Pros and Cons and Attitude 1 Running head: DECISIONAL BALANCE AND ATTITUDE Does the Transtheoretical Model Need an Attitude Adjustment? Integrating Attitude with Decisional Balance as Predictors of Stage of Change for Exercise Patricia J. Jordan, M.A. 1 Claudio R. Nigg, Ph.D. 1 Gregory J. Norman, Ph.D. 2 Joseph S. Rossi, Ph.D. 1 Sonya V. Benisovich, M.A. 3 1 Cancer Prevention Research Center, University of Rhode Island 2 Stanford Center for Research in Disease Prevention, Stanford University School of Medicine 3 Stanford University, School of Education Reference: Jordan, P. J., Nigg, C. R., Norman, G. J., Rossi, J. S., & Benisovich, S. V. (2001). Does the transtheoretical model need an attitude adjustment? Integrating attitude with decisional balance as predictors of stage of change for exercise. Psychology of Sport and Exercise , 3 (1), 65-83. This research was supported by Grants CA27821 and CA50087 from the National Cancer Institute. The authors gratefully acknowledge the contribution of Dr. Lisa L. Harlow. Correspondence concerning this article should be addressed to: Patricia J. Jordan, Cancer Prevention Research Center, University of Rhode Island, 2 Chafee Road, Kingston, RI, 02881, U.S.A. Electronic correspondence may be sent via e-mail to: <[email protected] >.

Welcome message from author
This document is posted to help you gain knowledge. Please leave a comment to let me know what you think about it! Share it to your friends and learn new things together.
Transcript
Pros and Cons and Attitude 1
Running head: DECISIONAL BALANCE AND ATTITUDE
Does the Transtheoretical Model Need an Attitude Adjustment?
Integrating Attitude with Decisional Balance as Predictors of Stage of Change for Exercise
Patricia J. Jordan, M.A.1 Claudio R. Nigg, Ph.D. 1
Gregory J. Norman, Ph.D.2 Joseph S. Rossi, Ph.D. 1
Sonya V. Benisovich, M.A. 3
1 Cancer Prevention Research Center, University of Rhode Island
2 Stanford Center for Research in Disease Prevention, Stanford University School of Medicine
3 Stanford University, School of Education
Reference:
Jordan, P. J., Nigg, C. R., Norman, G. J., Rossi, J. S., & Benisovich, S. V. (2001). Does the transtheoretical model need an attitude adjustment? Integrating attitude with decisional balance as predictors of stage of change for exercise. Psychology of Sport and Exercise, 3(1), 65-83.
This research was supported by Grants CA27821 and CA50087 from the National Cancer
Institute.
The authors gratefully acknowledge the contribution of Dr. Lisa L. Harlow.
Correspondence concerning this article should be addressed to: Patricia J. Jordan, Cancer
Prevention Research Center, University of Rhode Island, 2 Chafee Road, Kingston, RI, 02881,
U.S.A. Electronic correspondence may be sent via e-mail to: <[email protected]>.
Pros and Cons and Attitude 2
Abstract
Objectives. This study compared conceptually similar decision-making components from
the theory of planned behavior (attitude) and the transtheoretical model (pros and cons) to
determine the extent to which attitude towards exercise added to the prediction of stage of
exercise behavior beyond that of the pros and cons.
Method. A sample of college undergraduates (N=223) were given stage of change,
attitude and decisional balance measures regarding their exercise behavior. Structural equation
modeling (SEM) was used to test the underlying measurement structure of the decision-making
components, while a series of discriminant function analyses (DFAs) were performed using a
combination of pros, cons, and cognitive and affective attitudes as predictors of membership in
one of the five stages of change.
Results: SEM determined that a correlated four-factor model, which included pros and
cons and two attitude subscales, provided the best fit to the data. The DFAs revealed that the
addition of attitude components to pros and cons significantly increased the overall explained
variance across the stages of change from 32% to 56% and improved the predictive ability of pros
and cons from 31.2% to 48.2%.
Conclusions: Although conceptually related, pros, cons and attitude were not closely
linked at a construct-measurement level. Furthermore, the addition of attitude to pros and cons
increased the overall explained variance across stages of change and improved the predictive
ability of pros and cons alone. The measurement model and DFA results taken in combination
strongly suggest that the addition of cognitive and affective attitudes may strengthen the decision-
making aspect of the TTM.

Pros and Cons and Attitude 3
Does the TTM Need an Attitude Adjustment?
Integrating Attitude with Decisional Balance as Predictors of Stage of Change for Exercise
The most recent statistics available from the U.S. Department of Health and Human
Services (Murray & Lopez, 1996; National Center for Health Statistics, 1997) associate lack of
exercise with five of the top 10 U.S. population causes of death. Exercise is an associated risk
factor for diseases of the heart (the number one cause of death in 1995), cerebrovascular diseases
(number three), lung diseases (number four), diabetes (number seven), and suicide (number nine).
The U.S. government’s Healthy People 2010 initiative focuses on advances in preventive
therapies and reduction of risk factors associated with major causes of death and chronic illness,
including physical activity and fitness (U.S. Department of Health and Human Services, 2000).
This initiative identified physical activity as one of the leading indicators of preventive health
behaviors and emphasized the need for behavior health professionals to develop and provide more
effective interventions and behavior change programs designed to promote and maintain healthy
behaviors. However, the choice of an optimal program must ultimately be based on a better
understanding of the factors underlying behavior in any given situation (Godin, 1994).
A number of different theoretical frameworks have been applied to the study of exercise
behavior among various segments of the population (Godin, 1994). The theory of planned
behavior (Ajzen & Madden, 1986; Ajzen, 1991), for example, has been identified as one of the
most commonly applied behavior-prediction models in the exercise domain (McAuley &
Courneya, 1993), as well as the theory with the most support in this same area (Courneya, 1995;
Courneya, Estabrooks & Nigg, 1997).
Pros and Cons and Attitude 4
Another widely used behavior-change construct in the exercise domain is Prochaska and
DiClemente’s (1983) stages of change, the central organizing construct of the transtheoretical
model of behavior change (Prochaska & DiClemente, 1983, 1984; DiClemente, Prochaska,
Fairhurst, Velicer, Velasquez, & Rossi, 1991). Currently, the most popular stage model in health
psychology (Horwath,1999), the transtheoretical model integrates cognitive, affective and
behavioral processes and principles of change from leading theories of psychotherapy and health
psychology, including 10 processes of change, decisional balance and self-efficacy.
Although these two theories propose different determinants of behavior and behavior
change, they include conceptually similar variables—each theory places great importance on
decision-making (Dishman, 1994). Pros and cons from the transtheoretical model mirror the
behavioral beliefs from the theory of planned behavior that form the basis of attitude toward
behavior. In fact, there have been suggestions that decisional balance may not be a distinct
construct in this regard, as evidence by applications that treat it as an attitude-like construct (e.g.,
Rakowski et al., 1999).
The purpose of this study was to compare conceptually similar decision-making
components from the theory of planned behavior (attitude) and the transtheoretical model (pros
and cons) to determine if, and to what extent, attitude towards exercise added to the prediction of
transtheoretical model stage of exercise behavior beyond that of the pros and cons.
Development of a comprehensive behavior-change model is a process that assumes
continuous evaluation and improvement. Combining elements from other theoretical frameworks,
such as the theory of planned behavior, with the transtheoretical model can have the advantage of
including and examining different theoretically relevant variables (Courneya, 1995). This is not to
Pros and Cons and Attitude 5
suggest that the transtheoretical model is uncontested as the behavior change model of choice
(c.f., Joseph, Breslin, Skinner, 1999; Weinstein, 1998); however, it has captured broad interest in
research and practice and warrants further investigation. Such research also has the potential to
increase our understanding of what is important in promoting exercise behavior. Further, it can
evaluate whether two conceptually similar variables (e.g., decisional balance and attitude) address
real differences or whether they represent the same construct using different labels.
Theoretical Overview
The theory of planned behavior (Ajzen, 1991), an extension of Fishbein and Ajzen’s
(1975; Ajzen & Fishbein, 1980) theory of reasoned action, attempts to understand and
consequently predict behaviors not entirely under individual control. The theory of planned
behavior proposes that intention is the best predictor of behavior and is directly influenced by
attitude, subjective norm and perceived behavioral control. Attitude focuses on an individual's
positive or negative evaluation of a specific behavior, while the normative component reflects the
perceived social pressure felt by the individual to perform (or not) a particular behavior (Ajzen &
Fishbein, 1980). Perceived behavioral control assesses the presumed ease or difficulty of
performing a behavior and is thought to be an approximation of one’s actual situational control
(Ajzen & Fishbein, 1980; Terry & Hogg, 1996). The theory of planned behavior has been applied
to the study of exercise behavior by a number of investigators (e.g., Courneya & McAuley, 1995;
Dishman, 1994; Godin, 1993, 1994; McAuley & Courneya, 1993) and has been very helpful in
understanding the decision-making process underlying exercise behavior (Ajzen & Driver, 1992;
Godin, 1994).

Pros and Cons and Attitude 6
The strength of the transtheoretical model is its focus on the dynamic nature of health
behavior change (Marcus, Rakowski & Rossi, 1992). The stages of change were introduced as a
framework to describe the temporal aspect of the adoption and maintenance of healthy behaviors.
Individuals modifying a given behavior move through a series of stages, from precontemplation to
maintenance (Prochaska, DiClemente, & Norcross, 1992).
Precontemplation is the stage in which an individual has no intent to change behavior in
the near future, usually measured as the next six months. Individuals in the Contemplation stage
openly state their intent to change within the next six months. This has been deemed about as far
in advance as an individual can plan decisions (Prochaska & Marcus, 1994). Preparation is the
stage in which individuals intend to take steps to change, usually within the next 30 days. This
time frame reflects the immediacy of the intention to act. Preparers may have already made minor
adjustments in their thought patterns and behaviors, but typically do not reach the predetermined
Action criteria. The Action stage is one in which an individual has made overt, perceptible lifestyle
modifications for fewer than six months. For exercise, the highest likelihood for relapse occurs
within the first six months of starting a regular program (Dishman, 1994). Those in the
Maintenance stage are working to prevent relapse and consolidate gains secured during Action
(DiClemente et al., 1991; Prochaska et al., 1992; Prochaska, Redding, & Evers, 1997) and have
successfully continued exercising beyond six months (e.g., longer than a sport season).
Processes of change are those covert and overt activities individuals use to change
behavior (Prochaska, Velicer, DiClemente, & Fava, 1988), decisional balance represents an
individual’s assessment of the perceived importance of the advantages and disadvantages (pros
and cons) of performing a behavior (Velicer, DiClemente, Prochaska, & Brandenburg, 1985), and
Pros and Cons and Attitude 7
self-efficacy reflects confidence in one’s ability to perform (or not) the behavior in a given
situation (DiClemente, Prochaska, & Gibertini, 1985). Based on initial studies of smoking
cessation behavior, the transtheoretical model has been successfully applied to a wide variety of
health-related behaviors (Prochaska et al., 1994) and has demonstrated reliability in describing and
predicting behavior change. To date, more than 50 published studies have applied transtheoretical
model variables to exercise behavior in a variety of populations to both describe and increase
exercise behavior (Nigg, 1999).
Empirical Overview
Research using theory of planned behavior constructs has identified attitude as an
important behavior-change component (Courneya, 1995; Courneya, Estabrooks, & Nigg, 1997;
Courneya, Nigg, & Estabrooks, 1998; Godin, 1993, 1994). To obtain salient beliefs about a
person’s attitudes towards performing a behavior, questions are phrased in terms of the
advantages and disadvantages of performing this same behavior (Ajzen & Fishbein, 1980).
Courneya (1995; Courneya, Nigg, & Estabrooks, 1998) assessed attitude across the five stages of
change in older adults and found that attitude significantly discriminated most stages of change
pairs. From the information provided by Godin (1993, 1994), approximately 30% of the variance
in intention to exercise seems to be explained by the attitudinal component. Although attitude has
been traditionally conceived as a complex system, combining affective, cognitive and behavioral
elements (Rosenberg & Hovland, 1960), researchers often evaluate it as a unidimensional concept
(Ajzen & Fishbein, 1980). Recent literature, however, has become more concerned with the
distinction between the cognitive and affective dimensions of attitude as they relate to behavioral
decisions (Crites, Fabrigar & Petty, 1994; Eagly, Mladinic & Otto, 1994; Trafimow & Sheeran,
Pros and Cons and Attitude 8
1998). These researchers have concluded that, when assessed independently, cognitive and
affective attitude components do make discrete contributions to the overall attitude dimension.
Research applying the transtheoretical model utilizes decisional balance in a similar fashion
(Velicer et al., 1985). Based on Janis and Mann’s (1977) model of decision making, the
transtheoretical model incorporates an individual’s relative assessment of the benefits and costs of
changing a specific behavior. Originally conceived as an eight-component model — composed of
gains and losses to self and others, as well as approval or disapproval from self and others —
most studies centered around the transtheoretical model have been unable to replicate an eight-
factor or four-factor structure with any reliability (Prochaska et al., 1994). The most consistent
replication has been found using a simple two-factor structure: the pros and cons of changing
(Prochaska et al., 1994).
Pros and cons have been identified as consistently discriminating among individuals at
different stages of readiness for exercise (Gorely & Gordon, 1995; Marcus, Eaton, Rossi, &
Harlow, 1994; Marcus & Owen, 1992; Marcus, Rakowski, & Rossi, 1992; Marcus, Selby,
Niaura, & Rossi, 1992; Nigg & Courneya, 1998). A cross-sectional examination of 12 health
behaviors, including exercise, confirmed the importance of the relationship between the pros and
cons progress through the stages of change (Prochaska et al., 1994). For all 12 behaviors, the
cons of behavior change outweighed the pros for individuals in the precontemplation stage;
whereas, the reverse was found to be true for those in action and maintenance. Based on results
from Marcus, Rakowski and Rossi (1992), decisional balance in the realm of exercise explains
nearly 25% of variance across stages.

Pros and Cons and Attitude 9
Methods
Participants
Study participants (N=223) were recruited from undergraduate psychology classes at a
New England-area university in the U.S. The mean age of the sample was 19.8 years (SD=3.1),
with an average 13.5 years of education (SD=1.2); 69% were female; 95% unmarried; and 79%
reported good or very good health. The sample was composed of 89% White, 4% Latino-
American, 3% African-American, 3% Asian and 1% Other participants. Across stages of change,
the sample was composed of 8% in precontemplation (n=17), 11% in contemplation (n=24), 39%
in preparation (n=88), 12% in action (n=27), and 30% in maintenance (n=67).
Procedure
Institutional approval was obtained, as well as permission from course instructors, to have
participants complete a set of 11 questionnaires, including the measures noted below and
demographics information. Potential participants were supplied with all relevant information
pertaining to the study and their voluntary participation implied informed consent. Students were
given regular class sessions to complete the questionnaires, or were asked to complete the
questionnaires at home and return them by the following class session. Submission of a completed
questionnaire was rewarded with credit toward the department’s research participation
requirements. The entire set of questionnaires took approximately 30-40 minutes to complete.
Measures
Stages of Change for Exercise Behavior. Stages of exercise behavior were measured
using a five-item algorithm, where respondents were asked to answer “yes” or “no” to a series of
Pros and Cons and Attitude 10
five questions based on their current exercise behavior and future intentions to exercise (Reed,
Velicer, Prochaska, Rossi, & Marcus, 1997). Regular exercise was defined prior to the questions
as “any planned physical activity performed to increase physical fitness from three to five times
per week for a minimum 20 minutes per session at a level that increases one’s breathing rate and
causes one to break a sweat.” Subjects who did not exercise regularly and had no intention to
begin in the next six months were considered to be in the precontemplation stage. Those who did
not exercise regularly, but intended to start within the next six months, but not the next 30 days
were classified in the contemplation stage. Those who did not exercise regularly, but intended to
start in the next 30 days were placed in the preparation stage. Subjects who did exercise regularly,
but had not done so for a minimum of six months, were in action. Those who had been exercising
regularly for more than six months were grouped in the maintenance stage. Versions of this
measure have been found to be both reliable and valid (Courneya, 1995; Marcus, Banspach et al.,
1992; Marcus, Selby et al., 1992; Marcus & Simkin, 1993; Nigg & Courneya, 1998; Reed et al.,
1997).
Attitude was measured using six seven-point semantic differential scales, as suggested by
Fishbein & Ajzen (1975; Ajzen & Fishbein, 1980). Adjectives were presented without a negative
or positive sign preceding the numerical ratings. The statement preceding the adjective pairs was,
“I feel my participation in exercise at the present time is….” Three items tapped cognitive
properties of attitude (useful/useless, harmful/beneficial, wise/foolish) and three items tapped
affective properties of attitude (enjoyable/unenjoyable, pleasant/unpleasant, stressful/relaxing)
(e.g., Useful 3 - 2 - 1 - 0 - 1- 2 - 3 Useless). For analyses, the scales were translated (1 to 7), with
Pros and Cons and Attitude 11
lower scores corresponding to the negative adjective. Internal consistency (coefficient Alpha) for
each of the cognitive and affective subscales was .85.
Decisional Balance. Due to the fact that the existing decisional balance measure for
exercise had been developed on an adult worksite sample, the measure was re-constructed using
this sample of college students. Development of this measure followed the sequential method of
scale construction described by Jackson (1970, 1971) and Comrey (1988) and involved a
sequence of steps to ensure content and internal validity. An initial pool of approximately 100
statements (including Marcus et al.’s scale, 1992) representing Janis and Mann's (1977) original
eight-category conception of the benefits (pros) and costs (cons) of exercise was generated by a
group of regular exercisers and non-exercisers, including the researchers. The statements were
reviewed and revised to improve understanding, eliminate redundancies and a Q-sort was
conducted to ensure proper representation across the eight decisional-balance categories
recommended by Janis and Mann (1977). The final pool of items consisted of 69 statements,
including 38 pros and 31 cons of exercising. Subjects were asked to indicate on a Likert scale,
ranging from “not at all important” (1) to “extremely important” (5), the importance of each
statement when deciding whether or not to exercise in their leisure time.
A principal components analysis conducted on the 69 x 69 matrix of interitem correlations
for the decisional balance items yielded two components, labeled pros and cons, which was
consistent with the literature (Prochaska et al., 1994). The number of components to retain was
determined using Velicer’s (1976; Zwick & Velicer, 1986) minimum average partial (MAP)
correlation procedure and Horn’s (1965) parallel analysis.
Pros and Cons and Attitude 12
An item was retained on a component if it met the two following criteria: 1) it loaded .70
or greater on the target factor; and 2) it did not load higher than .20 on the second component.
Complex items and items that failed to meet the preceding guidelines were deleted. A total of 26
items, 15 pros and 11 cons, remained after the above procedure was completed. Ten items for
each component were selected based on strength of loading and additional qualitative assessment
to ensure breadth of construct. A more in-depth analysis of the structure of the decisional balance
item set upon which this research is based can be found elsewhere (Nigg et al., 1998).
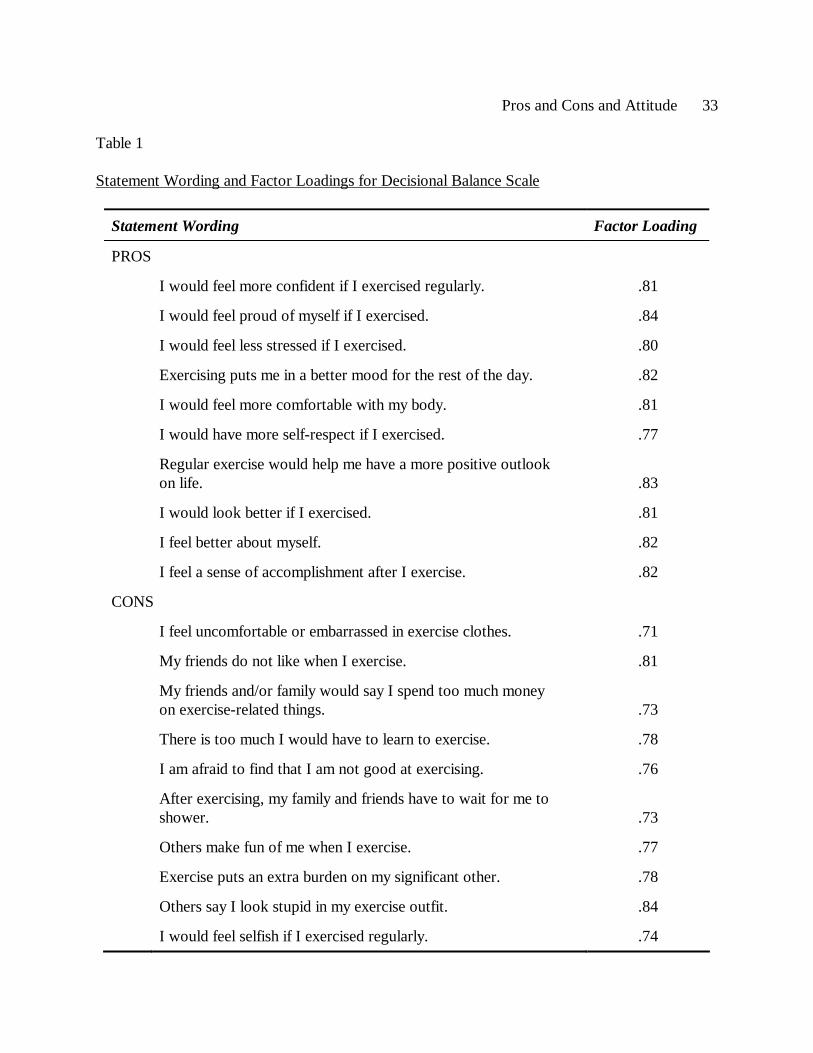
The final decisional balance scale included 10 pros and 10 cons. Statement wording and
loadings for each of the items are provided in Table 1. Coefficient Alpha (internal consistency)
reliabilities were strong (pros, α=.95; cons, α=.94).
Insert Table 1 about here
Results
Standardization of Scores
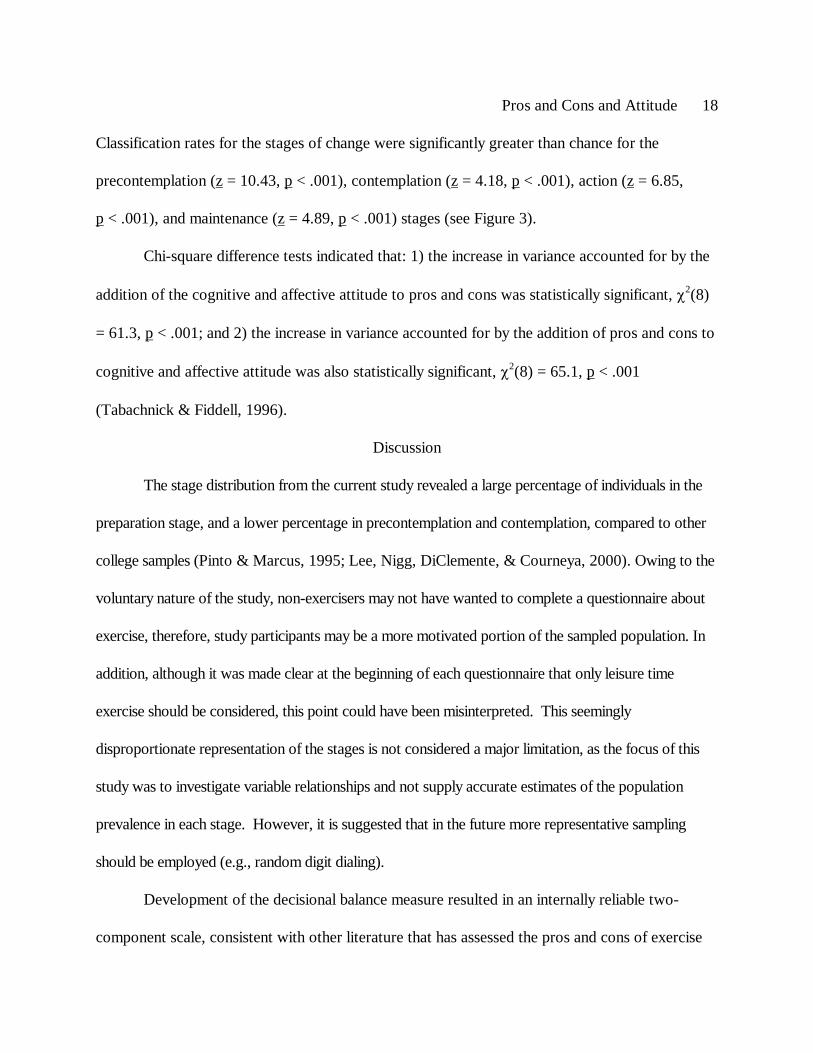
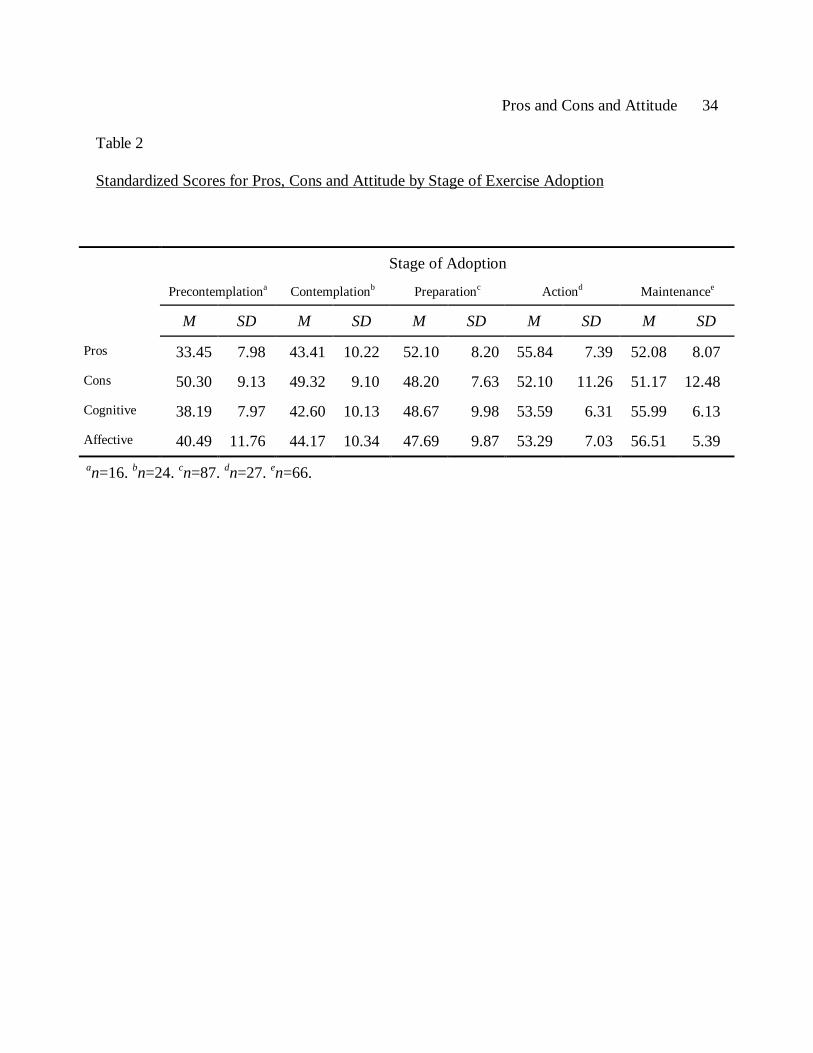
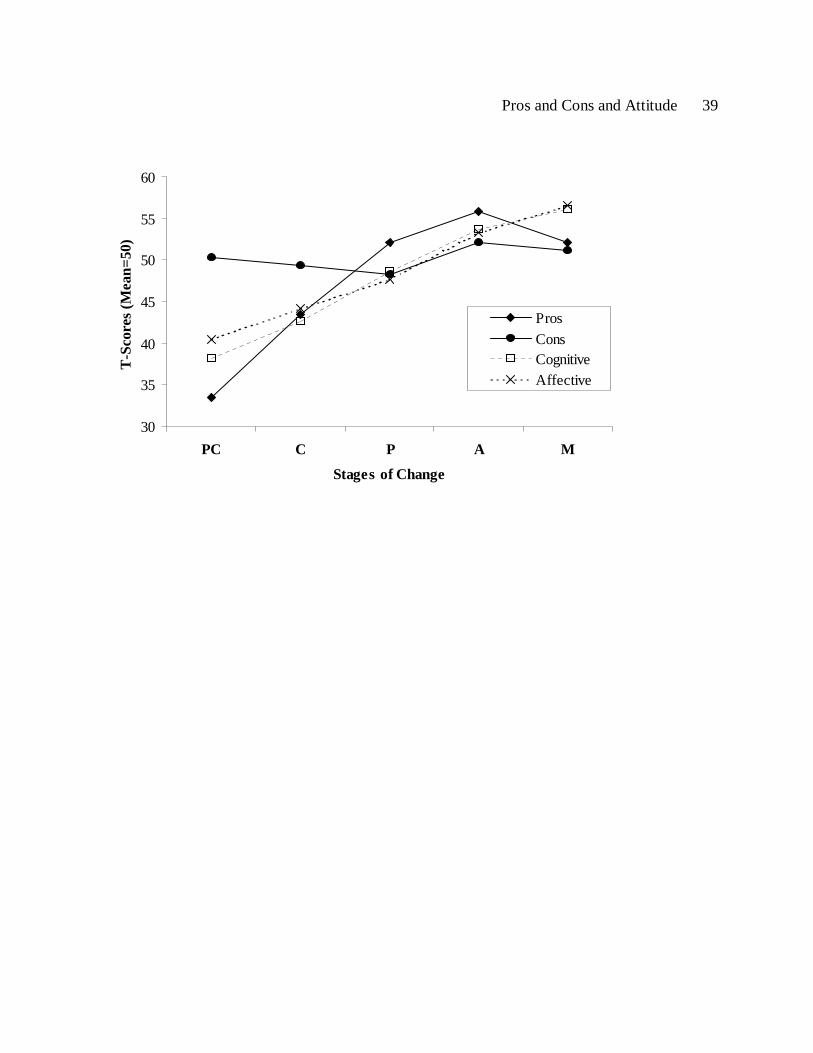
To obtain a standard metric, T-scores (M=50, SD=10) were calculated for pros, cons and
the two attitude constructs across the five stages of change (see Table 2). Figure 1 illustrates the
relationship between these variables for the current sample. Consistent with the findings of
Prochaska and colleagues (1994), the cons of exercise adoption were higher than the pros in the
precontemplation stage but reversed positions between the contemplation and preparation stages.
Figure 1 also portrays the linear relationship of cognitive and affective attitude across stages, with
an increase of almost two standard deviations from precontemplation to maintenance.
Pros and Cons and Attitude 13
Insert Table 2 & Figure 1 about here
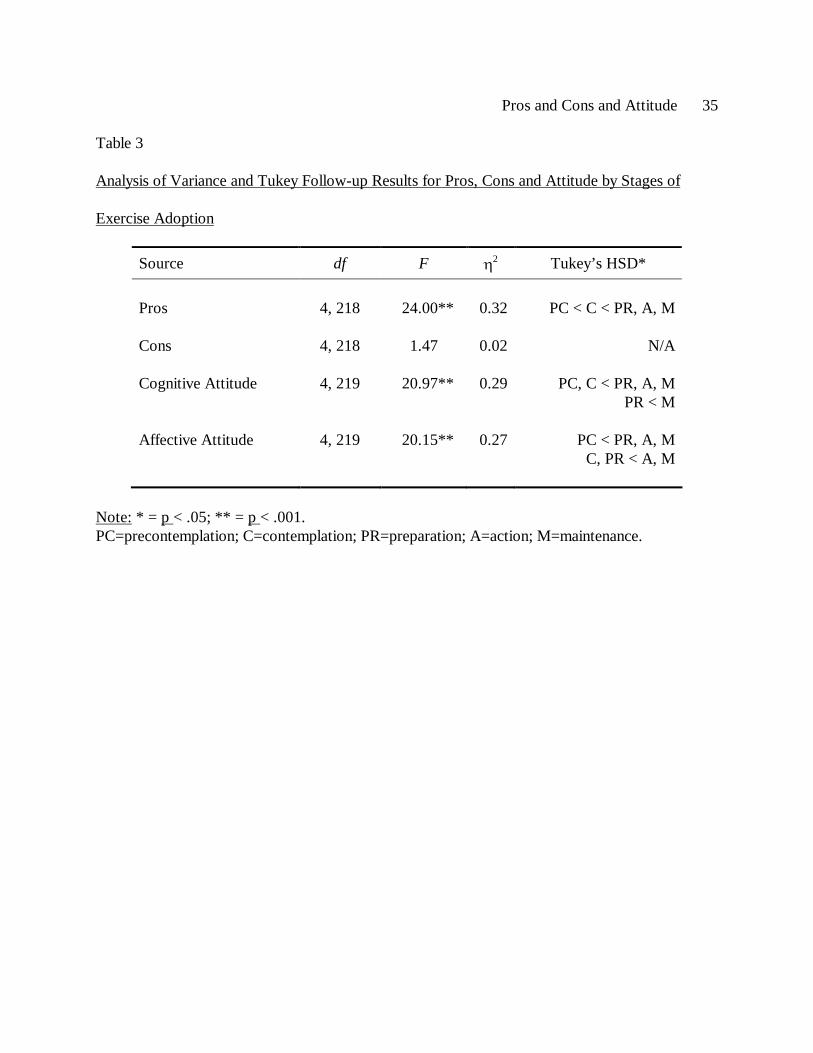
Multivariate analysis of variance (MANOVA) was used to determine mean differences
across the categorical stages of change for pros, cons and the two attitude subscales prior to
model testing (F(16,648)=10.68, p < .05, η2 = .16). Follow-up ANOVAs determined that pros
(F(4,218)=24.01, p < .05, η2 = .32), cognitive attitude (F(4,219)=20.97, p < .05, η2 = .29) and
affective attitude (F(4,215)=19.44, p < .05, η2 = .27) exhibited significant mean differences across
the stages of change. Results are shown in Table 3.
Insert Table 3 about here
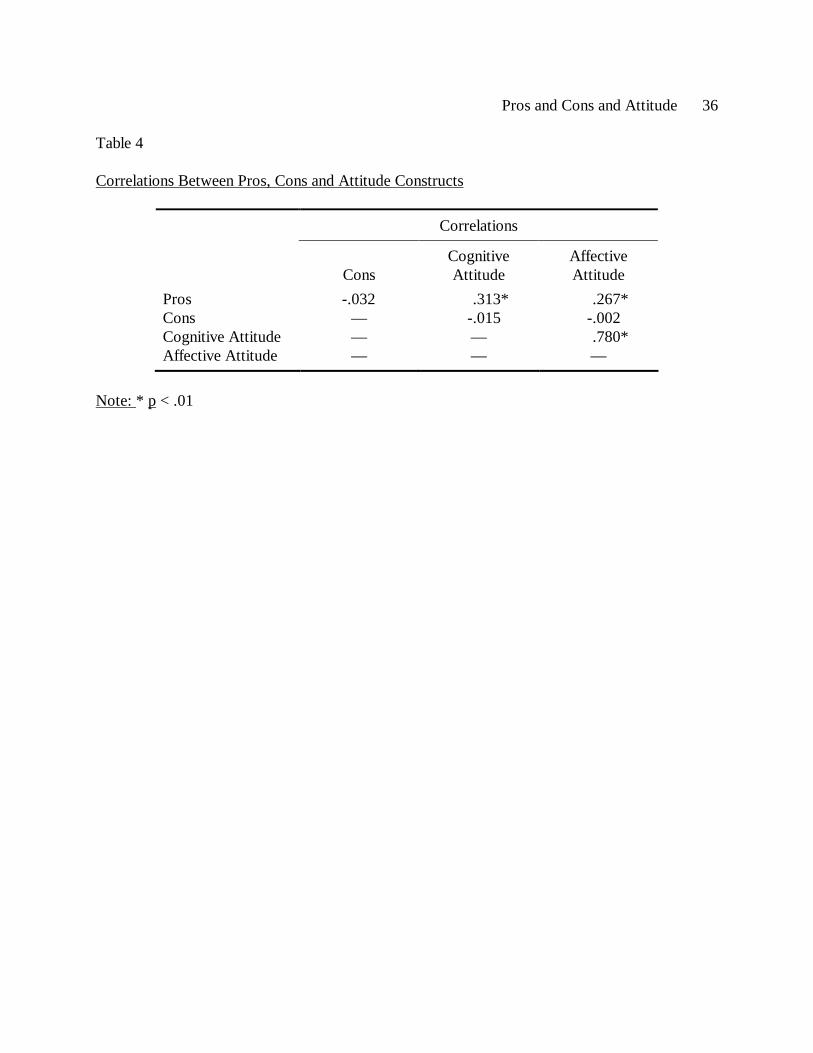
Correlations
Correlations between constructs were calculated to help inform subsequent measurement
model testing (see Table 4). Only the pros and attitude subscales were significantly related.
Insert Table 4 about here
Measurement Model Testing
To test the underlying measurement structure of the decision-making components, a series
of competing models were specified and estimated using structural equation modeling (SEM) with
EQS software (Bentler, 1989). Maximum likelihood estimation was used for all analyses. To
reduce the number of manifest variables and facilitate model testing, item parcels were created for
the pros and cons scales, whereby randomly selected sets of items on each scale were combined
and averaged to form a total of three composite manifest indicators for each latent construct. Item
parceling has been recommended for several reasons, including increased reliability, decreased
Pros and Cons and Attitude 14
idiosyncratic variance, the tendency for the item parcels to be more normally distributed and,
ultimately, a reduction in the ratio of measured variables to subjects (Marsh, Richards, Johnson,
Roche, & Tremayne, 1994). The six items that formed the attitude scale remained as single-item
indicators when cognitive and affective attitude constructs were examined independently, but item
pairs were created when the six attitude items were used to form a single attitude construct. This
ensured a ratio of three manifest variables to each latent construct for each analysis.
The following models were investigated:
1. Null Model. The null model assumed that there were no latent factors and that the items
were completely independent. This model was not thought of as a serious representation of the
data, but is a useful baseline against which other models may be compared.
2. One-Factor Model. This model hypothesized one general unspecified factor for decision
making. Evidence for this model would have indicated no differentiation among the decisional
balance and attitudinal constructs, lending support to a hypothesis that the only differences
between the two constructs were conceptual in nature and that existing measures may not be able
to discriminate these differences..
3. Uncorrelated Two-Factor Model. This model specified two uncorrelated factors: one
for decisional balance, composed of pros and cons; and one for attitude, composed of the
cognitive and affective subscales. No previous literature has found support for conceiving pros
and cons as a single factor; however, this model was intended as a means for comparison.
4. Uncorrelated Three-Factor Model. This model indicated a discrimination of the three
factors (pros, cons and attitude) and that the constructs are best represented as independent
aspects of decision making. Evidence for this model would support the hypothesis that these three
Pros and Cons and Attitude 15
decision-making components were unrelated — evidence that the three constructs are unique,
both conceptually and quantitatively.
5. Correlated Three-Factor Model. This model is similar to the previous model, however,
the pros and attitude factors were allowed to correlate, based on the results shown in Table 4.
This model represented the measurement model with three distinct but somewhat related factors.
6. Uncorrelated Four-Factor Model. This model discriminated pros, cons and the two
attitude components (affective and cognitive) and represented them as unrelated decision-making
constructs. Evidence for this model would support an hypothesis of the uniqueness of cognitive
and affective attitudes, as well as their distinction from the two decisional balance constructs.
7. Correlated Attitude Subscales Model. This model was based on the correlations among
the four decision-making constructs, which indicated that the two attitude subscales factors were
highly correlated, whereas the other correlations were relatively small.
8. Correlated Four-Factor Model. Resembling the four uncorrelated factors model, this
model allowed the pros factor and the two attitude subscales to correlate with each other, based
on the results shown in Table 4.
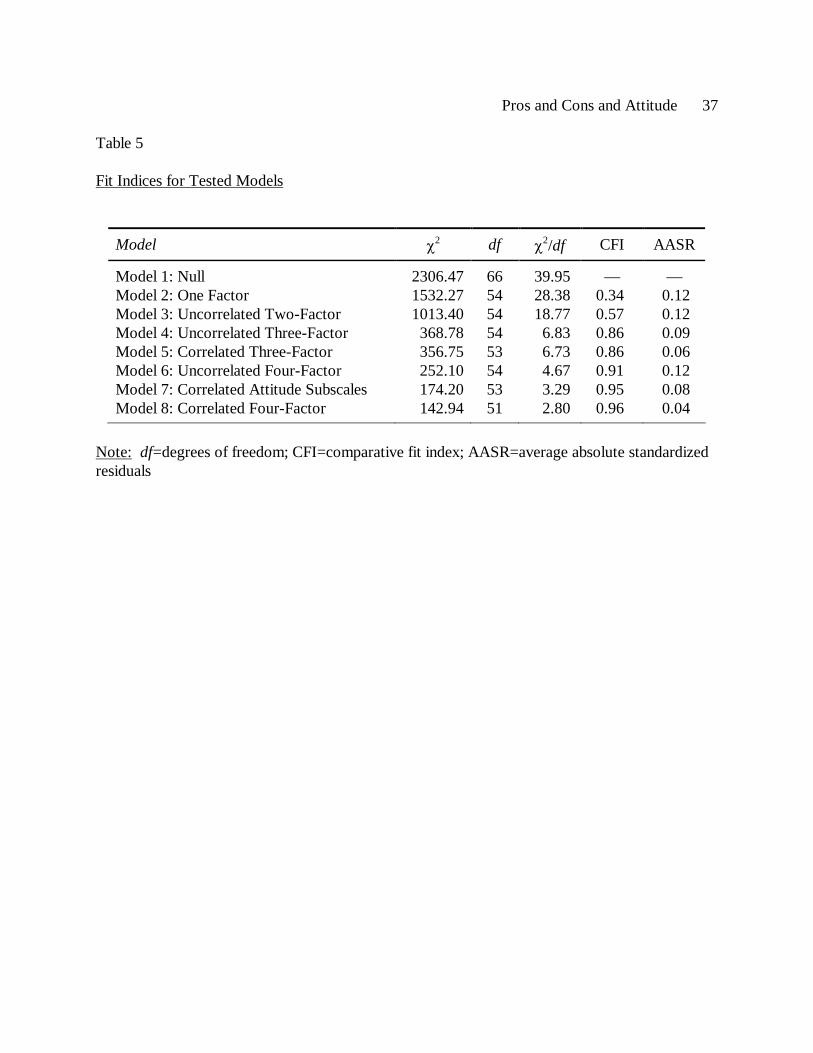
To assess the fit of the specified models three different fit indices were calculated for each
model. These included: Chi-square/degrees of freedom ratio (χ2/df); Comparative Fit Index (CFI);
and average absolute standardized residuals (AASR). For the χ2/df ratio, values less than 2.0
indicate good overall model fit (Marsh, Balla, & McDonald, 1988). A χ2/df ratio above 5.0
indicates unacceptably large differences between the parameterized model and the data. The CFI
is a measure of the proportion of the variation and covariation explained by the specified model
(Bentler, 1990). The index is bounded by 0 and 1.0, with 1.0 indicating a perfect fit. CFI values
Pros and Cons and Attitude 16
greater than .90 indicate excellent model fit. The AASR is an index of the discrepancy between
the specified model and the data (Bentler, 1990). Generally, values of .05 or less indicate good
model fit with 0 indicating a perfect fit. It is important to note that there is no single accepted
index of model fit. Use of several measures of fit, representing a variety of conceptual approaches
to the problem of assessing model adequacy, provides some protection against the possibility of
model misspecification (Marsh et al., 1988). Evaluation of all the models that were tested is
summarized in Table 5.
Insert Table 5 about here
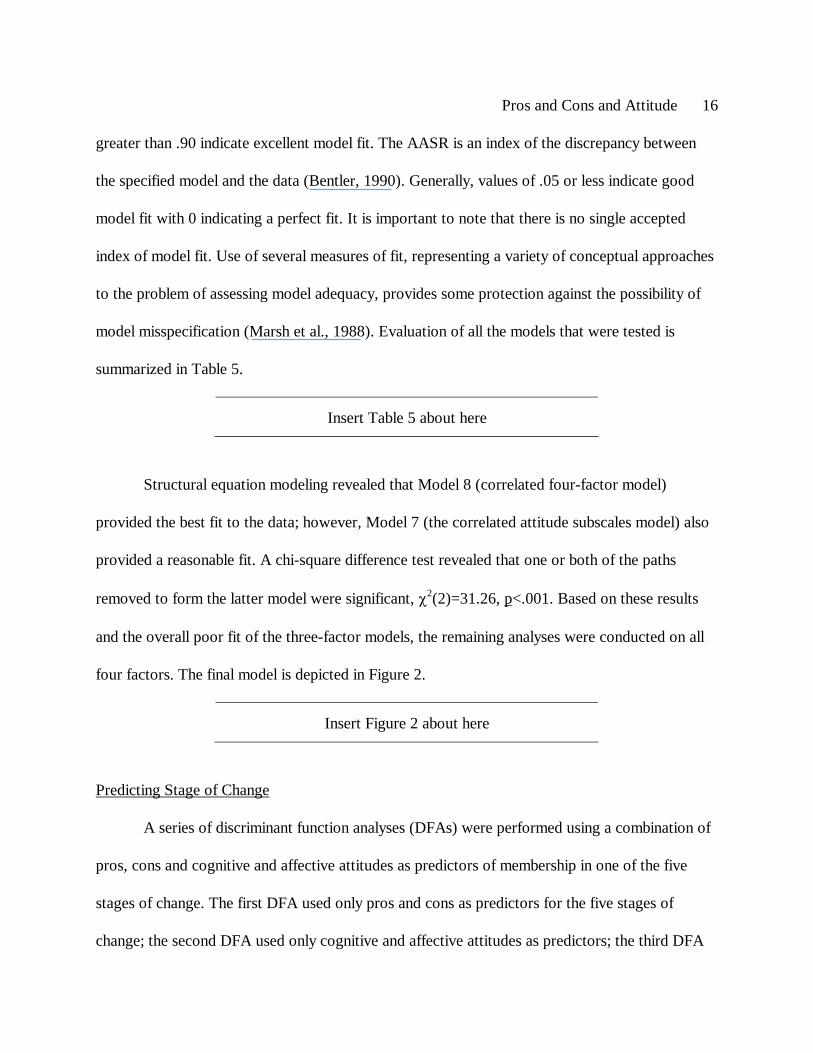
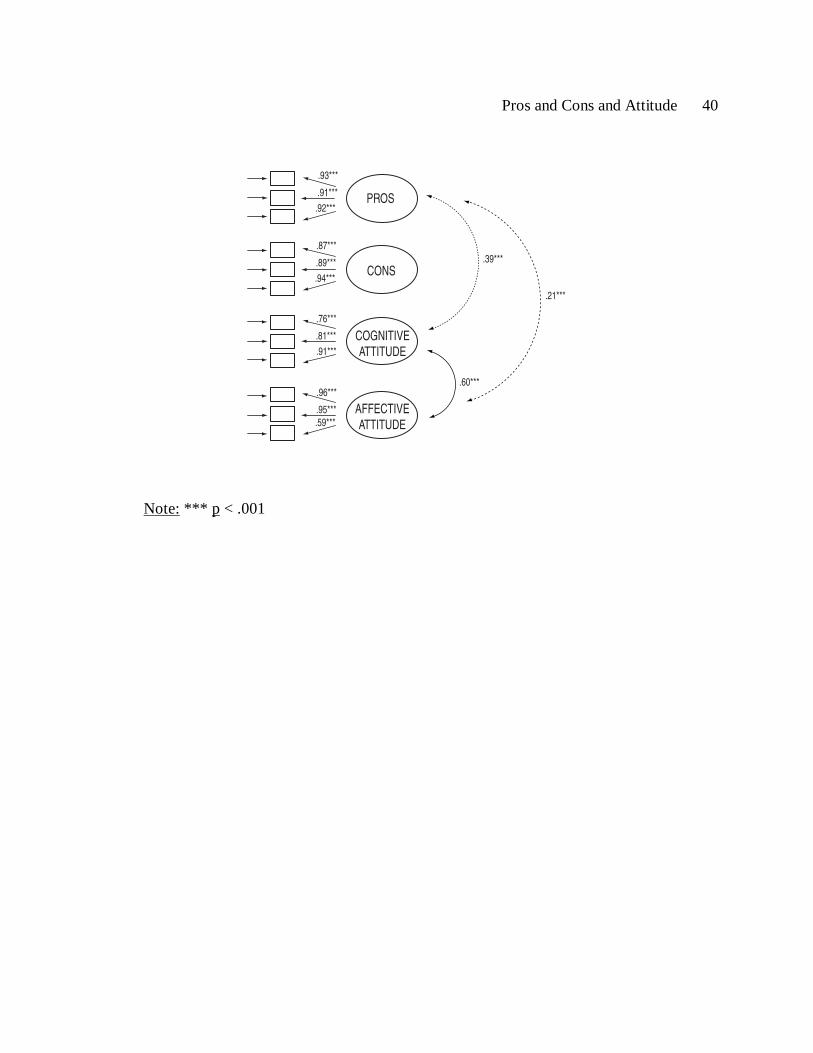
Structural equation modeling revealed that Model 8 (correlated four-factor model)
provided the best fit to the data; however, Model 7 (the correlated attitude subscales model) also
provided a reasonable fit. A chi-square difference test revealed that one or both of the paths
removed to form the latter model were significant, χ2(2)=31.26, p<.001. Based on these results
and the overall poor fit of the three-factor models, the remaining analyses were conducted on all
four factors. The final model is depicted in Figure 2.
Insert Figure 2 about here
Predicting Stage of Change
A series of discriminant function analyses (DFAs) were performed using a combination of
pros, cons and cognitive and affective attitudes as predictors of membership in one of the five
stages of change. The first DFA used only pros and cons as predictors for the five stages of
change; the second DFA used only cognitive and affective attitudes as predictors; the third DFA
Pros and Cons and Attitude 17
used all four scales as predictors. For each DFA missing data appeared to be random throughout
the groups and predictors, so listwise deletion was employed and the analyses were carried out on
all remaining cases.
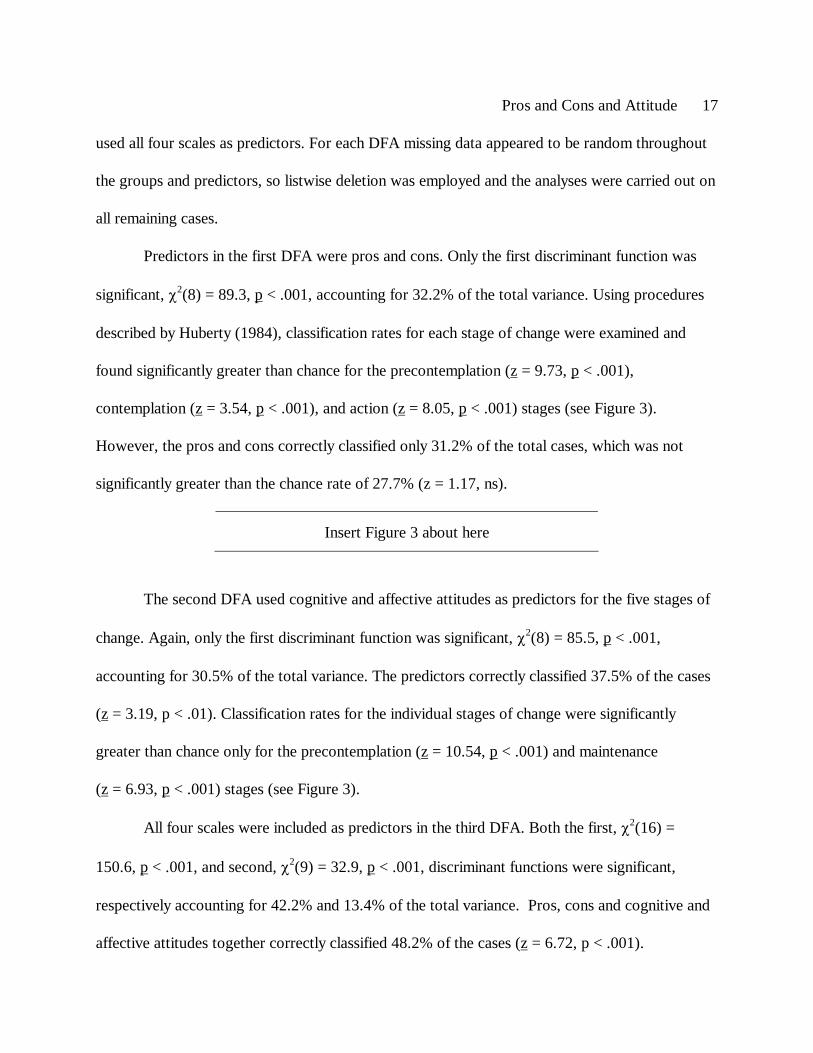
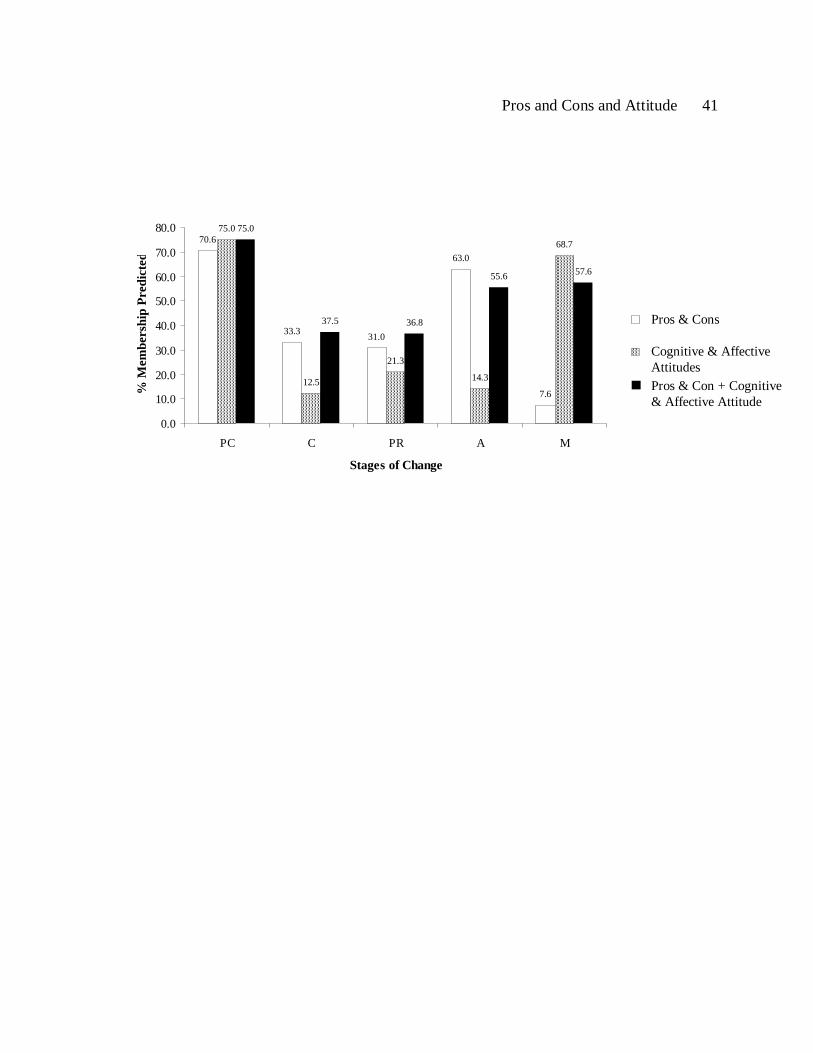
Predictors in the first DFA were pros and cons. Only the first discriminant function was
significant, χ2(8) = 89.3, p < .001, accounting for 32.2% of the total variance. Using procedures
described by Huberty (1984), classification rates for each stage of change were examined and
found significantly greater than chance for the precontemplation (z = 9.73, p < .001),
contemplation (z = 3.54, p < .001), and action (z = 8.05, p < .001) stages (see Figure 3).
However, the pros and cons correctly classified only 31.2% of the total cases, which was not
significantly greater than the chance rate of 27.7% (z = 1.17, ns).
Insert Figure 3 about here
The second DFA used cognitive and affective attitudes as predictors for the five stages of
change. Again, only the first discriminant function was significant, χ2(8) = 85.5, p < .001,
accounting for 30.5% of the total variance. The predictors correctly classified 37.5% of the cases
(z = 3.19, p < .01). Classification rates for the individual stages of change were significantly
greater than chance only for the precontemplation (z = 10.54, p < .001) and maintenance
(z = 6.93, p < .001) stages (see Figure 3).
All four scales were included as predictors in the third DFA. Both the first, χ2(16) =
150.6, p < .001, and second, χ2(9) = 32.9, p < .001, discriminant functions were significant,
respectively accounting for 42.2% and 13.4% of the total variance. Pros, cons and cognitive and
affective attitudes together correctly classified 48.2% of the cases (z = 6.72, p < .001).
Pros and Cons and Attitude 18
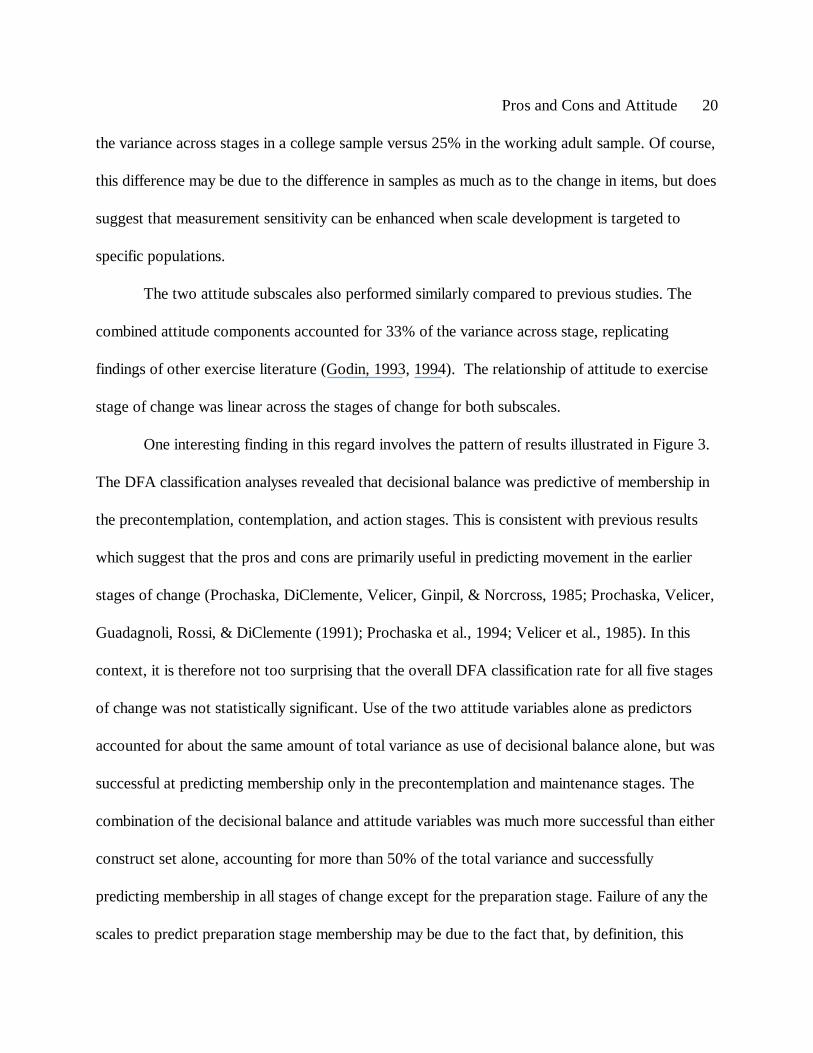
Classification rates for the stages of change were significantly greater than chance for the
precontemplation (z = 10.43, p < .001), contemplation (z = 4.18, p < .001), action (z = 6.85,
p < .001), and maintenance (z = 4.89, p < .001) stages (see Figure 3).
Chi-square difference tests indicated that: 1) the increase in variance accounted for by the
addition of the cognitive and affective attitude to pros and cons was statistically significant, χ2(8)
= 61.3, p < .001; and 2) the increase in variance accounted for by the addition of pros and cons to
cognitive and affective attitude was also statistically significant, χ2(8) = 65.1, p < .001
(Tabachnick & Fiddell, 1996).
Discussion
The stage distribution from the current study revealed a large percentage of individuals in the
preparation stage, and a lower percentage in precontemplation and contemplation, compared to other
college samples (Pinto & Marcus, 1995; Lee, Nigg, DiClemente, & Courneya, 2000). Owing to the
voluntary nature of the study, non-exercisers may not have wanted to complete a questionnaire about
exercise, therefore, study participants may be a more motivated portion of the sampled population. In
addition, although it was made clear at the beginning of each questionnaire that only leisure time
exercise should be considered, this point could have been misinterpreted. This seemingly
disproportionate representation of the stages is not considered a major limitation, as the focus of this
study was to investigate variable relationships and not supply accurate estimates of the population
prevalence in each stage. However, it is suggested that in the future more representative sampling
should be employed (e.g., random digit dialing).
Development of the decisional balance measure resulted in an internally reliable two-
component scale, consistent with other literature that has assessed the pros and cons of exercise

Pros and Cons and Attitude 19
(Marcus, Eaton, Rossi, & Harlow, 1994; Marcus, Rakowski, & Rossi, 1992; Nigg & Courneya,
1998; Prochaska et al., 1994). Some items from the present study were the same as those used by
Marcus and colleagues (1992; Marcus & Owen, 1992); however, the content of the final scale
differed somewhat from the scale developed on a working adult sample, reflecting value
differences placed on individual benefits or costs of exercising by the two samples. It is essential
that breadth of construct is present in a scale attempting to address the decision making
component, especially since conceptual frameworks (Janis & Mann, 1977) point to broader
interpretations. The developed scale represents seven of the eight categories described by Janis
and Mann (1977). The only category unaccounted for is approval from others. More importantly
both underlying mechanisms of the decision making process, self-persuasion and emotional
inoculation described by Janis and Mann (1977), are represented. This may indicate that the
structure underlying the decision making categories may be reflect the process, not different
categories of pros or cons. Therefore, the eight categories may be useful to guide interventions
whereas for assessment only the two processes are necessary.
Across the stages, the pros increased significantly from precontemplation to preparation.
The intersection of the pros and cons (the decisional balance point) was between contemplation
and preparation. The pros and decisional balance point replicated previous findings (e.g.,
Prochaska et al., 1994; Marcus, Rakowski, & Rossi, 1992). However, the cons did not differ
across the stages, which may be due to a combination of: 1) the homogeneous sample; 2) the
educated nature of the sample (college sample with an average of 13.5 years education); or 3)
power limitations in the early stages. This considered, the scale outperformed the decisional
balance measure used by Marcus, Rakowski and Rossi (1992), explaining approximately 35% of
Pros and Cons and Attitude 20
the variance across stages in a college sample versus 25% in the working adult sample. Of course,
this difference may be due to the difference in samples as much as to the change in items, but does
suggest that measurement sensitivity can be enhanced when scale development is targeted to
specific populations.
The two attitude subscales also performed similarly compared to previous studies. The
combined attitude components accounted for 33% of the variance across stage, replicating
findings of other exercise literature (Godin, 1993, 1994). The relationship of attitude to exercise
stage of change was linear across the stages of change for both subscales.
One interesting finding in this regard involves the pattern of results illustrated in Figure 3.
The DFA classification analyses revealed that decisional balance was predictive of membership in
the precontemplation, contemplation, and action stages. This is consistent with previous results
which suggest that the pros and cons are primarily useful in predicting movement in the earlier
stages of change (Prochaska, DiClemente, Velicer, Ginpil, & Norcross, 1985; Prochaska, Velicer,
Guadagnoli, Rossi, & DiClemente (1991); Prochaska et al., 1994; Velicer et al., 1985). In this
context, it is therefore not too surprising that the overall DFA classification rate for all five stages
of change was not statistically significant. Use of the two attitude variables alone as predictors
accounted for about the same amount of total variance as use of decisional balance alone, but was
successful at predicting membership only in the precontemplation and maintenance stages. The
combination of the decisional balance and attitude variables was much more successful than either
construct set alone, accounting for more than 50% of the total variance and successfully
predicting membership in all stages of change except for the preparation stage. Failure of any the
scales to predict preparation stage membership may be due to the fact that, by definition, this
Pros and Cons and Attitude 21
stage might be expected to be relatively less stable and more transitory, representing a transition
phase from contemplation to action (DiClemente et al., 1991). In general, precontemplation and
maintenance are considered to be the most stable stages of change whereas the middle stages —
contemplation, preparation, and action — are thought of as relatively less stable. These middle
stages were better predicted by pros and cons than by attitudes. These results could indicate that
the middle stages represent a time when attitudes are being formed or modified (and decisions are
being made) and are, therefore, too variable or inconsistent to be predictive of stage of change.
The results from the univariate post hoc tests shown in Table 3 also provide some support for this
hypothesis. While the pros differentiate the two early stages of change from the others, they do
not show any mean differences between the later three stages. The two attitude subscales do not
appear to differentiate the early stages of change, but do show mean differences between the
middle and later stages of change.
Although conceptually related, pros, cons and the two attitude subscales were relatively
distinct factors, indicating that the constructs were not multicollinear or redundant. In addition,
while the definition of attitude in the theory of planned behavior is conceptually and semantically
similar to pros and cons, they are not closely linked at a construct-measurement level. This was
supported by the final DFA, which illustrated that the addition of the attitude variables to pros and
cons increased the overall explained variance across stages of change by more than 23% (from
32.2% to 55.6%) and improved the predictive ability of pros and cons alone by 17% (from 31.2%
to 48.2%). The measurement model and DFA results taken in combination strongly suggest that
the addition of cognitive and affective attitudes may strengthen the decision-making aspect of the
TTM.
Pros and Cons and Attitude 22
A possible explanation for the difference in these constructs is that the decisional balance
item set was developed based on the eight categories outlined by Janis and Mann (1977): gains
and losses to self, which address all cognitive effects expected to result from the decision with
regards to individual utilitarian objectives; gains and losses to important others, which targets
individuals or groups with whom the individual is affiliated; self-approval and disapproval, which
includes one’s basic morals and values; and approval and disapproval of important others, which
targets the basic morals and values of individuals or groups with whom the individual is
associated. The attitude items, in contrast, addressed cognitive and affective components of
exercising. Although all eight dimensions of the Janis and Mann model were not represented in
the final pros and cons scales, the two constructs (decisional balance and attitudes) were not
developed from the same conceptual basis.
The difference in these constructs can perhaps be understood from an expectancy-value
model perspective. Two individuals who associate the same set of consequences with performing
a given behavior may hold different attitudes toward the behavior if they evaluate the
consequences differently. By the same token, people who have different sets of salient beliefs may
nonetheless have the same attitude. That is to say, one or more of a person’s beliefs can change
and yet his attitude may remain the same (Ajzen & Fishbein, 1980).
There may even be evidence in the disparity of the two response-style formats. A bipolar
scale of attitude may not correspond to that of the unipolar Likert format used for decisional
balance (Fishbein & Ajzen, 1975). In addition, scales providing a continuum of values may
indicate that the researcher has a bipolar conceptualization of the respective dimension, whereas
scales that present only positive values may indicate a unipolar conceptualization (Streiner &
Pros and Cons and Attitude 23
Norman, 1995). Although the attitude scales did not include positive or negative values,
respondents may have interpreted the endpoints as “negative” or “positive,” in order to
disambiguate the numeric values (Schwarz & Hippler, 1995; Schwarz, Knaüper, Hippler, Noelle-
Neuman, & Clark, 1991).
Some limitations need to be considered when interpreting these results. The cross-
sectional nature of the study does not allow for the inference of causality. The small cell sizes in
precontemplation and contemplation limit the power of the more advanced statistical analyses
used in this study. The assessments utilized self-report data and included no objective information
on actual exercise behavior. To address the ultimate goal of this line of research — behavior
change and associated health benefits — appropriate objective outcome measures should be
included.
Future research in this area should replicate the attitude variables in conjunction with the
pros and cons across the stages of change to determine if they add meaningfully to the
understanding of exercise behavior across different sample populations. In addition, it is important
to assess the relationship between attitudes and each stage of change to ascertain whether
attitudes are predictive of movement between all adjacent stage pairs or only certain ones. This
type of analysis is also recommended for the TTM variables and should be conducted
longitudinally. Furthermore, longitudinal investigations would allow an accurate assessment of the
temporal order of the constructs addressed in this investigation. For example, pros and cons may
precede attitudes leading to behavior, or pros and cons and attitudes may directly influence
behavior at the same level. Longitudinal designs can also ascertain whether the addition of attitude
Pros and Cons and Attitude 24
to the transtheoretical framework is predictive of stage movement and, ultimately, exercise
behavior.
This study demonstrates the importance of investigating other constructs and variables in
conjunction with the TTM in order to test the completeness of the approach and as part of an
ongoing evolutionary process. It is also important to recognize the value of integrating elements
of successful behavior-change models to produce the most effective outcomes. Although the
integration of attitudes into the TTM would require a more complete set of theoretical variables
(e.g., to what extent does attitude add to the TTM when processes of change and self-efficacy are
also included), these initial results seem worthy of further investigation. Furthermore, researchers
working with other change models should perhaps explore the integration of TTM variables into
their work in order to enhance efficacy and, ultimately, the development of interventions to
increase exercise adoption.
References
Ajzen, I. (1991). The theory of planned behavior. Organizational Behavior and Human
Processes, 50, 179-211.
Ajzen, I., & Driver, B. l. (1992). Application of the theory of planned behavior to leisure
choice. Journal of Leisure Research, 24, 207-224.
Ajzen, I., & Fishbein, M. (1980). Understanding attitudes and predicting social behavior.
Englewood Cliffs: NJ: Prentice-Hall.
Ajzen, I., & Madden, T. J. (1986). Prediction of goal-directed behavior: Attitudes,
intentions and perceived behavioral control. Journal of Experimental and Social Psychology, 22,
453-474.
Pros and Cons and Attitude 25
Bentler, P. M. (1989). EQS: Structural equations program manual. Los Angeles, CA:
BMDP Statistical Software.
Bentler, P. M. (1990). Comparative fit indexes in structural models. Psychological
Bulletin, 107, 256-259.
Cohen, J. (1977). Statistical power analysis for the behavioral sciences. New York: Academic
Press.
Courneya, K. S. (1995). Understanding readiness for regular physical activity in older
individuals: An application of the theory of planned behavior. Health Psychology, 14, 80-87.
Courneya, K. S., Estabrooks, P. A., & Nigg, C. R. (1997). Predicting change in exercise
stage over a three-year period: An application of the theory of planned behavior. Avante, 3,
1-13.
Courneya, K. S., & McAuley, E. (1995). Cognitive mediators of the social influence-
exercise adherence relationship: A test of the theory of planned behavior. Journal of Behavioral
Medicine, 18, 499-515.
Courneya, K. S., Nigg, C. R., & Estabrooks, P. A. (1998). Relationships among the
theory of planned behavior in older persons over a three-year period. Psychology and Health, 13,
355-367.
Comrey, A. L. (1988). Factor-analytic methods of scale development in personality and
clinical psychology. Journal of Consulting and Clinical Psychology, 56, 754-761.
Crites, S. L., Fabrigar, L. R., & Petty, R. E. (1994). Measuring the affective and cognitive
properties of attitudes: Conceptual and methodological issues. Personality and Social Psychology
Bulletin, 20, 619-634.
Pros and Cons and Attitude 26
DiClemente, C. C., Prochaska, J. O., Fairhurst, S. K., Velicer, W. F., Velasquez, M. M.,
& Rossi, J. S. (1991). The process of smoking cessation: An analysis of precontemplation,
contemplation, and preparation stages of change. Journal of Consulting and Clinical Psychology,
59, 295-304.
DiClemente, C. C., Prochaska, J. O., & Gibertini, M. (1985). Self-efficacy and the stages
of self-change in smoking. Cognitive Therapy and Research, 9, 181-200.
Dishman, R. K. (1994). The measurement conundrum in exercise adherence research.
Medicine and Science in Sports and Exercise, 26, 1382-1390.
Eagly, A. H., Mladinic, A. O., & Otto, S. (1994). Cognitive and affective bases of
attitudes toward social groups and social policies. Journal of Experimental Social Psychology, 30,
113-137.
Fishbein, M., & Ajzen, I. (1975). Belief, attitude, intention, and behavior: An introduction
to theory and research. Reading, MA: Addison-Wesley.
Godin, G. (1993). The theories of reasoned action and planned behavior: Overview of
findings, emerging research problems and usefulness for exercise promotion. Journal of Applied
Sport Psychology, 5, 141-157.
Godin, G. (1994). Theories of reasoned action and planned behavior: Usefulness for
exercise promotion. Medicine and Science in Sports and Exercise, 26, 1391-1394.
Gorely, T., & Gordon, S. (1995). An examination of the transtheoretical model and
exercise behavior in older adults. Journal of Sport and Exercise Psychology, 17, 312-324.
Horn, J. I. (1965). A rationale and test for the number of factors in factor analysis.
Psychometrika, 30, 179-185.
Pros and Cons and Attitude 27
Horwath, C. C. (1999). Applying the transtheoretical model to eating behavior change:
Challenges and opportunities. Nutrition Research Review, 12, 281-317.
Huberty, C. J. (1984). Issues in the use and interpretation of discriminant analysis.
Psychological Bulletin, 95, 156-171.
Jackson, D. N. (1970). A sequential system for personality scale development. In C. D.
Spielberger (Ed.), Current topics in clinical and community psychology, Vol. 2 (pp. 61-96). New
York: Academic Press.
Jackson, D. N. (1971). The dynamics of structured personality tests: 1971. Psychological
Review, 78, 229-248.
Janis, I. L., & Mann, L. (1977). Decision making: A psychological analysis of conflict,
choice and commitment. New York: Free Press.
Joseph, J., Breslin, C., & Skinner, H. (1999). Critical perspectives on the transtheoretical
model and stages of change. In J. A. Tucker, D. M. Donovan, & G. A. Marlatt (Eds.), Changing
addictive behavior: Bridging clinical and public health strategies. New York: Guilford.
Lee, C. (1993). Attitudes, knowledge, & stages of change: A survey of exercise patterns
in older Australian Women. Health Psychology, 12, 476-480.
Lee, R. E., Nigg, C. R., DiClemente, C. C., & Courneya, K. S. (2000). Validating the
stages of change for exercise behavior with adolescents. Annals of Behavioral Medicine, 22, S80.
Marcus, B. H., Banspach, S. W., Lefebvre, R. C., Rossi, J. S., Carleton, R. A., & Abrams,
D. B. (1992). Using the stages of change model to increase the adoption of physical activity
among community participants. American Journal of Health Promotion, 6, 424-429.
Pros and Cons and Attitude 28
Marcus, B. H., Eaton, C. A., Rossi, J. S., & Harlow, L. L. (1994). Self-efficacy, decision-
making, and stages of change: An integrative model of physical exercise. Journal of Applied
Social Psychology, 24, 489-508.
Marcus, B. H., & Owen, N. (1992). Motivational readiness, self-efficacy and decision-
making for exercise. Journal of Applied Social Psychology, 22, 3-16.
Marcus, B. H., Rakowski, W., & Rossi, J. S. (1992). Assessing motivational readiness and
decision making for exercise. Health Psychology, 11, 257-261.
Marcus, B. H., Selby, V., Niaura, R., & Rossi, J. S. (1992). Self-efficacy and the stages of
exercise behavior change. Research Quarterly for Exercise and Sport, 63, 60-66.
Marcus, B. H., & Simkin, L. R. (1993). The stages of exercise behavior. Journal of Sports
Medicine and Physical Fitness, 33, 83-88.
Marsh, H. W., Balla, J. R. & McDonald, R. P. (1988). Goodness-of-fit indexes in
confirmatory factor analysis: The effect of sample size. Psychological Bulletin, 103, 391-410.
Marsh, H. W., Richards, G. E., Johnson, S., Roche, L., & Tremayne, P. (1994). Physical
self-description questionnaire: Psychometric properties and a multitrait-multimethod analysis of
relations to existing instruments. Journal of Sport & Exercise Psychology, 16, 270-305.
McAuley, E., & Courneya, K. S. (1993). Adherence to exercise and physical activity as
health-promoting behaviors: Attitudinal and self-efficacy influences. Applied and Preventive
Psychology, 2, 65-77.
Murray, C. J. L., & Lopez, A. D. (Eds.). (1996). The global burden of disease: A
comprehensive assessment of mortality and disability form diseases, injuries and risk factors in
1990 and projected to 2020. Cambridge, MA: Harvard University Press.
Pros and Cons and Attitude 29
National Center for Health Statistics. (1997). Top ten U.S. population causes of death.
Monthly Vital Statistics Report, 45(11S2)(23), 40-43.
Nigg, C. R. (1999). Predicting, explaining and understanding adolescent exercise behavior
using longitudinal and cross-sectional approaches. Unpublished doctoral dissertation, University
of Rhode Island, Kingston, RI.
Nigg, C. R., & Courneya, K. S. (1998). Transtheoretical model: Examining adolescent
health behavior. Journal of Adolescent Health, 22, 214-224.
Nigg, C. R., Rossi, J. S., Norman, G. J. & Benisovich, S. V. (March, 1998). Structure of
decisional balance for exercise adoption. Poster presented at the 19th annual meeting of Society
of Behavioral Medicine, New Orleans, LA.
Pinto, B. M., & Marcus, B. H. (1995). A stages of change approach to understanding
college students' physical activity. Journal of American College Health, 44, 27-29.
Prochaska, J. O., & DiClemente, C. C. (1983). Stages and processes of self-change of
smoking: Toward an integrative model of change. Journal of Consulting and Clinical Psychology,
51, 390-395.
Prochaska, J. O., & DiClemente, C. C. (1984). Self-change processes, self-efficacy and
decisional balance across five stages of smoking cessation. In Advances in cancer control – 1983.
New York: Alan R. Liss, Inc.
Prochaska, J. O., DiClemente, C. C., & Norcross, J. (1992). In search of how people
change. American Psychologist, 47, 1102-1114.
Prochaska, J. O., DiClemente, C. C., Velicer, W. F., Ginpil, S., & Norcross, J. C. (1985).
Predicting change in smoking status for self-changers. Addictive Behaviors, 10, 395-406.
Pros and Cons and Attitude 30
Prochaska, J. O., Redding, C. A., & Evers, K. E. (1997). The transtheoretical model and
the stages of change. In K. Glanz, F. Marcus Lewis, and B. K. Rimer, Health behavior and health
education: theory, research and practice (2nd ed.) (pp. 60-84). San Francisco, CA: Jossey-Bass.
Prochaska, J. O., & Marcus, B. H. (1994). The transtheoretical model: Applications to
exercise. In R. K. Dishman (Ed.), Advances in Exercise Adherence (pp. 161-180). Champaign,
IL: Human Kinetics.
Prochaska, J. O., Velicer, W. F., DiClemente, C. C., & Fava, J. (1988). Measuring
processes of change: Applications to the cessation of smoking. Journal of Consulting and Clinical
Psychology, 56, 520-528.
Prochaska, J. O., Velicer, W. F., Guadagnoli, E., Rossi, J. S., & DiClemente, C. C.
(1991). Patterns of change: Dynamic typology applied to smoking cessation. Multivariate
Behavioral Research, 26, 83-107.
Prochaska, J. O., Velicer, W. F., Rossi, J. S., Goldstein, M. G., Marcus, B. H., Rakowski,
W., Fiore, C., Harlow, L. L., Redding, C. A., Rosenbloom, D., & Rossi, S. R. (1994). Stages of
change and decisional balance for 12 problem behaviors. Health Psychology, 13, 39-46.
Rakowski, W., Andersen, R. M., Stoddard, A. M., Urban, N., et al. (1997). Confirmatory
analysis of opinions regarding pros and cons of mammography. Health Psychology, 16, 433-442.
Reed, G., Velicer, W. F., Prochaska, J. O., Rossi, J. S. & Marcus, B. H. (1997). What
makes a good staging algorithm: Examples from regular exercise. American Journal of Health
Promotion, 12, 57-66.
Rosenberg, M. J., & Hovland, C. I. (1960). Cognitive, affective and behavioral
components of attitude. In M. J. Rosenberg & C. I. Hovland (Eds.), Attitude organization and
Pros and Cons and Attitude 31
change: An analysis of consistency among attitude components. New Haven, CT: Yale University
Press.
Schwarz, N., & Hippler, H.-J. (1995). The numeric values of rating scales: A comparison
of their impact in mail surveys and telephone interviews. International Journal of Public Opinion
Research, 7, 72-74.
Schwarz, N., Knaüper, B., Hippler, H.-J., Noelle-Neuman, E., & Clark, L. (1991). Rating
scales: Numeric value may change the meaning of scale labels. Public Opinion Quarterly, 55, 570-
582.
Streiner, D. L., & Norman, G. R. (1995). Health measurement scales: A practical guide to
their development and use (2nd ed.). New York: Oxford University Press.
Tabachnick, B. G., & Fidell, L. S. (1996). Using multivariate statistics (3rd ed.). New
York: HarperCollins.
Terry, D. J., & Hogg, M. A. (1996). Group norms and the attitude-behavior relationship:
A role for group identification. Personality and Social Psychology Bulletin, 22, 776-793.
Trafimow, D., & Sheeran, P. (1998). Some tests of distinction between cognitive and
affective beliefs. Journal of Experimental Social Psychology, 34, 378-397.
U.S. Department of Health and Human Services. (2000, 12 January). Healthy People 2010
Fact Sheet [Online]. Office of Disease Prevention and Health Promotion. Available:
http://www.health.gov/healthypeople/ [2000, 7 February].
Velicer, W. F. (1976). Determining the number of components from the matrix of partial
correlations. Psychometrika, 41, 321-327.
Pros and Cons and Attitude 32
Velicer, W. F., DiClemente, C. C., Prochaska, J. O., & Brandenburg, N. (1985).
Decisional balance measure for assessing and predicting smoking status. Journal of Personality
and Social Psychology, 48, 1279-1289.
Weinstein, N. D., Lyon, J. E., Sandman, P. M., & Cuite, C. L. (1998). Experimental
evidence for stages of health behavior change: The precaution adoption process model applied to
home radon testing. Health Psychology, 17, 445-453.
Zwick, W. R., & Velicer, W. F. (1986). A comparison of five rules for determining the
number of components to retain. Psychological Bulletin, 99, 432-442.
Pros and Cons and Attitude 33
Table 1
Statement Wording and Factor Loadings for Decisional Balance Scale
Statement Wording Factor Loading
PROS
I would feel more confident if I exercised regularly. .81
I would feel proud of myself if I exercised. .84
I would feel less stressed if I exercised. .80
Exercising puts me in a better mood for the rest of the day. .82
I would feel more comfortable with my body. .81
I would have more self-respect if I exercised. .77
Regular exercise would help me have a more positive outlook on life.
.83
I would look better if I exercised. .81
I feel better about myself. .82
I feel a sense of accomplishment after I exercise. .82
CONS
I feel uncomfortable or embarrassed in exercise clothes. .71
My friends do not like when I exercise. .81
My friends and/or family would say I spend too much money on exercise-related things.
.73
There is too much I would have to learn to exercise. .78
I am afraid to find that I am not good at exercising. .76
After exercising, my family and friends have to wait for me to shower.
.73
Others make fun of me when I exercise. .77
Exercise puts an extra burden on my significant other. .78
Others say I look stupid in my exercise outfit. .84
I would feel selfish if I exercised regularly. .74
Pros and Cons and Attitude 34
Table 2
Standardized Scores for Pros, Cons and Attitude by Stage of Exercise Adoption
Stage of Adoption
Precontemplationa Contemplationb Preparationc Actiond Maintenancee
M SD M SD M SD M SD M SD
Pros 33.45 7.98 43.41 10.22 52.10 8.20 55.84 7.39 52.08 8.07
Cons 50.30 9.13 49.32 9.10 48.20 7.63 52.10 11.26 51.17 12.48
Cognitive 38.19 7.97 42.60 10.13 48.67 9.98 53.59 6.31 55.99 6.13
Affective 40.49 11.76 44.17 10.34 47.69 9.87 53.29 7.03 56.51 5.39
an=16. bn=24. cn=87. dn=27. en=66.
Pros and Cons and Attitude 35
Table 3
Analysis of Variance and Tukey Follow-up Results for Pros, Cons and Attitude by Stages of
Exercise Adoption
Source df F η2 Tukey’s HSD*
Pros 4, 218 24.00** 0.32 PC < C < PR, A, M Cons 4, 218 1.47 0.02 N/A Cognitive Attitude 4, 219 20.97** 0.29 PC, C < PR, A, M
PR < M Affective Attitude 4, 219 20.15** 0.27 PC < PR, A, M
C, PR < A, M
Note: * = p < .05; ** = p < .001. PC=precontemplation; C=contemplation; PR=preparation; A=action; M=maintenance.
Pros and Cons and Attitude 36
Table 4
Correlations Between Pros, Cons and Attitude Constructs
Correlations
Cons
Cognitive Attitude
Affective Attitude
Pros -.032 .313* .267* Cons — -.015 -.002 Cognitive Attitude — — .780* Affective Attitude — — —
Note: * p < .01
Pros and Cons and Attitude 37
Table 5
Fit Indices for Tested Models
Model χ2 df χ2/df CFI AASR
Model 1: Null 2306.47 66 39.95 — — Model 2: One Factor 1532.27 54 28.38 0.34 0.12 Model 3: Uncorrelated Two-Factor 1013.40 54 18.77 0.57 0.12 Model 4: Uncorrelated Three-Factor 368.78 54 6.83 0.86 0.09 Model 5: Correlated Three-Factor 356.75 53 6.73 0.86 0.06 Model 6: Uncorrelated Four-Factor 252.10 54 4.67 0.91 0.12 Model 7: Correlated Attitude Subscales 174.20 53 3.29 0.95 0.08 Model 8: Correlated Four-Factor 142.94 51 2.80 0.96 0.04
Note: df=degrees of freedom; CFI=comparative fit index; AASR=average absolute standardized residuals
Pros and Cons and Attitude 38
Figure Captions
Figure 1. T-Scores for pros, cons and cognitive and affective attitude by stage of exercise
adoption.
Figure 2. Structural equation modeling results of Model 8 (Correlated Four-Factor).
Figure 3. Percent stage of change membership correctly predicted by decisional balance and
attitude variables in discriminant function classification analyses.
Pros and Cons and Attitude 39
30
35
40
45
50
55
60
PC C P A M
Stages of Change
T-S
core
s (M
ean=
50)
Pros
ConsCognitiveAffective
Pros and Cons and Attitude 40
Note: *** p < .001
Pros and Cons and Attitude 41
70.6
33.331.0
63.0
7.6
75.0
12.5
21.3
14.3
68.7
75.0
37.5 36.8
55.6 57.6
0.0
10.0
20.0
30.0
40.0
50.0
60.0
70.0
80.0
PC C PR A M
Stages of Change
% M
embe
rshi
p P
redi
cted
Series1
Series2
Series3
Pros & Cons
Cognitive & Affective Attitudes Pros & Con + Cognitive & Affective Attitude
Related Documents