INT’L. J. AGING AND HUMAN DEVELOPMENT, Vol. 72(3) 265-287, 2011 DOES THE RELATION BETWEEN VOLUNTEERING AND WELL-BEING VARY WITH HEALTH AND AGE?* MORRIS A. OKUN, PH.D. REBECA RIOS, PH.D. AARON V. CRAWFORD, MA ROY LEVY, PH.D. Arizona State University, Tempe ABSTRACT Previous studies have established a positive association between organi- zational volunteering and well-being. In the current study, we examined whether the relations between organizational volunteering and positive affect, negative affect, and resilience are modified by respondents’ age and number of chronic health conditions. This study used cross-sectional data from the 2008 Arizona Health Survey of residents 18 years old and older (N = 4,161). Multiple regression analyses provided no support for the hypothesis that age moderates the association between volunteer status and positive affect, negative affect, and resilience. In contrast, there was a significant (p < .05) interaction between volunteer status and chronic health conditions on posi- tive affect and resilience. Consistent with the compensatory hypothesis, as number of chronic health conditions increased, the relations between volun- teering and positive affect and resilience scores increased. Implications of these findings for increasing volunteering among adults with multiple chronic health conditions are discussed. *This work was supported by funds provided by the St. Lukes Health Initiative to the Resilience Solutions Group at Arizona State University. The authors were not involved in designing the survey, drawing the sampling frame, or collecting the data. 265 Ó 2011, Baywood Publishing Co., Inc. doi: 10.2190/AG.72.3.f http://baywood.com

Welcome message from author
This document is posted to help you gain knowledge. Please leave a comment to let me know what you think about it! Share it to your friends and learn new things together.
Transcript

INT’L. J. AGING AND HUMAN DEVELOPMENT, Vol. 72(3) 265-287, 2011
DOES THE RELATION BETWEEN VOLUNTEERING
AND WELL-BEING VARY WITH HEALTH AND AGE?*
MORRIS A. OKUN, PH.D.
REBECA RIOS, PH.D.
AARON V. CRAWFORD, MA
ROY LEVY, PH.D.
Arizona State University, Tempe
ABSTRACT
Previous studies have established a positive association between organi-
zational volunteering and well-being. In the current study, we examined
whether the relations between organizational volunteering and positive affect,
negative affect, and resilience are modified by respondents’ age and number
of chronic health conditions. This study used cross-sectional data from the
2008 Arizona Health Survey of residents 18 years old and older (N = 4,161).
Multiple regression analyses provided no support for the hypothesis that
age moderates the association between volunteer status and positive affect,
negative affect, and resilience. In contrast, there was a significant (p < .05)
interaction between volunteer status and chronic health conditions on posi-
tive affect and resilience. Consistent with the compensatory hypothesis, as
number of chronic health conditions increased, the relations between volun-
teering and positive affect and resilience scores increased. Implications of
these findings for increasing volunteering among adults with multiple chronic
health conditions are discussed.
*This work was supported by funds provided by the St. Lukes Health Initiative to the
Resilience Solutions Group at Arizona State University. The authors were not involved in
designing the survey, drawing the sampling frame, or collecting the data.
265
� 2011, Baywood Publishing Co., Inc.
doi: 10.2190/AG.72.3.f
http://baywood.com

Organizational volunteering has been defined as an unpaid activity that involves
“taking actions within an organizational framework that potentially provides
some service to one or more other people or to the community at large” (Piliavin
& Siegl, 2007, p. 454). For the12-month period from September 2007 through
August 2008, the U.S. Department of Labor reported that the rate of volunteering
among people 16 years old and older in the United States was 26.4%. The median
number of hours volunteered in this population was 52 hours. It was estimated
that the aggregate number of hours volunteered per year in the United States
exceeded 3 billion hours. With respect to societal benefits, economists estimated
that the monetary contribution associated with volunteering in the United States
exceeded 65 billion dollars (U.S. Department of Labor, 2009). Volunteering has
been touted as having a positive impact not only on society, but also on the
individuals who provide assistance to others (Gottlieb & Gillespie, 2008).
The current study was designed to address the question of whether there are
individual differences in the benefits that adults derive from volunteering. More
specifically, we carried out a secondary data analysis of a state-wide survey in
Arizona to investigate whether the relations between volunteering and measures
of subjective and psychological well-being vary according to differences in
number of chronic health conditions and age.
Researchers have distinguished between the higher-order constructs of sub-
jective well-being and psychological well-being (Linley, Maltby, Wood, Osborne,
& Hurling, 2009). Subjective well-being consists of three components—pleasant
emotions, unpleasant emotions, and judgments of life satisfaction (Diener, Suh,
Lucas, & Smith, 1999). In contrast, psychological well-being has been defined
as engagement with the existential challenges of life, such as maintaining a
sense of purpose in the face of hardships (Keyes, Shmotkin, & Ryff, 2002).
Linley et al. (2009) demonstrated that although they were correlated, indicators of
subjective well-being and indicators of psychological well-being load on different
factors. The data set that we used to test our hypotheses contained scales assessing
two components of subjective well-being (positive affect and negative affect)
and one component of psychological well-being (resilience).
THEORETICAL FOUNDATION FOR THE STUDY
Several mediators have been proposed to account for the beneficial effect of
volunteering on measures of subjective and psychological well-being including
increasing social integration and connectedness, enhancing the meaning of life,
coping better with stress due to a greater focus outside of self, fostering com-
petence, and promoting a more active and healthier life style (Midlarsky &
Kahana, 1994). In contrast, researchers have paid less attention to identifying
moderators of the association between volunteering and measures of subjective
and psychological well-being. There are different views regarding who benefits
the most from volunteering. In the context of the association between volunteering
266 / OKUN ET AL.

and mortality, Oman (2007) formulated two alternative hypotheses regarding
moderator variables. The complementary hypothesis posits that the benefits of
volunteering are more pronounced among individuals with ample psychosocial
resources. This hypothesis is based on the notion that individuals with favorable
psychosocial resources are best positioned to capitalize from performing volunteer
service. In contrast, the compensatory hypothesis proposes that the benefits of
volunteering are more pronounced among individuals with limited psychosocial
resources. This hypothesis is based on the notion that volunteering is a role that
enhances psychosocial resources and thus it helps to offset unfavorable life
circumstances.
Empirical Foundation for the Study
The Relation between Volunteering and Well-Being
Numerous cross-sectional studies have found a positive relation between volun-
teering and subjective well-being (Borgonovi, 2008; Bull & Aucoin, 1975; Carp,
1968; Dulin & Hill, 2003; Dye, Goodman, Roth, Bley, & Jensen, 1973; Edwards
& Kleemack, 1973; Fengler, 1984; Graney, 1975; Harlow & Cantor, 1996;
Herzog, Franks, Markus, & Holmberg, 1998; Hunter & Linn, 1981; McIntosh &
Danigelis, 1995; Schwartz, Meisenhelder, Ma, & Reed, 2003; Windsor, Anstey,
& Rodgers, 2008). In a meta-analysis of mostly cross-sectional studies, Wheeler,
Gorey, and Greenblatt (1998) examined the relation between volunteering and
life satisfaction. Based on 29 studies, they found that the average volunteer was
located at the 70th percentile in the distribution of life satisfaction scores for
non-volunteers. It should be noted that these cross-sectional studies did not
address the question of the causal direction of the effects. Therefore, it is note-
worthy that several longitudinal studies have provided additional support for
the hypothesis that volunteering is positively related to feelings of well-being
(Greenfield & Marks, 2007; Hao, 2008; Lum & Lightfoot, 2005; Morrow-Howell,
Hinterlong, Rozario, & Tang, 2003; Musick & Wilson, 2003; Piliavin & Siegl,
2007; Van Willigen, 2000).
Moderators of the Relation between
Volunteering and Well-Being
A few studies have investigated whether age moderates the association between
volunteering and well-being. In an initial study, Van Willigen (2000) used two
waves of data from the Americans’ Changing Lives data set. She classified
participants as “younger” (24-59 years old) and “older” (60 years old and older)
and examined the relations between volunteering and life satisfaction. Among
older adults, the relation between hours volunteered was linear and positive
whereas among young adults volunteering had a beneficial impact on life satis-
faction for those who volunteered approximately 70 hours per year or less but it
VOLUNTEERING AND WELL-BEING / 267

had an detrimental effect on life satisfaction for those who volunteered more
than 140 hours per year.
Musick and Wilson (2003) used three waves of data from the Americans’
Changing Lives data set. They classified participants as “younger” (24-64 years
old) and “older” (65 years old and older) and examined the association between
volunteering at baseline and sustained volunteering on changes in depressive
symptoms. They found that older adults benefitted in terms of a reduction
in depression symptoms from volunteering at baseline but younger volunteers
did not. For both younger and older adults alike, sustained volunteering was
associated with a reduction in depressive symptoms. However, the benefits of
sustained volunteering were more pronounced in the older, as compared to the
younger, age group. Finally, in a third study using three waves of data from the
Americans’ Changing Lives data set, Morrow-Howell et al. (2003) examined the
relations between volunteering and self-rated health, functional limitations, and
depressive symptoms among participants 60 years old and older. They found that
volunteering had a greater benefit with increased age for functional limitations and
depressive symptoms (but not for perceived health).
A handful of studies have examined health as a moderator of the benefits of
volunteering. Consistent with the complementary hypothesis, Sabin (1993) found
that volunteering lowered the risk of dying during the mortality surveillance
period only for participants who were in good health and had no functional
limitations. In contrast, the findings of three other studies supported the compen-
satory perspective. In a longitudinal study, Morrow-Howell et al. (2003) found
that the relation between previous functional limitations and subsequent func-
tional limitations was lower among volunteers than non-volunteers. In another
longitudinal study, Greenfield and Marks (2007) demonstrated that functional
limitations were associated with a decrease in personal growth (an indicator of
psychological well-being) only among older adults who were not continuously
involved with religious voluntary groups. More recently, in a prospective study,
Okun, August, Rook, and Newsom (2010) reported that the difference in the
risk of dying during the mortality surveillance period between older adults who
volunteered never or almost never and those who volunteered more frequently
than never or almost never increased as functional limitations increased.
Opposing Hypotheses Regarding Age and
Chronic Health Conditions as Moderators
Aging is accompanied by the loss of roles (Moen, Dempster-McClain, &
Williams, 1992) and by a lesser sense of purpose in life (Ryff, 1995). On the one
hand, from the perspective of the complementary hypothesis, the decline of
psychosocial resources with age suggests that the relation between volunteering
and subjective and psychological well-being will be stronger among younger
than older adults. However, Van Willigen (2000) posited that in the face of role
268 / OKUN ET AL.

losses, volunteering may be an especially meaningful, self-determined role that
creates a salient identity for older adults. In contrast, for younger adults, volun-
teering may be an offshoot of seeking (e.g., finding a job) and performing
(parenting) other roles. Thus, on the other hand, from the perspective of the
compensatory hypothesis, it can be predicted that the association between volun-
teering and measures of subjective and psychological well-being will be stronger
among older than younger adults.
Chronic health conditions are inversely related to psychosocial resources
such as self-esteem (Vilhjalmsson, 1998). Thus, according to the complementary
hypothesis, the association between volunteering and measures of subjective and
psychological well-being will be stronger as chronic health conditions decrease.
In contrast, the compensatory hypothesis makes the alternative prediction that
the association between volunteering and measures of subjective and psycho-
logical well-being will be stronger as chronic health conditions increase.
The Issue of Control Variables
There are multiple models that can be posited to account for the relations among
volunteering, health, age, and well-being and these models are not necessarily
mutually exclusive. For example, there may a reciprocal relation between volun-
teering and well-being such that volunteering promotes well-being (i.e., social
causation) and low levels of well-being are a barrier to volunteering (i.e., selection
effects) (Morrow-Howell, 2010). In the present study, we assumed that volun-
teering is an antecedent of subjective and psychological well-being. In light of
this assumption, we controlled for several types of variables including socio-
demographic characteristics (e.g., education), life style variables (e.g., partici-
pation in vigorous exercise), and indicators of social capital (e.g., neighborhood
social cohesion) that have been shown to be associated with volunteering, chronic
health conditions, age, and measures of subjective and psychological well-being.
METHOD
The Sample
The sample consisted of 4,196 respondents of the 2008 Arizona Health Survey
(AHS). A list-assisted random-digit dialing (RDD) approach was used to recruit
a sample representative of the adult residential population of Arizona. This
approach is the current standard method of choice for telephone surveys (Tucker,
Lepkowski, & Piekarski, 2002). Households were randomly selected from com-
prehensive telephone lists, and residents within households were then randomly
selected for participation. Households sampled for the survey excluded group
households of more than nine unrelated persons (e.g., communes, convents,
or dormitories), institutional facilities (e.g., prisons, nursing homes, residential
VOLUNTEERING AND WELL-BEING / 269

treatment facilities), the homeless, and those living in military barracks. People
living in residences without landlines were excluded from the sample.
In list-assisted sampling, a random sample of telephone numbers is drawn from
sets of 100 telephone numbers that cover the geographical region. Each set
contains 100 telephone numbers with the same first eight digits, with the last two
digits ranging from 00 to 99. A total of 129,250 telephone numbers were selected.
Procedures were implemented to purge out-of-scope telephone numbers, such
as nonresidential and nonworking numbers. The remaining 47,392 telephone
numbers were contacted for screening interviews. When addresses could be
obtained (approximately 58%), prospective participants were sent an advance
letter in English and Spanish prior to the initiation of calls. Screening interviewers
identified an adult of 18 years or older to serve as household informant, deter-
mined whether the phone number was associated with a residence, and ascertained
how many adults resided in the household. If more than one adult resided in
the household, a sample selection algorithm (Rizzo, Brick, & Park, 2004) was
used that was designed to ensure an equal probability of being selected for each
adult based on the number of adults in the household. A more detailed account of
AHS design and methodology is available for download online (AHS, 2008).
Measures
We assessed two aspects of subjective well-being (positive affect and negative
affect) and one aspect of psychological well-being (resilience).
Positive Affect
Positive affect was measured with the five-item World Health Organization’s
Well-Being Index (WHO-5) (Bech, 2004). Using a time frame of 30 days,
respondents were asked how often they felt “cheerful and in good spirits,” “active
and vigorous,” “calm and relaxed,” “awakened feeling fresh and rested,” and
“daily life was full of things that interest you.” Respondents rated the items on a
5-point scale (1 = all of the time, 5 = none of the time). After recoding each
item, item mean scores were created. Higher scores indicate greater positive
affect. The actual and potential minimum and maximum values were 1 and 5,
respectively. By and large, participants experienced moderately high levels of
positive affect (M = 3.69, SD = 0.69). The internal consistency reliability for
the measure of positive affect, as estimated by coefficient alpha, was .79.
Negative Affect
Negative affect was assessed with six-items from the Kessler Psychological
Distress Scale (K10) (Kessler, Andrews, Colpe, Hiripi, Mroczek, Normand,
et al., 2002). Using a time frame of 30 days, respondents were asked how
often they felt “nervous,” “hopeless,” “restless or fidgety,” “so depressed so that
270 / OKUN ET AL.

nothing could cheer you up,” “that everything was an effort,” and “worthless.”
Respondents rated the items on a 5-point scale (1 = all of the time, 5 = none of
the time). After recoding each item, item mean scores were created. Higher
scores indicate greater negative affect. Whereas the actual and potential minimum
value was the same (i.e., 1), the actual and potential maximum values were 4.83
and 5, respectively. Overall, participants reported fairly low levels of negative
affect (M = 1.57, SD = 0.60). The internal consistency reliability for the measure
of negative affect, as estimated by coefficient alpha, was .80.
Resilience
Resilience was measured with an abbreviated version of the Connor-Davidson
Resilience Scale (CD-RISC) (Connor & Davidson, 2003). Using a time frame of
30 days, participants responded to six statements pertaining to:
1. adapting when changes occur;
2. bouncing back after illness, injury, or other hardships;
3. achieving goals in the face of obstacles;
4. strength in dealing with life’s challenges;
5. having a strong sense of purpose; and
6. feeling in control of one’s life.
Respondents rated the items on a 5-point scale (1 = all of the time, 5 = none of
the time). After recoding each item, item mean scores were created. Higher scores
indicate greater resilience. The potential and actual minimum and maximum
values were 1 and 5, respectively. In general, participants reported that they
were very resilient (M = 4.26, SD = 0.61). The internal consistency reliability
for the measure of resilience, as estimated by coefficient alpha, was .82.
Volunteer Status
Respondents were asked, “In the past 12 months have you performed any
volunteer services, such as with a church, school, or civic groups, an arts,
health, or social service agency, or similar organization?” A dummy variable was
created in which participants who did not volunteer during the past year were
coded 0 and participants who volunteered during the past year were coded 1.
Forty-nine percent of the participants indicated that they had volunteered during
the past year.
Number of Chronic Health Conditions
Chronic health conditions refer to diagnosed physical, cognitive, and emo-
tional ailments that are expected to be of lengthy duration or permanent
(van der Lee, Mokkink, Grootenhuis, Heymans, & Offringa, 2007). We focused
on chronic physical conditions that participants were told they had by their
VOLUNTEERING AND WELL-BEING / 271

physicians. We reasoned that including chronic emotional health conditions
would result in contamination between our measure of chronic health condi-
tions and our measures of subjective and psychological well-being, and that
people with severe cognitive problems were unlikely to be able to respond to the
survey questions.
Participants were asked whether a doctor had ever told them that they had
each of the following conditions: asthma, diabetes, high blood pressure, heart
disease, arthritis, gout, lupus, or fibromyalgia, and a gastrointestinal, stomach, or
digestive disorder. For each chronic health condition, responses of “no” were
coded 0 and responses of “yes” were coded 1. The percentages of the sample
with each of the six chronic conditions were as follows: asthma (15%), diabetes
(11%), hypertension (37%), heart disease (16%), arthritis, gout or fibromyalgia
(34%), and a gastrointestinal, stomach, or digestive disorder (20%). A (lifetime)
number of chronic health conditions score was created by summing across the
six binary variables, with possible values ranging from 0 to 6. The mean number
of chronic health conditions was 1.33 (SD = 1.27).
Age
Participants were asked, “What is your age, please?” The age of the participants
ranged from 18 to 96 years old with a mean of 56.45 years old (SD = 17.43).
Control Variables
Sociodemographic control variables included gender, ethnicity/race, and edu-
cational attainment. Participants were asked, “Are you male or female?” Male
respondents were assigned a code of 0 and female respondents were assigned a
code of 1 to represent gender. The majority of the participants were women (63%).
We used survey items to assess Hispanic ethnicity and race. First, respondents
were asked to report whether or not they were “Latino or Hispanic.” Fourteen
percent of the participants indicated that they were Hispanic. Second, respondents
were asked seven “yes/no” questions regarding whether they were: (a) White,
(b) African American, (c) Native American or Alaskan Native, (d) Asian,
(e) Native Hawaiian, (f) other Pacific Islander, and (g) some other race. The racial
composition of the sample was: White (86%), African American (3%), American
Indian/Alaskan Native (2%), Asian (1%), Native Hawaiian or Other Pacific
Islander (0%), some other race (6%), and two or more races (2%). For the purposes
of the current study, only responses to the Hispanic ethnicity item were used
as a variable in the main statistical analyses. Non-Hispanics were coded 0 and
Hispanics were coded 1.
Educational attainment was assessed by asking respondents “What is the high-
est grade of education you have completed and received credit for?” Responses
were coded into a set of four dummy variables: high school graduate, some
college, college graduate, and some graduate course work or above. The reference
272 / OKUN ET AL.

group was less than a high school degree. Nine percent of participants did not
obtain a high school degree, 28% graduated from high school, 28% had some
college education, 19% obtained a college degree, and 16% had done at least
some post-baccalaureate course work.
Life style control variables included time spent working and engaging in
vigorous exercise. Respondents were asked, “How many hours per week do you
usually work at all jobs or businesses?” Fifty-one percent of the participants
were working (M = 20.80, SD = 22.52). Participants were asked to think about
vigorous activities they do that take hard physical effort, such as aerobics, running,
soccer, fast bicycling, or fast swimming. Then they were asked whether, in a
typical week, they do any vigorous physical activities. If respondents answered
in the affirmative, they were asked the number of days per week that they
typically engage in vigorous exercise. The mean number of days of vigorous
exercise per week was 1.27 (SD = 1.96).
Social capital control variables included marital status, number of household
members, number of family members living nearby, and neighborhood social
cohesion. Participants were asked whether they were married or living with a
partner, divorced, separated, widowed, or never married. A dummy variable was
created in which participants who were not married or living with a partner
were coded 0 and participants who were married or living in a marriage-like
relationship were coded 1. Fifty-seven percent of the participants were married
or living with a partner, 16% were widowed, 16% were divorced or separated,
and 11% had never married.
The number of people living in the household was assessed by summing
responses to three questions that asked about the number of: (a) children
(< 12 years old), (b) adolescents (12-17 years old), and (c) adults in the household
including the participant. The mean size of the households was 2.43 people
(SD = 1.58). The number of family members living nearby was assessed by asking
participants, “Not counting the people who live with you, how many other
adult family members live within an hour’s drive of your home?” The mean
number of adult family members living within an hour’s drive of the participant’s
residence was 3.29 (SD = 6.31).
Neighborhood social cohesion was assessed using a five-item subscale from
the Collective Efficacy Scale (Sampson, Raudenbush, & Earls, 1997). Sample
items included “people in this neighborhood can be trusted” and “people in this
neighborhood do NOT share the same values,” Respondents rated the items
on a 4-point scale (1 = strongly agree, 4 = strongly disagree). After recoding
positively worded statements, mean scores across items were created. The
sample mean on the neighborhood social cohesion scale of 3.13 (SD = 0.46)
indicates that, on average, participants were midway between agreeing and
strongly agreeing with the positive end of each neighborhood social cohesion
item. The internal consistency reliability for the Neighborhood Social Cohesion
scale, as estimated by coefficient alpha, was .77.
VOLUNTEERING AND WELL-BEING / 273
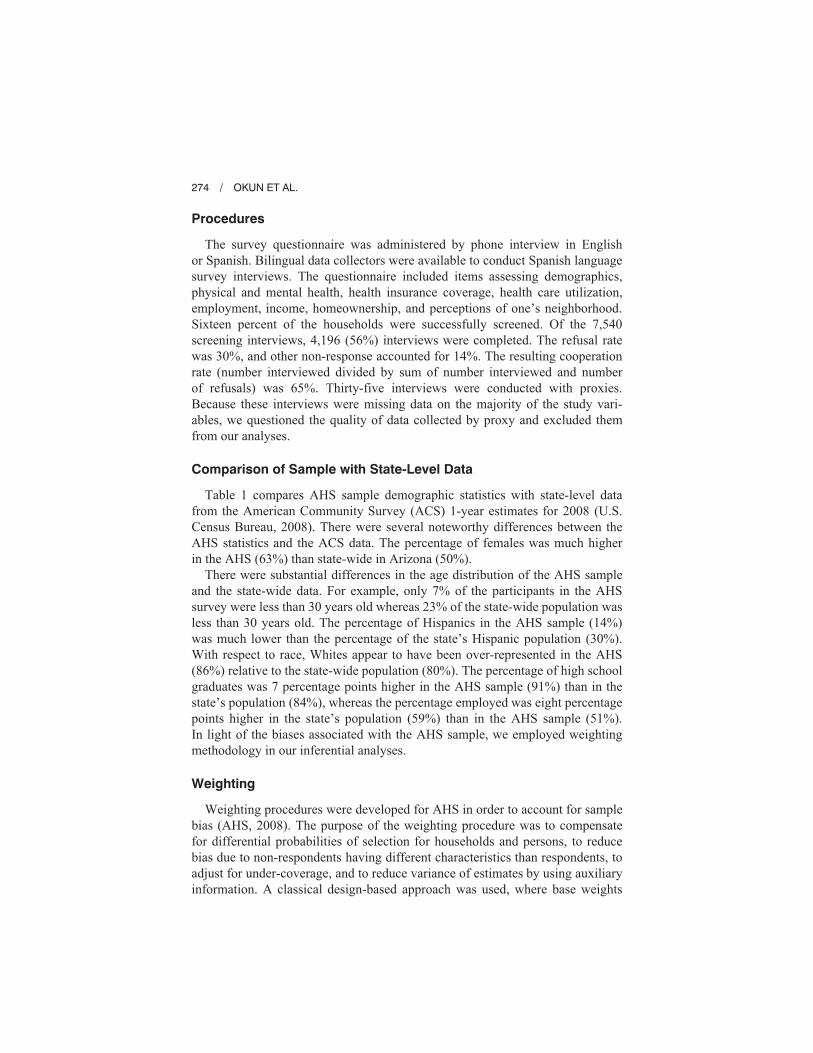
Procedures
The survey questionnaire was administered by phone interview in English
or Spanish. Bilingual data collectors were available to conduct Spanish language
survey interviews. The questionnaire included items assessing demographics,
physical and mental health, health insurance coverage, health care utilization,
employment, income, homeownership, and perceptions of one’s neighborhood.
Sixteen percent of the households were successfully screened. Of the 7,540
screening interviews, 4,196 (56%) interviews were completed. The refusal rate
was 30%, and other non-response accounted for 14%. The resulting cooperation
rate (number interviewed divided by sum of number interviewed and number
of refusals) was 65%. Thirty-five interviews were conducted with proxies.
Because these interviews were missing data on the majority of the study vari-
ables, we questioned the quality of data collected by proxy and excluded them
from our analyses.
Comparison of Sample with State-Level Data
Table 1 compares AHS sample demographic statistics with state-level data
from the American Community Survey (ACS) 1-year estimates for 2008 (U.S.
Census Bureau, 2008). There were several noteworthy differences between the
AHS statistics and the ACS data. The percentage of females was much higher
in the AHS (63%) than state-wide in Arizona (50%).
There were substantial differences in the age distribution of the AHS sample
and the state-wide data. For example, only 7% of the participants in the AHS
survey were less than 30 years old whereas 23% of the state-wide population was
less than 30 years old. The percentage of Hispanics in the AHS sample (14%)
was much lower than the percentage of the state’s Hispanic population (30%).
With respect to race, Whites appear to have been over-represented in the AHS
(86%) relative to the state-wide population (80%). The percentage of high school
graduates was 7 percentage points higher in the AHS sample (91%) than in the
state’s population (84%), whereas the percentage employed was eight percentage
points higher in the state’s population (59%) than in the AHS sample (51%).
In light of the biases associated with the AHS sample, we employed weighting
methodology in our inferential analyses.
Weighting
Weighting procedures were developed for AHS in order to account for sample
bias (AHS, 2008). The purpose of the weighting procedure was to compensate
for differential probabilities of selection for households and persons, to reduce
bias due to non-respondents having different characteristics than respondents, to
adjust for under-coverage, and to reduce variance of estimates by using auxiliary
information. A classical design-based approach was used, where base weights
274 / OKUN ET AL.

VOLUNTEERING AND WELL-BEING / 275
Table 1. Comparison of AHS Sample to State
Characteristics
Variable
AHS
(%)
State
(%)a
Gender
Male
Female
Ethnicity
Hispanic or Latino
Non-Hispanic or Latino
Race
White
African American
Native American or Alaska Native
Asian
Native Hawaiian or other
Pacific Islander
Some other race
Two or more races
Age
18-29 years old
30-39 years old
40-49 years old
50-59 years old
60-69 years old
70-79 years old
80+ years old
Education
High school graduate or higher
Employment
Employed
37%
63%
14%
86%
86%
3%
2%
1%
0%
6%
2%
7%
12%
16%
20%
19%
16%
10%
91%
51%
50%
50%
30%
70%
80%
4%
4%
2%
0%
7%
3%
23%
19%
18%
15%
12%
8%
5%
84%b
59%c
aState percentages refer to percentage of total population, unless otherwise specified.
In contrast, the AHS sample includes only the adult residential population of Arizona,
age 18 and over.
bPercentage of population age 25 years and over.cPercentage of population age 16 years and over in the civilian labor force.

were constructed from the inverse of the probabilities of selection for each
household. Base weights were then corrected using sub-sampling factor adjust-
ments to account for unequal probabilities of selection resulting from differ-
ences in sampling rates due to sampling and recruitment procedures, such as
refusal conversion sub-sampling, and stratification by telephone numbers with
and without mailing addresses.
Next, person weights were calculated for each respondent, taking into consider-
ation household weighting. Weights were further adjusted using raked weights.
Raking factors were used to compute weights that would adjust the survey sample
to population totals balanced on important demographic characteristics (AHS,
2008). In this procedure, initial person weights were raked to known control
totals. Control totals were identified using population estimates according to
the Arizona Department of Commerce Population estimates and the American
Community Survey estimates for Arizona (Arizona Department of Commerce,
2006; U.S. Census Bureau, 2008). The six raking dimensions were created by
combining demographic variables of age, sex, race, and ethnicity, and geographic
areas (Maricopa County and the remainder of the state). These variables are
correlated with characteristics of households without a landline telephone, such
as household tenure and education level.
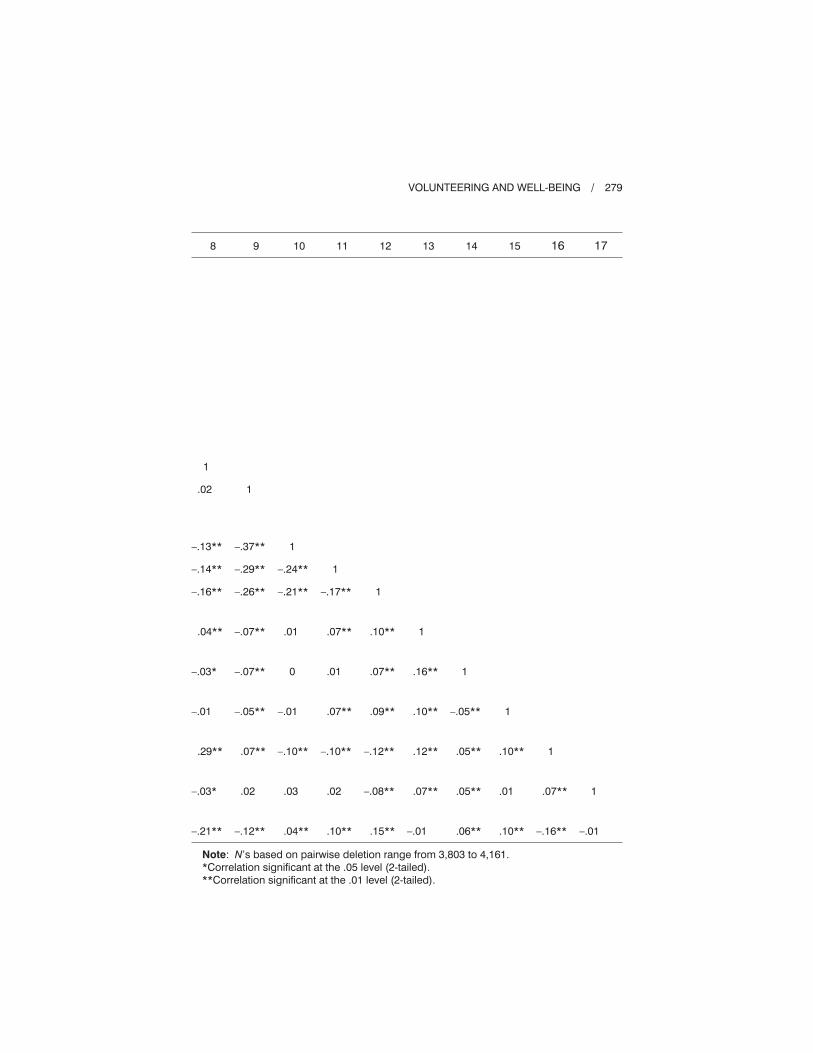
RESULTS
Correlations among the Study Variables
Table 2 presents the correlations among the study variables. The maximum
amount of variance shared by the measures of subjective and psychological
well-being was 35%, indicating that the three measures of well-being were not
equivalent to each other. Similarly, the relations between volunteer status and
the measures of subjective and psychological well-being were modest in mag-
nitude, with the absolute values of the correlations ranging from .11 to .15.
Number of chronic health conditions was positively correlated with negative
affect scores (r = .09) and inversely related to both positive affect (r = –.15)
and resilience (r = –.12) scores. Age was positively correlated with positive affect
(r = .09) and resilience (r = .06), and inversely related to negative affect (r = –.17)
scores. As expected, age was positively correlated with number of chronic health
conditions (r = .46). Age (r = .01) and number of chronic health conditions
(r = –.05) were weakly related to volunteering.
Among the control variables, neighborhood social cohesion exhibited the
strongest association with the well-being measures (the absolute values of the
correlations ranged from .17 to .21). The strongest correlate of age was house-
hold size (r = –.51) and the strongest correlate of number of chronic health
conditions was hours working per week (r = –.25). Among the control variables,
neighborhood social cohesion (r = .17) exhibited the strongest associations with
volunteer status.
276 / OKUN ET AL.

Tests of Moderator Variables
We tested for moderation using multiple regression. To account for complex
sample weights and partial missingness in the data, we used Mplus (Muthén
& Muthén, 1998-2006). Partial missingness in the context of our analyses
refers to missing values on any of the predictor variables. None of the cases
had missing values on the dependent variables, so all 4,161 of the cases were
included. Full-information maximum likelihood with robust standard errors
was used for estimation. For each of the three dependent variables (negative
affect, positive affect, and resilience), separate multiple regression analyses
were carried out. In these models, we centered age and chronic health condi-
tions. This was accomplished for each variable by subtracting the mean
from each score. Centering does not affect tests of interaction effects but
aids in the interpretation of main effects in the context of interaction effects
(Aiken & West, 1991). In these models, we included the main effects of the
covariates, volunteer status, centered age, centered chronic health conditions,
and the volunteer status by centered age and volunteer status by centered
chronic health conditions interaction effects. In the absence of any signifi-
cant (p < .05) interaction effects, we present a trimmed model containing only
main effects.
Table 3 summarizes the results of the regression analyses. Asterisks indicate
whether a coefficient was significantly different than 0 at the .05 level. The
volunteer status by chronic health conditions interaction term was statistically
significant (p < .05) in the models predicting positive affect and resilience
scores, but was not statistically significant (p > .05) in the model predicting
negative affect. The volunteer status by age interaction term was not significant
(p > .05) in any of the models. The R2 for the trimmed model predicting nega-
tive affect scores was .13 whereas the R2 for predicting positive affect scores
and resilience scores was .14 in both models. The volunteer status by chronic
health conditions interaction effect uniquely increased the R2 in the models
predicting both positive affect and resilience by .003.
In the model with positive affect scores as the dependent variable, the unstan-
dardized coefficient for the interaction between volunteering and health was .07.
A simple slopes plot of this interaction effect using values of 0, 1, and 2 chronic
health conditions (M = 1.05, SD = 1.18) indicates that the relation between
volunteering and positive affect scores tends to increase as the number of chronic
conditions increases (see Figure 1).
Similarly, the unstandardized coefficient for the interaction between
volunteering and number of chronic conditions in the model with resilience
scores as the dependent variable was .07. A simple slopes plot of this inter-
action effect indicates that the relation between volunteering and resilience
scores tends to increase as the number of chronic conditions increases (see
Figure 2).
VOLUNTEERING AND WELL-BEING / 277

278 / OKUN ET AL.
Table 2. Correlation Coefficients among the Study Variables
Variable 1 2 3 4 5 6 7
1. Negative affect
2. Positive affect
3. Resilience
4. Organizational
volunteering
5. Count of chronic
health conditions
6. Age
7. Female
8. Hispanic
9. Graduated high
school and some
trade school
10. Some college
11. College degree
12. Beyond a college
degree
13. Hours working
per week
14. Vigorous exercise
days per week
15. Married or living
with partner
16. Number of people
in household
17. Number or nearby
family members
18. Neighborhood
cohesion scale
1
–.59**
–.56**
–.14**
.09**
–.17**
.07**
.07**
.06**
0
–.10**
–.13**
–.07**
–.04**
–.13
.10
.04
–.21
1
.59**
.11**
–.15**
.09**
–.07**
.09**
–.04**
–.04*
.03
.05**
.06**
.16**
.07
.01
–.03
.17
1
.15**
–.12**
.06**
–.10**
–.02
–.04*
0
.08**
.12**
.17**
.12**
.12
–.04
.05
.20
1
–.05**
.01
.02
–.15**
–.13**
.03*
.14**
.16**
.06**
.11**
.09
–.04
.03
.17
1
.46**
.09**
–.11**
.02
.07**
–.02
–.03*
–.25**
–.19**
.01
–.23**
.01
.01
1
.05**
–.22**
–.03
.03*
.04**
.11**
–.35**
–.20
.10**
–.51**
–.14**
.20**
1
–.03*
.02
.03*
–.01
–.03*
–.26**
–.15**
–.04**
–.04**
–.02
.04*
VOLUNTEERING AND WELL-BEING / 279
8 9 10 11 12 13 14 15 16 17
1
.02
–.13**
–.14**
–.16**
.04**
–.03*
–.01
.29**
–.03*
–.21**
1
–.37**
–.29**
–.26**
–.07**
–.07**
–.05**
.07**
.02
–.12**
1
–.24**
–.21**
.01
0
–.01
–.10**
.03
.04**
1
–.17**
.07**
.01
.07**
–.10**
.02
.10**
1
.10**
.07**
.09**
–.12**
–.08**
.15**
1
.16**
.10**
.12**
.07**
–.01
1
–.05**
.05**
.05**
.06**
1
.10**
.01
.10**
1
.07**
–.16**
1
–.01
Note: N’s based on pairwise deletion range from 3,803 to 4,161.
*Correlation significant at the .05 level (2-tailed).
**Correlation significant at the .01 level (2-tailed).

DISCUSSION
Grimm, Spring, and Dietz (2007, p. 13) concluded from their review of the
literature that, “When individuals volunteer, they not only help their community
but also experience better health in later years, whether in terms of greater
longevity, higher functional ability, or lower rates of depression.” This conclusion
ignores the possibility that there are individual differences in who benefits the
most from volunteering. The present study tested the hypotheses that number of
chronic health conditions and age moderate the association between volunteering
and subjective and psychological well-being.
280 / OKUN ET AL.
Table 3. Unstandardized Regression Coefficients and Standard Errors
for the Multiple Regression Models
Positive
affect Resilience
Negative
affect
Predictor b SE b SE b SE
Female
Hispanic
High school degree
Some college
College degree
Graduate studies
Hours working
Vigorous exercise
Marital status
Household size
Family members nearby
Neighborhood social cohesion
Volunteering
Number of chronic health
conditions
Age
Volunteering*Number of
chronic health conditions
Volunteering*Age
–.03
.26*
.00
–.02
.02
–.01
.00*
.05*
.04
.02
.00
.20*
.07
–.15*
.01*
.07*
.00
.03
.05
.06
.06
.06
.06
.00
.01
.04
.01
.00
.04
.09
.02
.00
.03
.00
–.07*
.14*
.20*
.20*
.25*
.29*
.00*
.03*
.08*
.01
.01*
.20*
.16
–.10*
.01*
.07*
.00
.03
.04
.06
.06
.06
.06
.00
.01
.04
.01
.00
.04
.10
.02
.00
.02
.00
.06*
–.07
–.14*
–.16*
–.24*
–.25*
–.00*
–.01
–.09*
.00
.00
–.17
–.10*
.09*
–.01*
—
—
.03
.04
.06
.06
.05
.05
.00
.01
.03
.01
.00
.04
.03
.01
.00
—
—
*Statistically significant at the .05 level.

VOLUNTEERING AND WELL-BEING / 281
Figure 2. Simple slopes for predicted resilience scores.
Note that the values of the non-displayed predictors were set to the
mean for quantitative variables and the mode for categorical variables.
Figure 1. Simple slopes for predicted positive affect scores.
Note that the values of the non-displayed predictors were set to the
mean for quantitative variables and the mode for categorical variables.

The notion that the benefits of volunteering are more pronounced for indi-
viduals with greater psychosocial resources is referred to as the complementary
hypothesis and the notion that volunteering is more beneficial for individuals
with diminished psychosocial resources is labeled the compensatory hypothesis
(Oman, 2007). Consistent with the compensatory hypothesis, we demonstrated
that as the number of chronic health conditions increased, the relations between
volunteering and (a) positive affect scores, and (b) resilience scores increased.
Although Sabin (1993) did not find support for the compensatory hypothesis,
several other researchers have shown that the benefit of volunteering increases
as health (Greenfield & Marks, 2007; Okun et al., 2010) and other personal
resources (Fengler, 1984; Greenfield & Marks, 2004) decrease.
Adults with chronic health conditions tend to have lower self-esteem
(Vilhjalmsson, 1998), and thus may benefit the most from volunteering with
respect to well-being. Volunteering may have a particularly viable role for
boosting self-esteem because it has been linked to perceptions that other
people feel that one is useful (Gruenewald, Karlmangla, Greendale, Singer, &
Seeman, 2007). Furthermore, in an experimental field study, Midlarsky and
Kahana (1994) demonstrated that, relative to a control group, older adults who
were given individually tailored persuasive communications about the benefits
of volunteering were more likely to volunteer and had higher self-esteem.
Self-esteem, in turn, is strongly related to feelings of well-being (DeNeve &
Cooper, 1998).
It is important to note that the mechanism underlying the joint effect of
volunteering and number of chronic health conditions on positive affect and
resilience could reflect other dimensions of the self such as sense of belonging
(Midlarsky & Kahana, 1994), sense of mattering (Piliavin & Siegl, 2007), and
agentic self-concept (Herzog et al., 1998). Studies of adults with and without
chronic health conditions in which volunteering is manipulated and measures
of various dimensions of the self as well as measures of subjective and psycho-
logical well-being are administered post-treatment could shed light on the
dynamics underlying the joint effects of volunteering and health.
Consistent with other studies, the volunteering by health interaction effect
was not observed across all of the well-being measures (Greenfield & Marks,
2004, 2007). Although more research is needed, the joint effect of volunteering
and personal resources appears to be strongest for measures of psychological
well-being and weakest for measures of negative affect. This configuration of
findings suggests that volunteering may buffer the effects of losses in the health
domain and in other domains by engendering a positive reframing that what
one does matters (Piliavin & Siegl, 2007).
We did not find any evidence that the relation between volunteering and
well-being varied with age. One possible explanation for our failure to detect
an interaction between volunteer status and age has to do with the measure of
volunteering used in the AHS. Instead of assessing frequency of volunteering
282 / OKUN ET AL.

or hours volunteered, in the AHS, participants were simply asked whether they
had volunteered during the past year. In Van Willigen’s (2000) study, she did not
find a volunteering by age interaction on life satisfaction when she used a
dichotomous measure of volunteering (non-volunteer versus volunteer). Instead,
she found that age moderated the relation between hours volunteered and life
satisfaction. Therefore, the yes/no measure of volunteering used in the AHS
may have been too crude to detect the moderating influence of age on the asso-
ciation between volunteering and our measures of subjective and psychological
well-being. Another possibility is that previous research on the joint effect of
volunteering and age on measures of well-being which used earlier birth cohorts
does not generalize over historical time to more recent birth cohorts.
Limitations
The current study had several limitations. First, because we employed a cross-
sectional, non-experimental design, we cannot address the question of the causal
relations among volunteering, health, and subjective and psychological well-
being. For example, from the perspective of a selection effect model, resilience
may foster volunteering and this effect may be particularly strong among adults
with chronic health conditions.
Second, the scales available in the AHS to serve as indicators of subjective
and psychological well-being have not been used by other researchers studying
moderators of the association between volunteering and well-being. Future
research could address this limitation by including the scales used in the AHS
as well as more mainstream measures of subjective (Diener et al., 1999) and
psychological (Ryff, 1995) well-being. Third, the AHS included only one yes-no
question about volunteering. When other measures, such as hours volunteered are
employed, researchers can determine whether the linear and quadratic relations
between volunteering and measures of subjective and psychological well-being
vary by number of chronic health conditions (Windsor et al., 2008).
Fourth, because functional limitations were not assessed in the AHS, we were
unable to examine whether the moderating effect of health on the relation between
volunteering and well-being was greater for measures that tap into functional
limitations as opposed to number of chronic health conditions (Okun et al., 2010).
Finally, we accounted for only a modest amount of the variance in our dependent
variables and the effect sizes associated with our significant interaction effects
were very small (i.e., the unique R2 values were less than 1%). One possibility
is that the interaction between chronic health conditions and volunteering varies
with contextual variables such as type of volunteer work, motivation to volun-
teer, and the salience of the volunteer role.
Public Policy Implications
With the baby boomers reaching retirement age, there is growing interest in
tapping into their reservoir of talent by recruiting them to serve as volunteers
VOLUNTEERING AND WELL-BEING / 283

(Gottlieb & Gillespie, 2008). In 2009, legislation was passed designed to sub-
stantially increase the opportunities for volunteering afforded to older adults
(Corporation for National & Community Service, 2010). We have shown in an
age heterogeneous sample that the difference in positive affect and resilience
scores between volunteers and non-volunteers is more pronounced for people
with many, as opposed to few, chronic health conditions. However, individuals
with health problems are less likely to volunteer (Li & Ferraro, 2005). Thus,
somewhat paradoxically, those who may benefit the most from volunteering in
terms of their well-being are least likely to do so.
Physicians are powerful social influence agents with respect to changing the
health behavior of their patients (O’Connor, Rush, Prochaska, Pronk, & Boyle,
2001). Building on this finding and the knowledge that personal appeals are
an effective approach to recruiting volunteers (Smith, 1994), Hirschfelder and
Reilly (2007) described a pilot project in California in which patients recruited
from the Medicare practice of a large HMO receive a volunteerism “prescription”
and information about opportunities to volunteer. The findings from the
current study suggest that such programs could be used to fortify the emotional
well-being of adults with chronic health conditions as well as to address important
social issues.
REFERENCES
Aiken, L. S., & West, S. G. (1991). Testing and interpreting interactions. Newbury Park,
CA: Sage.
Arizona Department of Commerce. (2006). Commerce population estimates and projec-
tions. Accessed from http://www.azcommerce.com/EconInfo/Demographics
Arizona Health Survey (AHS). (2008). Design and methodology of the Arizona Health
Survey. Phoenix, AZ: St. Luke’s Health Initiatives.
Bech, P. (2004). Measuring the dimensions of psychological general well-being by the
WHO-5. QoL Newsletter, 32, 15-16.
Borgonovi, F. (2008). Doing well by doing good: The relationship between formal volun-
teering and self-reported and happiness. Social Science & Medicine, 66, 2321-2334.
Bull, N. C., & Aucoin, J. B. (1975). Voluntary association participation and life satis-
faction: A replication note. Journal of Gerontology, 30, 73-76.
Carp, F. M. (1968). Differences among older workers, volunteers, and persons who are
neither. Journal of Gerontology, 23, 497-501.
Connor, K. M., & Davidson, J. R. T. (2003). Development of a new resilience scale: The
Connor-Davidson Resilience Scale (CD-RISC). Depression and Anxiety, 18, 76-82.
Corporation for National & Community Service. (2010, April). Edward M. Kennedy Serve
American Act one year later. Retrieved on June 21, 2010 from http://www.national
service.gov/pdf/10_0421_saa_implementation.pdf
DeNeve, K. M., & Cooper, H. (1998). The happy personality: A meta-analysis of 137
personality traits and subjective well-being. Psychological Bulletin, 124, 197-229.
Diener, E., Suh, E. M., Lucas, R. E., & Smith, H. L. (1999). Subjective well-being:
Three decades of progress. Psychological Bulletin, 125, 276-301.
284 / OKUN ET AL.

Dulin, P., & Hill, R. (2003). Relationships between altruistic activity and positive and
negative affect among low-income older adults service providers. Aging & Mental
Health, 7, 294-299.
Dye, D., Goodman, M., Roth, M., Bley, N., & Jensen, K. (1973). The older adults volun-
teer compared to the nonvolunteer. The Gerontologist, 13, 215-218.
Edwards, J. N., & Kleemack, D. L. (1973). Correlates of life satisfaction: A re-examination.
Journal of Gerontology, 28, 497-502.
Fengler, A. P. (1984). Life satisfaction of subpopulations of elderly. Research on Aging,
6, 189-212.
Gottlieb, B., & Gillespie, A. A. (2008). Volunteerism, health, and civic engagement among
older adults. Canadian Journal on Aging, 27, 399-406.
Graney, M. J. (1975). Happiness and social participation in aging. Journal of Gerontology,
30, 701-706.
Greenfield, E. A., & Marks, N. F. (2007). Continuous participation in voluntary groups
as a protective factor for the psychological well-being of adults who develop func-
tional limitations: Evidence from the National Survey of Families and Households.
Journal of Gerontology: Social Sciences, 62B(1), S60-S68.
Greenfield, E. A., & Marks, N. F. (2004). Formal volunteering as a protective factor
for older adults’ psychological well-being. Journal of Gerontology: Social Sciences,
59B (5), S258-S264.
Grimm, R., Spring, K., & Dietz, N. (2007).The health benefits of volunteering: A review
of recent research. New York: Corporation for National & Community Service.
Gruenewald, T. L., Karlmangla, A. S., Greendale, G. A., Singer, B. H., & Seeman, T. E.
(2007). Feelings of usefulness to others, disability, and mortality in older adults:
The MacArthur Study of Successful Aging. Journal of Gerontology: Psychological
Sciences, 62B(1), P28-P37.
Hao, Y. (2008). Productive activities and psychological well-being among older adults.
Journal of Gerontology: Social Sciences, 63B, S64-S72.
Harlow, R., & Cantor, N. (1996). Still participating after all these years: A study of life
task participation in later life. Journal of Personality and Social Psychology, 71,
1235-1249.
Herzog, A. R., Franks, M. M., Markus, H. R., & Holmberg, D. (1998). Activities and well-
being in older age: Effects of self-concept and educational attainment. Psychology
and Aging, 13, 179-185.
Hirschfelder, M. A., & Reilly, S. L. (2007). Rx: Volunteer a prescription for healthy
aging. In S. G. Post (Ed.), Altruism and health: Perspective from empirical research
(pp. 116-140). New York: Oxford University Press.
Hunter, K. I., & Linn, M. W. (1981). Psychosocial differences between elderly volunteers
and non-volunteers. International Journal of Aging and Human Development, 12,
205-213.
Kessler, R. C., Andrews, G., Colpe, L. J., Hiripi, E. K., Mroczek, D. K., Normand,
S.-L. T., et al. (2002). Short screening scales to monitor population prevalences
and trends in non-specific psychological distress. Psychological Medicine, 32,
959-976.
Keyes, C. L. M., Shmotkin, D., & Ryff, C. D. (2002). Optimizing well-being: The
empirical encounter of two traditions. Journal of Personality and Social Psychology,
82, 1007-1022.
VOLUNTEERING AND WELL-BEING / 285

Li, Y., & Ferraro, K. F. (2005). Volunteering and depression in later life: Social benefit
or selection processes? Journal of Health and Social Behavior, 46, 68-84.
Linley, P. A., Maltby, J., Wood, A. M., Osborne, G., & Hurling, R. (2009). Measuring
happiness: The higher order factor structure of subjective and psychological well-
being measures. Personality and Individual Differences, 47, 878-884.
Lum, T. Y., & Lightfoot, E. (2005). The effects of volunteering on the physical and
mental health of older people. Research on Aging, 27, 31-55.
McIntosh, B. R., & Danigelis, N. L. (1995). Race, gender, and the relevance of productive
aging for elders’ affect. Journal of Gerontology: Social Sciences, 50B, S229-S239.
Midlarsky, E., & Kahana, E. (1994). Altruism in later life. Thousand Oaks, CA: Sage.
Moen, P., Dempster-McClain, D., & Williams, R. (1992). Successful aging: A life-course
perspective on women’s multiple roles and health. American Journal of Sociology, 97,
1612-1638.
Morrow-Howell, N. (2010). Volunteering in later life: Research frontiers. Journal of
Gerontology: Social Sciences, 65B, 461-469.
Morrow-Howell, N., Hinterlong, J., Rozario, P. A., & Tang, F. (2003). Effects of volun-
teering on the well-being of older adults. Journals of Gerontology. Series B: Psycho-
logical Sciences and Social Sciences, 58B, S137-S145.
Musick, M. A., & Wilson, J. (2003). Volunteering and depression: The role of psycho-
logical and social resources in different age groups. Social Science & Medicine, 56,
259-269.
Muthén, L. K., & Muthén, B. O. (1998-2006). Mplus user’s guide (4th ed.). Los Angeles,
CA: Muthén & Muthén.
O’Connor, P. J., Rush, W. A., Prochaska, J. O., Pronk, N. P., & Boyle, R. G. (2001). Pro-
fessional advice and readiness to change behavioral risk factors among members
of a managed care organization? American Journal of Managed Care, 7, 125-130.
Okun, M. A., August, K. J., Rook, K. S., & Newsom, J. T. (2010). Does volunteering
moderate the relation between functional limitations and mortality? Social Science
& Medicine, 71, 1662-1668.
Oman, D. (2007). Does volunteering foster physical health and longevity? In S. G. Post
(Ed.), Altruism and health: Perspectives from empirical research (pp. 15-32). New
York: Oxford University Press.
Piliavin, J. A., & Siegl, E. (2007). Health benefits of volunteering in the Wisconsin
Longitudinal Study. Journal of Health and Social Behavior, 48, 450-464.
Rizzo, L., Brick, J. M., & Park, I. (2004). A minimally intrusive method for sampling
persons in Random Digit Dialing surveys. Public Opinion Quarterly, 68, 267-274.
Ryff, C. D. (1995). Psychological well-being in adult life. Current Directions in Psycho-
logical Science, 4, 99-104.
Sabin, E. P. (1993). Social relationships and mortality among the elderly. Journal of
Applied Gerontology, 12, 44-60.
Sampson, R. J., Raudenbush, S. W., & Earls, F. (1997). Neighborhoods and violent crime:
A multilevel study of collective efficacy. Science, 277, 918-924.
Schwartz, C., Meisenhelder, J. B., Ma, Y., & Reed, G. (2003). Altruistic social interest
behaviors are associated with better mental health. Psychosomatic Medicine, 65,
778-785.
Smith, D. H. (1994). Determinants of voluntary association participation and volunteering:
A literature review. Nonprofit and Voluntary Sector Quarterly, 23, 243-263.
286 / OKUN ET AL.

Tucker, C., Lepkowski, J., & Piekarski, L. (2002). The current efficiency of list-assisted
telephone sampling designs. Public Opinion Quarterly, 66, 321-338.
U.S. Census Bureau. (2008). American Community Survey. Accessed from http:factfinder.
census.gov
U.S. Department of Labor. (2009, January). Volunteering in the United States, 2008.
Retrieved June 6, 2009, from http://www.bls.gov/news.release/pdf/volun.pdf
van der Lee, J. H., Mokkink, L. B., Grootenhuis, M. A., Heymans, H. S., & Offringa, M.
(2007). Definitions and measurement of chronic health conditions in children.
Journal of American Medical Association, 297, 2741-2751.
Van Willigen, M. (2000). Differential benefits of volunteering across the life course.
Journals of Gerontology, Series B: Social Sciences, 55, S308-S318.
Vilhjalmsson, R. (1998). Direct and indirect effects of chronic physical conditions on
depression: A preliminary investigation. Social Sciences & Medicine, 47, 603-611.
Wheeler, J. A., Gorey, K. M., & Greenblatt, B. (1998). The beneficial effects of volun-
teering of older volunteers and the people they serve: A meta-analysis. International
Journal of Aging and Human Development, 47, 69-79.
Windsor, T. D., Anstey, K. J., & Rodgers, B. (2008). Volunteering and psychological
well-being among young-old adults: How much is too much? The Gerontologist,
48, 59-70.
Direct reprint requests to:
Morris A. Okun
Department of Psychology
Arizona State University
Tempe, AZ 85287-1104
e-mail: [email protected]
VOLUNTEERING AND WELL-BEING / 287
Related Documents