DOES THE KYOTO PROTOCOL COST TOO MUCH AND CREATE UNBREAKABLE BARRIERS FOR ECONOMIC GROWTH? ALEXANDER GOLUB, ANIL MARKANDYA, and DOMINIC MARCELLINO We look to the literature on short-term cost models, long-term models based on endogenous growth, and long-term models that assume induced technical change, in order to demonstrate the current understanding of costs, which is the focus of the debate on abating climate change. Using these insights as well as other results—like the role of ancillary benefits and the lack of a relationship between decarbonization and economic growth—our contribution to this debate will be to help policy makers understand how economic analyses are conducted and how they should be used in the subsequent political discussions. (JEL Q52, Q54, Q58) I. INTRODUCTION Climate change policy is rightly seen as a major component of environmental policy, but its increasingly pertinent role in the wider context of economic policy is often over- looked. The debate on climate change policy, particularly with respect to the Kyoto Proto- col, was heavily focused on the economic costs and feasibility of the proposed greenhouse gas (GHG) mitigation plans. In an attempt to as- suage fears of overwhelming costs, the Kyoto Protocol was introduced with several mecha- nisms, which were designed to help lower the costs of implementation (See UNFCCC, 1997). Despite continued concerns about the potential high costs of implementation—from politicians, economists, and industry alike— the Protocol was ratified by, among others, the European Union (EU), Japan, Canada, Russia, and Ukraine, and it came into force in February 2005. The Bush Administration opted against ratification and has proceeded on its own path, spurred in large part by con- cerns about the purported high economic costs of implementing the Protocol. The Protocol, though, is but the first step in addressing the issue of climate change from a policy perspective. The debate on the costs of GHG mitigation continues apace as discus- sions begin for the period after Kyoto. In this post-Kyoto debate, the economic costs of mitigation will play an equal if not larger role, for many parties, than the discussion about the actual environmental effects of climate change. As the Kyoto Protocol is the only extant large-scale climate protection program, it is a natural laboratory to determine what the costs of climate protection will be. Future agreements will have to cover longer periods of time, include more countries, and may involve significantly deeper reductions in emis- sions. We use the former debate over the pro- jected costs of the Kyoto Protocol to provide an historical context that informs the ongoing debate about the next steps internationally. There are real costs that will be incurred for mitigating GHGs, but this debate also reveals the shortcomings of many economic estimates of these costs, which do not include the sub- stantial ancillary environmental benefits asso- ciated with the mitigation measures. More than merely an environmental policy, the issue of climate change is important for policy mak- ers in general and specifically for economic policy makers. Golub: Senior Economist, Environmental Defense, Washing- ton, DC. E-mail [email protected] Markandya: Professor, University of Bath, Bath, UK, and Director, International Energy Markets, Fondazione Eni Enrico Mattei (FEEM), Milan, Italy. E-mail [email protected] Marcellino: Policy Analyst, Environmental Defense, Washington, DC. E-mail dmarcellino@environmental defense.org ABBREVIATIONS EIA: Energy Information Administration EU: European Union GDP: Gross Domestic Product GHG: Greenhouse Gas ITC: Induced Technical Change MIT: Massachusetts Institute of Technology UNFCC: United Nations Framework Convention on Climate Change 520 Contemporary Economic Policy (ISSN 1074-3529) doi:10.1093/cep/byl012 Vol. 24, No. 4, October 2006, 520–535 Ó Western Economic Association International 2006 No Claim to Original U.S. Government Works Advance Access publication July 20, 2006

Welcome message from author
This document is posted to help you gain knowledge. Please leave a comment to let me know what you think about it! Share it to your friends and learn new things together.
Transcript
DOES THE KYOTO PROTOCOL COST TOO MUCH AND CREATEUNBREAKABLE BARRIERS FOR ECONOMIC GROWTH?
ALEXANDER GOLUB, ANIL MARKANDYA, and DOMINIC MARCELLINO
We look to the literature on short-term cost models, long-term models based onendogenous growth, and long-term models that assume induced technical change, inorder to demonstrate the current understanding of costs, which is the focus of thedebate on abating climate change. Using these insights as well as other results—likethe role of ancillary benefits and the lack of a relationship between decarbonizationand economic growth—our contribution to this debate will be to help policy makersunderstand how economic analyses are conducted and how they should be used in thesubsequent political discussions. (JEL Q52, Q54, Q58)
I. INTRODUCTION
Climate change policy is rightly seen asa major component of environmental policy,but its increasingly pertinent role in the widercontext of economic policy is often over-looked. The debate on climate change policy,particularly with respect to the Kyoto Proto-col, was heavily focused on the economic costsand feasibility of the proposed greenhouse gas(GHG) mitigation plans. In an attempt to as-suage fears of overwhelming costs, the KyotoProtocol was introduced with several mecha-nisms, which were designed to help lowerthe costs of implementation (See UNFCCC,1997). Despite continued concerns about thepotential high costs of implementation—frompoliticians, economists, and industry alike—the Protocol was ratified by, among others,the European Union (EU), Japan, Canada,Russia, and Ukraine, and it came into forcein February 2005. The Bush Administrationopted against ratification and has proceededon its own path, spurred in large part by con-cerns about the purported high economic costsof implementing the Protocol.
The Protocol, though, is but the first step inaddressing the issue of climate change froma policy perspective. The debate on the costsof GHG mitigation continues apace as discus-
sions begin for the period after Kyoto. In thispost-Kyoto debate, the economic costs ofmitigation will play an equal if not larger role,for many parties, than the discussion about theactual environmental effects of climate change.
As the Kyoto Protocol is the only extantlarge-scale climate protection program, it isa natural laboratory to determine what thecosts of climate protection will be. Futureagreements will have to cover longer periodsof time, include more countries, and mayinvolve significantly deeper reductions in emis-sions. We use the former debate over the pro-jected costs of the Kyoto Protocol to providean historical context that informs the ongoingdebate about the next steps internationally.
There are real costs that will be incurred formitigating GHGs, but this debate also revealsthe shortcomings of many economic estimatesof these costs, which do not include the sub-stantial ancillary environmental benefits asso-ciated with the mitigation measures. Morethan merely an environmental policy, the issueof climate change is important for policy mak-ers in general and specifically for economicpolicy makers.
Golub: Senior Economist, Environmental Defense, Washing-ton, DC. E-mail [email protected]
Markandya: Professor, University of Bath, Bath, UK, andDirector, International Energy Markets, FondazioneEni Enrico Mattei (FEEM), Milan, Italy. [email protected]
Marcellino: Policy Analyst, Environmental Defense,Washington, DC. E-mail [email protected]
ABBREVIATIONS
EIA: Energy Information AdministrationEU: European UnionGDP: Gross Domestic ProductGHG: Greenhouse GasITC: Induced Technical ChangeMIT: Massachusetts Institute of TechnologyUNFCC: United Nations Framework Convention
on Climate Change
520Contemporary Economic Policy (ISSN 1074-3529) doi:10.1093/cep/byl012Vol. 24, No. 4, October 2006, 520–535 � Western Economic Association International 2006
No Claim to Original U.S. Government WorksAdvance Access publication July 20, 2006

Furthermore, this debate pays little atten-tion to the question how certain are we aboutthe costs of environmental regulation, particu-larly with regard to the Kyoto Protocol? Whatevidence do we have that environmental regu-lations must be costly by necessity? Certainly,there are many studies that attempt to measurethese costs. Traditionally, they have been di-vided into the ‘‘top-down’’ studies, which modelthe whole economy as an interdependentstructure and look at the reduction in GrossDomestic Product (GDP) relative to a no-GHG constraint policy, and ‘‘bottom-up’’models, which identify the measures neededto achieve a given target reduction at the sec-toral level.1 Typically, bottom-up estimateshave estimated the costs at the national levelof a 20% reduction of GHG emissions rela-tive to the 1990 levels to range from beingnegligible to being slightly negative—that is,imposing the constraint actually lowers thecost to society of meeting the targets (IPCC,2001). We discuss this somewhat surprisingfinding later. With top-down models, however,the costs of GHG reduction are estimated tobe as high as 4%–5% of GDP.2 Due to the ag-gregated approach of top-down models, theside effects from changes in regulatory regimes(in this case the ancillary effects from the reg-ulation of climate change) cannot be taken in-to account. Some studies have found thatpolicies to limit the emission of GHGs resultin lower levels of emissions of particulate mat-ter up to 10 micrometers in size, and thisreduction of conventional pollution has imme-diate, positive human health and social bene-fits (see, e.g., RIVM, EFTEC, NTUA, 2000).It is not possible for top-down models to takethese types of results into account.
In addition to the modeling differences be-tween top-down and bottom-up approaches,another difference of methodology is presentwhen modeling long-term impacts, as opposedto the short- and medium-term impacts ofGHG mitigation. Much of the research influ-
encing public policy refers to models that lookat meeting the Kyoto target for 2010 or ata target for the next commitment period(e.g., 2020). But there is also a great deal ofwork that models the costs of a carbon-constrained economy over much longerperiods—100 years or more. What do thesemodels say about potential costs, and is theuse of such models appropriate?
This article examines the literature on costestimates from global warming abatement inorder to answer the question whether theKyoto Protocol will cost too much and placeunbreakable barriers on economic growth.Our objective is to use what is currently knownabout the costs of such regulation to determinewhat the likely impact will be on economicgrowth and GDP. We look at a number ofstudies to better understand how economicanalysis of the Protocol has been used in theliterature, in order to inform the political dis-cussion on this issue. The current focus ofthe debate on abating climate change is oncosts, and our contribution to this debate willbe to help policy makers understand how eco-nomic analyses are conducted and structuredand how they should be used in the subsequentpolitical discussions and debates.
References to the literature will appearthroughout, but this study is not a literaturereview; rather, it uses the results of the litera-ture to inform the political debate. We alsotake the view that, regardless of the projec-tions of economic analyses, real estimates ofthe implications of particular policies, likeabating the emission of GHGs, cannot beknown until such a policy is actually imple-mented. Economic analyses can be used asa guide for policy, but due to the (sometimessubstantial) difference in results between mod-els considering the same policy or in results ofone model considering several institutionalconstructions, model results need to be consid-ered with some skepticism. As will be exploredlater, the possibility that environmental regu-lations on carbon may have no effects on eco-nomic growth and GDP is supported by theresults of SO2 regulation, where economicimpacts have been essentially zero. And reduc-tions in carbon use have been achieved in thepast without apparently affecting growth.
Our analysis looks therefore to expandupon previous analyses by looking at boththe short-term and long-term costs of impos-ing a carbon constraint, analyzing additional
1. Additionally, there are now also some hybrid mod-els that attempt to bring the two approaches together.
2. The focus of this article is on the misrepresenta-tion of the costs of climate protection. Some groups thatconduct analyses of the cost of climate protection facepressures to include assumptions that make costsunreasonably high, whereas others include assumptionsthat produce unreasonably optimistic results. When de-termining the value of an analysis of the costs of climateprotection, each study must be viewed in light of itsassumptions and its results vis-a-vis other analyses.
GOLUB, MARKANDYA, & MARCELLINO: DOES THE KYOTO PROTOCOL COST TOO MUCH 521

studies, and drawing on recent experience todraw some lessons for policy. It concludesthat, for the short to medium term, the costspresented to the public have typically beenexaggerated. Further, in the long term, it issimply not possible to come up with a firm es-timate. There is little agreement on what thesecosts are, and agreement will likely never bereached because some of the key parameters,underlying and driving the costs, are unob-servable. To complement the models, oneshould look at historical data and see whatthose indicate. One should also place the exist-ing costs in the context of expected overallgrowth and look at the implied sacrificesfuture generations will be making relativeto their expected levels of well being. Also,one must recognize the subjective nature ofcosts as perception is a major determinantof whether something costs too much. Finally,even if the costs look likely to turn out toohigh in the long run, one always has the optionto change course: if the measures being intro-duced over the next 20 years or so to cut GHGemissions show, ex post, that the costs arehigh, society can make future commitmentsless stringent.
II. SHORT-TERM COST MODELS
A. What Is theConventionalPositiononCosts?
A range of estimates for the short-termcosts of GHG reductions—derived froma number of authoritative models (mainly
top-down) and defined as the costs of meetingthe 2010 Kyoto target (as negotiated in1997)—were presented in the Intergovernmen-tal Panel on Climate Change (IPCC) report of2001. Their results are given in Table 1, whichreports the cost of reductions in 2010 as apercentage of GDP in 2000. Two importantobservations can be made from the results.First, great uncertainty exists about whatthe actual cost of reduction might be—thehighest projected cost is three to seven timeshigher than the lowest in the ‘‘no-trade’’ case.Second, the costs fall considerably when thetarget can be met with emissions trading—for the United States, for example, the averageestimated costs across eight studies of the 2010target were 1.3% of GDP with no trade inemissions, but they fall by more than halfwhen trade was permitted among Annex Icountries and fell to 20% of the no-trade figurewith global trading in emissions. The reasonsfor the differences in cost are clear—with emis-sions trading, countries with high emissionsreductions costs can buy reductions fromcountries with lower costs, making for anoverall reduction in costs. At the same time,the low-cost countries benefit from the saleof the emissions, reducing their overall costsof compliance.3
Cost estimates from models differ not onlywhen different institutional structures are
TABLE 1
Energy Modeling Forum Main Results; GDP Loss in 2010 (in percentage of GDP;2010 Kyoto target)
No Trading Annex I Trading Global Trading
Model USA OECD-E Japan CANZ USA OECD-E Japan CANZ USA OECD-E Japan CANZ
ABARE-GTEM 1.96 0.94 0.72 1.96 0.47 0.13 0.05 0.23 0.09 0.03 0.01 0.04
AIM 0.45 0.31 0.25 0.59 0.31 0.17 0.13 0.36 0.20 0.08 0.01 0.35
CETA 1.93 0.67 0.43
G-Cubed 0.42 1.50 0.57 1.83 0.24 0.61 0.45 0.72 0.06 0.26 0.14 0.32
GRAPE 0.81 0.19 0.81 0.10 0.54 0.05
MERGE3 1.06 0.99 0.80 2.02 0.51 0.47 0.19 1.14 0.20 0.20 0.01 0.67
MS-MRT 1.88 0.63 1.20 1.83 0.91 0.13 0.22 0.88 0.29 0.03 0.02 0.32
Oxford 1.78 2.08 1.88 1.03 0.73 0.52 0.66 0.47 0.33
RICE 0.94 0.55 0.78 0.96 0.56 0.28 0.30 0.54 0.19 0.09 0.09 0.19
Source: Climate Change 2001: Mitigation (2001, p. 537). CANZ stands for Canada, Australia, and New Zealand.
3. The variation in costs also falls as one moves to aregime with emissions trading. The standard deviation,for example, of the costs for the United States withAnnex I trading is only 40% of the standard deviationwith nontrading.
522 CONTEMPORARY ECONOMIC POLICY
considered but also when different models an-alyze the same proposed legislation. A recentexample of this comes from analyses of theClimate Stewardship Act of 2003 (S.139),which was proposed and rejected by theU.S. senate in 2003. Researchers at the Mas-sachusetts Institute of Technology (MIT) andthe Energy Information Administration (EIA)each ran models to assess the economic effectsof the legislation. The architecture of the mod-els differed significantly in the responsivenessof each to changes in energy prices and the im-plication of the development of new technol-ogies. Despite looking at the same piece oflegislation, the MIT model predicted house-hold consumption losses of about $1,500,while EIA’s calculations were $6,400 perhousehold.4
We turn first to the institutional structureof legislation: assuming that (some) emissionstrading is permitted, will the costs of the pol-icy be excessive? This question cannot be fullyanswered without more information aboutthe benefits that will accrue from reducingGHG emissions, yet these benefits are knownto be extremely difficult to quantify, espe-cially in money terms. Nevertheless, policymakers can see what sacrifices are being askedof their people and how this compares withthe costs of other public goods. We take, asan example, the case of the United Statesand allow for Annex I trading. The highestestimate is 1.03% of GDP in 2000 or about$350 per person. Of course, it is not a smallamount—at about $103 billion in total, itequals one-third of last year’s Medicarebill—but it is an upper bound. Moreover, as-suming that the U.S. economy achievesa modest GDP per capita growth of 1.5%per annum, the cost will be only 0.89% ofGDP in 2010. The average estimate comesout at 0.6% of the 2000 GDP. The authorsalso note that experience with cost modelsin a related field—reduction in emissions ofsulfur—has proven them to be overestimatesof the actual costs. The models run prior tothe introduction of trading in sulfur emis-sions under a cap-and-trade system estimatedthat the equilibrium price would be around$600 per ton. The price almost immediatelyafter trading was established settled at
around $100 per ton, and currently, it is$200–$250 per ton (see Aulisi et al., 2000).
B. Why the Conventional Models MayExaggerate the Short- andMedium-TermCosts
A number of researchers have questionedthe assumptions of the models describedabove. Krause et al. (2002) review such criti-cism in a recent paper for cost estimationsin the United States. They analyze models thathave influenced U.S. policy on Kyoto andargue that the models overestimate the truecosts of meeting the targets for the followingreasons:
1. They take limited account of the use ofsinks to reduce GHGs.
2. They do not all allow for reductions inGHGs other than carbon dioxide.
3. They do not allow for the fact that lowerGHG emissions also imply lower emissionsof pollutants such as sulfates, nitrates, andparticles, which have harmful health effects.Hence, there is a ‘‘collateral’’ health benefitthat is not accounted for.
4. They assume that fiscal measures to re-duce GHGs, such as a carbon tax, would haveits revenues redistributed in a ‘‘neutral’’ fash-ion—that is, the revenues would not be usedto reduce other ‘‘distortionary’’ taxes, such asthose on labor. Such taxes could have incen-tive effects, although this has been disputedin the literature (Markandya, 2005).
5. They do not allow for the fact that gov-ernment can introduce a range of marketreforms to encourage energy efficiency, manyof which have very high payoffs. Indeed, someof these measures more than pay for them-selves, so any reduction in GHG emissionsis achieved at a negative net cost. These arereferred to as ‘‘no-regret’’ options.
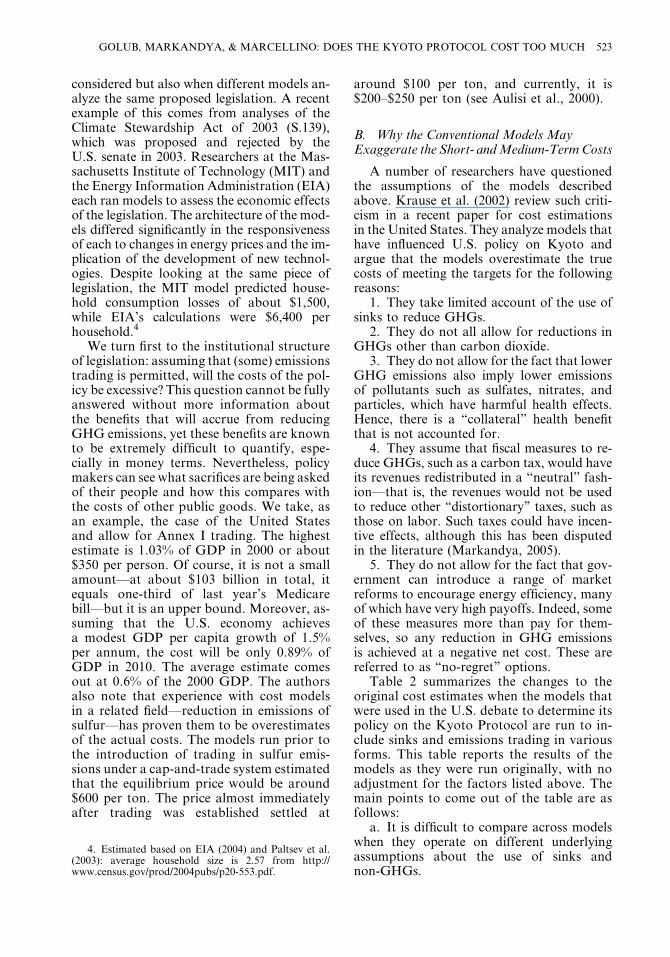
Table 2 summarizes the changes to theoriginal cost estimates when the models thatwere used in the U.S. debate to determine itspolicy on the Kyoto Protocol are run to in-clude sinks and emissions trading in variousforms. This table reports the results of themodels as they were run originally, with noadjustment for the factors listed above. Themain points to come out of the table are asfollows:
a. It is difficult to compare across modelswhen they operate on different underlyingassumptions about the use of sinks andnon-GHGs.
4. Estimated based on EIA (2004) and Paltsev et al.(2003): average household size is 2.57 from http://www.census.gov/prod/2004pubs/p20-553.pdf.
GOLUB, MARKANDYA, & MARCELLINO: DOES THE KYOTO PROTOCOL COST TOO MUCH 523
b. As in the IPCC table, it really makesa difference to costs when trading in emissionsis allowed for.
Krause et al. (2002) then go on to look athow the costs from one of the models usedin the debate (the CEF study by the U.S. De-partment of Energy, Interlaboratory WorkingGroup, 2000) performs, when account is takenof factors 3–5 above, that is, when tax recy-cling, collateral benefits, and market reformsare introduced. They measure the benefits ofthe market reforms by taking the net savingson energy bills as a result of measures intro-duced specifically for that purpose.5 Collateralbenefits are estimated, based on work bya range of scientists in the United Statesand elsewhere. Finally, the benefits of tax re-cycling are estimated, based on an ad hocassumption that they will offset a portionof GDP losses (the percentages vary from
50 to 150).6 The estimated GDP losses fromthe substitution effects—that is, the conven-tional losses reported in Table 2—are basedon the mean of the Energy Modeling Forum16 model runs. The model is run in two ver-sions: with only domestic actions to reduceemissions and with a regime that allows inter-national emissions trading. The results arereported in Table 3, which shows how the costestimates change as one introduces each ofthese dimensions of the model. An averagecost of 1.4% of GDP falls to 0.5% when mar-ket reforms are added to the model; the sameeffect results from incorporating internationalemissions trading. Bringing both emissionstrading and market reforms into the model,the outcome turns from a net cost to a netbenefit of 0.4% of GDP; the inclusion ofcollateral benefits makes the benefit equalto 0.5% of GDP.
One does not have to accept all the model-ing assumptions of this approach to come tothe conclusion that the conventional modelsdo indeed exaggerate the costs of GHG reduc-tion. One could argue that the benefits frommarket reform are exaggerated, but there is
TABLE 3
Costs of Compliance for United States with2010 Kyoto Target of Reduction of
C02 MtC/year
MarketReforms
InternationalTrading
CollateralBenefits
Costs in 2010as percentageof 2002 GDP
1.4
d 0.5
d 0.5
d d �0.4
d d d �0.5
Source: Krause et al. (2002). Based on EMF 16 (noadjustments) and CEF (for all adjustments). EMF ¼Energy Modeling Forum.
Note: A 1% decline in GDP was approximately 105billion dollars in 2002. ‘‘d’’ denotes the inclusion of thecategory in the model run.
TABLE 2
Costs of Compliance for United States with2010 Kyoto Target of 302 million metric tons
of carbon/year with No Market Reforms,
Tax Shifts, or Collateral Benefits
Study
Costs in $2002Billion Incurred
in 2010
Percentageof 2002GDP
1998 EIAa
Domestic without sinks 483 4.6
Domestic þ sinks 398 3.8
Annex I trading þ sinks 229 2.2
Global trading þ sinks 117 1.1
1999 EMF 16b
No trading (mean) 145 1.4
Annex I trading 69 0.7
Global trading 27 0.3
White House/CEAc
Domestic policy only 72 0.7
Annex I trading 43 0.4
Best-case trading 9 0.1
Source:Krause et al. (2002). EMF¼ EnergyModelingForum.
aThe EIA model has limited use of sinks but does notinclude non-CO2 GHGs.
bThe EMF 16 models have limited sink use in GHGmitigation but not when there is global trading. They donot include non-CO2 GHGs.
cTheWhiteHouseCEAmodel has no sinks but includesnon-CO2 GHGs. CEA stands for Council of EconomicAdvisors.
5. By thismeans, themodel incorporates the bottom-upresults of costs at the sectoral level.
6. Without doubt, tax recycling can lower the costs ofclimate protection, as the literature indicates. However,the downside of tax policies to achieve environmentalresults is, in fact, the environmental result itself. The set-ting of a tax, even if the revenues are recycled, leaves un-certain the level of environmental performance, whichhappens to be the top priority in the case of climatechange. An absolute cap on emissions, with a trading pro-gram, provides certainty of the environmental result, whilethe trading provision helps to direct funds for the reduc-tion of GHG emissions to the most cost-effective options.
524 CONTEMPORARY ECONOMIC POLICY

evidence from individual programs to suggestthat there are, indeed, significant gains fromenergy efficiency programs, and it is certainlythe case that the typical top-down models donot take these into account.7 Likewise, sub-stantial agreement exists that there are somereal collateral benefits from reduced GHGemissions, and due to this, they should be in-cluded as well.
C. What Has Recent Experience Shown?
Although there is limited experience withcountries operating under a Kyoto-type con-straint, there are some data since 1990, whichdemonstrate how countries that committed toreducing carbon emissions have performed. Inparticular, two countries, Germany and theUnited Kingdom, reduced emissions overthe period 1990–2000 by 11% and 3%, respec-tively. At the same time, they have achievedreal GDP growth over that decade of 20%and 29%, respectively. As noted later, partof this reduction is due to a switch out of coaland into gas, which may not be available forall countries and which will not offer the samepotential inGermany and the UnitedKingdomin the future. Nevertheless, options do exist,and there are some cases of them being usedeffectively to reduce emissions with influenc-ing growth. Of course, the fact that the car-bonization of these economies, measured ascarbon per unit of GDP, has declined whilethe economies have grown is not surprising.As Nakicenovic (2002) shows, the decarbon-ization rate for the United States from 1800to 2000 was about 1.3% per annum, whilethe annual per capita growth was about1.7%.8 The 1990s has shown a decline of2.8% per annum for these two countries, whichis the kind of rate of decarbonization neededfrom all countries, and for a sustained period,if societies are to stabilize global carbon emis-sions at some higher level in the future. Inci-dentally, the two Organization for Economic
Cooperation and Development (OECD)countries that did not ratify the Protocol—Australia and the United States—had decar-bonization rates over the same period of1.0% and 1.8% per annum, respectively,which, given the substantial growth theyattained in the 1990s, implied that emissionsin fact increased—29% and 16%, respectively.
At this point, it is pertinent to mention thatcost is in many ways a function of perception.Merely providing a monetary figure for thepurported cost of the Kyoto Protocol—orany other policy—is not sufficient in determin-ing whether it is too costly. (This is not to men-tion the fact that studies can overestimatecosts or exclude benefits depending on theassumptions and structure of a particularmodel.) For someone who does not believethat global warming is happening, any costsfor the Kyoto Protocol will be too high. Fromthe perspective of those who look at the long-term benefits of avoided climate change andthe ancillary human health benefits from mea-sures to reduceGHG emissions, the costs of theKyoto Protocol will likely not seem too high.
From the perspective of public policy, deci-sion makers have to navigate the balance be-tween the costs of reducing emissions versusthe benefits of avoided impacts from climatechange. This is a delicate balance as bothavoided impacts and the costs of reductionare based on models with significant uncer-tainties. As to the costs of climate impacts,Tol (2005) created a probability density func-tion of the marginal damage costs from car-bon dioxide emissions from 28 differentstudies. He concludes that $50 per ton of car-bon is probably the upper bound of marginaldamage costs of emissions of carbon dioxide,but his results also indicate that the costs arepotentially much smaller than this figure. Atthe same time, Tol (2005) recognizes that con-siderable uncertainty remains. While there isa high probability that the marginal damagecosts will be low, the probability functionhas a long—though relatively improbable—tail, where damage would be catastrophic.These continued uncertainties about costsand damages challenge policy makers whenmaking decisions about the appropriate levelof costs for a society to bear.
From the side of originally unforeseen ben-efits, work continues in assessing the value ofancillary benefits from measures to avert cli-mate change. One of the most recent studies
7. Economists are prone to arguing: if market reformswere capable of delivering real savings to society, whyhave these reforms not already been implemented? Whilesome skepticism along these lines is justified, it is impor-tant to acknowledge that some reforms are promoted bybringing the issue to the attention of energy users, who donot always act in an optimal manner. By assuming thatthere are no such inefficiencies in the system, one runsthe risk of taking a Panglossian view of the world.
8. The per capita growth refers to the period 1820–2000 and is taken from Maddison (2004).
GOLUB, MARKANDYA, & MARCELLINO: DOES THE KYOTO PROTOCOL COST TOO MUCH 525

was conducted by van Vuuren et al. (2006).This study concludes that there are likely sig-nificant ancillary benefits from the introduc-tion of the Kyoto Protocol in Europe—higher than previously predicted. The magni-tude of benefits depends, in part, on the use ofthe Kyoto Protocol’s flexibility mechanisms—like emission trading.
As demonstrated by the analysis in Tol(2005), considerable uncertainties remain withregard to predicting the marginal damagefrom climate abatement. Uncertainties also re-main with respect to climate impact modeling.The extent and cost of damage from climatechange still falls within a wide range, and thisuncertainty could leave room open for thepolitical acceptability of significantly highercosts than those previously deemed acceptable(see Mastrandea and Schneider, 2004). As theextent of possible damage becomes clearer,higher costs from programs to abate GHGemissions will become more politically accept-able. At the end of the day, however, the per-ception of cost determines the acceptability ofcost, even for public policymakers. Recent ev-idence does indicate that implementing theKyoto Protocol or other measures to limitthe emission of carbon dioxide and otherGHGs will not be as costly as previouslythought. Whether it will be too costly, ofcourse, remains a political judgment.
III. LONG-TERM COSTS
A. Long-Term Climate Models
Long-term models of the costs of climatechange have to take account of the costs ofmuch more stringent reductions in GHGs.Precisely how stringent depends on what tar-get concentrations of GHGs the world wantsto accept and by what date, but essentially,most models work in terms of a virtually fossil-free world one to two hundred years fromnow. Since two centuries is a long time formost planning purposes, there are real difficul-ties in deriving realistic estimates of the costsof attaining this goal. It is also not particularlyuseful to focus on total cost figures, which aregreatly influenced by unknowns. It is helpful,however, to note some of the key findings ofthe long-term modelers and see how they im-pact on decisions to be made today. A coupleof the key ones are discussed below.
The Costs of Moving to a Fossil-Free WorldDecline with Cumulative Investment in FossilEfficient and Fossil-Free Technologies. Muchof the earlier modeling of the costs of climatechange and the associated optimal policiesdid not take enough account of the fact thatthe efficiency with which a particular form ofenergy is used increases the longer that energyform isused.Arangeof studies reveal that thereis a stable mathematical relationship betweenthe duration of use and efficiency, predictingan increase in efficiency of 70%–90% for eachdoubling of the cumulative use of a particularenergy technology.This holds for carbonuse asa whole,9 as well as for a number of other en-ergy technologies (Nakicenovic, 2002).
Taking this into account implies an exter-nality from investment in a particular low-fossil technology because it generates benefitsfor future users. Not surprisingly, therefore, itsupports a policy of introduction of the tech-nologies before they are commercially viable,and this is what has been shown in a number ofpapers. Also unsurprisingly, the models showit is optimal to link the rate of investment inthese technologies to the rate of decline withrespect to cumulative use. Although this hasbeen known for a long time, the implementa-tion of suchmodels in a realistic analysis of thecosts of meeting GHG reductions is relativelyrecent. Nakicenovic (2002) has shown, for ex-ample, that taking such learning into accountimplies more investment in new and advancedtechnologies than is currently taking place anda reduction in the estimated cost of a givenreduction in GHG emissions.
The Modeling of Long-Term Objectives IsInfluenced by How Knowledge Affects Growthand How Energy Policies Induce Changes inEnergy Technologies. Parallel to the abovemodeling of technological change—whichoperates at the microlevel with individualtechnology data—there have been importantdevelopments at the macrolevel in the growthmodels that lie behind the integrated assess-ment models used in the climate changeliterature. The first improvement is the obser-vation that growth is influenced by the accu-mulation of knowledge in an economy, andthis accumulation is acquired by expenditureson learning, research, and development. The
9. The ‘‘elasticity’’ for carbon as a whole in the UnitedStates is estimated at 76%.
526 CONTEMPORARY ECONOMIC POLICY

inclusion of this factor, which has had a pro-found influenceongrowthmodeling (spawningthe huge ‘‘endogenous growth’’ literature),implies that there are benefits from knowledgeaccumulation that accrue not only to the per-son undertaking the investment in learning butalso to the society at large. One implication ofincluding this factor is that abatement meas-ures to reduce pollution or emissions of car-bon can actually promote growth if thereduction in emissions contributes to the pro-duction of knowledge (see, e.g., Goulder andSchneider, 1999; International Congress,2000; Smulders, 1999).
The second development has been to for-mally model induced technical change (ITC).This assumption supposes that investmentin knowledge in a particular sector can alsoaffect the efficiency of that sector as well asother sectors, now and in the future (much asthe above discussion of Nakicenovic illus-trates). Thus, policies that encourage energyefficiency in a particular sector also providean incentive to invest in knowledge in orderto improve efficiency of energy use in thatsector. This possibility is now explicitlyallowed for in the same model.
The models used for such analyses are com-plex, and their results do not always agree.10
Nordhaus (2002), for example, looks at theimplications of induced innovation in a modelthat previously did not have this element (theDICE-99 model). The objective is to maximizethe discounted utility of consumption (takinginto account the fact that emissions of GHGscontribute negatively to production). He findsthat induced innovation does not result ina higher level of emissions reduction for a verylong time—the model runs to 2400 and theemissions are lower with induced innovationonly after 2230 or thereabouts. The reason isthat investments in inventive activity are toosmall to make a difference—R&D investmentin the energy sector amounts to only 2% of out-put, while conventional investment is close to30%. As the author recognizes, however, thespecification of the complex carbon reductionoptions in such a macromodel is simplistic.
Other U.S. modelers have also come upwith some interesting conclusions with regardto the inclusion of endogenous change andITC and what they imply for climate policy.Goulder and Mathai (2002) look at the im-plied carbon tax and carbon abatement withITC and without it. If the objective is toachieve a given reduction in GHG emissionsby a given date at the lowest cost, ignoringthe presence of ITC will result in overstatingthe costs of the reduction and overstatingthe optimal carbon taxes. On the other hand,the impact is much smaller when the objectiveis tomaximize the net benefits from the climatepolicy. It is notable, however, that with ITCthere is not always a higher reduction in emis-sions in the earlier years—this outcomedepends on the details of the underlyingmodel.
On the European side, the results are some-what different from the aforementioned typesof models. At a workshop on ‘‘EconomicModeling of Environmental Policy and En-dogenous Technological Change’’ held inthe Netherlands in 2000, a number of paperslooked at climate change impacts. They con-cluded that, ‘‘the inclusion of technologicalchange is important, even though less thanexpected’’ (Carraro et al., 2003, p. 3). One ofthe papers particularly relevant for this discus-sion on climate change is that of Gerlagh andvan der Zwaan (2002), in which a model isdeveloped with two energy technologies:one based on carbon and one on noncarbon.For both energy resources, costs depend oncumulative production, according to thekinds of empirically determined learning ratesreferred to in Nakicenovic. The paper ana-lyzes the costs of an ambitious policy thatlimits global average temperature increasesto 2�C. They find that endogenous technolog-ical change warrants substantially earlieremissions reductions compared to the samemodel without such change. Moreover, al-though energy use is reduced in the earlyyears as carbon taxes come into force, the en-dogenous technological change in noncarbontechnologies reverses this trend, and energyuse starts to increase by the end of the 21stcentury.
More recently, Gerlagh has a paper(Gerlagh, 2004) in which he develops an en-dogenous growth model with ITC. The modelaims to minimize the costs of reaching a stablelevel of CO2 concentrations of 450 p.p.m. by
10. The role that learning curves, R&D, and ITC willhave on modeling results and, more importantly, on prac-tical results is complex. To address it properly is outsidethe scope of this article, but one that we look forward toaddressing in the future. In the context of this article, therole of these factors is dealt with quickly to give readers anidea of the importance of the issue without distractingthem from the original purpose of this article.
GOLUB, MARKANDYA, & MARCELLINO: DOES THE KYOTO PROTOCOL COST TOO MUCH 527

2100 (a very ambitious target). Runs of themodel that include ITC show much lower car-bon taxes and considerably smaller reductionsin consumption relative to the models withoutthis factor. Emissions reductions, however,are not very different compared to the no-ITC case.
To conclude then, the more recent models,while not in agreement, do point to lower costsof achieving the long-term objectives of stableconcentrations. The introduction of endoge-nous growth and ITC has helped move projec-tions in this general direction. However, themore immediate implications are less clear.They may not imply a greater reduction inemissions in the coming years—this appearsto depend on the model used. Intuitively, itmakes sense to argue that when investmentin energy efficiency and low-carbon/no-carbontechnologies has externalities more shouldbe invested in these areas. This will resultin lower costs of emissions reductions, al-though it may take some time for the effectto be realized. A planner looking to minimizethe discounted total costs will take account ofthe benefits of early action in designing pol-icy, but there are other macroeconomiceffects (e.g., the switch of resources out ofgeneral knowledge accumulation) that makethe overall impact ambiguous.
IV. EXPERIENCE WITH CO2 AND SO2
The discussion so far has been rather tech-nical and only weakly grounded in empiricalobservations. The models, while highly so-phisticated, really embody little of the historicevidence, which can shed light on the key mat-ters of concern. The simple question all of uswould like to see answered is the one alludedto in the title of this article: will the Kyoto Pro-tocol, as it is now and as it will evolve, createbarriers to economic growth? The answer tothis question is easier to search for thanto find. The short- to medium-term modelsdo not directly address the growth issue, al-though the small effect of the 2010 emissionsconstraint does not point to any real effect ongrowth. Certainly, it does not seem to have af-fected the growth performance of the coun-tries that are currently reducing emissions.To be sure, countries may face some tem-porary problems in meeting targets, but noone has shown any credible impacts on
underlying economic growth. The long-termmodels, too, have not directly addressed thisquestion, as they focus on the paths for emis-sions, carbon taxes, etc.
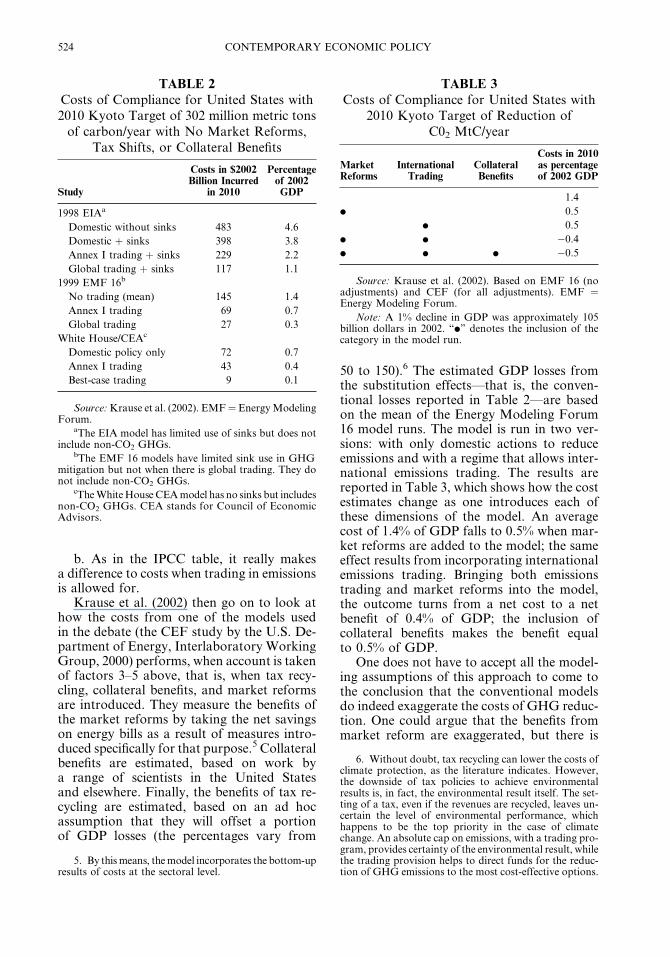
In this section, we look at the historicgrowth performance of major developed econ-omies to see what one can learn about howthey have responded to constraints on emis-sions of key pollutants. The historic recordover a period of 100 years and more showsthat developed countries attained an averagegrowth rate of per capita income of around1%–2% per annum. Table 4 provides dataon average annual growth rates by decadeand for the whole period 1870–2000 for someEuropean countries as well as the UnitedStates.11 Decadal growth rates vary fromsmall negative figures to as high as 7% infor Germany in the postwar decade of1950–1960. If one excludes the fluctuationscaused by wars, a high value is around 9%per annum (Japan from 1960 to 1970) anda low value is 0.1% (Finland from 1870 to1880) when viewing an entire decade. Thisvariation may be important in the contextof climate policy because a country in a highgrowth phase may want to be accommodatedwith a more lenient carbon reductions target.Taking the longer time horizon of the climateregime, however, it can expect real per capitagrowth of only 1%–2%. It is to be noted,though, that this growth rate refers to percapita income. If a country’s populationis growing, GDP will also grow by anamount that covers the increase in popula-tion as well.
A. Experience with CO2
As noted in section IIC, countries for whichdata are available show a long-term trend to-ward decarbonization. In the case of theUnited States, the shift in energy supply fromwood to coal and then to oil and gas—alongwith continually improving technologies—has meant that while in 1800 it took 2.5 kgof CO2 to generate one dollar of GDP, it nowtakes only 0.25 kg. The implied rate of decar-bonization is 1.3% per annum, and moreover,
11. We look at growth rates over 10 year periods tosmooth out cyclical factor. Annual growth rates can, ofcourse, vary much more. The per capita GDP data ofthe European countries were gathered from Maddison(2004). Income is measured in 1990 internationalGeary-Khamis dollars.
528 CONTEMPORARY ECONOMIC POLICY
it has remained quite steady over the 200years (see Nakicenovic, 2002). However, asGDP in the United States grew approxi-mately 3% per year, this resulted in a 1.7%annual increase in emissions. At this rateof increase, emissions double every 40 years.Similar trends are observed for other coun-tries but for much shorter periods as the datado not go back as far. The implication ofthese results for public policy is clear. Business-as-usual decreases in intensity are not enoughto reduce absolute emissions; something moreserious must be done.
As noted above, if societies are to stabilizecarbon emissions in the future, they will needto more than double the rate of decarboniza-tion—to around 3% per annum, which in turnwill result in an increase in future concentra-tions to 450–550 p.p.m. and a likely globaltemperature increase of around 2�C–4�C. Al-though such an increase would have seriousimpacts on the world, they are less than wewould have without stabilization. This thenbegs the question whether this is indeed possi-ble at a global level, without compromisingfuture economic growth.
To date, a sufficient answer to this questionhas not appeared in the literature, but thereare a few signals of what is possible. Somecountries, like France, have achieved a muchgreater rate of decarbonization during the lat-ter part of the last century without any notice-
able effect on its growth rate; this was achievedthrough the construction of nuclear powerplants that supply approximately 75% ofFrance’s electricity. The 1990s also saw theUnited Kingdom and Germany exhibit decar-bonization rates of around 2.8%; these reduc-tions were achieved primarily through fuelswitchingfromcoaltogasintheUnitedKingdomandthe large-scale closingofhigh-polluting, in-efficient industry and power production inGermany. As a caveat, one should be cautiouswhen extrapolating the performance of theseeconomies to others as the means throughwhich they, France, Germany, and theUnited Kingdom, achieved these reductionsmay not be available to all countries. At thesame time, their success points to thepossibilitythat such reductions are by nomeans infeasiblein the present economic structures. Table 5gives examples of countries that have exhibiteddecarbonization over the period from 1980 to2002, combining decreasing carbon intensitywith economic growth. Countries in that table(Denmark,Finland,France,Japan,Switzerland,and Sweden) exhibited decarbonization ratesranging from 1.5% to 4.2% per annum, withno discernable link to growth performance.
A more systematic examination of the dataon decarbonization and growth for Europe isshown in Figure 1. Using the decarbonizationexperienced by several EU nations over the pe-riod 1980–2002, we attempted to determine if
TABLE 4
Decennial Real Per Capita Growth Rates for Selected Developed Countries
CountryAustria(%)
Belgium(%)
Denmark(%)
Finland(%)
France(%)
Germany(%)
Italy(%)
Netherlands(%)
Sweden(%)
UK(%)
USA(%)
Japan(%)
China(%)
1870–1880 1.1 1.3 0.9 0.1 1.2 0.8 0.5 1.0 1.1 0.9 2.7 1.6
1880–1890 1.6 1.1 1.5 1.8 1.1 2.0 0.5 0.9 1.2 1.4 0.6 1.6
1890–1900 1.7 0.9 1.8 1.9 1.9 2.1 0.7 0.3 2.1 1.1 1.9 1.5
1900–1910 1.3 0.9 2.1 1.3 0.3 1.2 2.7 1.0 1.5 0.3 2.0 1.0
1910–1920 �3.1 �0.3 0.7 �0.3 0.8 �1.8 1.0 1.1 �0.6 �0.1 1.1 2.7
1920–1930 4.0 2.3 3.0 3.7 3.5 3.6 1.2 2.9 3.5 1.8 1.1 0.9
1930–1940 1.0 �0.9 �0.4 1.9 �1.1 3.1 1.9 �1.5 2.1 2.3 1.2 4.5
1940–1950 �0.7 1.8 3.1 2.8 2.7 �3.3 0.0 2.2 3.3 0.1 3.2 �4.0
1950–1960 5.8 2.4 2.4 3.9 3.7 7.1 5.4 3.3 2.6 2.2 1.7 7.6 4.4
1960–1970 4.1 4.3 3.7 4.4 4.5 3.5 5.1 3.7 3.9 2.2 2.9 9.3 1.5
1970–1980 3.5 3.1 1.8 3.1 2.6 2.7 3.1 2.1 1.6 1.8 2.1 3.3 3.1
1980–1990 2.1 1.7 1.9 2.7 1.8 1.2 2.2 1.6 1.7 2.4 2.2 3.4 5.7
1990–2000 1.7 1.9 2.2 1.8 1.4 1.6 1.4 2.3 1.4 1.9 1.9 1.2 6.3
1870–2000 1.8 1.6 1.9 2.2 1.9 1.9 1.9 1.6 1.9 1.4 1.9 1.60 4.2
Source: Maddison (2004).
GOLUB, MARKANDYA, & MARCELLINO: DOES THE KYOTO PROTOCOL COST TOO MUCH 529
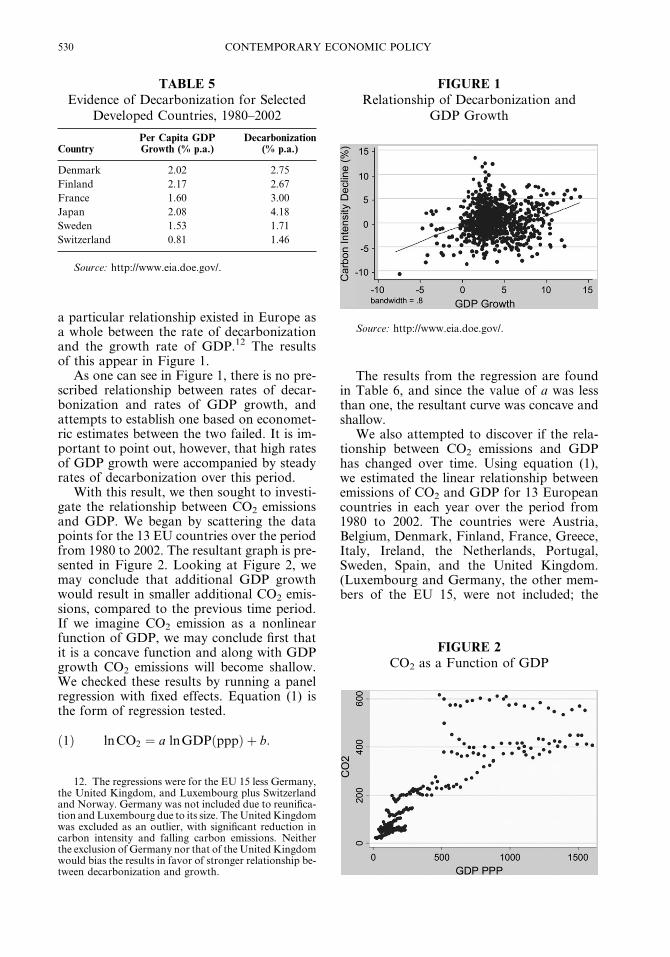
a particular relationship existed in Europe asa whole between the rate of decarbonizationand the growth rate of GDP.12 The resultsof this appear in Figure 1.
As one can see in Figure 1, there is no pre-scribed relationship between rates of decar-bonization and rates of GDP growth, andattempts to establish one based on economet-ric estimates between the two failed. It is im-portant to point out, however, that high ratesof GDP growth were accompanied by steadyrates of decarbonization over this period.
With this result, we then sought to investi-gate the relationship between CO2 emissionsand GDP. We began by scattering the datapoints for the 13 EU countries over the periodfrom 1980 to 2002. The resultant graph is pre-sented in Figure 2. Looking at Figure 2, wemay conclude that additional GDP growthwould result in smaller additional CO2 emis-sions, compared to the previous time period.If we imagine CO2 emission as a nonlinearfunction of GDP, we may conclude first thatit is a concave function and along with GDPgrowth CO2 emissions will become shallow.We checked these results by running a panelregression with fixed effects. Equation (1) isthe form of regression tested.
lnCO2 ¼ a lnGDPðpppÞ þ b:ð1Þ
The results from the regression are foundin Table 6, and since the value of a was lessthan one, the resultant curve was concave andshallow.
We also attempted to discover if the rela-tionship between CO2 emissions and GDPhas changed over time. Using equation (1),we estimated the linear relationship betweenemissions of CO2 and GDP for 13 Europeancountries in each year over the period from1980 to 2002. The countries were Austria,Belgium, Denmark, Finland, France, Greece,Italy, Ireland, the Netherlands, Portugal,Sweden, Spain, and the United Kingdom.(Luxembourg and Germany, the other mem-bers of the EU 15, were not included; the
FIGURE 2CO2 as a Function of GDP
TABLE 5
Evidence of Decarbonization for SelectedDeveloped Countries, 1980–2002
CountryPer Capita GDPGrowth (% p.a.)
Decarbonization(% p.a.)
Denmark 2.02 2.75
Finland 2.17 2.67
France 1.60 3.00
Japan 2.08 4.18
Sweden 1.53 1.71
Switzerland 0.81 1.46
Source: http://www.eia.doe.gov/.
FIGURE 1
Relationship of Decarbonization andGDP Growth
Source: http://www.eia.doe.gov/.
12. The regressions were for the EU 15 less Germany,the United Kingdom, and Luxembourg plus Switzerlandand Norway. Germany was not included due to reunifica-tion and Luxembourg due to its size. TheUnitedKingdomwas excluded as an outlier, with significant reduction incarbon intensity and falling carbon emissions. Neitherthe exclusion of Germany nor that of the UnitedKingdomwould bias the results in favor of stronger relationship be-tween decarbonization and growth.
530 CONTEMPORARY ECONOMIC POLICY

former due to its insignificant size and thelatter due to reunification and the difficultiesof combining data sets for East and WestGermany.)
CO2ti ¼ atGDPti þ bt; " i; t:ð2ÞIn equation (2), CO2ti is CO2 emissions for
13 European countries in each year from 1980to 2002, GDPti is GDP in constant prices forthe countries in each year, and at and bt arecoefficients to be estimated. Regressions wererun for equation (1) for each year, and theresults are reproduced in Table 7.
The steady decline of the values of at from0.95 in 1980 to 0.29 in 2002 is indicative of thechanging relationship between GDP and CO2
in these countries over the period. This fall invalue points to decarbonization of GDP overthe period. Although the constant (bt) was notsignificant, its steadily increasing value alsopoints to a changing relationship. It shouldbe noted that the change in value over the pe-riod occurred without explicit environmentalpolicy prescribing it. Whether or not this trendwould have continued in the future withoutclimate policy cannot be known, but it is safeto say that requiring economies to go downthis path in the future will be asking of themno more (expect perhaps in degree) than theyhad achieved on their own over the last 25years. The Kyoto Protocol, then, is not askingeconomies to do something foreign to them.Equations (1) and (2) cannot tell us anythingabout what will happen in the coming years.However, as data begin to become available,it would be valuable to conduct an analysis
of the effects of climate policy on the relation-ships described in (1) and (2), not just at anaggregated level but also with respect to re-gional effects to determine if there are localdifferences in any future trends.
B. Experience with SO2
Another way to shed light on the growth-emissions link is to look at what has happenedwith a pollutant whose emissions have alreadybeen constrained and its subsequent effects ongrowth: sulfur dioxide provides this example.Increasingly recognized as a pollutant withnegative health impacts, governments tooka number of measures, especially in thepost–World War II period, to reduce its emis-sions into the atmosphere. This is best shownin Figure 3, which plots both sulfur emissionsand GDP per capita and indicates years of keylegislation in the United Kingdom. Althoughthere were earlier acts to reduce sulfur, goingback to the late 1880s, the impact of postwarlegislation was the most marked. After the1956 Clean Air Act, emissions have fallensteadily, while real GDP has been on anequally steady upward path. A similar storyholds for Europe as a whole: sulfur emissionsper capita have fallen from a peak of 42.4 kgin 1957 to 5.6 kg in 2001.13 Moreover, duringthis period, annual growth in per capita GDPwas 3.2%. In the previous 34 years, sulfur
TABLE 6
Results from Panel Regression with Fixed Effects of CO2 as a Function of GDP
Number of observations 299
Number of groups 13
Observations per group 23
R2
Within 0.3558
Between 0.9403
Overall 0.8655
F(1,285) 157.40
Corr(u_i, Xb) 0.8867
Prob. . F 0.0000
Coefficient Std. Err. t P . jtj 95% Confident Interval
LNpppj0.2493355 0.01987 12.55 0.000 0.2102, 0.288
Constantj3.401906 0.10692 31.82 0.000 3.1915, 3.612
13. Countries included are Austria, Belgium,Denmark, Finland, France, Germany, Italy, Netherlands,Norway, Sweden, Switzerland, and the United Kingdom.
GOLUB, MARKANDYA, & MARCELLINO: DOES THE KYOTO PROTOCOL COST TOO MUCH 531

emissions went up 29%while annual growth inper capita GDP was 2.0%.14
The experience from SO2 does not of coursetranslate directly to CO2. There were easierend-of-pipe options with the former thatallowed industry to make significant reduc-tions than there appear to be for CO2. Fur-thermore, alternative fuels that emitted lessSO2, such as gas, have been readily available.Nevertheless, such a remarkable decline in sul-fur emissions, over such long periods, with anynotable impact on economic growth cannotpass unnoted. As legislation makes CO2 emis-
sions more costly to industry, so it will also de-velop new ways of reducing emissions. Thelow-sulfur technologies were not all knownat the time that regulations on SO2 werebrought into effect—many emerged after theregulations.
The observation that emissions of a pollut-ant increase in the early phases of economicgrowth and subsequently decline has, ofcourse, been studied in some depth. Referredto in the economics literature as an ‘‘Environ-mental Kuznets Curve,’’ such a curve postu-lates, in general terms, that economicgrowth will eventually rectify the negativeenvironmental impacts of the early stages ofeconomic development and that growth willlead to further environmental improvements.Applied to carbon emissions, it would pointto a decline in emissions after a certain pointin development has been reached. Empiricalstudies found turning points for various pollu-tants, including sulfur, but have generallyfailed to find one for CO2 (see Grossmanand Krueger, 1995; Rock, 1996; Selden and
TABLE 7
Results of Yearly Regressions of CO2 Emissions as a Function of GDP
at bt
Year Coefficient t-stat. Coefficient t-stat. Observations R2
1980 0.95 4.90 9.39 0.52 13 0.90
1981 0.83 4.76 10.14 0.59 13 0.89
1982 0.74 5.00 10.66 0.67 13 0.90
1983 0.69 4.73 8.50 0.55 13 0.90
1984 0.64 4.64 10.26 0.64 13 0.89
1985 0.61 4.55 12.14 0.73 13 0.89
1986 0.57 4.12 15.54 0.87 13 0.87
1987 0.55 4.35 15.06 0.85 13 0.88
1988 0.49 4.14 16.24 0.89 13 0.87
1989 0.48 4.42 15.91 0.90 13 0.89
1990 0.45 4.55 18.37 1.03 13 0.88
1991 0.44 4.59 19.76 1.09 13 0.88
1992 0.41 4.89 20.54 1.23 13 0.89
1993 0.39 4.62 22.21 1.26 13 0.88
1994 0.36 4.54 26.33 1.48 13 0.88
1995 0.36 5.53 24.46 1.49 13 0.91
1996 0.36 5.57 23.32 1.38 13 0.91
1997 0.34 5.81 27.94 1.61 13 0.91
1998 0.33 7.17 24.77 1.60 13 0.94
1999 0.32 7.82 23.17 1.55 13 0.94
2000 0.31 7.32 26.33 1.53 13 0.93
2001 0.30 6.65 29.07 1.52 13 0.91
2002 0.29 6.96 29.24 1.63 13 0.92
Source: http://www.eia.doe.gov/.
14. The sulfur emissions data for the European coun-tries were obtained from Stern (2004). Available emissionsdata for all 12 countries were compiled from publishedsources and include those that come from burning hardcoal, brown coal, and petroleum and from mining andsmelting activities. However, for year 2000 where the dataare missing, emissions of the countries (except Switzerland)were estimated by using a decomposition model basedon the use of fossil fuels and levels of smelting activities.The primary source for the data between 1850 and 1979 isthe ASL and Associates database, while the data between1980 and 2001 were obtained from the Convention onLong-Range Transboundary Air Pollution in Europe.
532 CONTEMPORARY ECONOMIC POLICY

Song, 1994; Shafik and Bandyopadhyay,1992). Some of the more recent papers in thisarea, however, cast doubt on the simple for-mulation of a ‘‘U’’-shaped relationship be-tween emissions and real income. Moreover,they note that any observed relationship willbe affected by policy variables, especiallymeasures to reduce emissions. Certainly, inthe case of Europe, an econometric estimateof the Kuznets curve finds the basic relation-ship between sulfur emissions andGDP (in percapita terms) influenced by key legislation toreduce emissions (see Markandya et al., 2004).
In light of this, what are the lessons fromthe sulfur experience for CO2? Although therehas yet to be a turning point in the CO2-GDPrelationship, the possibility of this happeningin the future must be quite high. As societiesintroduce new measures to reduce the carbon-ization of the economy, they may well findlower carbon levels in the more developedcountries. Moreover, if the SO2 experience isanything to go by, this can be achieved with-out sacrificing real economic growth.
V. CONCLUSIONS
At present, there is great disquiet about thecost and growth implications of the KyotoProtocol and, more generally, of the commit-ments needed to stabilize the climate system.As discussions begin to determine the formof GHG mitigation strategies after the KyotoProtocol, this debate will likely increase inpertinence and virulence. The role that theeconomic costs (and benefits) from GHG mit-igation will play in climate policy cannot beoverstated. The potential impact of climatepolicy on economic policy will be even larger,and the opposition to GHG mitigation ongrounds of purported high costs will be sub-stantial. This article has tried to address theseconcerns and to provide policy makers withmore information about the nature of envi-ronmental regulation and whether or notthey necessitate high costs. It beings withthe short- to medium-term outlook, to 2010or 2020, and examines the estimates of thecosts of the Kyoto Protocol for the UnitedStates. The case is made that the earlier studies
FIGURE 3
Gross Sulfur Emissions (1850–2001), Real GDP per capita (1870–2001), andSelected Air Pollution Regulation in the United Kingdom
GOLUB, MARKANDYA, & MARCELLINO: DOES THE KYOTO PROTOCOL COST TOO MUCH 533

came up with costs that were too high due tothe assumptions included in the models. If onetakes account of reducing GHGs throughsinks, through market reforms to increase en-ergy efficiency, and through market mecha-nisms, such as international permit trading,the costs come down significantly. It is alsoimportant to mention the role that collateralbenefits from lower levels of GHGs have onmodel results, which makes the case evenstronger that the costs of emission reductionhave been overstated to this point.
The other issue that has been addressed inthe literature relates to the long-term strategyfor reducing GHGs. Here the key questionshave been whether early action is justified orwhether it is better to wait until the costs ofsubstitution of fossil fuels decline. The morerecent literature on endogenous growth andITC is not unambiguous on this, but it doesindicate that the costs of achieving lower con-centrations of GHGs in the atmosphere arelower than previously predicted when thesefactors were neglected. Whether one shouldgo for greater emissions reductions in theimmediate future is less clear—some modelsadvocate it, others do not.
Models, of course, are just that—theoreti-cal constructs, and they are particularly shakywhen attempting to make predictions aboutthe long run. It pays to examine the historicdata and see what one can learn from the past.Historic data on carbon emissions is hard tocome by, but the extant information pointsto long-term trends in decarbonization ofaround 1.3% per annum. In order to achievegoals of climate stabilization, the decarboniza-tion rate will need to be accelerated—in alllikelihood, it must double. Some experienceof recent rates of decarbonization suggeststhat such an increase is feasible, without com-promising the growth performance of coun-tries. Finally, an example of what mighthappen could come from long-term experiencewith sulfur. Here major reductions have beenachieved in the post–World War period, with-out impacting the growth performance of thecountries concerned.
More work is needed, especially in develop-ing countries, to see if those that commit to areduction in emissions have any noticeable im-pact on their growth. For the present, however,the current state of knowledge does not supportthe fear that a move to a fossil-free world willseriously compromise its economic growth.
REFERENCES
Aulisi, A., D. J. Dudek, J. Goffman, M. Oppenheimer, A.Petsonk, and S.Wade.FromObstacle toOpportunity:How Acid Rain Emissions Trading Is DeliveringCleanerAir.NewYork:EnvironmentalDefense,2000.
Carraro, C., R. Gerlagh, and B. C. C. van der Zwaan.‘‘Endogenous Technical Change in EnvironmentalMacroeconomics.’’ Resource and Energy Economics,25, 2003, 1–10.
Climate Change 2001: Mitigation. Contribution of Work-ing Group III to the Third Assessment Report of theIntergovernmentalPanelonClimateChange.Cambridge,UK: Cambridge University Press, 2001.
Energy Information Administration. 2004. http://www.eia.doe.gov/.
Gerlagh, R. ‘‘A Climate-Change Policy Induced Shiftfrom Innovations in Energy Production to EnergySavings.’’ Working Papers no. 2004.128, FondazioneEni Enrico Mattei, 2004.
Gerlagh, R., and B. C. C. van der Zwaan. ‘‘Long-TermSubstitutability between Environmental and Man-Made Goods.’’ Journal of Environmental and Eco-nomic Management, 44, 2002, 329–45.
Goulder, L. H., andK.Mathai. ‘‘Optimal CO2 Abatementin the Presence of Induced Technological Change.’’Working Paper no. W6494, NBER, 1998.
Goulder, L., and S. Schneider. ‘‘Induced TechnologicalChange and the Attractiveness of CO2 AbatementPolicies.’’ Resource and Energy Economics, 21,1999, 211–53.
Grossman, G., and A. B. Krueger. ‘‘Economic Growthand the Environment.’’ The Quarterly Journal ofEconomics, 110, 1995, 353–77.
Interlaboratory Working Group. Scenarios for a CleanEnergy Future. Oak Ridge, TN: Oak Ridge NationalLaboratory and Berkeley, CA: Lawrence BerkeleyNational Laboratory, 2000.
International Congress. ‘‘Economic Modelling of Envi-ronmental Policy and Endogenous TechnologicalChange.’’ Contributors B. C. C. van der Zwaan,R.Gerlagh,C.Carraro,andG.Klaassen.Trippenhuis,Amsterdam, 16–17 November 2000.
IPCC. Third Assessment Report of the Intergovernmen-tal Panel on Climate Change. Cambridge, UK:Cambridge University Press, 2001.
Krause, F., S. J. DeCanio, J. A. Hoerner, and P. Baer.‘‘Cutting Carbon Emissions at a Profit (Part I): Op-portunities for the United States.’’ ContemporaryEconomic Policy, 20, 2002, 339–65.
Maddison, A. The World Economy: Historical Statistics.OECD Development Centre, Paris, 2004.
Markandya, A. ‘‘Policy Failures as a Cause of Environ-mental Degradation,’’ in The Handbook of Environ-mental Economics, edited by Karl-Goran Maler andJeffery Vincent. General editors: KennethArrow andMichael Intriligator. Amsterdam, The Netherlands:North Holland, 2005.
Markandya, A., A. Golub, and S. Pedroso. ‘‘EmpiricalAnalysis of National Income and SO2 Emissionsin Selected European Countries.’’ Nota Di Lavoro1.2004, Fondazione Eni Enrico Mattei, Milan, Italy,2004. http://www.feem.it/Feem/Pub/Publications/Wpapers/default.htm.
Mastrandrea, M., and S. Schneider. ‘‘Probabilistic Inte-grated Assessment of �Dangerous� Climate Change.’’Science, 304, 2004, 571–5.
534 CONTEMPORARY ECONOMIC POLICY

Nakicenovic, N. ‘‘Technological Change and Diffusion asa Learning Process,’’ inTechnological Change and theEnvironment, edited by A. Grubler, N. Nakicenovic,and W. D. Nordhaus. Washington, DC: Resourcesfor the Future and International Institute for Ap-plied Systems Analysis, 2002.
Nordhaus, W. D. ‘‘Modeling Induced Innovation in Cli-mate Change Policy,’’ in Technological Change andthe Environment, edited byA.Grubler, N.Nakicenovic,and W. D. Nordhaus. Washington, DC: Resourcesfor the Future and International Institute for Ap-plied Systems Analysis, 2002.
Paltsev, S., J. Reilly, H. Jacoby, A. D. Ellerman, andK. H. Tay. ‘‘Emissions Trading to Reduce GreenhouseGas Emissions in the United States: The McCain-Lieberman Proposal.’’ MIT Joint Program on theScience and Policy of Climate Change Report No.97, 2003.
Rock, M. T. ‘‘Pollution Intensity of GDP and TradePolicy: Can the World Bank Be Wrong?’’ WorldDevelopment, 24, 1996, 471–9.
RIVM, EFTEC, NTUA. ‘‘European EnvironmentalPriorities: An Environmental and Economic Assess-ment.’’ Report to DGXI of the European Commis-sion, 2000.
Selden, T. M., and D. Song. ‘‘Environmental Quality andDevelopment: Is there a Kuznets Curve for Air Pol-lution?’’ Journal of Environmental Economics andManagement, 27, 1994, 147–62.
Shafik, N., and S. Bandyopadhyay. ‘‘Economic Growthand Environmental Quality: Time Series andCross-Country Evidence.’’ Papers 904, World Bank,Country Economics Department, 1992.
Smulders, S. ‘‘Endogenous Growth Theory and the Envi-ronment,’’ in Handbook of Environmental and Re-source Economics, edited by J. C. J. M. van denBergh. Cheltenham, UK: Edward Elgar, 1999,610–21, chap. 42.
Stern, D. 2004. Website providing data for research.http://www.rpi.edu/;sternd/datasite.html.
Tol, R. ‘‘The Marginal Damage Costs of Carbon DioxideEmissions: An Assessment of the Uncertainties.’’Energy Policy, 33, 2005, 2064–74.
UNFCCC. Kyoto Protocol, 1997. http://unfccc.int/resource/docs/convkp/kpeng.pdf.
van Vuuren, D., J. Cofala, H. Eerens, R. Oostenrijk, C.Heyes, Z. Klimont, M. den Elzen, and M. Amann.‘‘Exploring the Ancillary Benefits of the Kyoto Pro-tocol for Air Pollution in Europe.’’ Energy Policy,34, 2006, 444–60.
GOLUB, MARKANDYA, & MARCELLINO: DOES THE KYOTO PROTOCOL COST TOO MUCH 535
Related Documents