DOES ONLINE EDUCATION LIVE UP TO ITS PROMISE? A LOOK AT THE EVIDENCE AND IMPLICATIONS FOR FEDERAL POLICY Spiros Protopsaltis and Sandy Baum i January 2019 Abstract Technology has the potential to increase access to education, enhance learning experiences, and reduce the cost of providing high-quality postsecondary education. However, despite the explosive growth of online education, which has been disproportionately large in the for-profit sector, our review of the evidence shows that this potential has not been realized. Instead, on average fully online coursework has contributed to increasing gaps in educational success across socioeconomic groups while failing to improve affordability. Even when overall outcomes are similar for classroom and online courses, students with weak academic preparation and those from low-income and under-represented backgrounds consistently underperform in fully-online environments. Success rates are lower and employers—in addition to students, faculty, academic leaders, and the public—attribute lower value to online than to classroom degrees. A strong body of evidence, as well as industry best practices, have consistently emphasized the critical role of frequent and meaningful interaction between students and instructors for increasing the quality of the online educational experience and improving student outcomes and satisfaction. Weakening federal requirements for regular and substantive interaction between students and faculty in online courses would likely decrease educational quality, further erode employer confidence in the value of online credentials, increase barriers to postsecondary success, and expand opportunities for some institutions to exploit vulnerable students and federal student aid programs. Acknowledgements The Laura and John Arnold Foundation (LJAF) provided support for this paper. Results, information and opinions represent the analysis, information and opinions of the authors and are not endorsed by or reflect the views or positions of LJAF or any employee thereof. i Spiros Protopsaltis is an Associate Professor and Director of the Center for Education Policy and Evaluation at George Mason University’s College of Education and Human Development and served as a deputy assistant secretary for higher education and student financial aid at the U.S. Department of Education during the Obama administration. Sandy Baum is a fellow in the Center on Education Data and Policy at the Urban Institute and professor emerita of economics at Skidmore College.

Welcome message from author
This document is posted to help you gain knowledge. Please leave a comment to let me know what you think about it! Share it to your friends and learn new things together.
Transcript

DOES ONLINE EDUCATION LIVE UP TO ITS PROMISE?
A LOOK AT THE EVIDENCE AND IMPLICATIONS FOR FEDERAL POLICY
Spiros Protopsaltis and Sandy Baumi
January 2019
Abstract
Technology has the potential to increase access to education, enhance learning experiences, and reduce
the cost of providing high-quality postsecondary education. However, despite the explosive growth of
online education, which has been disproportionately large in the for-profit sector, our review of the
evidence shows that this potential has not been realized. Instead, on average fully online coursework has
contributed to increasing gaps in educational success across socioeconomic groups while failing to
improve affordability. Even when overall outcomes are similar for classroom and online courses, students
with weak academic preparation and those from low-income and under-represented backgrounds
consistently underperform in fully-online environments. Success rates are lower and employers—in
addition to students, faculty, academic leaders, and the public—attribute lower value to online than to
classroom degrees. A strong body of evidence, as well as industry best practices, have consistently
emphasized the critical role of frequent and meaningful interaction between students and instructors for
increasing the quality of the online educational experience and improving student outcomes and
satisfaction. Weakening federal requirements for regular and substantive interaction between students and
faculty in online courses would likely decrease educational quality, further erode employer confidence in
the value of online credentials, increase barriers to postsecondary success, and expand opportunities for
some institutions to exploit vulnerable students and federal student aid programs.
Acknowledgements
The Laura and John Arnold Foundation (LJAF) provided support for this paper. Results, information and
opinions represent the analysis, information and opinions of the authors and are not endorsed by or reflect
the views or positions of LJAF or any employee thereof.
i Spiros Protopsaltis is an Associate Professor and Director of the Center for Education Policy and Evaluation at
George Mason University’s College of Education and Human Development and served as a deputy assistant
secretary for higher education and student financial aid at the U.S. Department of Education during the Obama
administration. Sandy Baum is a fellow in the Center on Education Data and Policy at the Urban Institute and
professor emerita of economics at Skidmore College.
1
Executive Summary
Predictions that technology will revolutionize postsecondary education have generated extreme optimism
about the promise of online coursework for solving the problems of rising college prices, as well as
unequal access and student outcomes. For the past couple of decades, the hope has been that students
whose geographical constraints, financial limitations, and work and family obligations make it difficult
for them to participate in brick-and-mortar classrooms will be able to enroll online and earn high-quality,
inexpensive degrees.
Today, almost one-third of college students take courses online, with no in-person component. Half of
these students are enrolled in exclusively online programs, while the remaining take at least one, but not
all of their courses, online. This form of delivery is particularly prevalent in the for-profit sector: for-
profit colleges enroll just 6 percent of all students, but 13 percent of students taking courses online and 24
percent of fully-online students.
However, more than a decade after Congress allowed online colleges full access to federal student aid
programs, and despite a subsequent explosion in their enrollment, a growing and powerful body of
evidence suggests that online learning is far from the hoped-for silver bullet. Online education has failed
to reduce costs and improve outcomes for students. Faculty, academic leaders, the public, and employers
continue to perceive online degrees less favorably than traditional degrees.
In a range of environments, the gaps in student success across socioeconomic groups are larger in online
than in classroom courses. Students without strong academic backgrounds are less likely to persist in fully
online courses than in courses that involve personal contact with faculty and other students and when they
do persist, they have weaker outcomes. Not surprisingly, students with more extensive exposure to
technology and with strong time management and self-directed learning skills are more likely than others
to adapt to online learning where students can do the work on their own schedules. There is considerable
danger that moving vulnerable students online will widen attainment gaps rather than solving the
seemingly intractable problem of unequal educational opportunity.
Technology can add to the learning experience when it supplements, rather than replaces, face-to-face
interaction. The outcomes of hybrid models employing this approach do not mirror the problems that
emerge in fully online courses. But high quality courses are expensive to produce and maintain. It is
inexpensive to post lectures online for large numbers of students to access, but high-quality courses with
meaningful interaction among students and between students and faculty are not money savers.
A key theme emerging from the literature is the critical importance of student-faculty interaction in online
settings. Researchers, as well as both proponents and skeptics of online education, emphasize the need to
design online courses that facilitate robust interactions as an essential component for improving the
quality of learning and student outcomes and satisfaction. Lack of sufficient interaction between students
and faculty is likely online education’s Achilles’ heel. Both evidence about the cognitive components of
learning and research on differences in outcomes in different types of courses confirm the central role of
meaningful personal interaction between the instructor, who is the subject-matter expert, and the student.
As efforts to further expand online opportunities proceed, it is critical to design more interactive
educational experiences that integrate regular, direct, and meaningful contact and communication though
real-time class sessions and other synchronous interactions with peers and instructors. It is reasonable to
believe that many of the problems with online learning— particularly for at-risk students—would be
mitigated if these courses and programs consistently incorporated the frequent and substantive personal
interaction that is central to the learning process.
2
In 2006, following several years of intense lobbying by online providers and the for-profit sector,
Congress provided online programs with unrestricted access to student aid, but required them “to support
regular and substantive interaction between the students and the instructor, synchronously or
asynchronously.” This key distinction was meant to clearly distinguish online from self-paced
correspondence programs, which rely on self-learning, do not provide such interaction, have limited
access to federal student aid, and also have a long history of fraud and abuse.
The recent rise of competency-based education, a self-paced educational model the vast majority of which
is offered online, along with a high-profile federal government audit of the nation’s largest competency-
based education provider, has contributed to calls for weakening or eliminating the long-standing
requirement for regular and substantive interaction. The House Republican proposal for reauthorizing the
Higher Education Act would effectively eliminate this key requirement. This approach would not only be
inconsistent with the significant evidence that clearly demonstrates the key role of faculty-student
interaction in ensuring a quality online education, but would further erode employer, educator, and public
confidence in its value.
Our review of the evidence demonstrates that:
Online education is the fastest-growing segment of higher education and its growth is
overrepresented in the for-profit sector.
A wide range of audiences and stakeholders—including faculty and academic leaders, employers
and the general public—are skeptical about the quality and value of online education, which they
view as inferior to face-to-face education.
Students in online education, and in particular underprepared and disadvantaged students,
underperform and on average, experience poor outcomes. Gaps in educational attainment across
socioeconomic groups are even larger in online than in traditional coursework.
Online education has failed to improve affordability, frequently costs more, and does not produce
a positive return on investment.
Regular and substantive student-instructor interactivity is a key determinant of quality in online
education; it leads to improved student satisfaction, learning, and outcomes.
Online students desire greater student-instructor interaction and the online education community
is also calling for a stronger focus on such interactivity to address a widely recognized
shortcoming of current online offerings.
For some students the choice may be between online coursework or no coursework at all. Even if success
rates are relatively low in online courses, the availability of these courses may allow students to enroll in
more courses, leading to the accumulation of more credits for some students. Even low pass rates might
increase graduation rates. But the greatest risk is that the rush to transform higher education will widen
the gulf between the college education available to those who arrive at the door with ample resources and
strong academic preparation and those who depend on postsecondary education to create a path to
productive lives.
Creating access to programs is a step forward, but only if those programs succeed in providing
meaningful educational opportunities to students with minimal levels of academic preparation who need
to develop their self-discipline, time management, and learning skills—not just have access to a specific
body of information. As we seek to improve the quality of online education and reverse its poor record in
an effort to ensure that it not only serves more students, but also serves them well, it is critical to promote
regular and substantive student-instructor interaction. Otherwise, we risk blurring the line between
education and self-learning and further opening the floodgates for unscrupulous online colleges to prey on
vulnerable students and exploit out federal student aid programs.
3
Predictions of a revolution quite clearly exaggerated the near-term prospects for change. But that does not
mean we should give up on technology’s potential to enhance college learning opportunities. It does mean
we should be cautious about proponents of innovation who over-promise and we should create and
maintain a regulatory environment that supports the use of technology to supplement and strengthen the
intrinsically interactive nature of teaching and learning.
4
Introduction
Long-standing challenges facing higher education—runaway prices and inadequate student outcomes,
coupled with persistent access and achievement gaps—have fueled widespread hope for transformative
solutions that will bend the cost curve and increase educational attainment, especially for students with
very limited financial resources and inadequate academic preparation. Predictions that innovations that
will revolutionize higher education and increase educational attainment across demographic groups are
just around the corner frequently rely on technology as a silver bullet.
The recent rise and fall of the dream that Massive Open Online Courses (MOOCs) would transform
higher education has not weakened the hype and hope, born in the 1990s, that online learning will both
lower the cost of providing education and ensure access to meaningful postsecondary credentials for
broad segments of the population who are not well served by more traditional college and university
programs.
The hopes are rooted in reasonable logic. Online education offers students flexibility and personalized
learning opportunities. Proponents have long argued that it holds the promise to transform the higher
education landscape by expanding access, improving instruction, and decreasing costs for underserved
populations. Students who are not geographically mobile and who have work and family obligations that
make it difficult for them to manage traditional class schedules can do online coursework on their own
schedules. The lack of a physical campus or classroom facilities and the potential for larger class sizes
without real-time professors could lower costs and reduce prices for students. If it can make college
accessible to students with limited options and busy schedules, customize the learning experience, and
reduce costs for both students and institutions, online education has enormous potential to positively
“disrupt” the higher education landscape and boost student outcomes.
However, more than a decade after Congress allowed online colleges full access to federal student aid
programs, and despite a subsequent explosion in their enrollment, a growing and powerful body of
evidence suggests that online learning is far from the hoped-for silver bullet. Not only has online
education failed to reduce costs and improve outcomes for students, its return on investment for both
students and taxpayers has also failed to materialize. Online students are frequently being charged more,
not less, than students in traditional programs. Employers continue to perceive online degrees less
favorably than traditional degrees. Academic leaders and faculty remain skeptical about the quality of
online learning and its pedagogical value.
High quality courses are expensive to produce and maintain. Students without strong academic
backgrounds are less likely to persist in fully online courses than in courses that involve personal contact
with faculty and other students and when they do persist, they have weaker outcomes. The students most
likely to enroll in online courses—and those the postsecondary system is most challenged to serve well—
suffer most from this learning format. In other words, moving vulnerable students online may be more
likely to widen attainment gaps than to solve the seemingly intractable problem of unequal educational
opportunity.
Researchers have conducted many studies in an attempt to evaluate the success of online courses.
Unfortunately, the research is far from conclusive. While some studies suggest that overall, learning
outcomes are similar to those in traditional classroom courses, a number of rigorous experimental studies
have found lower completion rates for online courses and, of particular concern, even larger gaps in
outcomes between at-risk students and those with strong academic preparation than those emerging in
classroom courses.

5
In searching for factors that may explain such disappointing outcomes, a key theme emerging from the
literature is the critical importance of student-faculty interaction in online settings. Researchers, as well as
both proponents and skeptics of online education, emphasize the need to design online courses that
facilitate robust interactions as an essential component for improving the quality of learning and student
outcomes. A significant volume of research and recent surveys of students, faculty and employers
demonstrate that lack of sufficient interaction between students and faculty is likely online education’s
Achilles’ heel.
The combination of the temptation of developing programs that attract large numbers of at-risk students
who have federal financial aid with the mounting evidence that fully online programs have not been
productive routes for these students makes structuring a reliable regulatory environment critical. The 2006
lifting of the requirement that schools had to deliver at least half of their programs, or enroll at least half
of their students, in physical classes in order to participate in federal student aid programs led to the
proliferation of online-only institutions, particularly in the for-profit sector.
As the U.S. Department of Education prepares to revisit and revise the current regulatory environment
and Congress prepares to reauthorize the Higher Education Act, it is important to examine the evidence
on online education and understand how legislative and/or regulatory changes could have a major impact
on educational opportunities and outcomes for students.
In this paper, we assess the evidence about whether online education lives up to the hype. After we
examine the growth of online learning, especially in the for-profit sector, we provide an overview of the
literature analyzing the strengths and weaknesses of online learning programs, with a focus on
disadvantaged students’ outcomes, and discuss the policy implications of the available evidence for
safeguarding students and taxpayers and promoting quality educational opportunities.
Online Education’s Explosive Enrollment Growth and Concentration in the For-Profit Sector
Enrollment in online education has exploded in recent years, consistently outpacing overall enrollment
growth. Although the National Center for Education Statistics (NCES) did not begin collecting annual
data until 2012, the NCES National Postsecondary Student Aid Study allows us to estimate the historical
trend:1
Between 2000 and 2012, the share of undergraduates enrolled in online courses grew fourfold
from 8 to 32 percent, while enrollment in fully online programs tripled from 2 to 6 percent.
Between 2004 and 2012, the share of graduate students enrolled in online courses more than
doubled, from 17 to 36 percent, while enrollment in fully online programs tripled from 6 percent
to 18 percent.
This trend is further confirmed by the annual online enrollment data reported by the Babson Survey
Research Group, which began collecting data in 2002. Specifically, from 2002 to 2012 (Figure 1):2
Online enrollment (the number of students taking at least one online course) more than
quadrupled (increased by 345 percent), from 1.6 to 7.1 million students, while overall higher
education enrolment grew by 28 percent.
The annual online enrollment growth rate ranged from 6 percent to 37 percent, outpacing overall
enrollment growth every year.

6
By 2012, one third of all students took at least one course online, compared to less than 10 percent a
decade earlier.
This growth trend has persisted in recent years, according to the NCES data. Between 2012 and 2016,
online enrollment expanded by 16 percent, while total enrollment declined by 4 percent.3 Every year
during this period online enrollment increased, while total enrollment decreased. Today, almost 1 in 3
college students (6.3 million or 32 percent) take courses online, with no in-person component. Half of
these students (3 million or 47 percent of those taking any online courses) are enrolled in exclusively
online programs (fully online), while the remaining take at least one, but not all of their courses, online
(partly online). Online students represent a considerably higher share of enrollment in the for-profit sector
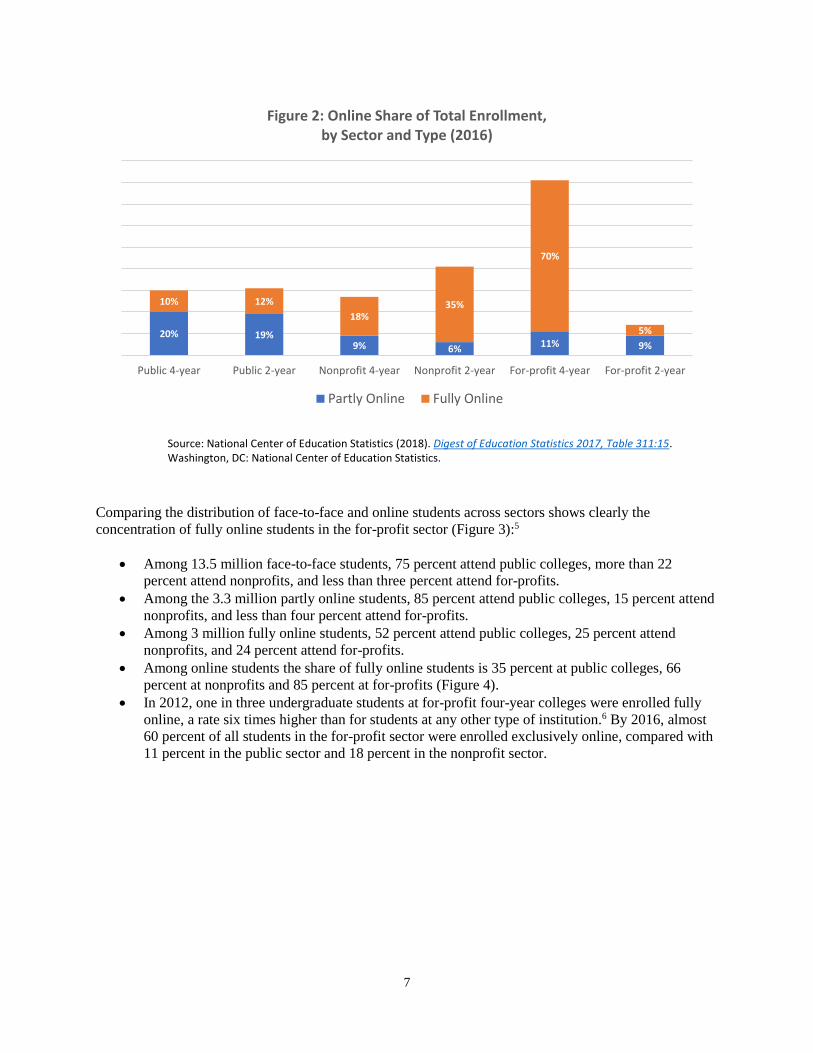
(Figure 2):4
For-profit colleges enroll just 6 percent of all students, but 13 percent of students taking courses
online and 24 percent of fully online students.
At four-year for-profit colleges, more than 80 percent are taking courses online, which is more
than two-and-a-half times the rate at public (29 percent) and triple the rate at private nonprofit (27
percent) four-year colleges.
At four-year for-profit colleges, 70 percent are fully online students, which is more than seven
times the rate at public (10 percent) and three-and-a-half times the rate at nonprofit (18 percent)
four-year colleges.
0
5,000,000
10,000,000
15,000,000
20,000,000
2002 2003 2004 2005 2006 2007 2008 2009 2010 2011 2012
Figure 1: Total and Online Enrollment (2002-2012)
Total Online
Source: I. Elaine Allen and Jeff Seaman (2014). Grade Change: Tracking Online Education in the United States. Babson Park, MA: Babson Survey Research Group and Quahog Research Group, LLC. p. 33.
7
Comparing the distribution of face-to-face and online students across sectors shows clearly the
concentration of fully online students in the for-profit sector (Figure 3):5
Among 13.5 million face-to-face students, 75 percent attend public colleges, more than 22
percent attend nonprofits, and less than three percent attend for-profits.
Among the 3.3 million partly online students, 85 percent attend public colleges, 15 percent attend
nonprofits, and less than four percent attend for-profits.
Among 3 million fully online students, 52 percent attend public colleges, 25 percent attend
nonprofits, and 24 percent attend for-profits.
Among online students the share of fully online students is 35 percent at public colleges, 66
percent at nonprofits and 85 percent at for-profits (Figure 4).
In 2012, one in three undergraduate students at for-profit four-year colleges were enrolled fully
online, a rate six times higher than for students at any other type of institution.6 By 2016, almost
60 percent of all students in the for-profit sector were enrolled exclusively online, compared with
11 percent in the public sector and 18 percent in the nonprofit sector.
20% 19%9% 6%
11% 9%
10% 12%
18%35%
70%
5%
Public 4-year Public 2-year Nonprofit 4-year Nonprofit 2-year For-profit 4-year For-profit 2-year
Figure 2: Online Share of Total Enrollment, by Sector and Type (2016)
Partly Online Fully Online
Source: National Center of Education Statistics (2018). Digest of Education Statistics 2017, Table 311:15. Washington, DC: National Center of Education Statistics.

8
Not only are fully online students disproportionately in the for-profit sector, a closer look at enrollment
data indicates that a small number of large providers enroll the lion’s share. (Similarly, in the nonprofit
sector, three institutions—Western Governors University, Liberty University and Southern New
52%
70%
75%
74%
25%
17%
22%
21%
24%
13%
3%
6%
0 10 20 30 40 50 60 70 80 90 100
Fully Online Students
Online Students
Face-to-Face Only Students
Total Students
Figure 3: Enrollment Distribution,by Online Participation and Sector (2016)
Public Nonprofit For-profit
65%
34%
15%
35%
66%
85%
Public Nonprofit For-profit
Figure 4: Online Enrollment Distribution, by Sector (2016)
Partly Online Fully Online
Source: National Center of Education Statistics (2018). Digest of Education Statistics 2017, Table 311:15. Washington, DC: National Center of Education Statistics.
Source: National Center of Education Statistics (2018). Digest of Education Statistics 2017, Table 311:15. Washington, DC: National Center of Education Statistics.
9
Hampshire University—enroll about a third of the fully-online students, but overall a far smaller share of
students in this sector are in such programs.):7
Ten for-profit colleges8 enroll over 58 percent of the for-profit sector’s online students, 40
percent of the sector’s students overall, and eight percent of all online students.
15 for-profit colleges9 enroll more than 75 percent of the sector’s fully online students, 43 percent
of the sector’s students overall, and 18 percent of all fully online students.
Others have also described this online concentration in both the for-profit sector and among a handful of
colleges within the sector.10 A major 2012 Senate investigation of the for-profit college industry, which
included an in-depth look at 30 of the largest companies, described the rapid expansion of online
enrollment and found that the sector engaged in aggressive recruitment and marketing and produced poor
student outcomes, including higher dropout rates. In particular, when comparing the outcomes of on-
campus and online students at the same institution, in addition to paying higher prices, the latter
experienced a 39 percent higher dropout rate (64 vs. 46 percent).11 That same year, a paper by Deming et
al. (2012) concluded that from 2000 to 2009 online for-profit colleges “increased from almost nothing to
become the largest part of the sector.” 12 More recently, Deming et al. (2016) found that “the 23 largest
for-profit institutions, owned by publicly traded companies and offering postsecondary degrees entirely
online, enrolled more than 1.1 million students in 2012 and accounted for nearly 20 percent of the growth
of US bachelor’s degrees (BAs) from 2002 to 2012.”13
In 2013 more than half of all students enrolled in institutions that are part of a for-profit chain were
studying fully online, compared with about 1 percent of those attending selective public and private
nonprofit four-year institutions. Non-selective public and private nonprofit colleges and universities and
independent for-profits fell between these extremes.14 Moreover, at-risk students are disproportionately
taking advantage of online coursework. Online students are more likely to be older, employed, female,
independent, with children, and enrolled part-time,15 which are student characteristics most prevalent in
the for-profit sector.16
In 2015-16, when 11 percent of undergraduates were studying entirely online, 15 percent of black
students were in fully online programs. Only 1 percent of students with no risk factors for failing to
complete a degree and 3 percent of those with one risk factor were enrolled fully online. A quarter of
students with four or more risk factors were in these programs.17 In addition, the share of fully online
students is negatively correlated with high school GPA. For example, 14 percent of students with high
school GPA between 1.0 and 1.4 were enrolled fully online in 2015-16, compared with 4 percent of those
with GPA of 3.5 or higher.18
Online student characteristics, which are associated with an increased dropout risk and lower completion
rates, combined with the trends discussed above and the for-profit sector’s poor record in affordability
and student outcomes, represent a significant challenge in ensuring quality educational opportunities for
disadvantaged students pursuing online degrees.
Perceptions of Online Education’s Quality and Value
Despite the dramatic growth of online education, there is significant skepticism about the value of online
education among faculty, academic leaders, employers, and the public.
Often cited by proponents as “a major barrier” to the adoption of online education, faculty have been and
remain apprehensive about its promise and potential.19 In ten national surveys of chief academic officers
by the Babson Survey Research Group during the 2002-2015 period, no more than about a third ever

10
reported that faculty accept the value and legitimacy of online education, ranging from a low of 28
percent in 2002, 2005 and 2014, to a high of 34 percent in 2007 (Figure 5).20 Most tellingly, in 2015,
which is the latest year of available data, just 29 percent reported faculty acceptance, just one percent
higher than in 2002, indicating no change in perception over a 13-year period. As the survey report
concluded, “a continuing failure of online education has been the inability to convince its most important
audience— higher education faculty members—of its worth.”21
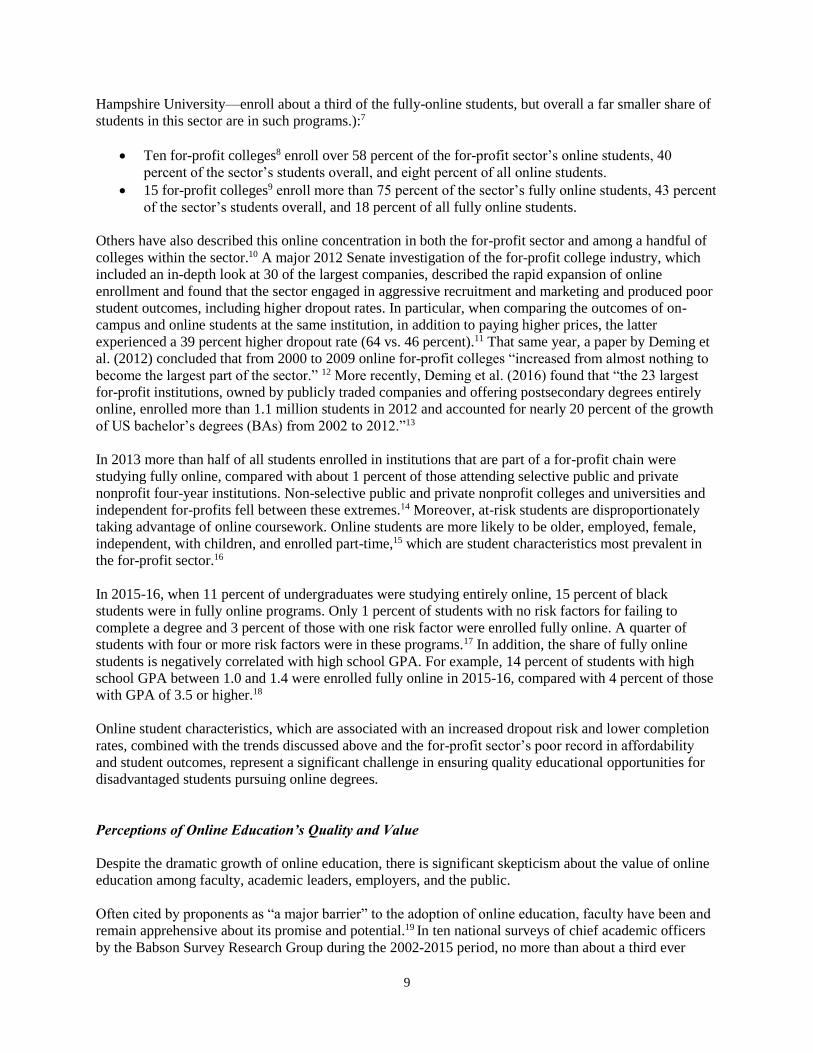
In a separate 2012 survey of a nationally representative sample of more than 4,500 faculty, 2 out of 3 (66
percent) reported that online learning outcomes are “inferior or somewhat inferior” to face-to-face
courses, compared with just six percent who said they were “superior or somewhat superior” (Figure 6).
Also, 6 out of 10 faculty (58 percent) reported “more fear than excitement” about online learning, and
fewer than half (47 percent) agreed that “online education can be as effective in helping students learn as
in-person instruction.” 22
28%29%
7%
15%
0%
5%
10%
15%
20%
25%
30%
35%
2002 2004 2005 2006 2007 2009 2011 2012 2014 2015
Figure 5: Faculty Acceptance of Online Education's Value and Legitimacy (2002-2015)
Agree Disagree
Source: I. Elaine Allen, I. Jeff Seaman, Russell Poulin, and Terri Taylor Straut (2016). Online Report Card: Tracking Online Education in the United States. Babson Park, MA: Babson Survey Research Group and Quahog Research Group, LLC. p. 47.
11
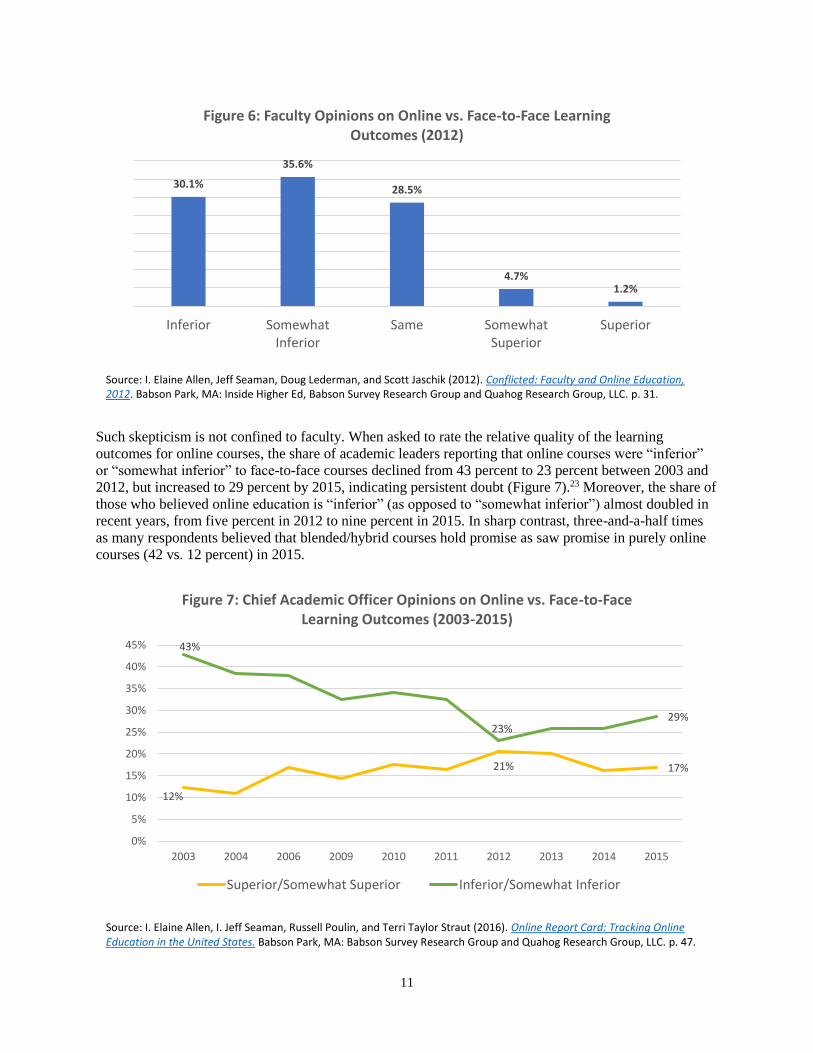
Such skepticism is not confined to faculty. When asked to rate the relative quality of the learning
outcomes for online courses, the share of academic leaders reporting that online courses were “inferior”
or “somewhat inferior” to face-to-face courses declined from 43 percent to 23 percent between 2003 and
2012, but increased to 29 percent by 2015, indicating persistent doubt (Figure 7).23 Moreover, the share of
those who believed online education is “inferior” (as opposed to “somewhat inferior”) almost doubled in
recent years, from five percent in 2012 to nine percent in 2015. In sharp contrast, three-and-a-half times
as many respondents believed that blended/hybrid courses hold promise as saw promise in purely online
courses (42 vs. 12 percent) in 2015.
30.1%
35.6%
28.5%
4.7%1.2%
Inferior SomewhatInferior
Same SomewhatSuperior
Superior
Figure 6: Faculty Opinions on Online vs. Face-to-Face Learning Outcomes (2012)
12%
21% 17%
43%
23%29%
0%
5%
10%
15%
20%
25%
30%
35%
40%
45%
2003 2004 2006 2009 2010 2011 2012 2013 2014 2015
Figure 7: Chief Academic Officer Opinions on Online vs. Face-to-Face Learning Outcomes (2003-2015)
Superior/Somewhat Superior Inferior/Somewhat Inferior
Source: I. Elaine Allen, Jeff Seaman, Doug Lederman, and Scott Jaschik (2012). Conflicted: Faculty and Online Education, 2012. Babson Park, MA: Inside Higher Ed, Babson Survey Research Group and Quahog Research Group, LLC. p. 31.
Source: I. Elaine Allen, I. Jeff Seaman, Russell Poulin, and Terri Taylor Straut (2016). Online Report Card: Tracking Online Education in the United States. Babson Park, MA: Babson Survey Research Group and Quahog Research Group, LLC. p. 47.
12
This uncertainty about the value and legitimacy of online education may also be fueled by growing
concerns about the difficulties with student retention. During the 2004-2014 decade of online enrollment
expansion, the share of chief academic officers who reported that student retention was a greater problem
in online than in face-to-face courses increased from 27 to 45 percent.24
Outside academia, the general public also remains skeptical about online education. A 2013 Gallup poll
found that “Americans' overall assessment of Internet-based college programs is tepid at best.”25 While
they recognize the broader range of options and value offered compared with a traditional face-to-face
education, most reported that it provides lower quality instruction and less rigorous grading and testing,
and is less credible to employers. Moreover, “despite lots of media and industry buzz about the
personalized nature of online instruction, Americans still view traditional, classroom-based education as
better tailored to each individual.”
Potentially contributing to negative perceptions of online education are recent government investigations
and lawsuits that have raised concerns about the quality of such programs. A 2011 GAO undercover
investigation of 15 online for-profit colleges documented significant issues with academic quality,
including three out of four colleges admitting students with fake high-school diplomas and half of the
colleges who enrolled such students failing to take action for substandard student performance, including
failure to attend class, failure to submit assignments, submission of objectively incorrect assignments,
submission of unresponsive assignments, and plagiarism.26 For example, two colleges knew assignments
were plagiarized but took no action, another college gave a passing grade to a student who submitted
photos of celebrities and political figures in lieu of essay question responses, and another college awarded
points for incomplete assignments.
More recently, following a 2016 lawsuit against George Washington University by a group of former
online students who argued that they had paid a higher price but received a lower quality education than
their on-campus peers,27 and specifically cited a lack of instruction by and limited interaction with
faculty,28 a Faculty Senate task force investigation of the university’s online education programs revealed
“lack of oversight, unclear course requirements and large student-faculty ratios.”29
Arguably though, the most important perception is that held on the demand side of the labor market.
Employers are the ultimate arbiters of the value of online education since they are best positioned to
compare the skills, knowledge, and overall employability of online graduates. Several studies prior to
2010 examined employer perceptions of online degrees and reached the same conclusion: employers view
candidates’ online degrees as inferior to or less desirable than degrees obtained through traditional, face-
to-face instruction.30 A 2012 comprehensive literature review of representative studies published between
2005 and 2010 in scholarly, peer-reviewed journals that covered a wide range of disciplines that are
overrepresented in online education and the for-profit sector and corresponding job markets (including
health and business) 31 concluded that “there is a much greater likelihood that a candidate with an online
degree would be viewed less favorably for employment purposes compared to the candidate with the
face-to-face degree.”32 The primary concern cited by employers about online learning was the lack of
interaction, and in particular face-to-face communication between students and faculty.
Similarly, a 2010 survey of 449 randomly selected human resource professionals by the Society for
Human Resource Management (SHRM) found that half viewed candidates with online degrees less
favorably than those with traditional degrees and that online degrees were far less acceptable for higher
positions in an organization.33
Given the online enrollment trends, one would expect that more recent evidence would find a shift to
more favorable employer perceptions; however, that is not the case. A major Chronicle of Higher
13
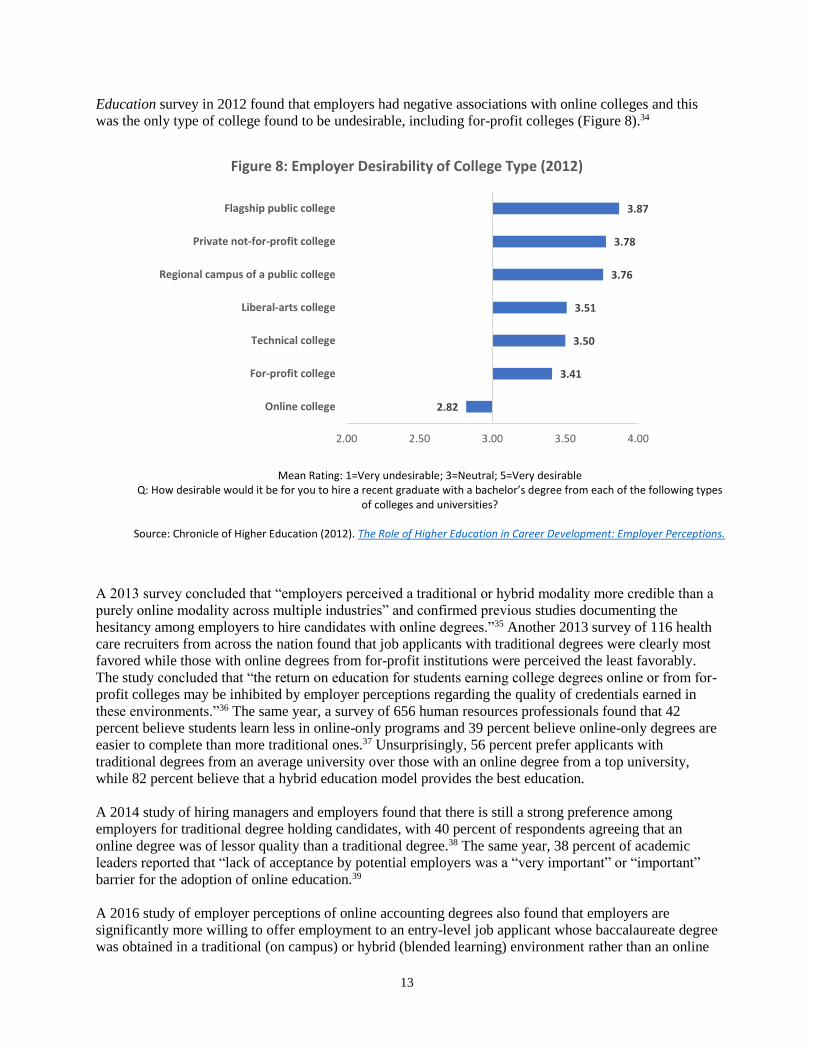
Education survey in 2012 found that employers had negative associations with online colleges and this
was the only type of college found to be undesirable, including for-profit colleges (Figure 8).34
A 2013 survey concluded that “employers perceived a traditional or hybrid modality more credible than a
purely online modality across multiple industries” and confirmed previous studies documenting the
hesitancy among employers to hire candidates with online degrees.”35 Another 2013 survey of 116 health
care recruiters from across the nation found that job applicants with traditional degrees were clearly most
favored while those with online degrees from for-profit institutions were perceived the least favorably.
The study concluded that “the return on education for students earning college degrees online or from for-
profit colleges may be inhibited by employer perceptions regarding the quality of credentials earned in
these environments.”36 The same year, a survey of 656 human resources professionals found that 42
percent believe students learn less in online-only programs and 39 percent believe online-only degrees are
easier to complete than more traditional ones.37 Unsurprisingly, 56 percent prefer applicants with
traditional degrees from an average university over those with an online degree from a top university,
while 82 percent believe that a hybrid education model provides the best education.
A 2014 study of hiring managers and employers found that there is still a strong preference among
employers for traditional degree holding candidates, with 40 percent of respondents agreeing that an
online degree was of lessor quality than a traditional degree.38 The same year, 38 percent of academic
leaders reported that “lack of acceptance by potential employers was a “very important” or “important”
barrier for the adoption of online education.39
A 2016 study of employer perceptions of online accounting degrees also found that employers are
significantly more willing to offer employment to an entry-level job applicant whose baccalaureate degree
was obtained in a traditional (on campus) or hybrid (blended learning) environment rather than an online
2.82
3.41
3.50
3.51
3.76
3.78
3.87
2.00 2.50 3.00 3.50 4.00
Online college
For-profit college
Technical college
Liberal-arts college
Regional campus of a public college
Private not-for-profit college
Flagship public college
Figure 8: Employer Desirability of College Type (2012)
Mean Rating: 1=Very undesirable; 3=Neutral; 5=Very desirable Q: How desirable would it be for you to hire a recent graduate with a bachelor’s degree from each of the following types
of colleges and universities?
Source: Chronicle of Higher Education (2012). The Role of Higher Education in Career Development: Employer Perceptions.

14
environment.”40 Employers appear more accepting of online degrees for lower-level than for upper-level
positions, consistent with findings in the 2010 SHRM survey.
In the field of education, two recent national surveys of high school principals found that applicants who
had taken coursework in a traditional/residential setting were overwhelmingly preferred over applicants
holding a degree earned partly or wholly online. Lack of personal interaction was the primary concern, as
“online courses were perceived as not presenting sufficient opportunity for students to develop important
social skills through interaction with other students and mentors.”41
Finally, a 2016 experimental study of the value of online degrees in the labor market found that a business
bachelor’s degree recipient from a for-profit online institution is 22 percent less likely to receive a
callback than one from a nonselective public institution.42
Regardless of the actual quality of the learning in fully online programs, students who earn these degrees
will have limited labor market opportunities as long as these strong views persist among employers.
Online Student Outcomes
Several studies have attempted to aggregate the findings of a wide range of earlier studies on the
effectiveness of online learning.43 These meta-analyses pre-date much of the more recent rigorous
experimental work in the field. More than one summative investigation has judged that the research does
not yield conclusive evidence of a systematic difference in learning outcomes between online and
classroom courses, but that the variation in findings across the body of existing work is so great as to
make it impossible to generalize. When hybrid models that blend face-to-face interaction with technology
are classified as online course work, results are more likely to favor the online option. The variation in
results is due to differences in methodology, the environments studied, and the nature of the courses
examined.
Some of the meta-studies include only rigorous peer-reviewed studies. Others explicitly include a wider
range of studies, many of which are based on simple comparisons of outcomes across small groups of
students. For example, the Tallent-Runnels et al (2016)44 review of research on online teaching and
learning includes primarily descriptive and qualitative studies. The consensus that emerges is that learning
outcomes appear to be the same as in traditional courses, but students with prior training in computers are
more satisfied than others with online courses. Well-designed experimental design studies may yield
insights not emerging from less rigorous methods.
Some studies focus on specific courses in economics or statistics, while others examine courses in a wide
range of disciplines. In most cases, it is difficult to know much about the actual pedagogical methods,
either in the classroom or online. It is hardly surprising that synchronous online courses with intense
faculty involvement and courses consisting entirely of recorded lectures have different outcomes or that
students in developmental education courses fare differently from those in master’s degree programs.
Measuring course completion rates will not necessarily yield the same conclusion as comparing test
scores of course completers. This distinction underlies some of the ambiguity in the research findings on
the success of online coursework, with measures of learning tending to yield more positive outcomes than
successful course completion rates for online coursework.
Are hybrid classes included in the online category being evaluated? How diverse are the students in the
study? These issues are particularly important, since there is broad consensus that classroom outcomes
can be strengthened when technology supplements traditional teaching methods and that online learning
15
is more successful when combined with some amount of face-to-face interaction. In other words, it is not
always easy to draw a clear line between online and classroom teaching and placing hybrid models on one
side or the other for evaluation purposes can significantly alter the results.
Equalizing Opportunity?
A 2017 Boston Globe editorial posited that “Online learning can ease economic inequality.” The opinion
piece, relying on insights gleaned from a recent conference, argued that colleges should increase
affordable, for-credit online offerings in order to create opportunities for at-risk students.45 Perhaps this
vision will eventually be realized, but for now, this suggestion creates a significant potential threat to
efforts to make meaningful progress is narrowing gaps in educational opportunities and outcomes across
demographic groups.
Much of the research finding comparable outcomes for online and classroom courses, as well as the
studies synthesizing that research, is more than a decade old. Despite the ambiguous findings from the
large body of research comparing general learning outcomes for online and classroom courses, more
recent studies using rigorous experimental techniques and focusing on the role of student characteristics
have found that fully online courses have a significant negative impact on outcomes for at-risk students.
In some environments, grades and other outcomes measures may be similar overall for purely online and
classroom courses, but online courses appear to have significant disadvantages for less-prepared students
and for those from under-represented groups. A number of studies at community colleges have found that
students who take on-line classes do less well in subsequent courses and are more likely than others not
only to fail to complete these courses, but to drop out of school.46
Online courses, particularly those where students can do the work on their own schedules, may require
more self-discipline and time management skills than traditional classroom courses. Interesting evidence
on this issue emerged when two economists announced, but did not enforce, a deadline for registering for
a MOOC they offered. Students who applied on time had higher grades and completion rates than those
who applied late, differences plausibly related to self-discipline.47
Purely online courses are also likely to limit opportunities for networking and interacting with instructors
and peers, potentially hampering the educational process.48 These realities make it unsurprising that
students without strong academic skills and preparation struggle without the classroom structure—even if
some students thrive.
Gladieux and Swail (1999)49 raised concerns about online learning increasing socioeconomic gaps in
educational outcomes twenty years ago and multiple studies confirm these findings about outcomes for
vulnerable populations. Not surprisingly, students with more extensive exposure to technology, and with
strong time management and self-directed learning skills are more likely than others to adapt to online
learning.
Recent rigorous studies of community college systems have been discouraging. Smith Jaggars and Xu
(2010) analyzed data on nearly 24,000 students in 23 institutions in the Virginia Community College
system. They concluded that students had a greater likelihood of failing or withdrawing from online
courses than from face-to-face courses and that students who took online coursework in early semesters
were somewhat less likely to return to school in following semesters. Students who took a higher
proportion of credits online were slightly less likely to attain a credential or transfer to a four-year
institution.
16
Similar conclusions emerged from the Washington State Community College System (Xu & Smith
Jaggars, 2011).50 Analyzing data from more than 51,000 students in 34 community and technical colleges,
the researchers found that although students with better educational preparation were more likely to enroll
in online courses, these students were significantly more likely to fail or withdraw from these courses
than students who took traditional face-to-face classes. Students who took more online courses were also
slightly less likely to complete a degree or transfer to a four-year college than those who took fewer
online courses. All types of students in the study performed worse in online courses, but some groups of
students had particular difficulty adjusting to online learning, including males, students with lower prior
GPAs, and black students. Performance suffered more in the social sciences and the applied professions
such as business and nursing than in other fields, but the performance gaps that existed among these
subgroups in face-to-face courses became even more pronounced in online courses in all subject areas.
According to this research from the Community College Research Center, the differences were even
greater for developmental courses than for college-level courses. In online developmental English, failure
and withdrawal rates were more than twice as high as in face-to-face classes. Students who took
developmental courses online were also significantly less likely to enroll in college-level gatekeeper math
and English courses. Of students who did enroll in gatekeeper courses, students who had taken
developmental education online were far less likely to pass than students who had taken it face-to-face.51
Similarly, Kupp (2012)52 found that in California community colleges, students enrolled in online classes
had, in the aggregate, lower completion rates and lower success rates than their peers in face-to-face
classes. The authors found that online instruction significantly increased the achievement gap between
Latino students, who experienced particularly large differences in success rates, grades, and withdrawal
relative to their performance in face-to-face sections of the same classes, and white students. Interviews
with Latino students enrolled in online courses provided insight into the importance of relationships to
Latino student success. Students identified the absence of a strong student-instructor relationship as the
key difference between their face-to-face and online educational experiences.
These findings are not limited to community colleges. A large study of students at a for-profit institution
that offered courses with the same syllabus, instructors, requirements, and assessments found consistently
worse outcomes for students taking the courses online. They earned lower grades in the courses and had
lower grades the following term, particularly in the same subject area or courses for which the course in
question was a pre-requisite. Students were about nine percentage points less likely to remain enrolled the
semester after taking an online course than after taking a similar course in a classroom. Of particular note,
the online classes reduced grades by more for students with below-average GPAs prior to the course.53
In a study based on the random assignment of students in a large introductory microeconomics course at a
major research university to either live lectures or watching these same lectures in an internet setting,
Figlio et al (2010)54 found no significant difference for students with high GPAs coming into the course.
But those with low GPAs had more difficulty adapting to the online context and their performance
suffered. Instruction, supplemental materials, and other course elements were the same for both groups.
The results were particularly strong for Hispanic students, male students, and lower-achieving students,
confirming other research finding at-risk students particularly likely to suffer from fully online courses.
Evidence about gender differences is mixed, despite the fact that overall, women have higher success
rates in higher education then men. Several studies have found no differences between males and females
in terms of their learning outcomes in online courses,55 but others have found that women perform
significantly better than men.56
Johnson and Mejia (2014) 57 found that students at California community colleges were less likely to
complete online courses and when they completed them, less likely to pass them. This result was
17
consistent across all groups of students, many fields of study, and most colleges in the system and
persisted over the 10-year period for which data were available. Controlling for student characteristics,
including prior academic achievement levels, increased the gap in success rates between the two types of
courses. Online course success rates were between 11 and 14 percentage points lower than success rates
in classroom courses. Of particular note, gaps across racial/ethnic groups were larger in online courses.
The authors found that younger students, African Americans, Latinos, males, students with lower levels
of academic skill, and part-time students were all likely to perform markedly worse in online courses than
in classroom courses. The success gaps were smaller for students who already had a college degree, those
who were following paths to transfer to a four-year institution, and students with GPAs above 3.0.58
However, Johnson and Mejia (2014) suggest that, contrary to the findings from the Community College
Research Center, the impact of the online format on long-term outcomes may differ from the impact on
success in individual courses. A study by Shea and Bidjerano (2014)59 supports this idea. Using data from
the Beginning Postsecondary Student Survey, a nationally representative sample of students who began
college in 2003-04, the authors found that in the nation as a whole, controlling for relevant background
characteristics, students who enrolled in some online courses during their first year at a community
college were more likely than similar students who did not take any of these courses to complete a
credential by 2009. Online courses can provide needed flexibility, particularly to students struggling to
combine school with family and work responsibilities. Even if success rates are relatively low in online
courses, the availability of these courses may allow students to enroll in more courses each term, leading
to the accumulation of more credits. Even low pass rates might increase graduation rates.
Online technology and pedagogy have developed considerably since many of the studies of this mode of
delivering college courses were conducted. There is every reason to be optimistic that outcomes could
improve over time as faculty and institutions have more experience. An interesting recent study examines
the experiences of students at small private nonprofit colleges, which developed online courses in
advanced humanities fields. The courses served students on multiple campuses and faculty found that, in
an environment where personal interaction is central to the academic experience, incorporating students
from other colleges was challenging. The difficulty of developing personal relationships with students
was the main reservation instructors had. However, attrition rates were low and all measured outcomes
improved as instructors gained experience when the courses were offered a second time.60
The Critical Role of Student-Instructor Interaction
Since the early days of online education, interaction has been identified as the key element for quality.
Almost 30 years ago, in defining distance education, University of Calgary professors Randy Garrison
and Doug Shale argued that interaction is “education at its most fundamental form”61 and that student-
instructor interaction in particular was “regarded as essential by many educators and highly desirable by
many learners.”62 They emphasized the importance of student-teacher communication as essential to
active learning. Even when online education was in its infancy, researchers had identified two-way and
interactive communication as a key feature of distance education, and considered interpersonal
communication and feedback as well as interaction among the seven critical competencies for online
instructors.63
This important realization about the centrality of interaction was also shared by the online education
industry. In 2006, the U.S. Distance Learning Association stated that “distance education refers
specifically to learning activities within a K–12, higher education, or professional continuing education
environment where interaction is an integral component” [emphasis added].64 A review of the relevant
evidence certainly confirms that interaction is essential for ensuring quality and student success in online
education.
18
Two major theories have been advanced to understand the effectiveness of online learning and both place
a premium on instructor interaction and presence.65 Transactional Distance posits that interaction is
critical as it minimizes the pedagogical distance between students and instructors, while Community of
Inquiry argues that teaching presence helps to provide structure and direction in the online environment,
including “design and organization, facilitating discourse and direct instruction.”66 Both online and face-
to-face classroom instructors fulfill three basic roles: (a) educational experience designer, (b) facilitator to
guide learning, and (c) subject matter expert.67
In essence, the literature argues that learning is an active, dynamic process, and that social isolation is a
risk factor associated with higher dropout rates. Instructor presence is integral for achieving interpersonal
interaction and activities that emulate those of a “real person.”68 Personal interaction increases student
satisfaction, and by extension, motivation to learn and succeed.69
Interpersonal interaction is a key feature of contemporary online learning and research over the past 20
years has consistently shown that strong student-instructor interaction increases student achievement.70
The following section summarizes a number of peer-reviewed studies related to this issue, all of which
confirm the importance of personal interaction in strengthening the student experience.
A 1999 survey of 1,406 State University of New York online students found that student–teacher
interaction was strongly related to student satisfaction and perceived learning.71 Students with low levels
of interaction had the lowest levels of satisfaction and learning and vice versa. The study concluded that
“the results clearly indicate that instructors’ activity is an important factor in the success of online
learning” and point “to the critical importance of active, authentic, and valued discussion to students’
perceptions of satisfaction and learning in online courses.”72 According to the study, frequent and
constructive student-instructor interaction, along with clear course structure and vibrant discussion, is
consistently associated with the success of online courses.
Another survey of 390 online MBA students between 1999 and 2001 at the University of Wisconsin
Oshkosh found that instructor efforts to interact personally with students were positive predictors of
student learning and course satisfaction.73 An extensive review of online learning literature in 2002
similarly concluded that quality online learning largely depends on plentiful student interaction with
instructors, as well as with other students, and content.74 The following year, another literature review
reached a similar conclusion about the central role of interaction to online learning and recommended its
expansion in order to become as effective as face-to-face interaction. 75
A 2003 survey of more than 200 online students at a private university also found that, consistent with
accepted theories, student-instructor interaction was a significant contributor to student learning and
satisfaction, and that students valued additional interaction with instructors and peers.76 The next year,
another published survey of 199 online students, which investigated their views of online instruction,
found that they wanted instructors who established trusting relationships and were actively engaged with
students and their learning.77
A 2005 case study of an online MBA program offered by a top business school, which included
interviews and focus groups with faculty and students as well as a survey of more than 100 students,
found that both instructors and students viewed such interaction as a key factor in high quality online
programs and an effective tool for learning.78 A 2006 survey of 131 undergraduate online students at
Indiana State University concluded that interacting with instructors was most beneficial.79 Yet another
survey of 186 online students from 38 courses on six campuses in the Midwest found that instructor-
student communication was strongly correlated with student engagement and urged instructors to provide
multiple and meaningful paths for such interactions in order to create presence, which is an integral
component of a successful online course.”80
19
In examining what specific instructor actions are most important in online student-instructor interactions,
a survey of 32 online instructors and 170 students from their classes at a large public university and a
private online university found that, among 19 actions identified by research,81 all but two were
considered important or very important by more than 60 percent of the instructors, while all 16 actions
were rated as highly by the students.82 The previously cited 2006 Tallent-Runnels comprehensive review
of 76 studies in online education also concluded that student-faculty interaction must be both regular and
substantive and reflect a clear understanding of the content, in order to truly promote learning.83 The
review concluded that faculty should promote interaction with students to help them construct knowledge,
participate in discussions, and provide scaffolding.
Another meta-analysis of 74 studies on the role of interaction in distance education in 2009 found that the
literature unequivocally supports the integral role and importance of interaction and concluded that
stronger interaction and the greater engagement it promotes is associated with improved achievement and
stronger outcomes.84
More recent peer-reviewed studies further confirm the significance of student-instructor interaction as a
key component of quality that leads to higher student satisfaction and achievement. A 2011 study of 23
online courses at two community colleges found that such regular and effective interaction encourages
online students to commit more and perform better academically.85 This is unsurprising, according to
Jaggars and Xu, given that “nearly every published online quality framework has emphasized the
importance of interpersonal communication and collaboration.”86 Specifically, in high-interaction courses,
instructors posted more frequently, sought student questions and feedback through various modes,
responded to students faster, and incorporated student feedback. Overall, interpersonal interaction was the
only design element that predicted student grades (unlike organization, objectives, and technology) and
students valued and were concerned more about their interactions with instructors than with their peers.
A 2013 survey of 223 graduate and undergraduate students found that student-instructor interaction was a
significant predictor of student satisfaction, and also confirmed previous research87 about its centrality in
the online course experience and its potentially strong impact on student outcomes and satisfaction.88
Another survey of online students during 2013-14 found that students perceive student-instructor
interaction and teaching presence as the most important factors for learning. Specifically, 82 percent rated
such interaction to be most/somewhat essential and 88 percent rated teaching presence to be
more/somewhat essential to their learning.89 A 2013 case study that examined the performance of two
instructors across six fully online courses also confirmed the instructor’s impact on student satisfaction, as
well as on teaching and social presence, and by extension, learning quality.90
A 2014 survey of 60 graduate online students found that online students believed they learned more in
courses with high student-instructor connections, confirming once again that students learn better when
both students and instructors actively participate. Students wanted a high degree of interactivity and
communication, including feedback and mentoring, and deeper relationships with instructors.91 The
authors warned that limited student-instructor online interaction leads to a disconnection and contributes
to a poor learning experience.
In exploring the factors contributing to the low student retention rates in a fully online environment,
driven in part by learner demotivation, researchers have suggested that live student-instructor interactions
can have a positive effect in creating a better learning environment and recommend designing courses that
foster more student-instructor and peer social interaction.92 Similarly, an earlier study also found that the
absence of a live component was very detrimental to online learning.93
Finally, student-instructor rapport also seems to be a key factor for student success. A survey of about 140
online undergraduate and graduate students at a medium-sized state university replicated the positive
20
correlation between student-instructor rapport and positive student outcome measures that has been found
in traditional settings, pointing to the need for a greater focus on student-instructor interaction behaviors
that build rapport, an important component of teaching.94
Beyond peer-reviewed research studies, the online education community has also emphasized recently the
importance of student-instructor interaction for ensuring quality. Since 2012, Learning House, a major
online education services provider, and Aslanian Market Research have conducted an annual national
survey of 1,500 prospective and actual online students to measure their perceptions, attitudes and
behaviors on a wide range of topics and issues. In its inaugural report, the authors argued that increased
interaction is a key competitive advantage of online education as a delivery method:95
Online learning not only allows institutions to serve more students at a lower expense,
but it also improves teaching methodologies, enhances the learning experience, and
increases interaction among students and instructors, sometimes even beyond the
interaction possible in a traditional classroom.
The same year, Learning House published a “Best Practices in Online Faculty Development” white paper,
which focuses heavily on the integral role of interaction and lists leadership of the discussion forum,
response to student assignments, and other classroom interactions as being among the core online faculty
responsibilities, in their effort to engage and motivate online students. 96 The paper describes best
practices in student-instructor online interactions:
For example, most of the faculty-student interaction occurs in a discussion forum where
the faculty member responds to individual student posts. He or she provides feedback,
refers the student to other posts and readings, probes for additional insights, draws
parallels and helps students connect concepts. Faculty members react and respond to
student comments rather than give a lecture or demonstration. The skill of presenting a
compelling lecture doesn’t apply to the online classroom; there, it is replaced with the
skill of stimulating student thinking and learning through multiple, short comments.
Moreover, the white paper argues that, regardless of the delivery method, “the faculty member is still the
key ingredient for an effective class and meaningful student experience,”97 and urges institutions to
require robust interaction with students as a key pedagogical strategy: 98
Institutions should set the most important expectation for faculty members--the tone and
type of interaction with students. Faculty member–student interaction occurs in three
basic ways: discussion forum participation, feedback on assignments, and e-mail
exchanges. Generally, the tone of the interaction should be supportive and encouraging
so students feel motivated to apply themselves. The type of interaction should be both
penetrating and expansive. Students often need to think more deeply, consider alternative
points of view, and gather more knowledge on a topic. Faculty members’ comments and
questions in grading and discussion forums can stimulate these practices in students.
Not only is student-faculty interaction a critical component of a quality online education, but the paper
argues that such interaction must be both frequent and substantive:99
Occasionally, people argue that quality is more important than quantity and so it is
inappropriate for academic leaders to set minimum expectations for faculty participation
in the classroom. They make the point that high-quality feedback once or twice a week is
better than minimal feedback four or five times a week. However, this issue should not be
a question of frequency or quality. The participation should be both frequent and high

21
quality for the optimal student experience. Both are important for a good learning
experience.
Similarly, a 2012 discussion paper by the Heritage Foundation promoting online education also describes
the important role of student-instructor interactions in all delivery modes: “It would appear, then, that stu-
dent interactions with professors can be meaningful either in person or online. The medium does not
determine the outcome; rather, the quality of interaction depends on how the medium is used.” The
argument is that interactions with online instructors and classmates, together with ongoing personal
relationships in the student’s community should be a substitute for an on-campus social life.”100
More recently, commenting on research that highlights the importance of quality interpersonal interaction,
the Online Learning Consortium (formerly the Sloan Consortium), which is “dedicated to integrating
online education into the mainstream of higher education,” agrees that instructor feedback promotes
student engagement and concludes that interaction is a critical area that online education needs to work
hard to provide: “Computers can distribute information and technology can make it snazzy, but the crucial
element of interpersonal relationships may be harder to perfect without face-to-face contact.”101
This conclusion is largely supported by an analysis of the seven reports published to date on the annual
“Online College Students” surveys, which confirms that students strongly value opportunities for
interaction with instructors and lack of such interaction is online education’s major shortcoming, despite
the above suggested best practices and aspirations.
In 2012, online students cited lack of direct contact and interaction with instructors and students (37
percent) and inconsistent or poor contact and communication with instructors (24 percent) as the top two
greatest disadvantages of online education, which, as the report concludes, supports the high level of
importance students give to having easy and open access to their instructors. The authors then recommend
that online education providers set expectations for the quantity and quality of faculty interaction with
students and provide appropriate faculty support and guidance. The surveys have also found that, when
selecting a program, offering “real-time” class sessions that facilitate synchronous student-instructor
interactions is an important programmatic feature that students look for when selecting an online
program.102
In 2015, almost one-third of students surveyed (29 percent) preferred the instructor-led model of
instruction, “where an instructor takes students through their learning activities,” while more than a third
(36 percent) would like to meet (virtually) regularly with a faculty member from their field of study to
discuss courses and schedule. The authors observe that online students would like more interaction with
faculty members. They argue that setting expectations for faculty interaction and using faculty members
as advisors would improve student satisfaction and probably retention. In 2016, the survey found that for
students, the opportunity to meet with classmates and instructors on campus was an attractive
programmatic feature of online programs.103
The key finding of the 2017 survey was that students want to be part of a community, with 57 percent of
students citing the importance of being able to regularly engage with classmates and instructors during
online classes, 27 percent desiring more contact with the instructor, and 22 percent asking for more
facilitated engagement among students in the class. In addition, more than three out of four students (76
percent) find optional virtual office hours held by instructors attractive. Once again, the authors
recommend a renewed focus on increased interactivity in online settings: “Set expectations and provide
training for faculty members who teach online courses to encourage and lead class discussions, as well as
engage with students outside of class time, whether via office hours, email, or other means.”
22
In summary, the surveys find that prospective and actual online students clearly demand a more
interactive educational experience, which includes regular and direct contact and communication with
instructors, easy access to instructors, real-time class sessions, and other synchronous interactions such as
virtual office hours and meetings, instructor-led learning, and a sense of community through engagement
with peers and instructors. In other words, for online education to reach its potential, a renewed focus on
and commitment to regular and substantive student-interactions is essential for student satisfaction,
achievement, and success. It is reasonable to believe that many of the problems with online learning—
particularly for at-risk students—would be mitigated if these courses and programs consistently
incorporated the personal interaction that is central to the learning process.
Return on Investment
Public policy should be based on reliable information about the value of investing in different types of
postsecondary education both for individual students and for society as a whole. Much of the motivation
for making education available to a wide range of students is that it opens doors to more rewarding lives
and to higher earnings for individuals and also increases the productivity of the nation’s labor force.
All other things equal, producing education using fewer resources will increase the rate of return to the
investment. But if the quality of the education suffers, this will not necessarily be the case. Even if we can
produce online education more cheaply than classroom education, if the savings are not passed onto the
students and if there are higher failure rates, less learning, and weaker labor market outcomes, it could
mean a long-run loss.
It is never easy to measure the value of education produced, but interesting insights come from a study by
Caroline Hoxby (2018) based on integrated data from the Internal Revenue Service and the Department of
Education. Hoxby examined earnings outcomes for all students who engaged in postsecondary education
that was wholly or substantially online between 1999 and 2014.104
Like other forms of postsecondary education, fully online learning does appear to increase the rate of
growth of income, but not enough to make up for the cost of the education or even, in most cases, the cost
to the individual student. The 10-year returns to fully online enrollment do not cover the direct costs to
society. The same is true for students enrolled substantially, but not entirely, online. In particular, students
who persist for short periods of time see very low returns—making the evidence of reduced persistence
rates for fully online students even more of a problem.
Hoxby concludes that the vast majority of online postsecondary enrollment generates earnings benefits
that never cover social costs and probably do not even cover students' private costs. Moreover, her data do
not support the idea that online education shifts people into higher productivity industries such as more
technical fields.
Some of these results may be related to the concentration of online study in for-profit institutions. In
2015-16, when 8 percent of undergraduates at degree-granting institutions were enrolled in the for-profit
sector, 30 percent of those studying exclusively online were enrolled in this sector.105 This enrollment
pattern might raise questions about how overall performance in online learning relates to institutional
type. However, most of the studies showing poor academic outcomes, particularly for vulnerable students,
compare students experiencing different modes of learning within individual institutions. As noted, the
concerning findings are consistent across sectors.
23
Reducing Costs
Theoretically, teaching more students with fewer instructors can make a big dent in the cost of providing
higher education. Rather than paying three professors on campus to lecture in halls seating 100 students, a
university can pay one professor to give one lecture reaching an infinite number of students at the same
time. Beyond the lecture approach, students can access pre-packaged on-line courses with exercises that
allow them to progress at their own pace, relieving faculty members of repeated interactions with
individuals and small groups. Also theoretically, those savings can then be passed on to students in the
form of reduced tuition.
The Hoxby study cited above found that exclusively online schools spend less than others on instruction,
but do not have significantly lower overall costs, possibly because of the expense of curriculum
development, administrative services, legal and fiscal operations, and other activities. It also found that
online colleges charged students more than classroom-based colleges with similar offerings.
Hoxby’s findings raise two important questions: whether online courses are really likely to reduce the
resources required to produce education and whether any savings will lead to more affordable education,
one of the main goals of proponents of the expansion of online education. The focus is usually on reduced
labor and facilities costs. But it is possible that additional non-instructional staffing time required will at
least partially compensate for savings in this area—not to speak of the technology costs for both
institutions and students. Moreover, the importance of integrating personal interaction into online courses
may limit the feasible reduction in instructional costs.
Another issue is that the vision of low marginal costs for online courses usually assumes that courses can
be developed once and ongoing costs will be low. There are, however, several reasons to question this
vision. Bringing new faculty into the process will continue to be time-consuming and resource-
demanding and many faculty face steeper learning curves than for classroom instruction. In a survey of
faculty asking how much time it took to plan and develop online courses relative to a comparable face-to-
face course, 100 percent of respondents answered about the same time or greater, including 80 percent
who answered more time or much more time.106
Online courses cannot just be created and left alone any more than lecture notes can. In most fields, new
developments and new insights arise frequently. Moreover, as technology evolves, the forms of online
learning will change. One advantage of technology is the possibility of collecting data about what works
best for students and using those data will inevitably lead to course revisions. All of this requires both
faculty time and support from others, including assessment experts, course designers, and technical
experts. Western Governors University spends between 25 and 35 cents in each of the subsequent three
years for every dollar invested to launch an online course.107 After reviewing the relevant evidence,
McPherson and Bacow (2015) concluded that high-quality online courses are expensive to deliver—at
least as expensive, if not more, to develop and staff than traditional face-to-face courses.108 In contrast, a
recent case study report estimated cost savings between 3 and 50 percent of average credit hour costs in
four of the six institutions examined in depth.109
Marketing is arguably a major cost driver and tuition inflator for online education, which may a go a long
way in shedding light on the cost question. According to John Katzman, founder and CEO of major
education companies (The Princeton Review, 2U, and Noodle): “Tech, spread out, becomes less
expensive. But recruiting the 300th student is more expensive than the 299th and every added student is
more expensive. And the two work against one another.”110
A critical issue is how online education has affected costs to students. A 2017 survey of about 200 online
education colleges by WICHE Cooperative for Educational Technologies found that more than half (54
24
percent) charged their online students more in tuition and fees than on-campus students and that nine out
of 21 cost components were higher for online education, while the rest were the same, thus challenging
the “mythology, unrealistic expectations, and unfulfilled promise regarding the economics of distance
education courses.”111 These findings were consistent with earlier surveys.112
A 2016 report by major investment advisor firm BMO reached a similar conclusion: “While conventional
wisdom holds that an online degree may cost less than one obtained at a bricks and mortar school, that
may not necessarily be the case…the average per credit, in-state cost for an online bachelor's program
was $277, compared with $243 per credit at brick-and-mortar schools.”113 Similarly, a 2017 survey of 182
chief online officers found that although a 2.5-to-1 majority views online programs as “revenue
generators” rather than as “a drain on resources” (45 vs. 18 percent), three out of four (74 percent) charge
the same tuition as the on-campus rate and 23 percent of programs charge their online students more.114
Interestingly, large online programs with more than 7,500 fully and partly online students, are the most
likely (59 percent) to call online programs revenue generators and are almost four times as likely to
charge higher tuition for these courses (57 percent vs. 15 percent). Among the top reasons cited for
charging online students more were online instruction and support services, online course and program
development, online program marketing costs, pricing headroom for high-demand programs, and meeting
revenue goals.
Overall, the available evidence undermines the argument that online education has significant potential to
reduce costs for students. Whether due to the high technological and instructional costs required to
provide and maintain a quality educational experience, the need for large marketing budgets, or simply
because savings are turned into profits or used to subsidize other programs, online education has yet to
bend the cost curve in higher education and offer an affordable option.
Online Education and Federal Policy: The Regular and Substantive Interaction Requirement
The law provides access to federal student aid for two types of programs that involve students being
separated from instructors: correspondence and online education. From 1992 through 2006, both types
were treated equally for purposes of federal student aid, with significant restrictions placed on them
compared with traditional face-to-face programs. In 2006, Congress changed course and began to treat
online programs similarly to traditional programs, thus providing unrestricted access to student aid.
However, in doing so, the law specifically required online education to provide “regular and substantive
interaction” (RSI) between students and instructors, unlike correspondence programs. The history behind
the RSI requirement is critical for understanding the current debate about its significance and whether it
should be revised.
In “direct response to the costly fraud, waste and abuse that resulted from the participation”115 of
correspondence programs in federal student aid, in 1992 Congress implemented the “50 percent rule,”
prohibiting higher education institutions from offering more than 50 percent of their programs through, or
enrolling more than 50 percent of their students in, correspondence or telecommunications (online)
programs.”116 In addition, Congress placed significant restrictions on correspondence education in regards
to student aid access and amounts. 117
After intense lobbying from online education providers and for-profit colleges,118 in 1998 Congress
created the Distance Education Demonstration Program, which provided waivers from the 50 percent rule
to about 30 institutions, primarily for-profits such as the University of Phoenix, but also including the
newly established Western Governors University (WGU) and University of Maryland University College,
both among the largest online universities in the nation today. As the program was set to expire, and
following another lobbying blitz,119 in 2006 Congress exempted all online programs from the 50 percent

25
rule in a deficit-reduction bill, thus providing them full access to federal student aid, but preserved the
rule for correspondence programs.120 In the next four years, online enrollments more than doubled.121
However, the 2006 change created a potential problem: there was no way to clearly distinguish between
the correspondence and online delivery modes. For example, a correspondence course could use
technology so that a correspondence course using “minor e-mail contact between students and a grader or
instructional assistant (who may or may not have subject matter expertise)” could gain full access to
federal student aid, and circumvent the 50 percent rule.122 Therefore, recognizing that “Quality standards
for electronically-delivered education emphasize the importance of interaction between the instructor and
student,” the Department’s final regulations implementing the 2006 change added the RSI requirement to
clearly distinguish online from correspondence education.123
In the 2008 reauthorization of the Higher Education Act, Congress codified into law this key distinction:
in order for a program to be classified as “distance education” (online) it must use technology “to support
regular and substantive interaction between the students and the instructor, synchronously or
asynchronously.”124 In other words, to be eligible for full access to federal student aid and avoid the 50
percent rule, online programs must provide RSI, rather than simply self-learning, which correspondence
courses offer. Absent RSI, a program would be classified as a correspondence program, subject to student
aid limitations and the 50 percent rule. Accordingly, federal regulations specify that in correspondence
education “interaction between the instructor and student is limited, is not regular and substantive, and is
primarily initiated by the student” and courses are typically “self-paced,” while distance education uses
technology “to deliver instruction to students who are separated from the instructor and to support regular
and substantive interaction between the students and the instructor, either synchronously or
asynchronously.”125
In 2014, the Department further clarified through non-regulatory guidance that student-faculty interaction
cannot be “wholly optional or initiated primarily by the student” or occur solely “upon the request of the
student.”126 Moreover, given the lack of a statutory or regulatory definition of instructor or faculty, the
Department clarified that students must interact with “institutional staff who meet accrediting agency
standards for providing instruction in the subject matter being discussed.” Otherwise, an IHE could
conceivably label any individual, regardless of their qualifications, as “faculty” for the purposes of
meeting this requirement. Given that accrediting agencies are responsible for academic quality assurance
in federal student aid programs, they are also responsible for determining or approving instructor
qualifications. To summarize, according to the RSI requirement, in online education:
Interaction between students and instructors occurs regularly as a required part of the program.
o Interaction that is wholly optional, initiated primarily by the student, or occurring only
upon the request of the student (either electronically or otherwise) is insufficient.
Interaction must be provided by institutional staff who meet accrediting agency standards for
providing instruction in the subject matter being discussed.
o Interactions between students and personnel who don’t meet accrediting agency standards
for providing instruction in the subject area are not substantive.
o The amount of faculty resources dedicated to the program must be sufficient in the
judgment of the accrediting agency.
Educational models that involve different instructors performing different roles127 may be used to
ensure regular and substantive interaction between students and instructors, but an institution
must still comply with the above requirements.
Overall, federal law, regulations and guidance make it clear that RSI is a key distinction that separates
online education from correspondence programs, which are subject to limitations to student aid and the
long-standing “50 percent” institutional eligibility rule.

26
Emergence of Online Competency-Based Education and Calls for Change
As evidenced by the explosive growth of online education, RSI has not hindered the expansion of
distance education programs. However, recent developments in higher education, particularly the
emergence of competency-based education (CBE) have fueled calls for revising RSI.
Despite its 50-year history in higher education,128 there is no consensus definition of CBE,129 not even
among CBE institutions,130 nor is the term defined in federal law or regulations.131 There also is no
uniform CBE model or approach.132 A major Department of Education study of the field in 2002 defined
“competency” as “a combination of skills, abilities, and knowledge needed to perform a specific task” and
described CBE as “defining, teaching, and assessing competencies.”133 In 2015, the Council of Regional
Accrediting Commissions (C-RAC), comprised of the seven regional accrediting agencies, issued a
common CBE framework that included the following definition:134
In general, competency-based education (CBE) is an outcomes-based approach to
earning a college degree or other credential. Competencies are statements of what
students can do as a result of their learning at an institution of higher education. While
competencies can include knowledge or understanding, they primarily emphasize what
students can do with their knowledge. Students progress through degree or credential
programs by demonstrating competencies specified at the course and/or program level.
The curriculum is structured around these specified competencies, and satisfactory
academic progress is expressed as the attainment or mastery of the identified
competencies. Because competencies are often anchored to external expectations, such as
those of employers, to pass a competency students must generally perform at a level
considered to be very good or excellent.
In recent years, CBE programs have experienced significant growth and attracted considerable attention
in the higher education and policymaking communities, in large part due to their potential to provide a
more accessible and affordable route to postsecondary education for non-traditional students, such as
older and working adults, and to improve student outcomes. In 2014, a total of 52 colleges either offered
(34 colleges) or had announced plans to launch (18 colleges) CBE programs. All colleges with active
CBE programs offered Prior Learning Assessments (PLA) that grant credits to students for knowledge
and skills previously mastered through experiential learning (professional, military or life experience).135
In 2014, a group of colleges offering CBE programs was formed, which today includes 30 colleges and
universities and four public systems with 82 campuses.136 By 2015, 600 colleges were either offering,
actively creating, or designing CBE programs, reflecting remarkable growth.137
The RSI requirement has major implications for CBE for three reasons: First, while CBE can be offered
either online, on campus, or both, the vast majority of programs are online, including those offered by the
largest and most well-known providers. Second, as a self-paced educational model, similar to
correspondence education, CBE often involves instructors performing different roles as “no single faculty
member is responsible for all aspects of a course or competency,” which is often described as the
“unbundling” of faculty roles.138
Finally, recent compliance findings involving online, mostly CBE, programs have fueled speculation
about RSI having a chilling effect on its growth,139 despite no such evidence to support such concerns.140
The Department of Education’s Office of Inspector General (OIG) has identified several RSI violations:
In 2012, the OIG found that Saint Mary-of-the-Woods College, a small private liberal arts college
in Indiana, had violated the 50 percent rule because its online courses did not provide RSI and
thus should have not received more than $42 million in federal funds between 2005 and 2010.141
27
In 2014, the OIG raised flags about approvals of CBE programs. Citing lack of RSI, the OIG said
such programs “are really correspondence programs.”142 For example, in reviewing one of the
approved school’s applications, the OIG found no evidence of either regular or substantive
interaction, neither was interaction with faculty, as required by law, described. Instead, “coaches”
replaced faculty.143 The Department relied on the accrediting agency’s approval of the program,
but the OIG’s review of the accreditor’s standards for faculty found that “the accrediting agency’s
definition of faculty and the definition of a coach in the school’s application did not match.” In
response, the Department issued the 2014 guidance mentioned earlier.
In 2015, the OIG released a final audit of the Higher Learning Commission (HLC), a regional
accrediting agency, related to its reviews of CBE programs that found significant problems with
how it applied its standards in determining the delivery methods and measurements of student
learning, including whether CBE programs provided RSI. HLC approved applications for “self-
paced programs” that “did not clearly indicate that the programs would include regular and
substantive interaction between students and school employees who met” its definition of
faculty.144
In 2016, the OIG released an audit of another regional accreditor, the Western Association of
Schools and Colleges (WASC) and found similar problems, concluding that its “control activities
did not provide reasonable assurance that schools properly classified the methods of delivery for
competency-based education programs,” including that WASC failed to evaluate whether they
were designed to ensure “faculty-initiated, regular, and substantive interaction between faculty
and students.”145
In response to the 2015 and 2016 audits, C-RAC urged accreditors to consider compliance with RSI when
evaluating CBE programs.146
However, the most high-profile OIG audit was released in 2017. After several years of trying to determine
whether WGU, the nation’s largest and most well-established online CBE provider, complied with
various aspects of federal law and regulations, the OIG concluded that about two-thirds of the 102 online
courses required for its three largest programs did not meet “the key” RSI requirement.147 The OIG
applied the following RSI test:
Interaction that was not primarily initiated by the student
Interaction with someone who instructs or provides knowledge about the subject matter of the
course (instructor)
Interaction relevant to the subject matter (substantive), and
Interaction occurring with some reasonable frequency considering the school-suggested length of
the course (regular)
Specifically, 32 course materials described no substantive interaction with an instructor, 27 courses
described a single substantive interaction, while 10 courses described two substantive interactions. In
other words, more than 6 out of 10 WGU students were enrolled in one or more of 69 courses that met the
definition of a correspondence, not distance education, course, thus causing WGU to violate the 50
percent rule. As a result, the audit recommended the return of $713 million in federal student aid for the
two-year period examined, plus funds received thereafter.
Of particular importance, the audit report concentrated on the issue of who qualifies as an instructor in an
unbundled faculty model, such as that employed by WGU and many other online CBE providers. The
28
OIG determined that out of the five groups of faculty (student mentors, course mentors, evaluators,
product managers, and council members) only student interaction with course mentors, who provided
instruction, and evaluators, who provided detailed course content feedback, qualified for the RSI
requirement, as the rest of the faculty were non-teaching faculty. Moreover, the audit found interaction
with course mentors was on an “as-needed basis and typically initiated by the student.”
The audit report also described some interactions that do not meet the RSI requirement, including
computer-generated assessment feedback; recorded webinars, videos, and reading materials; and contact
with non-instructional faculty. In contrast, the OIG provided examples of substantive interactions, such as
requiring the student to contact an instructor or participate in an online discussion board moderated by an
instructor, or an instructor providing feedback to students on their performance tasks. Overall, the audit
arguably sets a low bar for meeting the RSI requirement, both in terms of frequency and type of
interactions.
Recent Policy Developments
Following the OIG audits, and especially after the release of WGU audit report, online and CBE
education proponents have called for eliminating or revising RSI, arguing that it acts as a barrier to
innovation148 by applying “an obsolete, 20th-century definition to a 21st-century” educational model149
and “has to go.”150
In both Congress and the Department of Education, RSI is now under threat. The Department of
Education not only took no action on its OIG audit recommendations; it also announced a new regulatory
effort that will reexamine RSI.151 The Republican proposal in the House to reauthorize the Higher
Education Act would also gut both requirements by:
Repealing the definition of and, by extent, the RSI requirement for, online education;
Further weakening the definition of correspondence education; and,
Adding a new CBE definition that has a severely weakened, and largely unenforceable,
requirement for “substantive instructional interaction, including by faculty, and regular support
by the institution.”
While the repeal of RSI requires statutory change, the upcoming negotiated rulemaking provides an
opportunity to either strengthen or weaken it. One route that may be explored will be to adopt the
approach embedded in a Department of Education CBE experiment that was announced in 2014 to learn,
among other research questions, “how institutions ensure regular and substantive interaction between
students and instructors,” in which 30 institutions currently participate.152 The guidance restated the 2014
policy, but also provided additional flexibility, which is a core feature of such experiments. Specifically,
it specified a two-part RSI test, one concerning access to faculty and one regarding program design:153
Access to qualified faculty: “must be available to students who are struggling…or for any reason
when the student wants to interact with a faculty member.” Moreover, “Learning coaches, online
tutoring, and other support can be offered and used and may even count for the majority of
students’ support (and success),” with faculty access required “at least when students need or
want it.” The letter then notes that when “a faculty member is not the primary monitor of student
engagement with learning (as in traditional instructional models), the institution must have some
combination of staffing and systems to monitor student engagement, level of performance, and to
provide proactive support.”

29
Program design: The letter defined “regular interaction” as “periodic contact” that “can be event
driven,” including “through the use of email or other social media,” but “should be understood as
predictable regularity and built into program design” and “must create the opportunity for
substantive interaction.” The letter clarifies that “while an automated system for initiating contact
with students could be one aspect of program design, such a system in and of itself could not
meet the requirement for regular and substantive interaction.” However, the letter then states that
“contacts with students that create the opportunity for relevant discussion of academic subject
matter could qualify as substantive interaction.” Moreover, while acknowledging that assessment
“takes on particular importance in outcomes-focused programs like CBE,” the letter “does not
require that faculty administer and/or grade all assignments, though faculty feedback on student
assignments may be a very effective form of substantive interaction.”
The Watchdog Is Barking, but Who Is Listening?
In the past 15 years, the OIG has repeatedly warned the Department and Congress about the “the unique
risks inherent in the distance education environment” and several audits, investigations and special
projects have identified numerous instances of fraud and widespread vulnerabilities, including problems
with verifying student identity, determining attendance, and determining cost of attendance.154
Specifically, the OIG has concluded that, as “the fastest growing segment of higher education,” distance
education “creates unique oversight challenges and increases the risk of school noncompliance with the
law and regulations,” and has called on the Department, accrediting agencies, and states to adequately
monitor schools for compliance. In recent years, each OIG annual management challenges report to the
Secretary of Education and each semi-annual report to Congress highlights distance education as an area
that poses significant risks to the integrity of federal student aid programs. Moreover, its 2015 audit found
major weaknesses in the Department’s oversight of online education
In March 2018, the OIG submitted to Congress detailed comments and recommendations for needed
changes in the upcoming reauthorization of the Higher Education Act.155 Unsurprisingly, several of its
recommendations were focused on online education, and the OIG raises serious concerns about the
elimination of RSI, as well as the definition of “distance education,” in the House PROSPER Act. In
particular, the OIG argues that their elimination, coupled with the amended definition of correspondence
education that includes “interaction between the institution and the student is limited and the academic
instruction by the faulty is not regular and substantive,” will render meaningless the RSI requirement and
thus allow programs without any substantive interaction between subject-matter experts and students to
have full access to financial aid:
A significant difference from the former definition of distance education is that
“instructor” is replaced with “faculty.” Faculty could include mentors or counselors that
lack subject matter expertise in the courses a student is taking. Removing the definition of
distance education and replacing “instructor” with “faculty” in correspondence
education would allow a school to qualify for full participation in the Federal student aid
programs based on e-mail contact between students and faculty on matters unrelated to
the subject matter of a program. There will be no assurance that programs provide the
level of interaction Congress previously expected with instructors for full funding of
distance education. Distance education funding would only be restricted in the unlikely
event the programs qualify as correspondence education.
The OIG then urges lawmakers to retain the clear distinction between correspondence and distance
education by leaving intact the current definition of distance education, including the RSI requirement

30
between instructors and students, and calls for improved oversight by the Department, accrediting
agencies, and the States.
An Evidence-Based and Responsible Path Forward
In many ways, these efforts to loosen the requirements resemble the 2006 change Congress made to
exempt distance education from the 50 percent rule, despite warnings by GAO and others about the risks
involved,156 thus opening the floodgates of federal student aid to fully-online schools.157 Interestingly,
WGU was at the center of those efforts as well. As in 2016, the narrative is the same: federal law and
regulations are standing in the way of innovation, which could expand access and reduce costs for
students.158 As documented, the greatest beneficiaries of the 2006 change were for-profit colleges,159
which enroll almost one-third of all fully-online students, but less than ten percent of all students, and
distance education has not reduced costs for students.160 Before we go down this path of “deregulation for
innovation” again, it’s important to heed the lessons of history and avoid the same consequences, both
intended and unintended.
Our review of the evidence clearly demonstrates that, on average:
Online education is the fastest-growing segment of higher education and its growth is
overrepresented in the for-profit sector.
A wide range of audiences and stakeholders—including faculty and academic leaders, employers
and the general public—are skeptical about the quality and value of online education, which they
view as inferior to face-to-face education.
Students in online education, and in particular underprepared and disadvantaged students,
underperform and experience poor outcomes. Gaps in educational attainment across
socioeconomic groups are even larger in online than in traditional coursework.
Online education has failed to improve affordability, frequently costs more, and does not produce
a positive return on investment.
Regular and substantive student-instructor interactivity is a key determinant of quality in online
education; it leads to improved student satisfaction, learning, and outcomes.
Online students desire greater student-instructor interaction and the online education community
is also calling for a stronger focus on such interactivity to address a widely recognized
shortcoming of current online offerings.
The implications of the above for federal policy are significant. First, do no harm. Weakening RSI would
not only be inconsistent with the evidence that clearly demonstrates the key role of faculty-student
interaction in ensuring a quality online education, but would also further erode employer, student,
educator, and public confidence in and perceptions of its comparative value.
For example, adopting in federal law the flexibility provided in the ED experiment, as some recent
proposals advocate, would severely undermine the substance and intent of the RSI requirement:
By requiring “access to qualified faculty,” only for students “who need or want it,” this new
approach would allow students who are not struggling or do not initiate interaction to progress
through a program without such access, as is the case in correspondence courses, in which
interaction is “limited” and “primarily initiated by the student.”
By allowing institutions to “have some combination of staffing and systems to monitor student
engagement, level of performance, and to provide proactive support,” when a “faculty member is
not the primary monitor of student engagement with learning,” as is typical in CBE and other
31
unbundled programs, this approach would allow an institution to use a combination of 99 percent
technology and/or non-qualified staff and 1 percent qualified faculty to perform these key
instructional duties.
By interpreting “regular” interaction as “periodic contact” through email and social media and
“event driven” ( “completion of certain key competencies, a percentage of competencies, or the
submission of assessments”), this approach would allow occasional online chat rooms or virtual
office hours that “create the opportunity for substantive interaction” to meet the requirement.
By defining “substantive” as “interaction, or the opportunity for interaction, with a student that is
relevant to the academic subject matter in which the student is engaged,” this flexibility would
conceivably allow a student who does not take advantage of an interaction “opportunity” to
progress through a program without engaging substantively with faculty.
Finally, assessment is at the heart of CBE. While acknowledging that “assessment takes on
particular importance in outcomes-focused programs like CBE” and “faculty feedback on student
assignments may be a very effective form of substantive interaction,” this new approach would
allow non-faculty to “administer and/or grade all assignments.” Once again, by exempting
qualified faculty from this core component of the CBE educational experience, this approach
would further render the RSI requirement meaningless.
The flexibility provided by ED in the experiment should be rigorously evaluated prior to considering
embedding it in law or regulations. The purpose of such experiments is to inform potential policy changes
through the study of research questions. Adopting such a dramatic change without first studying its
impact on a small scale infuses unnecessary risk into our federal student aid programs with potentially
wide-ranging implications. Furthermore, deferring to accrediting agencies to define “instructor” and
“faculty” is unavoidable, at least under the current triad system in which accrediting agencies are the
authorities tasked with quality assurance. This was reaffirmed in the flexibility ED provided, which
required accreditors to determine which faculty have “the appropriate academic credentials and
experience in the applicable knowledge domain.” Finally, we must avoid any possibility of a student
progressing through an online program, whether CBE or not, without ever interacting with faculty.
Reforms that simply require “the opportunity for interaction” should be off the table, as they would set a
bar even lower than correspondence education.
A responsible path forward would reflect the evidence reviewed in this paper. RSI should be preserved, if
not strengthened, and vigorously enforced. Unbundled faculty models that have difficulty complying
should make changes to match the law instead of changing the law to match the needs of such models.
Interaction must be with subject-matter experts, not just anyone labeled “faculty” by an institution. It is in
the best interest of online providers to pursue the strategies recommended by the industry to increase
interaction and thus improve their quality, student outcomes and satisfaction, and employer confidence in
the value of their credentials. Not only is RSI a student and taxpayer safeguard, it is also an essential
element of a successful and sustainable business model.
Online education’s failure to yield cost savings for students and taxpayers, as well as the high
concentration of online students in the for-profit college sector, which has a well-established and long
record of predatory behavior and compliance troubles, should raise oversight concerns for policymakers
and the Department of Education. The incentives for a quick profit through lower production costs and
high tuition prices, subsidized by the federal government through aid, combined with an environment of
deregulation, further amplifies the repeated and urgent warnings of the OIG about the significant risks in
online education, which call for stronger monitoring and enforcement in this area of higher education.
Finally, it is imperative to keep in mind that RSI applies to all online programs, not just CBE programs.
While the impetus for additional “flexibility” is largely driven by the rapid growth of CBE programs and
the recent WGU audit, the key distinction should be maintained between correspondence and online
32
education, regardless of the educational model employed, whether CBE or some other alternative. Online
education, including CBE, has thrived while complying with the RSI requirement, so rather than changing
the law or regulations to accommodate particular online education models, which already face criticism
about their quality, Congress and regulators should instead focus on the evidence, which is clear: student-
instructor interaction is a key component of quality and strong student outcomes.
Conclusion
Continuing efforts to strengthen educational opportunities and learning outcomes for under-prepared
students and to reduce the cost of offering high-quality experiences are critical. But the evidence is clear
that much of the existing online coursework is moving this effort in the wrong direction. Students need
access to education, which involves meaningful interaction with faculty and other students—not just
exposure to materials that move them through a collection of information and exercises.
The greatest risk is that the rush to transform higher education will widen the gulf between the college
education available to those who arrive at the door with ample resources and strong academic preparation
and those who depend on postsecondary education to open the doors to productive lives. Creating access
to programs is a step forward, but only if those programs succeed in providing meaningful educational
opportunities to students with minimal levels of academic preparation who need to develop their self-
discipline, time management, and learning skills—not just have access to a specific body of information.
The intuition behind the idea that online learning has the potential to increase educational opportunities
and reduce costs for students with limited time, geographical mobility, and money is clear. But the
evidence reviewed in this paper raises significant questions about whether the promise of online education
has been realized to date. The type and quality of online learning accessible to students—especially those
with limited academic preparation and limited resources—is critical. Mounting evidence suggests that
although the outcomes of hybrid learning environments that mix online and classroom experiences are
similar to those of traditional classrooms, the same is not generally true of purely online courses,
particularly for at-risk students attending at-risk institutions.161
Undoubtedly technology will continue to progress and strategies for improving learning in classroom,
hybrid, and online settings will surely emerge. It is likely to become more feasible, for example, to
provide optimal course pacing and content to fit each student’s needs. The latest “intelligent” tutoring
systems not only assess students’ current weaknesses, but also diagnose why students make their specific
errors, adjusting instructional materials to meet their needs.162 But these innovations are likely to be most
effective as supplements to—not replacements for—meaningful educator-student interaction.
The negative findings about outcomes in online learning come from fully online courses. Hybrid courses
do not create the same burdens for students. Taking an asynchronous class without an engaged instructor
requires high levels of self-motivation, self-regulation and organization.163 Hybrid courses that integrate
technology into face-to-face classrooms generally yield similar or improved outcomes relative to standard
classrooms.164
Both the aggregate data on online learning and most studies of its effectiveness at individual institutions
focus primarily on for-profit or broad-access public institutions. But selective universities and liberal arts
colleges are also incorporating technology into their curricula. In many cases, these institutions are using
technology to enhance, rather than replace, traditional classroom experiences. Some of the better news
about online programs comes from efforts targeting students who have already proved their ability to
succeed in advanced academic work. Georgia Tech’s widely cited computer science master’s degree
program is getting very positive reviews and appears to be opening opportunities to new students, rather
33
than diverting them from face-to-face programs.165 Since this is a graduate program, all of the students
have already earned bachelor’s degrees, and in the case of Georgia Tech, passed rigorous admission
standards. Evidence about success in MOOCs confirms the reality that students from higher-income,
more educated backgrounds are most likely to participate and succeed in these courses.166
Some students, particularly older students with work and family responsibilities and those in rural areas
may be choosing between purely online education or no postsecondary education at all. But there is a real
risk that both cost-cutting efforts and well-intentioned moves to expand access to higher education could
lead to greater numbers of disadvantaged students being relegated to cheap and ineffective online
instruction, with detrimental results, both in terms of outcomes and student loan defaults. The findings
discussed in this paper should act as a cautionary note for efforts like California’s new wholly online
community college, which will be designed for adults seeking new labor market opportunities and will
offer only certificates and short-term credentials. It will take careful and innovative planning and design if
there is to be a reasonable prospect of delivering meaningful college-level work—as opposed to just the
transmission of information—through this route,
As McPherson and Bacow (2015) argue:167
If technology is used in broad access institutions to drive cost down without regard to
quality, and at the same time is used in elite higher education to further increase the cost
and restrict the availability of the “best” education, we will wind up with a society both
more unequal and less-productive than it could be.
In 2011, the year Sebastian Thrun began the MOOC revolution with his course on Artificial Intelligence,
Clayton Christensen predicted in The Innovative University that half of all colleges and universities would
go bankrupt within 10–15 years as alternative providers replaced them. Technology would enable an
entirely new business model to take hold. Writing with Michael Horn in 2013, Christensen explained that
students would soon gravitate toward less expensive options. “Unbundling” of higher education would
allow students to customize their own educational experiences. Students could still access face-to-face
interaction when they need it, but that would no longer be the norm.168 These predictions of a revolution
quite clearly exaggerated the near-term prospects for change. But that does not mean we should give up
on technology’s potential to enhance college learning opportunities. It does mean we should be cautious
about proponents of innovation who over-promise. We must carefully analyze the results of new
strategies that are implemented with the goal of broadening access and/or reducing costs without
compromising the quality of education. At a minimum, we must proceed with extreme caution when
revising the current statutory and regulatory environment governing online education to ensure that
students and taxpayers are protected from poor student outcomes that come at a very high cost.
Arguably everyone wants higher education to be more "innovative," to cut costs and improve quality for
students. Technological advancements and new models of education, like online CBE, offer the potential
to advance these shared goals. At the same time, when paying for an educational program, both students
and taxpayers expect that teaching is involved in the provision of educational services. The RSI
requirement is a key safeguard intended to ensure that online education does not become self-learning
with full access to federal aid.
34
REFERENCES
Abernathy, Pauline (2011, June 7). Testimony, Senate Committee on Health, Education, Labor, and
Pensions Hearing on “Drowning in Debt: Financial Outcomes of Students at For-Profit Colleges.
Washington, DC: The Institute for College Access & Success.
Adams, Jonathan (2016). “Teaching Certificates Earned Online and Hiring Practices of High School
Principals,” Journal of Educational Issues, 2, 73-90.
Adams, Jonathan, Sue Lee, and Juliann Cortese (2012). “The acceptability of online degrees: Principals
and hiring practices in secondary schools,” Contemporary Issues in Technology and Teacher Education,
12, 408-422.
Allen, I. Elaine and Jeff Seaman (2014). Grade Change: Tracking Online Education in the United States.
Babson Park, MA: Babson Survey Research Group and Quahog Research Group, LLC.
Allen, I. Elaine and Jeff Seaman (2015). Grade Level: Tracking Online Education in the United States.
Babson Park, MA: Babson Survey Research Group and Quahog Research Group, LLC.
Allen, I. Elaine, Jeff Seaman, Doug Lederman, and Scott Jaschik (2012). Conflicted: Faculty and Online
Education, 2012. Babson Park, MA: Inside Higher Ed, Babson Survey Research Group and Quahog
Research Group, LLC.
Allen, I. Elaine, Jeff Seaman, Russell Poulin, and Terri Taylor Straut (2016). Online Report Card:
Tracking Online Education in the United States. Babson Park, MA: Babson Survey Research Group and
Quahog Research Group, LLC.
Alpert, William, Kenneth Couch, and Oskar Harmon (2016). “A Randomized Assessment of Online
Learning.” American Economic Review: Papers and Proceedings 106(5), 378-382.
Arbaugh, J.B. (2001). “How instructor immediacy behaviors affect student satisfaction and learning in
Web-based courses.” Business Communication Quarterly, 64(4), 42-54.
Aslanian, Carol B. and David L. Clinefelter (2012). Online college students 2012: Comprehensive data
on demands and preferences. Louisville, KY: The Learning House, Inc.
Bailey, Allison, Nithya Vaduganathan, Tyce Henry, Renee Laverdiere, and Lou Pugliese (2018). Making
Digital Learning Work: Successful Strategies from Six Leading Universities and Community Colleges.
Boston, MA: The Boston Consulting Group and Arizona State University.
Banerjee, Abhijit V. and Esther Duflo (2014). “(Dis)organization and Success in an Economics MOOC.”
American Economic Review 104(5), 514–18.
Battalio, John (2007). “Interaction online: A reevaluation.” Quarterly Review of Distance Education,
8(4), 339–352; Doris U. Bolliger (2004). “Key factors for determining student satisfaction in online
courses.” International Journal on E-Learning, 3(1), 61–67.
Bawa, Papia (2016). “Retention in Online Courses: Exploring Issues and Solutions—A Literature
Review,” SAGE Open, 1-11.

35
Bernard, Robert M., Philip C. Abrami, Eugene Borokhovski, et al. (2009). “A meta-analysis of three
interaction treatments in distance education.” Review of Educational Research, 79(3), 1243-1289.
Bernard, Robert M., Philip C. Abrami, Yiping Lou, et al. (2004), “How does distance education compare
with classroom instruction? A meta-analysis of the empirical literature,” Review of Educational Research,
74, 379–439.
Bettinger, Eric P. and Susannah Loeb (2017). Promises and pitfalls of online education. Washington:
Brookings.
Boston Globe (2017, November 27), “Online learning can ease economic inequality,” Editorial
Boston Globe.
Bowen, William G., Matthew M. Chingos, Kelly A. Lack, and Thomas I. Nygren (2014). “Interactive
Learning Online at Public Universities: Evidence from a Six‐Campus Randomized Trial.” Journal of
Policy Analysis and Management 33(1), 94–111.
Carnevale, Dan (2007). “Employers Often Distrust Online Degrees,” Chronicle of Higher Education, 53,
A28.
Casement, William (2013). “Will Online Learning Lower the Price of College?” Journal of College
Admission.
Christensen, Clayton M. and Michael B. Horn (2013, November 1), “Innovation Imperative: Change
Everything Online Education as an Agent of Transformation, New York Times, Education Life.
Chronicle of Higher Education (2012). The Role of Higher Education in Career Development: Employer
Perceptions.
Clinefelter , David L. (2012). Best Practices in Online Faculty Development. Louisville, KY: The
Learning House, Inc.
Clinefelter, David L. and Carol B. Aslanian (2016). Online college students 2016: Comprehensive data
on demands and preferences. Louisville, KY: The Learning House, Inc.
Community College Research Center (2013). What we know about online course outcomes: Research
overview. New York: Teachers College, Columbia University.
Competency-Based Education Network (n.d.). “About C_BEN.”
Congressional Budget Office (2013). The Federal Pell Grant Program: Recent Growth and Policy
Options. Washington, DC: CBO;
Council of Regional Accrediting Commissions. (2015). Regional Accreditors Announce Common
Framework for Defining and Approving Competency-Based Education Programs. Washington, DC: C-
RAC.
Danzinger, Brian Lee (2007). Exploring Perceptions of Online Education by Human Resource
Professionals in Northeast Wisconsin. Doctoral Dissertation, Northcentral University.
36
Deming, David J., Claudia Goldin, and Lawrence F. Katz (2012). “The For-Profit Postsecondary School
Sector: Nimble Critters or Agile Predators?” Journal of Economic Perspectives, 26, 139-164.
Deming, David J., Claudia Goldin, Lawrence F. Katz, and Noam Yuchtman (2015). “Can Online
Learning Bend the Higher Education Cost Curve?” American Economic Review 105(5), 496–501.
Deming, David J., Noam Yuchtman, Amira Abulafi, Claudia Goldin, and Lawrence F. Katz (2016). “The
Value of Postsecondary Credentials in the Labor Market: An Experimental Study,” American Economic
Review, 106, 778-806.
Dennen, Vanessa P., A. Aubteen Darabi, and Linda J. (2007). “Instructor-learner interaction in online
courses: The relative perceived importance of particular instructor actions on performance and
satisfaction.” Distance Education, 28(1), 65-79.
Dixson, Marcia D. 2010). “Creating effective student engagement in online courses: What do students
find engaging?” Journal of the Scholarship of Teaching and Learning, 10, 1-13.
Dynarski, Eric (2018, January 19), “Online Courses Are Harming the Students Who Need the Most
Help.” New York Times.
.
Dynarski, Susan (2018, January). “Online courses are harming the students who need the most help. “The
New York Times.
Escueta, Maya, Vincent Quan, Andre Joshua Nickow, Philip Oreopoulos (2017), “Education Technology:
An Evidence-Based Review,” NBER Working Paper 23744.
Fain, Paul (2015, September 10). “Keeping Up With Competency,” Inside Higher Ed.
Fain, Paul (2016, January 15). “The Faculty Role Online, Scrutinized,” Inside Higher Ed.
Fain, Paul (2017, September 22). “Federal Audit Challenges Faculty Role at WGU,” Inside Higher Ed.
Figlio, David (2016), “A silver lining for online higher education?” Brookings: Evidence Speaks.
Figlio, David, Mark Rush, and Lu Yin (2013), “Is it Live or is it Internet? Experimental Estimates of the
Effects of Online Instruction on Student Learning,” Journal of Labor Economics 31(4), 763-784.
Flower, James C. and Holly Baltzer (2006). “Hiring Technical Education Faculty: Vacancies,
Criteria, and Attitudes toward Online Doctoral Degrees,” Journal of STEM Teacher Education, 43, 29-44.
Fogel, Calvin D. and Devonda Elliott (2013). “The Market Value of Online Degrees as a Credible
Credential,” Global Education Journal, 67.
Garrison, D. Randy and Doug Shale (1991) Education at a Distance, Malabar FL: Krieger Publishing.
Gladieux Lawrence and Watson Scott Swail (1999). The Virtual University & Educational Opportunity.
Issues of Equity and Access for the Next Generation. Policy Perspectives. Washington, DC: College
Board.
Goodman, Joshua, Julia Melkers, and Amanda Pallais (2016). “Can Online Delivery Increase Access to
Education?” National Bureau of Economic Research working paper 22754.

37
Graesser, Arthur C., Mark W. Conley, and Andrew Olney (2012). “Intelligent, tutoring systems,” in APA
Educational Psychology Handbook, Vol. 3: Application to Learning and Teaching, edited by Karen R.
Harris, Steve Graham, and Tim Urdan, Washington, DC: American Psychological Association.
Grossman, Amanda M., Leigh R. Johnson (2016). “Employer Perceptions of Online Accounting
Degrees,” Issues in Accounting Education, 31, 91-109.
Gunn, Cathy, Mae McSporran, Hamish Macleod and Sheila French (2003). “Dominant or different?
Gender issues in computer supported learning,” Journal of Asynchronous Learning Networks, 7(1).
Hartnett, Maggie (2016). Motivation in Online Education. Singapore: Springer.
Hermann, Astleitner and Richard Steinberg (2005). “Are There Gender Differences in Web-Based
Learning? An Integrated Model and Related Effect Sizes,” AACE Journal, 13(1), 47-63.
Hodge, Steven (2007). “The origins of competency-based training,” Australian Journal of Adult
Learning, 47(2).
Holden, Jolly T. and Philip J.L. Westfall (2006). An instructional media selection guide for distance
learning. Boston: United States Distance Learning Association.
Horn, Michael (2017, September 25). “Government Accountability Goes Unaccountable: Chilling WGU's
Innovation Engine.” Forbes.
Hoxby, Caroline (2018). “Online postsecondary education and labor productivity”. Education, Skills, and
Technical Change: Implications for Future US GDP Growth, Charles R. Hulten and Valerie A. Ramey,
editors Chicago: University of Chicago Press.
Huss, John A. (2007). “Attitudes of Middle Grades Principals toward Online Teacher Preparation
Programs in Middle Grades Education: Are Administrators Pushing “Delete”?” RMLE Online, 30, 1-13.
Jaggars, Shanna S. and Di Xu (2013). Predicting Online Student Outcomes From a Measure of Course
Quality (CCRC Working Paper No. 57). New York: Community College Research Center Teachers
College, Columbia University.
Jao, Jenna, Deanna Marcum, and Daniel Rossman (2018). CIC Consortium for Online Humanities
Instruction II: Evaluation Report for the Second Course Iteration, Ithaka S&R.
Johnson, Hans and Marisol Cuellar Mejia (2014). Online Learning and Student Outcomes in California’s
Community Colleges. Public Policy Institute of California.
Jones, Ida (2011). “Can You See Me Now? Defining Teaching Presence in the Online Classroom through
Building a Learning Community,” Journal of Legal Studies Education, 28, 67-116.
Joyner, Sheila A., Matthew B. Fuller, Peggy C. Holzweiss, Susan Henderson, and Robert Young (2014).
“The Importance of Student-Instructor Connections in Graduate Level Online Courses.” MERLOT
Journal of Online Learning and Teaching, 10.
Karl, Katherine and Joy Peluchette (2013). “Management Faculty Perceptions of Candidates with Online
Doctorates: Why the Stigma?” American Journal of Distance Education, 27, 89-99.
38
Kaupp, Ray (2012). “Online Penalty: The Impact of Online Instruction on the Latino-White Achievement
Gap,” Journal of Applied Research in the Community College, 19(2), 8-16.
Keefe, Thomas J. (2003). “Using technology to enhance a course: The importance of interaction.”
EDUCAUSE Quarterly, 1, 24–34.
Kehrwald, Benjamin (2008). “Understanding social presence in text-based online learning environments.”
Distance Education, 29, 89–106.
Kelchen, Robert (2015). The Landscape of Competency-Based Education: Enrollments, Demographics,
and Affordability. Washington, DC: American Enterprise Institute.
Keller, John M. (1987). “Development and use of the ARCS model of instructional design.” Journal of
Instructional Development, 11(4), 2–10.
Kinneer, James W. (2014). A Comparison of Health Care Recruiters' Attitudes toward RN-to-BSN
Degrees Based on Instructional Delivery Method and College For-Profit/Nonprofit Status. Doctoral
Dissertation, Indiana University of Pennsylvania
Kirkham, Chris (2011, December 6). “John Boehner Backed Deregulation Of Online Learning, Leading
To Explosive Growth At For-Profit Colleges,” Huffington Post.
Kreighbaum, Andrew (2018, July 30). “DeVos to Announce New Push for Deregulation, Innovation,”
Inside Higher Ed.
Kurzweil, Martin and Daniel Rossman (2018). Faculty Collaboration and Technology in the Liberal Arts.
Ithaka S&R.
Kyei-Blankson, Lydia, Esther Ntuli, and Heather Donnelly (2016). “Establishing the Importance of
Interaction and Presence to Student Learning in Online Environments,” World Journal of Educational
Research, 3.
Ladyshewsky, Richard K. (2013). “Instructor Presence in Online Courses and Student Satisfaction.”
International Journal for the Scholarship of Teaching and Learning, 7.
Lammers, William and J. Arthur Gillaspy (2013). “Brief Measure of Student-Instructor Rapport Predicts
Student Success in Online Courses.” International Journal for the Scholarship of Teaching and Learning,
7.
LeBlanc, Paul (2015, October 26). “Solving Yesterday's Problems Constrains Tomorrow's Solutions,”
Inside Higher Ed.
Lederman, Doug (2012, April 30). “Credit Hour (Still) Rules,” Inside Higher Ed.
Legal Information Institute (n.d.). 20 U.S Code1003.
Legal Information Institute (n.d.). 34 CFR 600.2
Legon, Ron and Richard Garrett (2018). The Changing Landscape of Online Education (CHLOE 2): A
Deeper Dive. Quality Matters & Eduventures Survey of Chief Online Officers.

39
Lieberman, Mark (2017, September 27). “Online Education on Notice,” Inside Higher Ed.
Lieberman, Mark (2018, July 18). “Keeping Online Courses Fresh: Valuable but Costly.” Inside Higher
Ed.
Linardopoulos, Nikolas (2012) “Employers’ perspectives of online education,” Campus-Wide Information
Systems, 2, 189-194.
McKenzie, Lindsay (2017, February 27). “Cost of Online Education May Be Higher Than We Think,
Study Suggests,” Chronicle of Higher Education.
McKeown, Karen D. (2012). Can Online Learning Reproduce the Full College Experience? Washington,
DC: Heritage Foundation.
McPherson, Michael and Lawrence Bacow (2015). “Online Higher Education: Beyond the Hype Cycle,”
Journal of Economic Perspectives, 29(4), 135-153.
Mirah J. Dow (2008). “Implications of social presence for online learning: A case study of MLS
students.” Journal of Education for Library and Information Science, 49(4), 238-239.
Mandelbaum, Renee M. (2014). “Acceptability of Online Degrees in Employer Hiring Practices,”
International Journal of Information and Communication Technology Education, 10.
McKenzie, Lindsay (2017) “Questions on Quality of Online Learning,” Inside Higher Ed.
Means, Barbara, Yukie Toyama, Robert Murphy, Marianne Bakia, and Karla Jones (2009), Evaluation of
evidence-based practices in online learning: A meta-analysis and review of online learning
studies, Washington, D.C.: U.S. Department of Education, Office of Planning, Evaluation, and Policy
Development.
Mendenhall, Robert (2012, November 5). “What Is Competency-Based Education?” Huffington Post.
Meyer, Katrina A (2002). “Quality in distance education: Focus on online learning”. In Adrianna J. Kezar
(Ed.), ASHE-ERIC Higher Education Report. San Francisco: Jossey-Bass.
Moore, Michael G. (1989). “Editorial: Three types of interaction.” The American Journal of Distance
Education, 3(2), 1-6
Mupinga, Davison M., Robert T. Nora, and Dorothy C. Yaw (2006). “The learning styles, expectations,
and needs of online students.” College Teaching, 54(1), 185-189.
National Center for Education Statistics (2002). Defining and Assessing Learning: Exploring
Competency-Based Initiatives. NCES 2002-159 Cooperative Working Group on Competency-Based
Initiatives. Washington, DC.
National Center for Education Statistics (2011). Students Attending For-Profit Postsecondary Institutions:
Demographics, Enrollment Characteristics, and 6-Year Outcomes. Washington, DC: U.S. Department of
Education.
National Center for Education Statistics (2012). Learning at a Distance: Undergraduate Enrollment in
Distance Education Courses and Degree Programs. Washington, DC: U.S. Department of Education.
40
National Center for Education Statistics (2015). Distance Education in Postsecondary Institutions.
Washington, DC: U.S. Department of Education.
National Center for Education Statistics (2016). National Postsecondary Student Aid Study (NPSAS)
2016.
National Center of Education Statistics (2017). A Profile of the Enrollment Patterns and Demographic
Characteristics of Undergraduates at For-Profit Institutions. Washington, DC: National Center of
Education Statistics.
National Center of Education Statistics (2018). Digest of Education Statistics 2017, Table 311:15.
Washington, DC: National Center of Education Statistics.
Newton, Derek (2018, June 28). “Why College Tuition is Actually Higher for Online Programs.” Forbes.
Nodine, T. R. (2016). “How did we get here? A brief history of competency- based higher education in
the United States,” Competency-based Education 2016.
Parry, Mark (2010). “Such a Deal? Maybe Not. Online learning can cost more than traditional education.”
Chronicle of Higher Education.
Porter, Stephens R. (2016) "Competency-Based Education and Federal Student Aid," Journal of Student
Financial Aid, 46(3).
Poulin, Russell and Terri T Straut (2017). WCET Distance Education Price and Cost Report. Boulder,
CO: WICHE Cooperative for Educational Technologies.
Price, Linda (2006). “Gender differences and similarities in online courses: Challenging stereotypical
views of women,” Journal of Computer Assisted Learning, 22(5), 349–359.
Public Agenda (2013). Not Yet Sold: What Employers and Community College Students Think About
Online Education. Brooklyn, NY: Public Agenda.
Saad, Lydia, Brandon Busteed, and Mitchell Ogisi (2013). In U.S., Online Education Rated Best for
Value and Options. Gallup.
Seaman, Julia E., I. Elaine Allen, and Jeff Seaman (2018). Grade Increase: Tracking Distance Education
in the United States. Babson Park, MA: Babson Survey Research Group.
Shea, Peter and Temi Bidjerano (2014). “Does online learning impede degree completion? A national
study of community college students.” Computers & Education, 75, 03–111.
Sher, Ali (2009). “Assessing the Relationship of Student-Instructor and Student-Student Interaction to
Student Learning and Satisfaction in Web-Based Online Learning Environment.” Journal of Interactive
Online Learning, 8(2), 102-120.
Shireman, Robert (2017). The For-Profit College Story: Scandal, Regulate, Forget, Repeat. Washington,
DC: The Century Foundation.
Silbera, Jeffery and Henry Sou Chien (2016). Education and Training. New York: BMO Capital Markets.
41
Snyder, Thomas D., Cristobal de Brey, and Sally A. Dillow (2018). Digest of Education Statistics 2016
(NCES 2017-094). Washington, DC: U.S. Department of Education.
Snyder, Thomas D. and Sally A. Dillow (2015). Digest of Education Statistics 2013 (NCES 2015-011).
National Center for Education Statistics, Institute of Education Sciences, U.S. Department of Education.
Washington, DC: National Center of Education Statistics.
Society for Human Resource Management (2010). Hiring Practices and Attitudes: Traditional vs. Online
Degree Credentials SHRM Poll. Alexandria, VA: SHRM.
Straumsheim, Carl (2016, April 15). “Equal Promises, Unequal Experiences.” Inside Higher Ed
Su, Bude, Curtis J Bonk, Richard J., Magjuka, Xiaojing Liu, and Seeung-hee Lee (2005). “The
importance of interaction in Web-based education: A program-level case study of online MBA courses.”
Journal of Interactive Online Learning, 4(1), 1–18.
Supiano, Beckie (2017, September 21). “What You Need to Know About the Inspector General’s Audit
of Western Governors U.,” Chronicle of Higher Education.
Swan, Karen (2002). “Building Learning Communities in Online Courses: the importance of interaction.”
Education, Communication & Information, 2(1), 23-49.
Tallent-Runnels, Mary K., Julie A. Thomas, William Y. Lan, et al. (2006), “Teaching courses online: A
review of the research,” Review of Educational Research, 76, 93–135.
Thach, Elizabeth C. and Karen L. Murphy (1995). “Competencies for distance education professionals.”
Educational Technology Research and Development, 43(1), 57–79.
Thompson, Leisa Dione (2009). Perceptions of employers toward hiring graduates with online degrees.
Doctoral Dissertation, University of Nevada, Las Vegas.
Thurmond, Veronica (2003). Examination of interaction variables as predictors of students' satisfaction
and willingness to enroll in future web-based courses while controlling for student characteristics.
Doctoral dissertation, University of Kansas.
U.S. Department of Education (2016). “Introduction to Competency-Based Education,” CBE Experiment
Guide.
U.S. Department of Education, Office of Federal Student Aid (2014). DCL ID: GEN-14-23. Subject:
Competency-Based Education Programs- Questions and Answers.
U.S. Department of Education, Office of Federal Student Aid (2016). 2016-2017 Introduction to FSA
Handbook Volume 2: School Eligibility and Operations.
U.S. Department of Education, Office of Federal Student Aid (2016). Competency-Based Education
Reference Guide.
U.S. Department of Education, Office of the Inspector General (2005). Reauthorization of 1998 Higher
Education Act.
U.S. Department of Education, Office of the Inspector General (2012). Saint Mary-of-the-Woods
College’s Administration of the Title IV Programs: Final Audit Report (ED-OIG/A05K0012).
42
U.S. Department of Education, Office of Federal Student Aid (2014). Invitation to Participate in the
Experimental Sites Initiative (FR Doc No: 2014-18075).
U.S. Department of Education, Office of the Inspector General (2014). Direct Assessment Programs:
Processes for Identifying Risks and Evaluating Applications for Title IV Eligibility Need Strengthening to
Better Mitigate Risks Posed to the Title IV Programs (ED-OIG/A05N0004).
U.S. Department of Education, Office of the Inspector General (2014). Title IV of the Higher Education
Act Programs: Additional Safeguards Are Needed to Help Mitigate the Risks That Are Unique to the
Distance Education Environment (ED-OIG/A07L0001).
U.S. Department of Education, Office of the Inspector General (2015). The Higher Learning Commission
Could Improve Its Evaluation of Competency-Based Education Programs to Help the Department Ensure
the Programs Are Properly Classified for Title IV Purposes (ED-OIG/A05O0010).
U.S. Department of Education, Office of the Inspector General (2016). The Western Association of
Schools and Colleges Senior College and University Commission Could Improve Its Evaluation of
Competency-Based Education Programs to Help the Department Ensure Programs Are Properly
Classified for Title IV Purposes (ED-OIG/A05P0013).
U.S. Department of Education, Office of the Inspector General (2017). Western Governors University
Was Not Eligible to Participate in the Title IV Programs: Final Audit Report (ED-OIG/A05M0009).
U.S. Department of Education, Office of the Inspector General (2018). U.S. Department of Education
Office of Inspector General Recommendations for the Reauthorization of the Higher Education Act.
U. S. District Court for the District of Columbia (2017). Brice Bradford et al. v. The George Washington
University. Case. 1:16-cv-00858-RBW Document 19.
U.S. Government Accountability Office (2002). Growth in Distance Education Programs and
Implications for Federal Education Policy (GAO-02-1125T). Washington, DC: GAO.
U.S. Government Accountability Office (2011). For-Profit Schools: Experiences of Undercover Students
Enrolled in Online Classes at Selected Colleges (GAO-12-150). Washington, DC: GAO.
U.S. Senate Committee on Health, Education, Labor and Pensions (2012). For Profit Higher Education:
The Failure to Safeguard the Federal Investment and Ensure Student Success. Washington, DC: U.S.
Congress.
Waddell, Kaveh (2016, September 26). “Virtual Classrooms Can Be as Unequal as Real Ones,” The
Atlantic.
Xu, Di and Shanna Jaggars (2014). “Performance Gaps between Online and Face-to-Face Courses:
Differences across Types of Students and Academic Subject Areas,” Journal of Higher Education, 85(5),
633-659.
Young, Suzanne (2006). “Student Views of Effective Online Teaching in Higher Education.” The
American Journal of Distance Education, 20:2, 65-77.
Yu-Chun Kuo, Andrew E. Walker, Brian R. Belland, and Kerstin E.E, Schroder (2013). “A predictive
study of student satisfaction in online education programs.” The International Review of Research in
Open and Distance Learning, 14(1), 16–39.
https://www2.ed.gov/about/offices/list/oig/misc/lettertocongressonoighearecommendationsmarch2018.pdf
43
Yukselturk, Erman and Safure Bulut (2009). “Gender Differences in Self-Regulated Online Learning
Environment” Educational Technology & Society, 12 (3), 12–22.
Zhao, Yong, Jing Lei, Bo Yan, Chun Lai, and Hueyshan S.s Tan (2005). “What makes the difference? A
practical analysis of research on the effectiveness of distance education,” Teachers College Record,
107(8), 1836–1884.

44
ENDNOTES
1 National Center for Education Statistics (2015). Distance Education in Postsecondary Institutions. Washington,
DC: U.S. Department of Education; National Center for Education Statistics (2012). Learning at a Distance:
Undergraduate Enrollment in Distance Education Courses and Degree Programs. Washington, DC: U.S.
Department of Education. 2 I. Elaine Allen and Jeff Seaman (2014). Grade Change: Tracking Online Education in the United States. Babson
Park, MA: Babson Survey Research Group and Quahog Research Group, LLC. 3 National Center for Education Statistics. (2013-2017). Digest of Education Statistics, Table 311.15: Number and
percentage of students enrolled in degree-granting postsecondary institutions, by distance education participation,
location of student, level of enrollment, and control and level of institution. Washington, DC: National Center of
Education Statistics. 4 National Center of Education Statistics (2018). Digest of Education Statistics 2017, Table 311:15. Washington,
DC: National Center of Education Statistics. 5 National Center for Education Statistics (2018). 6 National Center of Education Statistics (2017). A Profile of the Enrollment Patterns and Demographic
Characteristics of Undergraduates at For-Profit Institutions. Washington, DC: National Center of Education
Statistics. 7 Julia E. Seaman, Elaine Allen, and Jeff Seaman (2018). Grade Increase: Tracking Distance Education in the
United States. Babson Park, MA: Babson Survey Research Group. 8 University of Phoenix, Grand Canyon University (recently converted to nonprofit), Walden University, American
Public University, Ashford University, Capella University, Kaplan University (now part of Purdue University
Global), Colorado Technical University, Chamberlain College of Nursing, and Columbia Southern University. 9 The above institutions and DeVry University, Full Sail University, Northcentral University, American
InterContinental University, and South University (recently sold and converted to nonprofit). 10 David J. Deming, Claudia Goldin, Lawrence F. Katz, and Noam Yuchtman (2015). “Can Online Learning
Bend the Higher Education Cost Curve?” American Economic Review 105 (5): 496–501. 11 U.S. Senate Committee on Health, Education, Labor and Pensions (2012). For Profit Higher Education: The
Failure to Safeguard the Federal Investment and Ensure Student Success. Washington, DC: U.S. Congress. 12 David J. Deming, Claudia Goldin, and Lawrence F. Katz (2012). “The For-Profit Postsecondary School Sector:
Nimble Critters or Agile Predators?” Journal of Economic Perspectives, 26, 139-164. 13 David J. Deming, Noam Yuchtman, Amira Abulafi, Claudia Goldin, and Lawrence F. Katz (2016). “The Value of
Postsecondary Credentials in the Labor Market: An Experimental Study,” American Economic Review, 106, 778-
806. 14 Deming et al. (2015). 15 Thomas D. Snyder, Cristobal de Brey, and Sally A. Dillow (2018). Digest of Education Statistics 2016 (NCES
2017-094). Washington, DC: U.S. Department of Education; National Center for Education Statistics (2015). 16 David J. Deming et al. (2012). 17 Risk factors include delayed enrollment, no high school diploma; part-time enrollment; financially independence;
having dependents; single parent status; and working full-time while enrolled. (National Center for Education
Statistics (2016). National Postsecondary Student Aid Study (NPSAS) 2016 2016) 18 National Center for Education Statistics (2016). NPSAS 2016, Power Stats. 19 Allison Bailey, Nithya Vaduganathan, Tyce Henry, Renee Laverdiere, and Lou Pugliese (2018). Making Digital
Learning Work: Successful Strategies from Six Leading Universities and Community Colleges. Boston, MA: The
Boston Consulting Group and Arizona State University. 20 I. Elaine Allen, I. Jeff Seaman, Russell Poulin, and Terri Taylor Straut (2016). Online Report Card: Tracking
Online Education in the United States. Babson Park, MA: Babson Survey Research Group and Quahog Research
Group, LLC. 21 Allen et al. (2016), p. 26. 22 I. Elaine Allen, Jeff Seaman, Doug Lederman, and Scott Jaschik (2012). Conflicted: Faculty and Online
Education, 2012. Babson Park, MA: Inside Higher Ed, Babson Survey Research Group and Quahog Research
Group, LLC. 23 Allen et al. (2016). 24 I. Elaine Allen and Jeff Seaman (2015). Grade Level: Tracking Online Education in the United States. Babson
Park, MA: Babson Survey Research Group and Quahog Research Group, LLC.

45
25 Lydia Saad, Brandon Busteed, and Mitchell Ogisi (2013). In U.S., Online Education Rated Best for Value and
Options. Gallup. 26 U.S. Government Accountability Office (2011). For-Profit Schools: Experiences of Undercover Students Enrolled
in Online Classes at Selected Colleges (GAO-12-150). Washington, DC: GAO. 27 Carl Straumsheim (2016, April 15). “Equal Promises, Unequal Experiences.” Inside Higher Ed. 28 United States District Court for the District of Columbia (2017). Brice Bradford et al. v. The George Washington
University. Case. 1:16-cv-00858-RBW Document 19. 29 Lindsay McKenzie (2017) “Questions on Quality of Online Learning,” Inside Higher Ed; Carl Straumsheim, Carl.
(2016). 30 For example: James C. Flower and Holly Baltzer (2006). “Hiring Technical Education Faculty: Vacancies,
Criteria, and Attitudes Toward Online Doctoral Degrees,” Journal of STEM Teacher Education, 43, 29-44; Dan
Carnevale (2007). “Employers Often Distrust Online Degrees,” Chronicle of Higher Education, 53, A28;
Brian Lee Danzinger (2007). Exploring Perceptions of Online Education by Human Resource Professionals in
Northeast Wisconsin. Doctoral Dissertation, Northcentral University; John A. Huss (2007). “Attitudes of Middle
Grades Principals toward Online Teacher Preparation Programs in Middle Grades Education: Are Administrators
Pushing “Delete”?” RMLE Online, 30, 1-13; Leisa Dione Thompson (2009). Perceptions of employers toward hiring
graduates with online degrees. Doctoral Dissertation, University of Nevada, Las Vegas; Katherine Karl and Joy
Peluchette (2013). “Management Faculty Perceptions of Candidates With Online Doctorates: Why the Stigma?”
American Journal of Distance Education 27, 89-99. 31 National Center for Education Statistics (2012). Learning at a Distance: Undergraduate Enrollment in Distance
Education Courses and Degree Programs. Washington, DC: U.S. Department of Education; National Center for
Education Statistics (2011). Students Attending For-Profit Postsecondary Institutions: Demographics, Enrollment
Characteristics, and 6-Year Outcomes. Washington, DC: U.S. Department of Education. 32 Nikolas Linardopoulos (2012) “Employers’ perspectives of online education,” Campus-Wide Information
Systems, 2, 189-194. 33 Society for Human Resource Management (2010). Hiring Practices and Attitudes: Traditional vs. Online Degree
Credentials SHRM Poll. Alexandria, VA: SHRM. 34 Chronicle of Higher Education (2012). The Role of Higher Education in Career Development: Employer
Perceptions. 35 Calvin D. Fogl and Devonda Elliott (2013), “The Market Value of Online Degrees as a Credible Credential,”
Global Education Journal, 67. 36 James W. Kinneer (2014). A Comparison of Health Care Recruiters' Attitudes toward RN-to-BSN Degrees Based
on Instructional Delivery Method and College For-Profit/Nonprofit Status. Doctoral Dissertation, Indiana
University of Pennsylvania. 37 Public Agenda (2013). Not Yet Sold: What Employers and Community College Students Think About Online
Education. Brooklyn, NY: Public Agenda. 38 Renee M. Mandelbaum (2014). “Acceptability of Online Degrees in Employer Hiring Practices,” International
Journal of Information and Communication Technology Education, 10. 39 Elaine I Allen and Jeff Seaman. (2015). 40 Amanda M. Grossman and Leigh R. Johnson (2016). “Employer Perceptions of Online Accounting Degrees,”
Issues in Accounting Education, 31, 91-109. 41 Jonathan Adams, Jonathan (2016). “Teaching Certificates Earned Online and Hiring Practices of High School
Principals,” Journal of Educational Issues, 2, 73-90; Jonathan Adams, Sue Lee, and Juliann Cortese (2012). “The
acceptability of online degrees: Principals and hiring practices in secondary schools,” Contemporary Issues in
Technology and Teacher Education, 12, 408-422. 42 David J. Deming et al. (2016). 43Robert M., Bernard, Philip C. Abrami, Yiping Lou, et al. (2004), “How does distance education compare with
classroom instruction? A meta-analysis of the empirical literature,” Review of Educational Research, 74, 379–439;
Barbara Means, Yukie Toyama, Robert Murphy, Marianne Bakia, and Karla Jones (2009), Evaluation of evidence-
based practices in online learning: A meta-analysis and review of online learning studies, Washington, D.C.: U.S.
Department of Education, Office of Planning, Evaluation, and Policy Development; Mary K. Tallent-Runnels, Julie
A. Thomas, William Y. Lan, et al. (2006), “Teaching courses online: A review of the research,” Review of
Educational Research, 76, 93–135; Yong Zhao, Jing Lei, Bo Yan, Chun Lai, and Hueyshan S.s Tan (2005),. “What
makes the difference? A practical analysis of research on the effectiveness of distance education,” Teachers College
Record, 107(8), 1836–1884. 44 Mary K. Tallent-Runnels, et al. (2006).

46
45 Boston Globe (2017, November 27), “Online learning can ease economic inequality,” Editorial
Boston Globe 46 David Figlio, Mark Rush, and Lu Yin (2013), “Is it Live or is it Internet? Experimental Estimates of the Effects of
Online Instruction on Student Learning,” Journal of Labor Economics 31(4), 763-784; David Figlio (2016), “A
silver lining for online higher education?” Brookings: Evidence Speaks; Maya Escueta, Vincent Quan, Andre Joshua
Nickow, Philip Oreopoulos (2017), “Education Technology: An Evidence-Based Review,” NBER Working Paper
23744; Eric Bettinger and Susanna Loeb (2017), “Promises and Pitfalls of Online Education,” Brookings: Evidence
Speaks; Susan Dynarski (2018, January 19), “Online Courses Are Harming the Students Who Need the Most Help.”
New York Times. 47 Abhijit V. Banerjee and Esther Duflo (2014). “(Dis)organization and Success in an Economics MOOC.”
American Economic Review 104(5): 514–18. 48 Maya Escueta, et al. (2017). 49 Lawrence Gladieux and Watson Scott Swail (1999). The Virtual University & Educational Opportunity. Issues of
Equity and Access for the Next Generation. Policy Perspectives. Washington, DC: College Board. 50 Di Xu and Shanna Jaggars (2014), “Performance Gaps between Online and Face-to-Face Courses: Differences
across Types of Students and Academic Subject Areas,” Journal of Higher Education, 85(5, Sep-Oct): 633-659. 51 Community College Research Center (2013). What we know about online course outcomes: Research overview.
New York: Teachers College, Columbia University. 52 Ray Kaupp (2012). “Online Penalty: The Impact of Online Instruction on the Latino-White Achievement Gap,”
Journal of Applied Research in the Community College, v19 n2 p8-16. 53 Eric P. Bettinger and Susannah Loeb (2017). 54 David Figlio et al. (2013). 55 See, for example, Erman Yukselturk and Safure Bulut (2009). “Gender Differences in Self-Regulated Online
Learning Environment” Educational Technology & Society, 12 (3), 12–22; Hermann Astleitner and Richard
Steinberg (2005). “Are There Gender Differences in Web-Based Learning? An Integrated Model and Related Effect
Sizes,” AACE Journal, 13(1), 47-63. 56 See, for example, Linda Price (2006). “Gender differences and similarities in online courses: Challenging
stereotypical views of women,” Journal of Computer Assisted Learning, 22(5) pp. 349–359; Cathy Gunn, Mae
McSporran, Hamish Macleod and Sheila French (2003). “Dominant or different? Gender issues in computer
supported learning,” Journal of Asynchronous Learning Networks, 7(1). 57 Hans Johnson and Marisol Cuellar Mejia (2014). Online Learning and Student Outcomes in California’s
Community Colleges. Public Policy Institute of California. 58 Hans Johnson and Marisol Cuellar Mejia (2014). 59Peter Shea and Temi Bidjerano (2014). “Does online learning impede degree completion? A national study of
community college students.” Computers & Education 75 (2014) 103–111.
60 Jenna Jao, Deanna Marcum, and Daniel Rossman (2018). CIC Consortium for Online Humanities Instruction II:
Evaluation Report for the Second Course Iteration, Ithaka S&R. 61 D. Randy Garrison and Doug Shale (1991) Education at a Distance, Malabar FL: Krieger Publishing, (pp. 1-6). 62 Michael G. Moore (1989). “Editorial: Three types of interaction.” The American Journal of Distance Education,
3(2), 1-6, p. 2. 63 Elizabeth C. Thach and Karen L. Murphy (1995). “Competencies for distance education professionals.”
Educational Technology Research and Development, 43(1), 57–79. 64 Jolly T. Holden and Philip J.L. Westfall (2006). An instructional media selection guide for distance learning.
Boston: United States Distance Learning Association. p. 9. 65 Lydia Kyei-Blankson, Esther Ntuli, and Heather Donnelly (2016). “Establishing the Importance of Interaction and
Presence to Student Learning in Online Environments,” World Journal of Educational Research, 3. 66 Maggie Hartnett (2016). Motivation in Online Education. Singapore: Springer. 67 Ida M. Jones, Ida (2011). “Can You See Me Now? Defining Teaching Presence in the Online Classroom through
Building a Learning Community,” Journal of Legal Studies Education, 28, 67-116. 68 Marcia D. Dixson (2010). “Creating effective student engagement in online courses: What do students find
engaging?” Journal of the Scholarship of Teaching and Learning, 10, 1-13; Benjamin Kehrwald (2008).
“Understanding social presence in text-based online learning environments.” Distance Education, 29, 89–106. 69 John M. Keller (1987). “Development and use of the ARCS model of instructional design.” Journal of
Instructional Development, 11(4), 2–10; Vanessa P. Dennen, A. Aubteen Darabi, and Linda J. (2007). “Instructor-
learner interaction in online courses: The relative perceived importance of particular instructor actions on
performance and satisfaction.” Distance Education, 28(1), 65-79.
47
70 Robert M. Bernard, Philip C. Abrami, Eugene Borokhovski, et al. (2009). “A meta-analysis of three interaction
treatments in distance education.” Review of Educational Research, 79(3), 1243-1289. 71 Karen Swan (2002). “Building Learning Communities in Online Courses: the importance of interaction.”
Education, Communication & Information, 2:1, 23-49. 72 Karen Swan (2002). 73 J.B. Arbaugh (2001). “How instructor immediacy behaviors affect student satisfaction and learning in Web-based
courses.” Business Communication Quarterly, 64(4), 42-54. 74 Katrina A. Meyer (2002). “Quality in distance education: Focus on online learning”. In Adrianna J. Kezar (Ed.),
ASHE-ERIC Higher Education Report, (pp. i-vii). San Francisco: Jossey-Bass, p. vii. 75 Thomas J. Keefe (2003). “Using technology to enhance a course: The importance of interaction.” EDUCAUSE
Quarterly, 1, 24–34. 76 Ali Sher (2009). “Assessing the Relationship of Student-Instructor and Student-Student Interaction to Student
Learning and Satisfaction in Web-Based Online Learning Environment.” Journal of Interactive Online Learning,
8(2), 102-120. 77 Suzanne Young (2006). “Student Views of Effective Online Teaching in Higher Education.” The American
Journal of Distance Education, 20:2, 65-77. 78 Bude Su, Curtis J Bonk, Richard J Magjuka, Xiaojing Liu, and Seeung-hee Lee (2005). “The importance of
interaction in Web-based education: A program-level case study of online MBA courses.” Journal of Interactive
Online Learning, 4(1), 1–18. 79 Davison M. Mupinga, Robert T. Nora, and Dorothy C. Yaw (2006). “The learning styles, expectations, and needs
of online students.” College Teaching, 54(1), 185-189. 80 Marcia D. Dixson (2010). 81 1) Provide extensive feedback, 2) Provide examples, 3) Model communication protocols, 4) Check email to assess
learner needs, 5) Respond to student inquiries, 6) Prompt interaction, 7) Review appropriateness of course
materials/activities, 8) Respond to learner opinions, 9) Provide timely feedback, 10) Communicate
rules/expectations, 11) Address nonproductive behavior, 12) Post to discussion board, 13) Monitor discussions, 14)
Respond to emotional tones, 15) Ensure availability of technical assistance, 16) Contact nonparticipants, 17)
Accommodate individual differences, 18) Establish synchronous meeting times, 19) Check on learner access to
course materials. 82 Vanessa P. Dennen et al. (2007). 83 Mary K. Tallent-Runnels, et al. (2006). 84 Robert M. Bernard, et al. (2009). 85 Shanna S. Jaggars and Di Xu (2013). Predicting Online Student Outcomes From a Measure of Course Quality
(CCRC Working Paper No. 57). New York: Community College Research Center Teachers College, Columbia
University. 86 Ibid, p. 6. 87 John Battalio (2007). “Interaction online: A reevaluation.” Quarterly Review of Distance Education, 8(4), 339–
352; Doris U. Bolliger (2004). “Key factors for determining student satisfaction in online courses.” International
Journal on E-Learning, 3(1), 61–67; Veronica A. Thurmond (2003). Examination of interaction variables as
predictors of students' satisfaction and willingness to enroll in future web-based courses while controlling for
student characteristics. Doctoral dissertation, University of Kansas. 88 Yu-Chun Kuo, Andrew E. Walker, Brian R. Belland, and Kerstin E.E, Schroder. (2013). “A predictive study of
student satisfaction in online education programs.” The International Review of Research in Open and Distance
Learning, 14(1), 16–39. 89 Lydia Kyei-Blankson, Esther Ntuli, and Heather Donnelly (2016). 90 Richard K. Ladyshewsky (2013). “Instructor Presence in Online Courses and Student Satisfaction.” International
Journal for the Scholarship of Teaching and Learning, 7. 91 Sheila A. Joyner, Matthew B. Fuller, Peggy C. Holzweiss, Susan Henderson, and Robert Young (2014). “The
Importance of Student-Instructor Connections in Graduate Level Online Courses.” MERLOT Journal of Online
Learning and Teaching, 10. 92 Papia Bawa (2016). “Retention in Online Courses: Exploring Issues and Solutions—A Literature Review,” SAGE
Open, 1-11. 93 Mirah J. Dow (2008). “Implications of social presence for online learning: A case study of MLS students.”
Journal of Education for Library and Information Science, 49(4), 238-239. 94 William Lammers and J. Arthur Gillaspy (2013). “Brief Measure of Student-Instructor Rapport Predicts Student
Success in Online Courses.” International Journal for the Scholarship of Teaching and Learning, 7.
48
95 Carol B. Aslanian and David L. Clinefelter (2012). Online college students 2012: Comprehensive data on
demands and preferences. Louisville, KY: The Learning House, Inc. 96 David L. Clinefelter (2012). Best Practices in Online Faculty Development. Louisville, KY: The Learning House,
Inc. pp. 4-8. 97 David L. Clinefelter (2012), p. 5. 98 David L. Clinefelter (2012), p. 12. 99 David L. Clinefelter (2012), p. 12. 100 Karen D. McKeown. (2012). Can Online Learning Reproduce the Full College Experience? Washington, DC:
Heritage Foundation. 101 David L. Clinefelter and Carol B. Aslanian, C (2016). Online college students 2016: Comprehensive data on
demands and preferences. Louisville, KY: The Learning House, Inc. 102 The share of students who have identified this program feature has ranged from a high of 32 percent in 2012 to a
low of 6 percent in 2015, and was 15 percent in 2018. 103 Mean score of 3.09 for required on-campus courses and 3.43 for optional on-campus courses on a 5-point
effectiveness scale (1=not at all attractive and 5=very attractive). 104 Caroline Hoxby (2018). “Online postsecondary education and labor productivity.” Education, Skills, and
Technical Change: Implications for Future US GDP Growth, Charles R. Hulten and Valerie A. Ramey, editors
Chicago: University of Chicago Press. 105 National Center for Education Statistics (2016). 106 Martin Kurzweil and Daniel Rossman (2018). Faculty Collaboration and Technology in the Liberal Arts. Ithaka
S&R. 107 Mark Lieberman (2018, July 18). “Keeping Online Courses Fresh: Valuable but Costly.” Inside Higher Ed. 108 Michael McPherson and Lawrence Bacow (2015). “Online Higher Education: Beyond the Hype Cycle,” Journal
of Economic Perspectives 29(4), 135-153. 109 Allison Bailey, Nithya Vaduganathan, Tyce Henry, Renee Laverdiere, and Lou Pugliese (201). 110Derek Newton (2018, June 28). “Why College Tuition is Actually Higher for Online Programs.” Forbes. 111 Russell Poulin and Terri T Straut (2017). WCET Distance Education Price and Cost Report. Boulder, CO:
WICHE Cooperative for Educational Technologies. 112 Mark Parry (2010). “Such a Deal? Maybe Not. Online learning can cost more than traditional education.”
Chronicle of Higher Education; William Casement (2013). “Will Online Learning Lower the Price of College?”
Journal of College Admission. 113 Jeffery Silberand Henry Sou Chien (2016). Education and Training. New York: BMO Capital Markets. 114 Ron Legon and Richard Garrett. (2018). The Changing Landscape of Online Education (CHLOE 2): A Deeper
Dive. Quality Matters & Eduventures Survey of Chief Online Officers. 115 U.S. Department of Education, Office of the Inspector Genera (2005).Reauthorization of 1998 Higher Education
Act. 116 U.S. Government Accountability Office (2002). Growth in Distance Education Programs and Implications for
Federal Education Policy (GAO-02-1125T). Washington, DC: GAO. 117 For example, students enrolled in correspondence programs are considered half-time students, even if they are
enrolled full-time, and cost of attendance is limited to tuition and fees, books and supplies. Also, correspondence
programs leading to a certificate are ineligible for student aid. 118 Doug Lederman (2012, April 30). “Credit Hour (Still) Rules,” Inside Higher Ed. 119 Chris Kirkham (2011, December 6). “John Boehner Backed Deregulation Of Online Learning, Leading To
Explosive Growth At For-Profit Colleges,” Huffington Post. 120 Pauline Abernathy (2011, June 7). Testimony, Senate Committee on Health, Education, Labor, and Pensions
Hearing on “Drowning in Debt: Financial Outcomes of Students at For-Profit Colleges. Washington, DC: The
Institute for College Access & Success. 121 Chris Kirkham (2011). 122 U.S. Department of Education (2005). Third Report to Congress on the Distance Education Demonstration
Program. Washington, DC. 123 Federal Register: August 9, 2006 (Volume 71, Number 153), pp. 45665-45717. 124Legal Information Institute (n.d.). 20 U.S Code1003. 125Legal Information Institute (n.d.). 34 CFR 600.2 126 U.S. Department of Education, Office of Federal Student Aid (2014). DCL ID: GEN-14-23. Subject:
Competency-Based Education Programs- Questions and Answers.
49
127 “For example, some working with students to develop and implement an academic action plan, others evaluating
assessments and providing substantive feedback (merely grading a test or paper would not be substantive
interaction), and still others responding to content questions.”(U.S. Department of Education, Office of Federal
Student Aid, 2014). 128 T. R. Nodine (2016). “How did we get here? A brief history of competency- based higher education in the United
States,” Competency-based Education 2016; 1: 5–11; Steven Hodge (2007). “The origins of competency-based
training,” Australian Journal of Adult Learning Volume 47, Number 2. 129 Robert Mendenhall (2012, November 5). “What Is Competency-Based Education?” Huffington Post. 130 Robert Kelchen (2015). The Landscape of Competency-Based Education: Enrollments, Demographics, and
Affordability. Washington, DC: American Enterprise Institute. 131U.S. Department of Education (2016). “Introduction to Competency-Based Education,” CBE Experiment Guide. 132 Stephens R. Porter (2016) "Competency-Based Education and Federal Student Aid," Journal of Student
Financial Aid Vol. 46 (3). 133 National Center for Education Statistics (2002). Defining and Assessing Learning: Exploring Competency-Based
Initiatives. NCES 2002-159 Cooperative Working Group on Competency-Based Initiatives. Washington, DC. 134 Council of Regional Accrediting Commissions. (2015). Regional Accreditors Announce Common Framework for
Defining and Approving Competency-Based Education Programs. Washington, DC: C-RAC. 135 It is also worth noting that the cost of PLAs and PLA credits awarded are not eligible for federal student aid. 136 Competency-Based Education Network (n.d.). “About C_BEN.” 137 Paul Fain, (2015, September 10). “Keeping Up With Competency,” Inside Higher Ed. 138 U.S. Department of Education, Office of Federal Student Aid (2016). 2016-2017 Introduction to FSA Handbook
Volume 2: School Eligibility and Operations. 139 Michael Horn (2017, September 25). “Government Accountability Goes Unaccountable: Chilling WGU's
Innovation Engine,” Forbes. 140 Beckie Supiano (2017, September 21). “What You Need to Know About the Inspector General’s Audit of
Western Governors U.,” Chronicle of Higher Education. 141 U.S. Department of Education, Office of the Inspector General (2012). Saint Mary-of-the-Woods College’s
Administration of the Title IV Programs: Final Audit Report (ED-OIG/A05K0012). 142 U.S. Department of Education, Office of the Inspector General (2014). Direct Assessment Programs: Processes
for Identifying Risks and Evaluating Applications for Title IV Eligibility Need Strengthening to Better Mitigate
Risks Posed to the Title IV Programs (ED-OIG/A05N0004). 143 “As described in the school’s application, the program was to meet the requirement for weeks of instructional
time through the use of faculty-guided independent study. The application stated that the program would use a
“coach” to guide the student’s independent study, and the application’s glossary defined a coach as “a trained
professional, typically with counseling or coaching experience, who works with the student to establish goals and set
pace and who asks questions and recommends resources or support tools, as necessary.” The application did not
state that the coach was a faculty member or that a faculty member would guide students through independent study;
the glossary was silent on the terms “faculty” and “faculty member.” The application also did not state whether the
coach was required to have subject matter expertise in the area the student was pursuing through independent
study.” (U.S. Department of Education, Office of the Inspector General, 2014). 144 U.S. Department of Education, Office of the Inspector General (2015). The Higher Learning Commission Could
Improve Its Evaluation of Competency-Based Education Programs to Help the Department Ensure the Programs
Are Properly Classified for Title IV Purposes (ED-OIG/A05O0010). 145 U.S. Department of Education, Office of the Inspector General (2016). The Western Association of Schools and
Colleges Senior College and University Commission Could Improve Its Evaluation of Competency-Based Education
Programs to Help the Department Ensure Programs Are Properly Classified for Title IV Purposes (ED-
OIG/A05P0013). 146 Council of Regional Accrediting Commissions (2015). 147 U.S. Department of Education, Office of the Inspector General (2017). Western Governors University Was Not
Eligible to Participate in the Title IV Programs: Final Audit Report (ED-OIG/A05M0009). 148 Mark Lieberman (2017, September 27). “Online Education on Notice,” Inside Higher Ed. 149 Paul Fain (2017, September 22). “Federal Audit Challenges Faculty Role at WGU,” Inside Higher Ed. 150 Paul Fain (2016, January 15). “The Faculty Role Online, Scrutinized,” Inside Higher Ed. 151Andrew Kreighbaum (2018, July 30). “DeVos to Announce New Push for Deregulation, Innovation,” Inside
Higher Ed.
50
152 U.S. Department of Education, Office of Federal Student Aid (2014). Invitation to Participate in the
Experimental Sites Initiative (FR Doc No: 2014-18075). 153 U.S. Department of Education, Office of Federal Student Aid (2016). Competency-Based Education Reference
Guide. 154 U.S. Department of Education, Office of the Inspector General (2014). Title IV of the Higher Education Act
Programs: Additional Safeguards Are Needed to Help Mitigate the Risks That Are Unique to the Distance
Education Environment (ED-OIG/A07L0001). 155 U.S. Department of Education, Office of the Inspector General (2018). U.S. Department of Education Office of
Inspector General Recommendations for the Reauthorization of the Higher Education Act. 156 U.S. Government Accountability Office (2002). Growth in Distance Education Programs and Implications for
Federal Education Policy (GAO-02-1125T). Washington, DC: GAO. 157 Robert Shireman (2017). The For-Profit College Story: Scandal, Regulate, Forget, Repeat. Washington, DC: The
Century Foundation. 158 Paul LeBlanc (2015, October 26). “Solving Yesterday's Problems Constrains Tomorrow's Solutions,” Inside
Higher Ed. 159 Congressional Budget Office (2013). The Federal Pell Grant Program: Recent Growth and Policy Options.
Washington, DC: CBO; U.S. Senate Committee on Health, Education, Labor and Pensions (2012). For Profit
Higher Education: The Failure to Safeguard the Federal Investment and Ensure Student Success. Washington, DC:
U.S. Congress. 160 Lindsay McKenzie (2017, February 27). “Cost of Online Education May Be Higher Than We Think, Study
Suggests,” Chronicle of Higher Education. 161 William Alpert, Kenneth Couch, and Oskar Harmon (2016). “A Randomized Assessment of Online
Learning.” American Economic Review: Papers and Proceedings 106(5), 378-382; William G. Bowen, Matthew M.
Chingos, Kelly A. Lack, and Thomas I. Nygren (2014). “Interactive Learning Online at Public Universities:
Evidence from a Six‐Campus Randomized Trial.” Journal of Policy Analysis and Management 33(1): 94–111. 162 Arthur C. Graesser, Mark W. Conley, and Andrew Olney (2012). “Intelligent, tutoring systems,” in APA
Educational Psychology Handbook, Vol. 3: Application to Learning and Teaching, edited by Karen R. Harris, Steve
Graham, and Tim Urdan, Washington, DC: American Psychological Association. 163 Susan Dynarski (2018, January). “Online courses are harming the students who need the most help. “The New
York Times. 164 William T. Alpert, Kenneth A. Couch, and Oskar R. Harmon (2016, May). "A Randomized Assessment of
Online Learning." American Economic Review, vol. 106(5): 378-382; William Bowen, Matthew Chingos, Kelly
Lack, and Thomas Nygren (2014). 165 Joshua Goodman, Julia Melkers, and Amanda Pallais (2016). “Can Online Delivery Increase Access to
Education?” National Bureau of Economic Research working paper 22754 166 Kaveh Waddell (2016, September 26), “Virtual Classrooms Can Be as Unequal as Real Ones,” The Atlantic, 167 Michael McPherson and Lawrence Bacow 2015). 168 Clayton M. Christensen and Michael B. Horn (2013, November 1), “Innovation Imperative: Change Everything
Online Education as an Agent of Transformation, New York Times, Education Life.
https://www2.ed.gov/about/offices/list/oig/misc/lettertocongressonoighearecommendationsmarch2018.pdf
Related Documents


