ORIGINAL PAPER Does monetary poverty reflect caloric intake? Ibrahima Bocoum & Sandrine Dury & Johny Egg & Javier Herrera & Yves Martin Prevel Received: 15 April 2013 /Accepted: 2 December 2013 /Published online: 17 January 2014 # Springer Science+Business Media Dordrecht and International Society for Plant Pathology 2014 Abstract The use of expenditure surveys to measure food insecurity is widely discussed. In this study, we investigate food insecurity in terms of monetary poverty. Using a Malian survey that incorporates exceptionally detailed information on food consumption, we estimate that 35 % of the households are in a paradoxical situation, some poor households manag- ing to cover their caloric requirements by eating cheap calories and some non-poor households not doing so because they consume expensive calories and/or face constraints such as the obligation to share meals with visitors and high expendi- ture on health care or transportation. These findings highlight precautions that need to be taken when measuring food inse- curity through monetary income or expenditure indicators. Keywords Poverty . Food insecurity . Caloric intake . Household surveys . Mali Introduction Estimating the number of people who are food insecure is an important monitoring issue for development and food security policies, as well as for monitoring the impacts of economic crises. However, there is no simple, universally accepted method for assessing the proportion of a population that is food-insecure, as Headey ( 2013) has recently demonstrated in his assessment of the impact of the 2007/08 global food crisis. Since the 1970s, the FAO method, which refers to the global level of food availability, has been based on food balance sheets, assessed from macroeconomic data on production, trade, and consumption. While this is legiti- mate at the international level, it is nonetheless criticized as an indicator of the number of people undernourished at local levels (for instance Svedberg 1999, 2000, 2002). This is because it is based on highly aggregated data and hardly explicit hypotheses of distribution among individuals and households. However, during the past 2 years, the FAO has deployed a great deal of effort to update the food availability data as well as the methodology used to estimate undernourishment (e.g. FAO WFP and IFAD 2012). Household surveys of certain countries have been used to assess more accurately the inequalities of food access within populations. While these changes have resulted in the revision downward of the number of undernourished and the finding that undernourishment has declined more strongly since 1990, the FAO acknowledges that important gaps in data and deficiencies in data quality remain. A more comprehensive picture of the food security situation in every country requires additional indicators (FAO WFP and IFAD 2012). Svedberg ( 1999, 2002) recommends employing anthropo- metric indicators whereas Headey ( 2013) proposes using self- reporting indicators. Another alternative is to use food consump- tion and monetary poverty indicators obtained from Household Consumption and Expenditures Surveys (HCES) such as Living Standard Measurement Surveys (LSMS), mainly based on house- hold expenditure recall. These surveys are conducted on a regular basis in most developing countries and encompass large represen- tative samples of several thousand households. To our knowledge, surprisingly few authors (with the exception of Smith and I. Bocoum IRSTEA, UMR ITAP, F-34000 Montpellier, France I. Bocoum (*) : S. Dury CIRAD, UMR MOISA, F-34398 Montpellier, France e-mail: [email protected] S. Dury e-mail: [email protected] J. Egg INRA, UMR1110 MOISA, 34000 Montpellier, France e-mail: [email protected] J. Herrera IRD, UMR DIAL, 75000 Paris, France e-mail: [email protected] Y. M. Prevel IRD, UMR NUTRIPASS, F-34000 Montpellier, France e-mail: [email protected] J. Herrera PSL, Université Paris-Dauphine, LEDa, F-75000 Paris, France Food Sec. (2014) 6:113–130 DOI 10.1007/s12571-013-0318-0

Welcome message from author
This document is posted to help you gain knowledge. Please leave a comment to let me know what you think about it! Share it to your friends and learn new things together.
Transcript

ORIGINAL PAPER
Does monetary poverty reflect caloric intake?
Ibrahima Bocoum & Sandrine Dury & Johny Egg &
Javier Herrera & Yves Martin Prevel
Received: 15 April 2013 /Accepted: 2 December 2013 /Published online: 17 January 2014# Springer Science+Business Media Dordrecht and International Society for Plant Pathology 2014
Abstract The use of expenditure surveys to measure foodinsecurity is widely discussed. In this study, we investigatefood insecurity in terms of monetary poverty. Using a Maliansurvey that incorporates exceptionally detailed information onfood consumption, we estimate that 35 % of the householdsare in a paradoxical situation, some poor households manag-ing to cover their caloric requirements by eating cheap caloriesand some non-poor households not doing so because theyconsume expensive calories and/or face constraints such asthe obligation to share meals with visitors and high expendi-ture on health care or transportation. These findings highlightprecautions that need to be taken when measuring food inse-curity through monetary income or expenditure indicators.
Keywords Poverty . Food insecurity . Caloric intake .
Household surveys .Mali
Introduction
Estimating the number of people who are food insecure is animportant monitoring issue for development and food securitypolicies, as well as for monitoring the impacts of economic crises.However, there is no simple, universally accepted method forassessing the proportion of a population that is food-insecure, asHeadey (2013) has recently demonstrated in his assessment of theimpact of the 2007/08 global food crisis. Since the 1970s, the FAOmethod, which refers to the global level of food availability, hasbeen based on food balance sheets, assessed frommacroeconomicdata on production, trade, and consumption. While this is legiti-mate at the international level, it is nonetheless criticized as anindicator of the number of people undernourished at local levels(for instance Svedberg 1999, 2000, 2002). This is because it isbased on highly aggregated data and hardly explicit hypotheses ofdistribution among individuals and households. However, duringthe past 2 years, the FAO has deployed a great deal of effort toupdate the food availability data as well as the methodology usedto estimate undernourishment (e.g. FAO WFP and IFAD 2012).Household surveys of certain countries have been used to assessmore accurately the inequalities of food access within populations.While these changes have resulted in the revision downward of thenumber of undernourished and the finding that undernourishmenthas declined more strongly since 1990, the FAO acknowledgesthat important gaps in data and deficiencies in data quality remain.A more comprehensive picture of the food security situation inevery country requires additional indicators (FAOWFP and IFAD2012). Svedberg (1999, 2002) recommends employing anthropo-metric indicators whereas Headey (2013) proposes using self-reporting indicators. Another alternative is to use food consump-tion and monetary poverty indicators obtained from HouseholdConsumption and Expenditures Surveys (HCES) such as LivingStandardMeasurement Surveys (LSMS), mainly based on house-hold expenditure recall. These surveys are conducted on a regularbasis in most developing countries and encompass large represen-tative samples of several thousand households. To our knowledge,surprisingly few authors (with the exception of Smith and
I. BocoumIRSTEA, UMR ITAP, F-34000 Montpellier, France
I. Bocoum (*) : S. DuryCIRAD, UMR MOISA, F-34398 Montpellier, Francee-mail: [email protected]
S. Durye-mail: [email protected]
J. EggINRA, UMR1110 MOISA, 34000 Montpellier, Francee-mail: [email protected]
J. HerreraIRD, UMR DIAL, 75000 Paris, Francee-mail: [email protected]
Y. M. PrevelIRD, UMR NUTRIPASS, F-34000 Montpellier, Francee-mail: [email protected]
J. HerreraPSL, Université Paris-Dauphine, LEDa, F-75000 Paris, France
Food Sec. (2014) 6:113–130DOI 10.1007/s12571-013-0318-0
Subandoro 2007) have formally raised and investigated the ques-tion of whether these surveys could be used to assess and monitorfood security at the household and national levels. This very recenttrend has been discussed both by global institutions and scientists.
Through joint initiatives, the World Bank and the FAO arecurrently trying to take stock from these household surveys. As afollow up to a meeting in 2010, the Committee on World FoodSecurity (CFS) asked the FAO to revise its methodology forassessing undernourishment. One of the recommendations wasto make more use of the large household surveys available indifferent countries. Discussions on this topic also took place at aworkshop in Washington DC in April 2011 (“Monitoring,Assessment, and Data Working Group of the Ten Year Strategyfor the Reduction of Vitamin and Mineral Deficiencies”)1 and atan international symposium in Rome in January 2012(“International Scientific Symposium on Food & NutritionSecurity”).
The strengths andweaknesses of Household Consumption andExpenditure Surveys (HCES) were also recently discussed from a“nutrition community perspective” (Fiedler 2012) as a tool toassess dietary intake (e.g. Dop et al. 2012) or to design nutritionalintervention programs (Murphy et al. 2012). These authors com-pared food consumption data calculated from HCES (includingpurchases, self-consumption and gifts received, expressed inmon-etary units and converted into kilograms, and then into calories,nutrients, etc.) with othermeans tomeasure food consumption (forinstance, 24-h recall). In other words, they discuss the relevance ofHCES from an external point of view,whilewe propose to discussit from an internal one. Indeed, in the present paper, we putforward a comparison of the level of household poverty, whichis the main objective of these surveys, with their level of foodconsumption. We examine in detail the households that haveinadequate food consumption though are not poor according tothe monetary poverty indicator and, conversely, those that haveadequate food consumption but are monetarily poor.
The overall objective of this paper is thus also to contributeto the debate on the opportunity of using existing HCES toassess the food insecurity status of a population. Here wechose to stick to the original purpose of these HCES (measur-ing and monitoring poverty through monetary indicators)because a huge part of the limited statistical capacities of poorcountries, especially those under the Debt Initiative for theheavily indebted poor countries, is devoted to the calculationand monitoring of poverty using these HCES. The idea is toempirically verify whether this indicator of monetary povertycan be used as an indicator of food insecurity.
More precisely, using the national poverty assessment surveycarried out in 2001 inMali—which is unique as it captured bothfood consumption (measured in quantities) and expenditures(measured in monetary units) — we compare the overlap
between a poverty indicator and a food insecurity indicator(household caloric requirement). Certain HCES also includeanthropometric indicators (in the case ofMali the 1988/89 budgetand consumption survey and the 2001 national poverty assess-ment survey). Given that these indicators only focus on childrenunder 5 years old, we assume that they are less representative ofthe holistic situation of the household than caloric intake.However, a persistent deficit of caloric intake and poor perfor-mance using anthropometric indicators shows that these areconnected. Moreover, by considering the deficit of caloric intakeas an indicator of food insecurity, our study is relevant for lessdeveloped countries where obesity problems do not exist or arerare.
The paper is structured as follows: after a brief review ofthe controversy in the scientific literature concerning the rela-tionship between caloric intake and income/total expenditure,the study’s methodology, data, and econometric model arepresented. The next sections present the descriptive andeconometric results. Section 5 finally discusses the results.
Literature review: relationship between caloric intakeand income/total expenditure
The conventional view is that insufficient food consumption islinked to insufficient income (Strauss and Thomas 1995;Abdulai and Aubert 2004a, among others). We expect thereforethat poor households are food insecure and wealthy householdsare food secure. But the research results on this topic vary byauthor and type of indicator employed. Many authors haveinvestigated the relationship between income or total householdexpenditure (easier to measure) and food insecurity, particularlythrough the study of “Engel curves2” of calories or moresophisticated demand models. The majority of these works(Subramanian and Deaton 1996; Ohri-Vachaspati et al. 1998;Abdulai and Aubert 2004b) have concluded that an increase inhouseholds’ income or total expenditure would increase theirconsumption of calories. While these studies have strengthenedthe view that food insecurity (measured by caloric intake) isassociated with low income, Behrman and Wolfe (1984),Behrman and Deolalikar (1987), and Bouis and Haddad(1992) have explained that an increase in a household’s income(including among the poorest) is not necessarily accompaniedby extra consumption of calories. It depends on income elas-ticity for each food item. Staple foods are usually considered tobe inferior goods while meat and other processed foods areoften regarded as normal or superior goods. Another explana-tion pointed out by Deaton and Dreze (2009) is an increase infood or calorie prices relative to the prices of others goods.
1 The workshop has led to a special issue of Food and Nutrition Bulletin:Food and Nutrition Bulletin, vol. 33, no. 3, 2012.
2 Engel, a nineteenth-century statistician, was interested in the evolutionof budget proportions according to income. We are interested in caloricintake, but we simplify it by saying “Engel curve.”
114 I. Bocoum et al.

In India, Deaton and Dreze (2009) and Haddad (2009) haverecently found that, despite rapid macroeconomic development— the growth of real incomes and the lack of an increase forfood relative to income— individuals’ caloric intakes declinedbetween 1983 and 2004. These results are very troubling, as theauthors themselves acknowledged. Finally, other studies (e.g.Baulch and Masset 2003; Darmon et al. 2010) have comparedmonetary poverty and various food security indicators (nutri-tional status, individuals’ perceptions) and have found that theconnections between these indicators are weak.
Materials and methods
Data
The data used here comes from a national household surveycarried out in 2001 with the support of the World Bank — theMalian Poverty Assessment Survey (DNSI 2004). Householdswere selected using a two-stage cluster sampling method: theenumeration area (EA) and the household (DNSI 2004). The1998 census divided the Malian territory into 12,000 EAscontaining roughly 100 households each. For the survey, 750EAs well distributed by region and rural/urban areas wererandomly selected. Ten households were randomly selectedfrom each EA, leading to an initial sample size of 7,500 house-holds. Our analyses focused on a subsample of 4,952 house-holds for which complete data were available and of which3,121 were rural and 1,831 urban. The survey was conductedin four rounds between January and December 2001. The datacollected concerned socio-economic characteristics, food andnon-food expenditure statements, as well as the weights of foodcooked and consumed in the households. Each round lasted1 week during which the surveyors identified the weekly recur-rent expenditure and the exceptional expenditure of the threepreviousmonths. Foods used in the preparation of variousmealsconsumed at home were systematically weighed every day.
Empirical model
In this paper, we use caloric requirements as an indicator of foodinsecurity at the household level and compare it with an indi-cator of monetary poverty. This comparison gives four possiblesituations: poor households with insufficient calories, non-poorhouseholds with sufficient calories (both expected), poor house-holds with sufficient calories and non-poor households withinsufficient calories (both unexpected and paradoxical).
After examining the proportions of households in eachsituation, we tried to identify factors that affected the relation-ship between monetary poverty and total caloric requirements.These were the budget structure of households, the cost of thecalories consumed, solidarity among households, education ofhouseholds’ women, possession of non-monetary assets,
demographic characteristics of households, geographical lo-cation and ethnicity.
We used a multinomial logistic regression model in whichthe different combinations of monetary poverty and foodconsumption outputs are explained by a set of regressors,namely households’ socio-demographic characteristics. Themodel is essentially empirical, the selected explanatory vari-ables reflecting households’ choices (cost of calories con-sumed, budget proportions) and demographic characteristics(region, ethnicity, environment, etc.).
The probability for a household of being in a particularsituation can be written as follows:
Pj ¼ Prob y ¼ j Xjð Þ ¼ exp Xβ j
� �
1þXm
k¼1exp Xβkð Þ
Where j=1,…,4 represents the situation in which thehousehold is found (corresponds to one of the four modalitiesdescribed above)
X
1
4
P j ¼ 1
X is a vector of explanatory variablesβ is a vector of parameters associated with the explanatory
variablesk is the baselineThe probability of being in a particular situation is consid-
ered in comparison with the probability of being in the baseoutcome and is written as:
Pj ¼ Prob y ¼ mþ 1 Xjð Þ ¼ 1
1þXm
k¼1exp Xβkð Þ
The standard interpretation of the results of such a modelconsists in analysing factors that increase or decrease theprobability of being in one situation with reference to a dif-ferent situation. Such an interpretation is not really convenientin our case given the high number of situations, all being notrelatively interpretable to a unique situation of reference.Marginal effects of changes in explanatory variables on theprobability Prob(y =j |X) were thus calculated using the meth-od proposed by (Chamberlain 1982; Cahuzac and Bontemps2008). These average marginal effects represent the variationin percentage points of the probability of being in a particularsituation when an explanatory variable varies by a unit (quan-titative variable) or 0-1 (dichotomous variable). Bartus (2005)considered this method as being the most relevant. The valid-ity of the multinomial logit model is based primarily on thehypothesis of the independence of alternatives. Testing thishypothesis consists of checking that removing one of the four
Does monetary poverty reflect caloric intake? 115

modalities from the dependent variable does not have a sig-nificant impact on the estimated coefficients.
Construction of caloric intake and poverty indicators
The total expenditure used to calculate the monetary povertyindicator reflects the sum of the expenditure really incurred, plusthe amount of self-consumed production. A monetary value wasgiven to self-consumed production using unit values of purchasedgoods (expenditure divided by quantities). Median unit valueswere used in each region. These unit values are quite similar to theactual prices available. In addition, the expenditure concerningdurable goods was excluded due to the lack of information on theduration of their depreciation. According to Subramanian andDeaton (1996), the exclusion of this type of expenditure is astandard procedure to minimize the statistical noise.
The poverty line was calculated for each region and type ofarea (rural or urban). Cost of calories corresponding to theaverage minimum caloric requirements in each zone (area orregion) was estimated, based on an identical food basketcontaining the foods usually consumed in all regions. Theresult obtained corresponded to the food poverty line. Thisline thus depends in part on the structure of activities, age, andgender of individuals in each zone, which influence the min-imum caloric requirements, and on the local prices of com-modities included in the basket. To estimate the overall pov-erty line (also taking into account non-food requirements),households whose food expenditure was close to the foodpoverty line have been identified and their total average ex-penditure has been calculated.
Two techniques were tested (Bocoum 2011): one describedby Pradhan et al. (2001) and another by Ravallion (1998).Different results were found (see Table 5). The incidence ofmonetary poverty in Mali oscillates between 50 and 61 %,depending on the poverty line selected, but the regressionresults are not qualitatively different. Only the results of thelowest line (the most “optimistic”) are presented here. Tocalculate the calories consumed for meals prepared and con-sumed inside the home, the weight of the food’s edible portionused for preparing daily meals was converted into caloriesusing a Malian food composition table (Nordeide 1997).Leftovers and dishes given to other households weresubtracted, while dishes received by the household wereadded to calculate the total amount of calories consumed dailyinside the home. The amount of calories consumed outside thehome by all household members was estimated and added tohome consumption. The final total amount was then dividedby the actual number of portions (number of people sharingthe meals) to assess the household’s average daily food con-sumption in calories per capita.
Caloric requirements were calculated for each individual ineach household from the basal metabolic rate according togender, age, weight, height, and considering a medium
physical activity level. The calculation method was that ofSwindale and Ohri-Vachaspati (2005). Total energy require-ment at the household level was calculated by dividing theaverage daily food consumption by the average requirement.Households not reaching 100 % were classified as “withinsufficient caloric intake” and those reaching 100 % wereclassified as “with sufficient caloric intake”.
Results
Characteristics of households’ budget and caloricconsumption
Tables 1 and 4 show the different characteristics related to themean household budget and caloric consumption. The totalannual expenditure (excluding durable goods) per householdamounted to a national average of 96,825 CFA francs (FCFA)— 79,577 FCFA and 145,197 FCFA in rural and urban areasrespectively. The average rural income of 73,235 FCFA re-vealed by the more recent RuralStruc surveys3 (Samaké et al.2008) supports our estimates. But, our estimates are below thefigures published by DNSI (2004) using the same survey asus: respectively 169,334 FCFA, 129,012 FCFA, and 267,682FCFA at the national, rural and urban level.
Although our estimates do not take into account the durablegoods (1.8 % of household budget on average), the differencewith the above figures is primarily due to the data cleaningsmade from the raw data (see Box 1). Indeed, there were many
3 These surveys were conducted with 610 farms in 24 villages in thedifferent production areas of Mali.
Box 1: Treatment of data outliers
Data outliers on the quantities used for the preparation of meals andexpenses have been detected and treated as follows. The statisticaldistribution of each type of food (over a hundred) and each of the 39expenditure categories in each stratum (urban or rural area, region,household size) were analysed. Information outliers were identified bydefining “realistic” inter-quartile intervals around the median of distri-butions. Different intervals were tested before selecting the intervals[median +/-2 * (third quartile – first quartile)] for weighted quantitiesand [median +/-6 * (third quartile – first quartile)] for the differentexpenditure types that seemed to be the most effective given the results.The correction of outliers and missing data consisted of imputing themedian value per capita of distribution in the region and the environ-ment in question. These data entries were made for a total of fewer than10 % of observations, which limits the bias that such an action couldpotentially introduce. The fact remains that our data entry method hasthe potential effect of “centralizing” the data since we replaced extremedata, judged too weak or too strong, with a median value correspondingto a relatively “homogeneous” group (for the region, area, and house-hold size). Given that this article highlights the extreme cases, it can beassumed that our data entry method has a reducing effect on them.
116 I. Bocoum et al.

outliers identified in collaboration with statisticians of theNational Institute of Statistics ofMali that have been correctedby imputation.
Food expenditures represent on average 70 % of the totalexpenditures (72 % in rural areas and 62 % in urban areas).Cereals represent almost 50 % of the food expenditures (53 %in rural areas and 33 % in urban areas). The shares of food interms of total expenditure, as well as the share of cerealswithin food expenditure decrease with increasing total expen-ditures, as the figures by quintiles of total expenditures show.This actually confirms respectively Engel’s and Bennett’slaws.
About 50 % of Malians were below the poverty line (re-spectively 54 % and 37 % of rural and urban inhabitants). Thefigures, obtained from the analysis of a recent smaller and lessdetailed survey, show a slight decrease in these poverty inci-dences which were 44% at the national scale, 51% at the ruralscale and 31 % at the urban scale (Eozenou et al. 2013). Theinequalities of total expenditure between the households werevery high between the poorest quintile and the least poorquintile, but also within the quintiles.
Our estimates showed that the average caloric intakereached 2,259 kcal per day per person in Mali in 2001. Itshould be noted that this result is very close to that estimated
by the FAO4 (2,390 kcal/day/person in 2001), indicating therelevancy of FAO’s assessment for this indicator at nationalscale. In our case, individual food consumption surveys werecompiled, whereas the FAO estimate was made based on afood balance sheet from agricultural statistics and averageconsumption ‘norms.’ This closeness of the results surprisedus given the complexity of the surveys and aggregation cal-culations in both cases, and tends to reinforce the twomethodologies.
There is little difference between rural and urban inhabi-tants (respectively 2,245 and 2,298 kcal/day/person). In con-trast, the poorest have a significantly lower caloric intake inboth rural and urban areas.
The main sources of calories are cereals. They represent, onaverage, 82 % of the total calories consumed. This share ishigher in rural areas but decreases with increasing totalexpenditures.
The share of cereals in total consumption is closely relatedto the average cost of the calories consumed. Indeed, cerealsrepresent the cheapest source of calories and a lower propor-tion of this type of food in the food basket is associated with a
Table 1 Characteristics of households’ budgets and food consumption
Total Rural Urban
All Q 1 Q 5 All Q 1 Q 5
Total expenditure/year/per capita in CFA francs M 95,122 78,070 30,942 154,289 142,945 58,507 271,030
SD 67,812 49,274 8,238 53,746 87,083 13,224 104,876
Share of food expenditure M 69 % 72 % 77 % 62 % 62 % 71 % 51 %
SD 16 % 15 % 14 % 17 % 14 % 11 % 14 %
Share of cereals in food expenditures M 48 % 53 % 55 % 44 % 33 % 39 % 28 %
SD 18 % 17 % 19 % 15 % 13 % 14 % 10 %
Incidence of poverty 50 % 54 % 100 % 0 % 37 % 100 % 0 %
Kcal/day/per capita M 2,259 2,245 1,754 2,606 2,298 1,972 2,493
SD 722 731 591 714 695 658 704
Average cost of calories M 0.08 0.07 0.04 0.11 0.11 0.07 0.17
SD 0.05 0.04 0.02 0.06 0.06 0.03 0.09
Share of cereals in calories M 82 % 86 % 88 % 81 % 73 % 78 % 67 %
SD 10 % 7 % 7 % 9 % 8 % 7 % 9 %
Caloric requirements/day/per capita M 2,409 2,467 2,442 2,493 2,249 2,218 2,293
SD 210 195 173 199 162 133 177
Proportion of caloric requirements met M 94 % 91 % 72 % 105 % 102 % 89 % 109 %
SD 30 % 30 % 24 % 30 % 31 % 30 % 31 %
Households in caloric deficit 62 % 66 % 88 % 49 % 51 % 74 % 39 %
Total: rural and urban households mixed; All: all rural or urban households; Q1: first quintile of total expenditure, ie bottom 20 %; Q5: fifth quintile oftotal expenditure, ie top 20 %; M: Mean; SD: Standard Deviation
Source: Authors’ results
4 The FAO website assessed on 25/03/2012. http://www.fao.org/economic/ess/ess-fs/fs-data/ess-fadata/fr/
Does monetary poverty reflect caloric intake? 117

higher average cost of calories, but also with a more diversi-fied diet.
On average, energy consumption reached 2,409 kcal/day/person at the national level (respectively 2,467 and 2,249 inrural and urban environments). Country-wide, Malians con-sume approximately 94 % of their total energy requirement(i.e. calorie intake/average requirement): this is a mean of91 % in rural areas and 102 % in urban areas. But this is avery incomplete picture because it ignores inequalities.Indeed, if this calculation is done at the household level,62 % of Malians appear in caloric deficit (66 % in rural areasversus 51 % in urban areas).
At the country level, and both in rural and in urban areas,the percentage of households in caloric deficit was higher thanthose that are poor. Moreover, even in the richest quintile ofthe population, the incidence of energetic deficit was high(between 40 and 50 %).
Figure 1 is divided into four quadrants on the basis ofcalories consumed and total expenditure for each household.Calories consumed are presented as proportions of the mini-mum sufficiency (the horizontal line). Household expendituresare presented as proportions of the poverty line (the verticalline) Quadrant (1) contains households below the poverty linewhich are calorie deficient; quadrant (2) contains householdsabove the poverty line which are calorie sufficient; quadrant (3)contains households which, although below the poverty line,are also calorie sufficient; and quadrant (4) contains housewhich are above the poverty line but are calorie deficient.
The “expected” cases (quadrants 1 and 2) represented 65 %of the overall population— 67 % and 61 % in rural and urbanareas respectively. The “unexpected” cases (3 and 4) represent-ed 35 % of the population— 33 % of the rural population and39 % of the urban population.
Characteristics related to different combinations of monetarypoverty and food consumption outputs
The econometric estimate suggests ways to characterize thehouseholds found in the different quadrants, particularly inquadrants 3 and 4. The explanatory variables in the regressionmodel are described in Tables 2 and 3. Table 7 in the Annexshows the results of this analysis. These regression analyseswere made in urban and rural areas, as the consumptioncharacteristics are fundamentally different between these twoenvironments. There are thus two multinomial logistic regres-sions each for the four modalities corresponding to the fourquadrants in Fig. 1.
McFadden’s pseudo-R2 presented below in Table 7allows measuring the quality of model adjustment(Green 2000). This indicator has a limited value in modelswith discrete dependent variables (it is found in mostapplications between 0.2 and 0.6: Gujarati 2004). It isrespectively 0.31 and 0.37 in rural and urban areas inour study, indicating that the quality of our model adjust-ment is high.
The hypothesis of the independence of irrelevant al-ternatives is valid when the omission of one of thedependent variable modalities has no effect on the esti-mated parameters (Green op. cit .) The Chi-squaredstatistics provided by Hausman tests5 in our case allowus to validate this hypothesis. It is likely that theendogeneity of explanatory variables arises for somevariables in our model (e.g. the average cost of calories),though it was not formally tested. However, as our goal
Fig. 1 Individual household’sexpenditure and consumptionplotted as proportions of themonetary poverty line andminimum calorie sufficiency.Source: Authors’ estimates
5 Results available upon request.
118 I. Bocoum et al.

is only descriptive, this problem is less troublesome.Finally, given the large number of explanatory variables,the risk of collinearity between some variables is high.Correlation tests, however, showed a weak link betweenthe different variables (Table 6 shows the matrix ofcorrelation).6
The distribution of households across the quadrants inrural and in urban areas was different, especially for the“expected” cases (quadrants 1 and 2). The proportion ofpoor households with insufficient caloric intake washigher in rural areas than in urban areas (43 % versus25 %). On the other hand, the proportion of non-poor withsufficient caloric intake was higher in urban areas than inrural areas (36 % versus 24 %).
Among the variables studied, the cost of calories and thehousehold size were those that most often explained theposition of households across the four quadrants (Table 7).In rural areas, the number of visitors sharing households’meals and residing in the Koulikoro region were alsoimportant determinants, whatever the quadrant considered.In urban areas, the proportion of children in the householdand residing in the Segou, Sikasso, and Gao regions weremost often the determinant variables (The Box 2 belowpresents the main characteristics of the different regions ofMali).
Box 2: Characteristics of the different regions of Mali
Mali is a large landlocked country of West Africa. With a total area of 1.2millions Km2, the majority of the population is involved inagriculturally-based activities. The Northern regions (Tombouctou,Gao andKidal) are themost arid with less than 250 mm of rainfall peryear. These zones are structurally deficient in terms of food production.The main activities are nomadic and transhumant pastoralism. Moptiis located in the South of Tombouctou and receives up to 600 mm ofrainfall per year. The main activities are agriculture (dry cereals andrice in the Niger Delta) and agro-pastoralism. Kayes, Koulikoro andSegou are located in the South-West of Mopti. The activities in theseregions vary from livestock rearing in the more arid Northern bound todry cereals production and more diversified agricultural productions inthe Southern bound (maize, cotton and fruits). The “Office du Niger”in Segou is the zone where the main irrigation installations for riceproduction are located. The Northwest of the region of Kayes is knownas the zone where the people receive many remittances. Finally, theregion of Sikasso at the extreme South ofMali is the most fertile and isoften called the attic of Mali. The main products of this region aremaize, cotton and fruits.
Before focusing on the paradoxical cases (quadrants 3 and 4),the characteristics of households in the two “expected” cases(quadrants 1 and 2) are presented.
Being non-poor with sufficient caloric intake was as-sociated with higher cost of calories consumed and lowerhousehold size in both rural and urban areas, but theseassociations were stronger in urban areas than in ruralareas. Moreover, in rural areas, being non-poor with suf-ficient calories was associated with higher numbers oflivestock per capita and higher numbers of visitors shar-ing the households’ meals.
Being poor with insufficient caloric intake was asso-ciated, in both areas, with higher household size (effectof higher household size stronger in rural areas). Inrural areas only, being poor with insufficient calorieswas associated with the consumption of cheaper calo-ries, greater expenditure on tobacco and alcohol, fewervisitors sharing households’ meals, more numerousdishes received and a lower share of own productionin the calories consumed. In urban areas only, a higherproportion of children under 15 years old in the house-hold had a positive (but weak) effect on the probabilityof being poor with insufficient calories. In these areas,this probability was also linked to a lower level ofwomen’s education. This finding tracked well with thenegative relation between child malnutrition andwomen’s education shown by previous works such asSmith and Haddad (2002).
Ethnicity is a significant determinant of the above“expected cases” only in rural areas. Belonging to theSarakole ethnic group in comparison to belonging to theBambara/Malinké group (the most populous) wasstrongly and positively associated with the probabilityof being non-poor with sufficient calories and negativelyassociated with being poor with insufficient calories.
Some regions were also significantly associated withthese probabilities in both areas. Living in the rural areasof Kayes and Koulikoro, when compared to living in therural areas of Mopti (the region randomly selected as thereference), was strongly and positively associated with theprobability of being poor with insufficient calories andnegatively associated with being non-poor with sufficientcalories. Living in the urban areas of Segou and Sikasso,when compared to living in Bamako (the biggest urbancentre), was strongly and positively associated with theprobability of being non-poor with sufficient calories andnegatively associated with being poor with insufficientcalories. On the contrary, living in the urban areas ofGao, when compared to living in Bamako, was stronglyand negatively associated with the probability of beingnon-poor with sufficient calories, whereas it was positivelyassociated with being poor with insufficient calories.
Quadrants 3 and 4 are now analysed in depth becausethey are of particular interest to understand why it issometimes difficult to estimate food insecurity usingmonetary indicators.6 The highest correlation coefficients were about 0.3.
Does monetary poverty reflect caloric intake? 119

& Probability of being poor with sufficient caloric intake(quadrant 3)
In rural areas, this probability was strongly associated withthe lower cost of calories consumed by the household7 andfewer visitors who shared the household’s meals. This prob-ability was also associated with lower household size and a
higher share of consumption that came from self-production,but these links were weaker. Moreover, poor households withsufficient calories belonged more to the Sarakole and Dogonethnic groups rather than the Bambara/Malinke ethnic group,and lived more in the Mopti region rather than the Kayes,Koulikoro, and Sikasso regions.
In urban areas, the probability of being poor withsufficient calories was strongly associated with the low-er cost of calories consumed and greater number oflivestock owned by the household. This probabilitywas also associated with a lower proportion of children
Table 2 Description of variablesVariable name Description Variable type
educ_exp Budget proportion of education expenditure Household budget structurehealth_exp Budget proportion of health expenditure
trans_exp Budget proportion of transport expenditure
tobacco_exp Budget proportion of tobacco and alcohol expenditure
calcost Average cost of consumed calories (constant prices) Food structure
livestockpc Average number of livestock per capita Holdings
visitors Average number per week of visitors invited to share meals Solidarity between communitymembersgivendish Average quantity per week of given dishes
(in individual portions)
receivedish Average quantity per week of received dishes(in individual portions)
hsize Average household size Household demographicstructureu15years Proportion of individuals under 15 years old
womeduc Highest education level achieved by women in household(from 0 for primary school to 11 for university level)
Education level
sedentary 1 if household is sedentary, otherwise 0 Lifestyleautocons Proportion of food consumed coming from own production
bambara 1 if HH is Bambara or Malinké, otherwise 0 Ethnic group of HouseholdHead (HH)peulh 1 if HH is Peulh, otherwise 0
sonrhai 1 if HH is Sonrhai, otherwise 0
senoufo 1 if HH is Sénoufo or Minianka, otherwise 0
bobo 1 if HH is Bobo, otherwise 0
arabe 1 if HH is Arab, otherwise 0
touareg 1 if HH is Touareg, otherwise 0
sarakole 1 if HH is Sarakolé, otherwise 0
dogon 1 if HH is Dogon, otherwise 0
bozo 1 if HH is Bozo, otherwise 0
maure 1 if HH is Maure, otherwise 0
othereth 1 if HH belongs to another ethnicity, otherwise 0
kayes 1 if household is located in Kayes region, otherwise 0 Region of householdkkoro 1 Koulikoro, otherwise 0
Segou 1 Ségou, otherwise 0
siksso 1 Sikasso, otherwise 0
mopti 1 Mopti, otherwise 0
tomb 1 Tombouctou, otherwise 0
gao 1 Gao, otherwise 0
kidal 1 Kidal, otherwise 0
bko 1 Bamako, otherwise 0
7 The poor consume cheaper calories in general. But, the table of descrip-tive statistics shows that the poor with sufficient calories consume evencheaper calories than the poor with insufficient calories.
120 I. Bocoum et al.
under 15 years old in the household and a higher proportion ofconsumption that came from own production, but these linkswere weaker. Finally, this probability was strongly associatedwith living in Bamako as opposed to living in Kayes, Segou,Sikasso, or Gao.
& Probability of being non-poor with insufficient caloricintake (quadrant 4)
In rural areas, this probability was strongly associated withgreater health care expenditure, higher cost of calories
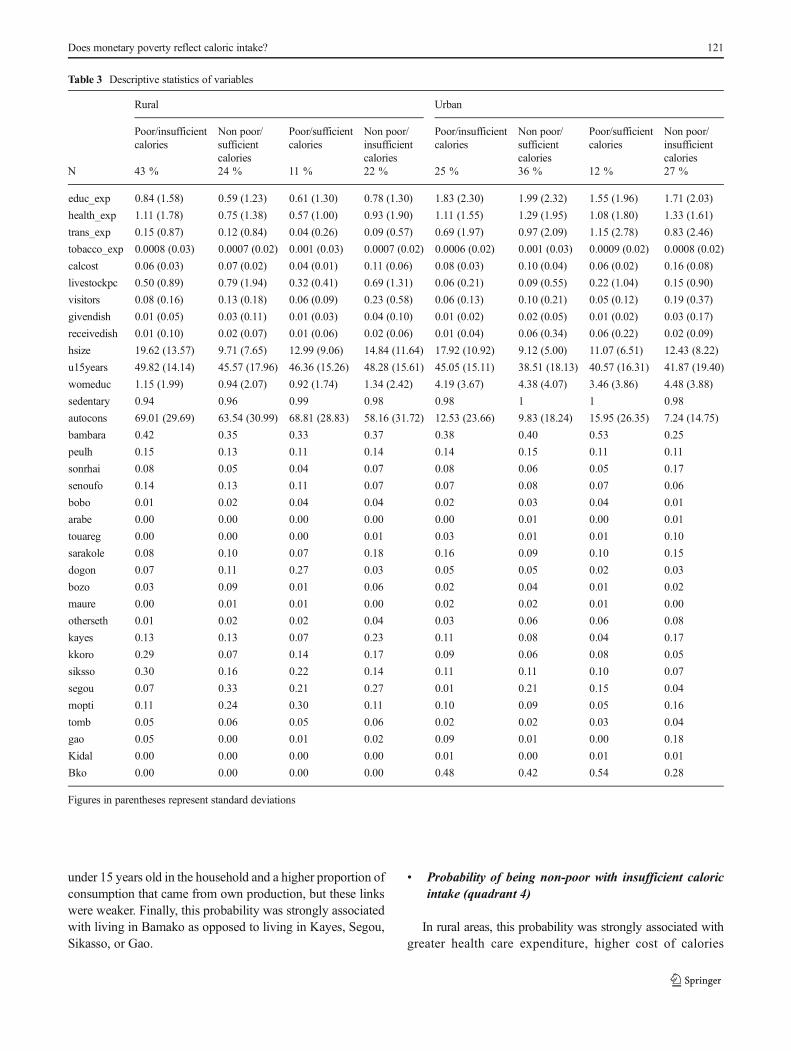
Table 3 Descriptive statistics of variables
Rural Urban
Poor/insufficientcalories
Non poor/sufficientcalories
Poor/sufficientcalories
Non poor/insufficientcalories
Poor/insufficientcalories
Non poor/sufficientcalories
Poor/sufficientcalories
Non poor/insufficientcalories
N 43 % 24 % 11 % 22 % 25 % 36 % 12 % 27 %
educ_exp 0.84 (1.58) 0.59 (1.23) 0.61 (1.30) 0.78 (1.30) 1.83 (2.30) 1.99 (2.32) 1.55 (1.96) 1.71 (2.03)
health_exp 1.11 (1.78) 0.75 (1.38) 0.57 (1.00) 0.93 (1.90) 1.11 (1.55) 1.29 (1.95) 1.08 (1.80) 1.33 (1.61)
trans_exp 0.15 (0.87) 0.12 (0.84) 0.04 (0.26) 0.09 (0.57) 0.69 (1.97) 0.97 (2.09) 1.15 (2.78) 0.83 (2.46)
tobacco_exp 0.0008 (0.03) 0.0007 (0.02) 0.001 (0.03) 0.0007 (0.02) 0.0006 (0.02) 0.001 (0.03) 0.0009 (0.02) 0.0008 (0.02)
calcost 0.06 (0.03) 0.07 (0.02) 0.04 (0.01) 0.11 (0.06) 0.08 (0.03) 0.10 (0.04) 0.06 (0.02) 0.16 (0.08)
livestockpc 0.50 (0.89) 0.79 (1.94) 0.32 (0.41) 0.69 (1.31) 0.06 (0.21) 0.09 (0.55) 0.22 (1.04) 0.15 (0.90)
visitors 0.08 (0.16) 0.13 (0.18) 0.06 (0.09) 0.23 (0.58) 0.06 (0.13) 0.10 (0.21) 0.05 (0.12) 0.19 (0.37)
givendish 0.01 (0.05) 0.03 (0.11) 0.01 (0.03) 0.04 (0.10) 0.01 (0.02) 0.02 (0.05) 0.01 (0.02) 0.03 (0.17)
receivedish 0.01 (0.10) 0.02 (0.07) 0.01 (0.06) 0.02 (0.06) 0.01 (0.04) 0.06 (0.34) 0.06 (0.22) 0.02 (0.09)
hsize 19.62 (13.57) 9.71 (7.65) 12.99 (9.06) 14.84 (11.64) 17.92 (10.92) 9.12 (5.00) 11.07 (6.51) 12.43 (8.22)
u15years 49.82 (14.14) 45.57 (17.96) 46.36 (15.26) 48.28 (15.61) 45.05 (15.11) 38.51 (18.13) 40.57 (16.31) 41.87 (19.40)
womeduc 1.15 (1.99) 0.94 (2.07) 0.92 (1.74) 1.34 (2.42) 4.19 (3.67) 4.38 (4.07) 3.46 (3.86) 4.48 (3.88)
sedentary 0.94 0.96 0.99 0.98 0.98 1 1 0.98
autocons 69.01 (29.69) 63.54 (30.99) 68.81 (28.83) 58.16 (31.72) 12.53 (23.66) 9.83 (18.24) 15.95 (26.35) 7.24 (14.75)
bambara 0.42 0.35 0.33 0.37 0.38 0.40 0.53 0.25
peulh 0.15 0.13 0.11 0.14 0.14 0.15 0.11 0.11
sonrhai 0.08 0.05 0.04 0.07 0.08 0.06 0.05 0.17
senoufo 0.14 0.13 0.11 0.07 0.07 0.08 0.07 0.06
bobo 0.01 0.02 0.04 0.04 0.02 0.03 0.04 0.01
arabe 0.00 0.00 0.00 0.00 0.00 0.01 0.00 0.01
touareg 0.00 0.00 0.00 0.01 0.03 0.01 0.01 0.10
sarakole 0.08 0.10 0.07 0.18 0.16 0.09 0.10 0.15
dogon 0.07 0.11 0.27 0.03 0.05 0.05 0.02 0.03
bozo 0.03 0.09 0.01 0.06 0.02 0.04 0.01 0.02
maure 0.00 0.01 0.01 0.00 0.02 0.02 0.01 0.00
otherseth 0.01 0.02 0.02 0.04 0.03 0.06 0.06 0.08
kayes 0.13 0.13 0.07 0.23 0.11 0.08 0.04 0.17
kkoro 0.29 0.07 0.14 0.17 0.09 0.06 0.08 0.05
siksso 0.30 0.16 0.22 0.14 0.11 0.11 0.10 0.07
segou 0.07 0.33 0.21 0.27 0.01 0.21 0.15 0.04
mopti 0.11 0.24 0.30 0.11 0.10 0.09 0.05 0.16
tomb 0.05 0.06 0.05 0.06 0.02 0.02 0.03 0.04
gao 0.05 0.00 0.01 0.02 0.09 0.01 0.00 0.18
Kidal 0.00 0.00 0.00 0.00 0.01 0.00 0.01 0.01
Bko 0.00 0.00 0.00 0.00 0.48 0.42 0.54 0.28
Figures in parentheses represent standard deviations
Does monetary poverty reflect caloric intake? 121

consumed, a greater number of visitors sharing meals,and fewer meals received from other households.Moreover, this probability was associated with greaterhousehold size, but the link was relatively weak. Thenon-poor with insufficient calories in rural areas wereof Peulh or Bobo ethnicity rather than Bambara/Malinke, and lived in the Koulikoro or Segou regions.
In urban areas, being non-poor with insufficientcaloric intake was also strongly associated with thehigher cost of calories consumed by the household,agreater number of visitors sharing meals and living inMopti rather than Bamako There were also weakerassociations between this probability and higher trans-portation expenditure, greater household size, and agreater number of children under 15 years old in thehousehold.
Discussion
The results concerning the strong relation between the cost ofcalories and the probability of being in one quadrant or an-other mainly reflects two behaviours:
(1) On average, the non-poor consumed more expensivecalories than the poor; this is because of the diversifica-tion of their diet, which is less centred on staple foodssuch as local cereals (See Table 1);
(2) The households that consumed “paradoxically”were those that tended to consume either the leastexpensive calories (poor with sufficient calories) orthe most expensive calories (rich with insufficientcalories). This was true in both rural and urbanareas.
In rural areas, it is difficult to say whether thesefindings reflect the households’ preferences to consumecheaper products or an availability constraint: in someremote villages, in the absence of exchange through localmarkets, diets will be limited to items that can be pro-duced in the region. Agro-climatic conditions determinein this case the components of the food basket. Becausecereals are the cheapest source of calories and mostcommonly grown products, this explains the significantrelationship found between higher self-production andbeing poor with sufficient calories.
At the urban level, as different foods are available in themarket, the findings were more linked to preferences, at leastfor the atypical households. The rate of self-consumption wasmuch lower in the cities (results not shown), and thus people
could “choose” with fewer constraints and express variouspreferences.8
We keep with Sen’s (1992) findings that the differences ofgoals and the variation in the ability to use endowments helpto explain differences in behaviour.We also keepwith those ofDeaton (1997), for whom the existence of non-poor peoplewith an unsatisfactory diet or poor people with an adequatediet are related to the fact that not all households spend asufficient proportion of their revenue on food in terms ofnutritional requirements.
Even poor people can have a relatively satisfactory diet (in thesense of their caloric requirementi) if they spend a larger propor-tion of their budget on food and if theymostly eat low-cost foods(see Table 4). From a case study in several developing countries,Banerjee and Duflo (2007) showed that the poor often spentlarge sums of money on tobacco, alcohol, or various traditionalceremonies. As this expenditure is not “top priority,” they con-cluded that the poor actually have many choices for managingtheir budget that would enable them to significantly improve thequality of their food consumption, but they make differentchoices. These different empirical studiess challenge the hierar-chy of requirements established byMaslow. Many people preferto meet social or private requirements, also regarded as “second-ary,” before completely covering their theoretical nutritionalrequirements. This implies that good nutrition does not neces-sarily result from improvements in income alone. Nutritioneducation may be as important for achieving good nutrition.
Moreover, the increased cost of health care in urban areasand of transport in rural areas increases the probability ofcalorie deficiency despite adequate total expenditure.
The significant effect of the number of guests atmealtime in rural areas means that, in some cases, lessersocial costs promote the ability to meet caloric require-ments despite limited financial resources, and in othersthe inability to cover requirements despite a priori suffi-cient resources.
The significant effect of household size on caloric require-ments or lack thereof on the poor and non-poor confirms thenegative relationship between the level of caloric intake and
8 Actually, farming in Mali mainly relies on extensive agricultural sys-tems with very few modern inputs. Even if it were possible for farmers todiversify their crops, it would be difficult to do so because of the badroads and difficulties of accessing inputs. Moreover, as in many othercountries, the agricultural policies of the last decades have not encourageddiversification since they have focused on cotton/maize systems andmono-cropping rice. As a result of their isolation (both for accessinginputs and selling outputs), unevenly distributed rainfall, and highly riskynatural and economic environment (very low prices of most commoditiesand production highly unstable) most farmers adopt risk avoidance strat-egies to insure minimum production of staple cereals in order to be able tofeed their household.
122 I. Bocoum et al.

the household size found in other studies (Rogers andLowdermilk 1991; Subramanian and Deaton op. cit .;Abdulai and Aubert 2004a).
Our results are mainly based on the comparison ofdifferent types of households defined using a particularcrossing of monetary poverty and caloric requirementsindicators. The main weakness of the method is theattribution of the same characteristics to different house-holds regardless of their proximity or their distancefrom the monetary poverty line or from the caloricintake threshold. This does not, however, question thevalidity of the results for a large portion of thepopulation.
We used the most recent, large, and complete house-hold survey available in Mali, which allowed the simul-taneous assessment of both household food consumption,using the weights of the different foods consumed athome and monetary poverty using detailed expendituredata. To our knowledge there is no other survey availablein the Sahel that has these characteristics. There are, ofcourse, other more recent surveys called “Enquête LégèreIntegrée Auprès des Ménages” (ELIM) carried out in2003, 2006 and 2010. Although these surveys includefood consumption information, the method of collectionof the data is far less precise because they are based onthe recall of quantities and frequencies of different itemsconsumed.
By using data from the 2001 household survey, our pur-pose was not to give a recent account of food insecurity inMali but to draw attention to the paradox that poor householdsbelow the poverty line may consume sufficient calories whilethose above the poverty line may consume insufficient calo-ries. Our hypothesis is that the factors explaining this paradoxare more structural than transient, as may be the food insecu-rity situation.
Determination of the intra-household distribution ofcalories is beyond the scope of the present study butshould be the subject of further research.. Further re-search is also required to compare poverty indicatorswith more qualitative food consumption indicators, suchas nutrient deficiencies as a household may consumemany calories but have a very poor diet in terms ofessential nutrients.
Conclusions
By assigning households to quadrants according to whether ornot their caloric requirements are met and according to theirposition in relation to the poverty line, we have estimated that11 % of households meet their caloric requirements although
they are poor, and 24 % do not meet them even though theyare above the poverty line. The discrepancy between these twoindicators is not intrinsically surprising because the determi-nants of poverty and food insecurity are not necessarily thesame. Yet, for most households, the monetary poverty indica-tor, most frequently available through surveys of households,adequately reflects satisfaction of caloric requirements’coverage.
We have shown that non-poor households do not covertheir caloric requirements due to eating habits that are charac-terized by consuming especially expensive calories and be-cause of certain binding expenditures (health care and trans-port). In contrast, poor households can meet their require-ments when they consume inexpensive calories, but this islikely to be at the expense of the overall quality of their diet.These findings challenge a vision which is centred on the needto meet their caloric requirements as the primary goal of thepoorest households.
This research supports the idea that monetary povertycould be a fairly good indicator of food insecurity, but it raisesawareness on precautions to make while measuring foodinsecurity soley through monetary indicators.
Above all, it encourages more frequent use of house-hold surveys in monitoring food security. A cost-effectiveand precision-conscious way to proceed would consist ofcomplementing monetary indicators with other availableinformation. These could be specific food habits, degreeof solidarity between households, vulnerability due tohealth problems or large household size. Moreover, thesesurveys offer opportunities to analyse further many otherissues for better monitoring of food insecurity and im-proved food security policies, such as access to inputs inrural areas (land, credit, seeds), access to markets, exis-tence and quality of roads, influence of pricing, alsocultural and religious factors.
A deficit in caloric intake is only one aspect of householdfood insecurity. The results presented in this study thus en-courage further research to describe and analyse the complexrelationships between the different dimensions of food inse-curity and poverty at the household level.
Acknowledgments The authors warmly thank:- Fellow nutritionists from UMR NUTRIPASS of IRD for their assis-
tance with consumption data processing, especially Sabrina Eymard-Duvernay and Edwige Landais;
- Fellow statisticians in Mali, especially Ms. Assa GakouDoumbia and Balla Keita from the National Institute of Statisticsand Siriki Coulibaly from Afristat for their advice for the datarecovery;
- The journal’s Editor and Assistant Editor as well as the threereviewers for their detailed comments on earlier versions of thistext.
Does monetary poverty reflect caloric intake? 123

Appendix
Table 4 Main characteristics of household food consumption by region in relation to the level of calorie consumption
Region Variable Household with calorie consumption belowindividual needs
Household with calorie consumption aboveindividual needs
M SD M SD
Kayes Share of food expenditures 71 % 0.14 73 % 0.14
Share of cereals in food expenditures 40 % 0.17 39 % 0.12
Average cost of calories in CFA francs 0.096 0.059 0.085 0.040
Koulikoro Share of food expenditures 71 % 0.17 70 % 0.19
Share of cereals in food expenditures 52 % 0.17 51 % 0.17
Average cost of calories in CFA francs 0.072 0.059 0.064 0.032
Sikasso Share of food expenditures 67 % 0.16 73 % 0.15
Share of cereals in food expenditures 55 % 0.17 54 % 0.17
Average cost of calories in CFA francs 0.067 0.050 0.067 0.026
Segou Share of food expenditures 66 % 0.15 71 % 0.15
Share of cereals in food expenditures 45 % 0.15 47 % 0.16
Average cost of calories in CFA francs 0.082 0.038 0.067 0.024
Mopti Share of food expenditures 69 % 0.15 76 % 0.12
Share of cereals in food expenditures 52 % 0.19 56 % 0.17
Average cost of calories in CFA francs 0.071 0.041 0.058 0.028
Tombouctou Share of food expenditures 70 % 0.16 69 % 0.16
Share of cereals in food expenditures 54 % 0.14 52 % 0.14
Average cost of calories in CFA francs 0.100 0.049 0.085 0.034
Gao Share of food expenditures 69 % 0.17 81 % 0.14
Share of cereals in food expenditures 47 % 0.14 47 % 0.08
Average cost of calories in CFA francs 0.110 0.057 0.120 0.054
Kidal Share of food expenditures 63 % 0.14 57 % 0.11
Share of cereals in food expenditures 38 % 0.12 42 % 0.10
Average cost of calories in CFA francs 0.200 0.100 0.076 0.051
Bamako Share of food expenditures 63 % 0.14 60 % 0.15
Share of cereals in food expenditures 32 % 0.13 30 % 0.11
Average cost of calories in CFA francs 0.130 0.079 0.100 0.041
Total Share of food expenditures 68 % 0.16 71 % 0.16
Share of cereals in food expenditures 48 % 0.18 47 % 0.18
Average cost of calories in CFA francs 0.084 0.058 0.073 0.035
Authors’ estimates
T-tests for Total are significant at least at 10 %
M Mean; SD Standard Deviation
124 I. Bocoum et al.

Table 5 Monetary poverty lines calculated by region and type of area
Region Area Food poverty line(CFA francs percapita and year)
Overall povertyline fromPradhan et al. 2001- Lower bound(CFA francs percapita and year)
Incidencewith lowerbound
Overall povertyline fromRavallion 1998 -Upper bound(CFA francs percapita and year)
Incidencewith upperbound
Kayes Rural 56,267 70,334 44 % 78,273 48 %
Urban 72,780 93,887 30 % 111,726 40 %
Koulikoro Rural 60,868 77,302 71 % 90,257 80 %
Urban 76,038 101,891 49 % 133,653 65 %
Sikasso Rural 55,146 71,690 69 % 78,203 75 %
Urban 70,737 98,324 39 % 121,832 51 %
Segou Rural 50,684 61,834 28 % 76,625 42 %
Urban 61,279 79,050 20 % 100,807 37 %
Mopti Rural 47,356 57,774 50 % 57,791 50 %
Urban 70,810 94,177 29 % 133,912 58 %
Tombouctou Rural 78,825 98,531 49 % 117,064 60 %
Urban 79,231 99,831 32 % 106,420 39 %
Gao Rural 73,229 92,268 83 % 99,325 91 %
Urban 86,977 112,200 29 % 204,815 84 %
Kidal Urban 97,407 131,500 43 % 247,570 83 %
Bamako Urban 90,361 120,180 44 % 169,579 72 %
Total rural 54 % 61 %
Total urban 37 % 61 %
National 50 % 61 %
Does monetary poverty reflect caloric intake? 125

Tab
le6
Matrixof
correlationof
thevariablesused
intheregressions
educ_exp
health_exp
trans_exp
tobacco_exp
calcost
livestockpc
visitors
givendish
receivedish
hsize
u15years
wom
educ
sedentary
educ_exp
1.0000
health_exp
0.0989
1.0000
trans_exp
0.0668
0.0861
1.0000
tobacco_exp
−0.0668
−0.0164
−0.0219
1.0000
Calcost
0.0800
0.0188
0.0704
−0.1106
1.0000
Livestockpc
−0.0674
0.0122
−0.0368
0.0146
−0.0225
1.0000
Visito
rs−0
.0350
0.0329
−0.0328
−0.0087
0.2978
0.0308
1.0000
Givendish
−0.0203
0.0159
−0.0121
−0.0387
0.2482
0.0131
0.3361
1.0000
Receivedish
−0.0150
0.0100
0.0009
0.0679
0.0525
0.0208
0.0983
0.0760
1.0000
Hsize
0.0523
0.0422
−0.0109
0.0088
−0.2044
−0.0098
−0.1742
−0.1150
−0.1021
1.0000
u15years
0.0219
−0.0195
−0.0716
−0.0499
−0.2085
−0.0561
−0.1126
−0.0586
−0.0660
0.1863
1.0000
Wom
educ
0.3672
0.0799
0.1337
−0.1451
0.2416
−0.1258
−0.0490
−0.0055
−0.0262
0.0717
−0.1250
1.0000
Sedentary
−0.0074
0.0175
0.0237
−0.0210
0.0487
−0.0226
0.0058
−0.0008
0.0084
−0.0075
−0.0091
0.0485
1.0000
Autocons
−0.2115
−0.0250
−0.1177
0.1413
−0.3511
0.1265
−0.0493
−0.0639
−0.0490
0.2180
0.1322
−0.3863
−0.0150
Bam
bara
−0.0022
0.0228
0.0177
0.0790
−0.0825
−0.0157
−0.0676
−0.0636
−0.0353
0.0550
0.0099
0.0266
−0.0078
Peulh
−0.0553
−0.0213
−0.0022
−0.0275
0.0066
0.0615
0.0085
−0.0017
−0.0115
−0.0526
−0.0292
−0.0399
−0.0313
Sonrhai
−0.0185
−0.0044
−0.0197
−0.1072
0.1180
−0.0294
0.1063
0.1784
0.0525
−0.1158
−0.0072
0.0053
0.0235
Senoufo
0.1101
0.0776
0.0120
−0.0368
−0.0409
0.0262
−0.0174
−0.0197
0.0086
−0.0150
0.0046
0.0438
0.0078
Bobo
0.0172
−0.0276
0.0003
−0.0033
−0.0410
0.0314
−0.0081
0.0026
−0.0021
−0.0053
0.0102
0.0084
0.0027
Arabe
0.0008
0.0014
−0.0014
0.0030
0.0666
−0.0200
0.0134
−0.0040
0.0042
−0.0344
0.0025
0.0085
0.0106
Touareg
−0.0320
−0.0265
−0.0265
−0.0024
0.1314
−0.0302
0.0561
0.0093
0.0309
−0.0771
−0.0107
−0.0356
−0.0066
Sarakole
0.0291
−0.0211
−0.0113
0.0267
0.0329
−0.0073
−0.0050
−0.0216
−0.0106
0.1347
0.0251
−0.0187
0.0047
Dogon
−0.0213
−0.0409
0.0025
0.0451
−0.0783
−0.0241
−0.0178
−0.0213
−0.0286
0.0163
0.0104
−0.0215
0.0277
Bozo
−0.0295
−0.0101
0.0049
−0.0017
−0.0166
0.0127
0.0085
−0.0157
0.0093
0.0001
0.0075
−0.0314
−0.0269
Maure
−0.0169
0.0166
−0.0137
−0.0306
0.0008
−0.0037
0.0354
−0.0062
0.0052
−0.0214
−0.0184
−0.0176
0.0178
Othereth
0.0070
−0.0034
0.0099
−0.0101
0.0375
−0.0292
−0.0159
−0.0037
0.0352
0.0073
−0.0123
0.0423
0.0048
autocons
bambara
peulh
sonrhai
senoufo
bobo
arabe
touareg
sarakole
dogon
bozo
maure
othereth
educ_exp
health_exp
trans_exp
tobacco_exp
Calcost
Livestockpc
Visito
rs
Givendish
Receivedish
Hsize
u15years
126 I. Bocoum et al.

Tab
le6
(contin
ued) autocons
bambara
peulh
sonrhai
senoufo
bobo
arabe
touareg
sarakole
dogon
bozo
maure
othereth
Wom
educ
Sedentary
Autocons
1.0000
Bam
bara
0.1423
1.0000
Peulh
0.0083
−0.3517
1.0000
Sonrhai
−0.1762
−0.2609
−0.1308
1.0000
Senoufo
0.1003
−0.2405
−0.1205
−0.0894
1.0000
Bobo
−0.0070
−0.1209
−0.0606
−0.0449
−0.0414
1.0000
Arabe
−0.0765
−0.0585
−0.0293
−0.0217
−0.0200
−0.0101
1.0000
Touareg
−0.1550
−0.1215
−0.0609
−0.0452
−0.0416
−0.0209
−0.0101
1.0000
Sarakole
−0.0451
−0.2770
−0.1388
−0.1030
−0.0949
−0.0477
−0.0231
−0.0479
1.0000
Dogon
0.0778
−0.1874
−0.0939
−0.0697
−0.0642
−0.0323
−0.0156
−0.0324
−0.0740
1.0000
Bozo
−0.0244
−0.1359
−0.0681
−0.0505
−0.0466
−0.0234
−0.0113
−0.0235
−0.0536
−0.0363
1.0000
Maure
−0.0231
−0.0981
−0.0492
−0.0365
−0.0336
−0.0169
−0.0082
−0.0170
−0.0387
−0.0262
−0.0190
1.0000
Othereth
−0.0891
−0.1754
−0.0879
−0.0652
−0.0601
−0.0302
−0.0146
−0.0304
−0.0692
−0.0468
−0.0340
−0.0245
1.0000
Does monetary poverty reflect caloric intake? 127

Tab
le7
Average
marginaleffects
Areaquadrant
RURAL
URBAN
(1)
(2)
(3)
(4)
(1)
(2)
(3)
(4)
educ_exp
0.219(0.502)
−0.939
(0.617)
−0.173
(0.313)
0.893(0.542)
0.192(0.415)
0.326(0.389)
−0.705
(0.451)
0.187(0.267)
health_exp
−0.814
(0.426)
−0.324
(0.472)
−0.309
(0.313)
1.447***
(0.382)
−0.422
(0.523)
0.560(0.475)
−0.748
(0.535)
0.610(0.340)
trans_exp
0.0305
(0.833)
1.748*
(0.821)
−1.182
(0.785)
−0.597
(0.905)
0.214(0.518)
0.180(0.467)
−1.082
(0.553)
0.688*
(0.329)
tobacco_exp
1.265***
(0.280)
−0.584
(0.352)
0.00444(0.135)
−0.686
(0.370)
−0.0727(0.341)
0.309(0.356)
−0.216
(0.327)
−0.0202(0.284)
calcost
−234.3***(22.64)
140.4***
(19.16)
−341.9***(22.26)
435.8***
(15.75)
27.60(31.65)
345.5***
(28.74)
−663.4***(36.30)
290.3***
(24.83)
livestockpc
−0.173
(0.639)
1.079*
(0.473)
−0.770
(0.550)
−0.136
(0.486)
−3.779
(2.866)
−0.942
(1.335)
3.812**(1.370)
0.909(0.729)
visitors
10.47**(3.552)
−12.64***(3.597)
−8.502*(3.528)
10.67***
(2.767)
4.244(6.127)
−6.537
(4.654)
−3.225
(6.709)
5.518*
(2.349)
givendish
−1.461
(10.87)
4.134(8.230)
−4.193
(9.934)
1.520(7.064)
−0.406
(22.05)
−15.68
(18.84)
12.52(32.20)
3.574(7.432)
receivedish
20.58**(7.245)
6.277(7.704)
−2.534
(4.699)
−24.32*(11.26)
−3.939
(7.183)
0.148(4.172)
2.003(4.653)
1.788(2.703)
hsize
1.347***
(0.0933)
−1.710***(0.141)
−0.275***(0.0619)
0.638***
(0.107)
1.577***
(0.135)
−2.259***(0.186)
−0.291
(0.160)
0.972***
(0.110)
u15years
0.0785
(0.0401)
−0.0885*
(0.0402)
−0.0104(0.0233)
0.0204
(0.0411)
0.228***
(0.0555)
−0.228***(0.0483)
−0.109*(0.0536)
0.108**(0.0352)
wom
educ
−0.544
(0.371)
0.299(0.388)
0.0355
(0.245)
0.209(0.355)
−0.856**
(0.276)
0.575*
(0.259)
0.244(0.283)
0.0377
(0.180)
sedentary
6.490(3.675)
9.733*
(3.834)
−6.091*(2.801)
−10.13*(4.527)
8.390(9.204)
−21.23
(15.13)
7.036(11.73)
5.802(8.306)
autocons
−0.0588*
(0.0258)
0.0197
(0.0267)
0.0288*(0.0146)
0.0103
(0.0265)
0.0110
(0.0442)
−0.0556(0.0463)
0.0948*(0.0438)
−0.0502(0.0344)
peulh
−0.675
(2.016)
−4.503*(2.078)
−0.293
(1.233)
5.471*
(2.242)
0.710(3.024)
−2.078
(2.759)
0.430(3.119)
0.939(2.006)
sonrhai
5.839(4.802)
−11.92**
(3.707)
−3.403
(2.054)
9.483(5.173)
−0.754
(4.471)
−1.625
(4.029)
−1.290
(4.560)
3.669(2.984)
senoufo
−6.472*(2.749)
5.328(3.176)
1.885(1.989)
−0.741
(3.031)
4.604(4.374)
−5.773
(3.406)
−2.501
(3.703)
3.669(2.963)
bobo
−6.441
(5.563)
−11.55**
(3.778)
3.936(3.434)
14.06**(5.409)
−3.106
(6.208)
−5.735
(5.485)
1.872(5.197)
6.969(5.303)
arabe
−14.24
(80388.7)
18.53(44564.9)
−8.082
(134240.9)
3.794(9287.2)
4.434(13.42)
0.181(12.05)
−4.792
(18.56)
0.177(5.803)
touareg
26.69(517058.2)
−27.99
(1621152.3)
− 8.165
(339370.2)
9.463(1008050.6)
−2.657
(6.343)
−7.153
(7.180)
1.415(9.305)
8.395(5.116)
sarakole
−12.63***(2.213)
7.055*
(2.920)
7.909***
(2.191)
−2.335
(2.531)
−3.957
(2.774)
1.721(3.192)
2.935(3.235)
−0.699
(2.203)
dogon
−5.706
(4.003)
0.659(3.608)
7.448*
(3.126)
−2.400
(3.990)
8.168(5.552)
2.039(4.832)
−7.435
(4.570)
−2.773
(3.522)
bozo
−4.715
(4.721)
6.057(4.422)
−4.463
(2.384)
3.121(4.570)
1.765(7.233)
12.35(6.931)
−7.520
(7.515)
−6.593
(4.219)
maure
−8.454
(5.825)
3.497(5.948)
6.669(4.721)
−1.712
(5.641)
0.769(7.340)
1.352(7.587)
0.459(7.139)
−2.580
(5.326)
autreseth
−11.63**
(3.650)
−4.037
(3.911)
0.333(2.758)
15.34***
(4.395)
0.605(4.136)
1.875(4.260)
−6.131
(3.916)
3.651(3.190)
kayes
17.00***
(3.738)
−17.68***(2.214)
−3.351*(1.575)
4.040(3.501)
−2.502
(3.170)
6.012(3.650)
−8.510*(3.519)
5.000(2.771)
kkoro
13.47***
(3.546)
−20.16***(2.050)
−4.933***(1.414)
11.63***
(3.455)
0.0341
(2.702)
−1.690
(3.015)
−1.925
(2.651)
3.581(2.600)
segou
−9.344**
(3.226)
−0.133
(2.788)
−0.0647(1.964)
9.542**(3.446)
−21.22***(1.751)
27.04***
(3.240)
−5.981*(2.503)
0.155(2.566)
siksso
20.38***
(3.837)
−20.56***(2.022)
−3.208*(1.634)
3.395(3.484)
−7.326*(3.108)
10.74**(3.837)
−7.206*(3.366)
3.788(3.061)
Mopti
−6.432*(3.141)
3.294(3.910)
−4.206
(3.922)
7.343*
(3.210)
tomb
20.86***
(5.395)
−16.52***(2.935)
4.772(4.130)
−9.110**
(3.465)
−1.641
(5.018)
−11.82**
(4.411)
9.806(5.902)
3.655(3.591)
gao
42.33(406740.4)
−28.12
(1189322.1)
1.089(61799.2)
−15.29
(720782.4)
23.99**(7.530)
−19.37***(5.170)
−13.42*(6.659)
8.789(4.734)
kidal
23.67*
(9.617)
−21.36***(6.157)
−7.414
(7.984)
5.100(5.779)
N3121
1831
pseudo
R-sq
0.314
0.377
Standard
deviationbetweenparenthesesP-value:*
p<0.05,**p<0.01,***
p<0.0
Authors’calculations
128 I. Bocoum et al.

References
Abdulai, A., & Aubert, D. (2004a). Nonparametric and parametric analysisof calorie consumption in Tanzania. Food Policy, 29(2), 113–129.
Abdulai, A., & Aubert, D. (2004b). A cross-section analysis of householddemand for food and nutrients in Tanzania. Agricultural Economics,31(1), 67–79.
Banerjee A. V. & Duflo E. (2007). The economic lives of the poor. Thejournal of economic perspectives, 21(1) , p. 141.
Bartus, T. (2005). Estimation of marginal effects using margeff. StataJournal, 5(3), 309–329.
Baulch, B., & Masset, E. (2003). Do monetary and nonmonetary indica-tors tell the same story about chronic poverty? A study of Vietnam inthe 1990s. World Development, 31(3), 441–453.
Behrman J. R. & Deolalikar A. B. (1987). Will Developing CountryNutrition Improve with Income? A Case Study for Rural SouthIndia. The Journal of Political Economy, 95(3) , p. 492.
Behrman, J. R.,&Wolfe, B. L. (1984).More Evidence onNutritionDemand:Income Seems Overrated and Women’s Schooling Underemphasized.Journal of Development Economics, 14(1–2), 105–128.
Bocoum I. (2011). Sécurité alimentaire et pauvreté. Analyse économiquedes déterminants de la consommation des ménages. Application auMali. Thèse de doctorat d’Economie, Université Montpellier 1,Montpellier. 245 pages plus annexes.
Bouis, H. E., & Haddad, L. J. (1992). Are estimates of calorie-incomeelasticities too high?: A recalibration of the plausible range. Journalof Development Economics, 39, 333–364.
Cahuzac E. & Bontemps C. (2008). Stata par la pratique: statistiques,graphiques et éléments de programmation. Stata Press Publ.
Chamberlain, G. (1982). Multivariate regression models for panel data.Journal of Econometrics, 18(1), 5–46.
Darmon N., Bocquier A., Vieux F. & Caillavet F. (2010). L’insécuritéalimentaire pour raisons financières en France. Lettre de l’ONPES (4) .
Deaton A.S. (1997). The Analysis of Household Surveys: AMicroeconometric Approach to Development Policy. Johns HopkinsUniv Pr.
Deaton, A., & Drèze, J. (2009). Food and Nutrition in india: Facts andinterpretations. Economic and political weekly, 44(7).
DNSI (2004). Enquête malienne sur l’évaluation de la pauvreté (EMEP)2001. Principaux résultats.
Dop, C., Pereira, C.,Mistura, L., Martinez, C., &Cardoso, E. (2012). UsingHousehold Consumption and Expenditures Survey (HCES) data toassess dietary intake in relation to the nutrition transition: A case studyfrom Cape Verde. Food & Nutrition Bulletin, 33(Supplement 2),221S–227S.
Eozenou P., Madani D. & Swinkels R. (2013). Poverty, Malnutrition andVulnerability in Mali. Policy Research Working Paper 6561. TheWorld Bank.
FAO, WFP & IFAD (2012). The State of Food Insecurity in the World2012. Economic growth is necessary but not sufficient to acceleratereduction of hunger and malnutrition. Rome, FAO.
Fiedler J.L. (2012). Towards overcoming the food consumption informa-tion gap: Strengthening household consumption and expendituressurveys for food and nutrition policymaking. Global Food Security(2012) , doi:10.1016/j.gfs.2012.09.002
Green, W. H. (2000). Econometric Analysis. Prentice-Hall International:Fourth Edition. 1004 p.
Gujarati D. N. (2004). Econométrie. Traduction de la 4ième editionaméricaine. De Boeck. 1009 p.
Haddad, L. (2009). Lifting the Curse: Overcoming PersistentUndernutrition in India. IDS Bulletin, 40(4), 1–8.
Headey,D.D. (2013). The Impact of theGlobal FoodCrisis on Self-AssessedFood Security. The World Bank Economic Review, 27(1), 1–27.
Murphy, S., Ruel, M., & Carriquiry, A. (2012). Should HouseholdConsumption and Expenditures Surveys (HCES) be used for
nutritional assessment and planning? Food & Nutrition Bulletin,33(Supplement 2), 235S–241S.
NordeideM. B. (1997). Table de composition d’aliments duMali. Institutde Nutrition. Oslo : Université d’Oslo.
Ohri-Vachaspati, P., Rogers, B. L., Kennedy, E., & Goldberg, J. P. (1998).The effects of data collection methods on calorie–expenditure elas-ticity estimates: a study from the Dominican Republic. Food Policy,23(3–4), 295–304.
Pradhan, M., Suryahadi, A., Sumarto, S., & Pritchett, L. (2001). Eating LikeWhich“Joneses”? An Iterative Solution to the Choice of a PovertyLine“ReferenceGroup”.Review of Income andWealth, 47(4), 473–488.
Ravallion M. (1998). Poverty Lines in Theory and Practice. World BankPublications.
Rogers, B. L., & Lowdermilk, M. (1991). Price policy and food con-sumption in urban Mali. Food Policy, 16(6), 461–473.
Samaké A., Bélières J-F., Corniaux C., Dembele N., Kelly V., Marzin J,Sanogo O. & Staatz J. (2008). Changements structurels deséconomes rurales dans la mondialisation. Programme RuralStrucMali-Phase II: MSU IER Cirad. http://siteresources.worldbank.org/AFRICAEXT/Resources/RURALSTRUC-MALI_Phase2.pdf
Sen A. K. (1992). Repenser l’inégalité. Traduction française de InequalityReexamined. Paris, Éditions du Seuil.
Smith, L. C., & Haddad, L. (2002). How Potent is Economic Growth inReducing Undernutrition? What Are the Pathways of Impact? NewCross-Country Evidence. Economic Development and CulturalChange, 51(1), 55–76.
Smith, L. C., & Subandoro, A. (2007). Measuring Food SecurityUsing Household Expenditure Surveys, Food Security inPractice . Washington DC: International Food and PolicyResearch Institute.
Strauss, J., & Thomas, D. (1995). Human resources: Empirical modelingof household and family decisions. Handbook of development eco-nomics, 3(1), 1883–2023.
Subramanian S. &Deaton A. (1996). The Demand for Food and Calories.Journal of Political Economy, 104(1) , p. 133.
Svedberg, P. (1999). 841 Million Undernourished? World Development,27(12), 2081–2098. doi:10.1016/s0305-750x(99)00102-3.
Svedberg, P. (2000). Poverty and undernutrition: Theory, measurement,and policy. USA: Oxford University Press.
Svedberg, P. (2002). Undernutrition Overestimated. EconomicDevelopment and Cultural Change, 51(1), 5–36.
Swindale A. & Ohri-Vachaspati P. (2005). Measuring household foodconsumption: a technical guide. 2005 ed.
Ibrahima Bocoum is an econo-mist. He holds a PhD from theUniversity of Montpellier 1. HisPhD thesis was focused on theanalysis of food consumption be-havior of households in the Sahel,in relation to poverty. In 2011, heworked at the French agriculturalresearch centre for development(CIRAD) on the relationship be-tween agrobiodiversity and foodsecurity. In 2012 and 2013, hewas a consultant in charge of sur-veys and data analyzes for OxfamGreat Britain and the World Bank.
He is presently working on social life cycle assessment, as a postdoctoralFellow. He performs his researches alternately between the NationalResearch Institute of Science and Technology for Environment andAgriculture (IRSTEA) in France, and the School of Management of theUniversité du Québec à Montréal in Canada.
Does monetary poverty reflect caloric intake? 129

Sandrine Dury has been workingas a researcher in agricultural andfood economics at CIRAD, theFrench agricultural research centrefor development, for 15 years. Sheis a member of the “Markets, Or-ganizations, Institutions andStakeholders Strategies” researchunit (UMR Moisa). She earnedher PhD in agricultural economicsat Montpellier University in 1997.Her work concerns food security,food consumption and local foodsupply in several locales in Africaand Europe. She now conducts
various international projects on food security, both in Western andNorthern Africa. Since 2010, she has been a board member of the SFER,the French Society of Agricultural Economics. She is supervising severalMasters and PhD students. http://agents.cirad.fr/index.php/Sandrine±DURY/Publications
Johny EGG is an agro-economist.He was formerly a researcher at theNational Institute of Agronomic Re-search in Montpellier (INRA)where he served as vice-director ofthe Unit “Markets, Organizations,Institutions and Stakeholders Strat-egies” (UMR MOISA). He is cur-rently President of the Institute forResearch and Application of Devel-opmentMethods (IRAM). He holdsa MSc in Economic Sciences fromthe University Paris I and a Special-ization Diploma from the NationalAgronomic Institute of Paris-
Grignon (INA-PG). His work focuses on the coordination structures ofagricultural products and on food security policies in developing countries.He has more particularly been working on cereals markets in West Africaand on the prevention and management policies of food crises in the Sahel.He has participated in expert meetings and studies for the OECD, theEuropean Commission and the Permanent Inter-State Committee forDrought Control in the Sahel (CILSS).
Javier Herrera is an economist.He is currently research director atthe Development Research Insti-tute (IRD) and senior researcher(and former director) at DIAL. Heholds a doctorate degree in eco-nomics from the University ofParis X, a Master degree in eco-nomics from the New School Uni-versity and a bachelor degree fromthe Catholic University, Peru. Hehas done consultant work with theWorld Bank, PNUD, ILO, PAHOand developing countries govern-ments. His recent research focuses
on poverty dynamics, spatial poverty traps, poverty measurement, sub-jective well, labour market transitions and vulnerability. He is currentlyworking on the impact of Haiti’s Earthquake on living conditions.
Yves Martin-Prével is an epide-miologist who graduated in Medi-cine at the Faculty of Montpellier(France); he holds also a diplomain Food and Nutrition in Develop-ing Countries, a MSc in Statisticsand a PhD in Public Health fromthe University of Paris VI. He en-tered the Nutrition Research Unitof IRD (the French Institute of Re-search for Development) in 1992and has been doing research inPublic Nutrition since then, withlongstanding posting in Africa.His main research topics include
indicators of dietary diversity, relationships between food vulnerabilityand nutrition security, urban nutrition, evaluation of nutritional interven-tions, nutritional surveillance systems. He is also or has been part ofvarious Experts’ Committees and Task Forces for international organiza-tions (notably FAO, WHO, WFP, UNSCN and the EuropeanCommission).
130 I. Bocoum et al.
Related Documents