Does learning in statistics get deeper or shallower? Ayse A.B. Bilgin Faculty of Science, Macquarie University, Sydney, Australia Abstract Purpose – While the natural expectation is that students seek greater depth of learning as they develop intellectually during their studies, some research calls this into question and even suggests that student learning can become shallower from year to year. The present study aims to investigate the relative depth of students’ learning at different stages of their undergraduate studies by comparing second-year with third-year students in two statistics units. Design/methodology/approach –A survey was conducted using Biggs’s Study Process Questionnaire. The survey results were used to compare second- and third-year groups, as well as to investigate other variables by comparing the performances of: international and domestic students, male and female students, students who worked and those who did not work, and students who intended to register for a higher degree and those who did not. Findings – Significant differences in approaches were found between male and female students; and between students who intended to enrol in a higher degree and those who did not. Research limitations/implications – Characteristics of the learning and teaching environment, including quality of teaching, were not investigated in this study. These and the possibility of students’ mixed approaches to learning depending on the unit of study might have significant impact on the results. Additionally, this study is specific to one Sydney university; therefore the results might not be generalisable. Originality/value – The findings from this study provide evidence that there is no significant difference between second and third year; or in international and local students’ approaches to learning in statistics. Keywords Learning, Statistics, Education, Students Paper type Research paper 1. Introduction There are many research papers addressing the question of university students’ approaches to learning (Biggs, 1987b; Kember and Gow, 1991; Kember, 2000; Cooper, 2004; Bilgin and Crowe, 2008). A few research articles focusing on the learning approaches of students in statistics have also appeared (Gordon, 1995; Bilgin and Crowe, 2008), but these studies either included only one cohort of students or had small sample sizes. The present study aims to examine statistics students’ approaches to learning over time in two large, and generally similar, statistics units. A number of researchers have identified two different levels of learning among university students (Biggs, 2003; Ramsden, 2003; Marton and Sa ¨ljo ¨, 1976; Entwistle and Ramsden, 1983), sometimes referred to as “surface” and “deep” learning. At the The current issue and full text archive of this journal is available at www.emeraldinsight.com/0951-354X.htm The author wishes to thank Dr David Bulger, Dr Tania Prvan and Ms Sigurbjorg Gudlaugsdottir for allowing her to survey their students; Ms Balamehala Pasupathy, Ms Natasha Almeida, Mr Simon Bartlett and Dr Paul Taylor for their assistance with the survey administration and data entry for this study; and of course the students for taking part in this study. IJEM 25,4 378 Received July 2010 Accepted July 2010 International Journal of Educational Management Vol. 25 No. 4, 2011 pp. 378-389 q Emerald Group Publishing Limited 0951-354X DOI 10.1108/09513541111136658

Welcome message from author
This document is posted to help you gain knowledge. Please leave a comment to let me know what you think about it! Share it to your friends and learn new things together.
Transcript
Does learning in statistics getdeeper or shallower?
Ayse A.B. BilginFaculty of Science, Macquarie University, Sydney, Australia
Abstract
Purpose – While the natural expectation is that students seek greater depth of learning as theydevelop intellectually during their studies, some research calls this into question and even suggeststhat student learning can become shallower from year to year. The present study aims to investigatethe relative depth of students’ learning at different stages of their undergraduate studies by comparingsecond-year with third-year students in two statistics units.
Design/methodology/approach – A survey was conducted using Biggs’s Study ProcessQuestionnaire. The survey results were used to compare second- and third-year groups, as well asto investigate other variables by comparing the performances of: international and domestic students,male and female students, students who worked and those who did not work, and students whointended to register for a higher degree and those who did not.
Findings – Significant differences in approaches were found between male and female students; andbetween students who intended to enrol in a higher degree and those who did not.
Research limitations/implications – Characteristics of the learning and teaching environment,including quality of teaching, were not investigated in this study. These and the possibility ofstudents’ mixed approaches to learning depending on the unit of study might have significant impacton the results. Additionally, this study is specific to one Sydney university; therefore the results mightnot be generalisable.
Originality/value – The findings from this study provide evidence that there is no significantdifference between second and third year; or in international and local students’ approaches to learningin statistics.
Keywords Learning, Statistics, Education, Students
Paper type Research paper
1. IntroductionThere are many research papers addressing the question of university students’approaches to learning (Biggs, 1987b; Kember and Gow, 1991; Kember, 2000; Cooper,2004; Bilgin and Crowe, 2008). A few research articles focusing on the learningapproaches of students in statistics have also appeared (Gordon, 1995; Bilgin andCrowe, 2008), but these studies either included only one cohort of students or had smallsample sizes. The present study aims to examine statistics students’ approaches tolearning over time in two large, and generally similar, statistics units.
A number of researchers have identified two different levels of learning amonguniversity students (Biggs, 2003; Ramsden, 2003; Marton and Saljo, 1976; Entwistleand Ramsden, 1983), sometimes referred to as “surface” and “deep” learning. At the
The current issue and full text archive of this journal is available at
www.emeraldinsight.com/0951-354X.htm
The author wishes to thank Dr David Bulger, Dr Tania Prvan and Ms Sigurbjorg Gudlaugsdottirfor allowing her to survey their students; Ms Balamehala Pasupathy, Ms Natasha Almeida, MrSimon Bartlett and Dr Paul Taylor for their assistance with the survey administration and dataentry for this study; and of course the students for taking part in this study.
IJEM25,4
378
Received July 2010Accepted July 2010
International Journal of EducationalManagementVol. 25 No. 4, 2011pp. 378-389q Emerald Group Publishing Limited0951-354XDOI 10.1108/09513541111136658
surface level learning is viewed in simple quantitative terms, as an accumulation offacts through memorisation. At this level some researchers also point to a lack ofengagement, where the student’s only aim is to pass with the minimum effort. At thehigher or deeper level, on the other hand, learning involves a process of understandingor of grasping the meaning of the learned material, in the sense that the learner is ableto benefit from what is learned by seeing how it can be applied in different contexts,possibly with a view to acquiring further information or understanding in thosecontexts. Biggs (2003) suggests that “[t]he low cognitive level of engagement derivingfrom the surface approach yields fragmented outcomes that do not convey the meaningof the encounter, whereas the deep approach yields the meaning at least as the studentconstrues it” (p. 13).
Also relevant to the present study is a further dimension of learning which Biggs(2003) adds to the “surface” and “deep” levels, namely, an “achievement approach”,where the student’s main aim is to obtain the highest possible grade, regardless of howinteresting they find the subject of study.
Learning approaches have been measured quantitatively by using questionnaires,for example Biggs’s well-known Study Process Questionnaire (SPQ) (Biggs, 1987a),which is being used in the present study. Other questionnaires are Entwistle’sApproaches to Studying Inventory (ASI) (Entwistle and Ramsden, 1983) and theApproaches and Study Skills Inventory for Students (ASSIST) (Tait et al., 1998).Qualitative studies also exist in the literature, where researchers have analysedinterviews with students using various methods of analysis – for example, thephenomenographic method of Marton and Booth (1997, p. 14) – to draw conclusionsabout their learning approaches.
Researchers have pointed out that teaching methods and methods of assessmentcan influence the way students approach their learning. Ramsden (2003) argues that“[t]he same student learns differently in different situations” (p. 49); in other words,students are capable of using both surface and deep approaches to their learning. Otherstudies show how different teaching methods might encourage one approach over theother (Saljo, 1981; Trigwell and Prosser, 1991; Trigwell et al., 1999).
A number of researchers have compared student learning along demographic lines(Marton and Saljo, 1976; Biggs, 2003; Entwistle and Ramsden, 1983); by looking atpossible differences between: students from different cultural backgrounds (Kember,2000; Ling et al., 2005; Leung et al., 2006); male and female students (Regan and Regan,1995; Baykan and Nacar, 2007); and students at different stages of their universitystudies (Watkins and Hattie, 1985; Biggs, 1987b; Kember, 2000; Zeegers, 2001).
1.1 AimsWe might expect students to become less surface oriented in their learning as theiruniversity studies progress, but Biggs et al. (2001) have warned of an alarmingtendency for students to become more surface oriented over the course of their studies,asserting that:
A particularly depressing finding is that most students in most undergraduate coursesbecome increasingly surface and decreasingly deep in their orientation to learning. There arehowever exceptions; students with aspirations for graduate study do not show this pattern intheir chosen area of study, nor do students taught using problem-based learning, who becomeincreasingly deep, and less surface, in their orientations (Biggs et al., 2001, p. 138).
Does learningget deeper or
shallower?
379
A primary purpose of our study is to determine whether statistics students’ learningapproaches change over the course of their studies and, if so, in what direction.
We undertook this study in a large metropolitan university – Macquarie Universityin Sydney, Australia. In 2008 this university was going through a structural change,specifically moving from a divisional structure to a faculty structure. Due to thischange, its department of statistics was moved from the Division of Economic andFinancial Studies (which became the Faculty of Business and Economics [FBE]) to theFaculty of Science. The department is one of the largest statistics departments inAustralia, with 24 full-time equivalent staff, and is responsible for a full range ofstatistics units from first-year undergraduate to Masters courses.
Two large-enrolment statistics units form the context of this study. These unitswere at second-year and at third-year level, where the second-year unit is a prerequisitefor the third-year unit. More than half the students enrolled in these units were FBEstudents who chose these units as their elective units. For students majoring instatistics, who formed around a quarter of the study population, these were core units.The units involved four hours of face-to-face teaching (three hours of lectures in largegroups and a one-hour small-group practical or tutorial) with additional onlinecommunication through a learning management system. Lecturers and tutors wereavailable for consultation with students every week up until the final exams.
The present study compares students at the two different levels. The fact thatstudents from the earlier year flow into the later year will make it possible to follow upwith a further, longitudinal study in due course. Another advantage of choosing thesetwo units for the study was that both have large enrolments, making it possible toobtain large sample sizes. Further advantages were that the teaching teams for the twounits tend to coordinate their activities, and they use very similar methods of teachingas well as similar methods of assessment (comprising a mid-semester test, a final examand electronic multiple-choice quizzes). These similarities meant that any observedchanges in learning approaches shown by students in the two years could fairlyconfidently be attributed to changes in the students’ own attitudes to learning overtime, rather than being attributable to differing teaching approaches or otherextraneous factors.
The study set out to survey the students using Biggs’s Study Process Questionnaire(SPQ) (1987a, b) and included a demographic survey developed in-house, so that inaddition to comparing second- with third-year statisticsstudents’ approaches to learning,we would be able to compare the learning approaches of domestic and internationalstudents, male and female students, part-time-employed students and students not in theworkforce, and students who intended to proceed to a higher degree in statistics and thosewho did not. A further aim of the study was to establish whether there is a relationshipbetween students’ learning approaches and their grades for the unit of study.
2. MethodBiggs’s SPQ is a self-reporting survey aimed at identifying students’ approaches tolearning. It consists of 42 items on six subscales, with seven items on each subscale.Each item elicits a response from the student on a scale ranging from 1 (“This item isnever or only rarely true of me”) to 5 (“This item is always or almost always true ofme”). Three of the six subscales deal with learning strategies (namely, deep, surfaceand achieving strategies – DS, SS and AS respectively) and three with learning
IJEM25,4
380
motives (deep, surface and achieving motives, or DM, SM and AM). In addition, eachstudent gets a Surface Approach, a Deep Approach and an Achieving Approach score,calculated by adding their surface strategy and surface motive scores ( ¼ SurfaceApproach score), their deep strategy and deep motive scores ( ¼ Deep Approachscore), and so on. These learning approaches are not mutually exclusive. For example,a student could have high scores in all approaches. A fuller explanation of what thecategories mean is provided in Biggs (1987a).
The SPQ and demographic surveys were conducted for both the second-year andthird-year student groups during the tenth teaching week of the second semester of 2008.For logistical reasons the second-year survey was conducted during the practicalsessions for the unit, all five of which were on the same day, while the third-year surveywas conducted during the unit’s lecture period. To eliminate any possible bias caused bythe presence of the researcher – who was also the course lecturer – she removed herselffrom the class after giving a short introduction inviting students to participate, and thesurvey was conducted by a research assistant, employed to oversee the process.
2.1 ParticipantsThere were 490 students enrolled in the second-year unit (Operations Research I), 323of whom participated in the study – a 66 per cent response rate. Of the 145 studentsenrolled in the third-year unit (Operations Research II), 59 – or 41 per cent –participated. The difference in response rate was most likely due to the attendancepatterns of the students (that is, attendance at the practical sessions was compulsoryfor the second-year students and attendance at lectures was not monitored for thethird-year students). Therefore 382 of the combined enrolments participated. Onesecond-year participant whose responses were clearly facetious was excluded from theanalysis. Four students who answered six or less of the 42 questions were droppedfrom the study; and one student was given only a surface approach score, since theyfailed to respond to any “achieving” items and offered only three responses to “deep”items. The age of the students (in years) was calculated by subtracting their birthdayfrom the survey day, and then dividing it by 365.25. The students’ achievements wererepresented by their standard numerical grade (SNG) for the unit.
2.2 Procedures and statistical analysisMotive and strategy scores for each student were calculated by totalling their scoresunder each of those headings. Some students did not answer all the SPQ questions, soto keep the maximum number of students within the study, a method of adjustingmotive and strategy scores was developed for this survey. Thus an adjusted subscalescore (ASS) was generated by calculating a student’s average score in a subscale (thatis, by dividing their total score under that subscale by the number of questionsanswered and then multiplying the result by 7, since there were seven items for eachsubscale). For example, a student who answered five questions in a subscale andscored 15 would get an ASS of 21 (15=5 ¼ 3 £ 7 ¼ 21), creating a reasonablecomparison between this student’s responses and those of students who had answeredall questions. For students who answered all seven questions in a subscale, theiradjusted and observed subscale scores would be the same.
Learning approach scores were calculated on the basis of adjusted subscale scores.Mean scores for motive and strategy approaches were then compared across different
Does learningget deeper or
shallower?
381
demographic groups – in particular, groups defined by gender, country of birth andunit studied. Depending on the number of groups, either ANOVA or t-tests were usedto compare the mean scores of approaches and subscales to test the hypothesis thatstudents’ approaches to learning were the same between the groups versus thehypothesis that students’ approaches to learning were different between groups. Thecorrelations between age, standard numerical grades, motives, strategies andapproaches scores were calculated using Spearman’s rho.
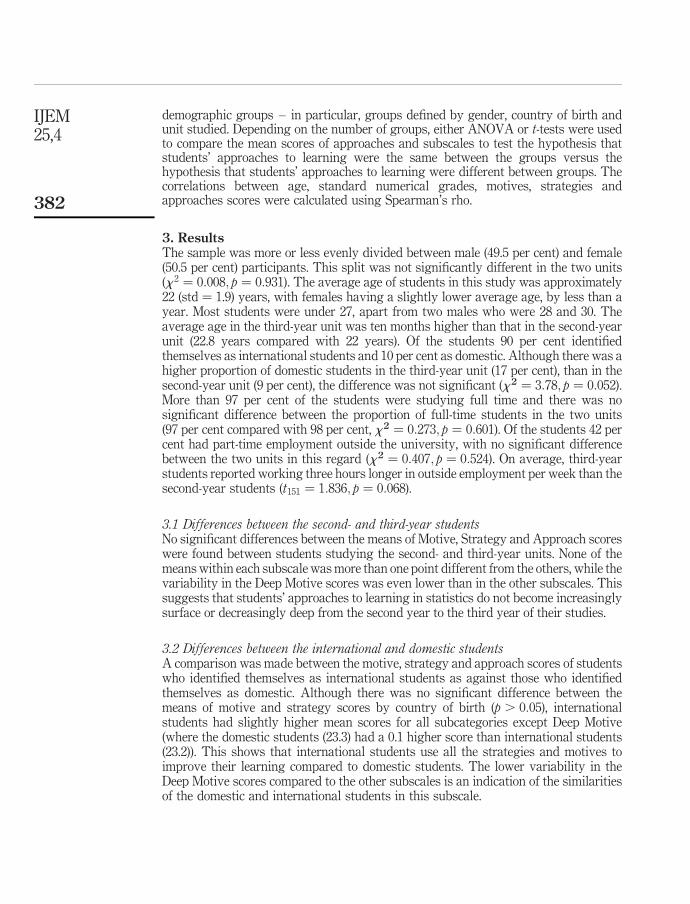
3. ResultsThe sample was more or less evenly divided between male (49.5 per cent) and female(50.5 per cent) participants. This split was not significantly different in the two units(x 2 ¼ 0:008; p ¼ 0:931). The average age of students in this study was approximately22 (std ¼ 1.9) years, with females having a slightly lower average age, by less than ayear. Most students were under 27, apart from two males who were 28 and 30. Theaverage age in the third-year unit was ten months higher than that in the second-yearunit (22.8 years compared with 22 years). Of the students 90 per cent identifiedthemselves as international students and 10 per cent as domestic. Although there was ahigher proportion of domestic students in the third-year unit (17 per cent), than in thesecond-year unit (9 per cent), the difference was not significant (x2 ¼ 3:78; p ¼ 0:052).More than 97 per cent of the students were studying full time and there was nosignificant difference between the proportion of full-time students in the two units(97 per cent compared with 98 per cent, x2 ¼ 0:273; p ¼ 0:601). Of the students 42 percent had part-time employment outside the university, with no significant differencebetween the two units in this regard (x2 ¼ 0:407; p ¼ 0:524). On average, third-yearstudents reported working three hours longer in outside employment per week than thesecond-year students (t151 ¼ 1:836; p ¼ 0:068).
3.1 Differences between the second- and third-year studentsNo significant differences between the means of Motive, Strategy and Approach scoreswere found between students studying the second- and third-year units. None of themeans within each subscale was more than one point different from the others, while thevariability in the Deep Motive scores was even lower than in the other subscales. Thissuggests that students’ approaches to learning in statistics do not become increasinglysurface or decreasingly deep from the second year to the third year of their studies.
3.2 Differences between the international and domestic studentsA comparison was made between the motive, strategy and approach scores of studentswho identified themselves as international students as against those who identifiedthemselves as domestic. Although there was no significant difference between themeans of motive and strategy scores by country of birth (p . 0:05), internationalstudents had slightly higher mean scores for all subcategories except Deep Motive(where the domestic students (23.3) had a 0.1 higher score than international students(23.2)). This shows that international students use all the strategies and motives toimprove their learning compared to domestic students. The lower variability in theDeep Motive scores compared to the other subscales is an indication of the similaritiesof the domestic and international students in this subscale.
IJEM25,4
382
The highest scores for both domestic and international students were for SurfaceApproach (where there was also the lowest variability or the highest similarity betweendomestic and international students). These were followed by Deep Approach scores(with a slightly higher variability). Achieving Approach scores were lower than otherApproach scores, and although domestic students’ scores here were more than twopoints higher than those of international students, this was not a statistically significantdifference (p ¼ 0:06), while variability was the highest for this approach.
Given the multicultural nature of Australian society, a significant number of thedomestic students in the study came from non-English speaking backgrounds – a factorthat may be as likely to influence a student’s approach to learning as their country oforigin. In addition to asking students about their nationality, the demographic surveyalso asked whether English was their first language. Although students whose firstlanguage was not English had higher mean scores for all Motive and Strategy scoresexcept Deep Strategy, a comparison between the mean Motive and Strategy scores ofthese students and those whose first language was English showed no significantdifference between the groups (p . 0:05). Approaches were not significantly differenteither. These findings provide evidence towards the similarity of learning approaches ofdomestic students regardless of their first language (that is, English or not).
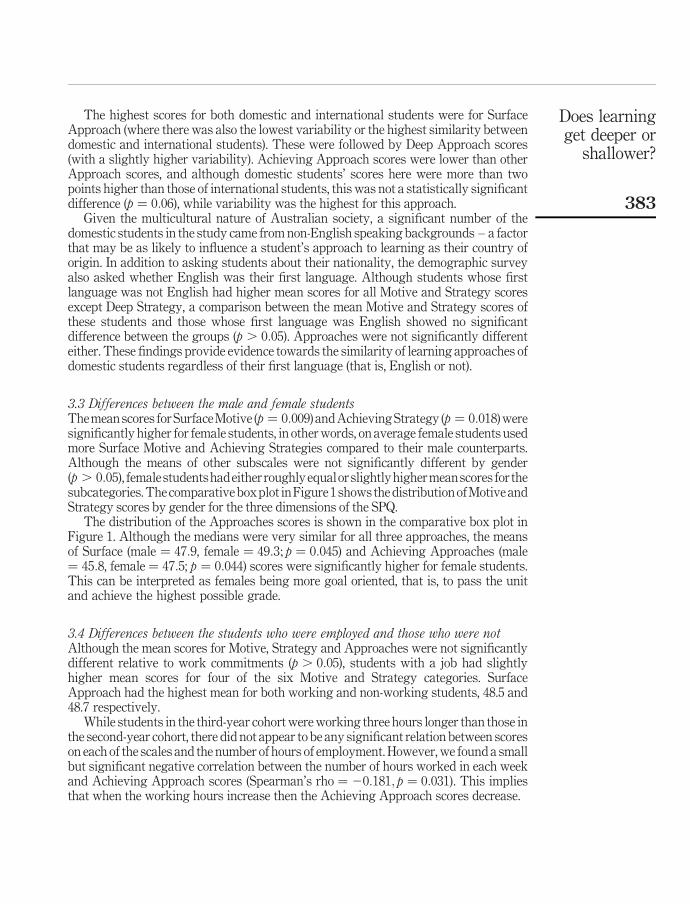
3.3 Differences between the male and female studentsThe mean scores for Surface Motive (p ¼ 0:009) and Achieving Strategy (p ¼ 0:018) weresignificantly higher for female students, in other words, on average female students usedmore Surface Motive and Achieving Strategies compared to their male counterparts.Although the means of other subscales were not significantly different by gender(p . 0:05), female students hadeither roughly equalorslightly higher meanscores for thesubcategories. The comparative box plot in Figure 1 shows the distribution of Motive andStrategy scores by gender for the three dimensions of the SPQ.
The distribution of the Approaches scores is shown in the comparative box plot inFigure 1. Although the medians were very similar for all three approaches, the meansof Surface (male ¼ 47:9, female ¼ 49:3; p ¼ 0:045) and Achieving Approaches (male¼ 45:8, female ¼ 47:5; p ¼ 0:044) scores were significantly higher for female students.This can be interpreted as females being more goal oriented, that is, to pass the unitand achieve the highest possible grade.
3.4 Differences between the students who were employed and those who were notAlthough the mean scores for Motive, Strategy and Approaches were not significantlydifferent relative to work commitments (p . 0:05), students with a job had slightlyhigher mean scores for four of the six Motive and Strategy categories. SurfaceApproach had the highest mean for both working and non-working students, 48.5 and48.7 respectively.
While students in the third-year cohort were working three hours longer than those inthe second-year cohort, there did not appear to be any significant relation between scoreson each of the scales and the number of hours of employment. However, we found a smallbut significant negative correlation between the number of hours worked in each weekand Achieving Approach scores (Spearman’s rho ¼ 20:181; p ¼ 0:031). This impliesthat when the working hours increase then the Achieving Approach scores decrease.
Does learningget deeper or
shallower?
383
3.5 The differences between students enrolled in different degreesThe degrees for which participants were enrolled were grouped into four categories:accounting (56 per cent), statistics (20 per cent), other (20 per cent) and missing (4 per cent).The “other” category included students who were enrolled in different double degrees(such as BA Economics and Applied Finance) and various single degrees (for example BAApplied Finance), where there were one or two students for each different degree. To beable to analyse the data these were aggregated into the “other” category. An ANOVA testshowed that the means of the Motive, Strategy and Approaches scores were notsignificantly different relative to the degree for which students were enrolled (p . 0:05).
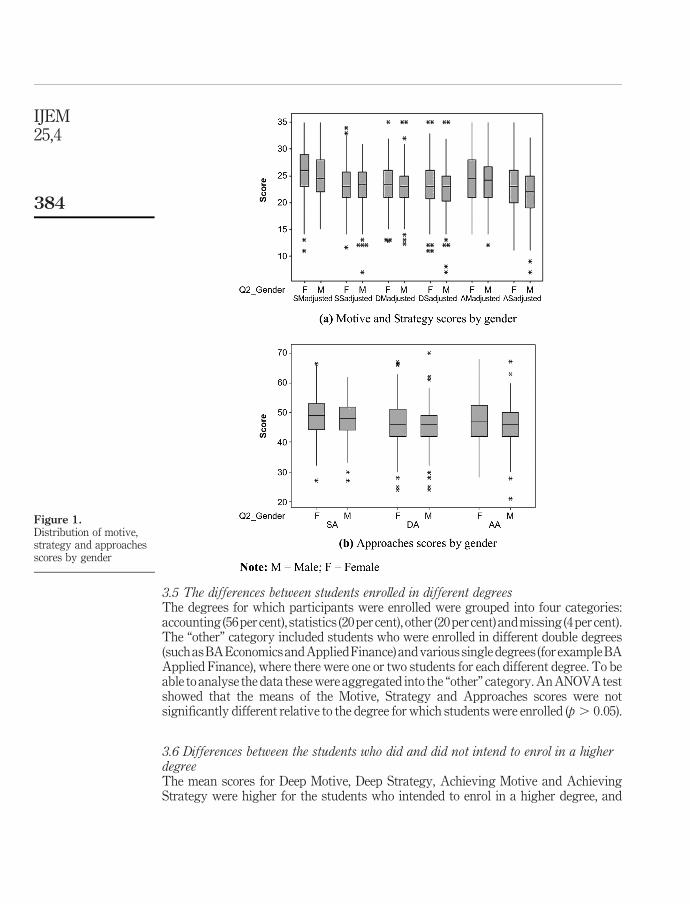
3.6 Differences between the students who did and did not intend to enrol in a higherdegreeThe mean scores for Deep Motive, Deep Strategy, Achieving Motive and AchievingStrategy were higher for the students who intended to enrol in a higher degree, and
Figure 1.Distribution of motive,strategy and approachesscores by gender
IJEM25,4
384
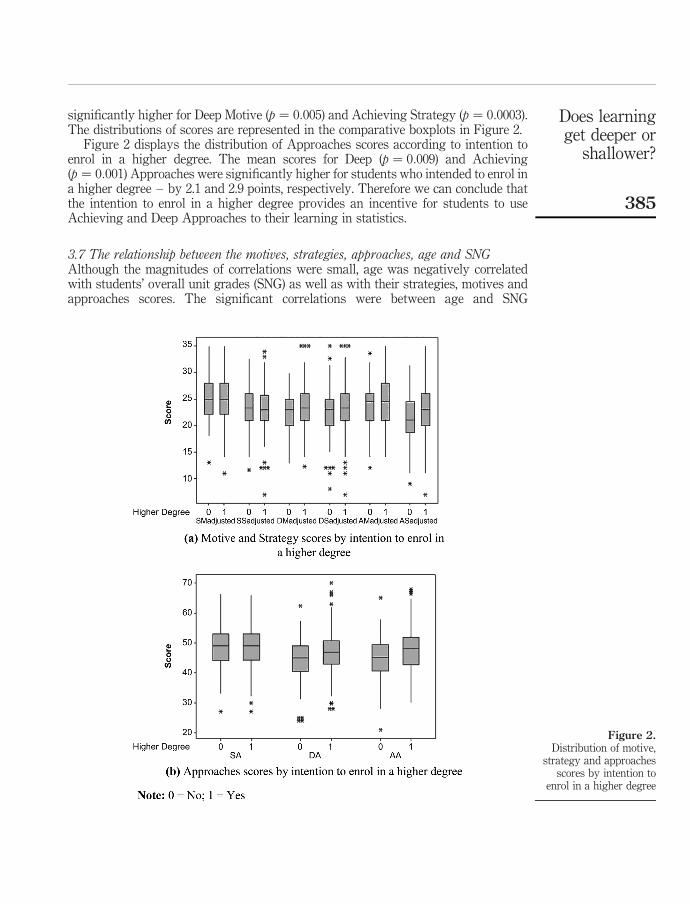
significantly higher for Deep Motive (p ¼ 0:005) and Achieving Strategy (p ¼ 0:0003).The distributions of scores are represented in the comparative boxplots in Figure 2.
Figure 2 displays the distribution of Approaches scores according to intention toenrol in a higher degree. The mean scores for Deep (p ¼ 0:009) and Achieving(p ¼ 0:001) Approaches were significantly higher for students who intended to enrol ina higher degree – by 2.1 and 2.9 points, respectively. Therefore we can conclude thatthe intention to enrol in a higher degree provides an incentive for students to useAchieving and Deep Approaches to their learning in statistics.
3.7 The relationship between the motives, strategies, approaches, age and SNGAlthough the magnitudes of correlations were small, age was negatively correlatedwith students’ overall unit grades (SNG) as well as with their strategies, motives andapproaches scores. The significant correlations were between age and SNG
Figure 2.Distribution of motive,
strategy and approachesscores by intention to
enrol in a higher degree
Does learningget deeper or
shallower?
385
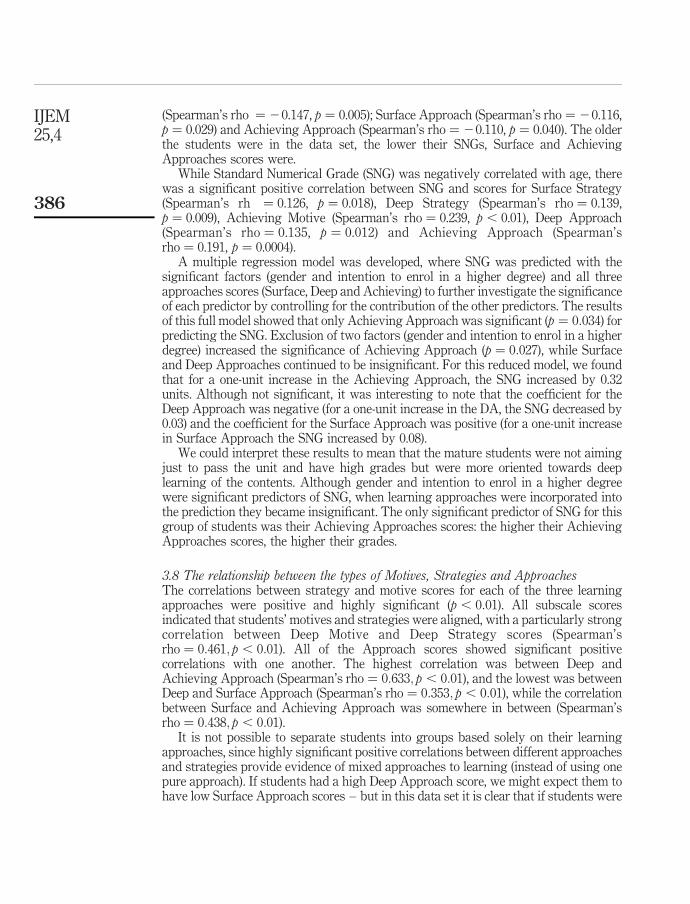
(Spearman’s rho ¼ 20.147, p ¼ 0.005); Surface Approach (Spearman’s rho ¼ 20.116,p ¼ 0.029) and Achieving Approach (Spearman’s rho ¼ 20.110, p ¼ 0.040). The olderthe students were in the data set, the lower their SNGs, Surface and AchievingApproaches scores were.
While Standard Numerical Grade (SNG) was negatively correlated with age, therewas a significant positive correlation between SNG and scores for Surface Strategy(Spearman’s rh ¼ 0.126, p ¼ 0.018), Deep Strategy (Spearman’s rho ¼ 0.139,p ¼ 0.009), Achieving Motive (Spearman’s rho ¼ 0.239, p , 0.01), Deep Approach(Spearman’s rho ¼ 0.135, p ¼ 0.012) and Achieving Approach (Spearman’srho ¼ 0.191, p ¼ 0.0004).
A multiple regression model was developed, where SNG was predicted with thesignificant factors (gender and intention to enrol in a higher degree) and all threeapproaches scores (Surface, Deep and Achieving) to further investigate the significanceof each predictor by controlling for the contribution of the other predictors. The resultsof this full model showed that only Achieving Approach was significant (p ¼ 0:034) forpredicting the SNG. Exclusion of two factors (gender and intention to enrol in a higherdegree) increased the significance of Achieving Approach (p ¼ 0:027), while Surfaceand Deep Approaches continued to be insignificant. For this reduced model, we foundthat for a one-unit increase in the Achieving Approach, the SNG increased by 0.32units. Although not significant, it was interesting to note that the coefficient for theDeep Approach was negative (for a one-unit increase in the DA, the SNG decreased by0.03) and the coefficient for the Surface Approach was positive (for a one-unit increasein Surface Approach the SNG increased by 0.08).
We could interpret these results to mean that the mature students were not aimingjust to pass the unit and have high grades but were more oriented towards deeplearning of the contents. Although gender and intention to enrol in a higher degreewere significant predictors of SNG, when learning approaches were incorporated intothe prediction they became insignificant. The only significant predictor of SNG for thisgroup of students was their Achieving Approaches scores: the higher their AchievingApproaches scores, the higher their grades.
3.8 The relationship between the types of Motives, Strategies and ApproachesThe correlations between strategy and motive scores for each of the three learningapproaches were positive and highly significant (p , 0:01). All subscale scoresindicated that students’ motives and strategies were aligned, with a particularly strongcorrelation between Deep Motive and Deep Strategy scores (Spearman’srho ¼ 0:461; p , 0:01). All of the Approach scores showed significant positivecorrelations with one another. The highest correlation was between Deep andAchieving Approach (Spearman’s rho ¼ 0:633; p , 0:01), and the lowest was betweenDeep and Surface Approach (Spearman’s rho ¼ 0:353; p , 0:01), while the correlationbetween Surface and Achieving Approach was somewhere in between (Spearman’srho ¼ 0:438; p , 0:01).
It is not possible to separate students into groups based solely on their learningapproaches, since highly significant positive correlations between different approachesand strategies provide evidence of mixed approaches to learning (instead of using onepure approach). If students had a high Deep Approach score, we might expect them tohave low Surface Approach scores – but in this data set it is clear that if students were
IJEM25,4
386
high in one approach score, they were also high on other approach score (that is, amixed approach to learning).
4. Limitations of the current studyThere are a number of considerations which should be kept in mind in considering theprevious results:
. While students’ demographic characteristics may be related to their learningapproaches, the way we identify demographic groups could make a significantdifference to the results produced by a survey. For example, we might define aninternational student simply according to nationality, or we might define themaccording to whether their culture and language differ from those of the greaterpart of the local population – a choice that could have a significant impact onsurvey results.
. Students might change their approach to learning from unit to unit. For example,their use of a Deep or Surface Approach in a subject might depend on how muchthey like that subject; or they might employ a particular approach because oftime pressure, such as using a Surface Approach because of a shortage of time(Ramsden, 1984). A change in their time pressures might also lead to a shift intheir approach midway through a unit. Alternatively, the same student mightuse different approaches simultaneously (Marton and Saljo, 1984; Bilgin andCrowe, 2008). Qualitative data are likely to help here, by providing informationabout whether, when and why students might change their approach.
. The way a unit is organised might impact on students’ learning approaches. Forexample, too many assessment tasks might encourage students to employ aSurface Approach.
. The quality of lecturing might affect students’ approaches to learning. But howis this to be measured? Again, qualitative data may help to determine the impactof a lecturer’s style or capacity for communication on students’ approaches tolearning.
. This research was undertaken in one urban university in Sydney; therefore theresults might not be generalisable, given the specific nature of teaching andlearning and the student body in this particular university.
5. ConclusionThis investigation showed that students’ approaches to learning in two statistics unitswere not significantly different at second- and third-year levels of study; nor did theydiffer significantly between domestic and international students; nor between studentswho worked and students who did not work; nor between students enrolled in differentdegrees.
There were significant differences, however, between students who intended toenrol in a higher degree and those who did not. Deep Motive, Deep Approach,Achieving Strategy and Achieving Approach scores were significantly higher amongthose students intending to proceed to a higher degree. There were also significantdifferences between female and male students, the former having significantly higherSurface Motive, Surface Approach, Achieving Strategy and Achieving Approachscores. Finally, and interestingly, the standard numerical grades of students were
Does learningget deeper or
shallower?
387
positively correlated with Deep and Achieving Approaches as well as with Surface andDeep Strategies and Achieving Motive.
This was a cross-sectional study where two groups of students at different levels ofstudy were surveyed and compared. A longitudinal study where the same students aresurveyed in consecutive years as second- and third-years in lower- and higher-levelcourses in the same discipline (such as statistics) would provide the best way of furtherinvestigating and assessing the results of the present study, particularly since thiswould allow for controlling for differences between individual students. A larger-scalestudy involving more than one institution and/or more than one discipline, andpossibly including institutions in different countries, could yield generalisable resultsthat would be of interest across the higher education sector.
References
Baykan, Z. and Nacar, M. (2007), “Learning styles of first year medical students attendingErciyes University in Kayseri, Turkey”, Advances in Physiology Education, Vol. 31,pp. 158-60.
Biggs, J.B. (1987a), Study Process Questionnaire Manual, Australian Council for EducationalResearch, Melbourne.
Biggs, J.B. (1987b), Student Approaches to Learning and Studying, Australian Council forEducational Research, Melbourne.
Biggs, J.B. (2003), Teaching for Quality Learning, Open University Press, Buckingham.
Biggs, J., Kember, D. and Leung, D.Y.P. (2001), “The revised two-factor Study ProcessQuestionnaire: R-SPQ-2F”, British Journal of Educational Psychology, Vol. 71, pp. 133-49.
Bilgin, A.A.B. and Crowe, S. (2008), “Approaches to learning in statistics”, Asian Social Science,Vol. 4 No. 3, pp. 37-43, available at: www.ccsenet.org/journal.html (accessed 22 February2009).
Cooper, B.J. (2004), “The enigma of the Chinese learner”, Accounting Education, Vol. 13 No. 3,pp. 289-310.
Entwistle, N.J. and Ramsden, P. (1983), Understanding Student Learning, Croom Helm, Londonand Canberra.
Gordon, S. (1995), “A theoretical approach to understanding learners of statistics”, Journal ofStatistical Education, Vol. 3 No. 3, pp. 1-16.
Kember, D. (2000), “Misconceptions about the learning approaches, motivation and studypractices of Asian students”, Higher Education, Vol. 40, pp. 99-121.
Kember, D. and Gow, L. (1991), “A challenge to the anecdotal stereotype of the Asian student”,Studies in Higher Education, Vol. 16 No. 2, pp. 117-28.
Leung, M.Y., Li, J., Fang, Z., Lu, X. and Lu, M. (2006), “Learning approaches of constructionengineering students: a comparative study between Hong Kong and mainland China”,Journal for Education in the Built Environment, Vol. 1 No. 1, pp. 112-31.
Ling, P., Arger, G., Filonenko, I., Chua, H. and Yin, C. (2005), “Approaches to study: a comparisonof Malaysian and Australian students”, in Brew, A. and Asmar, C. (Eds), Higher Educationin a Changing World, Proceedings of the 2005 HERDSA Annual Conference in Sydney,3-6 July 2005, Higher Education Research and Development Society of Australasia,Milperra, pp. 276-86.
Marton, F. and Booth, S. (1997), Learning and Awareness, Lawrence Erlbaum Associates,Mahwah, NJ.
Marton, F. and Saljo, R. (1976), “On qualitative difference in learning: I. Outcome and process”,British Journal of Educational Psychology, Vol. 46, pp. 4-11.
IJEM25,4
388
Marton, F. and Saljo, R. (1984), “Approaches to learning”, in Marton, F., Hounsell, D. andEntwistle, N. (Eds), The Experience of Learning, Scottish Academic Press, Edinburgh,pp. 39-58.
Ramsden, P. (1984), “The context of learning in academic departments”, in Marton, F.,Hounsell, D. and Entwistle, N. (Eds), The Experience of Learning, Scottish Academic Press,Edinburgh, pp. 198-216.
Ramsden, P. (2003), Learning to Teach in Higher Education, Routledge, London.
Regan, J. and Regan, L. (1995), “Changes in university students’ study processes during the firstyear of their undergraduate courses in relation to age, gender and faculty”, in Jeffery, P.L.(Ed.), Proceedings of 25th Annual Conference of the Australian Association for Research inEducation, 26-30 November, available at: www.aare.edu.au/95pap/regal95057.txt(accessed 30 June 2010).
Saljo, R. (1981), “Learning approach and outcome: some empirical observations”, InstructionalScience, Vol. 10 No. 1, pp. 47-65.
Tait, H., Entwistle, N.J. and McCune, V. (1998), “ASSIST: a reconceptualisation of the approachesto study inventory”, in Rust, C. (Ed.), Improving Students as Learners, Oxford Centre forStaff and Learning Development, Oxford Brookes University, Oxford, pp. 262-71.
Trigwell, K. and Prosser, M. (1991), “Improving the quality of student learning: the influence oflearning context and student approaches to learning on learning outcomes”, HigherEducation, Vol. 22 No. 3, pp. 251-66.
Trigwell, K., Prosser, M. and Waterhouse, F. (1999), “Relations between teachers’ approaches toteaching and students’ approaches to learning”, Higher Education, Vol. 37, pp. 57-70.
Watkins, D. and Hattie, J. (1985), “A longitudinal study of the approaches to learning ofAustralian tertiary students”, Human Learning, Vol. 4, pp. 127-41.
Zeegers, P. (2001), “Approaches to learning in science: a longitudinal study”, British Journal ofEducational Psychology, Vol. 71, pp. 115-32.
Further reading
Australian Academy of Science (2006), Mathematics and Statistics: Critical Skills for Australia’sFuture, available at: www.review.ms.unimelb.edu.au/Report.html (accessed 16 June).
Brookfield, S.D. (1995), Becoming a Critically Reflective Teacher, Jossey-Bass, San Francisco, CA.
About the authorAyse A.B. Bilgin is a Senior Lecturer in the Department of Statistics, in the Faculty of Science, atMacquarie University, Sydney, Australia. She teaches undergraduate and postgraduate studentsin various topics such as Operations Research, Data Mining and Decision Support Systems. Herresearch interests include statistics education and applied statistics, especially in health sciences.Ayse A.B. Bilgin can be contacted at: [email protected]
Does learningget deeper or
shallower?
389
To purchase reprints of this article please e-mail: [email protected] visit our web site for further details: www.emeraldinsight.com/reprints
Related Documents