ORIGINAL ARTICLE Does Japan really have robot mania? Comparing attitudes by implicit and explicit measures Karl F. MacDorman Sandosh K. Vasudevan Chin-Chang Ho Received: 29 December 2007 / Accepted: 17 March 2008 Ó Springer-Verlag London Limited 2008 Abstract Japan has more robots than any other country with robots contributing to many areas of society, including manufacturing, healthcare, and entertainment. However, few studies have examined Japanese attitudes toward robots, and none has used implicit measures. This study compares attitudes among the faculty of a US and a Japanese university. Although the Japanese faculty reported many more experiences with robots, implicit measures indicated both faculties had more pleasant associations with humans. In addition, although the US faculty reported people were more threatening than robots, implicit measures indicated both faculties associated weapons more strongly with robots than with humans. Despite the media’s hype about Japan’s robot ‘craze,’ response similarities suggest factors other than attitude better explain robot adoption. These include differences in history and religion, personal and human identity, economic structure, professional special- ization, and government policy. Japanese robotics offers a unique reference from which other nations may learn. K. F. MacDorman (&) Á S. K. Vasudevan Á C.-C. Ho School of Informatics, Indiana University, 535 West Michigan Street, Indianapolis, IN 46202, USA e-mail: kmacdorm@ upui edu S. K. Vasudevan e-mail: sanvasud@ upui edu C.-C. Ho e-mail: ho2@ upui edu 123 AI & Soc DOI 10.1007/s00146-008-0181-2 . i . e-mail: sanvasud@ upui edu i i .

Welcome message from author
This document is posted to help you gain knowledge. Please leave a comment to let me know what you think about it! Share it to your friends and learn new things together.
Transcript

ORI GIN AL ARTICLE
Does Japan really have robot mania? Comparingattitudes by implicit and explicit measures
Karl F. MacDorman Æ Sandosh K. Vasudevan ÆChin-Chang Ho
Received: 29 December 2007 / Accepted: 17 March 2008
� Springer-Verlag London Limited 2008
Abstract Japan has more robots than any other country with robots contributing to
many areas of society, including manufacturing, healthcare, and entertainment.
However, few studies have examined Japanese attitudes toward robots, and none has
used implicit measures. This study compares attitudes among the faculty of a US
and a Japanese university. Although the Japanese faculty reported many more
experiences with robots, implicit measures indicated both faculties had more
pleasant associations with humans. In addition, although the US faculty reported
people were more threatening than robots, implicit measures indicated both faculties
associated weapons more strongly with robots than with humans. Despite the
media’s hype about Japan’s robot ‘craze,’ response similarities suggest factors other
than attitude better explain robot adoption. These include differences in history and
religion, personal and human identity, economic structure, professional special-
ization, and government policy. Japanese robotics offers a unique reference from
which other nations may learn.
K. F. MacDorman (&) � S. K. Vasudevan � C.-C. Ho
School of Informatics, Indiana University,
535 West Michigan Street, Indianapolis, IN 46202, USA
e-mail: kmacdorm@ upui edu
S. K. Vasudevan
e-mail: sanvasud@ upui edu
C.-C. Ho
e-mail: ho2@ upui edu
123
AI & Soc
DOI 10.1007/s00146-008-0181-2
.
i .
e-mail: sanvasud@ upui edu
i
i .
1 Introduction
1.1 Robot ambivalence
Among all human artifacts, perhaps robots share the most in common with their
maker. Like computers, and in fact because they are controlled by computers, they
can process huge amounts of information. Like powered equipment, they can
manipulate their environment and move within it. And like dolls, mannequins, and
other effigies, they can resemble us—either abstractly or down to the dimples on our
cheeks. Nevertheless, the differences between machine and maker are profound.
Metabolism, life span, sexual reproduction, ancestry, culture, and consciousness for
now distinguish us from robots. Thus, the similarities and differences between us
and them circumscribe a chasm that is at once narrow and deep.
It should be unsurprising then that we view our creations with a certain
ambivalence. This ambivalence seems strongest for robots designed with the goal of
impersonating us in all respects.1 The Japanese roboticist Mori (1970) noted this
when he proposed that, as we make machines more humanlike, they would seem
more familiar until they became so human as to seem eerie. Bukimi no tani, his
graph of the relation between human likeness and familiarity, was translated into
English as the uncanny valley—thus forging an unintended link with Freud’s 1919
essay on the uncanny. Freud (1919/2003) argued that the uncanny are things that are
very familiar but repressed. Because the source of our feeling is not consciously
accessible, Freud advocated a lengthy process of psychoanalysis. In this study we
explore ways of examining the uncanny that do not rely on introspection.
Mori’s own hunch—which he did not elaborate—was that the uncanny valley
relates to the human need for self-preservation. But that only raises the question,
‘‘What do we mean by self?’’ If by self we mean the human phenotype that must
survive long enough to pass on its genes to the next generation and ensure its
success, we are led to a biological explanation of negative feelings toward robots
that must hold regardless of culture (e.g., the issues surrounding mate selection or
pathogen avoidance discussed in MacDorman and Ishiguro 2006). However, selfmay be understood another way: as the person a human body constructs from the
social environment, with a biography and a narrative to justify both its words and
deeds (MacDorman and Cowley 2006; Ross and Dumouchel 2004). To enjoy status
and esteem, persons are motivated to live up to the standards of their culture
(Cowley and MacDorman 2006), and their worldview and sense of identity reflect
that purpose.
Solomon et al. (1998) have argued that, by living up to cultural standards, we
make our lives meaningful. Our cultural worldview explains our place in the
universe and, in some religious contexts, offers us an afterlife. For these researchers
self-preservation is about defending not just the body but the worldview that gives
our lives meaning in the face of physical mortality—defending that worldview
against those who would transgress it. So the question remains, ‘‘Are our robotic
creations potential transgressors, trammeling our sense of identity and purpose?’’
1 In other words, robots that could pass the Total Turing Test (Harnad 1989).
AI & Soc
123
Ramey (2005) argues that they are. There is something disturbing about things
that cross category boundaries: like the undead of the horror genre. Douglas
(1966) had discussed this in relation to the dietary laws of Leviticus. According to
Douglas, restricted foods do not fit known categories. Eating pork is prohibited,
for example, because pigs unlike other cloven-hoofed animals do not chew their
cud. The category boundary problem is particularly acute for robots, which are
electromechanical, but share some human qualities (MacDorman and Cowley
2006). From the standpoint of human perception, not only do they exist on a
category boundary, but we are one of the categories—and in that sense, they could
be seen as a threat to our personal and human identity. If perfect human replicas
were ever created, how much room would that leave for our sense of human
specialness? How would our ‘‘hoped for’’ immortality stand up against their real
ability to outlive us?
1.2 The roots of East–West differences
The cognitive dissonance caused by objects that lie on category boundaries may not
be universal. For example, although some cultures push intersex individuals to
choose a male or female gender, other cultures afford room for a third gender (e.g.,
two-spirit people among the Native Americans). Although common category
membership produced the strongest object association in US children and adults,
Chinese children and adults were most sensitive to contextual and functional
relations between objects (Ji et al. 2000). This was attributed to a difference in
cognitive style: The West may sanction an analytic cognitive style, whereas a
cognitive style involving many relative comparisons may be more prevalent in Asia.
So cultural factors may influence the perception of an entity lying on a category
boundary.
The roots of these factors are to be found in the historical development of East
Asian and European cultures. Greek philosophy saw a separation of human and
nonhuman phenomena into ethics and nature; Socrates considered sense experience
(phenomena) to be a pale shadow of the true forms of objects (noumena, Plato 360
BCE/1888; Woelfel 1987). While Western philosophy sought absolute truth in
perfect, unchanging knowledge (universal laws), Eastern philosophy took a holistic
view on a universe seen as being in constant flux. The Western distinction between
the whole and its parts was less pronounced. Indeed, the whole and its parts were
seen as inseparable: ‘‘each ‘one’ defines the other, and indeed is the other’’ (Kincaid
1987, p. 332). However, given the rapid modernization of Asia, the spread of
Western-style education, and the globalization of information, there is a risk of
overemphasizing these differences.
Nevertheless, many of the dualisms that are ingrained in Western thinking, such
as the mind–body dualism, do not exist or are less pronounced in South and East
Asian cultures.2 For example, Buddhism broke from its Hindu roots by introducing
the concept of anatman (from Sanskrit, meaning no soul). As all things arise owing
2 Ironically, Western philosophy has progressively backed away from substance dualism (MacDorman
2004).
AI & Soc
123
to causes and conditions, they are considered devoid of selfhood or intrinsic nature.3
Life’s purpose is to see through conditioned existence by obtaining enlightenment.
Mori (1982) even proposes that, just like people, robots could pull their workings
into alignment to realize their Buddha-nature. Shinto, the original religion of Japan,
derives from animism: the belief that spirits can inhabit objects. This affords a
different sort of relationship, not only with nature, but with human creations like
robots. If a stone or tree can have a spirit, why not a robot? Although few present-
day Japanese believe in the literal truth of Shinto or Buddhism, they were part of the
cultural background during Japan’s modernization. Their philosophical elements
have held an enduring influence on attitudes toward technology over the years.
In examining Western and Japanese differences, Yamamoto (1983) contrasts the
creation story of Genesis with the neo-Confucian teachings of Zhu Xi (1130–1200).
Zhu Xi mixes Confucian and Taoist elements with traditional Chinese beliefs.
Crucially, there is no God and no mind/matter distinction in neo-Confucianism. Xi’s
(1967) neo-Confucian views on the oneness of reality, which were especially popular
among the samurai class during the Edo period (1603–1868), were seen as broadly
compatible with the materialistic views of the architects of Japan’s modernization
during the Meiji era (1868–1912, e.g., Hiroyuki Kato’s biological materialism,
discussed in Davis 1996; Yamamoto 1983). Thus arose a kind of scientism in Japan,
or heroic view of science and technology that developed without resistance from
Shinto or Buddhism. This differs from the relationship between science and religion
in the West, where frequent conflicts arise between scientists and believers on topics
ranging from the origin of life to the ethics of stem-cell research.
For a devout Jew, Christian, or Moslem, what is the significance a humanlike
robot? All of these religions have prohibitions against idolatry and the usurpation of
God’s role: ‘‘You shall not make for yourself an idol in the form of anything in
heaven above or on the earth beneath or in the waters below’’ (Exodus 20:4 New
International Version; cf. The Spider 29:25 Koran). Islam bans all icons from
mosques, just as the Puritans banned icons from their churches. The Amish do not
take photographs. The Taliban went as far as destroying any art that depicted a
human form. The Bible states, ‘‘God created man in his own image’’ (Genesis 1:27).
Thus, to build machines in man’s image, that is, with human qualities, would be to
usurp God’s role. An Arab journalist once described the creation of robots as a
‘‘God-crushing act’’ (Yamamoto 1983). This view contrasts with the sentiment
expressed in 1928 by Makoto Nishimura, a Japanese robotics pioneer, ‘‘If one
considers humans as the children of nature, artificial humans created by the hand of
man are thus nature’s grandchildren’’ (cited in Hornyak 2006, p. 38). These
examples indicate differences in how East Asian and other cultures confront
ambiguities in general and humanlike machines in particular.
Perhaps the most concise way to illustrate these differences is to consider what
Mazlish (1993) identifies as the four discontinuities: the Earth-centric view of the
universe; the creation myth of Genesis; Descartes view of the mind as rational and
controllable; and the notion that different principles govern the mental and
3 Nevertheless, Buddhism does make a distinction between sentient and nonsentient beings, and prohibits
the slaughter of sentient beings.
AI & Soc
123

mechanical. For those coming from a Judeo-Christian worldview, the four
discontinuities have historically buttressed humankind’s sense of self-impor-
tance—and not only as a species. These assumptions have influenced how each
individual’s sense of self is socially constructed. They ennoble us as human beings
and emphasize our uniqueness. Mazlish cites four events in the progress of science
and technology that have demolished the four discontinuities: the Copernican
Revolution; Darwin’s theory of natural selection; Freud’s work on the unconscious;
and the advent of intelligent machines. In the West, these have been ego shattering
events, undermining our self-image and personal and human identity (Cooley 2007).
If an electromechanical copy of a human being were ever created, this might be the
most ego shattering event of all.
However, what is fascinating about Japan is the historical absence of any of these
four discontinuities. In Buddhist or neo-Confucian cosmology, for example, we
reside in but one of myriads of multimillions of galaxies; no single act resulted in
the creation of humankind; the mind is as restless and uncontrollable as a wild
monkey; and there is no mind/matter—or mind/machine—distinction. For these
reasons, the existence of an android double would not threaten a Japanese sense of
self the way it would threaten a Judeo-Christian sense of self.
1.3 Attitudes toward robots in Japan
People around the world have different levels of exposure to robots because of their
personal experiences and what is covered in the media. The structure of a country’s
economy, its technological development, national funding priorities, and the
historical and religious context affect the social and cultural significance of robots,
and these factors in turn shape individual attitudes.
In the West the idea of using machines for rote work to free people to engage in
creative pursuits may be traced at least to Blaise Pascal’s invention of an adding
machine in 1642 (Singer et al. 1954). However, fictionalized accounts of robots
have been used to express ambivalence about technological progress, industriali-
zation, and the social dislocations caused by them. Since Capek (1921/2004) first
coined the term robot (from Czech robata, meaning serf labor, drudgery) in the
1921 science fiction play R.U.R., robots have frequently been depicted in a negative
light. The scenario in Capek’s play of robots bent on revolt or world domination has
been echoed in countless films and novels, such as the Hollywood blockbusters
Blade Runner, Terminator, and I, Robot. The robots running amok in these stories
symbolize the gap between human aspirations and the achievable reality. The stories
reveal what happens to society when human motives are allowed to play out without
the constraints of nature and morals. Even films presenting robots as heroes, such as
Short Circuit and Bicentennial Man, hold up a mirror not so much to the technology
as its creator. The very desire to create technology in our own image can reflect
human narcissism and hubris (Cooley 2007), which has often been critiqued in the
science fiction and horror genres.
Robots have had their greatest impact in Japan, where cultural perspectives on
robots have developed rather differently from perspectives in the West. From Japan’s
early Edo period, the elaborate performances of clockwork karakuri puppets have
AI & Soc
123

left audiences awestruck, and this tradition of craftsmanship and artistry has
continued to animate human-looking machines for the past 400 years (Hornyak
2006; Schodt 1988). Karakuri automata, for example, served tea, plucked and shot
arrows, and drew Chinese characters with brush and ink—all without human control.
Perhaps the most famous hero of Japanese manga (comics) is not human but the
fictional robot Astro Boy, serialized by Osamu Tezuka from 1951 to 1981 and also
adapted to film and television. Designed by Dr. Tenma to replace his son—and then
rejected by him—Astro Boy represents a convergence of human and machine in his
form, values, and sense of aesthetics. The robot could experience human emotions,
and through the guidance of a second mentor, Professor Ochanomizu, came to fight
crime, injustice, and evil. In 1956 Ironman appeared in manga as the remote-
controlled, crime-fighting robot of the boy detective Shotaro Kaneda. Another
action hero, Amuro Ray, pilots Gundam, his giant robotic suit of armor. A similar
man–machine symbiosis earlier appeared in the Go Nagai series, Mazinger Z. These
and other examples suggest that mass-audience fictional portrayals of robots in
Japan have generally been positive. But even so, in showing men’s desire to
dominate their sentient creations, these stories express ambivalence concerning
whether human beings and machines can find an ethical symbiosis, or whether the
compassion and judgment of the machine’s creator will be reduced to a
‘‘mechanical’’ calculation of personal or human benefit (Cooley 2007).
Beyond popular culture, robots—and especially industrial robots—play an
important role in the Japanese economy. Japan’s postwar economic growth has been
fueled by exports in the automotive and electronics industries, which enjoyed
efficiency gains in part through increased automation. During the 1970s and 1980s,
Japan maintained its manufacturing sector while most other developed economies
were shifting to services (Castells 2000). By 2000 Japan had ten times as many
industrial robots per capita as the United States.4 Automation has never been seen as
a threat to jobs in Japan, because companies employing robots would retrain
workers for other jobs rather than dismiss them as is more common in the US (Lynn
2002; Hornyak 2006).
In addition, Japan has promoted new applications for robots that support human
interaction. Japanese companies have pioneered entertainment, pet companion, and
humanoid robots, such as Sony’s robot dog Aibo and humanoid Qrio, Honda’s
Asimo, and AIST’s therapeutic robot seal Paro. Social robots frequently appear at
public events, expositions and conventions, and on television. Robots have even
been an integral part of the Japanese government’s plans for addressing the
country’s demographic crisis: the combination of an aging population and low
birthrate (Barry 2005).
It is useful to approach a topic as complex as US–Japanese attitudes toward robots
from different angles, collecting information about what people do, their reported
attitudes, and perhaps attitudes they would prefer not to report. Such an approach
provides method triangulation. This study uses implicit measures, based on the
implicit associate test, and explicit measures, based on the self-reported results of
questionnaires, to determine whether cultural differences exist among faculty
4 The Economist, December 1, 2001, p. 96.
AI & Soc
123
members at a Japanese and US university. Specifically, it uses explicit and implicit
measures to compare attitudes toward robots in relation to human beings along two
dimensions: pleasant–unpleasant and safe–threatening. It is hoped that the results
might shed light on cultural differences between Japan and the United States.
2 Background
2.1 Cross-cultural research on attitudes toward robots
Few cross-cultural surveys have examined how people make judgments about robots.
Shibata et al. (2004) studied humans’ subjective evaluations of Paro in Italy, Japan,
Korea, Sweden, and the UK. Their results found differences according to gender,
age, and nationality. British and Italian participants were concerned about the
necessity of Paro; Italian and Swedish participants focused on its animal-like
qualities; and Japanese participants noted its visual and tactile impression. Another
study on social interaction with the communication robot Robovie-II and Robovie-Msuggested that in Japan, younger generations do not necessarily prefer robots to older
generations (Nomura et al. 2007). However, the study was conducted at a robotics
exhibition. This kind of event is likely to attract robot enthusiasts of all ages.
While these studies focused on specific robots, other studies examined attitudes
toward robots in general. Nomura et al. (2006) developed the negative attitude
toward robots scale (NARS), which was used in a study with Chinese, Dutch, and
Japanese participants (Bartneck et al. 2005). The questionnaire consisted of three
parts: attitude toward the interaction with robots; attitude toward the social influence
of robots; and attitude related to emotions felt during interaction with robots.
The study found that only nationality had a significant influence on the social
dimension and that Japanese participants rated social influence significantly higher
than Chinese and Dutch participants. Gender and other participant variables did not
have any significant effect. In a follow-up study, Mexican, German, and US
participants were included with Chinese, Dutch, and Japanese participants, and the
same questionnaire was used (Bartneck et al. 2007). The results indicate that
participants from the USA were the most positive about interactions with robots,
and participants from Mexico were the most negative. The results for Japan were
unexpected:
In contrast to the popular belief that the Japanese love robots, our results
indicate that the Japanese are concerned about the impact robots might have
on society and that they are particularly concerned about the emotional aspects
of interacting with robots. A possible explanation could relate to their higher
exposure to robots in real life, and particularly through the Japanese media.
The Japanese could be more aware of robots’ abilities and also their
shortcomings. (Bartneck et al. 2007, p. 225)
One limitation of the above studies is that participants were recruited from
among groups with special interests, such as members of online robot forums. This
makes it difficult to generalize about the broader cultures.
AI & Soc
123

2.2 Explicit and implicit measures
Given the complex historical and philosophical differences between Japan and the
West, an important issue concerns how to measure culturally rooted attitudes toward
robots. Previous cross-cultural studies have relied on questionnaires. These explicitmeasures simply ask people their opinions. Questionnaires usually provide a fixed
number of responses and may collect the results into an index or scale.
Unfortunately, these kinds of explicit measures are susceptible to two kinds of
bias. First, participants may not be aware of attitudes affecting their behavior. When
people are unsure of their attitudes or do not understand the reasons behind them,
they may fall back on whatever explanation happens to be popular (i.e., a shared
report). Japanese, for example, see themselves collectively as a robot-friendly culture
(Hornyak 2006). But being on the front lines of robot adoption, individual Japanese
may feel anxiety and misgivings about robots, say, when it is their grandmother
being turned over by a robot in her hospital bed. Second, participants may be aware
of the attitudes affecting their behavior but choose to conceal them. People of all
cultures are incentivized to align to the feelings of others, and that tendency is strong
in Japan. When this results in a desire to conform, it can lead to a self-presentational
bias: how participants choose to present themselves to others (or to themselves) may
not accurately reflect their attitudes and dispositions owing to concerns about social
desirability (Greenwald et al. 1998; Ashburn-Nardo et al. 2003).
Past interviews with Japanese researchers raised concerns about both kinds of
bias. For example, several robotics professors and students asserted that they began
to study robotics because robots heroes in manga sparked their interest in childhood;
however, other researchers were skeptical of such claims. Japanese researchers
commonly mentioned Shinto animism as a reason for Japan’s acceptance of robots,
but nobody admitted to believing in animism personally. On the contrary, their
metaphysical position on the possibility of robot consciousness seemed closer to the
functionalism of Putnam (1967) or Dennett (1991). It would be exciting to measure
people’s positive or negative associations with robots, setting aside how participants
think they should answer, because these explanations often do not ring true.
One method to overcome self-presentational bias is to measure a participant’s
underlying automatic evaluation by means of an implicit measure. Implicit
measures are measurement outcomes that may indicate a purported construct by
means of processes that are uncontrolled, unintentional, unconscious, efficient,
effortless, fast, goal-independent, autonomous, or driven solely by the stimulus (De
Houwer and Moors 2007). Implicit measures may differ from explicit measures,
such as the self-reported attitudes and preferences collected from a questionnaire.
Examples of implicit measures include the implicit association test (Greenwald
et al. 1998), go/no-go association task (GNAT, Nosek and Banaji 2001), and
cognitive priming procedures (Bargh et al. 1992).
Recently, certain interpretations of implicit measures have been seriously
criticized because of claims made by early authors—for example, that the IAT
measures implicit attitudes stored in memory. There is nothing about the procedures
of implicit measures that ensures participants are not aware of their attitudes or that
the response is ‘‘accessed’’ rather than constructed (Fazio and Olson 2003). Nor is it
AI & Soc
123
safe to assume that implicit measures are a better indicator of what a person ‘‘really
believes.’’ Beliefs and associations are not the same. Associations are related to
personal history and often differ from personal preferences (Houben and Wiers
2007). Thus, implicit measures may be influenced by associations that are
‘‘extrapersonal’’—picked up from the culture but not necessarily aligned with
one’s personal beliefs, preferences, and attitudes (Karpinski and Hilton 2001; Olson
and Fazio 2004). In interpreting implicit measures, it is important to understand that
they are just one more source of evidence.
2.3 The implicit association test and its new scoring algorithm
The IAT measures automatic evaluative associations (Greenwald et al. 1998; Banaji
2001), namely, the differential associations of two target concepts (e.g., robot and
human) along an attribute dimension (e.g., safe–threatening) based on response
latencies during a combined categorization task. ‘‘IAT responses are considered
automatic because they are expressed without intention or control’’ (Dasgupta et al.
2000, p. 317). Indeed, the participant is unlikely to be aware of the causal processes
responsible for the evaluation (Greenwald and Banaji 1995). Performance is faster if
a more strongly associated attribute-concept pair shares the same response key than
if a less strongly associated attribute-concept pair shares the same response key. For
example, if we gave someone the task of pressing E when a robot or weapon
appeared and pressing I when a human or nonweapon appeared, we might expect
faster performance if the person associated robots and weapons more strongly than
humans and weapons.
The IAT consists of five blocks of categorization tasks. In the first block, the task
is to discriminate among a set of items according to their target concept membership
(e.g., either robot or human). In the second block, the task is to discriminate among a
different set of items according to their value on an attribute dimension (e.g., either
pleasant or unpleasant). In the third block, the tasks of the first and second block are
interspersed. (The order is shuffled.) The fourth block is the same as the first block
except the response keys for the target concepts are reversed. In the fifth block, the
tasks of the second and fourth blocks are interspersed. The third and fifth blocks are
used in scoring. The basic assumption behind the design of the IAT is that the
participant should be able to perform either the third block or the fifth block faster
depending on how the target concepts and attribute dimension are differentially
associated.
To test this method, Greenwald et al. (1998) presented on a computer screen
names of flowers, names of insects, pleasant words, and unpleasant words.
Participants were asked to categorize these words by pressing one of two keys. It
can be assumed on a priori grounds that the target concept flower and pleasant are
automatically associated as are the target concept insect and unpleasant. Therefore,
responses should be faster when flower and positive are both assigned to one key
and insect and negative are both assigned to another key, because the assignments
are compatible with existing associations. Furthermore, responses should be slower
for the reverse. The results clearly confirmed that the reaction times were faster with
compatible assignments.
AI & Soc
123
Experiments were conducted to assess the usefulness and efficiency of the IAT in
measuring automatic evaluative associations (Greenwald et al. 1998). Explicit self-
report measures of attitude were compared with IAT measures. Researchers found
that the IAT is more resistant to self-presentational bias than explicit measures.
When researchers introduced a sensitive domain of social attitudes (e.g., racial bias),
the effect size of explicit measure dropped very low even though the IAT measure
was high. The purported ability of the IAT to overcome self-presentational bias
partly accounts for its popularity in social psychology research (e.g., Ashburn-
Nardo et al. 2003).
Further studies were conducted to examine the relations between the IAT and
explicit self-report measures. In the Greenwald et al. (1998) study, the correlations
between the IAT and explicit measures ranged from 0.04 to 0.64 with only two out
of the 16 values being significant. Karpinski and Hilton (2001) suggested that social
desirability concerns in reporting attitudes toward racial or ethnic groups are the
reason for the lack of significance. These studies indicated that for sensitive topics
self-reports and the IAT were independent. This result was replicated in two
independent samples and in subsequent studies.
Greenwald et al. (2003) collected large data sets from demonstration IATs posted
on the Internet. These data sets were used to evaluate alternative scoring procedures.
It was found that the data from practice trials, which were thrown out in the
conventional algorithm, actually provided a better IAT measure. It was also found
that including error latencies improved the IAT measure. In the next study,
Greenwald et al. (2003) determined that among all the six available latency
transformations, the D measure performed best. His team also proposed to improve
the D measure by including error latencies. Based on the findings of their study,
Greenwald et al. (2003) developed a new scoring algorithm for the IAT that
should generally (a) better reflect underlying association strengths, (b) more
powerfully assess relations between association strengths and other variables of
interest, (c) provide increased power to observe the experimental manipula-
tions on association strengths, and (d) better reveal individual differences that
are due to association strengths rather than other variables. (p. 215)
This study uses the new IAT scoring algorithm.
2.4 Hypotheses
The following hypotheses are meant to compare attitudes toward robots and
familiarity with them in Japan and the US using implicit and explicit measures. They
follow the trend of stereotypes promulgated by the Western news media, which
identifies Japan with an enthusiasm for robots bordering on the irrational (e.g.,
Schodt 1988). These stereotypes perhaps reveal more about the misperceptions of
Western journalists than about Japan. Although the Japanese have demonstrated the
greatest willingness to imagine and work toward a future populated by friendly,
useful robots, they are also the most aware of the limitations of current robotic
technology. Thus, rather than labeling as irrational the current direction of Japan,
AI & Soc
123
other countries may benefit by understanding the reasons behind it. A Japanese and
US faculty were compared, because student lists are confidential in Japan.
H1. The Japanese faculty have more robot-related experiences than the US
faculty.
H2. The Japanese faculty report a stronger preference for robots and warmer
feelings toward robots than the US faculty.
H3. The US faculty rate robots as more threatening than the Japanese faculty.
H4. Implicit measures indicate the Japanese faculty more strongly associate
robots with pleasant words than the US faculty.
H5. Implicit measures indicate the US faculty more strongly associate robots with
weapons than the Japanese faculty.
3 Method
3.1 Participants
A total of 731 participants completed at least one of the two IATs or the
questionnaire on attitude toward robots, and 74.8% of those completed all three.
Participants were recruited by email from a random sample of faculty members at
Indiana University, USA (Bloomington and Indianapolis campuses) and Osaka
University, Japan (Suita and Toyonaka campuses). A follow-up email was sent to
those who had not responded.
There were 479 US participants and 237 Japanese participants. In the US group,
gender was almost equally distributed (52.1% male). In the Japanese group, 95.2%
of participants were male. The average age among the participants was 43.9, and the
average years of education was 20.5.
3.2 Materials
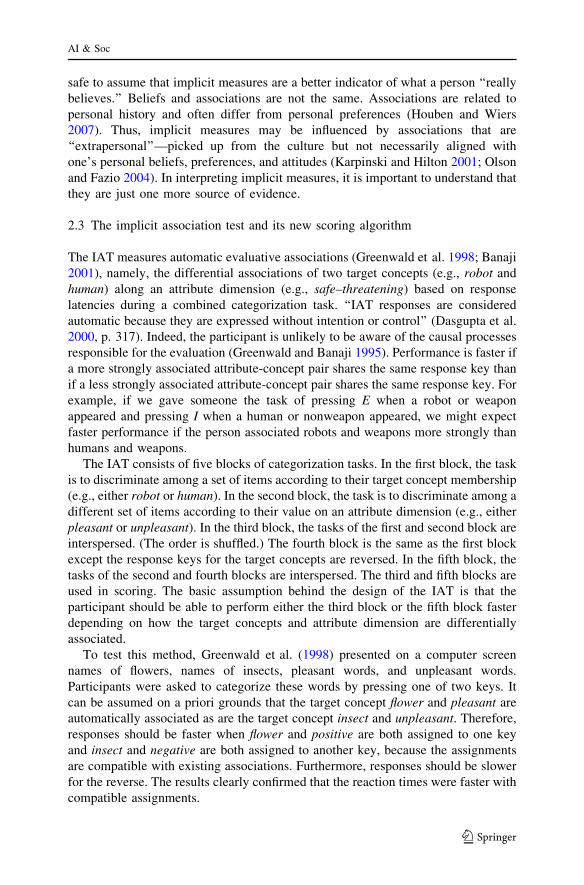
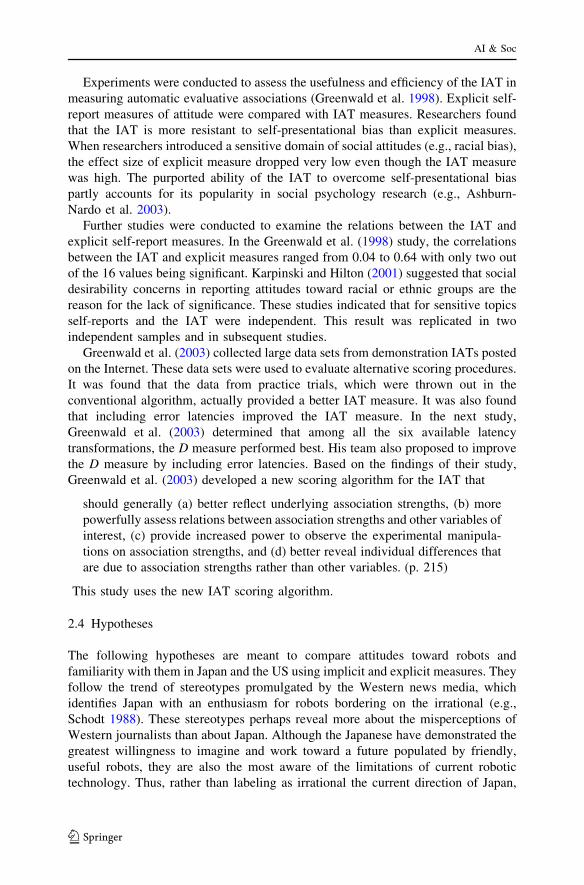
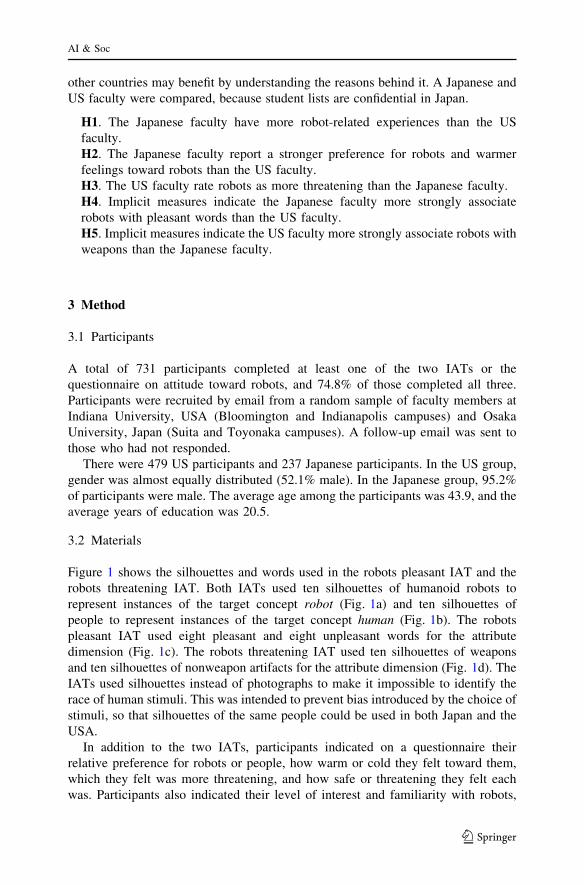
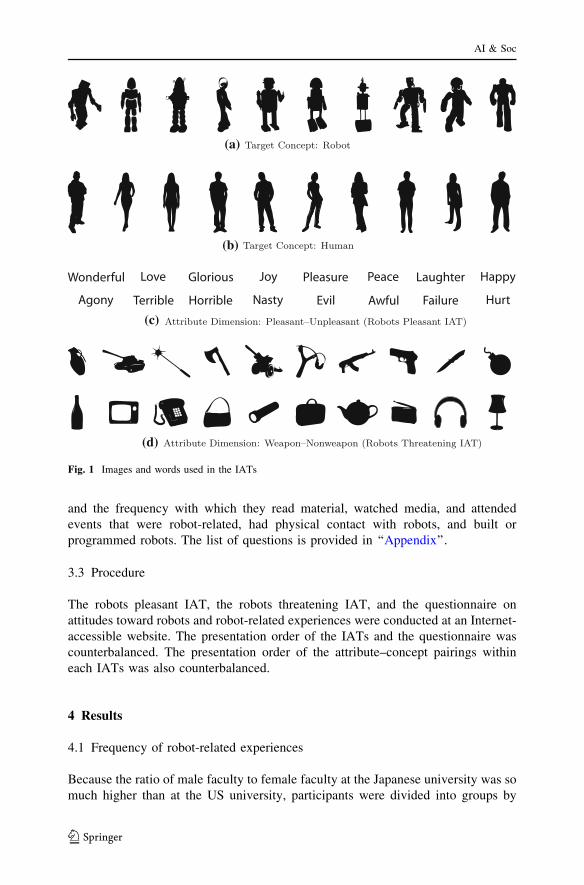
Figure 1 shows the silhouettes and words used in the robots pleasant IAT and the
robots threatening IAT. Both IATs used ten silhouettes of humanoid robots to
represent instances of the target concept robot (Fig. 1a) and ten silhouettes of
people to represent instances of the target concept human (Fig. 1b). The robots
pleasant IAT used eight pleasant and eight unpleasant words for the attribute
dimension (Fig. 1c). The robots threatening IAT used ten silhouettes of weapons
and ten silhouettes of nonweapon artifacts for the attribute dimension (Fig. 1d). The
IATs used silhouettes instead of photographs to make it impossible to identify the
race of human stimuli. This was intended to prevent bias introduced by the choice of
stimuli, so that silhouettes of the same people could be used in both Japan and the
USA.
In addition to the two IATs, participants indicated on a questionnaire their
relative preference for robots or people, how warm or cold they felt toward them,
which they felt was more threatening, and how safe or threatening they felt each
was. Participants also indicated their level of interest and familiarity with robots,
AI & Soc
123
and the frequency with which they read material, watched media, and attended
events that were robot-related, had physical contact with robots, and built or
programmed robots. The list of questions is provided in ‘‘Appendix’’.
3.3 Procedure
The robots pleasant IAT, the robots threatening IAT, and the questionnaire on
attitudes toward robots and robot-related experiences were conducted at an Internet-
accessible website. The presentation order of the IATs and the questionnaire was
counterbalanced. The presentation order of the attribute–concept pairings within
each IATs was also counterbalanced.
4 Results
4.1 Frequency of robot-related experiences
Because the ratio of male faculty to female faculty at the Japanese university was so
much higher than at the US university, participants were divided into groups by
(a)
(b)
(c)
(d)
Fig. 1 Images and words used in the IATs
AI & Soc
123
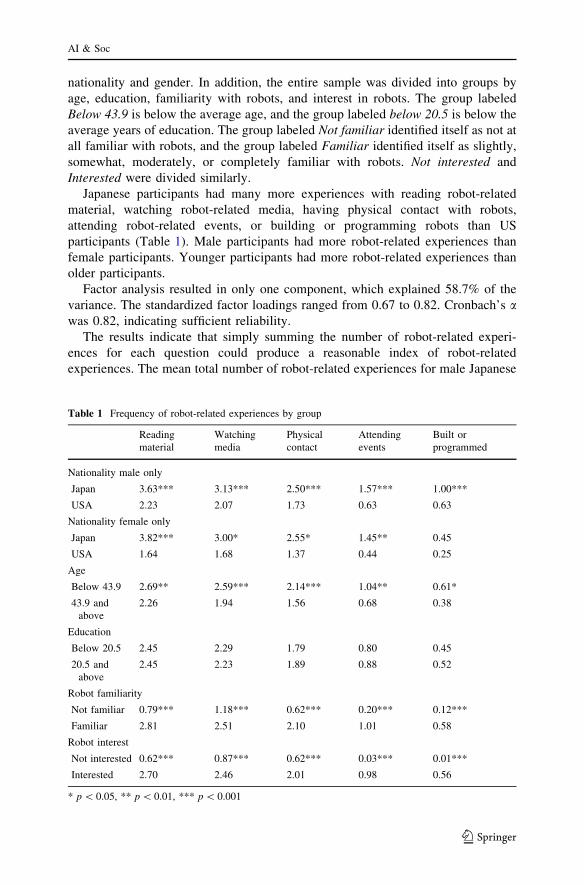
nationality and gender. In addition, the entire sample was divided into groups by
age, education, familiarity with robots, and interest in robots. The group labeled
Below 43.9 is below the average age, and the group labeled below 20.5 is below the
average years of education. The group labeled Not familiar identified itself as not at
all familiar with robots, and the group labeled Familiar identified itself as slightly,
somewhat, moderately, or completely familiar with robots. Not interested and
Interested were divided similarly.
Japanese participants had many more experiences with reading robot-related
material, watching robot-related media, having physical contact with robots,
attending robot-related events, or building or programming robots than US
participants (Table 1). Male participants had more robot-related experiences than
female participants. Younger participants had more robot-related experiences than
older participants.
Factor analysis resulted in only one component, which explained 58.7% of the
variance. The standardized factor loadings ranged from 0.67 to 0.82. Cronbach’s awas 0.82, indicating sufficient reliability.
The results indicate that simply summing the number of robot-related experi-
ences for each question could produce a reasonable index of robot-related
experiences. The mean total number of robot-related experiences for male Japanese
Table 1 Frequency of robot-related experiences by group
Reading
material
Watching
media
Physical
contact
Attending
events
Built or
programmed
Nationality male only
Japan 3.63*** 3.13*** 2.50*** 1.57*** 1.00***
USA 2.23 2.07 1.73 0.63 0.63
Nationality female only
Japan 3.82*** 3.00* 2.55* 1.45** 0.45
USA 1.64 1.68 1.37 0.44 0.25
Age
Below 43.9 2.69** 2.59*** 2.14*** 1.04** 0.61*
43.9 and
above
2.26 1.94 1.56 0.68 0.38
Education
Below 20.5 2.45 2.29 1.79 0.80 0.45
20.5 and
above
2.45 2.23 1.89 0.88 0.52
Robot familiarity
Not familiar 0.79*** 1.18*** 0.62*** 0.20*** 0.12***
Familiar 2.81 2.51 2.10 1.01 0.58
Robot interest
Not interested 0.62*** 0.87*** 0.62*** 0.03*** 0.01***
Interested 2.70 2.46 2.01 0.98 0.56
* p \ 0.05, ** p \ 0.01, *** p \ 0.001
AI & Soc
123

participants was 11.8 versus 7.0 for male US participants and 11.3 for female
Japanese participants versus 5.4 for female US participants. The index showed
highly significant differences in all groups (p = 0.000) except years of education.
The robots experiences index is employed later in the correlation analysis.
4.2 Self-reported attitudes toward robots
Table 2 shows the mean preference and warmth ratings by group. Although both
Japanese and US participants preferred people to robots, US participants preferred
people more than Japanese participants [F(458) = 16.19, p = 0.000, r = 0.79].
Older participants preferred people more than younger participants
[F(705) = 11.54, p = 0.001, r = 0.40], and the preference for people increased
for those more familiar with robots or more interested in them [F(725) = 9.90,
p = 0.002, r = 0.34]. Japanese participants felt somewhat warmer toward robots
than US participants [F(457) = 9.13, p = 0.003, r = 0.39]. Participants who were
not familiar with robots or not interested in them felt a bit warmer toward robots
than those who were more familiar with them or more interested in them
[F(724) = 33.83, p = 0.000, r = 0.78 and F(724) = 29.51, p = 0.000, r = 0.74,
respectively]. There was no significant difference in warm feelings toward people
by nationality, age, years of education, or familiarity.
Table 2 Mean self-reported Prefer Robots and Warm ratings by group
Prefer robots Robots warm People warm
Nationality male only
Japan -1.76*** 0.94** 1.22
USA -2.23 0.42 1.23
Nationality female only
Japan -1.00*** 1.00 2.18
USA -2.41 0.60 1.12
Age
Below 43.9 -1.97** 0.65 1.31
43.9 and above -2.28 0.64 1.09
Education
Below 20.5 -2.18 0.65 1.04
20.5 and above -2.09 0.61 1.35
Robot familiarity
Not familiar -2.42** 1.53*** 1.13
Familiar -2.04 0.45 1.23
Robot interest
Not interested -2.45** 1.71*** 0.44*
Interested -2.06 0.50 1.31
* p \ 0.05, ** p \ 0.01, *** p \ 0.001
AI & Soc
123

Table 3 shows the mean relative threatening ratings and safe ratings for robots
and people by group. On average US participants and especially Japanese
participants felt people were somewhat more threatening than robots [e.g.,
F(458) = 8.77, p = 0.003, r = 0.38 for males]. US participants also rated robots
as being a bit unsafe [e.g., F(457) = 8.79, p = 0.003, r = 0.38 for males], while
Japanese participants were neutral [F(457) = 8.79, p = 0.003, r = 0.38].
It is typical of IAT studies that the relative preference scale and warm/cold
thermometer scale are combined (e.g., Greenwald et al. 2003). However, the
Cronbach’s a for the three variables prefer robots, robots warm, and people warmafter z-score conversion was only 0.04, and the Cronbach’s a for robots morethreatening, robot safe, and people safe was -0.88. For US participants only, the
values were 0.16 and -1.08, respectively; and for Japanese participants only, 0.10
and -1.06, respectively. Other combinations were attempted, but they all showed
low reliability. Many researchers will not use an index that has a Cronbach’s a below
0.70. Factor analysis confirmed that each of the two groups of variables would not
load on a single factor. The first factor explained very little of the variance.
4.3 Implicit measures of attitudes toward robots
In the robots pleasant IAT, the average D measure was -0.41 with an effect size of
0.22. This D measure indicates that participants had more pleasant associations with
humans than with robots. There was no significant difference in the D measure by
Table 3 Mean self-reported Robots More Threatening and Safe ratings by group
Robots
more threatening
Robots safe People safe
Nationality male only
Japan -0.43** 0.02** 0.38
USA -0.86 -0.51 0.21
Nationality female only
Japan -0.36 -0.36 -0.27
USA -0.41 -0.29 0.34
Age
Below 43.9 -0.57 -0.33 0.11*
43.9 and above -0.57 -0.19 0.48
Education
Below 20.5 -0.46 -0.04* 0.29
20.5 and above -0.69 -0.52 0.29
Robot familiarity
Not familiar -0.43 0.01 0.08
Familiar -0.59 -0.32 0.32
Robot interest
Not interested -0.41 0.12 0.14
Interested -0.58 -0.31 0.30
* p \ 0.05, ** p \ 0.01, *** p \ 0.001
AI & Soc
123

nationality, gender, age, educational level, or robot familiarity or interest (Table 4).
The differences that appeared in the self-report did not appear in the IAT.
In the robots threatening IAT, the average D measure was 0.20 with an effect size
of 0.07. This D measure shows that overall participants felt somewhat threatened by
robots. However, the D measure showed significant differences by age and
nationality (Table 4). US participants associated robots with weapons to a greater
extent than Japanese participants, and older participants associated robots with
weapons to a greater extent than younger participants. Although participants
reported that people were more threatening than robots, the D measure shows that
they more strongly associated robots and weapons than people and weapons. These
gaps were more pronounced for US participants than for Japanese participants
[F(404) = 4.47, p = 0.035, r = 0.22]. The D measure shows that older people
more strongly associate robots with weapons than younger people [F(625) = 19.20,
p = 0.000, r = 0.61].
4.4 Correlations among self-reported and implicit measures
The number of robot-related experiences and self-reported ‘‘I prefer robots to
people’’ (Prefer Robots) were correlated for both Japanese (r = 0.15, p = 0.027,
two-tailed) and US (r = 0.13, p = 0.003, two-tailed) participants. The number of
Table 4 Mean self-reported and implicit measures by group
Prefer robots Robots more threatening
Self-report IAT D Self-report IAT D
Nationality male only
Japan -1.76*** -0.40 -0.43** 0.15*
USA -2.23 -0.40 -0.86 0.23
Nationality female only
Japan -1.00*** -0.31 -0.36 0.02D
USA -2.41 -0.42 -0.41 0.21
Age
Below 43.9 -1.97** -0.41 -0.57 0.14***
43.9 and above -2.28 -0.40 -0.57 0.26
Education
Below 20.5 -2.18 -0.39 -0.46 0.19
20.5 and above -2.09 -0.42 -0.69 0.21
Robot familiarity
Not familiar -2.42** -0.42 -0.43 0.25
Familiar -2.04 -0.41 -0.59 0.19
Robot interest
Not interested -2.45** -0.41 -0.41 0.23
Interested -2.06 -0.41 -0.58 0.20
D p \ 0.1, * p \ 0.05, ** p \ 0.01, *** p \ 0.001
AI & Soc
123
robot-related experiences and differential association between robots and weapons
(Robots More Threatening IAT D) were negatively correlated for Japanese
participants (r = -0.14, p = 0.042, two-tailed). The Robots More ThreateningIAT D and Prefer Robots self-report were negatively correlated for Japanese
participants (r = -0.22, p = 0.001, two-tailed). The number of robot-related
experiences and the self-report ‘‘Robots are more threatening than people’’ were
negatively correlated (r = -0.19, p = 0.000, two-tailed) for US participants. The
Robots More Threatening self-report was also negatively correlated with the PreferRobots self-report for US participants.
5 Discussion
5.1 The hypotheses revisited
H1 predicts the Japanese faculty have more robot-related experiences than the US
faculty. On average female faculty members of the Japanese university had 110%
more robot-related experiences than female faculty members of the US university
(Table 1). Male faculty members of the Japanese university had 69% more robot-
related experiences. The heightened prevalence of robot-related experiences at the
Japanese university was consistent across all five questions. This supports H1.
Although the Global Gender Gap Report 2007 ranks Japan as having greater
gender inequality than the US,5 and only 4.5% of the participants from the Japanese
university were female, among the Japanese faculty, there was not much of a gender
gap concerning robot experiences except with respect to building and programming
robots. However, there was a consistent gender gap among US participants: male
participants had on average 30% more robot-related experiences overall and 152%
more experiences with building or programming robots than female participants. In
both the US and Japan, younger people had more robot-related experiences.
H2 predicts the Japanese faculty report preferring robots and rate feeling warmer
toward robots than the US faculty. While the self-report results indicate this is true,
on average both Japanese and US participants moderately prefer people to robots
(Table 2). The difference between Japanese and US male participants is only 0.47
on a 7-point relative preference scale and 0.42 on an 11-point warm/cold
thermometer scale. In addition, Japanese felt warmer toward people than toward
robots, though not as warm toward people as their US counterparts. These small
cultural differences hardly indicate Japan is a culture in the throes of ‘‘robot mania.’’
H3 predicts the US faculty rate robots as more threatening than the Japanese
faculty. The results do not support H3. On average both Japanese and US
participants reported that people are more threatening than robots. This opinion was
stronger for US participants. However, on the safe/threatening thermometer scale,
US participants rated robots as slightly dangerous, whereas Japanese participants
rated them as neutral.
5 Sweden ranks first of 128 countries with the narrowest gender gap. The US is listed at 31 compared to
91 for Japan (Hausmann et al. 2007).
AI & Soc
123

Why were people rated as more threatening than robots in the self-report,
especially among US participants? The participants probably understand that robots
are controllable but people are not and, insofar as robots are a threat, it is because of
how people use them (e.g., as weapons). Although one might think the negative
rating for the Robots Safe self-report in the United States might be explained by a
higher prevalence of technophobia, empirical studies do not support that stereotype
(Weil and Rosen 1995).
The view that robots are threatening but people are even more threatening among
US participants may be a result of the higher rate of violent crime in the US and its
frequent coverage in the media. In 2005, the crime rate in the US was five times
higher than Japan for murders, 20 times higher for rapes, 30 times higher for
robberies, and 23 times higher for other acts of violence.6 Japanese police have a
close relationship with the local community. Most neighborhoods have a koban(police box), and officers still walk the beat and make home visits to learn about
people’s lives (Reubenfien 1989). Forced confessions are common, there is no plea
bargaining or jury system (though that is changing), and even guilty pleas must go
to trial. The result is a conviction rate approaching 99.9% (Scanlon 2003). In a
cultural study of Japan’s low crime rate, Komiya (1999) concludes
In Japan, the locality-based group formation causes both a sense of security
and an infinite number of repressive rules; these two elements are bound
together to produce high self-control, which acts as a strong force restraining
people from committing crime. (p. 369)
Thus, even though US participants felt robots were slightly threatening, they could
still feel that people were more threatening than robots.
H4 predicts the Japanese faculty more strongly associate robots with pleasant
words than the US faculty as indicated by the IAT D measure. This hypothesis is not
supported. All groups had about the same association. They uniformly associated
humans more strongly with pleasant words than robots.
H5 predicts the US faculty more strongly associate robots with weapons than the
Japanese faculty as indicated by the IAT D measure. Japanese and US participants
more strongly associated robots with weapons than humans. However, the strength
of this association was stronger for US participants, so H5 is partially supported.
On average why do US participants say people are more threatening than robots
but implicitly associate weapons with robots more than with humans? These results
are surprising given our expectation that the difference between implicit and explicit
measures would be greater for Japanese. US participants might be unaware of their
negative associations with robots, and these negative associations may not represent
their personal opinions. US participants might also be more likely to associate
robots with military applications rather than social applications. While Japanese
companies, research institutes, and universities and their funding agencies have
6 In 2005, Japan’s population was 127,756,000, and there were 1,392 murders, 5,988 robberies, 2,076
rapes, and 25,815 acts of violence (Japan Statistical Yearbook 2008, Chap. 25, Justice and police, p. 773,
Statistics Bureau, Ministry of Internal Affairs and Communications). In 2005, the USA’s population was
296,507,061 and there were 16,740 murders, 417,438 robberies, 94,347 rapes, and 1,390,745 acts of
violence (2006 Crime in the United States. Federal Bureau of Investigation, Department of Justice).
AI & Soc
123

invested heavily in social robotics, in the US more money has poured into defense-
related work. In addition, US participants may have some unconscious fears
concerning robots. The fears could stem from a lack of knowledge about robots or
familiarity with them; however, the results show that robot familiarity had little
effect on the IAT D measure.
More plausible explanations of unconscious fears of robots could include some of
the observations made in the introduction. People may feel ambivalent about robots,
because they constitute a mix of human and machine traits. Before the advent of
modern technologies, if an entity crossed such category boundaries as human/
nonhuman or alive/dead, it would be considered highly disturbing. However, robots
inhabit precisely these category boundaries (Turkle 2007). An additional concern is
that these are not just arbitrary categories. Rather, they are related to our notions of
who we are as human beings—in other words, our personal and human identity
(Ramey 2005). Entities that undermine these kinds of category boundaries could be
seen as particularly threatening, if only unconsciously. This could influence implicit
measures even though rationally participants may think people are more threatening
than robots.
5.2 Lessons learned
The standard method of creating a self-reported preference index by combining
relative preferences and warm/cold thermometer items (Greenwald et al. 2003)
failed for robots. One explanation is that many faculty members, especially in
Japan, may not conceive of robots as social or personified entities with independent
agency (Kahn et al. 2007). Several researchers reported using robots in laboratory
experiments and at first imagining the kinds of programmable mechanisms they use
that are in no way personified. Someone might feel cold toward such robots but
prefer them to people because they are fun to program.
This might also explain why those unfamiliar with robots felt warmer toward
them. When they think about robots, they may be imagining the personified robots
of popular culture. These robots have more humanlike characteristics that elicit
anthropomorphism. Also, because people who lack experience with robots
understand less about their internal workings, they may be more likely to treat
them as social agents than as machines.
From this discussion we might conclude that faculty members may not have one
concept of robot but many: laboratory robot, industrial robot, humanoid robot,
human double, and so on (Nomura et al. Kato 2005). Personal experience and how
the questionnaire and IAT are presented may influence which concepts of robot are
active. One solution might be to give the participant a clear idea of the kind of robot
the questionnaire is asking about. For example, if the questionnaire is about
humanoid robots, a definition of humanoid robot could be provided with short video
clips demonstrating well-known humanoid robots (e.g., Honda’s ASIMO, MIT’s
Cog, KAIST’s Hubo KHR-2). In addition, a validated self-report scale could be
developed specifically for attitudes toward humanoid robots.
It may also be a mistake to use people as a benchmark for judging attitudes
toward robots because of a wide variance in participants’ attitudes toward people in
AI & Soc
123

this study. Alternatives include using a neutral object instead or simply eliminating
the second target concept. This is the approach of the single target IAT (Penke et al.
2006) and go/no-go association task (Nosek and Banaji 2001).
As an implicit measure of association, the IAT does not distinguish associations
rooted in personal preferences from those rooted in extrapersonal information, such
as cultural norms, educational training and material, the news media, or other
people’s opinions (Karpinski and Hilton 2001; Olson and Fazio 2004). Although
this distinction is not essential to this study, because it concerns general attitudes
that are prevalent in Japan and the US, it can be relevant to studies on behavioral
choices. Olson and Fazio (2004) developed a personal IAT to handle these cases.
Houben and Wiers (2007) have successfully applied the personal IAT to the study of
alcohol consumption. While studies based on the IAT showed that heavy drinkers
had negative associations with alcohol, perhaps resulting from the prevalence of
negative attitudes in society, the personal IAT showed that they had positive
associations. In future research the personal IAT could be used to help separate
robot associations that concern personal preferences from those that concern
societal preferences. This might shed light on the differences in implicit and explicit
measures in this study.
5.3 Institutional and economic factors
The self-reported and IAT results reveal some striking similarities between Japan
and the US in attitudes toward robots. One possibility is that faculty members of the
chosen universities are not representative of their cultures as a whole. Another
possibility is that Japan’s robot culture is built on factors other than warm and safe
feelings about robots. These factors include Japan’s historical development,
economic structure, professional specialization, and government planning and
policy. Japan’s manufacturing sector has maintained its strength (Castells 2000) in
part through robotic automation; Japan’s universities graduate a high percentage of
native-born engineers, especially when compared to the US; Japan’s government
has envisioned robots as a possible solution to the demographic crisis; and given
Japan’s unique, tight-knit culture with many social rules and complexities, bringing
in foreign labor has long been considered problematic.
Sara Kiesler has proposed that Japan is experiencing a positive feedback loop in
robotics related to how commitment and expertise function in organizations and
economies.7 Once Japan acquired expertise in robotics, developed robots for factory
automation, and trained a substantial number of robotics engineers, these experts
began to create additional markets for their skills.
In the United States, this pattern is well known in the legal profession as
exemplified by the explosive growth not only in the supply of lawyers during the
past 40 years but also in the demand for their skills. According to Kagan (1994),
lawyers have advocated a progressive expansion of their role in society:
7 Personal communication.
AI & Soc
123
Lawyers, law professors, and judges generate a legal culture that supports
adversarial legalism as an essential aspect of governance. Organized groups of
lawyers systematically lobby courts and legislatures to extend the realm of
adversarial legalism and to block reforms that would reduce it. (p. 60)
In addition, lawyers have helped to foment an explosion in litigation. Elite firms
encourage corporate clients to adopt a ‘‘rent seeking’’ strategy by investing heavily
in lawsuits:
As litigants become more accustomed to launching large legal battles, their
opponents are compelled to follow suit. The big lawyer teams produce
increasingly complex and sophisticated legal strategies, making legal battles
more like a lottery—more dependent on big investments for successful
outcomes. (Sander and Williams 1989, p. 473)
The end result is spiraling demand for lawyers that the profession itself partly
generates. Could robotics engineers be doing the same in Japan?
Despite high initial starting salaries, engineering seldom provides a long-term
career in the US, and there is little job security. US engineers often take
management courses, because management is seen as a good exit strategy from the
profession. This contrasts with Japan where companies ‘‘are unusually effective in
delaying the technological obsolescence of their engineers’’ (Lynn 2002, p. 97).
Japan’s lifetime employment system implies that the largest firms will provide long-
term employment in exchange for employee loyalty. This encourages companies to
invest in the periodic in-house retraining of engineers. Some US engineers argue
that in the US the profession has been hamstrung for years by lawyers, regulators,
and corporate ‘‘bean counters’’ whose main concern is maximizing quarterly profits
(see comments on Engardio 2005). The prevalence of company cross-holdings in
Japan provides a buffer against the immediate concerns of shareholders, enabling
healthier companies to focus on long-term product development.
In addition to Japan’s high retention rates in engineering, the subject is a popular
major. Sixty-four percent of bachelor’s degrees in Japan are in science and
engineering compared with about one-third in the US (National Science Board
2006, pp 2–21). That figure is considerable given that a higher percentage of
Japanese high school students are college bound. In robotics Japan’s success is not
limited to industry. Japanese researchers dominate major robotics conferences, such
as the IEEE International Conference on Robotics and Automation. Patents provide
a means of measuring the intellectual productivity of Japanese engineers: ‘‘Japan-
based organizations lead the U.S. patent-assignee list with 9 of the top 20 slots.’’8
The success of Japanese engineering and automation has helped Japan maintain its
manufacturing base unlike all other G8 countries except Germany. This promotes
continued employment for engineers in Japan.
Since Japan’s economic slump of the 1990s (‘‘the lost decade’’), drawing
economic lessons from Japan has become unfashionable. Nevertheless, the US
preference for importing goods from countries with relatively low labor costs, such
8 IFI Patent Intelligence Issues Annual Rankings of Top U.S. Patent Assignees, PR Newswire, January
11, 2008.
AI & Soc
123

as China, rather than maintaining its manufacturing base may have long-term
consequences. Manufacturers escape stricter occupational safety, workers’ com-
pensation, and pollution regulations in the US. This is of global concern, for
instance, because pollution does not respect national boundaries. While today’s
products from China and elsewhere may be filling US landfills in a few years, China
will own a larger share of the US as it grows toward superpower parity. Is this really
what the US and other democracies want?
Japan has gambled that robots will provide a solution to its demographic crisis by
providing care to the elderly. Delirium, dementia, and depression caused by social
isolation pose a serious threat to the quality of life of older adults. Robots have the
potential to head off or postpone the onset of these conditions by providing
cognitive therapy, alleviating loneliness, and encouraging exercise to reduce obesity
and improve cardiovascular health. Robots have already been employed as social
mediators, rehabilitation coaches, and in monitoring care (Feil-Seifer et al. 2007).
The robot pet Paro, developed at Japan’s National Institute of Advanced Industrial
Science and Technology, has been used in nursing homes in Japan, the United
States, and Europe for companionship and to stimulate social interaction among
patients (Turkle 2007).
The use of eldercare robots in Japan is seen by some planners as preferable to
coping with the social problems that might result from a large influx of foreign
healthcare workers (Barry 2005). As more baby boomers retire, a shortage of
healthcare workers is also of concern to the US and other industrialized nations.
With most of the investment in robots for eldercare coming from Japan, this might
be another segment of the US economy—in addition to automobiles and consumer
electronics—that Japanese companies would dominate.
6 Conclusion
Although the Japanese faculty had many more experiences with robots than the US
faculty, the cross-cultural similarities in attitudes toward robots were more striking
than the differences. Implicit measures showed that both faculties associated
pleasant words more strongly with humans than with robots—and by similar
margins. Although the Japanese faculty reported feeling a bit warmer toward robots
than the US faculty, both faculties reported feeling warmer still toward people. Both
faculties also reported preferring people to robots, though the margin was wider in
the US. So implicit and explicit measures show a preference for people among both
faculties.
Both the Japanese and US faculty rated people as more threatening than robots,
but implicit measures showed that both faculties associated weapons with robots
more than with humans. This effect was significantly greater for the US faculty.
There are at least four possible explanations of this difference between implicit and
explicit measures: (1) Both faculties, and especially the US faculty, may have
rational safety concerns about people combined with unconscious fears of robots.
(2) Different concepts of robot may be active for participants during the IAT and
self-reports. (3) Participants may want to appear more favorable toward robots than
AI & Soc
123

they are (self-presentational bias). (4) The participants’ personal preferences may
differ from their extra-personal associations, such as those picked up from their
culture and upbringing. Although greater implicit/explicit differences were expected
in Japan, the differences were in fact greater in the US.
The differences between the Japanese and US faculty were not sufficient to
substantiate the view that Japan is a robot-loving society. This may indicate that the
Japanese and US faculty were not representative of their wider cultures, or that
factors other than attitude play a greater role in Japan’s adoption of robots. Major
differences exist in the historical development of Japan and the West. The main
religious and philosophical doctrines of Japan—Shinto, Buddhism, and neo-
Confucianism—have never impeded Japan’s progress in science and technology.
This contrasts with the enduring conflict between science and religion in the West.
Western assumptions about the uniqueness of human beings—from the creation
myth to notions of the soul and mind/matter duality—are of little consequence in
Japan. Thus, entities lying on the boundary between human and nonhuman do not
pose the same challenge to an individual’s sense of personal and human identity in
Japan as in the West.
There are several practical reasons for the prominence of robots in Japan. Robots
have played an important role in maintaining Japan’s manufacturing base. Owing to
a stronger commitment to retrain employees at companies adopting automation,
robots are not considered a threat to jobs. On the contrary, they are a key component
of government plans to address labor shortages in healthcare and eldercare. Japan’s
progress toward peaceful applications of robots is motivate by sound reasoning, not
irrational exuberance. An understanding of Japan’s case will help other nations
make more informed choices.
Acknowledgments We are grateful for the helpful advice and kind assistance of Leslie Ashburn-Nardo,
Mahzarin Banaji, Stephen J. Cowley, Anthony Faiola, Sara A. Hook, Hiroshi Ishiguro, Josette Jones,
Peter H. Kahn, Sara Kiesler, Tatsuya Nomura, Satoshi V. Suzuki, Hiroaki Yamano, Hiroki Yokota, and
three anonymous reviewers.
Appendix: Questionnaire
Robot-related experiences
1. How many times in the past one (1) year have you read robot-related stories,
comics, news articles, product descriptions, conference papers, journal papers,
blogs, or other material? (6-point scale) 0, 1, 2, 3, 4, 5 or more
2. How many times in the past one (1) year have you watched robot-related
programs on film, television, DVD, the Internet, or other media?
3. How many times in the past ten (10) years have you had physical contact with a
robot?
4. How many times in the past ten (10) years have you attended robot-related
lectures, exhibitions, trade shows, competitions, or other events?
5. How many times in your life have you built or programmed a robot?
AI & Soc
123

Attitudes toward robots
1. Select the statement that best describes your opinion. (7-point scale)
• I strongly prefer robots to people. (+3)
• I like robots and people equally. (0)
• I strongly prefer people to robots. (-3)
2. Rate how warm or cold you feel toward robots. (11-point scale)
• Very cold (-5)
• Neutral (0)
• Very warm (+ 5)
3. Rate how warm or cold you feel toward people. (11-point scale)
4. Select the statement that best describes your opinion. (7-point scale)
• Robots are much more threatening than people. (+ 3)
• Robots and people are equally threatening. (0)
• People are much more threatening than robots. (-3)
5. Rate how safe or threatening you feel robots are. (11-point scale)
6. Rate how safe or threatening you feel people are. (11-point scale)
7. How familiar are you with robots? (6-point scale)
• Not at all familiar (0)
• Completely familiar (+5)
8. How interested are you in robots? (6-point scale)
References
Ashburn-Nardo L, Knowles ML, Monteith MJ (2003) Black Americans implicit racial associations and
their implications for intergroup judgment. Soc Cogn 21:61–87
Banaji MR (2001) Implicit attitudes can be measured. Roediger HL III, Nairne JS, Neath I, Surprenant A
(eds) The nature of remembering: essays in honor of Robert G. Crowder. American Psychological
Association Press, Washington, DC, pp 117–150
Bargh JA, Chaiken S, Govender R, Pratto F (1992) The generality of the automatic attitude activation
effect. J Pers Soc Psychol 62:893–912
Barry B (2005) Better than people: why the Japanese want their robots to act more like humans. The
Economist, December 24
Bartneck C, Nomura T, Kanda T, Suzuki T, Kato K (2005) A cross-cultural study on attitude towards
robots. In: Proceedings of the 11th international conference on human–computer interaction
Bartneck C, Suzuki T, Kanda T, Nomura T (2007) The influence of people’s culture and prior experiences
with Aibo on their attitude towards robots. AI Soc 21:217–230
Capek K (1921/2004) Rossum’s universal robots (R.U.R.). Penguin, London
Castells M (2000) The rise of the network society, 2nd edn. Blackwell, Malden
Cooley M (2007) From judgment to calculation. AI Soc 21(4):395–409
Cowley SJ, MacDorman KF (2006) What baboons, babies, and Tetris players tell us about interaction: a
biosocial view of norm-based social learning. Connect Sci 18(4):363–378
Dasgupta N, McGhee D, Greenwald A, Banaji M (2000) Automatic preference for white Americans:
eliminating the familiarity explanation. J Exp Soc Psychol 36:316–328
AI & Soc
123

Davis W (1996) The moral and political naturalism of Baron Kato Hiroyuki. Institute for East Asian
Studies, Berkeley
De Houwer J, Moors A (2007) How to define and examine the implicitness of implicit measures. In:
Wittenbrink B, Schwarz N (eds) Implicit measures of attitudes: procedures and controversies.
Guilford Press, New York, pp 179–194
Dennett DC (1991) Consciousness explained. Little, Brown and Co., Boston
Douglas M (1966) Purity and danger: an analysis of concepts of pollution and taboo. Routledge, London
Engardio P (2005) Engineering: is the U.S. really falling? Businessweek, December 27
Fazio RH, Olson MA (2003) Implicit measures in social cognition research: their meaning and use. Annu
Rev Psychol 54:297–327
Feil-Seifer D, Skinner K, Mataric MJ (2007) Benchmarks for evaluating socially assistive robotics.
Interact Stud 8(3):423–439
Freud S (1919/2003) The uncanny [das Unheimliche] (D. McClintock, Trans.). Penguin, New York
Greenwald AG, Banaji MR (1995) Implicit social cognition: attitudes, self-esteem, and stereotypes.
Psychol Rev 102(1):4–27
Greenwald AG, McGhee DE, Schwartz LK (1998) Measuring individual differences in implicit
cognition: the implicit association test. J Pers Soc Psychol 74(6):1464–1480
Greenwald AG, Nosek BA, Banaji MR (2003) Understanding and using the implicit association test: I. An
improved scoring algorithm. J Pers Soc Psychol 85:197–216
Harnad S (1989) Minds, machines, and Turing. J Exp Theor Artif Intell 1(1):5–25
Hausmann R, Tyson LD, Zahidi S (2007) The global gender gap report. World Economic Forum, Geneva
Hornyak TN (2006) Loving the machine: the art and science of Japanese robotics. Kodansha, Tokyo
Houben K, Wiers RW (2007) Are drinkers implicitly positive about drinking alcohol? Personalizing the
alcohol-IAT to reduce negative extrapersonal contamination. Alcohol Alcohol 42(4):301–307
Ji L, Peng K, Nisbett RE (2000) Culture, control, and perception of relationships in the environment. J
Pers Soc Psychol 5:943–955
Kagan RA (1994) Do lawyers cause adversarial legalism? A preliminary inquiry. Law Soc Inq 19(1):1–62
Kahn PH, Ishiguro H, Friedman B, Kanda T, Freier NG, Severson RL (2007) What is a human? Toward
psychological benchmarks in the field of human-robot interaction. Interact Stud 8(3):363–390
Karpinski A, Hilton JL (2001) Attitudes and the implicit association test. J Pers Soc Psychol 1(5):774–
788
Kincaid DL (1987) Communication East and West: points of departure. In: Kincaid DL (ed)
Communication theory: Eastern and Western perspectives. Academic Press, San Diego, pp 331–340
Komiya N (1999) A cultural study of the low crime rate in Japan. Br J Criminol 39(3):369–390
Lynn LH (2002) Engineers and engineering in the U.S. and Japan: a critical review of the literature and
suggestions for a new research agenda. IEEE Trans Eng Manage 41(1):95–106
MacDorman KF (2004) Extending the medium hypothesis: the Dennett–Mangan controversy and beyond.
J Mind Behav 25(3):237–257
MacDorman KF, Cowley SJ (2006) Long-term relationships as a benchmark for robot personhood. In:
Proceedings of the 15th IEEE international symposium on robot and human interactive
communication. Hatfield, UK, September 6–9
MacDorman KF, Ishiguro H (2006) The uncanny advantage of using androids in social and cognitive
science research. Interact Stud 7(3):297–337
Mazlish B (1993) The fourth discontinuity: the co-evolution of humans and machines. Yale University
Press, New Haven
Mori M (1970) Bukimi no tani (in Japanese). [The uncanny valley] (MacDorman KF, Minato T). Energy
7(4):33–35
Mori M (1982) The Buddha in the robot: a robot engineer’s thoughts on science and religion. Tuttle,
Tokyo
National Science Board (2006) Science and engineering indicators 2006, vol 1. National Science
Foundation, Arlington
Nomura T, Kanda T, Suzuki T, Kato K (2005) People’s assumptions of robots: investigation of their
relationships with attitudes and emotions toward robots. In: Proceedings of the 14th IEEE
international workshop on robot and human interactive communication, pp 125–130
Nomura T, Kanda T, Suzuki T (2006) Experimental investigation into influence of negative attitudes
toward robots on human–robot interaction. AI Soc 20(2):138–150
AI & Soc
123
Nomura T, Tasaki T, Kanda T, Shiomi M, Ishiguro H, Hagita N (2007) Questionnaire-based social
research on opinions of Japanese visitors for communication robots at an exhibition. AI Soc
21(1):167–183
Nosek BA, Banaji MR (2001) The go/no-go association task. Soc Cogn 19(6):161–176
Olson MA, Fazio RH (2004) Reducing the influence of extra-personal associations on the implicit
association test: personalizing the IAT. J Pers Soc Psychol 86(5):653–667
Penke L, Eichstaedt J, Asendorpf JB (2006) Single attribute implicit association tests (SA-IAT) for the
assessment of unipolar constructs: the case of sociosexuality. Exp Psychol 53(4):283–291
Plato (360 BCE/1888) The republic, 3rd edn. In: Jowett B (Trans.). Clarendon Press, Oxford
Putnam H (1967) The mental life of some machines. In: Castaneda H (ed) Intentionality, minds and
perception. Wayne State University Press, Detroit, pp 439–460
Ramey CH (2005) The uncanny valley of similarities concerning abortion, baldness, heaps of sand, and
humanlike robots. In: Proceedings of the views of the uncanny valley workshop, IEEE-RAS
international conference on humanoid robots. Tsukuba, Japan
Reubenfien E (1989) U.S. police walk different beat in Japan. The Asian Wall Street Journal, January 13–
14
Ross D, Dumouchel P (2004) Emotions as strategic signals. Rational Soc 16(3):251–286
Sander RH, Williams ED (1989) Why are there so many lawyers? Perspectives on a turbulent market.
Law Soc Inq 14(3):431–479
Scanlon C (2003) Japan considers jury system. BBC News, March 12
Schodt FL (1988) Inside the robot kingdom: Japan, mechatronics, and the coming robotopia. Kodansha,
Tokyo
Shibata T, Wada K, Tanie K (2004) Tabulation and analysis of questionnaire results of subjective
evaluation of seal robot in Japan, UK, Sweden and Italy. In: Proceedings of the IEEE international
conference on robotics and automation. New Orleans
Singer CJ, Williams H, Adelmann B (1954) A history of technology. Oxford University Press, Oxford
Solomon S, Greenberg J, Pyszczynski T (1998) Tales from the crypt: the role of death in life. Zygon J
Relig Sci 33:9–43
Turkle S (2007) Authenticity in the age of digital companions. Interact Stud 8(3):501–517
Weil MM, Rosen LD (1995) A study of technological sophistication and technophobia in university
students from 23 countries. Comput Hum Behav 11(1):95–133
Woelfel J (1987) Development of the Western model: toward a reconciliation of Eastern and Western
perspectives. In: Kincaid DL (ed) Communication theory: Eastern and Western perspectives.
Academic Press, San Diego, pp 299–314
Xi Z (1967) In: Chu H, Lui T-C, Chan W-T (eds). Relections on things at hand: the neo-Confucian
anthology. Columbia University Press, New York
Yamamoto S (1983) Naze nihonjin niha robotto arerugi ga nai no ka? (in Japanese) [Why aren’t Japanese
allergic to robots?]. Gendai No Espuri 187:136–143
AI & Soc
123
Related Documents