Does Increased Lighting Reduce Crime? Studying the Impact of the Summer Night Lights Program on Crime in Los Angeles Siddheshwar “Sid” Salvi 4/19/2011 Advisor: Katharine Sims Submitted to the Department of Economics at Amherst College in partial fulfillment of the requirements for a Bachelor of Arts with Honors

Welcome message from author
This document is posted to help you gain knowledge. Please leave a comment to let me know what you think about it! Share it to your friends and learn new things together.
Transcript
Does Increased Lighting Reduce Crime?
Studying the Impact of the Summer Night Lights Program on Crime in Los Angeles
Siddheshwar “Sid” Salvi
4/19/2011
Advisor: Katharine Sims
Submitted to the Department of Economics at Amherst College in partial fulfillment of
the requirements for a Bachelor of Arts with Honors

ACKNOWLEDGEMENTS
First and foremost I would like to thank Professors Sims for her generous advice
and support throughout this process. I could not have finished (or started) this process
without her. Thank you to the Economics Lab for being my companion for the past few
months. Last, I want to thank Philip Spencer, and all of my friends and family for their
support.

ABSTRACT
In the summer of 2008, the City of Los Angeles implemented a new program to
prevent gang violence, “Summer Night Lights” (SNL). Since 2008, the program has
expanded from eight parks to twenty-four parks across the city. SNL aims to reduce gang
violence and crime by keeping park lights on until midnight each night from Wednesday
through Saturday during the summer months. The SNL program provides a unique
opportunity to properly determine whether increased lighting in communities reduces
crime. Since it was only implemented in select neighborhoods, the program itself defines
treatment and control groups. In this study, I determined if the SNL program reduced
crime in the neighborhoods in which it was implemented, and if so, the mechanism
through which the program has had an impact on crime. Specifically, I studied whether
the SNL program reduced crime by a) affecting the decision calculus of criminals by
increasing the probability of arrest due to increased surveillance, or b) increasing
community pride and cohesion signaling to criminals that they should not commit
offenses in the neighborhood. My identification strategy consisted of using a differences-
in-differences approach and a fixed effects model. Since the Summer Night Lights
program was not randomly implemented, it creates an endogeneity problem, selection
bias, where the crime rate affects treatment and treatment affects the crime rate. To
partially control for this selection bias, I and made the control group similar to the
treatment group using neighbor-to-neighbor propensity score matching. I also excluded
bordering neighborhoods to prevent any spillover effects or contamination of the control.
The results of this study show that the Summer Night Lights program had little impact on
crime in the neighborhoods in which it was implemented. Based on the evidence, it is
unclear whether the surveillance theory or the community confidence theory best
explains the relationship between lighting and crime.
Keywords: crime, lighting, Summer Night Lights, public economics

1
1. INTRODUCTION
In the summer of 2008, the City of Los Angeles implemented a new program to
prevent gang violence, “Summer Night Lights” (SNL). Since 2008, the program has
expanded from eight parks to twenty-four parks across the city.1 SNL aims to reduce
gang violence and crime by keeping park lights on until midnight each night from
Wednesday through Saturday during the summer months. Developed in partnership with
A Better LA, former USC coach Pete Carroll’s non-profit organization, the program also
provides free food and programming such as organized sports, skateboarding, movies,
intervention and mentoring for at-risk youth. SNL hires “intervention workers” to
maintain ceasefires between gangs and the community, and some youth have the
opportunity to work as programming supervisors. Additionally, an audit counted that
residents made 710,000 visits to the 24 sites between July 7th and September 4th 2010,
and on average 10,929 people were served free meals each night (Gold 2010). The SNL
program suggests a resurgence of structural solutions to crime among urban planning
experts.
Though it was at first met with skepticism, SNL now enjoys widespread support
and praise from the communities in which it has been implemented (Cathcart, 2009).
After the first year of the program, Miguel Leon, a gang intervention worker from Boyle
Heights said, “People were just waiting for it this summer. Last year it took a while to
ramp up; now this place is packed.” Sixty-year old Dorothy Poindexter-Bown of Harvard
1 Costello Park, Jim Gilliam Park, Denker Park, Ramon Garcia Park, Cypress Park, Glassell Park, Mount
Carmel Park, Harvard Park, Ross Snyder Park, Hubert Humphrey Park, Sepulveda Park, Ramona Gardens
Recreation Center, Nickerson Gardens Housing Development, Jordan Downs Housing Development,
Imperial Courts Housing Development, Edward R. Roybal Learning Center, Lemon Grove Park, Slauson
Park, Normandale Park, Lake Street Park, South Park, Jackie Tatum Harvard Park, Highland Park, Van
Ness Park.

2
Park remarked, “I’m taking it in, I’m thinking how nice it feels to be safe in the park at
night.” Reverend Jeff Carr, director of SNL and Mayor Villaraigosa’s Gang Reduction
and Youth Development division, reasons that “these neighborhoods with gang problems
don’t have a lot of assets. But there is a school, a park and a rec center. Those are public
assets. Let’s use those to create social connections that replace gangs.” This new
approach to crime contrasts with the old paradigm of increased police presence. For
example, Paul Seave, director of Gov. Arnold Schwarzenegger’s Office of Gang and
Youth Violence Policy commented, “Until about five years ago, the approach to gang
violence in California was largely a law enforcement one. But there has been a sea
change in the way everyone, particularly law enforcement, thinks. We cannot arrest our
way out of this problem.”
The City of Los Angeles claims that SNL has been a huge success in reducing
gang-related crime. The city boasts that since 2008 SNL has led to a 57% decrease in
homicide-related deaths in its participating neighborhoods (Summer Night Lights, 2010).
Using Los Angeles Police data, the Los Angeles Times reported that crime has fallen
40.4% since 2007 in neighborhoods surrounding SNL parks. Can the decline in
homicides be attributed solely to the SNL program? Gang experts in Los Angeles like
former LAPD lieutenant, Gary Nanson, and USC professor, Malcolm Klein have called
into question the LAPD’s gang statistics saying that they “don’t come close to reality”
(McDonald 2009).
The question of the Summer Night Light’s program’s efficacy has great economic
significance. Since Gary Becker’s seminal paper, Crime and Punishment, economists
have tried to compare the deterrent effects of various criminal policy measures. With

3
state budgets in shambles and city police departments constantly being asked to do more
with less, policy experts struggle with how to best allocate resources to prevent and
punish crime. To give a picture of crime in Los Angeles; in 2009, there were 23,779
violent crimes and 92, 271 property crimes (Crime and Arrest Weekly Statistics 2009).
In 2009, the City Council’s Ad Hoc Committee on Gang Violence estimated that Los
Angeles had 400 gangs with 39,000 members, but only 10 percent of those gangs were
responsible for 80 percent of the crime in the city. Even so, Los Angeles was not ranked
in the top 15 of “America’s Most Dangerous Cities” according to Forbes Magazine
(O'Malley 2009).
The Summer Night Lights program cost 5.4 million dollars this past year, all
funded by philanthropic donations. Therefore, the program cost $1,250 per park per hour
(Gold 2010). With this amount of expenditure, the LAPD could have hired forty more
police officers per hour per neighborhood. The total budget of the Los Angeles Police
Department in 2009 was 1.17 billion dollars. Of that, 1.12 billion dollars were paid in
salaries to 9,802 sworn personnel at an average hourly wage of $31. Per neighborhood,
the Los Angeles Police Department spends on average 4.29 million dollars per
neighborhood and has 36 sworn personnel. Keeping in mind these figures on the cost of
crime prevention and discovery, it is important to consider the monetary cost of crime. A
recent study estimated the average cost per murder to be higher than 17.2 million dollars,
including victim cost, the cost of arrest and adjudication, the cost of incarceration, the
opportunity costs of offenders’ time and productivity (De Lisi et. al 2009). With the
enormous costs of crime and the sizable amount of resources devoted to prevent, solve

4
and punish crime, the relative effectiveness of various deterrence mechanisms continues
to be a salient economic issue.
The SNL program provides a unique opportunity to properly determine whether
increased lighting in communities reduces crime. Since it was only implemented in
select neighborhoods, the program itself defines treatment and control groups. In this
study, I want to determine if the SNL program reduced crime in the neighborhoods in
which it was implemented, and if so, the mechanism through which the program has had
an impact on crime. Specifically, I am interested in whether the SNL program reduced
crime by a) affecting the decision calculus of criminals by increasing the probability of
arrest due to increased surveillance, or b) increasing community pride and cohesion
signaling to criminals that they should not commit offenses in the neighborhood. Section
2 discusses theory and previous literature on the impact of lighting on crime. Section 3
explains the methodology I employ and Section 4 details the dataset I use in this study.
In Section 5, I present the results of various econometric tests. Lastly, in Section 6, I
analyze the implications of my econometric analysis, provide possible avenues for further
research and place this study within the broader crime prevention debate.
2. LITERATURE REVIEW
2.1 ECONOMIC THEORY OF CRIME
When economists made their foray into criminology, they applied their all-
encompassing model of individual rational behavior to the field (Eide 2006). In this
model, an individual performs a criminal act if the total payoff, including the benefits of
the crime minus the expected cost of punishments and other costs, exceeds the gain from
legal alternatives. Jeremy Bentham wrote, “the profit of the crime is the force which

5
urges man to delinquency: the pain of punishment is the force employed to restrain him
from it. If the first of these forces be greater, the crime will be committed; if the second,
the crime will not be committed” (Bentham, 399). In his seminal paper, Crime and
Punishment, Becker gave new life to Bentham’s ideas, and argued that criminals do not
behave any differently than the average person – they are utility-maximizers (Becker,
170). Assuming that people act to maximize their utility and that utility is a positive
function of income, an individual’s expected utility from committing a crime is:
E[U] = PU(Y – f) + (1 – P)U(Y), (2.1)
Where U () is the individual’s utility function, P is the probability of arrest and
conviction, Y is the monetary equivalent of the total gain from the crime, and f is the
monetary equivalent of any sanctions (Becker, 177). In this model, an individual will
commit an offense when the expected utility of that action is positive. The comparative
statics of the above model indicate that increases in either the probability or severity of
punishment can change the criminal’s expected utility from positive to negative. Becker
presumes a greater response of criminals to changes in probability of conviction than to
punishment. An increase in the probability of arrest compensated by an equal percentage
decrease in punishment would not affect the expected income of crime, but could change
the expected utility.2 Consequently, since criminals are risk-preferers, an increase in p
would reduce the expected utility, and thus the number of crimes, more than an equal
percentage increase in f.3 Although not specified in the basic model, individual discount
2 EY = p(Y - f) + (I - p)Y = Y – pf
3- (∂EU/∂p)(p/U) = [U(Y) – U(Y – f)](p/U) as compared to (∂EU/∂f)(f/U) = pU’(Y – f)f/U
as [U(Y) – U(Y – f)]/f as compared to U’(Y – f)
The term on the left is the average change in utility between Y – f and Y. It would be greater than, equal
to, or less than U’(Y – f) depending on risk preference (U>0, U=0 or U<0)

6
rates will also affect the decision to commit crime because the benefits of crime occur
immediately, whereas punishment might come in the future, stretched over a long time.
Thus, a high discount rate implies a greater propensity to commit crime because it lowers
the present value of f. Since the development of this model of crime, numerous empirical
studies have supported the hypothesis that “the probability of punishment, and to a lesser
degree also the severity of punishment, has a deterrent effect on crime” (Eide 2006).
These studies acknowledge that criminal behavior stems from a wide array of causes.
Besides variations in crime levels between regions, gender, races, drug use, etc, norms,
opportunities and context also influence the decision to commit a crime. In summary,
the economic model suggests that the probability of conviction and punishment,
combining with the discount rate and various environmental factors all influence an
individual’s decision to commit crime.
2.2 EMPIRICAL RESEARCH ON THE ECONOMIC MODEL OF CRIME
Since Becker’s landmark paper, numerous economists have tested his economic
model of crime, making alterations and using many different estimation methods. There
is consensus in the literature that both the certainty and severity of punishment have a
strong deterrent effect on crime. The widespread acceptance of this claim is reflected by
its inclusion in most law and economics textbooks. For example, in Hirsch’s Law and
Economics: An Introductory Analysis,
“Estimates of the magnitude of the deterrent effect vary, but it appears that
an increase in law enforcement activity that increases either the probability
of punishment or the severity of punishment by 1 percent is on average
associated with a reduction in the number of offenses somewhere between
.3 and 1.1 percent.”

7
Below is a table summarizing the results of past studies on deterrence using
aggregate, cross-section data (Farrington and Welsh 2002):
Study
(Date)
Estimation
Procedure
Crime
Type
Probability
of Arrest
(PA)
Probability of
Conviction
(PC)
Probability of
Punishment
(PP)
Severity of
Punishment
(S)
Ehrlich
(1973)
OLS All, 1960 -5.26*** -.585***
2SLS -.991*** -.1.123***
Sjoquist
(1973)
OLS Robbery,
Burglary,
Larceny
-.342*** -.212
Carr-Hill &
Stern
(1973)
2SLS All, 1961 -.66*** -.28***
All, 1966 -.59*** -.17***
Orsagh
(1973)
OLS Felonies -.26***
2SLS -1.8***
Phillips &
Votey
(1975)
OLS Felonies -.622*** -.347***
2SLS/ 3 eq -.610*** -.342***
2SLS/4 eq -.701*** -.376***
Mathieson
& Passell
(1976)
OLS Robbery,
Murder
-1.06***,
-.743***
2SLS -2.95***,
-1.96***
Craig
(1987)
3SLS Felonies -.57***
Trumbull
(1989)
OLS All -.217*** -.451*** -.325*** -.149***
As shown in the table, the estimated elasticities are consistent with the predictions
of the theoretical model; the estimated coefficients of PA, PC, PP and S are negative and
PA < PC <PP.
In more recent years, economists have studied the economic model of crime using
a variety of datasets and methods. Witte (1980) uses individual data and develops a
variant of Becker’s model where the amount of crime a criminal commits is a monotonic
function of the time allocated to illegal activity. In this model, the dependent variable is
the number of arrests per month free. Witte realized that since more than 80 percent of

8
the men in the sample were rearrested during the period their activities followed, their
probability of arrest is quite high, and thus the probability of arrest would not greatly
affect their time allocation decision. Using a hybrid of a probit and least squares model,
and a maximum likelihood estimator, Witte found that the probability of punishment has
a greater effect on arrests and convictions than the severity of punishment.
In another recent study, Cornwell and Trumbull (1984) use a panel dataset of
North Carolina counties and both single and simultaneous equations panel data estimators
to address sources of endogeneity in past studies. The authors argue that a fundamental
flaw in previous studies has been the inability to control for unobserved heterogeneity in
the unit of observation. Using panel data, they account for unoberservable country
characteristics by conditioning on county effects in estimation. Using the ratio of FBI
crimes to county population as the crime rate and proxying the probability of arrest by the
ratio of arrest to offenses and controlling for police force, they adopted a log-linear
specification and found that the arrest and conviction elasticities are -.355 and -.282.
Their analysis suggests that the deterrent effects of arrest and conviction probabilities are
much smaller than would be indicated from cross-section estimation.
Steven Levitt, skeptical of the past economic literature suggesting a negative
empirical relationship between arrest rates and crime, conducted a study to discriminate
between deterrence, incapacitation and measurement error. In the model of crime, total
crimes is related to the true arrest rate (arrests/total crimes), however, empirical studies
can only use reported crimes because total crime data is unavailable. Thus, Levitt argues
that measurement error appears in both the left-hand and right-hand side variables in his
model of crime. Moreover, Levitt shows that this measurement error will lead to

9
negative bias, not attenuation bias as in the standard measurement error case (Levitt
1998). With only 38% of crimes reported, the possibility for measurement error is
serious (Bureau of Labor Statistics 1994). Yet, Levitt finds that the use of reported crime
in empirical studies does not lead to bias in the estimation of arrest effects.
Another important topic explored in the economic literature on crime is spillover
effects. Greater crime deterrence efforts may shift criminal activity to a different time
and place, possibly even resulting in an aggregate increase in crime. Hakim (1979) and
other studies since then have found a positive and significant spillover effect.
2.3 RELATIONSHIP BETWEEN LIGHTING AND CRIME: THEORY AND MECHANISMS
Two theories can explain how increased or improved lighting affects crime
(Farrington and Welsh 2002). Both theories argue that improved lighting affects p, the
probability of apprehension, in a criminal’s expected utility function. However, the two
theories give different reasons for how improved lighting affects p. The first theory
posits that increased or improved lighting increases the probability of arrest by
facilitating surveillance by both residents and police. The second theory suggests that
increased or improved lighting signals greater community investment leading to
increased community pride, cohesion and informal social control.
Believers in the first theory fit increased or improved lighting into a broader
category of “situational” approaches to crime, which concentrate on reducing crime
opportunities and increasing risk of punishment through changes in the physical
environment (Clarke, 1995). At its root, this theory posits that natural, informal
surveillance is the best crime prevention. In her bestselling book, The Death and Life of
Great American Cities, Jane Jacobs highlights the importance of having “eyes on the

10
street” to neighborhood peace. For those eyes to catch crime, the streets of the
neighborhood must be properly lit (Jacobs, 1961). Additionally, better lighting may
encourage greater street usage, which facilitates natural surveillance. Most importantly,
this theory predicts that increased or improved lighting especially reduces nighttime
crime.
Proponents of the second theory have a different perspective on the effect of
improved or increased lighting on crime: they stress the importance of bolstering
informal social control and community cohesion (Jacobs, 1961; Angel 1968) through
more effective street use and investment in the neighborhood (Taub et al, 1984; Taylor
and Gottfredson 1986). First, better lighting fosters community confidence; it gives a
clear signal that the local authorities are investing in the neighborhood. This can lead to
initiatives by residents that prevent crime and disorder. Greater community confidence
also affects the potential criminal’s utility function by increasing p; offenders feel that
any crimes are more likely to be reported due to residents’ greater concern for their
community. Second, improved illumination may reduce fear of crime because people
feel well-lit areas are safer than darker ones. When actual and perceived risks of crime
decrease, more residents use the lit area. This positive cycle changes the social mix and
activity patterns in the neighborhood, reducing the risk and fear of crime. Supporters of
this theory reason that better lighting will lead to decreases in both daytime and nighttime
crime.
In summary, two possible mechanisms mediate the effect of improved or
increased lighting on crime: better lighting increases surveillance or improves community
confidence to reduce crime. Although not able to pin down the mechanism, economists
11
have attempted to validate the overall hypothesis that improved illumination reduces
crime.
2.4 PAST EMPIRICAL RESEARCH ON LIGHTING AND CRIME
While little recent research has been done on the effect of increased lighting on
crime, research has been conducted in the United States and Great Britain over the past
forty years on the impact of improved lighting on crime (Farrington and Welsh 2002).
Interest in the relationship between better lighting and crime began in North America
after the great increase in crime in the 1960s. The implementation of improved
illumination projects across the country led to a comprehensive review by Tien et al.
(1979) as part of the National Evaluation Program of LEAA (Law Enforcement
Assistance Agency) funding. However, of the 103 street lighting projects, only fifteen
collected data on its impact and were structured properly to allow for analysis. Their
review yielded mixed and inconclusive results because most of the research projects
suffered from various flaws: weak design, misuse or complete absence of sound analytic
techniques, inadequate measures of street lighting, poor measures of crime, and
insufficient appreciation of the impact of lighting on different types of crime (Farrington
and Welsh, 1). Instead of prompting further research on the subject, academics in the
United States concluded that lighting had no effect on crime and conducted little further
study. In Great Britain, researchers began to study the effect of lighting on crime in the
early 1990s, when three small-scale street lighting projects in London were implemented
and evaluated (Painter, 1994). This study found that disorder and fear of crime decreased
and pedestrian street use rose significantly after lighting modifications. Since then the
Home Office (Great Britain) has funded regular reviews of street-lighting interventions.

12
In the most recent review, researchers conduct a meta-analysis of thirteen past studies
(Farrington & Welsh, 2002). The studies included in the meta-analysis met five criteria:
1) improved lighting was the main intervention, 2) crime was the measured outcome, 3)
high quality methodology, 4) the study included at least one experimental and control
area, and 5) at least twenty crimes were committed in each area (9). Farrington and
Welsh included five British studies from the past two decades and eight American
evaluations from the 1970’s in their review.
Beginning with the American studies, only four found that street lighting was
effective in reducing crime. The studies which found a negative influence of lighting on
crime measured both daytime and nighttime crime, whereas the inconclusive studies only
measured nighttime crime. The authors’ meta-analysis used odds ratios to measure the
effect size to provide a comparable measure of the effect of each project. The odds ratio
indicates the proportional change in crime in the control area compared with the
experimental area. An odds ratio less than 1.0 suggests an adverse effect of improved
lighting on crime, while an odds ratio above 1.0 implies a desirable effect of improved
lighting. The meta-analysis of the American studies yielded an average odds ratio
(weighted according to the standard error of each study) of 1.08 (28). In other words,
crime decreased by seven percent in experimental areas as opposed to the control areas.4
The five British studies showed that improved lighting led to a significant thirty percent
decrease in crime. In two of these studies, the financial savings from reduced crimes
greatly exceeded the financial costs of improved street lighting. Taking all thirteen
studies together, improved lighting reduced crime by twenty percent in experimental
4 Odds ratio calculated by dividing change in crimes in control area by change in crimes in experimental
area. Crime decreased by 7 percent in the experimental area as compared with the control area because the
change in the experimental area compared with the control area is the inverse of the odds ratio (1/1.08).

13
areas as compared with control areas. While the American studies were conducted in the
1970s, most of the British evaluations have been conducted in the last twenty years.
These British studies did not find any difference in the reduction between nighttime and
day-time crime, supporting the “community pride” theory.
One of the most rigorous studies included in the meta-analysis was by Painter and
Farrington (1999). Using victim surveys, they compared the prevalence and incidence of
crime twelve months before and twelve months after the installation of improved lighting
with adjacent and control areas where street lighting remained unchanged. They found
that the prevalence of crime decreased by 26 percent in the experimental area, as
compared to 21 percent in the adjacent area and 12 percent in the control area.5 In
addition, the incidence of crime reduced by 43 percent in the experimental area, 45
percent in the adjacent area and only 2 percent in the control area.6 Painter and
Farrington used surveys to determine household victimization and respondents’
perceptions, attitudes and behavior. The authors tested the extent to which changes in the
prevalence of crime were significantly different from another area by using an interaction
term in a logistic regression: 7
Log (P) = β0 + β1PrePost + β2ConExp + β3PrePost*ConExp
Using this method, they controlled for preexisting differences in crime rates
between experimental and control areas. Thus, they confidently concluded that the
5 Prevalence of crime: number of households victimized by crime/number of houses in area
6 Incidence of crime: average number of crimes per 100 households
7 Log – natural logartithm
P = probability of crime
PrePost = Dummy Before/After Variable
ConExp = Dummy Control/Experimental Varaible
PrePost*ConExp = Interaction term

14
change in crime in the experimental areas was significantly different from the change in
crime in control areas (LRCS = 4.69, p = .003).8
Similarly, to test the significance of the difference in the incidence of crime
between treatment and control areas, they used an interaction term in a Poisson regression
equation. As with prevalence of crime, they found that the change in crime in the
experimental area was significantly different from the change in crime in the control area
(LRCS = 7.17, p=.007). Overall, the Painter and Farrington study showed that improved
lighting reduces crime where it is implemented.
Even though the meta-analysis provides stable results, Farrington and Welsh
argue that significant knowledge gaps in this area exist (10). They suggest that future
research should measure crime using police records, victim surveys, and self-reports of
offending. In addition, future evaluations should include experimental, adjacent and non-
adjacent control areas, in order to test hypotheses about displacement and diffusion of
benefits. Ideally, a long time series of crimes before and after improved lighting in
experimental and control areas should be studied.
Based on these conclusions, the “Summer Night Lights” program in Los Angeles
provides an excellent opportunity to study the relationship between crime and lighting
because police crime data is readily available, and there are clearly-established treatment,
adjacent and non-adjacent control areas.
3. METHOD
In designing this study, there are three important decisions to be made to ensure
the best possible analysis of the effect of the Summer Night Lights program on crime.
First, I must pick an appropriate unit of analysis. I can either use neighborhoods as
8 LRCS = Likelhood Ratio Chi-Squared = interaction term in logisitc regression

15
defined by the Los Angeles Times/LAPD or distance from the park. I chose
neighborhoods as my unit of analysis instead of using a fixed area around a park because
the program was designed to reduce gang-related crime in the whole neighborhood. I
realize that my choice of unit of analysis may slightly bias my study towards the
“community pride and cohesion” theory, while choosing distance from the park would
imply a credence to the “surveillance” theory. Second, I must identify an appropriate
dependent variable: number of crimes or density of crime. Since most official statistics
are reported as density of crime (crimes per 1000 people), I chose to use density of crime
as my dependent variable. Third, I aggregated the crime data at two levels of specificity:
week and hour. At both levels, I calculated the number of crimes per thousand people for
every neighborhood. Fourth, I analyzed the effect on all crime and violent crime only. I
defined violent crime as aggravated assault, rape, murder and robbery. Since the Mayor’s
office touts that the program reduced “gang-related” homicide by 57%, I wish to examine
its effect on violent crime only (Summer Night Lights, 2010). Lastly, I must choose an
appropriate identification strategy to isolate the effect of the Summer Night Lights
program.
3.1 IDENTIFICATION STRATEGY
The nature of the Summer Night Lights program itself creates two complications.
First, the program did not just increase lighting in particular neighborhoods, but also
provided extensive programming (on average almost 11,000 people were fed each day
this past summer). To disentangle the effect of lighting and programming, I looked at
the differential impact of the program on overall crime versus nighttime crime. If the
Summer Night Lights program reduced nighttime crime more, it would suggest that

16
increased lighting plays a larger role in the impact of the project and also determines the
mechanism by which lighting affects crime.
Second, the Summer Night Lights project is not simply a program that keeps
lights on longer in random parks of the city, but was designed to target neighborhoods
with high gang violence. The Mayor’s office recognized that violent gang activity is
heavily concentrated in certain areas across the city and initially chose twelve
neighborhoods or “Gang Reduction Youth Development” zones for participation where
violent gang-related crime is at least 400 percent higher than other parts of Los Angeles
(Summer Night Lights, 2010). Since the Summer Night Lights program was not
randomly implemented, it creates an endogeneity problem, selection bias, where the
crime rate affects treatment and treatment affects the crime rate. Unfortunately, I could
not find a good instrumental variable that was correlated with treatment but uncorrelated
with the error term of crime rate. Instead, I controlled for time-invariant unobservables
and made the control group similar to the treatment group using neighbor-to-neighbor
propensity score matching.
Demographic factors associated with higher crime and correlated with a greater
probability of being chosen for the program include population density (people per square
mile, PopDensity), percent of neighborhood with a college degree (College), median
income (Income), percent of African Americans (Black), and percent of Latinos (Latino)
(Appendix 1, Table 2). Yet, there may be other unobservable factors affecting crime in
particular neighborhoods or at certain times of the year.
To control for time-invariant unobservables I used two models: differences-in-
differences and fixed effects.

17
1) Differences in Differences (D-D):
a) CrimeRate2009 = β0 + β1treated2008 + β2treated2009 + β3during2009 +
β4treated2008*during2009 + β5treated2009*during2009 + β6PopDensity + β7Latino +
β7Black + β8Income +ε
b) CrimeRate2010 = β0 + β1treated2008 + β2treated2009 + β3treated2010 + β4during2010 +
β5treated2008*during2010 + β6treated2009*during2010 + β7treated2010*during2010 +
β8PopDensity + β9Latino + β10Black + β11Income +ε
Treated2008, treated2009, treated2010, during2009 and during2010 are all dummy variables.
The treated variables equal 1 when a neighborhood participated in the Summer Night
Lights program beginning in the year in the subscript. For example, treated2008 equals 1
for all observations if the neighborhood was included in the program starting in 2008.
The during variables equal 1 for the weeks that the program was in session: July 1 – Sept.
7 in 2009 and July 7 - Sept. 4 in 2010. Hence, the interaction variables of treated and
during only equal 1 when the Summer Night Lights program was running and the
neighborhood was included in the program. The sign and magnitude of the coefficients
of the interaction variables indicate the impact of the Summer Night Lights program on
the crime rate. The value of the coefficient of the interaction term is called the average
treatment effect. To control for observable factors that may affect crime beyond
treatment and the time period, I include demographic variables for population density,
race and income.
2) Fixed Effects (FE):
a) CrimeRateneighborhood,t = β0 + β1lightsonneighborhood,t + β2hadlightsneighborhood,t + δt +
δneighborhood + εneighborhood,t
18
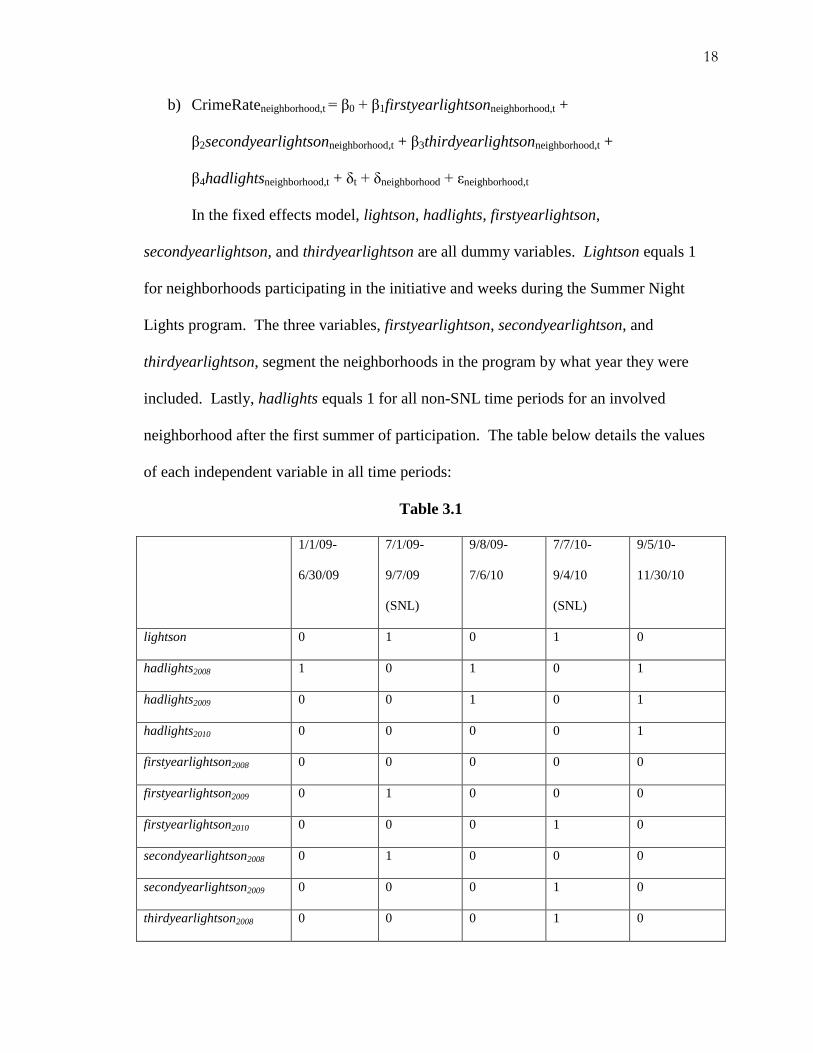
b) CrimeRateneighborhood,t = β0 + β1firstyearlightsonneighborhood,t +
β2secondyearlightsonneighborhood,t + β3thirdyearlightsonneighborhood,t +
β4hadlightsneighborhood,t + δt + δneighborhood + εneighborhood,t
In the fixed effects model, lightson, hadlights, firstyearlightson,
secondyearlightson, and thirdyearlightson are all dummy variables. Lightson equals 1
for neighborhoods participating in the initiative and weeks during the Summer Night
Lights program. The three variables, firstyearlightson, secondyearlightson, and
thirdyearlightson, segment the neighborhoods in the program by what year they were
included. Lastly, hadlights equals 1 for all non-SNL time periods for an involved
neighborhood after the first summer of participation. The table below details the values
of each independent variable in all time periods:
Table 3.1
1/1/09-
6/30/09
7/1/09-
9/7/09
(SNL)
9/8/09-
7/6/10
7/7/10-
9/4/10
(SNL)
9/5/10-
11/30/10
lightson 0 1 0 1 0
hadlights2008 1 0 1 0 1
hadlights2009 0 0 1 0 1
hadlights2010 0 0 0 0 1
firstyearlightson2008 0 0 0 0 0
firstyearlightson2009 0 1 0 0 0
firstyearlightson2010 0 0 0 1 0
secondyearlightson2008 0 1 0 0 0
secondyearlightson2009 0 0 0 1 0
thirdyearlightson2008 0 0 0 1 0

19
In the FE model, the treatment effect is measured by coefficients of lightson,
hadlights, firstyearlightson, secondyearlightson, and thirdyearlightson. If the Summer
Night Lights program reduced crime during the treatment period, we would expect the
coefficient of lightson to be negative. If multiple years of participation in the program
affect the impact of the program, the coefficients of secondyearlightson and
thirdyearlightson should be statistically different from zero. In the FE model, dummy
variables for each year, neighborhood and week serve as controls for time-invariant
unobservable factors. While these two models do not completely tackle the endogeneity
problem due to the existence of time-varying unobservables, we can make their results
stronger by using propensity scoring, which creates a control group “similar” to the
treatment group.
I used propensity score matching to refine my control group to include only those
neighborhoods that could have been chosen for treatment. Besley and Case (2000) show
that bias in a fixed effects model originates from: 1) “omitted variable bias caused by
observable variables that determine policy and that have independent influence on the
outcome of interest,” and 2) “Presence of unobservable variables that may determine both
the policy and outcome of interest.” To address these concerns they suggest selecting a
control group that is “similar” to the control group, which I do using propensity score
matching. The propensity score was generated using the nearest-neighbor approach,
which matched treatment neighborhoods to three other neighborhoods. In this model,
each treatment observation was matched to three neighbors using population density,
percent of African-Americans, percent of Latinos, and the median income of the

20
neighborhood. I only included matched neighborhoods in the control group. Thus, there
were sixty control neighborhoods and twenty treatment neighborhoods.
Lastly, to help control for any spillover effects of the treatment, I removed
neighborhoods bordering the treated neighborhoods from the control group. There are
two possible types of spillover effects: crime could have been displaced from the
treatment neighborhoods to bordering neighborhoods, or crime in the bordering
neighborhoods could have decreased because people in these neighborhoods participated
in the Summer Night Lights activities. These spillover effects would contaminate the
control group, and thus affect the estimated impact of the program in divergent ways. If
crime was displaced to the bordering neighborhoods, it would exaggerate the crime-
reducing effect of the program. On the other hand, if the crime-decreasing influence of
the program spread to the bordering neighborhood it would mask the Summer Night
Lights initiative’s effect. Therefore, I excluded the bordering neighborhoods to arrive at
the most accurate estimate of the Summer Night Lights program’s impact on crime.
After removing bordering neighborhoods and using propensity score matching, twenty
treatment and sixty control neighborhoods remained the sample.
3.2 DETERMINING THE MECHANISM
Since the Summer Night Lights program involves more than increased lighting, it
provides an opportunity to clearly test between the “community pride” and “natural
surveillance” theories. Since I have information about the time each crime was
committed, I will also run both the differences-in-differences and fixed effects models
using only the hours that the program was operational (7 pm – 12 am). Thus, if I find a
different impact of the program on crime during those hours as compared to the daytime,

21
I can verify which theory is at work. If the “natural surveillance” theory actually
underlies the relationship between lighting and crime, the coefficient of treatment in the
nighttime regression should be much more negative than in the daytime regression.
However, if the coefficient of treatment in the daytime regression is roughly equal to its
counterpart in the nighttime regression, this suggests that the “community pride”
mechanism is at work.
In summary, I designed my study to examine three questions: did the Summer
Night Lights program have an impact on crime overall, did it influence violent crime in
particular and what was the mechanism by which it effected crime rates in Los Angeles?
4. DATA
I use mapped crime data from the Los Angeles Police Department between
January, 1 2009 and November 30, 2010. The Los Angeles Police Department records
the place of the crime, time of the crime and the type of crime. In my dataset, I only
include Part I crimes, violent and property crimes, because Part II crimes include
offenses like electronic fraud and tax evasion that would likely not be affected changes
in lighting. Below is a table summarizing the crime data I received from the LAPD/LA
Times.

22
Table 4.1 – Summary Statistics (Entire Dataset)
# of Neighborhoods 272
# of Treated Neighborhoods 20
Total Part I Crimes Recorded 355,572
Aggravated Assault 34,234
Burglary 61,924
Grand Theft Auto 56,554
Homicide 1,015
Rape 2,602
Theft 87,524
Theft from Vehicle 80,155
Examining the relationships among demographic variables, I find as expected that
higher population density correlates with higher proportion of Latinos and African-
Americans, and lower median income and proportion of college graduates (Appendix 1,
Table 1). In addition, the higher the percentage of Latinos and African-Americans in a
neighborhood, the lower the median income and proportion of college graduates. Below
is a table of summary statistics of the neighborhoods which participated in the program:
23
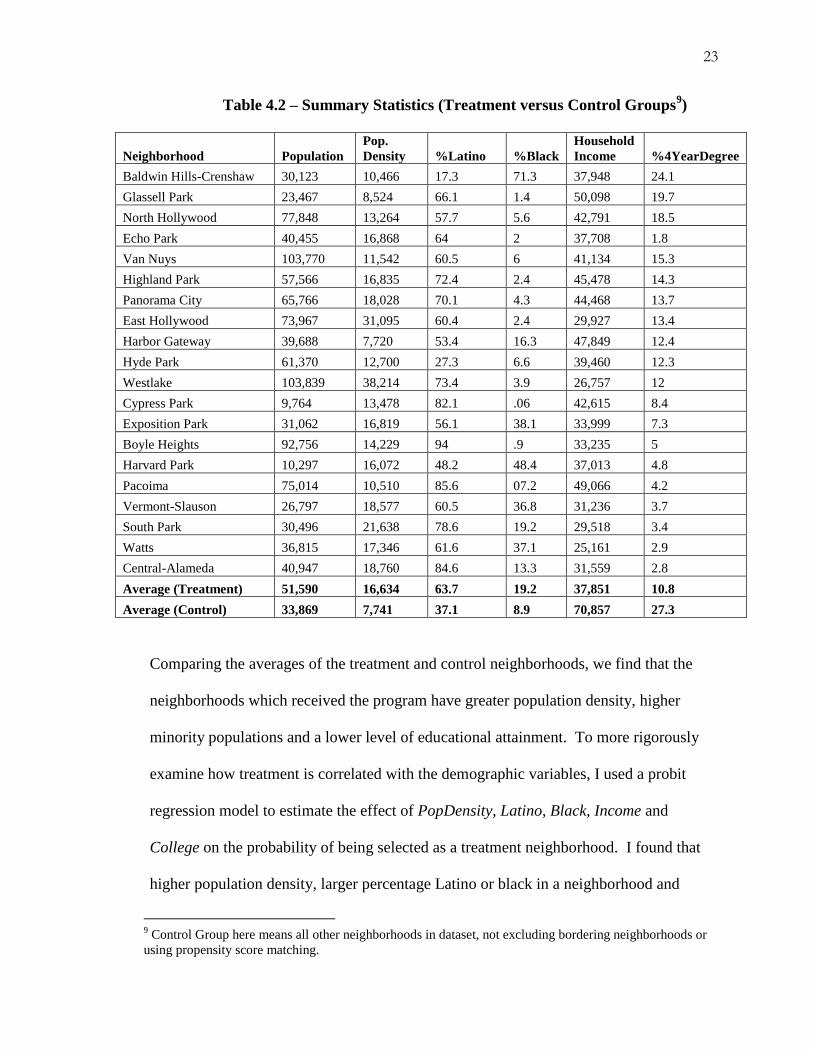
Table 4.2 – Summary Statistics (Treatment versus Control Groups9)
Neighborhood Population
Pop.
Density %Latino %Black
Household
Income %4YearDegree
Baldwin Hills-Crenshaw 30,123 10,466 17.3 71.3 37,948 24.1
Glassell Park 23,467 8,524 66.1 1.4 50,098 19.7
North Hollywood 77,848 13,264 57.7 5.6 42,791 18.5
Echo Park 40,455 16,868 64 2 37,708 1.8
Van Nuys 103,770 11,542 60.5 6 41,134 15.3
Highland Park 57,566 16,835 72.4 2.4 45,478 14.3
Panorama City 65,766 18,028 70.1 4.3 44,468 13.7
East Hollywood 73,967 31,095 60.4 2.4 29,927 13.4
Harbor Gateway 39,688 7,720 53.4 16.3 47,849 12.4
Hyde Park 61,370 12,700 27.3 6.6 39,460 12.3
Westlake 103,839 38,214 73.4 3.9 26,757 12
Cypress Park 9,764 13,478 82.1 .06 42,615 8.4
Exposition Park 31,062 16,819 56.1 38.1 33,999 7.3
Boyle Heights 92,756 14,229 94 .9 33,235 5
Harvard Park 10,297 16,072 48.2 48.4 37,013 4.8
Pacoima 75,014 10,510 85.6 07.2 49,066 4.2
Vermont-Slauson 26,797 18,577 60.5 36.8 31,236 3.7
South Park 30,496 21,638 78.6 19.2 29,518 3.4
Watts 36,815 17,346 61.6 37.1 25,161 2.9
Central-Alameda 40,947 18,760 84.6 13.3 31,559 2.8
Average (Treatment) 51,590 16,634 63.7 19.2 37,851 10.8
Average (Control) 33,869 7,741 37.1 8.9 70,857 27.3
Comparing the averages of the treatment and control neighborhoods, we find that the
neighborhoods which received the program have greater population density, higher
minority populations and a lower level of educational attainment. To more rigorously
examine how treatment is correlated with the demographic variables, I used a probit
regression model to estimate the effect of PopDensity, Latino, Black, Income and
College on the probability of being selected as a treatment neighborhood. I found that
higher population density, larger percentage Latino or black in a neighborhood and
9 Control Group here means all other neighborhoods in dataset, not excluding bordering neighborhoods or
using propensity score matching.

24
greater median incomes increase the probability of treatment, while the proportion of
college graduates does not affect the likelihood of treatment (Appendix 1, Table 2). The
disparity in demographic characteristics between the control and treatment groups and
the significant correlations between certain demographic variables and treatment
confirm that the Summer Night Lights program was not implemented randomly.
Looking for trends in the crime rate across the treated neighborhoods, I graphed
the average monthly crime rate. In the graph below, we find that the average crime rate
of the treated and control neighborhoods do not fluctuate much over the twenty-three
month period. However, the average crime rate of the control group is much lower than
the treatment group. In both groups, the only significant dips in crime occur in the
month of February possibly due to the fewer number of days in that month.
Figure 4.1 – Crime Trends (Treatment versus Control)

25
Next, to visualize the distribution of crime in the whole dataset, I generated the
following histogram of crimes per thousand people per week per neighborhood. The
histogram shows that crime is not normally distributed across neighborhoods and weeks,
and thus it makes sense to use a logistic regression.
Figure 4.2 – Distribution of Crime Rate
5. RESULTS
I have divided the results from the differences-in-differences and fixed effects
model by each level of specificity: overall weekly crime, violent crime, and daytime and
nighttime crime.
5.1 OVERALL WEEKLY CRIME
Tables 5.1 and 5.2 present the results of the differences-in-differences (D-D)
model for each year in the dataset. The first two columns display the results after
excluding bordering neighborhoods (“No Neighbors”) from the sample. In columns 3
and 4, I not only excluded bordering neighborhoods, but also used propensity score
matching to refine the control group further (“Using PS”). The D-D model controls for

26
time-invariant factors correlated with higher crime, population density, race and income
(coefficient estimates not displayed). Tables 5.1 and 5.2 suggest two conclusions. First,
as expected, the significant positive coefficients of treatment2009 show that being a
treatment neighborhood is associated with higher crime rates. A neighborhood included
in the program in 2009 has .108-1.223 or 5.61-43.1% more crimes per thousand people
per week. In addition, neighborhoods included in 2010 had 3.01- 6.45% higher crimes
per thousand people per week. Second, while some of the coefficients of the interaction
variables are negative, suggesting that the Summer Night Lights program reduced the
crime rate in the neighborhoods it in which it was implemented, these estimates are not
statistically different from zero.
Table 5.1 - 200910
Overall Crime (1)
(No Neighbors)
(2)
(No Neighbors)
(3)
(No Neighbors, Using
PS)
(4)
(No Neighbors, Using
PS)
VARIABLES Crimes per Week Ln(Crimes per Week) Crimes per Week Ln(Crimes per Week)
during2009 0.00431 -0.00206 -0.0185 -0.00301
(0.170) (0.0120) (0.0397) (0.0201)
treatment2008 -0.110 0.0161 0.0433 0.0189
(0.417) (0.0296) (0.0290) (0.0147)
treatment2009 1.136** 0.176*** 0.108*** 0.0561***
(0.494) (0.0350) (0.0297) (0.0150)
t08Xd09 -0.0178 -0.000522 0.00498 0.000709
(0.854) (0.0605) (0.0568) (0.0287)
t09Xd09 -0.0818 -0.0289 -0.0590 -0.0280
(1.003) (0.0711) (0.0623) (0.0315)
Observations 9,039 9,039 988 988
R-squared 0.026 0.061 0.245 0.294
10
In all tables: standard errors in parentheses, *** p<0.01, ** p<0.05, * p<0.1.
27
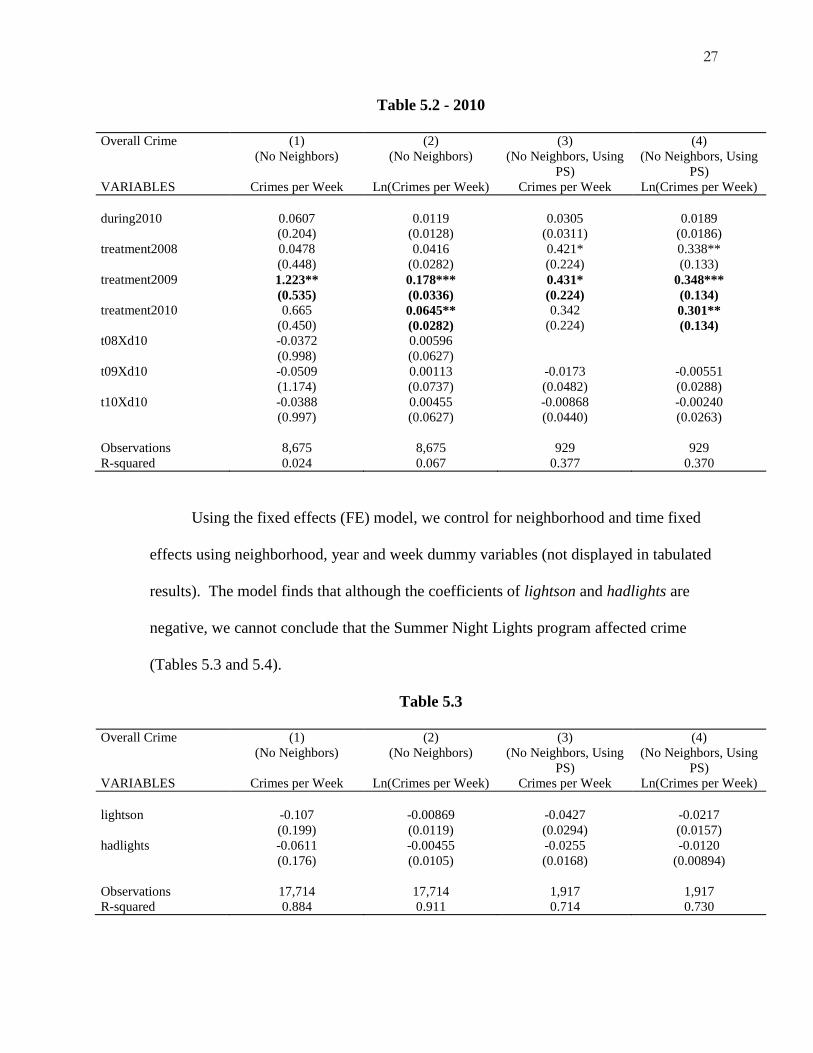
Table 5.2 - 2010
Overall Crime (1)
(No Neighbors)
(2)
(No Neighbors)
(3)
(No Neighbors, Using
PS)
(4)
(No Neighbors, Using
PS)
VARIABLES Crimes per Week Ln(Crimes per Week) Crimes per Week Ln(Crimes per Week)
during2010 0.0607 0.0119 0.0305 0.0189
(0.204) (0.0128) (0.0311) (0.0186)
treatment2008 0.0478 0.0416 0.421* 0.338**
(0.448) (0.0282) (0.224) (0.133)
treatment2009 1.223** 0.178*** 0.431* 0.348***
(0.535) (0.0336) (0.224) (0.134)
treatment2010 0.665 0.0645** 0.342 0.301**
(0.450) (0.0282) (0.224) (0.134)
t08Xd10 -0.0372 0.00596
(0.998) (0.0627)
t09Xd10 -0.0509 0.00113 -0.0173 -0.00551
(1.174) (0.0737) (0.0482) (0.0288)
t10Xd10 -0.0388 0.00455 -0.00868 -0.00240
(0.997) (0.0627) (0.0440) (0.0263)
Observations 8,675 8,675 929 929
R-squared 0.024 0.067 0.377 0.370
Using the fixed effects (FE) model, we control for neighborhood and time fixed
effects using neighborhood, year and week dummy variables (not displayed in tabulated
results). The model finds that although the coefficients of lightson and hadlights are
negative, we cannot conclude that the Summer Night Lights program affected crime
(Tables 5.3 and 5.4).
Table 5.3
Overall Crime (1)
(No Neighbors)
(2)
(No Neighbors)
(3)
(No Neighbors, Using
PS)
(4)
(No Neighbors, Using
PS)
VARIABLES Crimes per Week Ln(Crimes per Week) Crimes per Week Ln(Crimes per Week)
lightson -0.107 -0.00869 -0.0427 -0.0217
(0.199) (0.0119) (0.0294) (0.0157)
hadlights -0.0611 -0.00455 -0.0255 -0.0120
(0.176) (0.0105) (0.0168) (0.00894)
Observations 17,714 17,714 1,917 1,917
R-squared 0.884 0.911 0.714 0.730
28
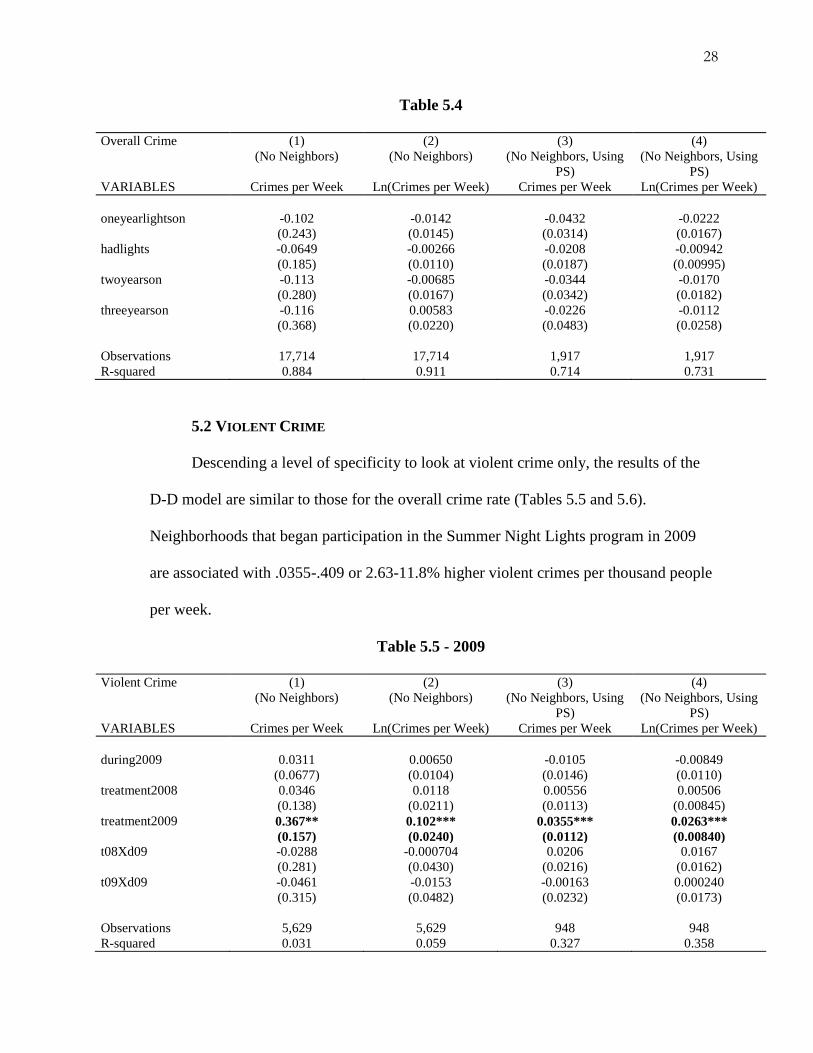
Table 5.4
Overall Crime (1)
(No Neighbors)
(2)
(No Neighbors)
(3)
(No Neighbors, Using
PS)
(4)
(No Neighbors, Using
PS)
VARIABLES Crimes per Week Ln(Crimes per Week) Crimes per Week Ln(Crimes per Week)
oneyearlightson -0.102 -0.0142 -0.0432 -0.0222
(0.243) (0.0145) (0.0314) (0.0167)
hadlights -0.0649 -0.00266 -0.0208 -0.00942
(0.185) (0.0110) (0.0187) (0.00995)
twoyearson -0.113 -0.00685 -0.0344 -0.0170
(0.280) (0.0167) (0.0342) (0.0182)
threeyearson -0.116 0.00583 -0.0226 -0.0112
(0.368) (0.0220) (0.0483) (0.0258)
Observations 17,714 17,714 1,917 1,917
R-squared 0.884 0.911 0.714 0.731
5.2 VIOLENT CRIME
Descending a level of specificity to look at violent crime only, the results of the
D-D model are similar to those for the overall crime rate (Tables 5.5 and 5.6).
Neighborhoods that began participation in the Summer Night Lights program in 2009
are associated with .0355-.409 or 2.63-11.8% higher violent crimes per thousand people
per week.
Table 5.5 - 2009
Violent Crime (1)
(No Neighbors)
(2)
(No Neighbors)
(3)
(No Neighbors, Using
PS)
(4)
(No Neighbors, Using
PS)
VARIABLES Crimes per Week Ln(Crimes per Week) Crimes per Week Ln(Crimes per Week)
during2009 0.0311 0.00650 -0.0105 -0.00849
(0.0677) (0.0104) (0.0146) (0.0110)
treatment2008 0.0346 0.0118 0.00556 0.00506
(0.138) (0.0211) (0.0113) (0.00845)
treatment2009 0.367** 0.102*** 0.0355*** 0.0263***
(0.157) (0.0240) (0.0112) (0.00840)
t08Xd09 -0.0288 -0.000704 0.0206 0.0167
(0.281) (0.0430) (0.0216) (0.0162)
t09Xd09 -0.0461 -0.0153 -0.00163 0.000240
(0.315) (0.0482) (0.0232) (0.0173)
Observations 5,629 5,629 948 948
R-squared 0.031 0.059 0.327 0.358

29
Table 5.6 - 2010
Violent Crime (1)
(No Neighbors)
(2)
(No Neighbors)
(3)
(No Neighbors, Using
PS)
(4)
(No Neighbors, Using
PS)
VARIABLES Crimes per Week Ln(Crimes per Week) Crimes per Week Ln(Crimes per Week)
during2010 0.0178 0.00802 0.0201 0.0147
(0.0880) (0.0121) (0.0167) (0.0130)
treatment2008 0.0795 0.0182 0.121* 0.107*
(0.157) (0.0216) (0.0718) (0.0560)
treatment2009 0.409** 0.0918*** 0.137* 0.118**
(0.182) (0.0250) (0.0722) (0.0563)
treatment2010 0.210 0.0255 0.116 0.103*
(0.152) (0.0209) (0.0721) (0.0562)
t08Xd10 -0.0195 0.00191 0.000287 0.000890
(0.348) (0.0478) (0.0223) (0.0174)
t09Xd10 -0.00422 0.00522
(0.391) (0.0537)
t10Xd10 -0.0187 -0.00243 0.0201 0.0147
(0.335) (0.0460) (0.0167) (0.0130)
Observations 5,296 5,296 887 887
R-squared 0.031 0.059 0.341 0.363
Using the FE model, I find that the Summer Night Lights Program weakly
reduces violent crime after the treatment period when controlling for time and
neighborhood fixed effects. Without excluding bordering neighborhoods or using
propensity score matching (“All”), the program decreases violent crime by 1.01% after
the treatment period (Table 5.7).
Table 5.7
Violent Crime (1)
(All)
(2)
(All)
(3)
(All, Using PS)
(4)
(All, Using PS)
VARIABLES Crimes per Week Ln(Crimes per Week) Crimes per Week Ln(Crimes per Week)
lightson -0.0459 -0.00645 0.00157 0.00177
(0.0632) (0.00656) (0.0144) (0.0111)
hadlights -0.0391 -0.0101* -0.00844 -0.00586
(0.0554) (0.00575) (0.00816) (0.00625)
Observations 14,178 14,178 1,938 1,938
R-squared 0.850 0.928 0.579 0.594

30
Table 5.8
Violent Crime (1)
(No Neighbors)
(2)
(No Neighbors)
(3)
(No Neighbors, Using
PS)
(4)
(No Neighbors, Using
PS)
VARIABLES Crimes per Week Ln(Crimes per Week) Crimes per Week Ln(Crimes per Week)
lightson -0.0641 -0.00863 -0.000838 -1.57e-05
(0.0753) (0.00701) (0.0148) (0.0113)
hadlights -0.0591 -0.0159*** -0.0132 -0.00951
(0.0662) (0.00616) (0.00853) (0.00651)
Observations 10,925 10,925 1,835 1,835
R-squared 0.851 0.940 0.582 0.597
Excluding bordering neighborhoods makes this result stronger (valid at higher
significance level), the Summer Night Lights program reduces violent crime by 1.6
percent (Table 5.8). However, the lagging impact of the program becomes statistically
insignificant when using a propensity score matching (Table 5.8, Columns 3 & 4). In
addition, as shown by the coefficient estimates in Table 5.9, the Summer Night Lights
project did not have a statistically significant differential impact on neighborhoods based
on the number of years of participation.
Table 5.9
Violent Crime (1)
(No Neighbors)
(2)
(No Neighbors)
(3)
(No Neighbors, Using
PS)
(4)
(No Neighbors, Using
PS)
VARIABLES Crimes per Week Ln(Crimes per Week) Crimes per Week Ln(Crimes per Week)
oneyearlightson -0.0530 -0.00779 -0.00146 -2.19e-05
(0.0907) (0.00844) (0.0157) (0.0120)
hadlights -0.0646 -0.0163** -0.0118 -0.00845
(0.0698) (0.00649) (0.00948) (0.00724)
twoyearson -0.0727 -0.00953 0.00224 0.00184
(0.106) (0.00987) (0.0174) (0.0133)
threeyearson -0.0925 -0.0101 0.00447 0.00476
(0.143) (0.0133) (0.0247) (0.0188)
Observations 10,925 10,925 1,835 1,835
R-squared 0.851 0.940 0.582 0.597

31
In summary, the results of the fixed effects model suggest that the Summer Night
Program only had a lagged effect on violent crime, reducing it 1.6% (Table 5.8).
5.3 NIGHTTIME CRIME
Turning to nighttime crime only, I again find using the D-D model that a)
treatment is positively associated with higher crime rates (estimated coefficient of
treatment2008, treatment2009 and treatment2010), and 2) the Summer Night Lights program
had no statistically significant effect on nighttime crime as shown by the estimated
coefficients of the interaction terms (Table 5.10 & 5.11). In addition, as shown in Table
5.10, I observe that the treatment period is associated with higher nighttime crime, as
suspected by the creators of the Summer Night Lights program (Summer Night Lights,
2010).
Table 5.10 - 2009
Nighttime Crime (1)
(No Neighbors)
(2)
(No Neighbors)
(3)
(No Neighbors, Using
PS)
(4)
(No Neighbors, Using
PS)
VARIABLES Crimes per Hour Ln(Crimes per Hour) Crimes per Hour Ln(Crimes per Hour)
during2009 0.000110 -0.00116 -0.00369 -0.00329
(0.0127) (0.00394) (0.00257) (0.00232)
treatment2008 -0.0410 -0.0154* 0.00643*** 0.00606***
(0.0256) (0.00793) (0.00215) (0.00194)
treatment2009 0.111*** 0.0401*** 0.0103*** 0.00943***
(0.0289) (0.00893) (0.00206) (0.00186)
t08Xd09 -0.00187 -0.00123 0.00100 0.000656
(0.0498) (0.0154) (0.00383) (0.00345)
t09Xd09 -0.00286 -6.28e-06 0.00349 0.00330
(0.0566) (0.0175) (0.00414) (0.00374)
Observations 18,997 18,997 3,471 3,471
R-squared 0.040 0.064 0.076 0.079

32
Table 5.11 - 2010
Nighttime Crime (1)
(No Neighbors)
(2)
(No Neighbors)
(3)
(No Neighbors, Using
PS)
(4)
(No Neighbors, Using
PS)
VARIABLES Crimes per Hour Ln(Crimes per Hour) Crimes per Hour Ln(Crimes per Hour)
during2010 0.0334** 0.0126*** 0.00735** 0.00684**
(0.0141) (0.00451) (0.00290) (0.00268)
treatment2008 0.00711 -0.00548 0.0111 0.0101
(0.0250) (0.00797) (0.0147) (0.0136)
treatment2009 0.138*** 0.0429*** 0.0117 0.0105
(0.0283) (0.00900) (0.0148) (0.0136)
treatment2010 0.0690*** 0.0106 0.00156 0.00123
(0.0227) (0.00724) (0.0147) (0.0136)
t08Xd10 -0.0302 -0.00904
(0.0546) (0.0174)
t09Xd10 -0.0270 -0.00609
(0.0608) (0.0194)
t10Xd10 -0.0303 -0.00726 -6.38e-05 1.41e-05
(0.0484) (0.0154) (0.00368) (0.00340)
Observations 17,721 17,721 3,307 3,307
R-squared 0.048 0.071 0.109 0.110
Using the FE model, we observe that the Summer Night Lights program weakly
reduces nighttime crime both during and after the treatment period after excluding
bordering neighborhoods (Table 5.12). During the treatment period, nighttime crime
reduces by .55% and after the treatment period it decreases by .49%.
Table 5.12
Nighttime Crime (No Neighbors) (No Neighbors) (No Neighbors, Using
PS)
(No Neighbors, Using
PS)
VARIABLES Crimes per Hour Ln(Crimes per Hour) Crimes per Hour Ln(Crimes per Hour)
lightson -0.0217 -0.00548* -0.00129 -0.00113
(0.0145) (0.00306) (0.00250) (0.00228)
hadlights -0.0165 -0.00486* -0.00138 -0.00110
(0.0128) (0.00271) (0.00149) (0.00135)
Observations 36,718 36,718 6,778 6,778
R-squared 0.791 0.907 0.415 0.415
However, the impact of the program again diminishes, becoming statistically
insignificant when using propensity score matching. This is the second time that the

33
perceived impact seems to hold when excluding bordering neighborhoods, but not when
also using propensity score matching.
When trying to determine whether multiple years of inclusion in the program has
a differential effect on nighttime crime, I cannot conclude with any certainty that any
number of years of participation has an influence, even though the signs of the
coefficients of oneyearlightson, twoyearson, and threeyearson suggest a reduction in
nighttime crime (Table 5.13).
Table 5.13
Nighttime Crime (No Neighbors) (No Neighbors) (No Neighbors, Using
PS)
(No Neighbors, Using
PS)
VARIABLES Crimes per Hour Ln(Crimes per Hour) Crimes per Hour Ln(Crimes per Hour)
oneyearlightson -0.0176 -0.00387 -0.000365 -0.000243
(0.0171) (0.00363) (0.00266) (0.00243)
hadlights -0.0189 -0.00553* -0.00176 -0.00148
(0.0136) (0.00287) (0.00166) (0.00151)
twoyearson -0.0238 -0.00692 -0.00278 -0.00257
(0.0207) (0.00438) (0.00295) (0.00269)
threeyearson -0.0379 -0.00900 -0.000814 -0.000708
(0.0285) (0.00603) (0.00429) (0.00391)
Observations 36,704 36,704 6,784 6,784
R-squared 0.791 0.907 0.415 0.415
To summarize, the Summer Night Lights program has a weak negative effect on
nighttime crime, reducing crimes per thousand people per hour by about .55% (Table
5.12) during the treatment period and .49-.55% after (Tables 5.12-3). From these
results, I can conclude that the impact of the program is weaker on nighttime crime than
violent crime.
Given the disparate results from examining nighttime and violent crime
individually, I looked at the Summer Night Lights program on nighttime violent crime.
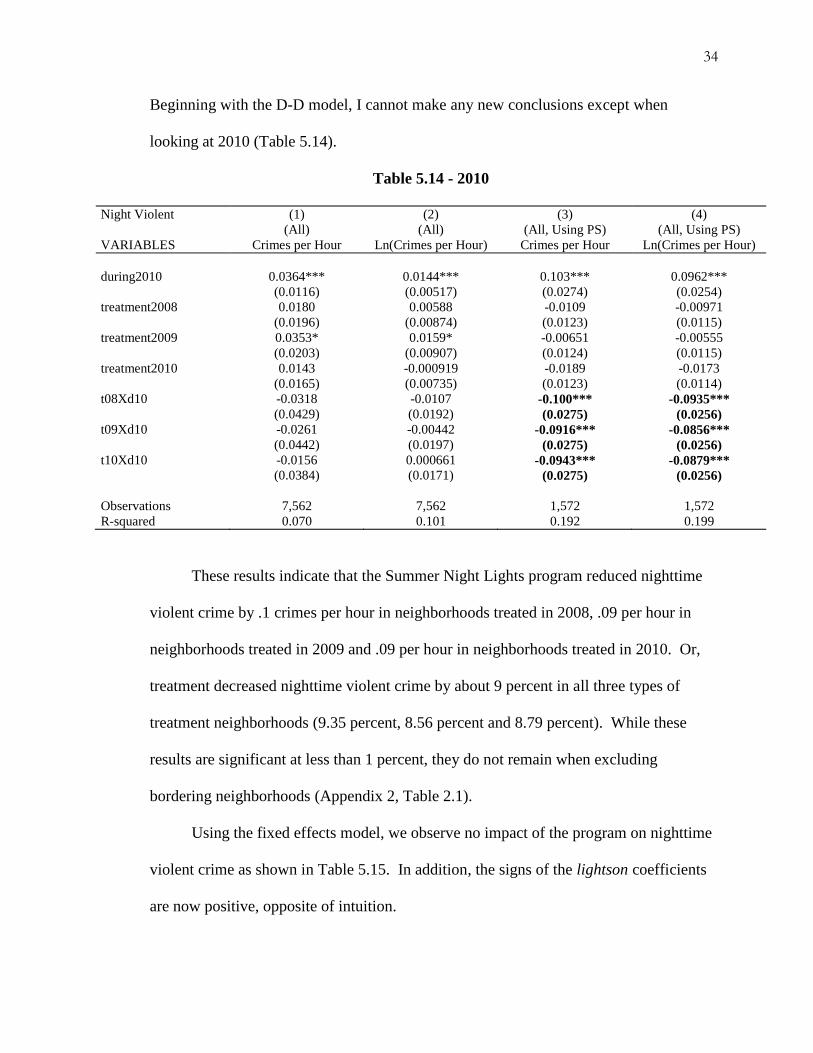
34
Beginning with the D-D model, I cannot make any new conclusions except when
looking at 2010 (Table 5.14).
Table 5.14 - 2010
Night Violent (1)
(All)
(2)
(All)
(3)
(All, Using PS)
(4)
(All, Using PS)
VARIABLES Crimes per Hour Ln(Crimes per Hour) Crimes per Hour Ln(Crimes per Hour)
during2010 0.0364*** 0.0144*** 0.103*** 0.0962***
(0.0116) (0.00517) (0.0274) (0.0254)
treatment2008 0.0180 0.00588 -0.0109 -0.00971
(0.0196) (0.00874) (0.0123) (0.0115)
treatment2009 0.0353* 0.0159* -0.00651 -0.00555
(0.0203) (0.00907) (0.0124) (0.0115)
treatment2010 0.0143 -0.000919 -0.0189 -0.0173
(0.0165) (0.00735) (0.0123) (0.0114)
t08Xd10 -0.0318 -0.0107 -0.100*** -0.0935***
(0.0429) (0.0192) (0.0275) (0.0256)
t09Xd10 -0.0261 -0.00442 -0.0916*** -0.0856***
(0.0442) (0.0197) (0.0275) (0.0256)
t10Xd10 -0.0156 0.000661 -0.0943*** -0.0879***
(0.0384) (0.0171) (0.0275) (0.0256)
Observations 7,562 7,562 1,572 1,572
R-squared 0.070 0.101 0.192 0.199
These results indicate that the Summer Night Lights program reduced nighttime
violent crime by .1 crimes per hour in neighborhoods treated in 2008, .09 per hour in
neighborhoods treated in 2009 and .09 per hour in neighborhoods treated in 2010. Or,
treatment decreased nighttime violent crime by about 9 percent in all three types of
treatment neighborhoods (9.35 percent, 8.56 percent and 8.79 percent). While these
results are significant at less than 1 percent, they do not remain when excluding
bordering neighborhoods (Appendix 2, Table 2.1).
Using the fixed effects model, we observe no impact of the program on nighttime
violent crime as shown in Table 5.15. In addition, the signs of the lightson coefficients
are now positive, opposite of intuition.

35
Table 5.15
Night Violent (1)
(No Neighbors)
(2)
(No Neighbors)
(3)
(No Neighbors, Using
PS)
(4)
(No Neighbors, Using
PS)
VARIABLES Crimes per Hour Ln(Crimes per Hour) Crimes per Hour Ln(Crimes per Hour)
lightson 0.00187 0.00178 3.81e-05 0.000109
(0.00841) (0.00745) (0.00246) (0.00224)
hadlights -0.00422 -0.00400 -0.00142 -0.00127
(0.00716) (0.00634) (0.00149) (0.00137)
Observations 4,570 4,570 3,290 3,290
R-squared 0.652 0.657 0.611 0.611
As presented in Table 5.16, I observe no differential effect of multiple years of
participation in the Summer Night Lights program. When excluding bordering
neighborhoods, I find that the program has a lagged effect, decreasing nighttime violent
crime by 6.6%.
Table 5.16
Night Violent (1)
(No Neighbors)
(2)
(No Neighbors)
(3)
(No Neighbors, Using
PS)
(4)
(No Neighbors, Using
PS)
VARIABLES Crimes per Hour Ln(Crimes per Hour) Crimes per Hour Ln(Crimes per Hour)
oneyearlightson -0.0151 -0.00456 -0.000623 -0.000455
(0.0162) (0.00501) (0.00260) (0.00237)
hadlights -0.0172 -0.00662* -0.00227 -0.00210
(0.0125) (0.00387) (0.00166) (0.00152)
twoyearson -0.0216 -0.00674 -0.00108 -0.00103
(0.0194) (0.00600) (0.00296) (0.00270)
threeyearson -0.0397 -0.0139* -0.00526 -0.00480
(0.0271) (0.00840) (0.00433) (0.00396)
Observations 11,594 11,594 3,290 3,290
R-squared 0.827 0.894 0.612 0.612
5.4 DAYTIME CRIME
To determine whether the “surveillance” theory or “community confidence”
theory better explains the effect of increased lighting on crime, I will compare the results
of the D-D and FE models when limiting the dataset to either nighttime or daytime crime

36
only. Looking at both the magnitude of the estimated coefficients of either the
interaction terms or lightson and hadlights, and the statistical significance level of those
estimates, I can determine which theory better explicates the mechanism.
Table 5.17 displays the results from the D-D model restricting the dataset to 2009,
and then excluding bordering neighborhoods (Columns 1-2) and using propensity
matching (Columns 3-4) to improve the control group. In neighborhoods that were
included in the initiative beginning in 2009, the Summer Night Lights program reduced
daytime crimes per thousand people per hour by .0051 crimes or .45%.
Table 5.17
(1)
(No Neighbors)
(2)
(No Neighbors)
(3)
(No Neighbors,
Using PS)
(4)
(No Neighbors,
Using PS)
VARIABLES Crimes per Hour Ln(Crimes per
Hour)
Crimes per Hour Ln(Crimes per
Hour)
during2009 0.00241 0.00142 -0.00257** -0.00242**
(0.00670) (0.00229) (0.00125) (0.00114)
treatment2008 -0.0306** -0.0138*** 0.00807*** 0.00748***
(0.0134) (0.00457) (0.00104) (0.000954)
treatment2009 0.112*** 0.0481*** 0.0153*** 0.0141***
(0.0149) (0.00507) (0.000987) (0.000901)
t08Xd09 -0.000234 -0.00126 0.000973 0.000954
(0.0272) (0.00930) (0.00191) (0.00175)
t09Xd09 -0.00469 -0.00616 -0.00508** -0.00454**
(0.0300) (0.0102) (0.00204) (0.00186)
Observations 55,000 55,000 9,962 9,962
R-squared 0.048 0.079 0.147 0.153
However, when looking at 2010, the coefficients of the interaction variables are no longer
significant (Table 5.18).

37
Table 5.18
(1)
(No Neighbors)
(2)
(No Neighbors)
(3)
(No Neighbors,
Using PS)
(4)
(No Neighbors,
Using PS)
VARIABLES Crimes per Hour Ln(Crimes per
Hour)
Crimes per Hour Ln(Crimes per
Hour)
during2010 0.0245*** 0.0107*** -0.00775 -0.00757
(0.00818) (0.00269) (0.0364) (0.0332)
treatment2008 -0.0128 -0.00916* 0.000430 5.29e-05
(0.0144) (0.00473) (0.0163) (0.0149)
treatment2009 0.131*** 0.0498*** 0.00476 0.00392
(0.0163) (0.00534) (0.0163) (0.0149)
treatment2010 0.0616*** 0.0131*** -0.00932 -0.00908
(0.0132) (0.00433) (0.0163) (0.0149)
t08Xd10 -0.0133 -0.000881 0.0180 0.0169
(0.0309) (0.0101) (0.0364) (0.0332)
t09Xd10 -0.00982 -0.000603 0.0160 0.0151
(0.0348) (0.0114) (0.0364) (0.0332)
t10Xd10 -0.0243 -0.00880 0.0111 0.0107
(0.0276) (0.00906) (0.0364) (0.0332)
Observations 51,760 51,760 9,699 9,699
R-squared 0.046 0.077 0.162 0.167
Using the FE model without excluding bordering neighborhoods or using propensity
score matching, I observe that the Summer Night Lights program decreases daytime
crimes by .012 crimes per thousand people per hour or .38% (Table 5.19, Columns 1-2)
and by .0029 crimes or .26% when using propensity score matching (Columns 3-4).
Table 5.19
(1)
(All)
(2)
(All)
(3)
(All, Using PS)
(4)
(All, Using PS)
VARIABLES Crimes per Hour Ln(Crimes per
Hour)
Crimes per Hour Ln(Crimes per
Hour)
lightson -0.0117* -0.00380** -0.00290** -0.00255**
(0.00707) (0.00172) (0.00130) (0.00119)
hadlights -0.00580 -0.00163 -0.00259*** -0.00231***
(0.00626) (0.00152) (0.000750) (0.000685)
Observations 139,236 139,236 20,459 20,459
R-squared 0.764 0.881 0.428 0.435

38
In contrast to the results from studying nighttime and violent crime, I find that the lagged
effect of the Summer Night Lights program becomes only apparent after using propensity
score matching (Columns 3-4). Specifically, the initiative decreased daytime crime by
.0026 crimes per thousand people per hour or .23%.
Even when refining the control group by controlling for spillover effects (Table
5.20, Columns 1-2) and using propensity score matching (Columns 3-4), the statistically
significant impact of the Summer Night Lights program remains:
Table 5.20
(1)
(No Neighbors)
(2)
(No Neighbors)
(3)
(No Neighbors,
Using PS)
(4)
(No Neighbors,
Using PS)
VARIABLES Crimes per Hour Ln(Crimes per
Hour)
Crimes per Hour Ln(Crimes per
Hour)
lightson -0.0159* -0.00519*** -0.00375*** -0.00333***
(0.00840) (0.00200) (0.00134) (0.00122)
hadlights -0.00858 -0.00256 -0.00304*** -0.00271***
(0.00743) (0.00177) (0.000779) (0.000710)
Observations 106,760 106,760 19,661 19,661
R-squared 0.763 0.884 0.441 0.446
The FE model estimates that the program reduced daytime crime by .0038-.0159 crimes
per thousand people per hour or .33-.52% (Table 5.20). In addition, the initiative had a
negative lagged effect on daytime crime equal to .00304 crimes per thousand people per
hour or .27%.
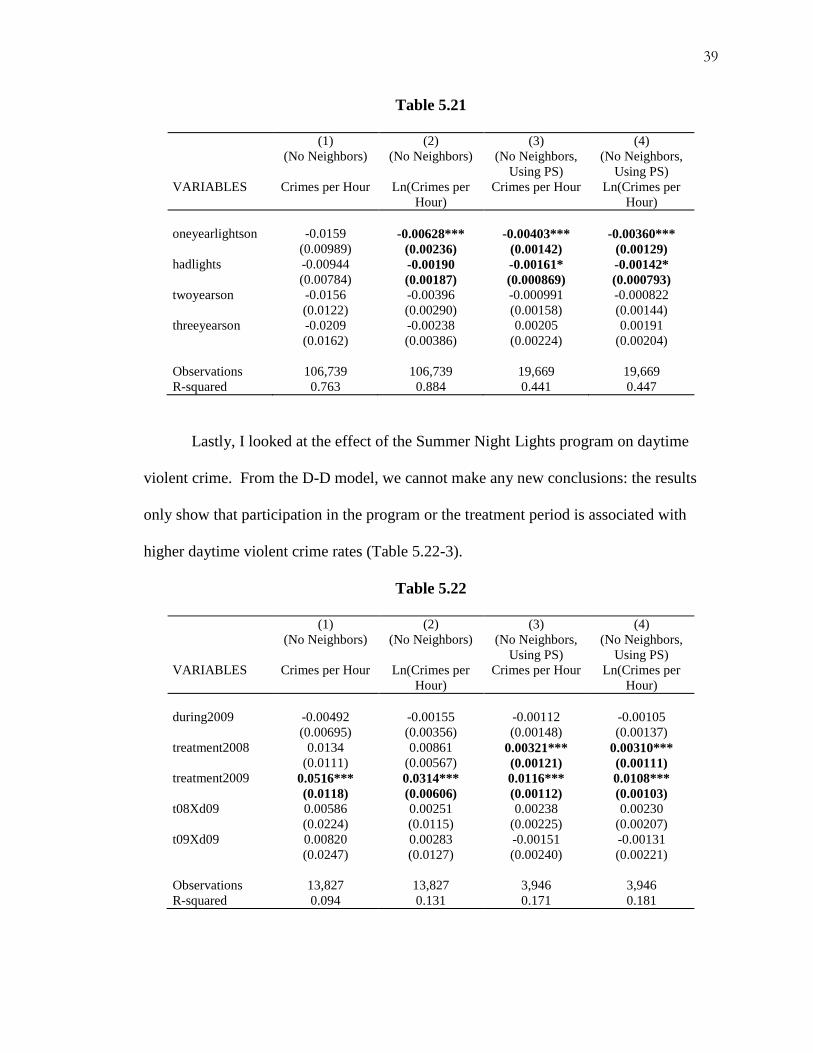
Turning to an examination of the differential impact of the program on daytime
crime, I find that multiple years of participation Summer Night Lights program did not
result in a greater reduction in crime. Table 5.21 shows that when using the strictest
constraints on the dataset, daytime crime reduced by .004 crimes per thousand people per
hour or .36% and by .63% when only controlling for spillover effects.
39
Table 5.21
(1)
(No Neighbors)
(2)
(No Neighbors)
(3)
(No Neighbors,
Using PS)
(4)
(No Neighbors,
Using PS)
VARIABLES Crimes per Hour Ln(Crimes per
Hour)
Crimes per Hour Ln(Crimes per
Hour)
oneyearlightson -0.0159 -0.00628*** -0.00403*** -0.00360***
(0.00989) (0.00236) (0.00142) (0.00129)
hadlights -0.00944 -0.00190 -0.00161* -0.00142*
(0.00784) (0.00187) (0.000869) (0.000793)
twoyearson -0.0156 -0.00396 -0.000991 -0.000822
(0.0122) (0.00290) (0.00158) (0.00144)
threeyearson -0.0209 -0.00238 0.00205 0.00191
(0.0162) (0.00386) (0.00224) (0.00204)
Observations 106,739 106,739 19,669 19,669
R-squared 0.763 0.884 0.441 0.447
Lastly, I looked at the effect of the Summer Night Lights program on daytime
violent crime. From the D-D model, we cannot make any new conclusions: the results
only show that participation in the program or the treatment period is associated with
higher daytime violent crime rates (Table 5.22-3).
Table 5.22
(1)
(No Neighbors)
(2)
(No Neighbors)
(3)
(No Neighbors,
Using PS)
(4)
(No Neighbors,
Using PS)
VARIABLES Crimes per Hour Ln(Crimes per
Hour)
Crimes per Hour Ln(Crimes per
Hour)
during2009 -0.00492 -0.00155 -0.00112 -0.00105
(0.00695) (0.00356) (0.00148) (0.00137)
treatment2008 0.0134 0.00861 0.00321*** 0.00310***
(0.0111) (0.00567) (0.00121) (0.00111)
treatment2009 0.0516*** 0.0314*** 0.0116*** 0.0108***
(0.0118) (0.00606) (0.00112) (0.00103)
t08Xd09 0.00586 0.00251 0.00238 0.00230
(0.0224) (0.0115) (0.00225) (0.00207)
t09Xd09 0.00820 0.00283 -0.00151 -0.00131
(0.0247) (0.0127) (0.00240) (0.00221)
Observations 13,827 13,827 3,946 3,946
R-squared 0.094 0.131 0.171 0.181

40
Table 5.23
(1)
(No Neighbors)
(2)
(No Neighbors)
(3)
(No Neighbors,
Using PS)
(4)
(No Neighbors,
Using PS)
VARIABLES Crimes per Hour Ln(Crimes per
Hour)
Crimes per Hour Ln(Crimes per
Hour)
during2010 0.0171 0.00809* 0.0587*** 0.0474***
(0.0107) (0.00473) (0.0187) (0.0168)
treatment2008 0.0277* 0.0178*** -0.0719*** -0.0628***
(0.0151) (0.00671) (0.00979) (0.00882)
treatment2009 0.0810*** 0.0427*** -0.0653*** -0.0567***
(0.0168) (0.00744) (0.00983) (0.00885)
treatment2010 0.0581*** 0.0250*** -0.0780*** -0.0685***
(0.0139) (0.00618) (0.00980) (0.00882)
t08Xd10 -0.0145 -0.00488 -0.0529*** -0.0418**
(0.0318) (0.0141) (0.0188) (0.0169)
t09Xd10 -0.0151 -0.00422 -0.0524*** -0.0414**
(0.0359) (0.0159) (0.0188) (0.0170)
t10Xd10 -0.0176 -0.00698 -0.0555*** -0.0442***
(0.0279) (0.0124) (0.0188) (0.0169)
Observations 12,733 12,733 3,650 3,650
R-squared 0.079 0.131 0.169 0.181
From the fixed effects model, we arrive at a result similar to when studying
daytime crime overall: the program decreased crime both during and after the treatment
period. Table 5.24 shows that daytime violent crime was reduced by .012 crimes per
thousand people per neighborhood or .50% when excluding neighborhoods, but this
estimate becomes insignificant when using propensity score matching. The model
estimates the lagged decrease in daytime violent crime due to the program equal to .0018
- .011 crimes per thousand people per hour or .16-.42% (Table 5.24). However, there is
no differential effect for multiple years of participation in the initiative (Table 5.25).

41
Table 5.24
(1)
(No Neighbors)
(2)
(No Neighbors)
(3)
(No Neighbors,
Using PS)
(4)
(No Neighbors,
Using PS)
VARIABLES Crimes per Hour Ln(Crimes per
Hour)
Crimes per Hour Ln(Crimes per
Hour)
lightson -0.0122* -0.00489* -0.00226 -0.00196
(0.00737) (0.00266) (0.00149) (0.00134)
hadlights -0.0107* -0.00420* -0.00178** -0.00156**
(0.00638) (0.00230) (0.000851) (0.000769)
Observations 26,560 26,560 7,596 7,596
R-squared 0.803 0.890 0.586 0.598
Table 5.25
(1)
(No Neighbors)
(2)
(No Neighbors)
(3)
(No Neighbors,
Using PS)
(4)
(No Neighbors,
Using PS)
VARIABLES Crimes per Hour Ln(Crimes per
Hour)
Crimes per Hour Ln(Crimes per
Hour)
oneyearlightson -0.0105 -0.00506 -0.00235 -0.00202
(0.00865) (0.00312) (0.00158) (0.00142)
hadlights -0.0110 -0.00402 -0.000568 -0.000428
(0.00683) (0.00246) (0.000952) (0.000860)
twoyearson -0.00998 -0.00310 0.000307 0.000433
(0.0107) (0.00385) (0.00175) (0.00158)
threeyearson -0.0204 -0.00669 0.000776 0.000951
(0.0144) (0.00519) (0.00249) (0.00225)
Observations 26,566 26,566 7,598 7,598
R-squared 0.802 0.890 0.587 0.599
6. CONCLUSION
In this study, I had two main questions: did the Summer Night Lights program
reduce crime and if so, by what mechanism? To answer the first question, I used a
differences-in-differences model and fixed effects model to measure the impact of the
program on crime overall (crimes per week per thousand people) and violent crime
(aggravated assault, rape, homicide and robbery). There are two possible mechanisms by
which increased lighting reduces crime (Farrington and Welsh 2002). Both theories

42
argue that improved lighting affects p, the probability of apprehension, in a criminal’s
expected utility function. However, the two theories give different reasons for how
improved lighting affects p. The first theory (surveillance theory) posits that increased or
improved lighting increases the probability of arrest by facilitating surveillance by both
residents and police. The second theory (community pride theory) suggests that
increased or improved lighting signals greater community investment leading to
increased community pride, cohesion and informal social control. Greater community
pride then motivates residents to report crimes more often. By comparing the impact of
the Summer Night Lights program on nighttime crime to daytime crime, we can identify
which mechanism is at work. If the reduction of nighttime crime is greater than the
decrease in crime overall, we can conclude that the first theory explains the relationship
between lighting on crime.
Table 6.1 summarizes the results of this study, displaying the crime-reducing
impact of the Summer Night Lights program on each type of crime.
Table 6.1
Overall
Crime
Violent Night Night-
Violent
Day Day-Violent
D-D No effect No effect No effect 8.6-8.4%***
(2010)
.45%**
(2009)
No effect
FE – during
treatment
period
No effect No effect .55%* No effect .33%*** .50%*
FE – after
treatment
period
No effect 1.6%*** .49-.55%*** .66%* .27%*** .16%**

43
Looking only at the results of the differences-in-differences model, the Summer
Night Lights program did not have much of an impact on crime in Los Angeles. In 2010,
when restricting the dataset to nighttime violent crime we find that treatment reduced
crimes by about .1 crimes per hour or 9 percent. On the other hand, in 2009, the program
decreased daytime crime by .45%. These results provide a confusing result: both the
surveillance theory and community confidence theory are at work because both night and
daytime crime dropped. However, I will later argue that the differences-in-differences
model did not accurately capture the impact of the Summer Night Lights program.
On the other hand, the results of the fixed effects specification draw a clearer
picture of the relationship between crime and the Summer Night Lights program. The
Summer Night Lights program had a lagged effect on violent (-1.6%), nighttime (-.5%),
nighttime violent (-.66%), daytime (-.27%) and daytime violent (-.16%) crime. In
addition, the program reduced nighttime (-.55%), daytime (-.33%) and daytime violent (-
.5%) crime during the treatment period. These results suggest that both the surveillance
and community confidence theories at work; the surveillance theory explains the greater
drop in nighttime crime as compared to daytime crime during the treatment period, and
the community confidence theory explicates the lagged effect of the program on violent,
nighttime and daytime crime. Thus, I cannot conclude with certainty which theory best
explicates the relationship between lighting and crime.
The lack of results from the differences-in-differences model can be attributed to
three issues with the approach itself. First, D-D requires four distinct groups for it to
isolate the impact of treatment: the control group before the change, the control group
after the change, the treatment group before the change, and the treatment group after the

44
change (Wooldridge 2006). The Summer Night Lights program and the data I received
made it difficult to divide the dataset into those four groups cleanly. For the
neighborhoods that started the Summer Night Lights program in 2008, the entire time
period of the dataset (2009 and 2010) was technically “after treatment.” Thus, for those
neighborhoods, the entire dataset had been tainted; the crime rates observed in the
summer of 2009 and 2010 were affected by the crime rate in the summer of 2008.
Moreover, no “baseline” crime rate existed for the inaugural neighborhoods. Due to an
inability to obtain earlier years of crime data, I have to simply recognize this
shortcoming. Second, two identification assumptions must be maintained in D-D
estimations (Besley & Case 2000): 1) apart from the control variables included, there are
no other forces affecting the treatment and control groups differentially pre- and post-
treatment, and 2) the composition of the treatment group and control group must remain
stable over the time period. While I controlled for population density, racial makeup and
income, there may have been time-varying unobservable factors that affected the
treatment and control groups, such as gang activity or unemployment. In addition, the
composition of the treatment and control groups was not static because six neighborhoods
entered the program in 2009 and seven neighborhoods joined the program in 2010. I
addressed this issue by creating three separate treatment groups: treatment2008,
treatment2009 and treatment2010. Even with all of these difficulties with the D-D model, I
chose to utilize it because of its simplicity and ability to control for time-invariant
unobservable variables.
Two major flaws hindered this study. First, it would have been helpful to have
crime data from before the Summer Night Lights program was ever implemented (pre-

45
2008). This would have helped establish a better baseline crime rate of each
neighborhood. Specifically, both models could have provided better results if there were
more time periods (years) in the dataset. Second, the Summer Night Lights program
aimed to reduce gang activity and gang-related violence. The crime statistics did not
reflect gang activity completely because it did not include drug-related arrests
(possession, trafficking, etc.) Thus, the program could have had a major role in reducing
drug crimes, but it would not have appeared in this study.
I believe that much research still remains to be done on this issue and it is relevant
to the larger question of what are the best ways to reduce crime. Crime prevention
initiatives are often costly, on average the LAPD spends 4.29 million dollars per
neighborhood, and thus finding cost-effective ways to reduce crime is important. The
Summer Night Lights program cost 5.4 million dollars this past year. Using the RAND
Corporation’s Cost of Crime calculator, I calculated that daytime crime in the treatment
neighborhoods cost 2.64 million dollars and nighttime crime cost 1.25 million dollars.11
If the Summer Night Lights program reduced daytime and nighttime crime by .33% and
.5% respectively, I estimate that the program saved a total of $14,422 of crime. On the
other hand, the value of each additional police officer is $361,501 in less crime.12
Thus,
Summer Night Lights was not a cost-effective crime prevention initiative.
11
"Cost of Crime Calculator." RAND Corporation. <http://www.rand.org/ise/centers/quality_policing/cost-
of-crime.html>. 12
Ibid.

46
Appendix 1
Table 1
Correlation Coefficient Table
Pop. Density Latino Black Income College
Pop. Density 1.000
Latino .5051 1.0000
Black .1770 -.0244 1.0000
Income -.4346 -.4595 -.2498 1.0000
College -.3635 -.7871 -.2452 .5846 1.0000
Table 2
Probit Regression:
(1) (2)
EQUATION VARIABLES treatment treatment
Treatment PopDensity .000024*** 6.06e-05***
(2.50e-06) (2.03e-05)
Latino 1.2041*** 1.938
(0.0843) (1.387)
Black 1.0926*** 2.164**
(0.0920) (1.064)
Income -.000036***
(1.59e-06)
College -0.000087
(0.23785)
Constant -.7298*** -3.467***
(0.12177) (1.267)
Observations 264 264
Standard errors in parentheses
*** p<0.01, ** p<0.05, * p<0.1
Appendix 2
Table 2.1
(5) (6) (7) (8)
VARIABLES crimesperthousa
nd
lncrimerate crimesperthousa
nd
lncrimerate
during2010 0.00784*** 0.00722*** 0.0143** 0.0135**
(0.00189) (0.00171) (0.00614) (0.00584)
treatment2008
treatment2009 -0.00172 -0.00156
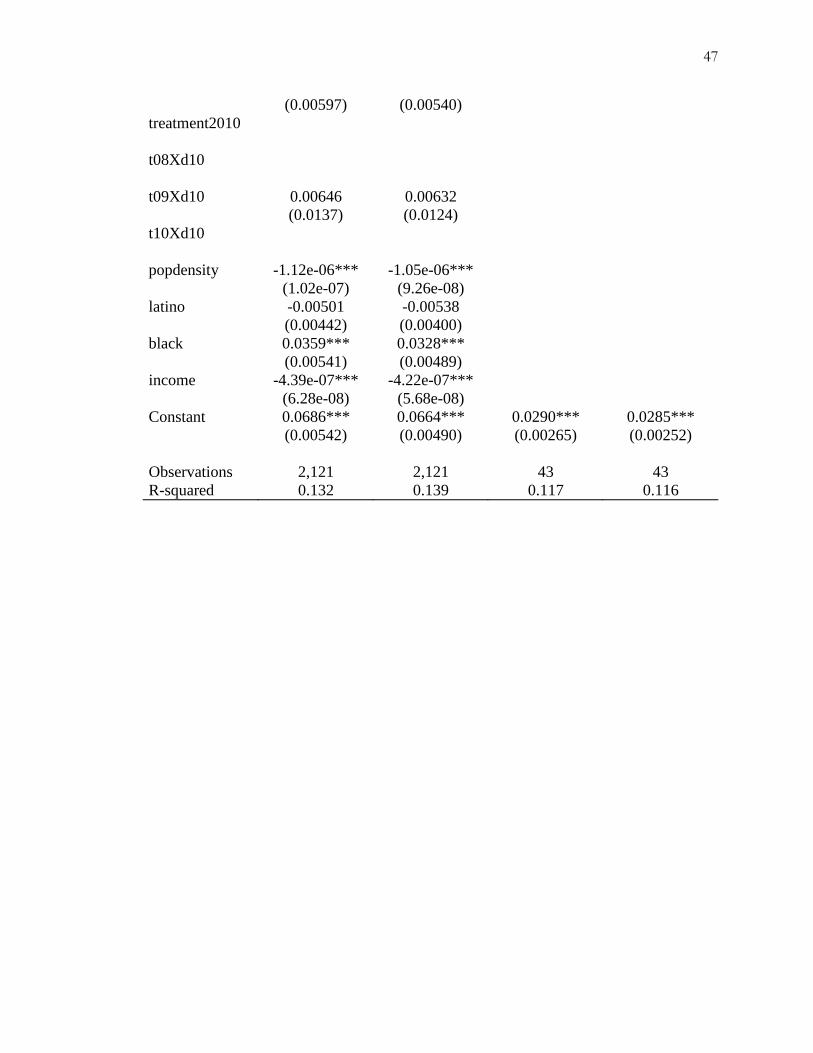
47
(0.00597) (0.00540)
treatment2010
t08Xd10
t09Xd10 0.00646 0.00632
(0.0137) (0.0124)
t10Xd10
popdensity -1.12e-06*** -1.05e-06***
(1.02e-07) (9.26e-08)
latino -0.00501 -0.00538
(0.00442) (0.00400)
black 0.0359*** 0.0328***
(0.00541) (0.00489)
income -4.39e-07*** -4.22e-07***
(6.28e-08) (5.68e-08)
Constant 0.0686*** 0.0664*** 0.0290*** 0.0285***
(0.00542) (0.00490) (0.00265) (0.00252)
Observations 2,121 2,121 43 43
R-squared 0.132 0.139 0.117 0.116

48
REFERENCES
Angel, S. (1968). Discouraging Crime Through City Planning. Berkeley: University of
California.
Becker, G. (1968). Crime and punishment: An economic approach. Journal of Political
Economy , 169-217.
Becker, G. (1976). The Economic Approach to Human Behavior. Chicago: University of
Chicago Press.
Bennett, T. H., & Wright, R. (1984). Burglars on Burglary. Farnbourough: Hants.
Bentham, J. (1789). An introduction to the principles of morals and legislation. In The
Utilitarians. Garden City, NY: Anchor Books.
Besley, T., & Case, A. (2000). Unnatural Experiments? Estimating the Incidence of
Endogenous Policies. The Economic Journal , 672-694.
Brow, W. W., & Reynolds, M. O. (1973). Crime and Punishment: Risk Implications.
Journal of Economic Theory , 508-514.
Cathcart, R. (2009, July 11). Lighting Up Tough Parks' Darkness. Retrieved November
31, 2010, from New York Times: http://www.nytimes.com/2009/07/12/us/12park.html
Clarke, R. V. (1995). Situational crime prevention. In M. Tonry, & D. P. Farrington,
Building a Safer Society: Strategic Approaches to Crime Prevention (pp. 91-150).
Chicago: University of Chicago Press.
Crime and Arrest Weekly Statistics. (2009, December 31). Retrieved March 21, 2011,
from Los Angeles Police Department:
www.lapdonline.org/read_the_beat_magazine/pdf_view/43819
Eide, E., Rubin, P., & Shepard, J. (2006). Economics of Crime. Microeconomics , 205-
279.
Farrington, D., & Welsh, B. (2002). Effects of improved street lighting on crime: a
systematic review. London: Home Office.
Gold, S. (2010, October 31). Crime falls 40% in neighborhoods with Summer Night
Lights program. Retrieved October 31, 2010, from Los Angeles Times:
http://articles.latimes.com/2010/oct/31/local/la-me-summer-night-20101030
Jacobs, J. (1961). The Death and Life of Great American Cities. New York: Random
House.

49
Levitt, S. (1998). Why Do Increased Arrest Rates Appear to Reduce Crime: Deterrence,
Incapacitation, or Measurement Error? Economic Inquiry , 353-372.
McDonald, P. R. (2009, August 18). L.A. Times Shills for Villaraigosa's 'Summer Night
Lights". Retrieved March 21, 2011, from LA Weekly Blogs:
http://blogs.laweekly.com/informer/2009/08/hector_tobar_summer_night_ligh.php
Newman, O. (1972). Defensible Space: Crime Prevention Through Urban Design. New
York: Macmillan.
O'Malley, Z. (2009, April 23). America's Most Dangerous Cities. Retrieved March 21,
2011, from Forbes: www.forbes.com/2009/04/23/most-dangerous-cities-lifestyle-real-
estate-dangerous-american-cities_slide.html
Painter, K. A., & Farrington, D. P. (1999). Street lighting and crime: Diffusion of benefits
in the Stoke-on-Trent project. In K. A. Painter, & N. Tilley, Surveillance of Public Space:
CCTV Street Lighting and Crime Prevention (pp. 77-122). Monsey, NY: Criminal Justice
Press.
Summer Night Lights. (2010, October 31). Retrieved March 21, 2011, from The Mayor of
the City of Los Angeles:
http://mayor.lacity.org/Issues/GangReduction/SummerNightLights/index.htm
Taub, R. P., Taylor, D. G., & Dunham, J. D. (1984). Paths of Neighborhood Change:
Race and Crime in Urban America. Chicago: University of Chicago Press.
Taylor, R. B., & Gottfredson, S. (1986). Environmental design, crime and prevention: An
examination of community dyanmics. In A. J. Reiss, & M. Tonry, Communities and
Crime (pp. 387-416). Chicago: University of Chicago Press.
Tien, J. M., O'Donnell, V. F., & Mirchandani, P. B. (1979). Street Lighting Projects:
National Evaluation Program, Phase 1 Report. Washington, D.C.: U.S. Department of
Justice.
Wooldridge, J. M. (2003). Introductory Econometrics a Modern Approach. Mason, OH:
Thomson.
Related Documents