Financial Management • Spring 2006 • pages 53 - 86 Does Hedging Affect Firm Value? Evidence from the US Airline Industry David A. Carter, Daniel A. Rogers, and Betty J. Simkins* Recent literature in corporate finance has fostered an improved understanding of why nonfinancial firms may hedge. 1 However, very little research has focused on whether hedging achieves reasonable economic objectives. In particular, many researchers are interested in whether hedging increases firm value. Allayannis and Weston (2001) examine the relation between foreign currency hedging and Tobin’s Q. They conclude that hedging is associated with higher firm value. On the other hand, Jin and Jorion (2004) find no relation between hedging and firm value for oil and gas producers. This article contributes to the body of corporate risk management research in two important ways. First, given the conflicting results on the relation between hedging and firm value, we provide additional evidence regarding this question by studying the hedging of jet fuel price risk exposure by US airlines. The airline industry offers a unique perspective from which to analyze the value of firms’ hedging activities because the industry is largely homogeneous and competitive. Further, we focus on the hedging of a single, homogeneous and volatile input commodity, jet fuel. Second, and perhaps more important, our analysis provides a better understanding of the source of potential value from hedging by airlines. To our knowledge, we are the first to find empirical evidence pointing to the source of value from hedging operations. We find that the airline industry exhibits two characteristics consistent with the general assumptions and framework developed in Froot, Scharfstein, and Stein (1993). First, the airline Does hedging add value to the firm, and if so, is the source of the added value consistent with hedging theory? We investigate jet fuel hedging behavior of firms in the US airline industry during 1992-2003 to examine whether such hedging is a source of value for these companies. We illustrate that the investment and financing climate in the airline industry conforms well to the theoretical framework of Froot, Scharfstein, and Stein (1993). In general, airline industry investment opportunities correlate positively with jet fuel costs, while higher fuel costs are consistent with lower cash flow. Given that jet fuel costs are hedgeable, airlines with a desire for expansion may find value in hedging future purchases of jet fuel. Our results show that jet fuel hedging is positively related to airline firm value. The coefficients on the hedging variables in our regression analysis suggest that the “hedging premium” is greater than the 5% documented in Allayannis and Weston (2001), and might be as large as 10%. We find that the positive relation between hedging and value increases in capital investment, and that most of the hedging premium is attributable to the interaction of hedging with investment. This result is consistent with the assertion that the principal benefit of jet fuel hedging by airlines comes from reduction of underinvestment costs. We thank an anonymous referee, Tom Aabo, George Allayannis, Chiddi Chidambaran, Georges Dionne, Chitru Fernando, Tomas Jandik, Wayne Mikkelson, Scott Topping, Alex Triantis (the Editor), Thouraya Triki, Larry Wall, participants at the 2004 American Finance Association Annual Meeting, 2003 FMA European meetings, 2001 FMA meetings, 2001 Eastern Finance Association meeting, and seminar participants at HEC Montréal, Kent State University, the 2003 Southwest Finance Symposium at the University of Tulsa, Wichita State University, and University of Oregon for useful comments. Janybek Abakirov, Brad Beall, Freddie Leonardi, Brent Asavamonchai, and Jie Shen provided excellent research assistance. We also thank John Doukouris in the Office of Economics at the Air Transport Association and Pete Reig at Williams, Inc. for providing airline fuel cost data. * David A. Carter and Betty J. Simkins are Associate Professors of Finance at Oklahoma State University in Stillwater, OK., Daniel A. Rogers is an Assistant Professor of Finance at the Portland State University in Portland, OR. 1 Allayannis and Ofek (2001), Berkman and Bradbury (1996), Dolde (1995), Gay and Nam (1998), Géczy, Minton, and Schrand (1997), Graham and Rogers (2002), Haushalter (2000), Mian (1996), Nance, Smith, and Smithson (1993), Rogers (2002), Schrand and Unal (1998), and Tufano (1996), are many of the published studies examining the determinants of corporate hedging behavior.

Does Hedging Affect Firm Value Evidence From the US Airline Industry
Dec 27, 2015
ghgfh
Welcome message from author
This document is posted to help you gain knowledge. Please leave a comment to let me know what you think about it! Share it to your friends and learn new things together.
Transcript

Financial Management • Spring 2006 • pages 53 - 86
Does Hedging Affect Firm Value?Evidence from the US Airline Industry
David A. Carter, Daniel A. Rogers, and Betty J. Simkins*
Recent literature in corporate finance has fostered an improved understanding of whynonfinancial firms may hedge.1 However, very little research has focused on whether hedgingachieves reasonable economic objectives. In particular, many researchers are interested inwhether hedging increases firm value. Allayannis and Weston (2001) examine the relation betweenforeign currency hedging and Tobin’s Q. They conclude that hedging is associated with higherfirm value. On the other hand, Jin and Jorion (2004) find no relation between hedging and firmvalue for oil and gas producers.
This article contributes to the body of corporate risk management research in two importantways. First, given the conflicting results on the relation between hedging and firm value, weprovide additional evidence regarding this question by studying the hedging of jet fuel pricerisk exposure by US airlines. The airline industry offers a unique perspective from which toanalyze the value of firms’ hedging activities because the industry is largely homogeneous andcompetitive. Further, we focus on the hedging of a single, homogeneous and volatile inputcommodity, jet fuel. Second, and perhaps more important, our analysis provides a betterunderstanding of the source of potential value from hedging by airlines. To our knowledge, weare the first to find empirical evidence pointing to the source of value from hedging operations.
We find that the airline industry exhibits two characteristics consistent with the generalassumptions and framework developed in Froot, Scharfstein, and Stein (1993). First, the airline
Does hedging add value to the firm, and if so, is the source of the added value consistent withhedging theory? We investigate jet fuel hedging behavior of firms in the US airline industry during1992-2003 to examine whether such hedging is a source of value for these companies. We illustratethat the investment and financing climate in the airline industry conforms well to the theoreticalframework of Froot, Scharfstein, and Stein (1993). In general, airline industry investmentopportunities correlate positively with jet fuel costs, while higher fuel costs are consistent with lowercash flow. Given that jet fuel costs are hedgeable, airlines with a desire for expansion may find valuein hedging future purchases of jet fuel. Our results show that jet fuel hedging is positively related toairline firm value. The coefficients on the hedging variables in our regression analysis suggest thatthe “hedging premium” is greater than the 5% documented in Allayannis and Weston (2001), andmight be as large as 10%. We find that the positive relation between hedging and value increasesin capital investment, and that most of the hedging premium is attributable to the interaction ofhedging with investment. This result is consistent with the assertion that the principal benefit of jetfuel hedging by airlines comes from reduction of underinvestment costs.
We thank an anonymous referee, Tom Aabo, George Allayannis, Chiddi Chidambaran, Georges Dionne, ChitruFernando, Tomas Jandik, Wayne Mikkelson, Scott Topping, Alex Triantis (the Editor), Thouraya Triki, Larry Wall,participants at the 2004 American Finance Association Annual Meeting, 2003 FMA European meetings, 2001 FMAmeetings, 2001 Eastern Finance Association meeting, and seminar participants at HEC Montréal, Kent StateUniversity, the 2003 Southwest Finance Symposium at the University of Tulsa, Wichita State University, and Universityof Oregon for useful comments. Janybek Abakirov, Brad Beall, Freddie Leonardi, Brent Asavamonchai, and Jie Shenprovided excellent research assistance. We also thank John Doukouris in the Office of Economics at the Air TransportAssociation and Pete Reig at Williams, Inc. for providing airline fuel cost data.*David A. Carter and Betty J. Simkins are Associate Professors of Finance at Oklahoma State University in Stillwater,OK., Daniel A. Rogers is an Assistant Professor of Finance at the Portland State University in Portland, OR.
1Allayannis and Ofek (2001), Berkman and Bradbury (1996), Dolde (1995), Gay and Nam (1998), Géczy, Minton,and Schrand (1997), Graham and Rogers (2002), Haushalter (2000), Mian (1996), Nance, Smith, and Smithson(1993), Rogers (2002), Schrand and Unal (1998), and Tufano (1996), are many of the published studies examiningthe determinants of corporate hedging behavior.

Financial Management • Spring 200654
industry’s history of investment spending is not negatively correlated with jet fuel costs, asone might expect. In fact, the relation between these two variables is largely positive. Second,airlines face significant distress costs. For example, Pulvino (1998, 1999) finds that distressedairlines are forced to sell aircraft at below-market prices. Froot et al. (1993) suggest that firmsfacing significant expected distress costs will choose to underinvest. The underinvestmentcost is an indirect cost of financial distress (e.g., Stulz, 1996). They show that hedging is amechanism to alleviate this underinvestment incentive. In their model, hedging is morevaluable when investment opportunities display lower correlations with cash flows fromhedgeable risks. Simply put, the airline industry provides an excellent sample setting becauseits environment conforms well to this theory of hedging.
The results show that airline firm value is positively related to hedging of future jet fuelrequirements. Additionally, changes in hedging are positively associated with changes in firmvalue. As in Allayannis and Weston (2001), we interpret certain results from our regressions asthe “hedging premium” (i.e., the added firm value attributable to hedging). Our results suggestthat the average hedging premium for airlines is likely in the range of 5% – 10%.
Given investment patterns in the airline industry, the value premium suggests that hedgingallows airlines more ability to fund investment during periods of high jet fuel prices. Thepositive relation between hedging and value further suggests that investors view suchinvestment as positive net present value projects. We find that the interaction betweenhedging and capital expenditures captures a large majority of the hedging premium. We alsoexamine a two-stage system in which hedging impacts value through its effect on capitalexpenditures. The results of this procedure also suggest that the hedging premium is largelyattributable to the effect of hedging on capital investment.
An additional rationale for our choice of studying hedging in the airline industry is that thefirms face substantial price risk associated with jet fuel price volatility. Guay and Kothari (2003)suggest that most sample firms used in many prior studies defining hedging using interest rateand/or currency derivatives may be unable to gain significant benefits from their derivativeholdings. We note that jet fuel prices are more volatile than prices of other underlying assetstypically studied, particularly currencies. Annualized jet fuel price volatility measured frommonthly averages over 1992-2003 is approximately 27%. As a point of comparison, Guay andKothari find that the annualized volatility of major currencies is only 11% (measured over 1988-1997). Additionally, using the median percentage of fuel consumption hedged, we show thatthe cash flow sensitivity to extreme jet fuel price changes (defined similarly to the measurecalculated by Guay and Kothari) of the median hedging firm in our sample is 21.7% of capitalexpenditures. Overall, airline exposure to jet fuel price risk is economically significant, andconsiderable cash can be realized by hedging in the event of an extreme price increase.
The article proceeds as follows. Section I provides a brief review of relevant hedging literature.Section II discusses the airline industry environment with respect to risk exposures, particularlyjet fuel price risk. This section also explores the relation between jet fuel costs, cash flow, andinvestment in the industry. Additionally, we provide analysis of the financing environment.Section III explores the determinants of jet fuel hedging by individual airlines. The value ofhedging is analyzed in Section IV, and we investigate whether the hedging premium is associatedwith the investment opportunities framework. Section V concludes the article.
I. Literature Review: Hedging and Firm Value
Most of the theoretical research in corporate risk management argues that firms can increase

Carter, Rogers, & Simkins • Does Hedging Affect Firm Value? 55
value by hedging. In a seminal article, Smith and Stulz (1985) argue that, by reducing theprobability of bankruptcy, hedging can increase firm value and this effect is larger for firmswith higher costs of financial distress. In the same article, they propose that firms facing anincome tax liability function that is convex in taxable income can reduce expected tax paymentsby hedging taxable income.
As noted in Stulz (1996), financial distress costs include those related to failure to investin valuable projects because of deadweight costs of debt. Froot et al. (1993) extend the Smithand Stulz (1985) analysis by illustrating the value of hedging for firms facing financialconstraints. Their basic framework shows that, when the costs of external capital includedeadweight costs, firms requiring outside financing will underinvest when internal cashflow is sufficiently low. Hedging generates additional cash in these states, thus circumventingthe underinvestment problem.2 An important feature of the Froot et al. model is that it allowsfor the firm’s investment opportunity set to be correlated with cash flows from the hedgeablerisk. If a positive correlation exists, less hedging is necessary because the firm enjoys anatural hedge (i.e., when cash flows are low, so are investment opportunities). Thus,hedging is more valuable to firms as investment opportunities are less positively correlatedwith the risk factor’s cash flows. Additionally, the Froot et al. model shows that if outsidefinancing costs increase as hedgeable cash flows decrease, then hedging becomes morevaluable. In essence, hedging allows a firm to minimize its need to access outside capitalwhen it is most expensive.
Tufano (1998) illustrates that, by adding manager-shareholder agency costs to the Frootet al. (1993) model, hedging may allow managers to destroy value. Tufano’s framework assumesthat managers are able to appropriate an amount in excess of the value created from aninvestment project. External capital providers know this agency problem exists and therefore,refuse to provide capital for this project. Managers may hedge to avoid the inability toinvest in the “pet” project after low cash flow realizations.
Interestingly, there is little empirical evidence to date that hedging assists in value creation.Two recent studies make direct attempts to address this shortcoming. Allayannis and Weston(2001) examine the effect of currency derivatives usage on relative market value (as definedby Tobin’s Q). They find a positive relation between currency hedging and Tobin’s Q, andinterpret this as evidence that hedging improves firm value. Jin and Jorion (2004) argue thatthe positive value effect of hedging shown in the cross-sectional sample used by Allayannisand Weston (2001) might be hard to interpret because of issues that are difficult to adequatelycontrol such as endogeneity of value and hedging or variation in risk exposures across thesample firms. In their study, Jin and Jorion (2004) show that hedging has no value effect fora sample of oil and gas firms. However, Jin and Jorion (2004) might have biased their resultsagainst finding a relation between hedging and firm value by selecting a sample in which, bytheir own admission, investors might prefer firms not to hedge (p. 3). In contrast, we analyzehedging by firms that are consumers of oil. Investors are less likely to use airline stocks asmechanisms to speculate on oil prices.
II. US Airline Industry Environment
The US airline industry offers an excellent setting for examining the effect of hedging onfirm value. First, airlines are exposed to substantial, but hedgeable, risk exposures. Oneparticularly notable risk facing airlines is their exposure to rising jet fuel prices. Second, the2Bessembinder (1991) and Mello and Parsons (2000) make a similar argument as to the benefit of hedging.

Financial Management • Spring 200656
investment and financing environment in the industry demonstrates similarities to the settingposed by Froot et al. (1993) in motivating the benefits of hedging. We discuss these twopoints in this section of the article.
A. Risk Exposures and Hedging Mechanisms
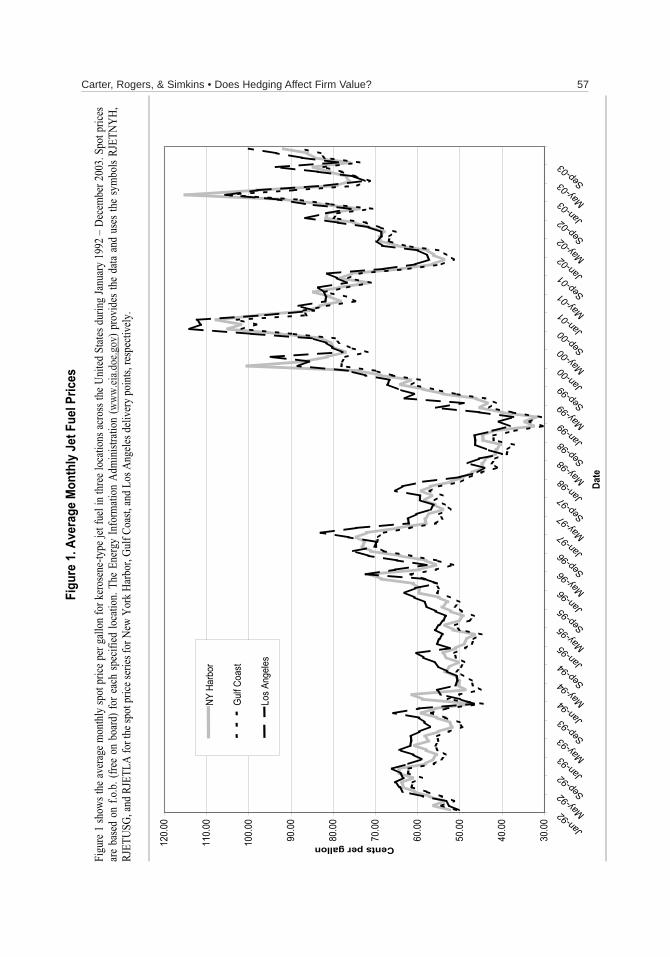
Airlines, like many industrial companies, are potentially exposed to risks resulting fromadverse movements in interest rates, foreign currency prices, and commodity prices,particularly jet fuel prices. Airlines’ fuel price exposures are particularly transparent becauseoil is a widely traded global commodity, and the poor economic condition of airlines (partlyas a result of higher fuel prices) has frequently been in the news since the terrorist attacks ofSeptember 11, 2001. Figure 1 shows average monthly spot jet fuel prices at three major UStrading hubs (New York Harbor, Gulf Coast, and Los Angeles) during January 1992 – December2003. Averaging across the three locations, the mean price of jet fuel is about 63.4 cents pergallon. Until about mid-1996, jet fuel prices were not particularly volatile, but clearly that hasnot been the case since late 1997. The standard deviation of average monthly fuel pricesduring 1992-2003 is about 15.7 cents per gallon.
We start our analysis by identifying publicly held US passenger airline companies withinformation available on the Compustat database during 1992-2003 (SIC code is 4512 or4513). We use the 10-K filings of these firms to obtain data regarding management of interestrate, foreign currency, and jet fuel risk exposures. Twenty-nine airlines disclose adequatelevels of data for our analysis. We eliminate one airline (Western Pacific) because its filingscontain limited data covering only two years of the sample period.
We find that airlines manage all three of these risks. From 259 firm-year observations, wefind 65 (58) disclosures of derivative usage specifically to manage interest rate (foreigncurrency) risk. Meanwhile, 88 firm-year observations include disclosures that some of nextyear’s jet fuel requirements have been explicitly hedged as of fiscal year-end. Many of theairlines that do not disclose hedging future jet fuel purchases discuss using fuel riskmanagement tactics such as fuel pass-through agreements entered into with major airlinepartners or charter arrangements that allow for fuel costs to be passed along to the organizationchartering the flight. Examples of airline disclosures about various mechanisms for managingfuel price risk are shown in the Appendix.
Overall, airline disclosures suggest fuel price risk is of significant importance. Fuel pricerisk is ubiquitous across all airlines, as opposed to foreign currency price risk that appliesonly to the relatively small set of airlines that operate in foreign markets. For example, foreignsales as reported by Compustat are non-zero for only nine of the companies in our sample.Interest rate risk would seem important in a highly levered industry, but interest ratederivatives usage among our sample firms suggests that interest rate risk is of a lowermagnitude than jet fuel price risk. As such, we focus the attention of our analysis on jet fuelprice risk. Nevertheless, our subsequent analyses incorporates interest rate and foreigncurrency decisions separately from jet fuel hedging decisions.3
Table I summarizes jet fuel costs and hedging policies of the sample airlines acrossavailable firm-years. For the full sample of firm-year observations, fuel costs average about13.6% of operating expenses. The percentages range from 8.5% (Mesaba Holdings) to3Jet fuel price risk price exhibits little correlation with foreign currency price risk or interest rate risk. Wecalculate correlation coefficients among monthly jet fuel returns, major currency index returns, and the yieldrelative (see Flannery and James, 1984) of the 7-year constant maturity Treasury bond during 1992-2003. Thecorrelation between jet fuel returns and the currency index is approximately –0.10 (p-value = 0.23). Thecorrelation between jet fuel returns and the yield relative is about 0.04 (p-value = 0.60).
Carter, Rogers, & Simkins • Does Hedging Affect Firm Value? 57F
igu
re 1
. A
ve
rag
e M
on
thly
Je
t F
ue
l P
ric
es
Figu
re 1
show
s the
aver
age m
onth
ly sp
ot p
rice p
er g
allon
for k
eros
ene-
type
jet f
uel i
n th
ree l
ocati
ons a
cros
s the
Uni
ted S
tates
dur
ing
Janu
ary
1992
– D
ecem
ber 2
003.
Spot
pric
es
are
base
d on
f.o.b
. (fre
e on
boa
rd) f
or e
ach
spec
ified
loca
tion.
The
Ener
gy In
form
ation
Adm
inist
ratio
n (w
ww.ei
a.doe
.gov)
pro
vide
s the
data
and
use
s the
sym
bols
RJET
NYH,
RJ
ETUS
G, an
d RJE
TLA
for t
he sp
ot pr
ice se
ries f
or N
ew Y
ork H
arbo
r, Gu
lf Co
ast,
and L
os A
ngele
s deli
very
poin
ts, re
spec
tively
.
30.0
0
40.0
0
50.0
0
60.0
0
70.0
0
80.0
0
90.0
0
10
0.0
0
11
0.0
0
12
0.0
0
Jan
-92 M
ay-
92 S
ep-9
2 Jan
-93 M
ay-
93 S
ep
-93 Ja
n-9
4 Ma
y-9
4 Se
p-9
4 Jan
-95 M
ay-
95 S
ep-9
5 Jan
-96 M
ay-
96 S
ep
-96 Ja
n-9
7 Ma
y-9
7 Se
p-9
7 Jan
-98 M
ay-
98 S
ep-9
8 Jan
-99 M
ay-
99 S
ep
-99 Ja
n-0
0 Ma
y-0
0 Se
p-0
0 Jan
-01 M
ay-
01 S
ep
-01 Ja
n-0
2 Ma
y-0
2 Se
p-0
2 Jan
-03 M
ay-
03 S
ep
-03
Da
te
Cents per gallon
NY
Ha
rbor
Gulf C
oast
Los A
ng
ele
s

Financial Management • Spring 200658
Table I. Fuel Usage, Derivatives Hedging, and Operational Hedging Disclosures
This table presents information on jet fuel usage and mechanisms used by airlines to manage fuel costs, including hedging, fuel pass-through agreements, and the use of charter operations. The derivative hedging disclosures present data gathered from firm 10-K filings. Column [1] reports the average percentage of operating costs that are spent on fuel during years for which data are disclosed. Column [2] lists the years during 1992-2003 that the firm hedged future fuel requirements. Column [3] presents the maximum time period the firm disclosed for hedging. The percentage of next year’s fuel consumption hedged at fiscal year-end for years in which hedging is disclosed is reported in Column [4]. Column [5] reports whether the airline discloses a fuel pass-through agreement in its 10-K filings (the existence of a pass-through agreement is reported as a one, zero otherwise). Similarly, Column [6] indicates that the airline discloses the existence of charter operations (the existence of charter operations is reported as a one, zero otherwise). Note: CC Air was acquired by Mesa Air in 2000; Comair Holdings was acquired by Delta Air Lines in January, 2000; Hawaiian Airlines changed name to Hawaiian Holdings in 2002; Midway Airlines’ final year of operation was 2000; Tower Air went bankrupt in 2001; TWA was acquired by American Airlines in 2001; and Vanguard Airlines’ final year of operation was 2001.
[1] [2] [3] [4] [5] [6]
Airline
Jet Fuel as a
Percentage of
Operating
Expenses
(Average Over
Sample
Period)
Years Jet
Fuel
Hedged
Maximum
Maturity of
Hedge
(Years)
Average
Percentage
of Next Year
Hedged
Fuel Pass-
through
Agreement
Charter
Operations
Airtran Holdings 18.84% 1999-2003 1.0 14% 0 0 Alaska Air Group 13.92% 1992-96,
2000-03 3.0 22% 0 0
America West Holdings 13.30% 1997-2003 <1.0 11% 0 0 AMR Corp 11.97% 1992-2003 3.0 28% 0 0 Amtran 18.44% 1998-2001 0.75 3% 1 1 Atlantic Coast Airlines 12.73% 1997-2000 1.0 5% 1 0 CCAir 8.69% None 0 1 Comair Holdings 10.19% None 0 1 Continental Airlines 15.14% 1992-93,
1996-20021.0 18% 0 0
Delta Air Lines 12.20% 1996-2003 3.0 34% 0 0 Express Jet Holdings 11.62% None 1 0 Frontier Airlines 15.58% 2002-03 2.0 2% 0 1 Great Lakes Aviation 15.28% None 0 1 Hawaiian Airlines 17.11% 1997-2002 2.0 8% 0 1 Jetblue Airways 16.07% 2002-03 1.25 43% 0 0 Mesa Air Group 15.09% None 1 1 Mesaba Holdings 8.45% None 1 0 Midway Airlines 12.52% None 0 0 Midwest Express Holdings 16.53% 1997-2002 0.75 4% 0 1 Northwest Airlines 13.57% 1997-2002 1.0 11% 0 1 SkyWest 12.20% None 1 0 Southwest Airlines 14.51% 1992-2003 6.0 43% 0 0 Tower Air 18.36% 1998 N/A 0% 1 1 TransWorld Airlines (TWA) 13.00% 1998-1999 2.0 1% 0 0 UAL Corp 12.30% 1995-2003 1.0 19% 0 0 US Airways Group 9.69% 1994-97,
2000-03 2.0 12% 0 0
Vanguard Airlines 17.61% None 0 1 World Airways 9.97% None 1 1 Average 13.75% 15% 0.28 0.41

Carter, Rogers, & Simkins • Does Hedging Affect Firm Value? 59
18.8% (Airtran Holdings).The next set of three columns in Table I reports information regarding hedging of future jet
fuel requirements. We show the calendar years in which fuel hedges are in place as of fiscalyear-end, maximum maturity of the hedge in years, and percentage of next year’s fuelrequirements hedged, respectively.4
Major airlines (defined as carriers with annual revenues in excess of $1 billion) morecommonly hedge future jet fuel purchases than do smaller ones. While all major airlineshedged during part of the period 1992-2003, only AMR and Southwest Airlines always hadhedges in place at the end of every year for which we have data. Eighteen of the 28 firmsreported hedging jet fuel in at least one year. Of hedging firms, the average hedged percentage(on an equally-weighted basis) of next year’s fuel consumption is approximately 15%.5 Weobserve wide variation in the amount of fuel hedged, even among hedgers. Recently,Southwest Airlines has often hedged close to 80% of its coming year’s fuel requirements. Inthe late 1990s, UAL typically had hedges in place for most of their next year’s expectedconsumption. However, it is not uncommon to observe airlines that hedge very little or noneof its future fuel purchases. This type of cross-sectional variation within an industry settingis generally consistent with recent theoretical models such as Adam, Dasgupta, and Titman(2004) and Mello and Ruckes (2004). Most hedging airlines also report the maximum maturityof jet fuel hedges. In recent years, airlines have been increasing the maximum lengths ofhedging horizons. Southwest has gained some notoriety in the press recently for extendingits fuel hedges to a maximum maturity of six years.6
Within the industry, some airlines use avenues other than hedging future fuel purchasesto manage fuel price risk. For example, some smaller carriers contract with major airlines toprovide service to smaller communities near the major airline’s hub. These carriers may havea fuel pass-through agreement where the major carrier absorbs the risk of fluctuating fuelprices. Table I indicates if carriers disclose such fuel pass-through agreements. Similar tofuel pass-through agreements, charter airlines typically do not bear the risk of fluctuatingfuel prices. The charter’s customer reimburses fuel costs. The final column of Table I indicatesairlines classified as having charter operations.7 One point worth noting about fuel pass-through and charter agreements is that these mechanisms do not lock in a price (or price cap)for future jet fuel, as is the case when airlines hedge future fuel purchases. Rather, users ofthese mechanisms experience higher fuel costs as fuel prices increase, but allow airlines topass the higher fuel cost to another party (i.e., the partner airline or the chartering customer).If the demand for air travel is price-elastic, then fuel pass-through and chartering arrangementsare not equivalent to hedging future fuel purchases. The former two mechanisms will beassociated with lower passenger demand if fuel prices rise, while the latter strategy allows
4Disclosure of commodity derivatives is not required under SFAS 119 (the FASB standard for derivative disclosurestarting in 1995). However, we are able to generally ascertain firm-years in which airlines use derivatives to hedgefuel purchases. Beginning in 1997, disclosures regarding significant market risks became required under SECguidelines. Airlines often discuss their market risks with respect to jet fuel under this requirement. For some firm-years prior to 1997, we are able to estimate the percentage of fuel requirements hedged by using notional valuedisclosures and gallons of fuel consumed.5Other averages are as follows: 10.9% across all non-missing firm-year observations; 16.4% across all firms withat least one year of disclosure about hedging and weighted by number of observations; and 29.4% across onlypositive firm-year observations.6Warren (2005) notes that Southwest’s more aggressive approach to hedging future jet fuel purchases might provecostly if oil prices fall in the future.7Charter carriers are defined as airlines that disclose that a significant part of their business is due tocharter operations.

Financial Management • Spring 200660
airlines to maintain current fares in spite of higher fuel prices. In subsequent analyses, wedifferentiate fuel hedging from these other fuel risk management mechanisms.
Thus far, we have discussed the fact that airlines appear to view volatile jet fuel pricesas a source of risk exposure. Next, we explore two possible ways of measuring airlineexposure to jet fuel prices. First, we estimate a monthly market model using an equally-weighted airline industry return that includes a jet fuel return factor. This type ofmethodology is standard in other research examining risk exposures.8 We conduct thefollowing monthly time-series regression:
Rt = α + βR
mt + γR
Jt + e
t, (1)
where Rt is the equally-weighted rate of return on the sample airlines in month t (as gathered
from CRSP), Rmt
is the return on the CRSP equally-weighted market portfolio, RJt is the
percentage change in Gulf Coast spot jet fuel prices (gathered from the Energy InformationAdministration), and ε
t is the idiosyncratic error term.9 The estimated coefficient, γ, is a
measure of the sensitivity of the industry’s stock price to changes in jet fuel prices. Weexpect airlines to be negatively exposed to the price of jet fuel.
In untabulated results, we find that airline industry stock prices are negatively related tojet fuel prices. The jet fuel exposure coefficient from Equation (1) is –0.11, and it is statisticallysignificant at the 5% level. The coefficient also implies economic significance of jet fuel pricechanges. Recall that the standard deviation of jet fuel prices shown in Figure 1 is 15.7 centsper gallon with a mean of 63.4 cents. Thus, a one standard deviation change in jet fuel pricerepresents approximately a 25% change from the mean price. Using a 25% price change in thecontext of the regression results suggests a one standard deviation movement in jet fuelprice results in a 2.75% change (monthly) in airline industry stock prices.
As a second measure of exposure, we use an approach suggested by Guay and Kothari(2003). They measure cash flow sensitivity to price risk by using a three standard deviationprice change to illustrate the effects of an extreme move in underlying asset prices (i.e.,interest rates, currencies, and commodities). In the case of jet fuel, a 45-cent (per gallon)change represents approximately three standard deviations. Thus, for each firm-yearobservation, we multiply gallons consumed by 45 cents to estimate the cash flow impact ofan extreme jet fuel price change. Scaling this amount by firm-year capital expenditures providesan estimate of the decline in investment possible if jet fuel prices increase dramatically fromone year to the next. Across firm-years from 1994-2003, the median of this value is 91%.Alternatively, this measure may be interpreted as the relative cash flow from the hedgeresulting if the firm has hedged 100% of its fuel consumption. The median percentage of nextyear’s fuel consumption hedged is 24% (for firms that hedge). Multiplying the prior amountsby 24% suggests that “normal” amounts of hedging would generate cash flow equal to21.7% of capital expenditures in the event of an extreme price move. By contrast, Guay andKothari find that the median firm in their sample would generate cash flow amounting to only9% of investing cash flow. While the 21.7% vs. 9% figures mentioned above are not directlycomparable, we note that capital expenditures are greater than or equal to investing net cashflow for over half of our sample. Thus, our comparison understates the greater importance of
8Currency exposures are studied by Bartov and Bodnar (1994), Bodnar and Wong (2000), Jorion (1990), andPantzalis, Simkins, and Laux (2001). Petersen and Thiagarajan (2000) estimate gold price exposures for goldmining firms.9When examining currency exposures, Bodnar and Wong (2003) point out that using the value-weighted indexcan distort the sign and size of the resulting exposures because of an inherent relation between market capitalizationand exposure. They recommend using the equal-weighted index to prevent this distribution shift.

Carter, Rogers, & Simkins • Does Hedging Affect Firm Value? 61
jet fuel hedging relative to the firms in Guay and Kothari’s sample. Clearly, jet fuel hedgingby airlines is economically meaningful in terms of their measure.
B. Jet Fuel Prices, Investment, Cash Flow, and Financing Environment
Froot et al. (1993) show that firms find hedging more valuable when the correlationbetween investment opportunities and cash flows resulting from hedgeable risks is lower.For airlines, this framework implies that hedging increasingly benefits shareholders ifvaluable investment opportunities are available when jet fuel prices are high (and internalcash flow is low as a result).
There are two major ways in which hedging can assist in an airline’s ability to invest. First,airlines typically negotiate large purchase orders with aircraft manufacturers years in advanceof delivery of some of the aircraft. Purchase orders are disclosed as firm commitments in thefinancial statement footnotes. However, the orders appear to include deferral/cancellationoptions as most carriers exercised such options following the terrorist attacks. Hedgingpreserves internal cash flow to meet future commitments to purchase aircraft.
Second, periods of economic downturn often result in failure and/or asset sales byfinancially weak airlines. Financially stronger airlines may be in a position to buy theseassets at prices below fair value (e.g., Pulvino, 1998, 1999). Investment may also take theform of acquisition of a financially weak carrier. Kim and Singal (1993) show that suchacquisitions typically yield higher fare environments upon completion of the acquisition. Ifhedging improves its cash position during economic downturns, the hedged airline may relyless (or not at all) on external sources of funds to make such capital expenditures (e.g., Frootet al., 1993). For example, AMR disclosed that its purchase of TWA during 2001 was fundedwith existing cash and assumption of TWA debt.10
To analyze whether the airline industry is characterized by the investment environmentdiscussed in Froot et al. (1993), we examine aggregate airline industry data on jet fuel costs,investment expenditures, and cash flow from 1979-2003. All airlines with at least $100 millionin assets in the Compustat active and research databases are included in the aggregatestatistics for investment expenditures and cash flows. The Froot et al. framework implies thehigher the correlation between jet fuel costs and investment, combined with a negativerelation between jet fuel costs and cash flow, the greater the benefit to hedging.
Table II illustrates the annual patterns of jet fuel costs, cash flow, and investment spendingfor US airlines during 1979-2003.11 The first column shows the level of industry jet fuel costsper gallon, as reported by the Air Transport Association. The cost of jet fuel has variedsignificantly over time. The average cost of jet fuel among US airlines during 1979-2003 isabout 71 cents per gallon.
The second column of Table II shows net income plus depreciation (scaled by book valueof assets). Industry cash flow has also shown significant variation over time. The meanvalue is about 5.4%, but has been negative during weak economic climates in 1990 and 2001-2002. Notably, these are also years in which fuel costs are above average. The highest cashflows occurred in 1997 and 1998 as fuel prices were moving lower (see Figure 1). Industry
10The discussion suggests that hedging should allow for firms to increase market share. We examine this bycalculating market share of available seat miles (ASM) for each firm-year by dividing each firm’s disclosed ASMby the total US industry’s ASM total (as disclosed by the Air Transport Association). We calculate the correlationcoefficient between the percentage of fuel requirements hedged and the change in market share. The correlationis positive (approximately 14%), and is statistically significant at the 5% level.11Table II shows per gallon jet fuel costs in nominal terms. Much of the analysis in this section uses both nominaland inflation-adjusted fuel costs.

Financial Management • Spring 200662
Table II. Jet Fuel Costs, Cash Flow, Capital Expenditures, and Leverage – US
Airlines (1979-2003)
This table shows annual average jet fuel costs, cash flow (defined as net income plus depreciation as a percentage of asset book value), capital expenditures (as a percentage of asset book value), and debt as a percentage of total assets. We report capital expenditures, as a percentage of assets, in two different ways: first, in the column labeled “Industry”, we show total industry capital expenditures divided by total industry assets; second, under “By Airline”, we report averages, medians, and standard deviations for the cross-section of airlines in the given year. Capital Expenditures (% of Assets)
By Airline
Year
Jet Fuel Costs
($/Gal)
Cash Flow
(% of Assets) Industry Average Median Std Dev
Debt (% of
Assets)
1979 $ 0.577 9.08% 18.4% 23.4% 21.4% 9.5% 43.4% 1980 $ 0.892 6.96% 16.3% 22.5% 19.3% 12.7% 44.9% 1981 $ 1.047 5.74% 14.8% 27.6% 19.8% 20.2% 42.8% 1982 $ 0.989 3.94% 13.7% 17.8% 14.2% 15.8% 47.4% 1983 $ 0.896 6.10% 14.8% 17.7% 15.1% 14.7% 44.8% 1984 $ 0.855 9.25% 12.3% 19.6% 16.4% 15.5% 43.8% 1985 $ 0.809 8.63% 14.7% 17.0% 15.4% 12.4% 42.2% 1986 $ 0.558 5.94% 14.5% 19.6% 15.5% 16.3% 41.1% 1987 $ 0.559 5.97% 12.4% 18.5% 13.8% 15.8% 40.2% 1988 $ 0.535 8.19% 12.0% 13.4% 12.7% 7.2% 40.3% 1989 $ 0.605 3.00% 13.1% 18.6% 18.5% 11.9% 32.3% 1990 $ 0.783 -2.43% 16.5% 16.7% 16.4% 10.7% 32.2% 1991 $ 0.691 2.25% 16.2% 12.0% 11.1% 7.9% 28.9% 1992 $ 0.637 0.62% 15.6% 11.7% 11.4% 7.5% 33.7% 1993 $ 0.606 2.75% 9.1% 12.1% 11.2% 10.1% 31.4% 1994 $ 0.558 3.95% 6.8% 11.9% 8.9% 9.9% 29.9% 1995 $ 0.558 7.98% 6.6% 11.6% 8.6% 9.9% 25.7% 1996 $ 0.664 9.27% 8.1% 11.6% 7.8% 9.2% 29.9% 1997 $ 0.645 11.19% 11.2% 11.5% 9.2% 7.4% 31.0% 1998 $ 0.513 10.05% 14.0% 14.5% 12.6% 9.7% 30.1% 1999 $ 0.531 9.17% 15.5% 16.7% 17.0% 9.9% 30.6% 2000 $ 0.806 7.43% 14.4% 16.4% 15.7% 13.3% 37.0% 2001 $ 0.777 -0.94% 11.3% 13.9% 11.1% 10.6% 39.3% 2002 $ 0.714 -3.17% 6.1% 9.5% 6.2% 11.9% 37.3% 2003 $ 0.849 2.88% 5.0% 9.6% 7.9% 11.9% 39.2% Average $ 0.706 5.35% 12.5% 15.8% 13.5% 11.7% 36.8% Median $ 0.664 5.97% 13.7% 16.4% 13.8% 10.7% 37.3% Std Dev $ 0.155 3.96% 3.7% 4.6% 4.1% 3.3% 6.2%

Carter, Rogers, & Simkins • Does Hedging Affect Firm Value? 63
fuel costs in 1998 were at the lowest level seen during the period examined. The Pearsoncorrelation between jet fuel costs and cash flow is about –0.185. This correlation becomesmuch more negative (-0.526) if we exclude the 1979–1985 period during which the industrywas in the process of transitioning into a more deregulated environment. Inflation-adjustedfuel costs also exhibit a negative correlation with cash flow (-0.487).
The third column of Table II shows industry capital expenditures as a percentage of bookvalue of assets.12 Capital expenditures range from a low of 6.6% in 1995 to a maximum of18.4% in 1979. The next three columns in Table II present summary statistics of investmentpercentages computed across firms for each year. These data suggest that there is significantvariation in the investment spending of airlines during any given year. The average dataexhibit similar patterns as observed in the aggregate industry investment data. Specifically,investment spending was relatively high during the 1980s and into the early 1990s, followedby low investment through 1996. The late 1990s exhibited relatively high levels of investment,followed by below-average investment spending in 2001-2003. Capital expenditures appearto be negatively correlated with firm size because the industry capital spending ratios (aweighted average) are typically below the simple averages and medians. Pearson correlationsbetween jet fuel costs and capital expenditures are positive during the 1979-2003 time period(0.144 for industry capital expenditures). The correlation declines to -0.116 if we exclude the1979-1985 observations, but inflation-adjusted fuel costs exhibit positive correlationswith industry capital expenditures in both the full time frame (0.464) and the shorter timeframe (0.362).
The simple analyses discussed earlier provide univariate evidence that the airline industryexhibits an investment and cash flow environment that is generally consistent with theassumptions of Froot et al. (1993). Next, we consider an extended investment cash-flowsensitivity framework to further explore the relation between jet fuel costs and capitalexpenditures. The dependent variable is capital expenditures scaled by lagged assets, andthe independent variables are: 1) inflation-adjusted jet fuel costs per gallon, 2) cash flowscaled by lagged assets, and 3) lagged Tobin’s Q. This regression allows us to control forcash flow and investment productivity effects on capital expenditures, in addition to thepossible effect of jet fuel costs. In untabulated results, we find a positive and statisticallysignificant (p-value is 0.04) coefficient on the jet fuel costs variable. Thus, the evidencesuggests that the airline industry offers greater investment opportunities when jet fuel pricesare higher.
An additional feature of the Froot et al. (1993) argument is that external finance is increasinglyexpensive when the hedgeable risk factor negatively affects cash flows (i.e., when jet fuelcosts are high). The source of the additional deadweight cost may be the result of distresscosts, information asymmetry, as well as other possible sources. Pulvino (1998) presentsevidence that airlines face significant distress costs. He shows that aircraft are often sold in“fire sales” by financially troubled airlines. In this context, Froot et al. (1993) imply thatairlines would want to hedge against rising fuel prices if this strategy makes it possible toinvest in aircraft (and other assets) of financially distressed airlines at discount prices.Alternatively, airlines may wish to hedge to avoid the possibility of selling assets at below-market values, thus reducing expected financial distress costs (e.g., Smith and Stulz, 1985).
The airline industry is capital intensive and the primary assets (aircraft) hold considerablecollateral value for lenders. Not surprisingly, firms in the industry often have significantamounts of debt in their capital structures. The final column of Table II shows the average
12According to the Director of Corporate Finance at Southwest Airlines, aircraft spending constitutes roughly90% of total capital expenditures, while maintenance expenditures are rarely capitalized.

Financial Management • Spring 200664
debt ratio across airlines for each year from 1979-2003. Average debt ratios were above 40%through 1988. Debt levels appear considerably lower throughout the 1990s. Weak industryconditions in recent years are likely a contributing factor to average debt levels approaching40% during the final several years of our sample period.
Airlines are not limited to buying aircraft. Firms in the industry often lease aircraft. If alease qualifies as an operating lease for accounting purposes, then the asset and theunderlying capital are not reported on the firm’s balance sheet. Thus, reported debt andassets are systematically understated for airlines that make greater use of operating leases.To obtain a sense of leasing practices across airlines and over time, we search 10-K filingdisclosures regarding percentage of aircraft fleets that are leased for fiscal years 1996, 2000,and 2003. In untabulated results, we find considerable variation in leasing practices acrossairlines and over time. Across all airlines, the leased percentage averages between 60% –70% during each of the three years examined. While no leasing is a rarity among our samplefirms, we do find a number of instances in which less than 30% of the fleet is leased.Meanwhile, some airlines lease their entire fleets. We also observe significant changes in theleasing percentages of individual firms. Because of the variation in leasing percentages, weexplore the effect of adjusting key variables (i.e., assets, debt, capital expenditures, etc.) toaccount for operating leases in subsequent analyses.
To better understand the cost of airline debt, we gather the S&P ratings for senior debt ofthe 15 sample airlines with ratings reported in the Compustat database. Panel A of Table IIIshows the level of credit ratings as of January 1988, the median rating for each airline, thehighest and lowest ratings experienced, and the rating as of May 2004. As of May 2004, onlyone airline (Southwest) had an investment grade credit rating. At the beginning of 1988, sixairlines possessed investment grade ratings. Over the time frame examined, nine airlinesexperienced a decline in credit rating, three filed Chapter 11 bankruptcy, and one waspurchased after filing bankruptcy. One airline had no net change in credit rating over theperiod studied, and one experienced an increase in its credit rating.
Panel B of Table III summarizes rating changes by year. The 1990-1994 period began withrelatively high jet fuel prices and a recession, and exhibited low cash flows. During this timeframe, credit ratings often declined. Twenty-four credit downgrades occurred versus onlyone upgrade. Continental, Trans World Airlines, and America West all filed Chapter 11bankruptcy during this period as well. A similar industry environment has emerged since2000, and 30 credit rating downgrades have occurred. Only three upgrades happened duringthis same time frame.
While jet fuel prices are not the sole source of the cash flow declines mentioned above, itis worth noting that they were relatively high during 1990, and again in 2000, as the industryslumps began. Alternatively, as jet fuel prices fell significantly during 1997-1999, airline debtwas often upgraded. Eight credit upgrades (over seven airlines) occurred during 1997 and1998. However, this upgrade activity did not offset much of the downgrades occurring in theearly 1990s.
Overall, the observations discussed above imply that airlines face lackluster creditmarkets during much of our sample period. As we have seen in the wake of the terroristattacks, external shocks can have devastating impact on the industry’s cash flows.Interestingly, the last major cash flow shock of the 1990s occurred during a periodwhen major airlines had better credit ratings. In the more recent environment, hedgingmay be much more important to airlines wishing to take advantage of future periods ofindustry consolidation.
The data presented thus far suggests that firms in the airline industry may have significant

Carter, Rogers, & Simkins • Does Hedging Affect Firm Value? 65
Table III. Credit Ratings – US Airlines (Jan 1988 – May 2004)
This table shows S&P ratings for senior debt as reported by Compustat over the period of January 1988 – May 2004. The first column shows the debt rating at the beginning of 1988 (or the first rating reported, if occurring after January 1988). The second, third, and fourth columns show the median, high, and low rating levels achieved during the period. Finally, the last column shows the rating as of the end of May 2004. The lower portion of the table summarizes the numbers of credit rating upgrades and downgrades by year.
Airline
S&P Sr
Debt Rating
(1/88)
Median
Rating High Rating Low Rating May 2004 Rating
Panel A. Airline Debt Ratings
Airtran Holdings* B- BB- CCC+ B- Alaska Air Group BB+ BB+ BBB- BB- BB- America West B B+ B+ Bankrupt B- AMR A BBB- A CCC B- Amtran* B B+ CCC CCC Atlantic Coast Airlines* B B B- B- Continental Airlines B B+ BB Bankrupt B Delta Air Lines A- BBB- A B- B- Midway Airlines* B- B- Bankrupt Bankrupt Northwest Airlines A BB A B+ B+ Southwest Airlines A- A- A A- A Tower Air* CCC CCC+ Bankrupt Bankrupt Trans World Airlines B- CCC B- Bankrupt Purchased by AMR UAL BBB BB+ BBB Bankrupt Bankrupt US Airways Group BBB B+ BBB Bankrupt CCC+
Panel B. Rating Upgrades and Downgrades
Year Upgrades Downgrades
1988 3 1 1989 2 1 1990 0 5 1991 1 7 1992 0 6 1993 0 3 1994 0 3 1995 1 0 1996 2 1 1997 5 0 1998 3 0 1999 0 0 2000 0 1 2001 1 12 2002 1 6 2003 1 7 2004 (thru May) 0 4
*Denotes that no rating is available for January 1988. Airtran, Amtran, Atlantic Coast, Midway, and Tower are first rated in April 1996, July 1997, September 1997, September 1998, and July 1998, respectively.

Financial Management • Spring 200666
investment opportunities when cash flows are low. Furthermore, industry investment hasbeen positively related to the level of jet fuel costs, suggesting that airlines could hedge topreserve cash flow to use for such investment. Hedging may be important in this respectbecause airlines face significant distress costs, and typically face low credit ratings.
III. What Explains Jet Fuel Hedging by Airlines?
Much of the empirical research in corporate risk management seeks to identify the factorsthat explain hedging. While the focus of our study is primarily to understand the valueeffects of hedging, it remains instructive to identify the explanatory factors of fuel hedgingin the airline industry. In particular, our discussion in Section II suggests that the Froot et al.(1993) underinvestment framework should be particularly applicable to our sample.13 In thissection, we analyze what factors are important in explaining jet fuel hedging by airlines.
A. Empirical Models
The theories of corporate risk management may be classified into three categories. First,financial constraint theories argue that measures of financial constraints should be useful inexplaining hedging. By relaxing these constraints, hedging allows for higher value by reducingexpected costs of underinvestment (e.g., Froot et al., 1993) or by reducing expected financialdistress costs (e.g., Smith and Stulz, 1985). Second, tax arguments suggest that hedging isvaluable because of greater tax benefits resulting from increased leverage (e.g., Leland,1998), or because of lower tax liabilities resulting from the convexity of corporate tax functions(e.g., Smith and Stulz, 1985). Finally, risk-averse managers are naturally inclined to seek waysto reduce firm risk. The nature of management’s holdings of corporate securities can increaseor reinforce their risk aversion (e.g., Smith and Stulz, 1985).
Incorporating theories of corporate risk management, we build empirical models to explainjet fuel hedging by the sample airlines. Table V shows results of three random effects models.The results shown reflect only variables exhibiting at least weak degrees of statisticalsignificance in explaining jet fuel hedging. Before discussing the results, we first discuss thevariables used (including those not included in the models presented). Table IV showssummary statistics for the variables discussed in subsequent paragraphs.
The dependent variable in each of the first two models of Table V is the percent of nextyear’s fuel requirements hedged as of the end of the fiscal year. As shown earlier in Table I,there is considerable variation in these hedge ratios, and a number of airlines do not hedgefuture fuel purchases at any time during our study. In Model 3 of Table V, we contrast theresults of Models 1 and 2 by using a simple binary measure of hedging that equals one if thepercent hedged is positive, or zero otherwise.
The first four independent variables shown in Model 1 of Table V have implications forfinancial constraints hypotheses. The capital expenditures-to-sales ratio and Tobin’s Q areused to proxy for the amount and productivity of investment opportunities, respectively. Inthe underinvestment costs framework, both of these variables should be positively relatedto hedging. The debt ratio serves as a standard measure of financial constraints, and is
13Several articles investigate whether corporate risk management practices are consistent with predictions of theFroot et al. (1993) theory. These include Adam (2002), Allayannis and Mozumdar (2000), Deshmukh and Vogt(2005), and Gay and Nam (1998). All of these articles find evidence suggesting that this theoretical frameworkexplains corporate hedging behavior. Nevertheless, none of the articles mentioned analyze the value implicationsof hedging.

Carter, Rogers, & Simkins • Does Hedging Affect Firm Value? 67
Table IV. Summary Statistics of Variables Used in Regression Models
This table presents summary statistics for the variables used in the regression models. The data are gathered from firm 10-K filings and Compustat.
Variable Mean Median Std Dev Min Max
% of next year's fuel requirements hedged 0.109 0.000 0.200 0 0.878
Positive % fuel hedged indicator 0.370 0.000 0.484 0 1
Capital expenditures-to-sales 0.117 0.083 0.127 0 1.030
Tobin’s Q 0.955 0.749 0.576 0.039 3.963
LT debt-to-assets 0.266 0.262 0.178 0.000 1.000
ln(Assets) 6.843 6.513 1.990 2.621 10.399
Capital expenditures-to-sales (lease-adjusted) 0.273 0.255 0.350 -0.828 1.775
Tobin’s Q (lease-adjusted) 0.962 0.864 0.342 0.265 3.530
LT debt-to-assets (lease-adjusted) 0.577 0.583 0.181 0 1
ln(Assets) (lease-adjusted) 7.498 7.349 1.796 3.728 10.609
Cash flow-to-sales 0.049 0.073 0.099 -0.353 0.359
Cash-to-sales 0.152 0.120 0.122 0.000 0.683
Credit rating* 22.278 20.000 7.790 8.000 30.000
Z-score 2.035 1.727 1.868 -6.167 7.666
Tax loss carryforwards-to-assets 0.110 0.000 0.386 0.000 3.635
Dividend indicator 0.297 0.000 0.458 0 1
Executive options-to-shares outstanding 0.046 0.034 0.061 0.000 0.570
Executive shares-to-shares outstanding 0.071 0.009 0.175 0.000 0.787
CEO options-to-shares outstanding 0.022 0.014 0.030 0.000 0.305
Executive shares-to-shares outstanding 0.035 0.003 0.123 0.000 0.772
Fuel pass-through indicator 0.222 0.000 0.416 0 1
Charter indicator 0.455 0.000 0.499 0 1
Foreign currency derivatives indicator 0.230 0.000 0.422 0 1
Interest rate derivatives indicator 0.258 0.000 0.438 0 1
*The reported statistics for the credit rating is based on the numerical values assigned by Compustat. Alarger value represents a lower credit score, e.g., a value of 2 corresponds to a AAA rating assigned byStandard & Poor’s, while a value of 27 corresponds to a D rating.

Financial Management • Spring 200668
generally predicted to show a positive relation with hedging if firms facing higherprobabilities of distress hedge more. Finally, firm size (as measured by the natural logarithmof total assets) potentially serves as an inverse measure of bankruptcy costs. If so, firm sizeshould be negatively related to hedging.14
In Section II, we discussed leasing practices of airlines. Aircraft are often leased usingoperating leases, and the values of these aircraft are not reflected on airline balance sheets.Thus, the reported values of the first four independent variables in Table V aresystematically misstated depending upon the usage of operating leases. We use anadjustment process explained in Damodaran (2002) to find the present value of futureoperating lease obligations. This present value is then added to assets and debt, thusadjusting the value of Q, the long-term debt-to-assets ratio, and total assets. We revisecapital expenditures by adding the difference between the present values of the operatinglease obligations to the reported capital expenditures. In Model 2, we use lease-adjustedvalues of the first four independent variables.
The next three variables shown, cash flow-to-sales ratio, cash-to-sales ratio, and creditrating, also might proxy for financial constraints. Airlines that generate greater cash flowshould have less binding financial constraints, so they might have fewer incentives tohedge. Alternatively, better-performing firms may want to hedge to lock in the effects of theirhigher profitability as in Breeden and Viswanathan (1998).
Cash holdings are an important form of financial slack for firms that view external financingas more costly than internal financing (e.g., Myers and Majluf, 1984). Thus, cash provides afinancial buffer, so we predict a negative relation with hedging. One additional financialconstraint variable employed, but dropped from the final tests, is an indicator variable forfirm-years in which dividends are paid. The dividend dummy exhibits no statisticallysignificant relation with jet fuel hedging.
The probability of bankruptcy serves as an important financial constraint. We utilize S&Pcredit ratings and Altman’s Z-score as potential measures of bankruptcy probability. Insubsequent analyses, we find that the Z-score exhibits no statistically significant relationwith jet fuel hedging. The S&P credit rating used is the Compustat numeric scale from 2 to 28(with lower numbers reflecting higher credit ratings). We code any missing firm-yearobservations with values of 30.
Graham and Rogers (2002) empirically examine the tax incentives to hedge for a broadcross-section of firms, and find that the tax benefits of additional leverage that can beundertaken are an important source of value from hedging. Their analysis suggests that weshould observe a positive relation between leverage and hedging if tax arguments areimportant. In the same article, they find no evidence that tax function convexity explainshedging behavior. While we do not have access to a direct measure of tax function convexity,we use tax loss carryforwards as a proxy. If tax convexity is important in explaining hedging,we expect a positive relation between carry-forwards and hedging. We find no statisticalevidence of any relation, and drop this variable from the analysis.
Tufano (1996) illustrates that managerial incentives are an important factor in explaininggold price hedging by mining firms. We incorporate managerial incentives by gatheringoption and share holding data for the executives listed in the Execucomp database and fromproxy statements. We divide executive share and option holdings by the number of sharesoutstanding for each firm-year. We also do this for the CEO only. We find that neither option
14Nance et al. (1993) point out that corporate risk management might be positively related to firm size becauseeconomies of scale may apply to operational and transactions costs of hedging. Most empirical studies of hedgingdocument positive relations with firm size.

Carter, Rogers, & Simkins • Does Hedging Affect Firm Value? 69
Table V. Determinants of Jet Fuel Hedging by Airlines
This table reports the results of regressions explaining the hedging of future jet fuel purchases by sample airlines during the period 1992 – 2003. In Models 1 and 2, the dependent variable is the percentage of the next year’s fuel requirements hedged as of the end of the fiscal year. In Model 3, the dependent variable is an indicator equaling one if the percentage hedged is greater than zero, and zero otherwise. Year dummies are included in each of the regressions, but are not reported. p-values are reported below the coefficients (in parentheses). Statistical significance at the 10%, 5%, and 1% levels is indicated by *, **, ***, respectively.
Model 1
Random
Effects Tobit
Model 2
Random
Effects Tobit
Model 3
Random
Effects Logit
Constant -0.0773 (0.817)
0.0234 (0.941)
-3.6849 (0.414)
Capital expenditures-to-sales 0.3073 (0.102)
3.6567 (0.164)
Tobin’s Q 0.1367 ** (0.017)
0.5934 (0.413)
LT debt-to-assets -0.0848 (0.579)
0.9672 (0.619)
ln(Assets) 0.0532 * (0.056)
0.5778 (0.141)
Capital expenditures-to-sales (adjusted for leases) 0.1001 (0.262)
Tobin’s Q (adjusted for leases) 0.2249 *** (0.007)
LT debt-to-assets (adjusted for leases) -0.2729 ** (0.043)
ln(Assets) (adjusted for leases) 0.0492 ** (0.032)
Cash flow-to-sales 0.7896 ** (0.034)
0.4812 (0.184)
7.4863 * (0.099)
Cash-to-sales -0.4939 (0.109)
-0.4056 (0.179)
-5.5166 (0.142)
Credit rating -0.0226 *** (0.000)
-0.0214 *** (0.000)
-0.1281 (0.109)
Fuel pass-through indicator -0.3854 *** (0.001)
-0.3894 *** (0.000)
-2.8554 ** (0.023)
Interest rate derivatives indicator 0.1128 * (0.065)
0.0766 (0.111)
1.6315 ** (0.047)
Executive shareholdings-to-shares outstanding 0.5684 *** (0.007)
0.4852 *** (0.007)
5.1093 ** (0.041)
Number of observations 215 (127 censored)
206 (120 censored)
215
Log likelihood -29.56 -30.80 -76.03

Financial Management • Spring 200670
holdings at the executive or CEO level provide explanatory power in the hedging models, nordoes CEO shareholdings. Executive shareholdings are the only remaining managerial incentivevariable shown in the model.
We also check the relations of alternative hedging mechanisms in the regressions.Specifically, we include dummy variables to indicate if airlines hold foreign currencyderivatives, if they hold interest rate derivatives, if they use fuel pass-through agreements,and if they disclose that chartering is a significant portion of their overall businesses. Neitherthe charter nor the foreign currency indicators exhibit any explanatory power in the modelsof jet fuel hedging, so these variables are dropped from the analyses.
B. Results
The results shown in Table V largely suggest that the percent of future jet fuel requirementshedged are explained by firm characteristics that are consistent with the underinvestmentcosts framework of Froot et al. (1993). Models 1 and 2 of Table V show that Tobin’s Q ispositively associated with the amount of jet fuel hedged. This result implies that airlineswith more productive investment opportunities hedge more, and this is a key predictionfrom the underinvestment hypothesis. Capital expenditures exhibit a positive relationwith the amount of hedging, although the coefficients are not statistically significant atstandard levels.
Firm leverage, after being adjusted to account for future operating lease obligations, isnegatively related to the amount of jet fuel hedged. Additionally, the credit rating variable isnegatively related to the amount of jet fuel hedged, thus implying that firms with highercredit ratings hedge more. This set of results could be argued to imply that hedging isconducted by airlines with fewer financial constraints.15 This argument is true if all airlinesface similar costs of distress (if distress occurs). However, if airlines with greater distresscosts optimally choose lower debt ratios and are assigned higher credit ratings, then theobserved results appear more consistent. Recall that underinvestment costs are a subset oftotal distress costs. Firms with greater productivities and amounts of investment opportunitiesstand to lose more value if distress occurs. Thus, the leverage and credit rating results arecomplementary to the Q and capital expenditures results discussed above. The ratio of cashflow to sales exhibits a positive relation with amount of jet fuel hedged in Model 1. Thisresult is generally inconsistent with a financial constraints argument. On the other hand, weobserve a negative (but not statistically significant) relation between cash holdings andamount hedged. Firm size shows a positive relation with jet fuel hedging. If smaller firms facelarger proportional distress costs, then this result is inconsistent with a distress argument.The hedging versus size result also suggests that larger airlines do not subscribe to a “toobig to fail” hypothesis in setting risk management policies. Rather, the positive relation isconsistent with an argument that economies of scale and/or scope might apply to hedgingfuture jet fuel purchases.
Model 3 of Table V utilizes a binary variable to indicate positive amounts of jet fuelhedging. To maintain consistency with Models 1 and 2, we employ a random effects model.The signs on the coefficients are consistent between the models, but the logit model is
15Fazzari, Hubbard, and Petersen (1988) argue that the sensitivity of investment to cash flow is a measure offinancial constraints for individual firms. We compute investment-cash flow sensitivity coefficients for eachairline using annual and quarterly data. We find that airlines with average hedge ratios of over 10% across allavailable years exhibit higher average investment-cash flow sensitivity coefficients than do airlines that hedgelittle or not at all. The statistical significance is weak because of the small number of airlines. P-value values are0.126 and 0.078 for the annual and quarterly data, respectively.

Carter, Rogers, & Simkins • Does Hedging Affect Firm Value? 71
unable to identify most of the relations found when using the continuous hedgingvariable. The logit model, as in the Tobit models, shows that jet fuel hedging is negativelyassociated with the existence of fuel pass-through agreements and positively related toexecutive shareholdings.16
IV. Do Investors Value Jet Fuel Hedging?
We investigate whether airlines’ jet fuel hedging activities affect firm value by estimatingthe empirical relationships between Tobin’s Q (our proxy for firm value) and jet fuel hedging.We construct our models to resemble those used by Allayannis and Weston (2001). Inaddition to fuel hedging variables, the list of explanatory variables used in Table VI includesfirm size, a dividend indicator, long-term debt-to-assets, cash flow-to-sales ratio, capitalexpenditures-to-sales ratio, advertising-to-sales ratio, S&P credit rating score, and Altman’sZ-score.17 We also include indicator variables to proxy for the possible effect on value ofother risk management techniques, such as fuel pass-through agreements, charter operations,interest rate derivatives, and foreign currency derivatives. Finally, we include a liquiditymeasure, the ratio of cash to sales, in the regressions. Carter and Simkins (2004) find thatairlines with greater liquidity demonstrate less sensitivity to the market price effect of the 9/11 attacks.18
A. Measurement of Firm Value
We measure firm value using the simple approximation of Tobin’s Q, developed by Chungand Pruitt (1994).19 This method offers several advantages: first, the computational cost islow relative to other more complex methods of calculating Tobin’s Q. Second, the data arereadily available using COMPUSTAT for small, as well as large, firms. Finally, Chung andPruitt (1994) and Perfect and Wiles (1994) find a high degree of correlation between the
16In untabulated results, we also include two other operational measures to analyze jet fuel hedging. Airlines witholder, less fuel-efficient aircraft might be more likely to hedge jet fuel purchases. We include average aircraft age(gathered from 10-K disclosures) to proxy for this argument. We also gather the percentage of labor costs as apercentage of operating expenses (also from 10-K filings), and hypothesize that airlines with higher labor costsmight require more active management of fuel costs. Because of data limitation, including these variables reducesthe number of observations to 153 in Models 1 and 3 and 150 in Model 2. In results consistent with thehypothesis that airlines flying older airplanes have greater incentives to hedge fuel costs, aircraft age shows apositive and statistically significant relation with jet fuel hedging in all three models when age and labor costpercentage are included. However, the coefficient on aircraft age is not significant if the labor cost percentagevariable is excluded.17We use the cash flow-to-sales ratio as a proxy for ROA used by Allayannis and Weston (2001). The correlationof these two variables is about 85%. We find that cash flow-to-sales effectively captures the expected positiverelation between profitability and firm value, while the ROA variable does not exhibit this relation. The inclusionof post-9/11/2001 data reduces the ability of ROA to explain firm value.18Hedging might also be associated with higher firm value because hedging firms are better able to meet analysts’earning forecasts, as suggested in Brown (2001). DaDalt, Gay, and Nam (2002) find that hedging allows firmsto better meet analyst forecasts. Using 169 annual analyst earnings forecasts during 1994-2002, we find thatthe firm-years in which firms hedged jet fuel display smaller forecast errors relative to non-hedging firm-years.The differences are not statistically significant if we include 2001 data, but become so when 2001 observationsare removed.19The Tobin’s Q ratio is calculated as the following sum divided by book value of total assets: (market value ofequity + liquidation value of preferred stock + the book values of long-term debt and current liabilities – currentassets + book value of inventory). We use Moody’s Industrial Manual to obtain the yields on preferred stock formedium-grade industrials.

Financial Management • Spring 200672
Table VI. Estimates of the Relation Between Firm Value and Hedging Behavior
This table reports the results of regressions of firm value, as measured by the natural logarithm of Tobin’s Q, on measures of hedging behavior and other firm characteristics. Models 1 and 2 are estimated with OLS using robust standard errors that account for the clustered sample. Model 3 is estimated as a firm fixed effects model, while Model 4 uses time-series feasible generalized least squares with heteroskedastically consistent standard errors. Year dummy variables are included in all regressions, but are not reported. p-values are reported in parentheses below the coefficients. Statistical significance at the 10%, 5%, and 1% levels is indicated by *, **, ***, respectively.
Variable
Model 1
Pooled OLS
(n = 229)
Model 2
Pooled OLS
(n = 228)
Model 3
Fixed
Effects
(n = 228)
Model 4
FGLS
(n = 228)
Constant -0.0272 (0.970)
-0.0852 (0.908)
1.1668 (0.163)
-0.5574 (0.179)
ln(Assets) -0.1716*** (0.004)
-0.1735 *** (0.003)
-0.1468 (0.126)
-0.1151 *** (0.000)
Dividend Indicator 0.2120 ** (0.040)
0.1927 * (0.056)
0.1402 (0.210)
0.1721 *** (0.001)
LT Debt-to-Assets 0.6936 * (0.075)
0.7095 * (0.074)
0.4952 ** (0.029)
0.8187 *** (0.000)
Cash Flow-to-Sales 1.4074 * (0.099)
1.3613 (0.108)
1.1890 ** (0.016)
0.4206 (0.244)
Cap Exp to Sales 0.2252 (0.487)
0.1825 (0.578)
-0.1489 (0.635)
0.1772 (0.378)
Z-score 0.1014 (0.185)
0.0982 (0.200)
0.1058 *** (0.003)
0.1800 *** (0.000)
Credit Rating -0.0063 (0.620)
-0.0046 (0.726)
-0.0169 (0.109)
-0.0042 (0.488)
Advertising-to-Sales 12.1061*** (0.001)
11.5784 *** (0.001)
-3.0200 (0.591)
10.8120 *** (0.000)
Cash-to-Sales -0.3432 (0.485)
-0.2764 (0.589)
-0.2291 (0.578)
-0.3086 (0.218)
Positive % Fuel Hedged Indicator 0.0442 (0.665)
% of Next Year’s Fuel Requirements Hedged
0.3475 * (0.069)
0.2770 (0.132)
0.3323 *** (0.005)
Charter Indicator -0.0619 (0.598)
-0.0575 (0.621)
-0.2775 ** (0.014)
-0.0074 (0.888)
Fuel Pass-through Indicator -0.2549 * (0.082)
-0.2367 * (0.096)
0.1172 (0.380)
-0.1826 *** (0.004)
Foreign Currency Derivatives Indicator 0.0969 (0.506)
0.1006 (0.508)
0.0199 (0.895)
0.1375 ** (0.031)
Interest Rate Derivatives Indicator 0.0484 (0.745)
0.0408 (0.785)
0.1194 (0.250)
-0.0326 (0.549)
R2 0.4555 0.4627 0.4725 Log Likelihood -57.84
Wald 2 340.97 ***

Carter, Rogers, & Simkins • Does Hedging Affect Firm Value? 73
simple approximation and more rigorous constructions of Q.20 DaDalt, Donaldson, and Garner(2003) note these three advantages of utilizing a simple construction of Q, and conclude thatthe simple Q calculation is preferable in most empirical applications. Given the proportion ofsmaller firms in our sample, the availability of data is an especially important issue.
Our sample consists of 28 airlines over a maximum period of 1992-2003 with a total of 251firm-year observations of Tobin’s Q. Given unavailability of operating lease data for fivefirm-years, the lease-adjusted Q variable has 246 observations.
B. Empirical Models: Firm Value and Hedging
Table VI presents initial results for the estimation of the effect of jet fuel hedging on airlinefirm value. The only distinction between the first two models is that we utilize a binary fuel-hedging variable in Model 1, while we use a continuous variable in Model 2. Both models areestimated using pooled OLS with robust standard errors that account for clustered data.21
The results shown in the first two models illustrate a positive relation between jet fuelhedging and airline firm value. However, the coefficient on the binary variable in Model 1 isnot statistically significant. This result implies that merely choosing to hedge future jet fuelpurchases, regardless of the amount, has a statistically immeasurable effect on value.However, the economic magnitude of the coefficient, 0.0442, is similar to the hedging premiumsdocumented by Allayannis and Weston (2001).
Using the continuous hedging measure, the results in Model 2 of Table VI show that thegreater the hedged percentage of next year’s fuel requirements, the higher is firm value. Thecoefficient is statistically significant at the 10% level. The coefficient of 0.3475 implies thatan airline with 100% of its fuel requirements hedged would exhibit a value premium of almost35% relative to one with none of its fuel requirements hedged. The average amount of fuelhedged across firm-years in which hedging is positive is 29.4% (see footnote 5). Thus, anaverage hedging firm exhibits a value premium of about 10.2%. The magnitude of this valuepremium is considerably larger than the 5% currency-hedging premium found by Allayannisand Weston (2001).
Models 3 and 4 of Table VI demonstrate that the magnitude of the hedging premiumassociated with the continuous hedging variable is robust to differing econometricspecifications. In these specifications, we estimate the regressions using fixed effects andtime-series feasible generalized least squares (FGLS), respectively.22 The coefficients on thehedged percentage of fuel requirements variable are about 0.28 and 0.33 in Models 3 and 4,and the coefficient is statistically significant in the FGLS specification.
20Perfect and Wiles (1994) find that regression results using the simple approximation may differ from morecomplex estimations of Tobin’s Q. However, when estimating relationships using changes in values, the simpleapproximation produces similar results to the other calculations of Q. We conduct tests using both value levelsand changes.21The fact that Q is an independent variable in the hedging specifications presented in Section III and hedgingvariables are independent variables in the firm value regressions raises concerns about endogeneity and simultaneitybiases. To address this issue, we conduct tests for endogeneity (e.g., Kennedy, 1992) of hedging in the valueregression (and vice versa). We find no support for the hypothesis that Q is endogeneous in the hedgingspecification. On the other hand, we find limited support that hedging is endogeneous in the Q regressions. To ourknowledge, there are no instrumental variable regression methodologies that can account for a censored variablein one of the regressions. As a robustness check, we use fitted values from the hedging specification as anindependent variable in the firm value regression, and continue to find economically significant relations (andoften statistically significant) between firm value and the percentage-hedged variable.22We also estimate the model using a random effects model. The results are very similar to those estimated in thepooled OLS regression of Model 2.

Financial Management • Spring 200674
In Section III, we adjust Tobin’s Q, assets, leverage, and capital expenditures to accountfor the effect of operating leases. In untabulated results, we repeat the analyses shown inTable VI. The results continue to suggest a hedging premium, although the magnitudes ofthe coefficients are about 30% - 60% of the size of those shown in Table VI. This changeoccurs generally across all independent variables. The statistical significance of the hedgingcoefficients remains similar to that of the coefficients shown in Table VI. A potentialexplanation for the change in magnitudes is that the operating lease adjustment has theeffect of increasing (decreasing) the level of Q for low (high) Q firms. This occurs becauseour measurement of Q assumes that the market value of debt is equal to the book value ofdebt. If the market value of debt is less than the book value for low Q firms and hedging hasa positive effect on market value, then the observed relation between fuel hedging and valuemay be diluted using the adjusted Q values.
The results shown in Tables V and VI raise a question about causality: higher Q firms areshown to hedge more in Table V, and firms that hedge more are associated with highervalues of Q. An alternative means to measure the value consequences of hedging is tomeasure the change in value when firms change hedging policy. This type of analysis isless likely to suffer from endogeneity that may call the Table VI results into question.Table VII shows the results from regressions of changes in natural logarithm of Q onchanges in the independent variables.
Table VII illustrates that changes in jet fuel hedging are positively related to changes infirm value. The first model uses changes in the binary hedging variable, and the coefficientimplies a hedging premium of about 6%. The second model uses changes in the continuousvariable. The positive coefficient of 0.188 suggests that a change from no hedging to theaverage (for hedging firms) of 29.4% is associated with a value change of about 5.5%. Thehedging coefficients are statistically significant at 10% in both models. To confirm thatchanges in Q are not driving the results we observe in Table VII, we also conduct regressionsof changes in the hedging variables on changes in the independent variables shown in TableV. We find no evidence that increases in Q are associated with increases in the amount orprobability of hedging future jet fuel purchases.
C. Is the Hedging Premium Related to Investment Opportunities?
The analysis presented in the prior section of the article establishes a positive relationbetween hedging and firm value. In Section III, we illustrate that the determinants of jetfuel hedging by airlines are largely consistent with an underinvestment theory. In thissection, we present analyses designed to ascertain whether such a rationale explains thehedging premium.
As an initial test, Table VIII shows the results of regression models that are comparable tothose presented in Table VI. The only difference is the inclusion of two additional independentvariables measuring the interaction of jet fuel hedging with capital expenditures. In Model 1,we use the binary fuel-hedging variable multiplied by the capital expenditures-to-sales ratio.Models 2 – 4 utilize the percentage-hedged variable to calculate the interaction term.
Table VIII shows no significant relation between the fuel-hedging variables and firm value.Meanwhile, the coefficient on the interaction of capital expenditures and hedging is positiveand statistically significant in two of the four models. The interpretation is that for airlineshedging future fuel purchases, greater capital spending is associated with higher firm value.As an example of the value premium associated with hedging, we use the average level ofcapital expenditures-to-sales of 11.7% and a hedge ratio of 29.4%. Using the coefficients

Carter, Rogers, & Simkins • Does Hedging Affect Firm Value? 75
Table VII. Estimates of the Relation Between Changes in Firm Value and
Changes in Hedging Behavior
This table shows results of regressions of the change in firm value, as measured by the change in the natural logarithm of Tobin’s Q, on measures of the change in hedging behavior and other firm characteristics. Year dummy variables are included in all regressions, but are not reported. T-statistics are calculated using standard errors corrected for clustering by firm in the sample data. The resulting p-values are shown in parentheses beneath the parameter estimates. Statistical significance at the 10%, 5%, and 1% levels is indicated by *, **, ***, respectively.
Variable
Model 1
Pooled OLS
(n = 201)
Model 2
Pooled OLS
(n = 200)
Constant -0.1319 (0.437)
-0.1635 (0.341)
ln(Assets) -0.3075 ** (0.037)
-0.2975 ** (0.049)
Dividend indicator -0.0296 (0.689)
-0.0243 (0.754)
LT debt-to-assets 0.9063 *** (0.006)
0.8968 *** (0.006)
Cash flow-to-sales 0.6597 (0.238)
0.6628 (0.246)
Cap exp to sales 0.2406 (0.403)
0.2558 (0.355)
Z-score 0.1270 (0.223)
0.1257 (0.229)
Credit rating -0.0176 (0.201)
-0.0169 (0.217)
Advertising-to-sales -3.7460 (0.653)
-3.8363 (0.644)
Cash-to-sales -1.1210 *** (0.000)
-1.1094 *** (0.000)
Positive % fuel hedged indicator 0.0602 * (0.060)
% of next year’s fuel requirements hedged 0.1881 * (0.068)
Charter indicator -0.0881 (0.410)
-0.0820 (0.444)
Fuel pass-through indicator 0.0744 (0.277)
0.0799 (0.213)
Foreign currency derivatives indicator -0.0148 (0.923)
-0.0241 (0.873)
Interest rate derivatives indicator -0.0669 (0.381)
-0.0686 (0.368)
R2 0.4382 0.4390
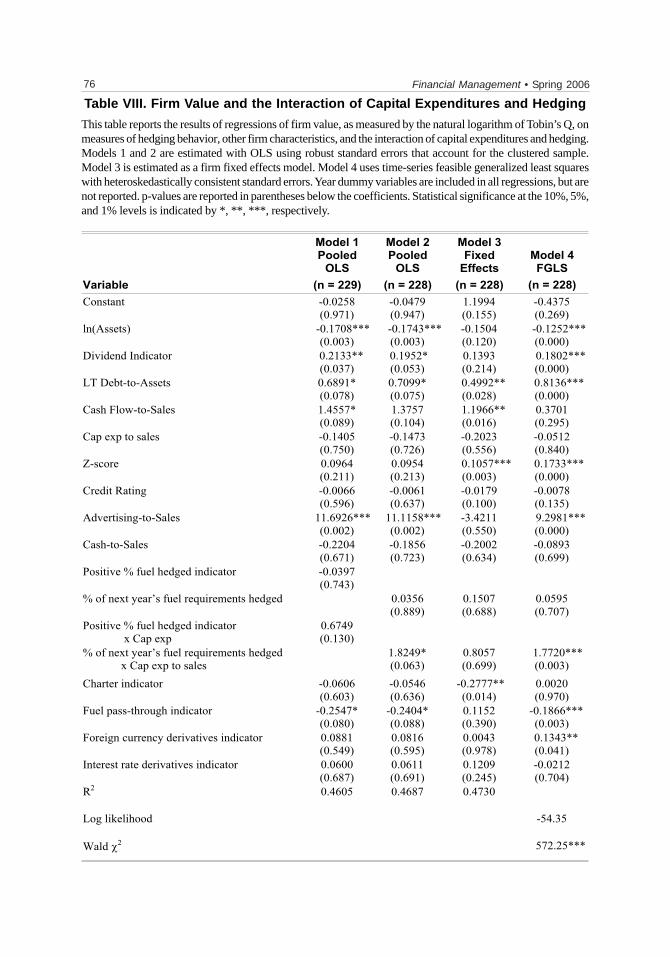
Financial Management • Spring 200676
Variable
Model 1
Pooled
OLS
(n = 229)
Model 2
Pooled
OLS
(n = 228)
Model 3
Fixed
Effects
(n = 228)
Model 4
FGLS
(n = 228)
Constant -0.0258 (0.971)
-0.0479 (0.947)
1.1994 (0.155)
-0.4375 (0.269)
ln(Assets) -0.1708***(0.003)
-0.1743***(0.003)
-0.1504 (0.120)
-0.1252*** (0.000)
Dividend Indicator 0.2133** (0.037)
0.1952* (0.053)
0.1393 (0.214)
0.1802*** (0.000)
LT Debt-to-Assets 0.6891* (0.078)
0.7099* (0.075)
0.4992** (0.028)
0.8136*** (0.000)
Cash Flow-to-Sales 1.4557* (0.089)
1.3757 (0.104)
1.1966** (0.016)
0.3701 (0.295)
Cap exp to sales -0.1405 (0.750)
-0.1473 (0.726)
-0.2023 (0.556)
-0.0512 (0.840)
Z-score 0.0964 (0.211)
0.0954 (0.213)
0.1057*** (0.003)
0.1733*** (0.000)
Credit Rating -0.0066 (0.596)
-0.0061 (0.637)
-0.0179 (0.100)
-0.0078 (0.135)
Advertising-to-Sales 11.6926***(0.002)
11.1158***(0.002)
-3.4211 (0.550)
9.2981*** (0.000)
Cash-to-Sales -0.2204 (0.671)
-0.1856 (0.723)
-0.2002 (0.634)
-0.0893 (0.699)
Positive % fuel hedged indicator -0.0397 (0.743)
% of next year’s fuel requirements hedged 0.0356 (0.889)
0.1507 (0.688)
0.0595 (0.707)
Positive % fuel hedged indicator x Cap exp
0.6749 (0.130)
% of next year’s fuel requirements hedged x Cap exp to sales
1.8249* (0.063)
0.8057 (0.699)
1.7720*** (0.003)
Charter indicator -0.0606 (0.603)
-0.0546 (0.636)
-0.2777** (0.014)
0.0020 (0.970)
Fuel pass-through indicator -0.2547* (0.080)
-0.2404* (0.088)
0.1152 (0.390)
-0.1866*** (0.003)
Foreign currency derivatives indicator 0.0881 (0.549)
0.0816 (0.595)
0.0043 (0.978)
0.1343** (0.041)
Interest rate derivatives indicator 0.0600 (0.687)
0.0611 (0.691)
0.1209 (0.245)
-0.0212 (0.704)
R2 0.4605 0.4687 0.4730
Log likelihood -54.35
Wald 2 572.25***
Table VIII. Firm Value and the Interaction of Capital Expenditures and Hedging
This table reports the results of regressions of firm value, as measured by the natural logarithm of Tobin’s Q, onmeasures of hedging behavior, other firm characteristics, and the interaction of capital expenditures and hedging.Models 1 and 2 are estimated with OLS using robust standard errors that account for the clustered sample.Model 3 is estimated as a firm fixed effects model. Model 4 uses time-series feasible generalized least squareswith heteroskedastically consistent standard errors. Year dummy variables are included in all regressions, but arenot reported. p-values are reported in parentheses below the coefficients. Statistical significance at the 10%, 5%,and 1% levels is indicated by *, **, ***, respectively.

Carter, Rogers, & Simkins • Does Hedging Affect Firm Value? 77
from Model 2 of Table VIII, the average hedging firm is expected to be valued 7.3% higherthan a non-hedging firm ((1.8249 x 0.117 x 0.294) + (0.0356 x 0.294)). The first term in parenthesesrepresents the portion of the hedging premium associated with capital expenditures, and isabout 86% of the total. If we repeat the hedging premium decomposition for the other modelssimilarly, we find that the interaction of hedging and capital expenditures explains 201%,38%, and 78% of the hedging premium in Models 1, 3, and 4, respectively.
While the analysis above is not a direct test that jet fuel hedging reduces theunderinvestment problem for airlines, it does establish that capital spending is more valuedfor hedgers than for non-hedgers. Why might this be? A reasonable argument would be thatjet fuel hedging makes future capital spending less susceptible to future increases in jet fuelprices. Thus, current capital expenditures might be more reflective of future capitalexpenditures. As a result, investors place additional value on capital expenditures madetoday by hedgers because of greater confidence that these are a better proxy for futureinvestment opportunities.23
Thus far, we have limited the analysis to one-stage regression specifications. The theoreticalframework for our empirical study suggests the following link: 1) the hedging decision ismade at time 0, 2) the outcome of investment decisions (i.e., capital expenditures) are observedbetween time 0 and time 1, and 3) firm value and the firm’s next hedging decision are observedat time 1. This sequence of events implies the following two-stage empirical framework:
Capital expenditurest = f(hedging
t-1, other controls)
Firm valuet = f(predicted capital expenditures
t, hedging
t, other controls)
To model this framework, we regress capital expenditures-to-sales on the cash flow-to-sales, lagged Q, and lagged percent hedging variables. The fitted values from the first-stagecapital expenditures estimation are then utilized in the second-stage estimation of Q.
Table IX presents results of the first-stage estimation of capital expenditures-to-sales, andthe second-stage estimation of Q. To obtain an estimated hedging premium from this system,we multiply the hedging coefficient reported in the first-stage estimation by the averagehedge percentage, and then multiply this amount by the coefficient on the predicted capitalexpenditures variable in the second-stage estimation. This portion represents the hedgingpremium associated with its effect on the firm’s capital spending. To obtain the total hedgingpremium, we then add the product of the hedging variable coefficient from the second-stageQ estimation and the average hedge percentage. We report results using Q and capitalexpenditures that are unadjusted (first two columns) and adjusted (last two columns) toaccount for operating leases.
The results shown in the first and third columns of Table IX illustrate that predicted capitalexpenditures are positively related to firm value. The second and fourth columns illustratethe effect of lagged hedging on capital expenditures. In both cases, the coefficients arepositive and economically significant (although the relation is not statistically significantwhen adjusted capital expenditures are used).
The implied hedging premium from the models using unadjusted Q and capitalexpenditures is about 20.7% [e.g., (0.0742 x 0.294 x 9.6394) + (-0.0126 x 0.294)]. The term inthe first parentheses represents the proportion of the hedging premium attributable to the
23An additional implication of our analysis is that hedging airlines should be better able to acquire other firms. As asimple test of this hypothesis, we gather acquisition data for the sample firms from Bloomberg and regress the numberof acquisitions completed during the sample time frame on a dummy variable equal to one if the airline hedged fuelpurchases during the time frame. We find a positive relation that is statistically significant at the 1% level.

Financial Management • Spring 200678
Table IX. The Effect of Hedging on Value via Capital Expenditures
This table shows results of regressions calculated with a two-stage process. In the first stage, we regress capital expenditures-to-sales on cash flow-to-sales, lagged Q, and the lagged percentage of fuel requirements hedged. In the second stage, we regress natural logarithm of Q on the predicted value of capital expenditures-to-sales estimated for each firm-year from the first-stage regressions. Coefficients are listed first with p-values listed below each coefficient. Year indicators are included in the regressions of Q, but are not reported. Standard errors in the regressions of Q are corrected to account for the clustered sample. Statistical significance is denoted by *, **, and *** to represent 10%, 5%, and 1% significance, respectively.
Variable
ln(Q)
(n = 203)
CAPX-to-
Sales
(n = 206)
ln(Q): Lease
Adj
(n = 201)
CAPX-to-
Sales:
Lease Adj
(n = 204)
Constant -1.0114 (0.158)
0.0602 *** (0.000)
-0.2699 (0.373)
-0.0941 (0.173)
ln(Assets) -0.1605 *** (0.006)
-0.0798 *** (0.004)
Dividend indicator 0.1703 * (0.073)
0.0870 * (0.072)
LT debt-to-assets 0.7211 ** (0.044)
0.3631 ** (0.020)
Cash flow-to-sales -0.8372 (0.344)
0.2296 *** (0.005)
-0.6964 (0.261)
1.1678 *** (0.000)
Predicted cap exp-to-sales 9.6394 *** (0.000)
1.2260 ** (0.010)
Z-score 0.0619 (0.178)
0.0516 * (0.084)
Credit rating -0.0006 (0.962)
-0.0030 (0.549)
Advertising-to-sales 9.7274 *** (0.005)
5.2255 ** (0.033)
Cash-to-sales -0.3732 (0.438)
-0.3647 * (0.099)
% of next year’s fuel requirements hedged
-0.0126 (0.942)
0.0713 (0.373)
Charter indicator -0.0475 (0.553)
-0.0111 (0.803)
Fuel pass-through indicator -0.2070 ** (0.038)
-0.0760 (0.171)
Foreign currency derivatives indicator
0.0968 (0.506)
0.0603 (0.368)
Interest rate derivatives indicator
0.0324 (0.766)
-0.0130 (0.809)
Lagged Q 0.0344 ** (0.013)
Lagged Q (lease-adjusted) 0.2928 *** (0.000)
Lagged % of next year’s fuel requirements hedged
0.0742 * (0.056)
0.1104 (0.330)
R2 0.6070 0.0999 0.6627 0.2153

Carter, Rogers, & Simkins • Does Hedging Affect Firm Value? 79
effect of hedging on capital expenditures. Thus, this model suggests that the hedgingpremium is entirely due to its effect on investment. If we examine the models that use Q andcapital expenditures adjusted for leases, the implied hedging premium is much smaller(about 6.1%). In this case, the proportion of the hedging premium associated withinvestment is about 65.5%.
D. How Does the Hedging Premium Change over Time?
Allayannis and Weston (2001) document that the hedging premium among firms withforeign currency exposure is highest during years in which the US dollar appreciates. Thisresult suggests that investors place higher valuations on hedging firms during periods inwhich hedging provides positive payoffs.
We analyze hedging premiums over time by interacting the hedge ratio with year indicatorvariables. Table X shows the coefficients on the by-year hedging variables from the samemodels as shown in Table VI, Models 2–4. The results generally show hedging premiumsincreasing over the time period studied with the highest values occurring in 2002 and 2003.For example, the coefficients on the 2002 hedge ratio variable are all statistically significant.The 2003 coefficients are statistically significant in two of three cases.24
We also examine the coefficient on the hedge ratio variable across different time periodsdepending upon the credit rating environment. From Table III, we observe that credit ratingchanges were entirely negative during 1992 – 1994 with limited changes, followed byoverwhelmingly positive changes from 1995 – 1998. The 2000 – 2003 period was characterizedby an inordinate number of downgrades. The interaction of the 2000 – 2003 indicator variablewith the hedge ratio shows a positive and statistically significant relation with firm value inall three specifications. This result implies that investors have valued hedging increasinglyduring recent years in which airlines have suffered from greater financial constraints.
Table X also shows hedging premiums during different jet fuel price conditions. Byobserving Figure 1, we categorize four different price regimes: 1) low prices and volatilityfrom 1992-1996, 2) declining prices during 1997-1998, 3) increasing prices from 1999-2000,and 4) high prices and volatility during 2002-2003. In results that are consistent with thoseseen earlier, we observe premiums that appear to increase over time with the highest premiumsoccurring in the 2002-2003 period. Thus, the results may be consistent with investors puttinga higher value on hedging during periods of high prices and volatility.
V. Conclusion
The US airline industry offers a unique sample allowing for a more direct test of the valueimplications of hedging predicted by Froot et al. (1993). High jet fuel prices coincide with lowindustry cash flows, and industry investment is positively related to the level of jet fuelcosts. Because jet fuel constitutes a large percentage of airline operating costs and jet fuelprices are highly volatile, airlines face an incentive to hedge fuel price risk. Such hedgingprovides firms with the opportunity to buy underpriced assets from distressed airlines duringperiods of high jet fuel prices and/or protects the ability to meet previously contracted24The stock price response of airlines to the September 11, 2001 attacks was quite varied as documented in Carterand Simkins (2004). We use their data to examine if hedging explains any of the variation of airline stock returnson September 17, 2001 (when the stock market reopened). In untabulated results, we find that the percentagehedged variable is positively related to abnormal returns, and exhibits stronger statistical significance than any ofthe variables included in their analysis..

Financial Management • Spring 200680
Table X. Hedging Premiums over Time
This table shows the results from regressions of the natural logarithm of Q on the percentage of next year’s fuel requirements hedged multiplied by a regime dummy variable (e.g., year, fuel pricing, etc.). The same set of control variables as shown in Table VI, Models 2 – 4 are utilized, but not reported. Statistical significance is denoted by *, **, and *** to represent 10%, 5%, and 1% significance, respectively.
Coefficients on Percentage of Next Year’s Fuel Requirements
Hedged * Regime Dummy
Pooled OLS Fixed Effects FGLS
Panel A. Hedging Premiums by Year
1994 -0.0267 0.5358 -0.2944 1995 -0.7683 0.0375 -0.8341 1996 0.5085 -0.4331 0.2993 1997 0.0871 0.0606 0.1846 1998 0.1112 0.0324 0.3073 * 1999 0.2491 0.1634 0.2517 2000 0.6318 0.4345 0.6061 ** 2001 0.3374 0.1648 0.4282 * 2002 1.1909 ** 1.0251 ** 0.9362 *** 2003 0.5749 * 0.4561 0.4665 **
Panel B. Hedging Premiums by Credit Rating Regime
1992 - 1994 (downgrades) -0.1286 1.0056 0.0140 1995 - 1998 (upgrades) 0.0249 -0.0255 0.0765 2000 - 2003 (downgrades) 0.5919 * 0.5154 ** 0.6541 ***
Panel C. Hedging Premiums by Fuel Price Regime
1992 - 1996 (low prices & volatility)
-0.2902 0.3175 -0.1293
1997 - 1998 (declining prices)
0.0485 -0.0010 0.1346
1999 - 2000 (increasing prices)
0.2568 0.2307 0.1344
2002 - 2003 (high prices & volatility)
0.7717 ** 0.6320 ** 0.7134 ***
purchase commitments.
We find that airlines employing jet fuel hedging trade at a premium, after controlling forother factors impacting value. This result provides evidence in support of Allayannis andWeston’s (2001) findings that hedging adds value, and suggests that the results of Jin andJorion (2004) might be a consequence of their sample choice. While Guay and Kothari (2003)question the validity of the Allayannis and Weston results, we argue that our results offerclearer evidence that hedging adds value because reduction of jet fuel price risk exposure isclearly economically significant.
Furthermore, our sample choice allows us to form a more educated opinion as to thesource of value gain from hedging. Large airlines are typically in the best position to buyassets of distressed airlines at discounted prices. Hedging future jet fuel purchases allows

Carter, Rogers, & Simkins • Does Hedging Affect Firm Value? 81
these firms a means to manage a significant source of variation in cash flows. Given that jetfuel price increases often coincide with distress in the airline industry, hedging provides anadditional source of cash for making acquisitions during these periods. Our results showthat the value increase from hedging increases with capital investment, and that thisinteraction provides the vast majority of the hedging premium. This result implies thatinvestors value hedging more in airlines where they expect hedging to protect the ability toinvest in bad times.
One caveat of our analysis is necessary. While we find that firm value is positivelyassociated with the amount of hedging, we do not claim that airlines can magically increasevalue by increasing the amount of fuel hedged. If airlines optimally choose an appropriatehedge ratio based on the benefits achievable from hedging, then firm value should reflectthis optimal hedging percentage. Rather, the hedging premium reflects that those firms withgreater ability to take advantage of the benefits associated with hedging, such as enhancedability to invest in economically profitable projects, have higher optimal valuations if theirhedging policy is chosen optimally. For example, the Froot et al. (1993) framework impliesthat an airline possessing valuable investment opportunities if fuel prices increase shouldchoose to hedge until it is ensured of enough cash flow to fund all of these investments. Foranother airline evaluating the same set of investment opportunities, if none are valuablethen this airline has no incentive to hedge future jet fuel purchases.�
Appendix. Example Disclosures Illustrating Fuel Price Risk for Airlines
The appendix provides examples of fuel price risk disclosures for airlines that do nothedge (see Panel A), use fuel derivatives (see Panel B) and use fuel pass-through agreements(see Panel C). The information is collected from the 10-K reports of airlines and illustrateshow exposure to jet fuel prices varies by firm based on the firm’s hedging mechanisms.
Panel A. Example Disclosures From Airlines that Do Not Hedge Future Jet Fuel Purchases
From Vanguard Airlines’ 1999 10K Report
Jet fuel costs are subject to wide fluctuations as a result of disruptions in supply or otherinternational events. The Company cannot predict the effect on the future availability andcost of jet fuel. The Boeing 737-200 jet aircraft is relatively fuel inefficient compared to neweraircraft. Accordingly, a significant increase in the price of jet fuel results in adisproportionately higher increase in the Company’s fuel expenses as compared with manyof its competitors who have, on average, newer and thus more fuel-efficient aircraft. TheCompany has not entered into any agreements that fix the price of jet fuel over any period oftime. Therefore, an increase in the cost of jet fuel will be immediately passed through to theCompany by suppliers. The Company has experienced reduced margins when the Companyhas been unable to increase fares to compensate for such higher fuel costs. Even at times
Financial Management • Spring 200682
when the Company is able to raise selected fares, the Company has experienced reducedmargins on sales prior to such fare increases.
From Airtran/ValueJet’s 1999 10K Report
The cost of jet fuel is an important expense for The Company. The Company estimates thata one-cent increase in fuel cost would increase the Company’s fuel expenses by approximately$57,000 per month, based on the Company’s current fuel consumption rate. Jet fuel costs aresubject to wide fluctuations as a result of sudden disruptions in supply, such as the effect ofthe invasion of Kuwait by Iraq in August 1990. Due to the effect of world and economic eventson the price and availability of oil, the future availability and cost of jet fuel cannot be predictedwith any degree of certainty. Increases in fuel prices or a shortage of supply could have amaterial adverse effect on the Company’s operations and operating results. The Company hasnot entered into any agreement which fixes the price or guarantees delivery of fuel over anyperiod of time. A significant increase in the price of jet fuel would result in a disproportionatelyhigher increase in the Company’s average total costs than its competitors using more fuelefficient aircraft and whose fuel costs represent a smaller portion of total costs.
Panel B. Example Disclosures From Airlines that Hedges Future Jet Fuel Purchases
From American Airlines’ 1999 10K Report
The impact of fuel price changes on the Company and its competitors is dependent uponvarious factors, including hedging strategies. Although American’s average cost per gallonof fuel in 1999 was flat in comparison to 1998, actual fuel prices began to increase in April1999 and continued significantly throughout 1999 and into 2000. However, American has afuel hedging program in which it enters into fuel swap and option contracts to protectagainst increases in jet fuel prices, which has had the effect of dampening American’s averagecost per gallon. To reduce the impact of potential continuing fuel price increases in 2000,American had hedged approximately 48 percent of its 2000 fuel requirements as of December31, 1999.
From United Airlines’ 1999 10K Report
Changes in fuel prices are industry-wide occurrences that benefit or harm United’scompetitors as well as United, although fuel-hedging activities may affect the degree towhich fuel-price changes affect individual companies…. The impact of rising fuel costs issomewhat tempered by United’s fuel hedging program. United pursues an options basedstrategy in which the upside is retained while the downside is eliminated. At the end of 1999,75% of United’s fuel exposure was hedged, but the goal is for fuel exposure in 2000 to be100% hedged by the end of the first quarter.
Panel C. Example Disclosures From Airlines using Fuel Pass-Through Agreements or Charter Arrangements
From Mesa Air Group’s 1999 10K Report
The Company has exposure to certain market risks associated with its aircraft fuel. Aviation

Carter, Rogers, & Simkins • Does Hedging Affect Firm Value? 83
fuel expense is a significant expense for any air carrier and even marginal changes greatlyimpact a carriers profitability. Standard industry contracts do not generally provide protectionagainst fuel price increases, nor do they insure availability of supply. However, both theUSAirways and America West fee for departure contracts allow fuel costs to be passeddirectly back to the codeshare partner, thereby reducing the overall exposure of Mesa to fuelprice fluctuations. In the fourth quarter of fiscal 1999, 62.2% of Mesa fuel requirements wereassociated with these contracts. A substantial increase in the price of jet fuel or the lack ofadequate fuel supplies in the future would have a material adverse effect on Mesa’s business,financial condition, and the results of operations and liquidity.
From Skywest, Inc.’s 1999 10K Report
The Company is exposed to fluctuations in the price and availability of aircraft fuel thataffect the Company’s earnings. Currently, the Company has limited its exposure to fuel priceincreases with respect to approximately 65 percent of available seat miles produced, due tocontractual arrangements with Delta and United. These major airlines reimburse the Companyfor the actual cost of fuel on contracted flights.
From World Airways’ 1995 10K Report
Fluctuations in the price of fuel has not had a significant impact on the Company’soperations in recent years. The Company’s exposure to fuel risk is limited because: 1) underthe terms of the Company’s basic contracts, the customer is responsible for providing fuel,2) under the terms of its full service contracts with the US Government, the Company isreimbursed for the cost of fuel it provides, and 3) under the Company’s charter contracts, theCompany is reimbursed for fuel price increases in excess of 5% of the price agreed upon inthe contract, subject to a 10% cap.

Financial Management • Spring 200684
References
Adam, T.R., 2002, “Do Firms Use Derivatives to Reduce their Dependence on External Capital Markets?”European Finance Review 6, 163-187.
Adam, T., S. Dasgupta, and S. Titman, 2004, “Financial Constraints, Competition, and Hedging in IndustryEquilibrium,” Hong Kong University of Science and Technology and University of Texas Working Paper.
Allayannis, G. and A. Mozumdar, 2000, “Cash Flow, Investment, and Hedging,” University of Virginia andVirginia Tech Working Paper.
Allayannis, G. and E. Ofek, 2001, “Exchange Rate Exposure, Hedging, and the Use of Foreign CurrencyDerivatives,” Journal of International Money and Finance 20, 273-296.
Allayannis, G. and J.P. Weston, 2001, “The Use of Foreign Currency Derivatives and Firm Market Value,”Review of Financial Studies 14, 243-276.
Bartov, E. and G.M. Bodnar, 1994, “Firm Valuation, Earnings Expectations, and the Exchange Rate ExposureEffect,” Journal of Finance 49, 1755-1785.
Berkman, H. and M.E. Bradbury, 1996, “Empirical Evidence on the Corporate Use of Derivatives,” FinancialManagement 25, 5-13.
Bessembinder, H., 1991, “Forward Contracts and Firm Value: Investment Incentive and Contracting Effects,”Journal of Financial and Quantitative Analysis 26, 519-532.
Bodnar, G.M. and M.H.F. Wong, 2003, “Estimating Exchange Rate Exposures: Issues in Model Structure,”Financial Management 32, 35-67.
Breeden, D. and S. Viswanathan, 1998, “Why Do Firms Hedge? An Asymmetric Information Model,” DukeUniversity Working Paper.
Brown, G.W., 2001, “Managing Foreign Exchange Risk with Derivatives,” Journal of Financial Economics60, 401-448.
Carter, D.A. and B.J. Simkins, 2004, “The Market’s Reaction to Unexpected, Catastrophic Events: TheCase of Airline Stock Returns and the September 11th Attacks,” Quarterly Review of Economics andFinance 44, 539-558.
Chung, K.H. and S.W. Pruitt, 1994, “A Simple Approximation of Tobin’s Q,” Financial Management 23,70-74.
DaDalt, P.J., J.R. Donaldson, and J.L. Garner, 2003, “Will any Q Do? Firm Characteristics and Divergencesin Estimates of Tobin’s Q,” Journal of Financial Research 26, 535-551.
DaDalt, P., G.D. Gay, and J. Nam, 2002, “Asymmetric Information and Corporate Derivatives Use,”Journal of Futures Markets 22, 241-267.
Damodaran, A., 2002, Investment Valuation: Tools and Techniques for Determining the Value of any Asset,2nd Ed., John Wiley & Sons, New York.
Deshmukh, S. and S.C. Vogt, 2005, “Investment, Cash Flow, and Corporate Hedging,” Journal of CorporateFinance 11, 628-644.
Dolde, W., 1995, “Hedging, Leverage, and Primitive Risk,” Journal of Financial Engineering 4, 187-216.
Fazzari, S.R., G. Hubbard, and B. Petersen, 1988, “Financing Constraints and Corporate Investment,”Brookings Papers on Economic Activity 1, 141-195.
Flannery, M. and C. James, 1984, “The Effect of Interest Rate Changes on the Common Stock Returns ofFinancial Institutions,” Journal of Finance 39, 1141-1153.
Froot, K., D. Scharfstein, and J. Stein, 1993, “Risk Management: Coordinating Investment and FinancingPolicies,” Journal of Finance 48, 1629-1658.

Carter, Rogers, & Simkins • Does Hedging Affect Firm Value? 85
Gay, G.D. and J. Nam, 1998, “The Underinvestment Problem and Corporate Derivatives Use,” FinancialManagement 27, 53-69.
Géczy, C., B.A. Minton, and C. Schrand, 1997, “Why Firms Use Currency Derivatives,” Journal of Finance52, 1323-1354.
Graham, J.R. and D.A. Rogers, 2002, “Do Firms Hedge in Response to Tax Incentives?” Journal of Finance57, 815-839.
Guay, W. and S.P. Kothari, 2003, “How Much Do Firms Hedge with Derivatives?” Journal of FinancialEconomics 70, 423-461.
Haushalter, G.D., 2000, “Financing Policy, Basis Risk, and Corporate Hedging: Evidence from Oil and GasProducers,” Journal of Finance 55, 107-152.
Jin, Y. and P. Jorion, 2004, “Firm Value and Hedging: Evidence from US Oil and Gas Producers,” Journal ofFinance (Forthcoming, April 2006).
Jorion, P., 1990, “The Exchange-Rate Exposure of US Multinationals,” Journal of Business 63, 331-346.
Kennedy, P., 1992, A Guide to Econometrics, 3rd Ed, Cambridge, MA, MIT Press.
Kim, E.H. and V. Singal, 1993, “Mergers and Market Power: Evidence from the Airline Industry,” AmericanEconomic Review 83, 549-569.
Leland, H.E., 1998, “Agency Costs, Risk Management, and Capital Structure,” Journal of Finance 53,1213-1243.
Mello, A.S. and J.E. Parsons, 2000, “Hedging and Liquidity,” Review of Financial Studies 13, 127-153.
Mello, A.S. and M.E. Ruckes, 2004, “The Role of Hedging in Product Market Rivalry,” University ofWisconsin Working Paper.
Mian, S.L., 1996, “Evidence on Corporate Hedging Policy,” Journal of Financial and Quantitative Analysis31, 419-439.
Myers, S.C. and N.S. Majluf, 1984, “Corporate Financing and Investment Decisions When Firms HaveInformation that Investors Do Not Have,” Journal of Financial Economics 13, 187-221.
Nance, D.R., C.W. Smith, Jr., and C.W. Smithson, 1993, “On the Determinants of Corporate Hedging,”Journal of Finance 48, 267-284.
Pantzalis, C., B.J. Simkins, and P. Laux, 2001, “Operational Hedges and the Foreign Exchange Exposure ofUS Multinational Corporations,” Journal of International Business Studies 32, 793-812.
Perfect, S.B. and K.W. Wiles, 1994, “Alternative Constructions of Tobin’s Q: An Empirical Comparison,”Journal of Empirical Finance 1, 313-341.
Petersen, M.A. and S.R. Thiagarajan, 2000, “Risk Measurement and Hedging: With and Without Derivatives,”Financial Management 29, 5-30.
Pulvino, T.C., 1998, “Do Asset Fire Sales Exist? An Empirical Investigation of Commercial AircraftTransactions,” Journal of Finance 53, 939-978.
Pulvino, T.C., 1999, “Effects of Bankruptcy Court Protection on Asset Sales,” Journal of Financial Economics52, 151-186.
Rogers, D.A., 2002, “Does Executive Portfolio Structure Affect Risk Management? CEO Risk-TakingIncentives and Corporate Derivatives Usage,” Journal of Banking and Finance 26, 271-295.
Schrand, C. and H. Unal, 1998, “Hedging and Coordinated Risk Management: Evidence from ThriftConversions,” Journal of Finance 53, 979-1013.
Smith, C.W., Jr. and R.M. Stulz, 1985, “The Determinants of Firms’ Hedging Policies,” Journal of Financialand Quantitative Analysis 20, 391-405.

Financial Management • Spring 200686
Stulz, R.M., 1996, “Rethinking Risk Management,” Journal of Applied Corporate Finance 9, 8-24.
Tufano, P., 1996, “Who Manages Risk? An Empirical Examination of Risk Management Practices in theGold Mining Industry,” Journal of Finance 51, 1097-1137.
Tufano, P., 1998, “Agency Costs of Corporate Risk Management,” Financial Management 27, 67-77.
Warren, S., 2005, “Hedge Hog Southwest Air Sharpens Its Teeth,” Wall Street Journal, May 19, C1.
Related Documents