DOES HEDGE ACCOUNTING REFLECT FIRMS‟ RISK MANAGEMENT ACTIVITIES? Elicia Parker Cowins A dissertation submitted to the faculty at the University of North Carolina at Chapel Hill in partial fulfillment of the requirements for the degree of Doctor of Philosophy in the Department of Accounting in the Kenan-Flagler School of Business. Chapel Hill 2014 Approved by: Jeffery S. Abarbanell Mary E. Barth Wayne R. Landsman Mark H. Lang Stephen Stubben

Welcome message from author
This document is posted to help you gain knowledge. Please leave a comment to let me know what you think about it! Share it to your friends and learn new things together.
Transcript

DOES HEDGE ACCOUNTING REFLECT FIRMS‟ RISK MANAGEMENT ACTIVITIES?
Elicia Parker Cowins
A dissertation submitted to the faculty at the University of North Carolina at Chapel Hill in partial fulfillment of the requirements for the degree of Doctor of Philosophy in the Department
of Accounting in the Kenan-Flagler School of Business.
Chapel Hill 2014
Approved by:
Jeffery S. Abarbanell
Mary E. Barth
Wayne R. Landsman
Mark H. Lang
Stephen Stubben

ii
© 2014 Elicia Parker Cowins
ALL RIGHTS RESERVED

iii
ABSTRACT
Elicia Parker Cowins: Does Hedge Accounting Reflect Firms‟ Risk Management Activities? (Under the direction of Wayne R. Landsman)
In this study, I examine the hedge accounting disclosures required under ASC Topic 815,
i.e., SFAS 133 (as amended), to investigate whether existing hedge accounting criteria reflect the
risk management activities of a set of non-financial firms. I begin by partitioning a sample of
firms into conventional hedgers and speculative hedgers based on a quantitative measure
designed to summarize the criteria that must be met for the fair value gains and losses from a
firm‟s derivative contracts to be recognized under the hedge accounting exception. This
quantitative measure is subsequently augmented to include qualitative factors in an effort to
further refine it. I then conduct a series of tests to evaluate whether the partitions exhibit
characteristics associated with risk management or speculation.
I find descriptive evidence that (1) speculative hedgers are riskier than conventional
hedgers; (2) there is no association between residual exposure to macroeconomic risk and total
firm risk for conventional hedgers; (3) there is a positive association between residual exposure
to commodities prices and total firm risk for speculative hedgers; (4) speculative hedgers
operate in more opaque information environments relative to those of conventional hedgers;
and, (5) speculative hedgers have more short-term shareholders. In the aggregate, these results
suggest hedge accounting criteria does reflect risk management activities.

iv
To my sister Anita. Your relentless pursuit of life on your own terms was, and still is, my greatest inspiration. I miss you everyday.

v
ACKNOWLEDGEMENTS
I appreciate the guidance and support I received from my dissertation committee
members, Jeffery Abarbanell, Mary Barth, Wayne Landsman, Mark Lang and Stephen Stubben.
I thank Linda Hughen for her helpful comments and access to the data used in her own
dissertation research. I gratefully acknowledge funding from the AICPA Foundation, the KPMG
Foundation and the Graduate School at the University of North Carolina at Chapel Hill.

vi
TABLE OF CONTENTS
LIST OF TABLES ......................................................................................................................... viii
LIST OF ABBREVIATIONS ............................................................................................................ ix
INTRODUCTION ............................................................................................................................. 1
INSTITUTIONAL DETAIL ............................................................................................................. 8
Hedge Accounting ............................................................................................................... 8
FASB/IASB Current Projects .............................................................................................. 9
PREDICTIONS .............................................................................................................................. 13
Risk Exposure .................................................................................................................... 13
Firm-Specific Risk Characteristics ........................................................................ 13
Macroeconomic Exposure and Total Firm Risk .................................................... 14
Information Environment and Shareholder Base ............................................................. 15
DATA, SAMPLE SELECTION AND RESEARCH DESIGN ........................................................... 16
Data and Sample Selection ................................................................................................ 16
Research Design ................................................................................................................. 17
Partitioning Variable.............................................................................................. 18
Risk Exposure Analyses ........................................................................................ 22
Information Environment and Shareholder Base Analysis .................................. 24
RESULTS ...................................................................................................................................... 26
Risk Exposure Results ...................................................................................................... 26
Firm Specific Risk Characteristics ........................................................................ 26

vii
Macroeconomic Exposure and Total Firm Risk .................................................... 27
Information Environment and Shareholder Base Results ............................................... 28
CONCLUSION .............................................................................................................................. 29
APPENDIX: VARIABLE DEFINITIONS ..................................................................................... 42
REFERENCES .............................................................................................................................. 44
viii
LIST OF TABLES
Table 1 - Firm Specific Risk Characteristics .................................................................................. 31
Table 2 - Descriptive Statistics and Correlations – Macroeconomic Exposure and Total Firm Risk Analysis ............................................................................................... 34
Table 3 – Macroeconomic Exposure and Total Firm Risk ........................................................... 36 Table 4 – Descriptive Statistics and Correlations – Information Environment and
Shareholder Base Analysis ........................................................................................... 38 Table 5 – Information Environment and Shareholder Base ........................................................ 40

ix
LIST OF ABBREVIATIONS
AH Accounting Hedger
ASC Accounting Standards Codification
CDS Credit Default Swap
CIO Chief Investment Office
ED Exposure Draft
EDGAR Electronic Data Gathering, Analysis and Retrieval
EH Economic Hedger
FASB Financial Accounting Standards Board
GAAP Generally Accepted Accounting Principles
IASB International Accounting Standards Board
IFRS International Financial Reporting Standards
OCI Other Comprehensive Income
SCP Synthetic Credit Portfolio
SEC Securities Exchange Commission
SFAS Statement of Financial Accounting Standards
SH Speculative Hedger

1
1. INTRODUCTION
On May 10, 2012, J.P. Morgan Chase announced that its London-based Chief Investment
Office (CIO) suffered trading losses of a little over $2 billion related to its positions in credit
derivatives. By July 13th, 2012, these losses had escalated to $5.8 billion and ultimately reached
$6.2 billion. On the after-hours conference call held to announce the initial loss, Jamie Dimon,
Chase‟s Chairman and CEO said:
Regarding what happened, the synthetic credit portfolio was a strategy to hedge the Firm’s overall credit exposure [emphasis added], which is our largest risk overall in its trust credit environment. 1 We‟re reducing that hedge. But in hindsight, the new strategy was flawed, complex, poorly reviewed, poorly executed and poorly monitored. The portfolio has proven to be riskier, more volatile and less effective an economic hedge than we thought.
Was J.P. Morgan‟s position in this particular case truly a strategy to hedge against its
exposure to credit risk or was it a speculative position?2 Is it even possible to make a clear
distinction between the two? In this study, I examine the disclosures required under ASC Topic
815 to investigate whether hedge accounting criteria provides information about a firm‟s risk
1 In prepared testimony read before the Senate Committee on Banking in the weeks following the loss disclosure, Dimon asserts more specifically that the CIO‟s losses on the hedge were the result of a modification to the firm‟s synthetic credit portfolio (SCP) made to reduce risk-weighted assets. The strategy essentially called for the addition of what traders believed would be offsetting positions, i.e., the CIO began selling CDSs to offset the risk exposure from the CDSs it had purchased. 2 Initial comments provided by Dimon and others representing the bank claimed that the losses were associated with a hedge position. However, considering (1) the SCP had previously been a profitable venture held by the CIO, a fact that could in and of itself suggest risk management was not the motivation; (2) the results of an investigation by the Senate Committee on Homeland Security and Governmental Affairs that found evidence of an increasing appetite for risk in the CIO, i.e., the implementation of a new Value-at-Risk model that facilitated the build-up of risky positions in the portfolio; and (3) recent Justice Department charges of conspiracy to hide losses in the portfolio that were levied on former JP Morgan traders, mounting evidence suggests the strategy was more indicative of a speculative position.

2
management practices.3 My particular interest is in determining whether the external financial
statement user can make the distinction between firms using derivatives to hedge risk and those
using them to speculate under current guidance or if there is evidence to suggest that the
standard is not useful for this purpose.
At an elementary level, a hedger should have (1) an exposure to a particular risk as a
result of its normal business operations, e.g., cash flow volatility, and (2) the desire to insure
against that risk. Conversely a speculator is the party who assumes the risk that the hedger
wishes to transfer (Johnson, 1960). Several issues complicate the application of these rather
rudimentary definitions of hedgers and speculators in practice. First, derivatives expose the
firm to different types of risk directly related to the contracts themselves.4 A successful risk
management program must consider how these incremental risks contribute to the overall risk
profile of the firm and manage them accordingly. Second, the manner in which a firm chooses
to hedge against its risk exposure can result in an overall increase in exposure to the very risk
the firm was attempting to reduce. 5 In other words, firms may ultimately be speculating, i.e.,
taking a view, under the guise of risk management. Survey evidence, e.g., Bodner, Hayt and
3 Although financial reporting outcomes that are reflective of a firm‟s risk management practices are not an explicit objective of hedge accounting under ASC Topic 815, language in the basis for conclusions suggests risk management and speculation should nonetheless yield different reporting outcomes under the existing standard. This issue will be discussed in greater detail in a subsequent section. 4 Unsettled derivative positions expose firms to different types of risks including counterparty credit risk and liquidity risk. Counterparty credit risk is associated with derivative contracts with a positive fair value and is the risk that the derivative counterparty will fail to meet its obligations under the contract. Exposure to this risk is greater when derivative contracts are traded over-the-counter as opposed to on organized exchanges. Liquidity risk exposure is associated with derivative contracts with a negative fair value and is the result of contract terms that require a firm to post increasing amounts of collateral as prices move in favor of the derivatives counterparty. 5 This can occur when a risk management strategy is only successful in hedging exposure under certain market conditions. One example of such a strategy is the “stack and roll” strategy implemented by Metallgesellschaft (MG) in the early 90‟s. MG was exposed to price risk as a result of entering into long-term forward contracts, with maturities of 5 to10 years, obligating the firm to deliver heating oil to its customers at a fixed price. The firm hedged against this risk by entering into short-term futures contracts that it closed out immediately before expiration, say monthly or quarterly, and replaced with a new set of short-term contracts. This strategy is effective as long as the forward price of the relevant commodity, oil in this case, is lower than the spot price. However, if the forward price exceeds the spot price, the short-term futures contracts are being rolled-over with losses. The interested reader is directed to Edwards and Canter (1995) for further detail on the topic.

3
Marston (1996), suggests that this does indeed occur. As a result, one can conclude that
expressed intent is not a sufficient condition for determining whether a firm‟s derivative
positions are in effect reducing or increasing exposure to risk.
In an effort to increase transparency regarding a firm‟s derivative use, the Financial
Accounting Standards Board (FASB) issued SFAS 133, Accounting for Derivative Instruments
and Hedging Activities, which requires recognition of all derivative contracts on the face of the
statement of financial position. The associated fair value gains and losses are reported as a
component of earnings unless the derivative instrument meets the criteria for hedge accounting
treatment. The hedge accounting exception mitigates the earnings volatility associated with fair
value recognition of derivative instruments by allowing firms to either (1) bypass the income
statement and recognize the gains and losses on derivatives designated as cash flow hedges in
comprehensive income until such time as the gain or loss associated with the hedged transaction
affects earnings or (2) recognize the hedged item in a fair value hedging relationship at fair value
thereby appropriately matching the fair value gains and losses on the derivative with the gains
and losses on the hedged item.
The criteria that must be met to obtain hedge accounting treatment have been
characterized as overly restrictive and overly burdensome resulting in reporting outcomes
inconsistent with the risk management activities of the firm (Comiskey and Mulford, 2008).
However, it is possible that the restrictive nature of the criteria for hedge accounting treatment
serves a purpose. Prior literature, e.g., Hodder, Hopkins and Wahlen (2006), has shown that
the incremental volatility associated with the recognition of fair value gains and losses from
derivative financial instruments provides risk-relevant information. By restricting hedge
accounting treatment to a small set of derivative activities that demonstrate the capacity to
reduce a firm‟s exposure to risk, it is possible the moderation of incremental earnings volatility
associated with derivatives reported under the hedge accounting exception serves to provide
information to the market about the relative risks of certain derivative positions. More

4
specifically, derivatives that do not substantially increase earnings volatility, e.g., those that
meet hedge accounting criteria, are potentially less risky than those that do. This is not to say
that the derivative activities that fail to meet the hedge accounting standard are absolutely
riskier or more speculative in nature, only that their effects on the exposure profile of the firm
are potentially more difficult to discern.
To investigate whether hedge accounting reflects firms‟ risk management activities, I
partition a set of quarterly observations for non-financial firms that employ derivatives in their
risk management programs into quintiles using a quantitative, accounting based measure
designed to summarize the criteria that must be met for the fair value gains and losses from a
firm‟s derivative contracts to be recognized under the hedge accounting exception.6 If these
criteria are in alignment with a firm‟s risk management activities, the observations that score
the highest should exhibit characteristics of conventional hedgers while the observations that
score the lowest should exhibit characteristics of speculative hedgers.7 8 If, however, these
criteria are out of alignment with a firm‟s risk management activities, characteristics of the firms
in each partition should be more ambiguous with either or both groups exhibiting the traits of
conventional and speculative hedging strategies.
6 I do not use financial services firms in this study primarily because of my concern regarding the feasibility of obtaining a sample of firms with sufficient cross-sectional variation in the proportion of derivatives designated as accounting hedges. Through casual observation of the 50 largest U.S. financial firms, I find that over half of them hold the vast majority of their derivatives in their trading book for market making as opposed to being held for use by the firm itself. These positions are not eligible for hedge accounting treatment, rendering the metric I propose to use as a partitioning mechanism meaningless in this setting. 7 Conventional hedgers are firms whose risk management objective is variance minimization, i.e., the equal attenuation of exposure to downside risk and upside potential. Speculative hedgers are firms whose risk management objective is focused on reducing downside risk while preserving as much of the upside as possible. The interested reader is directed to Stulz (1996) for more background on this notion of selective hedging techniques. 8 I use the terms conventional hedger and hedger as well as speculative hedger and speculator interchangeably throughout the paper. The more formal classifications, conventional and speculative hedgers, are more precise terms as I posit that speculation in this setting is occurring within firms‟ hedge portfolios.

5
Guidance regarding empirical proxies or tests that could be used to distinguish between
hedging and speculation is scarce. One archival study that attempts to make the distinction
between the two, Zhang (2009), does so by documenting a change in a firm‟s risk exposure after
the implementation of a derivatives risk management program. Firms that exhibit a decrease in
exposure to a particular risk are classified as hedgers or effective risk managers while those that
exhibit an increase in exposure to a particular risk are classified as speculators or ineffective risk
managers. My use of a sample of firms with established derivatives risk management programs
precludes the use of a change in risk exposures as a means to validate or invalidate the
accounting based measure employed to partition firms into their respective groups. Instead, I
conduct a series of tests motivated by theory and intuition to investigate whether the resulting
partitions exhibit characteristics associated with risk management or speculation as intended.
First, I examine the difference in risk profiles across partitions. If hedge accounting
reflects firms‟ risk management activities, I expect firms classified as conventional hedgers
based on my partitioning measure will on average exhibit a lower risk profile relative to those
classified as speculative hedgers. Using several proxies for risk, including accounting-based
measures, market-based measures, and measures of exposure to macroeconomic risks, i.e.,
exposure to interest rates, foreign exchange rates and commodities prices, I find that
conventional hedgers are on average less risky than speculative hedgers.
Next, I estimate the relation between firms‟ residual exposures to macroeconomic risk,
i.e., their exposures to interest rates, foreign exchanges and commodities prices after hedging,
and total firm risk via ordinary least squares regression. I predict the residual exposure to
macroeconomic risk will exhibit no relation to total firm risk for conventional hedgers because
these firms will have successfully hedged against those risks. Conversely, I predict the residual
exposure to macroeconomic risk will exhibit a positive association with total firm risk for
speculative hedgers because their objective is to preserve exposure to upside potential while
reducing or eliminating exposure to downside risk.

6
Consistent with predictions, I find that exposure to foreign exchange rates and
commodities prices are not associated with total firm risk for conventional hedgers. I also find a
marginally significant negative association between exposure to interest rates and total firm risk
for conventional hedgers, but this result is not robust to correction for serial correlation of the
residuals. With respect to speculative hedgers, I find a significantly positive association between
residual exposure to commodities prices and total firm risk consistent with predictions. I also
find no relation between exposure to interest rates and risk and a negative relation between
exposure to foreign exchange rates and risk for these firms. However, the negative relation
between exposure to foreign exchange rates and risk disappears as expected when the
partitioning measure is adjusted to correct for a misclassification of firms using foreign
exchange derivatives that will be detailed in a subsequent section.
Finally, I examine the relation between the classification of each firm-quarter
observation and the firm‟s information environment and shareholder base. Specifically, I obtain
multinomial logistic regression coefficient estimates for a set of hypothesized predictors where
the dependent variable, RANK, is a categorical variable from 1-5 decreasing in the proportion of
derivatives designated as accounting hedges. If hedge accounting criteria reflects risk
management, this ordering is also decreasing in the likelihood that the hedge portfolio
associated with the observation contains a relatively small speculative component. This test is
motivated by a theoretical result from Melumad, Weyns and Ziv (1999). Melumad et al. finds
that when a manager possesses superior information relative to current and potential
shareholders and when the firm‟s shareholder base is comprised of more short-term
shareholders, his hedge position is distorted, i.e., lower relative to the public information case. I
use an aggregate measure of firm-level transparency and a single proxy for the investment
7
horizon of a firm‟s shareholder base, share turnover, in my primary analysis.9 I find that the
information environment and shareholder base of a firm contribute to the probability of an
observation being classified as a speculative hedger in the predicted direction and interpret this
result as further evidence in support of using hedge accounting as a means to distinguish
hedging from speculation.
This study contributes to the literature that examines the risk-management practices of
non-financial firms. Although this literature is vast, particularly in the finance area, I believe I
have identified a yet unexplored area with respect to the identification of different risk
management behaviors via financial reporting outcomes. Further, while a few studies
investigate whether risk management or speculation is on average the primary objective of the
aggregate derivatives market, e.g., Hentschel and Kothari (2001) and Ciner (2006), this is the
first, to the best of my knowledge, to propose a means to distinguish firms using derivatives as
hedges from those using derivatives to speculate that could be applied to a broad set of
derivatives users.
This research could have policy implications and therefore may be of interest to standard
setters, given the FASB is considering relaxing the hedge accounting criteria under ASC Topic
815. The evidence contained herein is more consistent with the notion that the existing hedge
accounting rules and associated disclosures might be useful for distinguishing risk management
from speculation than the notion that they are overly restrictive and fail to reflect the risk
management activities of the firm. Therefore, caution should be employed in attempts to alter
hedge accounting criteria as the Board could inadvertently reduce the quality of information
supplied to the market regarding a firm‟s exposure to risk. Researchers could also find these
results of interest when addressing research questions predicated on an assumption that
derivatives users are using them to manage risk as opposed to using them to speculate.
9 The aggregate measure I use is very similar to the transparency measure employed by Lang, Lins and Maffett (2012) as it is the average decile rank of seven proxies for a firm‟s information environment, i.e., two earnings smoothness measures, analyst forecast error, analyst following, forecast dispersion, firm age and bid-ask spread.
8
The rest of the paper proceeds as follows. Section 2 provides institutional background
on the existing hedge accounting standard as well as the related exposure drafts currently under
consideration by the FASB and the IASB. Section 3 articulates predictions for the series of tests
that follow and Section 4 discusses the selection of the sample and the research design.
Empirical results are presented in Section 5 and Section 6 concludes.
2. INSTITUTIONAL DETAIL
2.1. Hedge Accounting
At present, financial reporting for derivative financial instruments is governed by SFAS
133, Accounting for Derivative Instruments and Hedging Activities, as amended (ASC Topic
815) which states that all derivative instruments should be recognized in the statement of
financial position at fair value. Accounting for changes in the fair value of derivatives, i.e., gains
and losses on derivative contracts, is contingent on whether that derivative has been designated
as a hedging instrument. Gains and losses on derivative instruments that fail to meet the
criteria for hedge accounting treatment, or for which the firm elects not to apply hedge
accounting are immediately recognized in earnings. Gains and losses on derivative instruments
that qualify for and are designated as hedging instruments are recognized in a manner such that
the gains and losses on the hedging instrument, the derivative, are recognized in the same
period as the gains and losses on the hedged item. Hedge accounting is an exception to the rule
regarding fair value recognition of derivatives and is permitted, in part, to address an artifact of
the mixed attribute accounting model.
Generally speaking, an entity may elect to designate a derivative instrument as either: (1)
a hedge of the exposure to changes in the fair value of a recognized asset or liability, or of an
unrecognized firm commitment, that are attributable to a particular risk (referred to as a fair
value hedge) or (2) a hedge of the exposure to variability in the cash flows of a recognized asset
or liability, or of a forecasted transaction, that is attributable to a particular risk (referred to as a
9
cash flow hedge).10 To qualify for fair value (cash flow) hedging designation, there must be
formal documentation of the hedging relationship as well as the firm‟s risk management
objective and strategy for undertaking the hedge.11 Further, the hedging relationship must be
expected to be “highly effective”, both at inception and on an ongoing basis.12 Gains and losses
on designated fair value hedging instruments are recognized in earnings as are the offsetting
gains and losses on hedged items. Gains and losses on designated cash flow hedging
instruments are subject to effectiveness testing with the effective portion recognized as a
component of other comprehensive income and reclassified to earnings in the same period(s)
during which the hedged transaction affects earnings. The remaining gains and losses on cash
flow hedging instruments, i.e. the ineffective portion, are recognized immediately in earnings.
2.2. FASB/IASB Current Projects
Hedge accounting is a current issue on both the IASB‟s and the FASB‟s respective
agendas. Although the projects were initiated prior to the financial crisis, demand for increased
transparency regarding an entity‟s exposure to derivative financial instruments has grown in its
wake. On May 26, 2010, the FASB issued an exposure draft proposing an update to the
accounting for derivative instruments and hedging activities. The main features of ASC Topic
815 regarding hedge accounting are retained by the exposure draft including: the types of items
and transactions that are eligible for hedge accounting and the types of risks eligible as hedged
risks. However, one substantive change relevant to this study is that the hedge effectiveness
criterion under the proposed update requires that the hedging relationship be reasonably
10 Derivative instruments used to hedge against foreign currency exposures are addressed separately in the standard, but generally fall into one of three categories: cash flow hedge, fair value hedge or net investment hedge. Net investment hedges are one of the few exceptions to the rule that non-derivative financial instruments cannot be designated as hedging instruments. 11 Additional documentation requirements include identification of the hedging instrument and hedged item, the nature of the risk being hedged and how the hedging instrument‟s effectiveness will be assessed. 12 A “highly effective” bright line is not explicit in the standard. However, in practice, a highly effective hedging instrument generally offsets no less than 80% and no more than 120-125% of the change in fair value or cash flow of a hedged item.

10
effective, as opposed to highly effective, in achieving offsetting changes in fair values or cash
flows attributable to the hedged risk during the period of the hedging relationship.13 In effect,
this would lower the bar for derivative contracts to qualify for and enjoy the benefits of hedge
accounting treatment.
The IASB released a separate exposure draft, ED/2010/13, on December 9, 2010 to
propose significant changes to existing IFRS hedge accounting requirements under IAS 39 to
provide more useful hedge accounting information. On February 9, 2011, the FASB issued a
discussion paper and an invitation to comment on the IASB Exposure Draft as the proposals
under the IASB ED could be characterized as further escalating the differences that currently
exist between U.S. GAAP and IFRS in the area of hedge accounting.14 15 A useful starting point
for a discussion on the merits of either proposal is a thorough examination of the financial
reporting outcomes of the current standards. My review of the academic literature has revealed
precious little empirical research on the topic. With this research, I hope to begin to fill this
void.
My review of SFAS 133 does not reveal a concise, explicit set of objectives for hedge
accounting. However, in the basis for conclusions of the standard, the FASB states, “Hedge
accounting for assets and liabilities initially arose as a means of compensating for situations in
which measurement anomalies between a hedged item and hedging instrument result in
recognizing offsetting gains and losses in earnings in different periods.” (SFAS 133, as amended,
13 The Board states that it amended the hedge effectiveness requirements in ASC Topic 815 in an effort to: (1) reduce the complexity associated with qualifying for hedge accounting; (2) make it easier for firms to consistently apply hedge accounting; and (3) provide comparability and consistency in financial statement results (BC218). 14 Existing differences between ASC Topic 815 and IAS 39 include, but are not limited to, the risk components that may be hedged as well as the way in which hedge effectiveness is assessed and measured. 15 The IASB Exposure Draft essentially broadens the scope of hedge accounting by: (1) expanding the type of instruments eligible to be designated as hedging instruments; (2) expanding the type of items that may be designated as hedged items; (3) amending the criteria to qualify for hedge accounting; and, (4) permitting the rebalancing of a hedging relationship to be accounted for as a continuation of an existing hedge rather than a discontinuation.
11
Paragraph 320) This suggests that hedge accounting is merely a tool used to provide resolution
for artifacts of the accounting system that result from the mixed attribute accounting model.
However, in addressing the criticism that the hedge accounting rules would not reflect the true
economics of certain types of hedging and risk management activities, the Board states “…some
aspects of „risk management‟ are hard to distinguish from speculation or „position taking‟ and
speculative activities should not be afforded special accounting.” (SFAS 133, as amended,
Paragraph 352) The assertion that speculative activities should yield different financial
reporting outcomes relative to hedging activities suggests another objective of hedge accounting
is to distinguish hedgers from speculators. Further, the disclosure amendment to SFAS 133,
SFAS 161, states that one of its objectives is “to provide users of financial statements with an
enhanced understanding of how and why an entity uses derivatives…” The purpose of this study
is to examine whether the standard, in its current form, is useful for determining which firms
are using derivatives as a means to reduce exposure (hedging) and which firms are either
unsuccessful in their attempt to reduce risk exposure (ineffective hedging) or deliberately using
derivatives as a means to increase exposure (speculation).
The hedge accounting rules under ASC Topic 815 could be considered a rather blunt
instrument for the purpose of distinguishing risk management from speculation. As of the end
of the comment period, the FASB received 71 comment letters in response to its discussion
paper and invitation to comment issued to solicit input on the IASB‟s exposure draft. One of the
common themes that emerged from an analysis of the comment letters is support for a more
principles-based approach to hedge accounting that would include aligning hedge accounting
more closely with risk management strategies.16 The criticism that the hedge accounting rules
16 The IASB exposure draft proposes an objective for hedge accounting that attempts to marry two extreme objectives, one that was deemed too broad and the other too narrow in focus. The Board‟s proposed objective is “to represent in the financial statements the effect of an entity‟s risk management activities that use financial instruments to manage exposures arising from particular risks that could affect profit or loss.”

12
under ASC Topic 815 do not reflect an entity‟s risk management activities is not a new one. In
fact, the FASB addresses this issue in the basis for conclusions of the original standard.
However, there is little agreement about just what the economics of hedging and risk management are. Because entities have different and often conflicting views of risk and risk management, a single approach to hedge accounting could not fully reflect the hedging and risk management strategies of all entities…Thus providing hedge accounting to the whole range of activities undertaken by some under the broad heading of risk management would be inconsistent with improving the usefulness and understandability of financial reporting. (SFAS 133, as amended, Paragraph 352)
In addition to the fundamental issue associated with developing a set of standards
capable of distinguishing risk management from speculation for a broad set of firms, there are at
least two further empirical challenges related to using hedge accounting in an effort to
differentiate risk management from speculation. First, hedge accounting is not mandatory.
Therefore, it is entirely possible that firms using derivatives to manage risk choose not to
designate their derivative instruments as accounting hedges and allow the effect of the
mismatch between the fair value gains and losses from derivative hedging instruments and the
gains and losses from hedged transactions to remain in their results from operations. This could
occur because meeting the requirements for hedge accounting treatment and continually
assessing the effectiveness of hedging relationships is not a costless activity. Thus, if the
perceived benefits of risk management exceed the costs of the incremental earnings volatility
that may result from not using hedge accounting, it is reasonable to expect firms could elect to
not designate some or all of their derivatives as accounting hedges.
Second, SFAS 159 The Fair Value Option for Financial Assets and Financial Liabilities
allows firms to opt to measure certain financial instruments at fair value. Thus, firms can, under
certain circumstances, achieve the same reporting outcomes for undesignated hedging
relationships as they can under the hedge accounting exception. In the extreme case that all of a
firm‟s hedged items meet the criteria established under SFAS 159 and are measured at fair
value, hedge accounting is unnecessary. As will be discussed in the research design section
below, I attempt to address these challenges by augmenting my partitioning measure to include
13
both quantitative and qualitative characteristics of firms in my sample. More specifically, I
incorporate qualitative data with respect to those firm-quarter observations with a high
proportion of undesignated derivatives, as it is these observations for which the alternative
explanations are particularly relevant.
3. PREDICTIONS
To investigate whether the partitioning metrics developed on the basis of the reporting
outcomes and disclosures provided under the existing hedge accounting standard yield
partitions that exhibit characteristics associated with risk management or speculation, I conduct
a series of tests motivated by both theory and intuition.17 I employ the use of three sets of tests
in an attempt to validate a partitioning mechanism developed based on the criteria that must be
met under the existing hedge accounting standard. The objective is to find consistent evidence
for or against the use of the measure as a means to distinguish hedging from speculation across
the analyses. Consistent evidence in support of its use would suggest that the hedge accounting
criteria do reflect the risk management activities of the firm while evidence against would
suggest that it does not.
3.1. Risk Exposure
3.1.1. Firm-Specific Risk Characteristics
If hedge accounting reflects firms‟ risk management activities, I expect that firms
classified as conventional hedgers will on average appear to be less risky than firms classified as
speculative hedgers. However, it is entirely possible that by partitioning on the proportion of
derivatives designated as accounting hedges, I am distinguishing accounting hedgers from
17 All tests that follow as described in the research design section are in fact joint tests of my predictions and my ability to classify firms as conventional hedgers and speculative hedgers. It is my view that potential misclassification bias, in this case, works against me. Misclassification is the result of either (1) derivative contracts that meet hedge accounting criteria but represent speculative activity or (2) derivative contracts that fail hedge accounting criteria but represent risk management activity. Either case would result in a bias against predictions.

14
economic hedgers as opposed to conventional hedgers from speculative hedgers. 18 If this is the
case, the relative risk characteristics of the two partitions will vary as a function of the risk proxy
examined. In order to allow for this possibility, I use two accounting-based risk measures
(earnings and cash flow volatility), three market-based risk measures (beta, idiosyncratic
volatility and equity volatility) and three macroeconomic risk measures (exposure to interest
rates, foreign exchange rates and commodities prices). If my partitioning measure is capturing
the differences between accounting hedgers and economic hedgers, I expect firms with a high
proportion of derivatives designated as accounting hedges will exhibit smaller earnings and cash
flow volatilities but greater equity and idiosyncratic volatilities as well as market betas and
exposure to macroeconomic risk relative to firms with a lower proportion of derivatives
designated as accounting hedges.
3.1.2. Macroeconomic Exposure and Total Firm Risk
Without exception, the primary purpose of holding derivative contracts for sample firms
is to hedge against exposure to one or more macroeconomic risks. Because my sample is
comprised of firms that actively use derivatives as part of their risk management programs, I
cannot observe their risk exposures prior to their hedge position and therefore cannot use a
change in exposure to validate my partitioning measure. However, I can make predictions about
whether and how firms‟ residual exposures to macroeconomic risk should be related to total
firm risk and how those associations should vary across partitions. If a firm has effectively
hedged its exposure to a particular macroeconomic risk, then total firm-wide risk should not
vary with residual exposure to that same macroeconomic risk, i.e., that risk should not
18 The divergent outcomes that result from a focus on accounting earnings versus a focus on economic earnings in this context were examined in Hughen (2010) with a study of the behavior of a sample of firms that had previously been subject to a restatement as a result of the misapplication of the hedge accounting standard. Hughen classifies firms as accounting hedgers (AH) and economic hedgers (EH) based on whether the firm chooses to take the steps necessary to ensure its hedging derivatives qualify for hedge accounting treatment (AH) or to continue with the economic hedge regardless of its effects on earnings volatility (EH) in order to investigate the conditions under which a firm would focus on accounting earnings over economic earnings. She finds that firms that were able to meet earnings targets in the period before the restatement are more likely to focus on accounting earnings.

15
contribute to the overall risk profile of the firm. Conversely, if the firm has been ineffective in
hedging macroeconomic risk, then total firm-wide risk should be increasing in the residual
exposure to that same macroeconomic risk. Thus, if hedge accounting reflects firms‟ risk
management activities, the residual macroeconomic risk exposures of firms classified as
conventional hedgers should exhibit no association with total risk while those of firms classified
as speculative hedgers should exhibit a positive association with total risk.
3.2. Information Environment and Shareholder Base
Melumad, Weyns and Ziv (1999) examines, in an analytical framework, the effects of
alternative approaches to hedge accounting on managerial hedging decisions and shareholder
wealth. Melumad et al. begins by deriving the optimal hedge position based on a full
information environment and subsequently investigates how the manger‟s hedge decision
differs from the optimal in an environment where the manager has superior information relative
to current and potential shareholders. Melumad et al. finds that when the manager possesses
superior information relative to current and potential shareholders, and shareholders must infer
the valuation relevant information, quantity exposure and the hedge decision, from the financial
reports, the manager‟s hedge decision is contingent on the reporting environment. In a hedge
accounting regime similar to the one that exists under ASC Topic 815, the manager‟s hedge
decision is distorted relative to the public information case. Specifically, the speculative portion
of the hedge position is increasing in the uncertainty about the firm‟s exposure as well as the
proportion of short-term shareholders.
The intuition behind this result is that because the firm‟s risk exposure is unobservable
to the market, new investors are exposed to greater (information) risk which in turn reduces
their willingness to invest in the firm. Consequently, for a given hedge position, share price is
lower purely as a result of a difference in the information environment as opposed to the risk
characteristics of the firm. In other words, the capital market benefits of hedging are reduced;
thus, the manager responds by reducing his hedge position, i.e., the costs of hedging, in an effort

16
to reduce the negative effect of hedging on firm value.19 20 Thus, if hedge accounting reflects risk
management, I predict that the probability the firm will have a high proportion of speculative
derivatives, i.e., undesignated derivative contracts, is increasing in the opacity of a firm‟s
information environment and decreasing in the investment horizon of the firm‟s shareholders.
4. DATA, SAMPLE SELECTION AND RESEARCH DESIGN
4.1. Data and sample selection
The data used for this study come from three sources. The first is a unique set of
manually collected quarterly footnote data related to a firm‟s derivative gains and losses for the
first fiscal quarter of 2009 through the last calendar quarter of 2012.21 22 SFAS 161 requires
enhanced disclosures about an entity‟s derivative and hedging activities including: (1) gross fair
value amounts segregated between derivatives that are designated as hedging instruments and
those that are not, with subcategories by type of contract, i.e., interest rate, foreign exchange,
commodity, etc.; (2) the location and amount of the derivative gains and losses reported in the
19 Assuming markets are imperfect, the primary capital market benefit of risk management is the reduction in capital costs achieved via management‟s efforts to avoid the adverse affects of financial distress on shareholder value. In other words, by reducing the volatility of cash flows, management can preserve shareholder value by minimizing the costs of financial distress, i.e., bankruptcy costs or opportunity costs associated with declined positive NPV projects. In return, shareholders will require a lower rate of return (Fatemi and Luft, 2002). The costs of risk management include the direct costs associated with initiating the hedge itself as well as indirect costs associated with administration of the hedge (Fatemi and Luft, 2002). The extent to which management engages in risk management activity is contingent on the relation between these and other costs and benefits. 20 The focus of this study is risk management via the use of derivative contracts. It is entirely possible, however, that firms use other, possibly less costly, means to minimize the adverse affects of their risk exposure. The extent to which alternative risk management tools are employed by the firms in my sample is unclear. However, because the sample is limited to firms that manage at least a portion of their risk with derivatives and because the relation being tested is that between the type of derivative held by a firm and its information environment as opposed to the relation between a firm‟s residual risk, after risk management, and its information environment, I expect cross-sectional variation in the use of such techniques will have a minimal affect on the inferences drawn from the results. 21 Footnote data are acquired from 10-Q and 10-K reports submitted to the SEC and available via the Commission‟s electronic data gathering, analysis and retrieval system, EDGAR. 22 The standard requiring expanded disclosures for derivative instruments and hedging activities, SFAS 161, is effective for fiscal years and interim periods beginning after November 15, 2008. Although early application was encouraged, the firms in my sample implemented expanded disclosures beginning in the first fiscal quarter of 2009. In order to preserve the maximum number of observations, I do not omit firms whose fiscal year is not a calendar year. As a result, I have an unbalance panel with observations per firm ranging from 13 to 16.
17
statement of financial performance or statement of financial position presented separately for
hedging instruments and hedged items in a fair value hedge; (3) the effective portion of gains
and losses on derivative instruments designated as cash flow and net investment hedges
recognized in OCI during the current period; (4) the effective portion of gains and losses
reclassified into earnings during the current period; (5) the amount of hedge ineffectiveness as
well as the amount excluded from the assessment of hedge effectiveness; and, (6) the gains and
losses on derivative instruments not designated as hedging instruments. These quantitative
disclosures are required for every annual and interim reporting period for which the statements
of financial position and performance are presented and must be presented in tabular format.
To be included in the sample, a firm must have had a non-zero balance on the statement of
financial position for derivative assets or liabilities for all four fiscal years 2009 – 2012. I
acquire all other accounting data from Compustat and monthly and quarterly firm and market
returns from the Center for Research in Security Prices (CRSP).
4.2. Research Design
I posit that whether a firm is hedging or speculating with respect to its derivative
positions is difficult to determine, at times even for the firm itself. Therefore, as an external user
of financial information, management‟s assertions as to the nature of the firm‟s derivative use
are insufficient to determine whether those positions are actually increasing or decreasing risk
exposure. The objective of this research is to evaluate whether hedge accounting and associated
disclosures can be used as a tool to distinguish derivative activity that is more consistent with
hedging risk from derivative activity that is more consistent with speculation. In that spirit, I
begin by identifying a sample of firms self-identified as those who use derivatives for risk
management purposes based on their footnote disclosures.
The initial sample was obtained by generating a list of non-financial firms from
Compustat sorted from largest to smallest based on total assets reported as of the 4th calendar
quarter of 2009. I then examined the footnote disclosures related to hedge accounting for all

18
quarterly periods from the first fiscal quarter of 2009 through the fourth calendar quarter of
2012 to determine whether the firm held derivatives for risk management purposes and to
retrieve the relevant quantitative disclosure data. The manually collected data include amounts
for the first 270 unique firms that had non-zero quarterly balances for derivative
assets/liabilities on the statement of financial position, approximately 4,300 firm-quarter
observations. The analyses that follow, however, are based on fewer observations as a result of
the data requirements for the remaining variables and, in some cases, the omission of the
middle quintile of firms ranked based on the partitioning metric.
4.2.1. Partitioning Variable
The baseline partitioning metric I employ in this study is the ratio of derivative assets
and liabilities designated as hedges to derivative assets and liabilities not designated as hedges.
If hedge accounting criteria is a useful tool for distinguishing hedgers from speculators, firms
with a greater proportion of derivatives designated as hedges should be engaged in derivative
activities that are more consistent with risk management relative to the derivative activities of
those with a greater proportion of undesignated hedges. I do not consider the firm‟s net
position in derivatives, i.e. the difference between its asset and liability positions, as I am
attempting to capture a summary measure of the firm‟s derivative activity as a whole. For this
metric, firms in the 1st quintile are those whose entire derivatives portfolio meets the criteria for
hedge accounting while firms in the 5th quintile are either those whose entire derivatives
portfolio fails to meet the criteria for hedge accounting or those who elect not to account for
some or all of their derivatives as accounting hedges.
Because hedge accounting is not required, it is entirely possible that a firm has elected
not to designate its derivatives as accounting hedges for one reason or another. This represents
a considerable research design issue because my objective is to investigate whether the criteria
that must be met in order to obtain hedge accounting treatment is effective at distinguishing risk
management activities from speculative activities. If firms with a higher proportion of

19
derivatives not designated as accounting hedges are bypassing the criteria altogether by
choosing not to use hedge accounting, the inferences that could be drawn from the results of my
tests are questionable. In an attempt to address this issue, I augment my baseline partitioning
measure to include qualitative information. This qualitative information either captures likely
reasons the relative costs and benefits of implementing hedge accounting could result in a
decision by management to forgo the hedge accounting exception or it serves to provide some
intuitive refinement to the baseline quantitative partitioning measure. 23
The first piece of qualitative information I incorporate into the baseline measure is the
decision to use the fair value option. SFAS 159, The Fair Value Option for Financial Assets and
Liabilities, allows firms to measure eligible items at fair value thus eliminating the accounting
mismatch between hedging instruments and certain hedged items, and the associated earnings
volatility, without applying complex hedge accounting provisions. In the limit, a firm that is
able to exercise the fair value option for all of its hedged items would not need to designate any
derivatives as accounting hedges in order to obtain similar financial reporting outcomes as those
achieved under the hedge accounting exception. Using the baseline partitioning measure, such
a firm would be classified as a speculative hedger observation when the opposite may be true.
Under SFAS 159, firms that exercise the fair value option are required to provide information to
facilitate the comparison between firms that choose alternative measurement attributes for
similar assets and liabilities.24 For the purposes of this study, the only information I capture and
use regarding the fair value option is whether the firm has made the election at any point during
the sample period and I eliminate firm-quarter observations from the speculative hedger group,
i.e., those in quintiles 4 and 5, that have done so.
23 In my tests, I consider the inclusion of each of these qualitative refinements individually because including them in a more comprehensive manner would result in a prohibitively small sample of speculative hedger observations for comparison. 24 Disclosure requirements under SFAS 159 include management‟s reasons for electing the fair value option, the difference between aggregate fair value and aggregate unpaid principal balance of loans, receivables and payables for which the fair value option was elected as well as methods and assumptions used to estimate fair values.
20
Next, I consider cross-sectional variation in the reporting of comprehensive income.
Prior literature (Hirst & Hopkins, 1998; Maines and McDaniel, 2000) suggests that the manner
in which comprehensive income is presented, i.e., in a performance statement or as a
component of shareholders‟ equity, affects how the capital markets interpret the information
provided. Maines and McDaniel (2000) finds that a group of nonprofessional investors assign
more weight to the volatility of comprehensive income components when they are reported in a
performance statement, such as a statement of comprehensive income. This becomes important
when one considers how hedge accounting, with respect to cash flow hedges, reduces earnings
volatility. By recognizing the fair value gains and losses on cash flow hedging instruments in
comprehensive income until the hedged transaction affects earnings, the fair value volatility is
essentially shifted from regular income to comprehensive income. If the results of Maines and
McDaniel (2000) hold more generally, the benefits of cash flow hedge accounting for firms that
report comprehensive income in a performance statement are reduced. This could explain why
some firms opt not to use hedge accounting and provides an alternative explanation for why a
firm has a higher proportion of undesignated derivative contracts. To address this issue, I
eliminate firm-quarter observations from the speculative hedger group, i.e., quintiles 4 and 5,
when the firm reports comprehensive income in a performance statement.25
Next I consider whether a firm‟s derivative contracts fail to meet the hedge accounting
criteria or whether the firm elects not to use the hedge accounting provisions. Including only
those observations where derivatives are not designated as accounting hedges because they fail
the criteria should result in a refinement of my baseline partitioning measure because it is more
consistent with the focus of this study, which is to examine the criteria under the existing hedge
accounting standard and its usefulness for distinguishing risk management from speculation. I
have attempted to glean this information from the footnotes and eliminate from the speculative
25 This variation ceases to be an issue for fiscal years and interim periods beginning after December 15, 2011, the effective date of ASU 2011-05, Presentation of Comprehensive Income. This amendment to the standards essentially requires all firms to report comprehensive income in a performance statement as opposed to a component of shareholder‟s equity.

21
hedger group, i.e., quintiles 4 and 5, firm-quarter observations where the firm explicitly states
they elected not to use hedge accounting for any reason. Although this should be the most ideal
refinement, the manner in which this information is disclosed makes it difficult to obtain a clear
separation. Specifically, many firms state that they have undesignated derivatives that fail the
criteria as well as those for which they have elected not to apply hedge accounting without
providing information on the relative proportion of each. Therefore, I eliminate all firm-quarter
observations from the speculative hedger group where the firm has stated that it elects not to
apply hedge accounting to any degree.
The next piece of qualitative information I consider is the use of speculative or trading
derivatives. A relatively small number of firms admit to using some of their derivative contracts
for other than risk management purposes. An intuitive refinement of my baseline partitioning
measure is to eliminate those firms that explicitly state that their derivatives are held solely for
risk-management purposes. However, there are at least two potential issues with this particular
refinement. First, it results in a relatively small speculative hedger sample for comparison
purposes. Considering a minimum of 13 observations per firm, in some instances the resulting
sample is only comprised of 4 or 5 unique firms. Second, it is entirely possible that a firm
employs the use of selective hedging techniques that may technically fall under the category of
risk management but practically look more like speculation (Stulz, 1996). This refinement
would eliminate such firms from consideration. Nonetheless, I eliminate from the speculative
hedger group, i.e., quintiles 4 and 5, firms that state in their disclosure that derivatives are only
held for hedging purposes.
Next, I consider those firms that use foreign exchange derivatives to hedge against
remeasurement gains and losses on recognized assets and liabilities denominated in a foreign
currency. Foreign currency denominated assets and liabilities are remeasured at the end of each
reporting period based on the currency rate at that point in time. Therefore the fair value
change on the hedging instrument will be offset by the remeasurement gain or loss reported in

22
the same period eliminating the need for hedge accounting designation. This provides an
alternative explanation for a higher proportion of undesignated derivative contracts. Thus, I
eliminate all firm-quarter observations from the speculative hedger group where the firm
explicitly states they are using foreign exchange derivatives for this purpose.
Finally, I consider the cost of restatement. It is possible that firms elect to forgo the
provisions under the hedge accounting standard because of the related complexity and potential
for restatement (Comiskey and Mulford, 2008). As opposed to trying to estimate the risk of or
absolute costs associated with a restatement, I consider the relative cost of a restatement and
assume that if a firm has experienced a restatement in a prior period, that firm would be less
likely to use hedge accounting. This provides an alternative explanation for a higher proportion
of undesignated contracts. Therefore, I eliminate all firm-quarter observations from the
speculative hedger group where the firm has had a restatement for any reason.
4.2.2. Risk Exposure Analyses
The first test I employ is a univariate test of means to investigate (1) whether the firm-
specific risk characteristics between the conventional and speculative hedger partitions differ
and (2) whether the augmented partitioning measures result in a greater distinction between
conventional and speculative hedger observations relative to the baseline partitioning measure.
In this test, I use accounting-based risk measures (earnings and cash flow volatilities,
EARN_VOL and CFO_VOL), market-based risk measures (beta, BETA, idiosyncratic volatility,
FIRMRSK, and equity volatility, VOLE) and macroeconomic risk measures (exposure to interest
rates, foreign exchange rates and commodities prices, IREXP, FXEXP and COMMEXP) to allow
for the possibility that my partitioning measure is capturing the distinction between accounting
hedgers and economic hedgers. Lower estimates across all eight risk proxies for conventional
hedger firms vis-à-vis speculative hedger firms would provide evidence consistent with my
predictions and the notion that the partitioning measure is capturing differences between risk
management and speculation. Conversely, lower (higher) estimates for accounting-based

23
(market-based and macroeconomic) risk measures for firms with a high proportion of
derivatives designated as accounting hedges would provide evidence consistent with the notion
that the partitioning measure is capturing differences between accounting hedgers and
economic hedgers.
Next, I use multivariate analysis to investigate whether the relation between total firm
risk and the residual exposure to macroeconomic risk varies across partitions in a predictable
manner. To test my predictions, I estimate the following equation via ordinary least squares:
(1) VOLEi,t = θ0 + θ 1EXPOSUREi,t + Σθ 2-kCONTROLSi,t + ε.
VOLE is a measure of total firm risk. EXPOSURE is a firm-specific variable intended to capture
a firm‟s exposure to interest rates, foreign exchange rates or commodities prices. The set of
control variables included in the regressions are those that have been shown in prior literature
to vary with equity volatility and include leverage, LEV, book-to-market ratio, BTM, return on
equity volatility, ROE_VOL, firm age, AGE, sales growth volatility, SGR_VOL, institutional
investors, INST, and inverse price, INVPRC.
To investigate how the relation between residual exposure to macroeconomic risk and
total firm risk differs across partitions, I estimate equation (1) separately for SH = 1 and 0. With
respect to this analysis, SH is an indicator variable equal to 1 for firms with 50% or more of their
firm-quarter observations in the 4th or 5th quintile of observations ranked by the ratio of
derivative assets and liabilities designated as accounting hedges. In effect, the firms themselves
are classified as conventional hedgers or speculative hedgers as opposed to the individual firm-
quarter observations as is the case for the univariate test above and the information
environment analysis below. This modification to the classification scheme is necessary because
the macroeconomic risk exposure estimates employed in the analysis require a longer time-
series of data to estimate.
The sample used to estimate equation (1) varies with the macroeconomic variable used
as EXPOSURE. Specifically, I restrict the sample to only those firms that have a nonzero

24
balance in derivative contracts related to the macroeconomic variable, i.e., when EXPOSURE is
a proxy for exposure to interest rates, the sample is restricted to those firms that have interest
rate derivative contracts. A zero coefficient estimate on EXPOSURE, θ1 = 0, for conventional
hedgers and a positive coefficient estimate on EXPOSURE, θ1 > 0, for speculative hedgers would
provide evidence consistent with predictions and suggest that hedge accounting is useful for
distinguishing risk management from speculation.
4.2.3. Information Environment and Shareholder Base Analysis
To test my predictions regarding the likelihood a firm would have a higher proportion of
speculative derivatives given the degree of opacity in its information environment and the
average investment horizon of its shareholder base, I estimate the following via multinomial
logistic regression:
(2) RANK = Ψ0 + Ψ1TRANSi,t + Ψ2TURNOVERi,t + Ψ3SIZEi,t + Ψ4LEVERAGEi,t +
Ψ5INTCOVi,t + Ψ6MTBi,t + ε.
RANK is a categorical variable that takes on a value from 1 to 5 based on the ratio of derivatives
designated as accounting hedges to derivatives not designated as hedges. TRANS is an
aggregate measure of a firm‟s information environment calculated as the average decile rank of
two earnings smoothness measures, analyst forecast error, analyst following, dispersion in
analyst forecasts, firm age and bid-ask spread . A positive multinomial logistic coefficient
estimate on TRANS, Ψ1 > 0, would provide evidence consistent with the prediction that the
probability a firm will have a low proportion of speculative derivatives is increasing in
transparency. Following Ang and Cheng (2006), I use TURNOVER as the proxy for the
investment horizon of a firm‟s shareholder base. A negative multinomial logistic coefficient
estimate on TURNOVER, Ψ2 < 0, would provide evidence consistent with the prediction that the
probability a firm will have a low proportion of speculative derivatives is decreasing in the
frequency of share turnover, i.e., increasing in the average investment horizon of the firm‟s
shareholders.
25
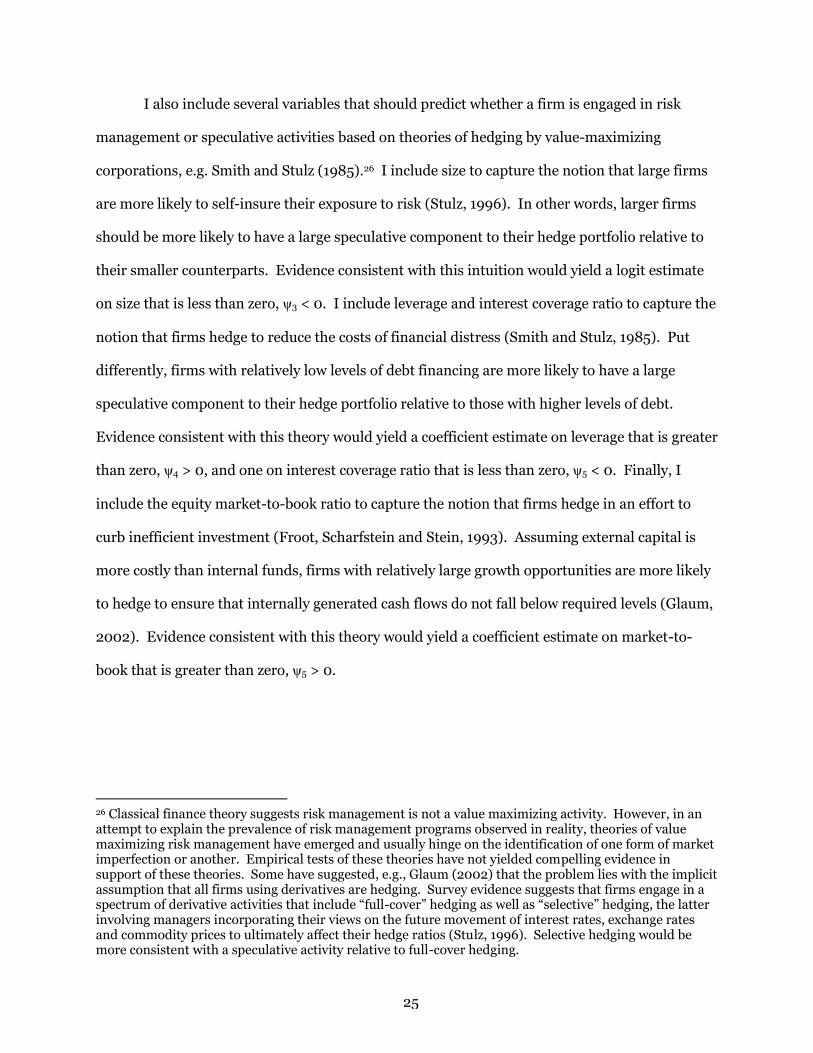
I also include several variables that should predict whether a firm is engaged in risk
management or speculative activities based on theories of hedging by value-maximizing
corporations, e.g. Smith and Stulz (1985).26 I include size to capture the notion that large firms
are more likely to self-insure their exposure to risk (Stulz, 1996). In other words, larger firms
should be more likely to have a large speculative component to their hedge portfolio relative to
their smaller counterparts. Evidence consistent with this intuition would yield a logit estimate
on size that is less than zero, ψ3 < 0. I include leverage and interest coverage ratio to capture the
notion that firms hedge to reduce the costs of financial distress (Smith and Stulz, 1985). Put
differently, firms with relatively low levels of debt financing are more likely to have a large
speculative component to their hedge portfolio relative to those with higher levels of debt.
Evidence consistent with this theory would yield a coefficient estimate on leverage that is greater
than zero, ψ4 > 0, and one on interest coverage ratio that is less than zero, ψ5 < 0. Finally, I
include the equity market-to-book ratio to capture the notion that firms hedge in an effort to
curb inefficient investment (Froot, Scharfstein and Stein, 1993). Assuming external capital is
more costly than internal funds, firms with relatively large growth opportunities are more likely
to hedge to ensure that internally generated cash flows do not fall below required levels (Glaum,
2002). Evidence consistent with this theory would yield a coefficient estimate on market-to-
book that is greater than zero, ψ5 > 0.
26 Classical finance theory suggests risk management is not a value maximizing activity. However, in an attempt to explain the prevalence of risk management programs observed in reality, theories of value maximizing risk management have emerged and usually hinge on the identification of one form of market imperfection or another. Empirical tests of these theories have not yielded compelling evidence in support of these theories. Some have suggested, e.g., Glaum (2002) that the problem lies with the implicit assumption that all firms using derivatives are hedging. Survey evidence suggests that firms engage in a spectrum of derivative activities that include “full-cover” hedging as well as “selective” hedging, the latter involving managers incorporating their views on the future movement of interest rates, exchange rates and commodity prices to ultimately affect their hedge ratios (Stulz, 1996). Selective hedging would be more consistent with a speculative activity relative to full-cover hedging.

26
5. RESULTS
5.1. Risk Exposure Results
5.1.1. Firm-Specific Risk Characteristics
Table 1 presents the risk characteristics of firms across partitions before and after the
inclusion of qualitative information. For all seven sets of results, the SH = 0 group consists of
the firm-quarter observations where the ratio of derivatives designated as accounting hedges to
derivatives not designated as accounting hedges is high. For the baseline results, the SH = 1
group consists of the firm-quarter observations where the ratio of derivatives designated as
accounting hedges to derivatives not designated as accounting hedges is low. For the remaining
six sets of results, the SH = 1 group consists of the firm-quarter observations where the ratio of
derivatives designated as accounting hedges to derivatives not designated is low and alternative
types of firms are systematically excluded as described above.
Consistent with my predictions, conventional hedgers are on average less risky than
speculative hedgers and in most cases the difference is statistically significant at conventional
levels. The one exception in tests using the baseline measure is the exposure to commodities
price risk which is slightly greater for conventional hedgers. Further, the augmentation of the
baseline quantitative partitioning measure is best improved either by excluding those firms that
use foreign currency derivatives to hedge against remeasurment gains and losses on recognized
assets and liabilities denominated in a foreign currency or by excluding those firms that report
comprehensive income in a performance statement. This conclusion is based on two factors.
First, the risk profile across all eight risk metrics is lower for the SH = 0 group relative to the SH
= 1 group under these two alternative scenarios. Second, the difference between partitions
across all eight risk metrics is significant at the 1% level under these two scenarios. The baseline
partitioning measure is also marginally improved by excluding those firms that exercised the
fair value option. The remaining proposed augmentations result in a more ambiguous split
between the two groups.
27
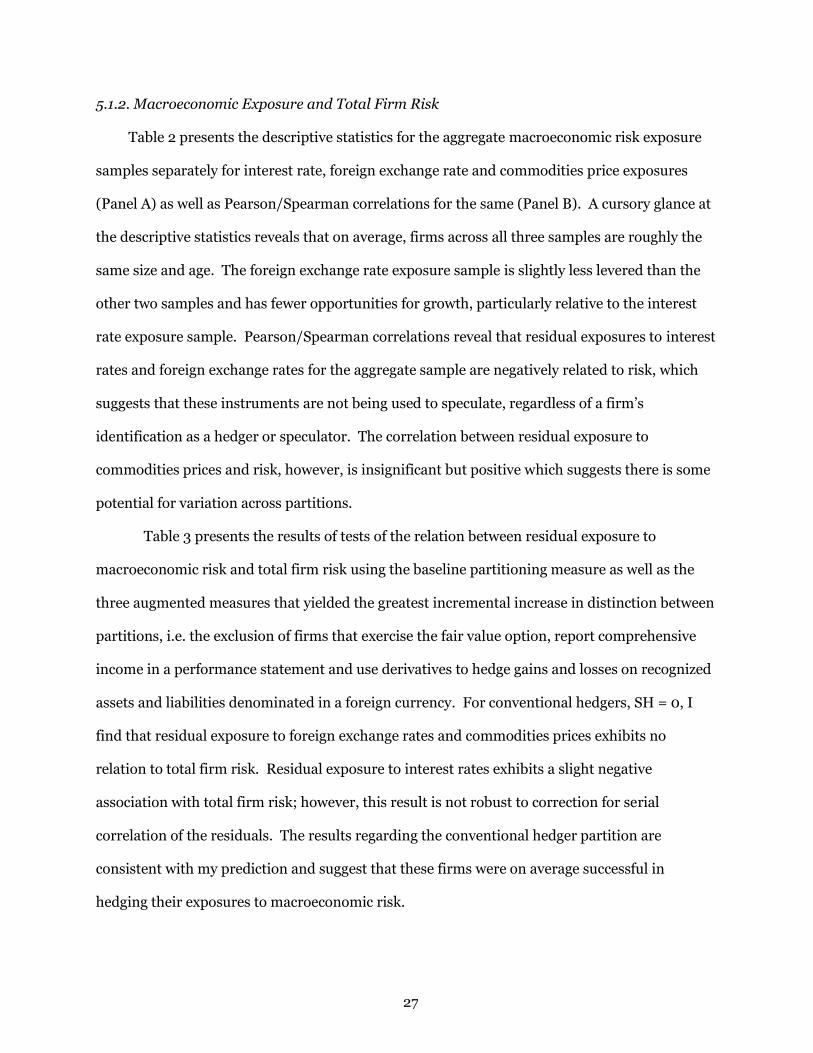
5.1.2. Macroeconomic Exposure and Total Firm Risk
Table 2 presents the descriptive statistics for the aggregate macroeconomic risk exposure
samples separately for interest rate, foreign exchange rate and commodities price exposures
(Panel A) as well as Pearson/Spearman correlations for the same (Panel B). A cursory glance at
the descriptive statistics reveals that on average, firms across all three samples are roughly the
same size and age. The foreign exchange rate exposure sample is slightly less levered than the
other two samples and has fewer opportunities for growth, particularly relative to the interest
rate exposure sample. Pearson/Spearman correlations reveal that residual exposures to interest
rates and foreign exchange rates for the aggregate sample are negatively related to risk, which
suggests that these instruments are not being used to speculate, regardless of a firm‟s
identification as a hedger or speculator. The correlation between residual exposure to
commodities prices and risk, however, is insignificant but positive which suggests there is some
potential for variation across partitions.
Table 3 presents the results of tests of the relation between residual exposure to
macroeconomic risk and total firm risk using the baseline partitioning measure as well as the
three augmented measures that yielded the greatest incremental increase in distinction between
partitions, i.e. the exclusion of firms that exercise the fair value option, report comprehensive
income in a performance statement and use derivatives to hedge gains and losses on recognized
assets and liabilities denominated in a foreign currency. For conventional hedgers, SH = 0, I
find that residual exposure to foreign exchange rates and commodities prices exhibits no
relation to total firm risk. Residual exposure to interest rates exhibits a slight negative
association with total firm risk; however, this result is not robust to correction for serial
correlation of the residuals. The results regarding the conventional hedger partition are
consistent with my prediction and suggest that these firms were on average successful in
hedging their exposures to macroeconomic risk.
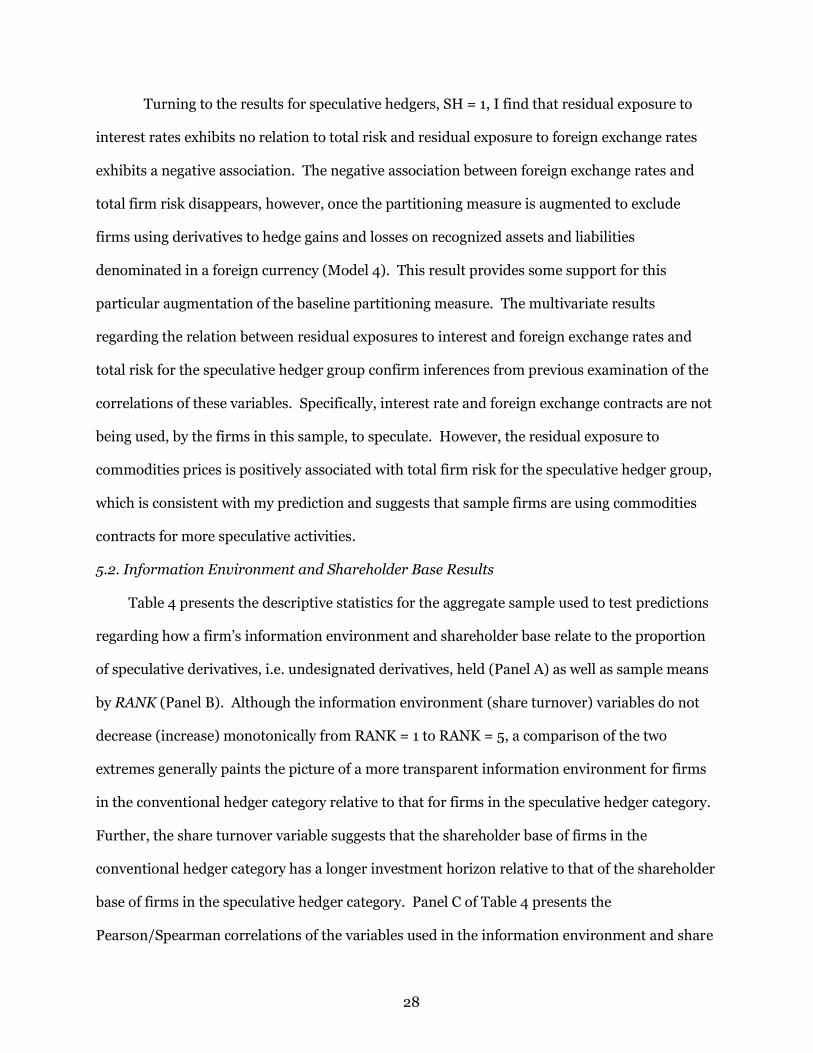
28
Turning to the results for speculative hedgers, SH = 1, I find that residual exposure to
interest rates exhibits no relation to total risk and residual exposure to foreign exchange rates
exhibits a negative association. The negative association between foreign exchange rates and
total firm risk disappears, however, once the partitioning measure is augmented to exclude
firms using derivatives to hedge gains and losses on recognized assets and liabilities
denominated in a foreign currency (Model 4). This result provides some support for this
particular augmentation of the baseline partitioning measure. The multivariate results
regarding the relation between residual exposures to interest and foreign exchange rates and
total risk for the speculative hedger group confirm inferences from previous examination of the
correlations of these variables. Specifically, interest rate and foreign exchange contracts are not
being used, by the firms in this sample, to speculate. However, the residual exposure to
commodities prices is positively associated with total firm risk for the speculative hedger group,
which is consistent with my prediction and suggests that sample firms are using commodities
contracts for more speculative activities.
5.2. Information Environment and Shareholder Base Results
Table 4 presents the descriptive statistics for the aggregate sample used to test predictions
regarding how a firm‟s information environment and shareholder base relate to the proportion
of speculative derivatives, i.e. undesignated derivatives, held (Panel A) as well as sample means
by RANK (Panel B). Although the information environment (share turnover) variables do not
decrease (increase) monotonically from RANK = 1 to RANK = 5, a comparison of the two
extremes generally paints the picture of a more transparent information environment for firms
in the conventional hedger category relative to that for firms in the speculative hedger category.
Further, the share turnover variable suggests that the shareholder base of firms in the
conventional hedger category has a longer investment horizon relative to that of the shareholder
base of firms in the speculative hedger category. Panel C of Table 4 presents the
Pearson/Spearman correlations of the variables used in the information environment and share

29
turnover analysis and is provided primarily to demonstrate that the aggregate TRANS variable
exhibits a significant positive correlation with its components.
Table 5 presents the results of the information environment and share turnover analysis
using the baseline partitioning measure as well as the three augmented measures presented in
Table 3. As implemented, the multinomial logistic regression models estimate the probability of
a firm appearing in categories 1 – 4 relative to the reference category 5. Models 1 through 4
provide evidence consistent with my predictions. Specifically, the multinomial logistic
coefficient estimates associated with the TRANS (TURNOVER) variable are positive (negative)
and significant across models. These results are robust to correction for serial correlation of the
residuals with the exception of the coefficient estimate on share turnover for RANK = 4 relative
to RANK = 5 which loses significance. These result are consistent with the notion that the more
transparent the firm‟s information environment (the more short-term shareholders a firm has),
the smaller (greater) the speculative portion of is hedge portfolio.
6. CONCLUSION
The objective of this study is to investigate whether the criteria that must be met in order
for the fair value gains and losses from a firm‟s derivative contracts to be recognized under the
hedge accounting exception reflect firms‟ risk management activities. Toward that end, I used
the quantitative disclosures from annual and interim reporting periods for a set of non-financial
firms to develop a partitioning measure meant to summarize the criteria. I subsequently
augment the quantitative measure with information from the qualitative disclosures in an effort
to refine it. I then conduct a series of tests to evaluate whether the partitions exhibit
characteristics associated with risk management or speculation. I find descriptive evidence
that (1) speculative hedgers are riskier than conventional hedgers; (2) there is no association
between residual exposure to macroeconomic risk and total firm risk for conventional hedgers;
(3) there is a positive association between residual exposure to commodities prices and total
firm risk for speculative hedgers; (4) speculative hedgers operate in more opaque information

30
environments relative to those of conventional hedgers; and, (5) speculative hedgers have a
shareholder base with a relatively short investment horizon. These results suggest hedge
accounting criteria does reflect risk management activities.
My interpretation of the results is subject to a number of caveats. Because a firm‟s risk
and the details regarding the strategy for managing that risk is unobservable to financial
statement users, I necessarily rely on intuition and theory regarding the determinants of
hedging versus speculative activities as well as firm-specific characteristics that could
distinguish one from the other. Further, I use empirical proxies to represent higher order
constructs. Thus, the analyses contained herein are essentially joint tests of the intuition and
theory that motivate them and the validity of the constructs employed.
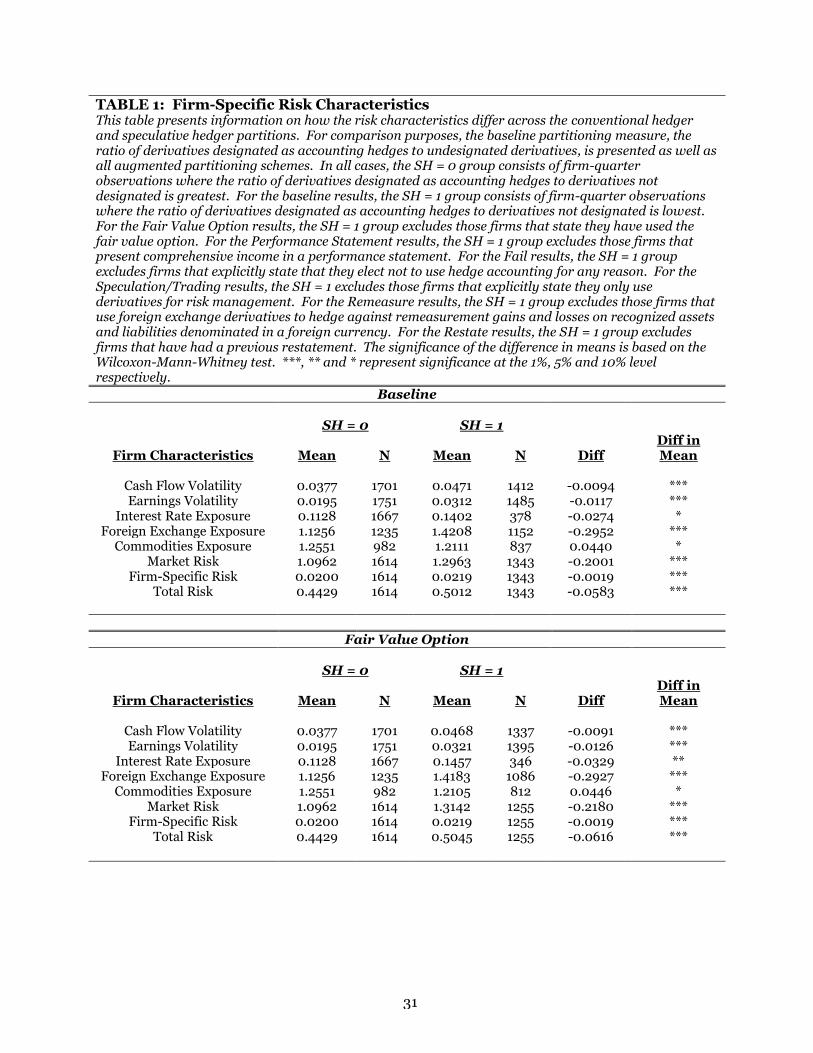
31
TABLE 1: Firm-Specific Risk Characteristics This table presents information on how the risk characteristics differ across the conventional hedger and speculative hedger partitions. For comparison purposes, the baseline partitioning measure, the ratio of derivatives designated as accounting hedges to undesignated derivatives, is presented as well as all augmented partitioning schemes. In all cases, the SH = 0 group consists of firm-quarter observations where the ratio of derivatives designated as accounting hedges to derivatives not designated is greatest. For the baseline results, the SH = 1 group consists of firm-quarter observations where the ratio of derivatives designated as accounting hedges to derivatives not designated is lowest. For the Fair Value Option results, the SH = 1 group excludes those firms that state they have used the fair value option. For the Performance Statement results, the SH = 1 group excludes those firms that present comprehensive income in a performance statement. For the Fail results, the SH = 1 group excludes firms that explicitly state that they elect not to use hedge accounting for any reason. For the Speculation/Trading results, the SH = 1 excludes those firms that explicitly state they only use derivatives for risk management. For the Remeasure results, the SH = 1 group excludes those firms that use foreign exchange derivatives to hedge against remeasurement gains and losses on recognized assets and liabilities denominated in a foreign currency. For the Restate results, the SH = 1 group excludes firms that have had a previous restatement. The significance of the difference in means is based on the Wilcoxon-Mann-Whitney test. ***, ** and * represent significance at the 1%, 5% and 10% level respectively.
Baseline SH = 0 SH = 1
Firm Characteristics Mean N Mean N Diff Diff in Mean
Cash Flow Volatility 0.0377 1701 0.0471 1412 -0.0094 *** Earnings Volatility 0.0195 1751 0.0312 1485 -0.0117 ***
Interest Rate Exposure 0.1128 1667 0.1402 378 -0.0274 * Foreign Exchange Exposure 1.1256 1235 1.4208 1152 -0.2952 ***
Commodities Exposure 1.2551 982 1.2111 837 0.0440 * Market Risk 1.0962 1614 1.2963 1343 -0.2001 ***
Firm-Specific Risk 0.0200 1614 0.0219 1343 -0.0019 *** Total Risk 0.4429 1614 0.5012 1343 -0.0583 ***
Fair Value Option SH = 0 SH = 1
Firm Characteristics Mean N Mean N Diff Diff in Mean
Cash Flow Volatility 0.0377 1701 0.0468 1337 -0.0091 *** Earnings Volatility 0.0195 1751 0.0321 1395 -0.0126 ***
Interest Rate Exposure 0.1128 1667 0.1457 346 -0.0329 ** Foreign Exchange Exposure 1.1256 1235 1.4183 1086 -0.2927 ***
Commodities Exposure 1.2551 982 1.2105 812 0.0446 * Market Risk 1.0962 1614 1.3142 1255 -0.2180 ***
Firm-Specific Risk 0.0200 1614 0.0219 1255 -0.0019 *** Total Risk 0.4429 1614 0.5045 1255 -0.0616 ***

32
TABLE 1: Firm-Specific Risk Characteristics (Cont.)
Performance Statement SH = 0 SH = 1
Firm Characteristics Mean N Mean N Diff Diff in Mean
Cash Flow Volatility 0.0377 1701 0.0502 805 -0.0125 *** Earnings Volatility 0.0195 1751 0.0337 824 -0.0142 ***
Interest Rate Exposure 0.1128 1667 0.1200 183 -0.0072 *** Foreign Exchange Exposure 1.1256 1235 1.5224 702 -0.3968 ***
Commodities Exposure 1.2551 982 1.3216 483 -0.0665 *** Market Risk 1.0962 1614 1.2873 761 -0.1911 ***
Firm-Specific Risk 0.0200 1614 0.0235 761 -0.0035 *** Total Risk 0.4429 1614 0.5356 761 -0.0927 ***
Fail SH = 0 SH = 1
Firm Characteristics Mean N Mean N Diff Diff in Mean
Cash Flow Volatility 0.0377 1701 0.0451 871 -0.0074 *** Earnings Volatility 0.0195 1751 0.0268 928 -0.0073 ***
Interest Rate Exposure 0.1128 1667 0.1597 255 -0.0469 ** Foreign Exchange Exposure 1.1256 1235 1.4128 743 -0.2872 *
Commodities Exposure 1.2551 982 1.2279 558 0.0272 * Market Risk 1.0962 1614 1.2792 821 -0.1830 ***
Firm-Specific Risk 0.0200 1614 0.0215 821 -0.0015 *** Total Risk 0.4429 1614 0.4930 821 -0.0501 ***
Speculation/Trading SH = 0 SH = 1
Firm Characteristics Mean N Mean N Diff Diff in Mean
Cash Flow Volatility 0.0377 1701 0.0505 257 -0.0128 *** Earnings Volatility 0.0195 1751 0.0303 288 -0.0108 ***
Interest Rate Exposure 0.1128 1667 0.1299 55 -0.0171 *** Foreign Exchange Exposure 1.1256 1235 1.0804 96 0.0452
Commodities Exposure 1.2551 982 1.0416 175 0.2135 Market Risk 1.0962 1614 1.3418 254 -0.2456 ***
Firm-Specific Risk 0.0200 1614 0.0206 254 -0.0006 ** Total Risk 0.4429 1614 0.4970 254 -0.0541 ***
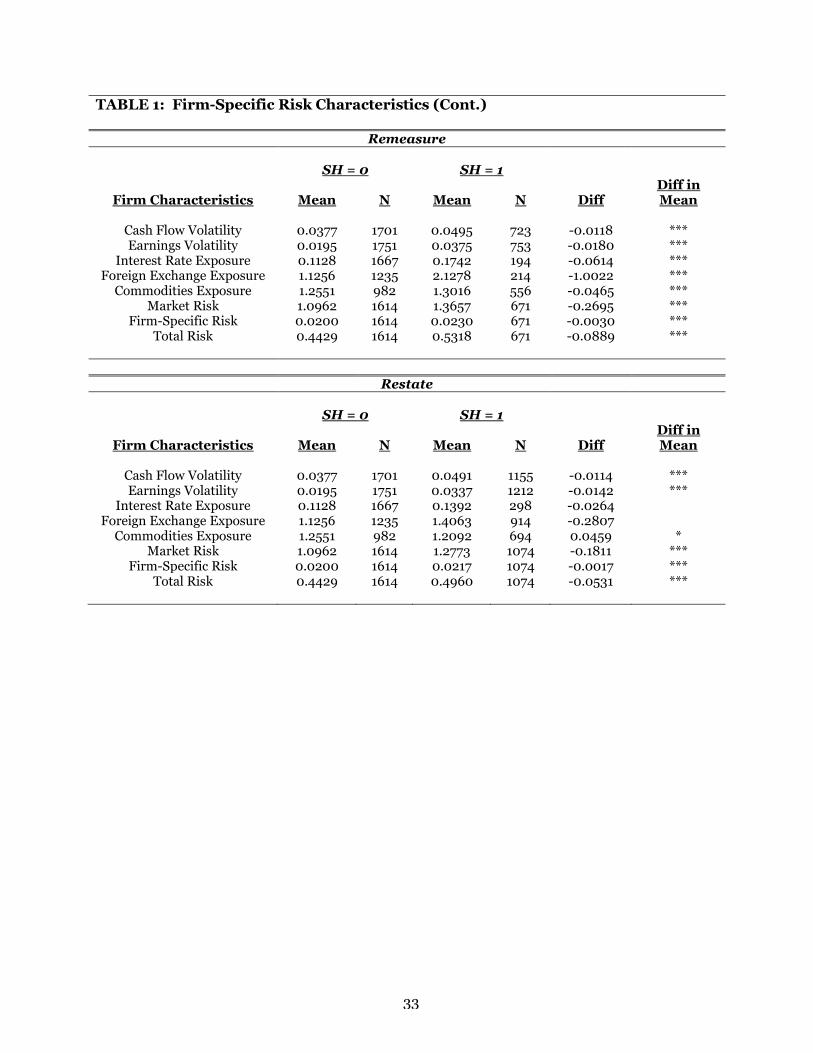
33
TABLE 1: Firm-Specific Risk Characteristics (Cont.)
Remeasure SH = 0 SH = 1
Firm Characteristics Mean N Mean N Diff Diff in Mean
Cash Flow Volatility 0.0377 1701 0.0495 723 -0.0118 *** Earnings Volatility 0.0195 1751 0.0375 753 -0.0180 ***
Interest Rate Exposure 0.1128 1667 0.1742 194 -0.0614 *** Foreign Exchange Exposure 1.1256 1235 2.1278 214 -1.0022 ***
Commodities Exposure 1.2551 982 1.3016 556 -0.0465 *** Market Risk 1.0962 1614 1.3657 671 -0.2695 ***
Firm-Specific Risk 0.0200 1614 0.0230 671 -0.0030 *** Total Risk 0.4429 1614 0.5318 671 -0.0889 ***
Restate SH = 0 SH = 1
Firm Characteristics Mean N Mean N Diff Diff in Mean
Cash Flow Volatility 0.0377 1701 0.0491 1155 -0.0114 *** Earnings Volatility 0.0195 1751 0.0337 1212 -0.0142 ***
Interest Rate Exposure 0.1128 1667 0.1392 298 -0.0264 Foreign Exchange Exposure 1.1256 1235 1.4063 914 -0.2807
Commodities Exposure 1.2551 982 1.2092 694 0.0459 * Market Risk 1.0962 1614 1.2773 1074 -0.1811 ***
Firm-Specific Risk 0.0200 1614 0.0217 1074 -0.0017 *** Total Risk 0.4429 1614 0.4960 1074 -0.0531 ***
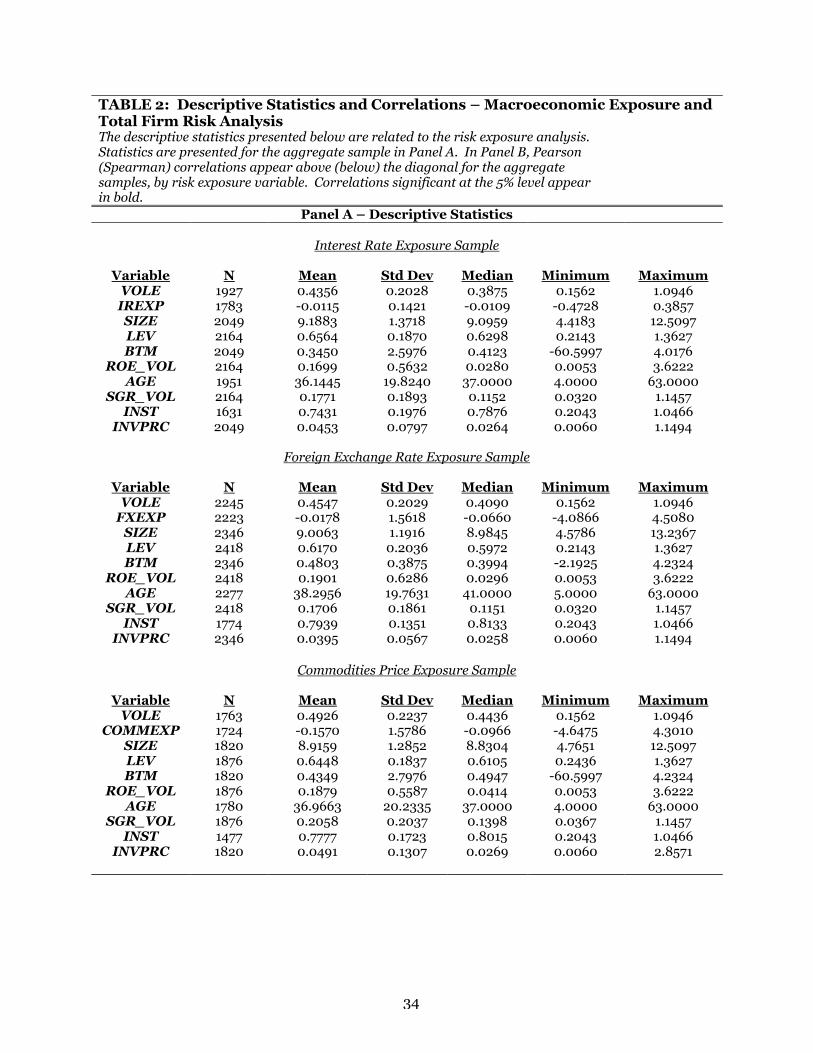
34
TABLE 2: Descriptive Statistics and Correlations – Macroeconomic Exposure and Total Firm Risk Analysis The descriptive statistics presented below are related to the risk exposure analysis. Statistics are presented for the aggregate sample in Panel A. In Panel B, Pearson (Spearman) correlations appear above (below) the diagonal for the aggregate samples, by risk exposure variable. Correlations significant at the 5% level appear in bold.
Panel A – Descriptive Statistics
Interest Rate Exposure Sample
Variable N Mean Std Dev Median Minimum Maximum VOLE 1927 0.4356 0.2028 0.3875 0.1562 1.0946 IREXP 1783 -0.0115 0.1421 -0.0109 -0.4728 0.3857 SIZE 2049 9.1883 1.3718 9.0959 4.4183 12.5097 LEV 2164 0.6564 0.1870 0.6298 0.2143 1.3627 BTM 2049 0.3450 2.5976 0.4123 -60.5997 4.0176
ROE_VOL 2164 0.1699 0.5632 0.0280 0.0053 3.6222 AGE 1951 36.1445 19.8240 37.0000 4.0000 63.0000
SGR_VOL 2164 0.1771 0.1893 0.1152 0.0320 1.1457 INST 1631 0.7431 0.1976 0.7876 0.2043 1.0466
INVPRC 2049 0.0453 0.0797 0.0264 0.0060 1.1494
Foreign Exchange Rate Exposure Sample
Variable N Mean Std Dev Median Minimum Maximum VOLE 2245 0.4547 0.2029 0.4090 0.1562 1.0946
FXEXP 2223 -0.0178 1.5618 -0.0660 -4.0866 4.5080 SIZE 2346 9.0063 1.1916 8.9845 4.5786 13.2367 LEV 2418 0.6170 0.2036 0.5972 0.2143 1.3627 BTM 2346 0.4803 0.3875 0.3994 -2.1925 4.2324
ROE_VOL 2418 0.1901 0.6286 0.0296 0.0053 3.6222 AGE 2277 38.2956 19.7631 41.0000 5.0000 63.0000
SGR_VOL 2418 0.1706 0.1861 0.1151 0.0320 1.1457 INST 1774 0.7939 0.1351 0.8133 0.2043 1.0466
INVPRC 2346 0.0395 0.0567 0.0258 0.0060 1.1494
Commodities Price Exposure Sample
Variable N Mean Std Dev Median Minimum Maximum
VOLE 1763 0.4926 0.2237 0.4436 0.1562 1.0946 COMMEXP 1724 -0.1570 1.5786 -0.0966 -4.6475 4.3010
SIZE 1820 8.9159 1.2852 8.8304 4.7651 12.5097 LEV 1876 0.6448 0.1837 0.6105 0.2436 1.3627 BTM 1820 0.4349 2.7976 0.4947 -60.5997 4.2324
ROE_VOL 1876 0.1879 0.5587 0.0414 0.0053 3.6222 AGE 1780 36.9663 20.2335 37.0000 4.0000 63.0000
SGR_VOL 1876 0.2058 0.2037 0.1398 0.0367 1.1457 INST 1477 0.7777 0.1723 0.8015 0.2043 1.0466
INVPRC 1820 0.0491 0.1307 0.0269 0.0060 2.8571
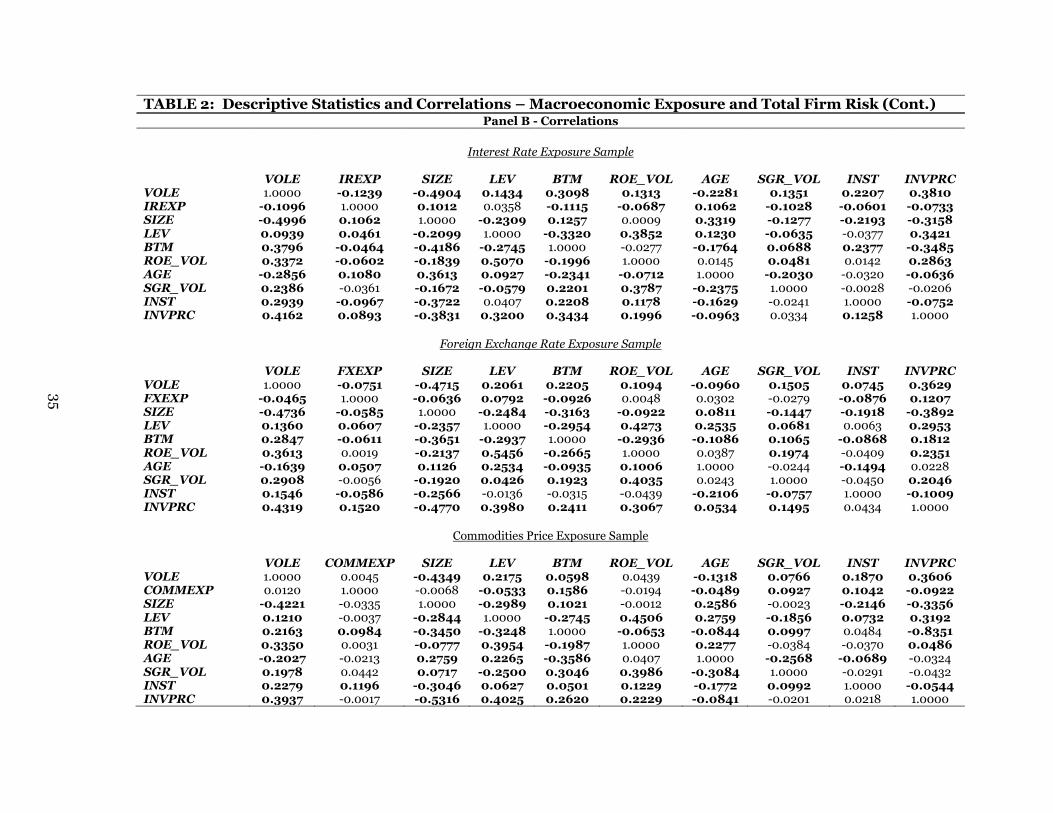
35
TABLE 2: Descriptive Statistics and Correlations – Macroeconomic Exposure and Total Firm Risk (Cont.) Panel B - Correlations
Interest Rate Exposure Sample
VOLE IREXP SIZE LEV BTM ROE_VOL AGE SGR_VOL INST INVPRC
VOLE 1.0000 -0.1239 -0.4904 0.1434 0.3098 0.1313 -0.2281 0.1351 0.2207 0.3810 IREXP -0.1096 1.0000 0.1012 0.0358 -0.1115 -0.0687 0.1062 -0.1028 -0.0601 -0.0733 SIZE -0.4996 0.1062 1.0000 -0.2309 0.1257 0.0009 0.3319 -0.1277 -0.2193 -0.3158 LEV 0.0939 0.0461 -0.2099 1.0000 -0.3320 0.3852 0.1230 -0.0635 -0.0377 0.3421 BTM 0.3796 -0.0464 -0.4186 -0.2745 1.0000 -0.0277 -0.1764 0.0688 0.2377 -0.3485 ROE_VOL 0.3372 -0.0602 -0.1839 0.5070 -0.1996 1.0000 0.0145 0.0481 0.0142 0.2863 AGE -0.2856 0.1080 0.3613 0.0927 -0.2341 -0.0712 1.0000 -0.2030 -0.0320 -0.0636 SGR_VOL 0.2386 -0.0361 -0.1672 -0.0579 0.2201 0.3787 -0.2375 1.0000 -0.0028 -0.0206 INST 0.2939 -0.0967 -0.3722 0.0407 0.2208 0.1178 -0.1629 -0.0241 1.0000 -0.0752 INVPRC 0.4162 0.0893 -0.3831 0.3200 0.3434 0.1996 -0.0963 0.0334 0.1258 1.0000
Foreign Exchange Rate Exposure Sample
VOLE FXEXP SIZE LEV BTM ROE_VOL AGE SGR_VOL INST INVPRC
VOLE 1.0000 -0.0751 -0.4715 0.2061 0.2205 0.1094 -0.0960 0.1505 0.0745 0.3629 FXEXP -0.0465 1.0000 -0.0636 0.0792 -0.0926 0.0048 0.0302 -0.0279 -0.0876 0.1207 SIZE -0.4736 -0.0585 1.0000 -0.2484 -0.3163 -0.0922 0.0811 -0.1447 -0.1918 -0.3892 LEV 0.1360 0.0607 -0.2357 1.0000 -0.2954 0.4273 0.2535 0.0681 0.0063 0.2953 BTM 0.2847 -0.0611 -0.3651 -0.2937 1.0000 -0.2936 -0.1086 0.1065 -0.0868 0.1812 ROE_VOL 0.3613 0.0019 -0.2137 0.5456 -0.2665 1.0000 0.0387 0.1974 -0.0409 0.2351 AGE -0.1639 0.0507 0.1126 0.2534 -0.0935 0.1006 1.0000 -0.0244 -0.1494 0.0228 SGR_VOL 0.2908 -0.0056 -0.1920 0.0426 0.1923 0.4035 0.0243 1.0000 -0.0450 0.2046 INST 0.1546 -0.0586 -0.2566 -0.0136 -0.0315 -0.0439 -0.2106 -0.0757 1.0000 -0.1009 INVPRC 0.4319 0.1520 -0.4770 0.3980 0.2411 0.3067 0.0534 0.1495 0.0434 1.0000
Commodities Price Exposure Sample
VOLE COMMEXP SIZE LEV BTM ROE_VOL AGE SGR_VOL INST INVPRC
VOLE 1.0000 0.0045 -0.4349 0.2175 0.0598 0.0439 -0.1318 0.0766 0.1870 0.3606 COMMEXP 0.0120 1.0000 -0.0068 -0.0533 0.1586 -0.0194 -0.0489 0.0927 0.1042 -0.0922 SIZE -0.4221 -0.0335 1.0000 -0.2989 0.1021 -0.0012 0.2586 -0.0023 -0.2146 -0.3356 LEV 0.1210 -0.0037 -0.2844 1.0000 -0.2745 0.4506 0.2759 -0.1856 0.0732 0.3192 BTM 0.2163 0.0984 -0.3450 -0.3248 1.0000 -0.0653 -0.0844 0.0997 0.0484 -0.8351 ROE_VOL 0.3350 0.0031 -0.0777 0.3954 -0.1987 1.0000 0.2277 -0.0384 -0.0370 0.0486 AGE -0.2027 -0.0213 0.2759 0.2265 -0.3586 0.0407 1.0000 -0.2568 -0.0689 -0.0324 SGR_VOL 0.1978 0.0442 0.0717 -0.2500 0.3046 0.3986 -0.3084 1.0000 -0.0291 -0.0432 INST 0.2279 0.1196 -0.3046 0.0627 0.0501 0.1229 -0.1772 0.0992 1.0000 -0.0544 INVPRC 0.3937 -0.0017 -0.5316 0.4025 0.2620 0.2229 -0.0841 -0.0201 0.0218 1.0000
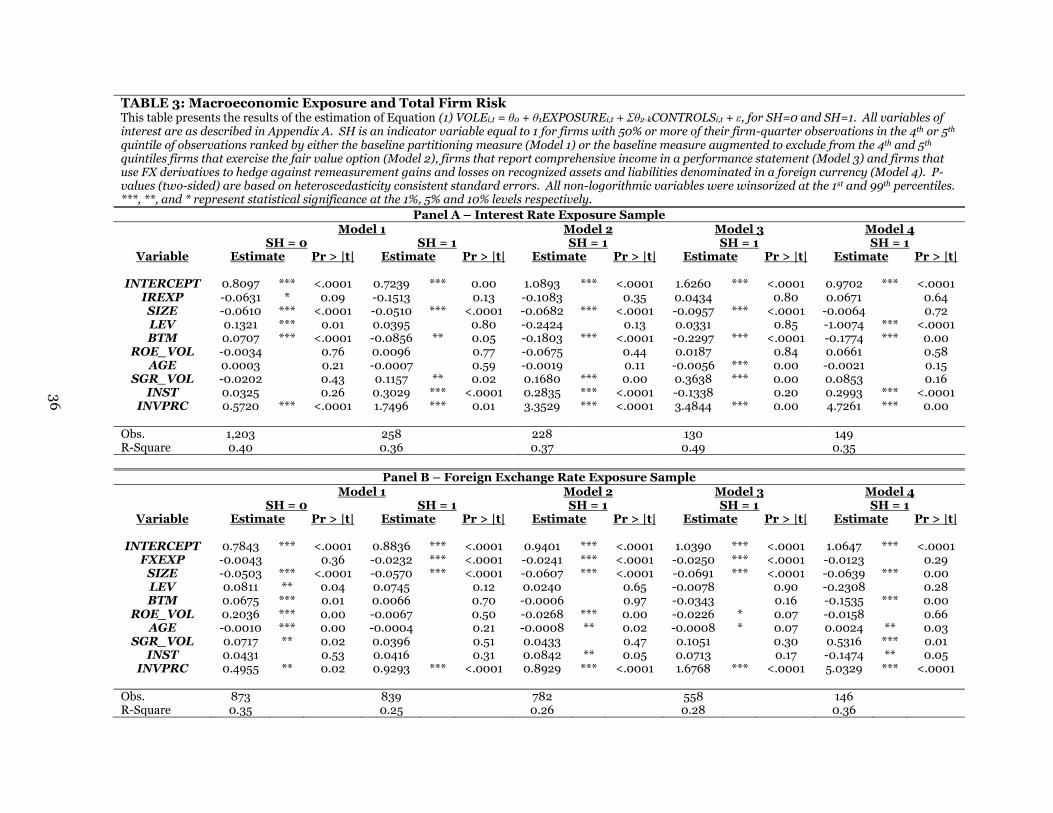
36
TABLE 3: Macroeconomic Exposure and Total Firm Risk This table presents the results of the estimation of Equation (1) VOLEi,t = θ0 + θ1EXPOSUREi,t + Σθ2-kCONTROLSi,t + ε, for SH=0 and SH=1. All variables of interest are as described in Appendix A. SH is an indicator variable equal to 1 for firms with 50% or more of their firm-quarter observations in the 4th or 5th quintile of observations ranked by either the baseline partitioning measure (Model 1) or the baseline measure augmented to exclude from the 4th and 5th quintiles firms that exercise the fair value option (Model 2), firms that report comprehensive income in a performance statement (Model 3) and firms that use FX derivatives to hedge against remeasurement gains and losses on recognized assets and liabilities denominated in a foreign currency (Model 4). P-values (two-sided) are based on heteroscedasticity consistent standard errors. All non-logorithmic variables were winsorized at the 1st and 99th percentiles. ***, **, and * represent statistical significance at the 1%, 5% and 10% levels respectively.
Panel A – Interest Rate Exposure Sample Model 1 Model 2 Model 3 Model 4 SH = 0 SH = 1 SH = 1 SH = 1 SH = 1
Variable Estimate Pr > |t| Estimate Pr > |t| Estimate Pr > |t| Estimate Pr > |t| Estimate Pr > |t|
INTERCEPT 0.8097 *** <.0001 0.7239 *** 0.00 1.0893 *** <.0001 1.6260 *** <.0001 0.9702 *** <.0001 IREXP -0.0631 * 0.09 -0.1513 0.13 -0.1083 0.35 0.0434 0.80 0.0671 0.64 SIZE -0.0610 *** <.0001 -0.0510 *** <.0001 -0.0682 *** <.0001 -0.0957 *** <.0001 -0.0064 0.72 LEV 0.1321 *** 0.01 0.0395 0.80 -0.2424 0.13 0.0331 0.85 -1.0074 *** <.0001 BTM 0.0707 *** <.0001 -0.0856 ** 0.05 -0.1803 *** <.0001 -0.2297 *** <.0001 -0.1774 *** 0.00
ROE_VOL -0.0034 0.76 0.0096 0.77 -0.0675 0.44 0.0187 0.84 0.0661 0.58 AGE 0.0003 0.21 -0.0007 0.59 -0.0019 0.11 -0.0056 *** 0.00 -0.0021 0.15
SGR_VOL -0.0202 0.43 0.1157 ** 0.02 0.1680 *** 0.00 0.3638 *** 0.00 0.0853 0.16 INST 0.0325 0.26 0.3029 *** <.0001 0.2835 *** <.0001 -0.1338 0.20 0.2993 *** <.0001
INVPRC 0.5720 *** <.0001 1.7496 *** 0.01 3.3529 *** <.0001 3.4844 *** 0.00 4.7261 *** 0.00 Obs. 1,203 258 228 130 149 R-Square 0.40 0.36 0.37 0.49 0.35
Panel B – Foreign Exchange Rate Exposure Sample Model 1 Model 2 Model 3 Model 4 SH = 0 SH = 1 SH = 1 SH = 1 SH = 1
Variable Estimate Pr > |t| Estimate Pr > |t| Estimate Pr > |t| Estimate Pr > |t| Estimate Pr > |t|
INTERCEPT 0.7843 *** <.0001 0.8836 *** <.0001 0.9401 *** <.0001 1.0390 *** <.0001 1.0647 *** <.0001 FXEXP -0.0043 0.36 -0.0232 *** <.0001 -0.0241 *** <.0001 -0.0250 *** <.0001 -0.0123 0.29
SIZE -0.0503 *** <.0001 -0.0570 *** <.0001 -0.0607 *** <.0001 -0.0691 *** <.0001 -0.0639 *** 0.00 LEV 0.0811 ** 0.04 0.0745 0.12 0.0240 0.65 -0.0078 0.90 -0.2308 0.28 BTM 0.0675 *** 0.01 0.0066 0.70 -0.0006 0.97 -0.0343 0.16 -0.1535 *** 0.00
ROE_VOL 0.2036 *** 0.00 -0.0067 0.50 -0.0268 *** 0.00 -0.0226 * 0.07 -0.0158 0.66 AGE -0.0010 *** 0.00 -0.0004 0.21 -0.0008 ** 0.02 -0.0008 * 0.07 0.0024 ** 0.03
SGR_VOL 0.0717 ** 0.02 0.0396 0.51 0.0433 0.47 0.1051 0.30 0.5316 *** 0.01 INST 0.0431 0.53 0.0416 0.31 0.0842 ** 0.05 0.0713 0.17 -0.1474 ** 0.05
INVPRC 0.4955 ** 0.02 0.9293 *** <.0001 0.8929 *** <.0001 1.6768 *** <.0001 5.0329 *** <.0001 Obs. 873 839 782 558 146 R-Square 0.35 0.25 0.26 0.28 0.36

37
TABLE 3: Macroeconomic Exposure and Total Firm Risk (Cont.)
Panel C – Dependent Variable = Economic Risk
Model 1 Model 2 Model 3 Model 4 SH = 0 SH = 1 SH = 1 SH = 1 SH = 1
Variable Estimate Pr > |t| Estimate Pr > |t| Estimate Pr > |t| Estimate Pr > |t| Estimate Pr > |t|
INTERCEPT 1.1414 *** <.0001 0.9540 *** <.0001 0.9362 *** <.0001 1.1268 *** <.0001 1.0183 *** <.0001 COMMEXP -0.0058 0.21 0.0153 *** 0.00 0.0148 *** 0.00 0.0251 *** <.0001 0.0265 *** <.0001
SIZE -0.0953 *** <.0001 -0.0523 *** <.0001 -0.0498 *** <.0001 -0.0609 *** <.0001 -0.0388 *** <.0001 LEV 0.1088 * 0.08 -0.1707 *** 0.01 -0.1777 *** 0.01 -0.0840 0.37 -0.5129 *** <.0001 BTM -0.0178 0.42 -0.0735 *** 0.00 -0.0690 *** 0.00 -0.0764 ** 0.02 -0.0470 * 0.10
ROE_VOL -0.0410 *** <.0001 0.0646 *** 0.00 0.1351 ** 0.02 0.1727 *** 0.01 0.2060 *** 0.00 AGE 0.0014 *** 0.00 -0.0004 0.26 -0.0004 0.34 -0.0008 0.17 -0.0010 * 0.07
SGR_VOL 0.2598 *** <.0001 -0.0149 0.61 -0.0376 0.21 -0.1991 *** <.0001 -0.0250 0.42 INST 0.0095 0.85 0.2339 *** <.0001 0.2249 *** <.0001 0.1492 *** 0.00 0.2045 *** <.0001
INVPRC 0.5817 *** 0.01 0.7151 *** <.0001 0.8249 *** <.0001 0.7402 *** 0.00 1.0123 ** 0.02 Obs. 791 616 586 360 422 R-Square 0.34 0.26 0.26 0.31 0.25

38
TABLE 4: Descriptive Statistics and Correlations – Information Environment and Shareholder Base Analysis The descriptive statistics presented below are related to the information environment/shareholder base analysis. Statistics are presented for the aggregate sample (Panel A) and sample means are provided by the categorical variable RANK (Panel B). Firm-quarters are classified based on the ratio of derivative assets and liabilities designated as accounting hedges to derivative assets and liabilities not designated as accounting hedges. RANK = 1 when all derivative contracts for that observation are designated as accounting hedges. RANK = 5 when none of the derivative contracts for that observation are designated as accounting hedges. The remaining observations are approximately equally distributed between RANK = 2-4. In Panel C, Pearson (Spearman) Correlations appear above (below) the diagonal for the aggregate sample. Correlations significant at the 5% level are in bold.
Panel A – Aggregate Sample Statistics
Variable N Mean Std Dev
Median Minimum Maximum
SMOOTH1 1888 -0.5514 0.2912 -0.5211 -1.2624 -0.1024 SMOOTH2 1888 0.7745 0.2574 0.8806 -0.1104 0.9950
FCAST_ERROR 1888 -0.0033 0.0054 -0.0016 -0.0345 0.0000 ANALYST FOLLOW
1888 16.6075 7.4753 16.0000 2.0000 45.0000
FCAST_DISP 1888 -0.0856 0.2714 -0.0500 -1.6667 0.9000 AGE 1888 41.0715 19.0465 48.0000 4.0000 63.0000
SPREAD 1888 -0.0180 0.0152 -0.0127 -0.1145 -0.0095 TRANS 1888 4.4504 1.3955 4.4286 0.5714 7.8571
TURNOVER 1888 13.5737 10.5486 10.3228 2.2590 65.2903 SIZE 1888 9.2463 1.2769 9.1330 5.7176 12.5097 LEV 1888 0.5983 0.1750 0.5860 0.2126 1.0188
INTCOV 1888 25.5520 64.8830 11.0970 -2.5440 536.0000 MB 1888 3.3095 3.4355 2.3491 -1.8073 21.6427
Panel B – Means By Rank RANK = 1 RANK = 2 RANK = 3 RANK = 4 RANK = 5
Variable N Mean N Mean N Mean N Mean N Mean
SMOOTH1 379 -0.5710 433 -0.4977 466 -0.4759 412 -0.5666 198 -0.7776 SMOOTH2 379 0.7661 433 0.8327 466 0.8375 412 0.7311 198 0.6058
FCAST_ ERROR
379 -0.0040 433 -0.0023 466 -0.0025 412 -0.0039 198 -0.0054
ANALYST FOLLOW
379 16.4486 433 17.6236 466 16.4936 412 15.1481 198 17.9950
FCAST_DISP 379 -0.0706 433 -0.0632 466 -0.0761 412 -0.1096 198 -0.1361 AGE 379 35.9736 433 44.0139 466 45.9270 412 42.1165 198 30.7929
SPREAD 379 -0.0178 433 -0.0184 466 -0.0178 412 -0.0175 198 -0.0187 TRANS 379 4.1941 433 4.8908 466 4.9013 412 4.2396 198 3.3557
TURNOVER 379 13.5820 433 11.6062 466 10.9150 412 14.9483 198 21.2577 SIZE 379 8.7410 433 9.4704 466 9.6232 412 9.2215 198 8.8885 LEV 379 0.6120 433 0.5941 466 0.6207 412 0.5731 198 0.5811
INTCOV 379 33.2177 433 30.2190 466 25.4890 412 19.3275 198 13.7729 MB 379 3.4858 433 4.0893 466 3.8264 412 2.4871 198 1.7612
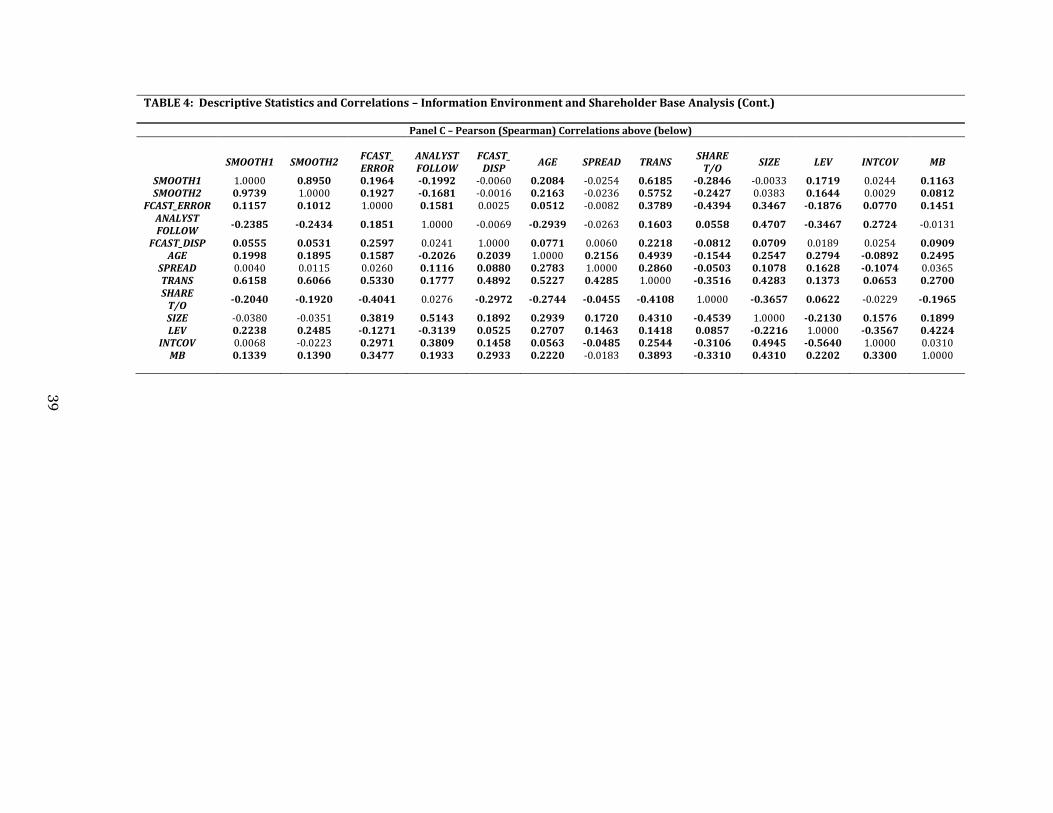
39
TABLE 4: Descriptive Statistics and Correlations – Information Environment and Shareholder Base Analysis (Cont.)
Panel C – Pearson (Spearman) Correlations above (below)
SMOOTH1 SMOOTH2 FCAST_ ERROR
ANALYST FOLLOW
FCAST_ DISP
AGE SPREAD TRANS SHARE
T/O SIZE LEV INTCOV MB
SMOOTH1 1.0000 0.8950 0.1964 -0.1992 -0.0060 0.2084 -0.0254 0.6185 -0.2846 -0.0033 0.1719 0.0244 0.1163 SMOOTH2 0.9739 1.0000 0.1927 -0.1681 -0.0016 0.2163 -0.0236 0.5752 -0.2427 0.0383 0.1644 0.0029 0.0812
FCAST_ERROR 0.1157 0.1012 1.0000 0.1581 0.0025 0.0512 -0.0082 0.3789 -0.4394 0.3467 -0.1876 0.0770 0.1451 ANALYST FOLLOW
-0.2385 -0.2434 0.1851 1.0000 -0.0069 -0.2939 -0.0263 0.1603 0.0558 0.4707 -0.3467 0.2724 -0.0131
FCAST_DISP 0.0555 0.0531 0.2597 0.0241 1.0000 0.0771 0.0060 0.2218 -0.0812 0.0709 0.0189 0.0254 0.0909 AGE 0.1998 0.1895 0.1587 -0.2026 0.2039 1.0000 0.2156 0.4939 -0.1544 0.2547 0.2794 -0.0892 0.2495
SPREAD 0.0040 0.0115 0.0260 0.1116 0.0880 0.2783 1.0000 0.2860 -0.0503 0.1078 0.1628 -0.1074 0.0365 TRANS 0.6158 0.6066 0.5330 0.1777 0.4892 0.5227 0.4285 1.0000 -0.3516 0.4283 0.1373 0.0653 0.2700 SHARE
T/O -0.2040 -0.1920 -0.4041 0.0276 -0.2972 -0.2744 -0.0455 -0.4108 1.0000 -0.3657 0.0622 -0.0229 -0.1965
SIZE -0.0380 -0.0351 0.3819 0.5143 0.1892 0.2939 0.1720 0.4310 -0.4539 1.0000 -0.2130 0.1576 0.1899 LEV 0.2238 0.2485 -0.1271 -0.3139 0.0525 0.2707 0.1463 0.1418 0.0857 -0.2216 1.0000 -0.3567 0.4224
INTCOV 0.0068 -0.0223 0.2971 0.3809 0.1458 0.0563 -0.0485 0.2544 -0.3106 0.4945 -0.5640 1.0000 0.0310 MB 0.1339 0.1390 0.3477 0.1933 0.2933 0.2220 -0.0183 0.3893 -0.3310 0.4310 0.2202 0.3300 1.0000

40
TABLE 5: Information Environment and Shareholder Base This table presents the results of the estimation of Equation (2): RANK = Ψ0 + Ψ1TRANSi,t + Ψ2TURNOVERi,t + Ψ3SIZEi,t+ Ψ4LEVERAGEi,t + Ψ5INTCOVi,t + Ψ6MBi,t + ε. All variables are as described in Appendix A. Model 1 provides multinomial logit coefficient estimates obtained from the aggregated baseline partitions. Models 2 through 4 provide multinomial logit coefficient estimates obtained from aggregated partitions excluding from the 4th and 5th quintiles firms that exercise the fair value option (Model 2), firms that report comprehensive income in a performance statement (Model 3), firms that use FX derivatives to hedge against remeasurement gains and losses on recognized assets and liabilities denominated in a foreign currency (Model 4). Estimates of ψ2<0 would provide evidence in support of hypothesis 4. All non-logorithmic variables were winsorized at the 1st and 99th percentiles. ***, **, and * represent statistical significance at the 1%, 5% and 10% levels respectively.
Model 1 Model 2 Model 3 Model 4
Var RANK Estimate Pr >
ChiSq Estimate Pr >
ChiSq Estimate Pr >
ChiSq Estimate Pr >
ChiSq
TRANS 1 0.4866 *** <.0001 0.4798 *** <.0001 0.4606 *** <.0001 0.7803 *** <.0001 TRANS 2 0.7648 *** <.0001 0.7597 *** <.0001 0.7259 *** <.0001 1.0847 *** <.0001 TRANS 3 0.6847 *** <.0001 0.6829 *** <.0001 0.6423 *** <.0001 1.0186 *** <.0001 TRANS 4 0.4724 *** <.0001 0.4571 *** <.0001 0.3959 *** 0.00 0.3922 *** 0.00
TURNOVER 1 -0.0427 *** <.0001 -0.0404 *** <.0001 -0.0585 *** <.0001 -0.0486 *** <.0001 TURNOVER 2 -0.0366 *** <.0001 -0.0345 *** <.0001 -0.0538 *** <.0001 -0.0444 *** <.0001 TURNOVER 3 -0.0492 *** <.0001 -0.0467 *** <.0001 -0.0665 *** <.0001 -0.0573 *** <.0001 TURNOVER 4 -0.0175 *** 0.01 -0.0176 *** 0.01 -0.0367 *** <.0001 -0.016 * 0.10
SIZE 1 -0.6995 *** <.0001 -0.6899 *** <.0001 -0.3742 *** 0.00 -0.6881 *** <.0001 SIZE 2 -0.3142 *** 0.00 -0.3101 *** 0.00 -0.0074 0.95 -0.3218 *** 0.007 SIZE 3 -0.1355 0.15 -0.1343 0.15 0.1710 0.18 -0.1579 0.18 SIZE 4 -0.1674 * 0.07 -0.1574 * 0.09 0.0718 0.58 0.1055 0.40
LEV 1 -0.3475 0.61 -0.2318 0.74 0.2990 0.72 0.2973 0.74 LEV 2 -1.3531 ** 0.05 -1.2204 * 0.08 -0.6960 0.41 -0.7344 0.42 LEV 3 0.7751 0.26 0.8847 0.20 1.4050 * 0.09 1.3705 0.13 LEV 4 -0.8160 0.22 -0.5574 0.41 -0.8632 0.30 -1.6201 * 0.09
INTCOV 1 0.0068 ** 0.05 0.0068 * 0.06 0.0071 0.14 0.0114 * 0.10 INTCOV 2 0.0044 0.21 0.0044 0.22 0.0047 0.32 0.0089 0.20 INTCOV 3 0.0049 0.16 0.0049 0.17 0.0052 0.27 0.0095 0.17 INTCOV 4 0.0014 0.70 0.0003 0.95 0.0018 0.72 0.0051 0.48

41
TABLE 5: Information Environment and Shareholder Base – Cont.
Model 1 Model 2 Model 3 Model 4
Var RANK Est. Pr >
ChiSq Est. Pr >
ChiSq Est. Pr >
ChiSq Est. Pr >
ChiSq
MB 1 0.3545 *** <.0001 0.3687 *** <.0001 0.1624 ** 0.02 0.3928 *** <.0001 MB 2 0.3790 *** <.0001 0.3920 *** <.0001 0.1856 *** 0.01 0.4138 *** <.0001 MB 3 0.3046 *** <.0001 0.3179 *** <.0001 0.1100 0.13 0.3349 *** 0.00 MB 4 0.2064 *** 0.00 0.2244 *** 0.00 0.0468 0.54 -0.3472 *** 0.00
Obs. 1888 1852 1687 1580
Pseudo R2 0.08 0.08 0.08 0.13

42
APPENDIX: VARIABLE DEFINITIONS
Variable Name
Variable Definition
SPECULATIVE HEDGER (SH)
An indicator variable equal to 1 if the firm-quarter observation is in quintile 4 or 5, i.e. firm-quarters with the smallest portion of derivative assets and liabilities designated as accounting hedges, 0 otherwise. For the Risk Exposure analysis, the variable is a fixed firm characteristic and only equals 1 when 50% or more of a firm’s quarterly observations fall into the 4th and 5th quintiles of observations with the greatest portion of derivative assets and liabilities designated as accounting hedges.
RANK
Categorical variable equal to 1-5 with 1 assigned to firm-quarters with all derivatives designated as accounting hedges and 5 assigned to firm-quarters with no derivatives designated as accounting hedges.
TRANS The average decile rank of SMOOTH1, SMOOTH2, FCAST_ERROR, ANALYST FOLLOW, FCAST_DISP, AGE and SPREAD.
SMOOTH1
The standard deviation of net income before extraordinary items scaled by average total assets divided by the standard deviation of cash flow from operations scaled by average total assets multiplied by -1 so larger values represent smoother earnings.
SMOOTH2
The correlation between the cash flow from operations scaled by average total assets and total accruals scaled by average total assets with the correlation coefficient multiplied by a -1 so that larger values represent smoother earnings.
FCAST_ERROR
The absolute value of the forecast error scaled by the stock price at the end of the prior fiscal quarter multiplied by -1. Forecast error is the I/B/E/S analysts’ mean annual earnings forecast less the actual earnings as reported by I/B/E/S.
ANALYST FOLLOW The number of analysts making a forecast for quarter t’s earnings.
FCAST_DISP
The coefficient of variation of analysts’ forecasts, i.e. the standard deviation of forecast for the fiscal quarter scaled by the mean estimate, both reported by I/B/E/S, multiplied by -1 so larger values represent a more transparent information environment.
AGE The number of fiscal years accounting data is available in Compustat
SPREAD The quarterly average of the absolute difference between the closing bid and ask price obtained from CRSP, multiplied by -1 so larger values represent a more transparent information environment.
TURNOVER The quarterly average of share volume scaled by the number of shares outstanding obtained from CRSP
CFO_VOL
The standard deviation of operating cash flows scaled by average total assets where standard deviations are calculated using 5 years, 20 quarters, of data. Operating cash flows are calculated as earnings before extraordinary items less total accruals. Total accruals equal ΔCurrent Assets – ΔCurrent Liabilities – ΔCash + ΔShort-Term Debt - Depreciation.

43
EARN_VOL The standard deviation of earnings before extraordinary items scaled by average total assets where standard deviations are calculated using 5 years, 20 quarters, of data.
BETA The market-model beta estimated using daily returns over quarters t-7 to t.
FIRMRSK The standard deviation of the residuals from the regressions used to estimate beta.
TOTAL RISK The standard deviation of firm returns estimated using daily returns over quarters t-7 to t.
IREXPOSURE, FXEXPOSURE,
COMMEXPOSURE
Exposure to interest rate, foreign exchange and commodities price risk is estimated for each firm-quarter observation by estimating the following regression via ordinary least squares: Ri,t = λ0i + λ1iRmt + λ2iMacrot + λi,t
where Ri,t is the cumulative raw return for firm i in month t; Rm,t is the value-weighted market portfolio return in month t; and Macrot is one of three macroeconomic variables with serve as proxies for interest rate risk, foreign currency risk and commodity price risk. The interest rate proxy is the monthly percentage change in LIBOR. The foreign currency risk proxy is the monthly percentage change in the Federal Reserve Board trade-weighted index which measures the strength of the U.S. dollar relative to other currencies of the index. The commodity price risk proxy is the monthly percentage change in the consumer price index of all commodities. The absolute value of the coefficient λ2i captures the firm exposure to the risk factor in each period. The exposure variable is a firm-specific variable estimated using month t-23 to month t returns.
MTB Market value of equity divided by book value of equity. SIZE The natural log of market value of equity LEV Total liabilities divided by total assets
INTCOV Interest expense divided by operating income before depreciation

44
REFERENCES
Adam, T. R. and C. S. Fernando, 2006, Hedging, speculation, and shareholder value, Journal of Financial Economics, 81 (2), 283-309.
Ang, J. S. and Y. Cheng, 2006, Direct evidence on the market-driven acquisition theory, Journal
of Financial Research, 29 (2), 199-216.
Barron, O. E., O. Kim, S. C. Lim, D. E. Stevens, 1998, Using analysts‟ forecasts to measure
properties of analysts‟ information environment, The Accounting Review, 73 (4), 421-
433.
Barton, J., 2001, Does the use of financial derivatives affect earnings management decisions?
The Accounting Review, 76 (1), 1-26.
Belk, P.A. and M. Glaum, 1990, The management of foreign exchange risk in UK multinationals:
An empirical investigation, Accounting and Business Research, 21 (81), 3-13.
Biddle, G. C. and J. Choi, 2006, Is comprehensive income useful? Journal of Contemporary
Accounting and Economics, 2 (1), 1-32.
Bodnar, G. M., G. S. Hayt and R. C. Marston, 1996, 1995 Wharton survey of derivatives usage by
US non-financial firms, Financial Management, 25 (4), 113-133.
Brown, G. W., 2001, Managing foreign exchange risk with derivatives, Journal of Financial
Economics, 60 (2-3), 401-448.
Brown, G. and N. Kapadia, 2007, Firm-specific risk and equity market development, Journal of
Financial Economics, 84 (2), 358-388.
Campbell, J. L., 2012, The fair value of cash flow hedges, future profitability and stock returns,
University of Georgia Working Paper.
Canter, M. and F. Edwards, 1995, The collapse of Metallgesellschaft: unhedgeable risks, poor
hedging strategy, or just bad luck? Journal of Futures Markets, 15(3), 211-264.
Chambers, D., T. J. Linsmeier, C. Shakespeare and T. Sougiannis, 2007, An evaluation of SFAS
No. 130 comprehensive income disclosures, Review of Accounting Studies, 12 (4), 557-
593.
Chen, W., H. Tan and E. Y. Wang, 2013, Fair value accounting and managers‟ hedging decisions,
Journal of Accounting Research, 51 (1), 67-103.
45
Chernenko, S. and M. Faulkender, 2011, The two sides of derivatives usage: hedging and
speculating with interest rate swaps, Journal of Financial and Quantitative Analysis, 46
(6), 1727-1754.
Chiang, R. and P. C. Venkatesh, 1988, Insider holdings and perceptions of information
asymmetry: A note, The Journal of Finance, 43 (4), 1041-1048.
Ciner, C., 2006, Hedging or speculation in derivative markets: The case of energy futures
contracts, Applied Financial Economics Letters, 2 (3), 189-192.
Comiskey, E. and C. Mulford, 2008, The non-designation of derivatives as hedges for accounting
purposes, Journal of Applied Research in Accounting and Finance, 3 (2), 3-16.
Dechow, P., W. Ge and C. Schrand, 2010, Understanding earnings quality: A review of the
proxies, their determinants and their consequences, Journal of Accounting and
Economics, 50 (2-3), 344-401.
DeMarzo, P. and D. Duffie, 1995, Incentives for hedging and hedge accounting, The Review of
Financial Studies, 8 (3), 743-771.
Dhaliwal, D., K. R. Subramanyam, and R. Trezevant, 1999, Is comprehensive income superior to
net income as a measure of firm performance? Journal of Accounting and Economics, 26
(1-3), 43-67.
Dichev, I. D. and V. W. Tang, 2009, Earnings volatility and earnings predictability, Journal of
Accounting and Economics, 47 (1-2), 160-181.
Edwards, F. R. and M. S. Canter, 1995, The collapse of metallgesellschaft: unhedgeable risks,
poor hedging strategy or just bad luck? The Journal of Futures Markets, 15 (3), 211-264.
Fatemi, A. and M. Glaum, 2000, Risk management practices of German firms, Managerial
Finance, 26 (3), 1-17.
Fatemi, A. and C. Luft, 2002, Corporate risk management costs and benefits, Global Finance
Journal, 13 (1), 29-38.
Faulkender, M., 2005, Hedging or market timing? selecting the interest rate exposure of
corporate debt, The Journal of Finance, 60 (2), 931-962.
Financial Accounting Standards Board, 1998, Financial Accounting Standards Board Statement
No. 133, Accounting for derivative instruments and hedging activities (Financial
Accounting Standards Board, Norwalk, CT).
46
Financial Accounting Standards Board, 2007, Financial Accounting Standards Board Statement
No. 159, The fair value option for financial assets and financial liabilities (Financial
Accounting Standards Board, Norwalk, CT).
Financial Accounting Standards Board, 2008, Financial Accounting Standards Board Statement
No. 161, Disclosures about derivative instruments and hedging activities (Financial
Accounting Standards Board, Norwalk, CT).
Financial Accounting Standards Board, 2010, Financial Accounting Standards Board Proposed
Standards Update, Accounting for financial instruments and revisions to the accounting
for derivative instruments and hedging activities (Financial Accounting Standards
Board, Norwalk, CT).
Financial Accounting Standards Board, 2011, Financial Accounting Standards Board Discussion
Paper, Selected issues about hedge accounting (Financial Accounting Standards Board,
Norwalk, CT).
Froot, K., S. Scharfstein, and J. Stein, 1993, Risk management: Coordinating corporate
investment and financing policies, The Journal of Finance, 48 (5), 1629-1658.
Gay, G.,and J. Nam, 1998, The underinvestment problem and corporate derivative use,
Financial Management, 27 (4), 53-69.
Geczy, C. C., B. A. Minton, and C. M. Schrand, 1997, Why firms use currency derivatives, The
Journal of Finance, 52 (4), 1323-1354.
Geczy, C. C., B. A. Minton, and C. M. Schrand, 2007, Taking a view: corporate speculation,
governance, and compensation, The Journal of Finance, 62 (5), 2405-2443.
Glaum, M., 2002, The determinants of selective exchange risk management – Evidence from
german non-financial corporations, Journal of Applied Corporate Finance, 14(4), 108-
121.
Glaum, M. and A. Klocker, 2011, Hedge accounting and its influence on financial hedging:
When the tail wags the dog, Accounting and Business Research, 41 (5), 1-31.
Graham, J. and C. Smith, 1999, Tax incentives to hedge, The Journal of Finance, 54 (6), 2241-
2262.
Guay, W. R., 1999, The impact of derivatives on firm risk: An empirical examination of new
derivative users, Journal of Accounting and Economics, 26 (1-3), 319-351.
Haushalter, G., 2000, Financing policy, basis risk, and corporate hedging: Evidence from oil
and gas producers, The Journal of Finance, 55 (1), 107-152.
47
Hentschel, L. and S.P. Kothari, 2001, Are corporations reducing or taking risks with derivatives?
The Journal of Financial and Quantitative Analysis, 36(1), 93-118.
Hirshleifer, J., 1975, Speculation and equilibrium: information, risk, and markets, The
Quarterly Journal of Economics, 89 (4), 519-542.
Hirshleifer, D. and S. H. Teoh, 2003, Limited attention, information disclosure, and financial
reporting, Journal of Accounting and Economics, 36 (1-3), 337-386.
Hirst, D. E. and P. E. Hopkins, 1998, Comprehensive income reporting and analysts‟ valuation
judgments, Journal of Accounting Research, 36 (Supplement), 47-75.
Hodder, L. D., P. E. Hopkins, and J. M. Wahlen, 2006, Risk-relevance of fair-value income
measures for commercial bank, The Accounting Review, 81 (2), 337-375.
Hughen, L., 2010, When do accounting earnings matter more than economic earnings?
Evidence from hedge accounting restatements, Journal of Business Finance and
Accounting, 37 (9&10), 1027-1056.
International Accounting Standards Board, 2010, Exposure Draft ED/2010/13, Hedge
Accounting (International Accounting Standards Board, London, UK).
International Accounting Standards Board, 2010, Basis for Conclusions and Illustrative
Examples Exposure Draft ED/2010/13, Hedge Accounting (International Accounting
Standards Board, London, UK).
Iqbal, M. J. and S. Z. A. Shah, 2012, Determinants of systematic risk, The Journal of Commerce,
4 (1), 47-56.
Jin, Y. and P. Jorion, 2006, Firm value and hedging: Evidence from U.S. oil and gas producers,
The Journal of Finance, 61 (2), 893-919.
Johnson, L. L., 1960, The theory of hedging and speculation in commodity futures, The Review
of Economic Studies, 27 (3), 139-151.
Jones, D. A. and K. J. Smith, 2011, Comparing the value relevance, predictive value and
persistence of other comprehensive income and special items, The Accounting Review,
86 (6), 2047-2073.
Kanagaretnam, K., R. Mathieu, and M. Shehata, 2009, Usefulness of comprehensive income
reporting in Canada, Journal of Accounting and Public Policy, 28 (4), 349-365.
Kanodia, C., 1999, Discussion of “comparing alternative hedge accounting standards:
Shareholders‟ perspective”, Review of Accounting Studies, 4 (3-4), 293-297.

48
Kanodia, C., A. Mukherji, H. Sapra, and R. Venugopalan, 2000, Hedge disclosures, future
prices, and production distortions, 38 (Supplement), 53-82.
Koonce, L., M. Lipe and M. McAnally, 2005, Judging the risk of financial instruments:
Problems and potential remedies, The Accounting Review, 80 (3), 871-895.
Lang, M., K.V. Lins and M. Maffett, 2012, Transparency, liquidity and valuation: international
evidence on when transparency matters most, Journal of Accounting Research, 50(3),
729-774.
Lins, K., H. Servaes and A. Tamayo, 2011, Does fair value reporting affect risk management?
international survey evidence, Financial Management, 40 (3), 525-551.
Liu, Z., G. Seow, and H. Xie, 2011, Does the hedge ineffectiveness measured under sfas 133
capture the economic ineffectiveness of a firm‟s hedging activities?, Working Paper.
Maines, L. A. and L. S. McDaniel, 2000, Effects of comprehensive-income characteristics on
nonprofessional investors‟ judgments: the role of financial-statement presentation
format, The Accounting Review, 75(2), 179-207.
Melumad, N., G. Weyns, and A. Ziv, 1999, Comparing alternative hedge accounting standards:
Shareholders‟ perspective, Review of Accounting Studies, 4 (3-4), 265-292.
Mendenhall, R. and W. Nichols, 1988, Bad news and differential market reactions to the
announcement of earlier-quarters versus fourth-quarter earnings, Journal of Accounting
Research, 26 (Supplement), 63-86.
Minton, B. A., C. Schrand, 1999, The impact of cash flow volatility on discretionary investment
and the costs of debt and equity financing, Journal of Financial Economics, 54 (3), 423-
460.
Mian, S., 1996, Evidence on corporate hedging policy, Journal of Financial and Quantitative
Analysis, 31 (3), 419-439.
Petersen, M. A., 2009, Estimating standard errors in finance panel data sets: comparing
approaches, The Review of Financial Studies, 22 (1), 435-480.
Sapra, H., 2002, Do mandatory hedge disclosures discourage or encourage excessive
speculation?, Journal of Accounting Research, 40 (3), 933-964.
Smith, C., R. Stulz, 1985, The determinants of firms‟ hedging policies, Journal of Financial and
Quantitative Analysis, 20 (4), 391-405.
Stulz, R., 1984, Optimal hedging policies, Journal of Financial and Quantitative Analysis, 19 (2),
127-140.
49
Stulz, R., 1996, Rethinking risk management, Journal of Applied Corporate Finance, 9 (3), 8-24.
Tufano, P., 1996, Who manages risk? an empirical examination of risk management practices in
the gold mining industry, The Journal of Finance, 51 (4), 1097-1137.
Tufano, P., 1998, Agency costs of corporate risk management, Financial Management, 27 (1), 67-
77.
Venkatachalam, M., 1996, Value-relevance of banks‟ derivatives disclosures, Journal of
Accounting Economics, 22 (1-3), 327-355.
Wong, M. H. F., 2000, The association between sfas no. 119 derivatives disclosures and the
foreign exchange risk exposure of manufacturing firms, Journal of Accounting Research,
38 (2), 387-417.
Zhang, H., 2009, Effect of derivative accounting rules on corporate risk-management behavior,
Journal of Accounting and Economics, 47 (3), 244-264.
Zhang, X. F., 2006, Information uncertainty and stock returns, The Journal of Finance, 61 (1),
105-137.
Zhang, X. F., 2010, The effect of high-frequency trading on stock volatility and price discovery,
Yale University Working Paper.
Related Documents