Working Paper 480 March 2018 Does Deforestation Increase Malaria Prevalence? Evidence from Satellite Data and Health Surveys Abstract Deforestation has been found to increase malaria risk in some settings, while a growing number of studies have found that deforestation increases malaria prevalence in humans, suggesting that in some cases forest conservation might belong in a portfolio of anti-malarial interventions. However, previous studies of deforestation and malaria prevalence were based on a small number of countries and observations, commonly using cross-sectional analyses of less-than-ideal forest data at the aggregate jurisdictional level. In this paper we combine 14 years of high-resolution satellite data on forest loss with individual-level survey data on malaria in more than 60,000 rural children in 17 countries in Africa, and fever in more than 470,000 rural children in 41 countries in Latin America, Africa, and Asia. Adhering to methods that we pre-specified in a pre-analysis plan, we tested ex-ante hypotheses derived from previous literature. We did not find that deforestation increased malaria prevalence nor that intermediate levels of forest cover had higher malaria prevalence. Our findings differ from most previous empirical studies, which found deforestation to be associated with greater malaria prevalence in other contexts. We speculate that this difference may be because deforestation in Africa is largely driven by the slow expansion of subsistence or smallholder agriculture for domestic use by long-time residents in stable socio-economic settings rather than by rapid clearing for market-driven agricultural exports by new frontier migrants as in Latin America and Asia. Our results imply that at least in Africa anti-malarial efforts should focus on other proven interventions such as bed nets, spraying, and housing improvements. Forest conservation efforts should focus on securing other benefits of forests, including carbon storage, biodiversity habitat, clean water provision, and other goods and services. www.cgdev.org Sebastian Bauhoff and Jonah Busch Keywords: Africa, pre-analysis plan, public health, Sustainable Development Goals JEL: C21, C23, I18, Q23

Welcome message from author
This document is posted to help you gain knowledge. Please leave a comment to let me know what you think about it! Share it to your friends and learn new things together.
Transcript
Working Paper 480 March 2018
Does Deforestation Increase Malaria Prevalence? Evidence from Satellite Data and Health Surveys
Abstract
Deforestation has been found to increase malaria risk in some settings, while a growing number of studies have found that deforestation increases malaria prevalence in humans, suggesting that in some cases forest conservation might belong in a portfolio of anti-malarial interventions. However, previous studies of deforestation and malaria prevalence were based on a small number of countries and observations, commonly using cross-sectional analyses of less-than-ideal forest data at the aggregate jurisdictional level. In this paper we combine 14 years of high-resolution satellite data on forest loss with individual-level survey data on malaria in more than 60,000 rural children in 17 countries in Africa, and fever in more than 470,000 rural children in 41 countries in Latin America, Africa, and Asia. Adhering to methods that we pre-specified in a pre-analysis plan, we tested ex-ante hypotheses derived from previous literature. We did not find that deforestation increased malaria prevalence nor that intermediate levels of forest cover had higher malaria prevalence. Our findings differ from most previous empirical studies, which found deforestation to be associated with greater malaria prevalence in other contexts. We speculate that this difference may be because deforestation in Africa is largely driven by the slow expansion of subsistence or smallholder agriculture for domestic use by long-time residents in stable socio-economic settings rather than by rapid clearing for market-driven agricultural exports by new frontier migrants as in Latin America and Asia. Our results imply that at least in Africa anti-malarial efforts should focus on other proven interventions such as bed nets, spraying, and housing improvements. Forest conservation efforts should focus on securing other benefits of forests, including carbon storage, biodiversity habitat, clean water provision, and other goods and services.
www.cgdev.org
Sebastian Bauhoff and Jonah Busch
Keywords: Africa, pre-analysis plan, public health, Sustainable Development Goals
JEL: C21, C23, I18, Q23
Center for Global Development2055 L Street NW
Washington, DC 20036
202.416.4000(f) 202.416.4050
www.cgdev.org
The Center for Global Development is an independent, nonprofit policy research organization dedicated to reducing global poverty and inequality and to making globalization work for the poor. Use and dissemination of this Working Paper is encouraged; however, reproduced copies may not be used for commercial purposes. Further usage is permitted under the terms of the Creative Commons License.
The views expressed in CGD Working Papers are those of the authors and should not be attributed to the board of directors, funders of the Center for Global Development, or the authors’ respective organizations.
Does Deforestation Increase Malaria Prevalence? Evidence from Satellite Data and Health Surveys
Sebastian BauhoffCenter for Global Development
Jonah BuschCenter for Global Development
Conversations with Matt Collin and Theo Talbot led to the concept for this paper. We thank Roxanne Oroxom, Jared Kalow, and Jens Engelmann for research assistance. We thank Mead Over and another reviewer, Derek Willis, and colleagues at Center for Global Development for helpful feedback.
The Center for Global Development is grateful for contributions from the Norwegian Agency for Development Cooperation in support of this work.
Sebastian Bauhoff and Jonah Busch, 2018. “Does Deforestation Increase Malaria Prevalence? Evidence from Satellite Data and Health Surveys.” CGD Working Paper 480. Washington, DC: Center for Global Development. https://www.cgdev.org/publication/does-deforestation-increase-malaria-prevalence-evidence-satellite-data-and-health
Contents
Introduction ...................................................................................................................................... 1
Methods ............................................................................................................................................. 4
Data ................................................................................................................................................ 4
Econometric model ..................................................................................................................... 9
Pre-analysis plan ........................................................................................................................... 9
Results .............................................................................................................................................. 10
Discussion........................................................................................................................................ 12
Conclusion ....................................................................................................................................... 14
References ........................................................................................................................................ 16
Figures and tables ........................................................................................................................... 21
1
Introduction
Malaria incidence fell by 41 percent globally between 2000 and 2015 (WHO, 2016). Yet malaria remains a substantial health burden in many low- and middle-income countries, with 212 million cases and 429,000 deaths worldwide in 2015 (WHO, 2016). This public health burden motivates the need for research on effective and cost-effective anti-malarial interventions. Proven anti-malarial interventions include insecticide-treated bed nets, indoor residual spraying, and prompt clinical treatment (Bhatt et al., 2015), as well as environmental management (e.g., drainage and canal lining) and modified human habitation (e.g., house siting and design) (Keiser et al., 2006).
The loss of natural forest cover (“deforestation”) has been found to increase the density of malaria-transmitting mosquitoes and increase malaria risk in some settings (e.g., Vittor et al., 2009), suggesting that in some circumstances forest conservation might belong in a portfolio of anti-malaria interventions. However, research is needed to establish whether and when deforestation increases the proportion of people with malaria (“prevalence”), and whether and when forest conservation would be a cost-effective anti-malarial strategy relative to other interventions.
Deforestation has been found to lead to heightened malaria risk through both ecological and socio-economic mechanisms. Relative to forests, deforested lands have higher temperatures (Lindblade, 2000), more sunlight (Yasuoka and Levins, 2007), and more standing water (Patz et al., 2000), resulting in accelerated life cycles (Afrane et al., 2005), faster pupation and growth rates (Munga et al., 2006), longer survival time (Zhong et al., 2016), and higher biting rates (Petney, 2001; Vittor et al., 2006) of malaria-transmitting mosquitoes. Relative to forests, cleared lands also have fewer insectivores, more species competing for ecological niche, and arguably fewer “dead-end hosts” to dilute malaria (LaPorta et al., 2013, Wood et al., 2014). Additionally, “frontier malaria” can result from unstable socio-economic conditions commonly associated with deforestation, including rapid in-migration, new human exposure (e.g., Friedrich, 2016) and low immunity, poor housing quality, and sparse availability of health services, (de Castro et al., 2006). Singer and de Castro (2006) suggest that these “frontier malaria” effects last for 6-8 years.
There is heterogeneity in the strength and direction of these effects. Different regions have different dominant Anopheles mosquito species (Kiszewski et al., 2004) and deforested areas may be favored by some mosquito species but not others (Kar et al., 2014; Burkett-Cadena and Vittor, 2017). Deforestation is canonically considered to lead to an increase in malaria-transmitting mosquitoes in Africa and Latin America but a decrease in Asia (Guerra et al., 2006). Small clearings can increase malaria by producing land cover more hospitable to larvae, while large clear cuts can decrease larvae (Singer and de Castro, 2006). While primary forest might suppress mosquitoes, secondary regrowth might encourage them (Vittor et al., 2009). And early stages of frontier settlement can have larger effects than later stages (de Castro et al., 2006; Baeza et al., 2017). All of which is to say, “the linkage between deforestation…and malaria transmission is a subtle process requiring analysis at several temporal and spatial scales” (Singer and de Castro, 2006). A recent systematic review of studies of deforestation and malaria risk in the Brazilian Amazon “failed to find

2
overwhelming evidence supporting a consistent simple and straightforward relationship between forests, deforestation rate, and malaria” (Tucker Lima et al., 2017).
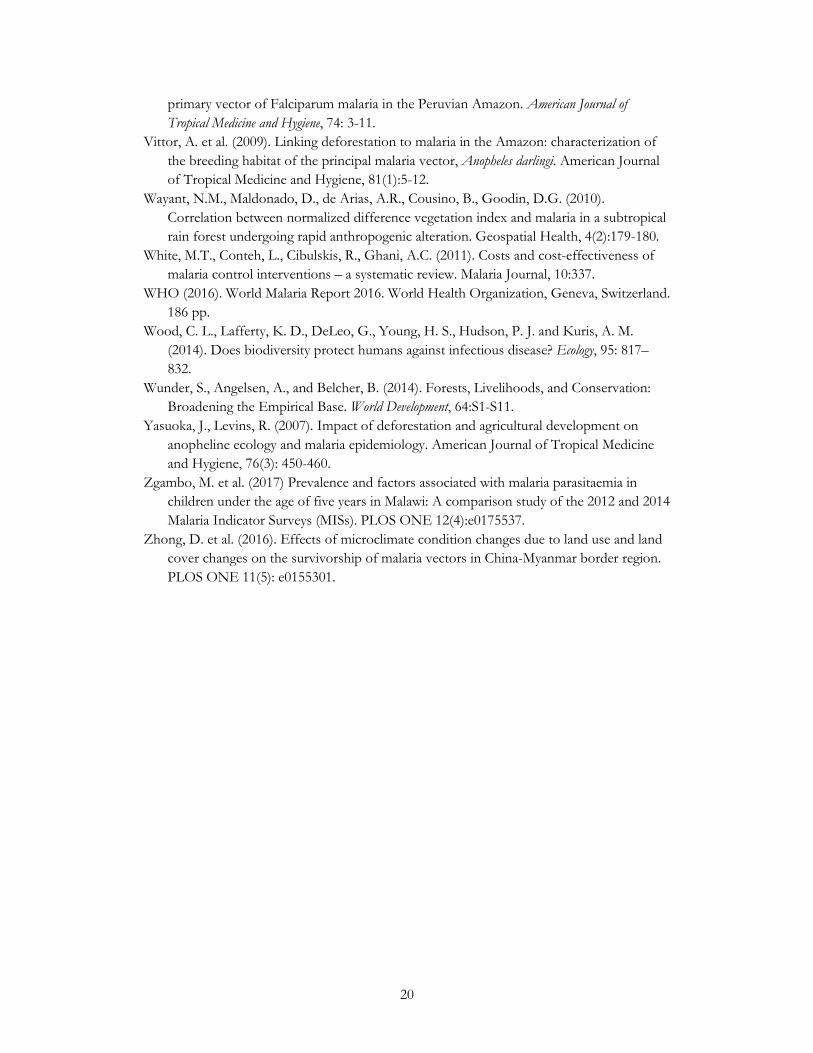
Furthermore, many other factors besides deforestation affect malaria prevalence in humans. Climatic variables that influence malaria include temperature, precipitation (Beck-Johnson et al., 2013, Mordecai et al., 2013; Parham and Michael, 2010), and seasonality (Hay et al., 1998). Demographically, children under five are more vulnerable to malaria than adults and suffer more than two-thirds of deaths from malaria (WHO, 2016). Differential access to health facilities means that malaria prevalence may be higher in areas that are poor or remote—two factors that more often than not are also correlated with higher forest cover and lower deforestation rates (Busch and Ferretti-Gallon, 2017). And people can engage in avoidance behaviors such as installing bed nets and window screens, reducing standing water, and spraying to repel mosquitoes. Thus, even though there are established ecological and socio-economic links between deforestation and malaria mosquito incidence and transmission, ecological nuance and human mediating factors mean that lower rates of deforestation might not always lead to lower malaria prevalence in humans in practice. We present a conceptual model of the coupled human and natural system of deforestation and malaria in Figure 1.
A recent strand of empirical literature has tested the hypothesis that deforestation increases malaria prevalence in humans using multivariate econometric tests (Wayant et al., 2010; Pattanayak et al., 2010; Olson et al., 2010; Valle and Clark, 2013; Hahn et al., 2014a; Garg, 2014; Terrazas et al., 2015; Fornace et al., 2016; Austin et al., 2017). Seven of these studies (including two studies not yet published in peer-reviewed literature) found a positive relationship, while one found no relationship (Hahn et al., 2014a) and one found a negative relationship (Valle and Clark, 2013, but see also Hahn et al. (2014b) and Valle (2014)) (Table 1).
However, these previous empirical studies of deforestation and malaria prevalence had several limitations. First, their geographic evidence base is narrow. Six of the nine studies were from either Brazil (n=4) or Indonesia (n=2), with one from Paraguay, one from Malaysia, and one cross-national study that compared national-level data across 67 countries. We are not aware of any empirical study of deforestation and malaria prevalence from Africa, where 88 percent of malaria cases occur (WHO, 2016) and where the pattern of patchy clearing by long-established smallholders differs from the large-scale clearing for industrial agriculture by recent migrants found elsewhere (Fisher, 2010). Second, the measures of forest loss used in many of these studies are less than ideal. Other than the 4 studies from Brazil that used high-resolution PRODES-Landsat data (Olson et al., 2010; Hahn et al., 2014a; Valle and Clark, 2013; Terrazas et al., 2015), the remaining studies relied on MODIS data (which relative to Landsat data has coarser spatial resolution (500 m) and is better for rapidly monitoring the occurrence of deforestation events than measuring the area of deforestation (Goetz et al., 2014)), NDVI (which measures vegetation greenness rather than forest cover), or self-reported national rates of deforestation (which are error-prone (Grainger, 2008)). Third, all but one study (Pattanayak, 2010) used data aggregated to the level of jurisdictions, rather than grid-cell-level data on deforestation and individual-level data on malaria. Spatially aggregated data is potentially prone to the ecological fallacy
3
(Piantadosi, 1988) or unmeasured confounding factors. One study of aggregated malaria survey data concluded that “it is not clear…that meaningful results can be obtained when survey data are highly aggregated; researchers…should asses the feasibility of disaggregating existing survey data” (Comfort et al., 2017). Fourth, the number of observations in previous studies is small, with fewer than 1000 observations in all but one study and fewer than 100 observations in three studies. Fifth, all but one previous study (Garg, 2014) is cross-sectional, which has the limitation of being unable to fully control for confounding unobserved time-invariant geographic variables that might be correlated with both deforestation and malaria.
The primary goal of this paper was to test ex ante hypotheses derived from previous literature: that malaria prevalence in humans is higher where deforestation is highest, and where forest cover is intermediate (de Castro et al., 2006), controlling for other factors using a multivariate regression analysis. In doing so we make a number of advances on previous empirical studies of deforestation and malaria prevalence. Our study explores previously unstudied geographic regions by examining data from malaria tests from 17 countries in Africa and data on fever from 41 countries across Latin America, Africa, and Asia. We used the most accurate data set for measuring forest cover and deforestation over large scales—30-meter resolution Landsat. We used granular data on malaria in individual children and deforestation at the local grid-cell level (roughly 5.5 kilometers squared at the equator), rather than examining effects at the aggregate jurisdictional level. Our sample size (n~60,000 individuals for malaria and n~470,000 individuals for fever) was considerably larger than most previous studies, allowing more degrees of freedom to conduct more sophisticated tests. And because our data contained some locations with repeat surveys in the same communities, we were able to supplement a core cross-sectional analysis with a panel analysis with geographic fixed effects.
Secondarily, we tested several other ex ante hypotheses derived from the literature related to disaggregation: that the effect of deforestation on malaria is greater in Latin America and Africa than Asia (Guerra et al., 2006); greater for smaller than larger cut sizes (Singer and de Castro, 2006); and greater at earlier stages of a forest transition (de Castro et al., 2006). We also tested the ex ante hypothesis that the effect of deforestation on malaria diminishes after about seven years (Singer and de Castro, 2006).
Initially, a third goal of this paper was to assess the cost-effectiveness of forest conservation as an anti-malarial intervention relative to other widely used interventions. We had planned to use the results of the multi-variate regression analysis to perform back-of-envelope calculations of avoided loss of disability-adjusted life-years (DALY) per dollar spent on forest conservation. We then planned to compare this estimate of cost-effectiveness to other common malaria interventions such as intermittent preventive treatment ($24/DALY), insecticide treated bed nets ($27/DALY) and indoor residual spraying ($143/DALY) (White et al., 2011). If forest conversation were comparable in cost-effectiveness to bed nets and spraying, this would suggest that the public health community should actively promote including forest conservation within a portfolio of interventions. If effective but not-cost-effective, they might still understand the anti-malarial value of forest conservation but view it only as a positive co-benefit of actions taken by others for other reasons. However, we were unable to carry out cost-effectiveness analyses for reasons explained below. We had also
4
planned to test whether the effect of deforestation on malaria is mediated through housing quality, water source, or access to health services, but were also unable to do so for reasons explained below.
This paper contributes to literature on the effectiveness and cost-effectiveness of malaria prevention measures (e.g., Keiser et al., 2006; White et al., 2011; Bhatt et al., 2015). More broadly it contributes to literatures quantifying the benefits and costs of forests and deforestation to health (eg Myers 2013; Rulli et al., 2017) including zoonoses (Gottwalt, 2015), as well as other development goals such as climate (Seymour and Busch, 2016), biodiversity (Lewis et al., 2015), poverty alleviation (Wunder et al., 2014), agriculture (Lawrence and Vandecar, 2014), and energy (eg Stickler et al., 2013).
We contribute to the trend toward ensuring the credibility of empirical results in economics by writing and adhering to a pre-analysis plan, as described further below.
Methods
Data
We obtained three indicators of malaria in children from the United States Agency for International Development’s Demographic and Health Survey Program, which includes both Demographic and Health Surveys and Malaria Indicator Surveys, all of which followed the same sampling protocol. Our primary dependent variable was the binary presence or absence of malaria in individual children under the age five. This measure was obtained from rapid diagnostic tests (“rapid tests”), which detect parasite antigens rather than actual parasites (Florey, 2014). They are relatively simple, requiring only a single drop of blood and do not require skilled technicians or access to laboratory equipment (Florey, 2014). However, rapid tests are prone to false positives (Kiemde et al., 2017), for example several weeks after the treatment of recent infections (Florey, 2014).
As a secondary dependent variable we used lab microscopy tests (“lab tests”) from the same suite of surveys. In this process blood smears are taken to laboratories to test for the presence or absence of malaria parasites; this process is often complicated under field conditions and can be more expensive than rapid tests (Florey, 2014). Given that it is not clear that the results of either rapid tests or lab tests are better than the other, we pre-specified rapid tests as our primary dependent variable rather than lab tests because the number of surveys that included this indicator was higher. Rapid tests were more frequently positive than lab microscopy tests in our data as they were in Florey (2014). Furthermore the two malaria tests were relatively well correlated in our data (r=0.58; Table 3) as they were in Florey (2014).
As a third dependent variable we used binary self-reported fever (“fever”) in the last two weeks. Results from malaria tests and fever may differ because there is a lag of up to two weeks between the fever onset and the blood tests, because many cases of fever are caused by something other than malaria (Mayxay et al., 2013, Kiemde et al., 2017), and because recall may be flawed. There is probably a positive and not-by-chance-alone correlation
5
between reported fever and rapid test results (Okiro and Snow, 2010), but this correlation is noisy and varies by country (eg Mayxay et al., 2013). Indeed, in our data fever is only weakly correlated with rapid tests (r=0.15) and lab tests (r=0.09). While fever is likely not a highly reliable proxy for malaria, it is still weakly correlated with malaria prevalence and was surveyed much more broadly, so we report results on this dependent variable as well.
Finally, in a single sensitivity analysis we included as a dependent variable mortality in children under one year of age. This variable does not distinguish the cause of death, but some substantial fraction are likely from malaria. Young children in particular are at high risk of malaria and more than two-thirds of malaria deaths occur in this group (WHO, 2016). We tested the relationship between deforestation and mortality to gain insight into whether ignoring malaria-related deaths that occurred before the interview date may have caused us to inadvertently underestimate the effect of deforestation on malaria prevalence.
Our candidate pool was all national surveys conducted under the auspices the Demographic and Health Surveys Program of the United States Agency for International Development (n~400; DHS, 2017b). These included both Demographic and Health Surveys, which asked about many development indicators, and Malaria Indicator Surveys, which were specific to malaria. These surveys were executed by an implementing agency within a host country, typically a national statistical agency. The countries and years for which surveys were conducted on malaria were not randomly selected. Rather, our sample of surveys was probably biased toward both places with higher levels of malaria (since Malaria Indicator Surveys were targeted to malaria-infected countries by design) and times with higher levels of malaria (since “the [Malaria Indicator Surveys are] usually timed to correspond with the high malaria transmission season.” (DHS, 2017c).
We restricted the scope of our study to surveys from countries in Latin America/Caribbean, Sub-Saharan Africa, and South and Southeast Asia. We then limited the study to surveys that gathered observations between 2001 and 2014—the period for which temperature and precipitation data were available. We dropped those 2014 surveys that gathered some observations in 2015 for which we did not have temperature data. We further restricted the scope to rural areas, following the rural/urban binary coding used in the surveys. These scope restrictions resulted in 60,305 respondents from 23 surveys in 17 countries for rapid tests; 56,883 respondents from 22 surveys in 17 countries for lab tests; and 469,539 respondents from 90 surveys in 41 countries for fever (Table 4), of which 79 surveys were Demographic and Health Surveys and 11 were Malaria Indicator Surveys. A subset of the surveys constituted a panel; that is, they collected data from within the same geographic cell at multiple points in time.
Respondents’ locations were geo-located by the original surveys. In order to preserve respondent confidentiality, the Demographic and Health Surveys administrators added random positional errors of 0-5 kilometers to 99 percent of rural clusters and random positional errors of 0-10 kilometers to 1 percent of rural clusters, within the country and survey region (DHS, 2017a). Surveys were designed to be representative of the national population or particular subsets including rural populations, after appropriate sample weights are applied; see more below on weighting.
6
Our independent variables of interest were forest cover and deforestation near the interview location. Both variables were obtained from a recent data set that was derived from satellite measurements (Hansen, 2013) and extended through 2015 (GFW, 2015). The data was spatially explicit at 30-meter resolution, applied spatially consistent methods across the entire globe, and applied temporally consistent methods from 2001-2014. The deforestation measure includes all loss of tree cover, including natural forests as well as plantations and gardens, and both anthropogenic clearing as well as natural causes such as fires. The measure of deforestation is gross rather than net; that is, it does not include forest gain. The Hansen et al. (2013) study also included a measure of forest gain, but this data set is unreliable for our purposes—as cautioned by Tyukavina et al. (2014), forest gain in the Hansen et al. (2013) data set includes only those lands that experienced a transition from non-forest to forest between 2001-2012; it does not capture regrowing forests that had not yet reached 5 meters in height by 2012, nor growth within forests that were established before 2000. Deforestation was measured annually 2001-2015, but we only used 2001-2014 because data on temperature and precipitation were available only through 2014. Forest cover was collected only for the year 2000. We approximated forest cover in a particular year by subtracting deforestation since 2000 from forest cover in the year 2000; this is an underestimate of actual forest cover because it does not account for regrowth.
We aggregated forest cover and forest-cover loss to cells that are 0.05 degrees on a side (~5.5 km at the equator) by updating the 2001-2012 data prepared by Busch and Engelmann (2017) through 2014 using the same methods. Both forest measures were fractional: deforestation was measured as the area of forest loss in the year as a fraction of cell area; forest cover was measured as the area of forest cover in the year as a fraction of cell area. Although aggregating forest cover and forest-cover loss to the grid-cell scale has the drawback of losing hyper-local information on deforestation associated with 30-meter satellite data, it has several advantages too. The aggregated scale is arguably more relevant for malaria transmission and forest cover change: the maximum flight distance of Anopheles mosquitoes is 3-10 km (Kaufmann and Briegel, 2004) while the flight range of a mosquito is typically 2-5 kilometers, thus deforestation in the local neighborhood may be a better indicator of malaria risk than just at the immediate point. To the extent that nearby observations may be spatially autocorrelated due to mosquitoes transmitting malaria between children included in surveys, these effects would be subsumed within the cell. The aggregated scale is also appropriate given the random positional errors of 0-5 km that were deliberately added to survey locations.
We included both forest cover and forest-cover squared as independent variables in our model, as we sought to differentiate between two distinct, though related, hypotheses derived from previous literature: first, that the highest risk of malaria is at intermediate levels of forest cover (e.g., de Castro et al., 2006), and second, that deforestation increases the risk of malaria (e.g., Vittor et al. 2009). As sensitivity analyses we examined models that included only deforestation; only deforestation and forest cover; and only forest cover and forest-cover squared. Four previous studies included both forest cover and deforestation as explanatory variables (Valle and Clark 2013; Hahn et al. 2014a; Terrazas et al. 2015; Fornace et al. 2016), though none also included forest-cover squared.
7
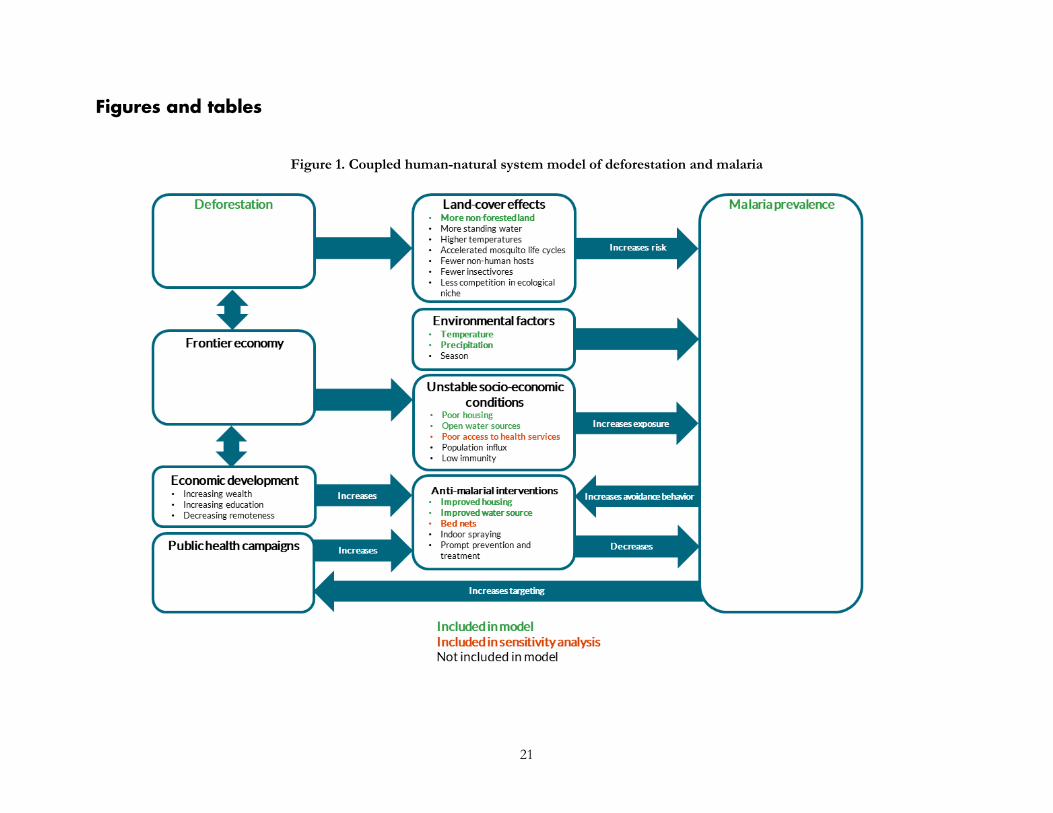
Both deforestation and forest cover were negatively correlated with illness-related dependent variables (malaria in rapid tests; malaria in lab tests; fever), though weakly so (-0.10<r<0) (Table 3). Heat maps of the relationship between forest cover, deforestation, and illness-related dependent variables did not show any clear pattern (Figure 2).
However, these simple first-order analyses could be biased if they do not control for the influence of other confounding variables that are correlated with deforestation and influence malaria prevalence. So, we turned next to multivariate regressions. We partially addressed potential omitted variables bias by including observable confounding variables in cross-sectional regressions. However, this could still leave out unobservable confounding variable. We addressed time-invariant, spatially variant unobservable variables in panel regressions, though this comes at a cost to sample size. We considered an instrumental variable approach using variables that were plausibly correlated with deforestation but not with malaria (e.g., agricultural prices), but we decided to reserve such an approach for future work.
We sought to control for the influence of other variables known to have a direct effect on the likelihood a subject would have malaria (Figure 1). Because malaria risk varies with weather, we included temperature and precipitation during the month of the interview as control variables. We considered one month to be a reasonable time interval as this corresponds roughly to the 2-4 week life cycle of an Anopheles mosquito (CDC, 2015). We included squared terms for both temperature and precipitation, as literature suggests malaria risk is highest at intermediate values of these variables (Beck-Johnson et al., 2013, Mordecai et al., 2013; Parham and Michael, 2010). Malaria also varies based on season, as does the timing of surveys: DHS surveys that collect biomarkers are generally fielded shortly after the rainy season when malaria risk is highest, whereas non-biomarker surveys are fielded in the dry season for logistical reasons (Measure Evaluation, 2013). We did not attempt to code season directly across many countries, though temperature and precipitation variables capture some aspects of seasonality.
Housing quality also affects malaria exposure (Tusting et al., 2015). As a proxy for housing quality we included floor type as a control variable. We constructed a binary code of whether the floor type of the house was unfinished (e.g., clay, mud, or sand) or finished (e.g., brick, cement, or tile). We selected floor type as the proxy for housing quality because all surveys asked about floor type whereas more than 20 surveys did not ask about wall or roof type. As a sensitivity analysis we replaced floor type as a control variable with an index of housing quality constructed by summing three binary measures of whether the floor, walls, and roof of the house were unfinished or finished. For example, we coded bamboo, thatch, and wood walls as unfinished and concrete, metal, and stone walls as finished; we coded canvas, palm, and straw roofs as unfinished and asbestos, shingles, and tin roofs as finished. For a list of how we coded all constructed variables see Table 2 of our pre-analysis plan.
Proximity to standing water affects exposure to malaria-transmitting mosquitoes (Patz et al., 2001). Thus we constructed and included a binary variable for whether the household’s water source was open (e.g., well, spring, pond) or piped or delivered (e.g., tap, bottled, tanker truck).

8
A child’s age affects their exposure and risk of malaria; for example older children had greater malaria prevalence in Malawi (Zgambo et al., 2017), which that study’s authors attributed to older children’s greater independence and time spent outdoors during evening hours. We included as a control variable the child’s age as a binary variable for each year between zero and four to allow for potential non-linear effects. Malaria biomarkers can linger in the bloodstream and malaria test results could potentially reflect exposure to malaria in months or years prior to the survey. Thus, to look only at malaria prevalence during the period of deforestation, we conducted a sensitivity analysis by including only children of age zero.
Households may adapt to increased environmental health risks by engaging in avoidance behavior (e.g., Moretti and Neidell, 2011). In the case of malaria, households may reduce their exposure to malaria-transmitting mosquitoes by installing insecticide-treated bed nets, which are considered an effective malaria prevention measure (Lengeler, 2014; Bhatt et al., 2015). We constructed a binary variable for whether the survey respondents stated that “some or all children slept under a bed net last night.” Because not all surveys asked about bed net usage, we included bed net usage only in a sensitivity analysis. Households at higher risk of malaria may be more likely to undertake avoidance behavior by installing bed nets; thus without considering avoidance behavior the coefficient on the effect of forest loss on malaria may underestimate the full effect.
Access to local health services affects malaria. We constructed a binary indicator with the value of 1 if the child was delivered in a health facility (e.g., private, government, or NGO) and 0 if delivered at home or with a traditional birth attendant or midwife. We considered this to be a good proxy indicator for the availability of local health services because birth has been universally experienced by children under 5 and we assumed that birth in a facility universally indicated better access to health services. Alternative proxy indicators such as “child has received other vaccinations,” were potentially less useful because recommended vaccines vary by country, some children may be too young to have received vaccines, and there could be a selection effect to vaccination campaigns, meaning that having been vaccinated might indicate either having better access to health services or living in an area with higher health risk. Because not all surveys asked about place of delivery, we included access to health services only in a sensitivity analysis.
We considered but did not include several control variables (e.g., wealth, education, remoteness) that, while likely correlated with malaria prevalence (e.g., Austin et al., 2017), should influence malaria transmission only through one of the direct channels above rather than directly (see Figure 1). There were also several variables hypothesized to directly affect malaria that we would have liked to include but for which data was not available. These included indoor spraying (e.g., Over et al., 2004) and population influx (see Figure 1).
We restricted the scope of our analysis to those observations for which data was available for all variables; that is we dropped observations lacking data for one or more variables.
9
Econometric model
Our primary econometric model was a spatially explicit cross-sectional logit model. That is:
Pr(𝑦𝑦𝑖𝑖𝑖𝑖𝑖𝑖 = 1|𝑿𝑿) = 𝑒𝑒𝛽𝛽𝑿𝑿𝑖𝑖𝑖𝑖𝑖𝑖/(1 + 𝑒𝑒𝛽𝛽𝑿𝑿𝑖𝑖𝑖𝑖𝑖𝑖)
where
𝛽𝛽𝑿𝑿𝑖𝑖𝑖𝑖𝑖𝑖 = 𝛼𝛼 + 𝛽𝛽1𝐹𝐹𝐹𝐹𝐹𝐹𝑒𝑒𝐹𝐹𝐹𝐹𝑖𝑖𝑖𝑖 + 𝛽𝛽2𝐹𝐹𝐹𝐹𝐹𝐹𝑒𝑒𝐹𝐹𝐹𝐹2𝑖𝑖𝑖𝑖 + 𝛽𝛽3𝐷𝐷𝑒𝑒𝐷𝐷𝐹𝐹𝐹𝐹𝑒𝑒𝐹𝐹𝐹𝐹𝐷𝐷𝐹𝐹𝐷𝐷𝐹𝐹𝐷𝐷𝑖𝑖𝑖𝑖 + 𝑪𝑪𝑪𝑪𝑪𝑪𝑪𝑪𝑪𝑪𝑪𝑪𝑪𝑪𝑪𝑪𝑪𝑪𝑪𝑪𝑪𝑪𝒊𝒊𝑪𝑪′𝛽𝛽4+ 𝑆𝑆𝑆𝑆𝐹𝐹𝑆𝑆𝑒𝑒𝑦𝑦𝑖𝑖𝑖𝑖 + 𝜀𝜀𝑖𝑖
Here, 𝑦𝑦𝑖𝑖𝑖𝑖𝑖𝑖 is the binary health outcome for child i in grid cell c at interview time t. Forest is the forest area in the year of time t and Deforestation is forest loss between the year of time t-1 and the year of time t. Covariates include weather, household, and child covariates: temperature and temperature squared in the month of time t; precipitation and precipitation squared in the month of time t; floor type; water source; and child age. In sensitivity analyses, additional covariates included place of delivery, bed net usage, wall type, and roof type. We included survey-specific dummy variables, e.g.,, for “Liberia 2009” and “Liberia 2011”. We clustered standard errors at the level of the forest grid cell because the exposures (forest cover and forest-cover change) were common to all children within a grid cell. In one sensitivity analysis we clustered standard errors at the level of DHS primary sampling units. In another sensitivity analysis we used an ordinary least squares (OLS) model rather than logit.
We weighted the observations in our sample to be representative of the rural population across the set of countries and years for which surveys were conducted. In one sensitivity analysis we rescaled the weights so that each survey counted equally; in another we used unweighted observations so that each observation counted equally.
Cross-sectional analyses of deforestation and malaria, including ours, face the challenge that observed variables may not fully control for all geographical differences that may be correlated with deforestation and affect malaria risk across sites, potentially introducing bias to estimates. In an attempt to address this issue we supplemented our cross-sectional analysis with a panel analysis that controlled for both observable and unobservable differences in malaria risk across sites. In the panel analyses we applied grid-cell level fixed effects in addition to survey-specific fixed effects in an OLS model. The panel specification would in theory be preferable to the pooled cross-sectional specification were it not for its small sample size. Out of 90 surveys, only two surveys collected repeat data from sites in the same grid cells for malaria rapid tests; two surveys collected repeat data from the same grid cells for malaria lab tests; and 19 surveys collected repeat data from the same grid cells for fever.
Pre-analysis plan
Like many other analyses, this analysis required choosing among many possible defensible model specifications and variables to include. In principle, we could have tested many permutations and chosen to present a combination of model specifications and included
10
variables that yielded a result that was statistically significant, or had a particular effect direction, while not reporting on many other tests conducted (“data mining”; “p-hacking”) (Olken, 2015). Ensuring the credibility of the analysis is especially relevant when testing a hypothesis prone to controversy, as in the case of deforestation and malaria (see for example Valle and Clark, 2013, Hahn et al., 2014b, Valle, 2014).
We sought to enhance the credibility of our analysis in two ways. First, prior to conducting any analyses, we pre-selected model specification and included variables based on explicit ex ante hypotheses grounded in previous literature and our understanding of the coupled human-natural system rather than based on an exploration of our data. Second, we wrote and adhered to a pre-analysis plan,1 in which all analyses to be undertaken in the study were specified in writing in advance. Pre-analyses plans are common and even required in some clinical research, but are uncommon and new in social science research including economics (see Miguel, 2014; Coffman and Niederle, 2015; Olken, 2015). Pre-analysis plans impose methodological discipline and prevent mid-stream revisions to methods and variables, and can help avoid the perception of inadvertently or deliberately placing a thumb on the scale to achieve desired results. On the downside, full specification in advance is “close to impossible,” while a pre-specified analysis “may miss the nuance that categorizes social science research” (Olken, 2015).
We employed a two-stage “split sample strategy” as suggested by Anderson and Magruder (2017). That is, in a first-stage pre-analysis plan we constructed and tested the software code on a subset of just two surveys: Liberia 2009 and Liberia 2011. These two surveys were chosen at random from the set of countries that 1) had data for both fever and malaria; 2) had more than one year of data; and 3) were in Africa. Then we produced a second-stage pre-analysis plan for the full sample. We made and noted deviations from the original pre-analysis plan only to ensure that our code was correct, not because the small sample yielded one result or another. Our pre-analysis plan describes in detail methods related to both those analyses that we undertook (e.g., correlations; heatmaps; cross-sectional regressions; panel regressions) as well as those that we were unable to undertake (e.g., mediation analyses; cost-effectiveness analysis).
Results
The results of our primary specification were not consistent with our ex ante hypotheses that malaria prevalence is higher at intermediate levels of forest cover, nor higher at greater levels of deforestation, controlling for other factors (Table 5). That is, in a pooled, weighted cross-sectional multivariate logit regression, we did not find a positive coefficient on forest cover, a negative coefficient on forest-cover squared, and joint significance; nor did we find a positive and significant coefficient on deforestation. This was the case for the primary dependent variable, malaria rapid test results, as well as for both secondary dependent
1 Our time-stamped pre-analysis plans are logged at https://www.cgdev.org/sites/default/files/Bauhoff-BuschPAP-Part-1-29_Aug_17-stamped.pdf and https://www.cgdev.org/sites/default/files/Bauhoff-Busch-PAP-Part2-16_Nov_17-stamped.pdf
11
variables: malaria lab test results and fever. As expected, we found malaria prevalence to be significantly higher at intermediate temperature, lower with a finished floor, and lower with a pumped or piped water source (Table 5). We also found malaria prevalence to be higher in older children, as found in Malawi by Zgambo et al (2017). The signs of the coefficients on precipitation and precipitation squared were consistent with malaria prevalence being higher at intermediate precipitation, but the coefficients were not jointly significant.
The results of multiple pre-specified sensitivity analyses were also not consistent with our ex ante hypotheses related to forest cover and deforestation. These sensitivity analyses included alternative weightings (Table 6-7); use of OLS (Table 8); reduction to the subset of observations for which data on all three dependent variables were collected (Table 9); clustering standard errors at the level of the DHS primary sampling unit (Table 10); the inclusion of a bed-net variable and place of delivery variable (Table 11-12); and the inclusion of the housing quality index in place of floor type (Table 13). (In these analyses bed net usage and delivery in a facility were both associated with significantly less malaria, and higher housing quality was associated with significantly less malaria and fever, as expected.) Nor were the hypothesized relationships with deforestation and forest cover borne out after limiting the sample to children of age zero only (Table 14), nor when using the alternative dependent variable of mortality in age-zero children (Table 15).
Alternative combinations of independent variables of interest also did not produce results consistent with our ex ante hypotheses. These included removing deforestation as an independent variable (Table 16), removing forest-cover squared as a dependent variable (Table 17), and removing both forest cover and forest-cover squared as dependent variables (Table 18).
Furthermore, for most individual surveys the results of our cross-sectional logit analyses also did not support our ex ante hypotheses (Table 19). The hypothesis that malaria is higher at greater levels of deforestation was borne out in only 1 out of 23 surveys for malaria rapid tests and only 1 out of 22 surveys for malaria lab tests. The hypothesis that malaria is higher at intermediate levels of deforestation was borne out in 4 out of 23 surveys for malaria rapid tests and 5 out of 23 surveys for malaria lab tests. For fever, the deforestation hypothesis was borne out in only 13 out of 90 surveys (8 out of 51 in Africa; 3 out of 10 in Asia; 2 out of 8 in Latin America), while the forest cover hypothesis was borne out in 23 out of 90 surveys (18 out of 51 in Africa; 2 out of 10 in Asia; 3 out of 8 in Latin America).
Our ex-ante hypotheses related to disaggregations were also not borne out. For instance, we did not find that the effect of deforestation on fever was significantly greater in Latin America and Africa than in Asia (Table 20). We did not find that the effect of deforestation on malaria or fever was significantly higher at earlier stages of a forest transition, i.e., at higher forest cover (Table 21). Nor did we find that the effect of deforestation on fever was disproportionately greater for smaller amounts of deforestation (Table 22). In no lagged period prior to the survey year were our ex-ante hypotheses related to forest cover and deforestation borne out (Table 23).
12
In our panel analysis, we did find, in accordance with our ex ante hypothesis, that malaria as measured in lab tests was significantly higher at intermediate levels of forest cover (Table 24). However, neither malaria as measured in rapid tests nor fever was significantly higher at intermediate levels of forest cover. None of the three dependent variables was significantly higher at higher levels of deforestation.
Because we did not find a significant effect of deforestation on malaria, we did not perform tests to see if the effect was mediated through housing quality, water source, or access to health services. Nor did we perform post-estimation analyses to calculate the total impact of deforestation on malaria, nor the marginal cost-effectiveness of forest conservation as an anti-malarial intervention.
Discussion
Neither of our ex ante hypotheses—that malaria prevalence would be higher at intermediate levels of forest cover, and that malaria prevalence would be higher at higher levels of deforestation—were borne out in our primary analysis, nor in many secondary sensitivity analyses. Out of 98 tests of pre-specified hypothesis run on the full pooled sample, in only a single case were our results consistent with our ex ante hypothesis: in the panel analysis, malaria as measured by rapid tests was significantly higher at intermediate levels of forest cover. Furthermore, only 11 of the 90 pre-specified hypothesis tests run on individual surveys related to malaria showed results consistent with our ex ante hypothesis. A slightly greater number of pre-specified hypothesis tests run on individual surveys related to fever showed results consistent with our ex ante hypothesis (n=36/180). Note that with so many tests some number of positive findings should be expected even in the absence of a real effect.
Our findings come with caveats related to the geographic distribution and selection of interviews. First, our malaria analysis was limited to 17 African countries (which together comprised 51 percent of the population and 65 percent of the deforestation of Sub-Saharan Africa circa 2010). Our fever analysis was geographically broader, sampling from 41 tropical countries (including 30 African countries which together comprised 93 percent of the population and 87 percent of the deforestation of Sub-Saharan Africa circa 2010). This sample included one survey from Indonesia, but no surveys from any of the other three countries for which previous studies found an effect of deforestation on malaria: Brazil, Malaysia, and Paraguay. Furthermore, the countries and years for which surveys were conducted on malaria were not randomly selected. Rather, our sample of surveys is probably biased toward both places and times with higher levels of malaria.
The limited geographic scope of surveyed countries and years means that our results are difficult to extrapolate beyond the set of countries included in the sample. Even within the countries and years of analysis, our pooled sample represented an artificial super-national aggregation of countries and years rather than a cohesive and intuitive bloc. It is important to note however that survey observations were designed to be, once properly weighted, representative of the particular countries and years in which they took place. Since few survey-specific results were consistent with our ex ante hypothesis, we are confident that our
13
main findings are not an artifact of the artificial super-national aggregate of countries nor the weighting scheme employed.
Our findings that forest cover and deforestation did not affect malaria nor fever prompt three questions. First, how do we reconcile our finding with previous studies that found that deforestation increases malaria risk factors, including in Africa (e.g., Lindblade et al., 2000; Cohuet et al., 2004; Afrane et al., 2005; Munga et al., 2006)? The relationship between deforestation and malaria risk is nuanced to begin with, as discussed in the Introduction, and any increase in malaria risk or exposure from deforestation could be swamped by other factors, e.g., related to economic growth or public health campaigns (Figure 1). This apparent discrepancy between an effect on malaria risk and a non-effect on malaria prevalence may be analagous to the so-called “paddies paradox” (Ijumba and Lindsay, 2001), in which communities near irrigation projects had less rather than more malaria in spite of increases in Anopheles mosquitoes, perhaps because increased wealth from irrigation led to increased use of bednets and better access to improved healthcare. We were able to partially control for investments in health through the inclusion of housing quality, bed-net usage, and place of delivery, but admit that such factors are difficult to fully control for in cross-sectional analyses.
Second, how do we reconcile our fever findings with previous studies that found deforestation to be associated with higher malaria prevalence in countries in South America and Southeast Asia? Fever is only a weak proxy for malaria, as discussed in the Introduction, so the absence of a positive relationship between deforestation and fever could be either because the effect on malaria is absent or because an effect is swamped by other causes of fever.
And third, how do we reconcile our malaria findings with the findings of previous studiesthat found a positive relationship between deforestation and malaria prevalence in Brazil, Indonesia, Malaysia, and Paraguay? We can think of several possible explanations for why our results might differ from what previous studies found. First, it could be that geographic variation in malaria-transmitting mosquito types and ecological conditions across the tropics means that deforestation has less of an effect on malaria in Africa than elsewhere. However, this would be contrary to the literature suggesting that it is Asia rather than Africa where deforestation has a lower effect on malaria risk (Guerra et al., 2006).
Second, there could be relevant differences in the phenomenon of deforestation between Africa and other tropical continents. Fisher (2010) describes an “African exception to drivers of deforestation,” in which deforestation in Africa is largely driven by the slow expansion of subsistence or smallholder agriculture for domestic use rather than market-driven agricultural exports as in Latin America and Asia. It could be that in Latin America and Asia relatively more deforestation is undertaken by new frontier migrants with associated unstable socio-economic conditions of poor housing stock, unimproved water sources, poor access to health services, and so forth. Meanwhile in Africa relatively more deforestation is by long-time residents for whom these conditions are less likely to be changed by deforestation.
14
Third, we used different data sets from previous studies. Our Landsat-derived data on forests are comparable to the Landsat-derived data used in the Brazil studies, but should be more accurate than the MODIS, NDVI-based, or self-reported data used in other studies. Our DHS-survey data on malaria at the individual level should be at least as good if not better than jurisdictional-level data, which necessarily rely on modeling assumptions to estimate population-level malaria rates. While greater levels of granularity are conceptually superior to aggregated data (e.g., Comfort et al., 2017), the difference in approach could account for the difference in findings.
Fourth, the contrast in our findings could be the result of methodological differences with previous studies. Our model specification differed from those of previous studies (as indeed previous studies’ specifications differed from each other; Table 1). We didn’t attempt to match others’ specifications; rather we derived our own specification based on our conceptual model of the coupled human and natural system (Figure 1).
Ideally, we could have isolated and tested the third and fourth potential explanations above by attempting to replicate previous studies’ methodologies as closely as possible using our data. However, our data set, the Demographic and Health Surveys, did not collect data on malaria in three of the four countries where previous studies were conducted (Brazil, Malaysia, and Paraguay), and collected data on fever only in Indonesia. Furthermore, aggregating our individual-level data on malaria and other household characteristics to the jurisdictional level would require making a number of difficult assumptions.
Given the multiple differences described above between our studies and others’ studies, we prefer to consider how our findings and findings in the literature could both be correct. We speculate that the most likely potential explanation is an African exception in the drivers of deforestation, and thus the channels through which deforestation leads to changes in malaria. We suggest this is a fruitful topic to explore in future research.
Our findings can help prioritize actions in both the health sector and the forest sector. For anti-malarial efforts, our findings do not support the inclusion of forest conservation within a portfolio of anti-malarial interventions, at least in Sub-Saharan Africa where 88 percent of malaria cases occur (WHO, 2016). It would be more effective to prioritize proven anti-malarial interventions such as bed nets, spraying, and housing improvements.
For forest conservation efforts in Africa, it makes sense to focus management interventions on securing the many other values of standing forests, including carbon storage, biodiversity habitat, clean water provision, food provision, and other aspects of health. The total social value of standing forests, and the case for conserving them, is considerable even without an effect on malaria.
Conclusion
Using by far the largest and most granular data set to date, we find little evidence to support the hypothesis that deforestation increases malaria prevalence in Africa. Our findings contrast with evidence that deforestation increases malaria risk factors in some settings,

15
including in Africa. However, many other factors besides deforestation also affect malaria prevalence in humans, including climate, community demographics, access to health facilities, and people’s behaviors to avoid malaria, meaning that increases in risk might not always translate to increases in prevalence. Our findings also contrast with the findings of most previous studies from Brazil, Indonesia, Malaysia, and Paraguay, as well as a cross-national study, which found that deforestation is associated with higher malaria prevalence. Although we can’t fully explain within this study why our findings differ from those of previous studies, we speculate that the explanation may be related to an African exception to drivers of deforestation, in which deforestation in Africa is undertaken relatively more by long-time residents living in stable socio-economic conditions rather than by frontier settlers. Our results imply that at least in Africa forest conservation does not appear to be an effective anti-malarial intervention. This implies anti-malarial efforts in Africa should focus on other proven interventions such as bed nets, spraying, and housing improvements. Forest conservation efforts in Africa should focus on securing other benefits of forests, including carbon storage, biodiversity habitat, clean water provision, and the provision of other goods and services.
16
References
Afrane, Y.A., Lawson, B.W., Githeko, A.K., Yan, G. (2005). Effects of microclimatic changes caused by land use and land cover on duration of gonotrophic cycles of Anopheles gambiae (Diptera: Cilicidae) in Western Kenya Highlands. Journal of Medical Entomology, 42(6):974-980.
Anderson, M.L, Magruder, J. (2017). Split-Sample Strategies for Avoiding False Discoveries. NBER Working Paper 23544.
Austin, K.F., Bellinger, M.O., Rana, P. (2017). Anthropogenic forest loss and malaria prevalence: a comparative examination of the causes and disease consequences of deforestation in developing nations. AIMS Environmental Science, 4(2): 217-231.
Baeza, A., Santos-Vega, M., Dobson, A.P., Pascual, M. (2017). The rise and fall of malaria under land-use change in frontier regions. Nature Ecology & Evolution. 1:0108.
Bauch, S. C., Birkenbach, A.M., Pattanayak, S.K., Sills, E.O. (2017). Public health impacts of ecosystem change in the Amazon. Proceedings of the National Academy of Sciences of the United States of America, 112(24):7414-7419.
Beck-Johnson, L.M. et al. (2013) Effect of temperature on Anopheles mosquito population dynamics and the potential for malaria transmission. PLOS One, 8(11): e79276.
Burkett-Cadena, N.D., Vittor, A.Y. (2017). Deforestation and vector-borne disease: forest conversion favors important mosquito vectors of human pathogens. Basic and Applied Ecology. https://doi.org/10.1016/j.baae.2017.09.012.
Busch, J., Ferretti-Gallon, K. (2017). What drives deforestation and what stops it? A meta-analysis. Review of Environmental Economics and Policy, 11(1):3-23.
CDC (2015). Anopheles mosquitoes. Center for Disease Control and Prevention. https://www.cdc.gov/malaria/about/biology/mosquitoes/ Accessed December 12, 2017.
Coffman, L.C., Niederle, M. (2015). Pre-analysis plans have limited upside especially where replications are feasible. Journal of Economic Perspectives, 29(3):81-98.
Cohuet et al., (2004). High Malaria Transmission Intensity Due to Anopheles funestus (Diptera: Culicidae) in a Village of Savannah–Forest Transition Area in Cameroon. Journal of Medical Entomology, 41(5):901-905.
Comfort et al., (2017) Exploring the use of routinely-available, retrospective data to study the association between malaria control scale-up and micro-economic outcomes in Zambia. Malaria Journal 16:15.
de Castro, M.C., Monte-Mor, R.L., Sawyer, D.O, Singer, B.H. (2006). Malaria risk on the Amazon frontier. Proceedings of the National Academy of Sciences of the United States of America. 103(7):2452-2457.
DHS (2017a). Methodology – Collecting Geographic Data. Demographic and Health Surveys. United States Agency for International Development, Washington, DC.https://dhsprogram.com/What-We-Do/GPS-Data-Collection.cfm Accessed December 13, 2017.
DHS (2017b). Survey Search. Demographic and Health Surveys. United States Agency for International Development, Washington, DC. https://dhsprogram.com/What-We-Do/Survey-Search.cfm
17
DHS (2017c). MIS Overview. Demographic and Health Surveys. United States Agency for International Development, Washington, DC. http://dhsprogram.com/what-we-do/survey-types/mis.cfm
Fisher, B. (2010). African exception to drivers of deforestation. Nature Geoscience, 3:375-376. Florey, L. (2014). Measures of Malaria Parasitemia Prevalence in National Surveys:
Agreement between Rapid Diagnostic Tests and Microscopy. DHS Analytical Studies 43. United States Agency for International Development, Washington, DC. 146pp.
Fornace, K.M. et al. (2016). Association between landscape factors and spatial patterns of Plasmodium knowlesi infections in Sabah, Malaysia. Emerging Infectious Diseases 22(2):201-208.
Friedrich, M.J. (2016). Deforestation clears way for zoonotic malaria in Malaysia. Journal of the American Medical Association. 315(11):1100.
Garg, T. (2014). Public health effects of ecosystem degradation: Evidence from deforestation in Indonesia. Job Market paper.
Goetz, S.J., Hansen, M., Houghton, R.A., Walker, W., Laporte, N., Busch, J. (2015) “Measurement and monitoring needs, capabilities and potential for addressing reduced emissions from deforestation and forest degradation under REDD+” Environmental Research Letters 10:123001.
Gottwalt, A. (2015). Importance of deforestation on vector-borne disease incidence. The Journal of Global Health.
Grainger, A. (2008). Difficulties in tracking the long-term global trend in tropical forest area. Proceedings of the National Academy of Sciences of the United States of America. 105(2):818-823.
Guerra, C.A., Snow, R.W., Hay, S.I. (2006). A global assessment of closed forests, deforestation, and malaria risk. Annals of Tropical Medicine and Parasitology. 100(3):189-204.
Hahn, M.B., Gangnon, R.E., Barcellos, C., Asner, G.P., Patz, J.A. (2014a). Influence of deforestation, logging, and fire on malaria in the Brazilian Amazon. PLOS One. 9(1):e85725
Hahn, M.B., Olson, S.H., Vittor, A.Y., Barcellos, C., Patz, J.A., Pan, W. (2014b). Conservation efforts and malaria in the Brazilian Amazon. American Journal of Tropical Medicine and Hygiene. 90(4):591-594.
Hay, S.I. Snow, R.W., Rogers, D.J. (1998). Predicting malaria seasons in Kenya using multitemporal meteorological satellite sensor data. Transactions of the Royal Society of Tropical Medicine and Hygiene, 92(1):12-20.
Ijumba, J.N., Lindsay, S.W. (2001). Impact of irrigation on malaria in Africa: paddies paradox. Medical and Veterinary Entomology. 15:1-11.
Kar, N.P., Kumar, A., Singh, O.P, Carlton, J.M., Nanda, N. (2014). A review of malaria transmission dynamics in forest ecosystems. Parasites & Vectors. 7:265.
Kaufmann, C., Briegel, H. (2004). Flight performance of the malaria vectors Anopheles gambiae and Anopheles atroparvus. Journal of Vector Ecology 29(1):140-153.
Keele, L., Tingley, D., Yamamoto, T. (2015). Identifying mechanisms behind policy interventions via causal mediation analysis. Journal of Policy Analysis and Management, 34(4):937-963.
18
Keiser, J., Singer, B.H., Utzinger, J. (2005). Reducing the burden of malaria in different eco-epidemiological settings with environmental management: a systematic review. Lancet Infectious Diseases, 2005(5):695-708.
Kiemde, F. et al. (2017). Accuracy of a Plasmodium falciparum specific histidine-rich protein 2 rapid diagnostic test in the context of the presence of non-malaria fevers, prior anti-malarial use and seasonal malaria transmission. Malaria Journal, 16:294.
Kiszewski, A. et al. (2004). A global index representing the stability of malaria transmission. American Journal of Tropical Medicine and Hygiene, 70(5):486-498.
Laporta GZ, et al. (2013) Biodiversity can help prevent malaria outbreaks in tropical forests. PLoS Neglected Tropical Diseases 7:e2139.
Lawrence, D., Vandecar, K. (2014). Effects of tropical deforestation on climate and agriculture. Nature Climate Change, 5:27-36.
Lengeler C. (2014) Insecticide-treated bed nets and curtains for preventing malaria. Cochrane Database of Systematic Reviews 2004(2): CD000363. DOI: 10.1002/14651858.CD000363.pub2.
Lewis, S.L., Edwards, D.P., Galbraith, D. (2015). Increasing human dominance of tropical forests. Science, 349(6250):827-832.
Lindblade, K.A., Walker, E.D., Onapa, A.W., Katungu, J., Wilson, M.L. (2000) Land use change alters malaria transmission parameters by modifying temperature in a highland area of Uganda. Trop Med Int Health 5(4):263–274.
Mayxay, M. et al. (2013). Causes of non-malarial fever in Laos: a prospective study. Lancet Global Health 2013(1):e46-54.
Measure Evaluation (2013). Household Survey Indicators for Malaria Control. United States Agency for International Development. https://www.measureevaluation.org/resources/publications/ms-13-78 Accessed December 12, 2017.
Miguel, E. et al. (2014). Promoting transparency in social science research. Science 343:30-31.
Mordecai, E.A. et al. (2013). Optimal temperature for malaria transmission is dramatically lower than previously predicted. Ecology Letters 16:22-30.
Moretti, E. and Neidell, M. (2011). Pollution, health, and avoidance behavior: evidence from the ports of Los Angeles. Journal of Human Resources, 45(1):154-175.
Munga, S. et al. (2006) Association between land cover and habitat productivity of malaria vectors in Western Kenyan Highlands. American Journal of Tropical Medicine and Hygiene. 74(1):69-75.
Myers, S. et al. (2013) Human health impacts of ecosystem alteration. Proceedings of the National Academy of Sciences, 110(47):18753-18760.
Okiro, E.A., Snow, R.W. (2010). The relationship between reported fever and Plasmodium falciparum infection in African children. Malaria Journal, 9:99.
Olken, B.A. (2015). Promises and perils of pre-analysis plans. Journal of Economic Perspectives, 29(3):61-80.
Olson, S.H., Gangnon, R., Silveira, G.A., Patz, J.A. (2010). Deforestation and malaria in Mancio Lima County, Brazil. Emerging Infectious Diseases, 16(7):1108-1115.
19
Over, M., Bakote’e, B., Velayudhan, R., Wilikai, P., Graves, P.M. (2004). Impregnated nets or DDT residual spraying? Field effectiveness of malaria prevention techniques in Solomon Islands, 1993–1999. American Journal of Tropical Medicine and Hygeine, 71(2):214-223.
Patz, J.A., Graczyk, T.K., Geller, N., & Vittor, A.Y. (2000). Effects of environmental change on emerging parasitic diseases. International Journal for Parasitology, 30(12-13), 1395–1405.
Parham, P.E., Michael, E. (2010) Modeling the effects of weather and climate change on malaria transmission. Environmental Health Perspectives, 118(5):620-626.
Pattanayak, S.K., Corey, C.G., Lau, Y.F., Kramer, R.A. (2010). Biodiversity conservation and child malaria: microeconomic evidence from Flores, Indonesia. ERID Working Paper Number 85.
Petney, T.N. (2001). Environmental, cultural, and social changes and their influence on parasite infections. International Journal for Parasitology, 31(9), 919–932.
Piantadosi, S., Byar, D.P., Green, S.B. (1988). The ecological fallacy. American Journal of Epidemiology, 127(5):893-904.
Rulli, M.C., Santini, M., Hayman, D.T.S., D’Odorico, P. (2017). The nexus between forest fragmentation in Africa and Ebola virus disease outbreaks. Scientific Reports doi:10.1038/srep41613.
Seymour, F., Busch, J. (2016). Why Forests? Why Now? The Science, Economics, and Politics of Tropical Forests and Climate Change. Center for Global Development, Washington, DC. 429pp.
Singer, B., de Castro, M.C. (2006). Enhancement and suppression of Malaria in the Amazon. American Journal of Tropical Medicine and Hygiene, 74(1):1-2.
Stickler, C.M., et al. (2013). Dependence of hydropower energy generation on forests in the Amazon Basin at local and regional scales. Proceedings of the National Academy of Sciences. 110(23):9601-9606.
Terrazas et al., (2015). Deforestation, drainage network, indigenous status, and geographical differences of malaria in the State of Amazonas. Malaria Journal 14:379.
Tucker Lima, J.M., Vittor, A., Rifai, S., Valle, D. (2017). Does deforestation promote or inhibit malaria transmission in the Amazon? A systematic literature review and critical appraisal of current evidence. Philosophical Transactions of the Royal Society B, 372:20160125.
Tusting, L.S. et al. (2015). The evidence for improving housing to reduce malaria: a systematic review and meta-analysis. Malaria Journal 14:209.
Tyukavina, A. et al., (2015) Aboveground carbon loss in natural and managed tropical forests from 2000-2012, Environmental Research Letters, doi:10.1088/1748-9326/10/7/074002.
UNDESA (2017). World Population Prospects: The 2017 Revision, DVD Edition. United Nations Department of Economic and Social Affairs, Population Division. New York, NY.
Valle, D. (2014). Response to the Critique by Hahn and Others Entitled “Conservation and Malaria in the Brazilian Amazon” American Journal of Tropical Medicine and Hygiene, 90(4):595-596.
Valle, D., Clark, J. (2013). Conservation efforts may increase malaria burden in the Brazilian Amazon. PLOS ONE 8(3): e57519.
Vittor AY, Gilman RH, Tielsch J, Glass G, Shields T, Lozano WS, Pinedo-Cancino V, Patz JA (2006). The effect of deforestation on the human-biting rate of Anopheles darlingi, the
20
primary vector of Falciparum malaria in the Peruvian Amazon. American Journal of Tropical Medicine and Hygiene, 74: 3-11.
Vittor, A. et al. (2009). Linking deforestation to malaria in the Amazon: characterization of the breeding habitat of the principal malaria vector, Anopheles darlingi. American Journal of Tropical Medicine and Hygiene, 81(1):5-12.
Wayant, N.M., Maldonado, D., de Arias, A.R., Cousino, B., Goodin, D.G. (2010). Correlation between normalized difference vegetation index and malaria in a subtropical rain forest undergoing rapid anthropogenic alteration. Geospatial Health, 4(2):179-180.
White, M.T., Conteh, L., Cibulskis, R., Ghani, A.C. (2011). Costs and cost-effectiveness of malaria control interventions – a systematic review. Malaria Journal, 10:337.
WHO (2016). World Malaria Report 2016. World Health Organization, Geneva, Switzerland. 186 pp.
Wood, C. L., Lafferty, K. D., DeLeo, G., Young, H. S., Hudson, P. J. and Kuris, A. M. (2014). Does biodiversity protect humans against infectious disease? Ecology, 95: 817–832.
Wunder, S., Angelsen, A., and Belcher, B. (2014). Forests, Livelihoods, and Conservation: Broadening the Empirical Base. World Development, 64:S1-S11.
Yasuoka, J., Levins, R. (2007). Impact of deforestation and agricultural development on anopheline ecology and malaria epidemiology. American Journal of Tropical Medicine and Hygiene, 76(3): 450-460.
Zgambo, M. et al. (2017) Prevalence and factors associated with malaria parasitaemia in children under the age of five years in Malawi: A comparison study of the 2012 and 2014 Malaria Indicator Surveys (MISs). PLOS ONE 12(4):e0175537.
Zhong, D. et al. (2016). Effects of microclimate condition changes due to land use and land cover changes on the survivorship of malaria vectors in China-Myanmar border region. PLOS ONE 11(5): e0155301.
21
Figures and tables
Figure 1. Coupled human-natural system model of deforestation and malaria
Figure 2: Heatmaps
0.2
.4.6
.81
For
est c
over
: 25
inte
rval
s fr
om 0
−1
0 .0011062 .0022125 .0033187 .004425 .0055312Deforestation: 25 intervals from 0−90th perc
0.050.100.150.200.250.300.350.400.450.500.550.600.650.700.750.800.850.900.95
Mea
n m
alar
ia r
apid
test
Based on 60305 observations. Weighting scheme 2
0.2
.4.6
.81
For
est c
over
: 25
inte
rval
s fr
om 0
−1
0 .0011624 .0023247 .0034871 .0046494 .0058118Deforestation: 25 intervals from 0−90th perc
0.050.090.140.180.230.270.320.360.410.450.500.540.590.630.680.720.770.810.86
Mea
n m
alar
ia la
b te
st
Based on 56883 observations. Weighting scheme 2
0.2
.4.6
.81
For
est c
over
: 25
inte
rval
s fr
om 0
−1
0 .0006856 .0013712 .0020569 .0027425 .0034281Deforestation: 25 intervals from 0−90th perc
0.040.070.110.150.180.220.260.290.330.360.400.440.470.510.550.580.620.660.69
Mea
n fe
ver
Based on 469533 observations. Weighting scheme 2
2
22
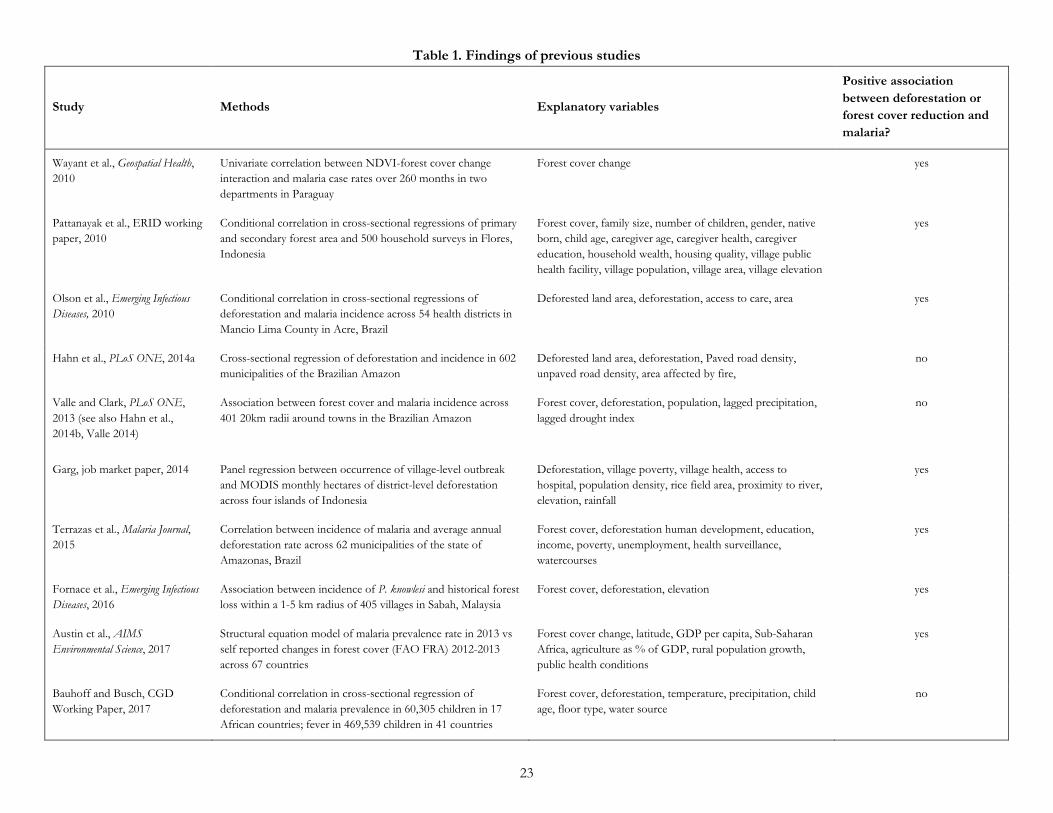
Table 1. Findings of previous studies
Study Methods Explanatory variables
Positive association between deforestation or forest cover reduction and malaria?
Wayant et al., Geospatial Health, 2010
Univariate correlation between NDVI-forest cover change interaction and malaria case rates over 260 months in two departments in Paraguay
Forest cover change yes
Pattanayak et al., ERID working paper, 2010
Conditional correlation in cross-sectional regressions of primary and secondary forest area and 500 household surveys in Flores, Indonesia
Forest cover, family size, number of children, gender, native born, child age, caregiver age, caregiver health, caregiver education, household wealth, housing quality, village public health facility, village population, village area, village elevation
yes
Olson et al., Emerging Infectious Diseases, 2010
Conditional correlation in cross-sectional regressions of deforestation and malaria incidence across 54 health districts in Mancio Lima County in Acre, Brazil
Deforested land area, deforestation, access to care, area yes
Hahn et al., PLoS ONE, 2014a Cross-sectional regression of deforestation and incidence in 602 municipalities of the Brazilian Amazon
Deforested land area, deforestation, Paved road density, unpaved road density, area affected by fire,
no
Valle and Clark, PLoS ONE, 2013 (see also Hahn et al., 2014b, Valle 2014)
Association between forest cover and malaria incidence across 401 20km radii around towns in the Brazilian Amazon
Forest cover, deforestation, population, lagged precipitation, lagged drought index
no
Garg, job market paper, 2014 Panel regression between occurrence of village-level outbreak and MODIS monthly hectares of district-level deforestation across four islands of Indonesia
Deforestation, village poverty, village health, access to hospital, population density, rice field area, proximity to river, elevation, rainfall
yes
Terrazas et al., Malaria Journal, 2015
Correlation between incidence of malaria and average annual deforestation rate across 62 municipalities of the state of Amazonas, Brazil
Forest cover, deforestation human development, education, income, poverty, unemployment, health surveillance, watercourses
yes
Fornace et al., Emerging Infectious Diseases, 2016
Association between incidence of P. knowlesi and historical forest loss within a 1-5 km radius of 405 villages in Sabah, Malaysia
Forest cover, deforestation, elevation yes
Austin et al., AIMS Environmental Science, 2017
Structural equation model of malaria prevalence rate in 2013 vs self reported changes in forest cover (FAO FRA) 2012-2013 across 67 countries
Forest cover change, latitude, GDP per capita, Sub-Saharan Africa, agriculture as % of GDP, rural population growth, public health conditions
yes
Bauhoff and Busch, CGD Working Paper, 2017
Conditional correlation in cross-sectional regression of deforestation and malaria prevalence in 60,305 children in 17 African countries; fever in 469,539 children in 41 countries
Forest cover, deforestation, temperature, precipitation, child age, floor type, water source
no
23
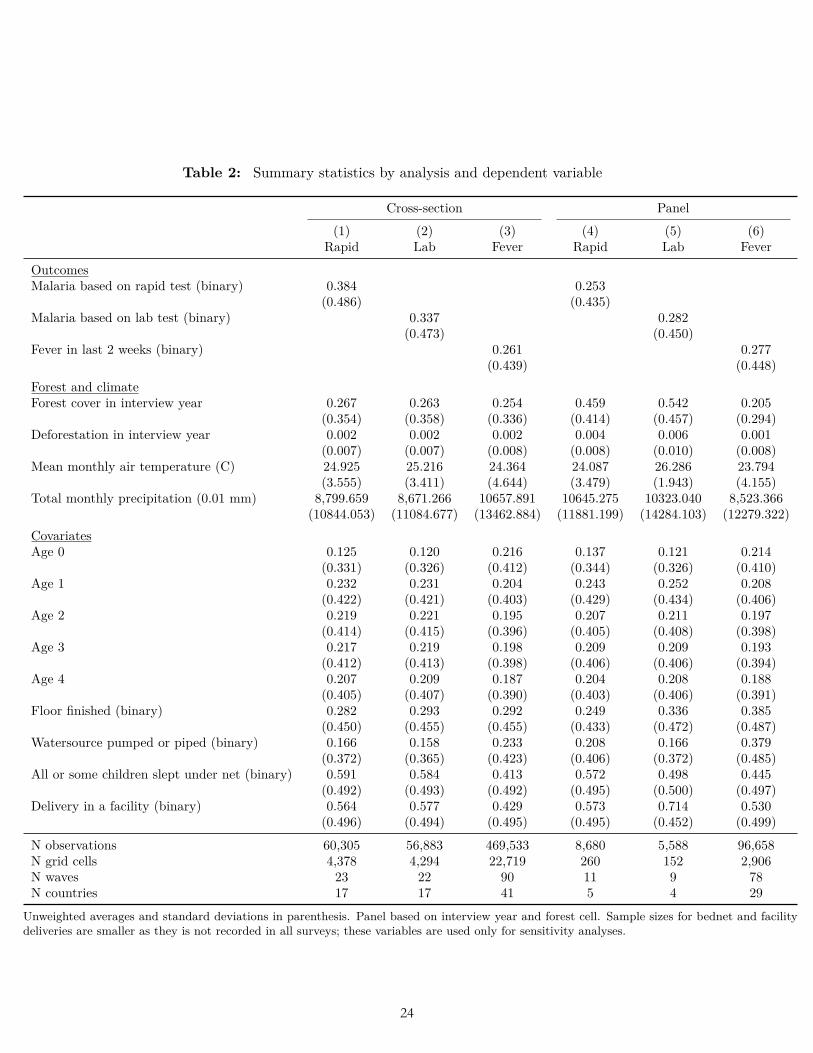
Table 2: Summary statistics by analysis and dependent variable
Cross-section Panel
(1) (2) (3) (4) (5) (6)Rapid Lab Fever Rapid Lab Fever
OutcomesMalaria based on rapid test (binary) 0.384 0.253
(0.486) (0.435)Malaria based on lab test (binary) 0.337 0.282
(0.473) (0.450)Fever in last 2 weeks (binary) 0.261 0.277
(0.439) (0.448)Forest and climateForest cover in interview year 0.267 0.263 0.254 0.459 0.542 0.205
(0.354) (0.358) (0.336) (0.414) (0.457) (0.294)Deforestation in interview year 0.002 0.002 0.002 0.004 0.006 0.001
(0.007) (0.007) (0.008) (0.008) (0.010) (0.008)Mean monthly air temperature (C) 24.925 25.216 24.364 24.087 26.286 23.794
(3.555) (3.411) (4.644) (3.479) (1.943) (4.155)Total monthly precipitation (0.01 mm) 8,799.659 8,671.266 10657.891 10645.275 10323.040 8,523.366
(10844.053) (11084.677) (13462.884) (11881.199) (14284.103) (12279.322)CovariatesAge 0 0.125 0.120 0.216 0.137 0.121 0.214
(0.331) (0.326) (0.412) (0.344) (0.326) (0.410)Age 1 0.232 0.231 0.204 0.243 0.252 0.208
(0.422) (0.421) (0.403) (0.429) (0.434) (0.406)Age 2 0.219 0.221 0.195 0.207 0.211 0.197
(0.414) (0.415) (0.396) (0.405) (0.408) (0.398)Age 3 0.217 0.219 0.198 0.209 0.209 0.193
(0.412) (0.413) (0.398) (0.406) (0.406) (0.394)Age 4 0.207 0.209 0.187 0.204 0.208 0.188
(0.405) (0.407) (0.390) (0.403) (0.406) (0.391)Floor finished (binary) 0.282 0.293 0.292 0.249 0.336 0.385
(0.450) (0.455) (0.455) (0.433) (0.472) (0.487)Watersource pumped or piped (binary) 0.166 0.158 0.233 0.208 0.166 0.379
(0.372) (0.365) (0.423) (0.406) (0.372) (0.485)All or some children slept under net (binary) 0.591 0.584 0.413 0.572 0.498 0.445
(0.492) (0.493) (0.492) (0.495) (0.500) (0.497)Delivery in a facility (binary) 0.564 0.577 0.429 0.573 0.714 0.530
(0.496) (0.494) (0.495) (0.495) (0.452) (0.499)
N observations 60,305 56,883 469,533 8,680 5,588 96,658N grid cells 4,378 4,294 22,719 260 152 2,906N waves 23 22 90 11 9 78N countries 17 17 41 5 4 29
Unweighted averages and standard deviations in parenthesis. Panel based on interview year and forest cell. Sample sizes for bednet and facilitydeliveries are smaller as they is not recorded in all surveys; these variables are used only for sensitivity analyses.
3
24
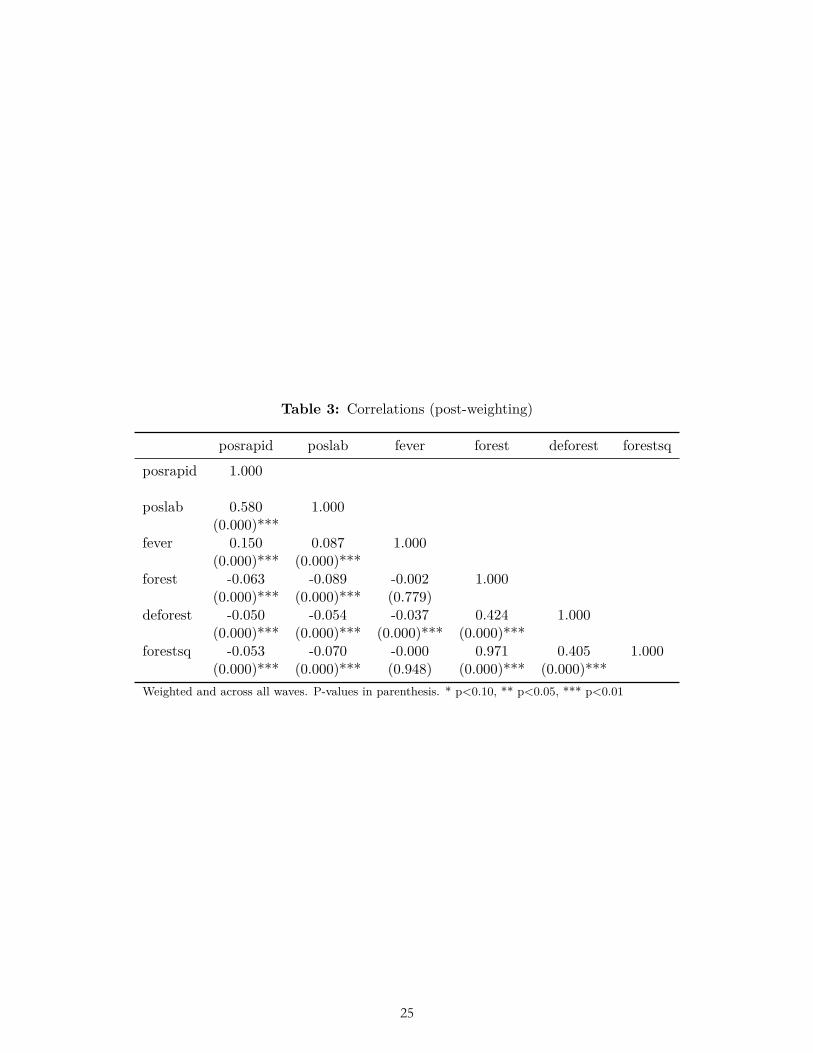
Table 3: Correlations (post-weighting)
posrapid poslab fever forest deforest forestsq
posrapid 1.000
poslab 0.580 1.000(0.000)***
fever 0.150 0.087 1.000(0.000)*** (0.000)***
forest -0.063 -0.089 -0.002 1.000(0.000)*** (0.000)*** (0.779)
deforest -0.050 -0.054 -0.037 0.424 1.000(0.000)*** (0.000)*** (0.000)*** (0.000)***
forestsq -0.053 -0.070 -0.000 0.971 0.405 1.000(0.000)*** (0.000)*** (0.948) (0.000)*** (0.000)***
Weighted and across all waves. P-values in parenthesis. * p<0.10, ** p<0.05, *** p<0.01
4
25
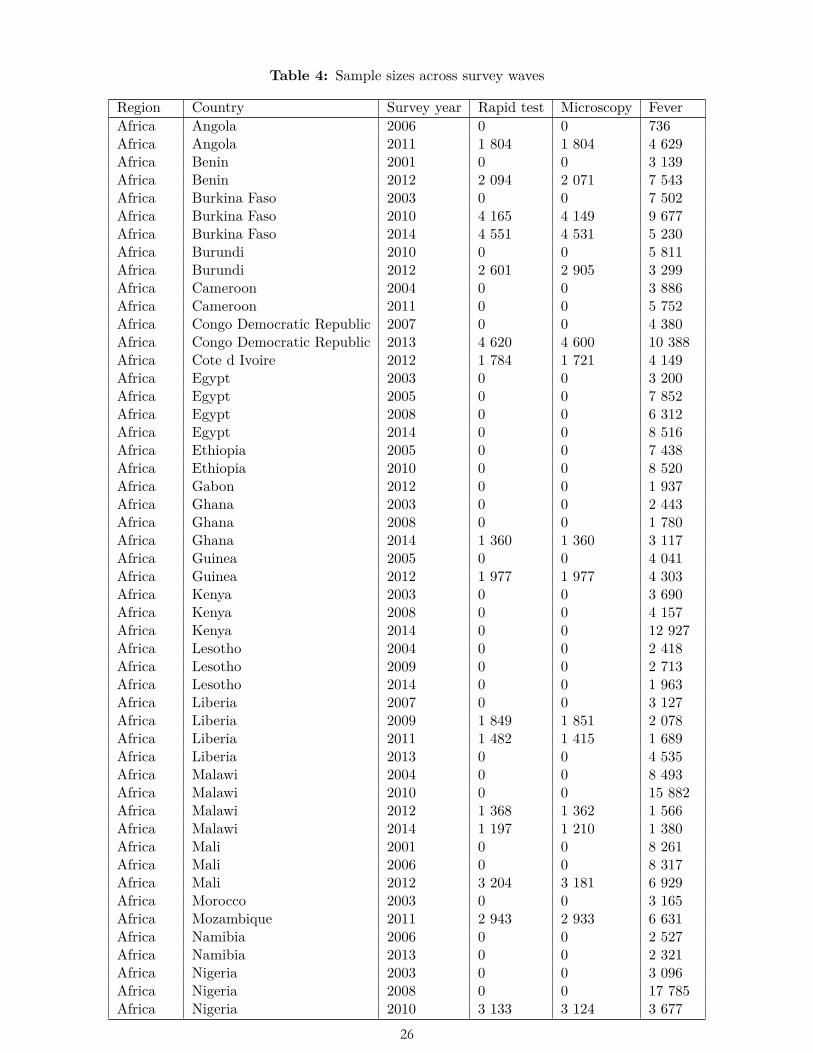
Table 4: Sample sizes across survey waves
Region Country Survey year Rapid test Microscopy FeverAfrica Angola 2006 0 0 736Africa Angola 2011 1 804 1 804 4 629Africa Benin 2001 0 0 3 139Africa Benin 2012 2 094 2 071 7 543Africa Burkina Faso 2003 0 0 7 502Africa Burkina Faso 2010 4 165 4 149 9 677Africa Burkina Faso 2014 4 551 4 531 5 230Africa Burundi 2010 0 0 5 811Africa Burundi 2012 2 601 2 905 3 299Africa Cameroon 2004 0 0 3 886Africa Cameroon 2011 0 0 5 752Africa Congo Democratic Republic 2007 0 0 4 380Africa Congo Democratic Republic 2013 4 620 4 600 10 388Africa Cote d Ivoire 2012 1 784 1 721 4 149Africa Egypt 2003 0 0 3 200Africa Egypt 2005 0 0 7 852Africa Egypt 2008 0 0 6 312Africa Egypt 2014 0 0 8 516Africa Ethiopia 2005 0 0 7 438Africa Ethiopia 2010 0 0 8 520Africa Gabon 2012 0 0 1 937Africa Ghana 2003 0 0 2 443Africa Ghana 2008 0 0 1 780Africa Ghana 2014 1 360 1 360 3 117Africa Guinea 2005 0 0 4 041Africa Guinea 2012 1 977 1 977 4 303Africa Kenya 2003 0 0 3 690Africa Kenya 2008 0 0 4 157Africa Kenya 2014 0 0 12 927Africa Lesotho 2004 0 0 2 418Africa Lesotho 2009 0 0 2 713Africa Lesotho 2014 0 0 1 963Africa Liberia 2007 0 0 3 127Africa Liberia 2009 1 849 1 851 2 078Africa Liberia 2011 1 482 1 415 1 689Africa Liberia 2013 0 0 4 535Africa Malawi 2004 0 0 8 493Africa Malawi 2010 0 0 15 882Africa Malawi 2012 1 368 1 362 1 566Africa Malawi 2014 1 197 1 210 1 380Africa Mali 2001 0 0 8 261Africa Mali 2006 0 0 8 317Africa Mali 2012 3 204 3 181 6 929Africa Morocco 2003 0 0 3 165Africa Mozambique 2011 2 943 2 933 6 631Africa Namibia 2006 0 0 2 527Africa Namibia 2013 0 0 2 321Africa Nigeria 2003 0 0 3 096Africa Nigeria 2008 0 0 17 785Africa Nigeria 2010 3 133 3 124 3 677
5
26
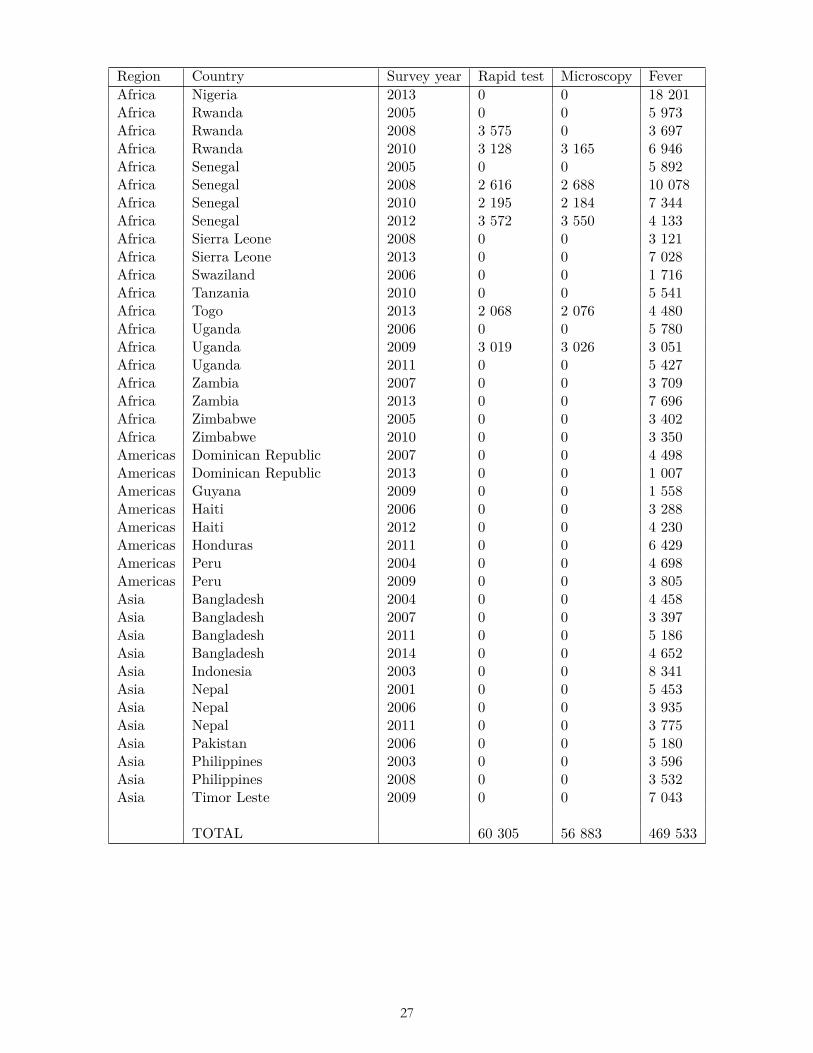
Region Country Survey year Rapid test Microscopy FeverAfrica Nigeria 2013 0 0 18 201Africa Rwanda 2005 0 0 5 973Africa Rwanda 2008 3 575 0 3 697Africa Rwanda 2010 3 128 3 165 6 946Africa Senegal 2005 0 0 5 892Africa Senegal 2008 2 616 2 688 10 078Africa Senegal 2010 2 195 2 184 7 344Africa Senegal 2012 3 572 3 550 4 133Africa Sierra Leone 2008 0 0 3 121Africa Sierra Leone 2013 0 0 7 028Africa Swaziland 2006 0 0 1 716Africa Tanzania 2010 0 0 5 541Africa Togo 2013 2 068 2 076 4 480Africa Uganda 2006 0 0 5 780Africa Uganda 2009 3 019 3 026 3 051Africa Uganda 2011 0 0 5 427Africa Zambia 2007 0 0 3 709Africa Zambia 2013 0 0 7 696Africa Zimbabwe 2005 0 0 3 402Africa Zimbabwe 2010 0 0 3 350Americas Dominican Republic 2007 0 0 4 498Americas Dominican Republic 2013 0 0 1 007Americas Guyana 2009 0 0 1 558Americas Haiti 2006 0 0 3 288Americas Haiti 2012 0 0 4 230Americas Honduras 2011 0 0 6 429Americas Peru 2004 0 0 4 698Americas Peru 2009 0 0 3 805Asia Bangladesh 2004 0 0 4 458Asia Bangladesh 2007 0 0 3 397Asia Bangladesh 2011 0 0 5 186Asia Bangladesh 2014 0 0 4 652Asia Indonesia 2003 0 0 8 341Asia Nepal 2001 0 0 5 453Asia Nepal 2006 0 0 3 935Asia Nepal 2011 0 0 3 775Asia Pakistan 2006 0 0 5 180Asia Philippines 2003 0 0 3 596Asia Philippines 2008 0 0 3 532Asia Timor Leste 2009 0 0 7 043
TOTAL 60 305 56 883 469 533
6
27
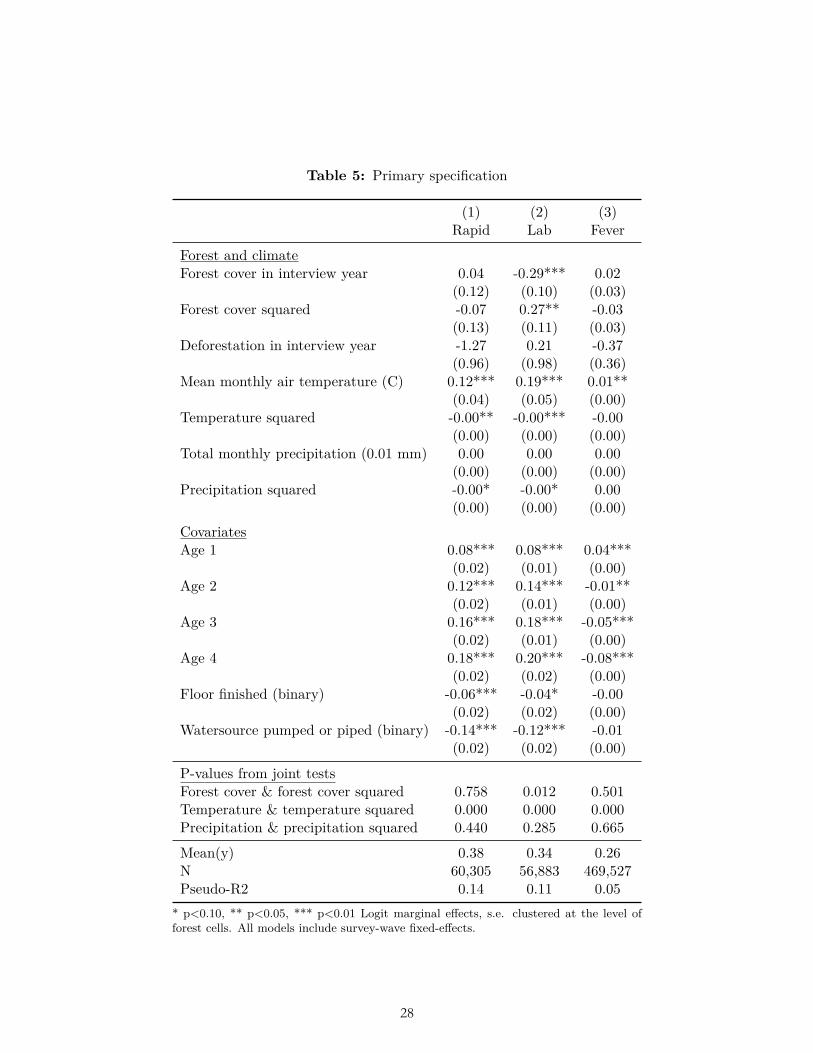
Table 5: Primary specification
(1) (2) (3)Rapid Lab Fever
Forest and climateForest cover in interview year 0.04 -0.29*** 0.02
(0.12) (0.10) (0.03)Forest cover squared -0.07 0.27** -0.03
(0.13) (0.11) (0.03)Deforestation in interview year -1.27 0.21 -0.37
(0.96) (0.98) (0.36)Mean monthly air temperature (C) 0.12*** 0.19*** 0.01**
(0.04) (0.05) (0.00)Temperature squared -0.00** -0.00*** -0.00
(0.00) (0.00) (0.00)Total monthly precipitation (0.01 mm) 0.00 0.00 0.00
(0.00) (0.00) (0.00)Precipitation squared -0.00* -0.00* 0.00
(0.00) (0.00) (0.00)CovariatesAge 1 0.08*** 0.08*** 0.04***
(0.02) (0.01) (0.00)Age 2 0.12*** 0.14*** -0.01**
(0.02) (0.01) (0.00)Age 3 0.16*** 0.18*** -0.05***
(0.02) (0.01) (0.00)Age 4 0.18*** 0.20*** -0.08***
(0.02) (0.02) (0.00)Floor finished (binary) -0.06*** -0.04* -0.00
(0.02) (0.02) (0.00)Watersource pumped or piped (binary) -0.14*** -0.12*** -0.01
(0.02) (0.02) (0.00)
P-values from joint testsForest cover & forest cover squared 0.758 0.012 0.501Temperature & temperature squared 0.000 0.000 0.000Precipitation & precipitation squared 0.440 0.285 0.665
Mean(y) 0.38 0.34 0.26N 60,305 56,883 469,527Pseudo-R2 0.14 0.11 0.05
* p<0.10, ** p<0.05, *** p<0.01 Logit marginal effects, s.e. clustered at the level offorest cells. All models include survey-wave fixed-effects.
7
28

Table 6: Primary specification modified so that each observation is weighted equally
(1) (2) (3)Rapid Lab Fever
Forest and climateForest cover in interview year 0.03 -0.02 0.01
(0.06) (0.06) (0.01)Forest cover squared -0.03 0.04 -0.01
(0.06) (0.06) (0.02)Deforestation in interview year -0.80 -0.35 -0.12
(0.64) (0.63) (0.17)Mean monthly air temperature (C) 0.14*** 0.13*** 0.00***
(0.02) (0.02) (0.00)Temperature squared -0.00*** -0.00*** -0.00**
(0.00) (0.00) (0.00)Total monthly precipitation (0.01 mm) 0.00* 0.00*** 0.00*
(0.00) (0.00) (0.00)Precipitation squared -0.00*** -0.00*** -0.00
(0.00) (0.00) (0.00)CovariatesAge 1 0.07*** 0.06*** 0.05***
(0.01) (0.01) (0.00)Age 2 0.13*** 0.12*** 0.01***
(0.01) (0.01) (0.00)Age 3 0.15*** 0.15*** -0.04***
(0.01) (0.01) (0.00)Age 4 0.16*** 0.16*** -0.07***
(0.01) (0.01) (0.00)Floor finished (binary) -0.06*** -0.07*** -0.01***
(0.01) (0.01) (0.00)Watersource pumped or piped (binary) -0.08*** -0.09*** -0.01***
(0.01) (0.01) (0.00)
P-values from joint testsForest cover & forest cover squared 0.855 0.564 0.695Temperature & temperature squared 0.000 0.000 0.005Precipitation & precipitation squared 0.095 0.003 0.083
Mean(y) 0.38 0.34 0.26N 60,305 56,883 469,533Pseudo-R2 0.24 0.19 0.05
* p<0.10, ** p<0.05, *** p<0.01 Logit marginal effects, s.e. clustered at the level offorest cells. All models include survey-wave fixed-effects.
8
29

Table 7: Primary specification modified so that each survey is weighted equally
(1) (2) (3)Rapid Lab Fever
Forest and climateForest cover in interview year -0.02 -0.07 0.01
(0.09) (0.08) (0.02)Forest cover squared 0.01 0.08 -0.02
(0.09) (0.09) (0.02)Deforestation in interview year -1.29* -1.35 -0.10
(0.69) (0.87) (0.21)Mean monthly air temperature (C) 0.14*** 0.14*** 0.00**
(0.03) (0.03) (0.00)Temperature squared -0.00*** -0.00*** -0.00*
(0.00) (0.00) (0.00)Total monthly precipitation (0.01 mm) 0.00 0.00 -0.00
(0.00) (0.00) (0.00)Precipitation squared -0.00* -0.00*** 0.00**
(0.00) (0.00) (0.00)CovariatesAge 1 0.08*** 0.07*** 0.05***
(0.01) (0.01) (0.00)Age 2 0.14*** 0.14*** 0.01***
(0.01) (0.01) (0.00)Age 3 0.17*** 0.16*** -0.04***
(0.01) (0.01) (0.00)Age 4 0.18*** 0.19*** -0.07***
(0.01) (0.01) (0.00)Floor finished (binary) -0.07*** -0.07*** -0.01***
(0.01) (0.01) (0.00)Watersource pumped or piped (binary) -0.11*** -0.10*** -0.01***
(0.01) (0.01) (0.00)
P-values from joint testsForest cover & forest cover squared 0.770 0.574 0.484Temperature & temperature squared 0.000 0.000 0.003Precipitation & precipitation squared 0.647 0.407 0.859
Mean(y) 0.38 0.34 0.26N 60,305 56,883 469,527Pseudo-R2 0.21 0.15 0.05
* p<0.10, ** p<0.05, *** p<0.01 Logit marginal effects, s.e. clustered at the level offorest cells. All models include survey-wave fixed-effects.
9
30
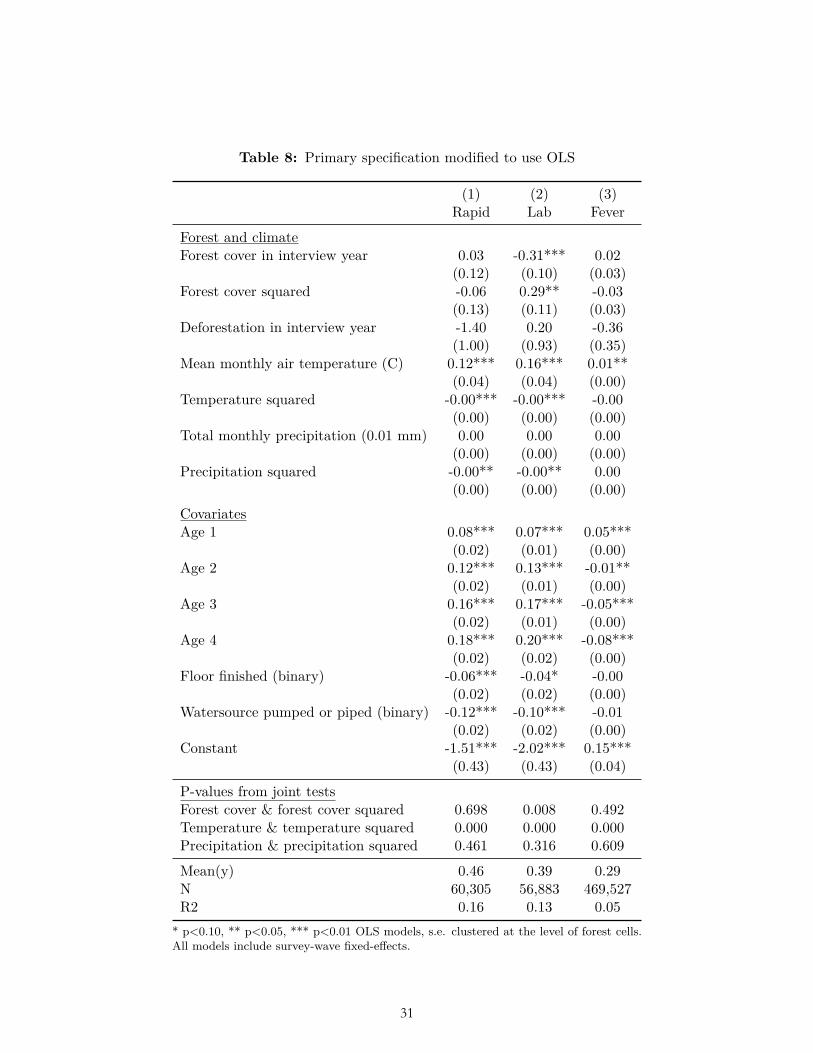
Table 8: Primary specification modified to use OLS
(1) (2) (3)Rapid Lab Fever
Forest and climateForest cover in interview year 0.03 -0.31*** 0.02
(0.12) (0.10) (0.03)Forest cover squared -0.06 0.29** -0.03
(0.13) (0.11) (0.03)Deforestation in interview year -1.40 0.20 -0.36
(1.00) (0.93) (0.35)Mean monthly air temperature (C) 0.12*** 0.16*** 0.01**
(0.04) (0.04) (0.00)Temperature squared -0.00*** -0.00*** -0.00
(0.00) (0.00) (0.00)Total monthly precipitation (0.01 mm) 0.00 0.00 0.00
(0.00) (0.00) (0.00)Precipitation squared -0.00** -0.00** 0.00
(0.00) (0.00) (0.00)CovariatesAge 1 0.08*** 0.07*** 0.05***
(0.02) (0.01) (0.00)Age 2 0.12*** 0.13*** -0.01**
(0.02) (0.01) (0.00)Age 3 0.16*** 0.17*** -0.05***
(0.02) (0.01) (0.00)Age 4 0.18*** 0.20*** -0.08***
(0.02) (0.02) (0.00)Floor finished (binary) -0.06*** -0.04* -0.00
(0.02) (0.02) (0.00)Watersource pumped or piped (binary) -0.12*** -0.10*** -0.01
(0.02) (0.02) (0.00)Constant -1.51*** -2.02*** 0.15***
(0.43) (0.43) (0.04)
P-values from joint testsForest cover & forest cover squared 0.698 0.008 0.492Temperature & temperature squared 0.000 0.000 0.000Precipitation & precipitation squared 0.461 0.316 0.609
Mean(y) 0.46 0.39 0.29N 60,305 56,883 469,527R2 0.16 0.13 0.05
* p<0.10, ** p<0.05, *** p<0.01 OLS models, s.e. clustered at the level of forest cells.All models include survey-wave fixed-effects.
10
31
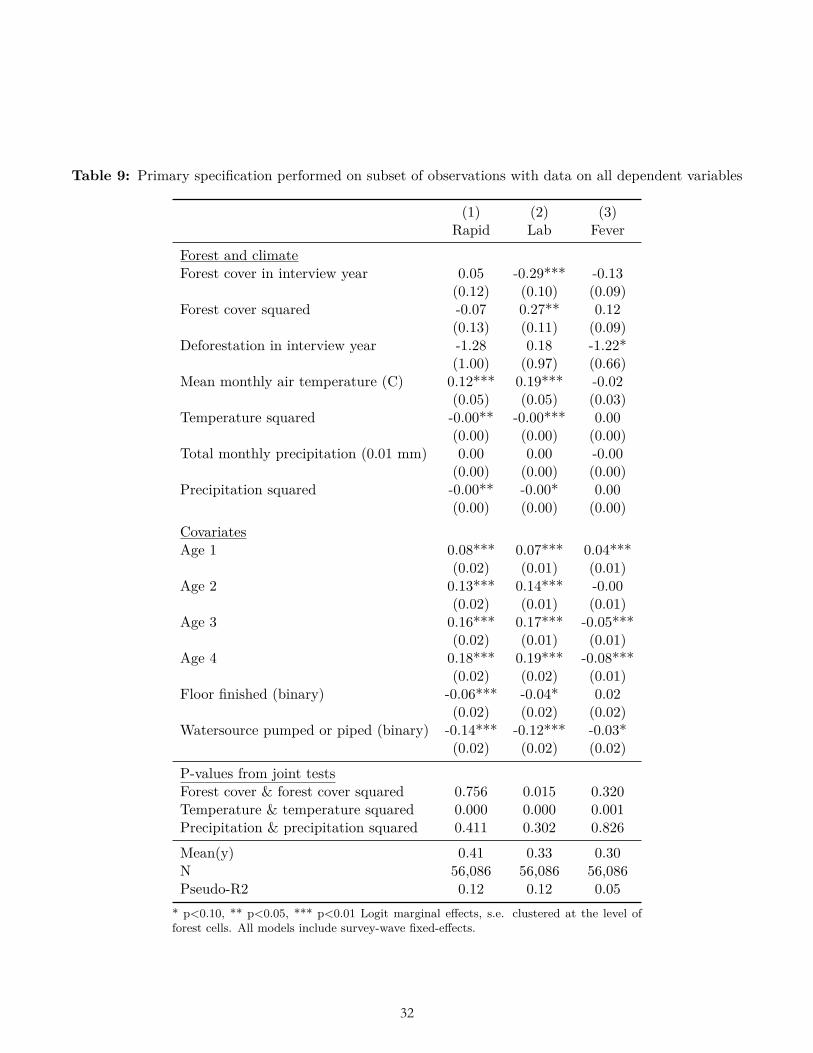
Table 9: Primary specification performed on subset of observations with data on all dependent variables
(1) (2) (3)Rapid Lab Fever
Forest and climateForest cover in interview year 0.05 -0.29*** -0.13
(0.12) (0.10) (0.09)Forest cover squared -0.07 0.27** 0.12
(0.13) (0.11) (0.09)Deforestation in interview year -1.28 0.18 -1.22*
(1.00) (0.97) (0.66)Mean monthly air temperature (C) 0.12*** 0.19*** -0.02
(0.05) (0.05) (0.03)Temperature squared -0.00** -0.00*** 0.00
(0.00) (0.00) (0.00)Total monthly precipitation (0.01 mm) 0.00 0.00 -0.00
(0.00) (0.00) (0.00)Precipitation squared -0.00** -0.00* 0.00
(0.00) (0.00) (0.00)CovariatesAge 1 0.08*** 0.07*** 0.04***
(0.02) (0.01) (0.01)Age 2 0.13*** 0.14*** -0.00
(0.02) (0.01) (0.01)Age 3 0.16*** 0.17*** -0.05***
(0.02) (0.01) (0.01)Age 4 0.18*** 0.19*** -0.08***
(0.02) (0.02) (0.01)Floor finished (binary) -0.06*** -0.04* 0.02
(0.02) (0.02) (0.02)Watersource pumped or piped (binary) -0.14*** -0.12*** -0.03*
(0.02) (0.02) (0.02)
P-values from joint testsForest cover & forest cover squared 0.756 0.015 0.320Temperature & temperature squared 0.000 0.000 0.001Precipitation & precipitation squared 0.411 0.302 0.826
Mean(y) 0.41 0.33 0.30N 56,086 56,086 56,086Pseudo-R2 0.12 0.12 0.05
* p<0.10, ** p<0.05, *** p<0.01 Logit marginal effects, s.e. clustered at the level offorest cells. All models include survey-wave fixed-effects.
11
32
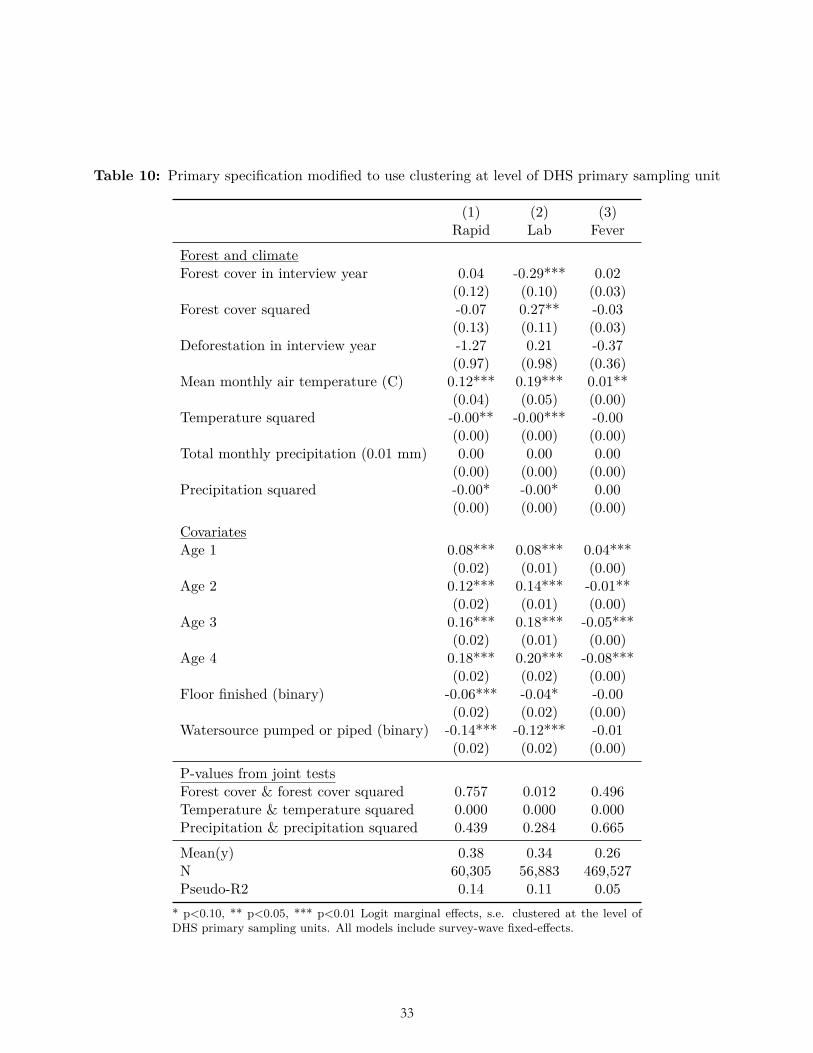
Table 10: Primary specification modified to use clustering at level of DHS primary sampling unit
(1) (2) (3)Rapid Lab Fever
Forest and climateForest cover in interview year 0.04 -0.29*** 0.02
(0.12) (0.10) (0.03)Forest cover squared -0.07 0.27** -0.03
(0.13) (0.11) (0.03)Deforestation in interview year -1.27 0.21 -0.37
(0.97) (0.98) (0.36)Mean monthly air temperature (C) 0.12*** 0.19*** 0.01**
(0.04) (0.05) (0.00)Temperature squared -0.00** -0.00*** -0.00
(0.00) (0.00) (0.00)Total monthly precipitation (0.01 mm) 0.00 0.00 0.00
(0.00) (0.00) (0.00)Precipitation squared -0.00* -0.00* 0.00
(0.00) (0.00) (0.00)CovariatesAge 1 0.08*** 0.08*** 0.04***
(0.02) (0.01) (0.00)Age 2 0.12*** 0.14*** -0.01**
(0.02) (0.01) (0.00)Age 3 0.16*** 0.18*** -0.05***
(0.02) (0.01) (0.00)Age 4 0.18*** 0.20*** -0.08***
(0.02) (0.02) (0.00)Floor finished (binary) -0.06*** -0.04* -0.00
(0.02) (0.02) (0.00)Watersource pumped or piped (binary) -0.14*** -0.12*** -0.01
(0.02) (0.02) (0.00)
P-values from joint testsForest cover & forest cover squared 0.757 0.012 0.496Temperature & temperature squared 0.000 0.000 0.000Precipitation & precipitation squared 0.439 0.284 0.665
Mean(y) 0.38 0.34 0.26N 60,305 56,883 469,527Pseudo-R2 0.14 0.11 0.05
* p<0.10, ** p<0.05, *** p<0.01 Logit marginal effects, s.e. clustered at the level ofDHS primary sampling units. All models include survey-wave fixed-effects.
12
33
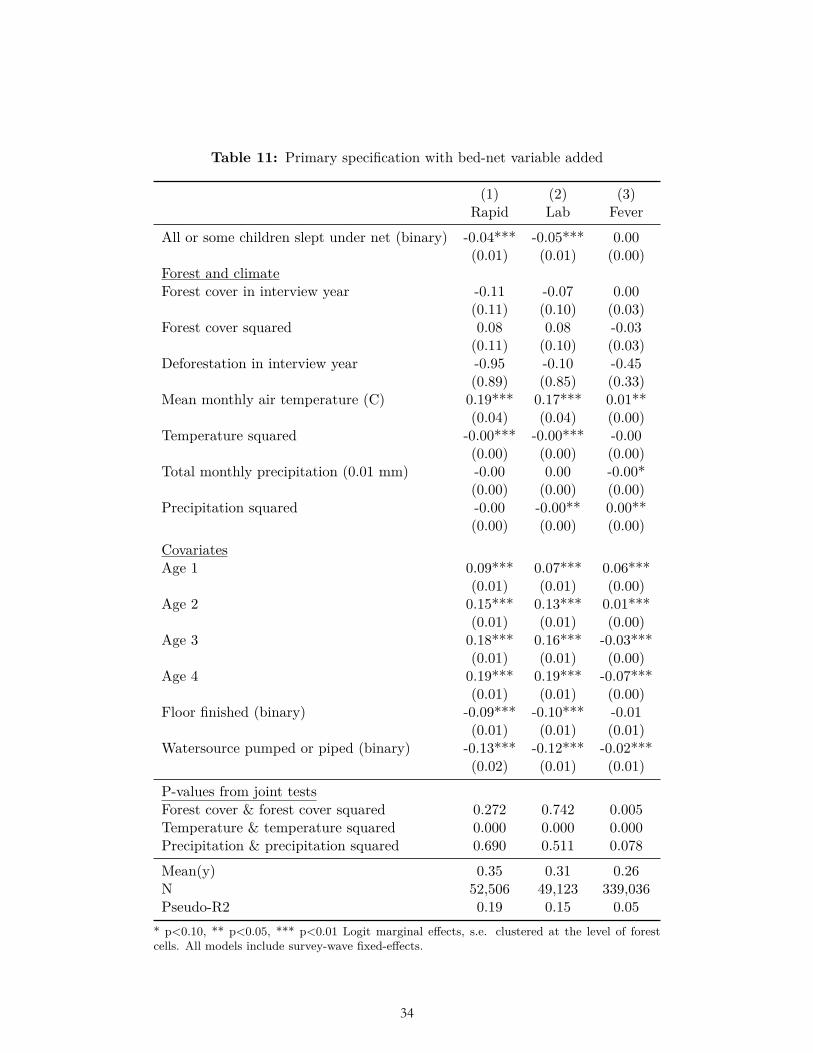
Table 11: Primary specification with bed-net variable added
(1) (2) (3)Rapid Lab Fever
All or some children slept under net (binary) -0.04*** -0.05*** 0.00(0.01) (0.01) (0.00)
Forest and climateForest cover in interview year -0.11 -0.07 0.00
(0.11) (0.10) (0.03)Forest cover squared 0.08 0.08 -0.03
(0.11) (0.10) (0.03)Deforestation in interview year -0.95 -0.10 -0.45
(0.89) (0.85) (0.33)Mean monthly air temperature (C) 0.19*** 0.17*** 0.01**
(0.04) (0.04) (0.00)Temperature squared -0.00*** -0.00*** -0.00
(0.00) (0.00) (0.00)Total monthly precipitation (0.01 mm) -0.00 0.00 -0.00*
(0.00) (0.00) (0.00)Precipitation squared -0.00 -0.00** 0.00**
(0.00) (0.00) (0.00)CovariatesAge 1 0.09*** 0.07*** 0.06***
(0.01) (0.01) (0.00)Age 2 0.15*** 0.13*** 0.01***
(0.01) (0.01) (0.00)Age 3 0.18*** 0.16*** -0.03***
(0.01) (0.01) (0.00)Age 4 0.19*** 0.19*** -0.07***
(0.01) (0.01) (0.00)Floor finished (binary) -0.09*** -0.10*** -0.01
(0.01) (0.01) (0.01)Watersource pumped or piped (binary) -0.13*** -0.12*** -0.02***
(0.02) (0.01) (0.01)
P-values from joint testsForest cover & forest cover squared 0.272 0.742 0.005Temperature & temperature squared 0.000 0.000 0.000Precipitation & precipitation squared 0.690 0.511 0.078
Mean(y) 0.35 0.31 0.26N 52,506 49,123 339,036Pseudo-R2 0.19 0.15 0.05
* p<0.10, ** p<0.05, *** p<0.01 Logit marginal effects, s.e. clustered at the level of forestcells. All models include survey-wave fixed-effects.
13
34
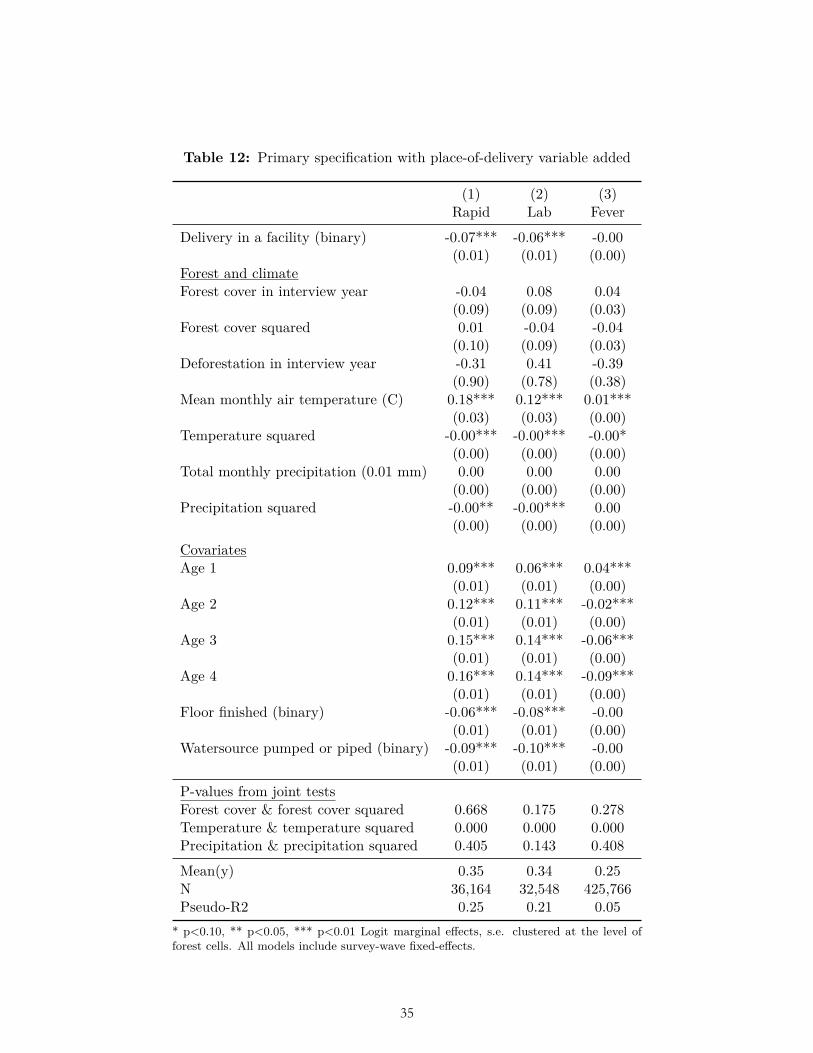
Table 12: Primary specification with place-of-delivery variable added
(1) (2) (3)Rapid Lab Fever
Delivery in a facility (binary) -0.07*** -0.06*** -0.00(0.01) (0.01) (0.00)
Forest and climateForest cover in interview year -0.04 0.08 0.04
(0.09) (0.09) (0.03)Forest cover squared 0.01 -0.04 -0.04
(0.10) (0.09) (0.03)Deforestation in interview year -0.31 0.41 -0.39
(0.90) (0.78) (0.38)Mean monthly air temperature (C) 0.18*** 0.12*** 0.01***
(0.03) (0.03) (0.00)Temperature squared -0.00*** -0.00*** -0.00*
(0.00) (0.00) (0.00)Total monthly precipitation (0.01 mm) 0.00 0.00 0.00
(0.00) (0.00) (0.00)Precipitation squared -0.00** -0.00*** 0.00
(0.00) (0.00) (0.00)CovariatesAge 1 0.09*** 0.06*** 0.04***
(0.01) (0.01) (0.00)Age 2 0.12*** 0.11*** -0.02***
(0.01) (0.01) (0.00)Age 3 0.15*** 0.14*** -0.06***
(0.01) (0.01) (0.00)Age 4 0.16*** 0.14*** -0.09***
(0.01) (0.01) (0.00)Floor finished (binary) -0.06*** -0.08*** -0.00
(0.01) (0.01) (0.00)Watersource pumped or piped (binary) -0.09*** -0.10*** -0.00
(0.01) (0.01) (0.00)
P-values from joint testsForest cover & forest cover squared 0.668 0.175 0.278Temperature & temperature squared 0.000 0.000 0.000Precipitation & precipitation squared 0.405 0.143 0.408
Mean(y) 0.35 0.34 0.25N 36,164 32,548 425,766Pseudo-R2 0.25 0.21 0.05
* p<0.10, ** p<0.05, *** p<0.01 Logit marginal effects, s.e. clustered at the level offorest cells. All models include survey-wave fixed-effects.
14
35
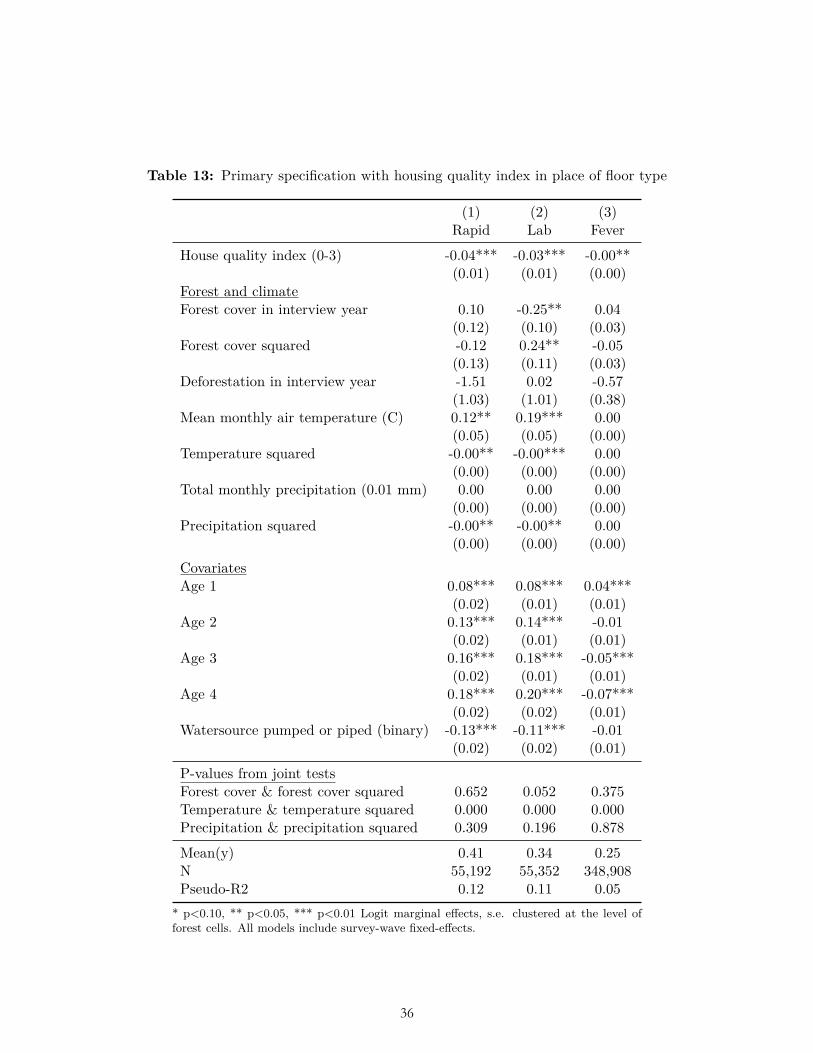
Table 13: Primary specification with housing quality index in place of floor type
(1) (2) (3)Rapid Lab Fever
House quality index (0-3) -0.04*** -0.03*** -0.00**(0.01) (0.01) (0.00)
Forest and climateForest cover in interview year 0.10 -0.25** 0.04
(0.12) (0.10) (0.03)Forest cover squared -0.12 0.24** -0.05
(0.13) (0.11) (0.03)Deforestation in interview year -1.51 0.02 -0.57
(1.03) (1.01) (0.38)Mean monthly air temperature (C) 0.12** 0.19*** 0.00
(0.05) (0.05) (0.00)Temperature squared -0.00** -0.00*** 0.00
(0.00) (0.00) (0.00)Total monthly precipitation (0.01 mm) 0.00 0.00 0.00
(0.00) (0.00) (0.00)Precipitation squared -0.00** -0.00** 0.00
(0.00) (0.00) (0.00)CovariatesAge 1 0.08*** 0.08*** 0.04***
(0.02) (0.01) (0.01)Age 2 0.13*** 0.14*** -0.01
(0.02) (0.01) (0.01)Age 3 0.16*** 0.18*** -0.05***
(0.02) (0.01) (0.01)Age 4 0.18*** 0.20*** -0.07***
(0.02) (0.02) (0.01)Watersource pumped or piped (binary) -0.13*** -0.11*** -0.01
(0.02) (0.02) (0.01)
P-values from joint testsForest cover & forest cover squared 0.652 0.052 0.375Temperature & temperature squared 0.000 0.000 0.000Precipitation & precipitation squared 0.309 0.196 0.878
Mean(y) 0.41 0.34 0.25N 55,192 55,352 348,908Pseudo-R2 0.12 0.11 0.05
* p<0.10, ** p<0.05, *** p<0.01 Logit marginal effects, s.e. clustered at the level offorest cells. All models include survey-wave fixed-effects.
15
36
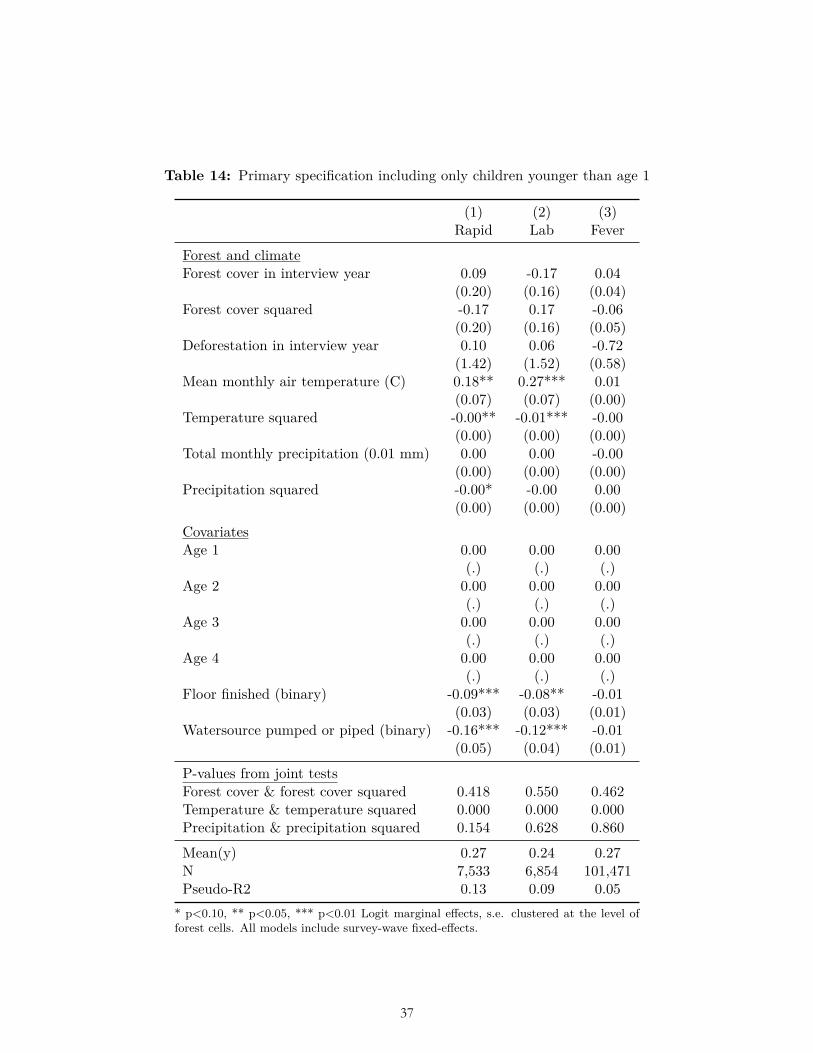
Table 14: Primary specification including only children younger than age 1
(1) (2) (3)Rapid Lab Fever
Forest and climateForest cover in interview year 0.09 -0.17 0.04
(0.20) (0.16) (0.04)Forest cover squared -0.17 0.17 -0.06
(0.20) (0.16) (0.05)Deforestation in interview year 0.10 0.06 -0.72
(1.42) (1.52) (0.58)Mean monthly air temperature (C) 0.18** 0.27*** 0.01
(0.07) (0.07) (0.00)Temperature squared -0.00** -0.01*** -0.00
(0.00) (0.00) (0.00)Total monthly precipitation (0.01 mm) 0.00 0.00 -0.00
(0.00) (0.00) (0.00)Precipitation squared -0.00* -0.00 0.00
(0.00) (0.00) (0.00)CovariatesAge 1 0.00 0.00 0.00
(.) (.) (.)Age 2 0.00 0.00 0.00
(.) (.) (.)Age 3 0.00 0.00 0.00
(.) (.) (.)Age 4 0.00 0.00 0.00
(.) (.) (.)Floor finished (binary) -0.09*** -0.08** -0.01
(0.03) (0.03) (0.01)Watersource pumped or piped (binary) -0.16*** -0.12*** -0.01
(0.05) (0.04) (0.01)
P-values from joint testsForest cover & forest cover squared 0.418 0.550 0.462Temperature & temperature squared 0.000 0.000 0.000Precipitation & precipitation squared 0.154 0.628 0.860
Mean(y) 0.27 0.24 0.27N 7,533 6,854 101,471Pseudo-R2 0.13 0.09 0.05
* p<0.10, ** p<0.05, *** p<0.01 Logit marginal effects, s.e. clustered at the level offorest cells. All models include survey-wave fixed-effects.
16
37
Table 15: Under-1 mortality
(1)Died before age 1
Forest and climateForest cover in year of birth -0.01
(0.01)Forest cover in year of birth squared 0.01
(0.01)Deforestation in year of birth -0.12
(0.13)Temperature in birth year-month -0.00
(0.00)Temperature in birth year-month squared -0.00
(0.00)Precipitation in birth year-month 0.00
(0.00)Precipitation in birth year-month squared -0.00
(0.00)CovariatesFloor finished (binary) -0.01***
(0.00)Watersource pumped or piped (binary) -0.00
(0.00)
P-values from joint testsForest cover & forest cover squared 0.588Temperature & temperature squared 0.277Precipitation & precipitation squared 0.452
Mean(y) 0.05N 445,678Pseudo-R2 0.01
* p<0.10, ** p<0.05, *** p<0.01 Logit marginal effects, s.e. clustered atthe level of forest cells. All models include survey-wave fixed-effects. Forestcover, deforestation, temperature and precipitation in year-month of death.
17
38
Table 16: Primary specification with deforestation omitted
(1) (2) (3)Rapid Lab Fever
Forest and climateForest cover in interview year 0.03 -0.29*** 0.02
(0.12) (0.10) (0.03)Forest cover squared -0.06 0.27** -0.03
(0.13) (0.11) (0.03)Mean monthly air temperature (C) 0.12*** 0.19*** 0.01**
(0.04) (0.05) (0.00)Temperature squared -0.00** -0.00*** -0.00
(0.00) (0.00) (0.00)Total monthly precipitation (0.01 mm) 0.00 0.00 0.00
(0.00) (0.00) (0.00)Precipitation squared -0.00* -0.00* 0.00
(0.00) (0.00) (0.00)CovariatesAge 1 0.08*** 0.08*** 0.04***
(0.02) (0.01) (0.00)Age 2 0.12*** 0.14*** -0.01**
(0.02) (0.01) (0.00)Age 3 0.16*** 0.18*** -0.05***
(0.02) (0.01) (0.00)Age 4 0.18*** 0.20*** -0.08***
(0.02) (0.02) (0.00)Floor finished (binary) -0.06*** -0.04* -0.00
(0.02) (0.02) (0.00)Watersource pumped or piped (binary) -0.14*** -0.12*** -0.01
(0.02) (0.02) (0.00)
P-values from joint testsForest cover & forest cover squared 0.708 0.011 0.479Temperature & temperature squared 0.000 0.000 0.000Precipitation & precipitation squared 0.408 0.288 0.657
Mean(y) 0.38 0.34 0.26N 60,305 56,883 469,527Pseudo-R2 0.14 0.11 0.05
* p<0.10, ** p<0.05, *** p<0.01 Logit marginal effects, s.e. clustered at the level offorest cells. All models include survey-wave fixed-effects.
18
39

Table 17: Primary specification with forest-cover squared omitted
(1) (2) (3)Rapid Lab Fever
Forest cover in interview year -0.02 -0.05 -0.00(0.04) (0.03) (0.01)
Deforestation in interview year -1.18 -0.17 -0.36(0.96) (0.99) (0.36)
Mean monthly air temperature (C) 0.12*** 0.19*** 0.01**(0.04) (0.05) (0.00)
Temperature squared -0.00** -0.00*** -0.00(0.00) (0.00) (0.00)
Total monthly precipitation (0.01 mm) 0.00 0.00 0.00(0.00) (0.00) (0.00)
Precipitation squared -0.00* -0.00* 0.00(0.00) (0.00) (0.00)
CovariatesAge 1 0.08*** 0.08*** 0.04***
(0.02) (0.01) (0.00)Age 2 0.12*** 0.14*** -0.01**
(0.02) (0.01) (0.00)Age 3 0.16*** 0.18*** -0.05***
(0.02) (0.01) (0.00)Age 4 0.18*** 0.20*** -0.08***
(0.02) (0.02) (0.00)Floor finished (binary) -0.06*** -0.04* -0.00
(0.02) (0.02) (0.00)Watersource pumped or piped (binary) -0.14*** -0.12*** -0.01
(0.02) (0.02) (0.00)
P-values from joint testsTemperature & temperature squared 0.000 0.000 0.000Precipitation & precipitation squared 0.425 0.440 0.646
Mean(y) 0.38 0.34 0.26N 60,305 56,883 469,527Pseudo-R2 0.14 0.11 0.05
* p<0.10, ** p<0.05, *** p<0.01 Logit marginal effects, s.e. clustered at the level offorest cells. All models include survey-wave fixed-effects.
19
40
Table 18: Primary specification with forest-cover and forest-cover squared omitted
(1) (2) (3)Rapid Lab Fever
Forest and climateDeforestation in interview year -1.35 -0.64 -0.39
(0.93) (0.97) (0.35)Mean monthly air temperature (C) 0.12*** 0.19*** 0.01**
(0.04) (0.05) (0.00)Temperature squared -0.00** -0.00*** -0.00
(0.00) (0.00) (0.00)Total monthly precipitation (0.01 mm) 0.00 0.00 0.00
(0.00) (0.00) (0.00)Precipitation squared -0.00* -0.00 0.00
(0.00) (0.00) (0.00)CovariatesAge 1 0.08*** 0.08*** 0.04***
(0.02) (0.01) (0.00)Age 2 0.12*** 0.14*** -0.01**
(0.02) (0.01) (0.00)Age 3 0.16*** 0.18*** -0.05***
(0.02) (0.01) (0.00)Age 4 0.18*** 0.20*** -0.08***
(0.02) (0.02) (0.00)Floor finished (binary) -0.06*** -0.04** -0.00
(0.02) (0.02) (0.00)Watersource pumped or piped (binary) -0.14*** -0.12*** -0.01
(0.02) (0.02) (0.00)
P-values from joint testsTemperature & temperature squared 0.000 0.000 0.000Precipitation & precipitation squared 0.495 0.662 0.663
Mean(y) 0.38 0.34 0.26N 60,305 56,883 469,527Pseudo-R2 0.14 0.11 0.05
* p<0.10, ** p<0.05, *** p<0.01 Logit marginal effects, s.e. clustered at the level offorest cells. All models include survey-wave fixed-effects.
20
41

Table 19. Individual surveys for which results are consistent with ex ante hypotheses related to deforestation and forest cover, from survey-by-survey regressions of
primary specification
rapid lab fever
deforestation forest cover deforestation forest cover deforestation forest cover
Total (1/22) (4/23) (1/21) (5/22) (13/89) (23/90)
4.5% 17.4% 4.8% 22.7% 14.6% 25.6%
Angola 2006 no no Angola 2011 no no no no no no Bangladesh 2004 no no Bangladesh 2007 YES no Bangladesh 2011 no YES Bangladesh 2014 no no Burkina Faso 2003 no YES Burkina Faso 2010 no no no no no no Burkina Faso 2014 no no no Benin 2001 no no Benin 2011 no no no no no YES Burundi 2010 no YES Burundi 2012 no YES no YES no YES Congo Democratic Republic 2007 no no Congo Democratic Republic 2013 no no no no no no Cote d'Ivoire 2011 no no no no no no Cameroon 2004 no YES Cameroon 2011 no no Dominican Republic 2007 YES no Dominican Republic 2013 no YES Egypt 2003 no no Egypt 2005 no no Egypt 2008 no no Egypt 2014 no no Ethiopia 2005 no no Ethiopia 2011 no YES Gabon 2012 no no Ghana 2003 no no Ghana 2008 no no Ghana 2014 no no no no no no Guinea 2005 YES no Guinea 2012 no no no YES no no Guyana 2009 no YES Honduras 2011 no no Haiti 2005 no no Haiti 2012 no no Indonesia 2002 no no Kenya 2003 no YES Kenya 2008 no YES Kenya 2014 no YES Liberia 2007 no YES Liberia 2009 no YES no YES no no Liberia 2011 no no no no no no
42
rapid lab fever
deforestation forest cover deforestation forest cover deforestation forest cover
Liberia 2013 no no Lesotho 2004 YES no Lesotho 2009 no no Lesotho 2014 no YES Morocco 2003 no YES Mali 2001 no YES Mali 2006 YES YES Mali 2012 no YES no YES YES no Malawi 2004 no no Malawi 2010 no no Malawi 2012 no no no no no no Malawi 2014 no no YES no no no Mozambique 2011 no no no YES no no Nigeria 2003 no no Nigeria 2008 no YES Nigeria 2010 no no no no no no Nigeria 2013 no no Namibia 2006 no no Namibia 2013 YES YES Nepal 2001 no no Nepal 2006 YES no Nepal 2011 YES no Peru 2004 no YES Peru 2009 YES no Philippines 2003 no no Philippines 2008 no YES Pakistan 2006 no no Rwanda 2005 no no Rwanda 2007 no no no no Rwanda 2010 no no no no no no Sierra Leone 2008 no no Sierra Leone 2013 no no Senegal 2005 no no Senegal 2008 YES no no no no YES Senegal 2010 no no no no YES no Senegal 2012 no no no no YES no Swaziland 2006 no no Togo 2013 no YES no no no no Timor-Leste 2009 no no Tanzania 2010 no no Uganda 2006 no no Uganda 2009 no no no no no no Uganda 2011 no no Zambia 2007 no no Zambia 2013 no no Zimbabwe 2005 YES YES Zimbabwe 2010 no no
43
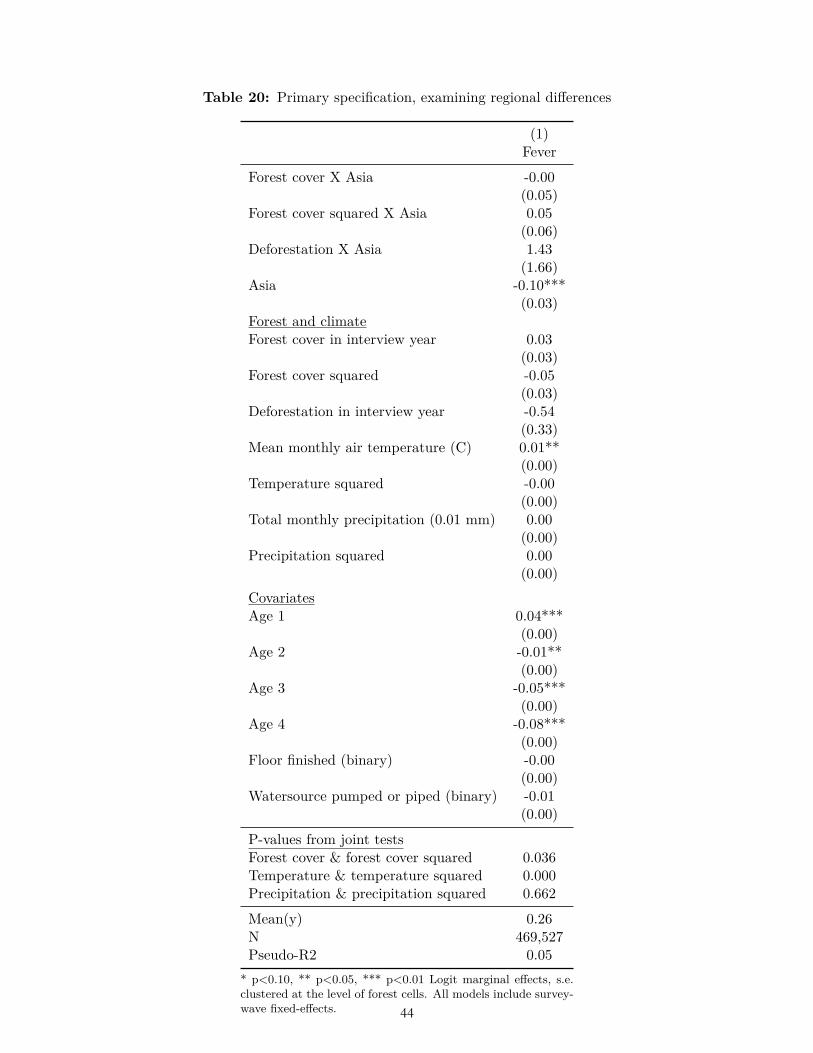
Table 20: Primary specification, examining regional differences
(1)Fever
Forest cover X Asia -0.00(0.05)
Forest cover squared X Asia 0.05(0.06)
Deforestation X Asia 1.43(1.66)
Asia -0.10***(0.03)
Forest and climateForest cover in interview year 0.03
(0.03)Forest cover squared -0.05
(0.03)Deforestation in interview year -0.54
(0.33)Mean monthly air temperature (C) 0.01**
(0.00)Temperature squared -0.00
(0.00)Total monthly precipitation (0.01 mm) 0.00
(0.00)Precipitation squared 0.00
(0.00)CovariatesAge 1 0.04***
(0.00)Age 2 -0.01**
(0.00)Age 3 -0.05***
(0.00)Age 4 -0.08***
(0.00)Floor finished (binary) -0.00
(0.00)Watersource pumped or piped (binary) -0.01
(0.00)
P-values from joint testsForest cover & forest cover squared 0.036Temperature & temperature squared 0.000Precipitation & precipitation squared 0.662
Mean(y) 0.26N 469,527Pseudo-R2 0.05
* p<0.10, ** p<0.05, *** p<0.01 Logit marginal effects, s.e.clustered at the level of forest cells. All models include survey-wave fixed-effects.
22
44

Table 21: Primary specification, examining earlier vs later stage of forest transition
(1) (2) (3)Rapid Lab Fever
Forest cover X deforestation -4.69 2.05 -0.24(4.77) (7.83) (1.53)
Forest and climateForest cover in interview year 0.03 -0.29*** 0.02
(0.12) (0.11) (0.03)Forest cover squared -0.05 0.26** -0.03
(0.13) (0.12) (0.03)Deforestation in interview year 2.23 -1.32 -0.20
(3.45) (6.15) (1.02)Mean monthly air temperature (C) 0.12*** 0.19*** 0.01**
(0.04) (0.05) (0.00)Temperature squared -0.00** -0.00*** -0.00
(0.00) (0.00) (0.00)Total monthly precipitation (0.01 mm) 0.00 0.00 0.00
(0.00) (0.00) (0.00)Precipitation squared -0.00* -0.00** 0.00
(0.00) (0.00) (0.00)CovariatesAge 1 0.08*** 0.08*** 0.04***
(0.02) (0.01) (0.00)Age 2 0.12*** 0.14*** -0.01**
(0.02) (0.01) (0.00)Age 3 0.16*** 0.18*** -0.05***
(0.02) (0.01) (0.00)Age 4 0.18*** 0.20*** -0.08***
(0.02) (0.02) (0.00)Floor finished (binary) -0.06*** -0.04* -0.00
(0.02) (0.02) (0.00)Watersource pumped or piped (binary) -0.14*** -0.12*** -0.01
(0.02) (0.02) (0.00)
P-values from joint testsForest cover & forest cover squared 0.869 0.015 0.539Temperature & temperature squared 0.000 0.000 0.000Precipitation & precipitation squared 0.461 0.279 0.667
Mean(y) 0.38 0.34 0.26N 60,305 56,883 469,527Pseudo-R2 0.14 0.11 0.05
* p<0.10, ** p<0.05, *** p<0.01 Logit marginal effects, s.e. clustered at the level offorest cells. All models include survey-wave fixed-effects.
23
45
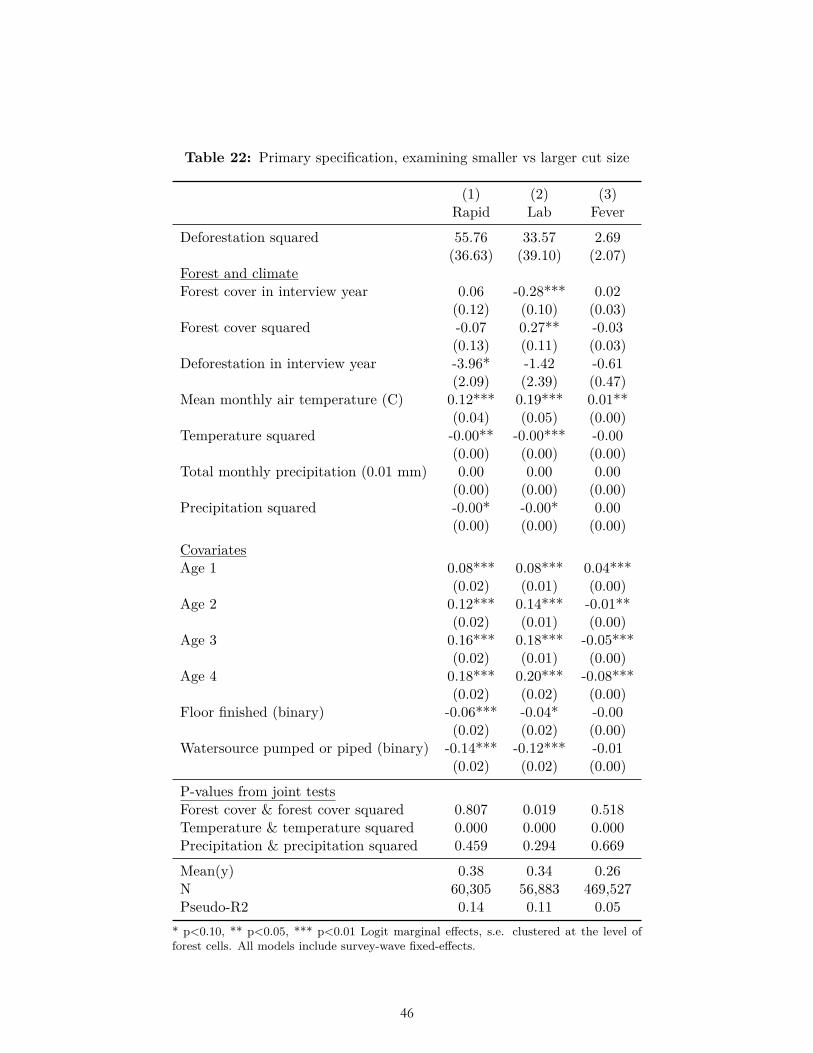
Table 22: Primary specification, examining smaller vs larger cut size
(1) (2) (3)Rapid Lab Fever
Deforestation squared 55.76 33.57 2.69(36.63) (39.10) (2.07)
Forest and climateForest cover in interview year 0.06 -0.28*** 0.02
(0.12) (0.10) (0.03)Forest cover squared -0.07 0.27** -0.03
(0.13) (0.11) (0.03)Deforestation in interview year -3.96* -1.42 -0.61
(2.09) (2.39) (0.47)Mean monthly air temperature (C) 0.12*** 0.19*** 0.01**
(0.04) (0.05) (0.00)Temperature squared -0.00** -0.00*** -0.00
(0.00) (0.00) (0.00)Total monthly precipitation (0.01 mm) 0.00 0.00 0.00
(0.00) (0.00) (0.00)Precipitation squared -0.00* -0.00* 0.00
(0.00) (0.00) (0.00)CovariatesAge 1 0.08*** 0.08*** 0.04***
(0.02) (0.01) (0.00)Age 2 0.12*** 0.14*** -0.01**
(0.02) (0.01) (0.00)Age 3 0.16*** 0.18*** -0.05***
(0.02) (0.01) (0.00)Age 4 0.18*** 0.20*** -0.08***
(0.02) (0.02) (0.00)Floor finished (binary) -0.06*** -0.04* -0.00
(0.02) (0.02) (0.00)Watersource pumped or piped (binary) -0.14*** -0.12*** -0.01
(0.02) (0.02) (0.00)
P-values from joint testsForest cover & forest cover squared 0.807 0.019 0.518Temperature & temperature squared 0.000 0.000 0.000Precipitation & precipitation squared 0.459 0.294 0.669
Mean(y) 0.38 0.34 0.26N 60,305 56,883 469,527Pseudo-R2 0.14 0.11 0.05
* p<0.10, ** p<0.05, *** p<0.01 Logit marginal effects, s.e. clustered at the level offorest cells. All models include survey-wave fixed-effects.
24
46
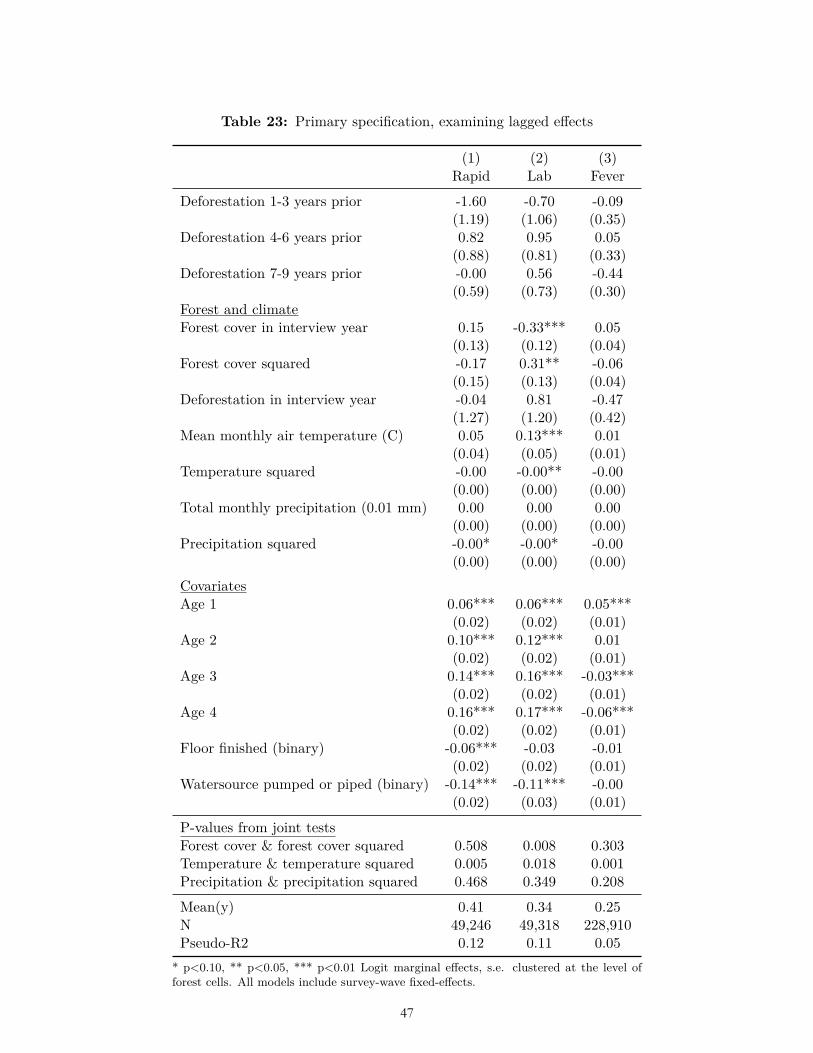
Table 23: Primary specification, examining lagged effects
(1) (2) (3)Rapid Lab Fever
Deforestation 1-3 years prior -1.60 -0.70 -0.09(1.19) (1.06) (0.35)
Deforestation 4-6 years prior 0.82 0.95 0.05(0.88) (0.81) (0.33)
Deforestation 7-9 years prior -0.00 0.56 -0.44(0.59) (0.73) (0.30)
Forest and climateForest cover in interview year 0.15 -0.33*** 0.05
(0.13) (0.12) (0.04)Forest cover squared -0.17 0.31** -0.06
(0.15) (0.13) (0.04)Deforestation in interview year -0.04 0.81 -0.47
(1.27) (1.20) (0.42)Mean monthly air temperature (C) 0.05 0.13*** 0.01
(0.04) (0.05) (0.01)Temperature squared -0.00 -0.00** -0.00
(0.00) (0.00) (0.00)Total monthly precipitation (0.01 mm) 0.00 0.00 0.00
(0.00) (0.00) (0.00)Precipitation squared -0.00* -0.00* -0.00
(0.00) (0.00) (0.00)CovariatesAge 1 0.06*** 0.06*** 0.05***
(0.02) (0.02) (0.01)Age 2 0.10*** 0.12*** 0.01
(0.02) (0.02) (0.01)Age 3 0.14*** 0.16*** -0.03***
(0.02) (0.02) (0.01)Age 4 0.16*** 0.17*** -0.06***
(0.02) (0.02) (0.01)Floor finished (binary) -0.06*** -0.03 -0.01
(0.02) (0.02) (0.01)Watersource pumped or piped (binary) -0.14*** -0.11*** -0.00
(0.02) (0.03) (0.01)
P-values from joint testsForest cover & forest cover squared 0.508 0.008 0.303Temperature & temperature squared 0.005 0.018 0.001Precipitation & precipitation squared 0.468 0.349 0.208
Mean(y) 0.41 0.34 0.25N 49,246 49,318 228,910Pseudo-R2 0.12 0.11 0.05
* p<0.10, ** p<0.05, *** p<0.01 Logit marginal effects, s.e. clustered at the level offorest cells. All models include survey-wave fixed-effects.
25
47
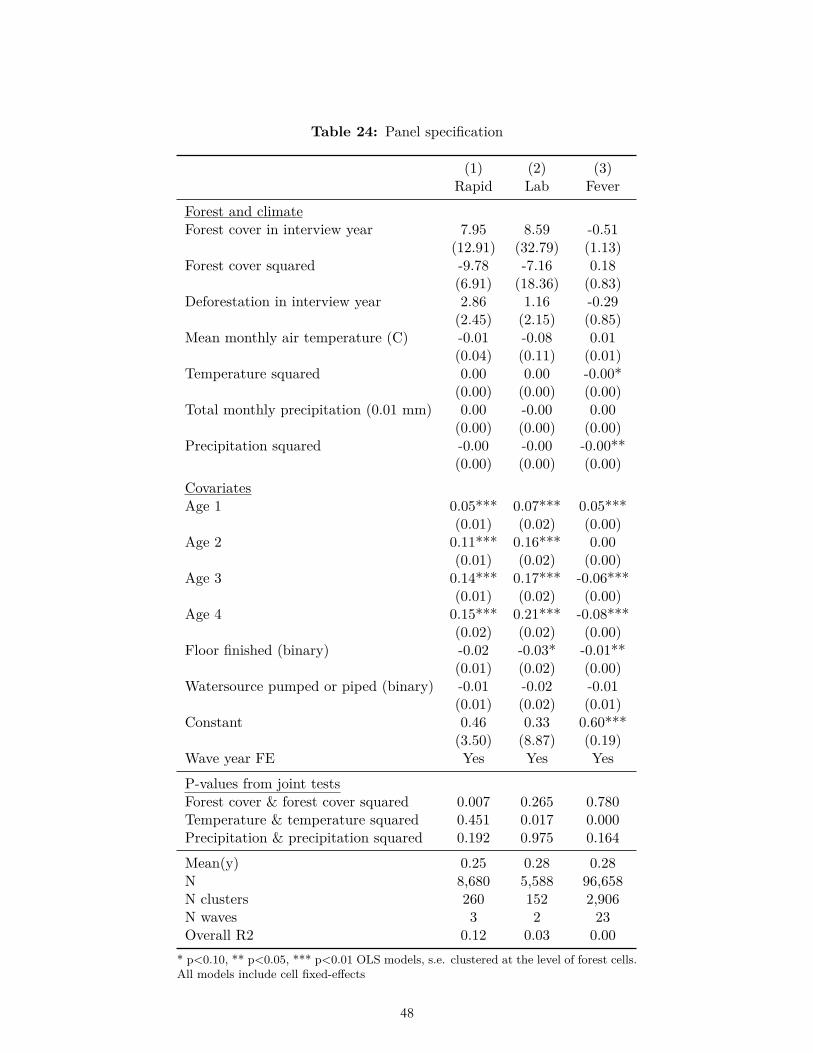
Table 24: Panel specification
(1) (2) (3)Rapid Lab Fever
Forest and climateForest cover in interview year 7.95 8.59 -0.51
(12.91) (32.79) (1.13)Forest cover squared -9.78 -7.16 0.18
(6.91) (18.36) (0.83)Deforestation in interview year 2.86 1.16 -0.29
(2.45) (2.15) (0.85)Mean monthly air temperature (C) -0.01 -0.08 0.01
(0.04) (0.11) (0.01)Temperature squared 0.00 0.00 -0.00*
(0.00) (0.00) (0.00)Total monthly precipitation (0.01 mm) 0.00 -0.00 0.00
(0.00) (0.00) (0.00)Precipitation squared -0.00 -0.00 -0.00**
(0.00) (0.00) (0.00)CovariatesAge 1 0.05*** 0.07*** 0.05***
(0.01) (0.02) (0.00)Age 2 0.11*** 0.16*** 0.00
(0.01) (0.02) (0.00)Age 3 0.14*** 0.17*** -0.06***
(0.01) (0.02) (0.00)Age 4 0.15*** 0.21*** -0.08***
(0.02) (0.02) (0.00)Floor finished (binary) -0.02 -0.03* -0.01**
(0.01) (0.02) (0.00)Watersource pumped or piped (binary) -0.01 -0.02 -0.01
(0.01) (0.02) (0.01)Constant 0.46 0.33 0.60***
(3.50) (8.87) (0.19)Wave year FE Yes Yes Yes
P-values from joint testsForest cover & forest cover squared 0.007 0.265 0.780Temperature & temperature squared 0.451 0.017 0.000Precipitation & precipitation squared 0.192 0.975 0.164
Mean(y) 0.25 0.28 0.28N 8,680 5,588 96,658N clusters 260 152 2,906N waves 3 2 23Overall R2 0.12 0.03 0.00
* p<0.10, ** p<0.05, *** p<0.01 OLS models, s.e. clustered at the level of forest cells.All models include cell fixed-effects
26
48
Related Documents