Risk Analysis, Vol. 29, No. 8, 2009 DOI: 10.1111/j.1539-6924.2009.01252.x Does Communicating (Flood) Risk Affect (Flood) Risk Perceptions? Results of a Quasi-Experimental Study Teun Terpstra, 1, ∗ Michael K. Lindell, 2 and Jan M. Gutteling 1 People’s risk perceptions are generally regarded as an important determinant of their deci- sions to adjust to natural hazards. However, few studies have evaluated how risk communi- cation programs affect these risk perceptions. This study evaluates the effects of a small-scale flood risk communication program in the Netherlands, consisting of workshops and focus group discussions. The effects on the workshop participants’ (n = 24) and focus group par- ticipants’ (n = 16) flood risk perceptions were evaluated in a pretest-posttest control group (n = 40) design that focused on two mechanisms of attitude change—direct personal expe- rience and attitude polarization. We expected that (H1) workshop participants would show greater shifts in their flood risk perceptions compared with control group participants and that (H2) focus groups would rather produce the conditions for attitude polarization (shifts toward more extreme attitudinal positions after group discussion). However, the results pro- vide only modest support for these hypotheses, perhaps because of a mismatch between the sessions’ contents and the risk perception measures. An important contribution of this study is that it examined risk perception data by both conventional tests of the mean differences and tests for attitude polarization. Moreover, the possibility that attitude polarization could cause people to confirm their preexisting (hazard) beliefs could have important implications for risk communication. KEY WORDS: Flood risk; personal experience; polarization; risk communication; risk perception 1. INTRODUCTION 1.1. Background Risk perception has long been theorized and empirically identified as an important predictor of people’s decisions to adjust to various kinds of natural hazards, including earthquakes, (1,2) flooding, (3–7) hurricanes, (8,9) tornadoes, (10) volca- noes, (11) and tsunamis. (12) Generally, higher levels of 1 University of Twente, Faculty of Behavioural Sciences, Psychol- ogy, & Communication of Health and Risk, The Netherlands. 2 Hazard Reduction & Recovery Center, Texas A&M University, College Station, TX, USA. ∗ Address correspondence to Teun Terpstra, University of Twente, PCHR, P.O. Box 217, 7500 AE Enschede, The Nether- lands; tel: 0031-651072570; fax: 0031-534894259; t.terpstra@ utwente.nl. perceived risk increase protection motivation. (13,14) Conversely, a low risk perception may lull people into a false sense of security and, as a result, cause them to overlook the risk as a threat that should be heeded. (15–18) Therefore, many studies focusing on individuals’ adjustments to natural hazards recom- mend that public authorities use risk communication to enhance people’s understanding of the hazards they face. Unfortunately, there are few studies that have evaluated the effects of risk communication pro- grams for natural hazards (19) and most of those have focused on earthquake hazard. For instance, Mileti and Fitzpatrick (20,21) and Mileti and Darlington (22) reported that earthquake risk communication pro- grams in California (the United States) had affected residents’ risk perceptions. In turn, elevated risk per- ceptions resulted in increased information-seeking 1141 0272-4332/09/0100-1141$22.00/1 C 2009 Society for Risk Analysis

Welcome message from author
This document is posted to help you gain knowledge. Please leave a comment to let me know what you think about it! Share it to your friends and learn new things together.
Transcript

Risk Analysis, Vol. 29, No. 8, 2009 DOI: 10.1111/j.1539-6924.2009.01252.x
Does Communicating (Flood) Risk Affect (Flood) RiskPerceptions? Results of a Quasi-Experimental Study
Teun Terpstra,1,∗ Michael K. Lindell,2 and Jan M. Gutteling1
People’s risk perceptions are generally regarded as an important determinant of their deci-sions to adjust to natural hazards. However, few studies have evaluated how risk communi-cation programs affect these risk perceptions. This study evaluates the effects of a small-scaleflood risk communication program in the Netherlands, consisting of workshops and focusgroup discussions. The effects on the workshop participants’ (n = 24) and focus group par-ticipants’ (n = 16) flood risk perceptions were evaluated in a pretest-posttest control group(n = 40) design that focused on two mechanisms of attitude change—direct personal expe-rience and attitude polarization. We expected that (H1) workshop participants would showgreater shifts in their flood risk perceptions compared with control group participants andthat (H2) focus groups would rather produce the conditions for attitude polarization (shiftstoward more extreme attitudinal positions after group discussion). However, the results pro-vide only modest support for these hypotheses, perhaps because of a mismatch between thesessions’ contents and the risk perception measures. An important contribution of this studyis that it examined risk perception data by both conventional tests of the mean differencesand tests for attitude polarization. Moreover, the possibility that attitude polarization couldcause people to confirm their preexisting (hazard) beliefs could have important implicationsfor risk communication.
KEY WORDS: Flood risk; personal experience; polarization; risk communication; risk perception
1. INTRODUCTION
1.1. Background
Risk perception has long been theorized andempirically identified as an important predictorof people’s decisions to adjust to various kindsof natural hazards, including earthquakes,(1,2)
flooding,(3–7) hurricanes,(8,9) tornadoes,(10) volca-noes,(11) and tsunamis.(12) Generally, higher levels of
1 University of Twente, Faculty of Behavioural Sciences, Psychol-ogy, & Communication of Health and Risk, The Netherlands.
2 Hazard Reduction & Recovery Center, Texas A&M University,College Station, TX, USA.
∗ Address correspondence to Teun Terpstra, University ofTwente, PCHR, P.O. Box 217, 7500 AE Enschede, The Nether-lands; tel: 0031-651072570; fax: 0031-534894259; [email protected].
perceived risk increase protection motivation.(13,14)
Conversely, a low risk perception may lull peopleinto a false sense of security and, as a result, causethem to overlook the risk as a threat that should beheeded.(15–18) Therefore, many studies focusing onindividuals’ adjustments to natural hazards recom-mend that public authorities use risk communicationto enhance people’s understanding of the hazardsthey face.
Unfortunately, there are few studies that haveevaluated the effects of risk communication pro-grams for natural hazards(19) and most of those havefocused on earthquake hazard. For instance, Miletiand Fitzpatrick(20,21) and Mileti and Darlington(22)
reported that earthquake risk communication pro-grams in California (the United States) had affectedresidents’ risk perceptions. In turn, elevated risk per-ceptions resulted in increased information-seeking
1141 0272-4332/09/0100-1141$22.00/1 C© 2009 Society for Risk Analysis
1142 Terpstra, Lindell, and Gutteling
behaviors, especially when people had received mul-tiple risk information messages and knew otherswho had engaged in protective behavior. Similarly,Tanaka(23) reported that having received earthquakerisk information through a larger number of commu-nication channels resulted in higher levels of earth-quake preparedness in both Japan and California.Mulilis and his colleagues(24,25) conducted risk com-munication field experiments but the brochures werelimited to information that was directly relevant tospecific theoretical propositions of their person rel-ative to event theory and, thus, were not repre-sentative of typical risk communication programssuch as Putting Down Roots in Earthquake Coun-try (http://www.earthquakecountry.info). This sameproblem exists in other risk communication studiesthat have utilized laboratory experiments to test the-oretical propositions and, in addition, had homoge-neous groups of respondents.(2)
The dominant paradigm in these studies hasbeen the assumption from expectancy-valence mod-els of attitude formation that providing informationfrom scientific sources will change people’s existingbeliefs and add new beliefs about the hazard and pro-tective actions. In turn, these changed or new beliefsare expected to influence people to adopt individ-ual hazard adjustments (e.g., store enough food andwater to last for three days) or increase their sup-port for collective hazard adjustments (e.g., enactingmore stringent building codes). Most of these stud-ies have implicitly assumed that people already hadperceptions of the hazard before receiving the riskcommunication materials and that the effects of theserisk communication materials should be tested by as-sessing changes in the mean ratings on risk dimen-sions. However, as discussed below, neither of theseassumptions is necessarily correct.
This study reports the outcomes of a small-scaleflood risk communication program in the Nether-lands, which is internationally known for its strongflood defenses. The obvious advantage of an exten-sive system of flood control works such as dikes isthat it protects people and property against floodswhose magnitude is less than the events for whichthey were designed (e.g., a 1 in 1,250-year flood).However, the disadvantage of structural protectionworks is that research(26) and practical experience(e.g., New Orleans during Hurricane Katrina) showthat people tend to overestimate their effectiveness.Thus, people’s flood risk perceptions can be unre-alistically low.(27) There are many stakeholders thathave an interest in reducing flood losses but the re-sponsibility for increasing individual hazard aware-
ness and flood preparedness generally falls to localgovernment.(28) Consequently, governments need tocommunicate the (potentially severe) consequencesof floods and ways to prepare for them.(29) The gov-ernment flood risk communication program that wereport below consisted of both workshops and groupdiscussions. On the basis of contemporary theories ofinformation processing, attitude formation, and atti-tude change, we expected that these risk communi-cation formats would differ in their effects on partic-ipants’ risk perceptions.
1.2. Information Processing, Attitude Formation,and Attitude Change
Many different theoretical frameworks havebeen used to describe the ways in which peopleconstruct and express their beliefs (perceptions)and attitudes. These theories have identified twobroad categories of processes by which attitudes areexpressed—“top-down” and “bottom-up” process-ing of information.(30) In daily life, our behavioralchoices tend to be so familiar that it is unnecessary tothink of the arguments for or against those choices, soeveryday decisions are typically guided by habit, im-pulse, or rule. In such cases, an attitude is expressedthrough a mostly automatic (“top-down”) process by,for instance, retrieving an attitudinal judgment im-mediately from memory(31,32) or by inferring it im-mediately from a similar attitude object(33) or a moregeneral value or belief—such as (dis)trust in the gov-ernment.(34)
In other cases, people must engage in bottom-up processing because automatic top-down processeshave failed to produce an immediate judgment.(35)
Sometimes, automatic processes fail because therehas been no previous thought about that attitude ob-ject. When this is true, researchers’ attempts to elicitpeople’s attitudes can yield pseudo-attitudes,(34,36)
which are expressed when people are asked for theiropinions about issues for which they have no in-formation. Pseudo-attitudes are usually influencedby extraneous conditions in the measurement con-text and are likely to be extremely unreliable.(37)
However, when there is relevant information inmemory, people use bottom-up processes to con-struct attitudes by weighing the relevance of avail-able salient beliefs.(38) Van Harreveld and Van derPligt(31) showed experimentally that people are espe-cially likely to engage in bottom-up processing whenthey regard an issue as personally relevant or whenthey are more involved with that issue.
Flood Risk Perceptions 1143
Bottom-up processing of information is centralto persuasive arguments theory (PAT), which hasbeen characterized as “the most sophisticated andwell researched” theory explaining how shifts inchoices, attitudes, and perceptions occur after groupdiscussion.(39−41) PAT asserts that individuals recallpro and con arguments from memory and that thenumber and persuasiveness of recalled argumentsdetermine how individuals formulate their positions.During group discussions, the persuasive argumentsthat are expressed cause attitude shifts to the ex-tent that they are relevant, valid, and novel. Ar-guments are seen to be relevant when they areperceived as logically connected to the issue be-ing considered. Arguments are seen to be validwhen they seem to be accurate, especially whenthey are consistent with other arguments being pre-sented or with a person’s existing beliefs. Finally,arguments are seen to be novel when they presentnew information or new implications of existinginformation.
Of course, people will not easily change stronglyheld attitudes and perceptions that are linked tomany consonant beliefs.(42) In particular, more ex-treme attitudes have been found to be more resistantto change, more persistent over time, and more likelyto cause biases in information processing. In con-trast, people who hold neutral attitudes—i.e., eval-uations that are neither positive nor negative(43)—are equally receptive to information supporting ordiscrediting a position. When people have equalamounts of positive and negative information (or vir-tually no information), an attitude may be easy tochange.
There are two primary mechanisms of attitudechange that seem to be particularly relevant to riskcommunication programs—direct personal experi-ence and vicarious experience produced by socialcommunication.(44) Direct behavioral experience hasa greater potential than vicarious experiences, suchas verbal descriptions and pictorial information, toincrease attitude strength and subsequent behavior.This is because attitudes based on direct experienceare more accessible in memory.(45–47) In particular,personal hazard experience increases protection mo-tivation because it provides greater vividness and de-tail of hazard information, more rapid recall of rele-vant information, greater personal involvement, andlower levels of uncertainty.(48) In turn, increased pro-tection motivation causes people to pay greater at-tention to relevant information, stimulates the col-lection of more information, and makes them more
likely to adopt hazard adjustments that will protectthem and their property.
In addition to direct experience with the haz-ard itself, people can also have direct experiencewith hazard adjustments that affects their likelihoodof adoption. For example, they might see that theirneighbors have elevated their homes above the baseflood elevation, purchased flood-proofing materials,or developed flood evacuation plans. Such obser-vations might lead them to develop more realis-tic assessments of these hazard adjustments’ pro-tective efficacy and cost, as well as their require-ments for time and effort, knowledge and skill,tools and equipment, and social cooperation.(49) Per-sonal experience with hazard adjustments increasesadjustment adoption intentions by providing morevivid and detailed information and lower levels ofuncertainty.
Vicarious experience with either a hazard or haz-ard adjustments can also affect people’s protectionmotivation and hazard adjustment adoption in thesame ways as direct experience. The principal differ-ence is that vicarious experience is not as vivid, eas-ily recalled, or personally involving. Thus, it is not aslikely to increase protection motivation or producehazard adjustment adoption.
Another type of attitudinal change results fromattitude polarization, which is the tendency to shifttoward a more extreme position on the same pole ofthe attitude continuum. This can occur after groupdiscussion(39,50) or by personal reflection.(51) Specif-ically, when group members begin their discussionsby having generally similar nonneutral attitudes, anyrelevant, valid, and novel arguments that are sharedduring group discussions tend to be consistent withmembers’ existing attitudes, thus increasing theirconfidence in the correctness of these attitudes.(52)
Any arguments that are inconsistent with the emerg-ing group consensus tend to be suppressed, especiallyif there are strong pressures against expressing dis-agreement.(53)
Interestingly, attitude polarization can also occurwhen people merely think about an attitude object—even without engaging in group discussions. Accord-ing to Tesser,(51) this occurs because thought aboutan object tends to generate additional beliefs thatare evaluatively consistent with the first thoughtsthat come to mind. Such a “self-generated attitudechange” does not occur in all people, nor does it oc-cur in all situations,(41,54) but it could produce atti-tude changes over time among people who are askedabout an attitude object but are not provided with

1144 Terpstra, Lindell, and Gutteling
additional information about it. That is, participationin a group discussion may be a sufficient conditionfor attitude polarization but may not be a necessarycondition for it.
In summary, the more individuals engage in di-rect behavioral experiences, the more they have vi-carious experience that exposes them to relevant,valid, and novel information, the more they reflecton the information they have, and the stronger isthe potential for them to change their attitudes, es-pecially when the attitude is weak. Strong attitudesmay become more extreme, but behavioral experi-ences and persuasive arguments, with a high degreeof relevance, validity, and novelty, favoring an oppo-site attitude may cause moderation toward the neu-tral point or even shifts to the opposite attitudinalposition.
One important attitude domain is the natural en-vironment, especially attitudes and behavior regard-ing environmental extremes such as floods. Beliefsand attitudes toward flood risk, such as those involv-ing many types of technologies and societal activities,can be addressed by means of a set of risk dimensionsin the “psychometric paradigm.”(55) An extensivebody of research dating back to Fischhoff et al.(56) hasdemonstrated the utility of two basic factors, dreadrisk and unknown risk, each of which is defined bya larger number of specific risk dimensions. Thesedimensions have been replicated in many differentcountries by people judging many different types ofhazardous technologies and activities. Consequently,they are likely to provide a useful basis for character-izing people’s perceptions of flood risk as well.
1.3. Aims and Hypotheses
This study focuses on whether direct personal ex-perience and vicarious experience obtained throughrisk communication cause changes in individuals’beliefs and attitudes toward flood hazard—that is,their flood risk perceptions. Inhabitants of two Dutchprovinces were invited to participate in a number ofworkshops consisting of a variety of activities thatwere supervised by flood risk experts who sharedtheir knowledge with the participants. In contrast, athird province organized one-time focus group dis-cussions that were led by group facilitators who hadno expertise in flood hazards. Thus, the workshopshad a highly experiential character, while the one-time focus group discussions used exclusively verbalcommunication. We therefore propose the followinghypotheses.
H1: Participants in multisession experientialworkshops with experts on flood risk willhave greater changes in their mean ratings offlood risk perceptions than will members of acontrol group.
The rationale for this hypothesis is that membersof the workshop group have spent an extended pe-riod of time involving direct personal experience withflood hazard mitigation projects. Compared with oth-ers who lack such direct personal experience (thecontrol group), the workshop group is expected toexperience a powerful effect on attitude formationand change. Moreover, the workshops are designedand conducted by flood risk experts who have a sys-tematic point of view that they are likely to havecommunicated to the participants. Consequently, theworkshop participants are likely to have receivedrelevant, valid, and novel arguments that “[e]xpertsare trustworthy but lack public support so the risksare increasing. Moreover, the risks are known to sci-ence even if not to those exposed and should not bedreaded because they are controllable.” Specifically,the workshop participants are likely to change theirrisk perceptions in the direction advocated by the ex-perts conducting the workshops.
H2: Participants in one-time focus group discus-sions are expected to have a higher degree ofpolarization shifts than members of a controlgroup.
The rationale for this hypothesis is that thosewho engage in one-time focus group discussions havespent an extended period of time talking about floodhazard but are unlikely to have encountered a coher-ent set of relevant, valid, and novel arguments ad-vocating attitude change in a single direction. Thus,they are more likely to have experienced the con-ditions that typically facilitate group polarization.(39)
That is, any persuasive arguments that they en-counter during group discussions are likely to be con-sistent with the first opinions expressed. Thus, focusgroups members will have more polarized risk per-ceptions after discussion than they had initially.
H3: Because they receive no information aboutflood risk, control group members will exhibitno systematic changes in their mean risk per-ceptions. However, the pretest will stimulatecontrol group members to reflect on the ques-tionnaire items, resulting in a polarization oftheir risk perceptions.
Flood Risk Perceptions 1145
There are two critical aspects of this hypothe-sis. First, pretests can have a sensitizing effect on re-spondents, which is why texts on experimental andquasi-experimental design advocate using posttest-only control groups to supplement pretest-posttestdesigns.(57) However, these methodologists have notidentified the specific mechanisms by which this “sen-sitization” affects people’s attitudes. Thus, the sec-ond critical aspect of the hypothesis is that, as notedpreviously, Tesser’s(51) theory of self-generated at-titude change predicts that people who spend timeruminating about an attitude object will tend toproduce increasingly polarized attitudes toward thatobject.
2. METHOD
2.1. Design of Risk Communication Activitiesand Procedures
In November 2002, governmental bodies fromthree Dutch provinces joined a European project onflood hazard. All three provinces are protected byflood defense structures—either from the tidal Wad-den Sea or from the large fresh water Lake IJssel,or both—designed to withstand flooding that occurswith a probability of 1/4,000 per year. For a com-parison, the city of London (the United Kingdom) isprotected against flooding by 1/1,000 per year, whilesafety norms in the United States are commonly1/100 per year.(29)
Provincial inhabitants were invited to participatein workshops and focus groups on flood risk. Twoseries of four workshops each were conducted inthe provinces of Flevoland and Friesland, one se-ries in each province between September 27, 2004(first workshop in Friesland) and January 17, 2005 (fi-nal workshop in Flevoland). These workshops, whichwere supervised by experts from public water au-thorities, gave the participants direct experience withflood hazard adjustments. To increase the effective-ness of the workshops, we developed a variety of ac-tivities that allowed the participants to have physicalencounters with flood risk management (e.g., visit-ing dike reinforcement projects and pumping stationsand walking through flood plains), conceptual ex-periences (e.g., playing board games involving land-use planning to decrease local flood vulnerability, at-tending lectures about flood hazards, and listening tofictional flood disaster stories), and face-to-face com-munication with key stakeholders (e.g., having dis-cussions with the local representative responsible forflood risk management and flood risk experts).
In Groningen, the inhabitants were invited toparticipate in focus group discussions. Two focusgroups were organized on September 29, 2005, in co-operation with the Dutch Institute for Public Opin-ion and Market Research (TNS NIPO). Each focusgroup, which met only once for two hours, was ledby mediators from the TNS NIPO (none of themwere experts on flood risk) who interviewed the par-ticipants by addressing several aspects of flood risk.Thus, even though the focus group members mighthave had equivalent experience with flood hazard,they had less direct experience with flood hazardadjustments.
Changes in participants’ flood risk perceptionswere measured in a pretest-posttest control groupquasi-experimental design. This study is classified asa quasi-experiment because the participants were notrandomly assigned to treatments.(57) Such designscannot rule out the possibility that posttest differ-ences among groups are due to preexisting differ-ences among the participants. The workshop par-ticipants completed the pretest questionnaire twoweeks before the first workshop and the posttestquestionnaire two weeks after the fourth workshop.The workshops were held one month apart, makingthe total time between pretest and posttest equal tofour months. The focus group participants followed asimilar procedure, each completing the pretest twoweeks before and the posttest questionnaires twoweeks after their focus group session. We controlledfor history effects by administering questionnaires totwo control groups that did not participate in eitherthe workshops or the focus groups. Individuals in thefirst control group completed the pretest and posttestquestionnaire at the same time as the participants inthe workshops, while the second control group paral-leled the focus groups.
2.2. Participants and External Influences
Participants in Friesland were selected by send-ing invitation letters to candidates who had rununsuccessfully during the previous elections forpositions in the general administration of the localwater board. From a substantial number of inter-ested respondents, 11 individuals were selected toparticipate in the workshops and 8 were selectedto participate in the control group. In Flevoland, theparticipants were approached via a number of so-cial and community platforms. Of the 19 individualswho enrolled, 13 individuals participated in the work-shops, while 6 participated in the control group. Theparticipants in the two focus groups and the control

1146 Terpstra, Lindell, and Gutteling
Table I. Demographic Characteristics ofthe Sample
Workshops Workshops Focus Groups Control Group Control GroupFlevoland Friesland Groningen Workshops Focus Groups Total
Male 6 10 9 10 10 45Female 7 1 7 4 16 35Age 25–70 20–65 20–70 25–65 20–70
Table II. Internal Consistency Reliabilities of the Scales
No. of Pretest PosttestScale Interpretation Items α α
Increasing risk Extent to which the risk is perceived as “increasing” 4 0.83 0.83Dread Extent to which the risk is “dreaded” (causing fear, emotional unrest, or stress) 3 0.75 0.67Known to exposed (KtE) Extent to which people believe they “know” the risk 2 0.61 0.65Known to science (KtS) Extent to which the risk is perceived as “known to experts/science” 2 0.59 0.55Control Extent to which people believe they can control the risk and/or their safety 2 0.32 0.57Trust Extent to which authorities are “trusted” in their information dissemination
about a risk (trust in the openness of authorities)2 0.66 0.65
Support Extent to which risk-reducing measures are perceived to be “supported” by thepublic
2 0.46 0.46
group in Groningen were drawn from the TNS-NIPOdatabase. Eight individuals participated in each focusgroup, while the control group consisted of 26 indi-viduals.
In all groups, the participants were selected toproduce a range of ages, professions, and locations ofresidence. The workshop participants were not paidfor their participation, but the participants of the fo-cus groups were compensated. Table I shows the de-mographics of the participants.
Two major events occurred during the study pe-riod (September 13, 2004–October 13, 2005) thatcould have influenced the participants’ risk percep-tions. During the course of the workshops, southeastAsia was struck by a tsunami (December 26, 2004),while at the end of August 2005—shortly before thefocus group sessions in Groningen—the south coastof the United States was struck by Hurricane Kat-rina, causing catastrophic flooding in New Orleans.The participants discussed these events during thesessions. We were not able to control for the po-tential effects of these events on risk perceptions.However, these events would be expected to affectthe control groups just as much as the workshop andfocus groups. Consequently, any systematic changesin the risk perceptions of the control groups shouldserve as indicators of these history effects.
2.3. Measures
The respondents were asked to complete aquestionnaire that was based on the psychometric
model.(55) A previous version of the questionnairewas tested in the summer of 2004 on a separate sam-ple (n = 49) of respondents.(58) To improve the ques-tionnaire’s psychometric properties, we removed andadded some new items, which resulted in the sevenmulti-item scales measuring flood risk perceptionsand attitudes toward flood risk management in thisstudy. The items were presented in the form ofstatements on five-point Likert scales ranging from“strongly disagree” to “strongly agree.” As Table IIindicates, five scales reflected the degree to whichflood risk is perceived as an increasing risk (4 items),as dreaded (3 items), as known to those exposed (2items), as known to science (2 items), and as one theycan control in case of actual flooding (2 items). Theother two scales measured the degree to which au-thorities are perceived as trustworthy (2 items) andthe respondents believe that there is support amongmembers of the Dutch society for collective risk mit-igation measures such as the construction of newflood defenses (2 items). There were good internalconsistencies (measured by Cronbach’s α) for thefour- and three-item scales and substantially poorerinternal consistencies for the two-item scales. Finally,the respondents reported their gender, level of for-mal education, and profession.
2.4. Statistical Analysis
All statistical analyses were performed usingthe Statistical Package for Social Sciences, version12 (SPSS Inc., Chicago, IL, USA). We analyzed
Flood Risk Perceptions 1147
shifts in risk perceptions using two different mea-sures: raw scores and polarization scores. In theanalysis of raw scores, we evaluated the effectsof the information treatments over time by con-ducting a repeated-measures multivariate analysisof variance (MANOVA), with the factor informa-tion treatment (workshop groups, focus groups, andcontrol groups) measured as the between-subjectfactor and pretest-posttest measured as the within-subject factor. In addition, we evaluated effect sizeson each of the scales by computing Cohen’s d withingroups (Mposttest – Mpretest/spooled). Following the ty-pology proposed by Lindell and Perry,(59) we clas-sified pretest-posttest changes based on the signifi-cance of the pretest-posttest correlations in additionto the pretest-posttest mean differences (pairedt-tests).
We conducted an analysis of polarization scoresbecause Rodrigo and Ato(50) showed that changesin the means on an aggregate level, as in an(M)ANOVA, do not provide unequivocal evidenceof the presence or absence of polarization. To as-sess the extent of polarization, we first determinedwhether an individual posttest item response showeda shift toward a higher value on the same pole asits pretest counterpart. When there was no changeor there was a change toward the opposite pole, welabeled that individual as showing no polarization.Second, we counted the number of respondents whoshowed polarization and no polarization separatelyfor each of the seven scales and, within scales, sep-arately for each of the three information conditions(workshop groups, focus groups, and control groups).Last, we calculated the frequencies of polarizationand no polarization and analyzed the resulting con-tingency tables using χ2 statistics.
risk increasing
dread
known to exposed
public support
known to science
control
trustworthy
1 2 3 4 5 1 2 3 4 5 1 2 3 4 5
risk not increasing
no dread
unknown to exposed
lack of public support
unknown to science
lack of control
not trustworthy
ControlFocusWorkshops
pretest
posttest
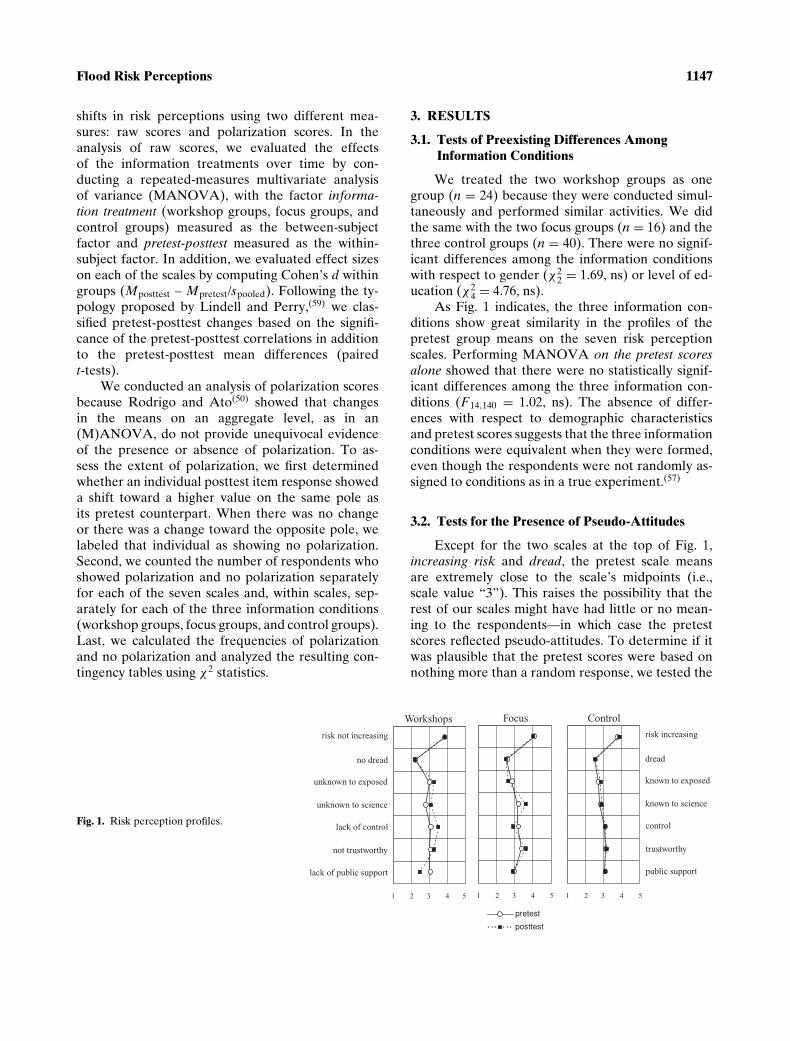
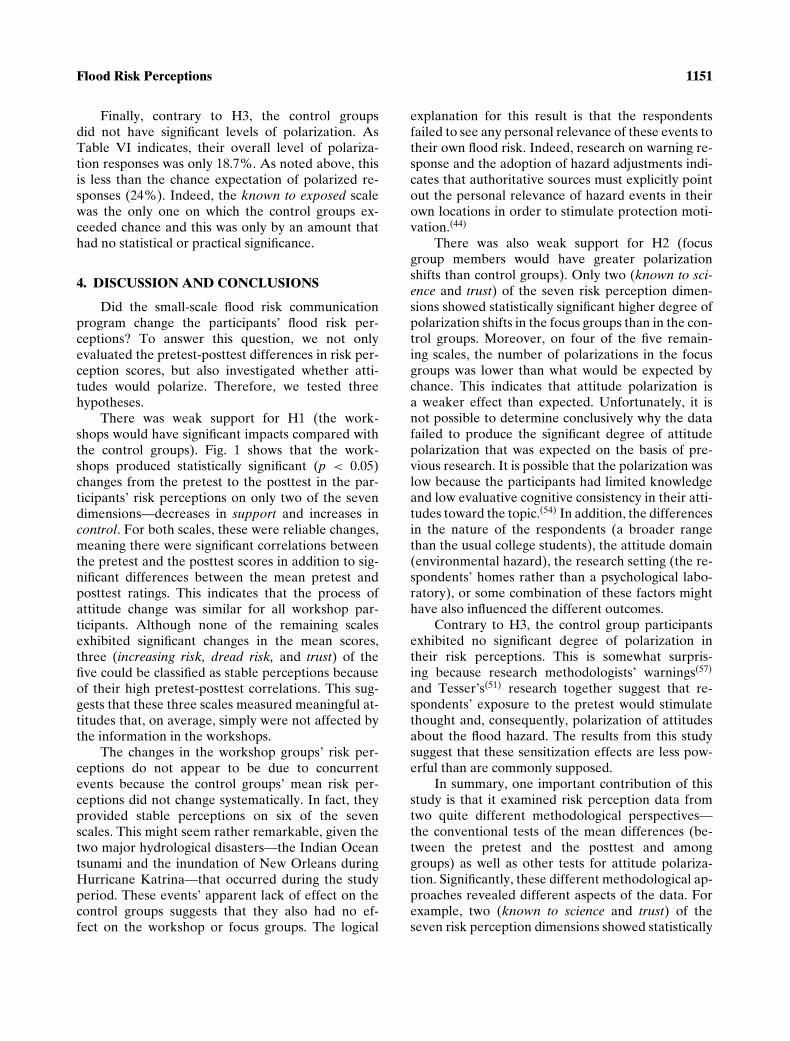
Fig. 1. Risk perception profiles.
3. RESULTS
3.1. Tests of Preexisting Differences AmongInformation Conditions
We treated the two workshop groups as onegroup (n = 24) because they were conducted simul-taneously and performed similar activities. We didthe same with the two focus groups (n = 16) and thethree control groups (n = 40). There were no signif-icant differences among the information conditionswith respect to gender (χ2
2 = 1.69, ns) or level of ed-ucation (χ2
4 = 4.76, ns).As Fig. 1 indicates, the three information con-
ditions show great similarity in the profiles of thepretest group means on the seven risk perceptionscales. Performing MANOVA on the pretest scoresalone showed that there were no statistically signif-icant differences among the three information con-ditions (F 14,140 = 1.02, ns). The absence of differ-ences with respect to demographic characteristicsand pretest scores suggests that the three informationconditions were equivalent when they were formed,even though the respondents were not randomly as-signed to conditions as in a true experiment.(57)
3.2. Tests for the Presence of Pseudo-Attitudes
Except for the two scales at the top of Fig. 1,increasing risk and dread, the pretest scale meansare extremely close to the scale’s midpoints (i.e.,scale value “3”). This raises the possibility that therest of our scales might have had little or no mean-ing to the respondents—in which case the pretestscores reflected pseudo-attitudes. To determine if itwas plausible that the pretest scores were based onnothing more than a random response, we tested the
1148 Terpstra, Lindell, and Gutteling
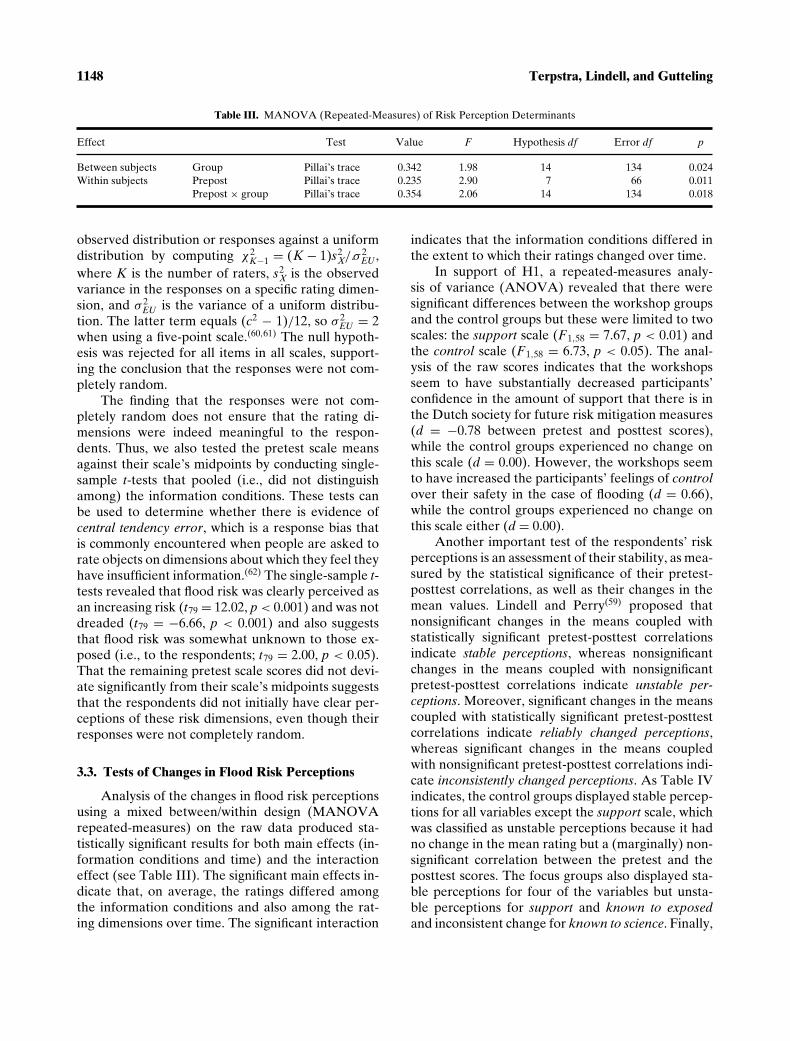
Table III. MANOVA (Repeated-Measures) of Risk Perception Determinants
Effect Test Value F Hypothesis df Error df p
Between subjects Group Pillai’s trace 0.342 1.98 14 134 0.024Within subjects Prepost Pillai’s trace 0.235 2.90 7 66 0.011
Prepost × group Pillai’s trace 0.354 2.06 14 134 0.018
observed distribution or responses against a uniformdistribution by computing χ2
K−1 = (K − 1)s2X/.σ 2
EU ,where K is the number of raters, s2
X is the observedvariance in the responses on a specific rating dimen-sion, and σ 2
EU is the variance of a uniform distribu-tion. The latter term equals (c2 − 1)/12, so σ 2
EU = 2when using a five-point scale.(60,61) The null hypoth-esis was rejected for all items in all scales, support-ing the conclusion that the responses were not com-pletely random.
The finding that the responses were not com-pletely random does not ensure that the rating di-mensions were indeed meaningful to the respon-dents. Thus, we also tested the pretest scale meansagainst their scale’s midpoints by conducting single-sample t-tests that pooled (i.e., did not distinguishamong) the information conditions. These tests canbe used to determine whether there is evidence ofcentral tendency error, which is a response bias thatis commonly encountered when people are asked torate objects on dimensions about which they feel theyhave insufficient information.(62) The single-sample t-tests revealed that flood risk was clearly perceived asan increasing risk (t79 = 12.02, p < 0.001) and was notdreaded (t79 = −6.66, p < 0.001) and also suggeststhat flood risk was somewhat unknown to those ex-posed (i.e., to the respondents; t79 = 2.00, p < 0.05).That the remaining pretest scale scores did not devi-ate significantly from their scale’s midpoints suggeststhat the respondents did not initially have clear per-ceptions of these risk dimensions, even though theirresponses were not completely random.
3.3. Tests of Changes in Flood Risk Perceptions
Analysis of the changes in flood risk perceptionsusing a mixed between/within design (MANOVArepeated-measures) on the raw data produced sta-tistically significant results for both main effects (in-formation conditions and time) and the interactioneffect (see Table III). The significant main effects in-dicate that, on average, the ratings differed amongthe information conditions and also among the rat-ing dimensions over time. The significant interaction
indicates that the information conditions differed inthe extent to which their ratings changed over time.
In support of H1, a repeated-measures analy-sis of variance (ANOVA) revealed that there weresignificant differences between the workshop groupsand the control groups but these were limited to twoscales: the support scale (F 1,58 = 7.67, p < 0.01) andthe control scale (F 1,58 = 6.73, p < 0.05). The anal-ysis of the raw scores indicates that the workshopsseem to have substantially decreased participants’confidence in the amount of support that there is inthe Dutch society for future risk mitigation measures(d = −0.78 between pretest and posttest scores),while the control groups experienced no change onthis scale (d = 0.00). However, the workshops seemto have increased the participants’ feelings of controlover their safety in the case of flooding (d = 0.66),while the control groups experienced no change onthis scale either (d = 0.00).
Another important test of the respondents’ riskperceptions is an assessment of their stability, as mea-sured by the statistical significance of their pretest-posttest correlations, as well as their changes in themean values. Lindell and Perry(59) proposed thatnonsignificant changes in the means coupled withstatistically significant pretest-posttest correlationsindicate stable perceptions, whereas nonsignificantchanges in the means coupled with nonsignificantpretest-posttest correlations indicate unstable per-ceptions. Moreover, significant changes in the meanscoupled with statistically significant pretest-posttestcorrelations indicate reliably changed perceptions,whereas significant changes in the means coupledwith nonsignificant pretest-posttest correlations indi-cate inconsistently changed perceptions. As Table IVindicates, the control groups displayed stable percep-tions for all variables except the support scale, whichwas classified as unstable perceptions because it hadno change in the mean rating but a (marginally) non-significant correlation between the pretest and theposttest scores. The focus groups also displayed sta-ble perceptions for four of the variables but unsta-ble perceptions for support and known to exposedand inconsistent change for known to science. Finally,
Flood Risk Perceptions 1149
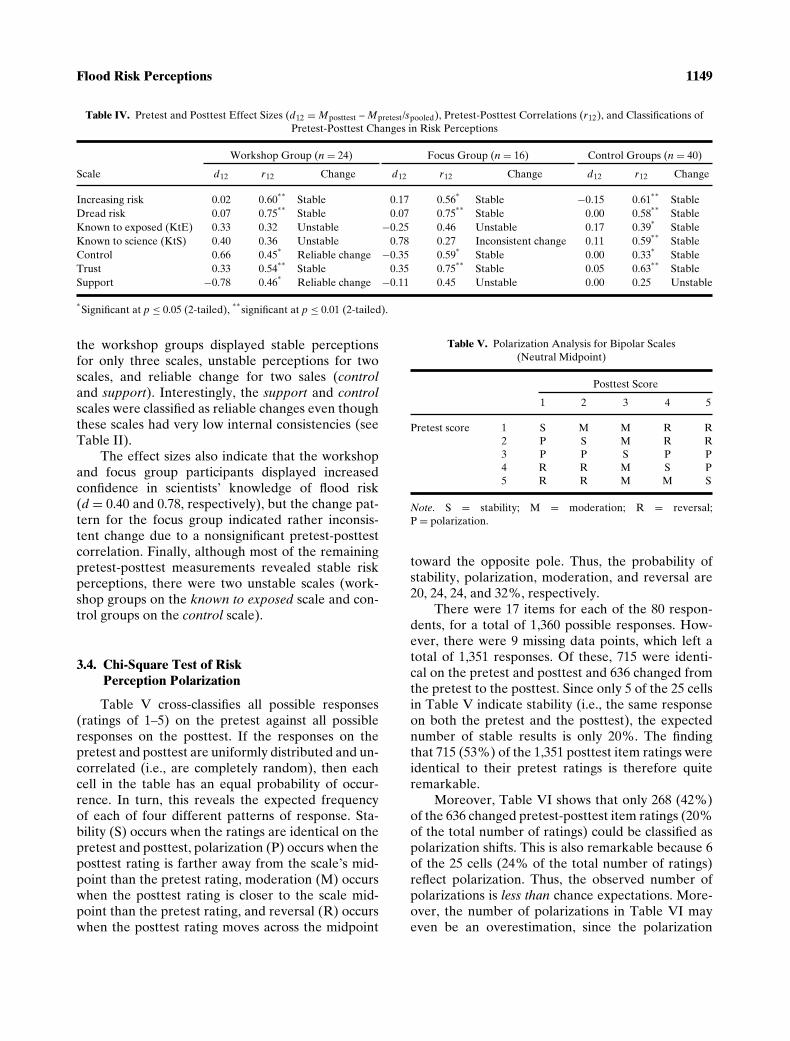
Table IV. Pretest and Posttest Effect Sizes (d12 = Mposttest – Mpretest/spooled), Pretest-Posttest Correlations (r12), and Classifications ofPretest-Posttest Changes in Risk Perceptions
Workshop Group (n = 24) Focus Group (n = 16) Control Groups (n = 40)
Scale d12 r12 Change d12 r12 Change d12 r12 Change
Increasing risk 0.02 0.60∗∗
Stable 0.17 0.56∗
Stable −0.15 0.61∗∗
StableDread risk 0.07 0.75
∗∗Stable 0.07 0.75
∗∗Stable 0.00 0.58
∗∗Stable
Known to exposed (KtE) 0.33 0.32 Unstable −0.25 0.46 Unstable 0.17 0.39∗
StableKnown to science (KtS) 0.40 0.36 Unstable 0.78 0.27 Inconsistent change 0.11 0.59
∗∗Stable
Control 0.66 0.45∗
Reliable change −0.35 0.59∗
Stable 0.00 0.33∗
StableTrust 0.33 0.54
∗∗Stable 0.35 0.75
∗∗Stable 0.05 0.63
∗∗Stable
Support −0.78 0.46∗
Reliable change −0.11 0.45 Unstable 0.00 0.25 Unstable
∗Significant at p ≤ 0.05 (2-tailed),
∗∗significant at p ≤ 0.01 (2-tailed).
the workshop groups displayed stable perceptionsfor only three scales, unstable perceptions for twoscales, and reliable change for two sales (controland support). Interestingly, the support and controlscales were classified as reliable changes even thoughthese scales had very low internal consistencies (seeTable II).
The effect sizes also indicate that the workshopand focus group participants displayed increasedconfidence in scientists’ knowledge of flood risk(d = 0.40 and 0.78, respectively), but the change pat-tern for the focus group indicated rather inconsis-tent change due to a nonsignificant pretest-posttestcorrelation. Finally, although most of the remainingpretest-posttest measurements revealed stable riskperceptions, there were two unstable scales (work-shop groups on the known to exposed scale and con-trol groups on the control scale).
3.4. Chi-Square Test of RiskPerception Polarization
Table V cross-classifies all possible responses(ratings of 1–5) on the pretest against all possibleresponses on the posttest. If the responses on thepretest and posttest are uniformly distributed and un-correlated (i.e., are completely random), then eachcell in the table has an equal probability of occur-rence. In turn, this reveals the expected frequencyof each of four different patterns of response. Sta-bility (S) occurs when the ratings are identical on thepretest and posttest, polarization (P) occurs when theposttest rating is farther away from the scale’s mid-point than the pretest rating, moderation (M) occurswhen the posttest rating is closer to the scale mid-point than the pretest rating, and reversal (R) occurswhen the posttest rating moves across the midpoint
Table V. Polarization Analysis for Bipolar Scales(Neutral Midpoint)
Posttest Score
1 2 3 4 5
Pretest score 1 S M M R R2 P S M R R3 P P S P P4 R R M S P5 R R M M S
Note. S = stability; M = moderation; R = reversal;P = polarization.
toward the opposite pole. Thus, the probability ofstability, polarization, moderation, and reversal are20, 24, 24, and 32%, respectively.
There were 17 items for each of the 80 respon-dents, for a total of 1,360 possible responses. How-ever, there were 9 missing data points, which left atotal of 1,351 responses. Of these, 715 were identi-cal on the pretest and posttest and 636 changed fromthe pretest to the posttest. Since only 5 of the 25 cellsin Table V indicate stability (i.e., the same responseon both the pretest and the posttest), the expectednumber of stable results is only 20%. The findingthat 715 (53%) of the 1,351 posttest item ratings wereidentical to their pretest ratings is therefore quiteremarkable.
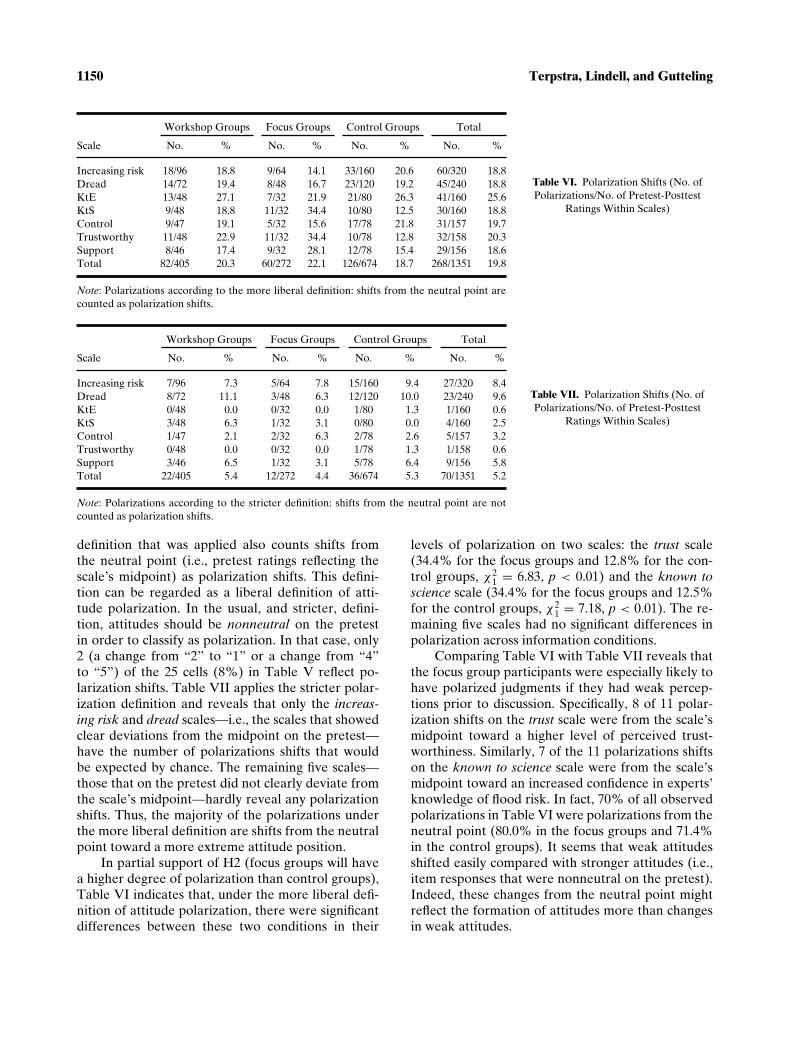
Moreover, Table VI shows that only 268 (42%)of the 636 changed pretest-posttest item ratings (20%of the total number of ratings) could be classified aspolarization shifts. This is also remarkable because 6of the 25 cells (24% of the total number of ratings)reflect polarization. Thus, the observed number ofpolarizations is less than chance expectations. More-over, the number of polarizations in Table VI mayeven be an overestimation, since the polarization
1150 Terpstra, Lindell, and Gutteling
Table VI. Polarization Shifts (No. ofPolarizations/No. of Pretest-Posttest
Ratings Within Scales)
Workshop Groups Focus Groups Control Groups Total
Scale No. % No. % No. % No. %
Increasing risk 18/96 18.8 9/64 14.1 33/160 20.6 60/320 18.8Dread 14/72 19.4 8/48 16.7 23/120 19.2 45/240 18.8KtE 13/48 27.1 7/32 21.9 21/80 26.3 41/160 25.6KtS 9/48 18.8 11/32 34.4 10/80 12.5 30/160 18.8Control 9/47 19.1 5/32 15.6 17/78 21.8 31/157 19.7Trustworthy 11/48 22.9 11/32 34.4 10/78 12.8 32/158 20.3Support 8/46 17.4 9/32 28.1 12/78 15.4 29/156 18.6Total 82/405 20.3 60/272 22.1 126/674 18.7 268/1351 19.8
Note: Polarizations according to the more liberal definition: shifts from the neutral point arecounted as polarization shifts.
Table VII. Polarization Shifts (No. ofPolarizations/No. of Pretest-Posttest
Ratings Within Scales)
Workshop Groups Focus Groups Control Groups Total
Scale No. % No. % No. % No. %
Increasing risk 7/96 7.3 5/64 7.8 15/160 9.4 27/320 8.4Dread 8/72 11.1 3/48 6.3 12/120 10.0 23/240 9.6KtE 0/48 0.0 0/32 0.0 1/80 1.3 1/160 0.6KtS 3/48 6.3 1/32 3.1 0/80 0.0 4/160 2.5Control 1/47 2.1 2/32 6.3 2/78 2.6 5/157 3.2Trustworthy 0/48 0.0 0/32 0.0 1/78 1.3 1/158 0.6Support 3/46 6.5 1/32 3.1 5/78 6.4 9/156 5.8Total 22/405 5.4 12/272 4.4 36/674 5.3 70/1351 5.2
Note: Polarizations according to the stricter definition: shifts from the neutral point are notcounted as polarization shifts.
definition that was applied also counts shifts fromthe neutral point (i.e., pretest ratings reflecting thescale’s midpoint) as polarization shifts. This defini-tion can be regarded as a liberal definition of atti-tude polarization. In the usual, and stricter, defini-tion, attitudes should be nonneutral on the pretestin order to classify as polarization. In that case, only2 (a change from “2” to “1” or a change from “4”to “5”) of the 25 cells (8%) in Table V reflect po-larization shifts. Table VII applies the stricter polar-ization definition and reveals that only the increas-ing risk and dread scales—i.e., the scales that showedclear deviations from the midpoint on the pretest—have the number of polarizations shifts that wouldbe expected by chance. The remaining five scales—those that on the pretest did not clearly deviate fromthe scale’s midpoint—hardly reveal any polarizationshifts. Thus, the majority of the polarizations underthe more liberal definition are shifts from the neutralpoint toward a more extreme attitude position.
In partial support of H2 (focus groups will havea higher degree of polarization than control groups),Table VI indicates that, under the more liberal defi-nition of attitude polarization, there were significantdifferences between these two conditions in their
levels of polarization on two scales: the trust scale(34.4% for the focus groups and 12.8% for the con-trol groups, χ2
1 = 6.83, p < 0.01) and the known toscience scale (34.4% for the focus groups and 12.5%for the control groups, χ2
1 = 7.18, p < 0.01). The re-maining five scales had no significant differences inpolarization across information conditions.
Comparing Table VI with Table VII reveals thatthe focus group participants were especially likely tohave polarized judgments if they had weak percep-tions prior to discussion. Specifically, 8 of 11 polar-ization shifts on the trust scale were from the scale’smidpoint toward a higher level of perceived trust-worthiness. Similarly, 7 of the 11 polarizations shiftson the known to science scale were from the scale’smidpoint toward an increased confidence in experts’knowledge of flood risk. In fact, 70% of all observedpolarizations in Table VI were polarizations from theneutral point (80.0% in the focus groups and 71.4%in the control groups). It seems that weak attitudesshifted easily compared with stronger attitudes (i.e.,item responses that were nonneutral on the pretest).Indeed, these changes from the neutral point mightreflect the formation of attitudes more than changesin weak attitudes.
Flood Risk Perceptions 1151
Finally, contrary to H3, the control groupsdid not have significant levels of polarization. AsTable VI indicates, their overall level of polariza-tion responses was only 18.7%. As noted above, thisis less than the chance expectation of polarized re-sponses (24%). Indeed, the known to exposed scalewas the only one on which the control groups ex-ceeded chance and this was only by an amount thathad no statistical or practical significance.
4. DISCUSSION AND CONCLUSIONS
Did the small-scale flood risk communicationprogram change the participants’ flood risk per-ceptions? To answer this question, we not onlyevaluated the pretest-posttest differences in risk per-ception scores, but also investigated whether atti-tudes would polarize. Therefore, we tested threehypotheses.
There was weak support for H1 (the work-shops would have significant impacts compared withthe control groups). Fig. 1 shows that the work-shops produced statistically significant (p < 0.05)changes from the pretest to the posttest in the par-ticipants’ risk perceptions on only two of the sevendimensions—decreases in support and increases incontrol. For both scales, these were reliable changes,meaning there were significant correlations betweenthe pretest and the posttest scores in addition to sig-nificant differences between the mean pretest andposttest ratings. This indicates that the process ofattitude change was similar for all workshop par-ticipants. Although none of the remaining scalesexhibited significant changes in the mean scores,three (increasing risk, dread risk, and trust) of thefive could be classified as stable perceptions becauseof their high pretest-posttest correlations. This sug-gests that these three scales measured meaningful at-titudes that, on average, simply were not affected bythe information in the workshops.
The changes in the workshop groups’ risk per-ceptions do not appear to be due to concurrentevents because the control groups’ mean risk per-ceptions did not change systematically. In fact, theyprovided stable perceptions on six of the sevenscales. This might seem rather remarkable, given thetwo major hydrological disasters—the Indian Oceantsunami and the inundation of New Orleans duringHurricane Katrina—that occurred during the studyperiod. These events’ apparent lack of effect on thecontrol groups suggests that they also had no ef-fect on the workshop or focus groups. The logical
explanation for this result is that the respondentsfailed to see any personal relevance of these events totheir own flood risk. Indeed, research on warning re-sponse and the adoption of hazard adjustments indi-cates that authoritative sources must explicitly pointout the personal relevance of hazard events in theirown locations in order to stimulate protection moti-vation.(44)
There was also weak support for H2 (focusgroup members would have greater polarizationshifts than control groups). Only two (known to sci-ence and trust) of the seven risk perception dimen-sions showed statistically significant higher degree ofpolarization shifts in the focus groups than in the con-trol groups. Moreover, on four of the five remain-ing scales, the number of polarizations in the focusgroups was lower than what would be expected bychance. This indicates that attitude polarization isa weaker effect than expected. Unfortunately, it isnot possible to determine conclusively why the datafailed to produce the significant degree of attitudepolarization that was expected on the basis of pre-vious research. It is possible that the polarization waslow because the participants had limited knowledgeand low evaluative cognitive consistency in their atti-tudes toward the topic.(54) In addition, the differencesin the nature of the respondents (a broader rangethan the usual college students), the attitude domain(environmental hazard), the research setting (the re-spondents’ homes rather than a psychological labo-ratory), or some combination of these factors mighthave also influenced the different outcomes.
Contrary to H3, the control group participantsexhibited no significant degree of polarization intheir risk perceptions. This is somewhat surpris-ing because research methodologists’ warnings(57)
and Tesser’s(51) research together suggest that re-spondents’ exposure to the pretest would stimulatethought and, consequently, polarization of attitudesabout the flood hazard. The results from this studysuggest that these sensitization effects are less pow-erful than are commonly supposed.
In summary, one important contribution of thisstudy is that it examined risk perception data fromtwo quite different methodological perspectives—the conventional tests of the mean differences (be-tween the pretest and the posttest and amonggroups) as well as other tests for attitude polariza-tion. Significantly, these different methodological ap-proaches revealed different aspects of the data. Forexample, two (known to science and trust) of theseven risk perception dimensions showed statistically
1152 Terpstra, Lindell, and Gutteling
significant higher degree of polarization shifts in thefocus groups than in the control groups. However,these were not the two scales (control and support)for which the workshops produced reliable change.Moreover, the trustworthiness scale was classified asa stable scale in all of the three groups, but the knownto science scale was classified as unstable and incon-sistent change in the workshop groups and in thefocus groups, respectively. Thus, the differences be-tween the results of χ2 and F-tests indicate that theanalysis of polarization scores detects aspects of atti-tude change that the analysis of the raw scores cannotand the analysis of the correlations detects some as-pects of attitude stability that the χ2 analysis of thepolarization scores cannot. Although the results ofthe two types of analyses differ, they are not incom-patible because (unidirectional) the mean changesand (bidirectional) polarization can take place con-currently within the same group of respondents. Theimportant question is whether one type of changepredominates and, if so, whether this takes placeoverall, only with some items, only with some groups,or only with some groups on some items.
More broadly, the findings in this study lead totwo conclusions. First, the analyses of the effects ofthe small-scale flood risk communication programin the three Dutch provinces revealed only mod-est effects in changing the participants’ risk percep-tions. We expected that the workshops would pro-duce more persuasive arguments that encouraged theparticipants to think of flood risk more often dur-ing and between subsequent workshops comparedwith the control groups. Moreover, since the work-shops had a significant experiential character (to-gether with the usual verbal or pictorial forms ofrisk communication), we expected that engaging inthese more direct behavioral experiences would havea significant impact on their risk perceptions. Thisstudy’s results suggest that if public authorities wantto change people’s risk perceptions so that they aremore in line with experts’ risk assessments, officialrisk communication programs should better focus onhow to address these risk perceptions.
Second, although polarized risk perceptionswere produced to a lesser extent than expected, po-larization occurred only when the participants wereencouraged to share their views without any in-tervention by experts presenting factual informa-tion on flood risk (i.e., only in the focus groups).In the Netherlands, water authorities seem re-luctant to communicate about flood risks—oftenpresuming that such a communication will cause
public unrest. However, our results suggest that fail-ing to systematically provide people with relevant,valid, and new flood risk information leaves their cur-rent beliefs unchallenged and may even cause themto polarize from their existing beliefs when exter-nal factors (e.g., increased media attention and de-bates on global warming or flood disasters abroad)stimulate thought and discussion with their peers.In the Netherlands, where flood risk perceptions aregenerally low, the mechanisms of self-generated andgroup-generated polarization might cause people tobecome unrealistically optimistic that flood disaster“can’t happen here.”(63) Such low risk perceptionswill keep people from taking the first crucial stepin flood preparation—personalizing the risk of liv-ing below sea level. In other words, public authoritiesshould be aware that not communicating risk is alsoa decision; moreover, it is a decision that may haveundesirable consequences.
Future research aiming to develop and evaluatepublic risk communication programs should take anumber of this study’s shortcomings into account.First, the scales need to be refined to increase theirreliabilities. The internal consistency reliabilities forknown to exposed, known to science, and trust aremarginal; the reliabilities for the control (α = 0.32 onpretest and 0.57 on posttest) and support (α = 0.46on pretest and posttest) scales were extremely low.Nonetheless, the low values of coefficient α did notprevent them from demonstrating statistically sig-nificant changes. The low α values, coupled withthe statistically significant test-retest (stability) cor-relations in the workshop group (and, to a lesserextent, the focus group), suggest that the individ-ual items within these scales were measuring dis-tinct aspects of the underlying constructs (hence thelow interitem correlations) that were relatively sta-ble over time. However, this possibility needs furtherexamination.
Second, the differences in the selection proce-dures for the workshop groups and the focus groupsprecluded any direct tests of the differences betweenthese two groups. The workshop group was verypolitically active and aware of water resources is-sues, so any differences between them and the focusgroups might have been because of these preexistingdifferences—even though there were no statisticallysignificant differences between these two groups (orthe control groups, for that matter) with respect totheir demographic characteristics or pretest scores.Future flood risk communication studies should atleast use similar recruitment strategies for both

Flood Risk Perceptions 1153
groups even if random assignment to conditions isnot possible.
Third, there might have been a minimal effectof the information conditions on the risk percep-tion measures because of a mismatch between them.One version of this argument is that the risk percep-tion measures were deficient in their ability to assessthe content of the information conditions. The work-shops, in particular, included a wide variety of activ-ities. Future evaluations of risk communication pro-grams might follow the recommendations of trainingresearchers(64) by conducting systematic analyses ofthe content of these workshops and by recording thecontent of the focus group discussions. Such analysescould provide the basis for developing content-validscales that would assess the extent to which eachgroup was exposed to, heeded, and comprehendedthe information that was presented.
An alternative version of the mismatch argumentis that the workshops (in particular) failed to pro-duce generally significant changes in the participants’risk perceptions because they failed to address topicsthat are directly relevant to people’s concerns aboutenvironmental hazards. There is merit to the secondversion of the argument because the dimensions inthe psychometric paradigm(65) were designed to ac-count for risk perceptions across the entire range ofhazardous technologies and societal activities. Theyoverlap many dimensions that have been identifiedby research on natural and technological hazards butare not identical to them.(66,67) Thus, the range of riskperception dimensions could be expanded in futureevaluations of flood risk communication programs byconsidering other theoretical perspectives such as theextended parallel process model,(68) person relativeto event theory,(24) and the protective action decisionmodel.(44,69)
In addition, future research should assess ex-perts’ and risk area residents’ mental models offlood hazard to identify their conceptions of the fac-tors that affect flood risk and the interrelationshipsamong those dimensions.(70–73) Current research onhurricane hazard is using this approach to examinelocal officials’ mental models of hurricane evacua-tions.(74) These data are being used together withan evaluation of people’s comprehension of a hur-ricane training guide to identify the ways in whichthe training guide needs to be improved. Similarefforts for flood hazard could provide effective meth-ods for improving communication between tech-nologists and the public about this hazard and itsmanagement.
Although it might seem that such risk informa-tion can only be disseminated through the mass me-dia, neighborhood meetings such as the workshopgroups in this study may be more effective in chang-ing risk perceptions and motivating household haz-ard adjustment adoption. Such meetings are feasiblein areas exposed to hydrological hazards such as in-land flooding, hurricane surge, and tsunami inunda-tion. Moreover, neighborhood meetings are neededbecause many—sometimes most—residents of suchareas cannot accurately identify their risk area fromlarge-scale maps.(75,76) Finally, neighborhood meet-ings may be the most likely means of generating thelevel of hazard intrusiveness (frequency of thought,discussion, and passive information receipt) that willpromote the adoption of household hazard adjust-ments.(77) However, further research is needed toverify this line of reasoning and extend it to otherhazards.
ACKNOWLEDGMENTS
This research was carried out in the frame-work of the European Regional Development FundInterreg IIIb FLOWS (Project Reference Number1-16-31-7-546-02). Other support for this researchwas provided by the U.S. National Science Founda-tion Grant SES 0527699. The views expressed in thisarticle are solely those of the authors.
REFERENCES
1. Lindell MK, Perry RW. Household adjustment to earthquakehazard: A review of research. Environment and Behavior,2000; 32(4):461–501.
2. Whitney DJ, Lindell MK, Nguyen HHD. Earthquake beliefsand adoption of seismic hazard adjustments. Risk Analysis,2004; 24(1):87–102.
3. Grothmann T, Reusswig F. People at risk of flooding: Whysome residents take precautionary action while others do not.Natural Hazards, 2006; 38(1–2):101–120.
4. Keller C, Siegrist M, Gutscher H. The role of the affect andavailability heuristics in risk communication. Risk Analysis,2006; 26(3):631–639.
5. Lave TR, Lave LB. Public perception of the risks of floods: Im-plications for communication. Risk Analysis, 1991; 11(2):255–267.
6. Siegrist M, Gutscher H. Flooding risks: A comparison of laypeople’s perceptions and expert’s assessments in Switzerland.Risk Analysis, 2006; 26(4):971–979.
7. Thieken AH, Petrow T, Kreibich H, Merz B. Insurability andmitigation of flood losses in private households in Germany.Risk Analysis, 2006; 26(2):383–395.
8. Peacock WG, Brody SD, Highfield W. Hurricane risk percep-tions among Florida’s single family homeowners. Landscapeand Urban Planning, 2005; 73(2–3):120–135.
9. Sattler DN, Kaiser CF, Hittner JB. Disaster preparedness: Re-lationships among prior experience, personal characteristics,

1154 Terpstra, Lindell, and Gutteling
and distress. Journal of Applied Social Psychology, 2000;30(7):1396–1420.
10. Mulilis JP, Duval TS. The PrE model of coping and tor-nado preparedness: Moderating effects of responsibility.Journal of Applied Social Psychology, 1997; 27(19):1750–1766.
11. Perry RW, Lindell MK. Living with Mt. St. Helens: HumanAdjustments to Volcano Hazards. Pullman, WA: WashingtonState University Press, 1990.
12. Johnston D, Paton D, Crawford GL, Ronan K, Houghton B,Burgelt P. Measuring tsunami preparedness in coastal Wash-ington, United States. Natural Hazards, 2005; 35(1):173–184.
13. Floyd DL, Prentice-Dunn S, Rogers RW. A meta-analysis ofresearch on protection motivation theory. Journal of AppliedSocial Psychology, 2000; 30(2):407–429.
14. Neuwirth K, Dunwoody S, Griffin RJ. Protection motivationand risk communication. Risk Analysis, 2000; 20(5):721–734.
15. Harris P. Sufficient grounds for optimism? The relationshipbetween perceived controllability and optimistic bias. Journalof Social and Clinical Psychology, 1996; 15(1):9–52.
16. Johnston D. Volcanic hazard perceptions: Comparative shiftsin knowledge and risk. Disaster Prevention and Management,1999; 8(2):118–126.
17. Spittal MJ, McClure J, Siegert RJ, Walkey FH. Optimisticbias in relation to preparedness for earthquakes. AustralasianJournal of Disaster and Trauma Studies, 2005; 1.
18. Weinstein ND. Unrealistic optimism about future life events.Journal of Personality and Social Psychology, 1980; 39(5):806–820.
19. Lindell MK, Alesch D, Bolton PA, Greene MR, Larson LA,Lopes R, May PJ, Mulilis J-P, Nathe S, Nigg JM, Palm R,Pate P, Perry RW, Pine J, Tubbesing SK, Whitney DJ. Adop-tion and implementation of hazard adjustments. InternationalJournal of Mass Emergencies and Disasters Special Issue,1997; 15(3):327–453.
20. Mileti DS, Fitzpatrick C. The causal sequence of risk commu-nication in the Parkfield earthquake prediction experiment.Risk Analysis, 1992; 12(3):393–400.
21. Mileti DS, Fitzpatrick C. The Great Earthquake PredictionExperiment. Boulder, CO: Westview, 1993.
22. Mileti DS, Darlington JD. The role of searching in shaping re-actions to earthquake risk information. Social Problems, 1997;44(1):89–103.
23. Tanaka K. The impact of disaster education on public prepara-tion and mitigation for earthquakes: A cross-country compar-ison between Fukui, Japan and the San Francisco Bay Area,California, USA. Applied Geography, 2005; 25(3):201–225.
24. Mulilis JP, Duval TS. Negative threat appeals and earth-quake preparedness: A person-relative-to-event (PRE) modelof coping with threat. Journal of Applied Social Psychology,1995; 25(15):1319–1339.
25. Mulilis JP, Lippa R. Behavioral change in earthquake pre-paredness due to negative threat appeals: A test of protec-tion motivation theory. Journal of Applied Social Psychology,1990; 20(8):619–638.
26. Harding DM, Parker DJ. Flood hazard at Shrewsbury, UnitedKingdom. Pp. 43–52 in White G (ed). Natural Hazards. NewYork: Oxford University Press, 1974.
27. Terpstra T, Gutteling JM. Households’ perceived responsi-bilities in flood risk management in the Netherlands. In-ternational Journal of Water Resources Development, 2008;24(4):555–565.
28. Lindell MK, Prater CS, Perry RW. Fundamentals of Emer-gency Management. Emmitsburg, MD: FEMA, 2006.
29. Ten Brinke WBM, Bannink BA. Dutch Dikes and Risk Hikes:A Thematic Policy Evaluation of Risks of Flooding in theNetherlands (in Dutch: Risico’s in Bedijkte Termen: EenThematische Evaluatie van het Nederlandse Veiligheidsbeleid
Tegen Overstromen). Bilthoven, The Netherlands: RIVM,2004.
30. Van Der Pligt J, De Vries NK, Manstead ASR, Van Harrev-eld F. The importance of being selective: Weighing the role ofattribute importance in attitudinal judgment. Pp. 135–200 inZanna MP (ed). Advances in Experimental Social Psychology.San Diego, CA: Academic Press, Inc., 2000.
31. Van Harreveld F, Van Der Pligt J. Attitudes as stable andtransparent constructions. Journal of Experimental Social Psy-chology, 2004; 40(5):666–674.
32. Van Harreveld F, Van Der Pligt J, De Vries NK, WennekerC, Verhue D. Ambivalence and information integration in at-titudinal judgment. British Journal of Social Psychology, 2004;43:431–447.
33. Visschers VHM, Meertens RM, Passchier WF, DeVries NK.How does the general public evaluate risk information? Theimpact of associations with other risks. Risk Analysis, 2007;27(3):715–727.
34. Schuman H, Kalton G. Survey methods. Pp. 635–698 inLindzey G, Aronson A (eds). Handbook of Social Psychology.New York: Random House, 1985.
35. Fazio RH. Attitudes as object-evaluation associations of vary-ing strength. Social Cognition, 2007; 25(5):603–637.
36. Converse PE. Attitudes and non-attitudes: Continuation ofa dialogue. Pp. 168–189 in Tufte ER (ed). The QuantitativeAnalysis of Social Problems. Reading, MA: Addison-Wesley,1970.
37. Lindell MK, Perry RW. Understanding evacuation behav-ior: An editorial introduction. International Journal of MassEmergencies and Disasters, 1991; 9:133–136.
38. Fishbein M, Ajzen I. Belief, Attitude, Intention and Behavior.Reading, MA: Addison-Wesley, 1981.
39. Isenberg JD. Group polarization: A critical review and meta-analysis. Journal of Personality and Social Psychology, 1986;50(6):1141–1151.
40. Eagly AH, Chaiken S. The Psychology of Attitudes. FortWorth, TX: Harcourt Brace, 1993.
41. Prislin R, Wood W. Social influence in attitudes and attitudechange. Pp. 671–706 in Albarracı́n D, Johnson BT, Zanna MP(eds). The Handbook of Attitudes. Mahwah, NJ: LawrenceErlbaum, 2005.
42. Petty RE, Krosnick JA. Attitude Strength: Antecedents andConsequences. Mahwah, NJ: Lawrence Erlbaum, 1995.
43. Thompson MM, Zanna MP, Griffin DW. Attitude strength:Let’s not be indifferent about (attitudinal) ambivalence. Pp.361–386 in Petty RE, Krosnick JA (eds). Attitude Strength:Antecedents and Consequences. Mahwah, NJ: Lawrence Erl-baum, 1995.
44. Lindell MK, Perry RW. Communicating Environmental Riskin Multiethnic Communities. Thousand Oaks, CA: Sage Pub-lications, Inc., 2004.
45. Fazio RH, Zanna MP. Direct experience and attitude-behavior consistency. Pp. 161–202 in Berkowitz L (ed). Ad-vances in Experimental Social Psychology. San Diego, CA:Academic Press, 1981.
46. Glassman LR, Albarracı́n D. Forming attitudes that pre-dict future behavior: A meta-analysis of the attitude-behavior relation. Psychological Bulletin, 2006; 132:778–822.
47. Regan DT, Fazio R. Consistency between attitudes and behav-ior: Look to method of attitude formation. Journal of Experi-mental Social Psychology, 1977; 13(1):28–45.
48. Weinstein ND. Effects of personal experience on self-protective behavior. Psychological Bulletin, 1989; 105(1):31–50.
49. Lindell MK, Prater CS. Risk area residents’ perceptions andadoption of seismic hazard adjustments. Journal of AppliedSocial Psychology, 2002; 32(11):2377–2392.
Flood Risk Perceptions 1155
50. Rodrigo MF, Ato M. Testing the group polarization hypothe-sis by using logit models. European Journal of Social Psychol-ogy, 2002; 32(1):3–18.
51. Tesser A. Self-generated attitude change. Advances in Exper-imental Social Psychology, 1978; 11:181–227.
52. White MP, Pahl S, Buehner M, Haye A. Trust in riskymessages: The role of prior attitudes. Risk Analysis, 2003;23(4):717–726.
53. Baron RS, Kerr NL, Miller N. Group Process, Group Deci-sion, Group Action. Pacific Grove, CA: Brooks/Cole, 1992.
54. Marsh KL, Wallace HM. The influence of attitudes on beliefs:Formation and change. Pp. 369–397 in Albarracı́n D, JohnsonBT, Zanna MP (eds). The Handbook of Attitudes. Mahwah,NJ: Lawrence Erlbaum, 2005.
55. Slovic P. The Perception of Risk. London: Earthscan Publica-tions Ltd., 2000.
56. Fischhoff B, Slovic P, Lichtenstein S, Read S, Combs B. Howsafe is safe enough? A psychometric study of attitudes towardstechnological risks and benefits. Policy Sciences, 1978; 9:127–152.
57. Shadish WR, Cook TD, Campbell DT. Experimental andQuasi-Experimental Designs for Generalized Causal Interfer-ence. Boston, MA: Houghton Mifflin, 2002.
58. Terpstra T, Gutteling JM, Geldof GD, Kappe LJ. The percep-tion of flood risk and water nuisance. Water Science and Tech-nology, 2006; 54(6–7):431–439.
59. Lindell MK, Perry RW. Effects of the Chernobyl accident onpublic perceptions of nuclear-plant accident risks. Risk Anal-ysis, 1990; 10(3):393–399.
60. Lindell MK, Brandt CJ. Measuring interrater agreement forratings of a single target. Applied Psychological Measurement,1997; 21(3):271–278.
61. Tinsley HEA, Weiss DJ. Interrater reliability and agreementof subjective judgments. Journal of Counseling Psychology,1975; 22:358–376.
62. Cascio WF, Aguinis H. Applied Psychology in Human Re-source Management, 6th ed. Englewood Cliffs, NJ: PrenticeHall, 2004.
63. Terpstra T. Emotions, trust, and perceived risk: Affective andcognitive routes to flood preparedness behavior. In prepara-tion.
64. Goldstein IL, Ford JK. Training in Organizations, 2nd ed. Bel-mont, CA: Wadsworth, 2002.
65. Slovic P. Perception of risk. Science, 1987; 236:280–285.66. Lindell MK. Perceived characteristics of environmental haz-
ards. International Journal of Mass Emergencies and Disas-ters, 1994; 12(3):303–326.
67. Lindell MK, Earle TC. How close is close enough? Public per-ceptions of the risks of industrial facilities. Risk Analysis, 1983;3:245–253.
68. Witte K. Putting the fear back into fear appeals: The extendedparallel process model. Communication Monographs, 1992;59(4):329–349.
69. Lindell MK, Perry RW. Behavioral Foundations of Commu-nity Emergency Planning. Washington, DC: Hemisphere Pub-lishing Corporation, 1992.
70. Atman CJ, Bostrom A, Fischhoff B, Morgan MG. Designingrisk communications: Completing and correcting mental mod-els of hazardous processes.1. Risk Analysis, 1994; 14(5):779–788.
71. Bostrom A, Atman CJ, Fischhoff B, Morgan MG. Evaluatingrisk communications: Completing and correcting mental mod-els of hazardous processes. 2. Risk Analysis, 1994; 14(5):789–798.
72. Bostrom A, Fischhoff B, Morgan MG. Characterizing mentalmodels of hazardous processes: A methodology and an appli-cation to radon. Journal of Social Issues, 1992; 48(4):85–100.
73. Carley K, Palmquist M. Extracting, representing, and analyz-ing mental models. Social Forces, 1992; 70(3):601–636.
74. Lindell MK, Buchanan B, Prater CS. Local Officials’ MentalModels of Hurricane Evacuation. College Station, TX: HazardReduction & Recovery Center, Texas A&M University, 2008
75. Arlikatti S, Lindell MK, Prater CS, Zhang Y. Risk area ac-curacy and hurricane evacuation expectations of coastal resi-dents. Environment and Behavior, 2006; 38(2):226–247.
76. Zhang Y, Prater CS, Lindell MK. Risk area accuracy and evac-uation from Hurricane Bret. Natural Hazards Review, 2004;5:115–120.
77. Lindell MK, Prater CS. Household adoption of seismic haz-ard adjustments: A comparison of residents in two states. In-ternational Journal of Mass Emergencies and Disasters, 2000;18:317–338.
Related Documents