NBER WORKING PAPER SERIES DOES BORDER ENFORCEMENT PROTECT U.S. WORKERS FROM ILLEGAL IMMIGRATION? Gordon H. Hanson Raymond Robertson Antonio Spilimbergo Working Paper 7054 http://www.nber.org/paperslw7054 NATIONAL BUREAU OF ECONOMIC RESEARCH 1050 Massachusetts Avenue Cambridge, MA 02138 March 1999 We thank seminar participants at the University of Texas, Texas A&M University, and the 1998 Midwest International Trade Meetings for comments. Hanson acknowledges financial support from the National Science Foundation (SBR-96 17578) and the Russell Sage Foundation. The views expressed in this paper are those of the authors and do not reflect those of the National Bureau of Economic Research. © 1999 by Gordon H. Hanson, Raymond Robertson, and Antonio Spilimbergo. All rights reserved. Short sections of text, not to exceed two paragraphs, may be quoted without explicit permission provided that full credit, including © notice, is given to the source.

Welcome message from author
This document is posted to help you gain knowledge. Please leave a comment to let me know what you think about it! Share it to your friends and learn new things together.
Transcript
NBER WORKING PAPER SERIES
DOES BORDER ENFORCEMENT PROTECTU.S. WORKERS FROM ILLEGAL IMMIGRATION?
Gordon H. HansonRaymond RobertsonAntonio Spilimbergo
Working Paper 7054http://www.nber.org/paperslw7054
NATIONAL BUREAU OF ECONOMIC RESEARCH1050 Massachusetts Avenue
Cambridge, MA 02138March 1999
We thank seminar participants at the University of Texas, Texas A&M University, and the 1998 MidwestInternational Trade Meetings for comments. Hanson acknowledges financial support from the NationalScience Foundation (SBR-96 17578) and the Russell Sage Foundation. The views expressed in this paper arethose of the authors and do not reflect those of the National Bureau of Economic Research.
© 1999 by Gordon H. Hanson, Raymond Robertson, and Antonio Spilimbergo. All rights reserved. Shortsections of text, not to exceed two paragraphs, may be quoted without explicit permission provided thatfull credit, including © notice, is given to the source.
Does Border Enforcement Protect U.S.Workers from Illegal Immigration?Gordon H. Hanson, Raymond Robertson,and Antonio SpilimbergoNBER Working Paper No. 7054March 1999JEL No. D20, FlO
ABSTRACT
In this paper, we examine the impact of government enforcement of the U.S.-Mexican border
on wages in the border regions of the United States and Mexico. The U.S. Border Patrol polices U.S.
boundaries, seeking to apprehend any individual attempting to enter the United States illegally.
These efforts are concentrated on the Mexican border, as most illegal immigrants embark from a
Mexican border city and choose a U.S. border state as their final destination. We examine labor
markets in southern California, southwestern Texas, and Mexican cities on the U.S.-Mexico border.
For each region, we have high-frequency time-series data on wages and on the number ofpersonhours that the U.S. Border Patrol spends policing border areas. For a range of empirical
specifications and definitions of regional labor markets, we find little impact of border enforcement
on wages in U.S. border cities and a moderate negative impact of border enforcement on wages in
Mexican border cities. These findings are consistent with two hypothesis: (1) border enforcement
has a minimal impact on illegal immigration, or (2) immigration from Mexico has a minimal impact
on wages in U.S. border cities.
Gordon H. Hanson Raymond RobertsonDepartment of Economics Department of EconomicsUniversity of Michigan Syracuse UniversityAnn Arbor, MI 48 109-1220 Syracuse, NY 13244-2130and NBER rarobertsyr.edugohansonumich.edu
Antonio SpilimbergoResearch DepartmentInternational Monetary Fund700 19th Street, NW 20431
L Intmduclion
A central component of U.S. immigration policy is the control of national borders. The
U.S. Border Patrol polices international boundaries, seeking to apprehend any individual
attempting to enter the United States illegally. These efforts are concentrated on the Mexican
border, where most attempts at illegal entry occur. Recent events have intensified interest in
undocumented immigration. Periodic economic downturns in Mexico contribute to surges in
attempts at illegal entry (Hanson and Spilimbergo 1999), and there is a growing concern that
immigrants are drawn to the United States by the availability of public assistance (Borjas and
Hilton 1996). In response to these circumstances, the U.S. government has dramatically
increased enforcement of U.S. borders. The number of hours Border Patrol officers spent
policing the Mexican border rose from 1.8 million in 1977 to 5.1 million in 1997.
In this paper, we examine the impact of border enforcement on wages in border regions
of the United States and Mexico. We study border areas as they are the regions most directly
affected by illegal immigration. Most illegal immigrants embark from a Mexican border city and
choose a U.S. border state as their fmal destination (Bustamante 1990; Warren 1995). Whatever
the impact of illegal immigration, it is likely to be strongest in border labor markets. The regions
we examine are southern California, southwestern Texas, and Mexican cities on the U.S.-Mexico
border. For each of these regions, we have monthly (or quarterly) data on wages and on the
number of person hours that the U.S. Border Patrol spends policing border areas and the number
of apprehensions its officers make while on patrol. If border enforcement is effective at
impeding illegal immigration from Mexico, then its effects, whether temporary or permanent,
should be apparent in border communities.
1
There is a small but growing literature on illegal immigration, to which we add. Hanson
and Spilimbergo (1999), building on earlier papers by Bean et al. (1990) and Borjas, Freeman,
and Lang (1991), fmd that illegal immigration from Mexico, as proxied by apprehensions at the
U.S.-Mexico border, is highly responsive to changes in Mexican wages and, to a lesser extent,
changes in U.S. wages.' Related papers include case studies of Mexican communities that send
illegal immigrants to the United States (Cornelius 1992; Donato, Durand, and Massey 1992),
estimates of the undocumented population in the United States (Warren 1995), and estimates of
the sensitivity of Mexican regions to U.S. labor-market shocks (Robertson 1998).2 There is very
little work on whether border enforcement affects labor-market outcomes in the United States or
Mexico. This gap in the literature is unfortunate, given the importance of border enforcement
in U.S. efforts to control illegal immigration.
Our work also relates to a broader literature on whether immigration has lowered the
wages of U.S. workers.3 This subject has attracted intense academic attention due to the
coincidence of two events -- rising immigration of low-skilled individuals (Borjas 1994) and a
relative decline in the earnings of low-skilled U.S. workers (Levy and Mumane 1992; Katz and
Murphy 1992). The standard approach in the literature is to examine the correlation between
changes in the wages of native U.S. workers and changes in the stock of immigrants in a cross
section of U.S. metropolitan areas.4 The predominant finding is that immigration has, at most,
a small negative effect on the earnings of native workers.
See Espenshade (1994) and Orrenius (1997) for related studies.Durand and Massey (1992) and Espenshade (1995) review the literature on illegal immigration.See Borjas (1994) and Friedberg and Hunt (1995) for surveys of this literature.Grossman (1982) is an early contribution. Recent work includes Borjas (1987), Altonji and Card (1991),
Lalonde and Topel (1991), Schoeni (1996), and Card (1997), Since the local stock of immigrants may becorrelated with local labor-market shocks, most studies treat the stock of immigrants as an endogenous variable.
2
There remains some doubt about whether existing research identifies the full effect of
immigration on wages. Borjas, Freeman, and Katz (1992, 1997) fmd three problems with using
cross-section data to identif' the wage effects of immigration. First, wage growth varies across
regions for reasons that are unrelated to immigration. Regions that, for whatever reason, attract
immigrants may have exceptional wage growth over certain periods. Without exogenous controls
for other factors that contribute to regional wage growth, the cross-sectional correlation between
changes in immigration and wages may be uninformative. Second, native workers may respond
to an influx of immigrants in their locale by migrating to other regions, mitigating the effect of
immigration on local wages. The literature is divided about whether immigrant inflows
contribute to native outmigration. Filer (1992) and Borjas, Freeman, and Katz (1997) fmd
evidence that it does, while Card (1997) finds evidence that it does not. Third, regions may
absorb immigrants without changes in wages by shifting into industries that use immigrant labor
relatively intensively. In California, the arrival of immigrants from Mexico and other low-wage
countries has been followed by rapid growth in apparel, textiles, food products, and other labor-
intensive industries (Hanson and Slaughter 1999).
Our approach helps assess the severity of the shortcomings in previous literature. Though
our analysis of illegal immigration is indirect -- border enforcement influences the cost of
entering the United States illegally, but it is not the sole determinant of illegal immigration --
there are several important advantages to our approach. In contrast to existing studies, which
mostly use cross-section data for U.S. regions at long time intervals, we have high-frequency
time-series data on wages and border enforcement in regions on both sides of the U.S.-Mexico
border. This allows us to control for the fact that long-run trends in wage growth may vary
3
across regions. It also means that we are able to examine both the short-run and long-run effects
of border enforcement on wages, thus controlling for the possibility that the arrival of illegal
immigrants in border regions may cause an outmigration of native workers or a change in the
mix of production activities in local industry.
In section II we describe the data we use in the analysis, in section ifi we discuss the
empirical specification, and in section IV we present results. For a range of specifications and
defmitions of regional labor markets, we find only a weak positive correlation between border
enforcement and wages in U.S. border regions and a moderate negative correlation between
border enforcement and wages in Mexican border cities. These findings are consistent with two
hypotheses: (1) border enforcement has a minimal deterrent effect on illegal immigration, or (2)
illegal immigration from Mexico has a minimal impact on wages in U.S. border areas. We
discuss interpretation of the fmdings in section V, by way of conclusion.
IL Data
As motivation for our focus on border labor markets, we briefly describe the spatial
distribution of legal and illegal Mexican immigrants in the United States. To examine the impact
of border enforcement on the U.S.-Mexico border region, we use a combination of industry data
and survey data to construct time series of wages in U.S. and Mexican border regions.
A. Bonier Labor Miutets: Tmmigmtion and Enfonement
Mexican immigrants in the United States tend to congregate in regions near the U.S.-
Mexico border. Data from the 1990 U.S. Census of Population and Housing (1% PUMS) show
4
that 46.5% of Mexican-born individuals that had immigrated within the previous five years
resided in the border region of California and 8.6% resided in the border region of Texas.5 Of
all Mexican immigrants, 41.6% resided in the California border region and 13.1% resided in the
Texas border region.6 The immediate labor-market consequences of Mexican immigration are
thus likely to be concentrated in border areas.
Recent Mexican immigrants tend to have low levels of education relative to U.S. workers.
In 1990 Mexican-born individuals in the United States who had immigrated within the previous
five years had an average of 9 years of education, compared to more than 13 years for U.S.
natives. Unsurprisingly, workers who are recent immigrants are most prevalent in industries that
are relatively intensive in the use of less-skilled labor. Table 1 shows the share of workers who
are Mexican immigrants for selected industries in California, Texas, and the rest of the United
States in 1980 and 1990. We focus on manufacturing, as it is this sector for which we have
wage data, but we also show figures for other high-immigrant industries. For the border region
of California in 1990, over 33% of workers in the apparel, textile, food products, lumber, and
furniture industries were Mexican immigrants, and a substantial fraction of these were recent
arrivals. In the state as a whole, the shares of workers who are Mexican immigrants are
somewhat smaller. For the border region of Texas in 1990, the fraction of workers who were
Mexican immigrants was 46% in apparel, 28% in textiles, and 22% in food products (and less
in lumber and furniture). Again, immigrant shares in the state as a whole are smaller. In
We define the California border region to include the Anaheim-Santa Ana, Los Angeles-Long Beach,Riverside-San Bernadino, and San Diego MSAs, and the Texas border region to include the Austin, Brownsville-Harlingen, Corpus Cristi, El Paso, Houston, McAllen-Edinburg, and San Antonio MSAs.
6 In 1980, 45.6% (40.3%) of recently arrived (total) Mexican immigrants resided in the California borderregion and 11.9% (14.3%) resided in the Texas border region.
5
contrast to border states, Mexican immigrants account for a very small fraction of workers in
these industries for the rest of the United States.
Recent Mexican immigrants include both legal and illegal aliens. Over the period 1980-
1995, legal admissions of Mexican nationals by the U.S. Immigration and Naturalization Service
(iNS) averaged 62,600 individuals per year.7 Warren (1995) estimates that over the period 1982-
1992 the average annual net inflow of illegal Mexican immigrants was 158,600 individuals per
year. Given the legal predicament of undocumented immigrants, we expect these individuals to
be even more concentrated in U.S. border cities than legal immigrants. Nearly all illegal
Mexican immigrants enter the United States by crossing the U.S.-Mexico border over land, which
requires them to spend at least some time in a U.S. border region. Relatively large populations
of Mexican nationals in U.S. border cities may make these areas relatively attractive for
undocumented arrivals. Warren (1995) estimates that in 1992 59.5% of undocumented Mexican
immigrants in the United States resided in California and 17.2% resided in Texas.
Illegal attempts to enter the United States are concentrated along the U.S.-Mexico border.
Available data are from unpublished records of the INS, which contain monthly figures for 1977-
1997 on the number individuals apprehended attempting to cross the U.S-Mexico border illegally
and the number of person hours the U.S. Border Patrol spends policing the border.8 Both series
This figure excludes individuals admitted under the Immigration Reform and Control Act of 1986, whichgave legal status to large numbers of long-term illegal aliens.
8 Data on enforcement and apprehensions are based on the "linewatch" activities of the U.S. Border Patrol.These activities occur at international borders; other enforcement activities, such as traffic checkpoints or raids onbusinesses, occur in the U.S. interior. Individuals apprehended by Border Patrol officers on linewatch duty areforeign residents attempting to enter the United States illegally; individuals apprehended by officers on non-linewatch duty have been residing in the United States for an unknown period of time. For most of our work,we use data on linewatch enforcement, since this measure captures enforcement efforts targeted at new illegalimmigrants. To check the sensitivity of our empirical results to this choice, we re-estimate all specificationsreplacing linewatch enforcement with total enforcement (linewatch plus non-linewatch).
6
are broken down by nine geographic regions.9 Apprehensions are an indirect indication of
attempted illegal immigration from Mexico. Over the sample period, more than 95.0% of those
apprehended by U.S. Border Patrol were Mexican nationals, and over 99.0% of apprehensions
by the U.S. Border Patrol occurred at the U.S.-Mexico border (INS 1996).
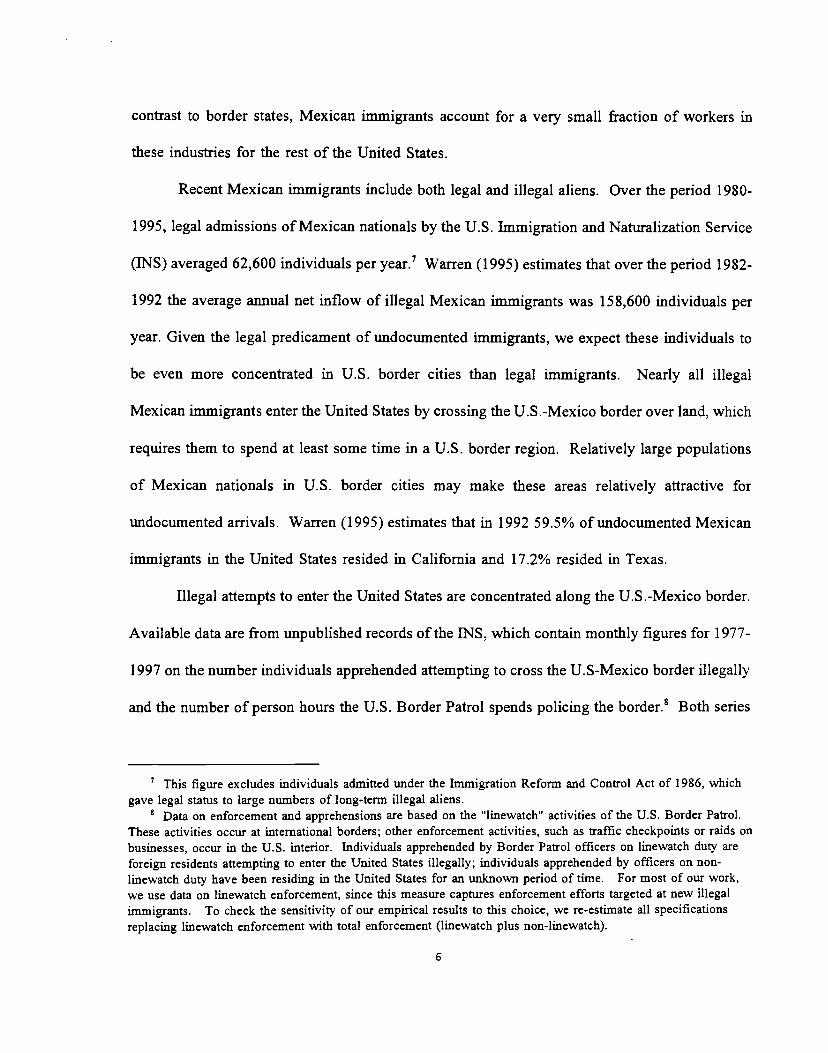
Figure 1 shows border apprehensions by state over the sample period. There is a seasonal
pattern in apprehensions (high in the summer, low in the winter), which mirrors seasonal
variation in U.S. labor demand (Hanson and Spilimbergo 1999). Most apprehensions occur in
California; San Diego alone accounts for an average of 49.5% of all border apprehensions. El
Paso is the second most important site for apprehensions, accounting for an average of 18.2%
of apprehensions. These two locations are near large U.S. population centers and cites where the
U.S.-Mexico border is relatively easy to cross. Late in the period, apprehensions rise in Arizona,
following increased enforcement of the border in California which may have encouraged those
attempting illegal entry to move east.
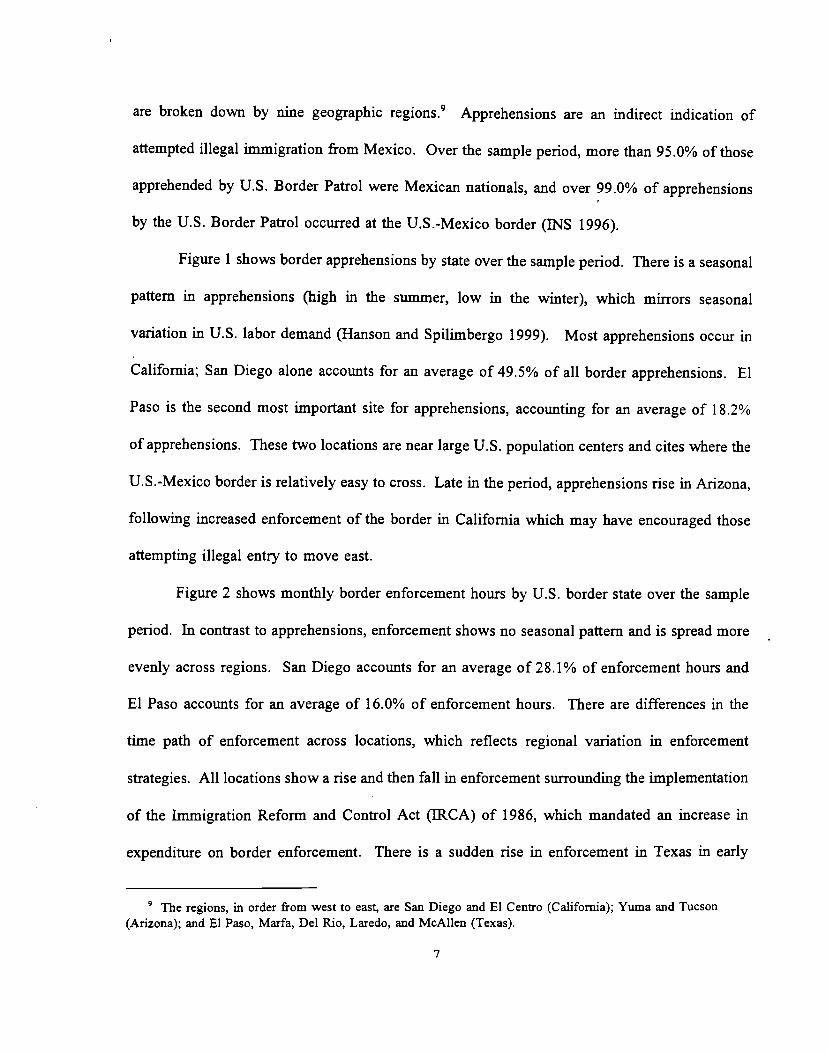
Figure 2 shows monthly border enforcement hours by U.S. border state over the sample
period. In contrast to apprehensions, enforcement shows no seasonal pattern and is spread more
evenly across regions. San Diego accounts for an average of 28.1% of enforcement hours and
El Paso accounts for an average of 16.0% of enforcement hours. There are differences in the
time path of enforcement across locations, which reflects regional variation in enforcement
strategies. All locations show a rise and then fall in enforcement surrounding the implementation
of the Immigration Reform and Control Act ([RCA) of 1986, which mandated an increase in
expenditure on border enforcement. There is a sudden rise in enforcement in Texas in early
The regions, in order from west to east, are San Diego and El Centro (California); Yuma andTucson
(Arizona); and El Paso, Marfa, Del Rio, Laredo, and McAllen (Texas).
7
1993. This increase is due mainly to "Operation Hold the Line" in El Paso, during which
enforcement hours more than doubled in a three-month period. Following this increase,
enforcement hours in Texas decline somewhat over the next three years. Enforcement hours are
stable in California between 1988 and 1993 and then rise dramatically in 1994 and 1995, as
attempted illegal entry increased following a currency crisis and a severe recession in Mexico and
as the INS increased border patrols in San Diego as part of "Operation Gatekeeper."
B. Wages in U.S. and Mexican Bonier Regions
We use several data sources to measure wages in the United States and Mexico. The
concentration of immigrants in border regions and in specific industries suggests that the impact
of immigration, and hence the impact of border enforcement, will be strongest in these regions
and industries. To allow the short-run effects of border enforcement to differ from the long-run
effects, it is important to use high-frequency data. It is also important to adjust for variation in
worker characteristics, such as age and education, across regions and industries, which requires
household-level data. Unfortunately, no data set has high-frequency observations on households
with sample sizes that are large enough to allow disaggregation by education level, region, and
industry. We use household-level data to measure wages by education level and region and
industry-level data to measure wages by industry and region. Though neither data set is ideal,
we aim to eliminate the possibility that our findings are an artifact of a particular data set by
using as many different wage measures as possible.
For data on wages in high-immigrant industries in California and Texas, we use the
Current Employment Statistics Survey from the Bureau of Labor Statistics (BLS), which gives
8
the average hourly wage for production workers in selected industries and regions at a monthly
frequency. As production workers tend to have much lower education and pay levels than
nonproduction workers, they are the workers most vulnerable to competition from illegal
immigrants and hence the workers most likely to benefit from border enforcement. We examine
the apparel, textiles, food products, lumber, and furniture industries in California and Texas over
the period 1977-1997. While data are available for individual cities within these states, gaps in
BLS data collection for individual MSAs make the available city-level time series very short.
For California, most employment in high-immigrant industries occurs in the Los Angeles area,
so that California employment is a reasonable proxy for employment in Los Angeles.'° We
confirm that our results hold for industries in individual MSAs over given subperiods.
For data on wages in U.S. border regions by education group, we use monthly data from
the Current Population Survey (CPS), which covers approximately 60,000 households nationwide.
The CPS identifies the state of residence for all households and the city of residence for all
households in a metropolitan statistical area (MSA). For the border region of California, we
include households in the Anaheim-Santa Ana, Los Angeles-Long Beach, Riverside-San
Bemadino, and San Diego MSAs; for the border region of Texas, we include households in the
Austin, Brownsville-Harlingen, Corpus Cristi, El Paso, Houston, McAllen-Edinburg, and San
Antonio MSAs. While it might be preferable to examine wage movements in each city
separately, small sample sizes for individual MSAs require us to aggregate across border cities
within a state. Data are available for the period January, 1986 to May, 1995.12
'° Over the sample period, the share of California employment in the Los Angeles-Long Beach MSA is 72%in the apparel industry, 66% in the textile industry, 63% in the furniture industry, 28% in the food productsindustry, and 19% in the lumber industry.
In 1990 the share of Mexican-born individuals in the population varies in California from 7.6% in SanDiego to 13.5% in Los Angeles-Long Beach, and in Texas from 2.7% in Austin to 25.8% in McAllen.
9
For data on wages in Mexican border regions, we use quarterly data from the Mexican
National Urban Employment Survey (ENEU), which covers approximately 96,000 households in
eight major urban areas. Included in the sample are Mexico's two largest border cities, Ciudad
Juarez, which neighbors El Paso, and Tijuana, which neighbors San Diego, both of which are
major crossing points for illegal immigrants. Data are available for the period 1987-1997.
Given the relatively low education levels of recent immigrants, the effects of immigration
are likely to differ across skill groups for workers in both the United States and Mexico. To
control for this possibility, we follow recent literature (see note 4) by calculating the age-adjusted
mean wage for four education categories in each border region, in each time period. To do so,
we estimate the following regression separately for each time period:
Wht = tDh.ie + YjkrEhjkt + Eht (1)j— k—i
where Whi is log real earnings for individual h in period t, D is a dummy variable for whether
individual h belongs to age group i, EJ/(. is a dummy variable for whether individual h has
education level j and resides in region k, the /3,,'s and the jkt' are parameters to be estimated,
and 6h: is an i.i.d. error term.t3 The 's are age-adjusted mean wages for different education
groups in different regions, which we use as dependent variables in subsequent analysis.
For both the CPS and the ENIEU, the individuals included in the sample are non-self-
employed, non-military males aged 16-64 who worked at least twenty hours in the survey week.
12Monthly CPS data are available for the period January, 1979 to December, 1996. Due to changes in
classification codes for MSAs, there are no MSA identifiers in the data for the periods July-December, 19S5 orJune-August, 1995. In order to use a continuous time series, we are limited to the intervening period. Stateidentifiers exist in CPS data for all months. We use both samples in our analysis.
13 For CPS data, the wage is usual weekly earnings, deflated by the U.S. CPI for the current month; forENEU data, the wage is usual monthly earnings, deflated by the Mexican CPI for the current month.
10
We include dummy variables for five age groups, 16-24 years, 25-34 years, 35-44 years, 45-54
years, and 55-64 years. For CPS data, we estimate region-education dummy variables for five
regions, border cities in California, non-border areas in California, border cities in Texas, non-
border areas in Texas, and the rest of the United States, and four education categories, high-
school dropout, high-school graduate, some college, and college graduate. For ENEU data, we
estimate region-education dummy variables for four regions, Ciudad Juarez, Tijuana, other border
cities, and interior cities,'4 and four education categories, 0-6 years (primary), 7-11 years
(secondary), 12-15 years, and greater than 15 years.'5
Figures 3 and 4 show average hourly wages for high-immigrant industries in California
and Texas, relative to wages for the same industries in the United States as a whole.16 While real
wages decline in all of these industries, there are also relative wage declines in California textiles
and lumber and Texas food products. Figures 5 and 6 show age-adjusted mean wages of high-
school dropouts and high-school graduates in California and Texas border cities, relative to those
for the corresponding education group in the rest of the United States. Wages for both high-
school dropouts and high-school graduates in California tend to be higher than in the rest of the
nation, but they decline in relative terms over the period. Wages for both education groups in
Texas are below those for the rest of the nation, and, though highly variable, show no time trend.
Figure 7 shows age-adjusted mean wages for individuals with primary (0-6 years) education and
secondary (7-11 years) education for Ciudad Juarez and Tijuana; wages are relative to those for
The other border cities are Matamoros and Nuevo Laredo. The interior cities are the country's threelargest cities, Guadalajara, Mexico City, and Monterrey.
15 The education categories for Mexico group individuals with similar skill levels, as indicated by averageearnings. There are spikes in the distribution of schooling at 6 years (primary school), 9 years (secondaryschool), and 12 years (preparatory school). Very few individuals complete 16 or more years of schooling.
16 Given age-adjusted mean wages are estimated coefficients from log-wage regressions, the relative wageswe show in Figures 3-6 are the log difference of the two relevant series.
11
the corresponding education group in interior Mexican cities. Wages are high relative to interior
cities, particularly in Tijuana, but decline over the period.
ilL Empirical Specification
A. Empirical Model
In this section, we present an empirical specification for how border enforcement will
influence and be influenced by wages in border regions. The starting point for the analysis is
the idea that wages in border regions will be affected by three factors: the migration of labor
between regions within a country, the immigration (or emigration) of labor from neighboring
countries, and local labor demand conditions. Rather than derive a structural model of wage
determination, we use a vector autogression (VAR) to summarize the manner in which border
wages, border enforcement, and wages in surrounding regions are jointly determined.
We assume workers prefer to be in the region that pays the highest real wage. If shocks
to labor demand or labor supply lower wages in the border region relative to the country as a
whole, workers will migrate away from the region until regional wages are equalized. Moving
costs or other frictions between regional labor markets may create dynamics in the adjustment
process (Topel 1986, Blanchard and Katz 1992). Labor migration between regions within a
country suggests that wages in border areas will be influenced by wages in surrounding regions.
Wages in U.S. border regions will also be influenced by the immigration of workers from
Mexico, where we focus on illegal immigration.'7 Attempted illegal immigration will be higher,
" While it would be desirable to also examine legal immigration, we lack high-frequency data on the stockof legal immigrants in border areas. It is important to note, however, that many legal immigrants may choose toimmigrate illegally while they await the outcome of their application for legal immigration. Until 1998, therewere no potential legal consequences of doing so (Hanson and Spilimbergo 1999).
12
the higher is the real U.S. wage relative to the real Mexican wage. The responsiveness of illegal
immigration to U.S.-Mexico wage differentials will depend on the costs of crossing the border,
an important component of which is the possibility of apprehension by the U.S. Border Patrol
and deportation back to Mexico. Once apprehended, individuals lose time out of the labor
market and face other psychic and monetary costs associated with detention. For a given U.S.-
Mexico relative wage, higher levels of enforcement by the U.S. Border Patrol will presumably
reduce attempts to enter the United States illegally, which will in turn affect wages along the
border. Through its impact on the flow of illegal immigrants across the U.S.-Mexico border, we
expect increases in border enforcement to put upward pressure on wages in U.S. border regions
and downward pressure on wages in Mexican border regions.'8
Border enforcement may in turn be influenced by labor-market conditions in the United
States and Mexico. If the U.S. Border Patrol chooses how intensively to enforce the border
based on expected illegal attempts to cross the border, then border enforcement is likely to be
increasing in the U.S.-Mexico wage differential. Factors other than labor-market conditions may
also influence border enforcement. U.S. politicians periodically campaign for more enforcement
of U.S. borders to gain the support of constituents that, for real or imagined reasons, feel
threatened by illegal immigration. This suggests that border enforcement may follow political
cycles, which may or may not he correlated with economic cycles.
The relationship between border wages, border enforcement, and wages in surrounding
regions may be summarized by the following bivariate VAR:
Border enforcement may reduce the inflow of illegal immigrants either directly, by leading to theapprehension and deportation of those that attempt illegal immigration, or indirectly, by deterring individuals inMexico from attempting to enter the United States illegally. In either case, border enforcement puts upwardpressure on wages in U.S. border regions and downward pressure on wages in Mexican border regions.
13
= a + E13w + + + pt +p. (2)
where y, is a 2x1 vector consisting of w, the wage in the U.S. border region, and h, U.S. border
enforcement (person hours the U.S. Border Patrol spends policing the border); X is a kx2 vector
of other variables that influence border wages, including wages in the rest of the United States
and wages in Mexico; a, p, and the ft's and 's are 2x1 vectors of parameters; the y's are 2xk
matrices of parameters; is a 2x1 vector of i.i.d. error terms; and all variables are in logs. The
time trend captures trend growth in border wages. For the United States, the border regions we
examine are those in California and Texas. The border wage may be that for a particular skill
group (high-school dropouts, high-school graduates) or for a particular industry (apparel, food
processing, textiles, lumber, furniture).
In an analogous manner, wages in Mexican border regions are likely to be influenced by
wages elsewhere in Mexico, wages in the United States, and enforcement of the U.S.-Mexico
border. Border enforcement conditions the probability of successful emigration from Mexico.
As Mexican border regions are the point of departure for illegal emigration to the United States,
the short-run and long-run supply of labor in these regions is likely to be affected by changes in
the intensity of border enforcement (though perhaps in quite different ways). We also estimate
a dynamic specification of wages in Mexican border cities, similar to that in equation (2).
14
B. Estimation Issues
There are several estimation issues to be addressed. A first issue is that in equation (2)
we implicitly assume that the variables in the X vector are exogenous to wages in the U.S.
border region and to border enforcement. These variables include wages in non-border regions
of the United States, national wages in Mexico, and, in unreported results, unemployment rates
in U.S. border states. To verif' that this assumption of exogeneity is warranted, we perform tests
of block exogeneity for these variables (Hamilton 1994), in which we test the null hypothesis that
lagged values of border wages and border enforcement are uncorrelated with the elements of the
X vector (where lagged values of this vector are included as explanatory variables). For all
measures of border wages, we fail to reject the null at any reasonable level of significance. This
justifies our assumption that equation (2) is a bivariate VAR containing additional exogenous
explanatory variables.
A second estimation issue is that illegal immigration may create a spurious correlation
between border enforcement and wages in U.S. border regions. To the extent that illegal
immigrants earn lower wages that residents of the United States, their entry into the U.S. labor
force will by defmition lower measured cwerage wages in the United States, even if they have
no impact on the wages of existing U.S. residents. If lower levels of border enforcement allow
higher levels of illegal immigration, there may be a spurious positive correlation between U.S.
wages and border enforcement. While such compositional effects are likely to be small in high-
frequency data, we still control for this problem by excluding potential illegal immigrants from
the sample. In estimating equation (2) on CPS data, we exclude from the sample all individuals
15
that describe themselves as born in Mexico and not U.S. citizens.'9 While this unfortunately
eliminates long-term Mexican residents, both legal and illegal, from our data, it ensures that our
data are unpolluted by compositional effects. We are unable to control for compositional effects
in BLS industry wage data. Thus, OLS coefficients on lagged border enforcement in industry
wage regressions may suffer from positive bias.
A third estimation issue arises from the fact that for some specifications (those relying
on wage data from the CPS or ENEU) we measure wages using coefficient estimates from the
regression in equation (1). These coefficient estimates appear as dependent variables in equation
(2). By construction the disturbance term in equation (2) will include a sampling error that has
a nonconstant variance over time. We use the White (1980) estimator to obtain
heteroskedasticity-consistent standard errors. A further problem is that equation (2) also includes
lagged values of the dependent variables as regressors. By using constructed regressors, we may
be introducing measurement error into the estimation. One solution would be to use instrumental
variables. Valid instruments, in this case, are extremely difficult to find, since we need variables
that are correlated with the first several lags of wages but uncorrelated with contemporaneous
shocks to wages (at monthly frequencies).2° We address the errors-in-variables problem indirectly
by examining the sensitivity of our results to changing the measure of wages that is used. Some
We exclude individuals who defme themselves as "Mexicanos" from the sample. The CPS uses threecategories for persons of Mexican descent, Mexican-American, Chicano, and Mexicano. The BLS includes theseas "write-in" categories and thus does not maintain strict defmitions. Nonetheless, Mexican-Americans aregenerally believed to be U.S. citizens of Mexican descent, Chicano is an alternative term for U.S. citizens ofMexican decent used mostly by the cohort of individuals who were young adults in the 1970s, and Mexicanoappears to be used mostly by Mexican-born individuals who are not U.S. citizens.2u An alternative approach would be to use the variance of the estimated coefficients from the first-stageregression in equation (1) as an estimate of the variance on the measurement error on the generated regressors inthe second-stage estimation of equation (2), which is similar to orthogonal regression. In unreported results, weapplied such regression techniques to CPS data. Since the coefficient estimates we obtained were implausible(negative values for coefficients on the lagged dependent variables), we do not report them here.
16
specifications, notably those using industry average wages (from BLS data), are not subject to
the same concerns about errors in the regressors.
P1. Empincal Results
In this section, we examine the relationship between enforcement of the U. S .-Mexico
border and wages in U.S. and Mexican border regions. Table 2 gives variable defmitions and
summary statistics for selected variables used in the analysis. For the United States, we examine
wages in high-immigrant industries in California and Texas, and wages of male high-school
dropouts and high-school graduates in California and Texas border cities; for Mexico, we
examine wages for males with primary and secondary education in the two largest border cities.
One important issue for VAR estimation concerns choosing the correct lag length for the
regressors. This is somewhat tricky in our case, since we have no independent information on
how long it takes for increases in border enforcement today to impact labor markets in border
areas. The impact is likely to be relatively rapid in Mexican border communities, since increases
in border enforcement impede workers from leaving Mexico. On the U.S. side of the border, it
is unclear how long it takes illegal immigrants to enter the labor force, once they have crossed
the border. We choose the lag length indicated by the Schwarz Criterion.2'
As an informal indication of the relationship between wages and enforcement, Figures 8-
11 show cross-correlograms for border enforcement and each measure of border wages, where
all series are detrended. These graphs plot the correlation between log border wages and leads
and lags of log border enforcement. If enforcement does impact wages, we would expect to see
21 In most cases, the lag length indicated by the Schwarz Criterion is the same as that indicated by the AkaikeInformation Criterion.
17
a positive correlation between wages and lags of enforcement in U.S. border regions and a
negative correlation between wages and lags of enforcement in Mexican border regions. Without
additional controls, however, these raw correlations are only a rough indication.
Figure 8 shows that in the California food products, apparel, and lumber industries there
is a positive correlation between wages and border enforcement, which peaks at two to four lags
of enforcement. This is weakly consistent with the hypothesis that border enforcement leads
border wages. For Texas border industries, shown in Figure 9, there is a similar relationship
between wages and enforcement in lumber and furniture. There is also a positive correlation
between wages and enforcement in apparel, but it peaks for the contemporaneous correlation.
There is zero correlation between wages and enforcement in food products and textiles. Turning
to wages for high-school dropouts and high-school graduates in California and Texas border
cities, shown in Figure 10, we see zero or negative correlations between wages and enforcement.
Finally, Figure 11 shows cross-correlograms for Mexican border cities. There is a negative
correlation between wages and enforcement in all cases, which peaks at six to eight leads of
enforcement suggesting that wages lead enforcement rather than the reverse. Overall, the cross-
correlograms reveal no consistent relationship between wages and enforcement. The regression
results we report below confirm this fmding.
A. High-Immigmnt Industiies in California and Texas
Tables 3-6 report OLS regression results, using either U.S. industry wages or border
enforcement as the dependent variable. Data are monthly and the time period is January, 1977
to June 1998. We examine whether border enforcement Granger causes wages in U.S. border
18
industries and whether U.S. border wages Granger cause border enforcement. For each case, we
report results with and without additional control variables in the estimation. The wage measure
is the log of average hourly real wages for production workers in the food products, textiles,
apparel, lumber, or furniture industries in California or Texas. The measure of border
enforcement is the log of total enforcement hours in Border Patrol sectors along either the
California or Texas-Mexico border. The additional control variables are log wages for the U.S.
industry as a whole and log real average hourly wages for manufacturing workers in Mexico.
All regressions include monthly dummy variables, a time trend, and three lags on the regressors.
Results for either two or four lags are very similar to those reported below.
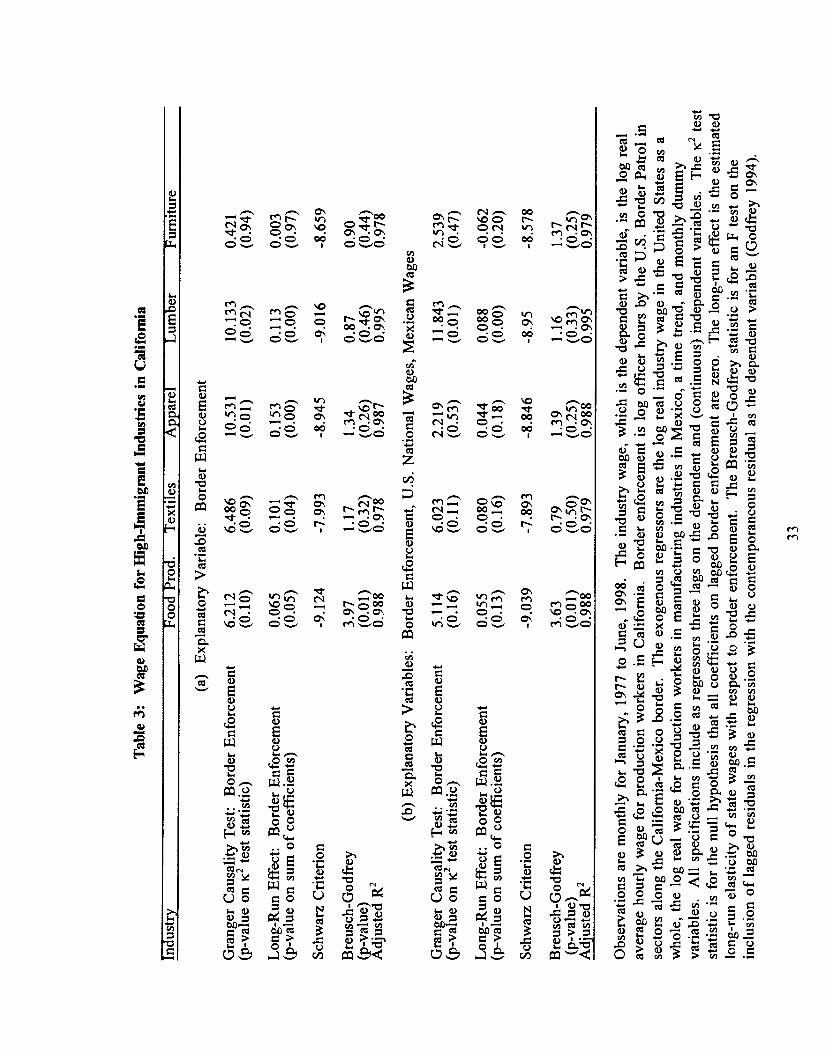
To begin, consider the results in Table 3a, in which wages are the dependent variable and
there are no additional controls in the regression. In two industries, apparel and lumber, the
coefficients on lagged border enforcement are jointly statistically significant at the 5% level, and
in three industries, the previous two plus textiles, they are jointly significant at the 10% level.
The results change markedly, however, when additional controls are included in the regression.
In Table 3b, we add lagged national industry wages and Mexican wages to the set of regressors.
The coefficients on lagged border enforcement are jointly significant at the 5% in only one
industry, lumber. In all other industries we easily reject the null hypothesis that border
enforcement Granger causes border wages.
Despite the imprecision of the coefficient estimates, it is important to ask whether the
estimated impact of border enforcement on industry wages in California is economically
important. Table 3 also reports the estimated long-run elasticity of wages with respect to border
enforcement. In Table 3b, the long-run elasticity of California industry wages with respect to
19
border enforcement ranges from 0.04 in apparel to 0.09 in lumber (ignoring the furniture industry,
where the estimated impact ranges from positive to negative). This impact is small, especially
when we consider that, given potential upward bias from compositional effects, it is likely to be
an upper bound on the true long-run impact.
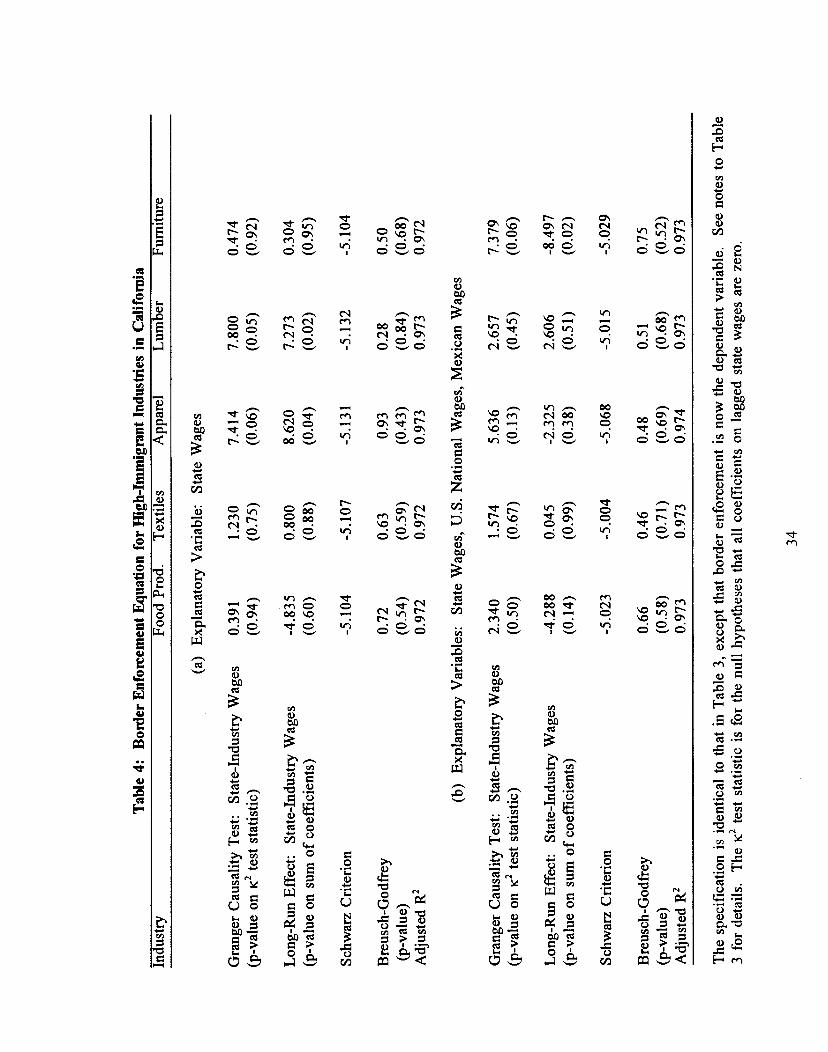
Table 4 reports results using the identical specification as in Table 3, except with border
enforcement as the dependent variable. There is little evidence that wages in high-immigrant
California industries influence border enforcement. In all regressions, except in the case of the
lumber industry without additional controls in the regression (Table 4a), we fail to reject the null
that the coefficients on lagged California industry wages are jointly zero at the 5% level. This
is not to say, however, that economic conditions in the United States are irrelevant for the border
enforcement decision. Unreported coefficient estimates indicate that for most industries, national
U.S. industry wages have a positive and statistically significant long-run impact on border
enforcement. This is consistent with the idea that the INS raises enforcement when economic
conditions in the United States improve, making the United States more attractive to prospective
immigrants in Mexico (but does not raise enforcement when economic conditions in U.S. border
states improve relative to the country as a whole).
In Tables 5 and 6, we repeat the analysis for Texas. Here, the results are even weaker.
Only in lumber are lagged values of border enforcement (along the Texas-Mexico border) jointly
significantly correlated with Texas industry wages. The estimated long-run impact of
enforcement on wages is again quite small. In no industry are lagged Texas industry wages
jointly significantly correlated with border enforcement. For most industries, it is again the case
that border enforcement along the Texas-Mexico border is positively correlated with lagged
20
values of national U.S. industry wages. Taken with the previous results, it appears that the INS
raises enforcement along the entire U.S.-Mexico border when overall economic conditions in the
United States improve (but not when economic conditions improve in border states alone).
In unreported regressions, we examine the sensitivity of our results to alternative
specifications and sample periods. We experiment with altering lag lengths on the regressors,
using national in place of regional measures of border enforcement, replacing California industry
wages with industry wages for the Los Angeles-Long Beach MSA (where Mexican immigrants
are highly concentrated), dropping observations after the devaluation of the peso in 1994 (which
was followed by a severe recession in Mexico), and adding apprehensions of individuals at the
border as a regressor. None of these changes has a material impact on the results. Border
enforcement has at most a weak positive impact on border industry wages and border industry
wages have no impact on border enforcement.
B. California and Texas Bonier Cities
In the preceding section, the unit of analysis was the average hourly wage for a high-
immigrant industry in a border state. While the industries in question are those where illegal
immigration seems most likely to have an observable impact, using average industry wages may
smooth over variation across workers, making the impact of border enforcement on wages
difficult to detect. In this section, we adopt an alternative definition of border labor markets.
We examine low-education males in California and Texas border cities. We perform a similar
series of regressions as those in Tables 3-6, except that now wages are the age-adjusted mean
wage for either high-school dropouts or high-school graduates in a given region. All other
21
variables, including border enforcement, remain the same. Data limitations restrict the analysis
to monthly data for the period January, 1986 to May, 1995. Table 7 reports the results.
The first column of Table 7 shows results using the wage for high-school dropouts in
California border cities as the dependent variable. We find a weak negative correlation between
border wages and lagged border enforcement. The correlation between wages for high-school
graduates and border enforcement, shown in column two, is also negative, though with less
statistical significance. The results for Texas, shown in columns three and four, are similar.
There is a negative correlation between wages and border enforcement for high-school dropouts,
which is statistically significant, and an imprecisely estimated correlation between wages and
border enforcement for high-school graduates. For neither California nor Texas do we fmd that
increases in border enforcement contribute to higher wages for low-education males. In
unreported results, we replaced border wages with border enforcement as the dependent variable.
Similar to the results in the previous section, in no case is border enforcement jointly
significantly correlated with lagged values of border wages.
To check the sensitivity of these results, we used alternative specifications and sample
periods. The results are unaffected by changing lag lengths on the regressors, replacing regional
border enforcement with national border enforcement, or including border apprehensions as a
regressor. Finally, we performed similar regressions in which we used the age-adjusted mean
wage for high-school dropouts or high-school graduates in either all of California or all of Texas
as the dependent variable. The advantage of this approach is that we are able to extend the time
period for the analysis to January, 1979 to March, 1996. We again find no evidence that border
enforcement has a positive long-run impact on wages in border states (indeed, in most cases the
22
estimated long-run impact of enforcement on wages remains weakly negative).
That we estimate a negative correlation between border wages and border enforcement
using wages constructed from CPS data contrasts with the results in Tables 3-6, in which we use
industry average wage data from the BLS. As indicated earlier, one concern is that measurement
error in the constructed wage measures from CPS data may contaminate the regression results
and somehow lead to downward bias in the estimated impact of enforcement on wages, in which
case the results in Table 7 would underestimate the impact of enforcement on wages. It is
important to re-emphasize that our concerns about compositional bias in average industry wages
suggest that the results in Tables 3-6 may overestimate the impact of enforcement on wages.
Taking either set of results, there is little evidence that border enforcement significantly raises
wages in U.S. border regions or industries.
C. Mexican Border Cities
Although the effects of border enforcement are negligible in U.S. border regions, it is
possible that U.S. border enforcement may have large effects on labor markets in Mexican border
regions. Mexican border cities are the transit point for most undocumented Mexican immigrants
and changes in border enforcement could have large effects, whether temporary or permanent,
on local labor supplies in these areas. We examine the two largest Mexican border cities, which
are also the major border crossing points for illegal immigrants, Tijuana, which neighbors San
Diego, and Ciudad Juarez, which neighbors El Paso. The empirical specification is similar to that
in previous sections. The dependent variable is the age-adjusted mean wage for Mexican males
with either primary (0-6 years) or secondary (7-11 years) education. Enforcement is now
23
measured as the log of monthly enforcement hours summed into quarters to match the frequency
of the wage data. Additional control variables are the log U.S. average hourly real wage for
production workers in manufacturing, the age-adjusted mean wage for the corresponding
education group in interior Mexico, and a time trend. The data are quarterly and cover the period
1987:1 to 1997:4. Table 8 contains the results.
We find that U.S. border enforcement has a negative but often imprecisely estimated
effect on Mexican wages. For Tijuana, lagged values of border enforcement are jointly
significantly correlated with wages for males with either primary or secondary education. For
Ciudad Juarez, there is no such evidence. The long-run elasticity of wages with respect to border
enforcement is -0.30 for both education groups in Tijuana and -0.03 to -0.04 for the two
education groups in Ciudad Juarez. Only for the secondary education group in Tijuana, however,
is the long-run impact significant. Thus, the results for Tijuana suggest border enforcement has
an economically significant impact on wages in the region, at least for males with secondary
education. The size of the effect is greater than that found for any U.S. border area.
The findings for Tijuana and Ciudad Juarez are robust to alternative lag structures. The
magnitude of the long-run effect for Tijuana increases somewhat when a third lag on the
regressors is added. To further evaluate the robustness of the results, we included the real
exchange rate as a regressor and examined results for other large Mexican border cities.
Including the real exchange rate does not affect the results qualitatively. The other border cities
we examine are Matamoros and Nuevo Laredo, which, over the sample period, were not primary
points for illegal entry into the United States. Unsurprisingly, we find no significant effects of
border enforcement on Mexican wages in either city.
24
The results suggest that U.S. border enforcement has a moderate negative effect on
Mexican wages. One problem is that the sample period, ten years with quarterly data, is short.
This leaves open the possibility that the results we fmd for Tijuana might not hold for other time
periods. Unfortunately, the data do not permit extending the analysis backwards in time.
V. Discussion
In this paper, we examine the correlation between enforcement of the U.S.-Mexico border
and wages in U.S. and Mexican border regions. For high-immigrant industries in California and
Texas, we fmd a positive long-run impact of border enforcement on wages for one industry only,
lumber, and even in this case the magnitude on the impact is quite small. We fmd no positive
effects whatsoever for low-education males in the border regions of either state. For Mexico, the
impact of U.S. border enforcement is larger. We find a moderate negative impact of border
enforcement on wages for males with secondary education in Tijuana, which is where a large
fraction of attempts at illegal entry occur over the sample period.
Our results are consistent with two alternative hypotheses. One is that border enforcement
has a minimal impact on illegal immigration. In this case, it would still be possible that illegal
immigration puts downward pressure on wages in U.S. border regions, but, since border
enforcement does not impede illegal immigration, we would find no correlation between
enforcement and wages in U.S. border regions. We find this interpretation implausible. That
wages in Tijuana decline following increases in border enforcement suggests that border
enforcement does influence border labor markets, if only in Mexico and not the United States.
Additionally, there is abundant evidence that when border enforcement increases at one part of
25
the border, attempts at illegal entry, and hence apprehensions, increase along other parts of the
border (see Figures 1 and 2). Substitution between border crossing sites indicates that at the
margin prospective mimigrants are deterred by higher levels of border enforcement. Graphic
illustrations of this fact are in unfortunate abundance. Following recent increases in border
enforcement at the traditional crossing points of San Diego, El Centro, and El Paso, more
immigrants have attempted to enter the United States by crossing the Sonoran desert into
Arizona. There has been a corresponding surge in deaths among those attempting illegal entry.
A second interpretation of our results is that border enforcement does deter illegal
immigrants but that illegal immigration has a minimal impact on labor markets in U.S. border
regions. We believe this to be the more defensible conclusion. There are two ways in which
border regions may adjust to influxes of illegal immigrants without large changes in wages. The
first is that, given an immigrant influx, U.S. natives may leave border regions or be deterred from
moving to border regions. Filer (1992) and Borjas, Freeman, and Katz (1997) provide evidence
in support of this view. The second is that border economies over time may shift towards
industries that are relatively intensive in the use of the skills of arriving immigrants. Hanson and
Slaughter (1999) find evidence in support of this view, especially for California.
Border enforcement remains the centerpiece of U.S. policy on illegal immigration. The
costs and benefits of this strategy are currently the subject of intense debate. The results in this
paper suggest that concerns about the wage impact of illegal immigration have been exaggerated.
While our results do not imply that eliminating border enforcement would leave labor markets
in U.S. border areas unaffected, over the range of values for which we observe variation in
border enforcement we detect no benefits for U.S. border communities in terms of higher wages.
26
References
Altonji, J.G. and D. Card. 1991. "The Effects of Immigration on the Labor Market Outcomesof Less-Skilled Natives." In J.M. Abowd and R.B. Freeman, eds., Immigration, Trade, and theLabor Market. Chicago: University of Chicago Press, pp. 201-59.
Bean, Frank D.; Espenshade, Thomas J.; White, Michael J. and Dymowski Robert F. "Post-IRCA Changes in the Volume and Composition of Undocumented Migration to the United States:An Assessment Based on Apprehensions Data," in Frank D. Bean, Barry Edmonston, and JeffreyS. Passe!, eds., Undocumented migration to the United States: IRCA and the experience of the1980's. Washington, DC: The Urban Institute, 1990, pp. 111-58.
Blanchard, 0. and L. Katz. 1992. "Regional Evolutions." Brookings Papers on EconomicActivity 1: 1-75.
Borjas, G.J. 1987. "Immigrants, Minorities, and Labor Market Competition." IndustrialandLabor Relations Review 40: 382-392.
Borjas, George J. "The Economics of Immigration." Journal of Economic Literature, December1994, 32(4), pp. 1667-1717.
Borjas, G.J., R.B. Freeman, and L.F. Katz. 1992. "On the Labor Market Effects of Immigrationand Trade." In G.J. Borjas and R.B. Freeman, eds., Immigration and the Work Force. Chicago:University of Chicago Press, pp. 213-44.
Borjas, G.J., R.B. Freeman, and L.F. Katz. 1997. "How Much do Immigration and Trade AffectLabor Market Outcomes?" Brookings Papers on Economic A ctivity 1: 1-90.
Borjas, G.J., Freeman, Richard B. and Lang, Kevin. 1991. "Undocumented Mexican-BornWorkers in the United States: How Many, How Permanent?" in John M. Abowd and RichardB. Freeman, eds., Immigration, Trade, and the Labor Market. Chicago, IL: University ofChicago Press, pp. 77-100.
Borjas, G.J. and L. Hilton. 1996. "Immigration and the Welfare State: Immigrant Participationin Means-Tested Entitlement Programs." Quarterly Journal of Economics 106: 575-604.
Bustamante, Jorge. 1990. "Undocumented Migration from Mexico to the United States:Preliminary Findings of the Zapata Canyon Project," in Frank D. Bean, Barry Edmonston, andJeffrey S. Passel, eds., Undocumented migration to the United States: IRCA and the experienceof the 1980's. Washington, DC: The Urban Institute, pp. 211-226.
Card, D.E. 1997. "Immigrant Inflows, Native Outflows, and the Local Labor Market Impactsof Higher Immigration." NBER Working Paper No. 5927.
27
Cornelius, Wayne A. 1992. "From Sojourners to Settlers: The Changing Profile of MexicanImmigration to the United States," in Jorge A. Bustamente, Clark W. Reynolds, and Raul A.Hinojosa, eds., U.S.-Mexico Relations: Labor-market Interdependence. Stanford, CA: StanfordUniversity Press, pp. 155-95.
Donato, Katherine M.; Durand, Jorge and Massey, Douglas 5. 1992. "Stemming the Tide?Assessing the Deterrent Effects of U.S. Immigration and Control." Demogrqthy, May, (2), pp.139-57.
Donato, Katherine M., and Massey, Douglas S. 1992. "Mexican Migration to the United States:A Critical Review." Latin A merican Research Review, 27: 3-43.
Espenshade, Thomas J. "Does the Threat of Border Apprehension Deter Undocumented U.S.Immigration?" Population and Development Review, December 1994, 20(4), pp. 871-91.
Espenshade, Thomas J. "Unauthorized Immigration to the United States." A nnual Review ofSociology Vol. 21, 1995, pp. 195-216.
Filer, R.K. 1992. "The Effect of Immigrant Arrivals on Migratory Patterns of Native Workers."In G.J. Borjas and R.B. Freeman, eds., Immigration and the Work Force. Chicago: University ofChicago Press.
Friedberg, Rachel M. and Hunt, Jennifer. "The Impact of Immigrants on Host-Country Wages,Employment, and Growth." Journal of Economic Perspectives, Spring 1995, 9(2), pp. 23-44.
Godfrey, L.G. 1994. "Testing for Serial Correlation by Variable Addition in Dynamic ModelsEstimated by Instrumental Variables." The Review of Economics and Statistics 76: 550-559.
Grossman, J.B. 1982. "The Substitutability of Natives and Immigrants in Production." Reviewof Economics and Statistics 54: 596-603.
Hamilton, J.D. 1994. Time Series A nalysis. Princeton, NJ: Princeton University Press.
Hanson, G.H. and A. Spilimbergo. 1999. "Illegal Immigration, Border Enforcement, and
Relative Wages: Evidence from Apprehensions at the U.S.-Mexico Border," American Economic
Review, forthcoming.
Hanson, G.H. and M.J. Slaughter. 1999. "Factor-Price Insensitivity to Immigration and theRybczynski Theorem: Evidence from U.S. States." Mimeo, University of Michigan.
Katz, L. and K.M. Murphy. 1992. "Changes in Relative Wages, 1963-1987: Supply and
Demand Factors." Quarterly Journal of Economics 107: 35-78.
LaLonde, R.J. and R.H. Topel. 1991. "Labor Market Adjustments to Increased Immigration."
28
In J.M. Abowd and R.B. Freeman, eds., Immigration, Trade, and the Labor Market. Chicago:University of Chicago Press, pp. 167-99.
Levy, F. and R.J. Murnane. 1992. "U.S. Earnings Levels and Earnings Inequality: A Reviewof Recent Trends and Proposed Explanations." Journal of Economic Literature 30: 1333-1382.
Orrenius, P. 1987. "The Role of Income Shocks on Migration Behavior and Migrant Self-Selection: The Case of Return Migrants from Mexico, 1970-1988." Mimeo, UCLA.
Robertson, R. 1998. "Wage Shocks and North American Labor Market Integration." Mimeo,Syracuse University.
Schoeni, R.F. 1997. "The Effect of Immigrants on the Employment of Wages of NativeWorkers: Evidence from the 1970s and 1980s." Mimeo, RAND.
Topel, R.H. 1986. "Local Labor Markets." Journal of Political Economy 94: S111-S143.
U.S. Immigration and Naturalization Service, Department of Justice. 1994 Statistical Yearbookof the Immigration and Naturalization Ser,'ice. Washington, D.C.: U.S. Government PrintingOffice, 1996.
Warren, Robert. "Estimates of the Undocumented Immigrant Population Residing in the UnitedStates, by Country of Origin and State of Residence: October 1992." Washington, D.C.: U.S.Immigration and Naturalization Service, Department of Justice, 1995.
29
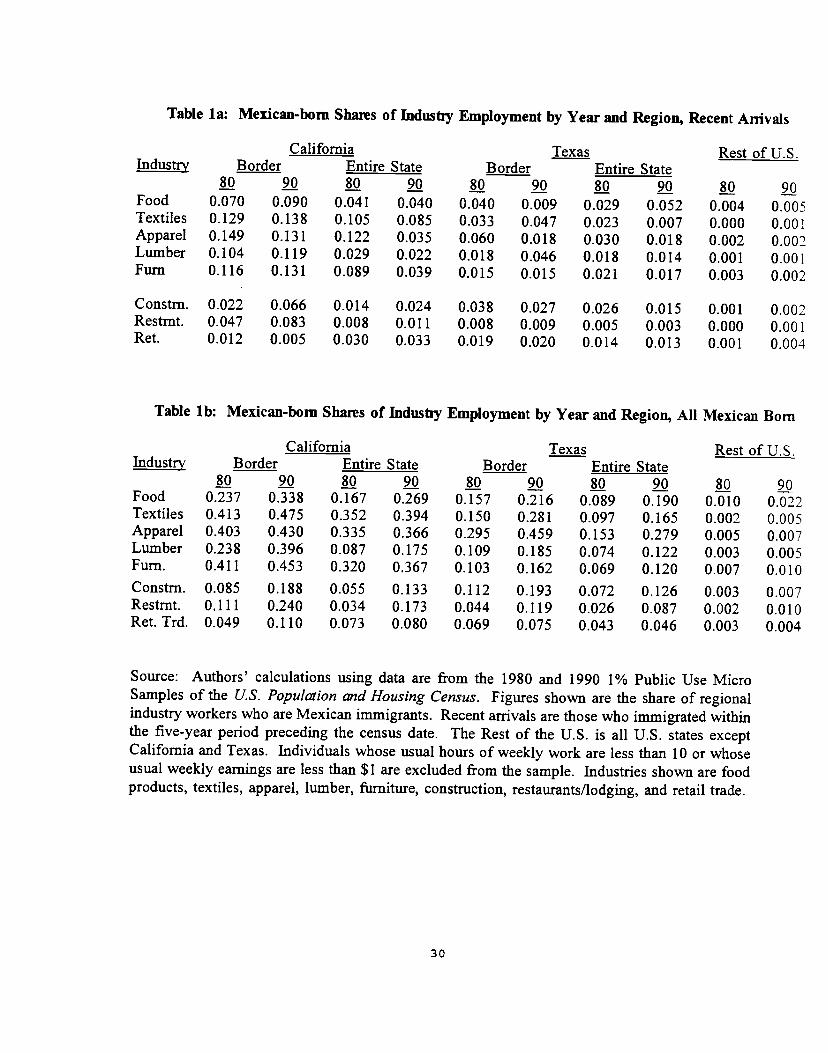
Table la: Mexican-born Shares of Industiy Employment by Year and Region, Recent Anivals
California Texas Rest of U.S.Industry Border Entire State Border Entire State
80 90 80 90 80 90 80 80 90Food 0.070 0.090 0.04 1 0.040 0.040 0.009 0.029 0.052 0.004 0.005Textiles 0.129 0.138 0.105 0.085 0.033 0.047 0.023 0.007 0.000 0.001Apparel 0.149 0.131 0.122 0.035 0.060 0.018 0.030 0.018 0.002 0.002Lumber 0.104 0.119 0.029 0.022 0.018 0.046 0.018 0.014 0.001 0.001Furn 0.116 0.131 0.089 0.039 0.015 0.015 0.021 0.017 0.003 0.002
Constrn. 0.022 0.066 0.014 0.024 0.038 0.027 0.026 0.015 0.001 0.002Restrnt. 0.047 0.083 0.008 0.011 0.008 0.009 0.005 0.003 0.000 0.001Ret. 0.012 0.005 0.030 0.033 0.019 0.020 0.014 0.013 0.001 0.004
Table ib: Mexican-born Shares of Industiy Employment by Year and Region, All Mexican Born
California Texas Rest of U.S.Industry Border Entire State Border Entire State
80 90 80 90 80 90 80 90 80 90Food 0.237 0.338 0.167 0.269 0.157 0.216 0.089 0.190 0.010 0.022Textiles 0.413 0.475 0.352 0.394 0.150 0.281 0.097 0.165 0.002 0.005Apparel 0.403 0.430 0.335 0.366 0.295 0.459 0.153 0.279 0.005 0.007Lumber 0.238 0.396 0.087 0.175 0.109 0.185 0.074 0.122 0.003 0.005Furn. 0.411 0.453 0.320 0.367 0.103 0.162 0.069 0.120 0.007 0.010Constrn. 0.085 0.188 0.055 0.133 0.112 0.193 0.072 0.126 0.003 0.007Restrnt. 0.111 0.240 0.034 0.173 0.044 0.119 0.026 0.087 0.002 0.010Ret. Trd. 0.049 0.110 0.073 0.080 0.069 0.075 0.043 0.046 0.003 0.004
Source: Authors' calculations using data are from the 1980 and 1990 1% Public Use MicroSamples of the US. Population and Housing Census. Figures shown are the share of regionalindustry workers who are Mexican immigrants. Recent arrivals are those who immigrated withinthe five-year period preceding the census date. The Rest of the U.S. is all U.S. statesexceptCalifornia and Texas. Individuals whose usual hours of weekly work are less than 10 or whoseusual weekly earnings are less than $1 are excluded from the sample. Industries shown are foodproducts, textiles, apparel, lumber, furniture, construction, restaurants/lodging, and retail trade.
30

Table 2: Summary Stafislics
(a) Vatiables for Wage-Gmwth Regressions in U.S. Bonier Regions
Variable Name Variable Defmition Mean Std.Error
California Wage- Age-adjusted mean wage for male high-school 4.896 0.223HS Dropout dropouts in southern California MSAs.
California Wage- Age-adjusted mean wage for male high-school 5.237 0.142HS Graduate graduates in southern California MSAs.
Texas Wage- Age-adjusted mean wage for male high-school 4.712 0.171HS Dropout dropouts in southwestern Texas MSAs.
Texas Wage- Age-adjusted mean wage for male high-school 5.051 0.129HS Graduate graduates in southwestern Texas MSAs.
US Wage- Age-adjusted mean wage for male high-school 4.815 0.139HS Dropout dropouts in U.S., excluding California and Texas.
US Wage- Age-adjusted mean wage for male high-school 5.128 0.095HS Graduate graduates in U.S., excluding California and Texas.
Mexico Wage Average hourly real wage for production workers -0.056 0.108in manufacturing industries.
Border Enforcement- Enforcement hours by U.S. Border Patrol in 11.188 0.179California California Border Patrol sectors.
Border Enforcement- Enforcement hours by U.S. Border Patrol in 11.563 0.182Texas Texas Border Patrol sectors.
All figures are in logs and at a monthly frequency for January, 1986 to May, 1995. For expositional ease,we exclude summary statistics on log wages for the food products, textiles, apparel, lumber, and furnitureindustries in California, Texas, and the rest of the United States. Wages for these industries are shownin Figures 3 and 4.
31
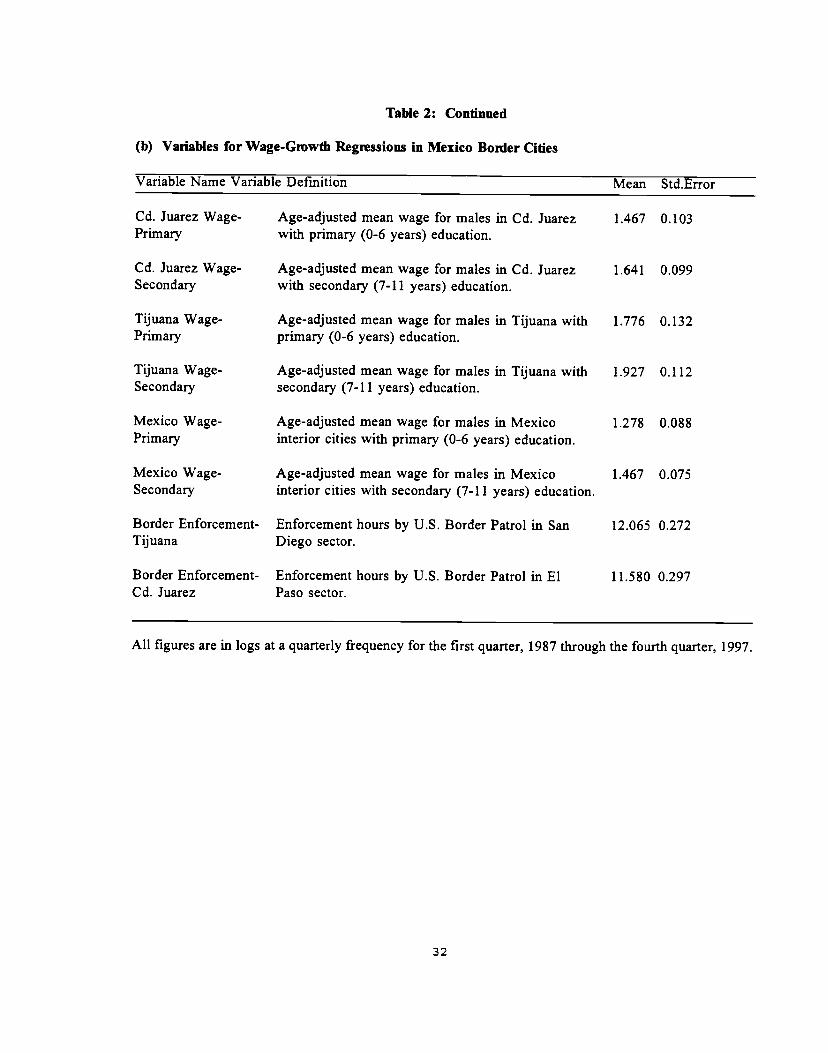
Table 2: Continued
(b) Vanables for Wage-Gmwth Regressions in Mexico Bonier Cities
Variable Name Variable Defmition Mean Std.Error
Cd. Juarez Wage- Age-adjusted mean wage for males in Cd. Juarez 1.467 0.103Primary with primary (0-6 years) education.
Cd. Juarez Wage- Age-adjusted mean wage for males in Cd. Juarez 1.641 0.099Secondary with secondary (7-11 years) education.
Tijuana Wage- Age-adjusted mean wage for males in Tijuana with 1.776 0.132Primary primary (0-6 years) education.
Tijuana Wage- Age-adjusted mean wage for males in Tijuana with 1.927 0.112Secondary secondary (7-11 years) education.
Mexico Wage- Age-adjusted mean wage for males in Mexico 1.278 0.088Primary interior cities with primary (0-6 years) education.
Mexico Wage- Age-adjusted mean wage for males in Mexico 1.467 0.075Secondary interior cities with secondary (7-11 years) education.
Border Enforcement- Enforcement hours by U.S. Border Patrol in San 12.065 0.272Tijuana Diego sector.
Border Enforcement- Enforcement hours by U.S. Border Patrol in El 11.580 0.297Cd. Juarez Paso sector.
All figures are in logs at a quarterly frequency for the first quarter, 1987 through the fourth quarter, 1997.
32
Tab
le 3
: W
age
Equ
atio
n fo
r Hig
h-Im
mig
rant
Indu
stiie
s in
Cal
ifor
nia
Indu
stry
Fo
od P
rod.
T
extil
es
App
arel
L
umbe
r Fu
rnitu
re
(a)
Exp
lana
tory
Var
iabl
e: B
orde
r E
nfor
cem
ent
Gra
nger
Cau
salit
y T
est:
Bor
der
Enf
orce
men
t 6.
212
6.48
6 (p
-val
ue o
n 1(
2 te
st s
tatis
tic)
(0.1
0)
(0.0
9)
10.5
31
(0.0
1)
10.1
33
(0.0
2)
0.42
1 (0
.94)
Lon
g-R
un E
ffec
t: B
orde
r E
nfor
cem
ent
0.06
5 0.
101
(p-v
alue
on
sum
of c
oeff
icie
nts)
(0
.05)
(0
.04)
0.
153
(0.0
0)
0.11
3 (0
.00)
0.
003
(0.9
7)
Schw
arz
Cri
teri
on
-9.1
24
-7.9
93
-8.9
45
-9.0
16
-8.6
59
Bre
usch
-God
frey
3.
97
1.17
(p
-val
ue)
(0.0
1)
(0.3
2)
Adj
uste
d R
2 0.
988
0.97
8
1.34
(0
.26)
0.
987
0.87
(0
.46)
0.
995
0.90
(0
.44)
0.
978
(b) E
xpla
nato
ry V
aria
bles
: B
orde
r E
nfor
cem
ent,
U.S
. Nat
iona
l W
ages
, M
exic
an W
ages
Gra
nger
Cau
salit
y T
est:
Bor
der
Enf
orce
men
t 5.
114
6.02
3 (p
-val
ue o
n (2
test
sta
tistic
) (0
.16)
(0
.11)
2.
219
(0.5
3)
11.8
43
(0.0
1)
2.53
9 (0
.47)
Lon
g-R
un E
ffec
t: B
orde
r E
nfor
cem
ent
0.05
5 0.
080
(p-v
alue
on
sum
of c
oeff
icie
nts)
(0
.13)
(0
.16)
0.
044
(0.1
8)
0.08
8 (0
.00)
-0
.062
(0
.20)
Schw
arz
Cri
teri
on
-9.0
39
-7.8
93
-8.8
46
-8.9
5 -8
.578
Bre
usch
-God
frey
3.
63
0.79
(p
-val
ue)
(0.0
1)
(0.5
0)
Adj
uste
d R
2 0.
988
0.97
9
1.39
(0
.25)
0.
988
1.16
(0
.33)
0.
995
1.37
(0
.25)
0.
979
Obs
erva
tions
are
mon
thly
for
Jan
uary
, 19
77 t
o Ju
ne,
1998
. T
he i
ndus
try
wag
e, w
hich
is
the
depe
nden
t va
riab
le, i
s th
e lo
g re
al
aver
age
hour
ly w
age
for
prod
uctio
n w
orke
rs i
n C
alif
orni
a.
Bor
der e
nfor
cem
ent i
s lo
g of
fice
r ho
urs
by t
he U
.S.
Bor
der P
atro
l in
se
ctor
s al
ong
the
Cal
ifor
nia-
Mex
ico
bord
er.
The
exo
geno
us r
egre
ssor
s are
the
log
rea
l in
dust
ry w
age
in t
he U
nite
d St
ates
as
a w
hole
, the
log
real
wag
e fo
r pr
oduc
tion
wor
kers
in
man
ufac
turi
ng in
dust
ries
in M
exic
o, a
tim
e tr
end,
and
mon
thly
dum
my
vari
able
s.
All
spec
ific
atio
ns in
clud
e as
regr
esso
rs th
ree
lags
on
the
depe
nden
t and
(con
tinuo
us)
inde
pend
ent v
aria
bles
. T
he 1
(2 t
est
stat
istic
is f
or th
e nu
ll hy
poth
esis
that
all
coef
fici
ents
on
lagg
ed b
orde
r enf
orce
men
t are
zer
o.
The
lon
g-ru
n ef
fect
is
the
estim
ated
lo
ng-r
un e
last
icity
of
stat
e w
ages
with
res
pect
to b
orde
r enf
orce
men
t. T
he B
reus
ch-G
odfr
ey s
tatis
tic is
for
an
F te
st o
n th
e in
clus
ion
of la
gged
res
idua
ls in
the
reg
ress
ion
with
the
con
tem
pora
neou
s res
idua
l as
the
dep
ende
nt v
aria
ble
(God
frey
199
4).
33
Tab
le 4
: B
onIe
r Enf
orce
men
t E
quat
ion
for H
igh-
Imm
igra
nt In
dust
ries
in C
alif
orni
a
Indu
stry
Fo
od P
rod.
T
extil
es
App
arel
L
umbe
r Fu
rnitu
re
(a)
Exp
lana
tory
Var
iabl
e:
Stat
e W
ages
Gra
nger
Cau
salit
y T
est:
Stat
e-In
dust
ry W
ages
0.
391
1.23
0 7.
414
7.80
0 0.
474
(p-v
alue
on
1(2
test
sta
tistic
) (0
.94)
(0
.75)
(0
.06)
(0
.05)
(0
.92)
Lon
g-R
un E
ffec
t: St
ate-
Indu
stry
Wag
es
-4.8
35
0.80
0 8.
620
7.27
3 0.
304
(p-v
alue
on
sum
of c
oeff
icie
nts)
(0
.60)
(0
.88)
(0
.04)
(0
.02)
(0
.95)
Schw
arz
Cri
teri
on
-5.1
04
-5.1
07
-5.1
31
-5.1
32
-5.1
04
Bre
usch
-God
frey
0.
72
0.63
0.
93
0.28
0.
50
(p-v
alue
) (0
.54)
(0
.59)
(0
.43)
(0
.84)
(0
.68)
A
djus
ted
R2
0.97
2 0.
972
0.97
3 0.
973
0.97
2
(b)
Exp
lana
tory
Var
iabl
es:
Stat
e W
ages
, U.S
. N
atio
nal
Wag
es, M
exic
an W
ages
Gra
nger
Cau
salit
y T
est:
Stat
e-In
dust
ry W
ages
2.
340
1.57
4 5.
636
2.65
7 7.
379
(p-v
alue
on
1C2 te
st s
tatis
tic)
(0.5
0)
(0.6
7)
(0.1
3)
(0.4
5)
(0.0
6)
Lon
g-R
un E
ffec
t: St
ate-
Indu
stry
Wag
es
-4.2
88
0.04
5 -2
.325
2.
606
-8.4
97
(p-v
alue
on
sum
of c
oeff
icie
nts)
(0
.14)
(0
.99)
(0
.38)
(0
.51)
(0
.02)
Schw
arz
Cri
teri
on
-5.0
23
-5.0
04
-5.0
68
-5.0
15
-5.0
29
Bre
usch
-God
frey
0.
66
0.46
0.
48
0.51
0.
75
(p-v
alue
) (0
.58)
(0
.71)
(0
.69)
(0
.68)
(0
.52)
A
djus
ted
R2
0.97
3 0.
973
0.97
4 0.
973
0.97
3
The
spe
cifi
catio
n is
ide
ntic
al t
o th
at in
Tab
le 3
, ex
cept
tha
t bo
rder
enf
orce
men
t is
now
the
depe
nden
t va
riab
le.
See
note
s to
Tab
le
3 fo
r de
tails
. T
he 1
(2 t
est s
tatis
tic is
for
the
nul
l hy
poth
eses
that
all
coef
fici
ents
on
lagg
ed s
tate
wag
es a
re z
ero.
34
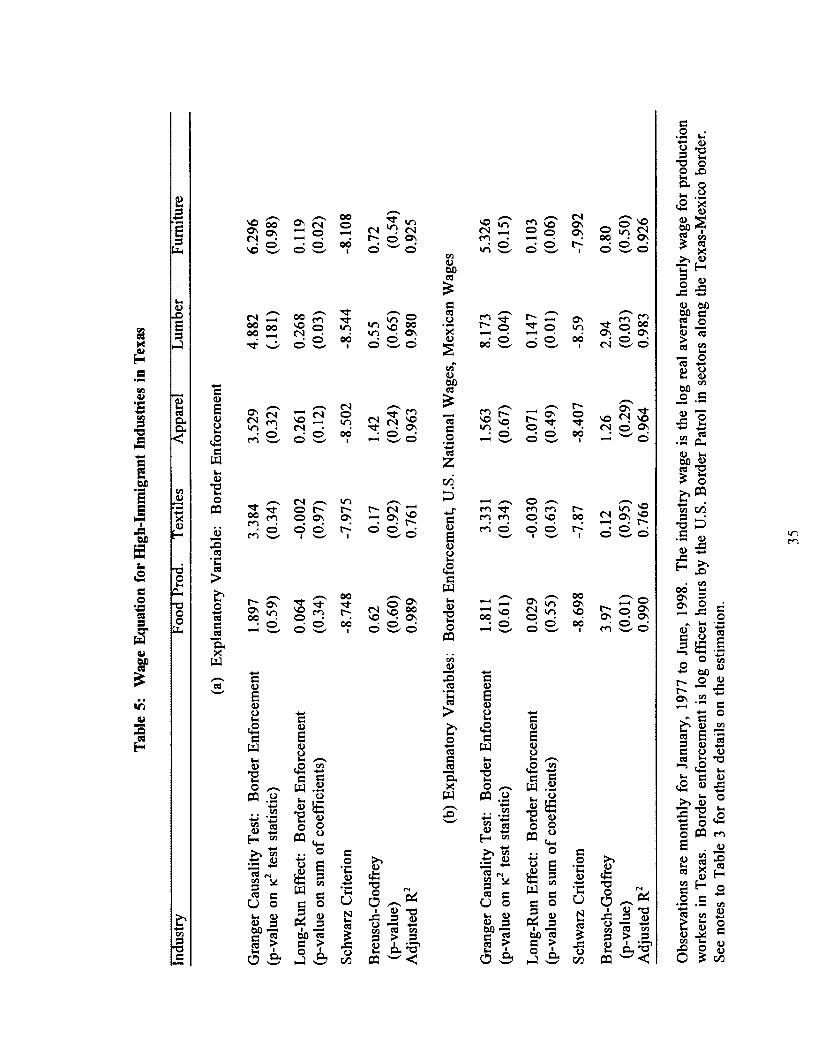
Tab
le 5
: W
age
Equ
alio
n fo
r Hig
h-Im
mig
rant
Ind
ustii
es i
n T
exas
Indu
stry
Fo
od P
rod.
T
extil
es
App
arel
L
umbe
r Fu
rnitu
re
(a)
Exp
lana
tory
Var
iabl
e:
Bor
der
Enf
orce
men
t
Gra
nger
Cau
salit
y T
est:
Bor
der
Enf
orce
men
t 1.
897
3.38
4 3.
529
4.88
2 6.
296
(p-v
alue
on
1c2
test
sta
tistic
) (0
.59)
(0
.34)
(0
.32)
(.
181)
(0
.98)
Lon
g-R
un E
ffec
t: B
orde
r E
nfor
cem
ent
0.06
4 -0
.002
0.
261
0.26
8 0.
119
(p-v
alue
on
sum
of c
oeff
icie
nts)
(0
.34)
(0
.97)
(0
.12)
(0
.03)
(0
.02)
Schw
arz
Cri
teri
on
-8.7
48
-7.9
75
-8.5
02
-8.5
44
-8.1
08
Bre
usch
-God
frey
0.
62
0.17
1.
42
0.55
0.
72
(p-v
alue
) (0
.60)
(0
.92)
(0
.24)
(0
.65)
(0
.54)
A
djus
ted
R2
0.98
9 0.
761
0.96
3 0.
980
0.92
5
(b) E
xpla
nato
ry V
aria
bles
: B
orde
r E
nfor
cem
ent,
U.S
. Nat
iona
l W
ages
, Mex
ican
Wag
es
Gra
nger
Cau
salit
y T
est:
Bor
der
Enf
orce
men
t 1.
811
3.33
1 1.
563
8.17
3 5.
326
(p-v
alue
on
1(2
test
sta
tistic
) (0
.61)
(0
.34)
(0
.67)
(0
.04)
(0
.15)
Lon
g-R
un E
ffec
t: B
orde
r E
nfor
cem
ent
0.02
9 -0
.030
0.
07 1
0.14
7 0.
103
(p-v
alue
on
sum
of c
oeff
icie
nts)
(0
.55)
(0
.63)
(0
.49)
(0
.01)
(0
.06)
Schw
arz
Cri
teri
on
-8.6
98
-7.8
7 -8
.407
-8
.59
-7.9
92
Bre
usch
-God
frey
3.
97
0.12
1.
26
2.94
0.
80
(p-v
alue
) (0
.01)
(0
.95)
(0
.29)
(0
.03)
(0
.50)
A
djus
ted
R2
0.99
0 0.
766
0.96
4 0.
983
0.92
6
Obs
erva
tions
are
mon
thly
for
Jan
uary
, 19
77 to
Jun
e, 1
998.
T
he in
dust
ry w
age
is t
he l
og r
eal
aver
age
hour
ly w
age
for p
rodu
ctio
n w
orke
rs i
n T
exas
. B
orde
r en
forc
emen
t is
log
off
icer
hou
rs b
y th
e U
.S.
Bor
der P
atro
l in
sec
tors
alo
ng th
e T
exas
-Mex
ico
bord
er.
See
note
s to
Tab
le 3
for
oth
er d
etai
ls o
n th
e es
timat
ion.
35
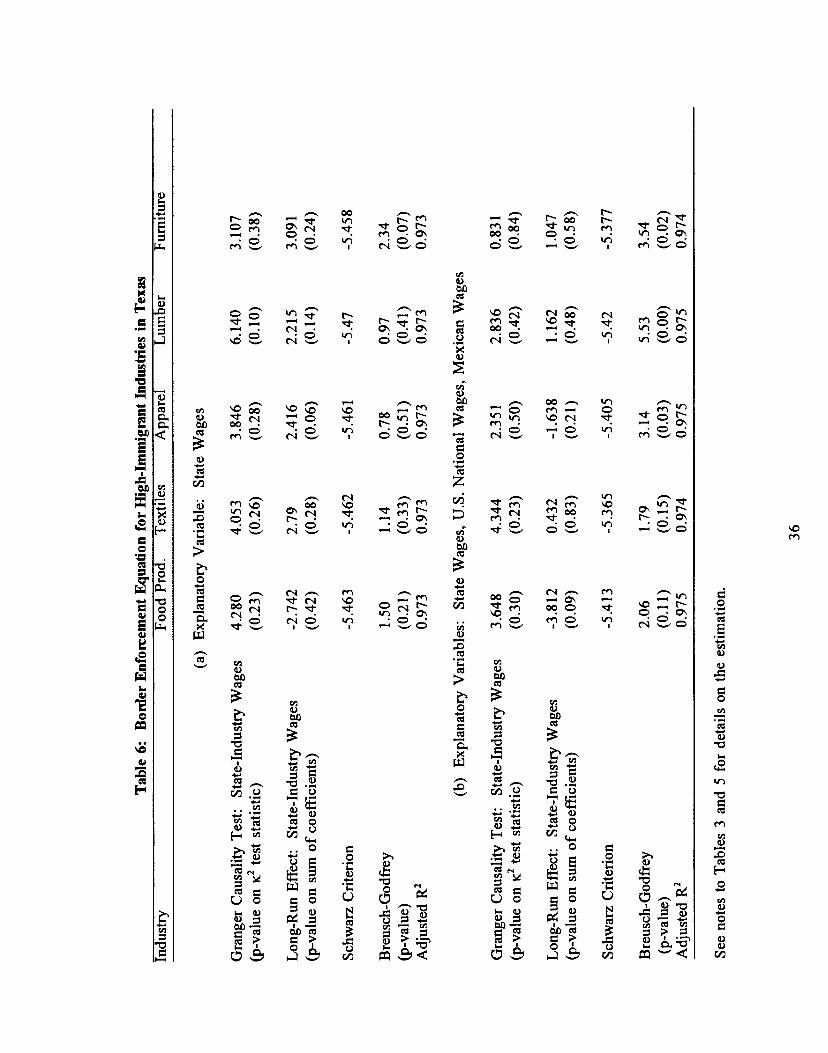
Tab
le 6
: B
orde
r Enf
orte
men
t Equ
alio
n fo
r H
igh-
Imm
igra
nt I
ndus
tiies
in
Tex
as
Indu
stry
Fo
od P
rod.
T
extil
es
App
arel
L
umbe
r Fu
rnitu
re
(a)
Exp
lana
tory
Var
iabl
e:
Stat
e W
ages
Gra
nger
Cau
salit
y T
est:
Stat
e-In
dust
ry W
ages
4.
280
4.05
3 3.
846
6.14
0 3.
107
(p-v
alue
on
ic te
st s
tatis
tic)
(0.2
3)
(0.2
6)
(0.2
8)
(0.1
0)
(0.3
8)
Lon
g-R
un E
ffec
t: St
ate-
Indu
stry
Wag
es
-2.7
42
2.79
2.
416
2.21
5 3.
091
(p-v
alue
on
sum
of c
oeff
icie
nts)
(0
.42)
(0
.28)
(0
.06)
(0
.14)
(0
.24)
Schw
arz
Cri
teri
on
-5.4
63
-5.4
62
-5.4
61
-5.4
7 -5
.458
Bre
usch
-God
frey
1.
50
1.14
0.
78
0.97
2.
34
(p-v
alue
) (0
.21)
(0
.33)
(0
.51)
(0
.41)
(0
.07)
A
djus
ted
R2
0.97
3 0.
973
0.97
3 0.
973
0.97
3
(b)
Exp
lana
tory
Var
iabl
es:
Stat
e W
ages
, U.S
. Nat
iona
l W
ages
, M
exic
an W
ages
Gra
nger
Cau
salit
y T
est:
Stat
e-In
dust
ry W
ages
3.
648
4.34
4 2.
351
2.83
6 0.
83 1
(p-v
alue
on
K2
test
sta
tistic
) (0
.30)
(0
.23)
(0
.50)
(0
.42)
(0
.84)
Lon
g-R
un E
ffec
t: St
ate-
Indu
stry
Wag
es
-3.8
12
0.43
2 -1
.638
1.
162
1.04
7
(p-v
alue
on
sum
of c
oeff
icie
nts)
(0
.09)
(0
.83)
(0
.21)
(0
.48)
(0
.58)
Schw
arz
Cri
teri
on
-5.4
13
-5.3
65
-5.4
05
-5.4
2 -5
.377
Bre
usch
-God
frey
2.
06
1.79
3.
14
5.53
3.
54
(p-v
alue
) (0
.11)
(0
.15)
(0
.03)
(0
.00)
(0
.02)
A
djus
ted
R2
0.97
5 0.
974
0.97
5 0.
975
0.97
4
See
note
s to
Tab
les
3 an
d 5
for
deta
ils o
n th
e es
timat
ion.
36
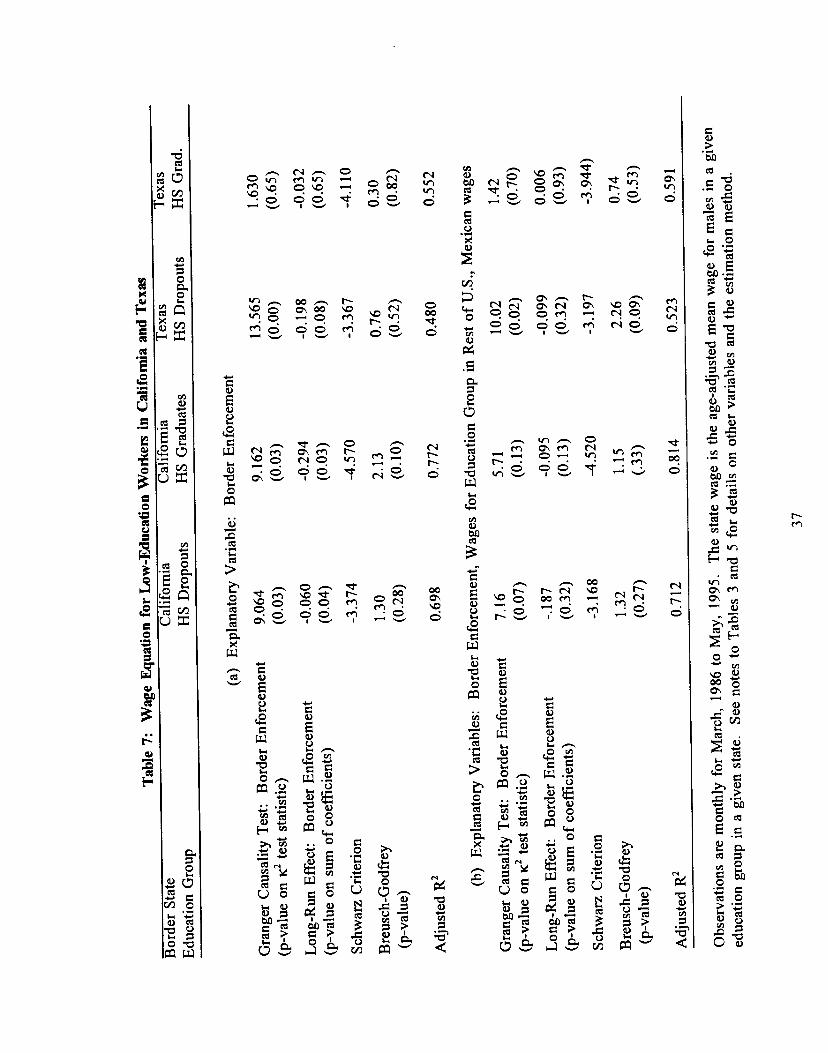
Tab
le 7
: W
age E
quat
ion
for L
ow-E
duca
tion
Wor
kers
in
Cal
ifor
nia
and
Tex
as
Cal
ifor
nia
Cal
ifor
nia
HS
Dro
pout
s H
S G
radu
ates
Gra
nger
Cau
salit
y T
est:
Bor
der
Enf
orce
men
t
(p-v
alue
on
1c2
test
sta
tistic
)
Lon
g-R
un E
ffec
t: B
orde
r Enf
orce
men
t
(p-v
alue
on
sum
of c
oeff
icie
nts)
Schw
arz
Cri
teri
on
Bre
usch
-God
frey
(p
-val
ue)
Adj
uste
d R
2 0.
698
(b)
Exp
lana
tory
Var
iabl
es:
Bor
der
Enf
orce
men
t, W
ages
for E
duca
tion
Gro
up in
Res
t of
U.S
., M
exic
an w
ages
Gra
nger
Cau
salit
y T
est:
Bor
der
Enf
orce
men
t 7.
16
5.71
(p-v
alue
on
1(2
test
sta
tistic
) (0
.07)
(0
.13)
Lon
g-R
un E
ffec
t: B
orde
r E
nfor
cem
ent
(p-v
alue
on
sum
of c
oeff
icie
nts)
Schw
arz
Cri
teri
on
-3.1
68
-4.5
20
-3.1
97
-3.9
44)
Bre
usch
-God
frey
1.
32
1.15
(p-v
alue
) (0
.27)
(.
3 3)
Adj
uste
d R
2
Bor
der
Stat
e E
duca
tion
Gro
up
(a)
Exp
lana
tory
Var
iabl
e: B
orde
r E
nfor
cem
ent
Tex
as
HS
Dro
pout
s
Tex
as
HS
Gra
d.
9.06
4 (0
.03)
9.16
2 (0
.03)
13.5
65
(0.0
0)
1.63
0 (0
.65)
-0.0
60
(0.0
4)
-0.2
94
(0.0
3)
-0.1
98
(0.0
8)
-0.0
32
(0.6
5)
-3.3
74
-4.5
70
-3.3
67
-4.1
10
1.30
(0
.28)
2.13
(0
.10)
0.76
(0
.52)
0.30
(0
.82)
0.77
2 0.
480
0.55
2
-.18
7 (0
.32)
-0.0
95
(0.1
3)
10.0
2
(0.0
2)
-0.0
99
(0.3
2)
1.42
(0
.70)
0.00
6 (0
.93)
0.71
2 0.
814
2.26
(0
.09)
0.74
(0.5
3)
0.52
3 0.
591
Obs
erva
tions
are
mon
thly
for
Mar
ch,
1986
to
May
, 19
95.
The
sta
te w
age
is t
he a
ge-a
djus
ted
mea
n w
age
for
mal
es i
n a
give
n
educ
atio
n gr
oup
in a
giv
en s
tate
. Se
e no
tes
to T
able
s 3
and
5 fo
r de
tails
on
othe
r va
riab
les
and
the
estim
atio
n m
etho
d.
37
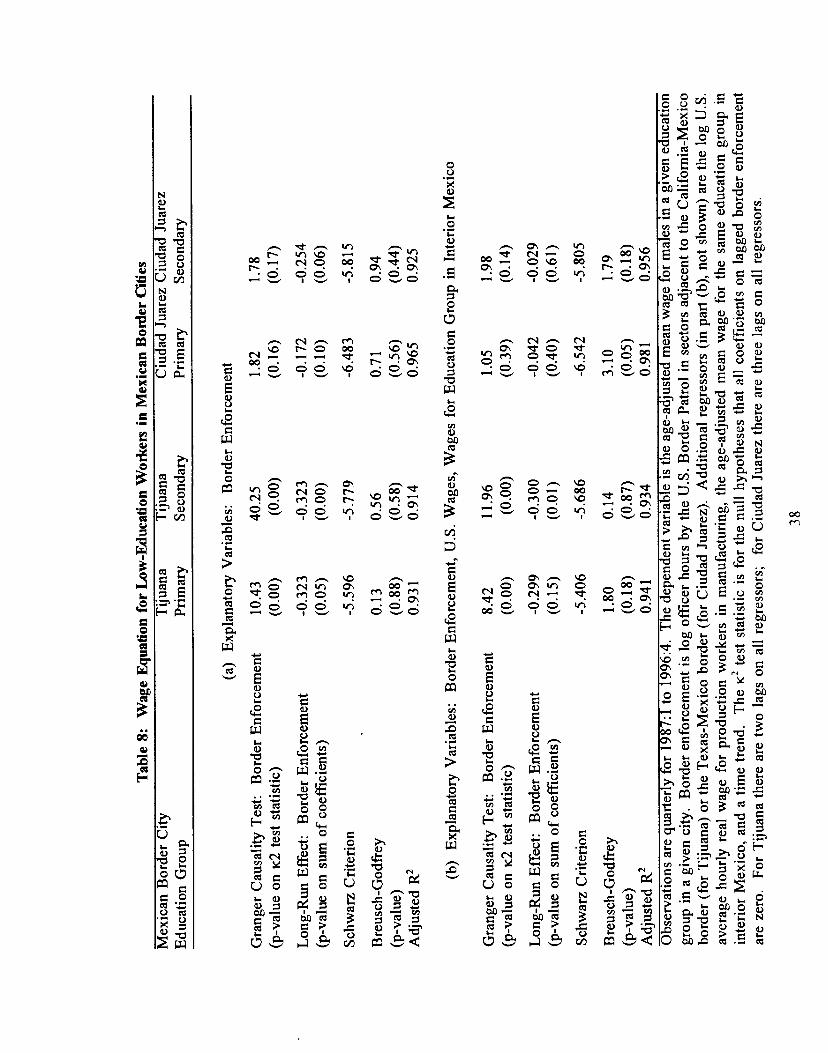
Tab
le 8
: W
age
Equ
atio
n fo
r Low
-Edu
catio
n W
oile
rs i
n M
exic
an B
onie
r Citi
es
Mex
ican
Bor
der
City
T
ijuan
a T
ijuan
a C
iuda
d Ju
arez
Ciu
dad
Juar
ez
Edu
catio
n G
roup
Pr
imat
y Se
cond
ary
Prim
ary
Seco
ndar
y
(a)
Exp
lana
tory
Var
iabl
es:
Bor
der
Enf
orce
men
t
Gra
nger
Cau
salit
y T
est:
Bor
der
Enf
orce
men
t 10
.43
40.2
5 1.
82
1.78
(p-v
alue
on
K2
test
sta
tistic
) (0
.00)
(0
.00)
(0
.16)
(0
.17)
Lon
g-R
un E
ffec
t: B
orde
r E
nfor
cem
ent
-0.3
23
-0.3
23
-0.1
72
-0.2
54
(p-v
alue
on
sum
of c
oeff
icie
nts)
(0
.05)
(0
.00)
(0
.10)
(0
.06)
Schw
arz
Cri
teri
on
-5.5
96
-5.7
79
-6.4
83
-5.8
15
Bre
usch
-God
frey
0.
13
0.56
0.
71
0.94
(p-v
alue
) (0
.88)
(0
.58)
(0
.56)
(0
.44)
A
djus
ted
R2
0.93
1 0.
914
0.96
5 0.
925
(b)
Exp
lana
tory
Var
iabl
es:
Bor
der
Enf
orce
men
t, U
.S.
Wag
es,
Wag
es f
or E
duca
tion
Gro
up in
Inte
rior
Mex
ico
Gra
nger
Cau
salit
y T
est:
Bor
der
Enf
orce
men
t 8.
42
11.9
6 1.
05
1.98
(p-v
alue
on
1(2
test
sta
tistic
) (0
.00)
(0
.00)
(0
.39)
(0
.14)
Lon
g-R
un E
ffec
t: B
orde
r Enf
orce
men
t -0
.299
-0
.300
-0
.042
-0
.029
(p-v
alue
on
sum
of c
oeff
icie
nts)
(0
.15)
(0
.01)
(0
.40)
(0
.61)
Schw
arz
Cri
teri
on
-5.4
06
-5.6
86
-6.5
42
-5.8
05
Bre
usch
-God
frey
1.
80
0.14
3.
10
1.79
(p-v
alue
) (0
.18)
(0
.87)
(0
.05)
(0
.18)
A
djus
ted
R2
0.94
1 0.
934
0.98
1 0.
956
Obs
erva
tions
are
qua
rter
ly fo
r 198
7:1
to 1
996:
4.
The
dep
ende
nt v
aria
ble
is th
e ag
e-ad
just
ed m
ean
wag
e fo
r mal
es in
a gi
ven
educ
atio
n
grou
p in
a g
iven
city
. B
orde
r enf
orce
men
t is
log
offi
cer
hour
s by
the
U.S
. Bor
der P
atro
l in
sec
tors
adj
acen
t to
the
Cal
ifor
nia-
Mex
ico
bord
er (
for
Tiju
ana)
or
the
Tex
as-M
exic
o bo
rder
(for
Ciu
dad
Juar
ez).
Add
ition
al r
egre
ssor
s (i
n pa
rt (
b), n
ot sh
own)
are
the
log
U.S
.
aver
age
hour
ly r
eal
wag
e fo
r pr
oduc
tion
wor
kers
in
man
ufac
turi
ng, t
he a
ge-a
djus
ted
mea
n w
age
for
the
sam
e ed
ucat
ion
grou
p in
in
teri
or M
exic
o, a
nd a
tim
e tr
end.
T
he K
2 te
st s
tatis
tic is
for
the
nul
l hyp
othe
ses
that
all
coef
fici
ents
on
lagg
ed b
orde
r en
forc
emen
t ar
e ze
ro.
For
Tiju
ana
ther
e ar
e tw
o la
gs o
n al
l re
gres
sors
; fo
r C
iuda
d Ju
arez
the
re a
re th
ree
lags
on
all
regr
esso
rs.
38
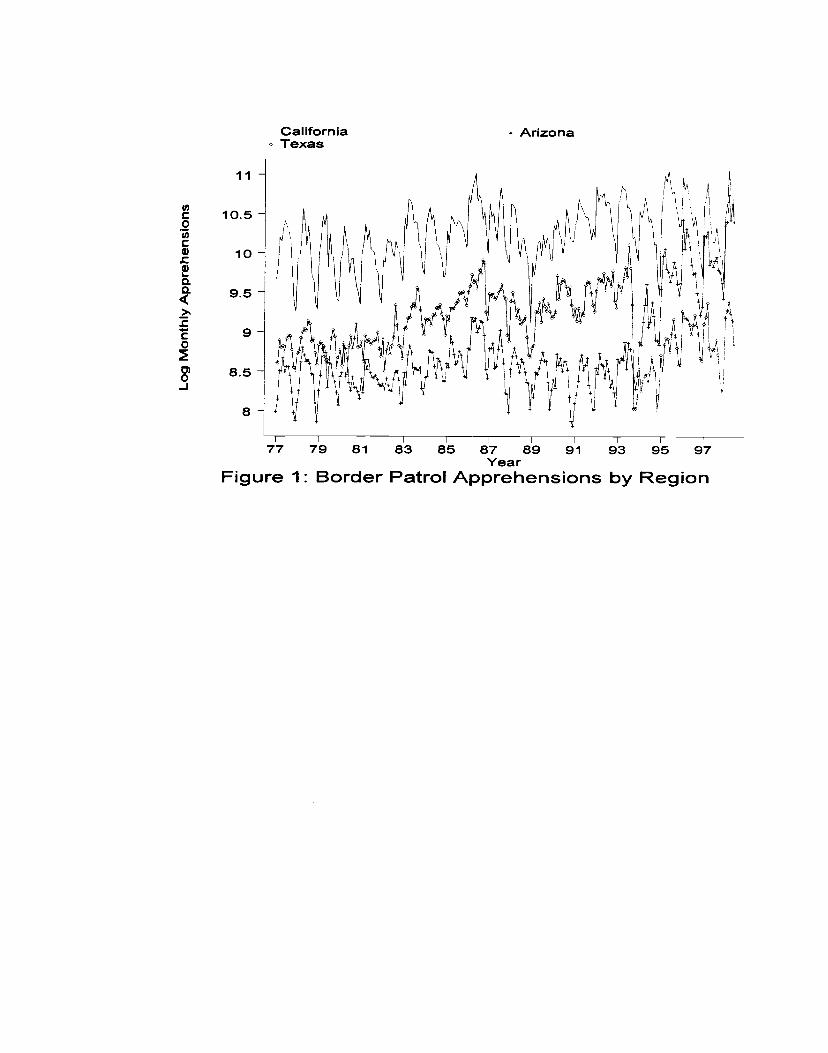
CaliforniaTexas
11 -
• Arizona
10.5 -
10
'I)
0CU,.C
aa>C4-.C0
C,0-J
9.5 -
9-
8.5 -
I I I I I I I77 79 81 83 85 87 89 91 93 95 97Year
Figure 1: Border Patrol Apprehensions by Region
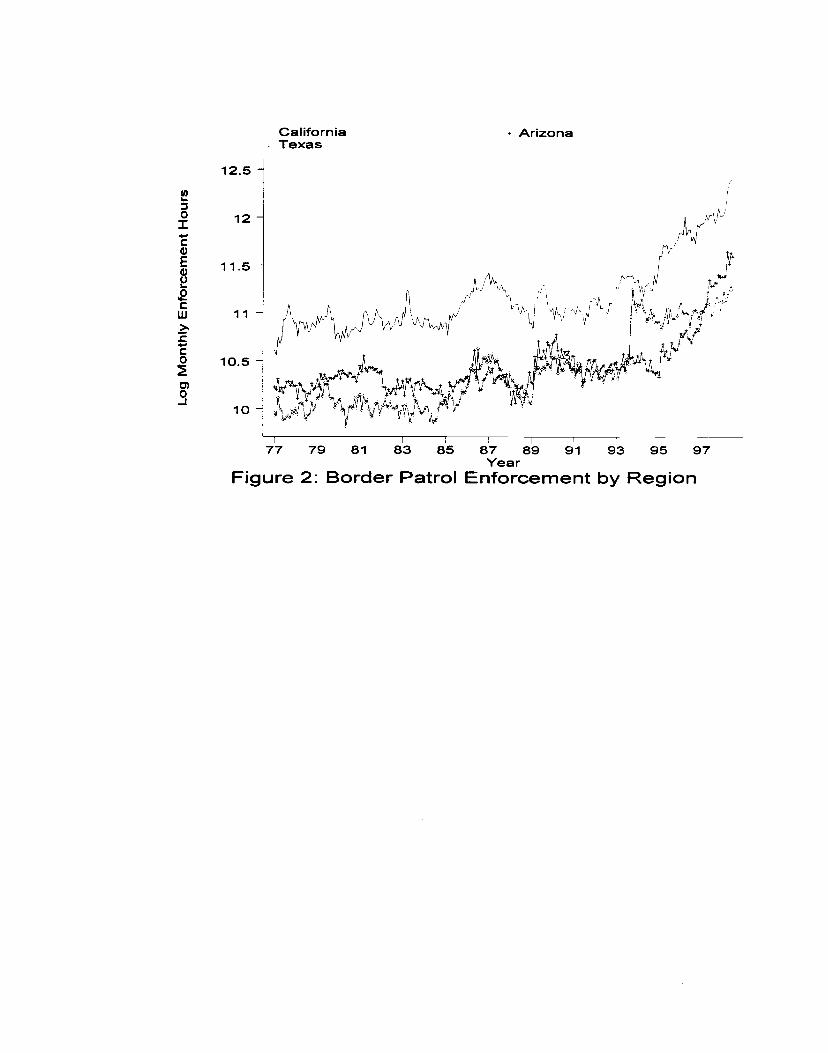
CaliforniaTexas
• Arizona
(I,I-
0ICa)E
Cw>
C0
0)0-J
12.5 -
12 -
11.5 -
11 —
10.5 -
10 -
I I J
77 79 81 83 85 87 89 91 93 95 97Year
Figure 2: Border Patrol Enforcement by Region
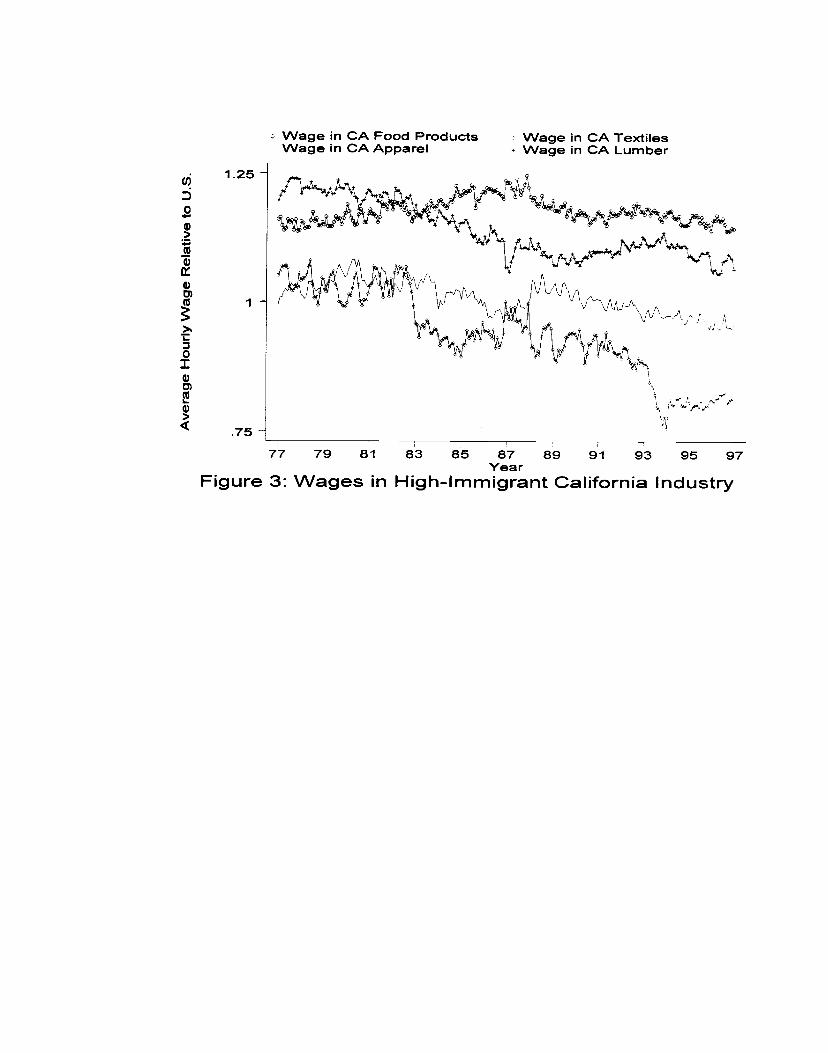
Wage in CA Textiles• Wage in CA Lumber
81 83 85 87 89 91 93 95 97Year
High-Immigrant California Industry
Wage in CA Food ProductsWage in CA Apparel
ci:
0a)>
a)
a:a)C)
0Ia)0)
a)
1.25 -
1-
.75
Figure 3: Wages in77 79
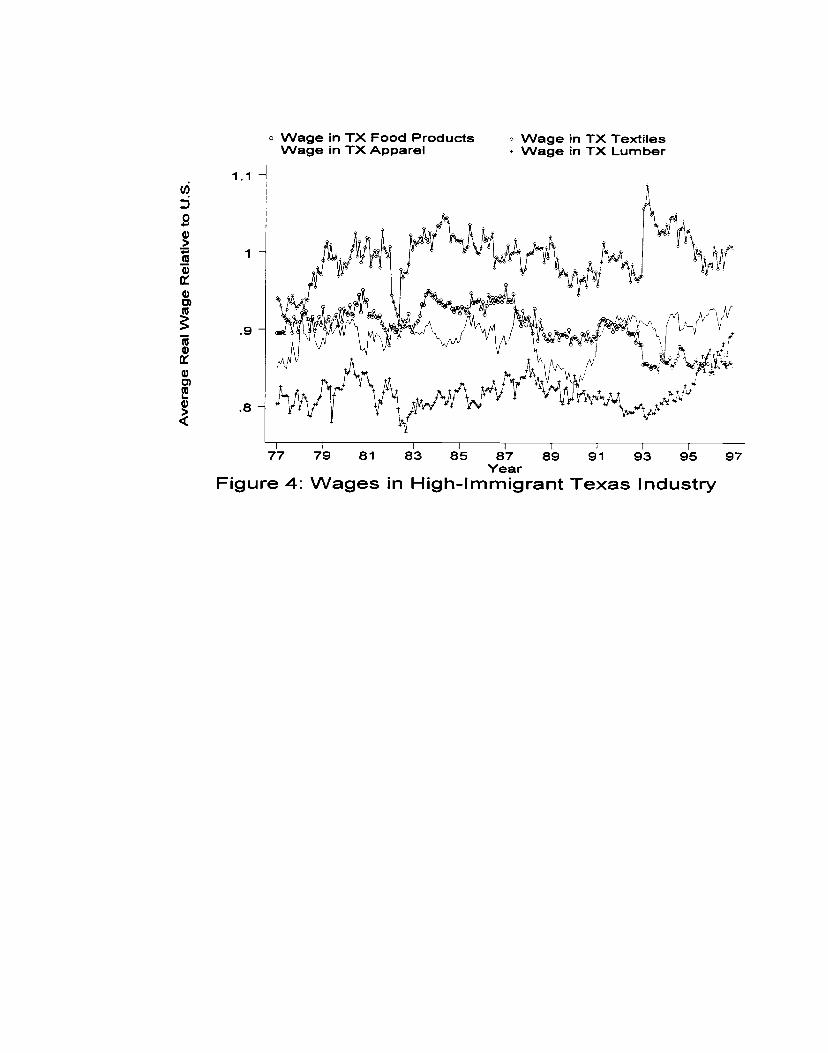
ci:
0
>-I
0::
IFigure 4: Wages
Wage in TX Textiles• Wage in TX Lumber
Yearin High-Immigrant Texas Industry
97
o Wage in TX Food ProductsWage in TX Apparel
1.1 —
1—
.9 -
.8 -
I I I I I I I
77 79 81 83 85 87 89 91 93 95
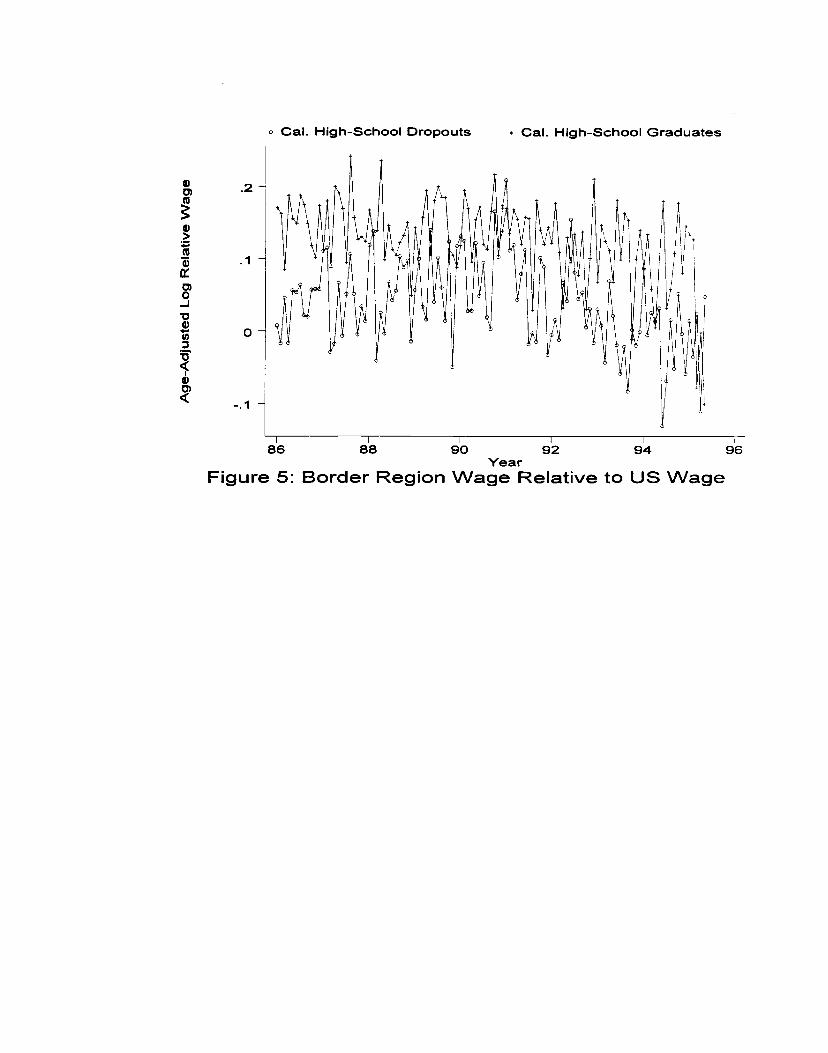
a)
I
.2
.1 -
0-
—.1 -
Cal. High-School Dropouts * Cal. High-School Graduates
I I I I
86 88 90 92 94Year
Figure 5: Border Region Wage Relative to US Wage96
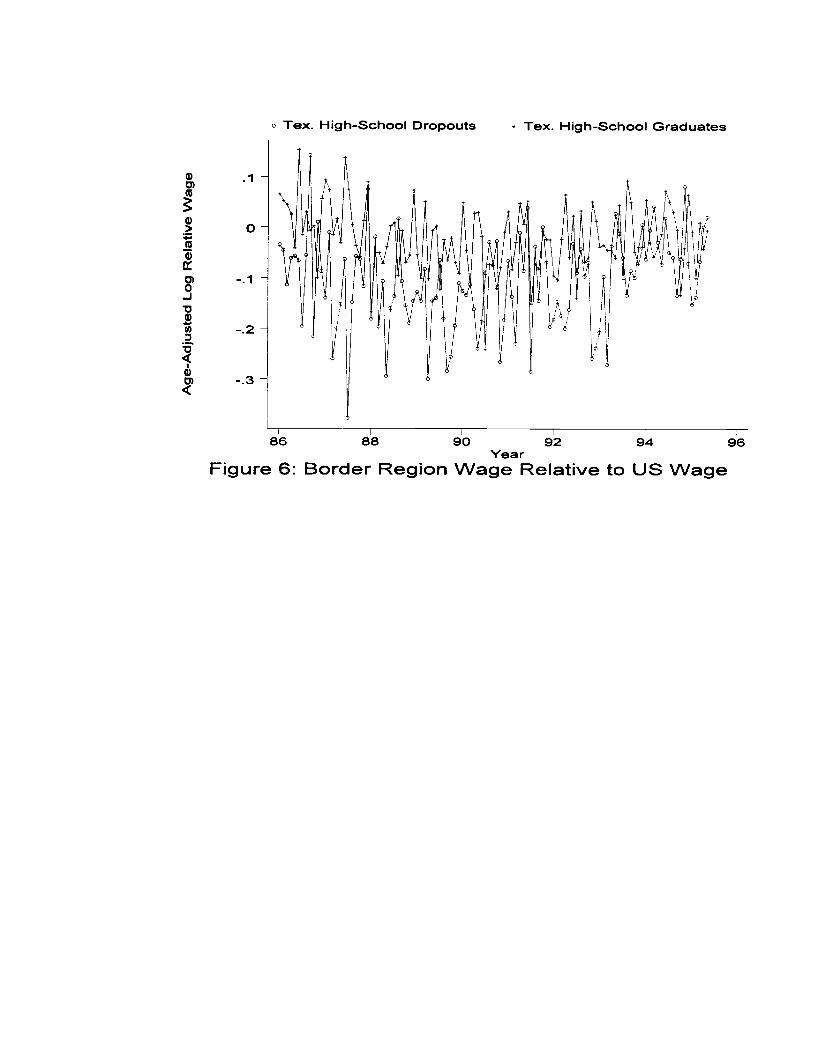
Tex. High-School Dropouts Tex. High-School Graduates
86 88 90 92 94Year
Figure 6: Border Region Wage Relative to US Wage96
.1
0-
—.1 -
-.3-
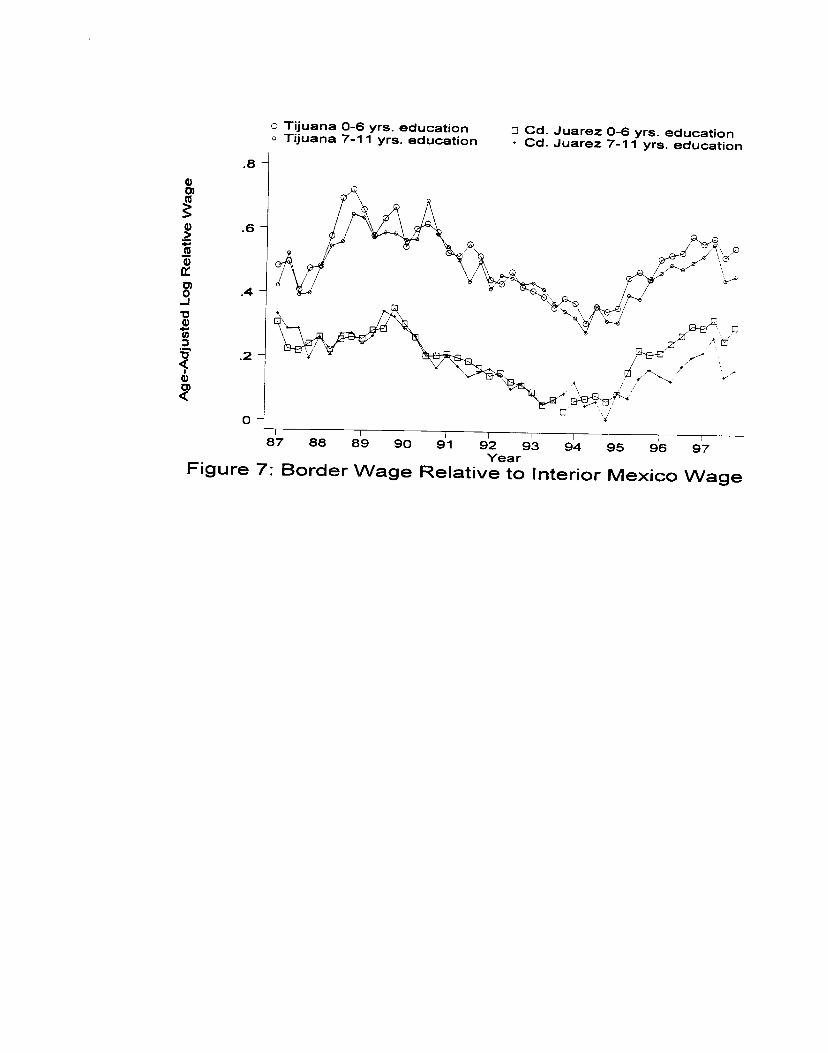
Q)
I
.8
.6
.4
.2
0
o Tijuana 0-6 yrs. educationo Tijuana 7-11 yrs. education o Cd. Juarez 0-6 yrs. education
• Cd. Juarez 7-11 yrs. education
Figure 7: Border Wage89 90 91 92
YearRelative to Interior Mexico
97
Wage
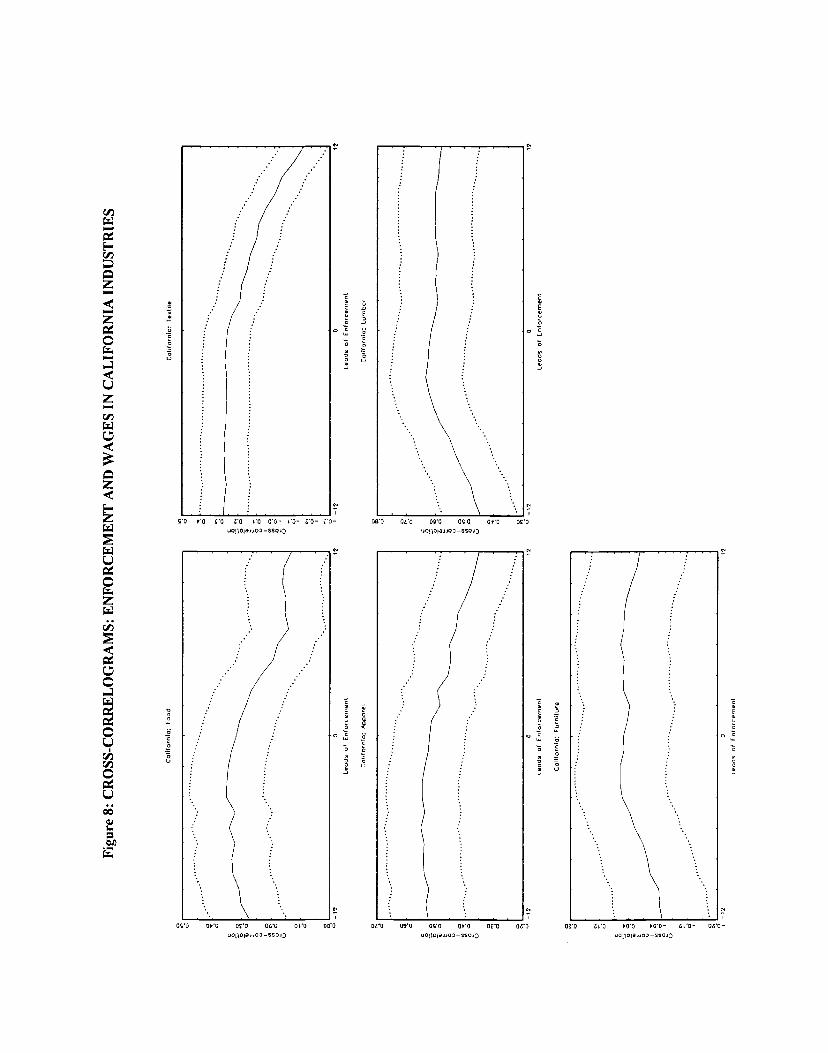
Figu
re 8:
CR
OSS
-CO
RR
EL
OG
RA
MS:
E
NFO
RC
EM
EN
T A
ND
WA
GE
S IN
CA
LIF
OR
NIA
IN
DU
STR
IES
Col
ifor
nior
Foo
d C
olrf
orni
o: T
etde
d 0
Leod
s of
Enf
orce
men
t Le
ads of
Enf
orce
men
t
Coi
dom
nia:
00
00re
l C
odfo
rnlo
: Lum
ber
0 0
1?
Lead
s of
Enf
orce
men
t Le
ads
of E
nfor
cem
ent
Cnl
ifom
nio:
F
urni
ture
—'2
0
2 Le
ads of
Enf
omce
nnt
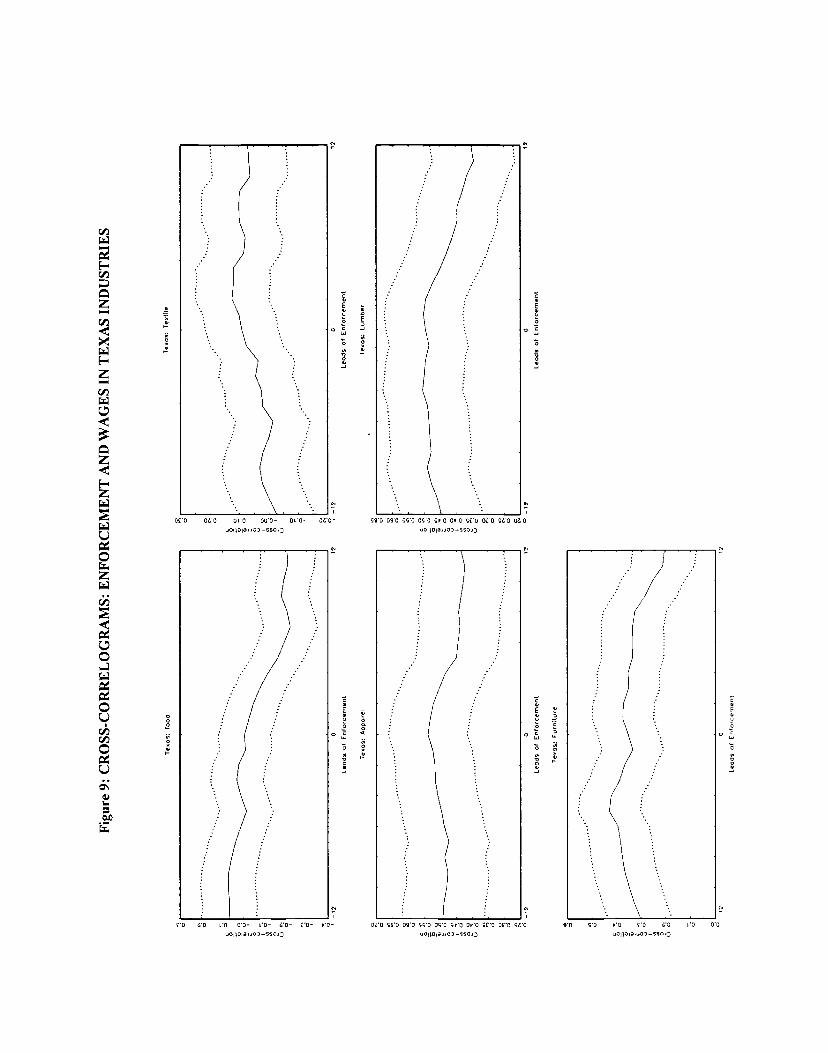
Figu
re 9:
CR
OSS
-CO
RR
EL
OG
RA
MS:
E
NFO
RC
EM
EN
T A
ND
WA
GE
S IN
TE
XA
S IN
DU
STR
IES
Tex
as:
food
P
esos
; T
extil
e
0 I?
0
Lead
s ot
Enf
orce
men
t Le
ods
of E
nfor
cem
ent
lead
s: A
ppar
el
Teu
os
Lum
ber
° -'2
0
I —
1?
P
Lend
s ot
Enf
orce
men
t Le
ads of
Enf
orce
men
t
may
Fur
nitu
re
—:2
o
:2
Lend
s 0t
Err
torc
emer
't
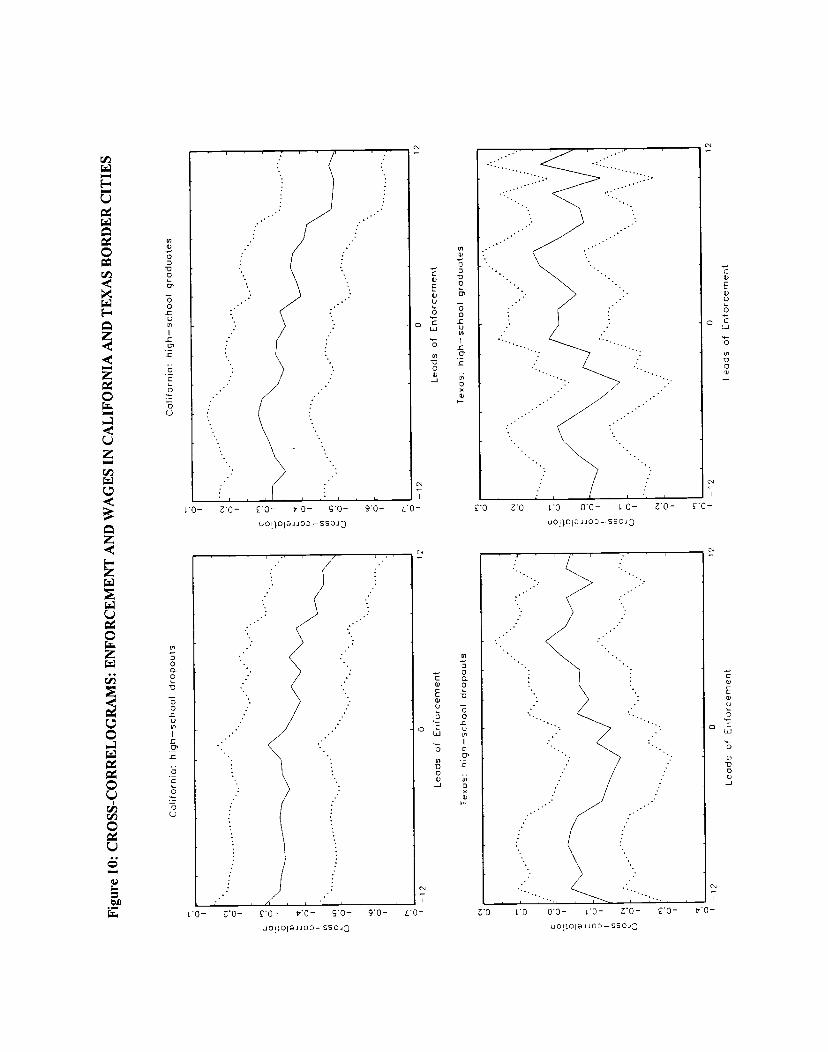
Figu
re 1
0: C
RO
SS-C
OR
RE
LO
GR
AM
S: E
NFO
RC
EM
EN
T A
ND
WA
GE
S IN
CA
LIF
OR
NIA
AN
D T
EX
AS
BO
RD
ER
CIT
IES
Cal
ifor
nia:
hig
h—sc
hool
dr
opou
ts
Cal
iforn
ia:
high
—sc
hool
gr
adua
tes
6 6
( .
.. (N
N
N
C
6 I
—12
0
12
I —
12
0 12
Leod
s of
Enf
orce
men
t Le
ads
of E
nfor
cem
ent
Tex
as:
high
—sc
hool
dr
opou
ts
Tex
as:
hugh
—sc
hool
gra
duat
es
Cl 0
6
•
(N
0 6
0 6
—12
0
12
—12
0
12
Lead
s of
Enf
orce
men
t Le
ads
of E
nfor
cem
ent
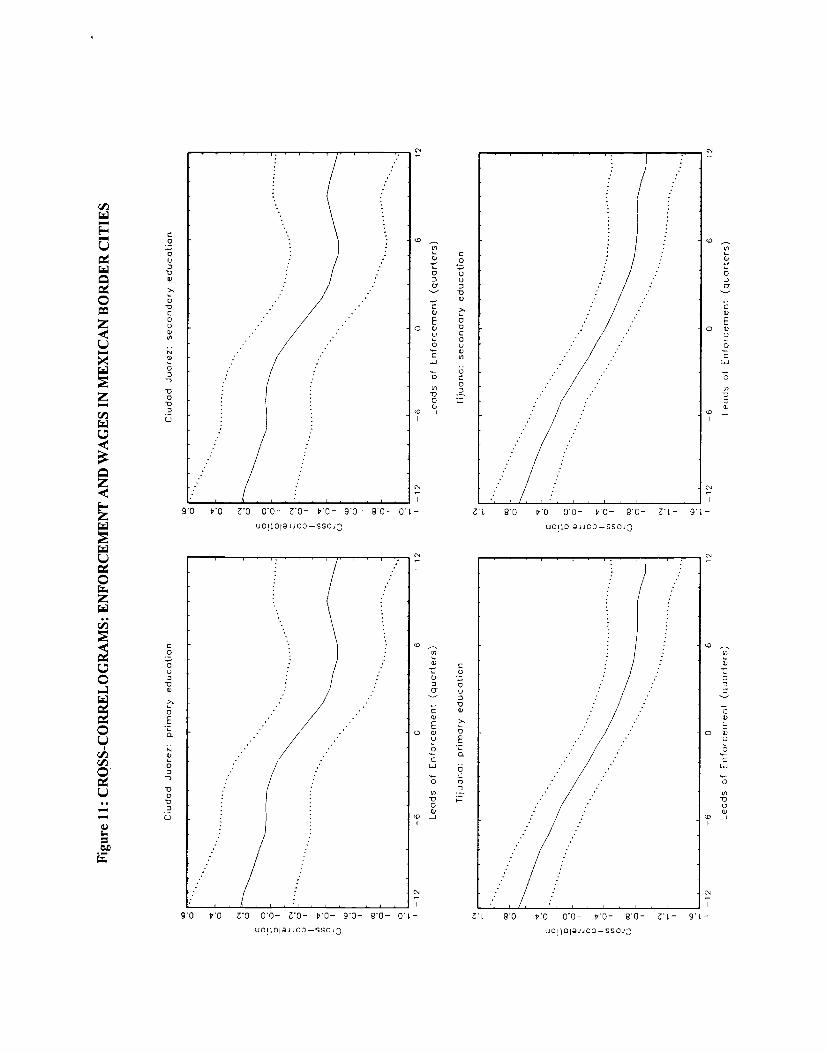
C
0 Oct
0 o't.
U) 0 (a
0
Figu
re 1
1: C
RQ
SS-C
OR
RE
LO
GR
AM
S: E
NFO
RC
EM
EN
T A
ND
WA
GE
S IN
ME
XIC
AN
BO
RD
ER
CIT
IES
C
(N 6
C Oct
0
o U) 06
o
I
U) 0
(0 6 a:
, 0
Ciu
dc,d
Juo
rez:
prim
ary
educ
atio
n C
iuda
d Ju
orez
: se
cond
ary
educ
atio
n )0
6
C 0 0 a, 0 0 U
) 0 0
—12
0 12
—
12
—6
0 6
—6
0 6
Lead
s of
E
nfor
cem
ent
(qua
rter
s)
Lead
s of
E
nfor
cem
ent
(qua
rter
s)
Tiju
ono:
pr
imar
y ed
ucat
ion
Tiju
ono:
se
cond
ary
educ
atio
n
12
C 0 0 0 u U) 0 0
(0
—12
—
6 0
6 12
—
12
Lead
s of
E
nfor
cem
ent
(quo
rter
s)
Lead
s of
Enf
orce
men
t (q
uart
ers)
—6
0 6
12
Related Documents