ORIGINAL RESEARCH ARTICLE published: 26 October 2012 doi: 10.3389/fpsyg.2012.00434 Does attentional selectivity in the flanker task improve discretely or gradually? Ronald Hübner* and Lisa Töbel Fachbereich Psychologie, Universität Konstanz, Konstanz, Germany Edited by: Narayanan Srinivasan, University of Allahabad, India Reviewed by: Angela J.Yu, University of California, USA Eddy J. Davelaar, Birkbeck College, UK *Correspondence: Ronald Hübner, Fachbereich Psychologie, Universität Konstanz, Fach D29, D-78457 Konstanz, Germany. e-mail: ronald.huebner@ uni-konstanz.de An important question is whether attentional selectivity improves discretely or continu- ously during stimulus processing. In a recent study, Hübner et al. (2010) found that the discrete Dual-StageTwo-Phase (DSTP) model accounted better for flanker-task data than various continuous-improvement models. However, in a subsequent study, White et al. (2011) introduced the continuous shrinking-spotlight (SSP) model and showed that it was superior to the DSTP model. From this result they concluded that attentional selectivity improves continuously rather than discretely. Because different stimuli and procedures were used in these two studies, though, we questioned that the superiority of the SSP model holds generally.Therefore, we fit the SSP model to Hübner et al.’s data and found that the DSTP model was again superior. A series of four experiments revealed that model superiority depends on the response-stimulus interval.Together, our results demonstrate that methodological details can be crucial for model selection, and that further comparisons between the models are needed before it can be decided whether attentional selectivity improves continuously or discretely. Keywords: selective attention, continuous versus discrete, flanker task, modeling, diffusion models INTRODUCTION Selective spatial attention is an important control mechanism for goal-directed behavior. Accordingly, it has intensively been investi- gated during the last decades. One idea of how specific information is selected from the visual field is to assume some kind of spa- tial attentional filtering. For instance, based on results obtained with the spatial-cueing paradigm, some researchers proposed that such filtering proceeds like an attentional spotlight, i.e., that visual attention can be allocated to a certain location and that items at that location are processed more intensively than items at other locations (Posner, 1980; Posner et al., 1980). Further important properties of spatial attention have also been revealed by the flanker task (Eriksen and Eriksen, 1974), in which participants have to categorize a target stimulus as fast and as accurately as possible, while ignoring irrelevant flanker stimuli. The flankers are usually congruent, i.e., associated with the same response as the target, or incongruent, i.e., associated with the opposite response. The degree to which the flankers can be ignored or filtered out is assessed by the difference between the performance for congruent and incongruent stimuli, which is called the flanker congruency effect. Usually, responses to congruent stimuli are faster and more reliable than responses to incongruent flankers and the size of dif- ferences in RT and error rate (ER) are considered as measures of the efficiency of selective attention. Results obtained with the flanker task have led to the attentional zoom-lens metaphor, which gener- alizes the spotlight idea by not only assuming a variable position of the attentional filter, but also a variable size and form (Eriksen and Schultz, 1979; Eriksen and St James, 1986). The regularly observed flanker congruency effect clearly indi- cates that selectivity is limited. Moreover, Gratton et al. (1988) analyzed distributional data and found that this limit changes in time. Usually, accuracy on incongruent trials is much higher for slow than for fast responses, indicating that attentional selectivity improves during the course of processing. In view of such results it has been hypothesized that stimulus processing is unselective in a first phase of processing, but then, after some time, enters a second phase with relatively high selectivity (e.g., Gratton et al., 1992). In more recent models, it has also been assumed that the increase in selectivity is controlled by some conflict monitoring mechanism. Accordingly, attentional selectivity is increased only after a response conflict is detected, which also leads to an unse- lective and a selective phase, at least for incongruent stimuli (e.g., Davelaar, 2008; Yu et al., 2009). Yet, as the zoom-lens metaphor already suggests, a discrete and stage-like improvement of selec- tivity is not the only way to account for the dynamics of selective attention. It is also possible that selectivity increases continuously with processing time by a gradually narrowing attentional focus on the target item (e.g., Heitz and Engle, 2007). Because the con- tinuous account seems plausible and is relatively easy to formalize, it has been implemented in the frameworks of neural-networks (e.g., Cohen et al., 1992; Liu et al., 2008), of Bayesian observers (e.g., Yu et al., 2009), and of diffusion processes (e.g., Liu et al., 2009). Recently, however, the idea of a discrete and stage-like improve- ment of selectivity has also been formalized by Hübner et al. (2010). Their Dual-Stage Two-Phase (DSTP) model relies on the assumption of two discrete stages of stimulus selection, an early stage of low selectivity and a late stage of high selectivity. The infor- mation provided by these two stages drives response selection in a first and second phase, respectively. Both phases are modeled by a diffusion process (cf. Ratcliff, 1978). Such processes are basically characterized by a drift rate reflecting the evidence available for www.frontiersin.org October 2012 |Volume 3 | Article 434 | 1

Welcome message from author
This document is posted to help you gain knowledge. Please leave a comment to let me know what you think about it! Share it to your friends and learn new things together.
Transcript
ORIGINAL RESEARCH ARTICLEpublished: 26 October 2012
doi: 10.3389/fpsyg.2012.00434
Does attentional selectivity in the flanker task improvediscretely or gradually?Ronald Hübner* and LisaTöbel
Fachbereich Psychologie, Universität Konstanz, Konstanz, Germany
Edited by:Narayanan Srinivasan, University ofAllahabad, India
Reviewed by:Angela J. Yu, University of California,USAEddy J. Davelaar, Birkbeck College,UK
*Correspondence:Ronald Hübner , FachbereichPsychologie, Universität Konstanz,Fach D29, D-78457 Konstanz,Germany.e-mail: [email protected]
An important question is whether attentional selectivity improves discretely or continu-ously during stimulus processing. In a recent study, Hübner et al. (2010) found that thediscrete Dual-Stage Two-Phase (DSTP) model accounted better for flanker-task data thanvarious continuous-improvement models. However, in a subsequent study, White et al.(2011) introduced the continuous shrinking-spotlight (SSP) model and showed that it wassuperior to the DSTP model. From this result they concluded that attentional selectivityimproves continuously rather than discretely. Because different stimuli and procedureswere used in these two studies, though, we questioned that the superiority of the SSPmodel holds generally. Therefore, we fit the SSP model to Hübner et al.’s data and foundthat the DSTP model was again superior. A series of four experiments revealed that modelsuperiority depends on the response-stimulus interval. Together, our results demonstratethat methodological details can be crucial for model selection, and that further comparisonsbetween the models are needed before it can be decided whether attentional selectivityimproves continuously or discretely.
Keywords: selective attention, continuous versus discrete, flanker task, modeling, diffusion models
INTRODUCTIONSelective spatial attention is an important control mechanism forgoal-directed behavior. Accordingly, it has intensively been investi-gated during the last decades. One idea of how specific informationis selected from the visual field is to assume some kind of spa-tial attentional filtering. For instance, based on results obtainedwith the spatial-cueing paradigm, some researchers proposed thatsuch filtering proceeds like an attentional spotlight, i.e., that visualattention can be allocated to a certain location and that items atthat location are processed more intensively than items at otherlocations (Posner, 1980; Posner et al., 1980). Further importantproperties of spatial attention have also been revealed by theflanker task (Eriksen and Eriksen, 1974), in which participantshave to categorize a target stimulus as fast and as accurately aspossible, while ignoring irrelevant flanker stimuli. The flankers areusually congruent, i.e., associated with the same response as thetarget, or incongruent, i.e., associated with the opposite response.The degree to which the flankers can be ignored or filtered out isassessed by the difference between the performance for congruentand incongruent stimuli, which is called the flanker congruencyeffect. Usually, responses to congruent stimuli are faster and morereliable than responses to incongruent flankers and the size of dif-ferences in RT and error rate (ER) are considered as measures of theefficiency of selective attention. Results obtained with the flankertask have led to the attentional zoom-lens metaphor, which gener-alizes the spotlight idea by not only assuming a variable positionof the attentional filter, but also a variable size and form (Eriksenand Schultz, 1979; Eriksen and St James, 1986).
The regularly observed flanker congruency effect clearly indi-cates that selectivity is limited. Moreover, Gratton et al. (1988)analyzed distributional data and found that this limit changes in
time. Usually, accuracy on incongruent trials is much higher forslow than for fast responses, indicating that attentional selectivityimproves during the course of processing. In view of such resultsit has been hypothesized that stimulus processing is unselectivein a first phase of processing, but then, after some time, enters asecond phase with relatively high selectivity (e.g., Gratton et al.,1992). In more recent models, it has also been assumed that theincrease in selectivity is controlled by some conflict monitoringmechanism. Accordingly, attentional selectivity is increased onlyafter a response conflict is detected, which also leads to an unse-lective and a selective phase, at least for incongruent stimuli (e.g.,Davelaar, 2008; Yu et al., 2009). Yet, as the zoom-lens metaphoralready suggests, a discrete and stage-like improvement of selec-tivity is not the only way to account for the dynamics of selectiveattention. It is also possible that selectivity increases continuouslywith processing time by a gradually narrowing attentional focuson the target item (e.g., Heitz and Engle, 2007). Because the con-tinuous account seems plausible and is relatively easy to formalize,it has been implemented in the frameworks of neural-networks(e.g., Cohen et al., 1992; Liu et al., 2008), of Bayesian observers(e.g., Yu et al., 2009), and of diffusion processes (e.g., Liu et al.,2009).
Recently, however, the idea of a discrete and stage-like improve-ment of selectivity has also been formalized by Hübner et al.(2010). Their Dual-Stage Two-Phase (DSTP) model relies on theassumption of two discrete stages of stimulus selection, an earlystage of low selectivity and a late stage of high selectivity. The infor-mation provided by these two stages drives response selection in afirst and second phase, respectively. Both phases are modeled by adiffusion process (cf. Ratcliff, 1978). Such processes are basicallycharacterized by a drift rate reflecting the evidence available for
www.frontiersin.org October 2012 | Volume 3 | Article 434 | 1
Hübner and Töbel Attentional selectivity in the flanker task
A
-B
Time
0
0
Selection of
Response A
Phase 1 Phase 2
C
-D
Selection of Stimulus C
Response
selection
process
Stimulus
selection
process
µRS2
µRS1= µta ± µfl
µSS
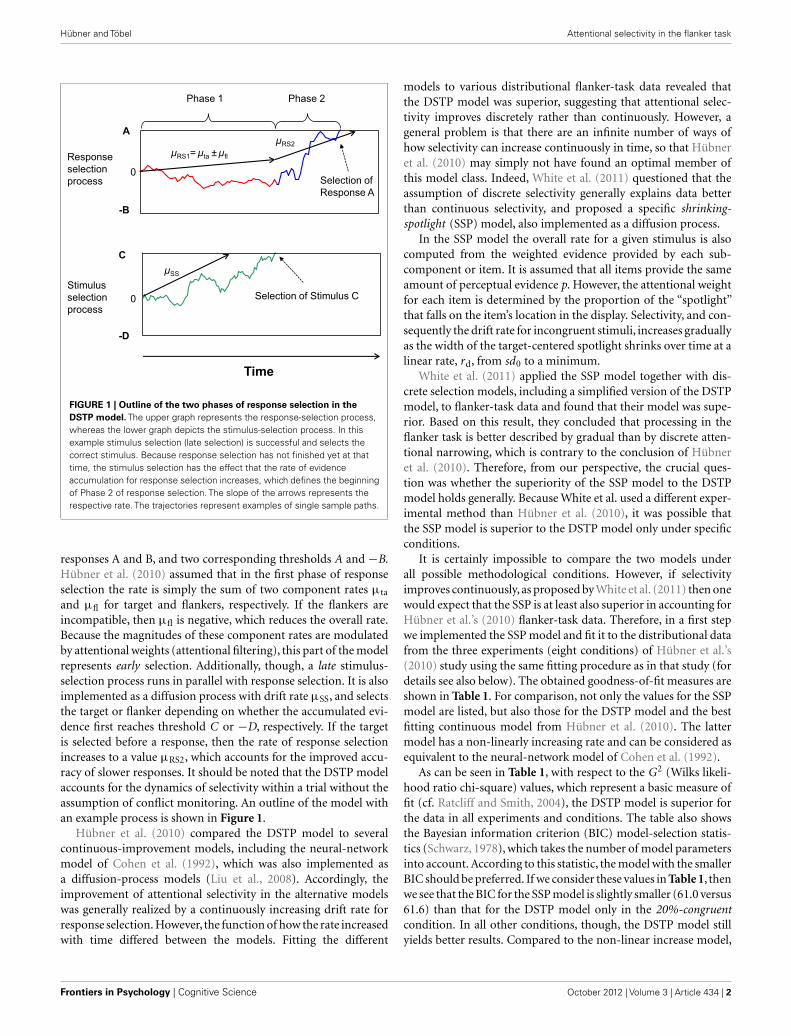
FIGURE 1 | Outline of the two phases of response selection in theDSTP model. The upper graph represents the response-selection process,whereas the lower graph depicts the stimulus-selection process. In thisexample stimulus selection (late selection) is successful and selects thecorrect stimulus. Because response selection has not finished yet at thattime, the stimulus selection has the effect that the rate of evidenceaccumulation for response selection increases, which defines the beginningof Phase 2 of response selection. The slope of the arrows represents therespective rate. The trajectories represent examples of single sample paths.
responses A and B, and two corresponding thresholds A and −B.Hübner et al. (2010) assumed that in the first phase of responseselection the rate is simply the sum of two component rates µta
and µfl for target and flankers, respectively. If the flankers areincompatible, then µfl is negative, which reduces the overall rate.Because the magnitudes of these component rates are modulatedby attentional weights (attentional filtering), this part of the modelrepresents early selection. Additionally, though, a late stimulus-selection process runs in parallel with response selection. It is alsoimplemented as a diffusion process with drift rate µSS, and selectsthe target or flanker depending on whether the accumulated evi-dence first reaches threshold C or −D, respectively. If the targetis selected before a response, then the rate of response selectionincreases to a value µRS2, which accounts for the improved accu-racy of slower responses. It should be noted that the DSTP modelaccounts for the dynamics of selectivity within a trial without theassumption of conflict monitoring. An outline of the model withan example process is shown in Figure 1.
Hübner et al. (2010) compared the DSTP model to severalcontinuous-improvement models, including the neural-networkmodel of Cohen et al. (1992), which was also implemented asa diffusion-process models (Liu et al., 2008). Accordingly, theimprovement of attentional selectivity in the alternative modelswas generally realized by a continuously increasing drift rate forresponse selection. However, the function of how the rate increasedwith time differed between the models. Fitting the different
models to various distributional flanker-task data revealed thatthe DSTP model was superior, suggesting that attentional selec-tivity improves discretely rather than continuously. However, ageneral problem is that there are an infinite number of ways ofhow selectivity can increase continuously in time, so that Hübneret al. (2010) may simply not have found an optimal member ofthis model class. Indeed, White et al. (2011) questioned that theassumption of discrete selectivity generally explains data betterthan continuous selectivity, and proposed a specific shrinking-spotlight (SSP) model, also implemented as a diffusion process.
In the SSP model the overall rate for a given stimulus is alsocomputed from the weighted evidence provided by each sub-component or item. It is assumed that all items provide the sameamount of perceptual evidence p. However, the attentional weightfor each item is determined by the proportion of the “spotlight”that falls on the item’s location in the display. Selectivity, and con-sequently the drift rate for incongruent stimuli, increases graduallyas the width of the target-centered spotlight shrinks over time at alinear rate, rd, from sd0 to a minimum.
White et al. (2011) applied the SSP model together with dis-crete selection models, including a simplified version of the DSTPmodel, to flanker-task data and found that their model was supe-rior. Based on this result, they concluded that processing in theflanker task is better described by gradual than by discrete atten-tional narrowing, which is contrary to the conclusion of Hübneret al. (2010). Therefore, from our perspective, the crucial ques-tion was whether the superiority of the SSP model to the DSTPmodel holds generally. Because White et al. used a different exper-imental method than Hübner et al. (2010), it was possible thatthe SSP model is superior to the DSTP model only under specificconditions.
It is certainly impossible to compare the two models underall possible methodological conditions. However, if selectivityimproves continuously, as proposed by White et al. (2011) then onewould expect that the SSP is at least also superior in accounting forHübner et al.’s (2010) flanker-task data. Therefore, in a first stepwe implemented the SSP model and fit it to the distributional datafrom the three experiments (eight conditions) of Hübner et al.’s(2010) study using the same fitting procedure as in that study (fordetails see also below). The obtained goodness-of-fit measures areshown in Table 1. For comparison, not only the values for the SSPmodel are listed, but also those for the DSTP model and the bestfitting continuous model from Hübner et al. (2010). The lattermodel has a non-linearly increasing rate and can be considered asequivalent to the neural-network model of Cohen et al. (1992).
As can be seen in Table 1, with respect to the G2 (Wilks likeli-hood ratio chi-square) values, which represent a basic measure offit (cf. Ratcliff and Smith, 2004), the DSTP model is superior forthe data in all experiments and conditions. The table also showsthe Bayesian information criterion (BIC) model-selection statis-tics (Schwarz, 1978), which takes the number of model parametersinto account. According to this statistic, the model with the smallerBIC should be preferred. If we consider these values in Table 1, thenwe see that the BIC for the SSP model is slightly smaller (61.0 versus61.6) than that for the DSTP model only in the 20%-congruentcondition. In all other conditions, though, the DSTP model stillyields better results. Compared to the non-linear increase model,
Frontiers in Psychology | Cognitive Science October 2012 | Volume 3 | Article 434 | 2
Hübner and Töbel Attentional selectivity in the flanker task
Table 1 | Fit statistics of different models for the three experiments
and corresponding conditions in Hübner et al. (2010).
Experiment/condition Model G2 df BIC
Experiment 1: DSTP 12.4 15 59.9
Wide Non-linear increase 26.6 13 81.2
SSP 48.5 17 82.4
Experiment 1: DSTP 15.7 15 63.2
Narrow Non-linear increase 42.3 13 103
SSP 56.2 17 90.1
Experiment 2: DSTP 7.86 15 50.3
1-position-central Non-linear increase 18.8 13 73.3
SSP 24.7 17 55.0
Experiment 2: DSTP 10.0 15 52.5
2-positions-lateral Non-linear increase 25.5 13 80.0
SSP 26.6 17 56.9
Experiment 2: DSTP 8.18 15 47.7
3-positions-central Non-linear increase 19.2 13 70.0
SSP 15.4 17 43.7
Experiment 2: DSTP 17.7 15 62.2
3-positions-lateral Non-linear increase 40.7 13 97.9
SSP 34.0 17 65.9
Experiment 3: DSTP 12.6 15 61.6
20%-congruent Non-linear increase 25.7 13 89.7
SSP 26.0 17 61.0
Experiment 3: DSTP 25.3 15 74.3
80%-congruent Non-linear increase 51.1 13 114
SSP 60.6 17 95.6
In Experiment 1 the spacing (wide, narrow) between target and flanker was
varied, in Experiment 2 the stimulus position and spatial uncertainty, and in Exper-
iment 3 the proportion of congruent versus incongruent stimuli. The values for
the DSTP model and the non-linear increase model are reproduced from Hüb-
ner et al. (2010), whereas the values for the SSP model are obtained by new
fits. G2, Wilks likelihood ratio chi-square; df, degrees of freedom; BIC, Bayesian
information criterion.
the BIC for the SSP model was always superior except for thewide condition. Thus, the SSP model is a parsimonious modelthat, in terms of BIC, is more successful than the best continuous-improvement model considered in Hübner et al. (2010). However,it is still less successful compared to the DSTP model.
These comparisons show that the SSP model is not generallysuperior to the DSTP model. Accordingly, the conclusion thatattentional selectivity improves continuously is no longer justi-fied. Rather, with respect to the different models, it is obvious thattheir superiority depends on methodological details. The methodapplied in Hübner et al. (2010) seems to be favorable for the DSTPmodel, whereas that in White et al. (2011) is advantageous for theSSP model.
Thus, a further aim of the present study was to investigatewhich details of the applied methods are crucial for model supe-riority. Of the differences between the studies those with respectto stimuli and tasks were most striking. Although both studies
used a flanker task, Hübner et al. required parity judgments onnumerals, whereas White et al.’s (2011) participants had to indi-cate the pointing direction of arrows. Therefore, after verifying inour first experiment that White et al.’s (2011) result was replic-able in our lab, we combined in Experiment 2 the arrow stimuliand the corresponding task with the procedure in Hübner et al.(2010). As a result, the DSTP model was now better than the SSPmodel, which indicated that some other variable must be crucialfor model superiority. The experiments still differed in stimu-lus duration, response-stimulus interval (RSI), error feedback,and responding. Because there were striking differences in thevariance of the latencies between the experiments, we speculatedthat stimulus duration might be an important factor. However,its variation in Experiment 3 had no effect on model superior-ity. Therefore, we next examined the effect of the RSI, becausethis factor is known to affect automatic as well as controlledprocess (e.g., Soetens et al., 1985). Indeed, the result of Experiment4, combined with that of Experiment 3, shows that a relativelylong RSI leads to data that are fit better by the DSTP than bythe SSP model, whereas the opposite holds for a relatively shortRSI.
EXPERIMENT 1In our first experiment we tried to replicate White et al.’s (2011)results. To this end, we collected data by applying the same stim-uli and procedure as in that study. Specifically, we used verticallyarranged arrows as stimuli and a “left” or “right” decision as task,and also adopted the other procedural details from White et al.(2011). If the task and procedure matter for model superiority,then the SSP model should again fit the data better than the DSTPmodel.
METHODParticipantsEighteen participants (mean age 24.4 years, five male) with nor-mal or corrected-to-normal vision, participated in the study. Theywere recruited at the Universität Konstanz and were paid 8 C/h.
Apparatus and stimuliStimuli were presented on a 19′′-monitor with a resolution of1280× 1024 pixels, and a personal computer (PC) served for con-trolling stimulus presentation and response registration. The itemset was the same as in White et al. (2011) and consisted of left orright pointing arrows (<,>). Participants were seated at a distanceof about 45 cm from the screen, so that the width and height ofthe arrows subtended a visual angle of approximately 0.7˚. Stimuliwere presented in white on a black background. The target arrowalways appeared at the center of the screen. Flanker arrows (twoabove, and two below the target) were arranged vertically as inWhite et al. (2011). The separation between the items was always0.4˚. For congruent stimuli, the flanker arrows pointed in the samedirection as the target arrow, whereas for incongruent stimuli theflankers pointed in the opposite direction.
ProcedureStimuli were presented at the center of the screen and remainedon the display until response. The task was to decide whether the
www.frontiersin.org October 2012 | Volume 3 | Article 434 | 3
Hübner and Töbel Attentional selectivity in the flanker task
target arrow pointed to the left or to the right, and to indicatethe decision by pressing corresponding keys “y” and “–” on thekeyboard (German layout) with their index finger of their left andright hand, respectively. Stimuli were congruent on half of thetrials and incongruent on the other half. One second after theresponse, the next trial began. No error feedback was given. Afteran RSI of 350 ms the next stimulus appeared.
Participants first performed a 48-trials practice block, and thenworked through 16 test blocks of 64 trials each in a 45 min session.Outliers were controlled by eliminating the fastest and slowestresponses. Cut-offs were chosen in such a way that less than 1%of the data were excluded (cf. Ulrich and Miller, 1994). For thepresent experiment this means that responses faster than 250 msor slower than 1500 ms were excluded from analysis (<0.9% ofthe data).
Model fittingTo examine model performance, responses-time distributions forcorrect and incorrect responses in each condition (congruent,incongruent) were constructed by quantile-averaging (0.1, 0.3, 0.5,0.7, and 9) the data. By this procedure, the data of each conditionwere sorted into six bins comprising 10, 20, 20, 20, 20, and 10%of the data, respectively. One exception were the error responsesfor congruent stimuli. Because they occurred rarely, only the 0.5quantile was used for representing the corresponding RTs, as inWhite et al. (2011), which produced only two bins (50, 50%).Computer-simulation versions of the DSTP and the SSP modelwere then fit to these distributions with the same fit procedure asin Hübner et al. (2010). Specifically, the PRAXIS algorithm (Brent,1973; Gegenfurtner, 1992) was applied to find parameter valuesfor a given model that minimized the G2 statistics (cf. Ratcliff andSmith, 2004):
G2= 2
J∑i=1
N pi1n
(pi
πi
),
In this equation J is the number of bins, pi is the proportion ofobservations in the ith bin, and πi is the proportion in this binpredicted by the considered model. N is the number of all obser-vations1. Because the congruent and incongruent conditions werefit together, we had J= 20 bins (six for correct responses in thecongruent condition, two for errors in the congruent condition,six for correct responses in the incongruent condition, and six forerrors in the incongruent conditions).
Assuming symmetric thresholds (A=B, C=D), there wereseven parameters for the DSTP model, including one parameter(t er) for representing the non-decisional time. The SSP model hadfive parameters. Let J c and J i be the number of bins for the congru-ent and incongruent condition, respectively, and M the number ofmodel parameters, then the degrees of freedom (df) are calculatedby df= (J c− 1)+ (J i− 1)−M.
We simulated 8× 10⁵ trials for each condition and fit cycle.To prevent that the obtained parameter estimates represent a
1Because we fit group data, the average number of valid trials per person was usedas number of observation (N ) for computing these values. For the present objectivethis is sufficient, because these measures merely served for comparing the models.
local minimum, the fit procedure was repeated several times withdifferent sets of initial parameter values.
RESULTS AND DISCUSSIONMean performanceThe latencies of correct responses were analyzed by a one-factorANOVA for repeated measures on the factor congruency (congru-ent, or incongruent). The analysis revealed a significant congruencyeffect, F(1, 18)= 126, p < 0.001. Responses were faster for con-gruent than for incongruent stimuli (Table 2). The mean ER was7.28%. The ERs were subjected to an ANOVA of the same typeas for the RTs. It revealed a significant effect of congruency, F(1,18)= 42.2, p < 0.001, indicating that congruent stimuli produceda smaller ER than incongruent ones (Table 2).
These results show the same pattern as those in White et al.’s(2011) first experiment. However, the responses in the presentexperiment were numerically faster (474 versus 505 ms), and thecongruency effect was smaller in RT (∆38 versus ∆78 ms) as wellas in ER (∆5.81 versus ∆7.6%).
Model fitsThe parameters and goodness-of-fit values obtained from fit-ting the DSTP and the SSP model to the distributional data arealso shown in Table 3. The table also shows BIC model-selectionvalues (Schwarz, 1978), which also represent goodness-of-fit butadditionally take the number of model parameters into account.Accordingly, the model with the smaller BIC should be preferred.As can be seen, although the pure goodness-of-fit (G2) was slightlybetter for the DSTP model, the BIC value is in favor (i.e., smaller)of the SSP model due to the fewer parameters of that model.
Thus, by applying the task and procedure of White et al. (2011),and by fitting the models to the data we have to conclude thatthe SSP model is indeed superior to the DSTP model, at leastunder these specific conditions. The fact that the DSTP model issuperior under other experimental conditions suggests that pro-cedural differences produced the inconclusive results with respectto model superiority. The question now was which methodolog-ical details were responsible for the advantage of the SSP modelin the present experiment. To answer this question, we conductedfurther experiments.
EXPERIMENT 2In this experiment we examined the role of stimulus type and taskfor model superiority. The hypothesis was that data obtained witharrow stimuli and the corresponding task might generally be betteraccounted for by the SSP model. If this is the case, then this modelshould also be superior to the DSTP model when arrow stimuli arecombined with the procedure of Hübner et al. (2010). To test thishypothesis, we used the same stimuli and task as in Experiment 1,but applied the procedure as in Hübner et al. Specifically, stimuliwere presented only for 165 ms, participants had to indicate theirdecision by pressing a corresponding key with their index or mid-dle finger of their right hand, respectively, errors were signaled bya tone, and the RSI was 2000 ms. Moreover, whereas the flankingarrows had always been arranged vertically in White et al. (2011),we also included a condition with horizontally arranged items.
If the observed difference in fit performance between the DSTPand the SSP model was due to the applied stimulus type and task,
Frontiers in Psychology | Cognitive Science October 2012 | Volume 3 | Article 434 | 4
Hübner and Töbel Attentional selectivity in the flanker task
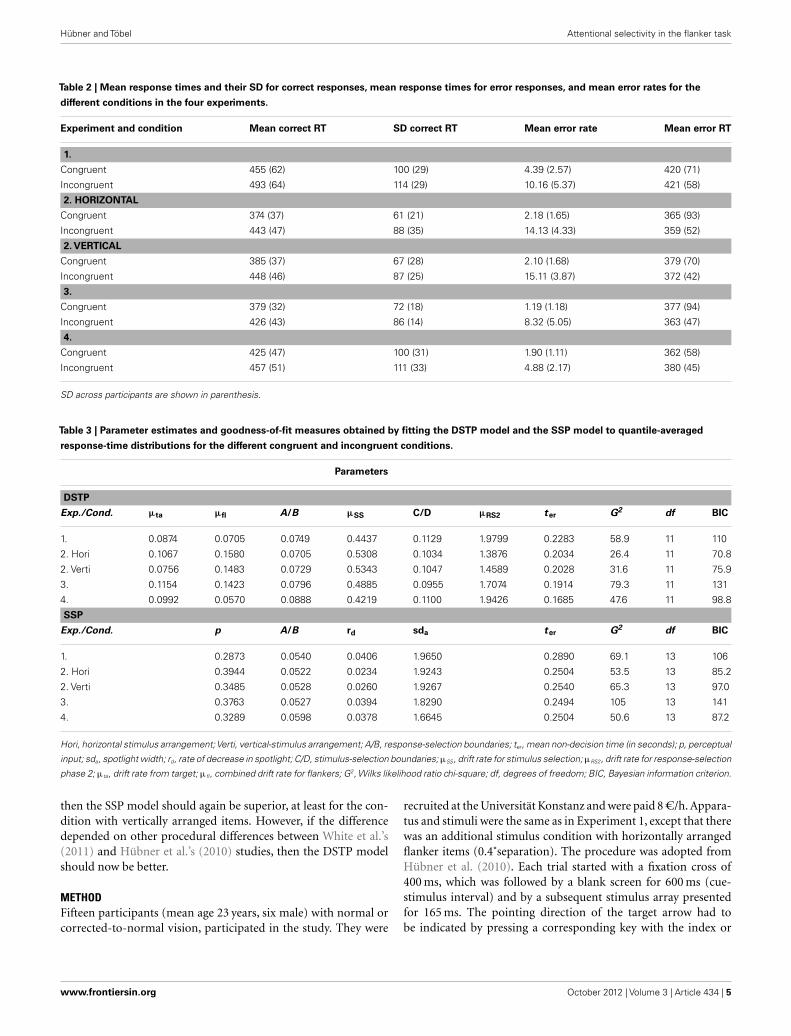
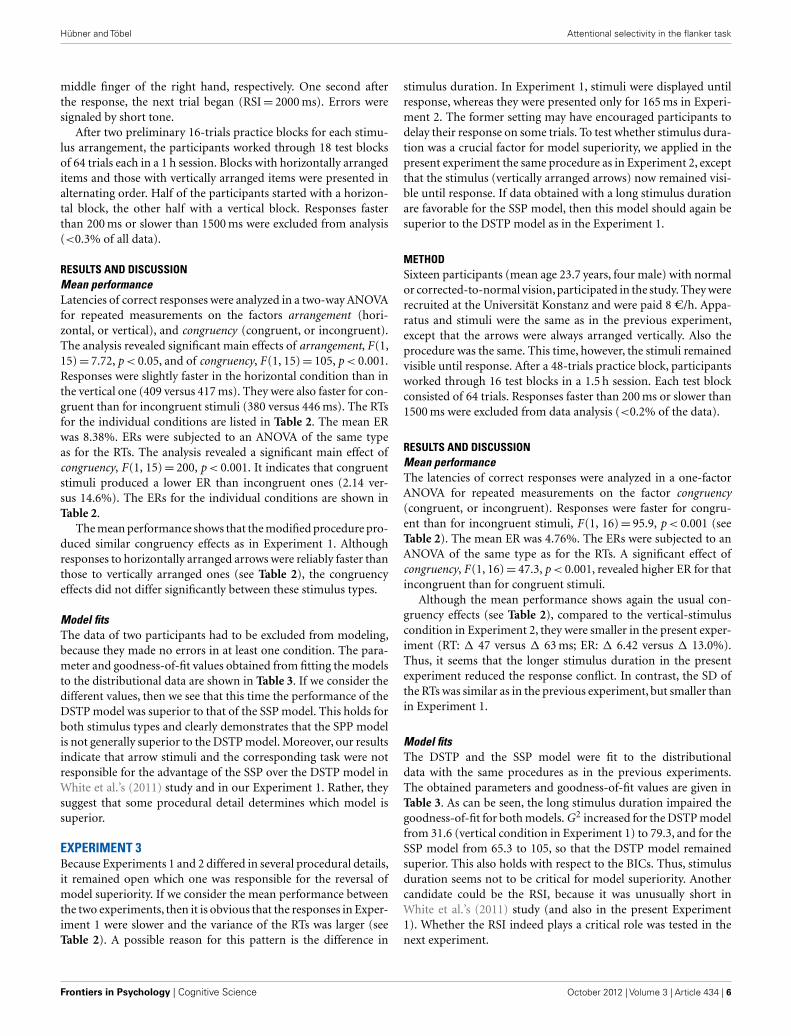
Table 2 | Mean response times and their SD for correct responses, mean response times for error responses, and mean error rates for the
different conditions in the four experiments.
Experiment and condition Mean correct RT SD correct RT Mean error rate Mean error RT
1.
Congruent 455 (62) 100 (29) 4.39 (2.57) 420 (71)
Incongruent 493 (64) 114 (29) 10.16 (5.37) 421 (58)
2. HORIZONTAL
Congruent 374 (37) 61 (21) 2.18 (1.65) 365 (93)
Incongruent 443 (47) 88 (35) 14.13 (4.33) 359 (52)
2. VERTICAL
Congruent 385 (37) 67 (28) 2.10 (1.68) 379 (70)
Incongruent 448 (46) 87 (25) 15.11 (3.87) 372 (42)
3.
Congruent 379 (32) 72 (18) 1.19 (1.18) 377 (94)
Incongruent 426 (43) 86 (14) 8.32 (5.05) 363 (47)
4.
Congruent 425 (47) 100 (31) 1.90 (1.11) 362 (58)
Incongruent 457 (51) 111 (33) 4.88 (2.17) 380 (45)
SD across participants are shown in parenthesis.
Table 3 | Parameter estimates and goodness-of-fit measures obtained by fitting the DSTP model and the SSP model to quantile-averaged
response-time distributions for the different congruent and incongruent conditions.
Parameters
DSTP
Exp./Cond. µta µfl A/B µSS C/D µRS2 ter G2 df BIC
1. 0.0874 0.0705 0.0749 0.4437 0.1129 1.9799 0.2283 58.9 11 110
2. Hori 0.1067 0.1580 0.0705 0.5308 0.1034 1.3876 0.2034 26.4 11 70.8
2. Verti 0.0756 0.1483 0.0729 0.5343 0.1047 1.4589 0.2028 31.6 11 75.9
3. 0.1154 0.1423 0.0796 0.4885 0.0955 1.7074 0.1914 79.3 11 131
4. 0.0992 0.0570 0.0888 0.4219 0.1100 1.9426 0.1685 47.6 11 98.8
SSP
Exp./Cond. p A/B rd sda ter G2 df BIC
1. 0.2873 0.0540 0.0406 1.9650 0.2890 69.1 13 106
2. Hori 0.3944 0.0522 0.0234 1.9243 0.2504 53.5 13 85.2
2. Verti 0.3485 0.0528 0.0260 1.9267 0.2540 65.3 13 97.0
3. 0.3763 0.0527 0.0394 1.8290 0.2494 105 13 141
4. 0.3289 0.0598 0.0378 1.6645 0.2504 50.6 13 87.2
Hori, horizontal stimulus arrangement;Verti, vertical-stimulus arrangement; A/B, response-selection boundaries; ter, mean non-decision time (in seconds); p, perceptual
input; sda, spotlight width; rd, rate of decrease in spotlight; C/D, stimulus-selection boundaries; µSS, drift rate for stimulus selection; µRS2, drift rate for response-selection
phase 2; µta, drift rate from target; µfl, combined drift rate for flankers; G2, Wilks likelihood ratio chi-square; df, degrees of freedom; BIC, Bayesian information criterion.
then the SSP model should again be superior, at least for the con-dition with vertically arranged items. However, if the differencedepended on other procedural differences between White et al.’s(2011) and Hübner et al.’s (2010) studies, then the DSTP modelshould now be better.
METHODFifteen participants (mean age 23 years, six male) with normal orcorrected-to-normal vision, participated in the study. They were
recruited at the Universität Konstanz and were paid 8 C/h. Appara-tus and stimuli were the same as in Experiment 1, except that therewas an additional stimulus condition with horizontally arrangedflanker items (0.4˚separation). The procedure was adopted fromHübner et al. (2010). Each trial started with a fixation cross of400 ms, which was followed by a blank screen for 600 ms (cue-stimulus interval) and by a subsequent stimulus array presentedfor 165 ms. The pointing direction of the target arrow had tobe indicated by pressing a corresponding key with the index or
www.frontiersin.org October 2012 | Volume 3 | Article 434 | 5
Hübner and Töbel Attentional selectivity in the flanker task
middle finger of the right hand, respectively. One second afterthe response, the next trial began (RSI= 2000 ms). Errors weresignaled by short tone.
After two preliminary 16-trials practice blocks for each stimu-lus arrangement, the participants worked through 18 test blocksof 64 trials each in a 1 h session. Blocks with horizontally arrangeditems and those with vertically arranged items were presented inalternating order. Half of the participants started with a horizon-tal block, the other half with a vertical block. Responses fasterthan 200 ms or slower than 1500 ms were excluded from analysis(<0.3% of all data).
RESULTS AND DISCUSSIONMean performanceLatencies of correct responses were analyzed in a two-way ANOVAfor repeated measurements on the factors arrangement (hori-zontal, or vertical), and congruency (congruent, or incongruent).The analysis revealed significant main effects of arrangement, F(1,15)= 7.72, p < 0.05, and of congruency, F(1, 15)= 105, p < 0.001.Responses were slightly faster in the horizontal condition than inthe vertical one (409 versus 417 ms). They were also faster for con-gruent than for incongruent stimuli (380 versus 446 ms). The RTsfor the individual conditions are listed in Table 2. The mean ERwas 8.38%. ERs were subjected to an ANOVA of the same typeas for the RTs. The analysis revealed a significant main effect ofcongruency, F(1, 15)= 200, p < 0.001. It indicates that congruentstimuli produced a lower ER than incongruent ones (2.14 ver-sus 14.6%). The ERs for the individual conditions are shown inTable 2.
The mean performance shows that the modified procedure pro-duced similar congruency effects as in Experiment 1. Althoughresponses to horizontally arranged arrows were reliably faster thanthose to vertically arranged ones (see Table 2), the congruencyeffects did not differ significantly between these stimulus types.
Model fitsThe data of two participants had to be excluded from modeling,because they made no errors in at least one condition. The para-meter and goodness-of-fit values obtained from fitting the modelsto the distributional data are shown in Table 3. If we consider thedifferent values, then we see that this time the performance of theDSTP model was superior to that of the SSP model. This holds forboth stimulus types and clearly demonstrates that the SPP modelis not generally superior to the DSTP model. Moreover, our resultsindicate that arrow stimuli and the corresponding task were notresponsible for the advantage of the SSP over the DSTP model inWhite et al.’s (2011) study and in our Experiment 1. Rather, theysuggest that some procedural detail determines which model issuperior.
EXPERIMENT 3Because Experiments 1 and 2 differed in several procedural details,it remained open which one was responsible for the reversal ofmodel superiority. If we consider the mean performance betweenthe two experiments, then it is obvious that the responses in Exper-iment 1 were slower and the variance of the RTs was larger (seeTable 2). A possible reason for this pattern is the difference in
stimulus duration. In Experiment 1, stimuli were displayed untilresponse, whereas they were presented only for 165 ms in Experi-ment 2. The former setting may have encouraged participants todelay their response on some trials. To test whether stimulus dura-tion was a crucial factor for model superiority, we applied in thepresent experiment the same procedure as in Experiment 2, exceptthat the stimulus (vertically arranged arrows) now remained visi-ble until response. If data obtained with a long stimulus durationare favorable for the SSP model, then this model should again besuperior to the DSTP model as in the Experiment 1.
METHODSixteen participants (mean age 23.7 years, four male) with normalor corrected-to-normal vision, participated in the study. They wererecruited at the Universität Konstanz and were paid 8 C/h. Appa-ratus and stimuli were the same as in the previous experiment,except that the arrows were always arranged vertically. Also theprocedure was the same. This time, however, the stimuli remainedvisible until response. After a 48-trials practice block, participantsworked through 16 test blocks in a 1.5 h session. Each test blockconsisted of 64 trials. Responses faster than 200 ms or slower than1500 ms were excluded from data analysis (<0.2% of the data).
RESULTS AND DISCUSSIONMean performanceThe latencies of correct responses were analyzed in a one-factorANOVA for repeated measurements on the factor congruency(congruent, or incongruent). Responses were faster for congru-ent than for incongruent stimuli, F(1, 16)= 95.9, p < 0.001 (seeTable 2). The mean ER was 4.76%. The ERs were subjected to anANOVA of the same type as for the RTs. A significant effect ofcongruency, F(1, 16)= 47.3, p < 0.001, revealed higher ER for thatincongruent than for congruent stimuli.
Although the mean performance shows again the usual con-gruency effects (see Table 2), compared to the vertical-stimuluscondition in Experiment 2, they were smaller in the present exper-iment (RT: ∆ 47 versus ∆ 63 ms; ER: ∆ 6.42 versus ∆ 13.0%).Thus, it seems that the longer stimulus duration in the presentexperiment reduced the response conflict. In contrast, the SD ofthe RTs was similar as in the previous experiment, but smaller thanin Experiment 1.
Model fitsThe DSTP and the SSP model were fit to the distributionaldata with the same procedures as in the previous experiments.The obtained parameters and goodness-of-fit values are given inTable 3. As can be seen, the long stimulus duration impaired thegoodness-of-fit for both models. G2 increased for the DSTP modelfrom 31.6 (vertical condition in Experiment 1) to 79.3, and for theSSP model from 65.3 to 105, so that the DSTP model remainedsuperior. This also holds with respect to the BICs. Thus, stimulusduration seems not to be critical for model superiority. Anothercandidate could be the RSI, because it was unusually short inWhite et al.’s (2011) study (and also in the present Experiment1). Whether the RSI indeed plays a critical role was tested in thenext experiment.
Frontiers in Psychology | Cognitive Science October 2012 | Volume 3 | Article 434 | 6
Hübner and Töbel Attentional selectivity in the flanker task
EXPERIMENT 4In this experiment we tested effects of the RSI on model superior-ity. A preliminary experiment in our lab revealed that a short RSIof 350 ms, as used by White et al. (2011), and in our Experiment1, is only feasible in combination with a long stimulus duration.Therefore, we used the same procedure as in Experiment 3, exceptthat the RSI was now reduced from 2000 to 350 ms. This modifica-tion had the advantage that Experiments 3 and 4 differed only withrespect to this single factor. Accordingly, it was possible to comparethe performance between these two experiments statistically.
METHODSixteen participants (mean age 21.5 years, four male) with nor-mal or corrected-to-normal vision, participated in the study. Theywere recruited at the Universität Konstanz and were paid 8 C/h.Apparatus and stimuli were the same as in the previous experi-ment. Also the procedure was the same as in Experiment 3, exceptthat the RSI was reduced to 350 ms. For this objective we hadalso to abandon the fixation cross. After a 48-trials practice block,the participants worked through 16 test blocks of 64 trials eachin a 45 min session. Responses faster than 200 ms or slower than1500 ms were excluded from data analysis (<0.9% of the data).
RESULTS AND DISCUSSIONMean performanceThe latencies of correct responses were analyzed by a one-factorANOVA for repeated measurements on the factor congruency(congruent, or incongruent). It revealed a significant effect ofcongruency, F(1, 16)= 58.8, p < 0.001. Responses were faster forcongruent than for incongruent stimuli (Table 2). The mean ERwas 3.39%. The ERs were subjected to an ANOVA of the sametype as for the RTs. It revealed a significant effect of congruency,F(1, 16)= 36.6, p < 0.001, indicating that incongruent stimuliproduced a higher ER than congruent ones (Table 2).
Comparison with experiment 3To assess the effects of the difference in RSI between the presentexperiment and Experiment 3 (Experiment 3: long RSI of 2000 ms;Experiment 4: short RSI of 350 ms), we subjected the mean RTs andtheir SDs for correct responses, and the mean ERs to two-factorANOVAs with within-participant factor congruency (congruent,or incongruent), and between-participants factor RSI (long, orshort), respectively. We report only results involving the factor RSI.A significant main effect of RSI in RT, F(1, 30)= 6.35, p < 0.05,indicates faster responses for the long than for the short RSI(403 versus 441 ms). Moreover, there was a significant interactionbetween RSI and congruency in RT, F(1, 30)= 4.94, p < 0.05, aswell as in ER, F(1, 30)= 13.0, p < 0.01. These interactions indicatethat congruency effects were generally stronger for the long thanfor the short RSI. Finally, there was a significant main effect of RSIin the SD, F(1, 30)= 9.47, p < 0.01. The SDs were smaller for thelong than for the short RSI (86.1 versus 98.7 ms).
The comparison between Experiments 3 and this experimentshows that a shorter RSI increased the mean of the RTs as well astheir SD (see also Table 2). It is well known that RT and RSI arenegatively correlated (e.g., Rabbitt, 1980). A further effect of thereduced RSI was that the congruency effects were smaller, which
suggests that during a short RSI the attentional weights can bemaintained more optimally across trials. If this was the case, thenthe congruency-sequence effect should also have varied with RSI.The congruency-sequence effect is thought to reflect the phenom-enon that the congruency effect is larger after a congruent trialthan after an incongruent one (Gratton et al., 1992).
To test whether the congruency-sequence effect was affected byRSI, we subjected the mean RTs for correct responses and the meanERs (trials with an error on the previous-trial were excluded) tothree-factor ANOVAs with the within-participant factors congru-ency (congruent, or incongruent), and previous-trial congruency(congruent, or incongruent), and the between-participants fac-tor RSI (long, or short). In RT it revealed a significant three-wayinteraction between all factors, F(1, 30)= 6.96, p < 0.05. It indi-cates that the congruency effect was reduced to a lesser extent forthe long RSI, i.e., from 51 ms after a congruent trial to 41 ms afteran incongruent one, than for the short RSI, where the reductionwas from 44 to 21 ms. However, a further analysis revealed thatthe effect was also significant for the long RSI, F(1, 15)= 28.1,p < 0.001. In ER there was a significant previous-trial congru-ency effect, F(1, 30)= 22.7, p < 0.001, which, however, was notmodulated by RSI.
Model fitsThe DSTP and the SSP model were fit to distributional data withthe same procedures as in the previous experiments. One par-ticipant had to be excluded, because she made no errors in thecongruent condition. Parameter values and goodness-of-fit mea-sures are listed in Table 3. As can be seen, the short RSI had crucialeffects on model superiority. Although the pure goodness-of-fit(G2) was still slightly better for the DSTP model, the model-selection criterion (BIC) was now again smaller for the SSP model.Thus, these results suggest that a short RSI is crucial for modelselection. Its duration determines whether the SSP model or theDSTP model is superior.
GENERAL DISCUSSIONAn important question is whether spatial selective attentionimproves discretely or continuously during stimulus processingand response selection in the flanker task. If one considers thecorresponding studies, though, then the results are inconclusive.Whereas Hübner et al. (2010)found that the discrete DSTP modelaccounts better for flanker-task data than various continuousmodels, White et al. (2011)observed that their continuous SSPmodel was superior. Because both studies used different tasks andprocedures, it was not possible to decide whether the superiorityof the SSP model holds generally, or only under certain conditions.Therefore, in a first step, we also applied the SSP model to Hübneret al.’s data, and found that its fit was worse than that of the DSTPmodel (see Table 1). This shows that the SSP model is not generallysuperior, and suggested that methodological details were respon-sible for the opposite conclusions. To investigate which details arecrucial in this respect, we conducted a series of experiments.
In our first experiment we tested whether White et al.’s (2011)results are replicable in our lab. The results show that the SSP isindeed superior to the DSTP model under the specific methodapplied in that study. Although the pure goodness-of-fit was
www.frontiersin.org October 2012 | Volume 3 | Article 434 | 7
Hübner and Töbel Attentional selectivity in the flanker task
slightly better for the DSTP model, the model-selection statistics(BIC) was in favor of the SSP model, due to the fewer parametersof that model. This result supported our hypothesis that specificprocedural details were responsible for the incompatible resultsbetween Hübner et al.’s (2010) and White et al.’s (2011) study.
In our second experiment we examined the role of task andstimuli for model superiority. To this end, we used the same stim-uli and task as White et al. (2011), but applied the experimentalprocedure of Hübner et al. (2010). It turned out that now the DSTPmodel was superior, which indicated that stimuli and task were notcrucial for the superiority of the SSP model in White et al.’s (2011)study. To examine exactly which procedural details were essen-tial in this respect, we ran two subsequent experiments in whichwe tested the role of stimulus duration (Experiment 3), and of RSI(Experiment 4). The results demonstrate that the RSI is the crucialvariable. The SSP model seems to be superior to the DSTP model
only if the RSI is short, as in Experiments 1 and 4, where the RSIwas 350 ms, compared to the 2000 ms in Experiments 2 and 3.
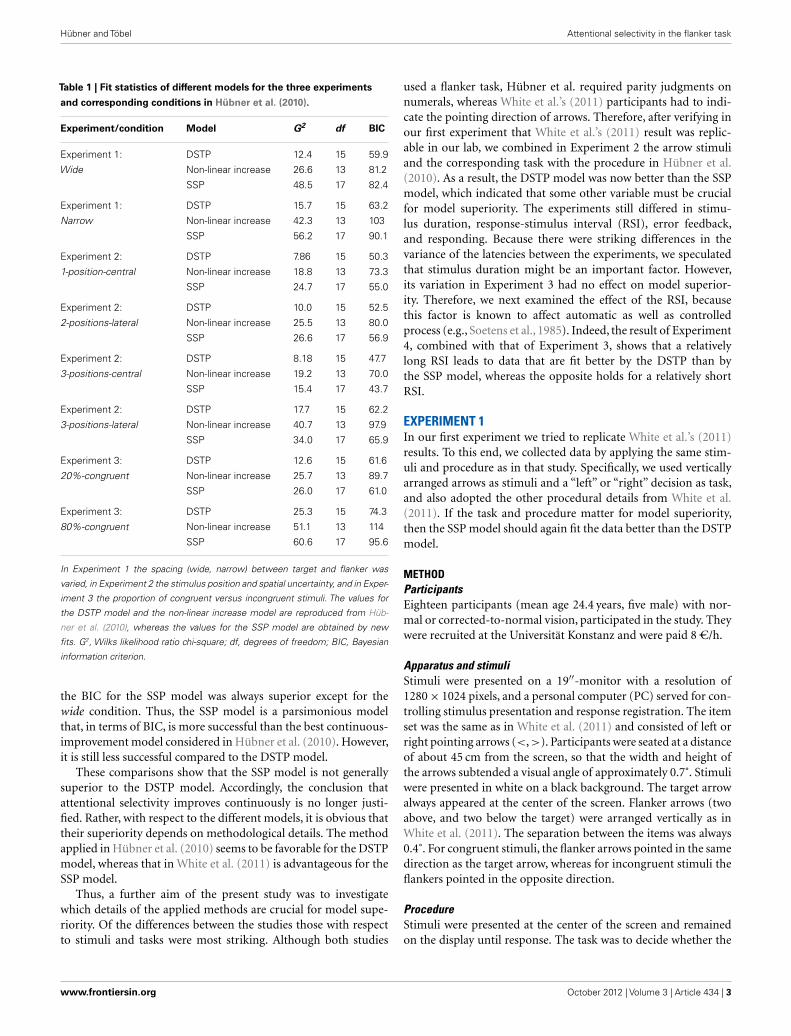
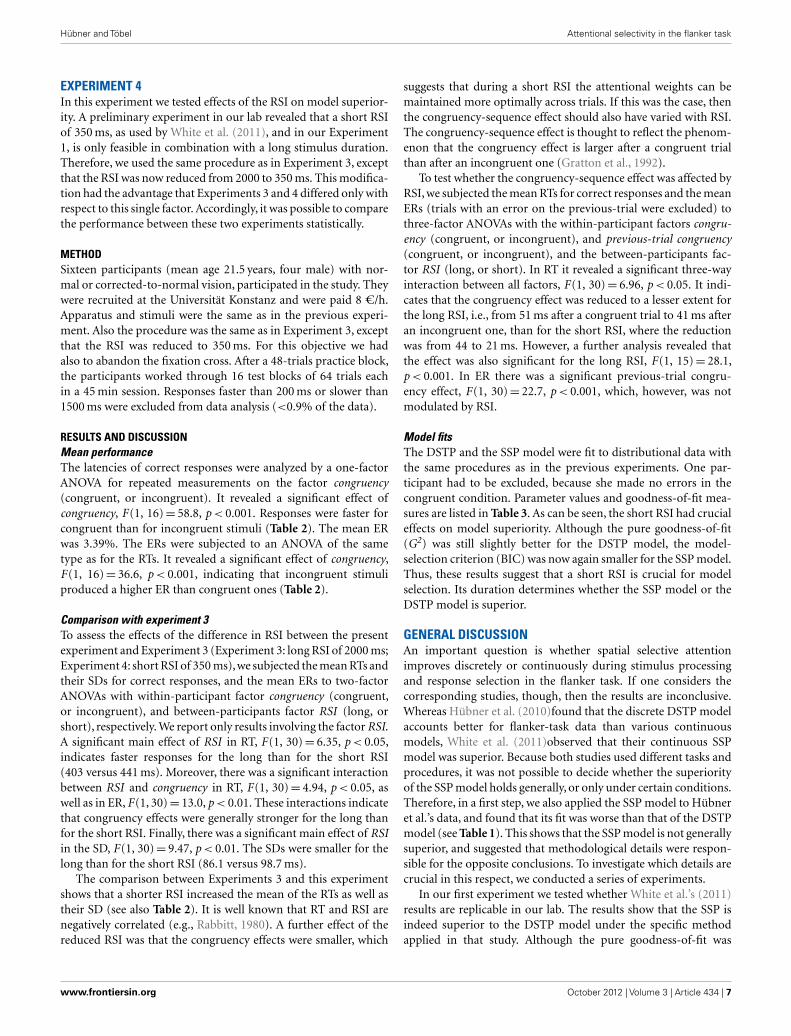
The considerations so far do not answer the question of whythe RSI actually had an effect on model superiority. Thus, to fur-ther examine why the RSI had such an effect on model superiority,it might be helpful to consider the distributional data in detail.We did this exemplarily for our last two experiments, because theydiffered only in RSI, and model superiority was reversed betweenthem. Figure 2 shows the empirical cumulative distribution func-tions of the RTs for correct responses in the different conditionsand the corresponding model fits. As can be seen, both models fitthe data for both experiments relatively well, and differences arehardly noticeable by visual inspection. If we consider the corre-sponding goodness-of-fit values, i.e., to what extent the deviationsfor correct responses contributed to G2, then we find that the SSPmodel was superior to the DSTP model in the two experiments
300 400 500 600 700
0.0
0.2
0.4
0.6
0.8
1.0
Exp. 3 - DSTP Model
Cum
ula
tive P
robabili
ty
Conditions
con
inc
model
model
300 400 500 600 700
0.0
0.2
0.4
0.6
0.8
1.0
Exp. 3 - SSP Model
300 400 500 600 700
0.0
0.2
0.4
0.6
0.8
1.0
Exp. 4 - DSTP Model
Response Time (ms )
Cum
ula
tive P
robabili
ty
300 400 500 600 700
0.0
0.2
0.4
0.6
0.8
1.0
Exp. 4 - SSP Model
Response Time (ms)
Cumulative Distribution Data and Model Fits
FIGURE 2 | Cumulative distribution functions of RTs for correctresponses to congruent (con) and incongruent (inc) stimuli inExperiments 3 (upper panels) and 4 (lower panels). The symbols
represent the vincentized data and the lines the corresponding modelperformance of the DSTP model (left panels) and SSP model (rightpanels).
Frontiers in Psychology | Cognitive Science October 2012 | Volume 3 | Article 434 | 8
Hübner and Töbel Attentional selectivity in the flanker task
(Experiment 3: DSTP 58.8, SSP 48.5; Experiment 4: DSTP 49.7,SSP 42.7). This superiority, though, does not hold generally. InExperiment 1, for instance, the DSTP fit correct responses simi-larly good or even better than the SSP model (horizontal condition:DSTP 17.5, SSP 23.3; vertical condition: DSTP 27.3, SSP 27.3).
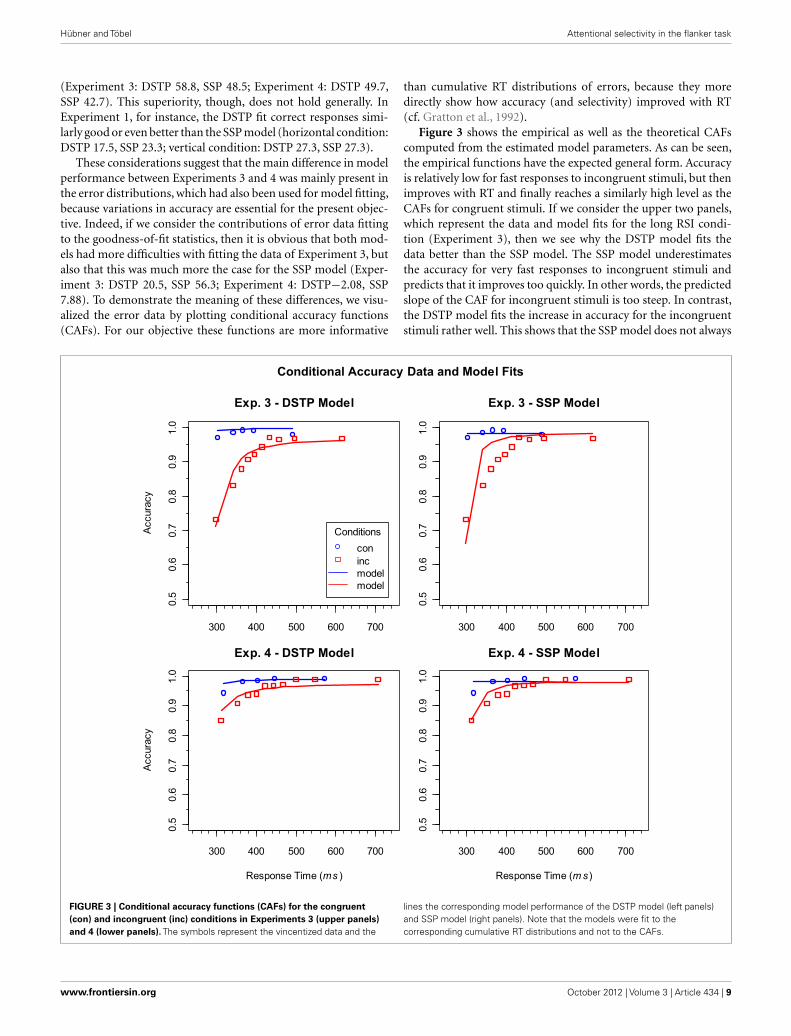
These considerations suggest that the main difference in modelperformance between Experiments 3 and 4 was mainly present inthe error distributions, which had also been used for model fitting,because variations in accuracy are essential for the present objec-tive. Indeed, if we consider the contributions of error data fittingto the goodness-of-fit statistics, then it is obvious that both mod-els had more difficulties with fitting the data of Experiment 3, butalso that this was much more the case for the SSP model (Exper-iment 3: DSTP 20.5, SSP 56.3; Experiment 4: DSTP−2.08, SSP7.88). To demonstrate the meaning of these differences, we visu-alized the error data by plotting conditional accuracy functions(CAFs). For our objective these functions are more informative
than cumulative RT distributions of errors, because they moredirectly show how accuracy (and selectivity) improved with RT(cf. Gratton et al., 1992).
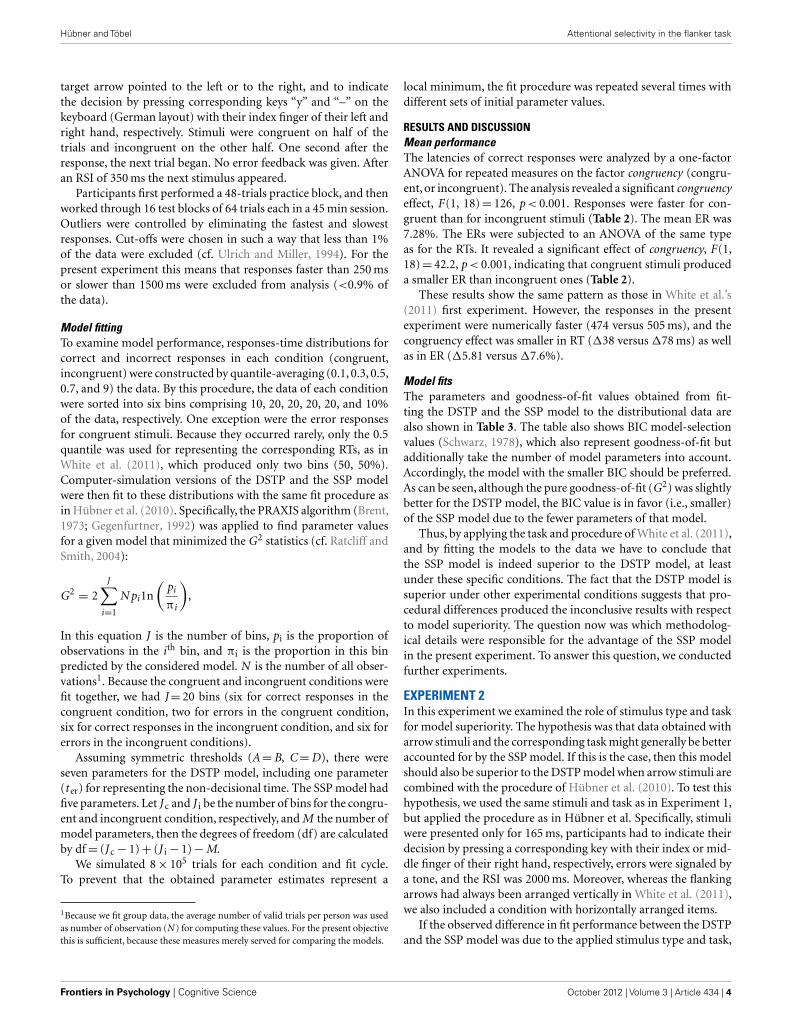
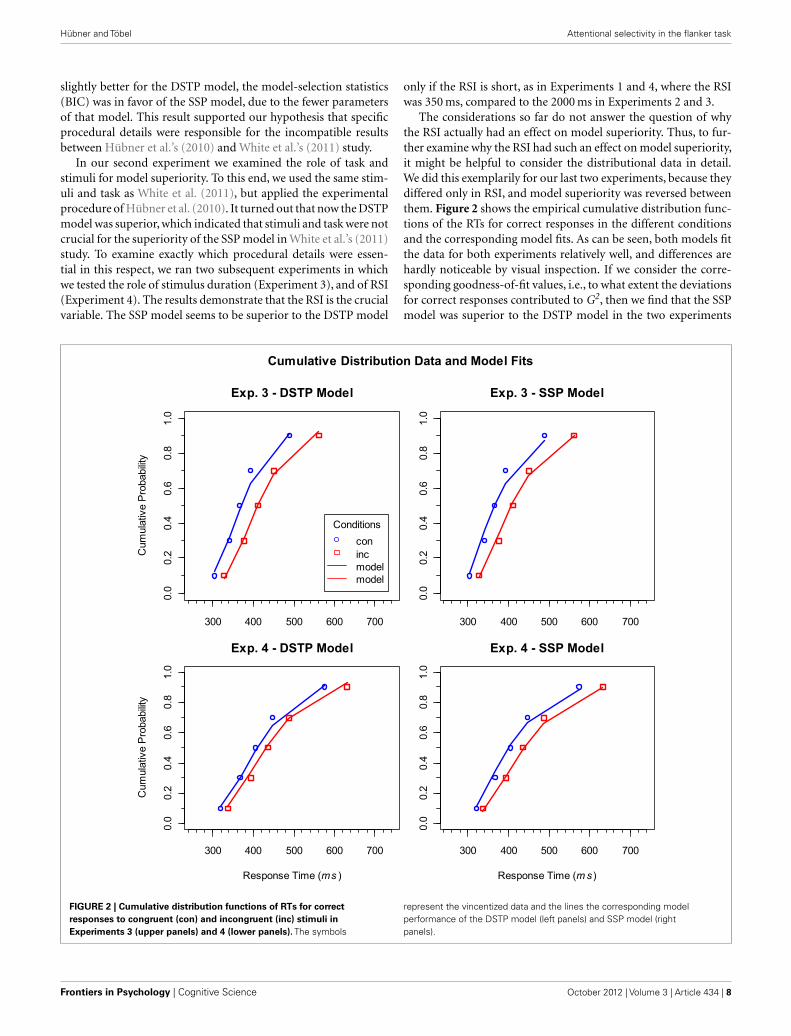
Figure 3 shows the empirical as well as the theoretical CAFscomputed from the estimated model parameters. As can be seen,the empirical functions have the expected general form. Accuracyis relatively low for fast responses to incongruent stimuli, but thenimproves with RT and finally reaches a similarly high level as theCAFs for congruent stimuli. If we consider the upper two panels,which represent the data and model fits for the long RSI condi-tion (Experiment 3), then we see why the DSTP model fits thedata better than the SSP model. The SSP model underestimatesthe accuracy for very fast responses to incongruent stimuli andpredicts that it improves too quickly. In other words, the predictedslope of the CAF for incongruent stimuli is too steep. In contrast,the DSTP model fits the increase in accuracy for the incongruentstimuli rather well. This shows that the SSP model does not always
300 400 500 600 700
0.5
0.6
0.7
0.8
0.9
1.0
Exp. 3 - DSTP Model
Accura
cy
Conditions
con
inc
model
model
300 400 500 600 700
0.5
0.6
0.7
0.8
0.9
1.0
Exp. 3 - SSP Model
300 400 500 600 700
0.5
0.6
0.7
0.8
0.9
1.0
Exp. 4 - DSTP Model
Response Time (ms )
Accura
cy
300 400 500 600 700
0.5
0.6
0.7
0.8
0.9
1.0
Exp. 4 - SSP Model
Response Time (ms)
Conditional Accuracy Data and Model Fits
FIGURE 3 | Conditional accuracy functions (CAFs) for the congruent(con) and incongruent (inc) conditions in Experiments 3 (upper panels)and 4 (lower panels). The symbols represent the vincentized data and the
lines the corresponding model performance of the DSTP model (left panels)and SSP model (right panels). Note that the models were fit to thecorresponding cumulative RT distributions and not to the CAFs.
www.frontiersin.org October 2012 | Volume 3 | Article 434 | 9
Hübner and Töbel Attentional selectivity in the flanker task
adequately fit the slope of steep CAFs. The CAFs for the shortRSI condition (Experiment 4) can be seen in the lower panels ofFigure 3. Obviously, accuracy for fast responses to incongruentstimuli was already relatively high under this condition, indicatinga correspondingly high spatial selectivity. For these data the fit ofSSP model was similarly good as that of the DSTP model.
In a recent article, White et al. (2012) compared the perfor-mance of their SSP model with that of two specific Bayesianobserver models (Yu et al., 2009), which also assume a continuous-improvement of selectivity. They could show that the crucialdifference of the observer models compared to other continuous-improvement models is not their Bayesian decision part, but theassumed attentional mechanisms, which were based on compat-ibility bias and spatial uncertainty. White et al. (2012) fit theobserver models to data from White et al. (2011), and also con-sidered CAFs. The comparison revealed that the SSP model wassuperior, mainly because it adequately captured the steep slopes inthe CAFs for incongruent stimuli. However, as we have seen in thepresent study, predicting a steep slope might not always be appro-priate. Accordingly, as the CAFs were less steep in the present studyfor conditions with a long RSI, one might ask whether the observermodels might be superior to the SSP model in this case, or evenbetter than the DSTP model. If we consider the fits of the differentmodels to the data from Experiment 1 in White et al. (2011), thenwe see that the SSP model was slightly superior to the DSTP model(χ2
SSP = 632 vs. χ2DSTP = 656), whereas both models largely out-
performed the Bayesian observer models (χ2Observer = 1553, and
4411, respectively; see White et al., 2012). Thus, given the moderatedifferences in performance between the DSTP and the SSP modelin the present experiments, it is highly likely that the SSP model aswell as the DSTP model remain superior to the observer modelsalso for longer RSIs, as applied in the present study. In any case,we can conclude that there is no single continuous-improvementmodel, at least up to now, that is generally superior to the DSTPmodel.
Given our result that the congruency effects were relativelysmall in the experiments with a short RSI (Experiments 1 and4), one could speculate that this is a necessary condition for thesuperiority of the SSP model. However, if we consider the congru-ency effects in White et al.’s (2011) study, then we see that theywere also relatively large. Thus, it seems that the size of the con-gruency effect is not crucial. What could instead be responsible isthe fact that a short RSI produces broader RT distributions, whichis compatible with the observed greater SD of the RTs. As can beseen in Figure 2, slow responses were delayed to a larger extentthan fast responses.
Thus, we have the result that the SSP model, which so farrepresents the most successful continuous-improvement mech-anism of spatial selectivity, is not generally superior to the discreteimprovement DSTP model, but only under specific conditions.One of these conditions, as figured out in the present study, isgiven if the RSI is rather short. In our experiments, RTs and theirSD decreased with an increasing RSI, as can be seen by consider-ing the distributions in Figure 2. This effect can have differentorigins. For instance, with a short RSI participants might nothave been well prepared for responding again shortly after anexecuted response, presumably, because there is some refractory
period (Rabbitt, 1969). There is also evidence that a short RSIdelays the onset of sensory evidence accumulation (e.g., Sei-bold et al., 2011). Furthermore, sequential effects suggest thatshort RSIs generally increase automatic facilitation, whereas longRSIs increase the impact of expectations (e.g., Soetens et al.,1985).
Obviously, the short RSI in Experiments 1 and 4 reduced thecongruency effects, suggesting that attentional adjustments couldbetter be maintained from one trial to the next. This would bein line with other results showing that carry-over effects betweentrials depend on the RSI. Egner et al. (2010), for instance, variedthe RSI from 500 to 5000 ms in steps of 500 ms. They found thatcongruency-sequence effects decreased with an increasing RSI,andwere absent for RSIs longer than 2000 ms. Indeed, also in our datawe found such a modulation. The comparison between Experi-ments 3 and 4 revealed that the congruency-sequence effect waslarger for the short than for the long RSI, although it was stillpresent for the long RSI. It should be noted, however, that in ourexperiments the congruency-sequence effect does not necessarilyreflect some kind of conflict adaptation (Botvinick et al., 2001),because with the present set of stimuli there were unequal propor-tions of target/response repetitions in the different congruency-sequences, which might also have contributed to the observedsequential effects (Mayr et al., 2003).
Our results support the notion that the specific RSI in anexperiment can have various positive and/or negative effects onperformance. Choosing a long RSI is no guarantee that there areno sequential effects. However, they might be reduced, comparedto short RSIs, at least with respect to the more automatic processes.If we consider our model parameters (Table 3), then they suggestthat the RSI mainly affected early attentional selection, i.e., earlyspatial filtering. If we compare the corresponding values betweenExperiments 3 and 4 for the DSTP model, then we see that thepartial rate for the target (µta) was only somewhat smaller undera short RSI (Experiment 4), whereas that for the flankers (µfl)was substantially reduced. These values indicate that early selec-tion was more effective under the short RSI. Similarly, for the SSPmodel the initial diameter (sda) of the spotlight was smaller inExperiment 4, as was the perceptual evidence (p). Furthermore,for both models the response criterion (A/B) was higher for theshort RSI.
Taken together, our study shows that, different from Whiteet al.’s (2011) suggestion, the continuous SSP model is not gener-ally superior to the discrete DSTP model, not even for explainingthe performance in simple flanker tasks. Rather, it offers a moreparsimonious description of flanker-task data only under specificconditions. One of such conditions, as also shown in the presentstudy, is a relatively short RSI. Thus, it remains open whether selec-tivity of spatial attention improves continuously or discretely. Asboth models largely mimic each other, many comparisons undervarious conditions might probably be necessary to reach a finaldecision of which attentional mechanism is valid.
ACKNOWLEDGMENTSWe thank Shreyasi Mishra for collecting the data for Experiment1 and Michael Dambacher for his valuable comments on thismanuscript.
Frontiers in Psychology | Cognitive Science October 2012 | Volume 3 | Article 434 | 10
Hübner and Töbel Attentional selectivity in the flanker task
REFERENCESBotvinick, M. M., Braver, T. S., Barch,
D. M., Carter, C. S., and Cohen, J.D. (2001). Conflict monitoring andcognitive control. Psychol. Rev. 108,624–652.
Brent, R. P. (1973). Algorithms for Func-tion Minimization Without Deriva-tives. Englewood Cliffs, NJ: Prentice-Hall.
Cohen, J. D., Servan-Schreiber, D., andMcClelland, J. L. (1992). A paral-lel distributed processing approachto automaticity. Am. J. Psychol. 105,239–269.
Davelaar, E. J. (2008). A computationalstudy of conflict-monitoring at twolevels of processing: reaction timedistributional analyses and hemody-namic responses. Brain Res. 1202,109–119.
Egner, T., Ely, S., and Grin-band, J. (2010). Going, going,gone: characterizing the time-course of congruency sequenceeffects. Front. Psychol. 1:154.doi:10.3389/fpsyg.2010.00154
Eriksen, B. A., and Eriksen, C. W. (1974).Effects of noise letters upon the iden-tification of a target letter in a non-search task. Percept. Psychophys. 16,143–149.
Eriksen, C. W., and Schultz, D. W.(1979). Information processing invisual search: a continuous flow con-ception and experimental results.Percept. Psychophys. 25, 249–263.
Eriksen,C. W.,and St James, J. D. (1986).Visual attention within and aroundthe field of focal attention: a zoomlens model. Percept. Psychophys. 40,225–240.
Gegenfurtner, K. R. (1992). PRAXIS:Brent’s algorithm for function min-imization. Behav. Res. MethodsInstrum. Comput. 24, 560–564.
Gratton, G., Coles, M. G., andDonchin, E. (1992). Optimiz-ing the use of information:strategic control of activation ofresponses. J. Exp. Psychol. Gen. 121,480–506.
Gratton, G., Coles, M. G. H., Sirevaag,E. J., Eriksen, C. W., and Donchin,E. (1988). Pre- and poststimulusactivation of response channels: apsychophysiological analysis. J. Exp.Psychol. Hum. Percept. Perform. 14,331–344.
Heitz, R. P., and Engle, R. W. (2007).Focusing the spotlight: individualdifferences in visual attention con-trol. J. Exp. Psychol. Gen. 136,217–240.
Hübner, R., Steinhauser, M., and Lehle,C. (2010). A dual-stage two-phasemodel of selective attention. Psychol.Rev. 117, 759–784.
Liu, Y. S., Holmes, P., and Cohen, J. D.(2008). A neural network model ofthe Eriksen task: reduction, analysis,and data fitting. Neural Comput. 20,345–373.
Liu, Y. S., Yu, A., and Holmes,P. (2009). Dynamical analysis ofBayesian inference models for theEriksen task. Neural Comput. 21,1520–1553.
Mayr, U., Awh, E., and Laurey, P.(2003). Conflict adaption effects inthe absence of executive control.Nat. Neurosci. 6, 450–452.
Posner, M. I. (1980). Orienting of atten-tion. Q. J. Exp. Psychol. 32, 3–25.
Posner, M. I., Snyder, C. R. R., andDavidson, B. J. (1980). Attentionand the detection of signals. J. Exp.Psychol. Gen. 109, 160–174.
Rabbitt, P. M. A. (1969). Psychologi-cal refractory delay and response-stimulus interval duration in serial,choice responses tasks. Acta Psychol.(Amst.) 30, 195–219.
Rabbitt, P. M. A. (1980). The effectsof S-R interval duration on ser-ial choice reaction time: preparationtime or response monitoring time?Ergonomics 23, 65–77.
Ratcliff, R. (1978). A theory of memoryretrieval. Psychol. Rev. 85, 59–108.
Ratcliff, R., and Smith, P. L. (2004). Acomparison of sequential samplingmodels for two-choice reaction time.Psychol. Rev. 111, 333–367.
Schwarz, G. (1978). Estimating thedimension of a model. Ann. Stat. 6,461–464.
Seibold, V. C., Bausenhart, K. M., Rolke,B., and Ulrich, R. (2011). Doestemporal preparation increase therate of sensory information accu-mulation? Acta Psychol. (Amst.) 137,56–64.
Soetens, E., Boer, L. C., and Hueting, J.E. (1985). Expectancy or automaticfacilitation? Separating sequentialeffects in two-choice reaction time. J.Exp. Psychol. Hum. Percept. Perform.11, 598–616.
Ulrich, R., and Miller, J. (1994). Effectsof truncation on reaction timeanalysis. J. Exp. Psychol. Gen. 123,34–80.
White, C. N., Brown, S., and Ratcliff, R.(2012). A test of Bayesian observermodels of processing in the Eriksen
flanker task. J. Exp. Psychol. Hum.Percept. Perform. 38, 489–497.
White, C. N., Ratcliff, R., and Starns, J.J. (2011). Diffusion models of theflanker task: discrete versus gradualattentional selection. Cogn. Psychol.63, 210–238.
Yu, A. J., Dayan, P., and Cohen, J.D. (2009). Dynamics of attentionalselection under conflict: toward arational Bayesian account. J. Exp.Psychol. Hum. Percept. Perform. 35,700–717.
Conflict of Interest Statement: Theauthors declare that the research wasconducted in the absence of any com-mercial or financial relationships thatcould be construed as a potential con-flict of interest.
Received: 20 June 2012; accepted: 02October 2012; published online: 26 Octo-ber 2012.Citation: Hübner R and Töbel L(2012) Does attentional selectivity inthe flanker task improve discretely orgradually? Front. Psychology 3:434. doi:10.3389/fpsyg.2012.00434This article was submitted to Frontiers inCognitive Science, a specialty of Frontiersin Psychology.Copyright © 2012 Hübner and Töbel.This is an open-access article distributedunder the terms of the Creative Com-mons Attribution License, which per-mits use, distribution and reproductionin other forums, provided the originalauthors and source are credited and sub-ject to any copyright notices concerningany third-party graphics etc.
www.frontiersin.org October 2012 | Volume 3 | Article 434 | 11
Related Documents