Does amygdalar perfusion correlate with antidepressant response to partial sleep deprivation in major depression? Camellia P. Clark * , Gregory G. Brown, Sarah L. Archibald, Christine Fennema-Notestine, Deborah R. Braun, Linda S. Thomas, Ashley N. Sutherland, and J. Christian Gillin Department of Psychiatry 9151B, San Diego V.A. Medical Center and University of California at San Diego, 9500 Gilman Drive, La Jolla, CA 92093, USA Abstract This study used functional MRI (fMRI) to clarify the sites of brain activity associated with the antidepressant effects of sleep deprivation (SD). We hypothesized: (1) baseline perfusion in right and left amygdalae will be greater in responders than in nonresponders; (2) following partial sleep deprivation (PSD), perfusion in responders’ right and left amygdalae would decrease. Seventeen unmedicated outpatients with current major depression and eight controls received perfusion- weighted fMRI and structural MRI at baseline and following 1 night of late-night PSD. Baseline bilateral amygdalar perfusion was greater in responders than nonresponders. Clusters involving both amygdalae decreased from baseline to PSD specifically in responders. Right amygdalar perfusion diverged with PSD, increasing in nonresponders and decreasing in responders. These novel amygdalar findings are consistent with the overarousal hypothesis of SD as well as other functional imaging studies showing increased baseline amygdalar activity in depression and decreased amygdalar activity with remission or antidepressant medications. Keywords Magnetic resonance imaging; functional; Depressive disorder; major 1. Introduction One night of total sleep deprivation (TSD) or partial sleep deprivation (PSD) produces temporary remission in 40–60% of patients with major depression (Wu and Bunney, 1990). Yet mechanisms of the antidepressant effects of sleep deprivation (SD), and explanations of why some individuals respond while others do not, remain unclear. Previous positron emission tomography (PET) and single photon emission computed tomography (SPECT) studies of SD report at least one area in which responders and nonresponders differ significantly at baseline, along with differential response patterns to SD in responders and nonresponders. In most cases, areas of differing baseline activity or unique change in responders were reported in ventral anterior cingulate, basal orbital, or medial frontal areas (Ebert et al., 1991, 1994; Wu et al., 1992, 1999; Volk et al., 1992). Similar PET findings in these areas have been linked with clinical response to antidepressant medications (Buchsbaum et al., 1997; Mayberg, 1997). More recent work has employed functional magnetic resonance imaging (fMRI) to examine these effects with superior spatial resolution (Clark et al., 2001; Clark et al., submitted for publication). We recently (Clark et al., submitted for publication) used fMRI to clarify the * Corresponding author. Tel.: +1 858 552 8585x2580; fax: +1 858 642 6393. E-mail address: [email protected] (C.P. Clark). NIH Public Access Author Manuscript Psychiatry Res. Author manuscript; available in PMC 2008 July 16. Published in final edited form as: Psychiatry Res. 2006 January 30; 146(1): 43–51. NIH-PA Author Manuscript NIH-PA Author Manuscript NIH-PA Author Manuscript

Welcome message from author
This document is posted to help you gain knowledge. Please leave a comment to let me know what you think about it! Share it to your friends and learn new things together.
Transcript

Does amygdalar perfusion correlate with antidepressant responseto partial sleep deprivation in major depression?
Camellia P. Clark*, Gregory G. Brown, Sarah L. Archibald, Christine Fennema-Notestine,Deborah R. Braun, Linda S. Thomas, Ashley N. Sutherland, and J. Christian GillinDepartment of Psychiatry 9151B, San Diego V.A. Medical Center and University of California at SanDiego, 9500 Gilman Drive, La Jolla, CA 92093, USA
AbstractThis study used functional MRI (fMRI) to clarify the sites of brain activity associated with theantidepressant effects of sleep deprivation (SD). We hypothesized: (1) baseline perfusion in rightand left amygdalae will be greater in responders than in nonresponders; (2) following partial sleepdeprivation (PSD), perfusion in responders’ right and left amygdalae would decrease. Seventeenunmedicated outpatients with current major depression and eight controls received perfusion-weighted fMRI and structural MRI at baseline and following 1 night of late-night PSD. Baselinebilateral amygdalar perfusion was greater in responders than nonresponders. Clusters involving bothamygdalae decreased from baseline to PSD specifically in responders. Right amygdalar perfusiondiverged with PSD, increasing in nonresponders and decreasing in responders. These novelamygdalar findings are consistent with the overarousal hypothesis of SD as well as other functionalimaging studies showing increased baseline amygdalar activity in depression and decreasedamygdalar activity with remission or antidepressant medications.
KeywordsMagnetic resonance imaging; functional; Depressive disorder; major
1. IntroductionOne night of total sleep deprivation (TSD) or partial sleep deprivation (PSD) producestemporary remission in 40–60% of patients with major depression (Wu and Bunney, 1990).Yet mechanisms of the antidepressant effects of sleep deprivation (SD), and explanations ofwhy some individuals respond while others do not, remain unclear. Previous positron emissiontomography (PET) and single photon emission computed tomography (SPECT) studies of SDreport at least one area in which responders and nonresponders differ significantly at baseline,along with differential response patterns to SD in responders and nonresponders. In most cases,areas of differing baseline activity or unique change in responders were reported in ventralanterior cingulate, basal orbital, or medial frontal areas (Ebert et al., 1991, 1994; Wu et al.,1992, 1999; Volk et al., 1992). Similar PET findings in these areas have been linked withclinical response to antidepressant medications (Buchsbaum et al., 1997; Mayberg, 1997).
More recent work has employed functional magnetic resonance imaging (fMRI) to examinethese effects with superior spatial resolution (Clark et al., 2001; Clark et al., submitted forpublication). We recently (Clark et al., submitted for publication) used fMRI to clarify the
* Corresponding author. Tel.: +1 858 552 8585x2580; fax: +1 858 642 6393. E-mail address: [email protected] (C.P. Clark).
NIH Public AccessAuthor ManuscriptPsychiatry Res. Author manuscript; available in PMC 2008 July 16.
Published in final edited form as:Psychiatry Res. 2006 January 30; 146(1): 43–51.
NIH
-PA Author Manuscript
NIH
-PA Author Manuscript
NIH
-PA Author Manuscript

exact medial frontal sites of brain activity associated with the antidepressant effects of SD inboth region of interest (ROI) and voxelwise analyses. Using an arterial spin labeling (ASL)based fMRI method, we found greater baseline left ventral anterior cingulate (LVAC) perfusionin responders than nonresponders and a reduction of LVAC perfusion with PSD specific to theresponder group. To test the anatomic specificity of these findings, we a priori divided theanterior cingulate and medial frontal cortex into dorsal, rostral, and ventral ROIs for eachhemisphere, using ROIs derived from the Talairach daemon.
The “overarousal” hypothesis postulates that depression is associated with a pathologicalincrease in physiologic arousal and that SD works by “de-arousing” depressed patients, or atleast those who respond clinically. Aside from behavioral observations (Szuba et al., 1991),subjective reports of increased energy level (Van Den Burg et al., 1992), and neuroendocrinestudies documenting increased hypothalamic–pituitary–adrenal (HPA) axis activity (Roy-Byrne et al., 1984), the main evidence for this theory comes from polysomnographic andfunctional neuroimaging data. Sleep abnormalities in depression, consistent with depressedpatients’ reports of disturbed and nonrestorative sleep, include prolonged sleep latency,reduced total sleep time and sleep efficiency, and decreased slow wave (“deep”) sleep as wellas increased REM sleep (Benca et al., 1992; Benca, 1996). Depressed patients have also beenreported to exhibit increased nocturnal core temperature, especially those who respond to SD(Elsenga and van den Hoofdakker, 1988).
Functional brain-imaging data have shown elevated baseline limbic activity in depressedpatients in wakefulness and sleep, with decreases in limbic activity in association with SD orother antidepressant treatments. Generally, reports of altered baseline limbic function in SDresponders have focused primarily on medial frontal areas, including our own findings in theleft ventral anterior cingulate area. Elevated baseline levels of limbic activity in depressedpatients, whether in SD studies (Ebert et al., 1991, 1994; Wu et al., 1992) or other paradigms(Bench et al., 1992; Mayberg et al., 1997), are consistent with the concept of increasedphysiologic arousal. The overarousal hypothesis is also consistent with decreases in limbicactivity in association with TSD (Ebert et al., 1991, 1994; Wu et al., 1992), PSD (Clark et al.,submitted for publication) or other anti-depressant treatments (Scott et al., 1994; Buchsbaumet al., 1997).
The present study investigates the role of the amygdala in response to PSD in depressedindividuals. Little has been reported about amygdalar function in connection with theantidepressant response to SD (Ebert et al., 1991; Wu and Gillin, 1992), and in our previousstudy we focused on the prefrontal cortex. However, increasing evidence suggests an importantrole for the amygdala in major depression (Whalen et al., 2002). Elevated resting baselineglucose metabolism has been reported in patients with major depression (Abercrombie et al.,1998; Drevets et al., 2002b). Treatment with antidepressant medications has been reported tomodify affective response (Sheline et al., 2001; Davidson et al., 2003; Fu et al., 2004) andresting amygdalar activity (Drevets et al., 2002a) in major depression. Based on theseobservations, as well as the overarousal hypothesis, we predicted increased baseline perfusionin both the left and right amygdalae among PSD responders with major depression. We alsohypothesized that perfusion in responders’ right and left amygdalae would decrease with SD.
2. Methods2.1. Subjects
Seventeen unmedicated outpatients with current major depression and eight controls receivedperfusion-weighted fMRI and structural MRI at baseline and following 1 night of late-nightPSD. To enter the study, depressed subjects (ages 18–55) had to meet full diagnostic criteriafor current DSM-IV major depressive disorder (unipolar) and to have a baseline 17-item
Clark et al. Page 2
Psychiatry Res. Author manuscript; available in PMC 2008 July 16.
NIH
-PA Author Manuscript
NIH
-PA Author Manuscript
NIH
-PA Author Manuscript

Hamilton Depression Rating Scale (HDRS-17) score of 16 or greater. Control subjects had nopsychiatric disorders and were matched groupwise for age, sex, handedness, education, andtobacco use. Exclusion criteria included other Axis I disorders; conditions that might beexacerbated by sleep deprivation (e.g., epilepsy or bipolar disorder); potential safetycontraindications to MRI (pacemakers, metal implants, pregnancy, lactation); irregular ordeviant sleep cycle or primary sleep disorders; active substance abuse or dependence; historyof alcohol or cocaine abuse or dependence; neurological problems or history of significanthead injury; significant circulatory conditions (including hypertension) that could affect thecerebral circulation; and recent use of medications or substances that could affect sleep pattern,EEG, and/or patterns of brain blood flow.
All subjects received the Structured Clinical Interview for DSM-IV (SCID) (First et al.,1996) as well as a thorough medical and laboratory evaluation as previously described (Clarket al., 1999). All subjects were physically healthy and medication free for at least 2 weeks atthe time of the study. (No patient took fluoxetine during the 2 months before to the study.) Allsubjects signed consent forms approved by the UCSD Human Research Protections Program.
2.2. General procedures2.2.1. General study procedures—All subjects were required to keep and document (bycompleting sleep diaries) regular retiring and arising times for 5 nights preceding the study.Subjects spent an adaptation night, a baseline night, and a night of PSD in the sleep laboratory,with standard montage and scoring (Clark et al., 1999). On the PSD night, subjects had toremain awake beginning at 3 a.m. During SD subjects remained within constant visualsupervision of study personnel and wore wrist activity and light meters (Sleep Watch) (Sadehet al., 1994) to document wakefulness. Subjects also were required to fill out the StanfordSleepiness Scale every 15 min (Hoddes et al., 1973).
The baseline and PSD polysomnography/fMRI blocks were performed in randomizedcounterbalanced order. Structural and perfusion MRI were performed on all subjects atapproximately noon on baseline and sleep-deprived days. Mood ratings, including theHDRS-17, were administered on baseline and sleep-deprived days at 8 a.m. and before andafter each scanning session.
Clinical response was measured by the decrease in the modified HDRS-17 (HDRS-17-Mod)(i.e., omitting the sleep and weight loss items) from baseline to the lowest score following PSD.Responders were defined by a decrease of 40% or greater in the HDRS-17-Mod (Wu et al.,1999).
2.2.2. fMRI procedures—All subjects were scanned on a General Electric Signa 1.5 Tscanner, using a standard head coil. Subjects were instructed to relax but remain awake andmotionless throughout the scans; they were fitted with soft earplugs and positioned carefullyin the head coil with comfortable supports and cushions. To verify that subjects remained awakeduring scans, subjects were asked to keep their eyes open and to apply continuous gentle tonicpressure to a soft rubber bulb connected to a pressure transducer and computer monitor.
Structural scans were performed using the following T1-weighted SPGR sequence: TR: 20 ms,TE: minimum full, flip angle: 30°, FOV: 250 mm, NEX: 1, with 124 sagittal slices 1.5 mmthick and in-plane resolution of 0.9765×0.9765 mm.
Perfusion-weighted axial images were obtained using a spiral imaging (Li et al., 1999)refinement of the QUIPSS II pulsed arterial spin labeling (Wong et al., 1997, 1998b) sequencedeveloped at UCSD. Arterial spin labeling techniques such as the fMRI pulse sequencedescribed can be thought of as similar to diffusible tracer imaging techniques (e.g., H2
15O-
Clark et al. Page 3
Psychiatry Res. Author manuscript; available in PMC 2008 July 16.
NIH
-PA Author Manuscript
NIH
-PA Author Manuscript
NIH
-PA Author Manuscript

PET), with “tagged” blood (e.g., blood that has been magnetically inverted proximal to theimaging region) as the “tracer”. Because of this endogenous contrast, no injections (e.g.,gadolinium) are needed. The actual measured perfusion signal is the difference betweenmeasured tagged and untagged (control) signal intensity in the slice(s) of interest (Wong et al.,1997, 1998b; Clark et al., 2001). Because the spiral protocol is technically a series of fast singleslices tagged individually, it avoids many potential problems with quantitation. Two slabs ofnine 7-mm-thick axial slices (in-plane resolution of 1.875 mm by 1.875 mm) were obtained,covering the entire cerebrum, with the following parameters: TR: 3500 ms, TE: minimum; TI1:700 ms; TI2: 1400 ms; flip angle: 90°, FOV: 240 mm, 100 repetitions.
2.2.3. Processing and analysis—Data were analyzed using Analysis of FunctionalNeuroimages (AFNI) 2.56 g (Cox, 1996). Images were bias-corrected with a nonparametric,nonuniform intensity normalization algorithm commonly referred to by its acronym as N3(Sled et al., 1998). Preliminary skull stripping was performed with a Hybrid Watershedalgorithm developed to be conservatively sensitive to the inclusion of brain (Dale et al.,1999; Segonne et al., 2004). This method uses a watershed algorithm to find local optima ofimage intensity gradients to segment images into connected components (Hahn and Peitgen,2000). A deformable surface model is then used to find the boundary of the brain. Remainingnon-brain tissue was removed with AFNI 3dIntracranial iteratively (with varying minimumsignal intensity values) and manual editing where required. The 3dIntracranial routine fits athree-compartment Gaussian mixture mode to the gray scale intensity histogram to initiallyclassify voxels into gray matter, white matter, and cerebrospinal fluid compartments. This stepis followed by a series of steps that use global geometric constraints and neighborhoodconnectivity rules to arrive at a cohesive intracranial volume. The strategy of using twoautomated skull stripping programs that involve quite different segmentation algorithms oftenproduces a more satisfactory intracranial volume than using these routines singularly(Fennema-Notestine et al., 2005).
Brains were segmented into gray, white, and cerebrospinal fluid compartments by fitting athree-compartment Gaussian mixture model to the intensity histogram with TriComp (Bondiet al., 2005). Resulting gray matter masks were transformed into Talairach space (Talairachand Tournoux, 1988) to create standardized yet individualized masks for perfusion data.
Perfusion images were coregistered to the 50th repetition (to minimize movement artifact).Next, for each repetition, images of the running difference between tagged and nontaggedimages were calculated and made into 4D (three spatial, one temporal) data sets using a scriptwritten by Eric Wong, M.D., Ph.D. For this pulse sequence, the difference between tagged andcontrol images is directly proportional to brain blood flow in ml blood/ml tissue/minute units(Wong et al., 1997, 1998a; Clark et al., 2001) and is expressed in MR signal intensity units.At this point, spurious negative values were omitted for each repetition and each voxel. Thefirst three repetitions and outlier repetitions were omitted for each voxel; the remainingrepetitions were averaged. Thus, perfusion was calculated as mean perfusion-weighted signalaveraged over each voxel.
We performed ROI-based analyses for right and left amygdalae blindly with respect todiagnosis and condition. Amygdala ROIs were produced on the AC-PC aligned tissuesegmented gray matter mask produced by TriComp’s gray–white matter differentiationdescribed above. Thus, anatomical designation required only the separation of amygdalar graymatter from other gray matter regions that were both contiguous and adjacent to the amygdalasuch as the superior boundary of the hippocampus. For example, the collateral sulcus was usedas part of the inferolateral boundary of the amygdala. In addition to the gray matter mask, theregistered T1-weighted image was used for anatomic reference (Fig. 1). The most posteriorboundary of the amygdala was defined as the first slice in which the mammillary bodies were
Clark et al. Page 4
Psychiatry Res. Author manuscript; available in PMC 2008 July 16.
NIH
-PA Author Manuscript
NIH
-PA Author Manuscript
NIH
-PA Author Manuscript

clearly visible. The most anterior slice on which the amygdala was designated was the slice inwhich the long columns of the fornix were most fully volumed. Reliability and boundarycriteria were developed in conjunction with two experienced morphometrists (SLA, CFN).Reliability was established by one operator (CPC) performing the ROI analysis blindly on twobrains 1 week apart and then analyzing the number of 1 mm3 voxel counts for each ROI. Theaverage intrarater reliability was 89%; for both amygdalae on both brains, there was an averageof 89% agreement for amygdalar volumes between both analyses (Jernigan et al., 2001).
For ROI analyses, we compared baseline right and left amygdalar perfusion betweenresponders, nonresponders, and controls using a one-way analysis of variance (ANOVA).Because we were mainly interested in differences between responders and nonresponders, weused the multivariate model to perform a repeated measures analysis of variance (MANOVA)with condition (baseline vs. PSD) and hemisphere as within-group factors and response(responder vs. nonresponder) as the between-group factor. To test our a priori hypotheses thatresponders would show a greater change in amygdala perfusion than nonresponders, weperformed one-tailed independent-group t-tests on change scores (baseline perfusion minussleep-deprived perfusion) separately for right and left amygdalae.
For voxelwise analyses, we used within-sample or between-sample t-tests to test for the effectof PSD (Friston et al., 1994). We used a cluster threshold method to protect against Type Ierror (Forman et al., 1995). Our cluster threshold required a connectivity radius of 2.66 mm(e.g., the in-plane pixel length multiplied by the square root of 2), which identified face-to-face or edge-to-edge voxels as connected, and a minimum volume of 443 mm3 (18 voxels,based on Monte Carlo simulations). Perfusion data for individual scans were spatiallysmoothed with a Gaussian kernel of 3.75 mm (e.g., twice the in-plane pixel length).
3. ResultsSeventeen patients (male/female 5/12; 42.8±9.5 years) and eight controls (male/female 4/4;35.0±9.5 years) participated in the study. Patients and controls did not differ significantly ondemographic measures. Responders (n =5) and nonresponders (n =12) did not differ on age,gender, or ethnicity. However, responders had significantly more years of education thannonresponders (t =10.6, df =1, P =0.000, between-groups t-test, 2-tailed). Interestingly, all fiveof the responders reported 16 years of education (see Table 1).
Baseline HDRS-17 and HDRS-17-Mod did not differ between responders (e.g., patients witha decrease of at least 40% in the HDRS-17-Mod with PSD) and nonresponders. However,HDRS-17-Mod diverged with PSD (see Table 2). A group by time analysis of variance betweenthese two groups and conditions revealed a significant interaction effect (F =11.0, df =1,15,P =0.005, η2=0.42, Table 2). Five of the seventeen patients were responders, e.g., patientswhose HDRS-17-Mod decreased by 40% or more from baseline to PSD.
3.1. ROI analyses3.1.1. Baseline perfusion—In the one-way ANOVA, the group effect was significant forright amygdala (F =7.5, df =2,24, P =0.003); follow-up t-tests indicated that mean rightamygdala perfusion was greater in responders than in either nonresponders (P =0.03) orcontrols (P =0.028) (Bonferroni correction). There was no significant group effect for leftamygdala. However, in direct comparisons of responders with nonresponders, baselineperfusion was significantly greater in responders in the left (t =2.2, df =15, P < 0.048, η2=0.24)and also in the right (t =4.3, df =15, P < 0.001, η2=0.54) amygdala (Table 3).
3.1.2. Sleep deprivation—In the condition by hemisphere by group (responder vs.nonresponder) repeated-measures MAN-OVA, there were no significant interaction effects or
Clark et al. Page 5
Psychiatry Res. Author manuscript; available in PMC 2008 July 16.
NIH
-PA Author Manuscript
NIH
-PA Author Manuscript
NIH
-PA Author Manuscript

significant effects for the sleep deprivation condition. However, the main effect for hemispherewas greater on the left than the right regardless of group or condition (F =22.37, df =1,15, P <0.001). Moreover, the group effect was significant (F =11.71, df =1,15, P =0.003), withresponders experiencing greater perfusion on both baseline and sleep-deprived days thannonresponders.
When directly compared, right amygdala change scores (calculated as baseline minus sleep-deprived perfusion) were significantly different between non-responders and responders (t=2.3, df =15, P < 0.033, η2=0.19, between-groups t-test, 2-tailed). In examinations of rightamygdala perfusion means, responders appeared to decrease, whereas nonrespondersincreased. The nonresponders’ right amygdala perfusion significantly increased with PSD (t=− 2.6, df =11, P < 0.023, η2=0.38) and carried a similar trend (t =− 1.8, df =16, P < 0.098) inthe major depression group as a whole (within-group t-test, 2-tailed). The left amygdala didnot show any significant change between baseline and PSD conditions for any subject group.
3.2. Voxelwise analyses3.2.1. Baseline—Cluster threshold adjusted t-test maps revealed small areas including theright amygdala in which responders’ perfusion was greater than that of nonresponders. Nosignificant difference between responders and nonresponders was apparent in the leftamygdala.
3.2.2. Sleep deprivation—Cluster threshold adjusted t-test maps revealed clustersinvolving both amygdalae (more pronounced on the right), which also showed a significantdecrease from baseline to PSD specifically in responders (Fig. 2). Nonresponders and controlsshowed virtually no clusters in which perfusion changed significantly from baseline to PSD.
4. DiscussionOur most important findings from this study include greater baseline amygdalar perfusion inresponders than nonresponders and differential amygdalar perfusion changes with SD betweenresponders and nonresponders. Increased baseline perfusion in responders was apparentbilaterally in ROI analysis on between-group t-tests; however, only the stronger right amygdaladifference was evident on voxelwise analysis. The MAN-OVA indicated that the largerperfusion values for the responders were maintained at follow-up. In response to PSD,responders showed clusters of significantly decreased perfusion in both amygdalae, althoughneither amygdala significantly changed based on ROI analysis. On the other hand,nonresponders significantly increased right amygdalar perfusion with PSD when ROI datawere examined. Because of the relatively small subject numbers, particularly for responders,we examined Tukey’s box plots (Tukey, 1977) of all amygdalar ROI variables to verify thatbetween-and within-group differences were not spurious results caused by statistical outliers.
A review of previous imaging studies of sleep in depression revealed higher left amygdalarelative glucose metabolism in patients with major depression than healthy controls in wakingand non-REM sleep (Nofzinger, 2004). In addition, the increase in glucose metabolism fromwaking to REM sleep was more pronounced in depressed patients than controls in a widespreadarea including left amygdala (Nofzinger et al., 1997). Taken together with reports of increasedREM sleep in depression (Benca et al., 1992), these may contribute to greater wakingamygdalar perfusion in some depressed patients.
Elevated baseline amygdalar perfusion in responders, like increased baseline activity elsewherein the limbic system, is consistent with the overarousal hypothesis of SD (Gillin et al., 1995).In addition, our amygdalar findings may be related to the effects of depression itself on theamygdala. Drevets et al. (2002b) found increased left amygdalar glucose metabolic rate
Clark et al. Page 6
Psychiatry Res. Author manuscript; available in PMC 2008 July 16.
NIH
-PA Author Manuscript
NIH
-PA Author Manuscript
NIH
-PA Author Manuscript

(compared with normal controls) in bipolar depressed patients and in unipolar major depressionpatients with positive family histories. They also reported positive correlations between leftamygdalar glucose metabolic rate and stressed plasma cortisol levels in unmedicated patientswith unipolar depression. In another study of unmedicated patients with major depression, rightamygdalar metabolism correlated positively with the intensity of negative affect (Abercrombieet al., 1998).
Clusters in which responders’ perfusion significantly decreased with PSD in both amygdalaeare consistent with the concept that SD “de-arouses” responders, as evidenced by decreasedactivity in other parts of the limbic system as well. Based on effect sizes, a larger group ofresponders may be needed to see a significant perfusion decrease in ROI analyses. It is alsointeresting that nonresponders, at least in ROI statistics, responded in the opposite way, witha significant between-group difference in right amygdala change score driven by thenonresponder group’s significant increase in amygdalar perfusion. This is consistent withprevious functional imaging data (Wu et al., 1999; Gillin et al., 2001) suggesting thatresponders and nonresponders represent two distinct groups of depressed patients.
Other studies report decreasing left amygdalar activity with remission in patients with majordepression. The increased left amygdalar response to masked, especially fearful, faces (ascompared with controls) resolves with antidepressant medications (Sheline et al., 2001). Inanother fMRI study, the left amygdalar response to viewing sad faces diminished withantidepressant medication (Fu et al., 2004). Finally, in bipolar patients experiencing a majordepressive episode, resting left amygdala CBF decreased with remission in patients takingmood stabilizers, but it remained elevated in those not on mood stabilizers (Drevets et al.,2002a). Despite the focus of these findings on the left amygdala, the variability in the lateralityof amygdalar findings in normal controls (Phillips et al., 2001; Baas et al., 2004), as well as inmajor depression, its treatment, and remission (Abercrombie et al., 1998; Drevets et al.,2002b), precludes definitive conclusions about lateralized amygdalar perfusion in depression.
Our amygdalar findings are interesting in light of previous SD studies. In their initial PETstudy, Wu et al. (1992) reported greater bilateral amygdalar baseline metabolism, with nochange in amygdalar metabolism with TSD in any group. However, a subsequent article (Wuet al., 1999) utilizing additional subjects did not report significant amygdalar findings. MostPET and SPECT studies of SD in depression that reported any temporal lobe findings (Ebertet al., 1991; Volk et al., 1992; Kaendler et al., 1993), involved template-based ROIs or manuallyplaced rectangular ROIs in predefined levels axially. In some cases (Volk et al., 1992; Kaendleret al., 1993), these ROIs did not permit any conclusions at all specific to amygdalar function.Ebert et al. (1991) found greater baseline infratemporal hexamethylpropyleneamine oxime(HMPAO) activity bilaterally in responders than nonresponders, with responders uniquelyshowing decreased bilateral infratemporal HMPAO activity after TSD. They reported an areaof greater baseline activity in responders than controls in an area including right amygdala andportions of hippocampus and parahippocampus. In the responder group only, HMPAO activitydecreased after TSD in the right amygdala/hippocampal/parahippocampal area.
It is possible that the relative paucity of significant amygdalar findings in SD studies ofdepression reflect spatial resolution limitations of PET and SPECT and/or different ROIimplementation methods, none of which utilized hand tracing based on structural MRI data.
We also considered whether differences in imaging conditions might explain why ouramygdalar findings have not previously been reported. However, previous studies of theantidepressant response to SD have imaged subjects during resting conditions (e.g., eyes closedor looking at a white screen in a quiet room) (Ebert et al., 1991; Volk et al., 1992) or performinga visual version of the Continuous Performance Task (Wu et al., 1992; Clark et al., 1998). In
Clark et al. Page 7
Psychiatry Res. Author manuscript; available in PMC 2008 July 16.
NIH
-PA Author Manuscript
NIH
-PA Author Manuscript
NIH
-PA Author Manuscript

our study, subjects were imaged while applying gentle tonic pressure to a soft rubber bulbconnected to a pressure transducer and computer monitor. (Continuous visualization of thecomputer monitor during scanning allowed us to verify that subjects maintained wakefulnessat this time.) None of these conditions would be considered affective tasks in any way.
In summary, our findings are consistent with the overarousal hypothesis of depression and withthe amygdala’s key role in major depression (Whalen et al., 2002). Interestingly, our amygdalarfindings of increased baseline bilateral perfusion in responders (by ROI and voxelwiseanalyses) parallel our left ventral anterior cingulate findings (Clark et al., submitted forpublication).
Further study, perhaps using an emotional “challenge” such as presentation of affective stimuliin baseline and sleep-deprived conditions, will be necessary to delineate the relationshipbetween the amygdala’s role in depression and its activity in association with the antidepressantresponse to SD.
Acknowledgements
This work was supported by 5 K08 MH01642, M01RR00827, and the VISN 22 Mental Illness, Research, Educationand Clinical Center. We thank Lesley Wetherell, Anna Demodena, and Dexter Walpole for their help in conductingthis study.
ReferencesAbercrombie HC, Schaefer SM, Larson CL, Oakes TR, Lindgren KA, Holden JE, Perlman SB, Turski
PA, Krahn DD, Benca RM, Davidson RJ. Metabolic rate in the right amygdala predicts negative affectin depressed patients. NeuroReport 1998;9:3301–3307. [PubMed: 9831467]
Baas D, Aleman A, Kahn RS. Lateralization of amygdala activation: a systematic review of functionalneuroimaging studies. Brain Research Reviews 2004;45:96–103. [PubMed: 15145620]
Benca RM. Sleep in psychiatric disorders. Neurologic Clinics 1996;14:739–764. [PubMed: 8923493]Benca RM, Obermeyer WH, Thisted RA, Gillin JC. Sleep and psychiatric disorders: a meta-analysis.
Archives of General Psychiatry 1992;49:651–668. [PubMed: 1386215]Bench CJ, Friston KJ, Brown RG, Scott LC, Frackowiak RSJ, Dolan RJ. The anatomy of melancholia—
focal abnormalities of cerebral blood flow in major depression. Psychological Medicine 1992;22:607–615. [PubMed: 1410086]
Bondi MW, Houston WS, Eyler LT, Brown GG. fMRI evidence of compensatory mechanisms in olderadults at genetic risk for Alzheimer’s disease. Neurology 2005;64:501–508. [PubMed: 15699382]
Buchsbaum MS, Wu JC, Siegel BW, Hackett E, Trenary M, Abel L, Reynolds C. Effect of sertraline onregional metabolic rate in patients with affective disorders. Biological Psychiatry 1997;41:15–22.[PubMed: 8988791]
Clark C, Dupont R, Lehr P, Yeung D, Halpern S, Golshan S, Gillin JC. Is there a relationship betweendelta sleep at night and afternoon cerebral blood flow, assessed by HMPAO-SPECT, in depressedpatients and normal controls? Preliminary data. Psychiatry Research: Neuroimaging 1998;84:89–99.
Clark CP, Gillin JC, Golshan S, Demodena A, Smith TL, Danowski S, Irwin M, Schuckit M.Polysomnography and depressive symptoms in primary alcoholics with and without a lifetimediagnosis of secondary depression and in patients with primary major depression. Journal of AffectiveDisorders 1999;52:177–185. [PubMed: 10357031]
Clark CP, Frank LR, Brown GG. Sleep deprivation, EEG, and functional MRI in depression: preliminaryresults. Neuropsychopharmacology 2001;25:S79–S84. [PubMed: 11682279]
Clark CP, Brown GG, Frank L, Thomas L, Sutherland AN, Gillin JC. Improved anatomic delineation ofthe antidepressant response to partial sleep deprivation in medial frontal cortex using perfusion-weighted functional MRI. Psychiatric Research: Neuroimaging. submitted for publication
Cox R. AFNI: Software for analysis and visualization of functional magnetic resonance neuroimages.Computers and Biomedical Research 1996;29:162–173. [PubMed: 8812068]
Clark et al. Page 8
Psychiatry Res. Author manuscript; available in PMC 2008 July 16.
NIH
-PA Author Manuscript
NIH
-PA Author Manuscript
NIH
-PA Author Manuscript

Dale AM, Fischl B, Sereno MI. Cortical surface-based analysis: I. Segmentation and surfacereconstruction. NeuroImage 1999;9:179–194. [PubMed: 9931268]
Davidson RJ, Irwin W, Anderle MJ, Kalin NH. The neural substrates of affective processing in depressedpatients treated with venlafaxine. American Journal of Psychiatry 2003;160:64–75. [PubMed:12505803]
Drevets WC, Bogers W, Raichle ME. Functional anatomical correlates of antidepressant drug treatmentassessed using PET measures of regional glucose metabolism. European Neuropsychopharmacology2002a;12:527–544. [PubMed: 12468016]
Drevets WC, Price JL, Bardgett ME, Reich T, Todd RD, Raichle ME. Glucose metabolism in theamygdala in depression: relationship to diagnostic subtype and plasma cortisol levels. Pharmacology,Biochemistry and Behavior 2002b;71:431–447.
Ebert D, Feistel H, Barocka A. Effects of sleep deprivation on the limbic system and the frontal lobes inaffective disorders: a study with Tc-99m-HMPAO SPECT. Psychiatry Research: Neuroimaging1991;40:247–251.
Ebert D, Feistel H, Barocka A, Kaschka W. Increased limbic blood flow and total sleep deprivation inmajor depression with melancholia. Psychiatry Research: Neuroimaging 1994;55:101–109.
Elsenga S, van den Hoofdakker R. Body core temperature and depression during total sleep deprivationin depressives. Biological Psychiatry 1988;24:531–540. [PubMed: 3167142]
Fennema-Notestine C, Ozyurt I, Clark CP, Morris S, Bischoff-Grethe A, Bondi MW, Jernigan TL, FischlB, Segonne F, Shattuck DW, Leahy RM, Rex DE, Toga AW, Zou KH, Morphometry BIRN, BrownGG. Quantitative evaluation of automated skull-stripping methods applied to contemporary andlegacy images: effects of diagnosis, bias correction, and slice location. Human Brain Mapping.2005June 28 [Electronic publication ahead of print]
First, MB.; Spitzer, RL.; Williams, JBW. Structured Clinical Interview for DSM-IVAxis I Disorders-Patient Edition (SCID-I/P, Version 2.0). Biometrics Research Department, New York StatePsychiatric Institute; New York, NY: 1996.
Forman SD, Cohen JD, Fitzgerald M, Eddy WF, Mintun MA, Noll DC. Improved assessment ofsignificant activation in functional magnetic resonance imaging (fMRI): use of cluster-size threshold.Magnetic Resonance in Medicine 1995;33:636–647. [PubMed: 7596267]
Friston KJ, Jezzard P, Turner R. Analysis of fMRI time-series. Human Brain Mapping 1994;1:153–171.Fu CH, Williams SC, Cleare AJ, Brammer MJ, Walsh ND, Kim J, Andrew CM, Pich EM, Williams PM,
Reed LJ, Mitterschiffthaler MT, Suckling J, Bullmore ET. Attenuation of the neural response to sadfaces in major depression by antidepressant treatment: a prospective, event-related functionalmagnetic resonance imaging study. Archives of General Psychiatry 2004;61:877–889. [PubMed:15351766]
Gillin JC, Ho AP, Buchsbaum MS, Wu J, Abel L, Bunney WE Jr. Functional brain imaging, sleep, andsleep deprivation: contributions to the “overarousal” hypothesis of depression. ActaNeuropsychiatrica 1995;7:33–34.
Gillin JC, Buchsbaum M, Wu J, Clark C, Bunney W Jr. Sleep deprivation as a model experimentalantidepressant treatment: findings from functional brain imaging. Depression and Anxiety2001;14:37–49. [PubMed: 11568981]
Hahn H, Peitgen HO. The skull stripping problem in MRI solved by a single 3D watershed transform.Paper presented at the Proceedings of the MICCAI, LNCS 2000;1935:134–143.
Hoddes E, Zarcone V, Smyth H. Quantification of sleepiness: a new approach. Psychophysiology1973;10:431–436. [PubMed: 4719486]
Jernigan TL, Archibald SL, Fennema-Notestine C, Gamst AC, Stout JC, Bonner J, Hesselink JR. Effectsof age on tissues and regions of the cerebrum and cerebellum. Neurobiology of Aging 2001;22:581–594. [PubMed: 11445259]
Kaendler, SH.; Volk, S.; Maul, FD.; Weber, R.; Georgi, K.; Hertel, A.; Pflug, B.; Hor, G. Evaluation ofTotal Sleep Deprivation by Single Photon Emission Computerized Tomography. Maurer, K., editor.Springer-Verlag; Berlin: 1993. p. 115-120.
Li, T-Q.; Takahashi, A.; Moseley, ME.; Glover, GH. A single-shot dual-echo spiral FAIR sequence forsimultaneous measurements of CBF and oxygenation in fMRI. Paper presented at the InternationalSociety for Magnetic Resonance in Medicine, 1731; 1999.
Clark et al. Page 9
Psychiatry Res. Author manuscript; available in PMC 2008 July 16.
NIH
-PA Author Manuscript
NIH
-PA Author Manuscript
NIH
-PA Author Manuscript

Mayberg HS. Limbic-cortical dysregulation: a proposed model of depression. Journal of Neuropsychiatry1997;9:1–11.
Mayberg HS, Brannan SK, Mahurin RK, Jerabek PA, Brickman JS, Tekell JL, Silva A, McGinnis S,Glass TG, Martin CC, Fox PT. Cingulate function in depression: a potential predictor of treatmentresponse. NeuroReport 1997;8:1057–1061. [PubMed: 9141092]
Nofzinger EA. What can neuroimaging findings tell us about sleep disorders? Sleep Medicine 2004;5(Supplement 1):S16–S22. [PubMed: 15301993]
Nofzinger EA, Mintun MA, Wiseman MB, Kupfer DJ, Moore RY. Forebrain activation in REM sleep:an FDG PET study. Brain Research 1997;770:192–201. [PubMed: 9372219]
Phillips ML, Medford N, Young AW, Williams L, Williams SC, Bullmore ET, Gray JA, Brammer MJ.Time courses of left and right amygdalar responses to fearful facial expressions. Human BrainMapping 2001;12:193–202. [PubMed: 11241871]
Roy-Byrne, PG.; Uhde, TW.; Post, RM. Antidepressant Effects of One Night’s Sleep Deprivation:Clinical and Theoretical Implications. Post, RM.; Ballenger, J., editors. William and Wilkins;Baltimore: 1984. p. 817-835.
Sadeh A, Sharkey K, Carskadon M. Activity-based sleep–wake identification: an empirical test ofmethodological issues. Sleep 1994;17:201–207. [PubMed: 7939118]
Scott AIF, Dougall N, Ross M, O’Carroll RE, Riddle W, Ebmeier KP, Goodwin GM. Short-term effectsof electroconvulsive treatment on the uptake of 99mTc-exametazime into brain in major depressionshown with single photon emission tomography. Journal of Affective Disorders 1994;30:27–34.[PubMed: 8151046]
Segonne F, Dale AM, Busa E, Glessner M, Salat D, Hahn HK, Fischl B. A hybrid approach to the skullstripping problem in MRI. NeuroImage 2004;22:1060–1075. [PubMed: 15219578]
Sheline YI, Barch DM, Donnelly JM, Ollinger JM, Snyder AZ, Mintun MA. Increased amygdala responseto masked emotional faces in depressed subjects resolves with anti-depressant treatment: an fMRIstudy. Biological Psychiatry 2001;50:651–658. [PubMed: 11704071]
Sled JG, Zijdenbos AP, Evans AC. A nonparametric method for automatic correction of intensitynonuniformity in MRI data. IEEE Transactions on Medical Imaging 1998;17:87–97. [PubMed:9617910]
Szuba MP, Baxter LR Jr, Fairbanks LA, Guze BH, Schwartz JM. Effects of partial sleep deprivation onthe diurnal variation of mood and motor activity in major depression. Biological Psychiatry1991;30:817–829. [PubMed: 1751624]
Talairach, J.; Tournoux, P. Co-Planar Stereotaxic Atlas of the Human Brain. Thieme Medical Publishers;New York: 1988.
Tukey, JW. Exploratory Data Analysis. Addison-Wesley; Reading, MA: 1977.Van Den Burg W, Beersma DGM, Bouhuys AL, Van Den Hoofdakker RH. Self-rated arousal concurrent
with the antidepressant response to total sleep deprivation of patients with a major depressivedisorder: a disinhibition hypothesis. Journal of Sleep Research 1992;1:211–222. [PubMed:10607054]
Volk S, Kaendler SH, Weber R, Georgi K, Maul F, Hertel A, Pflug B, Hoer G. Evaluation of the effectsof total sleep deprivation on cerebral blood flow using single photon emission computerizedtomography. Acta Psychiatrica Scandinavica 1992;86:478–483. [PubMed: 1471542]
Whalen PJ, Shin LM, Somerville LH, McLean AA, Kim H. Functional neuroimaging studies of theamygdala in depression. Seminars in Clinical Neuropsychiatry 2002;7:234–242. [PubMed:12382206]
Wong EC, Buxton RB, Frank LR. Implementation of quantitative perfusion imaging techniques forfunctional brain mapping using pulsed arterial spin labeling. NMR in Biomedicine 1997;10:237–249. [PubMed: 9430354]
Wong EC, Buxton RB, Frank LR. A theoretical and experimental comparison of continuous and pulsedarterial spin labeling techniques for quantitative perfusion imaging. Magnetic Resonance in Medicine1998a;40:348–355. [PubMed: 9727936]
Wong EC, Buxton RB, Frank LR. Quantitative imaging of perfusion using a single subtraction (QUIPSSand QUIPSS II). Magnetic Resonance in Medicine 1998b;39:702–708. [PubMed: 9581600]
Clark et al. Page 10
Psychiatry Res. Author manuscript; available in PMC 2008 July 16.
NIH
-PA Author Manuscript
NIH
-PA Author Manuscript
NIH
-PA Author Manuscript

Wu J, Buchsbaum MS, Gillin JC, Tang C, Cadwell S, Keator D, Fallon JH, Wiegand M, Najafi A, KleinE, Hazen K, Bunney WE Jr. Prediction of antidepressant effects of sleep deprivation by metabolicrates in the ventral anterior cingulate and medial prefrontal cortex. American Journal of Psychiatry1999;156:1149–1158. [PubMed: 10450253]
Wu JC, Bunney WE Jr. The biological basis of an antidepressant response to sleep deprivation and relapse:review and hypothesis. American Journal of Psychiatry 1990;147:14–21. [PubMed: 2403471]
Wu JC, Gillin JC. Elevated cingulate cortex in subtype of depression which improves with sleepdeprivation. Sleep Research 1992;21:326.
Wu JC, Gillin JC, Buchsbaum MS, Hershey T, Johnson JC, Bunney WE Jr. Effect of sleep deprivationon brain metabolism of depressed patients. American Journal of Psychiatry 1992;149:538–543.[PubMed: 1554042]
Clark et al. Page 11
Psychiatry Res. Author manuscript; available in PMC 2008 July 16.
NIH
-PA Author Manuscript
NIH
-PA Author Manuscript
NIH
-PA Author Manuscript
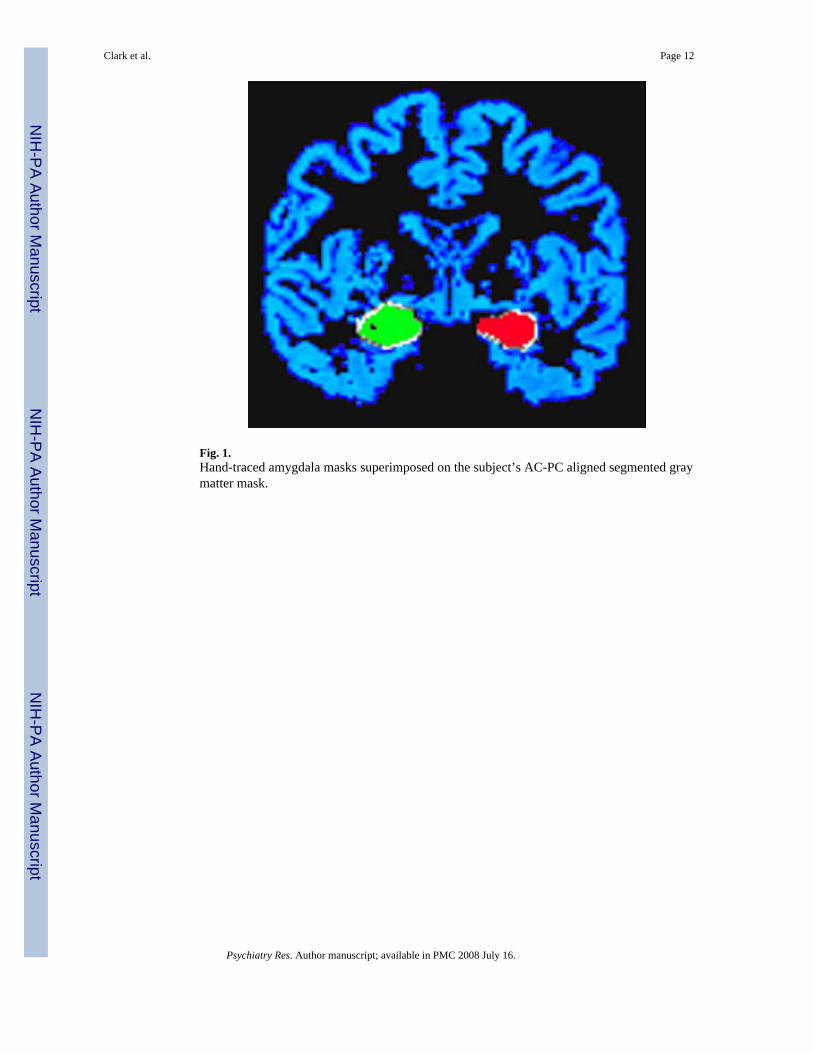
Fig. 1.Hand-traced amygdala masks superimposed on the subject’s AC-PC aligned segmented graymatter mask.
Clark et al. Page 12
Psychiatry Res. Author manuscript; available in PMC 2008 July 16.
NIH
-PA Author Manuscript
NIH
-PA Author Manuscript
NIH
-PA Author Manuscript

Fig. 2.Areas including amygdalae in which responders’ perfusion decreased from baseline to sleep-deprived scans.
Clark et al. Page 13
Psychiatry Res. Author manuscript; available in PMC 2008 July 16.
NIH
-PA Author Manuscript
NIH
-PA Author Manuscript
NIH
-PA Author Manuscript

NIH
-PA Author Manuscript
NIH
-PA Author Manuscript
NIH
-PA Author Manuscript
Clark et al. Page 14
Table 1Demographic measures (percent or mean±S.D.)
Patients (n =17) Responders (n =5) Nonresponders (n =12) Controls (n =8)
Female 70.6% 60.0% 75.0% 50%Caucasian 70.6% 80.0% 66.7% 75%Age 42.4±9.5 43.4±6.1 42.0±10.8 35.0±9.5Years of education 14.3±1.3 16.0±0.0* 13.6±0.8* 15.1±1.3
Responders are defined by having a decrease in the modified 17-item Hamilton Depression Rating Scale of at least 40% with sleep deprivation.
*t =10.6, df =11, P =0.000 (between-groups t-test, 2-tailed).
Psychiatry Res. Author manuscript; available in PMC 2008 July 16.

NIH
-PA Author Manuscript
NIH
-PA Author Manuscript
NIH
-PA Author Manuscript
Clark et al. Page 15
Table 2Modified Hamilton scoresa (mean±S.D.)
Baseline Sleep-deprived
Responders (5) 16.6±1.5 8.0±2.5Nonresponders (12) 15.3±4.8 12.9±3.7
Responders are defined by having a decrease in the modified 17-item Hamilton Depression Rating Scale of at least 40% with sleep deprivation.
a17-item Hamilton Depression Rating Scale omitting sleep and weight loss items.
Psychiatry Res. Author manuscript; available in PMC 2008 July 16.

NIH
-PA Author Manuscript
NIH
-PA Author Manuscript
NIH
-PA Author Manuscript
Clark et al. Page 16Ta
ble
3A
myg
dala
per
fusi
on (m
ean±
S.D
.)
Bas
elin
eSl
eep-
depr
ived
BL
− S
D
Rig
htL
eft
Rig
htL
eft
Rig
htL
eft
NC
s (8)
88.1
±39.
014
7.2±
84.1
109.
9±60
.512
9.1±
60.9
− 21
.9±4
5.6
18.1
±66.
1Pt
s (17
)94
.1±4
3.2
155.
8±65
.811
0.0±
41.3
173.
8±66
.1−
11.7
±34.
1−
14.5
±80.
1R
s (5)
142.
1±43
.120
3.9±
56.4
130.
4±45
.720
3.4±
65.7
11.8
±16.
70.
5±86
.0N
Rs (
13)
74.1
±23.
713
5.7±
60.5
99.1
±38.
515
4.8±
61.8
− 25
.0±3
5.2
− 19
.2±8
4.0
NC
: nor
mal
con
trol,
Pts:
pat
ient
s, R
s: re
spon
ders
, NR
s: n
onre
spon
ders
, BL:
bas
elin
e, S
D: s
leep
-dep
rived
, BL −
SD: b
asel
ine
min
us sl
eep-
depr
ived
. Val
ues a
re in
gra
y sc
ale
MR
uni
ts.
Psychiatry Res. Author manuscript; available in PMC 2008 July 16.
Related Documents