Does Air Pollution Increase Electric Vehicle Adoption? Evidence from U.S. Metropolitan Areas, 2011-2018 Jude Bayham, a Jesse Burkhardt, a Makena Coffman b , Sherilyn Hayashida, c,* Sumner La Croix d a Department of Agricultural and Resource Economics, Colorado State University, Fort Collins, CO, 80523 USA d Institute for Sustainability and Resilience, Dept. of Urban and Regional Planning and University of Hawai‘i Economic Research Organization, University of Hawai‘i at Mānoa, 2424 Maile Way, Saunders 113, Honolulu, HI 96822, USA c University of Hawai‘i Economic Research Organization, University of Hawai‘i at Mānoa, 2424 Maile Way Saunders 542, Honolulu, HI 96822, USA d Dept. of Economics and University of Hawai‘i Economic Research Organization University of Hawai‘i at Mānoa, 2424 Maile Way, Saunders 542, Honolulu, HI 96822, USA *Corresponding author: [email protected] 10 September 2021 For Presentation University of Hawai‘i Workshop on Energy and Environmental Research Monday, September 13, 2021 12 pm to 1:15 pm HST Do not copy, distribute, post or cite this paper without permission © Abstract We estimate a model for adoption of electric vehicles in 427 of the largest metropolitan areas in the 48 contiguous U.S. states. We use a data set with new registrations for battery electric vehicles (BEV) and plug-in electric vehicles (PHEV) by metro area over the 2011-2018 period, and investigate whether adoption of new EVs is affected by multiple types of air pollution - both long-term metro air pollution as measured by PM2.5 and more temporary metro events as measured by the presence of lower-level and upper-level atmosphere smoke plumes. Regression results show that both PM2.5 pollution and smoke plumes affect BEV and PHEV adoptions by metro area. Keywords: electric vehicles; pollution; smoke plumes; state EV policies; psuedo-Poisson estimates; high dimensional fixed effects JEL codes: Q52, Q48, O33, R40

Welcome message from author
This document is posted to help you gain knowledge. Please leave a comment to let me know what you think about it! Share it to your friends and learn new things together.
Transcript
Does Air Pollution Increase Electric Vehicle Adoption?Evidence from U.S. Metropolitan Areas, 2011-2018
Jude Bayham,a Jesse Burkhardt,a Makena Coffmanb,Sherilyn Hayashida,c,* Sumner La Croixd
a Department of Agricultural and Resource Economics, Colorado State University, Fort Collins,CO, 80523 USA
dInstitute for Sustainability and Resilience, Dept. of Urban and Regional Planning and Universityof Hawai‘i Economic Research Organization, University of Hawai‘i at Mānoa, 2424 Maile Way,
Saunders 113, Honolulu, HI 96822, USA
cUniversity of Hawai‘i Economic Research Organization, University of Hawai‘i at Mānoa, 2424Maile Way Saunders 542, Honolulu, HI 96822, USA
dDept. of Economics and University of Hawai‘i Economic Research OrganizationUniversity of Hawai‘i at Mānoa, 2424 Maile Way, Saunders 542, Honolulu, HI 96822, USA
*Corresponding author: [email protected]
10 September 2021
For Presentation
University of Hawai‘i Workshop on Energy and Environmental ResearchMonday, September 13, 2021
12 pm to 1:15 pm HST
Do not copy, distribute, post or cite this paper without permission ©
AbstractWe estimate a model for adoption of electric vehicles in 427 of the largest metropolitan areas inthe 48 contiguous U.S. states. We use a data set with new registrations for battery electricvehicles (BEV) and plug-in electric vehicles (PHEV) by metro area over the 2011-2018 period,and investigate whether adoption of new EVs is affected by multiple types of air pollution - bothlong-term metro air pollution as measured by PM2.5 and more temporary metro events asmeasured by the presence of lower-level and upper-level atmosphere smoke plumes. Regressionresults show that both PM2.5 pollution and smoke plumes affect BEV and PHEV adoptions bymetro area.
Keywords: electric vehicles; pollution; smoke plumes; state EV policies; psuedo-Poissonestimates; high dimensional fixed effects
JEL codes: Q52, Q48, O33, R40

11. Introduction
In this paper we investigate whether people living in U.S. metropolitan areas with higher levelsof local air pollution, both persistent and temporary, are more likely to adopt electric vehicles(EVs). EVs have the potential to reduce multiple sources of air pollution, including smog-forming emissions. Both battery electric vehicles (BEVs) and plug-in hybrid electric vehicles(PHEVs) are commonly referred to as Zero Emissions Vehicles (ZEVs) - reflecting thatelectricity-based fuel contributes no direct exhaust emissions.1 The marketing of EVs as ZEVsshow a clear transmission of information about air pollution and vehicle type that mightinfluence consumer purchases. A substantial portion of local air pollution, in addition to globalair pollution in the form of greenhouse gases (GHG), comes from the combustion of fossil fuelsin vehicular transport (Holland et al., 2016 and 2020; Lei et al., 2021; Shi et al. 2017). A range oflocal air pollutants is well-documented to have deleterious health effects (Berhane et al, 2016;EPA, 2021; Halliday et al., 2018; Soriano et al., 2020). Consumers who experience increases inpersistent or temporary sources of local air pollution could be motivated to switch from afossil-fuel-powered vehicle to a partly electric-powered PHEV or fully electric-powered BEV. Ina similar inquiry for China, Guo et al (2020) use PM2.5 levels as a proxy for local air pollutionand find a robust positive and statistically significant relationship between PM2.5 levels and EVsales using data for 20 major cities between 2014 and 2018.
We additionally inquire whether consumers adopt EVs in response to more temporary sources ofair pollution, via smoke plumes. For the United States, Larsen et al. (2018) find that smokeplumes relate to increased measures of PM2.5 and the number of unhealthy air quality days.Burke et al. (2021, 1-2) found that in the United States “[o]ver the last four decades, burned areafrom wildfires has roughly quadrupled,” while smoke days per year increased by almost twodays per year on average from 2005 to 2020. Here the transmission of information regarding airquality and EVs is more indirect, though exacerbated levels of poor air quality days, visiblesmoke haze, and media reports might heighten consumer awareness of air pollution moregenerally, as well as prompt consumers to make the connection between air quality and climatechange.
To assess whether temporary and persistent local air pollution affect EV adoption, we use paneldata on EV registrations covering 427 U.S. metropolitan areas from 2011 to 2018 to estimate theeffect of PM2.5 pollution levels and the presence of smoke plumes on EV adoption within metroareas. Our econometric model accounts for the number of publicly accessible charging stationswithin a state as well as measures of state-level EV policies that could contribute to regionalvariation in EV adoption. Metro-year fixed effects absorb year-over-year changes within metroareas and quarterly fixed effects absorb idiosyncratic macroeconomic shocks to the U.S.economy and automobile market. We use a Poisson psuedomaximum likelihood high
1 The federal government has provided waivers to some states from its Corporate Average Fuel Economy(CAFE) standards on the grounds that these states need more stringent local air pollution measures tomeet clean air standards set by the Clean Air Act. By 2018 nine states had adopted California’s clean airstandards and its ZEV mandate: Connecticut, Maine, Maryland, Massachusetts, New Jersey, New York,Oregon, Rhode Island, and Vermont. Colorado enacted a ZEV mandate in 2019 and Washington State in2020.
2dimensional fixed effects estimator to obtain results from samples of new BEV and PHEVregistrations.
Our results show that changes in local air pollution within U.S. metropolitan areas are associatedwith changes in consumer purchases of new EVs, with a complex pattern of findings for BEVsand PHEVs. We find that increases in PM2.5 air pollution within metro areas are associated withincreased adoption of BEVs and decreased adoption of PHEVs. The importance of this result isamplified by the large average decline (19 percent) in quarterly PM2.5 air pollution within the427 metro areas in our sample between 2011 and 2018. From this perspective, declines in metroarea air pollution during the 2010s depressed adoptions of BEVs and raised adoptions of PHEVs.We also find that changes in smoke plume pollution within metro areas affected EV purchases,but that the effect was relatively small compared to that generated by PM2.5 pollution. Smokeplumes had a positive and statistically significant relationship to PHEV sales, and a negative andstatistically significant relationship to BEV sales. These results are important because ourmeasure of annual smoke plume days in metro areas declined from 2011 to 2016 beforeregistering increases in 2017 and 2018 (Figure 2). The overall effect of this exogenous decline insmoke plumes is to depress PHEV adoptions, increase BEV adoptions, and decrease overall EVadoptions, as consumers saw less need to take action towards mitigating air pollution throughtheir vehicle purchase. We conclude that consumers in the new vehicle market are rationallymore receptive to signals about the environment generated by changes in persistent PM2.5pollution in their metro area relative to changes in temporary smoke plume pollution typicallyoriginating outside their metro area.
2. Literature Review
EVs negate or reduce tailpipe emissions depending on whether they are BEVs or PHEVs.Whether they reduce net air pollution, including GHGs, depends on the type of energy used tocreate the electricity used to recharge the EV2 and the vehicles they replace. Several simulationstudies have shown that high levels of EV adoption have the potential to yield substantial publichealth benefits by reducing several types of local air pollution (Brady and OʻMahony, 2011;Ferrero et al., 2016; Soret et al., 2014). Holland et al. (2020) document a dramatic decline inlocal air pollutants from power plants across the United States from 2010 to 2017 due tointegration of renewable energy and natural gas into electricity grids. The most notable drop isfor sulfur dioxide (SO2), which fell by 75 percent. Fine particulate matter (PM2.5) declined byabout 35 percent. Carbon dioxide (CO2), a GHG, declined by about 20 percent. With this drop instationary sources of air pollution, the net benefits of electrifying transportation systemssubstantially increased. Dividing the country into three large regions—East, West, and Texas –Holland et al. (2020) estimated the net environmental benefit from an electric-powered FordFocus driven 15,000 miles per year replacing a gasoline-powered Ford Focus for 2010 and 2017.They found that the average annual net benefit was positive in 2010 for Texas and the West but
2 Based on the average mix of energy sources in U.S. electricity generation during 2019, the U.S.Department of Energy (DOE) estimates that a BEV typically produces the least GHG emissions, followedby a PHEV, a hybrid electric vehicle (HEV) and, lastly, a gasoline vehicle (AFDC, 2019a). Vehiclerankings by GHG emissions are somewhat different at the state level. EVs are an improvement overHEVs in most states, though in 15 coal-dependent states, HEVs still outperform EVs in terms of GHGemissions. The DOE does not provide the same level of information for local air pollutants.

3negative for the East. By 2017 net benefits had increased substantially in each region, andbecome positive in the East.3 Overall, these findings suggest that stationary sources of PM2.5pollution declined across the U.S. over our study's time-period (Figure 2).
Though EVs clearly lead to a reduction in pollutants via a reduction in combustion of fossilfuels, the net effect of switching to an EV on mobile sources of particulate matter pollution ismore uncertain (Shi et al., 2017; Schöllnhammer et al. 2014). Soret et al. (2014) and Timmersand Achten (2016) conclude that the reduction in particulate pollution from an EV that replacesan internal combustion engine (ICE) vehicle is substantially lower than conventionallyconceived, just a 1.0% - 5.0% reduction. Timmers and Achten (2016) find that 90% of PM10 and85% of PM2.5 pollution are not exhaust-related and that the increased weight of EVs relative tosimilar size fossil-fuel-powered vehicles results in more non-exhaust particulate-relatedemissions due to greater tire wear and road wear. The basis for this finding is extended inAmbrose et al. (2020) who find that BEV size--think the movement of the market to new Teslamodels--and battery weight increased from 2012-2018.
Our research abstracts from the degree to which EVs reduce different types of local airpollution, and focuses instead on determining whether the presence of local air pollutantsmotivates an EV purchase in metro areas across the United States. While ours is the first study toexamine this question for the U.S. EV market, Guo et al. (2020) have investigated this questionfor China’s EV market. Using panel data for 20 major cities in China, they show that a positiverelationship exists between average PM2.5 concentration levels and EV purchases for 20 majorcities in China. Their use of PM2.5 data, similar to ours, serves as a proxy for changes in localair quality conditions.
More broadly, there is evidence that some car buyers choose more environmentally friendly carsbecause car purchases are highly visible to others, and send “green signals” to other consumersabout the car owner’s environmental bona fides (Sexton and Sexton, 2014; White and Sintov,2017). There are numerous survey-based studies conducted during our study period thatinvestigate the role of environmental awareness, attitudes and symbolic attributes, includingconcern about climate change, in shaping intention to purchase an EV. Survey work conductedwhen contemporary EVs first came to market in the early 2010s found that potential earlyadopters tended to be motivated by concerns about the environment and oil dependence as wellas pollution reduction (Carley et al., 2013; Hackbarth and Madlener, 2013; Hidrue et al., 2011;Zhang et al., 2011). Carley et al. (2019) compare 2011 and 2017 survey results for residents inthe 21 largest U.S. cities. They find that consumer intent to purchase an EV increased over this6-year interval, though environmental factors, including concerns about climate change andenvironmental signaling, do not explain much of this increase. Using surveys of residents inthree different regions of China, Shi et al. (2017) identify multiple ways that travelers (includingdrivers) might be influenced in their decision-making about travel mode and technology by
3 Muehlleger and Rapson (2021) find that the relevant replacement car in California was not an ICE FordFocus but a very fuel efficient car. They conclude that "[t]he actual incremental pollution abatementarising from EVs today is thus substantially smaller than one would predict using the fleet average as thecounterfactual vehicle." Moreover, Burlig, Bushnell, Rapson, Wolfram (2021) find that EVs are drivenjust 5,500 miles per year in California and find some evidence for substitution into ICE vehicles in afamily’s vehicle portfolio.
4PM2.5 levels, including attitudes, norms, and expectation that individual actions matter inpollution reduction. They find that respondent attitudes towards haze pollution was the strongestfactor relating to the intent to adopt an EV. In a survey of Japanese drivers, Okada et al. (2019)find that environmental awareness has a small direct impact on their intention to purchase an EVbut a larger impact on post-purchase satisfaction of EV drivers.
There are numerous policy, geographic, consumer, and economic factors that could influencevariation in U.S. metro-level EV adoption. Coffman et al. (2017) survey the literature through2015 on factors affecting EV adoption. The adequacy of public charging networks and unevenpolicy support for EV adoptions stand out as particularly important factors. Using panel data for2011-2015, Wee et al. (2018) and Jenn et al. (2018) study various policy instruments used bystate governments to support EV adoption including vehicle purchase incentives, home chargersubsidies, reduced vehicle license taxes, and preferential lane access. Though preferential laneaccess accrues benefits to a much smaller set of area residents, prior studies have found it to behighly valued by drivers who use those highways (Bento et al., 2014; Jenn et al. 2020;Shewmake and Jarvis, 2014). Wee et al. (2018) find that a $1,000 increase in the value of EV netsubsidies increases new EV registrations by 5-11%, while Jenn et al. (2018) find a 2.6% increase.In the first half of the 2010s, an increasing number of states adopted supportive EV policies, butin the second half of the decade, the number with home charger subsidies declined from eight totwo, the number with purchase subsidies declined from 17 to 13, while the number with anannual EV fee, a disincentive to EV adoption, increased from six to 20 (Hayashida, La Croix,and Coffman, 2021).
Lastly, there are also supply-side constraints that could be important factors underlying changesin EV adoption at the municipal level. Federal corporate average fuel economy (CAFE)standards are set nationwide, but allow states that are non-compliant with Clean Air Actstandards for local air pollutants to follow California’s more stringent policies. The federalgovernment enabled this exemption in 2013 via a waiver to CAFE. Eleven states, often referredto as “Section 177 states,” have adopted ZEV mandates that require vehicle manufacturers to hitannual targets on ZEV car sales. BEVs are given full credit as a ZEV, while PHEVs arediscounted in meeting the target because they are still run partially on fossil fuels. These targetscould limit the ability of vehicle manufacturers to change their supply of EVs in response tochanges in consumer demand for EVs generally or for BEVs relative to PHEVS.
3. Data
We construct our data set from five separate data sets covering the 48 contiguous states and the374 largest metropolitan areas. The five data sets are (1) registrations of new BEV and PHEVcars, (2) estimates for PM2.5 pollution, (3) days of landscape fire smoke plumes, (4) state-levelvariables, including measures of subsidies and fees for EVs and charging stations, and (5)metro-level variables, including income and population.
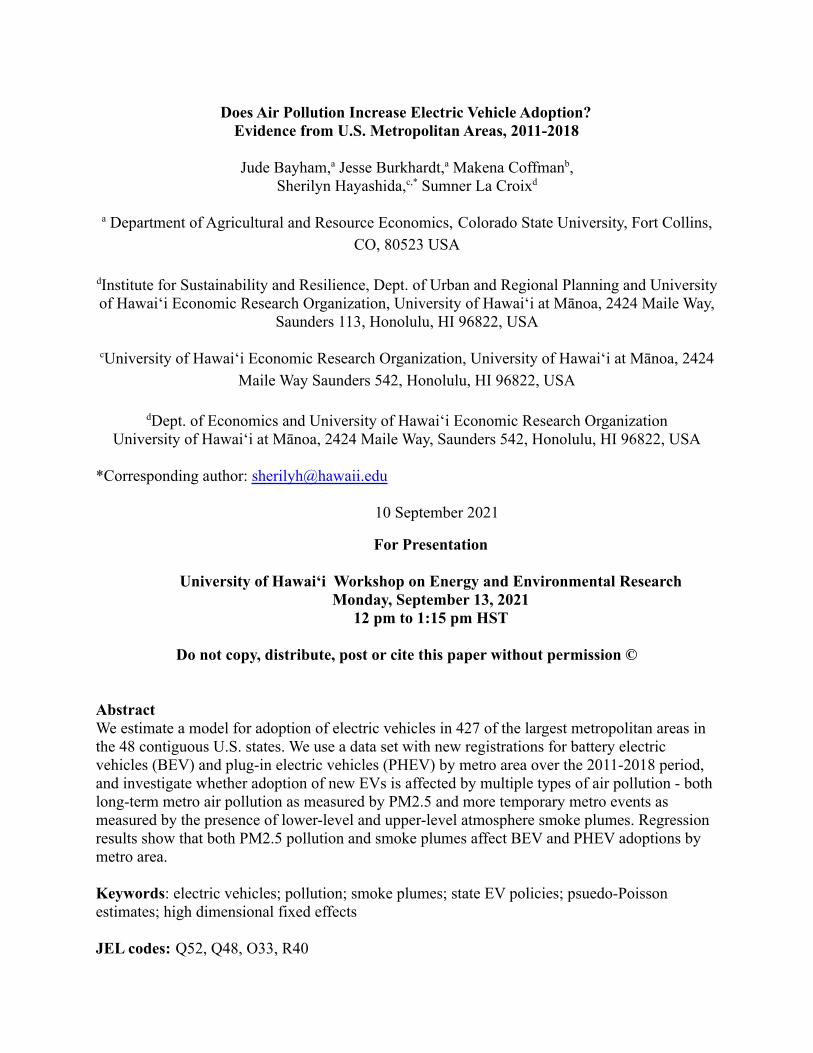
Our first data set consists of monthly registrations of new BEVs and PHEVs by metro area from2011 to 2018 (IHS Markit, 2020).4 Figure 1 displays total monthly registrations by vehicle type
4 The registration data reports two separate values for vehicles sold in different parts of core-basedstatistical areas (CBSAs) which consist of metropolitan and micropolitan areas. Some CBSAs are located
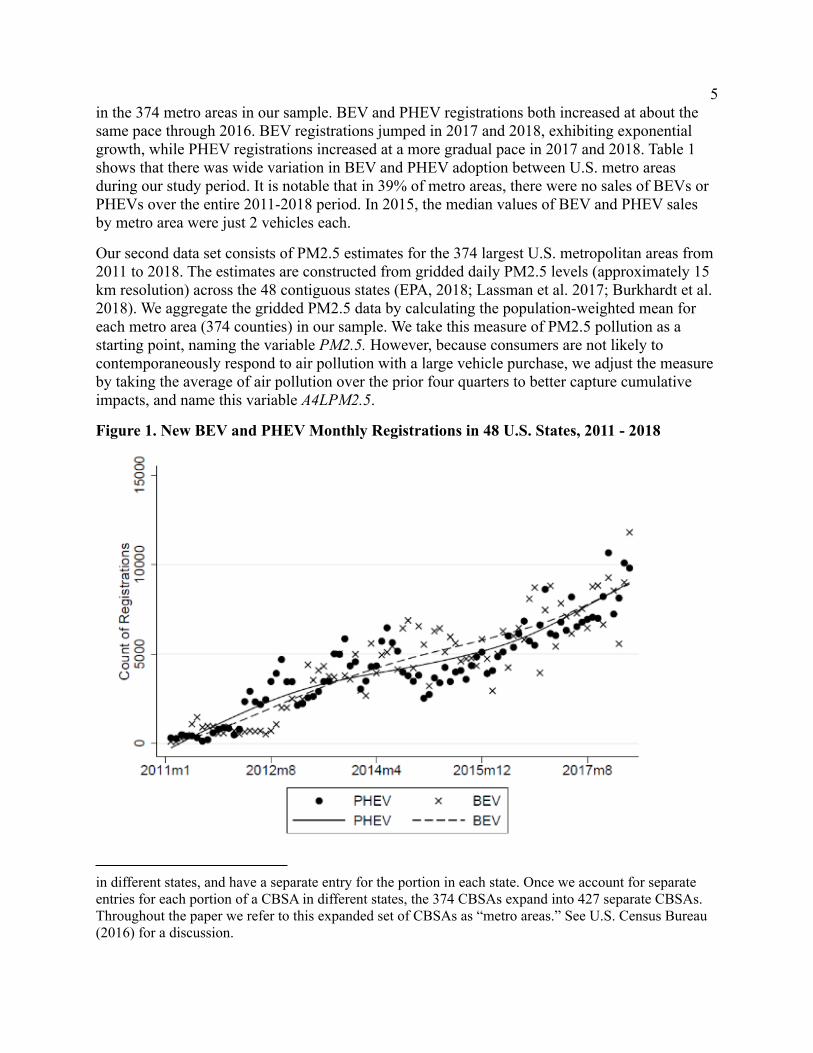
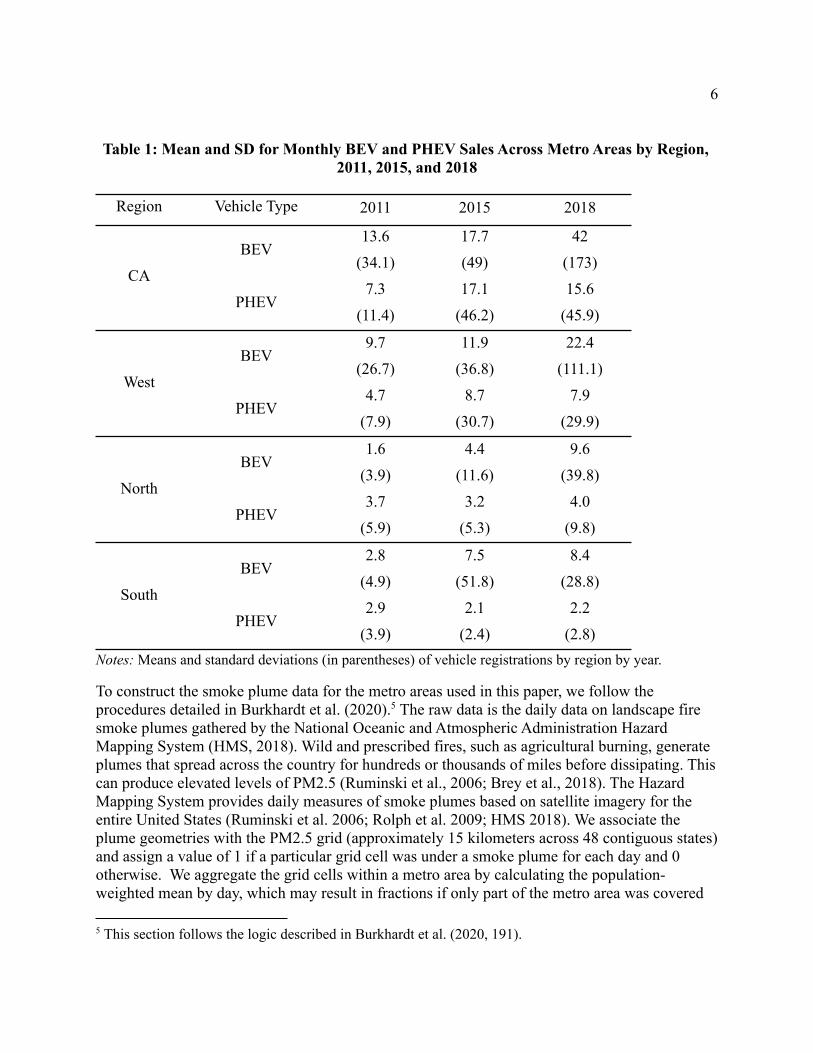
5in the 374 metro areas in our sample. BEV and PHEV registrations both increased at about thesame pace through 2016. BEV registrations jumped in 2017 and 2018, exhibiting exponentialgrowth, while PHEV registrations increased at a more gradual pace in 2017 and 2018. Table 1shows that there was wide variation in BEV and PHEV adoption between U.S. metro areasduring our study period. It is notable that in 39% of metro areas, there were no sales of BEVs orPHEVs over the entire 2011-2018 period. In 2015, the median values of BEV and PHEV salesby metro area were just 2 vehicles each.
Our second data set consists of PM2.5 estimates for the 374 largest U.S. metropolitan areas from2011 to 2018. The estimates are constructed from gridded daily PM2.5 levels (approximately 15km resolution) across the 48 contiguous states (EPA, 2018; Lassman et al. 2017; Burkhardt et al.2018). We aggregate the gridded PM2.5 data by calculating the population-weighted mean foreach metro area (374 counties) in our sample. We take this measure of PM2.5 pollution as astarting point, naming the variable PM2.5. However, because consumers are not likely tocontemporaneously respond to air pollution with a large vehicle purchase, we adjust the measureby taking the average of air pollution over the prior four quarters to better capture cumulativeimpacts, and name this variable A4LPM2.5.
Figure 1. New BEV and PHEV Monthly Registrations in 48 U.S. States, 2011 - 2018
in different states, and have a separate entry for the portion in each state. Once we account for separateentries for each portion of a CBSA in different states, the 374 CBSAs expand into 427 separate CBSAs.Throughout the paper we refer to this expanded set of CBSAs as “metro areas.” See U.S. Census Bureau(2016) for a discussion.
6
Table 1: Mean and SD for Monthly BEV and PHEV Sales Across Metro Areas by Region,2011, 2015, and 2018
Region Vehicle Type 2011 2015 2018
CA
BEV13.6 17.7 42
(34.1) (49) (173)
PHEV7.3 17.1 15.6
(11.4) (46.2) (45.9)
West
BEV9.7 11.9 22.4
(26.7) (36.8) (111.1)
PHEV4.7 8.7 7.9
(7.9) (30.7) (29.9)
North
BEV1.6 4.4 9.6
(3.9) (11.6) (39.8)
PHEV3.7 3.2 4.0
(5.9) (5.3) (9.8)
South
BEV2.8 7.5 8.4
(4.9) (51.8) (28.8)
PHEV2.9 2.1 2.2
(3.9) (2.4) (2.8)Notes: Means and standard deviations (in parentheses) of vehicle registrations by region by year.
To construct the smoke plume data for the metro areas used in this paper, we follow theprocedures detailed in Burkhardt et al. (2020).5 The raw data is the daily data on landscape firesmoke plumes gathered by the National Oceanic and Atmospheric Administration HazardMapping System (HMS, 2018). Wild and prescribed fires, such as agricultural burning, generateplumes that spread across the country for hundreds or thousands of miles before dissipating. Thiscan produce elevated levels of PM2.5 (Ruminski et al., 2006; Brey et al., 2018). The HazardMapping System provides daily measures of smoke plumes based on satellite imagery for theentire United States (Ruminski et al. 2006; Rolph et al. 2009; HMS 2018). We associate theplume geometries with the PM2.5 grid (approximately 15 kilometers across 48 contiguous states)and assign a value of 1 if a particular grid cell was under a smoke plume for each day and 0otherwise. We aggregate the grid cells within a metro area by calculating the population-weighted mean by day, which may result in fractions if only part of the metro area was covered
5 This section follows the logic described in Burkhardt et al. (2020, 191).
7by a plume. Next we sum the number of days within a quarter that a metro area was under asmoke plume. We name this variable SmokePlume.6 Next we take the average over the prior fourquarters, and name this variable A4LSmokePlume.
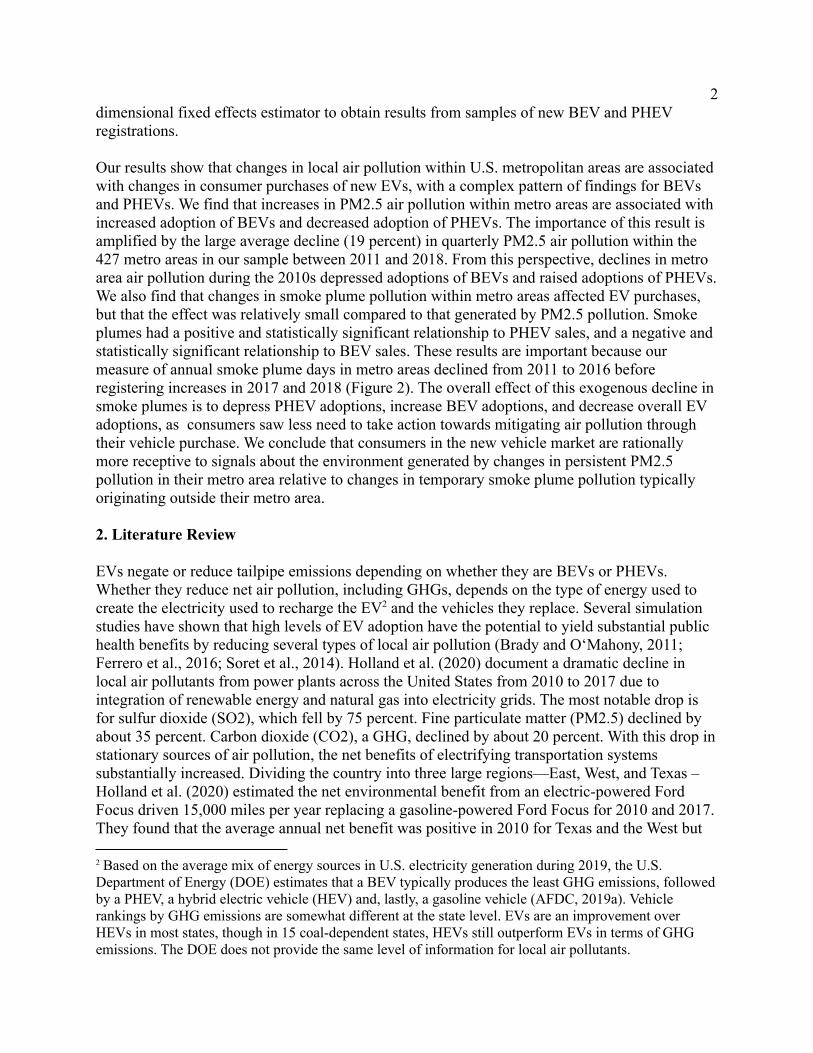
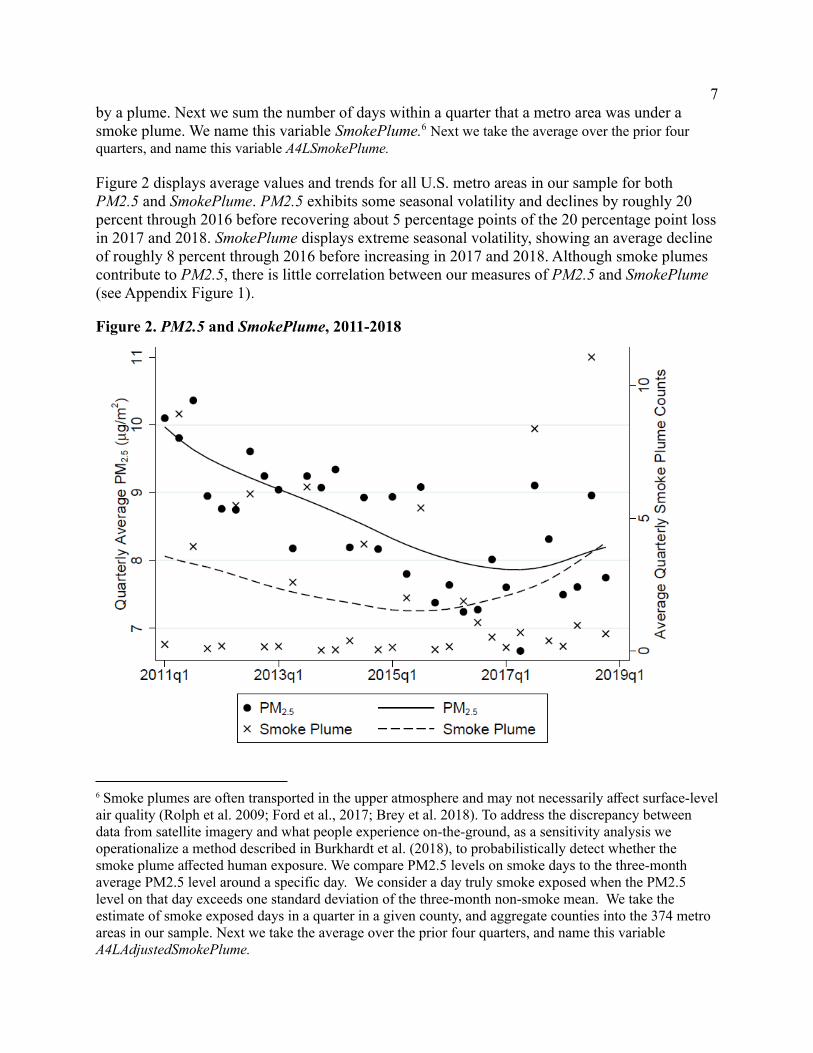
Figure 2 displays average values and trends for all U.S. metro areas in our sample for bothPM2.5 and SmokePlume. PM2.5 exhibits some seasonal volatility and declines by roughly 20percent through 2016 before recovering about 5 percentage points of the 20 percentage point lossin 2017 and 2018. SmokePlume displays extreme seasonal volatility, showing an average declineof roughly 8 percent through 2016 before increasing in 2017 and 2018. Although smoke plumescontribute to PM2.5, there is little correlation between our measures of PM2.5 and SmokePlume(see Appendix Figure 1).
Figure 2. PM2.5 and SmokePlume, 2011-2018
6 Smoke plumes are often transported in the upper atmosphere and may not necessarily affect surface-levelair quality (Rolph et al. 2009; Ford et al., 2017; Brey et al. 2018). To address the discrepancy betweendata from satellite imagery and what people experience on-the-ground, as a sensitivity analysis weoperationalize a method described in Burkhardt et al. (2018), to probabilistically detect whether thesmoke plume affected human exposure. We compare PM2.5 levels on smoke days to the three-monthaverage PM2.5 level around a specific day. We consider a day truly smoke exposed when the PM2.5level on that day exceeds one standard deviation of the three-month non-smoke mean. We take theestimate of smoke exposed days in a quarter in a given county, and aggregate counties into the 374 metroareas in our sample. Next we take the average over the prior four quarters, and name this variableA4LAdjustedSmokePlume.

8
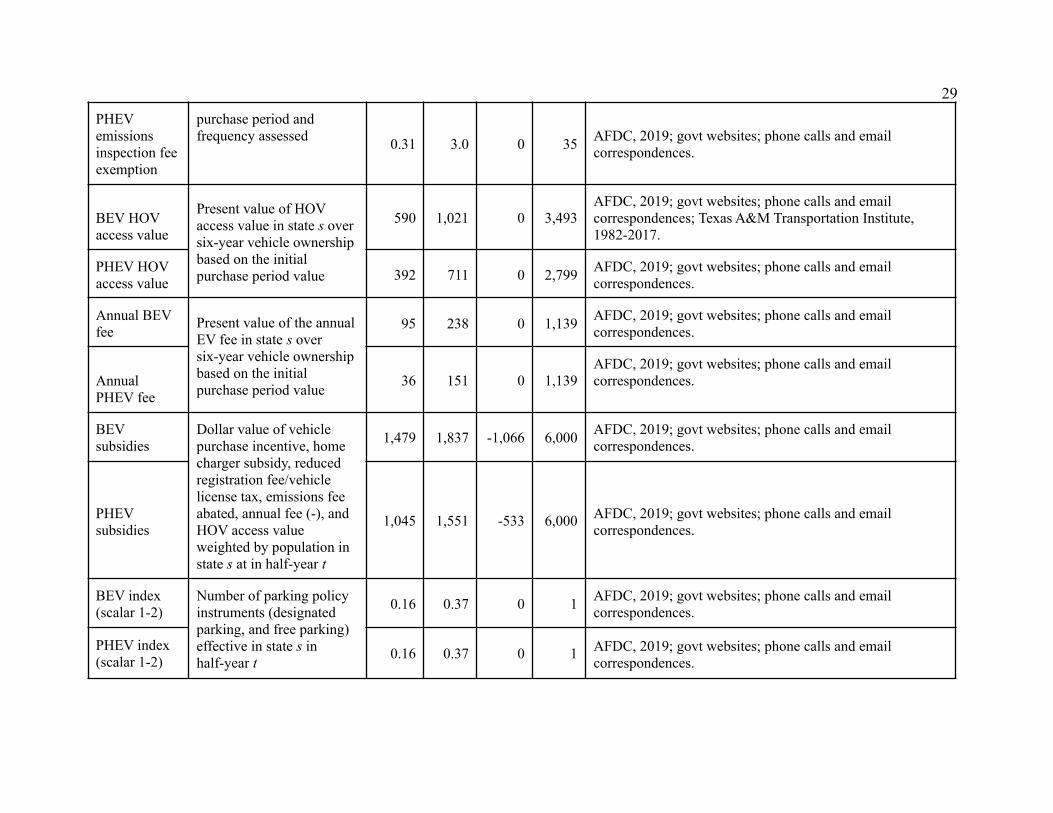
As a control variable, we include a measure (Subsidies) of the net value of state EV policyinstruments, as documented for 2010-2015 in Wee et al. (2018, 2019) and extended to 2016-2018in Hayashida et al. (2021). This variable is measured on a semi-annual basis, and changes whennew policy instruments are implemented or existing policy instruments repealed.7 States havespecified EV policy instruments that often differ in value depending on whether a vehicle is aBEV or PHEV. Thus, we specify two different measures of Subsidies: BEV-Subsidies andPHEV-Subsidies. Each measure is the sum of the monetary value of six state-level policyinstruments: five incentives (vehicle purchase incentives, home charger subsidies, reducedlicence and registration fees, and high occupancy vehicle lane access) and one disincentive(annual EV fees). One-time benefits are aggregated with annually accruing benefits and costs bytaking the net present value over the average vehicle ownership period of six years, assuming a5% discount rate (Wee et al., 2018). Appendix Table 1 summarizes the intervals when variousstate policy instruments are in effect.8
Lastly our data includes one additional variable used as a control in regressions and two morevariables used to test for heterogeneous effects of A4LPM2.5 and A4LSmokePlume on EVadoptions. PublicChargers is the number of charging stations open to the public per 1,000 squaremiles of land by state. Two more variables, metro income per capita (Income) and metropopulation (Population), are used in regression specifications designed to determine whether theeffects of A4LPM2.5 and A4LSmokePlume are heterogeneous with respect to metro income andmetro population.
Table 2 displays descriptive statistics, definitions and sources for all variables used in theregressions reported in tables in the main text and appendix.
Table 2. Variable Descriptions, Summary Statistics, and Data Sources, 2011 - 2018
Variable Description Mean s.d. Min Max Source
EV Registrations
BEV-registrations
New registrations ofBEVs sold in 39 262 0 10,152 IHS Markit,
2021.
8 For some state-level policy data--HOV lane access and designated parking, we gather additional datafrom a number of publicly-available sources. All data were collected at the state level except data onexemptions from emissions inspections. They were usually collected at the county level, but then assignedas a state-level policy based on whether the policy reached at least 50% of the population in the state.Sources include government websites, phone calls and e-mail correspondence, including Alternative FuelsData Center (AFDC). (2019b). State Laws and Incentives. U.S. Department of Energy. Accessed 5October 2019. Available at https://afdc.energy.gov/laws/state
7 Policy data from Hayashida et al. (2021) are dated according to the enactment date of a policy. We haveupdated this data set to date the start of a policy as the period when it becomes effective.

9metropolitan area a inquarter q
PHEV-registrations
New registrations ofPHEVs sold inmetropolitan area a inquarter q
33 208 0 7,475 IHS Markit,2021.
Pollution
A4LPM2.5
Population-weightedPM2.5 (mg/m3) inmetropolitan area a inquarter q, measured asthe average the prior fourquarters
8.7 1.9 2.9 19
EPA, 2018;Lassman et al.,
2017; Burkhardtet al., 2018.
A4LSmokePlume
Population-weightedsmoke plume days inmetropolitan area a inquarter q, measured asthe average of the priorfour quarters
7.3 4.8 0 27 HMS, 2018.
A4LAdjustedSmoke Plume
Population-weightedsmoke plume days(excluding high altitudeplumes) in metropolitanarea a in quarter q,measured as the averageof the prior four quarters
2.0 2.0 0 15 HMS, 2018.
State EV Policies
BEV-Subsidies
Dollar value of vehiclepurchase incentive, homecharger subsidy, reducedregistration fee/vehiclelicense tax, emissions feeabated, annual fee(negative), and HOVaccess value
1,479 1,837 -1,066 6,000AFDC, 2019;govt websites;phone calls and
emailcorrespondence.
PHEV-Subsidies 1,045 1,551 -533 6,000
AFDC, 2019;govt websites;phone & emailcorrespondences.

10Other Variables
PopulationPopulation (100,000s) inmetropolitan area a inyear y
9.4 22 0.5 203U.S. Census
Bureau,2010-2018a.
Income
Per capita income(100,000s) inmetropolitan area a inyear y (2018$)
0.3 0.1 0.1 0.6U.S. Census
Bureau,2010-2018b.
PublicChargers
Number of chargingstations per 1000 squaremiles (land) in state s inquarter q
554 1,179 0 10,128 AFDC, 2020;U.S. Census
Bureau, 2012.
Note: Each variable has 13,644 initial observations: 8 years x 4 quarters x 427 metro areas,including separate observations for metro areas spanning several states.
4. Methods
We estimate all regression models using separate samples of quarterly data for BEVs and PHEVsover the 2011-2018 period. Our baseline specification is a model that includes a quarterly fixedeffect, a metro area-by-year fixed effect, the two pollution variables (A4LPM2.5 andA4LSmokePlume) and controls for the value of state EV policy instruments (Subsidies) and thenumber of charging stations open to the public in the state (PublicChargers).9 The baselinespecification is:
where is the count of BEV registrations in metro area i in quarter t for the BEV sample𝐸𝑉𝑅𝑒𝑔𝑖𝑡
and the count of PHEV registrations for the PHEV sample, is the fixed effect for metro area iγ𝑖𝑦
in year t, is a quarter fixed effect and is an idiosyncratic error term. The quarterly fixedδ𝑞
ϵ𝑖𝑡
effect absorbs unobservable shocks that are constant across metro areas but vary by quarter suchas macroeconomic shocks that affect the overall national market for EVs. The metro-year fixedeffect absorbs idiosyncratic shocks affecting each metro area in a given year such asmetro-specific changes in vehicle sales, fuel prices, income, and population. All regressions are
9 Increases in PublicChargers could result in consumers substituting a BEV purchase for a PHEVpurchase due to the denser charging options available to drivers taking long-distance trips. However,increases or expected increases in EV registrations could also induce changes in public and privateinvestments in the charging network open to the general public. The positive feedback from EVregistrations to PublicChargers implies that the estimated coefficient on PublicChargers will be biasedupwards.

11estimated with a Poisson pseudomaximum likelihood estimator to account for zero values on thedependent variables, overdispersion, and heteroskedasticity.10 Standard errors in all regressionsare robust standard errors, and are clustered by metro area.
For identification, each model relies on within-metro area, within-year variation in air pollutionlevels via either persistent air pollution (A4LPM2.5) or more temporary spikes in pollution(A4LSmokePlume). Although an EV that replaces a fossil-fuel-powered vehicle will displacesome local pollutants, we assume that marginal EV sales are not noticeably affecting localemissions, and will not affect lagged emissions. Moreover, metro area EV sales are unlikely todirectly affect the probability of smoke plumes in the metro area over the eight-year intervalcovered by our PHEV and BEV samples.
Are there a priori expectations for the signs on coefficients for the two pollution variables? Thefirst-order effect should likely be that the relationship is positive - that consumers respond togreen signals by substituting into a green good. However, in this case there are multiple vehiclesfrom which consumers can choose. Chan and Kotchen (2014) present a generalized impurepublic (green) good and linear characteristics model that looks at private choice of impure publicgoods with both private and public characteristics. An EV is an example of an impure publicgood that generates private transportation services and environmental services. In a model withjust one green vehicle, say BEVs with only an electric engine, we would expect the coefficientsfor both pollution variables to be positive, as an increase in any type of pollution should inducesubstitution out of gasoline-powered vehicles into green BEVs. However, with two types ofgreen vehicles that are substitutes, say BEVs and PHEVs with an electric engine and agas-powered engine, coefficients for both pollution variables could be either positive or negative.In response to an increase in either A4LPM2.5 or A4LSmokePlume, we again expect asubstitution out of gasoline-powered vehicles into EVs, and therefore we expect that at least oneof the coefficients on A4LPM2.5 will be positive in either the BEV or the PHEV regression.Similarly, we expect that at least one of the coefficients on A4LSmokePlume will be positive ineither the BEV or PHEV regressions. Chan and Kotchen (2014) show that changes in demand forgreen goods in their generalized model (m goods and n characteristics) “depend on the implicitcross-price effects among private characteristics, public characteristics, and across both” (p. 13).In addition, when an environmental parameter changes (in this case, the level of metropollution), there are additional income effects and complications stemming from kinked budgetconstraints due to the discrete choice between BEVs and PHEVs.11
Beyond the baseline regressions, we estimate other regressions to check on the sensitivity of thebaseline results to different samples, time periods, and inclusion of variables to account forheterogeneous treatment effects. First, we split the samples of EV sales into the 2011-2014 and2015-2018 periods to check whether the estimated regression coefficients change as markets forBEVs and PHEVs changed over time. This is an important check as sales in 80 percent of metroareas increased sharply over the eight-year period and the composition of EV models in the
11 Finally, it is possible that both coefficients on the pollution variables are negative if consumers decideto substitute away from both conventional autos and EVs into non-plug-in hybrid electric vehicles.
10 We use the STATA ppmlhdfe estimator in all specifications (Correia, Guimarães, and Zylkin, 2020).

12market changed rapidly as new models entered and some models exited the market. Second, weestimate the model without California metro areas, which collectively accounted for 42 percentof EV sales over the sample period. This allows us to check whether estimates for A4LPM2.5and A4LSmokePlume are driven by California metro areas. Third, we estimate the model using asample that excludes metro areas with sales below the median. This enables us to check whethermetro areas in which markets for EVs have not yet emerged on a substantial scale are muting thepollution regression coefficients in the baseline regressions.
Next we examine whether estimates of A4LPM2.5 and A4LSmokePlume are heterogeneous inmetro areas with different population sizes (Population) and average per capita income (Income).We do this by estimating specifications with interaction terms between the two pollutionvariables and the demographic variables. Estimates could differ across metro areas with differentincomes because consumers with higher incomes have more discretion in their budgets torespond voluntarily to environmental signals, and may have different preferences for differenttypes of environmental goods. Estimates could differ across metro areas with differentpopulation sizes for a number of reasons, most of which are related to population density. Theseinclude greater densities of EV dealers, availability of more EV models, smaller parking spaces,and more media/internet sources drawing attention to changes in PM2.5 and smoke plumepollution within the metro area.
We also examine whether estimates of coefficients for A4LPM2.5 and A4LSmokePlume areheterogeneous within metro areas located in states with Zero Emission Vehicle (ZEV)regulations. Auto dealers and manufacturers in states with ZEV regulations are more constrainedin how they adjust supply of internal combustion engine cars and EVs in response to changes indemand than auto dealers and manufacturers in states without ZEV regulations. The ZEVconstraints could affect how they respond to changes in consumer demand stemming fromchanges in metro PM2.5 and smoke plume pollution.
We also recognize that the error terms from the PHEV and BEV regressions are likely to becorrelated with each other given that the two green vehicles are substitutes (Chan and Kotchen,2014). To account for this possibility, we estimate a set of regressions on the share of BEVregistrations to EV registrations. The ratio measure of market composition removes allinformation in the dependent variable regarding the overall expansion of the EV market but canpotentially provide additional insights into substitution of BEVs for PHEVs, and vice-versa,within metro areas in response to changes in the two pollution measures.
Finally, we conduct two robustness checks. First, we rerun all regression specifications using adifferent measure of smoke plumes, A4LAdjustedSmokePlumes, that incorporates only thosesmoke plumes that reach surface levels and could directly affect human exposure. Second, wererun all regression specifications using a more comprehensive measure of air pollution, AirQuality Index (AQI), that incorporates five different measures of air pollution, including PM2.5.
135. Empirical Results
A. Results for Regressions with BEV Sample
Table 3 reports results for eight specifications of regressions with the BEV sample. In thebaseline BEV specification (Table 3, column 1), the estimate for A4LPM2.5 is positive (0.19)and statistically significant at the one percent level. This means that a one unit increase inA4LPM2.5 (which indicates an increase in PM2.5 pollution) is associated with an average 19percent increase in BEV sales within metro areas. To put this in perspective, a one-standarddeviation increase in within-metro area A4LPM2.5 (1.1 units) increases BEV registrations withinmetro areas by an average 20.9%. In contrast, the estimate for A4LSmokePlume is negative(-0.0077) and statistically significant at the 10 percent level. A one-standard deviation (withinmetro areas) increase (3.26 units) in A4LSmokePlume decreases BEV registrations within metroareas by an average 2.5%. Thus variations in PM2.5 pollution are much more important inexplaining variations in BEV sales than variations in pollution from smoke plumes.
As discussed in Section 4, we estimate seven variations of our baseline regression. First, we splitthe sample in two at the start of 2015 and re-estimate the baseline regressions with the splitsamples. Results from regressions using the 2011-2014 and 2015-2018 samples are reported incolumns 2 and 3, respectively. In the regression with the 2011-2014 sample (column 2), theestimated coefficient on A4LPM2.5 is negative and statistically insignificant, while the estimatedcoefficient on A4LSmokePlume is positive and statistically significant at the one percent level.Both results are diametrically opposite to those obtained in estimates with the full sample(column 1). However, estimated coefficients on A4LPM2.5 and A4LSmokePlume from theregression with the 2015-2018 sample (column 3) have the same signs and statistical significanceas the coefficients in the baseline full-sample regressions, with the coefficients on A4LPM2.5(0.27) and A4LSmokePlume (-0.03) both larger in absolute value than the correspondingcoefficients in the baseline regressions. These larger estimates provide some indication thatconsumers in the U.S. vehicle market became more sensitive to environmental signals in thesecond half of our sample.
The next five variations--excluding California metro areas from the sample, excluding metroareas with below median sales of BEVs, including interaction variables between metropopulation and the two pollution measures, including interaction variables between metroincome and the two pollution measures, and including interaction variables between state ZEVstatus and the two pollution measures--all yield estimated coefficients on A4LPM2.5 andA4LSmokePlume that follow the same pattern of signs and statistical significance as in thebaseline regression. The estimated coefficient on the interaction variable between A4LPM2.5 andPopulation is positive and statistically significant at the five percent level (column 6), indicatinga larger response to PM2.5 pollution in metro areas with higher populations. The interactionvariable between Income and A4LSmokePlume is negative and statistically significant at the tenpercent level, indicating a smaller response to changes in SmokePlume in higher-income metroareas (column 7). Similarly, the interaction variable between ZEV and A4LPM2.5 yields anegative but statistically insignificant coefficient, while the interaction term between ZEV andA4LSmokePlume yields a negative and statistically significant coefficient, indicating theconsumer response to increased smoke plumes is larger in ZEV states (column 8). Overall, the
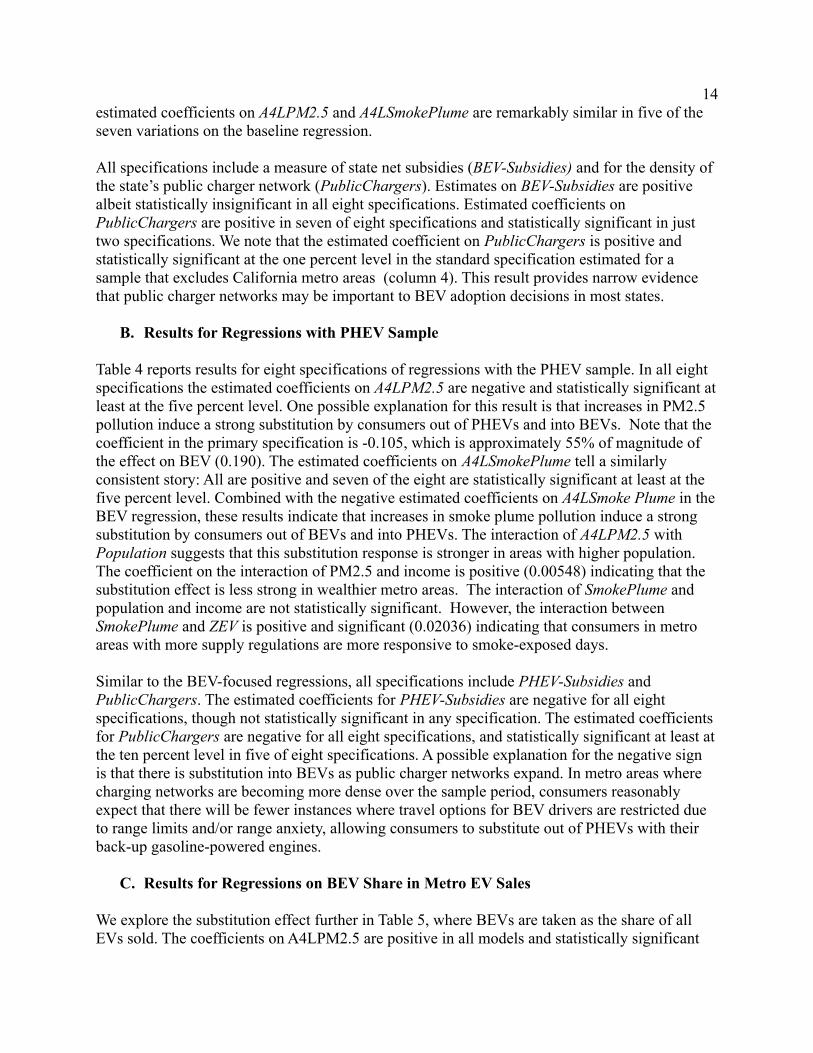
14estimated coefficients on A4LPM2.5 and A4LSmokePlume are remarkably similar in five of theseven variations on the baseline regression.
All specifications include a measure of state net subsidies (BEV-Subsidies) and for the density ofthe state’s public charger network (PublicChargers). Estimates on BEV-Subsidies are positivealbeit statistically insignificant in all eight specifications. Estimated coefficients onPublicChargers are positive in seven of eight specifications and statistically significant in justtwo specifications. We note that the estimated coefficient on PublicChargers is positive andstatistically significant at the one percent level in the standard specification estimated for asample that excludes California metro areas (column 4). This result provides narrow evidencethat public charger networks may be important to BEV adoption decisions in most states.
B. Results for Regressions with PHEV Sample
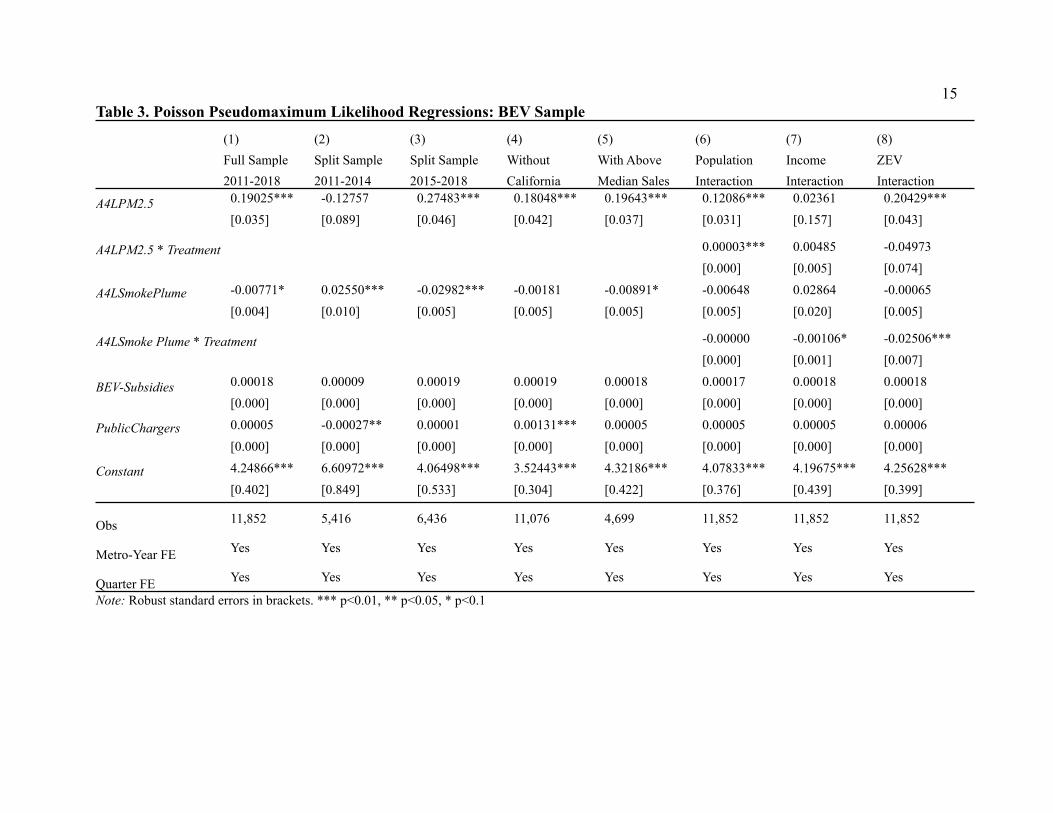
Table 4 reports results for eight specifications of regressions with the PHEV sample. In all eightspecifications the estimated coefficients on A4LPM2.5 are negative and statistically significant atleast at the five percent level. One possible explanation for this result is that increases in PM2.5pollution induce a strong substitution by consumers out of PHEVs and into BEVs. Note that thecoefficient in the primary specification is -0.105, which is approximately 55% of magnitude ofthe effect on BEV (0.190). The estimated coefficients on A4LSmokePlume tell a similarlyconsistent story: All are positive and seven of the eight are statistically significant at least at thefive percent level. Combined with the negative estimated coefficients on A4LSmoke Plume in theBEV regression, these results indicate that increases in smoke plume pollution induce a strongsubstitution by consumers out of BEVs and into PHEVs. The interaction of A4LPM2.5 withPopulation suggests that this substitution response is stronger in areas with higher population.The coefficient on the interaction of PM2.5 and income is positive (0.00548) indicating that thesubstitution effect is less strong in wealthier metro areas. The interaction of SmokePlume andpopulation and income are not statistically significant. However, the interaction betweenSmokePlume and ZEV is positive and significant (0.02036) indicating that consumers in metroareas with more supply regulations are more responsive to smoke-exposed days.
Similar to the BEV-focused regressions, all specifications include PHEV-Subsidies andPublicChargers. The estimated coefficients for PHEV-Subsidies are negative for all eightspecifications, though not statistically significant in any specification. The estimated coefficientsfor PublicChargers are negative for all eight specifications, and statistically significant at least atthe ten percent level in five of eight specifications. A possible explanation for the negative signis that there is substitution into BEVs as public charger networks expand. In metro areas wherecharging networks are becoming more dense over the sample period, consumers reasonablyexpect that there will be fewer instances where travel options for BEV drivers are restricted dueto range limits and/or range anxiety, allowing consumers to substitute out of PHEVs with theirback-up gasoline-powered engines.
C. Results for Regressions on BEV Share in Metro EV Sales
We explore the substitution effect further in Table 5, where BEVs are taken as the share of allEVs sold. The coefficients on A4LPM2.5 are positive in all models and statistically significant
15Table 3. Poisson Pseudomaximum Likelihood Regressions: BEV Sample
(1) (2) (3) (4) (5) (6) (7) (8)Full Sample Split Sample Split Sample Without With Above Population Income ZEV2011-2018 2011-2014 2015-2018 California Median Sales Interaction Interaction Interaction
A4LPM2.5 0.19025*** -0.12757 0.27483*** 0.18048*** 0.19643*** 0.12086*** 0.02361 0.20429***[0.035] [0.089] [0.046] [0.042] [0.037] [0.031] [0.157] [0.043]
A4LPM2.5 * Treatment 0.00003*** 0.00485 -0.04973[0.000] [0.005] [0.074]
A4LSmokePlume -0.00771* 0.02550*** -0.02982*** -0.00181 -0.00891* -0.00648 0.02864 -0.00065[0.004] [0.010] [0.005] [0.005] [0.005] [0.005] [0.020] [0.005]
A4LSmoke Plume * Treatment -0.00000 -0.00106* -0.02506***[0.000] [0.001] [0.007]
BEV-Subsidies 0.00018 0.00009 0.00019 0.00019 0.00018 0.00017 0.00018 0.00018[0.000] [0.000] [0.000] [0.000] [0.000] [0.000] [0.000] [0.000]
PublicChargers 0.00005 -0.00027** 0.00001 0.00131*** 0.00005 0.00005 0.00005 0.00006[0.000] [0.000] [0.000] [0.000] [0.000] [0.000] [0.000] [0.000]
Constant 4.24866*** 6.60972*** 4.06498*** 3.52443*** 4.32186*** 4.07833*** 4.19675*** 4.25628***[0.402] [0.849] [0.533] [0.304] [0.422] [0.376] [0.439] [0.399]
Obs 11,852 5,416 6,436 11,076 4,699 11,852 11,852 11,852
Metro-Year FE Yes Yes Yes Yes Yes Yes Yes Yes
Quarter FE Yes Yes Yes Yes Yes Yes Yes Yes
Note: Robust standard errors in brackets. *** p<0.01, ** p<0.05, * p<0.1
16Table 4. Poisson Pseudomaximum Likelihood Regressions: PHEV Sample
(1) (2) (3) (4) (5) (6) (7) (8)Full Sample Split Sample Split Sample Without With Above Population Income ZEV2011-2018 2011-2014 2015-2018 California Median Sales Interaction Interaction Interaction
A4LPM2.5 -0.105*** -0.232*** -0.058** -0.123*** -0.109*** -0.094*** -0.290*** -0.126***[0.030] [0.065] [0.024] [0.028] [0.032] [0.032] [0.085] [0.027]
A4LPM2.5 * Treatment -0.00000* 0.00548** 0.06768[0.000] [0.002] [0.044]
A4LSmokePlume 0.01460*** 0.03003*** 0.00903** 0.00999*** 0.01305*** 0.01386*** 0.00259 0.00997***[0.004] [0.010] [0.004] [0.002] [0.004] [0.005] [0.016] [0.002]
A4LSmokePlume * Treatment 0.00000 0.00035 0.02036**[0.000] [0.000] [0.009]
PHEV-Subsidies -0.00002 -0.00007 -0.00001 -0.00001 -0.00002 -0.00002 -0.00002 -0.00002[0.000] [0.000] [0.000] [0.000] [0.000] [0.000] [0.000] [0.000]
PublicChargers -0.00006* -0.0006*** -0.00002 -0.00022 -0.00005 -0.00006* -0.00007** -0.00007**[0.000] [0.000] [0.000] [0.000] [0.000] [0.000] [0.000] [0.000]
Constant 6.77569*** 7.70305*** 6.58050*** 6.77158*** 7.01236*** 6.80275*** 6.73615*** 6.79459***[0.228] [0.598] [0.149] [0.190] [0.247] [0.233] [0.180] [0.178]
Obs 12,856 6,328 6,528 12,060 4,699 12,856 12,856 12,856
Metro-Year FE Yes Yes Yes Yes Yes Yes Yes Yes
Quarter FE Yes Yes Yes Yes Yes Yes Yes Yes
Note: Robust standard errors in brackets. *** p<0.01, ** p<0.05, * p<0.1

17Table 5. Poisson Pseudomaximum Likelihood Estimates for Share of BEVs in Total EVs Sold
(1) (2) (3) (4) (5) (6) (7) (8) (9)Full Sample Split Sample Split Sample Without With Above Population Income ZEV Net2011-2018 2011-2014 2015-2018 California Median Sales Interaction Interaction Interaction Subsidy
A4LPM2.5 0.07145*** 0.05390 0.09511*** 0.07208*** 0.08026*** 0.06494*** 0.16588* 0.07579*** 0.07613***[0.020] [0.036] [0.024] [0.022] [0.019] [0.022] [0.089] [0.025] [0.020]
A4LPM2.5 * Treatment 0.00102* -0.33028 -0.00617[0.001] [0.291] [0.038]
A$LSmoke Plume -0.00330 -0.00709 -0.01945** -0.00228 -0.00304 -0.00372 -0.02086 -0.00149 -0.00283[0.008] [0.011] [0.009] [0.008] [0.005] [0.008] [0.036] [0.008] [0.007]
A4LSmoke Plume * Treatment 0.00008 0.06202 -0.01567[0.000] [0.111] [0.016]
BEV-Subsidies 0.00003 0.00021*** 0.00001 0.00003 -0.00000 0.00003 0.00003 0.00003[0.000] [0.000] [0.000] [0.000] [0.000] [0.000] [0.000] [0.000]
Net BEV-PHEV Subsidies 0.00004*[0.000]
Public Chargers 0.00014*** -0.00004 0.00007** 0.00078*** 0.00012*** 0.00013*** 0.00014*** 0.00014***[0.000] [0.000] [0.000] [0.000] [0.000] [0.000] [0.000] [0.000]
Constant -1.48923*** -1.67459*** -1.51950*** -1.70100*** -1.46428*** -1.52985*** -1.46974*** -1.52026*** -1.40007***[0.170] [0.343] [0.188] [0.184] [0.156] [0.164] [0.166] [0.179] [0.165]
Obs 10,760 4,764 5,996 10,035 4,699 10,760 10,760 10,760 10,760Metro-Year FE Yes Yes Yes Yes Yes Yes Yes Yes YesQuarter FE Yes Yes Yes Yes Yes Yes Yes Yes YesNote: Robust standard errors in brackets. *** p<0.01, ** p<0.05, * p<0.1

18at least at the 10 percent level in all specifications but for the one estimated with the 2011-2014split sample (column 2). The results support the hypothesis of a substitution from PHEV to BEVinduced by PM2.5. The estimated coefficients on A4LSmokePlume are positive for seven ofeight regressions, though only statistically significant in the 2015-2018 sample (Table 5, column3). We find that during the early part of the sample (2011-2014), BEV subsidies have a positiveeffect on the share of BEV sold, which suggests that subsidies played an important role duringthe early phases of BEV adoption relative to metro air quality. We also experimented with analternative measure of subsidies, which is the difference between BEV and PHEV subsidies,named NetBEV-PHEV-Subsidies. Results (column 9) for a specification with this subsidyvariable using the full 2011-2018 sample shows an estimated coefficient (0.00004) that ispositive, relatively small, and statistically significant at the 10 percent level.
D. Two Robustness Checks
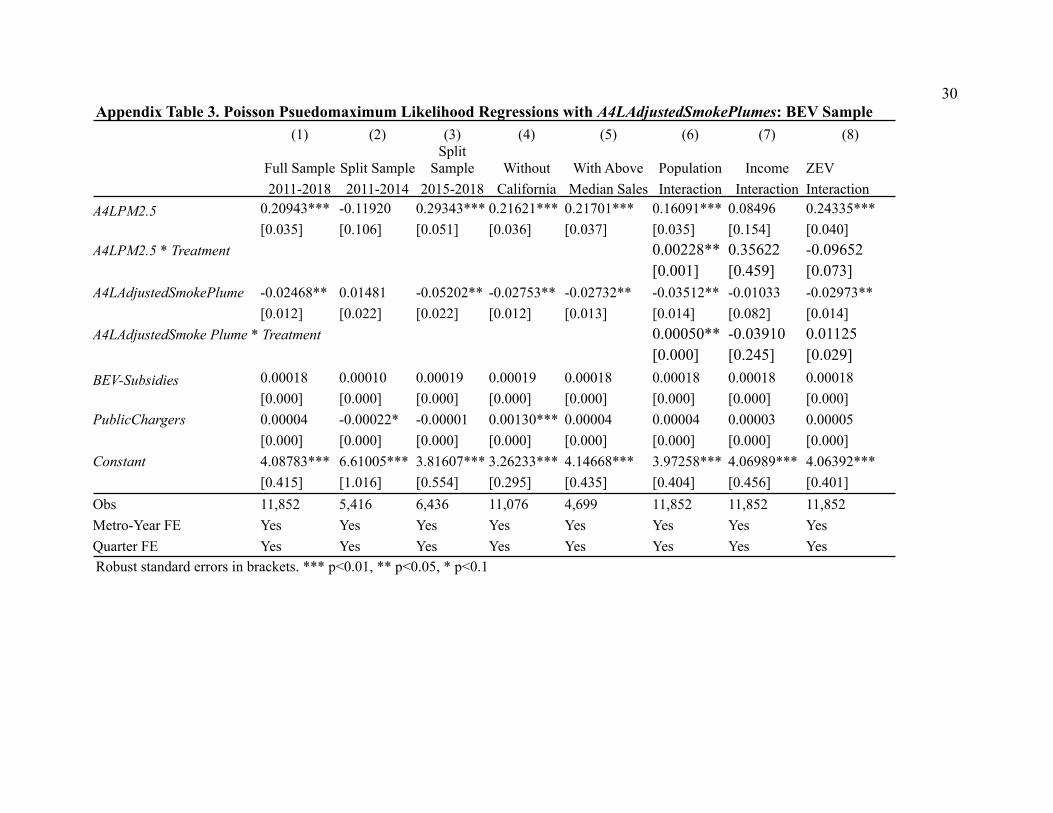
First, we estimated regression specifications with a measure of smoke plumes adjusted to includeonly plumes that affect surface level air quality: A4LAdjustedSmokePlumes. Results are reportedin Appendix Table 3 for the BEV sample and Appendix Table 4 for the PHEV sample. Estimatesare broadly consistent with those obtained from regressions estimated with A4LSmokePlume,with levels of statistical significance for estimated coefficients on pollution variables lower insome specifications.
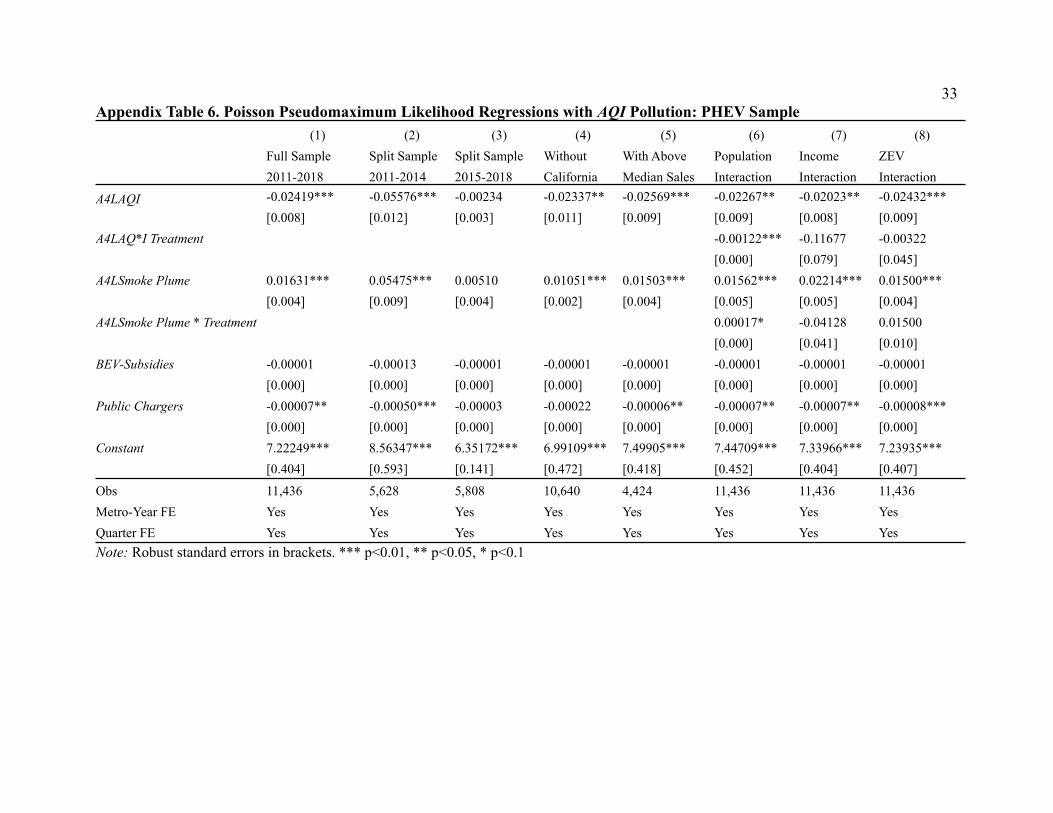
Second, we estimated regression specifications with a broad measure of metro pollution, the AirQuality Index (AQI). The EPA calculates AQI for metro areas from five air pollutants:ground-level ozone, PM2.5, carbon monoxide, sulfur dioxide, and nitrogen dioxide. Results fromregression specifications replacing AL4PM2.5 with AL4AQI are reported in Appendix Table 5 forthe BEV sample and Appendix Table 6 for the PHEV sample. Estimates are broadly consistent insigns and statistical significance of estimated coefficients with those obtained in regressions withA4LSmokePlume.
7. Discussion and Conclusion
Our study shows that changes in local air pollution within U.S. metropolitan areas are associatedwith changes in consumer purchases of new EVs. We find a positive association between PM2.5pollution and BEV adoption, and a negative association between PM2.5 pollution and PHEVadoption. Chan and Kotchen’s (2014) framework for analyzing choice between multiple greengoods points us to the possibility of consumer substitution from PHEVs to BEVs in response toincreases in PM 2.5. Over our sample period there was a large average decline (19 percent) inquarterly PM2.5 air pollution within the metropolitan areas in our sample between 2011 and2018. This means that a decline in PM2.5 levels served to suppress BEV and raise PHEVadoptions.
Smoke plumes caused by wild and agricultural fires that drift over metropolitan areas, on theother hand, are positively associated with PHEV adoption and negatively associated with BEVadoption - though this effect is relatively small in comparison to the consumer response toPM2.5. We speculate that the preference for PHEVs in response to the presence of smoke
19plumes may be tied to risk-averse consumers substituting into the EV technology which allowsmore flexibility during an environmental emergency, such as an evacuation from a wildfire. Inthis case annual smoke plume days in metro areas declined from 2011 through 2016, and thenincreased through the end of our sample period in 2018.12 Whereas our measure of PM2.5pollution represents more persistent air pollution from local sources, our measure of smokeplumes tends to be more sporadic, seasonal, and temporary. As such, we conclude that driversare rationally more receptive to persistent environmental signals than temporary ones,particularly given that smoke plumes often originate outside of the metropolitan area.
Our results regarding the influence of metro pollution on EV adoption provide usefulinformation for framing the future policy environment. If declines in metro area PM2.5 pollutioncontinue in tandem with increases in smoke pollution, then policymakers may find that thePHEV market is expanding even in the absence of new state and federal EV policies while theBEV market is contracting. In addition, we find that increases in PM2.5 are associated with a netincrease in EV adoption (BEV increasing and PHEV decreasing) while state-level BEV netsubsidies only induce adoption in the 2011-2014 subsample of our data. This suggests thatexisting policy interventions may have only induced early adoption of a lesser knowntechnology, whereas voluntary response plays a continued role. This finding adds to the broaderliterature on the role of voluntary behavior versus policy-induced behavior (e.g., Ostrom, 2020;Bayham et al., 2015; Yan et al., 2021). We emphasize though that our results should not beinterpreted as a justification for relaxing emissions regulations because neither state policy northe presence of local air pollution will prompt EV adoption to the levels set by U.S. goals to curbthe climate crisis. The Biden administration has set a goal of EVs accounting for 50% of new carsales by 2030.13 Achievement of this target clearly depends on whether consumer preferencesbegin to tilt towards green goods, whether technology underlying BEV and PEV modelssubstantially improves (particularly with respect to battery weight, performance and cost), howthe relative prices of EVs and conventional vehicles evolve, and the important role ofsupply-side interventions.
References
Alam, D. S., Hyde, B., Duffy, P., McNabola, A. (2018). Analysing the Co-Benefits of transportfleet and fuel policies in reducing PM2.5 and CO2 emissions. Journal of Cleaner Production,172, 623-634. https://doi.org/10.1016/j.jclepro.2017.10.169.
Alternative Fuels Data Center (AFDC). (2019b). State Laws and Incentives. U.S. Department ofEnergy. Accessed 5 October 2019. Available at https://afdc.energy.gov/laws/state (last access on5 October 2019)
13 See “President Biden sets a goal of 50 percent electric vehicle sales by 2030,” New York Times, Aug. 5,2021. Available at: https://www.nytimes.com/2021/08/05/business/biden-electric-vehicles.html (lastaccess on 22 August 2021).
12 Our study does not include 2020 and 2021, which had notoriously bad wildfire smoke seasons.

20Ambrose, H., Kendall, A., Lozano, M., Wachche, S., Fulton, L. (2020). Trends in life cyclegreenhouse gas emissions of future light duty electric vehicles. Transportation Research Part D:Transport and Environment, 81, 102287.
Bayham, J., Kuminoff, N.V., Gunn, Q., and Fenichel, E. P. (2015). Measured voluntaryavoidance behaviour during the 2009 A/H1N1 epidemic. Proceedings of the Royal Society B:Biological Sciences, 282, 20150814.
Berhane, K., Chang, C., and McConnell, R. (2016). Association of Changes in Air Quality withBronchitic Symptoms in Children in California, 1993-2012. Journal of the American MedicalAssociation, 315(14), 1491-1501.
Brady, J., and O’Mahoney, M. (2011). Travel to work in Dublin. The potential impacts of electricvehicles on climate change and urban air quality. Transportation Research Part D, 16, 188-193.
Brey, S., Ruminski, M., Atwood, S., and Fischer, E. (2018). Connecting Smoke Plumes toSources Using Hazard Mapping System (hms) Smoke and Fire Location Data Over NorthAmerica. Atmospheric Chemistry and Physics, 18(1), 1745–1761.
Burke, M., Driscoll, A., Heft-Neal, S., Xue, J., Burney, J., and Wara, M. (2021). The ChangingRisk and Burden of Wildfire in the United States. Proceedings of the National Academy ofSciences, 118(2), e2011048118.
Burkhardt, J., Bayham, J., Wilson, A., Berman, J. D., O’Dell, K., Ford, B., Fischer, E. V., andPierce, J. R. (2020). The relationship between monthly air pollution and violent crime across theUnited States. Journal of Environmental Economics and Policy, 9(2), 188-205.https://doi.org/10.1080/21606544.2019.1630014
Burlig, F., Bushnell, J., Rapson, D., and Wolfram, C. (2021). "Low Energy: Estimating ElectricVehicle Electricity Use." American Economic Association Papers and Proceedings, 111, 430-35.
Carley, S., Krause, R., Lane, B., and Graham, J. (2013). Intent to Purchase a Plug-In ElectricVehicle: A Survey of Early Impressions in Large U.S. Cities. Transportation Research Part D,18, 39-45.
Carley, S., Siddiki, S., and Nicholson-Crotty, S. (2019). Evolution of Plug-In Electric VehicleDemand: Assessing Consumer Perceptions and Intent to Purchase Over Time. TransportationResarch Part D, 70, 94-111.
Chan, N. W., and Kotchen, M. J. (2014). A generalized impure public good and linearcharacteristics model of green consumption. Resource and Energy Economics, 37, 1-16.
Correia, S., Guimrães, P., and Zylkin, T. (2019). Verifying the existence of maximumlikelihood estimates for generalized linear models. ArXiv Working Paper No. arXiv:1903.01633.https://arxiv.org/abs/1903.01633.

21Correia, S., Guimarães, P., and Zylkin, T. (2020). Fast Poisson estimation with high-dimensionalfixed effects. Stata Journal, 20, 95-115.
Environmental Protection Agency [EPA] (2018). Air Quality System Data Mart. Available at:http://www.epa.gov/ttn/airs/aqsdatamart (last access on 21 August 2021)
Environmental Protection Agency [EPA] (2021). Green Vehicle Guide, Light Duty VehicleEmissions. Available: https://www.epa.gov/greenvehicles/light-duty-vehicle-emissions (lastaccess on 21 August 2021)
Federal Highway Administration (FHWA). (2010-2018). Table VM-2 Vehicle-miles of travel, byfunctional system, Table HM-10 Length by ownership, Table HM-15 Length by functionalsystem. Highway Statistics.
Ferrero, E., Alessandrini, S., and Balanzino, A. (2016). Impact of the Electric Vehicles on the AirPollution from a Highway. Applied Energy, 169, 450-459. DOI: 10.1016/j.apenergy.2016.01.098
Field, C. B., Mortsch, L.B., Brklacich, M., Forbes, D L., Kovacs, P., Patz, J. A., Running, S. W.,and Scott, M. J. (2007). Climate Change 2007 - Impacts, Adaptation and Vulnerability.Contribution of Working Group II to the Fourth Assessment Report of the IPCC. CambridgeUniversity Press, Cambridge, U.K.
Ford, B., Val Martin, M., Zelasky, S., Fischer, E., Anenberg, S., Heald, C., and Pierce, J. (2018).Future Fire Impacts on Smoke Concentrations, Visibility, and Health in the Contiguous UnitedStates. GeoHealth, 2(8), 229–247.
Ghalwash, T. (2007). Energy taxes as a signaling device: An empirical analysis of consumerpreferences. Energy Policy, 35, 29-38.
Guo, J., Zhang, X., Gu, F., Zhang, H., and Fan, Y. (2020). Does Air Pollution Stimulate ElectricVehicle Sales? Empirical Evidence from Twenty Major Cities in China. Journal of CleanerProduction, 249, 119372.
Hackbart, A., and Madlener, R. (2013). Consumer Preferences for Alternative Fuel Vehicles: ADiscrete Choice Analysis. Transportation Research Part D, 25, 5-17.
Halliday, T. J., Lynham, J., and de Paula, A. (2018). Vog: Using Volcanic Eruptions to Estimatethe Health Costs of Particulates. Economic Journal, 129(620), 1782-1816.https://doi.org/10.1111/ecoj.12609
Hayashida, S., La Croix, S. and Coffman, M. (2021). Understanding changes in electric vehiclepolicies in the U.S. states, 2010-2018. Transport Policy 103, 211-223.https://doi.org/10.1016/j.tranpol.2021.01.001
Hidrue, M., Parsons, G., Kempton, W., and Gardner, M. (2011). Willingness to Pay for ElectricVehicles and their Attributes. Resource and Energy Economics, 3, 686-705.
22Holland, S., Mansur, E., Muller, N., and Yates, A. (2016). Are there Environmental Benefitsfrom Driving Electric Vehicles? The Importance of Local Factors. American Economic Review,106, 3700-3729. DOI: 10.1257/aer.20150897
Holland, S., Mansur, E., Muller, N. and Yates, A. (2020). Decompositions and PolicyConsequences of an Extraordinary Decline in Air Pollution from Electricity Generation.American Economic Journal: Economic Policy, 12(4), 244-274. DOI: 10.1257/pol.20190390
HMS. 2018. “Smoke Plume Shape Files 2006–2013.” Accessed 11 June 2019.https://www.ospo.noaa.gov/Products/land/hms.html.
IHS Markit (2020). Dataset of new vehicle registration by metro area, 2011-2018.
IPCC (2007). Panel on Climate Change. In: Climate Change 2007: Impacts, Adaptation andVulnerability. Contribution of Working Group II to the Fourth Assessment Report of theIntergovernmental Panel on Climate Change, M.L. Parry, O.F. Canziani, J.P. Palutikof, P.J. vander Linden and C.E. Hanson, Eds. Cambridge University Press, Cambridge, UK, 617-652.
Irvine, I. (2017). Electric Vehicle Subsidies in the Era of Attribute-Based Regulations. CanadianPublic Policy, 43, 50-60. https://doi.org/10.3138/cpp.2016-010
Jenn, A., Springel, K., and Gopal, A. R. (2018). Effectiveness of Electric Vehicle Incentives inthe United States. Energy Policy, 119, 349-356. https://doi.org/10.1016/j.enpol.2018.04.065
Jenn, A., Lee, J., Hardman, S., and Tal, G. (2020). An in-depth examination of electric vehicleincentives: Consumer heterogeneity and changing response over time. Transportation ResearchPart A, 132, 97-109.
Larsen A.E., Reich, B. J., Ruminski, M., and Rappold, A.G. (2018). Impacts of Fire SmokePlumes on Regional Air Quality, 2006–2013. Journal of Exposure Science & EnvironmentalEpidemiology 28 (4), 319–327. DOI: 10.1038/s41370-017-0013-x
Lassman, W., Ford, B., Gan, R. W., Pfister, G., Magzamen, S., Fischer, E. V., and Pierce, J. R.(2017). Spatial and Temporal Estimates of Population Exposure to Wildfire Smoke during theWashington State 2012 Wildfire Season using Blended Model, Satellite, and in Situ Data.GeoHealth, 1(3),106–121.
Lei, R., Feng, S., and Lauvaux, T. (2021). Country-Scale Trends in Air Pollution and Fossil FuelCO2 Emissions During 2001-2018: Confronting the Roles of National Policies and EconomicGrowth. Environmental Research Letters, 16, 014006.
Linn, J., and McConnell, V. (2019). Interactions between federal and state policies for reducingvehicle emissions. Energy Policy, 126, 507-517. DOI: 10.1016/j.enpol.2018.10.052
Muehlegger, E., and Rapson, D. (2020). Measuring the Environmental Benefits of ElectricVehicles (Relative to the Car That Wasn’t Bought). NBER Working Paper No. 27197.

23
Okada, T., Tamaki, T., and Managi, S. (2019). Effect of Environmental Awareness on PurchaseIntention and Satisfaction Pertaining to Electric Vehicles in Japan. Transportation Research PartD, Transport and Environment, 67, 503-513.
Ostrom, E. (2000). Crowding out citizenship. Scandinavian Political Studies, 23, 3–16.
Rolph, G. D., Draxler, R. R., Stein, A. F., Taylor A., Ruminski, M. G., Kondragunta, S., Zeng,J., et al. (2009). Description and Verification of the Noaa Smoke Forecasting System: The 2007Fire Season. Weather and Forecasting, 24 (2), 361–378.
Ruminski, M., Kondragunta, S., Draxler, R., and Zeng, J. (2006). Recent Changes to the HazardMapping System. In: 15th International Emission Inventory Conference. New Orleans,Louisiana, May 15-18, 2006.
Shi, H., Wang, S., and Zhao, D. (2017). Exploring Urban Resident’s Vehicular PM2.5 ReductionBehavior Intention: An Application of the Extended Theory of Planned Behavior. Journal ofCleaner Production, 147, 603-613.
Schöllnhammer, T., Hebbinghaus, H., Wurzler, S., and Schultz, T. (2014). Effects of ElectricVehicles on Air Quality in Street Canyons. Meteorologische Zeitschrift, 23(3), 331-336.
Seaton, A., Godden, D., MacNee, W., and Donaldson, K. (1995). Particulate Air Pollution andAcute Health Effects. Lancet, 345(8943), 176–178.
Sexton, S. E., Sexton, A. L. (2014).Conspicuous conservation: The Prius halo and willingness topay for environmental bona fides. Journal of Environmental Economics and Management, 67,303-317.
Soret, A., Guevara, M., and Baldasano, J. M. (2014). The Potential Impacts of Electric Vehicleson Air Quality in the Urban Areas of Barcelona and Madrid (Spain). Atmospheric Environment,99, 51-63. https://doi.org/10.1016/j.atmosenv.2014.09.048
Soriano, J. B., Kendrick, P. J., Paulso, K. R., Gupta, V., Vos, T., and Global Burden of Disease(GBD) Chronic Respiratory Disease Collaborators (2020). Prevalence and attributable healthburden of chronic respiratory diseases, 1990–2017: a systematic analysis for the Global Burdenof Disease study 2017. Lancet Respiratory Medicine, 8, 585–96.
Seaton A., Soutar, A., Crawford, V., Elton, R., McNerlan, S., Cherrie, J., Watt, M., Agius, R., andStout, R. (1999). Particulate Air Pollution and the Blood. Thorax, 54(11), 1027–1032.
Timmers, V. R. J. H., Achten, P. A. J. (2016). Non-exhaust PM emissions from electric vehicles.Atmospheric Environment, 134, 10-17. https://doi.org/10.1016/j.atmosenv.2016.03.017
U.S. Census Bureau. (2011-2018). Table B01003. Total state population. 1-year estimates.
24U.S. Census Bureau (2011-2018). Annual Estimates of the Resident Population for MetropolitanStatistical Areas in the United States and Puerto Rico: April 1, 2010 to July 1, 2019.
U.S. Census Bureau (2016). Core-Based Statistical Areas. Available at:https://www.census.gov/topics/housing/housing-patterns/about/core-based-statistical-areas.html(last access on 20 August 2021)
Wee, S., Coffman, M., and La Croix, S. (2018). Do electric vehicle incentives matter? Evidencefrom the 50 U.S. States. Research Policy, 47(9), 1601-1610.DOI: 10.1016/j.respol.2018.05.003
Wee, S., Coffman, M., and La Croix, S. (2019). Data on U.S. State-Level Electric VehiclePolicies, 2010–2015. Data in Brief 23. https://doi.org/10.1016/j.dib.2019.01.006
White, L. V., and Sintov, N. D. (2017). You are what you drive: Environmentalist and socialinnovator symbolism drives electric vehicle adoption intentions. Transportation Research PartA, 99, 94-113.
Yan, Y., Malik, A. A., Bayham, J., Fenichel, E. P., Couzens, C., and Omer, S. B. (2021).Measuring voluntary and policy-induced social distancing behavior during the COVID-19pandemic. Proceedings of the National Academy of Sciences, April 20, 2021, 118(16)e2008814118. https://doi.org/10.1073/pnas.2008814118
Zarazus de Rubens, G.Z., 2019. Who will buy electric vehicles after early adopters? Usingmachine learning to identify the electric vehicle mainstream market. Energy, 172, 243-254.https://doi.org/10.1016/j.energy.2019.01.114
Zhang, Y., Yu, Y., and Zhou, B. (2011). Analyzing Public Awareness and Acceptance ofAlternative Fuel Vehicles in China: The Case of EV. Energy Policy, 39, 7015-7024.
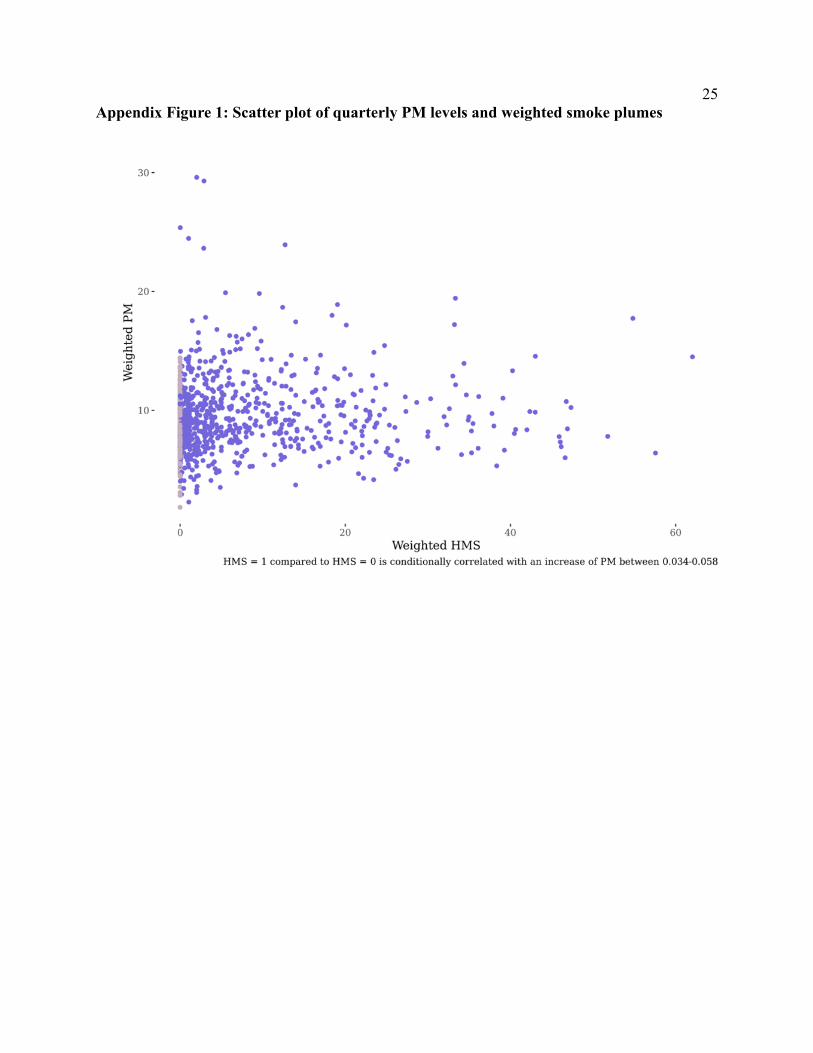
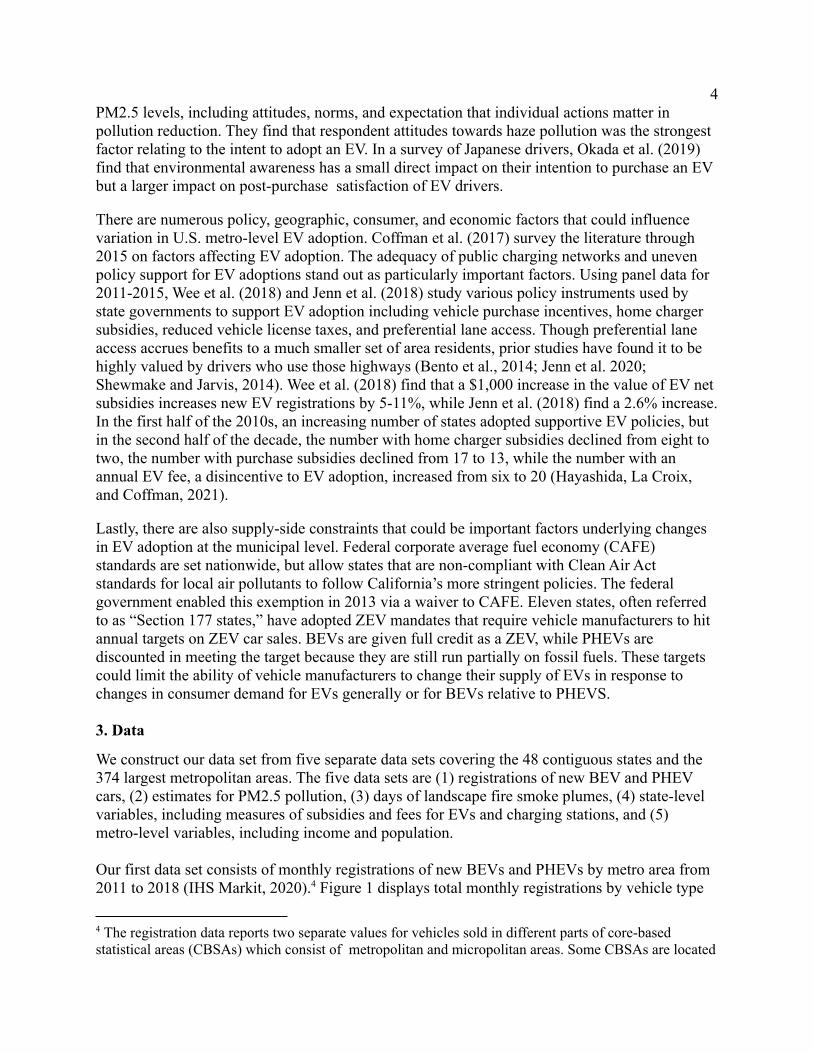
25Appendix Figure 1: Scatter plot of quarterly PM levels and weighted smoke plumes
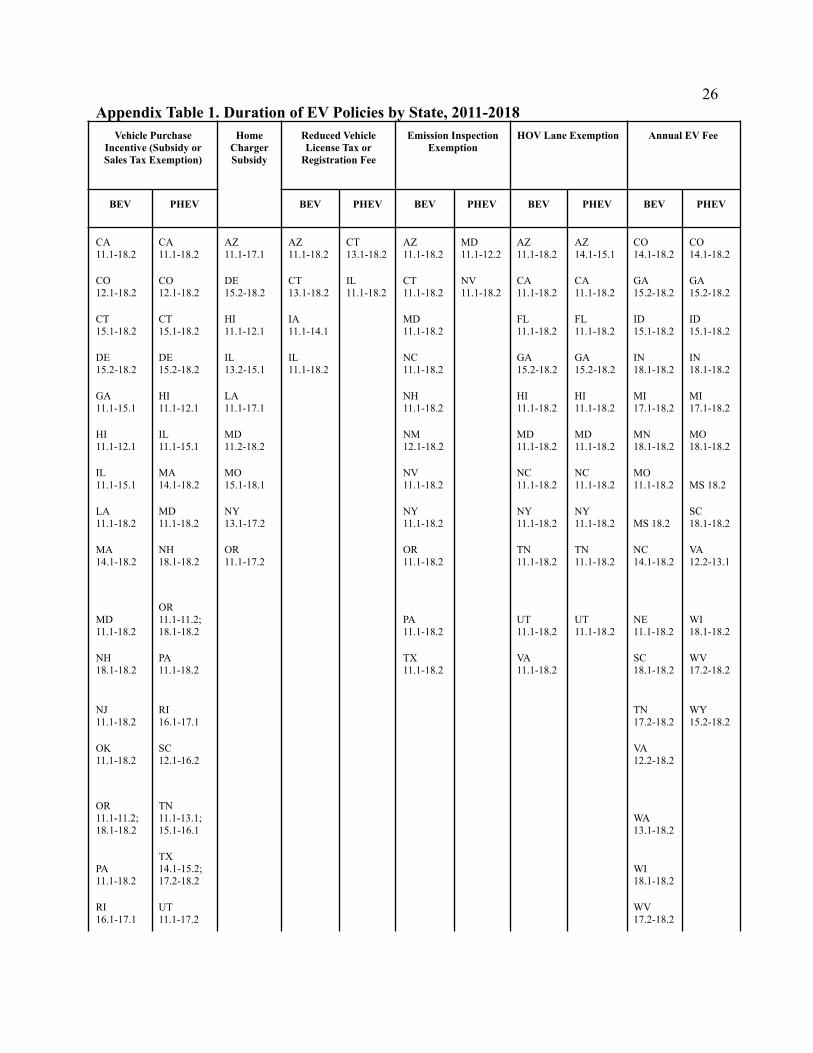
26Appendix Table 1. Duration of EV Policies by State, 2011-2018
Vehicle PurchaseIncentive (Subsidy orSales Tax Exemption)
HomeChargerSubsidy
Reduced VehicleLicense Tax or
Registration Fee
Emission InspectionExemption
HOV Lane Exemption Annual EV Fee
BEV PHEV BEV PHEV BEV PHEV BEV PHEV BEV PHEV
CA11.1-18.2
CA11.1-18.2
AZ11.1-17.1
AZ11.1-18.2
CT13.1-18.2
AZ11.1-18.2
MD11.1-12.2
AZ11.1-18.2
AZ14.1-15.1
CO14.1-18.2
CO14.1-18.2
CO12.1-18.2
CO12.1-18.2
DE15.2-18.2
CT13.1-18.2
IL11.1-18.2
CT11.1-18.2
NV11.1-18.2
CA11.1-18.2
CA11.1-18.2
GA15.2-18.2
GA15.2-18.2
CT15.1-18.2
CT15.1-18.2
HI11.1-12.1
IA11.1-14.1
MD11.1-18.2
FL11.1-18.2
FL11.1-18.2
ID15.1-18.2
ID15.1-18.2
DE15.2-18.2
DE15.2-18.2
IL13.2-15.1
IL11.1-18.2
NC11.1-18.2
GA15.2-18.2
GA15.2-18.2
IN18.1-18.2
IN18.1-18.2
GA11.1-15.1
HI11.1-12.1
LA11.1-17.1
NH11.1-18.2
HI11.1-18.2
HI11.1-18.2
MI17.1-18.2
MI17.1-18.2
HI11.1-12.1
IL11.1-15.1
MD11.2-18.2
NM12.1-18.2
MD11.1-18.2
MD11.1-18.2
MN18.1-18.2
MO18.1-18.2
IL11.1-15.1
MA14.1-18.2
MO15.1-18.1
NV11.1-18.2
NC11.1-18.2
NC11.1-18.2
MO11.1-18.2 MS 18.2
LA11.1-18.2
MD11.1-18.2
NY13.1-17.2
NY11.1-18.2
NY11.1-18.2
NY11.1-18.2 MS 18.2
SC18.1-18.2
MA14.1-18.2
NH18.1-18.2
OR11.1-17.2
OR11.1-18.2
TN11.1-18.2
TN11.1-18.2
NC14.1-18.2
VA12.2-13.1
MD11.1-18.2
OR11.1-11.2;18.1-18.2
PA11.1-18.2
UT11.1-18.2
UT11.1-18.2
NE11.1-18.2
WI18.1-18.2
NH18.1-18.2
PA11.1-18.2
TX11.1-18.2
VA11.1-18.2
SC18.1-18.2
WV17.2-18.2
NJ11.1-18.2
RI16.1-17.1
TN17.2-18.2
WY15.2-18.2
OK11.1-18.2
SC12.1-16.2
VA12.2-18.2
OR11.1-11.2;18.1-18.2
TN11.1-13.1;15.1-16.1
WA13.1-18.2
PA11.1-18.2
TX14.1-15.2;17.2-18.2
WI18.1-18.2
RI16.1-17.1
UT11.1-17.2
WV17.2-18.2
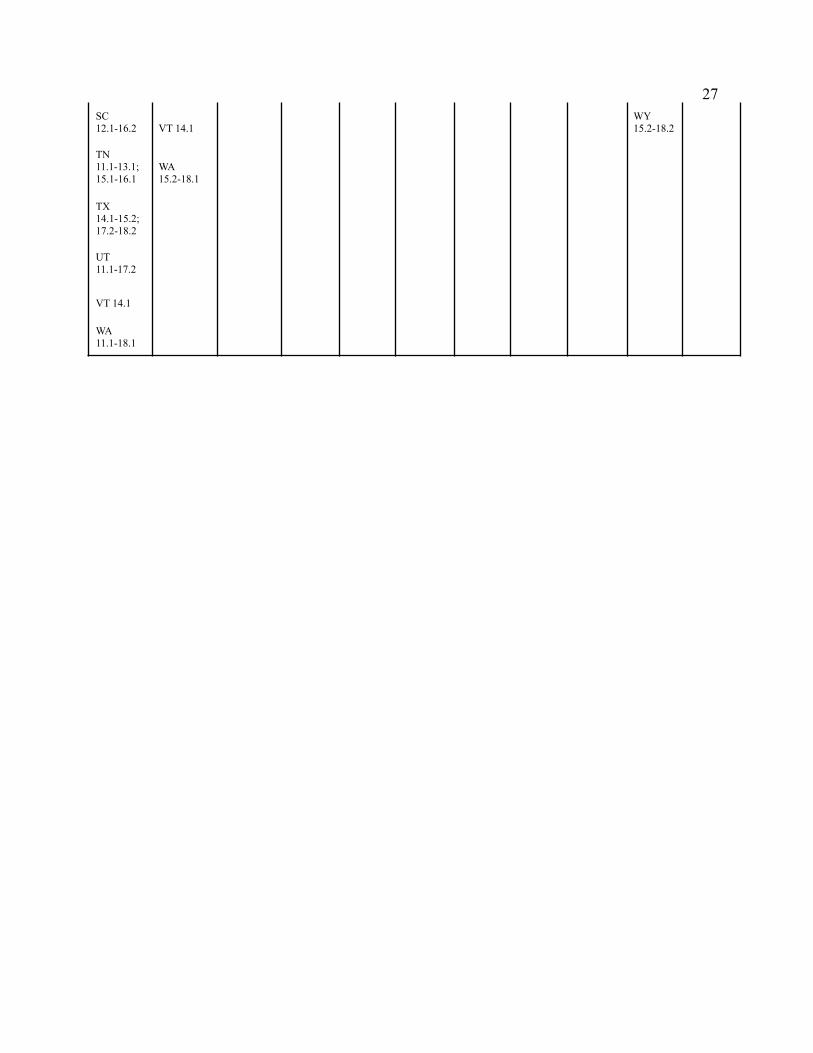
27SC12.1-16.2 VT 14.1
WY15.2-18.2
TN11.1-13.1;15.1-16.1
WA15.2-18.1
TX14.1-15.2;17.2-18.2
UT11.1-17.2
VT 14.1
WA11.1-18.1

28Appendix Table 2. State Policy Variable Descriptions, Summary Statistics, and Data Sources: 2011 - 2018.
Variable Description Mean S.D. Min. Max. Source
EV Policies
BEVpurchaseincentive
Dollar value of vehiclepurchase incentive (in theform of a rebate, subsidy,income tax credit, excisetax credit, or sales taxexemption) in state s inhalf-year t
902 1,428 0 6,000 AFDC, 2019; govt websites; phone calls and emailcorrespondences.
PHEVpurchaseincentive
481 1,043 0 6,000 AFDC, 2019; govt websites; phone calls and emailcorrespondences.
Home chargersubsidy
Dollar value of homecharge subsidy forhardware and/orinstallation in state s inhalf-year t
45 180 0 1,500 AFDC, 2019; govt websites; phone calls and emailcorrespondences.
BEV reducedVLT orregistrationfee
Present value savings fromreduced VLT orregistration fee in state sover six-year vehicleownership based on theapplicable fee in thepurchase period andfrequency assessed
58 265 0 1,599 AFDC, 2019; govt websites; phone calls and emailcorrespondences.
PHEVreduced VLTor registrationfee
17 89 0 528 AFDC, 2019; govt websites; phone calls and emailcorrespondences.
BEVemissionsinspection feeexemption
Present value savings fromemissions inspection feeexemption in state s oversix-year vehicleownership based on theapplicable fee in the
20 44 0 184 AFDC, 2019; govt websites; phone calls and emailcorrespondences.
29purchase period andfrequency assessed
PHEVemissionsinspection feeexemption
0.31 3.0 0 35 AFDC, 2019; govt websites; phone calls and emailcorrespondences.
BEV HOVaccess value
Present value of HOVaccess value in state s oversix-year vehicle ownershipbased on the initialpurchase period value
590 1,021 0 3,493AFDC, 2019; govt websites; phone calls and emailcorrespondences; Texas A&M Transportation Institute,1982-2017.
PHEV HOVaccess value 392 711 0 2,799 AFDC, 2019; govt websites; phone calls and email
correspondences.
Annual BEVfee Present value of the annual
EV fee in state s oversix-year vehicle ownershipbased on the initialpurchase period value
95 238 0 1,139 AFDC, 2019; govt websites; phone calls and emailcorrespondences.
AnnualPHEV fee
36 151 0 1,139AFDC, 2019; govt websites; phone calls and emailcorrespondences.
BEVsubsidies
Dollar value of vehiclepurchase incentive, homecharger subsidy, reducedregistration fee/vehiclelicense tax, emissions feeabated, annual fee (-), andHOV access valueweighted by population instate s at in half-year t
1,479 1,837 -1,066 6,000 AFDC, 2019; govt websites; phone calls and emailcorrespondences.
PHEVsubsidies 1,045 1,551 -533 6,000 AFDC, 2019; govt websites; phone calls and email
correspondences.
BEV index(scalar 1-2)
Number of parking policyinstruments (designatedparking, and free parking)effective in state s inhalf-year t
0.16 0.37 0 1 AFDC, 2019; govt websites; phone calls and emailcorrespondences.
PHEV index(scalar 1-2) 0.16 0.37 0 1 AFDC, 2019; govt websites; phone calls and email
correspondences.
30Appendix Table 3. Poisson Psuedomaximum Likelihood Regressions with A4LAdjustedSmokePlumes: BEV Sample
(1) (2) (3) (4) (5) (6) (7) (8)
Full Sample Split SampleSplit
Sample Without With Above Population Income ZEV2011-2018 2011-2014 2015-2018 California Median Sales Interaction Interaction Interaction
A4LPM2.5 0.20943*** -0.11920 0.29343*** 0.21621*** 0.21701*** 0.16091*** 0.08496 0.24335***[0.035] [0.106] [0.051] [0.036] [0.037] [0.035] [0.154] [0.040]
A4LPM2.5 * Treatment 0.00228** 0.35622 -0.09652[0.001] [0.459] [0.073]
A4LAdjustedSmokePlume -0.02468** 0.01481 -0.05202** -0.02753** -0.02732** -0.03512** -0.01033 -0.02973**[0.012] [0.022] [0.022] [0.012] [0.013] [0.014] [0.082] [0.014]
A4LAdjustedSmoke Plume * Treatment 0.00050** -0.03910 0.01125[0.000] [0.245] [0.029]
BEV-Subsidies 0.00018 0.00010 0.00019 0.00019 0.00018 0.00018 0.00018 0.00018[0.000] [0.000] [0.000] [0.000] [0.000] [0.000] [0.000] [0.000]
PublicChargers 0.00004 -0.00022* -0.00001 0.00130*** 0.00004 0.00004 0.00003 0.00005[0.000] [0.000] [0.000] [0.000] [0.000] [0.000] [0.000] [0.000]
Constant 4.08783*** 6.61005*** 3.81607*** 3.26233*** 4.14668*** 3.97258*** 4.06989*** 4.06392***[0.415] [1.016] [0.554] [0.295] [0.435] [0.404] [0.456] [0.401]
Obs 11,852 5,416 6,436 11,076 4,699 11,852 11,852 11,852Metro-Year FE Yes Yes Yes Yes Yes Yes Yes YesQuarter FE Yes Yes Yes Yes Yes Yes Yes YesRobust standard errors in brackets. *** p<0.01, ** p<0.05, * p<0.1

31Appendix Table 4. Poisson Pseudomaximum Likelihood Regressions with A4LAdjustedSmokePlumes: PHEV Sample
(1) (2) (3) (4) (5) (6) (7) (8)Full Sample Split Sample Split Sample Without With Above Population Income ZEV2011-2018 2011-2014 2015-2018 California Median Sales Interaction Interaction Interaction
A4LPM2.5 -0.09803*** -0.25195*** -0.06788*** -0.12024*** -0.09630*** -0.08137*** -0.27513*** -0.11662***[0.022] [0.051] [0.022] [0.014] [0.024] [0.022] [0.068] [0.014]
A4LPM2.5 * Treatment -0.00073*** 0.52166** 0.06280[0.000] [0.208] [0.042]
A4LAdjustedSmokePlume 0.01030 0.01525 0.01937*** 0.00919 0.00426 0.00498 -0.03714 0.00396[0.013] [0.036] [0.005] [0.015] [0.013] [0.014] [0.048] [0.016]
A4LAdjustedSmokePlume * Treatment 0.00022** 0.14538 0.02656[0.000] [0.115] [0.018]
PHEV-Subsidies -0.00002 -0.00007 -0.00001 -0.00002 -0.00002 -0.00002 -0.00002 -0.00002[0.000] [0.000] [0.000] [0.000] [0.000] [0.000] [0.000] [0.000]
PublicChargers -0.00006** -0.00052*** -0.00001 -0.00024* -0.00005* -0.00006** -0.00006** -0.00006**[0.000] [0.000] [0.000] [0.000] [0.000] [0.000] [0.000] [0.000]
Constant 6.79456*** 8.05080*** 6.67982*** 6.80754*** 6.98549*** 6.83360*** 6.75166*** 6.80218***[0.174] [0.466] [0.151] [0.110] [0.188] [0.182] [0.133] [0.137]
Obs 12,856 6,328 6,528 12,060 4,699 12,856 12,856 12,856Metro-Year FE Yes Yes Yes Yes Yes Yes Yes YesQuarter FE Yes Yes Yes Yes Yes Yes Yes YesNote: Robust standard errors in brackets. *** p<0.01, ** p<0.05, * p<0.1

32Appendix Table 5. Poisson Pseudomaximum Likelihood Regressions with AQI Pollution: BEV Sample
(1) (2) (3) (4) (5) (6) (7) (8)Full Sample Split Sample Split Sample Without With Above Population Income ZEV2011-2018 2011-2014 2015-2018 California Median Sales Interaction Interaction Interaction
A4LAIQ 0.03206*** 0.00430 0.04948*** 0.02362** 0.03231*** 0.02224** 0.02067 0.03012***[0.011] [0.012] [0.019] [0.011] [0.011] [0.011] [0.013] [0.012]
A4LAIQ* Treatment 0.00386*** 0.43880*** 0.08258[0.001] [0.133] [0.074]
A4LSmoke Plume -0.00794* 0.02019* -0.02349*** 0.00052 -0.00928** -0.01106** -0.00327 -0.00672[0.004] [0.011] [0.005] [0.004] [0.004] [0.005] [0.010] [0.005]
A4LSmoke Plume * Treatment 0.00010 -0.07359 -0.01453[0.000] [0.073] [0.025]
BEV-Subsidies 0.00018 0.00007 0.00019 0.00020 0.00018 0.00018 0.00018 0.00019[0.000] [0.000] [0.000] [0.000] [0.000] [0.000] [0.000] [0.000]
Public Chargers 0.00008** -0.00026** 0.00006 0.00131*** 0.00008** 0.00006* 0.00004 0.00007*[0.000] [0.000] [0.000] [0.000] [0.000] [0.000] [0.000] [0.000]
Constant 4.12968*** 5.35603*** 3.59567*** 3.84512*** 4.22589*** 3.75760*** 3.46198*** 4.00815***[0.364] [0.765] [1.011] [0.423] [0.371] [0.425] [0.480] [0.378]
Obs 10,632 4,891 5,741 9,856 4,424 10,632 10,632 10,632Metro-Year FE Yes Yes Yes Yes Yes Yes Yes YesQuarter FE Yes Yes Yes Yes Yes Yes Yes YesNote: Robust standard errors in brackets. *** p<0.01, ** p<0.05, * p<0.1
33Appendix Table 6. Poisson Pseudomaximum Likelihood Regressions with AQI Pollution: PHEV Sample
(1) (2) (3) (4) (5) (6) (7) (8)Full Sample Split Sample Split Sample Without With Above Population Income ZEV2011-2018 2011-2014 2015-2018 California Median Sales Interaction Interaction Interaction
A4LAQI -0.02419*** -0.05576*** -0.00234 -0.02337** -0.02569*** -0.02267** -0.02023** -0.02432***[0.008] [0.012] [0.003] [0.011] [0.009] [0.009] [0.008] [0.009]
A4LAQ*I Treatment -0.00122*** -0.11677 -0.00322[0.000] [0.079] [0.045]
A4LSmoke Plume 0.01631*** 0.05475*** 0.00510 0.01051*** 0.01503*** 0.01562*** 0.02214*** 0.01500***[0.004] [0.009] [0.004] [0.002] [0.004] [0.005] [0.005] [0.004]
A4LSmoke Plume * Treatment 0.00017* -0.04128 0.01500[0.000] [0.041] [0.010]
BEV-Subsidies -0.00001 -0.00013 -0.00001 -0.00001 -0.00001 -0.00001 -0.00001 -0.00001[0.000] [0.000] [0.000] [0.000] [0.000] [0.000] [0.000] [0.000]
Public Chargers -0.00007** -0.00050*** -0.00003 -0.00022 -0.00006** -0.00007** -0.00007** -0.00008***[0.000] [0.000] [0.000] [0.000] [0.000] [0.000] [0.000] [0.000]
Constant 7.22249*** 8.56347*** 6.35172*** 6.99109*** 7.49905*** 7.44709*** 7.33966*** 7.23935***[0.404] [0.593] [0.141] [0.472] [0.418] [0.452] [0.404] [0.407]
Obs 11,436 5,628 5,808 10,640 4,424 11,436 11,436 11,436Metro-Year FE Yes Yes Yes Yes Yes Yes Yes YesQuarter FE Yes Yes Yes Yes Yes Yes Yes YesNote: Robust standard errors in brackets. *** p<0.01, ** p<0.05, * p<0.1

34Highlights
● We analyze the effect of air pollution on EV adoption in 350 U.S. metro areas.
● Two measures of pollution, PM2.5 particles and wildfire smoke plumes, are specified.
● We use a Poisson pseudomaximum likelihood high definition fixed effect estimator.
● Increases in PM2.5 pollution result in more BEV and less PHEV adoptions.
● Increases in smoke plume pollution result in less BEV and more PHEV adoptions.
Related Documents