Does a cross-cultural peer-to-peer mentoring experience influence students’ cross-cultural adaptability? A thesis submitted in fulfilment of the requirements for the degree of Doctor of Philosophy Kathleen Elizabeth Adams Master of Education (RMIT University), Master of Business Administration (RMIT University), Bachelor of Economics, Monash University School of Economics Finance and Marketing College of Business RMIT University November 2019.

Welcome message from author
This document is posted to help you gain knowledge. Please leave a comment to let me know what you think about it! Share it to your friends and learn new things together.
Transcript
Does a cross-cultural peer-to-peer mentoring experience influence students’ cross-cultural adaptability?
A thesis submitted in fulfilment of the requirements for the degree of Doctor of Philosophy
Kathleen Elizabeth Adams
Master of Education (RMIT University), Master of Business Administration (RMIT University), Bachelor of Economics, Monash University
School of Economics Finance and Marketing
College of Business
RMIT University
November 2019.
ii
DECLARATION
I certify that except where due acknowledgment has been made, the work is that of the author
alone: the work has not been submitted previously, in whole or in part, to qualify for any other
academic award; the content of the thesis is the result of work which has been carried out since
the official commencement date of the approved research program; any editorial work, paid or
unpaid, carried out by a third party is acknowledged; and ethics procedures and guidelines have
been followed.
I acknowledge the support I have received for my research through the provision of an
Australian Government Research Training Program Scholarship.
Kathleen Elizabeth Adams
Date: 26th November, 2019
iii
ACKNOWLEDGEMENTS They say that it takes a village to raise a child, but in this instance, the child is this thesis. Of
all the people who were in my “village” I would like to say thank you to my sons, Dylan
Sweeny and his fiancée Amy, and Bryce Sweeny together with his partner Bec for their
patience and kindness throughout this journey. I need to thank God, for when there were only
one set of footprints in the sand, it was because He carried me when I found this too hard. I
also need to acknowledge my husband David who was there through most of a very difficult
experience.
To my extended family, and all my friends I would like to thank you for your unwavering belief
that I could finish this thesis. In particular I would like to thank my sister Alison and my
brother-in-law, Bruce, as well as Chen, Penny, Marg, K and Cate who all saw the blood sweat
and tears that went into this thesis and I hope they know that their words of encouragement
meant the world to me.
To all my colleagues both past and present; my previous Head of School, Professor Tim Fry,
my Dean, Professor Heath McDonald and my discipline leaders during this process, Professor
Francis Farrelly, Associate Professor Michael Schwartz, Professor Mike Reid and Associate
Professor Angela Dobele I say a very big thank-you. Again, your support has been greatly
appreciated. Our previous head of school, Professor Tony Naughton, died the week before I
was accepted into the PhD program. I hope he is proud that I finished it.
To all of my wonderful colleagues who are too numerous to name, whether they agreed that I
could approach their students for my study, if they took the time to pilot my survey, or if they
smiled or asked how I was, and even the dreaded question “how’s your PhD going”? Their
support has been wonderful, and I hope they know how much I appreciated it.
My fellow PhD students were also incredibly supportive; but I would especially like to thank
Neha Bajaj, Avni Misra and Jane Fry, who made this journey less lonely. We shared lots of
hugs, smiles and tears.
iv
I also want to thank the wonderful people who took care of my body, mind and soul, namely
Dr Adrian Tang, Dr Karen McGraw and Dr John Reggars. To my editor, Judy Gregory, I would
also like to thank her for her assistance.
But most of all I would like to thank my amazing supervisory team. Firstly, I have nothing but
praise for my senior supervisor, Associate Professor Zografina Kopanidis (Foula). I have such
respect and admiration for her for believing in me since the beginning, being patient and kind,
and teaching me the “art of research”. Over the years, she has been nothing short of amazing.
I would also like to thank Dr Sveta Angelopoulos, a late addition to my team, but her
unflappable demeanour when reviewing my work and answering my questions was invaluable.
And to the remaining team member, Dr Marion Steel - she may have escaped to another
university, but she couldn’t escape me. I want to especially thank her for her editing skills and
encouragement.
My fur children, Titan and Skye, have slept on blankets in front of my desk for many years and
have cuddled and licked me whenever they sensed I needed encouragement. I’m not sure what
they will do now that I am no longer at the computer for hours and hours often seven days per
week.
And finally, to mangle a quote attributed to Pope Julius II who asked Michelangelo when he
was painting the Sistine Chapel “when would you make an end”? I say, “This PhD will never
be finished, but it is submitted”.

v
For Mum, Dad and Tony
vi
PEER-REVIEWED ARTICLES AND CONFERENCE PAPERS
Journal article:
Griffiths, K., Kopanidis, F., & Steel, M. (2018). Investigating the value of a peer-to-peer
mentoring experience. Australasian Marketing Journal (AMJ), 26(2), 92-98. (Q2)
Conference Papers:
1. Australian and New Zealand Marketing Association Conference. Wellington, NZ, December 2019. (Winner of Best Paper in the Marketing Education Track). Griffiths, K., Kopanidis, F., Angelopoulos S., & Steel, M. Which international experiences impact cross-cultural adaptability?
2. Australian and New Zealand Marketing Association Conference, Adelaide, December 2018.
Griffiths, K., Kopanidis, F., Angelopoulos S., & Steel, M. Do marketing students gain cross-cultural skills as a result of undertaking a peer-peer mentoring experience “at home”.
3. World Association for Co-operative Education 3rd International Research Symposium
in Stuttgart, Germany, June 2018. Griffiths, K., Kopanidis, F., & Steel, M. Is there value for higher education students to undertake a cross-cultural peer-to-peer mentoring experience?
4. Australian and New Zealand Marketing Association Conference, Melbourne, December 2017.
Griffiths, K., Kopanidis, F., & Steel, M. Investigating the value of a peer-to-peer mentoring experience.
5. Office of Teaching and Learning Symposium, Sydney, June 2016.
Griffiths, K., Kopanidis, F., & Steel, M. To investigate functional outcomes of a cross-cultural formal peer-to-peer mentoring experience on higher education students’ cross-cultural adaptability
ross-
vii
TABLE OF CONTENTS
CHAPTER 1 INTRODUCTION ............................................................................................ 3 1.1 Introduction ..................................................................................................................... 3 1.2 Objectives of this study ................................................................................................... 3 1.3 Context for this study ...................................................................................................... 5 1.4 Contribution of this research .............................................................................................. 9 1.5 Methodology ................................................................................................................. 12 1.6 Outline of this thesis ...................................................................................................... 13 1.7 Delimitations of scope and key assumptions ................................................................ 15 1.8 Conclusion ..................................................................................................................... 16 1.9 Definitions of terms ....................................................................................................... 17
CHAPTER 2 LITERATURE REVIEW .............................................................................. 20 2.1 Introduction ................................................................................................................... 20 2.2 Theoretical Frameworks ................................................................................................ 23
2.2.1 Intergroup Contact Theory ........................................................................... 24 2.2.2 Social Learning Theory ................................................................................ 25 2.2.3 Theory of Cross-Cultural Adaptation........................................................... 26 2.2.4 Cross-Cultural Adaptability Inventory ......................................................... 27 2.2.5 The CCAI and Emotional Intelligence ......................................................... 29 2.2.6 Culture .......................................................................................................... 31
2.3 Cross-cultural skills development ................................................................................. 33 2.3.1 Cross-Cultural Adaptability in Higher Education
students .................................................................................................... 34 2.3.2 Cross-cultural Enjoyment ............................................................................ 35 2.3.3 Cross-cultural Tolerance .............................................................................. 36 2.3.4 Cross-cultural Personal Values .................................................................... 38 2.3.5 Cross-cultural Valuing Others...................................................................... 39 2.3.6 Cross-Cultural Communication in Higher Education students
....................................................................................................... 40 2.3.7 Cross-Cultural Competence in Higher Education
students .................................................................................................... 41 2.4 Peer-to-peer mentoring .................................................................................................. 43
2.4.1 Academic peer-to-peer mentoring in Universities ....................................... 45 2.5 Demographics and socio-economic factors................................................................... 49 2.6 Socialisation .................................................................................................................. 51 2.7 Previous private international experiences .................................................................... 56 2.8 Offshore international academic experiences ............................................................... 58 2.9 At home international academic experiences ................................................................ 62 2.10 Conclusion ..................................................................................................................... 69
viii
CHAPTER 3 RESEARCH METHODOLOGY .................................................................. 70 3.1 Introduction ................................................................................................................... 70 3.2 Research Approach ....................................................................................................... 71
3.2.1 The research paradigm ................................................................................. 72 3.2.2 The SLMs Experience (the manipulation) .................................................... 72 3.2.2 Quasi-experimental design ........................................................................... 73
3.3 Description of Sampling Plan ....................................................................................... 75 3.4 Implementation of the Measurement Instrument .......................................................... 75
3.4.1 The Content .................................................................................................. 76 3.5 Data Collection .............................................................................................................. 82
3.5.1 Semester 1, 2017 Pre-Test ........................................................................... 82 3.5.2 Semester 1, 2017 Post-test ........................................................................... 83 3.5.3 Semester 2, 2017 Pre-Test ........................................................................... 83 3.5.4 Semester 2, 2017 Post-test ........................................................................... 83
3.6 Data Set ......................................................................................................................... 84 3.6.1 The Independent Variables .......................................................................... 84 3.6.2 The Dependent Variables ............................................................................ 85
3.7 Original cultural dimensions from the CCAI™ ............................................................ 86 3.7.1 Emotional Resilience ................................................................................... 86 3.7.2 Flexibility/Openness .................................................................................... 86 3.7.3 Perceptual Acuity ............................................................................ 86 3.7.4 Personal Autonomy ...................................................................................... 87
3.8 Covariates ...................................................................................................................... 87 3.8.1 Demographic and Socio-economic factors .................................................. 87 3.8.2 Socialising .................................................................................................... 87 3.8.3 Previous Private International Experiences ................................................. 88 3.8.4 External International Academic Experiences ............................................. 88 3.8.5 Internal International academic experiences ................................................ 88
3.9 Approach to the Analysis .............................................................................................. 88 3.9.1 Descriptive Statistics .................................................................................... 89 3.9.2 Exploratory Factor Analysis ....................................................................... 89
3.10 Statistical Methods used ................................................................................................ 91 3.11 Summary ...................................................................................................................... 92
CHAPTER 4 ANALYSIS OF STUDENT SAMPLES ....................................................... 94 4.1 Introduction ................................................................................................................... 94 4.2 Profile of Questionnaire Respondents .......................................................................... 95 4.3 Demographic and Socio-economic Factors................................................................... 97 4.4 Socialising ................................................................................................................... 100 4.5 Private international experiences ................................................................................ 101 4.6 External International Academic experiences ............................................................. 103 4.7 Internal International Academic Experiences ............................................................. 105 4.8 Profile Summary of all Respondents ........................................................................... 106 4.9 Respondents’ top questions from the CCAI™ ............................................................ 107
ix
4.9.1 Emotional Resilience: The Top Questions ................................................. 108 4.9.2 Flexibility Openness: The Top Questions .................................................. 109 4.9.3 Perceptual Acuity: The Top Questions ...................................................... 109 4.9.4 Personal Autonomy: The Top Questions ................................................... 110
4.10 Measurement scale examination ............................................................................... 111 4.10.1 Assessing the suitability of the data for Exploratory Factor
Analysis (EFA) .......................................................................................... 112 4.10.2 Review of component and pattern matrices using Principal
Factor Analysis (PCA) ............................................................................... 113 4.10.3 Review of communalities - PCA ............................................................. 114 4.10.4 Review of Total Variance........................................................................ 114 4.10.5 Oblique factor rotation ............................................................................ 114 4.10.6 Orthogonal factor rotation ...................................................................... 115 4.10.7 Final assessment of reliability ................................................................ 117 4.10.8 Final Factor Groupings ............................................................................ 117 4.10.9 The ETPV conceptual model .................................................................. 120 4.10.10 The Enjoyment, Tolerance, Personal Values and Valuing
Others factors ............................................................................................. 121 4.10.10.1Enjoyment scale ...................................................................... 121
4.10.10.2 Tolerance scale ....................................................................... 121
4.10.10.3 Personal values scale .............................................................. 122
4.10.10.4 Valuing others scale ............................................................... 122
4.11 Descriptive statistics for the adapted cultural dimensions of enjoyment, tolerance, personal values and valuing others.............................................................................. 122
4.12 Descriptive statistics for the fifteen covariates ........................................................... 125 4.13 Conclusion ................................................................................................................... 126
CHAPTER 5 ANALYSIS OF RESULTS .......................................................................... 128 5.1 Introduction .................................................................................................................... 128 5.2 Research question one - Peer-to-peer mentoring influence ........................................ 129 5.3 Assumption testing for analysis of variance using ANOVA ......................................... 130
5.3.1 Sample size................................................................................................. 130 5.3.2 Normality using Q-Q scatter plots ............................................................. 130
5.3.2.1Shapiro Wilk tests of normality .................................................. 130
5.3.3 Homoscedasticity ....................................................................................... 131 5.3.4 Multivariate Outliers. ................................................................................. 132 5.3.5 Sphericity ................................................................................................... 132 5.3.6 Multicollinearity and singularity ................................................................ 133 5.3.7 Linearity ..................................................................................................... 134 5.3.8 Homogeneity of variance-covariance matrices .......................................... 134
5.4 Analysis of variance results......................................................................................... 134 5.4.1 Cross-Cultural Enjoyment Dimension ....................................................... 135 5.4.2 Cross-Cultural Tolerance Dimension ......................................................... 136
x
5.4.3 Cross-cultural Personal Values Dimension ................................................ 137 5.4.4 Cross-cultural Valuing Others Dimension ................................................. 139 5.4.5 Research question one summary ................................................................ 141
5.5 Research Question Two – Effect of Previous Experiences ......................................... 142 5.5.1 Repeated Measures Multivariate Analysis of Covariance
(MANCOVA) Results ................................................................................ 146 5.5.2 Differences between the groups - demographic and socio-
economic factors ........................................................................................ 147 5.5.2.1 Differences within each group’s pre- and post-responses per
dimension- demographics and socio-economic factors ................................ 149
5.5.3 Differences between-groups – socialising ................................................. 152 5.5.3.1Differences within each group for their pre- and post-responses per
dimension- socialising ................................................................................... 154
5.5.4 Differences between-groups for their pre- and post-test responses per dimension – private international experiences .................... 155
5.4.1 Differences within each group for their pre- and post-responses per dimension- private international experiences ...................... 156
5.5.5 Differences between-groups for their pre- and post-test responses per dimension – external international experiences .................. 158
5.5.5.1 Differences within each group for their pre- and post-responses per dimension- external international experiences .............................................. 159
5.5.6 Differences between-groups for their pre- and post-test responses per dimension – internal international experiences ............................ 161
5.5.6.1 Differences within each group for their pre- and post-responses per dimension- internal international experiences .............................................. 163
5.5.7 Research question two summary .............................................................. 165 5.6 Conclusion ................................................................................................................... 167
CHAPTER 6 DISCUSSION AND CONCLUSION .......................................................... 169 6.1 Introduction ................................................................................................................. 169 6.2 Hypotheses: An Overview .......................................................................................... 170 6.3 Cross-cultural skills development in graduates ........................................................... 173 6.4 Development of the proposed conceptual model ....................................................... 174 6.5 Contributions of this thesis to literature ...................................................................... 174
6.5.1 Internal drivers of cross-cultural adaptability ............................................ 175 6.5.2 External drivers of cross-cultural adaptability - covariates........................ 175
6.5.2.1 Demographics and socio-economic factors ................................ 176
6.5.2.2 Socialising .................................................................................. 176
6.5.2.3 Private international experiences ............................................... 177
6.5.2.4 External international academic experiences ............................. 177
6.5.2.5 Internalinternationalacademicexperiences ................................. 178
6.5.3 Results of the peer-to-peer mentoring experience ..................................... 180 6.6 Managerial / Business contributions ........................................................................... 181 6.7 Higher Education contributions .................................................................................. 182 6.8 Limitations of this thesis ............................................................................................. 185
xi
6.9 Further research recommended ................................................................................... 187 6.10 Conclusion ................................................................................................................... 191
6.10.1 Employability skills ................................................................................. 191 6.10.2 Cross-cultural skills development ............................................................ 191 6.10.3 Results of this study ................................................................................. 192 6.10.4 Contributions of this thesis....................................................................... 192
Reference List ....................................................................................................................... 194
xii
List of Tables
Table 3.1 Selection of students for this study…………………………………………..75
Table 3.2 Variables and corresponding number of questionnaire items………………..80
Table 3.3 A summary of the data analysis strategy……………………………………..92
Table 4.1 Respondents by subject and Bachelor of Business degree program…………95
Table 4.2 Demographic and socio-economic factors…………………………………...97
Table 4.3 Socialising…………………………………………………………………..100
Table 4.4 Private international experiences…………………………………………....102
Table 4.5 External international academic experiences………………………………..103
Table 4.6 Internal international academic experiences………………………………...105
Table 4.7 Top questions – Emotional Resilience……………………………………....108
Table 4.8 Top questions – Flexibility Openness……………………………………….109
Table 4.9 Top questions – Perceptual Acuity………………………………………….110
Table 4.10 Top questions – Personal Autonomy………………………………………..110
Table 4.11 KMO and Bartlett’s Test – all 50 questions………………………………...113
Table 4.12 KMO and Bartlett’s Test – PCA and Varimax……………………………...115
Table 4.13 KMO and Bartlett’s Test – questions removed……………………………..116
Table 4.14 KMO and Bartlett’s Test – questions removed……………………………..116
Table 4.15 Final factor loadings………………………………………………………...117
Table 4.16 Summary descriptive statistics – enjoyment, tolerance, personal values and
valuing others……………………………………………………………………………….124
Table 4.17 Summary descriptive statistics for all covariates……………………………126
Table 5.1 Summary Levene’s Test results……………………………………………..132
Table 5.2 Box’s Test of Equality of Covariance Matrices……………………………...134
Table 5.3 Mixed-model ANOVA results – Enjoyment………………………………..135
Table 5.4 Mixed-model ANOVA results – Tolerance…………………………………136
Table 5.5 Mixed-model ANOVA results – Personal Values…………………………..137
Table 5.6 Marginal means contrasts for each combination of within-subject variables for
the mixed-model ANOVA – Personal Values……………………………………………....138
Table 5.7 Mixed-model ANOVA results – Valuing Others……………………………139
Table 5.8 Marginal means contrasts for each combination of within-subject variables for
the mixed-model ANOVA – Personal Values………………………………………………140
xiii
Table 5.9 Summary of whether exposure to a cross-cultural peer-to-peer mentoring
experience influences students’ cross-cultural adaptability…………………………………142
Table 5.10a Between-groups - demographics and socio-economic factors………………148
Table 5.10b Within-groups - demographics and socio-economic factors………………...150
Table 5.10c Between-groups – socialising……………………………………………….153
Table 5.10d Within-groups – socialising…………………………………………………154
Table 5.10e Between-groups - previous private international experiences……………….156
Table 5.10f Within-groups - previous private international experiences…………………157
Table 5.10g Between-groups – previous external international academic experiences…..158
Table 5.10h Within-groups - previous external international academic experiences……..160
Table 5.10i Between-groups - previous internal international academic experiences……162
Table 5.10j Within-groups - previous internal international academic experiences……..163
Table 5.11 Covariates hypotheses summary………………………………………..…...165
Table 6.1 Hypotheses set one – mixed-model analysis of variance ……………………170
Table 6.2 Hypotheses set two – repeated measures analysis of covariance……………171
Table 6.3 Hypotheses set three – repeated measures analysis of covariance…………..171
Table 6.4 Hypotheses set four – repeated measures analysis of covariance……………172
Table 6.5 Hypotheses set five – repeated measures analysis of covariance……………172
Table 6.6 Hypotheses set six – repeated measures analysis of covariance…………….173
xiv
List of Figures
Figure 2.1 An overview of the literature review…………………………………………23
Figure 2.2 Theoretical components of cross-cultural learning…………………………...24
Figure 3.1 Overview of methodology……………………………………………………71
Figure 5.1 Estimated marginal means – Enjoyment…………………………………….135
Figure 5.2 Estimated marginal means – Tolerance……………………………………...137
Figure 5.3 Estimated marginal means – Personal Values……………………………….139
Figure 5.4 Estimated marginal means – Valuing Others………………………………..141
Figure 5.5 The proposed conceptual model (ETPV)…………………………………...168
xv
List of Abbreviations
Abbreviation Explanation
ANOVA Analysis of variance
BIHECC (BIHECC). Business, Industry and Higher Education Collaboration Council
CCAI™ Cross-Cultural Adaptability Inventory
CCAT Kim’s Cross-Cultural Adaptation Theory
DAE Deloitte Access Economics Deloitte Access Economics
DoE Department of Education Department of Education
EFA Exploratory Factor Analysis p. 100
EFM School of Economics Finance and Marketing
ETPV model The Enjoyment, Tolerance, Personal Values and Valuing Others Model
HE Higher Education
HEMP Higher Education Mentoring Program
ICT Allport’s Intergroup Contact Theory
IECCA International Experience and Cross-Cultural Adaptability questionnaire
LAMPs Law Student Association Mentoring Program
Mahalanobis distance The distance between two points in multivariate space.
MANCOVA Multivariate Analysis of Covariance
OECD Organization for Economic Co-operative Development
PCA Principal Component Analysis
PWC Price Waterhouse Coopers
SAP Study Abroad Program
SES Socio-economic status
SLAMs Student Learning Advisory Mentors
SLM Student Learning Mentor
SLT Bandura’s Social Learning Theory
SPSS Statistics Package for Social Science
Subjects Subjects, Courses, Units
UA University Australia
WIL Work Integrated Learning
xvi
Appendices
A. Ethics approval……………………………………………………………………...257
B. Permission from the Head of School to send questionnaires to students from the Economics, Finance and Marketing School at RMIT University…………………..258
C. Permission from the Manager of the Student Learning Advisor Mentors (SLAMs) to send questionnaires to students……………………………………………………..259
D. Plain language statement……………………………………………………………260
E. Copyright permission to use the CCAI………………………………………………264
F. Outline of questionnaire……………………………………………………….…….265
G. Correlation matrix – 50 questions from the CCAI………………………………….268
H. Component matrix from initial Principal Component Analysis (PCA)……………..272
I. Pattern matrix from initial Principal Component Analysis (PCA)………………….274
J. Communalities from Principal Component Analysis (PCA)………………………..276
K. Total variance explained…………………………………………………………….278
L. Catell’s scree plot test……………………………………………………………….280
M. Parallel Analysis…………………………………………………………………….281
N. Total variance with five factors……………………………………………………...282
O. Final rotated factor matrix – Principal Axis Factoring (PFA) - Varimax rotation….284
P. Q-Q scatterplots……………………………………………………………………..285
Q. Summary Shapiro Wilks test results………………………………………………...259
R. Scatterplots of predicted values and model residuals……………………………….287
S. Spearman correlation coefficients…………………………………………………..288
1
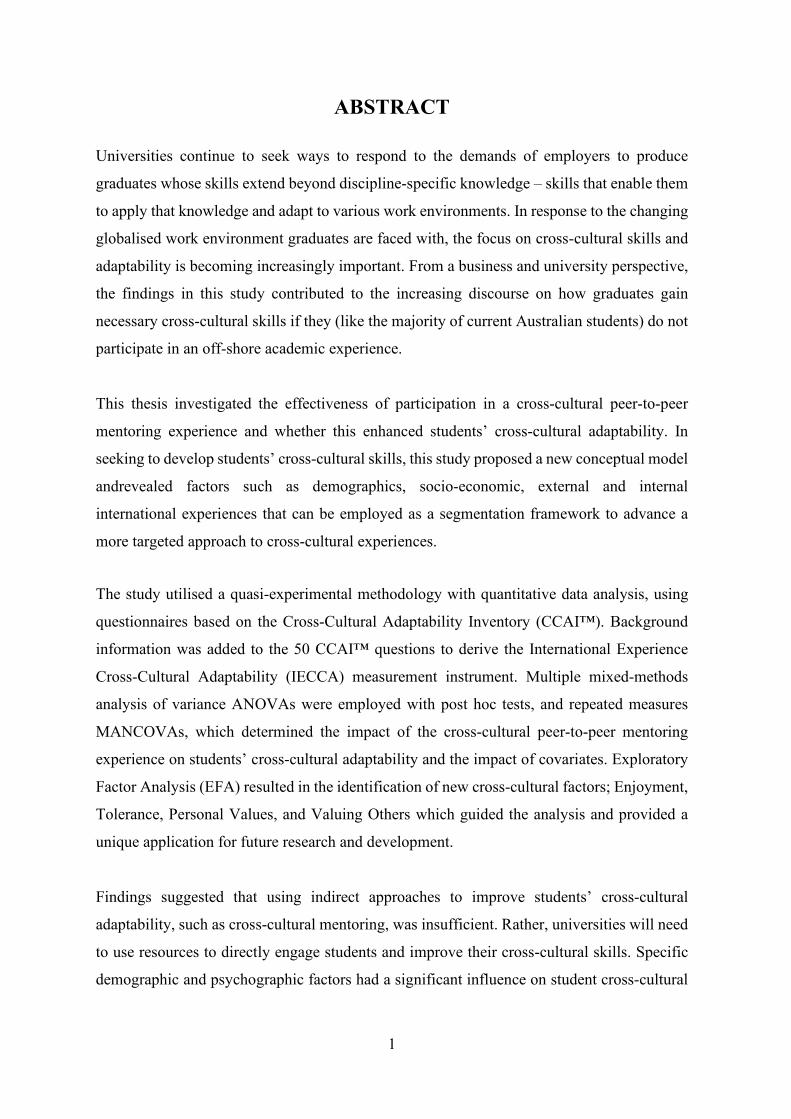
ABSTRACT Universities continue to seek ways to respond to the demands of employers to produce
graduates whose skills extend beyond discipline-specific knowledge – skills that enable them
to apply that knowledge and adapt to various work environments. In response to the changing
globalised work environment graduates are faced with, the focus on cross-cultural skills and
adaptability is becoming increasingly important. From a business and university perspective,
the findings in this study contributed to the increasing discourse on how graduates gain
necessary cross-cultural skills if they (like the majority of current Australian students) do not
participate in an off-shore academic experience.
This thesis investigated the effectiveness of participation in a cross-cultural peer-to-peer
mentoring experience and whether this enhanced students’ cross-cultural adaptability. In
seeking to develop students’ cross-cultural skills, this study proposed a new conceptual model
andrevealed factors such as demographics, socio-economic, external and internal
international experiences that can be employed as a segmentation framework to advance a
more targeted approach to cross-cultural experiences.
The study utilised a quasi-experimental methodology with quantitative data analysis, using
questionnaires based on the Cross-Cultural Adaptability Inventory (CCAI™). Background
information was added to the 50 CCAI™ questions to derive the International Experience
Cross-Cultural Adaptability (IECCA) measurement instrument. Multiple mixed-methods
analysis of variance ANOVAs were employed with post hoc tests, and repeated measures
MANCOVAs, which determined the impact of the cross-cultural peer-to-peer mentoring
experience on students’ cross-cultural adaptability and the impact of covariates. Exploratory
Factor Analysis (EFA) resulted in the identification of new cross-cultural factors; Enjoyment,
Tolerance, Personal Values, and Valuing Others which guided the analysis and provided a
unique application for future research and development.
Findings suggested that using indirect approaches to improve students’ cross-cultural
adaptability, such as cross-cultural mentoring, was insufficient. Rather, universities will need
to use resources to directly engage students and improve their cross-cultural skills. Specific
demographic and psychographic factors had a significant influence on student cross-cultural
2
adaptability as measured by the new cultural dimensions developed in the thesis, providing
guidance to the university sector.
This study advanced existing literature through the unique development of the IECCA
measurement instrument and the proposed ETPV conceptual model and demonstrated their
potential to be used in higher education pedagogy. These could include analysing the effect
of international internships on cross-cultural adaptability, which is currently an under-
researched area.
Keywords: cross-cultural adaptability, peer-to-peer mentoring, graduate global employment,
quantitative research
3
Chapter 1
INTRODUCTION
1.1 Introduction
Over the past few decades, technological, financial, political, cultural and educational forces
have converged and created the globalised, integrated world economy of which Australia is a
part. In order to maintain global competitiveness, employees must be ‘productive, efficient
and appropriately skilled’ (Price Waterhouse Coopers (PwC), 2016). These seismic shifts in
global economies have placed pressure on the world’s workforce participants to become more
educated, increase their skills and change their expectations to remain employable (Gardner
& Perry, 2011). In response to the globalisation of the business environment, universities must
evolve to meet the demands of employers. Graduates must have more than just discipline-
specific skills by the time they join the workforce (Griffiths, Kopanidis & Steel, 2018;
McArthur, Kubacki, Pang & Alcaraz 2017; Delpechitre & Baker 2017; Deloitte Access
Economics (DAE), 2017). The value of a degree for employability, is being questioned
(Ewan, 2016; PwC, 2016; Hanson, 2016) and employers are demanding that graduates and
other employees are able to exhibit relevant experience, evidence of work-readiness,
(Jackson, Rowbottom, Ferns & McLaren, 2017; Edwards, Perkins, Pearce & Hong, 2015) and
be able to adapt and be effective internationally, or to communicate successfully with people
who have views that are different (Chang, Yuan & Chuang, 2013; Bennett, 2004; Caligiuri,
2006; Simkhovych, 2009). The requirements from businesses have presented new challenges
(and opportunities) to the higher education sector in meeting these needs.
1.2 Objectives of this study
This thesis investigated whether exposure to a cross-cultural experience via peer-to-peer
mentoring influenced ‘cross-cultural adaptability’ in university students. It proposed a new
measurement instrument adapted from the Cross-cultural Adaptability Inventory CCAI™
(Kelley & Meyers, 1987, 1992), to examine whether a cross-cultural peer-to-peer mentoring
4
experience ‘at home’ had a significant influence on students’ cross-cultural adaptability. The
enhanced measurement instrument, the International Experience Cross-Cultural Adaptability
(IECCA) emerged from the application of the CCAI scale in an educational context – peer-
to-peer mentoring. In the adapted measurement instrument the influence of demographic,
socio-economic, socialising, previous private international experience, external (offshore)
international experience and internal (at home) international experience covariates on
students’ cross-cultural adaptability was analysed. Studies by Kelley and Meyers (1987),
Goldstein and Smith (1999), Kitsantas (2004), Alon and Higgins (2005), Williams (2005),
Anderson, Lawton, Rexeisen and Hubbard (2006), Ang, Van Dyne, Koh and Ng, (2007),
Zielinksi (2007), EmamJomeh-Zadeh, Damirchi, Durban and Sharifi, (2012), Chang et al.,
(2013), Taguchi (2015) and Taguchi, Xiao and Li, (2016), amongst others, informed and
supported the research. These significant categorical segmentation covariates added fresh
theoretical perspectives to the understanding of cross-cultural adaptability in this context.
Conceptual Model Development
Questions from the original CCAI™ which represented the four existing cultural dimensions
– emotional resilience; flexibility/openness; perceptual acuity and personal autonomy of the
Kelley and Meyers’ (1987, 1992, 1995) CCAI™ were reduced after Exploratory Factor
Analysis (EFA) was conducted. New cultural dimensions emanated from this analysis and
were used to develop a proposed conceptual model for future research. Results of the EFA
were found in chapter four.
The adapted CCAI™ questionnaire addressed the following objectives:
1. To identify which drivers were the most important in understanding the students’
cross-cultural adaptability.
2. To identify what aspects of students’ previous experiences further influenced the
proposed conceptual model.
The following research questions centred on two themes which addressed these objectives:
5
Influence of cross-cultural mentoring experience
1. Did a cross-cultural peer-to-peer mentoring experience influence students’ cross-
cultural adaptability?
2. What aspects of the cross-cultural mentoring experience deepened the understanding
of the results of the research and furthered our understanding of using peer-to-peer
mentoring to develop cross-cultural adaptability skills in university graduates?
Influential aspects of students’ previous experiences
1. Did gender, age, ethnicity and socio-economic factors influence cross-cultural
adaptability?
2. Did socialising with others or having friends or family from other cultures influence
cross-cultural adaptability?
3. Did previous private international experiences such as international holidays and
foreign language learning at school influence cross-cultural adaptability?
4. Did external international academic experiences such as exchange, study tours and
international internships influence cross-cultural adaptability?
5. Did internal international academic experiences such as internationalised subject
content, cross-cultural group work and foreign language study at university influence
cross-cultural adaptability?
This study focused on students’ responses to a pre- and post-test that examined the influence
of the cross-cultural mentoring experience on students’ cross-cultural adaptability, offered an
approach to the research questions posed, and a methodology for future research to apply and
test the validity of the adapted measurement instrument in different higher educational
contexts.
1.3 Context for this study
According to Australian government statistics, around 1.4 million Australian students were
enrolled at Australian universities in 2017, one million of whom enrolled in an undergraduate
program (Universities Australia (UA), 2019). At the same time, there were over 703,000
international students from 198 countries studying on a student visa in Australia, an increase
of 10% from 2018 (UA, 2019). Four hundred and twenty thousand of these international
6
students were enrolled in higher education institutions (Department of Education (DoE),
2019b).
International education is worth $35.2 billion to the Australian economy, making it the fourth-
largest export industry (DoE, 2019a). These figures suggest that the Higher Education sector
is highly competitive, with students able to apply to institutions globally. Universities’ global
rankings provide them with the opportunity to showcase their strengths and influence their
recruitment of students and staff (Niland, 2016), effectively acting as promotion material. The
focus of Higher Education is currently on graduate employability skills, which is a worldwide
focus.
Numerous definitions of employability appear throughout academic literature. Yorke and
Knight (2004, p.8), for example, define employability as “a set of achievements – skills,
understandings and personal attributes – that make graduates more likely to gain employment
and be successful in their chosen occupations, which benefits themselves, the workforce, the
community and the economy”. Dacre-Pool and Sewell (2007, p.280) contend that it is “a set
of skills, knowledge, understanding and personal attributes that make a person more likely to
choose and secure occupations in which they can be satisfied and successful”.
Employability skills include those essential to obtaining a job such as interview, job-
searching and resumé or curriculum vitae creation skills; generic skills such as teamwork,
organisation and communication; personal attributes such as punctuality, self-confidence,
discipline and adherence to deadlines, and discipline-specific skills (Freudenberg, Brimble &
Cameron, 2009). Universities may not be able to guarantee employment for their graduates,
but can, and are expected to, develop their employability skills, not only for initial
employment but also for future career development (Pegg, Waldock, Hendy-Isaac & Lawton,
2012; Wilton, 2011; Helyer & Lee, 2014).
Employers’ perceptions that there are gaps between graduate workplace performance and
employers’ expectations are well-documented, (Business, Industry and Higher Education
Collaboration Council (BIHECC), 2007; Helyer, 2011), particularly in “critical thinking,
decision making, conflict resolution, leadership and meta-cognitive skills” (Jackson, 2013
p.2). Universities are expected to develop these skills, as they are imperative, as is disciplinary
knowledge in the workplace (Dacre-Pool & Sewell, 2007). Research concurs that there is
7
value in universities developing skills in their (business) graduates that enhance their
employability. Professional, discipline-specific, generic, key and non-technical skills (Yorke
& Knight, 2004; Jackson, 2013) are vital to strengthening graduate work-readiness and
enabling graduates to differentiate themselves from others. Included within the critical generic
skills is the ability of graduates to engage with people from different social, ethnic and
religious backgrounds.
Universities have tried and trialled many ways to develop students’ cross-cultural skills.
Offshore experiences such as exchange, study tours and international internships are still
a popular way to develop these skills. In 2017, 49,000 Australian university students
undertook an off-shore program (Department of Education (DoE), 2019). Of these,
around 11% were international undergraduate students, 60% (29,400) were domestic
undergraduate students, and 29% were post-graduate students (DoE, 2019). Of the 14,000
post-graduate students, there was no current information on the breakdown between
domestic and international students (DoE, 2019). Therefore, of the one million Australian
students enrolled at a university, over 95% did not undertake an international academic
experience (DoE, 2019), so universities are looking to internationalisation ‘at home’
programs to provide these students with the cross-cultural skills that businesses require.
Various approaches to connecting international industries, communities and students have
been undertaken to prepare students for the global labour market, such as industry internships.
There have also been discussions between the university and businesses on subject content
and assessment. Virtual projects and others that are combined with short-term study abroad
programs are also emerging. These projects offer an opportunity for students to work in cross-
cultural teams and even collaborate on a global project in different countries, time zones and
cultures, mimicking how global business operates (RMIT, 2015). Other approaches included
internationalising the curriculum, working in cross-cultural groups and using
international students as a resource. These students have been utilised in the peer-to-peer
mentoring area, as many of the invited mentors are international students with excellent
grades.
One major university in Melbourne, Australia (RMIT), puts the preparation of students for
the globalised world of work at the centre of their strategic plan 2015-2020. Their strategy
emphasises their global reach with programs across their global urban campuses and
8
partnerships and involving many international students and staff. RMIT states that by 2020,
their students will have successfully developed cross-cultural skills and competencies so that
as graduates, they are prepared for global labour markets. RMIT’s strategy refers to pedagogy,
digital tools, and students’ mobility to achieve their global outlook (RMIT, 2015), and to
enhance the cross-cultural competence and adaptability of their graduates. This type of
strategy and the degree to which the graduate students are globally transformed, has come
under question (Gregersen-Hermans, 2016; Hawanini, 2011). Leask (2016) concurs, stating
that most university policy statements contain claims that their graduates will have global
skills and perspectives, and be ready to make a positive difference in our global and connected
world, but how their current internationalisation activities (such as internationalising the
curriculum or student mobility) develop these skills remains unclear. These activities need to
be directed at all students’ learning; otherwise, these policies will not be effective in all
students’ attainment of these skills.
Peer-to-peer mentoring has successfully been used by universities to transition first-year
students, from school to university. It is also used for academic mentoring for struggling
students. For example, in the past ten years, major universities in Australia have offered peer-
to-peer mentoring programs for student mentors to help mentees with any aspect of learning and
assessment tasks in their current subject. (For example: Student Learning Advisory Mentors
(SLAMs) at RMIT University, Melbourne; the Law students’ Association Mentoring Program
(LAMPs) at Griffith University in Queensland (Woods et al., 2013); the Higher Education
Mentoring Program (HEMP) at William Angliss Institute (2019); The University of
Melbourne, (2019); Australian Marketing Institute, 2019; University of South Australia,
2019). Peer mentors are usually selected as they are successful academically, and have
excellent social, communication and leadership skills. As an outcome of this, a mentor
provides a positive role model for the students while guiding them in social and academic
success. Mentors tend to offer advice, support, and encouragement, in addition to friendship
to students (Kemlo, 2010).
These types of peer-to-peer mentoring have been regularly researched (RMIT, 2010; Kemlo,
2010; Woods et al., 2013; Falchikov, 2001; Kram, 1985). Previous research has found that
both domestic and international mentees were increasingly engaged with the university
community. Additionally, both the mentors and the mentees displayed increased motivation and
desired to achieve better results during their studies (Kemlo, 2010).
9
International student peer-to-peer mentoring experiences can be traced to Furnham & Bochner’s
(1982) assertion that if international students are welcomed into a new culture by friends from
the host culture, they may encounter fewer problems than if they are alone. They posited that
onshore international student problems came from the lack of local knowledge and that peer-to-
peer mentoring between local and international students, may result in reduced attrition,
increased academic performance and preference for spending time with local students
(Westwood & Barker, 1990, as cited in Othred et al., (2013). Tan and Yates (2011, p. 389)
found that many Asian students did not attend peer mentoring sessions, nor do they ask for help.
To these students, this resulted in ‘loss of face’. As struggling Asian students do not take up
these opportunities, their results suffered, often from poor English skills (Tan & Yates, 2011).
However, research shows that Australian students who did receive help from academic mentors
typically achieved higher results for their assignments (Astin, 2012).
1.4 Contribution of this research
Underlying this study was the premise that developing generic skills in both business and
undergraduate programs would enhance graduate employability. It extended the literature on
graduate employability skills and considered the effects of a cross-cultural peer-to-peer
mentoring experience on participants’ cross-cultural adaptability skills. It also extended the
literature on the cross-cultural generic skills development of higher education students
involved in cross-cultural peer-to-peer mentoring. To date, there have been numerous studies
on the effects of peer-to-peer mentoring (Johnson, 1989; Jacobi, 1991; Scandura, 1992; Allen,
Poteet, & Burroughs, 1997; Allen, Poteet, Russell, & Dobbins, 1997a; Noe, 1988; Allen &
Poteet, 1999; Fox & Stevenson, 2007; Kemlo 2010; Santos & Reigadas, 2002; Wanberg,
Welsh, & Hezlett, 2003; Sanchez, Bauer & Paronto, 2006; Hall & Jaugietis, 2010; Thomas,
2012; Chester, Burton, Xenos & Elgar, 2013; Griffiths et al., 2018) but fewer studies on the
effects of student dyads from different cultures and how these may contribute to students’
cross-cultural skills development (Kram, 1983, 1985; Dreher & Ash, 1990; Dreher & Cox,
1996; Heilmann, 2012; Leong, 2007; Woods, Poropat, Barker, Hills, Hibbins & Borbasi,
2013; Arkoudis, Yu, Baik, Chang, Lang, Watty, Borland, Pearce & Lang, 2010; Caligiuri &
Tarique, 2012; Mosey, Wright & Clarysse, 2012).
10
This study focused exclusively on the academic peer-to-peer mentoring group at a major
university in Australia. The peer-to-peer mentoring area where the Student Learning Mentors
(SLMs) were rostered was established to bring mentors and mentees together so that the
mentee could receive help from the more experienced mentor. Moreover, it was conducted
only on students who had experienced a cross-cultural experience. As there were only 20
students in the dataset who had experienced a non-cross-cultural experience, they were
excluded from this study, Therefore, this thesis extended the literature on cross-cultural
mentoring by addressing this gap in current research and it explored whether cross-cultural
peer-to-peer mentoring influenced students’ cross-cultural adaptability.
A significant contribution of this thesis was the adaptation of existing cross-cultural
adaptability dimensions emanating from previous research by Kelley and Meyers (1987,
1992). Their Cross-cultural Adaptability Inventory (CCAI™) was developed in conjunction
with businesses, expatriates, training personnel, and the Peace Corps. This well-used and
extensively researched measurement instrument (for example Edwards, 1999; Black &
Gergerson, 1999; Elmuti, Tuck & Kemper, 2008; DeWald, 2009; Goldstein & Smith, 1999)
was adapted into a new measurement instrument which can be applied in a new research area;
that of peer-to-peer mentoring. The new measurement instrument provided an original
conceptualisation around the research area in an alternate context. The proposed conceptual
model, and the new cross-cultural adaptability measurement instrument proposed in this
study, can be used for future research in the burgeoning field of cross-cultural generic skills
development of graduates. It can also be used in other contexts in the higher education setting
to confirm whether different pedagogical methods influenced students’ cross-cultural
adaptability skills.
This study provided direction for university policy on programs that are effective (and those
that are not) on graduates’ cross-cultural skills development. Given university claims that
students will broaden their cross-cultural skills and competencies, and while relevant research
identified in existing literature provided a rationale for this study, the outcome of this research
assessed whether indirect ‘at home’ methods of ‘cross-cultural engagement’ – via university
peer-to-peer SLM mentoring –affected students’ cross-cultural adaptability, or whether more
targeted approaches needed to be undertaken to develop this skillset.This study also
investigated whether covariates such as age, gender, ethnicity, socio-economic status,
11
socialising or previous international experiences influenced students’ cross-cultural
adaptability both before and after their peer-to-peer mentoring experience.
Universities need to know if they are graduating cross-culturally competent students and to
understand what it means to be cross-culturally competent. Terminology further complicates
this aspect of skill development. Researchers have used various terms such as inter-cultural
readiness (Dodd, 2007), cultural intelligence (Earley & Mosakowski, 2004), global
competencies (Willard, 2009), cross-cultural adaptability (Kelley & Meyers, 1987), inter-
cultural sensitivity (Byram, 2003) and inter-cultural communication (Yu, 2012) inter-
changeably (Rosenbusch, 2014). There is extensive literature on cross-cultural competence
and similar concepts, such as inter-cultural: competence, intelligence and sensitivity
(Budworth & Degama, 2012; Engle & Crowne, 2014; MacNab, Brislin, & Worthley, 2012).
Although not synonymous, these terms are all intrinsically linked (Lokkesmoe, Kuchinke, &
Ardichvili, 2016).
This study provided evidence whether direct methods of intervention such as undertaking
exchange, study tours or foreign internships may be more effective than cross-cultural
peer-to-peer mentoring. Because of the requirements for graduates to have discipline-
specific and generic skills, this research sought to provide an innovative theoretical
perspective on whether cross-cultural peer-to-peer mentoring experiences influenced
students’ cross-cultural adaptability and thus influenced their cross-cultural skills
development.
If students, both local and international are not receiving the cross-cultural experiences and
development of the generic skills that they need in their years at university, then the
international relationships and reputation of the home university may decline (Czinkota, 2005;
Kehm, 2005; Marginson & Van der Wende, 2007). Employers may look elsewhere for their
employees if they perceive that the graduates of these universities are not cross-culturally
adaptable and work-ready.
Research of this nature has important implications for universities in a competitive global
marketplace. It has the potential to:
• Support the university graduates’ cross-cultural generic skills development and
employability claims.
12
• Deliver practical support to the university marketing team, demonstrating that the
university can provide students who (only) study ‘at home’ with the cross-cultural
adaptability skills that employers are seeking.
• Add to the university's marketing strategies directed at prospective students. They and
their future global employers are looking for tangible benefits of cross-cultural skills
that will be in evidence at graduation.
1.5 Methodology
A between and within-subjects, quasi-experiment of two groups’ pre- and post-testing was
applied using questionnaire data. The significant element of the quasi-experiment was the
measurement of the dependent variables; in this case, the student’s change in their cross-
cultural adaptability according to the four cultural dimensions developed using Kelley and
Meyers’ (1987, 1992) Cross-Cultural Adaptability Inventory (CCAI™). Pre- and post-testing
enabled changes to be gathered and analysed. This quasi-experimental design allowed for the
control of the experience (peer-to-peer mentoring) but did not include random assignment of
participants.
Data were collected via an online questionnaire from students studying different business
degrees as well as from student learning mentors (SLMs). Preliminary data analysis involved
undertaking a descriptive analysis which provided an understanding of the samples and their
behaviour. Sample distributions of the various demographic, socio-economic levels,
socialising, private international experiences, external international and internal international
experience, as well as pre- and post-test changes in their cross-cultural adaptability, were
analysed. Descriptive statistics were also analysed to assess how representative the samples
were with respect to changes in students’ cross-cultural adaptability.
Repeated measures analysis of variance (ANOVAs) were employed to examine how students’
cross-cultural adaptability varied over time (pre- and post-test). Multiple measurements of
that variable (each of the four cross-cultural dimensions) and repeated measures analysis of
covariance (MANCOVAs) were then conducted to analyse any influence on the cultural
dimensions as a result of the students’ pre-existing demographic and socio-economic levels
as well as their pre-existing experiences (Statistics Solutions, 2013).
13
This study aimed to improve our understanding of the peer-to-peer mentoring experience in
higher education and to strive for ways to understand and improve our educational practice
and generic skills development (Floden, 1996). The field of investigation and methodologies
adopted in this thesis reflected disciplines in mentoring, cross-cultural mentoring and cross-
cultural adaptation. Even though these results were context-dependent, the adapted
measurement instrument can be used in further research on whether other pedagogical
experiences have a significant influence on students or others to develop their cross-cultural
adaptability skills. Definitions of keywords are found in section 1.9 of this chapter, and
abbreviations can be found in the Glossary on p.xiv.
1.6 Outline of this thesis
Chapter two contained a detailed literature review with a focus on students’ employability
skills, which included their cross-cultural skills development. Culture was discussed, with a
focus on cross-cultural communication, cross-cultural competence and cross-cultural
adaptability - terms that are often used inter-changeably in cross-cultural literature. A detailed
discussion on cross-cultural adaptability, including its significant theories, followed. Research
on the influence of students’ demographics, socio-economic backgrounds, social relationships
and previous private international experiences on their cross-cultural development was
overviewed, alongside any influence of pre-existing international academic experiences. The
next section of the chapter examined mentoring, peer-to-peer mentoring and cross-cultural
peer-to-peer mentoring in Higher Education. The final part of the chapter discussed the
measurement instrument investigated and utilised in this thesis - the Cross-Cultural
Adaptability Inventory (CCAI™) - and its four cultural dimensions.
An adapted measurement instrument, the International Experience Cross-Cultural
Adaptability (IECCA), was developed based on past literature and the drivers of cross-cultural
adaptability as measured by the CCAI™ (Kelley & Meyers, 1987). The drivers of cross-
cultural adaptability were identified, and these may be influenced by students’ backgrounds
and previous experiences. Each driver and influence were discussed in detail. Six sets of
hypotheses were proposed. The chapter concluded by identifying a gap in the mentoring
literature - whether a cross-cultural peer-to-peer mentoring experience influenced the cross-
cultural adaptability of either the mentor or the mentee.
14
Chapter three introduced and discussed an appropriate methodology with which to investigate
any changes in the cross-cultural adaptability of students after a cross-cultural mentoring
experience. The theoretical foundations of quasi-experimental research, exploratory factor
analysis and mixed between and within-subjects repeated-measures analysis of variance
(ANOVA) and repeated measures analysis of covariance (MANCOVA) were used in this
study. This chapter also incorporated descriptions of the data collection, early validation of
the measurement instrument and the pre- and post-tests that were undertaken.
Chapter four presented the results of the analysis and findings of the student samples including
the descriptive analysis and provided an understanding of the sample distributions of the
various demographic, socio-economic, socialising, private international experiences, external
and internal international academic experience covariates. This chapter assessed to what
extent the samples were representative of students’ cross-cultural adaptability. It profiled the
student cohorts who represented both the SLM and mentees, as well as those respondents from
these subjects who did not meet with a SLM. Student mentees seeking help were from the
Faculty of Business. These students were enrolled in: Business Statistics, Macro Economics,
Micro-Economics, Marketing Research, Econometrics, Financial Markets, Business Finance
and Business to Business Marketing, at a University in Australia.
Kelley and Meyers’ (1987) scales of cross-cultural adaptability - Emotional Resilience,
Flexibility Openness, Perceptual Acuity and Personal Autonomy - and their indicators were
then tested through exploratory factor analysis (EFA) and adapted to reflect the responses of
the student cohort used in the study. At the conclusion of this chapter the descriptive analysis
was found for the variables that were the most important for this study’s respondents.
Chapter five presented the analysis for the proposed new measurement instrument and the
adapted cultural dimensions evident after exploratory factor analysis was performed. The
results and findings from pre- and post-test analysis used mixed model analysis of variance
(ANOVAs) and repeated measures analysis of covariance (MANCOVAs) were then
discussed. This chapter also identified the measurement properties (reliabilities and validities)
of the observed and latent variables. The association amongst important constructs comparing
the pre-test and post-test responses were examined. Chapter five concluded by demonstrating
the suitability of the measurement instrument and the analyses to research questions
considering the links between constructs. The proposed hypotheses developed from the model
15
were tested empirically. The results of the research were presented for the six sets of
hypotheses.
Chapter six presented the discussion and conclusions of the research undertaken. The chapter
summarised the aims and main arguments of this thesis, followed by the method used. It then
presented an overview of the results of the six sets of hypotheses and reflected upon the
contributions this thesis made to the literature, both at a conceptual and practical level in terms
of the educational and employability implications for cross-cultural adaptability skills.
Limitations of this thesis were discussed. Finally, the aim was to identify and suggest
recommendations for opportunities for future research in this field of educational and cross-
cultural mentoring research.
1.7 Delimitations of scope and key assumptions
The main objective of this thesis was to investigate whether mere exposure to a cross-cultural
experience via peer-to-peer mentoring influenced ‘cross-cultural adaptability’ in university
students. It specifically focused on the pre- and post-test responses by students who had either
undertaken a cross-cultural peer-to-peer mentoring experience or not. It examined the
influence of the cross-cultural mentoring experience on each of the adapted cultural
dimensions that were developed based on the CCAI™. Important categorical segmentation
covariates: demographics, socio-economic, socialisation experience, private international
experiences, external academic experiences and internal academic experiences added fresh
theoretical perspectives for the understanding of cross-cultural adaptability in this context.
This study took place in one university in one major city – Melbourne, in one state – Victoria,
in Australia. It used a questionnaire which was sent to students studying Business subjects in
Higher Education only and had no respondents from the business community. SLMs were
high achievers as only those who had received a Distinction or High Distinction were invited
to become mentors. They were also invited to be part of the research.
The overall response numbers (n=234), were consistent with other studies in this area (Prasad,
Showler, Schmitt, Ryab & Nye, 2017; Hua, Fan, Walker, Hou, Zheng & Debode, 2018). A
broad assumption was that students in each group were relatively similar. All the students in
16
the questionnaire were either studying or mentoring in the subjects that were chosen for this
study, and they had all achieved high school results of a high enough standard for acceptance
into university. This study made no association with individual respondents’ results. Although
many of the students who completed this questionnaire did not have English as their primary
language, the assumption was that they were able to understand the questions and answer
them correctly. Finally, this study assumed that respondents from each semester in 2017 were
similar, as subjects and experiences were available to all students throughout the year, with
off-shore experiences available at the end of each semester.
1.8 Conclusion
This chapter laid the foundations for this thesis. It introduced the research problem and
research questions. The background of this thesis was discussed, including the current state
of the Australian higher education market and its future direction. It also introduced the
current needs of employers of Higher Education Business students, especially in terms of
generic and cross-cultural adaptability skills. The research was justified, definitions were
presented, the methodology was briefly described and justified, and the thesis chapters were
outlined. On these foundations, the thesis proceeded with a detailed description of the
literature.
17
1.9 Definitions of terms
It is important to note that terms such as cross-cultural, inter-cultural and cultural are used
interchangeably in much of the literature. In the same way, global and international are used
interchangeably. These were also used interchangeably in this thesis. Irrespective of the terms
used, it appears consistent that future graduates require curricula that is more about cultural
adaptability and competence to be able to work effectively in the global workforce.
Culture:
Values, beliefs, attitudes, preferences, customs, learning styles, communication styles,
history/historical interpretations, achievements and accomplishments, technology, the arts,
literature, etc.—the total of what a group of people has created together, share and transmit
(Paige, 2006).
Culture shock:
“A form of anxiety which results from the misunderstanding of commonly perceived and
understood signs of cultural interaction” (Adler, 1975, p. 13).
Cultural Adaptability:
“The motivation and ability to adapt one’s behaviour to the prevailing norms, values, belief,
customs and expectations that function as a societal level prototype in a given geographical
location” (Deal, Leslie, Dalton & Ernst, 2013, p.150).
Cultural Competence:
Knowledge about several dimensions of global and international cultures; appreciation of
cultural, racial and ethnic diversity; understanding of the complexities of issues in a global
context; comfort in working with people from different cultures (Morais & Ogden, 2010).
Cultural Intelligence:
An individual's ability to adapt to new cultures. It draws upon "cultural knowledge" about
“both the facts that we hold about another culture as well as our knowledge of how things
operate” (Earley et al., 2006, p 5-6).
18
Cultural Sensitivity:
“The ability to discriminate and experience relevant cultural differences” (Hammer, Bennett
& Wiseman, 2003, p. 422).
Cultural Skills:
“Reflect behavioural ability and focus on communication skills “such as behavioural
flexibility, interactional management, and verbal and non-verbal skills” in inter-cultural
interactions” (Chen & Starosta. 1998, p.49).
Employability:
“A set of achievements – skills, understandings and personal attributes – that make graduates
more likely to gain employment and be successful in their chosen occupations, which benefits
themselves, the workforce, the community and the economy”. Yorke and Knight (2004, p.8).
External (Offshore) International experience:
Most often short-term (generally less than one year) international education experiences are
undertaken as part of an Australian university degree into communities, workplaces and other
experiential environments (Davis, Milne & Olsen, 1999).
Global (Cross) Cultural Competence
“The ability to be culturally empathic, adaptable, diplomatic. Positive in one’s attitude and
able to demonstrate emotional stability and maturity”. Phatak (1992) as cited in Wallenberg-
Learner (2013 p.29).
Globalisation:
Wallenberg-Learner (2013 p. 17) suggested that globalisation is “the intensification of
worldwide social relations that link distant localities in such a way that events occurring on
one side of the globe can have a significant impact on those localities existing on the other
side.”
Internationalised curriculum:
“The incorporation of an international and inter-cultural dimension into the preparation,
delivery and outcomes of a program of study” (Leask, 2009, p. 209).
19
Internal ‘at home’ international experiences:
“Internationalization at home is the purposeful integration of international and inter-cultural
dimensions into the formal and informal curriculum for all students, within domestic learning
environments” (Beelen & Jones, 2015, p 12).
Mentoring:
Mullen (1994) as cited in (Wanberg et. al. 2003, p. 39) defines mentoring as: “a one-on-one
relationship between a less experienced (protégé/mentee) and a more experienced person
(mentor) and is prototypically intended to advance the personal and professional growth of
the less experienced individual”.
Peer-to-peer mentoring (P2P mentoring):
Mentorship which usually takes place between a person who has lived through a specific
experience who is a peer mentor and a person who is new to such experience which is the
peer protégé/mentee (Hall & Jaugietis, 2011).
Transnational Education/Sojourner/Offshore/International students:
Any teaching or learning activity in which the students involved are in a different country to
where the institution providing the education is based (Lim & Shah, 2017, p.254).
20
Chapter 2
LITERATURE REVIEW
2.1 Introduction
Chapter one introduced the background to this thesis, including the current state of
internationalisation in the Australian tertiary education market and the need for graduates to
have employability skills. In our interconnected global economy, now more than ever,
university students are required to graduate with a set of skills for current and future
employability success. These skills are required to be both discipline-specific and generic
(McArthur, Kubacki, Pang & Alcarez, 2017; Delpechitre & Baker, 2017; Deloitte Access
Economics (DAE), 2017). Universities are expected to develop discipline-specific skills in
their graduates by strengthening their core subject content to cover current practices in their
field, as these skills are essential for applying disciplinary knowledge in the workplace
(Dacre-Pool & Sewell, 2007). The specific generic skills that current literature discusses
include: teamwork, organisation and communication; personal attributes such as punctuality,
self-confidence, discipline, adherence to deadlines, and the ability to work with and interact
with colleagues and others from many different social, ethnic and religious backgrounds,
perhaps with different languages, whether in Australia or overseas (Reichard, Serrano,
Condren, Wilder, Dollwet & Wang, 2015; Chang et al., 2013; Deardorff, 2006; Caliguiri,
2006; Turner, 2006; Bennett, 2004; Medenhall, Kuhlmann & Stahl 2001).
Cross-cultural skills are an additional requirement to professional, discipline-specific skills,
generic, essential and non-technical skills that each graduate should be able to apply in the
workplace (Yorke & Knight, 2004; Jackson, 2013). These are vital to enhancing graduate
work-readiness and enabling graduates to differentiate themselves from other job seekers.
Recent studies found that as competition increases for jobs globally (Brown, 2003; Brown &
Hesketh, 2004; Brown & Tannock, 2009; Brown, Lauder, & Ashton, 2011), students need to
develop their social capital to enhance their job applications by developing these skills
(Tomlinson, 2008). There is almost a ‘global war’ for the most talented graduates from
21
anywhere in the world (Brown & Tannock, 2009; Brown et al., 2011; Bathmaker, Ingram &
Waller, 2013).
Employers’ perceptions that there are gaps between graduate workplace performance and
employers’ expectations are well-documented, particularly critical thinking, decision making,
conflict resolution, leadership and meta-cognitive skills (BIHECC, 2007; Helyer, 2011). To
address these concerns, many universities have implemented an international dimension into
their strategic plans for their students to develop the cross-cultural skills necessary to remain
employable into the future (for example RMIT, 2015; Monash, 2019; UNSW, 2018). Most
Australian university strategies refer to curriculum design, digital tools, teaching strategies
and opportunities for students’ mobility through Study Abroad Programs (SAPs) - semester
or year exchange, study tours and international internships, to reflect and embed their global
outlook. There is a substantial body of literature on the critical need for employees to possess
competence in cultural management, communication, global knowledge, cultural diversity
and cultural adaptability. Development of these cross-cultural skills in students by graduation
is no longer a choice, but a specific goal of higher education. (RMIT, 2015; Root &
Ngampornchai, 2012; Paige & Goode, 2009; Hunter, White & Godbey, 2006; Hynes, 2008).
Universities in Australia have strategies that emphasise their global reach often with
campuses, programs and partnerships across a network of global urban centres and a high
number of international students and staff. For example, RMIT University in Melbourne states
in their strategy that their students will have successfully developed cross-cultural skills and
competencies so that their graduates are prepared for global labour markets (RMIT 2015).
While cross-cultural skills are an essential capability for graduates to develop, they are rarely
part of formal university education. Rather, it is usually assumed that these skills would be
acquired through ‘experience’ or by formal or informal contact with international students on
campus (Dimitrov, Dawson, Olsen & Meadows, 2014). Leask (2016) concurred, stating that
most university policy statements declared that their graduates would have global skills and
perspectives and be ready to make a difference in a globally connected world.
For students who did not undertake an offshore experience, Australian universities are
offering various international ‘at home’ experiences in which students can engage. These
experiences include internationalised curriculum, cross-cultural group work, foreign language
learning and cross-cultural peer-to-peer mentoring.
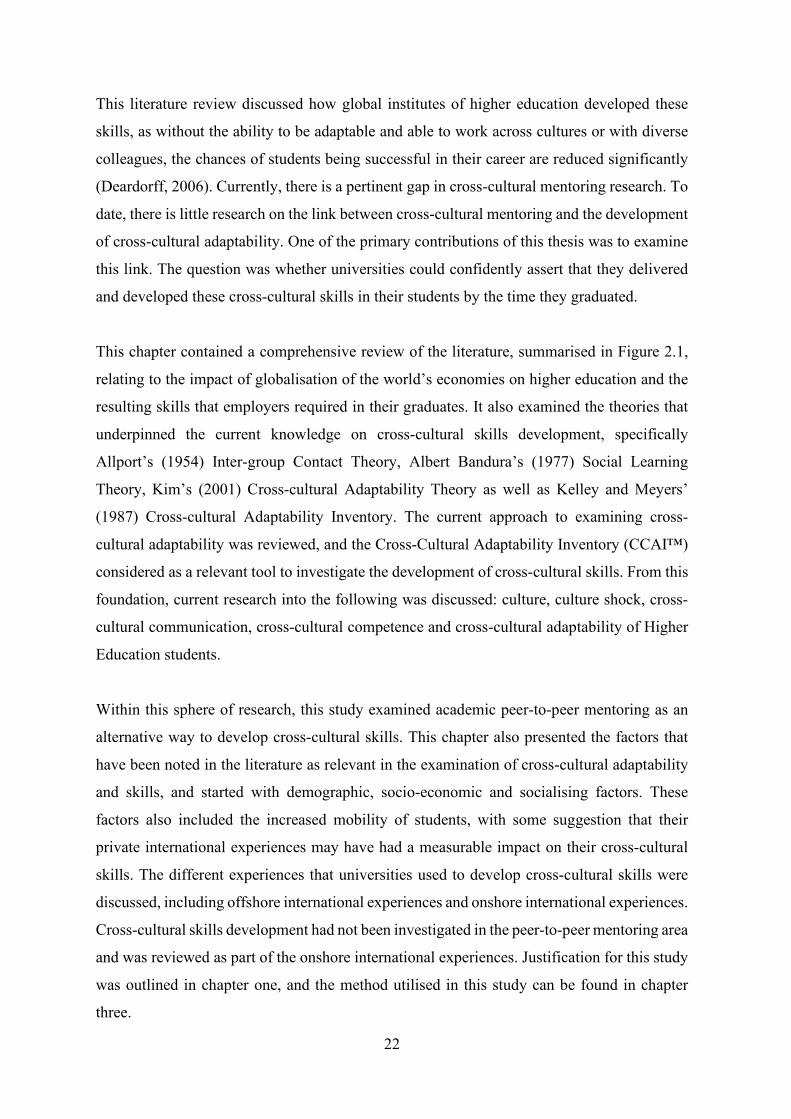
22
This literature review discussed how global institutes of higher education developed these
skills, as without the ability to be adaptable and able to work across cultures or with diverse
colleagues, the chances of students being successful in their career are reduced significantly
(Deardorff, 2006). Currently, there is a pertinent gap in cross-cultural mentoring research. To
date, there is little research on the link between cross-cultural mentoring and the development
of cross-cultural adaptability. One of the primary contributions of this thesis was to examine
this link. The question was whether universities could confidently assert that they delivered
and developed these cross-cultural skills in their students by the time they graduated.
This chapter contained a comprehensive review of the literature, summarised in Figure 2.1,
relating to the impact of globalisation of the world’s economies on higher education and the
resulting skills that employers required in their graduates. It also examined the theories that
underpinned the current knowledge on cross-cultural skills development, specifically
Allport’s (1954) Inter-group Contact Theory, Albert Bandura’s (1977) Social Learning
Theory, Kim’s (2001) Cross-cultural Adaptability Theory as well as Kelley and Meyers’
(1987) Cross-cultural Adaptability Inventory. The current approach to examining cross-
cultural adaptability was reviewed, and the Cross-Cultural Adaptability Inventory (CCAI™)
considered as a relevant tool to investigate the development of cross-cultural skills. From this
foundation, current research into the following was discussed: culture, culture shock, cross-
cultural communication, cross-cultural competence and cross-cultural adaptability of Higher
Education students.
Within this sphere of research, this study examined academic peer-to-peer mentoring as an
alternative way to develop cross-cultural skills. This chapter also presented the factors that
have been noted in the literature as relevant in the examination of cross-cultural adaptability
and skills, and started with demographic, socio-economic and socialising factors. These
factors also included the increased mobility of students, with some suggestion that their
private international experiences may have had a measurable impact on their cross-cultural
skills. The different experiences that universities used to develop cross-cultural skills were
discussed, including offshore international experiences and onshore international experiences.
Cross-cultural skills development had not been investigated in the peer-to-peer mentoring area
and was reviewed as part of the onshore international experiences. Justification for this study
was outlined in chapter one, and the method utilised in this study can be found in chapter
three.
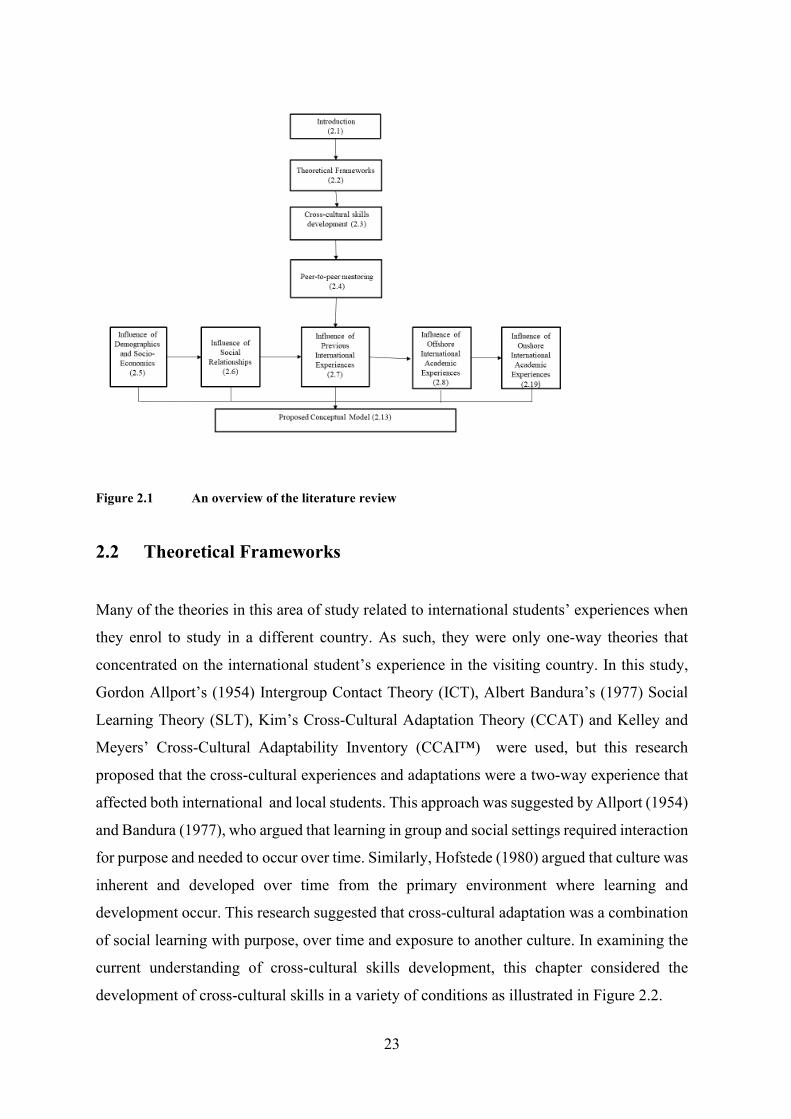
23
Figure 2.1 An overview of the literature review
2.2 Theoretical Frameworks
Many of the theories in this area of study related to international students’ experiences when
they enrol to study in a different country. As such, they were only one-way theories that
concentrated on the international student’s experience in the visiting country. In this study,
Gordon Allport’s (1954) Intergroup Contact Theory (ICT), Albert Bandura’s (1977) Social
Learning Theory (SLT), Kim’s Cross-Cultural Adaptation Theory (CCAT) and Kelley and
Meyers’ Cross-Cultural Adaptability Inventory (CCAI™) were used, but this research
proposed that the cross-cultural experiences and adaptations were a two-way experience that
affected both international and local students. This approach was suggested by Allport (1954)
and Bandura (1977), who argued that learning in group and social settings required interaction
for purpose and needed to occur over time. Similarly, Hofstede (1980) argued that culture was
inherent and developed over time from the primary environment where learning and
development occur. This research suggested that cross-cultural adaptation was a combination
of social learning with purpose, over time and exposure to another culture. In examining the
current understanding of cross-cultural skills development, this chapter considered the
development of cross-cultural skills in a variety of conditions as illustrated in Figure 2.2.
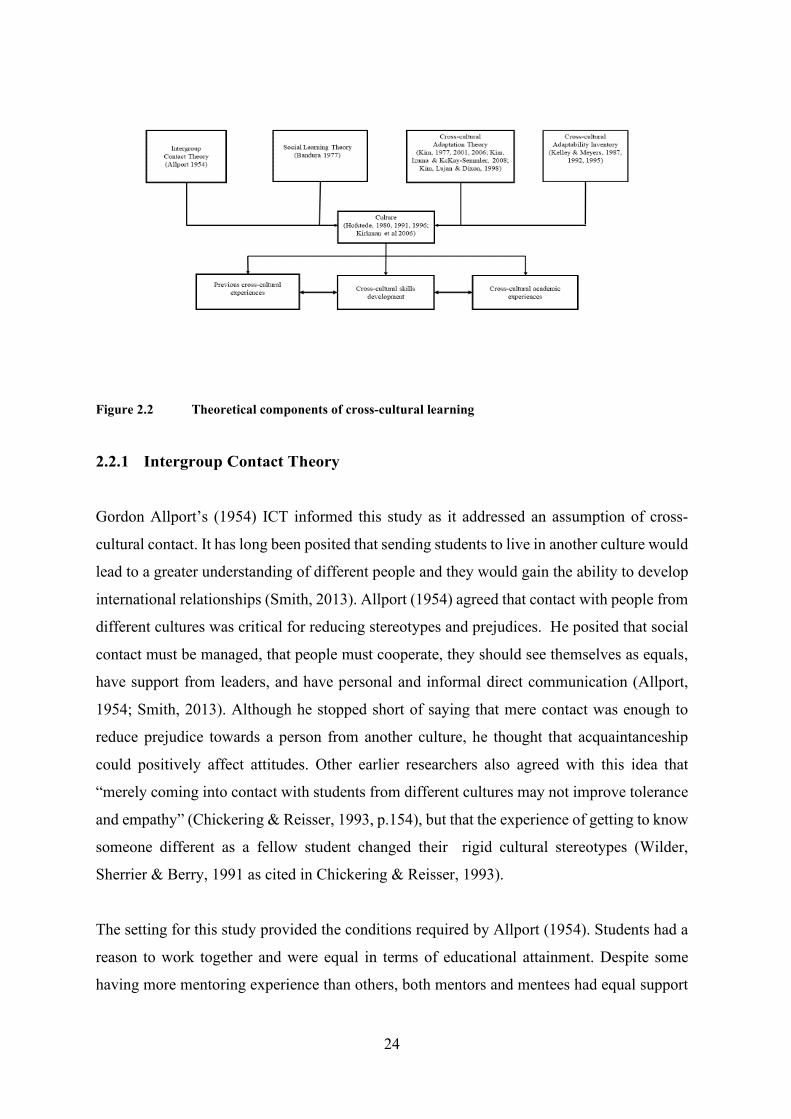
24
Figure 2.2 Theoretical components of cross-cultural learning
2.2.1 Intergroup Contact Theory
Gordon Allport’s (1954) ICT informed this study as it addressed an assumption of cross-
cultural contact. It has long been posited that sending students to live in another culture would
lead to a greater understanding of different people and they would gain the ability to develop
international relationships (Smith, 2013). Allport (1954) agreed that contact with people from
different cultures was critical for reducing stereotypes and prejudices. He posited that social
contact must be managed, that people must cooperate, they should see themselves as equals,
have support from leaders, and have personal and informal direct communication (Allport,
1954; Smith, 2013). Although he stopped short of saying that mere contact was enough to
reduce prejudice towards a person from another culture, he thought that acquaintanceship
could positively affect attitudes. Other earlier researchers also agreed with this idea that
“merely coming into contact with students from different cultures may not improve tolerance
and empathy” (Chickering & Reisser, 1993, p.154), but that the experience of getting to know
someone different as a fellow student changed their rigid cultural stereotypes (Wilder,
Sherrier & Berry, 1991 as cited in Chickering & Reisser, 1993).
The setting for this study provided the conditions required by Allport (1954). Students had a
reason to work together and were equal in terms of educational attainment. Despite some
having more mentoring experience than others, both mentors and mentees had equal support
25
from the university. The mentoring sessions were informal, and often students developed
friendships outside of the mentoring area (Kemlo, 2018).
Both Allport’s (1954) ICT and Wilder, Sherrier and Berry, (1991) suggested the mentoring
experiences were related to the Flexibility Openness cultural dimension (Kelley & Meyers,
1987, 1992). The requirement was getting to know someone different as a fellow student and
their ability to cope with unfamiliar people, ideas and tolerance towards other who were
different. ICT also suggested that contact between students of a different culture in the
mentoring experience was also related to the Personal Autonomy dimension as it was
specifically related to respect for people from other cultures.
2.2.2 Social Learning Theory
Albert Bandura's (1977) Social Learning Theory (SLT) provided a theoretical foundation for
understanding cross-cultural adaptability (Black & Mendenhall, 1990; Church, 1982; David,
1976). SLT (1977) explained human behaviour in terms of “a continuous reciprocal
interaction between cognitive, behavioural, and environmental determinants” (p. vii). SLT
also emphasised the importance of observing and following people from different cultures.
People need to take note of their behaviours, attitudes, and emotional reactions. Fortunately,
most human behaviour is learned observationally through modelling “from observing others,
people form an idea of how new behaviours are performed, and on later occasions, this
information serves as a guide for action” (Bandura, 1977, p. 22). Bandura (1977) formulated
his findings in a four-step pattern combining a cognitive and an operant view of learning,
namely:
1. Attention - the individual noticed something in the environment.
2. Retention - the individual remembered what was noticed.
3. Reproduction - the individual produced an action that is a copy of what was seen.
4. Motivation - the environment delivered a consequence that changed the probability the
behaviour would be emitted again (reinforcement and punishment).
Bandura's work draws from both behavioural and cognitive views of learning. He believed
that mind, behaviour, and the environment all play an essential role in the learning process
(Bandura, 2001). Bandura (1986) also noted that “people must develop basic capabilities over
26
an extended period, and they must continue to master new competencies to fulfil changing
demands throughout their life spans” (p. 20).
Bandura’s (1977) SLT resonated with the Emotional Resilience cultural dimension as this
measured the ability of people to cope with any ambiguity and stress that may occur during
the cross-cultural mentoring experience. SLT also related to the observation of others who
were different from themselves as well as the ability to implement the behaviours that were
observed. It also related to the Perceptual Acuity cultural dimension in that both the mentee
and particularly the mentor, as the more experienced student, dealt with the interpersonal
sensitivity of the mentee when they visited the SLM. The mentor also needed to perceive cues
accurately between their culture and set the mentee at ease during the mentoring session.
These experiences were related to the Personal Autonomy dimension as both the mentor and
the mentee were expected to respect the traditions of the other culture.
SLT was particularly applicable when studying offshore programs. Previous research
suggested that instead of cross-cultural understanding developing, stereotypes may actually
be reinforced, unless there was intervention such as cultural mentoring (Bandura, 1977;
Smith, 2013). As this study was interested in duplicating the cross-cultural adaptation effects
for students without attending a study abroad experience, Bandura’s theory was an appropriate
theory to underpin this research as it insisted that mind, behaviour and the environment are
all critical and need to be addressed in local international experiences.
2.2.3 Theory of Cross-Cultural Adaptation
Kim and others (Kim, 1977, 2001, 2006; Kim, Izumi & McKay-Semmler, 2008, 2009; Kim,
Lujan & Dixon, 1998) have offered cross-cultural adaptation theory to explain the process of
adaptation experienced by international students, and suggested ways to reduce stress and
increase the student’s ability to function (Kim et al., 2009). This theory claimed that the
student experiences stress followed by adaptation and finally, growth. These steps took time,
and the student gradually developed more significant adaptation and communication skills
when interacting with local students (Sandel, 2013). They posited that initial interaction with
other international students helped the incoming student adapt.
27
A weakness of Kim’s theory was that it considered culture to be unimpacted by the presence
of the international student who was becoming more adaptable (Kramer, 2000; Sandel &
Liang, 2010). The theory ignored the possibility that cultures were dynamic, and that
interaction between local and international students would result in changing cultural
perspectives. This was relevant to this study as contact between domestic and international
students impacted the cross-cultural adaptability of both.
2.2.4 Cross-Cultural Adaptability Inventory
Kelley & Meyers (1987, 1992, 1995) developed the CCAI™ to quantify the dimensions
known to be associated with cross-cultural adaptability. Since the development of the
measurement instrument in 1987, it underwent two revisions. The inventory consisted of 50
questions that comprised four subscales: Emotional Resilience, Flexibility Openness,
Perceptual Acuity and Personal Autonomy. Emotional Resilience measured the degree to
which a person could bounce back from negative emotions while maintaining a positive
attitude towards new experiences. It was the largest of the four CCAI™ scales, containing
eighteen items. Specifically, it measured coping with stress and ambiguity, rebounding from
imperfections and mistakes, trying new experiences and interacting with new people in new
or unfamiliar situations. Flexibility Openness consisted of fifteen items and assessed the
respondent’s willingness to be receptive and enjoy different ways of thinking and behaving
in a new environment. It measured interest in unfamiliar people and ideas, tolerance towards
others and flexibility regarding new experiences. Perceptual Acuity measured the
respondent’s interpersonal sensitivity and the ability to perceive cues accurately across
cultures. The ten items of this subscale focused on communication skills, cross-cultural
empathy and the accurate interpretation of nonverbal and social signals. Finally, the smallest
but most complex scale, the seven items of the Personal Autonomy dimension, dealt with
personal identity and adherence to a robust set of cross-cultural values, as well as respecting
the values and traditions of the other culture (Kelley & Meyers, 1997).
There is a considerable body of literature which deals with the CCAI™. There have been over
45 studies using the CCAI™ in the cross-cultural arena, many of which took place in a Higher
Education setting (Field, 1990; Remmert, 1993; Chen, 2015). It is an accepted tool for studies
on developing cross-cultural adaptability and has shown a high degree of reliability across
different settings. Kelley and Meyers (1992) reported overall reliability of 0.90 for the
28
CCAI™, 0.82 for the Emotional Resilience subscale, 0.80 for the Flexibility Openness
subscale, 0.78 for the Perceptual Acuity subscale and 0.68 for the Personal Autonomy
subscale. Kitsanis and Meyers (2001) also found that it had significant reliability. However,
there was conflicting evidence about the construct validity (Montagliani & Giacalone, 1998).
Davis and Finney (2006) administered the questionnaire to 709 higher education students in
the USA. Confirmatory factor analysis indicated that the fit of the four-factor model was “very
poor” (p.323), and there were high correlations among the four factors (0.87-0.98).
Exploratory factor analysis on the same data indicated a one or two-factor solution (David &
Finney, 2006). Nguyen, Biderman and McNary (2010) also found that the four-factor
structure did not fit the data very well. Goldstein and Smith (1999) compared forty-two
graduate students in the USA who had received inter-cultural training, with thirty-nine who
had not. In that study, the training group had significantly higher scores than the control group.
According to Majunidar, Keystone and Cuttress (1999), the CCAI™ has been tested on
hundreds of participants from various cultures, with different ages and occupations. It had
demonstrated high internal consistency and validity in many studies (Fukasawa, 1990;
Goldstein, 1992; Elmuti, et al., 2008), and was considered a suitable measurement instrument
for capturing the range of cognitive skills necessary to succeed in a cross-cultural environment
(Kraemer & Beckstead, 2003).
Study abroad researchers have also utilised the CCAI™, and these studies were well
represented in the literature. A study by Kitsantas and Meyers (2001) compared eleven
students enrolled in graduate subjects to thirteen students enrolled in a SAP. T-tests before
the offshore experience showed no difference between the groups, but t-tests after their
experience showed a significant difference for the students who did complete the SAP,
relative to those who did not. Study abroad was not the only area where the CCAI™ had been
used. It had also been used in the foreign language arena where it explored the relationship
between foreign language skills and the cross-cultural adaptability of the students. It was also
used in Health Care Education and Dental hygiene (Connolly, Darby, Tolle-Watts, Thomson-
Lakey, 2004; Kraemer, Takeuchi & Frese, 2003; DeWald, 2009).
The CCAI™ was chosen for this study as it had been used in business and study abroad areas
and had tested the cross-cultural skills that universities were trying to instil in their graduates.
As this study discussed the same skills that need to be developed in students from an
international onshore experience, CCAI™ were considered appropriate.
29
2.2.5 The CCAI and Emotional Intelligence
Emotional intelligence involves the awareness of one’s own and others’ emotions and the
ability to control them and to reason with others using emotions [effectively], (Goleman,
1995; Petrides, 2009a and 2009b; Salovey & Mayer, 1990). Seminal research provides an
alternate definition: the ability to focus on the perception and expression of emotions
accurately and adaptively; the ability to understand emotional knowledge; to use feelings, and
to regulate emotions (Salovey, Mayer, Caruso, Loes, Lopez & Snyder, 2003).
Cultural researchers found that emotional intelligence contributed to cultural adjustment in
global assignments (Dolan & Cerdin, 2005) and others suggested that it be incorporated in the
training for international experiences (Ornstein and Nelson, 2006). Yamazaki and Kayes
(2004) have found that living and working in other cultures developed the understanding of
moods, emotions and personality, some of the components of emotional intelligence. The
construct of emotional intelligence, a measure of emotional resilience, was identified by
cross-cultural researchers as a requirement of successful cross-cultural adaptability
(Cherbosque, Gardenswartz and Rowe, 2005; Tang, 2001). Furnham and Bochner (1986)
considered the link between [cross] cultural adaptability (the focus of this study), as being
able to participate in new situations and respond effectively to emotional experiences. Cui and
Awa’s (1992) study added to the literature and found that cross-cultural success required:
empathy, flexibility, patience, role flexibility, tolerance for ambiguity and the ability to
establish and maintain relationships. These characteristics were similar to those expressed in
the Emotional Resilience and Perceptual Acuity cultural dimensions of the CCAI™
Emotional intelligence was considered a social and emotional skill that resulted in successful
relationships. It involved interpersonal and intrapersonal sensitivity, impulse control,
optimism, and empathy (Goleman, 1995; Bar-On, 1997b, 2000). Bar-On (1997a) found that
emotional intelligence was characterised by intrapersonal functioning, interpersonal
relationships, stress management, and mood regulation. He developed a self-report measure
of Emotional Intelligence called the Bar- On EQI. These elements resonate with the
Emotional Resilience, Flexibility Openness as well as Personal Autonomy.
Cherbosque, Gardenswartz, and Rowe (2005) expanded this definition of emotional
intelligence, adding the capacity for [cross] cultural adaptation into their construct. They
30
developed the Emotional Intelligence and Diversity (EID) model of emotional intelligence
which consisted of four constructs: Affirmative Introspection: the ability to understand one’s
reaction to others; Self-Governance: the ability to maintain a positive attitude and self-control
in the face of upsetting emotions; Intercultural Literacy: the ability to empathise with other’s
cultural rules, norms and values; and Social Architecting: self-control and self-discipline to
build productive relationships. These constructs were similar to those of Perceptual Acuity,
Emotional Resilience and Personal Autonomy.
Research by Montaglini and Giacalone (1998) found that the CCAI™ correlated with
impression management, empathy and social-emotional skills. These were all components of
the construct of emotional intelligence (Bar-On, 1997a; Goleman, 1995). Tang (2001) also
explored the relationship between emotional intelligence and cross-cultural adaptability using
the CCAI™ (Kelley & Meyers, 1987, 1992) as a measure of cross-cultural effectiveness. In
that study, emotional intelligence was characterised by empathy, communications of emotions
and regulation of mood. The characteristics of both these studies correlated with the cross-
cultural adaptability dimensions of Perceptual Acuity, Personal Autonomy and Flexibility
Openness.
Further research was undertaken to investigate whether there was a relationship between
cross-cultural adaptability and emotional intelligence (Meyers, Lewak, Stolberg & Savarese-
Levine, 2008). They found that cross-cultural adaptability was related to extroversion,
emotional poise and control, warmth, empathy and stress tolerance. These attributes were also
aspects of emotional intelligence, therefore is was also posited that emotional intelligence was
related to all of the cross-cultural adaptability dimensions: Emotional Resilience, Flexibility
Openness, Perceptual Acuity and Personal Autonomy. Cross-cultural adaptability was then
able to be assessed using measures of emotional intelligence, as well as the CCAI™ measures.
Emotional factors clearly played a significant role in cross-cultural adjustment, confirming
the link between emotional intelligence and cross-cultural adaptability suggested by Tang
(2001). These findings also supported the use of a tool called Emotional Intelligence and
Diversity (EID) for training, which emphasised the role of emotional intelligence in cultural
adaptation (Tang, 2001).
The research by (Meyers et al., 2008) also suggested there were certain personality types who
were inherently suited for the challenges of cultural adaptability. It suggested that individuals
31
could be taught the coping strategies that comprise the core of emotional intelligence. By
training an individual in emotional intelligence, that person could increase their effectiveness
in dealing with people from other cultures. The overlap between emotional intelligence and
the CCAI™ questions was taken into account when the new cultural dimensions were
developed from the original CCAI™ questions as a result of the Exploratory Factor Analysis
undertaken.
2.2.6 Culture
The assumption as stated in this study concurred with the need for Higher Education (HE)
students to develop cross-cultural skills (McArthur et al., 2017; Delpechitre & Baker, 2017;
DAE, 2017; Chang et al., 2013). Spitzberg and Changnon, (2009) found that culture was
concerned with enduring but evolving inter-generational attitudes, values, beliefs, rituals,
customs and behavioural patterns into which people were born, but it was maintained by
people’s ongoing behaviours (Safta, 2011). Earlier, Hofstede in his seminal work (2001)
defined culture as being “the collective programming of the mind distinguishing the members
of one group or category of people from another” (p. 9). Hofstede’s definition of culture
referred to nations, regions, ethnicities, religions, occupations, organisations or genders
(Hofstede, 2013), but he acknowledged that cultural learning was as crucial to a particular
(human) group or sub-culture, as personality was in determining the uniqueness of an
individual (Hofstede, 2001).
There has been some criticism of Hofstede’s (1980) original work such as the study by
Sivakumar and Nakata (2001), who argued that Hofstede’s work has reduced culture to an
overly simplistic six-dimension conceptualisation, and that results of his work were based on
a limited sample due to his research being conducted at IBM only. Sivakumar and Nakata
(2001) also suggested that the work did not capture the dynamic nature of culture and ignored
within-country cultural differences. Further studies also questioned its theoretical basis, its
methods and its definitions (McSweeney, 2002; Smith, 2002; Kirkman, Lowe & Gibson,
2016). The study by Kirkman et al., (2006) showed that Hofstede’s cultural values framework
had been applied in over 180 studies. Hofstede (1981; 2011) further found that cultural values
in organisations were associated with (among others) individual behaviours related to
personality and group processes (Kirkman et al., 2006). Hofstede also argued that societal,
32
national and gender cultures, which children acquire in their youth, were more established in
their minds than cultures obtained at school [or university] (Hofstede, 2001; Hofstede, 2011).
A variety of cultures exist, including business, social, group, team, individual and
fundamental cultural beliefs. Each person will most likely belong to more than one of these
groups (EmamJomeh-Zadeh, Damirchi, Darban, & Sharifi, 2012). University graduates are
born into a national culture, but also have cultural characteristics based on their ethnicity,
occupation and gender. They also develop cultural skills and traits from the sub-cultures they
belonged to, including those developed at university, work and home. Thus, developing an
awareness of culture and each student’s ability to adapt to cultural differences was key to
future success (EmamJomeh-Zadeh et al., 2012).
Brislin and Yoshida (1994) suggested that culture covered expectations and values, Their
study suggested that for HE students, their “ability to function effectively in any situation
depends upon [their] skills in recognising and responding appropriately to the values and
expectations of those around [them]” (Anderson, Lawton, Rexeisen & Hubbard, 2005, p. 47).
In a later study, Landis and Bhagat (1996) took this contention further by arguing that inter-
cultural sensitivity was crucial to enabling people to live and work with others from different
cultural backgrounds.
Many people were exposed to cultural differences because of the ease of international travel
either for personal or job-related reasons. Expatriation was the process where individuals lived
and worked outside his or her country (Carpenter, Sanders & Gregersen, 2001; Inkson, Arthur,
Pringle, & Barry, 1997; Reuber & Fischer, 1997; Sambharya, 1996; Takeuchi et al., 2005;
Crowne, 2013). These studies on expatriates and expatriate failures wereconsidered valuable,
(Makela, 2007; Manev & Stevenson, 2001). In particular, these failures were a cost concern
for many companies (Black & Gregersen, 1999; McNulty & Tharenou, 2004; Solomon, 1995;
Welch, 2003). Some companies reported expatriate failure rates as high as 83% (McFarland,
2006). Employers were constantly searching for more effective methods to select employees
who would have a lower chance of failure (Crowne, 2013). As previously highlighted,
employers were looking to universities to develop cross-cultural adaptability skills in their
graduates and were hopeful that this would directly reduce the cost of expatriate failures.
33
One of the significant areas of expatriate failure related to culture shock and the inability to
adapt (Ward & Kennedy, 1996; Aryee & Stone, 1996; Shaffer, Harrison & Gilley, 1999;
Selmer, 2002; Shi & Wang, 2014). Research completed by Windham International (1999)
found that partner dissatisfaction, family issues and the inability to adapt were three critical
causes for expensive expatriate failure. Students attending an offshore experience such as
exchange, study tour or international internships may have experienced culture shock to a
greater or lesser degree. This shock may have resulted in anger, frustration, depression or
homesickness (Black & Gregersen, 1999). A study by Miller (1986) found that issues such as
climate, dress rules, language, education, food, transport, housing, religion, entertainment,
family life and friendships could all result in culture shock. Therefore, it was vital that students
developed cross-cultural adaptability skills to counter these negative feelings.
2.3 Cross-cultural skills development
Cross-cultural understanding started from essential cultural awareness, through to cultural
exposure. Students may have developed some cultural knowledge about differences and
similarities between cultures through previous international exposure including friends or
family from another culture, through private international holidays or participation in
international academic experiences. Past research had found that cross-cultural adaptability
developed the ability and willingness to adapt one's style of communicating, motivating,
negotiating and managing teams in different cultures to achieve success in a cross-cultural
environment (Eichenger, Leslie, Dalton, Ernst & Deal, 2015).
In this literature review, the term ‘cross-cultural skills’ had been used to define the list of
skills discussed above, that graduates were expected to display at the commencement of
their employment. Since as early as the 1970s, researchers had used various terms such as
(inter) cross-cultural adaptability (Wiseman & Abe, 1986; Kelley & Meyers, 1997), (inter)
cultural readiness (Dodd, 2007), (inter) cultural intelligence (Earley & Mosakowski, 2004;
Engle & Crowne, 2014 ), experience of cultural difference (leading to) global (inter-cultural)
competence (Hammer, Gudykunst & Wiseman, 1978; Willard, 2009; Bennett, 1993; Hammer
et al., 2003; Budworth & Degama, 2012), inter-cultural sensitivity (Byram, 2003; Straffon,
2003; MacNab et al., 2012) and inter-cultural communication, (Yu, 2010; Chen & Starosta,
34
2000) virtually inter-changeably (Rosenbusch, 2014). Although these six constructs were not
synonymous, they were intrinsically linked (Lokkesmoe et al., 2016).
2.3.1 Cross-Cultural Adaptability in Higher Education students
Australia is one of the most culturally diverse countries in the world as 29% of the population
were born overseas, and 46% of Australians have at least one parent who was born overseas
(Australian Bureau of Statistics (ABS), 2019). The globalisation of the business world
demands an understanding of cultural diversity when dealing with people of different
nationalities. Large intakes of international students from diverse backgrounds offer a starting
point in evolving cross-cultural skills development. As cross-cultural adaptation is the process
of responding to the demands of a new culture, students need to change their perspectives and
come to terms with the beliefs of the new culture or country (Shi & Wang, 2014).
Cross-cultural adaptability is a diverse construct, developed from training literature from the
United States Peace Corps, international religious missionaries, the diplomatic corps, the
military, and the global business community (Grove & Torbiron, 1985; Torbiron, 1982).
These institutions prepare people to work effectively in other cultures (Hannigan, 1990), and
because of their diverse roles, each have developed different descriptions of cultural
adaptability. Prior studies have found that the ability to adapt to different cultures was critical,
especially for students (Kelley & Meyers, 1987; Bennett, 2004; Caliguiri, 2006; Simkhovych,
2009; Chang et al., 2013). Cross-cultural adaptability indicates the potential for cross-cultural
effectiveness in the host country (Kelley & Meyers, 1995). Previous studies found that critical
elements of adaptability were successful interaction with people from other cultures (e.g.
communication, flexibility and openness), as well as maintaining emotional stability (Chang
et al., 2013). Still other studies suggested that facing different customs, values, rules and
assumptions (Caligiuri & Santo, 2001; Swagler & Jome, 2005; Chang et al., 2013) were skills
necessary for students to be successful.
Students are expected to adjust, assimilate or adapt. Adaptation is s concerned with the
alteration of behaviour through interaction, where the action of one participant impacts the
actions of others in each situation (Spitzberg & Changnon, 2009). These models were
grounded in Allport’s (ICT) (1954) as discussed above, but adaptation models tended to
emphasise the process of cross-cultural adaptation itself as a criterion of cross-cultural
35
competence (Kim, 1988, 1995, 2001; Spitzberg & Changnon, 2009). According to Kim
(2001), an individual’s internal condition was based on their willingness to change, ethnic
proximity, and whether they had an adaptive personality. The pressure of adapting to a
different culture, compared to maintaining one’s own culture, was one of the most powerful
issues in the development of inter-cultural competence (Berry, Kim, Power, Young & Bujaki,
1989; Spitzberg & Changnon, 2009). Their previous research also argued that adaptability
was foundational to achieving cultural competence, thereby supporting this study as it was
looking for ways to influence a student’s cross-cultural adaptability and ensure a student
became more culturally competent.
2.3.2 Cross-cultural Enjoyment
Based on Csikszentmihayi’s (1977) ‘pleasure/enjoyment continuum’, enjoyment was defined
as non-repetitive automatic acts and involved more complex activities which required the use
of a person’s physical and intellectual potential (Winch, 2017). In addition to this, Blunsdon,
Reed and McNeil’s (2003) definition of enjoyment: “enjoyment is sometimes called ‘interest’
or ‘expressed liking’” (Blunsdon, Reed & McNeil, 2003, p. 44). For other researchers,
enjoyment consisted of high and low arousal positive states (Tsai, Knutson & Fung, 2006).
They found that some people were “enthusiastic, excited, energetic” (Tsai, Knutson, & Fung,
2006, p. 290) and that pleasurable experiences may result in feelings of “joy” (Kuppens, 2008,
p. 1054), whereas others were “calm, relaxed, serene” (Tsai, Knutson & Fung, 2006, p. 290),
“content” (Kuppens, 2008, p. 1054) and “at ease” (Kuppens, 2008, p. 1057).
Differences in feeling enjoyment were claimed to be culture specific. According to Tsai,
Knutson and Fung (2006), people from individualist cultures (e.g. American, British and
Australian culture) (Hofstede, 1980), seem to prefer and value enthusiastic, excited, energetic
people but people from collectivist cultures (e.g. Chinese and other East Asian cultures)
(Hofstede, 1980) seemed to prefer and value calm, relaxed, serene characteristics (Tsai,
Knutson & Fung, 2006). Global university students’ cohorts consist of both individualist and
collectivist cultures.
Other studies of enjoyment identify trait emotions and state emotions (Goetz, Nathan, Hall,
Frenzel & Pekrun, 2006). Trait emotions take time to develop (Lumby, 2011) and involve
cumulative enjoyment. State emotions on the other hand are experienced in the present time
36
(Lumby, 2011). According to Blunsdon, Reed and McNeil’s (2003) study, “students are more
willing to act on their feeling for the moment…enjoyment is experienced at the moment, while
learning often occurs over a long period of time and one’s appreciation of the learning
experience (cognition) might occur at a much later point in time” (Blunsdon, Reed & McNeil,
2003, p. 52). This suggests that students usually experience state emotions first before they
may experience trait emotions.
Resnik and Schallmoser (2019) found in a study in which students from an Austrian university
were paired with others from Germany, that gaining first-hand experience of the others’
culture gave the students on both sides’ enjoyment. Interestingly, many established
friendships which also added to the enjoyment of the cross-cultural experience. These findings
resonate with other studies (Kim & Goldstein, 2005; Lin & Rancer, 2003; Zimmermann,
1995) who also found that successful communication with others while in another country
resulted in future willingness to communicate in different cultures. This later study (Resnick
& Schallmoser, 2019) confirmed that the experience of being paired with a student from
another culture resulted in enjoyment by the students involved.
The prior study by Resnik and Schallmoser (2019) on enjoyment between students from two
different countries working together resonated with this study as the CCAI™ showed similar
themes which included: enjoying talking to others, enjoyment of people from different
cultures and the enjoyment of new experiences, cultures, and people (Kelley & Meyers, 1987).
As the SLM experience was informal and may have resulted in friendships forming, the
experience may have been enjoyable for both the mentor and the mentee.
2.3.3 Cross-cultural Tolerance
Previous research in the areas of expatriation and globalisation asserted that tolerance for
ambiguity had a positive influence on the development of cross-cultural skills (Arthur &
Bennett, 1995; Jokinen, 2005; Mol, Born, Willemsen & Van Der Molen, 2005; Osland, 2008;
Herman, Stevens, Bird, Mendenhall & Oddou, 2010). Tolerance for ambiguity was found to
be necessary in the diverse global workplace as change created by globalisation created
complexity and ambiguity (Lane, Maznevski & Medenhall, 2004). Tolerance for ambiguity
is “the tendency to perceive ambiguous situations as desirable” (Budner, 1962, p.29). More
recent research by McLain (1993) addressed the contextual meaning of ambiguity, describing
37
the construct as “a range, from rejection to attraction, of reactions to stimuli perceived as
unfamiliar, complex, dynamically uncertain, or subject to multiple conflicting interpretations”
(p.184).
A growing body of literature conceptually links tolerance of ambiguity to cross-cultural skills
development (Medenhall, Osland, Bird, Oddou & Maznevski, 2008). It was proposed to
impact cross-cultural communication (Kealey, 1996; Nishida, 1985; Ruben & Kealey, 1979),
cross-cultural competence (Abbe, Gulick & Herman, 2007), expatriate success (Gregerson,
Morrison & Black, 1998; Mol et al., 2005) and cross-cultural competence (Furuya, Stevens,
Bird, Oddou & Medenhall, 2009).
Budner’s (1962) 16-item measurement instrument was used frequently in management and is
therefore relevant to this study as employers want graduates with cross-cultural skills, of
which tolerance for ambiguity is one. Other studies suggested that one of the major outcomes
of higher education is to prepare a tolerant specialist in cross-cultural communication (Trius,
2011; Shyryaeva, Trius, 2013). Graduates also depend on cross-cultural communication
competence and this may be in a foreign language (Shyryaeva & Trius, 2013). Universities
around the globe need to educate university students to develop their tolerance among other
skills that include inter-ethnic friendships and co-operation and respect for different cultures
(Gorbunov, 2009; Shyryaeva & Trius, 2013). These issues are universal and therefore inter-
cultural tolerance needs to be considered from a cross-cultural adaptability viewpoint.
Researchers have been asking for experimental studies to be undertaken to fully establish the
relationship between cross-cultural change and tolerance of ambiguity (Spencer-Rodgers,
Williams & Peng, 2010).
In sum, prior studies on tolerance (Medenhall et al., 2008; Trius, 2011; Shyryaeva, Trius,
2013; Gorbunov, 2009; Budner, 1962) resonated with this study as the CCAI™ showed
similar themes which included: the ability to cope with stress and the ability to keep an open
mind (Kelley & Meyers, 1987). Students participating in the SLM experience as either the
mentor or the mentee had stressful experiences. Both the mentor and the mentee developed
tolerance skills to deal with these stressful situations.
38
2.3.4 Cross-cultural Personal Values
Previous researchers have defined values as desirable, abstract goals such as security or justice
(Rokeach, 1973; Schwartz, 1992). Similar to needs, motives and goals, values motivate people
to act (Rohan, 2000; Seligman, Olson & Zanna, 1996). However, values differ from specific
goals (Emmons, 1989; King, 1995; Robert & Robins, 2001; Winnel, 1987) because values are
not context specific. Unlike needs and motives (Bilsky, 1998; McClelland, 1985), values are
understood in ways that enable people to communicate them to others. Schwartz (1992)
developed the value theory, finding that the values were: power, achievement, hedonism,
stimulation, self-direction, universalism, benevolence, tradition, conformity and security.
Schwartz’s theory (1992) has been tested in more than 200 samples from more than 70
countries and, the ten values have been verified (Davidov, Schmidt & Schwartz, 2008;
Schwartz, 2006; Spini, 2003; Schwartz, 1992; Schwartz & Sagiv, 1995; Schwartz & Bardi,
2001).
Allport (1979), Bennett (2003), Erickson (1997), Gollnick and Chinn (2005) and Goodenough
(1987) contend that cultural lenses are imprinted early in life and subconsciously continue to
evolve over a lifetime. Banks (2001), Brown (2005b) and Howard, (1999) indicate that these
develop our self-concepts and in turn, how we value, respect, accept and interact with others
both within and outside of our cultures, and how we see ourselves with relation toothers..
Therefore before we can develop strong cross-cultural skills, we should know our values
(Banks, 2001; Bennett, 2003; Brown, 2005a; Goodlad & Mantle-Bromley, 2004; Howard,
1999).In many different countries, people think that benevolence values are most important
whereas power, tradition and stimulation values are among the least important. However,
people from different countries differ substantially: people vary in how important each value
is for them.
In sum, prior studies on personal values (Banks, 2001; Brown, 2005b; Howard, 1999;
Bennett, 2003; Brown, 2005a; Goodlad & Mantle-Bromley, 2004) resonated with this study
as the CCAI™ showed similar themes which included: confidence in communication and
judgement, the ability to lead a fulfilling life in other cultures and maintaining their own
beliefs and values (Kelley & Meyers, 1987). SLMs more particularly required confidence in
their communication skills and their judgment when dealing with mentees from another
culture.
39
2.3.5 Cross-cultural Valuing Others
Values determine behaviour and as they are based on learning and individual experience, they
are related to personal values that were discussed in 2.3.4. Values determine how we evaluate
behaviour and what we deem appropriate (Kayes, Kayes & Yamazaki, 2005). Thus, behaviour
must be consistent with the values of a culture. Valuing different cultures involves
understanding complex cultural norms. Research presented by House, Javidan, Hanges &
Dorfman (2002), suggested that culturally embedded values lay along nine dimensions:
uncertainty avoidance, power distance, societal collectivism, in-group collectivism,
egalitarianism, assertiveness, future orientation, performance orientation, and human
orientation. In other words, valuing different cultures goes beyond simply knowing the
differences between cultures to appreciating how these differences are expressed in day-to-
day situations.
A variety of studies from diverse cultures showed that valuing different cultures is an
important success factor. Cleveland, Mangone and Adams (1969) described how showing
empathy for a host culture was positively related to successful US expatriate adaptation. Cui
and Awa (1992) found similar experiences with expatriates from diverse cultures working in
China. Building relationships within the host culture created the possibility of coming into
contact and creating new experiences with others. Research on expatriates found that it had
been easy for them to isolate themselves from the host culture and this seemed especially true
for expatriates from the US and Britain. Living in western hotels or expatriate communities
provided a sense of comfort and familiarity in a host culture. Yet, it was the relationships with
individuals from the local cultures that seemed to provide the most opportunities for learning
to understand others in different cultures (Kayes, et. al., 2005).
In sum, prior research on valuing others (House et al., 2002; Cui & Awa, 1992; Kayes, et al.,
2005) resonated with this study as the CCAI™, showed similar themes which included:
considering the impact of their actions in a new cultural environment, trying to understand
other people’s culture and feelings, deciding that people from other cultures are equally
valuable and having an interest in learning about different people, (Kelley & Meyers, 1987).
The SLM required these skills, as during the mentoring experience, they needed to understand
their mentee’s feelings and (perhaps) reluctance to ask questions. They also needed to have
an interest in their mentee’s cultural background to understand their needs.
40
2.3.6 Cross-Cultural Communication in Higher Education students
Communication is fundamental to the cross-cultural adaptation process. Inter-cultural
communication competence was defined by Hammer, Gudykunst and Wiseman (1978) as
having three interrelated components: the ability to handle psychological stress, to
communicate effectively, and to establish interpersonal relationships. Adaptation tends to
occur when people were willing to communicate in a new country (Kim, 2001). Willingness
to communicate is defined as “one’s predisposition to initiate inter-cultural communication
encounters” (Kassing, 1997, p. 400). This has been applied by Yashima, Zenuk-Nishide and
Shimizu, (2004), to examine foreign language study, and showed that communicating in a
second language increased self-esteem and participation in new activities. MacIntyre, Baker,
Clement and Conrod, (2001) concurred, as they also found that students who communicated
with people in the new country were more positive.
In contrast, if students were not confident with their second-language ability, they may have
been unwilling to speak to local students (Medenhall et al., 2008). They also suggested that
students who acquired the skills necessary to communicate in a new culture would have a
more comfortable and positive experience in communicating with members of the host
country. He also stated that this also included “building relationships, handling stress, and
switching communication styles when appropriate and acknowledgement of different skills
and competencies about different situations and contexts” (Mendenhall, Osland, Bird, Oddou
& Maznevski, 2008, p.20).
Similarly, favourable experiences communicating with others while in another country, as
well as an overall positive experience, resulted in future willingness to communicate in other
cultures (Kim & Goldstein, 2005; Lin & Rancer, 2003). Zimmermann (1995) also found that
there was a positive relationship between a student’s ethnicity and the new culture if there
was frequent communication with local students. International exchange students in a study
by Surdam and Collins (1984) also found adjustment easier if they spent time talking and
interacting with a student who was not part of their own ethnic or cultural group. A global
issue in education was that student cohorts were becoming more culturally diverse and have
differing literacy competence, but all would have to participate in an increasingly diverse
workforce (Hartman, Renguette & Seig, 2018; Gardner & Perry, 2011; Chang et al., 2013).
41
As such, they found that it was crucial that language teachers had the skills necessary to
provide both domestic and international students with the skills that were required to
communicate in an increasingly diverse world (Hartman et al., 2018), however,whether
foreign language study should be linked with cultural studies has been debated since the 1970s
(Gerighausen & Seel, 1982; Gohring, 1980). In later studies understanding the history of the
culture was developed and added to the foreign language studies curriculum. The term inter-
cultural competence emerged in an article by Muller (1993) favouring the opinion that
contemporary foreign language teaching must include inter-cultural competence.
In this study, inter-cultural communication was an integral part of the peer-to-peer mentoring
experience. Without effective communication in the cross-cultural dyad, learning would not
take place. In this research, the mentor needed to have significant communication skills from
their training and from their previous experience in the subject they were mentoring.
However, mentees, may not have had the same level of communication skills in the language
of instruction. These studies suggested that the student who asked for help needed to be
confident in the ability of the mentor to explain in straightforward language. Otherwise it
might have been found that only those students who already had higher cross-cultural
adaptability skills attended the SLM area.
2.3.7 Cross-Cultural Competence in Higher Education students
Bennett (1993) used the word inter-cultural sensitivity and warned in the early 1990s that it
was not part of human history. He suggested that cross-cultural contact had historically been
accompanied by bloodshed, oppression or genocide. However, in today’s globally connected
world, inter-cultural competency development is emerging as a central focus of higher
education internationalisation efforts (Clifford & Montgomery, 2011; Caruana & Ploner,
2010; Sison & Brennan, 2012; Scharoun, 2016).
Cross-cultural competence reaches across many academic disciplines, including
anthropology, education, management, psychology and sociology. There is still disagreement
on what cross-cultural competence involves. Fantini (2005) found that inter-cultural
competence required many traits, dimensions, and steps necessary for its development.
Wiseman (2003) found that cross-cultural knowledge, motivation, and skills, together with
42
interactions among individuals of differing cultures, developed cross-cultural competence.
Hunter (2004) enlarged the definition, by adding the need to be open while learning to
understand the cultural norms and expectations.
Deardorff (2009) also extended the definition of inter-cultural competence as “ a cultural
learning process in which one builds authentic relationships by observing, listening, and
asking those who are from different backgrounds to teach, to share, to enter into a dialogue
together about relevant needs and issues” (p.xiii). However, Fantini (2005) defined inter-
cultural competence as “the complex set of abilities needed to perform effectively and
appropriately when interacting with others who are linguistically and culturally different from
oneself” (p.1). Another study by Chen and Starosta (1996) presented three perspectives that
people embody when developing inter-cultural competence: inter-cultural competence: inter-
cultural sensitivity, inter-cultural awareness, and the ability to think quickly in different
cultural situations. Although there is disagreement about the definition that should be used, it
is clear that inter-cultural competence involves developing knowledge, skills and abilities
from people from different cultures by interacting, engaging, and learning.
More recently, a shift in the communication and psychology disciplines resulted in a focus on
relationship development which led to more relationally focused research (Chen, 2002;
Collier, 1996; Hecht, Larkey & Johnson, 1992; Hect & Ribeau, 1984; Hecht & Larkey, 1994).
Cant (2004) agreed with this shift, suggesting that successful managers must have flexibility,
resourcefulness, ability to articulate a vision for the organisation, and the ability to cope with
contradictions and ambiguity. He discussed how these five competencies fit within the
cultural contexts of cultural self-awareness; cultural competence; leading multi-cultural
teams; negotiating across cultures; and having a global mindset, concluding that the goal of
academic international business programs was to develop these cultural competencies (Cant,
2004).
An alternative approach was developed by Cohen (2007) for world-class success. His work
extended the research already conducted by Kelley and Meyers (1995) on crucial personality
traits required for cultural competence, including being open to new experiences, being
curious about the world, being enthusiastic, energetic, and willing to listen and learn. He also
found that being able to adapt readily and being willing to ask questions were important
(Cohen, 2007).
43
Reimers (2008) agreed that students needed ‘global competency’ - the knowledge and skills
– to work across disciplines, understand global challenges, especially when interacting with
people from Asia, and respond to and resolve issues effectively. Reimers (2008) defined
‘global competence’ in an Eastern setting as having three interdependent dimensions:
1. A positive approach, active engagement with cultural differences; empathy with
people from Asia, an interest in their history, and the ability to engage in constructive,
respectful, and peaceful interactions.
2. The ability to speak, understand and think in foreign languages.
3. Knowledge of world history, geography, globalisation, healthcare, climate change,
economics and international politics.
In this study, the ability to be flexible, open and willing to engage with students from another
culture was an integral part of their time at university. If students maximised their time by
interacting with international students and undertaking international experiences, they may
have been better positioned for a more successful business career. Developing these skills
was, therefore, of high importance.
2.4 Peer-to-peer mentoring
The term ‘mentor’ appears to have originated in Homer’s epic poem, The Odyssey, published
in the eighth or ninth century. Odysseus entrusted his son, Telemachus, to his friend Mentor,
while he was away. Mentor was a surrogate father, teacher, role model, protector, advisor,
guide and counsellor to the inexperienced boy (Beye, 1976). The use of the word, mentoring,
appears to have been used in America for the first time at the end of the eighteenth century
when Murry (1778) authored one of the first books on mentoring. In the Journal of Education
(1884), teacher-student relationships were discussed and ‘The Mentor’ was published by ‘The
Mentor Association’ (Moffat, 1913). In 1973, Bradley and Adamson wrote about faculty
mentors at Empire College in New York. This was followed by Collins and Scott (1978)
publishing Everyone Who Makes It Has a Mentor. Levinson, Darrow, Levinson and McKee
(1978) popularised the term mentor when they wrote about mentors being the most important
relationships a man could have.
44
To date, there have been numerous studies on the effects of peer-to-peer mentoring in higher
education settings since their inception in the eighteenth century that focused on graduate
experiences, student adjustment and retention and student performance (Materniak, 1984;
Johnson, 1989; Jacobi, 1989; Scandura, 1992; Allen et al., 1997a; Noe, 1988; Allen & Poteet,
1999; Fox & Stevenson, 2007; Kemlo 2010; Santos & Reigadas, 2002; Wanberg et al., 2003;
Sanchez et al., 2006; Allen et al., 2008; Hall & Jaugietis, 2010; Thomas, 2012; Chester et al.,
2013; Deakin University, 2010; Freeman & Kelton, 2004; Leung & Bush, 2003; Macquarie
University, 2010; Monash University, 2009; University of British Columbia, 2010; University
of Melbourne, 2010; Gershenfeld, 2014; Griffiths et al., 2018).
The issue of experience was a crucial factor in the success of the mentoring arrangement, but
there must also be trust for the mentee to share fears and experiences with their mentor as it
was intended to increase the personal and professional growth of the mentee (Mullen, 1994).
In another study by Gardiner mentoring was defined as “primarily listening with empathy,
sharing experiences and learning (usually mutually), professional friendship, developing
insight through reflection, being a sounding board, encouraging” (Gardiner, 1998, p. 77),
which introduced the notion of mutuality and professional friendship. Much of the existing
research on traditional mentoring in business had addressed the following aspects: the
outcomes, diversity (especially gender and ethnicity), individual characteristics, the dynamics
of the relationship and the use of formal mentoring programs (Wanberg et al., 2003).
Peer-to-peer mentoring is the type of mentorship which usually was between a person who
lived through an experience, and a person who had not (Hall & Jaugietis, 2010). In the field
of higher education, peer mentoring has been used for several reasons, including:
a. Advantages or benefits that were credited to traditional mentoring
b. The absence or lack of academic volunteers or university administrators, as well as the
higher availability of students to use as mentors. These were often second or later year
students, from diverse cultures.
c. As peer-to-peer mentoring services required a low budget to administer or develop, they
were a cheap alternative to support students who were perceived as likely to withdraw or fail
(Hall & Jaugietis, 2011; Griffiths et al., 2018).
For many years, universities have used student-to-student peer mentoring to help students
make the transition to university from secondary school (Westwood & Barker, 1990; Asbee
45
& Woodall, 2000; Cross, 1998; Goodland, 1998; Hughes & Fahy, 2009; MATE, RMIT
University, 2010; Collings et al.,, 2015; Fox et al., 2010; Heirdsfield, Walker & Walshe,
2008). The relationship between the mentee and the mentor offered the mentee a sense of
connection where they might feel otherwise lost (Thomas, 2012).
2.4.1 Academic peer-to-peer mentoring in Universities
Programs have been created to help mentor students in their learning and assessment tasks,
usually by a more experienced student assisting a less experienced student. Examples are the
Student Learning Advisory Mentors (SLAMs) at RMIT (Kemlo, 2010); the Law students’
Association Mentoring Program (LAMPs) at Griffith University in Queensland (Woods et al.,
2013); the Higher Education Mentoring Program (HEMP) at William Angliss Institute (2019).
The University of Melbourne, (2019); Australian Marketing Institute, 2019; Falchikov, 2001;
Kram, 1985; University of South Australia, 2019). Peer mentors are usually selected as they
were successful academically, and had excellent social, communication and leadership skills.
As an outcome of this, a mentor provides a positive role model for the students while guiding
them in social and academic success. Mentors tend to offer advice, support, and
encouragement, in addition to friendship to students (Kemlo, 2010).
In addition to the elements described above, previous research found that student mentors
should also be able to listen in a non-judgemental way. These mentors may not have been
considered ‘senior’ but they have had more experience of the subject, having gone through it
in a previous year or semester. The prior completion of the subject was vital, as it showed
empathy and understanding of the subject-specific issues. Experience of the subject was more
important than the age of the mentor (Kemlo, 2010).
A study by Tinto (1993), found that successful peer mentoring increased the retention rate of
students. Chester et al., (2013) also argued that programs of peer mentoring were significant
components in the strategy to increase the undergraduate experience, particularly in their first
year. Hall and Jaugietis (2011) conducted a study in which they reported on a six-year research
project about the development of a peer mentoring program where feedback was used to
improve the program continuously. In their study, this process increased the level of overall
participant experiences, and the benefits were enhanced throughout the life of the program.
Participation in the program improved the leadership, organisational and communication
46
skills of peer mentors. In higher education, peer mentoring has been considered as one of the
successful methods of engaging and retaining students for many years (Kemlo, 2010).
Peer mentoring has also been linked to other benefits across a variety of settings, but Kram
(1983) and others (Dreher & Cox, 1996; Heilmann, 2012) raised the need to study cross-
cultural mentoring relationships, to understand any unique attributes, and to enhance the
generalisability of comparative analysis. Researchers have recognised that peer mentoring
helps with student adjustment to university (Santos & Reigadas, 2002; Sanchez, Bauer &
Paronto, 2006). However, few programs address the goals of improving inter-cultural
interactions and facilitating the transition to university. These studies used ethnically matched
peer-to-peer mentors and mentees, which made it impossible to determine whether it was
ethnic matching or the mentoring experience itself, or some combination, that mentees found
useful. It is imperative to extend the limited research on the effects of non-ethnically matched
mentoring on the development of students’ cross-cultural skills (Woods et al., 2013). Large
international student cohorts are a feature of most business faculties in universities in
Australia, but there is a lack of integration with the local student population. Together with
the global expansion of education, there is the potential to create groups of disadvantaged
students because of their lack of understanding of cross-cultural situations (Mosey et al.,
2012).
Cross-cultural peer-to-peer mentoring in higher education includes ongoing, and often
inspiring interactions with students from different ethnicity, race, gender, socio-economic
background, or sexual orientation. A mentor who works across cultures guides the personal
and intellectual development of the mentee (Arkoudis et al., 2010; Caligiuri & Tarique, 2012).
Peer-to-peer mentoring in cross-cultural environments was developed based on virtues, values
and vision. The determination of values that were held jointly across different cultures,
resulted in the growth of both understanding and trust between students in the dyad. Previous
research in educational settings has shown that mentors do not need to come from the same
social or cultural backgrounds as their mentees (Arkoudis et al., 2010; Caliguri & Tarique,
2012; Griffiths et al., 2018). Each should take into consideration the differences between
them. Because of the complexity of cross-cultural mentoring relationships, mentors required
abilities or attributes: selflessness, active listening skills, non-judgemental attitude, honesty,
patience, persistence, and appreciation for the diversity of their mentees (Crutcher, 2007).
47
University peer-to-peer mentoring and pastoral care services are frequently employed by
universities to improve the international student experience (Russell, Rosenthal & Thomson,
2009; Monash University, 2009; RMIT University, 2010; Jones & Brown, 2007). Woods et
al., (2013) conducted a study examining the effectiveness of short-term mentoring, to develop
cross-cultural friendships at one university in Australia. The results of this study suggested
that the mentoring program enhanced cross-cultural interactions for mentees. Further research
reported that mentees spent more time with cross-ethnic friends than did the control group
after the completion of the peer-to-peer mentoring program (Kemlo, personal communication,
February 15, 2018). Woods et al., (2013) also revealed a significant positive association
between the cultural empathy of the mentee and cross-cultural friendships.
Most research on international students’ experience of peer-to-peer mentoring schemes
involved a single country mentoring scheme in a Western education and values system.
(Kram, 1983; Noe, 1988; Allen et al., 1997a; Allen & Poteet, 1999; Dreher & Ash, 1990;
Scandura, 1992; Dreher & Cox, 1996; Allen et al., 2004; Heilmann, 2012; Leong, 2007;
Woods et al., 2013; Arkoudis et al., 2010; Caligiuri & Tarique, 2012; Mosey, Wright &
Clarysse, 2012; Griffiths et al., 2018). Future research is necessary to find whether these same
effects would be evident in an Eastern setting.
Individuals who are different ethnically and racially have previously stated that they felt
uncomfortable due to stereotypical expectations and historical race relations (Ferrari, 2004;
Jacobi, 1991; Johnson-Bailey, Cervero & Baugh, 2004; Long, 1994; Ortiz-Walters & Gilson,
2005, Tenenbaum, Crosby & Gliner, 2001). Much of the literature has a very different
viewpoint. Current research reports that cross-cultural peer mentoring is exceptionally
successful when it does occur (Bova, 2000; Johnson-Bailey et al., 2004; Packard, Walsh &
Seidenberg, 2004; Ragins & Scandura, 1997; Budge, 2014).
Theories of both inter-group contact and social learning underpin this study and they both
suggest that contact between people from different cultures has an effect on respondents’
cross-cultural skills development (Allport, 1954; Bandura, 1977). These theories suggest that
a cross-cultural peer-to-peer mentoring experience may influence students’ cross-cultural
adaptability. Allport (1954) did not suggest that mere contact was enough to change attitudes
towards a person from another culture, but he did posit that acquaintanceship such as that
developed with a SLM could positively affect cultural attitudes. More recent research by
48
Pettigrew and Tropp (2006) as well as Soria and Triosi (2014), suggest that contact enabled
conditions for positive contact outcomes to emerge which included learning about cultural
diversity, which improved attitudes and reduced stereotypes. Bandura’s (1977) SLT explained
human behaviour in terms of “a continuous reciprocal interaction between cognitive,
behavioural, and environmental determinants” (p. vii). His theory also emphasised the
importance of observing and following people from different cultures to develop their cross-
cultural skills. People need to take note of their behaviours, attitudes, and emotional reactions.
These conditions are evident in academic peer-to-peer mentoring as the mentor and mentee
meet and observe each other during the mentoring experience.
This study added to the research in the peer mentoring area, that had been asking for studies
of different dyads, whether by age, gender or ethnicity (Kram, 1983; Woods et al., 2013;
Arkoudis et al., 2010; Mosey et al., 2012). It also added a new dimension to the peer mentoring
area by studying whether the peer mentoring contact had an influence on either the mentor or
the mentee’s cross-cultural skills development as measured by the CCAI™ (Kelley & Meyers
1987, 1992). This study also enabled universities to understand the effects of cross-cultural
interaction by gathering evidence about which international programs had a significant
influence on students’ cross-cultural adaptability.
This study examined whether participation in the cross-cultural mentoring experience with a
SLM influenced higher education students’ cross-cultural adaptability relative to those
students who did not seek help from a SLM. Therefore, it can be hypothesised that:
H1: Having a cross-cultural experience with a SLM will have a significant influence on
students’ cross-cultural adaptability overall as measured by the dimensions
developed as a result of exploratory factor analysis (EFA) of enjoyment, tolerance,
personal values or valuing others relative to students who did not seek help from a
SLM.
H1a: Having a cross-cultural experience with a SLM will have a significant influence on
students’ cross-cultural adaptability for the dimension of enjoyment, relative to
students who did not seek help from a SLM.
H1b: Having a cross-cultural experience with a SLM will have a significant influence on
students’ cross-cultural adaptability for the dimension of tolerance, relative to
students who did not seek help from a SLM.
49
H1c: Having a cross-cultural experience with a SLM will have a significant influence on
students’ cross-cultural adaptability for the dimension of personal values, relative to
students who did not seek help from a SLM.
H1d: Having a cross-cultural experience with a SLM will have a significant influence on
students’ cross-cultural adaptability for the dimension of valuing others, relative to
students who did not seek help from a SLM.
2.5 Demographics and socio-economic factors
Demographics have been beneficial in predicting behaviours as suggested by Rokeach (1973),
who suggested that values have a direct relationship with demographics, such as culture and
education. Shoham Florenthal, Rose and Kropp (1998) were in accord with Rokeach who
asserted the importance of examining both values and demographics simultaneously, as both
constructs were useful for segmentation purposes (Kopanidis, 2008). McCarty and Shrum
(1993, p.78) noted academic researchers were “reluctant” to consider demographic variables
when explaining behaviour, stating that the demographic factors (gender, age, income and
education) were essential to understand the values-behaviour relationship.
Harris (1977) summarised twenty-four variables that differentiated highly successful from
less successful international Peace Corps teaching volunteers, and found that these variables
included facility with language, adaptability, responsibility, cultural sensitivity, interest in
nationals, the realism of goals, agreement and compromise, inner strength, self-reliance,
patience or tolerance, perseverance, initiative, reliability, argumentativeness, courteousness,
cooperativeness, friendliness, and general maturity.
Several more recent studies in higher education show the importance of student interactions
with others from different races, ethnicities, and social classes, which all develope the
student’s understanding of diversity, and may positively change the racial climate on campus
(Hurtado, 1992; Hurtado, Carter, & Sharp, 1995; Soria & Triosi, 2014). Hurtado, Milem,
Clayton- Pedersen, and Allen (1998) as well as Soria and Triosi (2014), demonstrated that
interracial contact had a positive effect on students’ views. Tierney (1992) also agreed and
found that programs that encouraged contact and conversation produced cultural learning,
support, and understanding.
50
In this study, it was postulated that adaptability was mitigated by foreign language ability and
general maturity, for example. Socio-economic status was a broad concept which comprised
three main dimensions: occupation, education and wealth (Carman, 1977). Parental
occupational status was defined as the occupation of the parents with the highest occupational
status. For this study, both parents were considered for their effect on the cultural adaptability
of the students, as the baseline before the peer-to-peer mentoring experience. Family income
was intentionally left out of the questionnaire, as previously, this question could have been be
intimidating to the respondents, even if they knew the answer (Jones, 2001).
Based on several recommendations that originated from a report commissioned by the
University of Queensland (Western, McMillman & Dorington,1998), each socio-economic
factor was considered as a single item and measured with fixed choice questions. Siddique
(1963) as cited in Sharma and Jung (1985) reported that there was no significant relationship
between sex, religion, education of the father, occupation of the father and interaction with
international students. He further implied that situational factors seemed to be crucial in
determining the actual degree of interaction. Hassan’s (1961) study showed that students who
came from families of high status within their own country interacted with local (American
students) more frequently than international students.
Through the use of repeated measures of analysis of covariance, (MANCOVA) analysis, this
study examined whether participation in a cross-cultural mentoring experience influenced
higher education students’ cross-cultural adaptability relative to those who did not, after
controlling for demographic and socio-economic factors. These factors may have had an
influence on the four cross-cultural adaptability dimensions, which in turn might have
influenced the overall cross-cultural adaptability of the student. Therefore, it can be
hypothesised that:
H2: Demographic and socio-economic factors will have a significant influence on
students’ cross-cultural adaptability in both the pre- and post-tests as measured by
the dimensions of enjoyment, tolerance, personal values or valuing others for students
who have a cross-cultural mentoring experience, relative to students who did not seek
help from a SLM.
H2a: Age will have a significant influence on students’ cross-cultural adaptability in both
the pre- and post-tests as measured by the dimensions of enjoyment, tolerance,
51
personal values or valuing others, for the students who had a cross-cultural mentoring
experience with a SLM, relative to students who did not seek help from a SLM.
H2b: Gender will have a significant influence on students’ cross-cultural adaptability in
both the pre- and post-tests as measured by the dimensions of enjoyment, tolerance,
personal values or valuing others, for students who have a cross-cultural mentoring
experience with a SLM, relative to students who did not seek help from a SLM.
H2c: Ethnicity will have a significant influence on students’ cross-cultural adaptability in
both the pre- and post-tests as measured by the dimensions of enjoyment, tolerance,
personal values or valuing others, for students who have a cross-cultural mentoring
experience with a SLM, relative to students who did not seek help from a SLM.
H2d: Mothers’ education level will have a significant influence on their cross-cultural
adaptability in both the pre- and post-tests as measured by the dimensions of
enjoyment, tolerance, personal values or valuing others, for students who have a
cross-cultural mentoring experience with a SLM, relative to students who did not
seek help from a SLM.
H2e: Fathers’ education level will have a significant influence on their cross-cultural
adaptability in both the pre- and post-tests as measured by the dimensions of
enjoyment, tolerance, personal values or valuing others, for students who have a
cross-cultural mentoring experience with a SLM, relative to students who did not
seek help from a SLM.
2.6 Socialisation
The number of international students has grown globally (Organization for Economic
Cooperation and Development, (OECD), 2017). Universities have the potential to serve as
places of cross-cultural skills development, and for international friendship development.
Having international students on local campuses provides many opportunities for direct and
indirect cultural contacts for local students. This facilitates better cross-cultural social
participation (Sharma & Jung, 1985), resulting in cultural adjustment. Allport's (1954) contact
theory was used to understand how students gained inter-cultural competence by interacting
with international students on campus, or while studying abroad. Proximity did not always
lead to ‘meaningful’ interaction (Wessel, 2009).
52
Additionally, various studies showed that interactions between domestic and international
higher education students rarely resulted in cross-cultural friendships (Trice, 2004; Gareis,
2012). Studies by Deutsch (1970), Kowcha (1970) and Matross, Page and Hendricks (1982)
agreed that students who reported making friends were more understanding, accepting and
respectful of different nationalities, ethnic backgrounds and races. Friendship was widely
understood to be unconstrained by geography, ethnicity and culture (Blatterer 2015; Bunnell,
Yea, Peaks, Skelton & Smith. 2012). Other studies on cross-cultural friendships between
domestic and international students also had an optimistic view of friendship as a source of
freedom and knowledge (McKenzie & Baldassar, 2017). A study by Bennett, Volet and
Fozdar (2013) explored a cross-cultural relationship between a Vietnamese student and a
domestic Australian student and highlighted the fact that friendships between domestic and
international students were not the norm.
It is argued that cross-cultural friendships help to build students’ cross-cultural competence
(Jon, 2013). Building such relationships are now proposed as outcomes of university
internationalisation ‘at home’ programs (Amit, 2010; Barnick, 2010; Leask, 2004, 2008,
2016), but although these programs provide opportunities for this interaction, these
friendships remain uncommon, and literature is still divided. A meta-analysis completed by
Pettigrew and Tropp (2006) confirmed the idea that inter-group contact typically reduced
inter-group prejudice. According to Allport’s Contact Theory (1954), mere contact was
insufficient, but a study by Vogt (1997) hypothesised that the more frequent and in-depth the
interaction of members of different social groups, the more likely they would be to get along.
In a study by Goldsen, Schuman and Williams (1956), personality characteristics and
environmental factors influenced the development of relationships. They found that American
students who scored highly on the social interaction scale, were more outgoing and friendlier,
were involved on campus, and were not miscreants, isolated or dissatisfied with student life.
Later, Deutsch (1970), Kowcha (1970) and Matross et al., (1982) agreed that students who
reported making friends were understanding, accepting and respectful of different
nationalities, ethnic backgrounds and races. A later study by Kets de Vries and Mead (1992)
argued that early involvement in cross-cultural environments could be an essential factor in
adults’ ability to work cross-culturally. The effect of childhood cross-cultural socialisation
was a contributing factor to how successful that person would be in dealing with cultural
adaptability as an adult (Kets de Vries & Mead, 1992; Eichenger et al., 2015).
53
Ryan (2011) acknowledged that international students “provide an opportunity for the co-
construction of new knowledge and more collaborative ways of working and thinking” (p.
631 & 642). If innovative ways could be developed to build meaningful and closer
relationships and friendships between domestic and international students (Rose-Redwood &
Rose-Redwood, 2018), then the international students gained more from their time at an
international university and underwent a cross-cultural transformation. Universities have a
responsibility to their international students to ensure they have the experience that they and
their families expect. Otherwise, their reputations in the international education arena would
diminish.
Interactions between domestic and international students in the home country, as well as the
international student’s experience, have featured in academic research for some time (Tierney,
1992; Hurtado et al., 1995; Hurtado et al.,,1998; Cooper, 2009; Arkoudis et al., 2010; Gothard,
Downey & Gray, 2012). Some studies suggested that domestic students preferred to study
with other local students because they were unsure of the level of linguistic proficiency of
international students (Smith, 2006; Stone, 2006a, 2006b). Significant findings of Robertson,
Line, Jones and Thomas (2000) and Volet and Ang (1998), in an Australian setting, supported
previous assertions that there were low levels of interaction between local and international
students, and that local students may spend more time in part-time work, and more time
studying at home with technology-assisted learning, leading to even fewer opportunities for
engagement between local and international students.
This low rate of inter-cultural interaction between international students and domestic
students has concerned higher education academics and researchers for some time
(Chapdelaine & Alexitch, 2004; Halualani, Chitgopekar, Morrison & Dodge, 2004; Pitts,
2009). Low inter-cultural interaction undermines the educational value of attending an
international university for international students and fails to result in the potential for
diversity awareness for locally born students (Halualani et al., 2004; Smart, Volet & Ang,
2000, Trice, 2004). At many universities, inter-cultural communication skills and confidence
in communicating and interacting with students from different cultures remain undeveloped
(Hibbins & Barker, 2011; Pitts, 2009; Ujitani & Volet, 2008).
54
Allport (1954) specified in his ICT, that fruitful intergroup contacts could be achieved with:
enforcement of initiatives and taking ownership of participants' success; meaningful
interactions rather than superficial contact; the equal status between individuals to reduce
stereotypes and prejudices, and to have more interactions with individuals that are more
cooperative rather than competitive. Allport's (1954) theory continues to be used in new
studies as researchers consider new situations for better cross-cultural contact. In a study by
Wagner and Machleit (1986) that extended contact theory, they found that positive contact
required a common language, voluntary contact and a prosperous economy. Pettigrew (1998)
noted that Allport's theory explained when contact resulted in positive change but not how
and why the change occurred. Pettigrew and Tropp (2006) as well as Soria and Triosi (2014),
suggested that Allport’s criteria were not necessary for inter-group contact to be positive, but
instead they enabled conditions for positive contact outcomes to emerge. Pettigrew (1998)
also offered a broader theory of intergroup contact that explained how intergroup contact
reduced prejudice. This included learning about cultural diversity, which improved attitudes
and reduced stereotypes; which resulted in changes in behaviour, and changes in attitudes;
which resulted in positive emotions, empathy, and intergroup friendships (Soria & Triosi,
2014).
Although ICT provided support for interpersonal interactions to lead to the development of
inter-cultural competencies, Lewin’s (1936) person-environment interaction theory suggested
a different method to understand how the higher education environment promoted students’
inter-cultural development. Lewin suggested that behaviour resulted from the interaction of
the person and their environment. In higher education, curricular, co-curricular, and
interpersonal activities could influence the student’s cross-cultural competencies (Kuh, Shu,
Witt, Andreas, Lyons & Strange, 1991). Early behavioural researchers believed that in certain
situations, individual behaviour could be explained, predicted, and modified (Conyne &
Clack, 1981). Therefore, well designed curricular and co-curricular international experiences
expose students to people from diverse cultures, present opportunities for understanding
international cultures, and situate students within a global context. Such activities provide
students with opportunities to develop inter-cultural competencies. In Australia, international
student recruitment has been a significant driver and a resource for internationalisation of the
curriculum. A study by Ping (1999) also found that on-campus interactions with students from
different cultures may have the potential to prepare students for future cross-cultural
environments.
55
Kashima and Loh (2006) studied 200 international students in Melbourne, Australia. In their
study, students with more social support from locals and students from their own country
showed evidence of psychological adjustment, but they found that interactions with local
students were essential. Results of their research showed that some students coped better than
others; therefore, encouraging cross-cultural interaction might have benefited the student who
found flexibility difficult. Factors that were positively correlated to socio-cultural adjustment
were English speaking background, and the length of time the student had been studying in
Australia. Research also suggested that being flexible resulted in happier international
education experiences. Marginson and Sawir (2011) also found that those able to be more
adaptable were more likely to succeed academically.
An increasing number of universities subscribe to the notion that inter-cultural understanding
would develop when students from different cultures were enrolled on one campus (Weigl,
2009). Universities that had policies and procedures to encourage inter-cultural skills
development urged teachers to select content and learning experiences that developed these
skills among their students. To address the need for cross-cultural skills development, students
could be encouraged to consider global issues from many perspectives and benefit from
membership of a diverse community of learners (Phillips, 2011). With the increase in
international students enrolled in higher education, even those who did not participate in an
offshore experience had opportunities for contact with international students (Soria & Triosi,
2014).
Through the use of repeated measures of analysis of covariance, (MANCOVA) analysis, this
study examined whether participation in a cross-cultural mentoring experience with a SLM
influenced students’ cross-cultural adaptability relative to the students who did not seek help
from a SLM, after controlling for hours spent socialising, or having friends or family from
another culture. These factors may have an influence on the four cross-cultural adaptability
dimensions, which in turn might have influenced the overall cross-cultural adaptability
of the higher education student. Therefore, it can be hypothesised that:
H3: Previous socialising factors will have a significant influence on students’ cross-
cultural adaptability in both the pre- and post-tests as measured by the dimensions of
enjoyment, tolerance, personal values or valuing others for students for students who
56
have a cross-cultural mentoring experience with a SLM, relative to students who did
not seek help from a SLM.
H3a: The number of hours spent socialising will have a significant influence on students’
cross-cultural adaptability in both the pre- and post-tests measured by the dimensions
of enjoyment, tolerance, personal values, or valuing others, for the group who had a
cross-cultural mentoring experience with a SLM, relative to students who did not seek
help from a SLM.
H3b: Having friends or family from a different culture will have a significant influence on
students’ cross-cultural adaptability in both the pre- and post-tests as measured by
the dimensions of enjoyment, tolerance, personal values, or valuing others, for the
group who had a cross-cultural mentoring experience with a SLM, relative to students
who did not seek help from a SLM.
2.7 Previous private international experiences
Not every university student has the same experiences in their pre-university lives. Not all
students come from a privileged background, but even if they do not, international travel costs
have reduced significantly over the past twenty years, making international travel more
affordable. A gap year after the end of high school has also continued to be undertaken by
many Australian students, or if not a year, then some form of shorter-term travel. Students
who were exposed to cultural differences early in their lives or careers would find different
cultures more familiar if they had more exposure (Bornstein, 1989). They would not find other
cultures challenging to relate to and therefore would experience less anxiety. The more
cultural experience of international friends or family that an individual had before they
travelled, the more flexible their personality would already be, and it would be easier to adapt
to a new culture (De Verthelyi, 1995; Tomich, McWorter & King, 2000). Kets de Vries and
Mead (1992) wrote that the impact of childhood cross-cultural socialisation was an essential
factor in dealing with cultural adaptability as an adult.
Adults who had not mixed with culturally different people may have felt more threatened by
people from other cultures, than adults who had positive experiences (Bornstein, 1989). These
findings were not new, as Smith (1955) also found that people with more extensive inter-
cultural experience adopted new ideas more quickly. Merryfield (2000) agreed and found that
57
those who travel internationally for an extended period developed an understanding of what
it was like to be perceived as different.
A model for international encounters developed by Beamer (1995) suggested an explanation
of the impact of cultural immersion on cultural learning. This model posited that when people
met a person from a new culture, their pre-conceived ideas were usually different from reality.
When cultural immersion increased, people modified their ideas and behaviours, which
helped them alleviate culture shock, and developed their cultural competence (Nishida, 1999).
The psychological theory of exposure to another culture (Zajonc, 1968) might also explain
why some people are more culturally adaptable. According to this theory, if people were
exposed to people who were different, they developed a positive attitude toward that person
(Zajonc, 1968). De Verthelyi (1995) also suggested that an individual’s motivation to
experience a new culture depended on prior cultural experiences and whether these shaped
them to be adaptable. Through this, individuals began to gain an understanding of the host
intentions and actions, which made for a more straightforward adaptation to occur (Tomich
et al., 2000). This supported Allport’s (1954) findings that contact decreased prejudice against
others who were culturally different from themselves.
In the discussion of cross-cultural communication, Reimers (2008) found the importance of
being able to speak, understand, and preferably think in (several) foreign languages. Whether
foreign language study should be linked with cultural studies had been debated since the 1970s
(Gerighausen & Seel, 1982; Gohring, 1980); Byram, 1989, 1997; Byram, Gribcova &
Starkey, 2002). An article by Moeller (2014) favoured the opinion that contemporary foreign
language teaching must have included inter-cultural competence. Current language study at
high school did include history and cultural discussions, and due to the possible impact on
overall ATAR scores in year 12, (Victorian Tertiary Admissions Centre (VCAT), 2019),
foreign languages were studied extensively at high school, but there was a considerable
decrease in language study at university.
Through the use of repeated measures of analysis of covariance, (MANCOVA) analysis, this
study examined whether participation in cross-cultural mentoring experience with a SLM
influenced students’ cross-cultural adaptability relative to the students who did not meet with
a SLM, after controlling for students having previous private holidays or learning a foreign
language at school. These factors might have an influence on the four cross-cultural
58
adaptability dimensions, which in turn influence the overall cross-cultural adaptability of
the higher education student. Therefore, it can be hypothesised that:
H4: Previous private international experiences will have a significant influence on
students’ cross-cultural adaptability in both the pre- and post-tests as measured by
the dimensions of enjoyment, tolerance, personal values, or valuing others, for
students who had a cross-cultural mentoring experience with a SLM, relative to
students who did not seek help from a SLM.
H4a: Having been on private holidays in countries different from that in which the student
was born will have a significant influence on students’ cross-cultural adaptability in
both the pre- and post-tests as measured by the dimensions of enjoyment, tolerance,
personal values or valuing others, for students who had a cross-cultural mentoring
experience with a SLM, relative to students who did not seek help from a SLM.
H4b: Having studied a foreign language at school will have a significant influence on
students’ cross-cultural adaptability in both the pre- and post-tests as measured by
the dimensions of enjoyment, tolerance, personal values or valuing others, for
students who had a cross-cultural mentoring experience with a SLM, relative to
students who did not seek help from a SLM.
2.8 Offshore international academic experiences
To date, a review of cross-cultural literature related to cross-cultural skills development in
universities revealed that the mechanisms for achieving these cross-cultural graduate skills
have been the subject of considerable discussion. Study Abroad Programs (SAPs) have been
extensively studied, but usually from the experience of a local student participating in an
offshore study. Following companies who had sent employees abroad to increase their
international experience or develop their cross-cultural training, (Suutari & Burch, 2001),
increasing numbers of universities globally have implemented exchange programs that
encourage students to undertake international travel to develop their cross-cultural skills
(Weigl, 2009).
Studying abroad is also considered an important factor to enhance the student experience and
employability, and for many universities, it is becoming a key component of their
59
internationalisation strategies. Many universities are moving towards shorter, high-influence
experiences to help students strengthen their core skills and competencies (West, 2017). As
an example, RMIT University positioned studying abroad as a central platform to its 2020
‘Ready for Life and Work’ strategic plan (RMIT, 2015). Although students are encouraged to
expand their horizons past their national boundaries and undertake an off-shore international
experience, only approximately three to ten per cent of Australian students participated in an
offshore program; currently, most participated in overseas exchange programs (Universities
Australia Data Snapshot, 2019). Despite the observed benefits of these programs, the
connection between international offshore experiences and graduate employability skills
remains an under-researched area (Crossman & Clarke, 2010; Cai, 2013). This study posited
that both outbound exchange and inbound international exchange influenced these students’
cross-cultural adaptability in the same way.
An early cross-cultural study by Oberg (1960) argued that travellers to a new country
underwent a succession of steps starting with a ‘honeymoon’ period, where they felt
fascinated, elated and optimistic. Hostility towards the new country may have occurred next,
followed by a recovery phase where the traveller developed comfort with the language and
then the culture. The final stage was where new customs were accepted and enjoyed (Oberg,
1960). In 1982, Church provided insights for students on the psychological adjustment of
relatively short visits to new cultures. He found that previous studies tended to concentrate on
sojourner experiences or cultural differences, which were specific to the example. He also
stated that only one theory of adjustment was unlikely. He studied both communication and
social interaction with locals and noted a positive relationship between these two factors. He
suggested that there is a “notion of a multi-cultural sojourner able to adjust freely between
multiple cultures” and commented on these students’ development of self-reliance and self-
awareness changes rather than changes in culture-based ideologies and norms (Church, 1982,
p.558).
A number of other studies exist that indicate that students reap significant academic, personal
benefits, gain knowledge of different cultures, gain a broader perspective and improve cross-
cultural understanding and communication skills from offshore academic experiences,
(Knight, 2004; Thomas & Inkson, 2004; Goodman, Jones & Macais, 2007; Vande Berg,
Connor-Linton & Paige, 2009; Braskamp, Braskamp & Merrill,; Sison & Brennan, 2012;
Harrison, 2012 as cited in Chang et al., 2013; Scharoun, 2016; Castro, Woodlin, Lundgren &
60
Byram, 2016) but other studies found that sometimes the opposite was true (Chang et al.,
2013; Weigl, 2009: Bhaskar-Shrinivas, Harrison, Shaffer & Luk, 2005; Selmer, 2002).
Despite the observed benefits of these programs, the connection between international
offshore experiences and graduate employability remains an under-researched area
(Crossman & Clarke, 2010; Cai, 2013).
A study in international academic experiences by Leong (2007) showed that students with
international study experience became more inter-culturally effective. In that study, he
followed two groups of Singaporean undergraduate university students. Both the control
group (who stayed at home), and the second group (who attended either an international
exchange program in western countries (EU, USA, Australia and NZ) or Asian countries
(most non-English speaking), were sent a questionnaire before and after the exchange
program, using the Multi-cultural Personality Questionnaire and the socio-cultural adaptation
scale. After the exchange program, post-test scores indicated exchange students' higher
ratings on most cultural dimensions (Leong, 2007). However, other studies were contradictory
(Pederson, 2010), so more research is required to establish whether these international
academic experiences have an effect on students’ cross-cultural adaptability (Littrell & Salas,
2005; Anderson, Lawton, Rexeisen & Hubbard, 2005).
Work-integrated learning (WIL) is an extensive term for pedagogical experiences that gives
students ‘real world’ work exposure (Patrick, Peach, Pocknee, Webb, Flether & Pretto, 2009).
These placements are internationally recognised as a way for students’ placements to enhance
their graduate employability (Yorke & Knight 2004; Peach & Matthews, 2011). The
experiences of (WIL) both inside and outside of the university, provides an approach that
provides students with evidence of the development of their employability skills (Ferns &
Moore, 2012; Smith, Ferns & Russell, 2016). Outcomes of previous research on WIL
placements’ employment-related skills development were reduced to a short-list, as reported
in Ferns, Smith & Russell, (2014) and Smith et al., (2014). One of the six dimensions of
employability that resulted from the work by Bollen (1989), that resonated with this study,
was that graduates “can work with other people effectively, fairly and cross-culturally” (as
cited in Smith et al., 2016 p. 201). This study specifically questioned students about their
participation in international internships, as existing research such as this, found that
enrolment in these international internships did not develop students’ cross-cultural skills as
61
well as the ability to “develop a coherent approach to build workforce capability skills and
individuals’ prospects (Universities Australia, 2015, p.1).
This study did not consider study abroad programs per se but did consider whether previous
study abroad was a mitigating factor in students’ cross-cultural adaptability. It also looked at
whether local international experiences gave students the equivalent experience received by
those who attended a Study Abroad Program (SAP). Offshore experiences were expensive for
the student to participate in; therefore, this type of study reduced students’ expenses if it found
that experiences at home achieved similar results. Just as students who undertook an offshore
academic experience such as exchange, study tour or international internship benefitted from
the cross-cultural interaction, private international experiences were also posited as
influencing a students’ pre-existing cross-cultural adaptability.
Through the use of repeated measures of analysis of covariance, (MANCOVA) analysis, this
study examined whether participation in cross-cultural mentoring experience at SLM
influenced students’ cross-cultural adaptability relative to the students who did not meet with
a SLM, after controlling for participation in offshore academic experiences: exchange, study
tour or international internship. These factors may influence the four cross-cultural
adaptability dimensions, which in turn might influence the overall cross-cultural
adaptability of the higher education student. Therefore, it can be hypothesised that:
H5: Off-shore international experiences will have a significant influence on students’
cross-cultural adaptability in both the pre- and post-tests as measured by the
dimensions of enjoyment, tolerance, personal values, or valuing others for students
who have a cross-cultural mentoring experience with a SLM, relative to those who
did not seek help from a SLM.
H5a: Having been on an exchange program will have a significant influence on students’
cross-cultural adaptability in both the pre- and post-tests as measured by the
dimensions of enjoyment, tolerance, personal values or valuing others, for students
who have a cross-cultural mentoring experience with a SLM, relative to those who
did not seek help from a SLM.
H5b: Having enrolled in an international study tour will have a significant influence on
students’ cross-cultural adaptability in both the pre- and post-tests as measured by
the dimensions of enjoyment, tolerance, personal values or valuing others, for
62
students who have a cross-cultural mentoring experience with a SLM, relative to
those who did not seek help from a SLM.
H5c: Having completed an international internship will have a significant influence on
students’ cross-cultural adaptability as measured by the dimensions of enjoyment,
tolerance, personal values or valuing others, for students who have a cross-cultural
mentoring experience, relative to those who did not seek help from a SLM.
2.9 At home international academic experiences
Although travel abroad has long been considered a means of acquiring cross-cultural
skills, there is support for the suggestion that inter-cultural skills could be achieved
through education and training, without the need for international travel (Altschuler,
Sussman & Kachuer, 2003; Bennett, Bennett & Allen, 1999; Paige, 1993; Pruegger &
Rogers, 1994). There was some concern that travelling abroad may not achieve cultural
sensitivity. Kelly (1963) posited that a student could participate in a SAP without
experiencing the culture that they visited. While study tours and exchange programs will
continue to remain significant global experiences for a limited number of students,
universities are now seeking to scaffold inclusive, universal ‘globalised’ pedagogical
experiences situated in local contexts, also known as ‘internationalisation at home' (Nilsson,
2000; Osfield, 2008; Otten, 2000; Paige et al., 2003; Kimmel & Volet, 2012; Leask & Carroll,
2011; Jon, 2013; Leask, 2011; Leask & Bridge, 2013). These experiences aim to benefit all
students, as not all study abroad opportunities are accessible or affordable for all (Brown &
Jones, 2007; Burnett & Huisman, 2010; Lee, Poch, Shaw & Williams, 2012; Soria &
Triosi,2014; Lenhart, 2017).
Many of these ‘at home’ experiences are being implemented in universities around Australia
as part of programs such as the Global Canopy Program (Mills et al., 2016). Universities agree
that they must develop integrated, coordinated strategies and curriculum for all students,
whether they travel abroad or not. Unless the gains in cross-cultural skills development arising
from alternative programs are assessed, it is difficult to determine which ‘at home’ academic
experiences are most effective in producing the equivalent outcome (Anderson, Lawton,
Rexeisen & Hubbard, 2005).
63
Although the previously discussed theories and previous research in this area presented
diverse perspectives in the development of inter-cultural competency, they did contribute to
a framework from which we could gain an understanding of the many ways in which internal
‘at home’ internationalisation experiences, or offshore international experiences such as study
abroad, could enhance university students’ inter-cultural competencies. In response to the
global world of work, universities are continuing to internationalise their curriculum to
develop students’ inter-cultural skills. These skills are necessary to be successful in a multi-
cultural and global workforce (Lee et al., 2012; Soria & Triosi, 2014). Universities are finding
new ways of connecting international industry to communities and students, to prepare them
for the global labour market. For this to happen, universities are developing industry
placements, where the university and companies are partners on program design and
assessment. Virtual projects and virtual mobility projects, or ones that are combined with
short international study experiences are also emerging. These projects offer an opportunity
for students to work in multinational teams and collaborate on global projects across
countries, time zones and cultures, which mimic how a global business operates (RMIT,
2015b). Measuring whether these activities were effective in helping students to acquire
international and inter-cultural competencies are relatively unexplored (Soria, 2015).
The higher education study programs that do make efforts to monitor the learning outcomes
of their internationalisation ‘at home’ activities, applied various testing methods. Self-
evaluations aimed at measuring students’ acquisition of specific competencies were often
used as part of their international experience (Castro et al., 2016; Teichler, 2004; Harari,
1992). More objective methods, such as feedback from fellow students or academics, are not
commonly applied. Some subjects apply certain specific qualitative assessment methods
(interviews, self-evaluations, peer assessment), and in some other cases, efforts to accurately
measure inter-cultural learning outcomes may involve the use of standardised tests. While
some institutions are outwardly committed to the acquisition of inter-cultural competencies
by all students, they tend to facilitate this process through elective subjects. As a result, only
a minority of their student population have an opportunity to acquire such cross-cultural
competencies.
Leask (2009) argued that an internationalised curriculum should “engage students with
internationally informed research and cultural and linguistic diversity and purposefully
develop their international and inter-cultural perspectives as global professionals and citizens”
64
(Leask, 2009, p.209). The suggested alternatives range from presentations on different
cultures in a domestic classroom, to actual involvement with different cultures in foreign
locations. In a 2012 study, Brewer and Leask suggested four distinct strategies for
internationalising the curriculum. Firstly, to recruit international academics, secondly for
these academics to develop cross-cultural skills through collaboration with international
students. These academics should also teach abroad or take students to study abroad as part
of a subject they teach. They should also attend international seminars and conferences. The
third strategy was recruiting international students, and the final strategy was for students to
complete university study abroad programs. Nilsson (2003) defined international ‘at home’
experiences as “any internationally related activity except outbound student mobility” (p. 31).
This study did not include study abroad programs as ‘at home’ activities but instead
considered them an important factor as part of students’ previous external international
academic experiences. The skills that students developed on study abroad experiences were
the same that ‘at home’ activities sought to develop.
In recent years, there has been a significant increase in universities’ international student
population in both Australia and globally (DoE, 2019; Jon, 2013; Stronkhorst, 2005; Wachter,
2003). International students now make up around 29% of university students in Australia
(DoE, 2018). These international students were either enrolled in a university in another
country, participated in an exchange program in a foreign country, or participated in a short
or longer-term study tour (McKenzie & Baldassar, 2017). Brown and Jones (2007, as cited in
Coryell et al., (2012) noted: “international students are now seen to be at the heart of the
university and a valuable source of cultural capital” (p. 79). International students study
together with domestic students, who may have been from the city or state where the
university is located, or they may also have come from rural, regional or interstate locations.
They also may be international migrants with national citizenship or permanent resident status
(McKenzie & Baldassar, 2017).
Domestic students may be from many different ethnic backgrounds but consider themselves
to be local students. In many cases, local students already had friendship groups at university
from prior schooling, from having met other local students in earlier years at university,
through workplaces, or by having similar social experiences either in person (such as clubs or
societies), or online through social media (McKenzie & Baldassar, 2017). In many cases,
international students socialise with each other due to language barriers, cultural differences,
65
and because university social events are often arranged for international students separately
(such as Asian nights) (McKenzie et al., 2017). Segregation and lack of enthusiasm on the
part of domestic students to making friends with international students are significant,
according to research (Woods et al., 2013). In their study at an Australian university that
examined whether short-term mentoring programs built cross-cultural student friendships,
they found that mentees and international students did develop friendships, but domestic
students did not develop friendships with mentors (Woods et al., 2013). Bennett et al., (2013)
found that when international students had no link to local students’ friendship group, cross-
cultural friendships were unlikely to occur (McKenzie & Baldassar, 2017; Blatter, 2015;
Bowman & Park, 2014; Lee, 2006). However, when international students were from the same
ethnic background as domestic students, or when domestic students had similar backgrounds
to exchange students studying in Australia, then cross-cultural friendships were possible.
There were also exceptions where foreign language learning was included, where the
domestic student befriended international students who already spoke the foreign language
(McKenzie & Baldassar, 2017).
A large body of research explored the domestic and international students’ self-imposed
segregation. Peacock and Harrison (2009) found that the main reason why domestic and
international students in the UK created silos of isolation, was that domestic students felt that
interaction with international students required them to give extra thought to everything they
communicated, and to explain the meaning of colloquial English. They declared this to be
exhausting. Summers and Volet (2008) also interviewed international students, most of whom
claimed they were homesick, which was intensified by the lack of interaction with domestic
peers. In Australia, there is also a lack of interaction between Australian and international
students from Asian backgrounds, who make up considerable numbers at Australian
universities. These students do not have the opportunity to develop their cross-cultural
awareness and an understanding and acceptance of each other (Nesdale & Todd, 1993; Volet
& Ang, 2012).
Academics have the power to bring international and domestic students together through
formal and informal exercises, projects, assignments and group work, as they are the means
for fully internationalising the curriculum and enhancing student cross-cultural learning
(Leask & Beelen, 2009, as cited in Brewer & Leask, 2012). Coryell et al., (2012) asserted that
academic staff must offer international subject content with the opportunity for inter-cultural
66
skills development. Other researchers found that academics could connect their students with
international students and could promote cross-cultural friendships outside the classroom and
beyond one semester, and thereby influence students’ acquisition of inter-cultural skills (Soria
& Triosi, 2014). They also discovered that domestic students who were friendly with an
international students were significantly more likely to develop inter-cultural skills than those
who had not developed these friendships.
There is a lack of theoretically based research on learning and instruction that concerns
international and multi-cultural student groups at university. While there are many reasons
why international and domestic students do not mix, a study by Volet and Ang (2012) did
address both international and domestic students’ group formation as being two-way and
interactive. That study found that both domestic and international students preferred working
with similar people due to their perceptions of “feeling more comfortable, thinking along the
same wavelength, and sharing a similar communication style and sense of humour when
interacting with peers from the same cultural background” (Volet & Ang, 2012, p. 25). Also,
their study found the reluctance from both sides was inflated by language problems,
pragmatism and negative stereotypes. Many of the students in that study said that coming
from the same culture and having many things in common made group management easier.
These findings agreed with Tan’s (1997) study of Singaporean students and Volet and Tan-
Quigley’s (1995) study of social interactions between staff and international students. Another
study by Volet (1999) also found that Australian students had negative attitudes towards
culturally mixed groups in comparison with the students who originated from Singapore and
Malaysia. Their position of making no effort to mix with students from other cultures defeated
one of the primary purposes of internationalisation in higher education.
Waistell (2011) wrote that multi-cultural group work was an essential workplace skill, and
that if students developed inter-cultural competence that may have alleviated future workplace
concerns about working with an international team. As researchers continued to promote
internationalisation ‘at home’ through multi-cultural group assignments and projects, they
hoped this work promoted inter-cultural sensitivity and competence development. Domestic
students believed working with international students would lower their subject average, but
De Vita (2002) researched this myth, and found that multi-cultural groups earned higher
marks than monocultural groups. In contrast, Summers and Volet’s (2008) research led to
discouraging findings. They concluded that the further students advanced in their program of
67
study, the less favourable their attitudes became towards working in a multi-cultural group.
They found that regardless of merit or proof to the contrary, international and domestic
students did not voluntarily work together in an academic setting (Summers & Volet, 2008,
2010). Cross-cultural group work does present an opportunity for inter-group contact, which
relates to Allport’s (1954) contact theory. It provides opportunities for more positive attitudes
to develop and provide both groups perception of equal status in the work-group context. This
leads to the enhancement of cross-cultural skills on both sides.
Some scholars recommend that multi-cultural groups be compulsory, to overcome domestic
and international students’ aversions to mixed cultural groups, within or outside of the
classroom (Briguglio, 2007; Crose, 2011; Deardorff, 2006; De Vita, 2002; Krajewski, 2011;
Leask, 2009; Summers & Volet, 2008; Volet & Ang, 2012; Waistell, 2011). Crose (2011) and
Leask (2009) made specific and complementary suggestions, such as using the first-class
sessions as ‘ice breakers’, to allow the students to get to know one another; organising and
communicating directions for project completion and using in-class small group discussions
to encourage collaboration. Peacock and Harrison (2009) recommended grouping domestic
and international students evenly to avoid ‘swamping’, which occurs when there were too
many international students in a group. Krajewski’s (2011) student interviews produced a list
of activities which encouraged interaction, the most successful of which included preparing
and giving group presentations and teamwork or interaction in small group activities.
Unfortunately, domestic and international students working together to complete an academic
project was not easily achieved, and the desire to continue working together later was
challenged by additional research. These results coincided with later research by Volet and
Ang’s (2012). They conducted a qualitative study concerning Australian and international
students’ desire and willingness to form multi-cultural groups for class projects. They
concluded, “students not only preferred to work with peers from similar cultural backgrounds
but [they] remained reluctant to mix after a successful cross-cultural experience is of concern”
(Volet & Ang, 2012, p. 33). These results raised a critical question: even though students
lacked the desire to work in multi-cultural groups in an academic setting, after working in
multi-cultural groups did their inter-cultural competence change?
Guided by previous research and through the use of repeated measures of analysis of
covariance, (MANCOVA) analysis, this study explored whether students’ engagement in an
internationalisation ‘at home’ experience of peer-to-peer mentoring influenced students’ self-
68
reported development in cross-cultural adaptation. In summary, internationalising the
curriculum, including multi-cultural group projects and assignments in a formal academic
setting and, hence increasing domestic and international student interaction, or learning a
foreign language at university are strategies for developing students’ cross-cultural
adaptability. Therefore, it can be hypothesised that:
H6: International experiences ‘at home’ will have a significant influence on students’
cross-cultural adaptability in both the pre- and post-tests, as measured by the
dimensions of enjoyment, tolerance, personal values or valuing others, for students
who have a cross-cultural mentoring experience with a SLM, relative to those who
did not seek help from a SLM.
H6a: Completing a subject with internationalised content will have a significant influence
on students’ cross-cultural adaptability as measured by the dimensions of enjoyment,
tolerance, personal values or valuing others, for students who have a cross-cultural
mentoring experience, relative to those who did not seek help from a SLM.
H6b: Working in cross-cultural groups will have a significant influence on students’ cross-
cultural adaptability as measured by the dimensions of enjoyment, tolerance, personal
values or valuing others, for students who have a cross-cultural mentoring experience
with a SLM, relative to those who did not seek help from a SLM.
H6c: Studying a foreign language at university will have a significant influence on
students’ cross-cultural adaptability as measured by the dimensions of enjoyment,
tolerance, personal values or valuing others, for students who have a cross-cultural
mentoring experience with a SLM, relative to those who did not seek help from a
SLM.
This study linked many of the theories and previous research discussed above. It used
students in an informal peer-to-peer mentoring experience where interaction was necessary.
According to Allport (1954) as well as Pettigrew and Tropp (1998, 2006, 2008, 2011), this
contact may have had an impact on students’ cross-cultural adaptability. It considered
whether demographics, socio-economic factors, socialising with others, having either
private, offshore or onshore international experiences were extenuating factors in developing
cross-cultural adaptability. The number of items/questions per construct can be found in
Table 3.2 in chapter three, which is found on page 80). It examined whether an on-campus
international experience of cross-cultural peer-to-peer mentoring influenced the students’
69
cross-cultural adaptability, and whether this cross-cultural mentoring experience was
considered equivalent to a study abroad program.
2.10 Conclusion
This chapter analysed previous literature in the area of cross-cultural adaptability, cross-
cultural communication and cross-cultural competence skills development in university
students. It then discussed mentoring and peer-to-peer mentoring in a higher education
setting. It acknowledged the possible effects of private international experiences, previous
international academic experiences, students’ socialisation factors, demographics and socio-
economic factors. This chapter laid the literature out and found that there are gaps in the
cross-cultural adaptability literature, as it did not address cross-cultural peer mentoring dyads
as a possible tool for cross-cultural skills development. It also used the often cited CCAI™
in a different area than business, training, the military and health care, where it had been used
extensively. In this study, the CCAI™ was used in the higher education sector, in an entirely
new area of peer-to-peer mentoring. In addition, it provided future employers as well as
current universities, with another possible way to show that these graduates had the cross-
cultural adaptability skills that employers were looking for. These skills were necessary for
the present and future global workforce. The review of the literature enabled the research
questions to be considered in the hypotheses that were described in each section. Chapter
three discussed the methodology utilised in this study.
70
Chapter 3
RESEARCH METHODOLOGY
3.1 Introduction
Chapter one introduced the research questions, objectives and contribution of this thesis.
Chapter two presented an overview of the relevant literature, provided a conceptual frame of
reference, a consolidation of a set of underlying constructs, pertinent guidelines for the
formation of the empirical research and the hypotheses that were tested. The literature review
chapter recognised the limited research on the application of the CCAI™ in an education
context and whether peer-to-peer mentoring was an effective method for a cross-cultural
experience.
Chapter three considered the research methodology used to support this study. The context of
this study was discussed, and the research paradigm introduced. The literature review
contained several research questions and hypotheses, which in turn provided direction for the
construction of the research approach. As the stated hypotheses identified critical constructs
and proposed relationships between these variables, this thesis leaned toward employing
quantitative methodology. The remainder of this chapter considered the study’s quantitative
research approach, the justification for the questionnaire approach and the selection of specific
questions and scale items in the development of the online data collection questionnaire
employed for the main study. The implementation process in the data collection was provided.
The sample design was considered, as well as an overview of the data analysis approach.
This thesis investigated whether exposure to a cross-cultural peer-to-peer mentoring
experience influenced the cross-cultural adaptability of university students. The influence of
background experience covariates on respondents’ cross-cultural adaptability was also
examined.
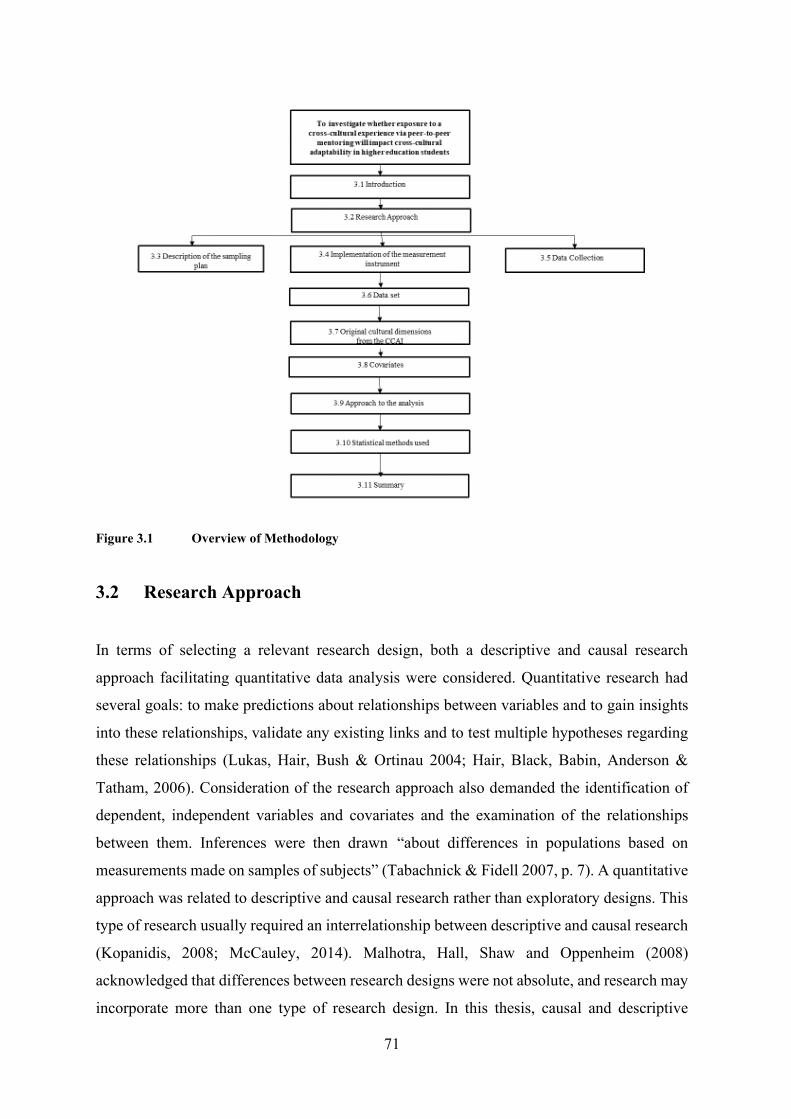
71
Figure 3.1 Overview of Methodology
3.2 Research Approach
In terms of selecting a relevant research design, both a descriptive and causal research
approach facilitating quantitative data analysis were considered. Quantitative research had
several goals: to make predictions about relationships between variables and to gain insights
into these relationships, validate any existing links and to test multiple hypotheses regarding
these relationships (Lukas, Hair, Bush & Ortinau 2004; Hair, Black, Babin, Anderson &
Tatham, 2006). Consideration of the research approach also demanded the identification of
dependent, independent variables and covariates and the examination of the relationships
between them. Inferences were then drawn “about differences in populations based on
measurements made on samples of subjects” (Tabachnick & Fidell 2007, p. 7). A quantitative
approach was related to descriptive and causal research rather than exploratory designs. This
type of research usually required an interrelationship between descriptive and causal research
(Kopanidis, 2008; McCauley, 2014). Malhotra, Hall, Shaw and Oppenheim (2008)
acknowledged that differences between research designs were not absolute, and research may
incorporate more than one type of research design. In this thesis, causal and descriptive
72
research were combined. The descriptive analysis was used in the preliminary stage of
establishing the conceptual model.
3.2.1 The research paradigm
The positivist research paradigm was employed in this study. Positivism extended the
methods of natural sciences to the exploration of human life (Gudykunst & Nishida, 1989;
Hasan, 2016). Positivism was described as a “belief system arising out of practices in the
natural sciences which assume that matters that are the subject of research are susceptible to
being investigated objectively and that their integrity is established with a reasonable degree
of certainty” (Brand 2009, p. 432). Objective verification required the “application of the
scientific method either through analysis in the case of those matters which are capable of
internal verification (e.g. mathematical equations) or through the gathering of data in the case
of those things which cannot be verified from their terms” (Crotty, 1998, p.25).
This paradigm was used by social scientists who sought to understand patterns of behaviour
within social relationships. Typically, the approach that social scientists had taken was
characterised using sizeable data sets that were subject to quantitative analysis (Hasan, 2016).
Positivism was particularly relevant to this study as it sought to form an objective
understanding of the relationship between the variables that were included within the CCAI™
as well as their interface with the backgrounds of the sample of higher education student
respondents (n=214). Further, pre-existing demographic and socio-economic factors,
socialisation, private, offshore academic and on-shore academic experiences were
investigated to determine their capacity to influence the students’ existing cross-cultural
adaptability. In this study, the educational and managerial implications for university policy
were outlined in chapter one and were further discussed in chapter six.
3.2.2 The SLMs Experience (the manipulation)
Students who chose to visit the SLM during the semester received academic support and
guidance with their assessment pieces from a mentor who had previously completed the
subject and received either a Distinction or a High Distinction. Meetings were arranged
through the administrators who considered the availability of mentors according to their
agreed mentoring availability during the week. In this study, assignment to groups was on a
73
random basis as student mentees self-selected into the groups of either using the SLM service
or not using the service. Half the group participated in the experience (cross-cultural peer-to-
peer mentoring at the SLM service), and half did not. Within the SLM area, students were
randomly assigned a mentor who had been appointed for the subject the mentee required, but
within the consideration of timetabling of the mentoring session according to which mentor
was available.
Those students who self-selected to visit the SLM and were the group who had participated in
a cross-cultural experience were considered from previous research to have experienced
incidental contact. According to Allport’s (1954) ICT and Pettigrew and Tropp’s (2006) later
research, which underpinned this study, this informal contact and getting to know someone
from another culture was hypothesised to have an influence on the participants’ cross-cultural
adaptability.
In addition, Bandura’s (1977) SLT provides an alternative theoretical framework for
understanding cross-cultural adaptability in that changes in human behaviour can occur from
learning from others and that there must be an intervention such as cultural mentoring to break
down any rigid cultural stereotypes (Wilder, Sheerier & Berry, 1991 as cited in Chickering &
Reisser, 1993).
The cross-cultural dyad experience and the cross-cultural adaptability of the participants in
the mentor or mentee relationship with the SLM was hypothesised to have an influence on
their cross-cultural adaptability according to the four cultural dimensions of the CCAI™. As
this measurement instrument had been utilised in a Higher Education setting (Field, 1990;
Renmert, 1993; Chen, 2015), albeit in a different pedagogical area, all responses to the 50
questions from the CCAI™ were related to the interaction of the mentor and the mentee, and
had relevance to their peer-to-peer mentoring experience with a SLM from another culture.
3.2.3 Quasi-experimental design
The research design used for the study was quasi-experimental, i.e. an experimental design
that did not meet all the requirements which were necessary for controlling the influences of
extraneous variables, and when random assignment of participants was not possible (Rossi &
Freeman, 1985; Kidder & Judd, 1986; Rossi, Henry, Lipsey & Freeman, 2004; Dinardo,
74
2008). The quasi-experiment was referred to by Cook and Campbell (1979) as an "untreated
control group design with pre-test measures at more than one-time interval" (p. 117-118).
Although they classified an untreated control group design with pre- and post-measures as a
"generally interpretable non-equivalent control group design" (p. 103), they posited that the
design became stronger when additional pre-tests were added. A quasi-experiment applied to
the study being undertaken because it used ‘pre-post testing’ which meant that there were tests
done before any data were collected to see if there were any confounding factors in the
responses (Morgan, 2000).
As such, a within and between subjects’ quasi-experimental design was used, featuring the
inclusion of the treatment to one group, but not the other. The students who did not participate
in the experiment were called the NoSLM group and did not use the SLM service at all. The
students who did use the SLM service and had a cross-cultural mentoring experience (either
as a mentor or a mentee) were called the SLM group. The non-equivalent control group design
was commonly used in studies such as this, when a pure experimental design was not possible
and when the research required working with pre-formed groups (Krathwohl, 2004). The
quasi-experimental design reduced the reactive effects of the experimental process and
improved the external validity of the design. This design was more sensitive to internal
validity problems due to the interaction between such covariates as selection and maturation,
selection and history, and selection and pre-testing (Dmitrov & Rumrill, Jr, 2003).
In a pre-test, post-test design, the dependent variables – the four cross-cultural adaptability
dimensions from the CCAI ™ – were measured once before the cross-cultural peer-to-peer
mentoring experience was implemented and once afterwards. The same respondents
participated in both the pre- and post-tests. The question then was not whether respondents
who received the treatment’s cross-cultural adaptability improved, but whether they improved
relative to participants who did not receive the treatment. Also, possible influences of previous
demographic, socio-economic, socialising, private international experience and external and
internal academic international experiences before the peer-to-peer mentoring experience
were tested.
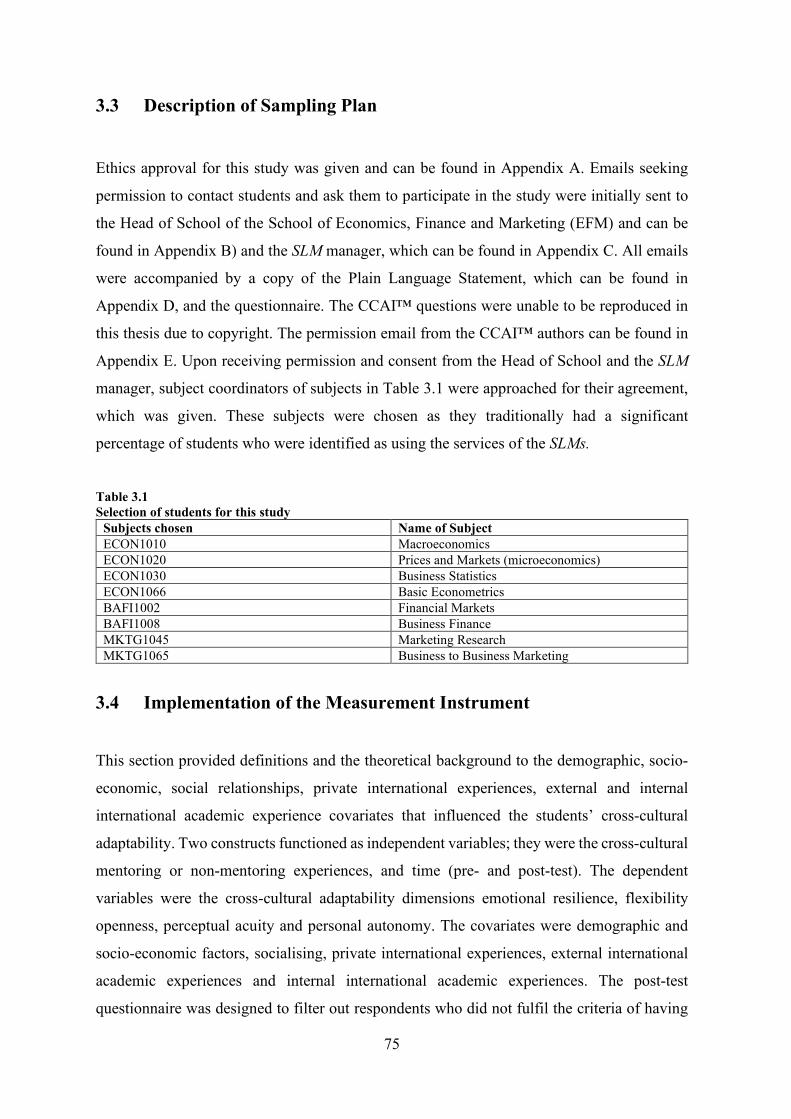
75
3.3 Description of Sampling Plan
Ethics approval for this study was given and can be found in Appendix A. Emails seeking
permission to contact students and ask them to participate in the study were initially sent to
the Head of School of the School of Economics, Finance and Marketing (EFM) and can be
found in Appendix B) and the SLM manager, which can be found in Appendix C. All emails
were accompanied by a copy of the Plain Language Statement, which can be found in
Appendix D, and the questionnaire. The CCAI™ questions were unable to be reproduced in
this thesis due to copyright. The permission email from the CCAI™ authors can be found in
Appendix E. Upon receiving permission and consent from the Head of School and the SLM
manager, subject coordinators of subjects in Table 3.1 were approached for their agreement,
which was given. These subjects were chosen as they traditionally had a significant
percentage of students who were identified as using the services of the SLMs.
Table 3.1 Selection of students for this study
Subjects chosen Name of Subject ECON1010 Macroeconomics ECON1020 Prices and Markets (microeconomics) ECON1030 Business Statistics ECON1066 Basic Econometrics BAFI1002 Financial Markets BAFI1008 Business Finance MKTG1045 Marketing Research MKTG1065 Business to Business Marketing
3.4 Implementation of the Measurement Instrument
This section provided definitions and the theoretical background to the demographic, socio-
economic, social relationships, private international experiences, external and internal
international academic experience covariates that influenced the students’ cross-cultural
adaptability. Two constructs functioned as independent variables; they were the cross-cultural
mentoring or non-mentoring experiences, and time (pre- and post-test). The dependent
variables were the cross-cultural adaptability dimensions emotional resilience, flexibility
openness, perceptual acuity and personal autonomy. The covariates were demographic and
socio-economic factors, socialising, private international experiences, external international
academic experiences and internal international academic experiences. The post-test
questionnaire was designed to filter out respondents who did not fulfil the criteria of having
76
completed the pre-test. Subsequently, respondents were prompted screen by the screen on
their device to answer each question.
Data for this study was collected via the use of a questionnaire - a commonly applied process
for social science research (De Vaus, 2014) – which provided consistent measurement of the
research variables and produced information not available elsewhere. A questionnaire was
best suited for this study due to the considerable initial population size. Questionnaires also
had the advantage of cost-effectiveness, efficiency, speed of data collection and ease of
completion (Babbie 1998; Zikmund, 1997). Further benefits accrued as a result of the online
administration of the questionnaire: additional cost reduction by eliminating the need for data
entry; avoidance of input errors (Malhotra et al., 2008); and readily available information in
a form that facilitated the type of statistical analysis required for this study. Also, the questions
and the response formats were standardised, ensuring that all respondents faced the same
stimuli.
The research questionnaire was hosted online on the university website utilising Qualtrics
software. Three main principles of question design and development were used in determining
the questions - necessity; clarity; and the collection of the information required for the analysis
that followed (Alreck & Settle, 1995; Burns & Bush, 1995; Churchill & Iacobucci, 2002;
Cooper & Emory, 1995; Dillman, 1978, Malhotra et al., 2008).
3.4.1 The Content
This section described the content of the questionnaire used for this study and the process of
its development. The questionnaire contained six sections and utilised a combination of
closed-ended questions and Likert-type scales. The summarised questionnaire format can be
found in Appendix F. In total, 15 covariates were subject to analysis. These variables were
demographic and socio-economic factors, socialising, private international experience,
offshore international experiences and onshore international experiences. The cultural
dimensions that were developed using all 50 CCAI™ questions were the dependent variables.
The pre-test questionnaire commenced with items designed that explored the socio-
demographic attributes of the respondents and then posed questions relating to the
77
respondents’ previous international experiences. The final sequence of questions in both the
pre- and post-test questionnaire explored the respondents’ cross-cultural adaptability, as
suggested by the four cultural dimensions of the CCAI™.
Part A: Socio-demographic analysis was designed to assess the demographic and socio-
economic characteristics of the sample, including age, gender, ethnicity, mothers’ and
fathers’ highest education level. This section included six questions of nominal and ordinal
data.
Part B: Socialising details were recorded here. Two questions were included on hours spent
socialising per week during the semester as well as if the student had friends or family from
different cultures. These questions were developed in consideration of Allport’s (1954) ICT
where he posited that contact with people from different cultures could increase cultural
development. Refer to chapter two for a full discussion on ICT. This section included three
questions of nominal and ordinal data.
Part C: Information on previous private international experiences was requested. The first
question related to information on their previous private international holidays either
undertaken with their family, with friends or on their own. The second question requested
details of questions students’ prior language study in high school and the details of which
languages they had studied. A prior study by Kets de Vries and Mead (1992) suggested that
cross-cultural exposure at an early age could be a significant covariate in how successful a
person could be in later life, dealing with different cultures. The total number of weeks spent
offshore was included, but not reported on in this study. This section included five questions
of nominal and ordinal data.
Part D: The students’ previous offshore international academic experiences were requested.
These included time on exchange in a different country, attendance on an international study
tour or completion of an international internship. Study tours were the domain of upper-class
gentlemen from 1660-1820 and were called ‘The Grand Tour’ (National Gallery UK, 2019).
However, as travel became cheaper and more accessible, and with the advent of the railway,
travel was no longer only for the elite. In the early 1900s, Harlow Gale also discussed “the
necessity of international travel in creating a cosmopolitan citizen” (Mobley & Dorfman,
p.153). Later studies also concurred that one of the ways that these skills could be developed
78
was by early international experience (Kets DeVries & Mead, 1992). As such, this section
was included. This section included six questions of nominal and ordinal data.
Part E: This section asked questions about the student’s onshore international academic
experiences. Information on any subjects with an internationalised content was requested.
This topic had been extensively researched by Leask and others since 1999 and had been
found in numerous studies to be influential in giving students cross-cultural experience,
which in turn affected their cross-cultural skills development. The second question related to
whether they had experienced any group work with any students from another culture. This
topic also fell under the ICT of Allport (1954), which suggested that people who interacted
with people from different cultures would become more culturally aware. The final question
asked details on their learning of a foreign language at university, which had been previously
found to be significant as an essential part of the extensive research on international
communication. Previous research reported that foreign language learning did affect
students’ cross-cultural skills. It enabled strangers to access the host culture and in turn, bring
empowerment to the speaker (Lewis, 1948; Clement, Noels & Karine, 1994; Kim, 2001).
This section included three questions with nominal and ordinal data.
Part F: The final section of the questionnaire asked for responses to the 50 questions from
the CCAI™. This measurement instrument was developed together with the military, the
Peace Corps, missionaries, business people and trainers (Kelley & Meyers, 1987). The
CCAI™ was chosen for this study due to its reported value as a culture-general
measurement instrument that assessed cultural adaptability and helped individuals
understand the covariates or qualities, which could enhance cross-cultural effectiveness
(Kelley & Meyers, 1995). It had long been used as a learning tool in a variety of settings
including academia, for cultural diversity training, cultural awareness and to assess
travel-abroad readiness. In academia, users had applied the CCAI™ to individual groups
of medical, pharmacy, dental hygiene, teaching and business students over many years
and after global experiences (Kraemer & Beckstead, 2003; Kitsantis, 2004; Williams,
2005; Shaftel, Shaftel & Ahluwalis, 2007; Chang et al., 2013; Hayward & Charrette,
2012; Glickman, Olsen & Rowthorne, 2015). As this study was built around the same skills
development of students who did undertake an offshore experience, this questionnaire was
deemed appropriate.
79
With a maximum score of six for each of the 50 questions, the maximum overall score
was 300. The CCAI™ (Kelley & Meyers, 1987) combined the questions to reflect four
cross-cultural dimensions – 1) Emotional Resilience – the ability to rebound and react
positively to new experiences; 2) Flexibility/Openness – enjoying different ways of
thinking and behaving; 3) Perceptual Acuity – paying attention to and accurately
perceiving various aspects of the environment; and 4) Personal Autonomy – the evolution
of a personal system of values and beliefs while respecting others and their value systems.
In a study by Kraemer and Beckstead (2003), Kelley and Meyers’ CCAI™ (1987, 1995)
was reported that its internal reliability was 0.9, with 653 respondents from diverse
cultural and occupational backgrounds with 288 entry-level Master of Therapy Students.
It was reported to have a high face, content and construct validity (Kelley & Meyers,
1995). However, there have since been criticisms on aspects of its validity by authors
whose own research analyses had limitations, such as the tools used for this study (Ngyen
et al., 2010) and sample homogeneity bias (Davis & Finney, 2006), according to CCAI™
researchers.
Before the release of the final version of the complete questionnaire to the students, it was
shared with four experienced academics to be pilot tested. They each had input into the
wording of the questions for understanding, flow and duplication. After this test, the order of
the questions was changed to place all demographic and socio-economic questions first,
followed by the questions relating to socialising, private international experiences, external
(offshore) international academic experiences and internal (onshore) international academic
experiences. The third section of the questionnaire contained questions related to students’
participation in the peer-to-peer mentoring experience. In the final part, the CCAI™ questions
on their cross-cultural adaptability were positioned. After this feedback was given, the
questionnaire was updated for their suggestions. Only then was it scheduled for release to the
students.
The desired question content was chosen to ensure that respondents clearly and quickly
understood the objectives of the research and thus, what was expected of them (Churchill &
Iacobucci, 2002). For example, each question was examined in light of the overall study.
Ordinary words were used, and ambiguous words were avoided. Generalisations and
estimates were not used, rather concrete numbers or choices were required to be completed,
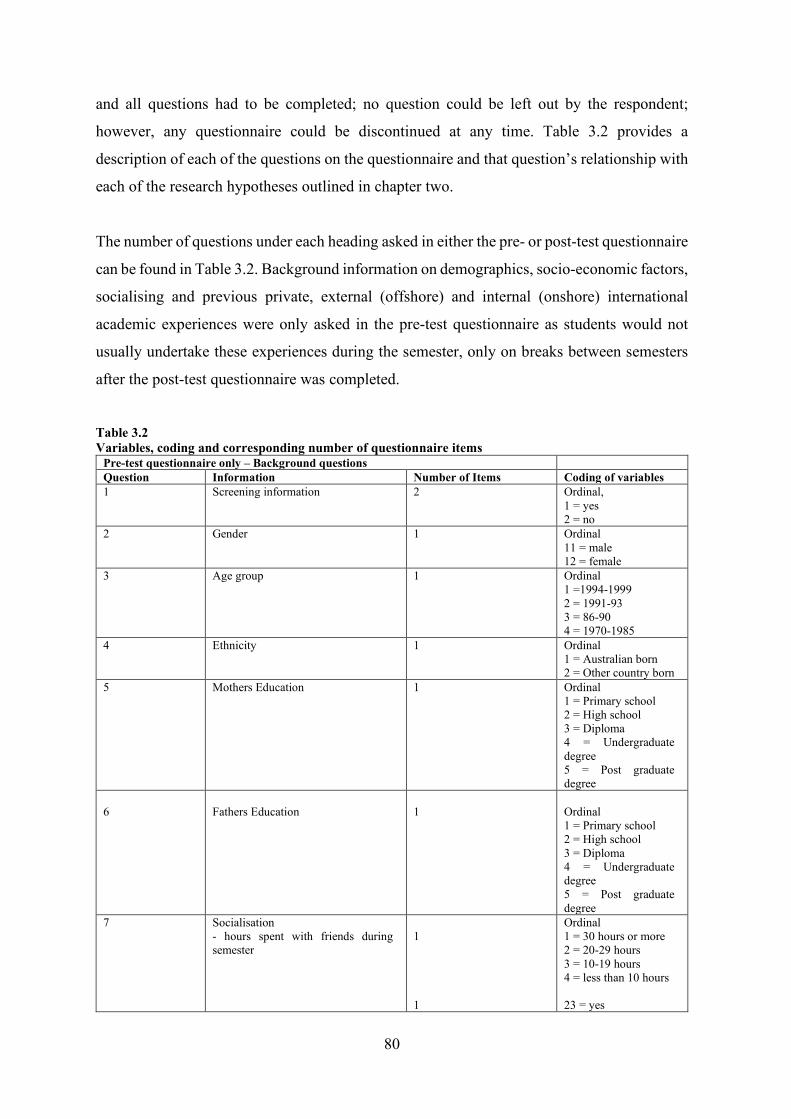
80
and all questions had to be completed; no question could be left out by the respondent;
however, any questionnaire could be discontinued at any time. Table 3.2 provides a
description of each of the questions on the questionnaire and that question’s relationship with
each of the research hypotheses outlined in chapter two.
The number of questions under each heading asked in either the pre- or post-test questionnaire
can be found in Table 3.2. Background information on demographics, socio-economic factors,
socialising and previous private, external (offshore) and internal (onshore) international
academic experiences were only asked in the pre-test questionnaire as students would not
usually undertake these experiences during the semester, only on breaks between semesters
after the post-test questionnaire was completed.
Table 3.2 Variables, coding and corresponding number of questionnaire items
Pre-test questionnaire only – Background questions Question Information Number of Items Coding of variables 1 Screening information 2 Ordinal,
1 = yes 2 = no
2 Gender 1 Ordinal 11 = male 12 = female
3 Age group 1 Ordinal 1 =1994-1999 2 = 1991-93 3 = 86-90 4 = 1970-1985
4 Ethnicity 1 Ordinal 1 = Australian born 2 = Other country born
5 Mothers Education 1 Ordinal 1 = Primary school 2 = High school 3 = Diploma 4 = Undergraduate degree 5 = Post graduate degree
6
Fathers Education
1
Ordinal 1 = Primary school 2 = High school 3 = Diploma 4 = Undergraduate degree 5 = Post graduate degree
7 Socialisation - hours spent with friends during semester
1 1
Ordinal 1 = 30 hours or more 2 = 20-29 hours 3 = 10-19 hours 4 = less than 10 hours 23 = yes
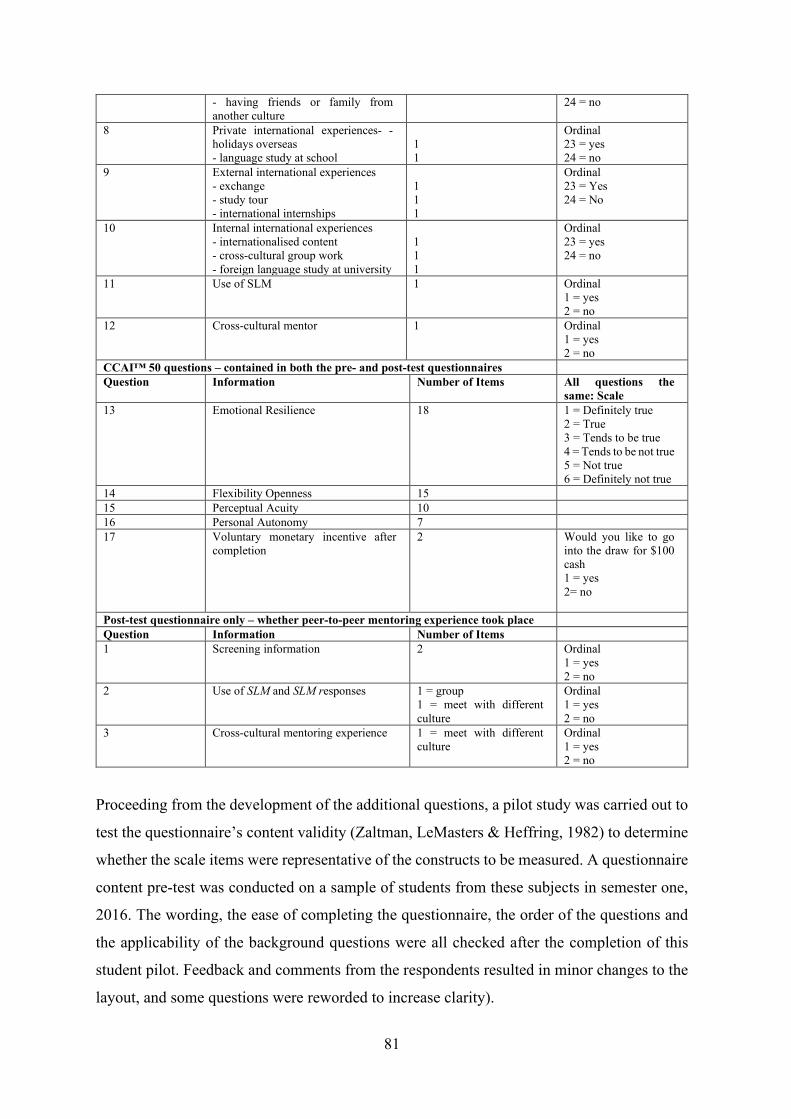
81
- having friends or family from another culture
24 = no
8 Private international experiences- - holidays overseas - language study at school
1 1
Ordinal 23 = yes 24 = no
9 External international experiences - exchange - study tour - international internships
1 1 1
Ordinal 23 = Yes 24 = No
10 Internal international experiences - internationalised content - cross-cultural group work - foreign language study at university
1 1 1
Ordinal 23 = yes 24 = no
11 Use of SLM 1 Ordinal 1 = yes 2 = no
12 Cross-cultural mentor 1 Ordinal 1 = yes 2 = no
CCAI™ 50 questions – contained in both the pre- and post-test questionnaires Question Information Number of Items All questions the
same: Scale 13 Emotional Resilience 18 1 = Definitely true
2 = True 3 = Tends to be true 4 = Tends to be not true 5 = Not true 6 = Definitely not true
14 Flexibility Openness 15 15 Perceptual Acuity 10 16 Personal Autonomy 7 17 Voluntary monetary incentive after
completion 2 Would you like to go
into the draw for $100 cash 1 = yes 2= no
Post-test questionnaire only – whether peer-to-peer mentoring experience took place Question Information Number of Items 1 Screening information 2 Ordinal
1 = yes 2 = no
2 Use of SLM and SLM responses 1 = group 1 = meet with different culture
Ordinal 1 = yes 2 = no
3 Cross-cultural mentoring experience 1 = meet with different culture
Ordinal 1 = yes 2 = no
Proceeding from the development of the additional questions, a pilot study was carried out to
test the questionnaire’s content validity (Zaltman, LeMasters & Heffring, 1982) to determine
whether the scale items were representative of the constructs to be measured. A questionnaire
content pre-test was conducted on a sample of students from these subjects in semester one,
2016. The wording, the ease of completing the questionnaire, the order of the questions and
the applicability of the background questions were all checked after the completion of this
student pilot. Feedback and comments from the respondents resulted in minor changes to the
layout, and some questions were reworded to increase clarity).
82
Data was collected through the development and distribution of an online questionnaire. The
population of interest for this thesis consisted of both SLMs and students from the subjects
listed in Table 3.1 found on page 77. Respondents were sent the link to the questionnaire from
an email sent directly to them using their student email account, from the Manager of the SLM
area, Ms Kemlo. They were asked to click on a link if they opted to participate after reading
the Plain Language Statement. This acceptance activated the questionnaire. Participation in
the research was voluntary, and participants remained anonymous. If they agreed to
participate at the start of the online questionnaire, they were directed to the main body of the
questionnaire. The questionnaire itself was hosted using the Qualtrics software available to
university staff and students. After the amendments to the questionnaire content had been
made, the questionnaire was distributed to students in 2017 as detailed in the following
section.
3.5 Data Collection
The SLM mentoring service was available for all students from week four until week eleven
each semester. During that time, the invited and then appointed mentors were available for
students to make appointments to receive help from the mentor/s for the subject for which
they needed help. This study only involved students who sought help from the list of subjects
in Table 3.1 on page 75.
3.5.1 Semester 1, 2017 Pre-Test
The data collection process for the pre-test in semester one, 2017, commenced in week four
of the semester and was open for two weeks. The questionnaires were distributed online to
both the SLMs themselves and the students from the chosen subjects (see Table 3.1 which can
be found on page 75). The questionnaires were not sent to students who had previously
completed them in 2016. This was arranged through their student number being matched by
Qualtrics in the email sent by Ms Kemlo. The administration of the questionnaire began with
another brief description of the project and instructions on how to complete the questionnaire.
Students were advised that their participation was voluntary, and confidential. In total, 4269
questionnaires were distributed online, and 607 responses were received.
83
3.5.2 Semester 1, 2017 Post-test
The data collection process for the post-test in semester one, 2017, commenced in week
twelve of the semester and was again open for two weeks. The 607 respondents from the pre-
test received the second questionnaire, containing only the 50 questions from the CCAI™,
and 233 responses were received. After merging the files using SPSS v25 and cleaning the
file for respondents who had completed the pre-test but who did not complete the post-test
questionnaire, 135 useable responses were used in this thesis. These provided information for
both the pre- and post-tests for semester one, 2017.
3.5.3 Semester 2, 2017 Pre-Test
The data collection process for the pre-test in semester two, 2017, commenced in week four
of the semester and was open for two weeks. In total, 4460 questionnaires were distributed to
both the SLMs themselves and students from the subjects detailed in Table 3.1 (see page
number 75). The questionnaires were not sent to students who had previously completed them
in either the previous semester or in 2016. This was arranged through their student number
being matched by Qualtrics in the email sent by Ms. Kemlo. The administration of the
questionnaire began with another brief description of the project and instructions on how to
complete the questionnaire. Students were advised that their participation was voluntary, and
confidential. The questionnaire was administered online and was open for responses from
week four of the semester for two weeks. Of the 4460 self-administered questionnaires that
were sent out, 478 responses were received (10.7%). After cleaning the file for incomplete
responses, 347 were useable (72.4% of final responses).
3.5.4 Semester 2, 2017 Post-test
The same 347 students who had responded in the pre-test were sent the post-test questionnaire
in week 12 of the semester. The questionnaire contained only the 50 questions from the
CCAI™ and was open from week 12 for two weeks. Of the 347 questionnaires sent out, 150
responses were collected, representing a 43.2% response rate. After cleaning the file for
incomplete responses and removing responses from students who had not completed the pre-
test, 137 were useable (84.7% of final responses). Across both semesters, there were 234
84
useable responses. These provided information for both the pre- and post-tests for semester
two, 2017.
The students in semester one and semester two 2017 who had used the services of a SLM but
did not have the experience with a mentor/mentee from another culture amounted to 20
students, so for this study, this group was removed to give useable results and not skew the
data analysis. The total responses relating to the students who had participated in a cross-
cultural mentoring experience was 214.
Once data collection was finalised, Statistical Processing for Social Science software (SPSS)
v25 was used to analyse the data. Frequency and cross-tabulations were produced first and
then inspected for possible errors and to screen the data for missing cases — this ensured the
accuracy of the data. Outliers were identified and profiled to ensure extreme values did not
influence results. The decision was made not to remove the outliers.
3.6 Data Set
The multi-item questions from the CCAI™ presented in the questionnaire utilised a six-point
Likert scale to record the students’ responses. These responses ranged from 1= very strongly
disagree to 6= very strongly agree. This response protocol followed the CCAI™ precisely so
that results in this study could be compared with other studies on this and other related
subjects. It was also employed throughout the questionnaire to promote consistency and lessen
the impact of potential respondent fatigue (Dillman, 2000). The Likert scales were either
ordinal interval scales or continuous scales and showed whether respondents agreed or
disagreed with the statements in the questionnaire. In this thesis, the four hypothesised drivers
were the cultural dimensions measured by the CCAI™. The final data set consisted of
metrically measured variables.
3.6.1 The Independent Variables
The peer-to-peer mentoring experience, for those students who participated in cross-cultural
mentoring with a SLM, as well as the students who did not meet with a SLM (the NoSLM
group), were the independent variables in this study, as were the time-related pre- and post-
85
tests. Students from the subjects found in Table 3.1 (see page number 75) were chosen from
subjects where traditionally, they were heavier users of SLMs. Both mentors and mentees
were grouped for this study as the topic of interest was the cross-cultural adaptability change
from either side, not a study of mentor and mentee experiences.
3.6.2 The Dependent Variables
The measurement tool that was used in this study for the level of cross-cultural adaptability
was the CCAI™ (Kelley & Meyers, 1987; 1992; 1995). Designed solely as a self-selection
measure, i.e., for personal use, the questionnaire consisted of 50-items. The CCAI™ was not
developed to predict success or failure in cross-cultural interactions; instead, it measured the
individual potential for cross-cultural adaptability. The 50 cross-cultural adaptability
inventory questions were not altered for this research as they had been used in numerous
studies. The CCAI™ questionnaire was relevant in assessing readiness to adapt to working in
companies with diverse employees, and across countries, regions or globally as required
(Kelley & Meyers, 1995; McPherson & Szul, 2008; Griffiths et al., 2018) and the results of
this study could be compared to previous studies. Additional questions were added to the
original measurement instrument developed by Kelley and Meyers (1987, 1992), covering the
background of the respondent. The four cultural dimensions based on the CCAI™ were the
dependent variables used in this study.
All questions were prefaced by “These questions are about your adaptability to living/working
in another country”. “Please read each statement carefully and choose the response that best
describes you right now”. Respondents rated their level of agreement to each item using a 6-
point Likert scale (1= not true, 6=Definitely true). In the next section, the original cultural
dimensions, as determined by Kelley and Meyers (1987, 1992, 1995) are described. It is
essential to note that in this study, these dimensions were adapted to reflect the responses
of the cohort of students in this study and are discussed in more detail in chapter five.
86
3.7 Original cultural dimensions from the CCAI™
3.7.1 Emotional Resilience
Emotional Resilience assessed the degree to which a person self-regulated his or her
emotions, maintained emotional equilibrium amidst a new or changing environment and
rebounded from and deal constructively with the negative feelings which were a normal part
of the cross-cultural experience (Kelley & Meyers, 1987; Griffiths et al., 2018). The eighteen
items that measured the level of emotional resilience asked respondents how they responded
in unfamiliar situations. For example, respondents were asked if they liked to try new things.
Respondents rated their level of agreement to each item using a 6-point Likert scale (1= not
true, 6=Definitely true).
3.7.2 Flexibility/Openness
Flexibility/Openness measured the extent to which people were open to different ways of
thinking and interacting with diverse situations which were usually a part of the cross-cultural
experience. In this construct, preparedness to learn from things and people different from
oneself was likely to result in a change in flexibility/openness (Kelley & Meyers, 1987;
Griffiths et al., 2018). The fifteen items that measured the level of flexibility/openness asked
respondents how they enjoyed interacting with people who were different from them. For
example, they were asked if they liked to be with all kinds of people. Respondents rated their
level of agreement to each item using a 6-point Likert scale (1= Definitely not true,
6=Definitely true).
3.7.3 Perceptual Acuity
Perceptual Acuity assessed the extent to which a person was attentive to and accurately
perceived verbal and nonverbal communication in interpersonal relationships with people
from different cultures (Kelley & Meyers, 1987; Griffiths et al., 2018). The ten items that
measured the level of perceptual acuity asked respondents if they paid attention to and
accurately perceived various characteristics of the environment. For example, they were asked
if they believed all cultures had something worthwhile to offer. Respondents rated their level
87
of agreement to each item using a 6-point Likert scale (1= Definitely not true, 6=Definitely
true).
3.7.4 Personal Autonomy
The last subscale, Personal Autonomy, measured the extent to which people made their own
final decisions. This person had evolved a personal system of values and beliefs which he or
she felt comfortable and confident enough to act on amidst diversity (Kelley & Meyers, 2003;
Griffiths et al., 2018). In this construct, personal identity and confidence in one’s values and
beliefs resulted in a change in personal autonomy (Kelley & Meyers, 1987). The seven items
that measured the level of personal autonomy asked respondents if they had evolved a
personal system of values and beliefs that made them feel comfortable acting in strange
settings and also to what extent they were able to respect others’ values and beliefs. For
example, they were asked if they believed that all people, no matter what race, were equally
valuable. Respondents rated their level of agreement to each item using a 6-point Likert scale
(1= Definitely not true, 6=Definitely true).
3.8 Covariates
An overview of the covariates listed below was hypothesised to affect the cross-cultural
adaptability of the students’ pre-test scores.
3.8.1 Demographic and Socio-economic factors
Demographic variables based on a respondent’s gender, age and country of birth as well as
socio-economic variables of mothers’ and fathers’ highest level of education provided a
descriptive profile of the student cohorts. Demographic and socio-economic covariates were
hypothesised to influence a student’s cross-cultural adaptability.
3.8.2 Socialising
The number of hours that the respondent spent socialising with others from different cultures
during the semester was collected. Details of whether the student had family or friends from
88
another culture were requested. Socialising was hypothesised to influence a student’s cross-
cultural adaptability.
3.8.3 Previous Private International Experiences
Respondents were asked about their previous international experiences. These included
whether they had been on any private international holidays, which were with family, friends,
by themselves or at school and whether they learned a foreign language at high school.
Previous private international travel or high school foreign language learning was
hypothesised to influence a student’s cross-cultural adaptability.
3.8.4 External International Academic Experiences
Respondents were asked about their previous experience participating in either an
international exchange, study tour or internship. This study hypothesised that participation in
an external international experience would influence a student’s cross-cultural adaptability.
3.8.5 Internal International academic experiences
Respondents were asked about international experiences they had participated in at a major
university in Melbourne, Australia. These included whether they had completed any subject
with an internationalised curriculum, whether they had participated in any group work with
students from another culture or had studied a foreign language at university. This study
hypothesised that completion of a subject with internationalised content or working in cross-
cultural groups on assignments influenced a student’s cross-cultural adaptability.
3.9 Approach to the Analysis
Data analysis of describing, summarising and grouping the data led to completing both
descriptive and exploratory factor analysis (EFA). These results were found in chapter four.
Many studies typically utilised descriptive research and the use of EFA (McCauley, 2014;
Kopanidis, 2008; Whitehead, Raffan & Deaney, 2006; Veloutsou, Paton & Lewis, 2005;
Joseph & Joseph 1998; 2000, Kimweli & Richards 1999; Scott & Lamont 1977). After EFA,
89
further analysis can be found in chapter five which addressed the hypotheses set out in chapter
two, using a quantitative approach that was tested in two distinct stages, the pre- and post-
tests.
3.9.1 Descriptive Statistics
Descriptive analysis was undertaken to provide an understanding of the sample. Descriptive
analysis entailed profiling the respondents to give a snapshot of who responded to the
questionnaire. This section aimed to assess the sample concerning data gathered outside the
specific conceptual model as well as the demographic, socio-economic, socialising, private,
external and internal international academic experiences of the respondents. Another aim of
the descriptive statistics using numerical measures of central location and dispersion, was to
assess how representative the sample was concerning the same variables just listed, and the
students who either did use a SLM and had a cross-cultural experience or did not meet with a
SLM at all. A summary and description of the results were available in chapter four.
3.9.2 Exploratory Factor Analysis
Factor analysis is a term used to describe several methods designed to analyse inter-
relationships within a set of variables resulting in the specification of new factors. In
multivariate statistics, Exploratory Factor Analysis (EFA) is a statistical method used to
uncover the underlying structure of a set of variables. “EFA explores the data and provides
the researcher with information about how many factors are needed to best represent the data”
(Hair et al., 2006, p. 773). EFA can be used when the researcher does not have a priori
hypothesis to work with on factors or patterns of factors measured. It is commonly used by
researchers when developing a scale and serves to identify a set of latent constructs underlying
an assortment of measured items. In this research, items were adapted and examined in terms
of a different context (cross-cultural adaptability), and thus, EFA was applicable. EFA
procedures were more accurate when each factor was represented by multiple measured
variables in the analysis. All variables applied to the conceptual model contained at least three
distinct items (McCauley, 2014).
EFA required the researcher to make several important decisions about how to conduct the
analysis because there was no one accepted approach. Researchers were faced with numerous
90
choices when conducting factor analysis, and in general, the literature provides inconsistent
and inconclusive information in terms of these decisions (Schmitt, 2011). In the case of this
study, EFA was used as a tool to provide operational definitions for descriptive statistics and
subsequent analysis using mixed methods ANOVAs and repeated measures MANCOVAs, as
well as to test the validity and reliability of the proposed measurement instrument. The general
purpose of factor analytic techniques was to define the underlying structure of the variables,
and the primary purpose of EFA was to determine the underlying structure among the
variables in this study (Hair et al., 2006). The EFA provided the mechanism for developing
the constructs to produce the measurement variables for further model analysis and testing.
The Bartlett test of sphericity tested the null hypothesis that there are no correlations amongst
the variables. If the observed significance was small (<0.05), then the test provided evidence
that the correlation matrix had significant correlations between at least some of the variables
(Hair et al., 2006). The Kaiser-Meyer-Olkin Measure of Sampling Adequacy (KMO) was
used to compare the magnitude of the observed correlations about the magnitudes of the
partial correlation coefficients. Measures less than 0.5 were not suitable for further analysis.
All variables were examined using the Varimax rotation method, and KMO as “rotation of
the factors improves the interpretation by reducing some of the ambiguities that often
accompany initial unrotated factor solutions” (Hair et al., 2006, p. 123). Varimax rotation was
chosen as it was usually the default rotation method. There was no compelling analytical
reason to choose one method over another (Hair et al., 2006; McCauley, 2014).
While factor loadings within the range from 0.30 to 0.40 could be considered with a sample
size over 300, this study had a sample size of 214. Loadings higher than 0.5 were significant
(Hair et al., 2006) and were considered for further evaluation in this study. When the
underlying factors were not well understood, lack of a prior specification in EFA was a
strength (Gerbing & Hamilton 1996). In the case of this study, although the number of factors
per construct was already known and specified, EFA was undertaken to examine underlying
patterns or correlations. The development of a measurement model developed in concert with
EFA was undertaken. Full details of the EFA analysis are in chapter four.
91
3.10 Statistical Methods used
Statistical methods that were traditionally used in comparing two groups with pre-test and
post-test data included paired-sample T-tests, Mann Whitney U tests, univariate, bivariate or
mixed designs ANOVAs, and repeated measures MANOVA or MANCOVA (Pallant, 2016).
The use of pre-test scores helped to reduce error variance, which thus produced more powerful
tests than designs with no pre-test data (Stevens, 2009). For research question one that
hypothesised that either meeting with a SLM or not would influence a student’s cross-cultural
adaptability for any or all four cultural dimensions, four separate mixed-design ANOVAs
were used, one for each dependent variable. Also, due to this study having fifteen covariates,
multivariance analysis of covariance (MANCOVA) was chosen to analyse research question
two. The power of MANCOVA was that it analysed the probability of finding differences
between the two groups when they existed. MANCOVA was also used to adjust the post-test
means for pre-test differences within the two groups (Garson, 2015). If the pre-test scores
were not reliable, the treatment effects could be severely biased, particularly with non-
randomised designs such as inthis study (Dmitrov & Rumrill, Jr., 2003). However,
MANCOVAs only showed the influence of the covariate on the four cultural dimensions.
They were not directional.
Covariates were added in the MANCOVA analysis so that errors could be reduced and so that
the analysis eliminated the covariates’ effect on the relationship between the two groups and
the dependent variables (Statistics Solutions, 2018). MANCOVA was an extension of
ANCOVA for cases such as in this study where there was more than one dependent variable
and where the control of covariates was required. As for all tests in the ANOVA family, the
primary aim of the MANCOVA was to test for significant differences between group means.
The covariates were additional covariates for each group, thus reducing the error term in the
model (Garson, 2015) as each covariate represented a source of variation that had not been
controlled in the quasi-experiment and was believed to affect the dependent variable (Kirk,
1982). MANCOVA aimed to remove the effects of such uncontrolled variation, to ensure an
accurate measurement of the actual relationship between the group and the four dependent
variables. Planned comparisons and post-hoc comparisons to see which values of a variable
contribute the most to the explanation of the dependent variables were used in the mixed
design ANOVAs for research question one. These were not available in Repeated Measures
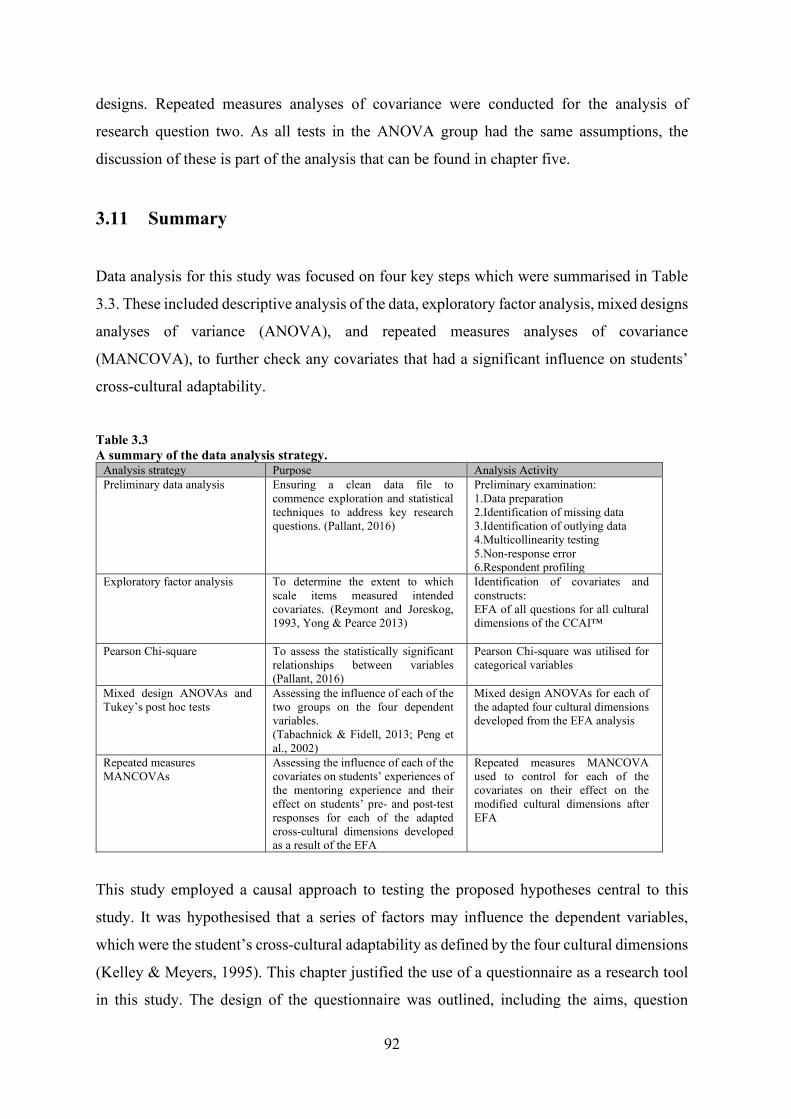
92
designs. Repeated measures analyses of covariance were conducted for the analysis of
research question two. As all tests in the ANOVA group had the same assumptions, the
discussion of these is part of the analysis that can be found in chapter five.
3.11 Summary
Data analysis for this study was focused on four key steps which were summarised in Table
3.3. These included descriptive analysis of the data, exploratory factor analysis, mixed designs
analyses of variance (ANOVA), and repeated measures analyses of covariance
(MANCOVA), to further check any covariates that had a significant influence on students’
cross-cultural adaptability.
Table 3.3 A summary of the data analysis strategy.
Analysis strategy Purpose Analysis Activity Preliminary data analysis Ensuring a clean data file to
commence exploration and statistical techniques to address key research questions. (Pallant, 2016)
Preliminary examination: 1.Data preparation 2.Identification of missing data 3.Identification of outlying data 4.Multicollinearity testing 5.Non-response error 6.Respondent profiling
Exploratory factor analysis To determine the extent to which scale items measured intended covariates. (Reymont and Joreskog, 1993, Yong & Pearce 2013)
Identification of covariates and constructs: EFA of all questions for all cultural dimensions of the CCAI™
Pearson Chi-square To assess the statistically significant relationships between variables (Pallant, 2016)
Pearson Chi-square was utilised for categorical variables
Mixed design ANOVAs and Tukey’s post hoc tests
Assessing the influence of each of the two groups on the four dependent variables. (Tabachnick & Fidell, 2013; Peng et al., 2002)
Mixed design ANOVAs for each of the adapted four cultural dimensions developed from the EFA analysis
Repeated measures MANCOVAs
Assessing the influence of each of the covariates on students’ experiences of the mentoring experience and their effect on students’ pre- and post-test responses for each of the adapted cross-cultural dimensions developed as a result of the EFA
Repeated measures MANCOVA used to control for each of the covariates on their effect on the modified cultural dimensions after EFA
This study employed a causal approach to testing the proposed hypotheses central to this
study. It was hypothesised that a series of factors may influence the dependent variables,
which were the student’s cross-cultural adaptability as defined by the four cultural dimensions
(Kelley & Meyers, 1995). This chapter justified the use of a questionnaire as a research tool
in this study. The design of the questionnaire was outlined, including the aims, question
93
content, wording, structure, composition and minimisation of errors. The administration of
the questionnaire and the sample size and sampling issues were detailed. The sequence of the
structured steps taken to implement both the pre- and post-tests were described. The actions
taken to ensure that data were accurately processed through descriptive statistics were
discussed as well as the use of mixed model ANOVAs and repeated measures MANCOVAs.
Chapter four to follow was dedicated to assessing the main measurement tools used in this
study. It provided the results of the descriptive statistics which described, summarised and
grouped the data and the analysis that occurred in exploratory factor analysis. Chapter five
then discussed the data analysis about the research questions addressed in chapter one.
Empirical findings were also discussed.
94
Chapter 4
ANALYSIS OF STUDENT SAMPLES
4.1 Introduction
This chapter presented the results of the descriptive analysis as well as an analysis of the
findings about the student samples. The aim of this section was to assess how representative
the samples were with respect to students’ cross-cultural adaptability and to provide an
understanding of the samples through examining distributions of the demographic and socio-
economic factors, private international experiences, external international academic
experiences, internal international academic experience variables and their cross-cultural
adaptability before and after the peer-to-peer mentoring experience. Furthermore, the
description of the sample entailed an exploratory discussion of similarities and differences of
suggested relationships between the variables and the use of the SLM service.
The results of the analysis in this chapter informed the discussion and implications in chapter
five. Chapter four is organised around seven major topics.
1. Topic one profiled the respondents in terms of their demographic and socio-
economic factors.
2. Topic two profiled the respondents in terms of their socialising factors.
3. Topic three profiled the respondents in terms of their previous private
international experiences.
4. Topic four profiled the respondents in terms of their previous external
international (offshore) academic experiences.
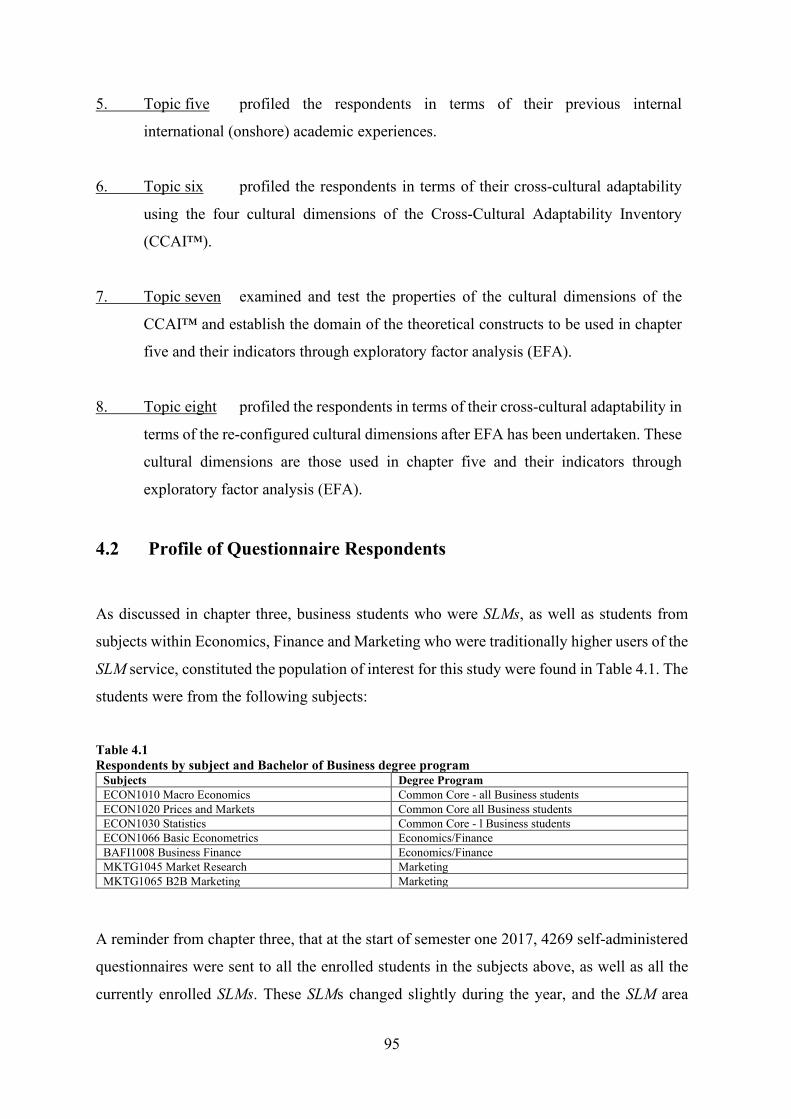
95
5. Topic five profiled the respondents in terms of their previous internal
international (onshore) academic experiences.
6. Topic six profiled the respondents in terms of their cross-cultural adaptability
using the four cultural dimensions of the Cross-Cultural Adaptability Inventory
(CCAI™).
7. Topic seven examined and test the properties of the cultural dimensions of the
CCAI™ and establish the domain of the theoretical constructs to be used in chapter
five and their indicators through exploratory factor analysis (EFA).
8. Topic eight profiled the respondents in terms of their cross-cultural adaptability in
terms of the re-configured cultural dimensions after EFA has been undertaken. These
cultural dimensions are those used in chapter five and their indicators through
exploratory factor analysis (EFA).
4.2 Profile of Questionnaire Respondents
As discussed in chapter three, business students who were SLMs, as well as students from
subjects within Economics, Finance and Marketing who were traditionally higher users of the
SLM service, constituted the population of interest for this study were found in Table 4.1. The
students were from the following subjects:
Table 4.1 Respondents by subject and Bachelor of Business degree program
Subjects Degree Program ECON1010 Macro Economics Common Core - all Business students ECON1020 Prices and Markets Common Core all Business students ECON1030 Statistics Common Core - l Business students ECON1066 Basic Econometrics Economics/Finance BAFI1008 Business Finance Economics/Finance MKTG1045 Market Research Marketing MKTG1065 B2B Marketing Marketing
A reminder from chapter three, that at the start of semester one 2017, 4269 self-administered
questionnaires were sent to all the enrolled students in the subjects above, as well as all the
currently enrolled SLMs. These SLMs changed slightly during the year, and the SLM area
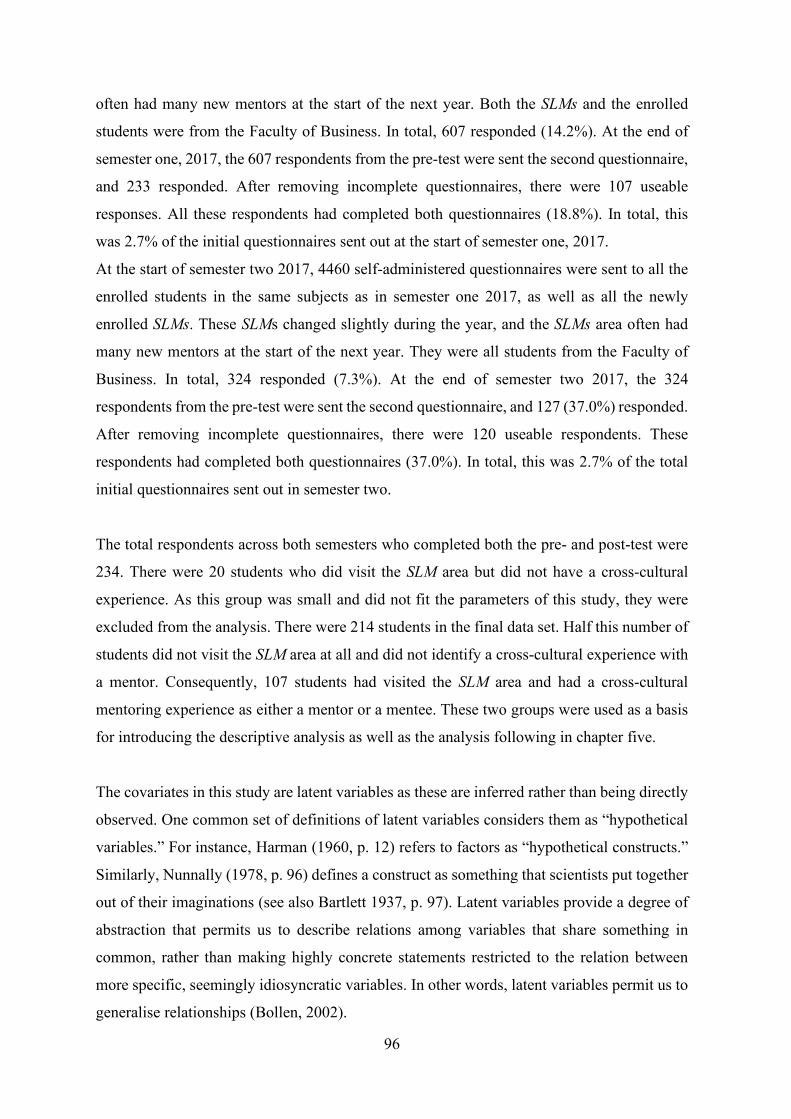
96
often had many new mentors at the start of the next year. Both the SLMs and the enrolled
students were from the Faculty of Business. In total, 607 responded (14.2%). At the end of
semester one, 2017, the 607 respondents from the pre-test were sent the second questionnaire,
and 233 responded. After removing incomplete questionnaires, there were 107 useable
responses. All these respondents had completed both questionnaires (18.8%). In total, this
was 2.7% of the initial questionnaires sent out at the start of semester one, 2017.
At the start of semester two 2017, 4460 self-administered questionnaires were sent to all the
enrolled students in the same subjects as in semester one 2017, as well as all the newly
enrolled SLMs. These SLMs changed slightly during the year, and the SLMs area often had
many new mentors at the start of the next year. They were all students from the Faculty of
Business. In total, 324 responded (7.3%). At the end of semester two 2017, the 324
respondents from the pre-test were sent the second questionnaire, and 127 (37.0%) responded.
After removing incomplete questionnaires, there were 120 useable respondents. These
respondents had completed both questionnaires (37.0%). In total, this was 2.7% of the total
initial questionnaires sent out in semester two.
The total respondents across both semesters who completed both the pre- and post-test were
234. There were 20 students who did visit the SLM area but did not have a cross-cultural
experience. As this group was small and did not fit the parameters of this study, they were
excluded from the analysis. There were 214 students in the final data set. Half this number of
students did not visit the SLM area at all and did not identify a cross-cultural experience with
a mentor. Consequently, 107 students had visited the SLM area and had a cross-cultural
mentoring experience as either a mentor or a mentee. These two groups were used as a basis
for introducing the descriptive analysis as well as the analysis following in chapter five.
The covariates in this study are latent variables as these are inferred rather than being directly
observed. One common set of definitions of latent variables considers them as “hypothetical
variables.” For instance, Harman (1960, p. 12) refers to factors as “hypothetical constructs.”
Similarly, Nunnally (1978, p. 96) defines a construct as something that scientists put together
out of their imaginations (see also Bartlett 1937, p. 97). Latent variables provide a degree of
abstraction that permits us to describe relations among variables that share something in
common, rather than making highly concrete statements restricted to the relation between
more specific, seemingly idiosyncratic variables. In other words, latent variables permit us to
generalise relationships (Bollen, 2002).
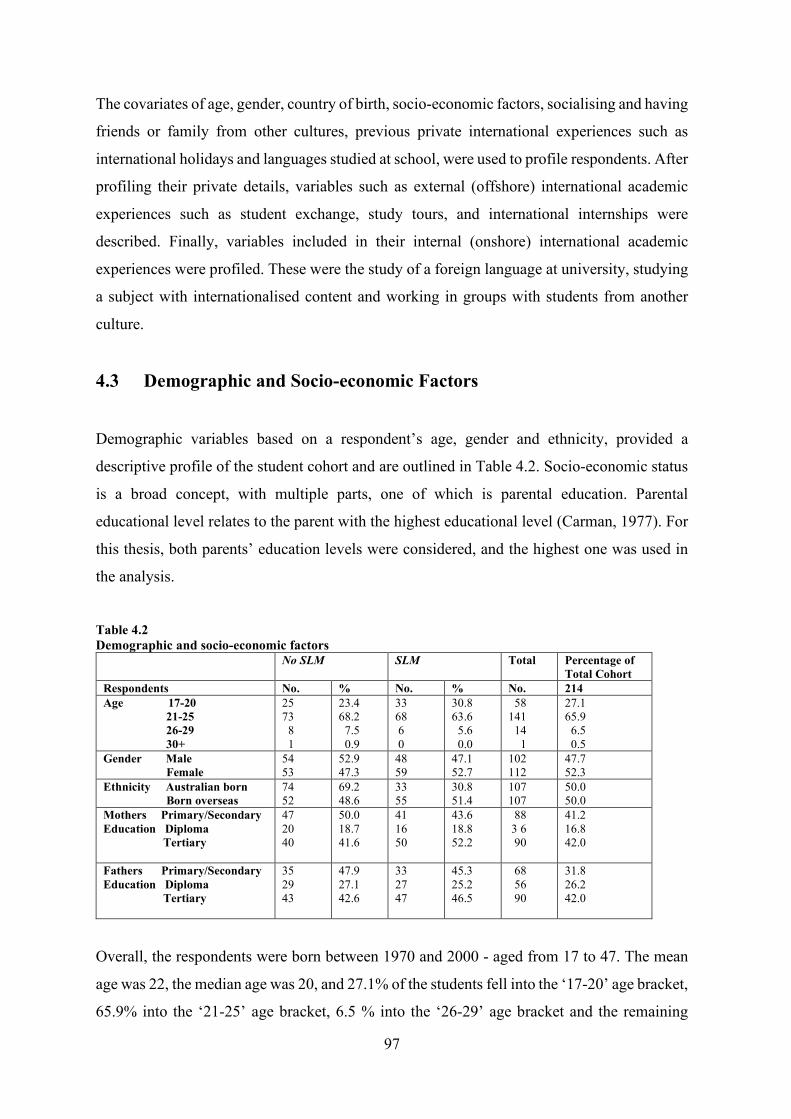
97
The covariates of age, gender, country of birth, socio-economic factors, socialising and having
friends or family from other cultures, previous private international experiences such as
international holidays and languages studied at school, were used to profile respondents. After
profiling their private details, variables such as external (offshore) international academic
experiences such as student exchange, study tours, and international internships were
described. Finally, variables included in their internal (onshore) international academic
experiences were profiled. These were the study of a foreign language at university, studying
a subject with internationalised content and working in groups with students from another
culture.
4.3 Demographic and Socio-economic Factors
Demographic variables based on a respondent’s age, gender and ethnicity, provided a
descriptive profile of the student cohort and are outlined in Table 4.2. Socio-economic status
is a broad concept, with multiple parts, one of which is parental education. Parental
educational level relates to the parent with the highest educational level (Carman, 1977). For
this thesis, both parents’ education levels were considered, and the highest one was used in
the analysis.
Table 4.2 Demographic and socio-economic factors
No SLM SLM Total Percentage of Total Cohort
Respondents No. % No. % No. 214 Age 17-20 21-25 26-29 30+
25 73 8 1
23.4 68.2 7.5 0.9
33 68 6 0
30.8 63.6 5.6 0.0
58 141 14 1
27.1 65.9 6.5 0.5
Gender Male Female
54 53
52.9 47.3
48 59
47.1 52.7
102 112
47.7 52.3
Ethnicity Australian born Born overseas
74 52
69.2 48.6
33 55
30.8 51.4
107 107
50.0 50.0
Mothers Primary/Secondary Education Diploma Tertiary
47 20 40
50.0 18.7 41.6
41 16 50
43.6 18.8 52.2
88 3 6 90
41.2 16.8 42.0
Fathers Primary/Secondary Education Diploma Tertiary
35 29 43
47.9 27.1 42.6
33 27 47
45.3 25.2 46.5
68 56 90
31.8 26.2 42.0
Overall, the respondents were born between 1970 and 2000 - aged from 17 to 47. The mean
age was 22, the median age was 20, and 27.1% of the students fell into the ‘17-20’ age bracket,
65.9% into the ‘21-25’ age bracket, 6.5 % into the ‘26-29’ age bracket and the remaining
98
0.5% were classified in the ‘30+’ age bracket. The students who had undertaken a SLM
experience represented 56.9% of the ‘17-20’ age bracket and those who had not undertaken a
SLM experience 43.1%. For the ‘21-25’ age bracket, students who did not meet with a SLM
represented 51.8% with those who had visited SLM the remaining 48.2%. The group who had
not visited a SLM had the only student who was over 30. There were no mature age students
in the group who had visited SLM.
In exploring the question “Is there a relationship between age and whether to use the SLM
academic support service? A chi-square test for independence indicated that age was not
related to the decision to attend SLM or not to attend SLM, χ 2 (3, n =214) = 2.566, p=0.463,
Cramer’s V=0.110.
There was an almost equal gender distribution, with approximately 48% male and 52%
female. Of the respondents, 52.9% and 43.7% of females did not use the services of a SLM
for academic help. Of the students who did use the services of a SLM as either a mentor or
mentee, 47.1% were male with the remaining 52.7% female.
In exploring the question “Is there a relationship between gender and whether to use the SLM
academic support service? A chi-square test for independence (with Yate’s Continuity
Correction) indicated no significant association between gender and whether the respondents
chose to use the SLM service or not, χ 2 (1, n =214) = 0.469, p=0.494, phi=0.056. The Yates’
Correction for Continuity was used as it compensates for the over-estimate of the chi-square
value when used with a two by two table.
Most respondents (58.9%) were born in Australia, with 41.1% of the respondents being born
in a country other than Australia. The group who had not used SLM contained 69.2% of
students born in Australia with the remaining 30.8% being non-Australian born. Of the SLM
experience group, 48.6% were born in Australia with the remaining 51.4% being non-
Australian born.
In exploring the question “Is there a relationship between ethnicity and whether to use the
SLM service or not? A chi-square test for independence (with Yate’s Continuity Correction)
indicated that students who were Australian born were more likely to use the SLM service
than students who were born overseas, χ 2 (1, n =214) = 8.511, p=0.002, phi=0.209.
99
In terms of measuring the socio-economic background, James et al., (1999, as cited in
Kopanidis, 2008) chose the highest parental education as an appropriate measure. Socio-
economic status (SES) subgroups were defined as follows:
1. Lower SES: parents who attended primary school and may have completed secondary
school.
2. Medium SES: parents who had completed a vocational qualification, diploma or
associate diploma (e.g. TAFE).
3. Higher SES: parents who had completed an undergraduate or post-graduate
university degree.
According to the above banding, mothers were almost equal in the Higher SES band (42%)
and the Lower SES band (41.2%) with those in the Medium SES band the remaining 16.8%.
Within the Higher SES band, respondents with mothers with an undergraduate or postgraduate
degree were more likely to have visited the SLM service for academic help (52.2%). For
mothers within the Medium SES band, the respondents were equally likely to use the service
of SLMs or not (18.8% each). Respondents with mothers from the Lower SES band were less
likely to have used the SLM service (50%) than those who did not (43.6%).
In exploring the question “Is there a relationship between mothers’ education and whether
the respondents used the services of the SLM area? A chi-square test for independence (with
Yate’s Continuity Correction) indicated that overall mothers’ education levels did not affect
whether they used the services of SLM, χ 2 (4, n =214) = 5.369, p=0.251, Cramer’s V=0.209.
According to the above banding, most fathers of the respondents were in the Higher SES band
(42%). Within the Higher SES band, 46.5% of respondents had used the service of SLM, but
42.6% had not. Within the respondents with fathers in the Medium SES band, they were
equally distributed between the two groups (25.2% each). Within the Lower SES band, 46.5%
of respondents utilised the SLM service while 42.6% did not.
In exploring the question “Is there a relationship between fathers’ education and whether the
respondents used the services of the SLM? A chi-square test for independence (with Yate’s
Continuity Correction) indicated no significant association between fathers’ education levels
and whether they used the SLM services, χ 2 (4, n =214) = 1.416, p=0.841, Cramer’s V=0.081.
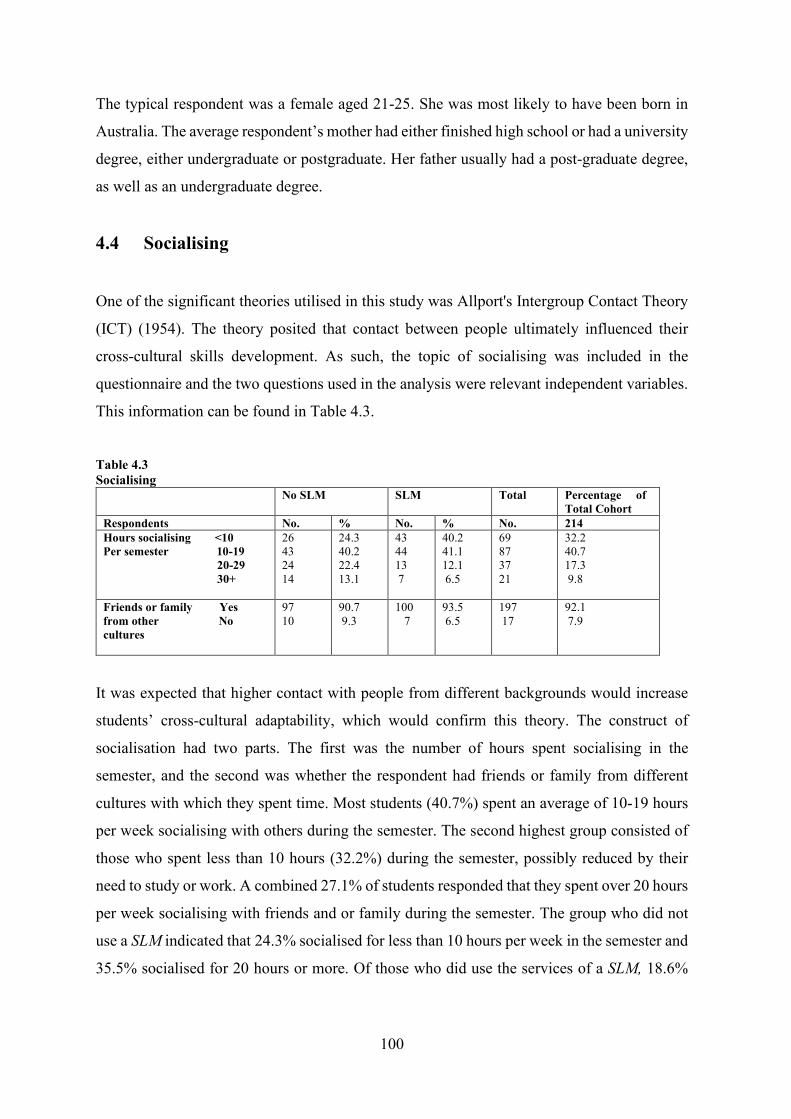
100
The typical respondent was a female aged 21-25. She was most likely to have been born in
Australia. The average respondent’s mother had either finished high school or had a university
degree, either undergraduate or postgraduate. Her father usually had a post-graduate degree,
as well as an undergraduate degree.
4.4 Socialising
One of the significant theories utilised in this study was Allport's Intergroup Contact Theory
(ICT) (1954). The theory posited that contact between people ultimately influenced their
cross-cultural skills development. As such, the topic of socialising was included in the
questionnaire and the two questions used in the analysis were relevant independent variables.
This information can be found in Table 4.3.
Table 4.3 Socialising
No SLM SLM
Total Percentage of Total Cohort
Respondents No. % No. % No. 214 Hours socialising <10 Per semester 10-19 20-29 30+
26 43 24 14
24.3 40.2 22.4 13.1
43 44 13 7
40.2 41.1 12.1 6.5
69 87 37 21
32.2 40.7 17.3 9.8
Friends or family Yes from other No cultures
97 10
90.7 9.3
100 7
93.5 6.5
197 17
92.1 7.9
It was expected that higher contact with people from different backgrounds would increase
students’ cross-cultural adaptability, which would confirm this theory. The construct of
socialisation had two parts. The first was the number of hours spent socialising in the
semester, and the second was whether the respondent had friends or family from different
cultures with which they spent time. Most students (40.7%) spent an average of 10-19 hours
per week socialising with others during the semester. The second highest group consisted of
those who spent less than 10 hours (32.2%) during the semester, possibly reduced by their
need to study or work. A combined 27.1% of students responded that they spent over 20 hours
per week socialising with friends and or family during the semester. The group who did not
use a SLM indicated that 24.3% socialised for less than 10 hours per week in the semester and
35.5% socialised for 20 hours or more. Of those who did use the services of a SLM, 18.6%
101
socialised for 20 hours or more, 40.2% socialised for less than 10 hours during the semester
and 41.1% fell into the 10-19hour bracket.
In exploring the question “Is there a relationship between the number of hours spent
socialising and whether the respondents used the service of the SLM area? A chi-square test
for independence indicated that the number of hours spent socialising during the semester and
whether they did or did not use the SLM service was related, χ 2 (3, n =214) = 9.804, p=0.020,
Cramer’s V=0.214.
Most respondents (92.1%) stated that they have friends or family from a different culture,
leaving only 7.9% of respondents who stated that they did not have any friends or family from
another culture. The group who did not utilise the services of a SLM stated that 90.7% of them
have friends or family from another culture. The group who had a SLM experience was also
high at 93.5%.
In exploring the question “Is there a relationship between having friends and family from
another culture and whether or not the respondents used a SLM? A chi-square test for
independence (with Yate’s Continuity Correction) indicated that there was no significant
association between having friends and family from another country/culture and whether they
used the SLM service, χ 2 (1, n =214) = 0.256, p=0.613, phi=0.056.
As Allport (1954) found while developing his ICT, when people spent time together, they
developed their cross-cultural skills. The average respondent spent ‘10-19’ hours per
semester socialising with others and had friends and or family from other cultures, confirming
the application of contact theory in this study. Contact can also be incidental and may have
influenced the student in developing their cross-cultural skills (Pettigrew & Tropp, 2006).
4.5 Private international experiences
The distribution of questionnaire respondents to the questions related to private international
experiences can be seen in Table 4.4. These were whether the student had studied a foreign
language at high school or whether they had been on private international holidays.
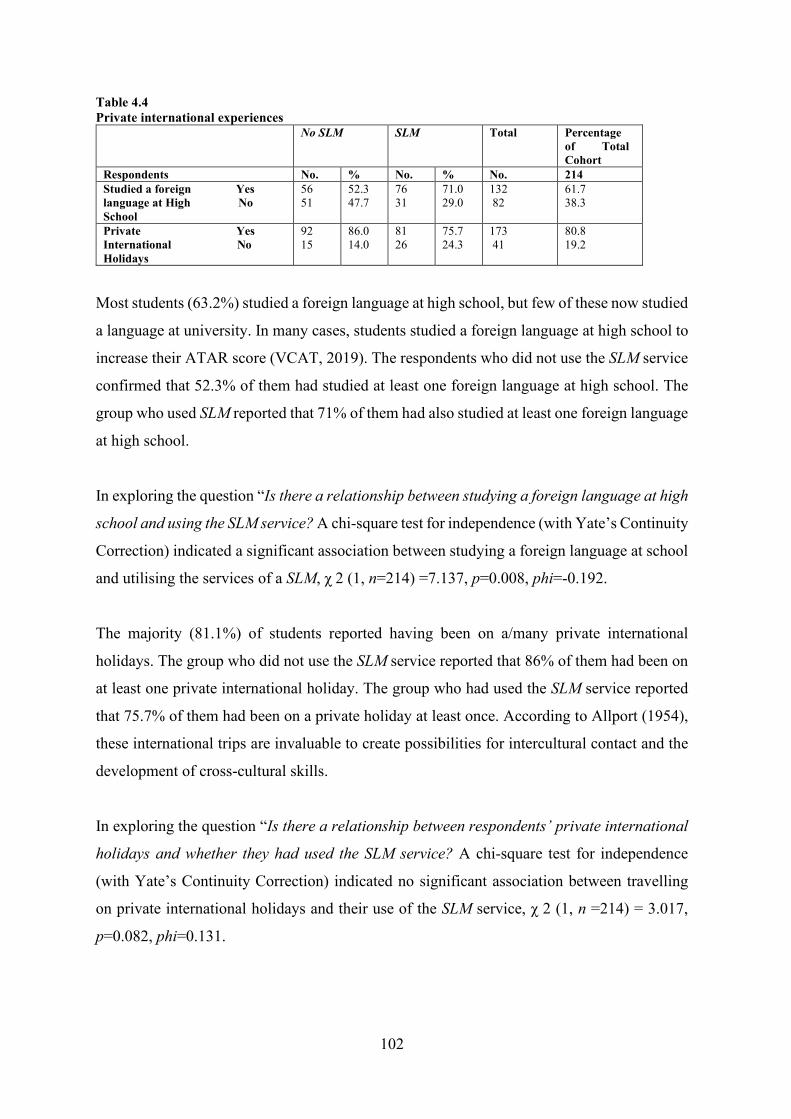
102
Table 4.4 Private international experiences
No SLM SLM Total Percentage of Total Cohort
Respondents No. % No. % No. 214 Studied a foreign Yes language at High No School
56 51
52.3 47.7
76 31
71.0 29.0
132 82
61.7 38.3
Private Yes International No Holidays
92 15
86.0 14.0
81 26
75.7 24.3
173 41
80.8 19.2
Most students (63.2%) studied a foreign language at high school, but few of these now studied
a language at university. In many cases, students studied a foreign language at high school to
increase their ATAR score (VCAT, 2019). The respondents who did not use the SLM service
confirmed that 52.3% of them had studied at least one foreign language at high school. The
group who used SLM reported that 71% of them had also studied at least one foreign language
at high school.
In exploring the question “Is there a relationship between studying a foreign language at high
school and using the SLM service? A chi-square test for independence (with Yate’s Continuity
Correction) indicated a significant association between studying a foreign language at school
and utilising the services of a SLM, χ 2 (1, n=214) =7.137, p=0.008, phi=-0.192.
The majority (81.1%) of students reported having been on a/many private international
holidays. The group who did not use the SLM service reported that 86% of them had been on
at least one private international holiday. The group who had used the SLM service reported
that 75.7% of them had been on a private holiday at least once. According to Allport (1954),
these international trips are invaluable to create possibilities for intercultural contact and the
development of cross-cultural skills.
In exploring the question “Is there a relationship between respondents’ private international
holidays and whether they had used the SLM service? A chi-square test for independence
(with Yate’s Continuity Correction) indicated no significant association between travelling
on private international holidays and their use of the SLM service, χ 2 (1, n =214) = 3.017,
p=0.082, phi=0.131.
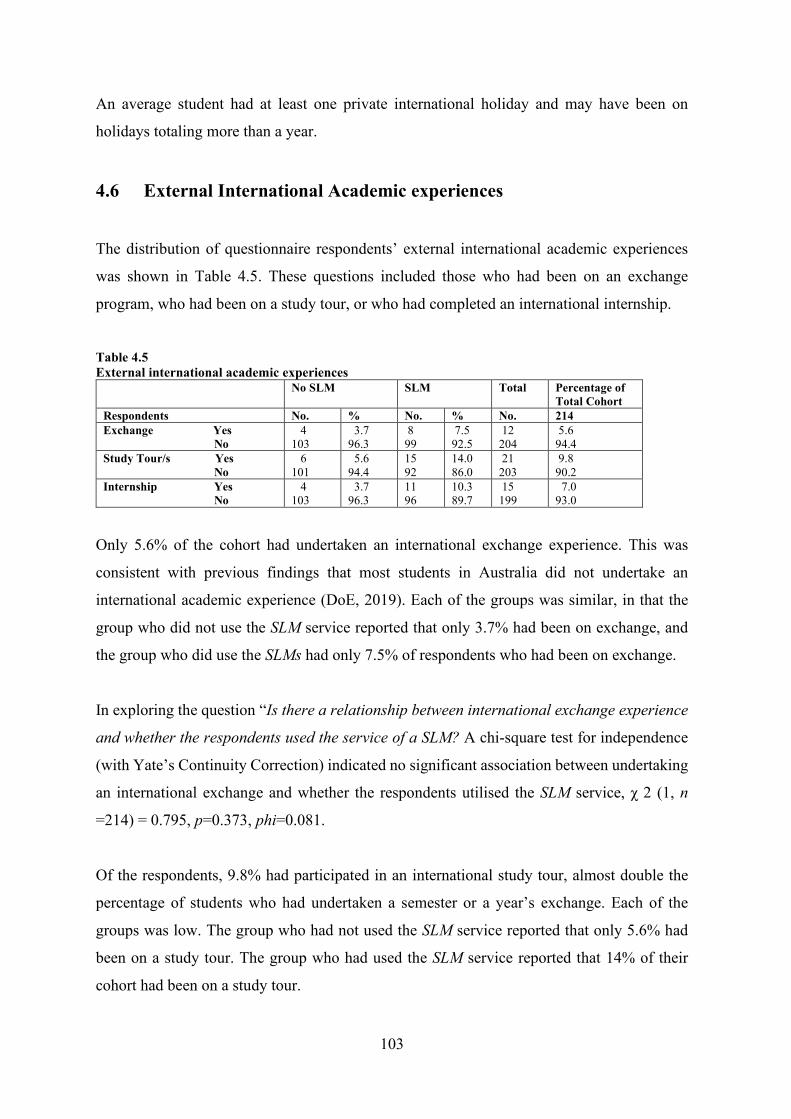
103
An average student had at least one private international holiday and may have been on
holidays totaling more than a year.
4.6 External International Academic experiences
The distribution of questionnaire respondents’ external international academic experiences
was shown in Table 4.5. These questions included those who had been on an exchange
program, who had been on a study tour, or who had completed an international internship.
Table 4.5 External international academic experiences
No SLM SLM Total Percentage of Total Cohort
Respondents No. % No. % No. 214 Exchange Yes No
4 103
3.7 96.3
8 99
7.5 92.5
12 204
5.6 94.4
Study Tour/s Yes No
6 101
5.6 94.4
15 92
14.0 86.0
21 203
9.8 90.2
Internship Yes No
4 103
3.7 96.3
11 96
10.3 89.7
15 199
7.0 93.0
Only 5.6% of the cohort had undertaken an international exchange experience. This was
consistent with previous findings that most students in Australia did not undertake an
international academic experience (DoE, 2019). Each of the groups was similar, in that the
group who did not use the SLM service reported that only 3.7% had been on exchange, and
the group who did use the SLMs had only 7.5% of respondents who had been on exchange.
In exploring the question “Is there a relationship between international exchange experience
and whether the respondents used the service of a SLM? A chi-square test for independence
(with Yate’s Continuity Correction) indicated no significant association between undertaking
an international exchange and whether the respondents utilised the SLM service, χ 2 (1, n
=214) = 0.795, p=0.373, phi=0.081.
Of the respondents, 9.8% had participated in an international study tour, almost double the
percentage of students who had undertaken a semester or a year’s exchange. Each of the
groups was low. The group who had not used the SLM service reported that only 5.6% had
been on a study tour. The group who had used the SLM service reported that 14% of their
cohort had been on a study tour.
104
In exploring the question “Is there a relationship between study tour attendance and whether
or not the respondents used the SLM service? A chi-square test for independence (with Yate’s
Continuity Correction) indicated no significant association between study tour participation
and whether they used the SLM service, χ 2 (1, n =214) = 3.379, p=0.066, phi=-0.141.
Only 7% of the total cohort had participated in an international internship, with a few more in
the group who had used the SLM service. The group who had not used the SLM service had
3.7% who had gone on an international internship, but the group who had used the SLM
service had more than double at 10.3%. The numbers are too low to draw any meaningful
inferences.
In exploring the question “Is there a relationship between undertaking an international
internship and using the services of a SLM? A chi-square test for independence (with Yate’s
Continuity Correction) indicated no significant association between undertaking an
international internship and whether the respondents used the SLM service, χ 2 (1, n =214) =
2.581, p=0.108, phi=-0.128.
The respondents in this study confirmed current and past research that most university
students did not take up opportunities to participate in international exchange, international
study tour or international internships. As seen in the literature review, the reasons for this are
many, but from the Australian students' perspective, many have part-time jobs that they may
have to resign from to attend such an experience and do not see the value in an offshore
opportunity (James et al.,, 2007).
Twelve of the respondents had undertaken an exchange, only 21 respondents had undertaken
a study tour, and 15 had undertaken an international internship. The total number of
respondents who had undertaken an international offshore experience of any type was 48, but
when the students who had gone on multiple experiences were removed, this figure dropped
to only 38 of the 214 who had undertaken an international offshore experience. Although this
represented 17.7% of the total cohort, only 12 were in the group who had not utilised the SLM
service, (5.6% of the total respondents) and 26 students in the group who did use the SLM
service (6.5% of the total respondents).
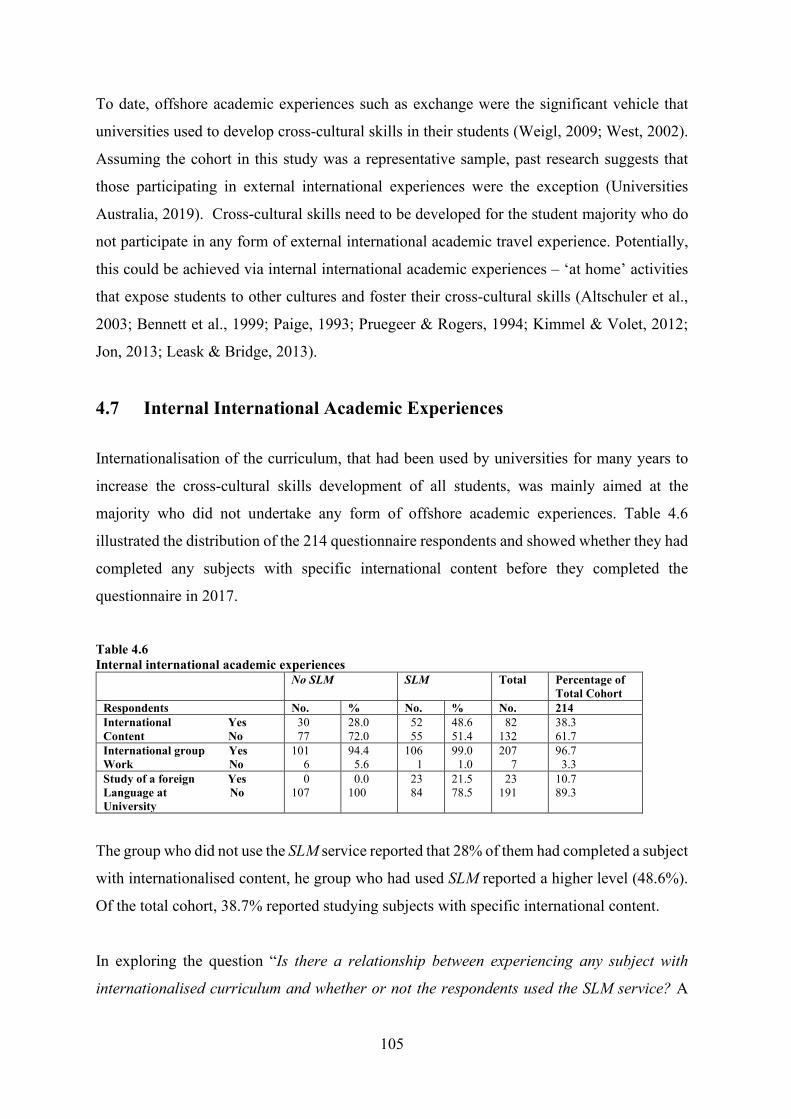
105
To date, offshore academic experiences such as exchange were the significant vehicle that
universities used to develop cross-cultural skills in their students (Weigl, 2009; West, 2002).
Assuming the cohort in this study was a representative sample, past research suggests that
those participating in external international experiences were the exception (Universities
Australia, 2019). Cross-cultural skills need to be developed for the student majority who do
not participate in any form of external international academic travel experience. Potentially,
this could be achieved via internal international academic experiences – ‘at home’ activities
that expose students to other cultures and foster their cross-cultural skills (Altschuler et al.,
2003; Bennett et al., 1999; Paige, 1993; Pruegeer & Rogers, 1994; Kimmel & Volet, 2012;
Jon, 2013; Leask & Bridge, 2013).
4.7 Internal International Academic Experiences Internationalisation of the curriculum, that had been used by universities for many years to
increase the cross-cultural skills development of all students, was mainly aimed at the
majority who did not undertake any form of offshore academic experiences. Table 4.6
illustrated the distribution of the 214 questionnaire respondents and showed whether they had
completed any subjects with specific international content before they completed the
questionnaire in 2017.
Table 4.6 Internal international academic experiences
No SLM SLM Total Percentage of Total Cohort
Respondents No. % No. % No. 214 International Yes Content No
30 77
28.0 72.0
52 55
48.6 51.4
82 132
38.3 61.7
International group Yes Work No
101 6
94.4 5.6
106 1
99.0 1.0
207 7
96.7 3.3
Study of a foreign Yes Language at No University
0 107
0.0 100
23 84
21.5 78.5
23 191
10.7 89.3
The group who did not use the SLM service reported that 28% of them had completed a subject
with internationalised content, he group who had used SLM reported a higher level (48.6%).
Of the total cohort, 38.7% reported studying subjects with specific international content.
In exploring the question “Is there a relationship between experiencing any subject with
internationalised curriculum and whether or not the respondents used the SLM service? A
106
chi-square test for independence (with Yate’s Continuity Correction) indicated a significant
association between international subject content and the users of the SLM service, χ 2 (1, n
=214) = 8.719, p=0.003, phi=-0.211.
The number of international students on Australian university campuses continued to be a
significant source of cross-cultural contact for those from Australia (Allport, 1954). Almost
all (97%) reported having participated in a subject where cross-cultural groups were formed.
The group who had not used the SLM service reported that 94.4% of them had completed at
least one group project with a student from another culture while 99% of students in the group
who had used the SLM service reported group work with others from another culture.
In exploring the question “Is there a relationship between participation in cross-cultural
group work and the use of the SLM service? A chi-square test for independence (with Yate’s
Continuity Correction) indicated no significant association between cross-cultural group work
and whether the respondents had used the SLM service, χ 2 (1, n =214) = 2.363, p=0.124,
phi=-0.131.
The majority (88.9%) of students reported that they were not studying a language at
university. All students (100%) of the group who did not meet with a SLM reported not
studying a foreign language at university. In the group who did attend the SLM area, 75% of
them reported that they were not studying a foreign language at university.
In exploring the question “Is there a relationship between studying a foreign language at
university and utilising the SLM service? A chi-square test for independence (with Yate’s
Continuity Correction) indicated there was a significant association between foreign language
study at university and using the SLM service, χ 2 (1, n =214) = 23.578, p=0.000, phi=-0.347.
4.8 Profile Summary of all Respondents
The typical undergraduate student in this study who participated in the SLM service, either as
a mentor or a mentee, was an Australian born female, aged 17- 20 years old. This student’s
mother completed at least high school education but was equally likely to have a university
degree, either undergraduate or postgraduate. She typically spent between 10 and 19 hours
107
per week socialising during the semester and has friends or family from other cultures. She
did study a foreign language at high school but did not study a language at university. She
had been on private international holidays with either her friends, family or alone, and may
have spent a gap year overseas. She had not undertaken an exchange, study tour or
international internship, nor had she studied any subjects with an internationalised curriculum.
She had, however, participated in group work with students from another culture.
The chi-square tests of independence between the variables and students’ use of the SLM
academic service suggested overall that there was very little significance between the
composition of the group who had used the service and those respondents who did not use the
service. The significant results from these tests for relatedness between the respondent’s
likelihood to use the services of SLM were for ethnicity, hours spent socialising, studying a
foreign language at university and completing a subject with international content.
The influence of completing a foreign language either at high school or at university may have
encouraged respondents to use the SLM service as they may have had difficulty if English was
not their first language. This study found that completing subjects with international content
may be considered difficult for some students, which may have encouraged students to use
the SLM service.
4.9 Respondents’ top questions from the CCAI™
The CCAI™ identified questions as reflecting respondents' cultural dimensions such as
Emotional Resilience, Flexibility Openness, Perceptual Acuity, and Personal Autonomy.
Respondents were asked to rate on a six-point Likert-type scale (1= strongly disagree to 6 =
strongly agree) each of the questions on the CCAI™ showing the extent to which the
respondent agreed with the statement in the questionnaire. Analyses of the top-ranked
questions for each cultural dimension were performed to indicate which questions rated as the
most important for respondents across the four dimensions. As the actual CCAI™
measurement instrument’s questions were subject to copyright protection, the specific
questions cannot be detailed in this thesis.
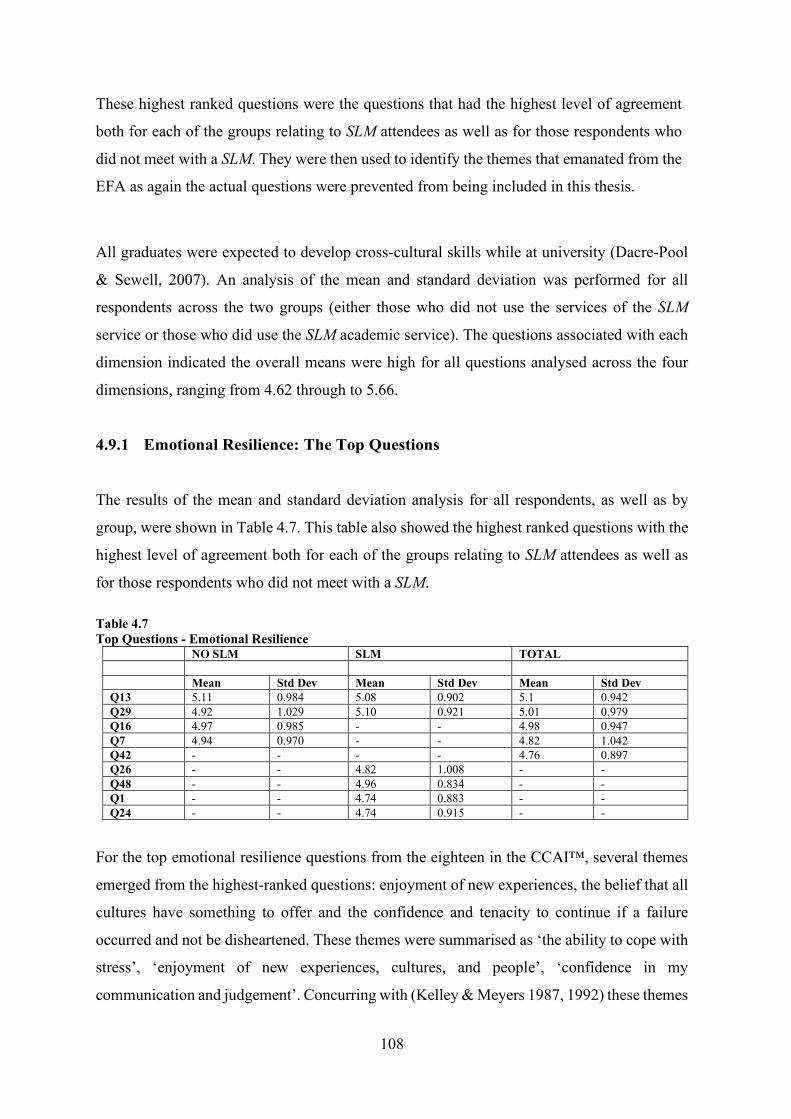
108
These highest ranked questions were the questions that had the highest level of agreement
both for each of the groups relating to SLM attendees as well as for those respondents who
did not meet with a SLM. They were then used to identify the themes that emanated from the
EFA as again the actual questions were prevented from being included in this thesis.
All graduates were expected to develop cross-cultural skills while at university (Dacre-Pool
& Sewell, 2007). An analysis of the mean and standard deviation was performed for all
respondents across the two groups (either those who did not use the services of the SLM
service or those who did use the SLM academic service). The questions associated with each
dimension indicated the overall means were high for all questions analysed across the four
dimensions, ranging from 4.62 through to 5.66.
4.9.1 Emotional Resilience: The Top Questions
The results of the mean and standard deviation analysis for all respondents, as well as by
group, were shown in Table 4.7. This table also showed the highest ranked questions with the
highest level of agreement both for each of the groups relating to SLM attendees as well as
for those respondents who did not meet with a SLM. Table 4.7 Top Questions - Emotional Resilience
NO SLM SLM TOTAL Mean Std Dev Mean Std Dev Mean Std Dev Q13 5.11 0.984 5.08 0.902 5.1 0.942 Q29 4.92 1.029 5.10 0.921 5.01 0.979 Q16 4.97 0.985 - - 4.98 0.947 Q7 4.94 0.970 - - 4.82 1.042 Q42 - - - - 4.76 0.897 Q26 - - 4.82 1.008 - - Q48 - - 4.96 0.834 - - Q1 - - 4.74 0.883 - - Q24 - - 4.74 0.915 - -
For the top emotional resilience questions from the eighteen in the CCAI™, several themes
emerged from the highest-ranked questions: enjoyment of new experiences, the belief that all
cultures have something to offer and the confidence and tenacity to continue if a failure
occurred and not be disheartened. These themes were summarised as ‘the ability to cope with
stress’, ‘enjoyment of new experiences, cultures, and people’, ‘confidence in my
communication and judgement’. Concurring with (Kelley & Meyers 1987, 1992) these themes
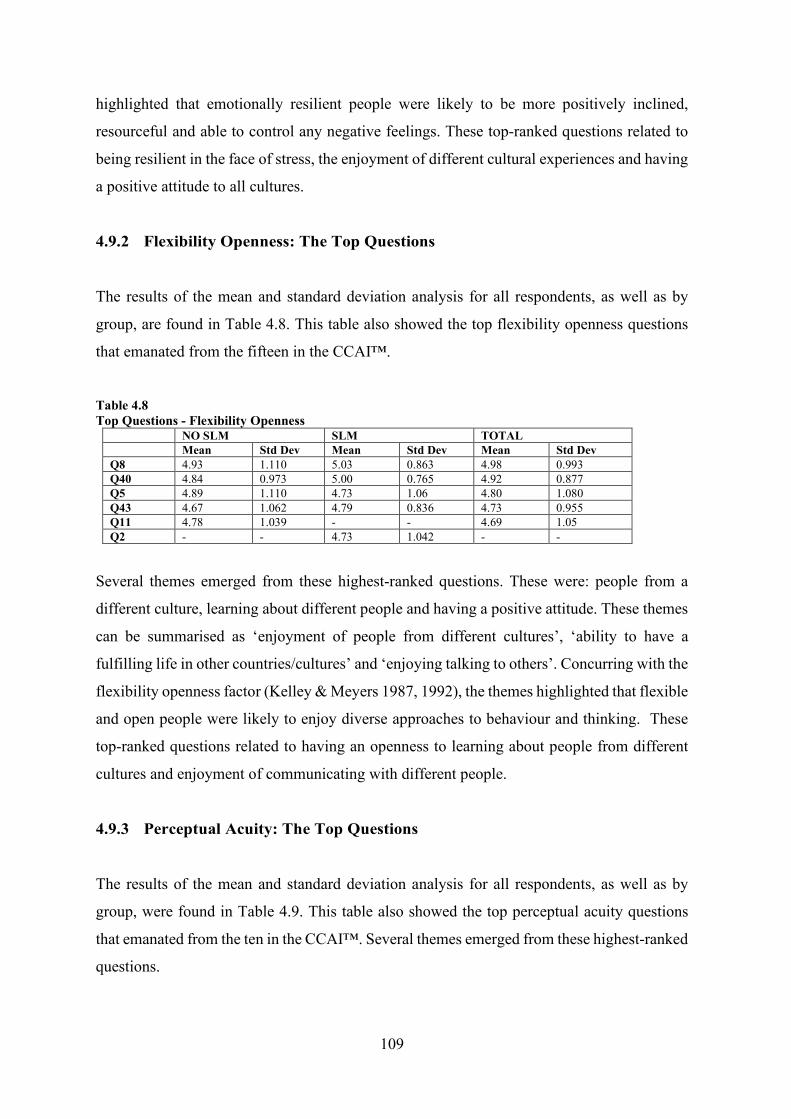
109
highlighted that emotionally resilient people were likely to be more positively inclined,
resourceful and able to control any negative feelings. These top-ranked questions related to
being resilient in the face of stress, the enjoyment of different cultural experiences and having
a positive attitude to all cultures.
4.9.2 Flexibility Openness: The Top Questions
The results of the mean and standard deviation analysis for all respondents, as well as by
group, are found in Table 4.8. This table also showed the top flexibility openness questions
that emanated from the fifteen in the CCAI™.
Table 4.8 Top Questions - Flexibility Openness
NO SLM SLM TOTAL Mean Std Dev Mean Std Dev Mean Std Dev Q8 4.93 1.110 5.03 0.863 4.98 0.993 Q40 4.84 0.973 5.00 0.765 4.92 0.877 Q5 4.89 1.110 4.73 1.06 4.80 1.080 Q43 4.67 1.062 4.79 0.836 4.73 0.955 Q11 4.78 1.039 - - 4.69 1.05 Q2 - - 4.73 1.042 - -
Several themes emerged from these highest-ranked questions. These were: people from a
different culture, learning about different people and having a positive attitude. These themes
can be summarised as ‘enjoyment of people from different cultures’, ‘ability to have a
fulfilling life in other countries/cultures’ and ‘enjoying talking to others’. Concurring with the
flexibility openness factor (Kelley & Meyers 1987, 1992), the themes highlighted that flexible
and open people were likely to enjoy diverse approaches to behaviour and thinking. These
top-ranked questions related to having an openness to learning about people from different
cultures and enjoyment of communicating with different people.
4.9.3 Perceptual Acuity: The Top Questions
The results of the mean and standard deviation analysis for all respondents, as well as by
group, were found in Table 4.9. This table also showed the top perceptual acuity questions
that emanated from the ten in the CCAI™. Several themes emerged from these highest-ranked
questions.
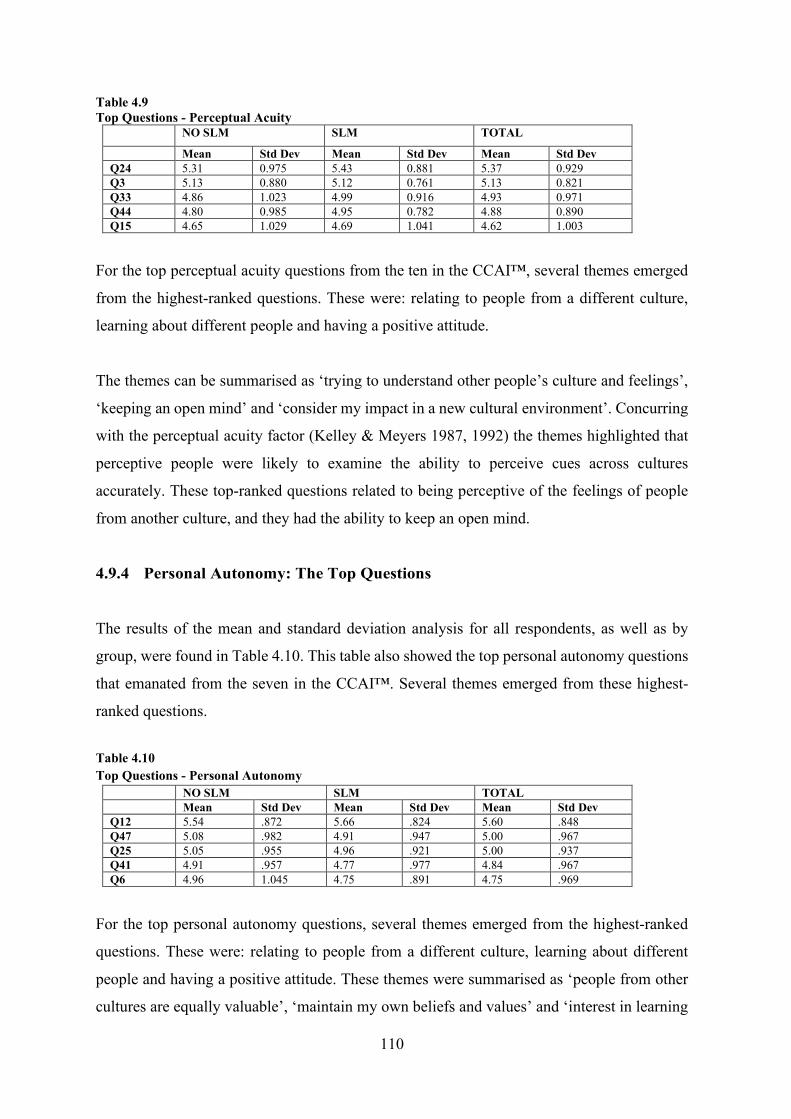
110
Table 4.9 Top Questions - Perceptual Acuity
NO SLM SLM TOTAL
Mean Std Dev Mean Std Dev Mean Std Dev Q24 5.31 0.975 5.43 0.881 5.37 0.929 Q3 5.13 0.880 5.12 0.761 5.13 0.821 Q33 4.86 1.023 4.99 0.916 4.93 0.971 Q44 4.80 0.985 4.95 0.782 4.88 0.890 Q15 4.65 1.029 4.69 1.041 4.62 1.003
For the top perceptual acuity questions from the ten in the CCAI™, several themes emerged
from the highest-ranked questions. These were: relating to people from a different culture,
learning about different people and having a positive attitude.
The themes can be summarised as ‘trying to understand other people’s culture and feelings’,
‘keeping an open mind’ and ‘consider my impact in a new cultural environment’. Concurring
with the perceptual acuity factor (Kelley & Meyers 1987, 1992) the themes highlighted that
perceptive people were likely to examine the ability to perceive cues across cultures
accurately. These top-ranked questions related to being perceptive of the feelings of people
from another culture, and they had the ability to keep an open mind.
4.9.4 Personal Autonomy: The Top Questions
The results of the mean and standard deviation analysis for all respondents, as well as by
group, were found in Table 4.10. This table also showed the top personal autonomy questions
that emanated from the seven in the CCAI™. Several themes emerged from these highest-
ranked questions.
Table 4.10 Top Questions - Personal Autonomy
NO SLM SLM TOTAL Mean Std Dev Mean Std Dev Mean Std Dev Q12 5.54 .872 5.66 .824 5.60 .848 Q47 5.08 .982 4.91 .947 5.00 .967 Q25 5.05 .955 4.96 .921 5.00 .937 Q41 4.91 .957 4.77 .977 4.84 .967 Q6 4.96 1.045 4.75 .891 4.75 .969
For the top personal autonomy questions, several themes emerged from the highest-ranked
questions. These were: relating to people from a different culture, learning about different
people and having a positive attitude. These themes were summarised as ‘people from other
cultures are equally valuable’, ‘maintain my own beliefs and values’ and ‘interest in learning
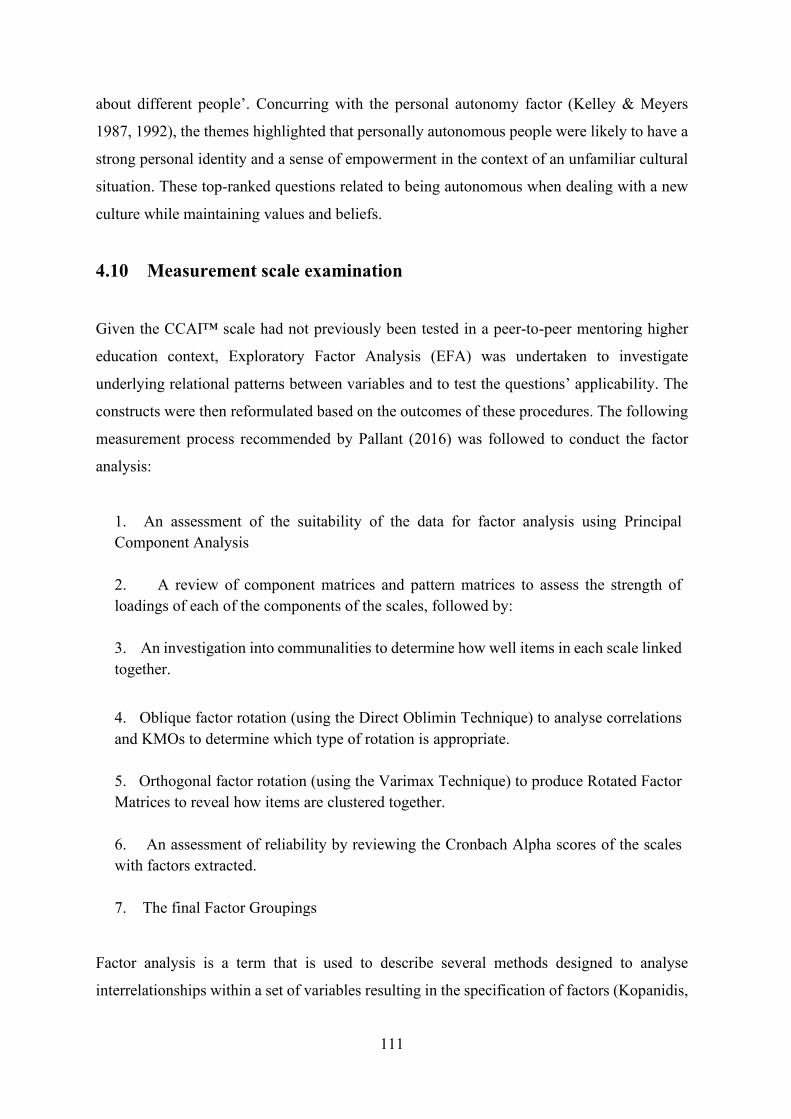
111
about different people’. Concurring with the personal autonomy factor (Kelley & Meyers
1987, 1992), the themes highlighted that personally autonomous people were likely to have a
strong personal identity and a sense of empowerment in the context of an unfamiliar cultural
situation. These top-ranked questions related to being autonomous when dealing with a new
culture while maintaining values and beliefs.
4.10 Measurement scale examination
Given the CCAI™ scale had not previously been tested in a peer-to-peer mentoring higher
education context, Exploratory Factor Analysis (EFA) was undertaken to investigate
underlying relational patterns between variables and to test the questions’ applicability. The
constructs were then reformulated based on the outcomes of these procedures. The following
measurement process recommended by Pallant (2016) was followed to conduct the factor
analysis:
1. An assessment of the suitability of the data for factor analysis using Principal Component Analysis
2. A review of component matrices and pattern matrices to assess the strength of loadings of each of the components of the scales, followed by: 3. An investigation into communalities to determine how well items in each scale linked together.
4. Oblique factor rotation (using the Direct Oblimin Technique) to analyse correlations and KMOs to determine which type of rotation is appropriate. 5. Orthogonal factor rotation (using the Varimax Technique) to produce Rotated Factor Matrices to reveal how items are clustered together. 6. An assessment of reliability by reviewing the Cronbach Alpha scores of the scales with factors extracted. 7. The final Factor Groupings
Factor analysis is a term that is used to describe several methods designed to analyse
interrelationships within a set of variables resulting in the specification of factors (Kopanidis,
112
2008). In multivariate statistics, EFA is a statistical method used to uncover the underlying
structure of a set of variables and explores data to provide the researcher with information
about “how many factors are needed to best represent the data” (Hair et al., 2006 p. 773). As
a methodology, EFA is commonly used by researchers when developing a scale and serves to
identify a set of latent constructs underlying an assortment of measured items.
4.10.1 Assessing the suitability of the data for Exploratory Factor Analysis (EFA)
EFA requires the researcher to make several important decisions about how to complete the
analysis because there is no one set approach. Researchers are faced with numerous decisions
when conducting factor analysis, and, in general, the literature provides inconsistent and
inconclusive information in terms of these decisions (Schmitt 2011). EFA was used as a tool
to provide operational definitions for descriptive statistics and to test the validity and
reliability of the proposed measurement instrument. The purpose of factor analytic techniques
is to “define the underlying structure of the variables, in order to define the underlying
structure among the variables in the analysis” (Hair et al., 2006, p104). The goal was to reduce
“the dimensionality of the original space and to give an interpretation to the new space,
spanned by a reduced number of new dimensions which are supposed to underlie the old ones”
(Rietveld & Van Hout, 1993, p. 254), or to explain the variance in the observed variables in
terms of underlying latent factors” (Having, 2003, p.2). Thus, factor analysis offered not only
the possibility of gaining a clear view of the data, but also the possibility of using the output
in subsequent analyses (Field, 2000: Rietveld & Van Hout, 1993).
The 50-item CCAI™ was examined to determine its underlying structure, assessing students’
cross-cultural adaptability. Final data was based on 214 students who answered all questions
(demographic and background questions as well as the CCAI™ questions) and identified
themselves as either not attending SLM or as attending SLM.
Before performing EFA, the suitability of the sample for factor analysis was assessed using
the Bartlett test of sphericity (Bartlett, 1954). If the observed significance was small (<0.05),
then the test provided evidence that the correlation matrix had no significant correlations
between all or most of the variables (Hair et al., 2006) The strength of inter-correlations
among the questions was reviewed to determine whether coefficients of greater than 0.3 could
be found as recommended by Tabachnick and Fiddell (2013). In this study, the correlation
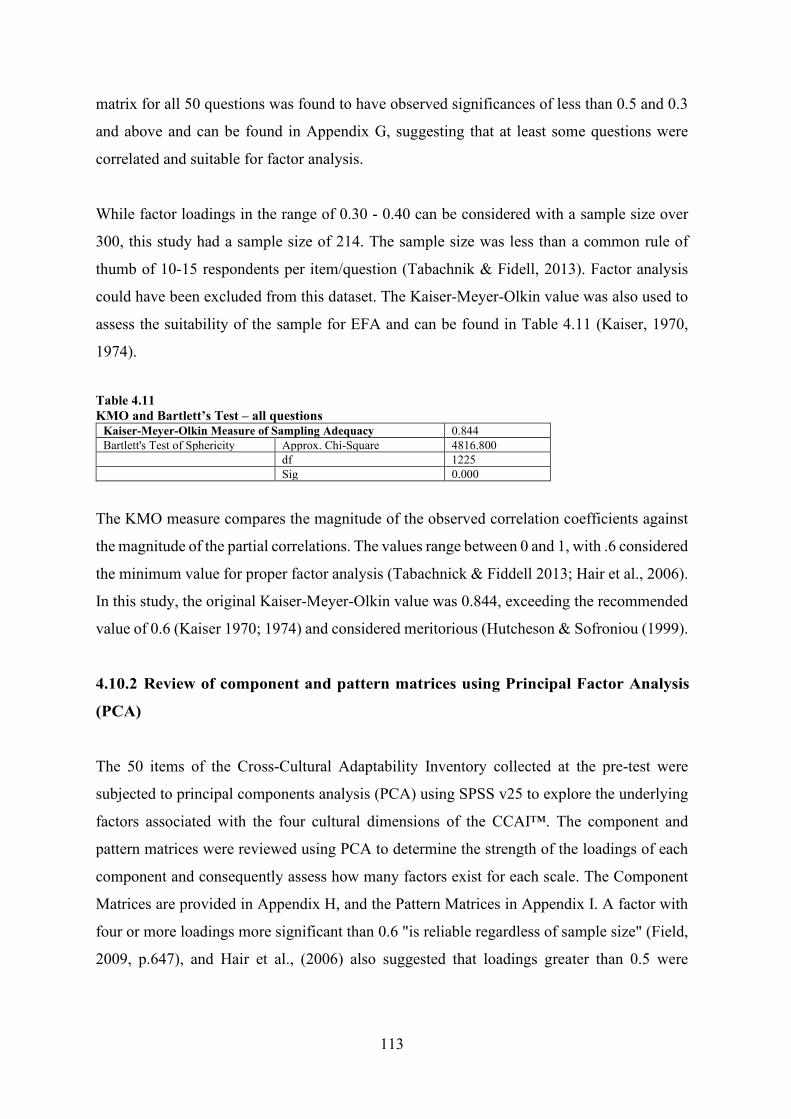
113
matrix for all 50 questions was found to have observed significances of less than 0.5 and 0.3
and above and can be found in Appendix G, suggesting that at least some questions were
correlated and suitable for factor analysis.
While factor loadings in the range of 0.30 - 0.40 can be considered with a sample size over
300, this study had a sample size of 214. The sample size was less than a common rule of
thumb of 10-15 respondents per item/question (Tabachnik & Fidell, 2013). Factor analysis
could have been excluded from this dataset. The Kaiser-Meyer-Olkin value was also used to
assess the suitability of the sample for EFA and can be found in Table 4.11 (Kaiser, 1970,
1974).
Table 4.11 KMO and Bartlett’s Test – all questions
Kaiser-Meyer-Olkin Measure of Sampling Adequacy 0.844 Bartlett's Test of Sphericity Approx. Chi-Square 4816.800 df 1225 Sig 0.000
The KMO measure compares the magnitude of the observed correlation coefficients against
the magnitude of the partial correlations. The values range between 0 and 1, with .6 considered
the minimum value for proper factor analysis (Tabachnick & Fiddell 2013; Hair et al., 2006).
In this study, the original Kaiser-Meyer-Olkin value was 0.844, exceeding the recommended
value of 0.6 (Kaiser 1970; 1974) and considered meritorious (Hutcheson & Sofroniou (1999).
4.10.2 Review of component and pattern matrices using Principal Factor Analysis
(PCA)
The 50 items of the Cross-Cultural Adaptability Inventory collected at the pre-test were
subjected to principal components analysis (PCA) using SPSS v25 to explore the underlying
factors associated with the four cultural dimensions of the CCAI™. The component and
pattern matrices were reviewed using PCA to determine the strength of the loadings of each
component and consequently assess how many factors exist for each scale. The Component
Matrices are provided in Appendix H, and the Pattern Matrices in Appendix I. A factor with
four or more loadings more significant than 0.6 "is reliable regardless of sample size" (Field,
2009, p.647), and Hair et al., (2006) also suggested that loadings greater than 0.5 were
114
practically significant. With these in mind, EFA was conducted, and component and pattern
matrices were analysed to ensure that these requirements were found in the final output.
4.10.3 Review of communalities - PCA
An investigation into communalities determined how well items in each scale linked together.
As Pallant (2016) describes, items of a value of < 0.3 may indicate that the item does not fit
well with others. In this first instance, the lowest communality value was 0.462 for question
11. Full details of the communalities can be found in Appendix J. It can be interpreted that all
items in the questionnaire fitted well together as the value was > 0.3.
4.10.4 Review of Total Variance
A decision was taken to apply a more stringent standard about the relationships between items
and consequently, SPSS v25 was programmed to display only loadings that were above 0.4.
PCA revealed the presence of 12 factors with eigenvalues exceeding 1, explaining 22.7,
8.2, 5.3, 4.7, 3.8, 3.4, 2.9, 2.8, 2.6, 2.4, 2.2, 1.1 of the variance respectively, a total of
63.38% the total variances can be found in Appendix K. An inspection of the Catell’s
scree plot in Appendix L, revealed a break after the fifth component. It was decided to
retain the five components for further analysis. This was further signified by the results
of Parallel Analysis (Watkins, 2000). The Parallel Analysis results were presented in
Appendix M. It showed six components with eigenvalues exceeding the corresponding
criterion values for a randomly generated data matrix of the same sample size of 214,
together with 50 variables (the same as the 50 questions from the CCAI) and 100 random
replications. Pairwise deletion of cases was then used with any missing values (Zhao and
Gallant, 2012).
4.10.5 Oblique factor rotation
Oblique factor rotation (using the Direct Oblimin Technique) was used to analyse correlations
and KMOs to determine which type of rotation was appropriate. When the analysis forced
five factors and eigenvalues over 0.5, there was still an adequate sample size based on
the KMO score of 0.844 found in Table 4.11 – a score higher than the recommended 0.6
and referred to as Meritorious (Hutcheson & Sofronious, 1999), and Bartlett's test of
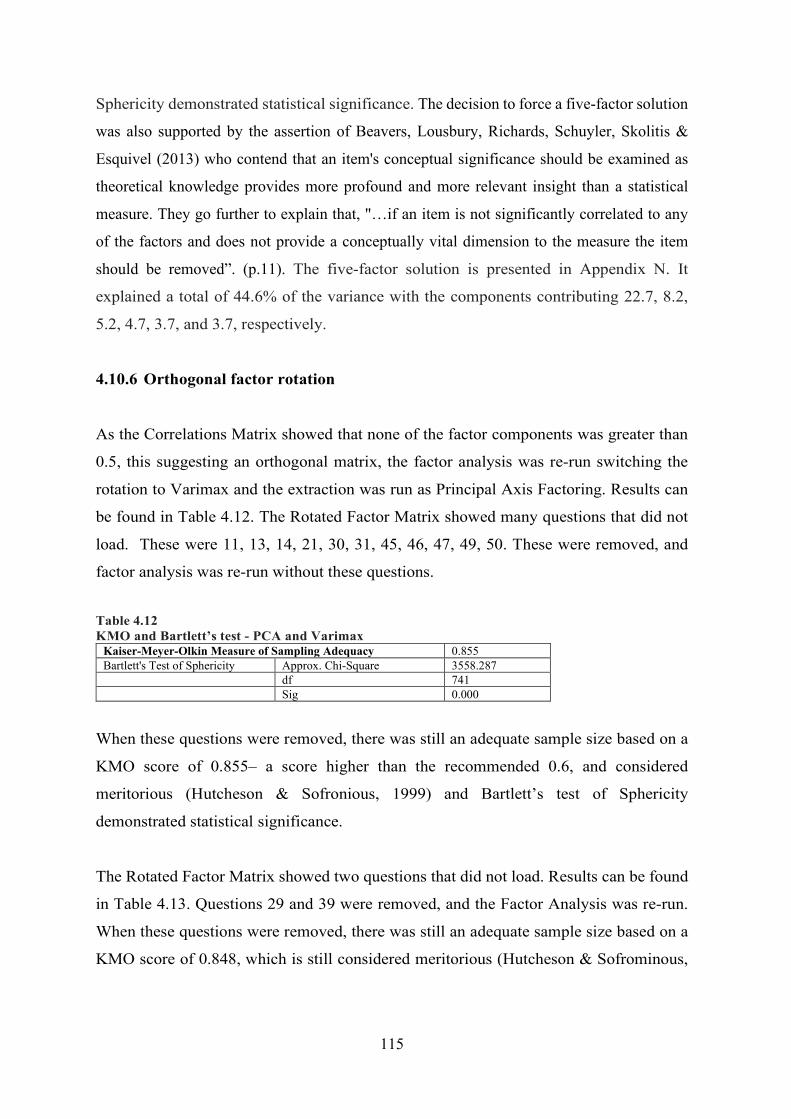
115
Sphericity demonstrated statistical significance. The decision to force a five-factor solution
was also supported by the assertion of Beavers, Lousbury, Richards, Schuyler, Skolitis &
Esquivel (2013) who contend that an item's conceptual significance should be examined as
theoretical knowledge provides more profound and more relevant insight than a statistical
measure. They go further to explain that, "…if an item is not significantly correlated to any
of the factors and does not provide a conceptually vital dimension to the measure the item
should be removed”. (p.11). The five-factor solution is presented in Appendix N. It
explained a total of 44.6% of the variance with the components contributing 22.7, 8.2,
5.2, 4.7, 3.7, and 3.7, respectively.
4.10.6 Orthogonal factor rotation
As the Correlations Matrix showed that none of the factor components was greater than
0.5, this suggesting an orthogonal matrix, the factor analysis was re-run switching the
rotation to Varimax and the extraction was run as Principal Axis Factoring. Results can
be found in Table 4.12. The Rotated Factor Matrix showed many questions that did not
load. These were 11, 13, 14, 21, 30, 31, 45, 46, 47, 49, 50. These were removed, and
factor analysis was re-run without these questions.
Table 4.12 KMO and Bartlett’s test - PCA and Varimax
Kaiser-Meyer-Olkin Measure of Sampling Adequacy 0.855 Bartlett's Test of Sphericity Approx. Chi-Square 3558.287 df 741 Sig 0.000
When these questions were removed, there was still an adequate sample size based on a
KMO score of 0.855– a score higher than the recommended 0.6, and considered
meritorious (Hutcheson & Sofronious, 1999) and Bartlett’s test of Sphericity
demonstrated statistical significance.
The Rotated Factor Matrix showed two questions that did not load. Results can be found
in Table 4.13. Questions 29 and 39 were removed, and the Factor Analysis was re-run.
When these questions were removed, there was still an adequate sample size based on a
KMO score of 0.848, which is still considered meritorious (Hutcheson & Sofrominous,
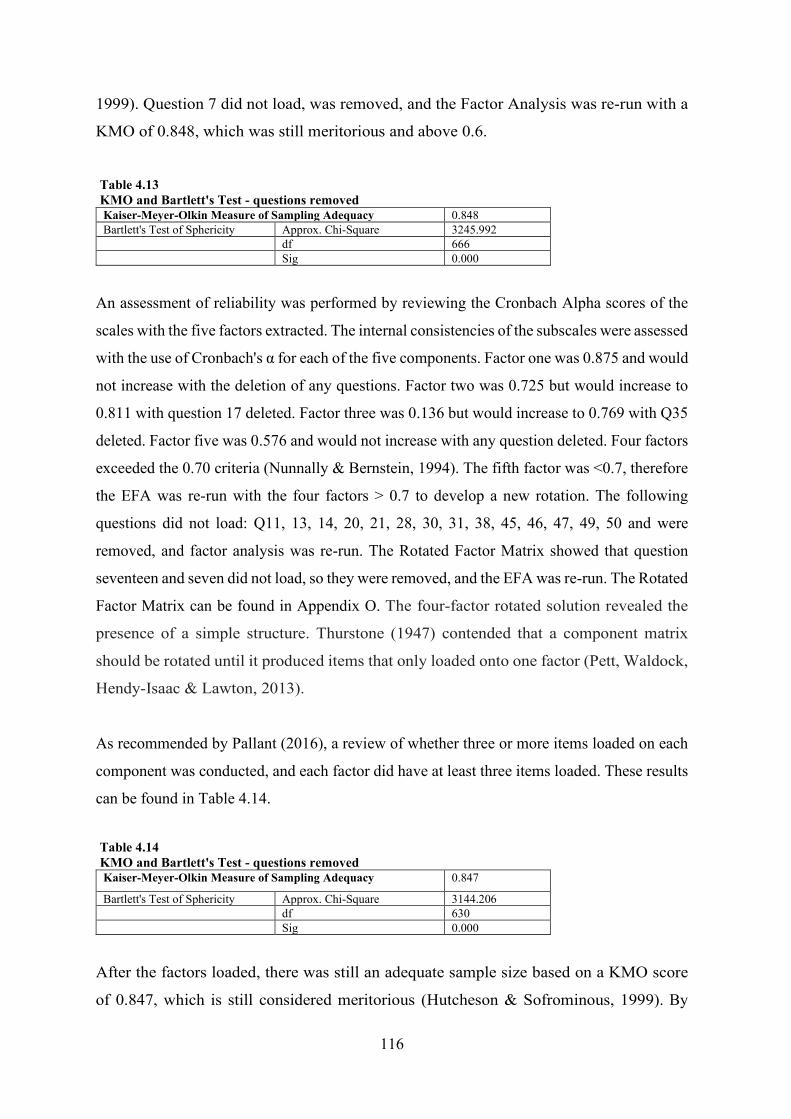
116
1999). Question 7 did not load, was removed, and the Factor Analysis was re-run with a
KMO of 0.848, which was still meritorious and above 0.6.
Table 4.13 KMO and Bartlett's Test - questions removed Kaiser-Meyer-Olkin Measure of Sampling Adequacy 0.848 Bartlett's Test of Sphericity Approx. Chi-Square 3245.992 df 666 Sig 0.000
An assessment of reliability was performed by reviewing the Cronbach Alpha scores of the
scales with the five factors extracted. The internal consistencies of the subscales were assessed
with the use of Cronbach's α for each of the five components. Factor one was 0.875 and would
not increase with the deletion of any questions. Factor two was 0.725 but would increase to
0.811 with question 17 deleted. Factor three was 0.136 but would increase to 0.769 with Q35
deleted. Factor five was 0.576 and would not increase with any question deleted. Four factors
exceeded the 0.70 criteria (Nunnally & Bernstein, 1994). The fifth factor was <0.7, therefore
the EFA was re-run with the four factors > 0.7 to develop a new rotation. The following
questions did not load: Q11, 13, 14, 20, 21, 28, 30, 31, 38, 45, 46, 47, 49, 50 and were
removed, and factor analysis was re-run. The Rotated Factor Matrix showed that question
seventeen and seven did not load, so they were removed, and the EFA was re-run. The Rotated
Factor Matrix can be found in Appendix O. The four-factor rotated solution revealed the
presence of a simple structure. Thurstone (1947) contended that a component matrix
should be rotated until it produced items that only loaded onto one factor (Pett, Waldock,
Hendy-Isaac & Lawton, 2013).
As recommended by Pallant (2016), a review of whether three or more items loaded on each
component was conducted, and each factor did have at least three items loaded. These results
can be found in Table 4.14.
Table 4.14 KMO and Bartlett's Test - questions removed Kaiser-Meyer-Olkin Measure of Sampling Adequacy 0.847
Bartlett's Test of Sphericity Approx. Chi-Square 3144.206 df 630 Sig 0.000
After the factors loaded, there was still an adequate sample size based on a KMO score
of 0.847, which is still considered meritorious (Hutcheson & Sofrominous, 1999). By
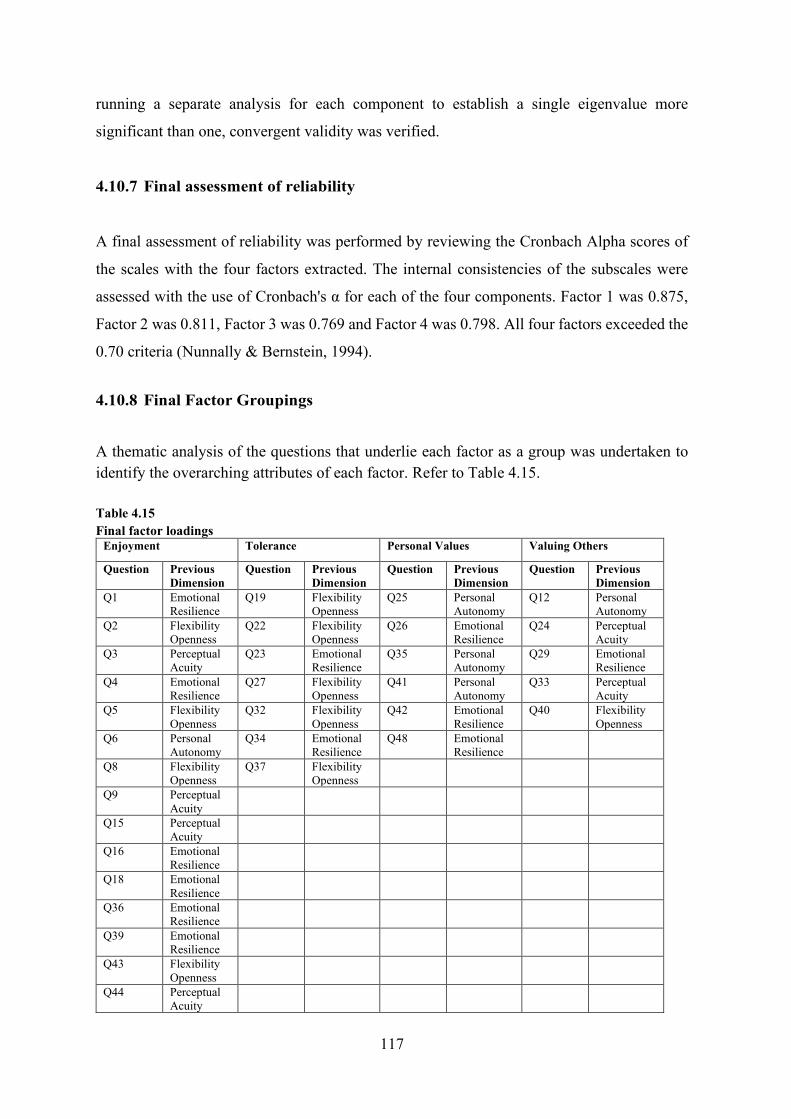
117
running a separate analysis for each component to establish a single eigenvalue more
significant than one, convergent validity was verified.
4.10.7 Final assessment of reliability
A final assessment of reliability was performed by reviewing the Cronbach Alpha scores of
the scales with the four factors extracted. The internal consistencies of the subscales were
assessed with the use of Cronbach's α for each of the four components. Factor 1 was 0.875,
Factor 2 was 0.811, Factor 3 was 0.769 and Factor 4 was 0.798. All four factors exceeded the
0.70 criteria (Nunnally & Bernstein, 1994).
4.10.8 Final Factor Groupings
A thematic analysis of the questions that underlie each factor as a group was undertaken to identify the overarching attributes of each factor. Refer to Table 4.15. Table 4.15 Final factor loadings
Enjoyment Tolerance Personal Values Valuing Others
Question Previous Dimension
Question Previous Dimension
Question Previous Dimension
Question Previous Dimension
Q1 Emotional Resilience
Q19 Flexibility Openness
Q25 Personal Autonomy
Q12 Personal Autonomy
Q2 Flexibility Openness
Q22 Flexibility Openness
Q26 Emotional Resilience
Q24 Perceptual Acuity
Q3 Perceptual Acuity
Q23 Emotional Resilience
Q35 Personal Autonomy
Q29 Emotional Resilience
Q4 Emotional Resilience
Q27 Flexibility Openness
Q41 Personal Autonomy
Q33 Perceptual Acuity
Q5 Flexibility Openness
Q32 Flexibility Openness
Q42 Emotional Resilience
Q40 Flexibility Openness
Q6 Personal Autonomy
Q34 Emotional Resilience
Q48 Emotional Resilience
Q8 Flexibility Openness
Q37 Flexibility Openness
Q9 Perceptual Acuity
Q15 Perceptual Acuity
Q16 Emotional Resilience
Q18 Emotional Resilience
Q36 Emotional Resilience
Q39 Emotional Resilience
Q43 Flexibility Openness
Q44 Perceptual Acuity
118
Factor one displayed themes of ‘ability to deal with stress’, ‘enjoyment of life and
communication’, ‘understanding different peoples’ thoughts and feelings’ and ‘confidence’.
A number of these themes were the same as the original emotional resilience factors relating
to ‘coping with stress’, ‘enjoying life in new cultures’ and ‘confidence’. This factor also
displayed themes similar to the original flexibility openness dimension of ‘enjoying talking
to others’ and ‘enjoyment’ relating to the final theme of ‘the ability to have a fulfilling life in
another country’. This factor is also related to the original themes in the perceptual acuity
dimension ‘understanding others’ culture and feelings’ like ‘understanding different peoples’
thoughts and feelings’, ‘keeping an open mind’ and ‘considering my impact in a new culture’,
together being related to ‘confidence’. Finally, this factor was related to the original personal
autonomy dimension was ‘interest in learning about different people’ and ‘people are equally
valuable’. Both related to ‘understanding different people’s thoughts and feelings’.
Consequently, factor one was termed ‘enjoyment’. This label is relevant to students in the
higher education system, who enjoyed their private and international experiences that were
essential to their cultural skills development.
The themes that arose from analysing factor two were ‘understanding myself’, ‘being tolerant
of new experiences and people’ and ‘having a positive attitude’. This factor was similar to
the original emotional resilience cultural dimension. ‘Enjoying new cultural experiences’
relates to ’being tolerant of new experiences’, perhaps with a different emphasis of
‘tolerance’. They do not relate to the other themes from emotional resilience. This factor was
dissimilar to the original flexibility openness cultural dimension as it was inwardly related to
the person, whereas the flexibility openness themes related to outward experiences of talking
and having a fulfilling life in other countries. This factor’s themes of ‘tolerance’ and ‘having
a positive attitude’ were similar to the original perceptual acuity themes of ‘keeping an open
mind’ and ‘trying to understand other peoples' culture and feelings’. Finally, this factor’s
theme of ‘people from another culture are equally valuable’ is related to the original theme of
‘having a positive attitude’ in the original personal autonomy cultural dimension. The theme
‘understanding myself’ relates to the ‘maintaining my own beliefs and values’ theme.
Accordingly, factor two was termed ‘tolerance’. This new name related to higher education
students being tolerant of international students with whom they work within cross-cultural
groups, and it related to living and studying in Melbourne, a multi-cultural city.
119
The themes of factor three were ‘maintaining personal values’, ‘trusting my ability’, and
‘making decisions from my attitudes’. Some of these themes were similar to the original
emotional resilience cultural dimension relating to ‘confidence in my own judgement’ but
were different from the remaining emotional resilience themes of ‘the ability to cope with
stress’, and ‘enjoyment of new cultural experiences’. This factor also had some similarity to
the original flexibility openness theme of being able to trust my ability’. This theme
influenced a person in being able to ‘make decisions from my attitudes’. This factor is also
related to the original themes in the perceptual acuity dimension, which related to the new
factor themes of ‘deciding from my attitudes’ and ‘trusting my ability’. They both reflected
the theme of ‘confidence in my judgement’. Finally, this factor is related to the original
personal autonomy dimension where the original cultural theme of ‘maintain my own beliefs
and values’ was similar to the new factor theme of ‘maintain my personal values.’.
Subsequently, factor three was termed ‘personal values’. This label was relevant in the context
of higher education as students are encouraged to maintain their value system as well as
conforming to behaviours expected in a multi-cultural university and society.
The themes of factor four are ‘people from other cultures are valuable’, ‘I consider my impact
on others’ and ‘learning about different people’. This factor had similarities with the original
cultural dimension of emotional resilience with relation to both the ‘enjoyment of new
experiences, cultures and people’ being related to the ‘learning from different people’
dimension in the new factor. Also, ‘confidence in my communication and judgement’ was
related to the new theme of ‘considering my impact on others’. This factor was also similar
to the theme of ‘enjoying talking with others’ from the original flexibility openness dimension
which can be related to ‘learning about different people’. This factor was also related to the
original themes from the perceptual acuity cultural dimension. ‘Trying to understand other
peoples' culture and feelings’ again resonates with ‘learning about different people’. The
theme of ‘keeping an open mind’ is related to the new factor theme of ‘people from other
cultures are valuable’, and the theme of ‘considering my impact in a new cultural
environment’ relates to the new factor theme of ‘considering my impact on others’. Finally,
the original personal autonomy theme ‘people from other cultures are equally valuable’ was
the same as that of the new factor ‘others are equally valuable’ and ‘interest in learning about
different people’ was also brought about by considering other people to be ‘equally valuable’.
120
Therefore, factor four was termed ‘valuing others’. This label was relevant to this study as
previous research found that opportunities for interaction between local and international
students needed to be expanded. Studies by Allport (1954) and Pettigrew and Tropp (2006)
found that if contact were increased then both local and international students who met and
communicated with diverse students, would increase their cross-cultural skills and tolerance
for people from another culture. For the rest of the analysis in this study, these factors were
created and were used.
4.10.9 The ETPV conceptual model
The relationships between the empirical concepts and their abstract counterparts in this study
are reflective. The four cultural dimensions are determined by the peer-to-peer mentoring
experience and then by the previous experiences of the 15 covariates in the study.
The covariates in this study are latent variables as these are inferred rather than being directly
observed. One common set of definitions of latent variables considers them as “hypothetical
variables.” For instance, Harman (1960, p. 12) refers to factors as “hypothetical constructs.”
Similarly, Nunnally (1978, p. 96) defines a construct as something that scientists put together
out of their imaginations (see also Bartlett 1937, p. 97)
Latent variables provide a degree of abstraction that permits us to describe relations among a
class of events or variables that share something in common, rather than making highly
concrete statements restricted to the relation between more specific, seemingly idiosyncratic
variables. In other words, latent variables permit us to generalize relationships (Bollen, 2002).
These are used in this study and show the influence that each of the covariates have on each
of the dependent variables.
Although both EFA and CFA are based on the common factor model, EFA is primarily a data-
driven approach which tries to uncover patterns by exploring the dataset (Child, 2006),
whereas CFA is theoretically grounded and attempts to confirm hypotheses (Yong & Pearce,
2013; Child, 2006; Suhr, 2006; Gerbing & Hamilton 1996). EFA is most appropriately used
when links between the observed variables and their underlying latent variables are unknown
or uncertain as was the case in this study. EFA is considered exploratory in the sense that the
researcher has no prior knowledge that the observed variables do indeed measure the intended
121
factors. Essentially, the researcher uses EFA to determine the number of factors influencing
variables and to analyse which variables ‘go together’ (DeCoster, 1998). In this study, the
goal was to find the smallest number of factors that would account for the correlations in the
CCAI™ (McDonald, 1985) and to interpret new dimensions which underlie the original ones
(Rietveld & Van Hout, 1993). Thus, through factor analysis a clear view of the data was
gained and there is the opportunity to use the output in future analyses (Field, 2000; Rietveld
& Van Hout, 1993). The EFA analysis was designed to measure particular constructs
underlying this proposed conceptual model.
In contrast, CFA is appropriately used when the researcher has some knowledge of the
underlying latent variable structure. Based on theory and/or empirical research, relations
between the observed measures and the underlying factors a priori are postulated then, this
hypothesized structure is statistically tested (Byrne, 2005; Suhr, 2006).
4.10.10 The Enjoyment, Tolerance, Personal Values and Valuing Others factors
The Enjoyment, Tolerance, Personal Values and Valuing Others (ETPV) factors emerged as
an outcome of analysing this cohort of students’ cross-cultural adaptability and formed the
basis of findings and discussion that were found in chapters five and six. The original
questions from the original cultural dimensions were re-configured as a result of the EFA.
4.10.10.1 Enjoyment scale
Of the eighteen questions from the Emotional Resilience cultural dimension that were used in
in the CCAI™, six of these formed the basis of the Enjoyment dimension in the proposed
conceptual model (ETPV). The analysis also suggested that they were represented in the
remaining three new cultural dimensions. Two were utilised in the tolerance dimension, three
in the personal values dimension and one in the valuing others dimension.
4.10.10.2 Tolerance scale
Of the fifteen questions from the Flexibility Openness cultural dimension that were used in
the CCAI™, five of these formed the basis of the Tolerance dimension in the proposed
122
conceptual model (ETPV). The analysis also suggested that three questions were represented
in the enjoyment dimension and one in the valuing others dimension.
4.10.10.3 Personal values scale
Of the ten questions from the Perceptual Acuity cultural dimension that were used in the
CCAI™, two of these formed the basis of the valuing others dimension in the proposed
conceptual model (ETPV). The analysis also suggested that four questions were represented
in the enjoyment dimension.
4.10.10.4 Valuing others scale
Of the seven questions from the Personal Autonomy cultural dimension that were used in the
CCAI™ one of these was represented in the valuing others dimension in the proposed
conceptual model (ETPV). The analysis also suggested that three questions were represented
in the personal values dimension and one in the enjoyment dimension.
4.11 Descriptive statistics for the adapted cultural dimensions of
enjoyment, tolerance, personal values and valuing others
Summary statistics for each of the adapted cultural dimensions and both groups of students
were provided in Table 4.16 and illustrated the means, standard deviations, standard error of
the means, skewness and kurtosis values for each of the cultural dimensions broken down by
total, and group. These descriptives provided information about the distribution of the
responses for the four cultural dimensions used in the analyses of variance in chapter five
Previous research found that when the skewness measure is greater than two, the variable is
asymmetrical about its mean. When the kurtosis was greater than or equal to three, then the
variable's distribution was significantly different from a normal distribution as it tended to
produce outliers (Westfall & Henning, 2013). As displayed in Table 4.16, some of the results
were either skewed or showed kurtosis. Skewness values provided information about
symmetry of the responses, but kurtosis shows the peakedness of the responses. If the
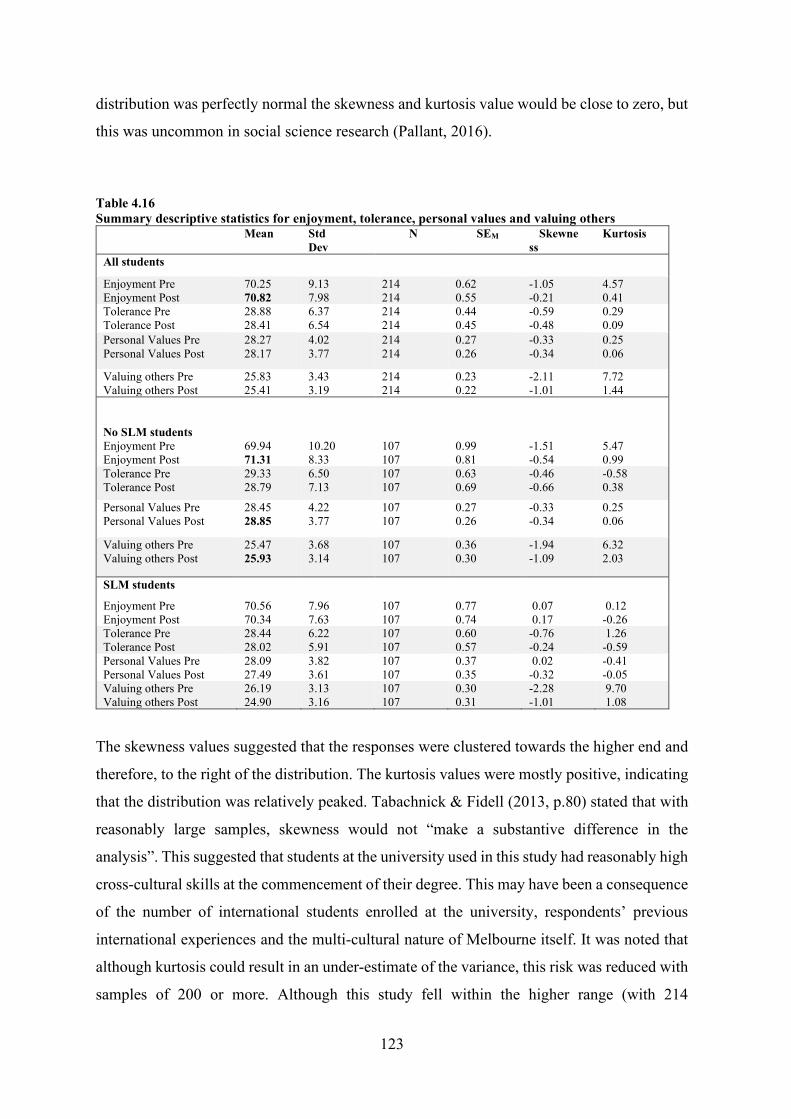
123
distribution was perfectly normal the skewness and kurtosis value would be close to zero, but
this was uncommon in social science research (Pallant, 2016).
Table 4.16 Summary descriptive statistics for enjoyment, tolerance, personal values and valuing others
Mean Std Dev
N SEM Skewness
Kurtosis
All students
Enjoyment Pre Enjoyment Post
70.25 70.82
9.13 7.98
214 214
0.62 0.55
-1.05 -0.21
4.57 0.41
Tolerance Pre Tolerance Post
28.88 28.41
6.37 6.54
214 214
0.44 0.45
-0.59 -0.48
0.29 0.09
Personal Values Pre Personal Values Post
28.27 28.17
4.02 3.77
214 214
0.27 0.26
-0.33 -0.34
0.25 0.06
Valuing others Pre Valuing others Post
25.83 25.41
3.43 3.19
214 214
0.23 0.22
-2.11 -1.01
7.72 1.44
No SLM students Enjoyment Pre Enjoyment Post
69.94 71.31
10.20 8.33
107 107
0.99 0.81
-1.51 -0.54
5.47 0.99
Tolerance Pre Tolerance Post
29.33 28.79
6.50 7.13
107 107
0.63 0.69
-0.46 -0.66
-0.58 0.38
Personal Values Pre Personal Values Post
28.45 28.85
4.22 3.77
107 107
0.27 0.26
-0.33 -0.34
0.25 0.06
Valuing others Pre Valuing others Post
25.47 25.93
3.68 3.14
107 107
0.36 0.30
-1.94 -1.09
6.32 2.03
SLM students
Enjoyment Pre Enjoyment Post
70.56 70.34
7.96 7.63
107 107
0.77 0.74
0.07 0.17
0.12 -0.26
Tolerance Pre Tolerance Post
28.44 28.02
6.22 5.91
107 107
0.60 0.57
-0.76 -0.24
1.26 -0.59
Personal Values Pre Personal Values Post
28.09 27.49
3.82 3.61
107 107
0.37 0.35
0.02 -0.32
-0.41 -0.05
Valuing others Pre Valuing others Post
26.19 24.90
3.13 3.16
107 107
0.30 0.31
-2.28 -1.01
9.70 1.08
The skewness values suggested that the responses were clustered towards the higher end and
therefore, to the right of the distribution. The kurtosis values were mostly positive, indicating
that the distribution was relatively peaked. Tabachnick & Fidell (2013, p.80) stated that with
reasonably large samples, skewness would not “make a substantive difference in the
analysis”. This suggested that students at the university used in this study had reasonably high
cross-cultural skills at the commencement of their degree. This may have been a consequence
of the number of international students enrolled at the university, respondents’ previous
international experiences and the multi-cultural nature of Melbourne itself. It was noted that
although kurtosis could result in an under-estimate of the variance, this risk was reduced with
samples of 200 or more. Although this study fell within the higher range (with 214
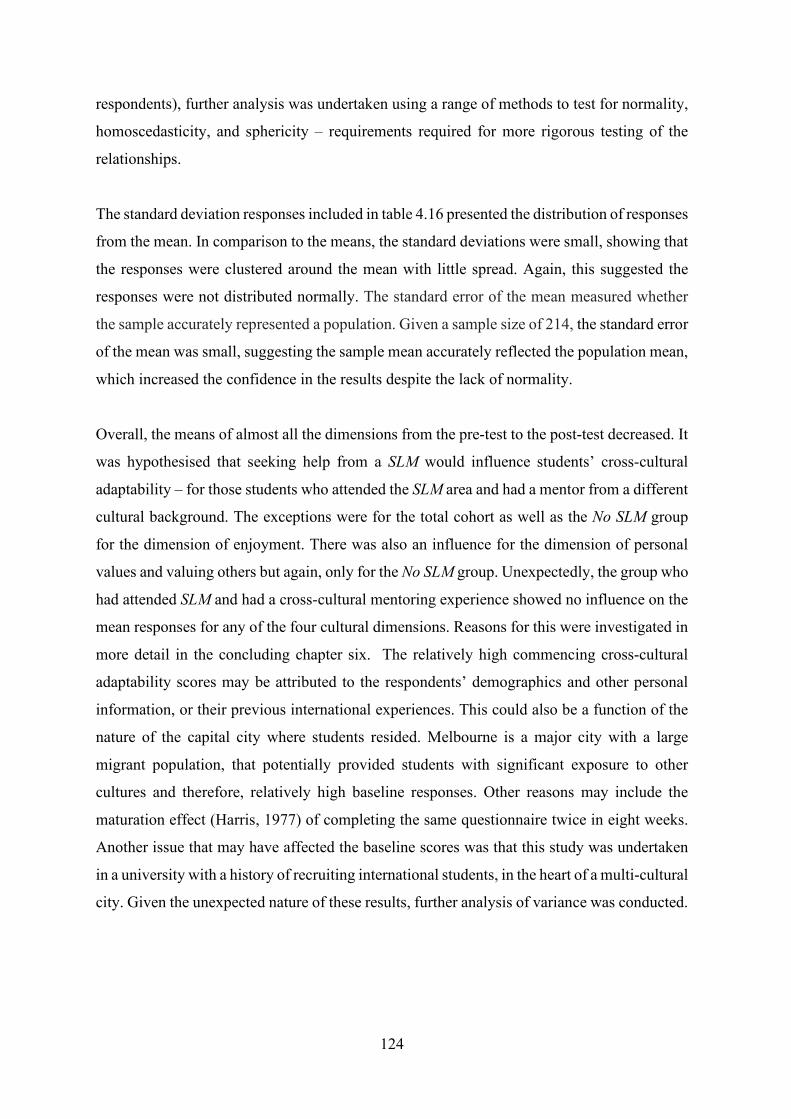
124
respondents), further analysis was undertaken using a range of methods to test for normality,
homoscedasticity, and sphericity – requirements required for more rigorous testing of the
relationships.
The standard deviation responses included in table 4.16 presented the distribution of responses
from the mean. In comparison to the means, the standard deviations were small, showing that
the responses were clustered around the mean with little spread. Again, this suggested the
responses were not distributed normally. The standard error of the mean measured whether
the sample accurately represented a population. Given a sample size of 214, the standard error
of the mean was small, suggesting the sample mean accurately reflected the population mean,
which increased the confidence in the results despite the lack of normality.
Overall, the means of almost all the dimensions from the pre-test to the post-test decreased. It
was hypothesised that seeking help from a SLM would influence students’ cross-cultural
adaptability – for those students who attended the SLM area and had a mentor from a different
cultural background. The exceptions were for the total cohort as well as the No SLM group
for the dimension of enjoyment. There was also an influence for the dimension of personal
values and valuing others but again, only for the No SLM group. Unexpectedly, the group who
had attended SLM and had a cross-cultural mentoring experience showed no influence on the
mean responses for any of the four cultural dimensions. Reasons for this were investigated in
more detail in the concluding chapter six. The relatively high commencing cross-cultural
adaptability scores may be attributed to the respondents’ demographics and other personal
information, or their previous international experiences. This could also be a function of the
nature of the capital city where students resided. Melbourne is a major city with a large
migrant population, that potentially provided students with significant exposure to other
cultures and therefore, relatively high baseline responses. Other reasons may include the
maturation effect (Harris, 1977) of completing the same questionnaire twice in eight weeks.
Another issue that may have affected the baseline scores was that this study was undertaken
in a university with a history of recruiting international students, in the heart of a multi-cultural
city. Given the unexpected nature of these results, further analysis of variance was conducted.
125
4.12 Descriptive statistics for the fifteen covariates
Summary statistics for each of the covariates for all students and then for each separate group
(NoSLM and SLM) were provided in Table 4.17, and illustrated the means, standard
deviations, standard error of the means, skewness and kurtosis values. These provided
information about the distribution of the responses for the covariates used in the analyses of
covariance. Also displayed in Table 4.17, some of the results were either skewed or showed
kurtosis. Many of the skewness values suggested that the responses are clustered towards the
higher end, and many of the kurtosis values were positive, which indicated that the distribution
was relatively peaked. Tabachnick & Fidell (2013, p.80) state that with reasonably large
samples (over 200) skewness will not “make a substantive difference in the analysis”. This
suggests that many students at the university had friends or family from other cultures, had
participated in exchange, study tours or foreign internships, had taken private international
holidays and had studied a foreign language at university. These experiences had been taken
by students in both the NoSLM and SLM groups.
Table 4.17 Summary descriptive statistics for all covariates
Mean Std Dev
N SEM Skewness Kurtosis
All students
Age Ethnicity Mothers’ Ed Fathers’ Ed Hours socialise Friends/Family Private Hols Lang school Exchange Study Tour Foreign Intern Internat Content C/C groups Lang Uni
1.80 1.41 3.15 3.18 2.05 1.08 1.19 1.38 1.06 1.10 1.07 1.38 1.03 1.11
0.56 0.49 1.21 1.36 0.94 0.27 0.39 0.49 0.23 0.29 0.26 0.49 0.18 0.31
214 214 214 214 214 214 214 214 214 214 214 214 214 214 214
0.039 0.034 0.083 0.093 0.064 0.019 0.027 0.033 0.016 0.020 0.017 0.033 0.012 0.021
0.145 0.361 0.191 -0.142 0.613 3.110 1.567 0.481 3.859 2.702 3.368 0.481 5.254 2.535
0.559 -1.870 -1.269 -1.139 -0.504 7.675 0.457 -1.769 12.893 5.299 9.342 -1.769 25.605 4.425
NoSLM
Age Gender Ethnicity Mothers’ Ed Fathers’ Ed Hours socialise Friends/Family Private Hols Lang school
1.86 1.49 1.31 3.06 3.11 2.24 1.09 1.14 1.48
0.57 0.50 0.46 1.25 1.34 0.97 0.29 0.35 0.50
107 107 107 107 107 107 107 107 107
0.055 0.049 0.045 0.120 0.130 0.094 0.028 0.034 0.049
0.300 0.019 0.830 0.288 -0.111 0.372 2.793 2.073 0.094
1.234 -2.000 -1.312 -1.192 -1.098 -0.808 5.803 2.296 -1.991
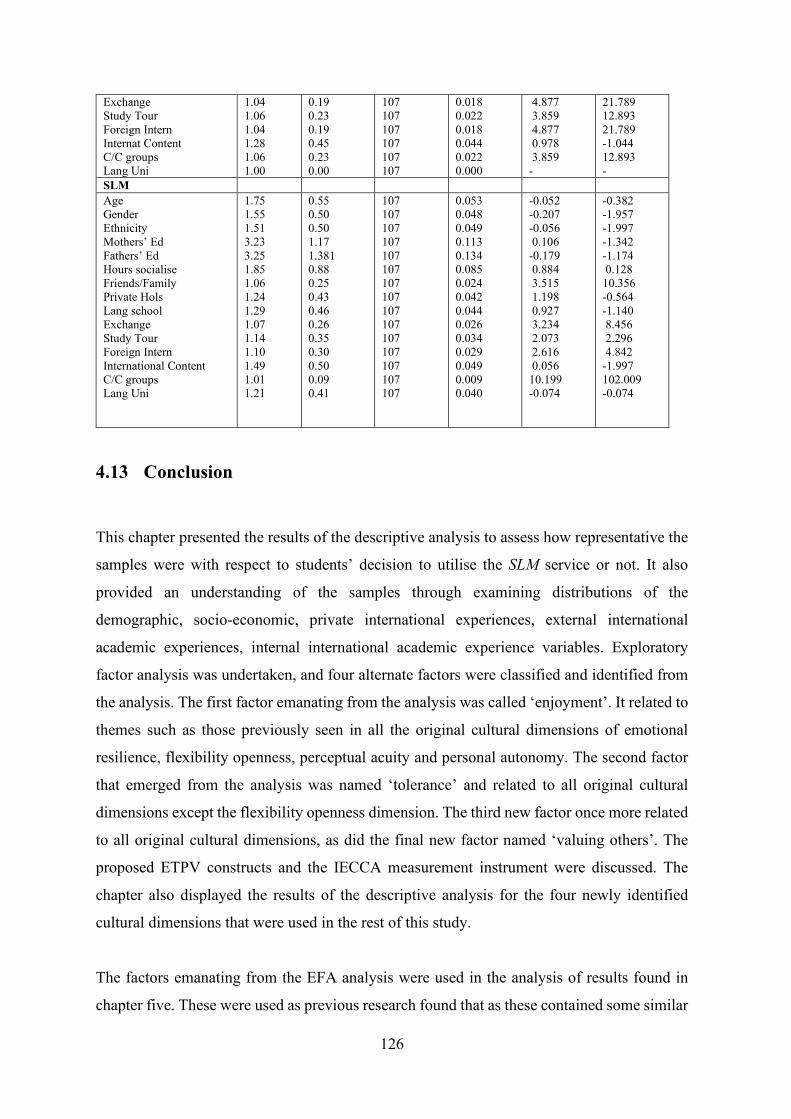
126
Exchange Study Tour Foreign Intern Internat Content C/C groups Lang Uni
1.04 1.06 1.04 1.28 1.06 1.00
0.19 0.23 0.19 0.45 0.23 0.00
107 107 107 107 107 107
0.018 0.022 0.018 0.044 0.022 0.000
4.877 3.859 4.877 0.978 3.859 -
21.789 12.893 21.789 -1.044 12.893 -
SLM Age Gender Ethnicity Mothers’ Ed Fathers’ Ed Hours socialise Friends/Family Private Hols Lang school Exchange Study Tour Foreign Intern International Content C/C groups Lang Uni
1.75 1.55 1.51 3.23 3.25 1.85 1.06 1.24 1.29 1.07 1.14 1.10 1.49 1.01 1.21
0.55 0.50 0.50 1.17 1.381 0.88 0.25 0.43 0.46 0.26 0.35 0.30 0.50 0.09 0.41
107 107 107 107 107 107 107 107 107 107 107 107 107 107 107
0.053 0.048 0.049 0.113 0.134 0.085 0.024 0.042 0.044 0.026 0.034 0.029 0.049 0.009 0.040
-0.052 -0.207 -0.056 0.106 -0.179 0.884 3.515 1.198 0.927 3.234 2.073 2.616 0.056 10.199 -0.074
-0.382 -1.957 -1.997 -1.342 -1.174 0.128 10.356 -0.564 -1.140 8.456 2.296 4.842 -1.997 102.009 -0.074
4.13 Conclusion
This chapter presented the results of the descriptive analysis to assess how representative the
samples were with respect to students’ decision to utilise the SLM service or not. It also
provided an understanding of the samples through examining distributions of the
demographic, socio-economic, private international experiences, external international
academic experiences, internal international academic experience variables. Exploratory
factor analysis was undertaken, and four alternate factors were classified and identified from
the analysis. The first factor emanating from the analysis was called ‘enjoyment’. It related to
themes such as those previously seen in all the original cultural dimensions of emotional
resilience, flexibility openness, perceptual acuity and personal autonomy. The second factor
that emerged from the analysis was named ‘tolerance’ and related to all original cultural
dimensions except the flexibility openness dimension. The third new factor once more related
to all original cultural dimensions, as did the final new factor named ‘valuing others’. The
proposed ETPV constructs and the IECCA measurement instrument were discussed. The
chapter also displayed the results of the descriptive analysis for the four newly identified
cultural dimensions that were used in the rest of this study.
The factors emanating from the EFA analysis were used in the analysis of results found in
chapter five. These were used as previous research found that as these contained some similar
127
measures that were related to some of the original cultural dimensions, “it may be a good idea
to use the scores on the different factors instead of the scores on the original variables”
(Rietveld & Van Hout, p.2).
128
Chapter 5
ANALYSIS OF RESULTS
5.1 Introduction
Chapter four assessed how representative the samples were with respect to students’ cross-
cultural adaptability both before and after the EFA was conducted. The descriptives provided
an understanding of a typical respondent by examining distributions of the socio-economic
and previous international experiences, as well as their cross-cultural adaptability before and
after the peer-to-peer mentoring experience. The properties of the CCAI™ were also tested,
and a new conceptual model was proposed to test significant pathways amongst the emerging
constructs of enjoyment, tolerance, personal values and valuing others. Based on the findings
of this study, the ETPV model is predicated on several key assumptions:
• that students’ cross-cultural adaptability is a function of their cross-cultural
experiences
• that underlying characteristics of students are of significance in influencing their
cross-cultural adaptability
• that the ETPV model will account for the variability in the cross-cultural adaptability
in higher education students
This chapter presented the findings related to the research questions central to the focus of
this quasi-experimental study It assessed whether cross-cultural peer-to-peer mentoring
influenced the cross-cultural adaptability of the participants. The analysis was also undertaken
to determine whether demographics, socio-economic factors, socialising, previous private
international experiences, external international academic experiences or internal
international academic experiences may have influenced the respondents’ cross-cultural
adaptability as defined by Kelley and Meyers (1987, 1992). This chapter also introduced and
129
discussed the application of the ETPV model as an analytical tool and tested the six sets of
proposed hypotheses. The chapter presented detailed results to address the following two
research questions:
RQ1: Did exposure to a cross-cultural peer-to-peer mentoring experience at SLM influence
student’s cross-cultural adaptability and are these changes significant?
RQ2: Did a student’s demographics, socio-economic factors, socialising or previous
international experiences influence their cross-cultural adaptability? Do these factors
influence respondents from the NoSLM group differently from the SLM group?
5.2 Research question one - Peer-to-peer mentoring influence
Based on the constructs identified in the literature review (see chapter two), the four general
hypotheses proposed for research question one were restated as:
H1: Having a cross-cultural experience with a SLM will have a significant influence on
students’ cross-cultural adaptability overall as measured by the dimensions
developed as a result of exploratory factor analysis (EFA) of enjoyment, tolerance,
personal values or valuing others relative to students who did not seek help from a
SLM.
H1a: Having a cross-cultural experience with a SLM will have a significant influence on
students’ cross-cultural adaptability for the dimension of enjoyment, relative to
students who did not seek help from a SLM.
H1b: Having a cross-cultural experience with a SLM will have a significant influence on
students’ cross-cultural adaptability for the dimension of tolerance, relative to
students who did not seek help from a SLM.
H1c: Having a cross-cultural experience with a SLM will have a significant influence on
students’ cross-cultural adaptability for the dimension of personal values, relative to
students who did not seek help from a SLM.
H1d: Having a cross-cultural experience with a SLM will have a significant influence on
students’ cross-cultural adaptability for the dimension of valuing others, relative to
students who did not seek help from a SLM.
130
5.3 Assumption testing for analysis of variance using ANOVA
Following the grouping of the respondents into either not using the SLM service or using the
SLM service, analysis of variance with between and within-subjects’ factors was conducted
to evaluate each group’s cross-cultural dimensions for any changes from the pre-test to the
post-test. Prior to the analysis of variance of between and within-subjects’ factors, the
requirements of sample size, normality, homoscedasticity, outliers, sphericity,
multicollinearity, singularity, linearity and homogeneity of variance-covariance matrices
were assessed. Homogeneity of regression slopes was not required as this study does not
perform a step-down analysis (Pallant, 2016).
5.3.1 Sample size
Analysis of variance requires more cases in each cell than there are dependent variables as an
absolute minimum (Pallant, 2016). If the sample size is considered sufficiently large, some
violations of some of these requirements are allowed, e.g. normality. In this study, there were
a total of 214 cases, with an equal split between the two groups being 107 per group, so this
requirement was upheld.
5.3.2 Normality using Q-Q scatter plots
Normality was evaluated using Q-Q scatterplots (Bates, Mächler, Bolker, & Walker, 2014;
DeCarlo, 1997; Field, 2013). The Q-Q scatterplot compared the distribution of the residuals
with a normal distribution (a distribution which follows a bell curve). In the Q-Q scatterplot,
the line represented the theoretical quantiles of a normal distribution. Normality was assumed
if the points formed a ‘relatively’ straight line. The Q-Q scatterplots can be found in Appendix
P. The solid line in each figure was the normal line, and the scatter plots were not far from
this line, therefore, suggesting that the residuals were approximating a normal distribution.
5.3.2.1 Shapiro Wilk tests of normality
In addition to the Q-Q scatter plots, Shapiro Wilk tests were conducted as a robustness check
to determine whether the distributions of enjoyment, tolerance, personal values or valuing
131
others in either the pre- or post-test were significantly different from a normal distribution.
Appendix Q shows the results of Shapiro-Wilk tests for the total cohort as well as each group,
NoSLM or SLM. A Shapiro-Wilk test was conducted to determine whether differences could
have been produced by a normal distribution (Razali & Wah, 2011).
Overall, the Shapiro Wilk results suggested that in most cases, the distribution of the
dimensions suggested non-normality. The exceptions were enjoyment (post) for the total
cohort and the SLM group along with enjoyment (pre-) and personal values (pre- and post)
for the SLM group. However, according to the Central Limit Theorem (CLT), the mean of
any random variable will be approximately normally distributed as the sample size increases.
Therefore, with a sufficiently large sample size (n > 50), deviations from normality would
have had little effect on the results (Stevens, 2009). Given the size of the sample for the total
cohort in this study (n=214) and each group (n=107), the results would not affect the next
stage of the testing, and this requirement was, therefore, upheld.
5.3.3 Homoscedasticity
Homoscedasticity was evaluated by plotting the residuals against the predicted values (Bates
et al., 2014; Field, 2013; Osborne & Walters, 2002). The requirement of homoscedasticity
was met if the points appeared randomly distributed with a mean of zero and no apparent
curvature. The scatterplots (see Appendix R), were used to explore the relationship between
the pre- and post-responses for each dimension when controlling for the differences in the
groups (Pallant, 2016). These scatterplots indicated whether variables were related in a linear
or curvilinear fashion as only linear relationships were suitable for correlation analyses. They
also indicated whether the variables were positively related (high score on one is associated
with high responses on another). The scatterplots showed that the dependent variables did not
violate the homoscedasticity requirement necessary for the variance/covariance analysis used
in this study.
In addition, the Levene’s test for equality of variance, which can be found in Table 5.1, was
conducted for each of the dependent variables for each group to assess whether the
homogeneity of variance requirement is met (Levene, 1960). The homogeneity of variance
requirement requires that the variance of the dependent variable is approximately equal in
each group.
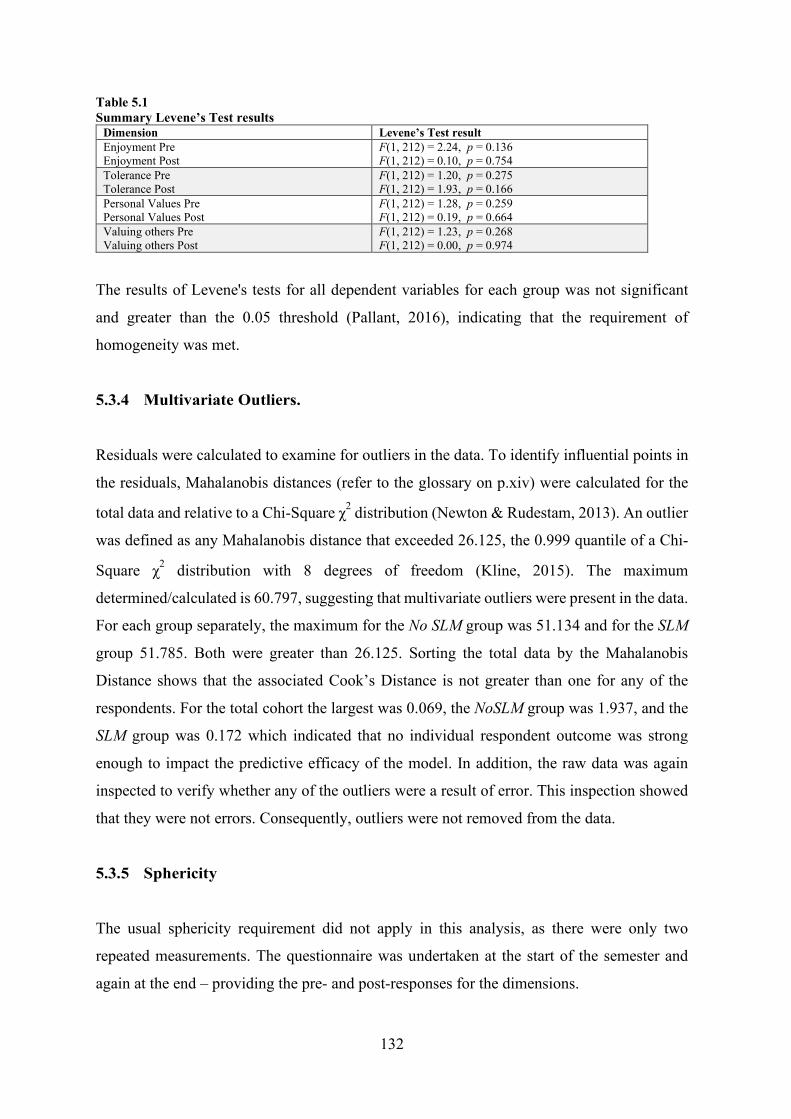
132
Table 5.1 Summary Levene’s Test results
Dimension Levene’s Test result Enjoyment Pre Enjoyment Post
F(1, 212) = 2.24, p = 0.136 F(1, 212) = 0.10, p = 0.754
Tolerance Pre Tolerance Post
F(1, 212) = 1.20, p = 0.275 F(1, 212) = 1.93, p = 0.166
Personal Values Pre Personal Values Post
F(1, 212) = 1.28, p = 0.259 F(1, 212) = 0.19, p = 0.664
Valuing others Pre Valuing others Post
F(1, 212) = 1.23, p = 0.268 F(1, 212) = 0.00, p = 0.974
The results of Levene's tests for all dependent variables for each group was not significant
and greater than the 0.05 threshold (Pallant, 2016), indicating that the requirement of
homogeneity was met.
5.3.4 Multivariate Outliers.
Residuals were calculated to examine for outliers in the data. To identify influential points in
the residuals, Mahalanobis distances (refer to the glossary on p.xiv) were calculated for the
total data and relative to a Chi-Square χ2 distribution (Newton & Rudestam, 2013). An outlier
was defined as any Mahalanobis distance that exceeded 26.125, the 0.999 quantile of a Chi-
Square χ2 distribution with 8 degrees of freedom (Kline, 2015). The maximum
determined/calculated is 60.797, suggesting that multivariate outliers were present in the data.
For each group separately, the maximum for the No SLM group was 51.134 and for the SLM
group 51.785. Both were greater than 26.125. Sorting the total data by the Mahalanobis
Distance shows that the associated Cook’s Distance is not greater than one for any of the
respondents. For the total cohort the largest was 0.069, the NoSLM group was 1.937, and the
SLM group was 0.172 which indicated that no individual respondent outcome was strong
enough to impact the predictive efficacy of the model. In addition, the raw data was again
inspected to verify whether any of the outliers were a result of error. This inspection showed
that they were not errors. Consequently, outliers were not removed from the data.
5.3.5 Sphericity
The usual sphericity requirement did not apply in this analysis, as there were only two
repeated measurements. The questionnaire was undertaken at the start of the semester and
again at the end – providing the pre- and post-responses for the dimensions.
133
5.3.6 Multicollinearity and singularity
Analysis of variance or covariance worked best when the dependent variables were
moderately correlated; therefore, a Spearman’s rho correlation analysis was conducted among
the pre- and post-test responses for each cultural dimension and each group. Given univariate
outliers in Enjoyment and Valuing others (pre- and post), Tolerance (pre-), and Personal
Values, (pre-) a Spearman’s rho test was chosen rather than Pearson’s correlations as it was
unaffected by outliers. The correlation coefficients were between 0.17 and 0.62, indicating
some combinations were a small effect, and other combinations were a large effect size for
each group (Cohen, 1988) and for each combination for each group (see Appendix S). These
correlations indicated that as each of the pre-test responses increased, the relative post-test
score also tended to increase. Cohen's (1988) standard was applied to evaluate the strength of
the relationships between the pre- and post-test responses, where coefficients between 0.10
and 0.29 represented a small effect size; coefficients between 0.30 and 0.49 represented a
moderate effect size, and coefficients above 0.50 indicated a large effect size. As r = <0.9 for
all combinations, multicollinearity did not exist (Pallant, 2016). A Spearman correlation
required that the relationship between each pair of variables did not change direction and were
thus monotonic (Conover & Iman, 1981).
The correlations were further examined using Holm corrections to adjust for multiple
comparisons based on an alpha value of 0.05. For the NoSLM group, significant positive
correlations were observed for all combinations of the pre- and post-test except for the
combination of valuing others (pre-) and personal values (post). Apart from this pair,
correlations indicated that there were significant correlations for the NoSLM group responses
for the pre- and post-tests. For the SLM group, significant positive correlations were observed
for all combinations of pre- and post except for the combination of valuing others (pre-) and
tolerance (post). The results confirmed the overall positive correlations of the dependent
variables. Therefore, this requirement was upheld. Singularity, another requirement of
analysis of variance/covariance, was also not permitted. It occurred when one dependent
variable was a combination of other independent variables. This was not the case in this study
as each dependent variable was a standalone variable (Pallant, 2016).
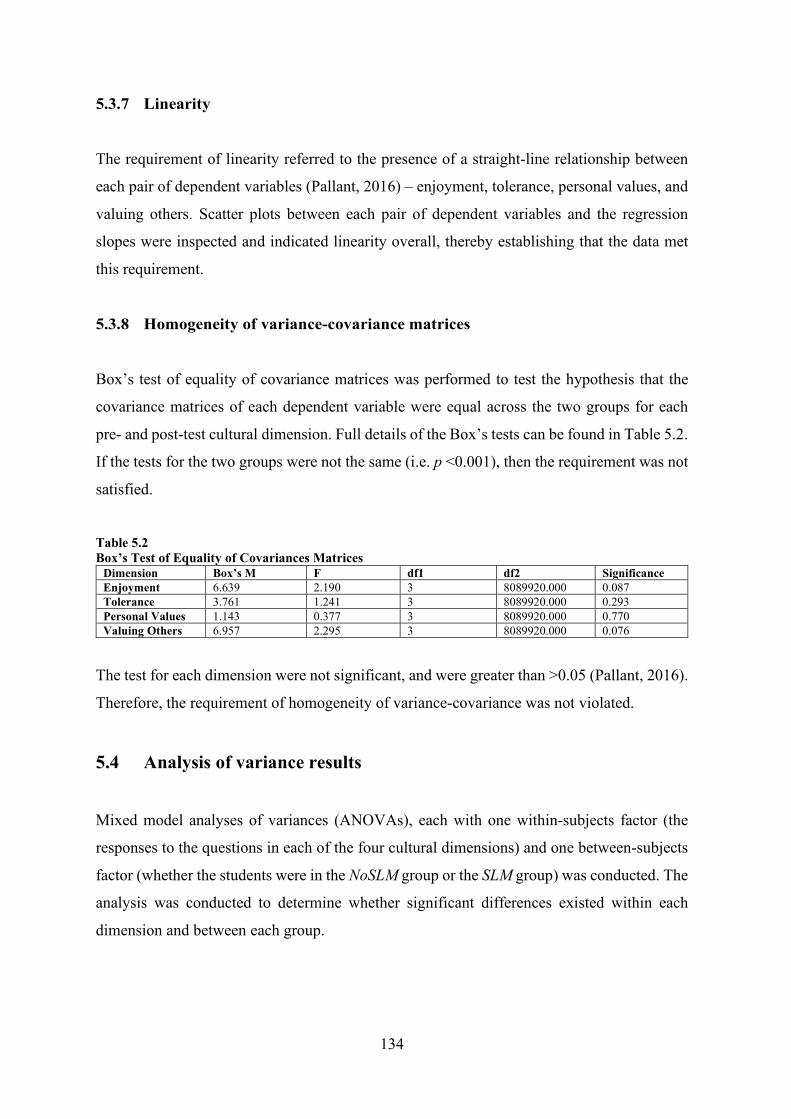
134
5.3.7 Linearity
The requirement of linearity referred to the presence of a straight-line relationship between
each pair of dependent variables (Pallant, 2016) – enjoyment, tolerance, personal values, and
valuing others. Scatter plots between each pair of dependent variables and the regression
slopes were inspected and indicated linearity overall, thereby establishing that the data met
this requirement.
5.3.8 Homogeneity of variance-covariance matrices
Box’s test of equality of covariance matrices was performed to test the hypothesis that the
covariance matrices of each dependent variable were equal across the two groups for each
pre- and post-test cultural dimension. Full details of the Box’s tests can be found in Table 5.2.
If the tests for the two groups were not the same (i.e. p <0.001), then the requirement was not
satisfied.
Table 5.2 Box’s Test of Equality of Covariances Matrices
Dimension Box’s M F df1 df2 Significance Enjoyment 6.639 2.190 3 8089920.000 0.087 Tolerance 3.761 1.241 3 8089920.000 0.293 Personal Values 1.143 0.377 3 8089920.000 0.770 Valuing Others 6.957 2.295 3 8089920.000 0.076
The test for each dimension were not significant, and were greater than >0.05 (Pallant, 2016).
Therefore, the requirement of homogeneity of variance-covariance was not violated.
5.4 Analysis of variance results
Mixed model analyses of variances (ANOVAs), each with one within-subjects factor (the
responses to the questions in each of the four cultural dimensions) and one between-subjects
factor (whether the students were in the NoSLM group or the SLM group) was conducted. The
analysis was conducted to determine whether significant differences existed within each
dimension and between each group.
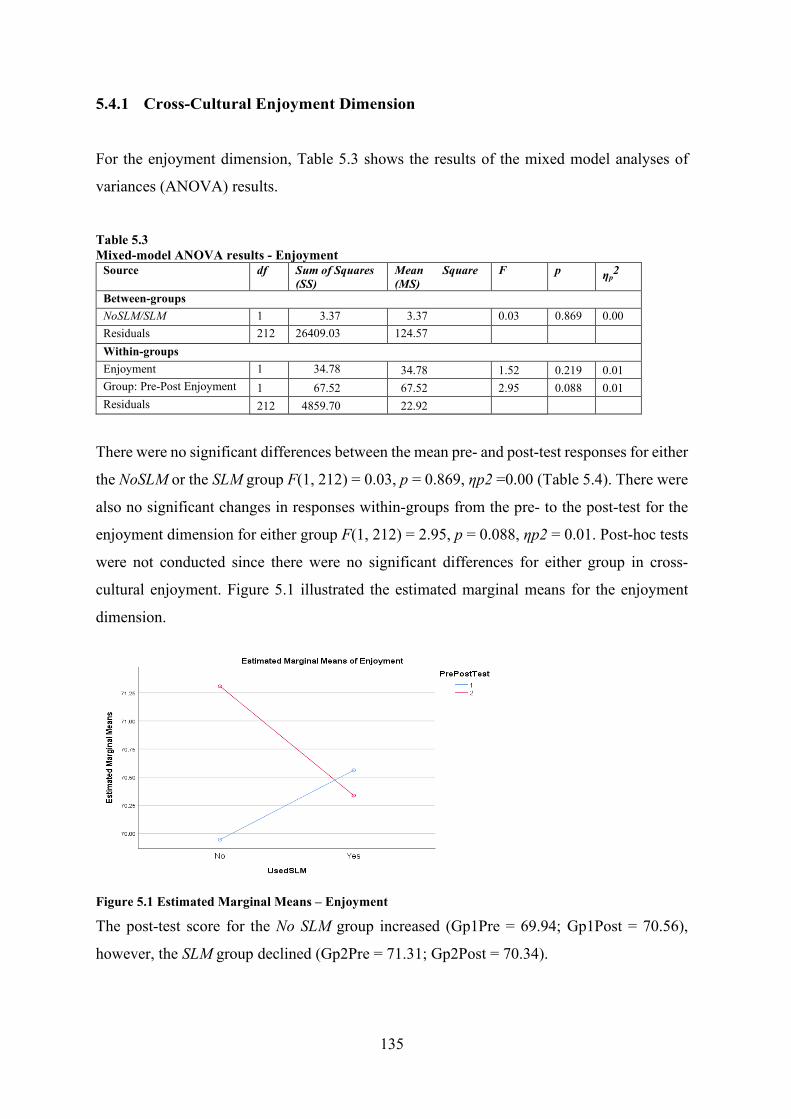
135
5.4.1 Cross-Cultural Enjoyment Dimension
For the enjoyment dimension, Table 5.3 shows the results of the mixed model analyses of
variances (ANOVA) results.
Table 5.3 Mixed-model ANOVA results - Enjoyment
Source df Sum of Squares (SS)
Mean Square (MS)
F p ηp2
Between-groups NoSLM/SLM 1 3.37 3.37 0.03 0.869 0.00 Residuals 212 26409.03 124.57 Within-groups Enjoyment 1 34.78 34.78 1.52 0.219 0.01 Group: Pre-Post Enjoyment 1 67.52 67.52 2.95 0.088 0.01 Residuals 212 4859.70 22.92
There were no significant differences between the mean pre- and post-test responses for either
the NoSLM or the SLM group F(1, 212) = 0.03, p = 0.869, ηp2 =0.00 (Table 5.4). There were
also no significant changes in responses within-groups from the pre- to the post-test for the
enjoyment dimension for either group F(1, 212) = 2.95, p = 0.088, ηp2 = 0.01. Post-hoc tests
were not conducted since there were no significant differences for either group in cross-
cultural enjoyment. Figure 5.1 illustrated the estimated marginal means for the enjoyment
dimension.
Figure 5.1 Estimated Marginal Means – Enjoyment
The post-test score for the No SLM group increased (Gp1Pre = 69.94; Gp1Post = 70.56),
however, the SLM group declined (Gp2Pre = 71.31; Gp2Post = 70.34).
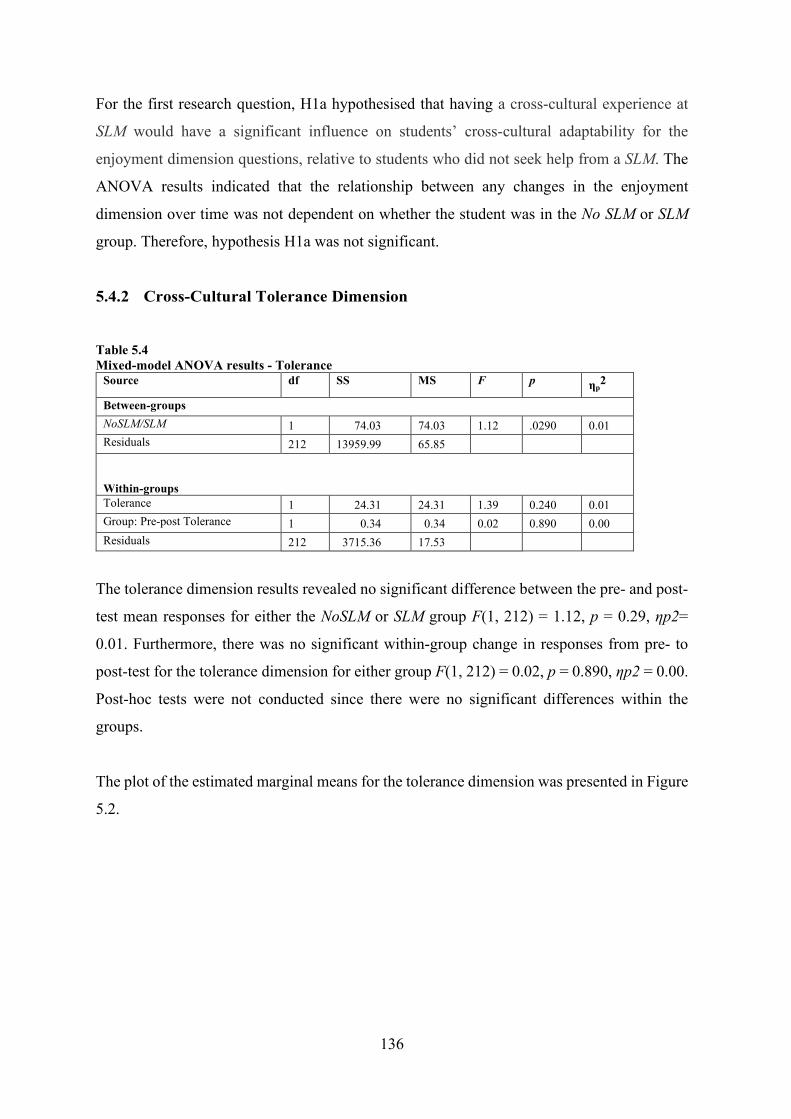
136
For the first research question, H1a hypothesised that having a cross-cultural experience at
SLM would have a significant influence on students’ cross-cultural adaptability for the
enjoyment dimension questions, relative to students who did not seek help from a SLM. The
ANOVA results indicated that the relationship between any changes in the enjoyment
dimension over time was not dependent on whether the student was in the No SLM or SLM
group. Therefore, hypothesis H1a was not significant.
5.4.2 Cross-Cultural Tolerance Dimension
Table 5.4 Mixed-model ANOVA results - Tolerance
Source df SS MS F p ηp2
Between-groups NoSLM/SLM 1 74.03 74.03 1.12 .0290 0.01 Residuals 212 13959.99 65.85 Within-groups Tolerance 1 24.31 24.31 1.39 0.240 0.01 Group: Pre-post Tolerance 1 0.34 0.34 0.02 0.890 0.00 Residuals 212 3715.36 17.53
The tolerance dimension results revealed no significant difference between the pre- and post-
test mean responses for either the NoSLM or SLM group F(1, 212) = 1.12, p = 0.29, ηp2=
0.01. Furthermore, there was no significant within-group change in responses from pre- to
post-test for the tolerance dimension for either group F(1, 212) = 0.02, p = 0.890, ηp2 = 0.00.
Post-hoc tests were not conducted since there were no significant differences within the
groups.
The plot of the estimated marginal means for the tolerance dimension was presented in Figure
5.2.
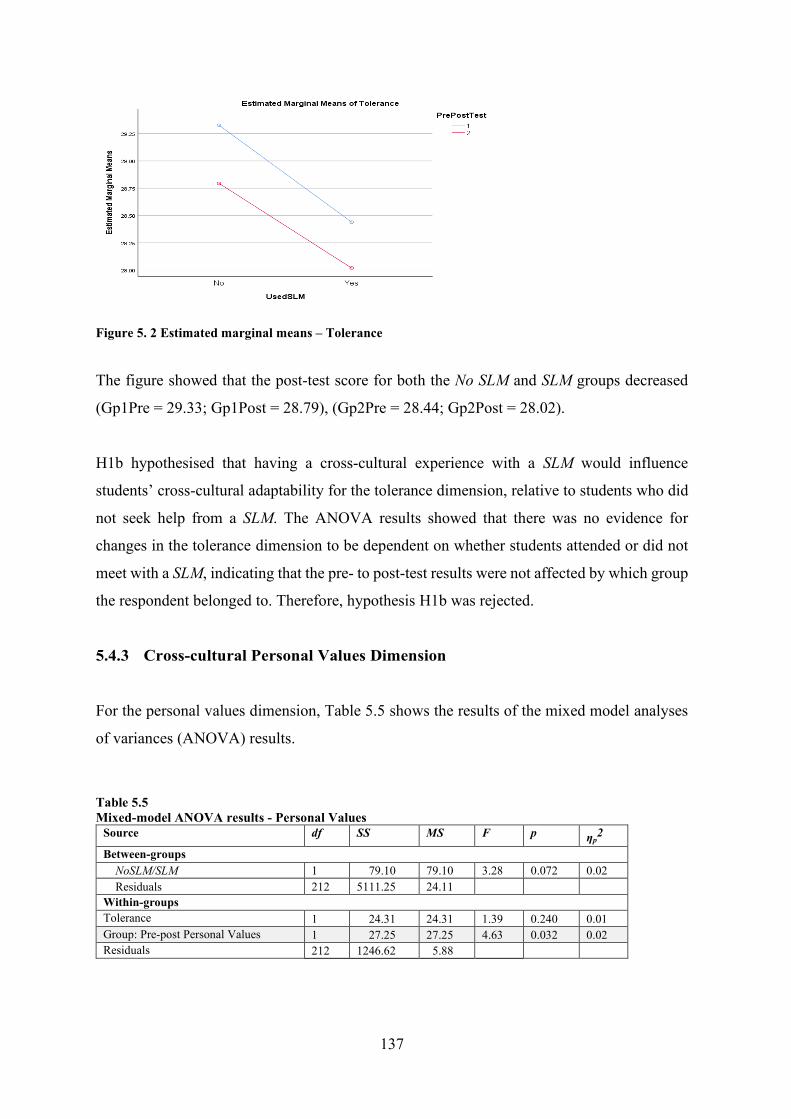
137
Figure 5. 2 Estimated marginal means – Tolerance
The figure showed that the post-test score for both the No SLM and SLM groups decreased
(Gp1Pre = 29.33; Gp1Post = 28.79), (Gp2Pre = 28.44; Gp2Post = 28.02).
H1b hypothesised that having a cross-cultural experience with a SLM would influence
students’ cross-cultural adaptability for the tolerance dimension, relative to students who did
not seek help from a SLM. The ANOVA results showed that there was no evidence for
changes in the tolerance dimension to be dependent on whether students attended or did not
meet with a SLM, indicating that the pre- to post-test results were not affected by which group
the respondent belonged to. Therefore, hypothesis H1b was rejected.
5.4.3 Cross-cultural Personal Values Dimension
For the personal values dimension, Table 5.5 shows the results of the mixed model analyses
of variances (ANOVA) results.
Table 5.5 Mixed-model ANOVA results - Personal Values
Source df SS MS F p ηp2
Between-groups NoSLM/SLM 1 79.10 79.10 3.28 0.072 0.02 Residuals 212 5111.25 24.11 Within-groups Tolerance 1 24.31 24.31 1.39 0.240 0.01 Group: Pre-post Personal Values 1 27.25 27.25 4.63 0.032 0.02 Residuals 212 1246.62 5.88
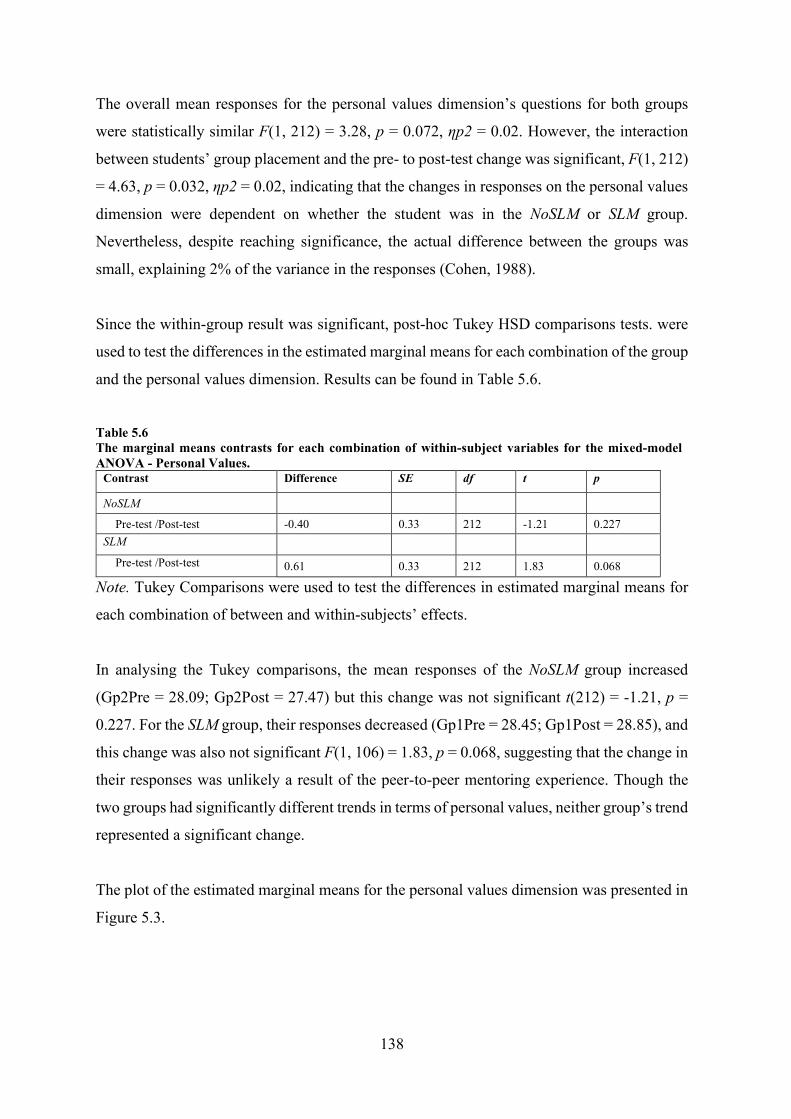
138
The overall mean responses for the personal values dimension’s questions for both groups
were statistically similar F(1, 212) = 3.28, p = 0.072, ηp2 = 0.02. However, the interaction
between students’ group placement and the pre- to post-test change was significant, F(1, 212)
= 4.63, p = 0.032, ηp2 = 0.02, indicating that the changes in responses on the personal values
dimension were dependent on whether the student was in the NoSLM or SLM group.
Nevertheless, despite reaching significance, the actual difference between the groups was
small, explaining 2% of the variance in the responses (Cohen, 1988).
Since the within-group result was significant, post-hoc Tukey HSD comparisons tests. were
used to test the differences in the estimated marginal means for each combination of the group
and the personal values dimension. Results can be found in Table 5.6.
Table 5.6 The marginal means contrasts for each combination of within-subject variables for the mixed-model ANOVA - Personal Values.
Contrast Difference SE df t p
NoSLM
Pre-test /Post-test -0.40 0.33 212 -1.21 0.227 SLM Pre-test /Post-test 0.61 0.33 212 1.83 0.068
Note. Tukey Comparisons were used to test the differences in estimated marginal means for
each combination of between and within-subjects’ effects.
In analysing the Tukey comparisons, the mean responses of the NoSLM group increased
(Gp2Pre = 28.09; Gp2Post = 27.47) but this change was not significant t(212) = -1.21, p =
0.227. For the SLM group, their responses decreased (Gp1Pre = 28.45; Gp1Post = 28.85), and
this change was also not significant F(1, 106) = 1.83, p = 0.068, suggesting that the change in
their responses was unlikely a result of the peer-to-peer mentoring experience. Though the
two groups had significantly different trends in terms of personal values, neither group’s trend
represented a significant change.
The plot of the estimated marginal means for the personal values dimension was presented in
Figure 5.3.
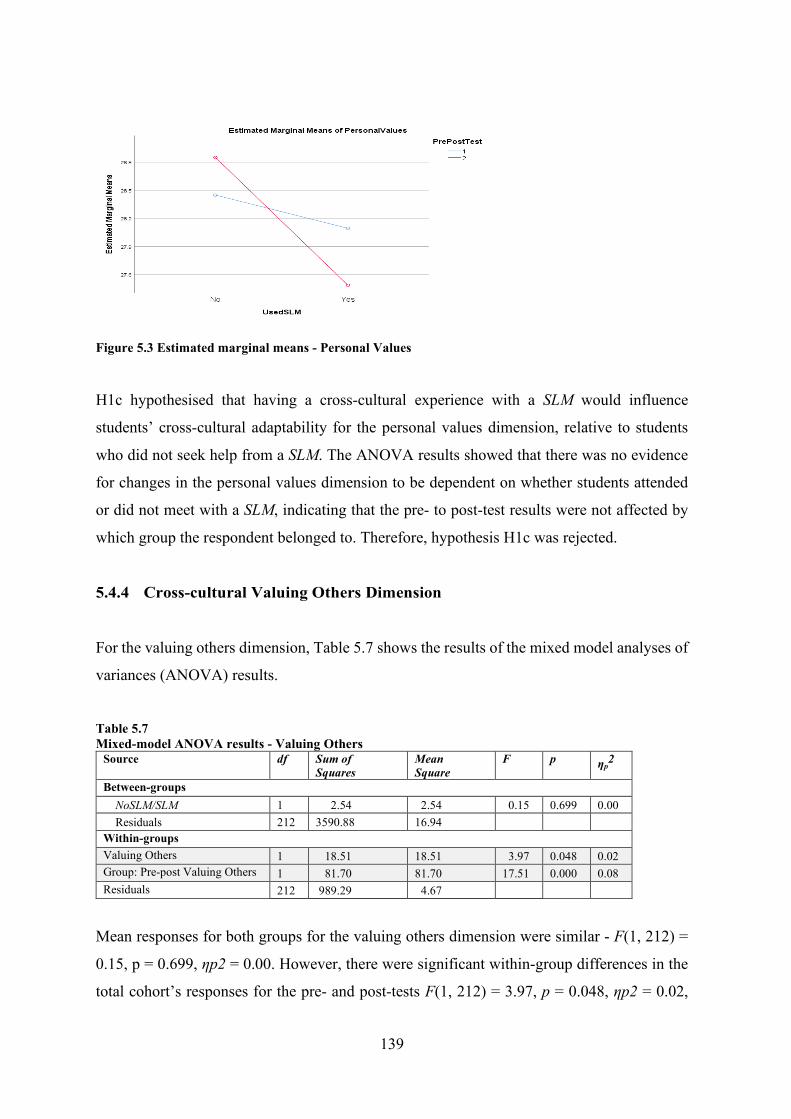
139
Figure 5.3 Estimated marginal means - Personal Values
H1c hypothesised that having a cross-cultural experience with a SLM would influence
students’ cross-cultural adaptability for the personal values dimension, relative to students
who did not seek help from a SLM. The ANOVA results showed that there was no evidence
for changes in the personal values dimension to be dependent on whether students attended
or did not meet with a SLM, indicating that the pre- to post-test results were not affected by
which group the respondent belonged to. Therefore, hypothesis H1c was rejected.
5.4.4 Cross-cultural Valuing Others Dimension
For the valuing others dimension, Table 5.7 shows the results of the mixed model analyses of
variances (ANOVA) results.
Table 5.7 Mixed-model ANOVA results - Valuing Others
Source df Sum of Squares
Mean Square
F p ηp2
Between-groups NoSLM/SLM 1 2.54 2.54 0.15 0.699 0.00 Residuals 212 3590.88 16.94 Within-groups Valuing Others 1 18.51 18.51 3.97 0.048 0.02 Group: Pre-post Valuing Others 1 81.70 81.70 17.51 0.000 0.08 Residuals 212 989.29 4.67
Mean responses for both groups for the valuing others dimension were similar - F(1, 212) =
0.15, p = 0.699, ηp2 = 0.00. However, there were significant within-group differences in the
total cohort’s responses for the pre- and post-tests F(1, 212) = 3.97, p = 0.048, ηp2 = 0.02,
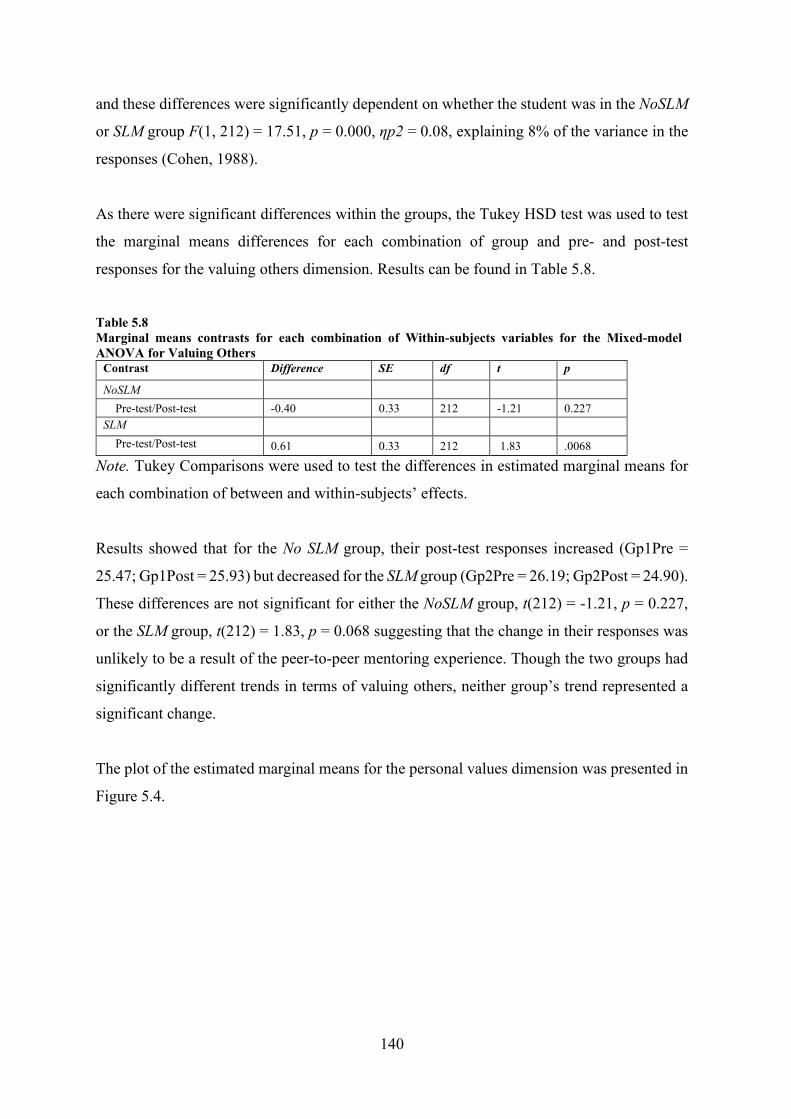
140
and these differences were significantly dependent on whether the student was in the NoSLM
or SLM group F(1, 212) = 17.51, p = 0.000, ηp2 = 0.08, explaining 8% of the variance in the
responses (Cohen, 1988).
As there were significant differences within the groups, the Tukey HSD test was used to test
the marginal means differences for each combination of group and pre- and post-test
responses for the valuing others dimension. Results can be found in Table 5.8.
Table 5.8 Marginal means contrasts for each combination of Within-subjects variables for the Mixed-model ANOVA for Valuing Others
Contrast Difference SE df t p
NoSLM Pre-test/Post-test -0.40 0.33 212 -1.21 0.227 SLM Pre-test/Post-test 0.61 0.33 212 1.83 .0068
Note. Tukey Comparisons were used to test the differences in estimated marginal means for
each combination of between and within-subjects’ effects.
Results showed that for the No SLM group, their post-test responses increased (Gp1Pre =
25.47; Gp1Post = 25.93) but decreased for the SLM group (Gp2Pre = 26.19; Gp2Post = 24.90).
These differences are not significant for either the NoSLM group, t(212) = -1.21, p = 0.227,
or the SLM group, t(212) = 1.83, p = 0.068 suggesting that the change in their responses was
unlikely to be a result of the peer-to-peer mentoring experience. Though the two groups had
significantly different trends in terms of valuing others, neither group’s trend represented a
significant change.
The plot of the estimated marginal means for the personal values dimension was presented in
Figure 5.4.
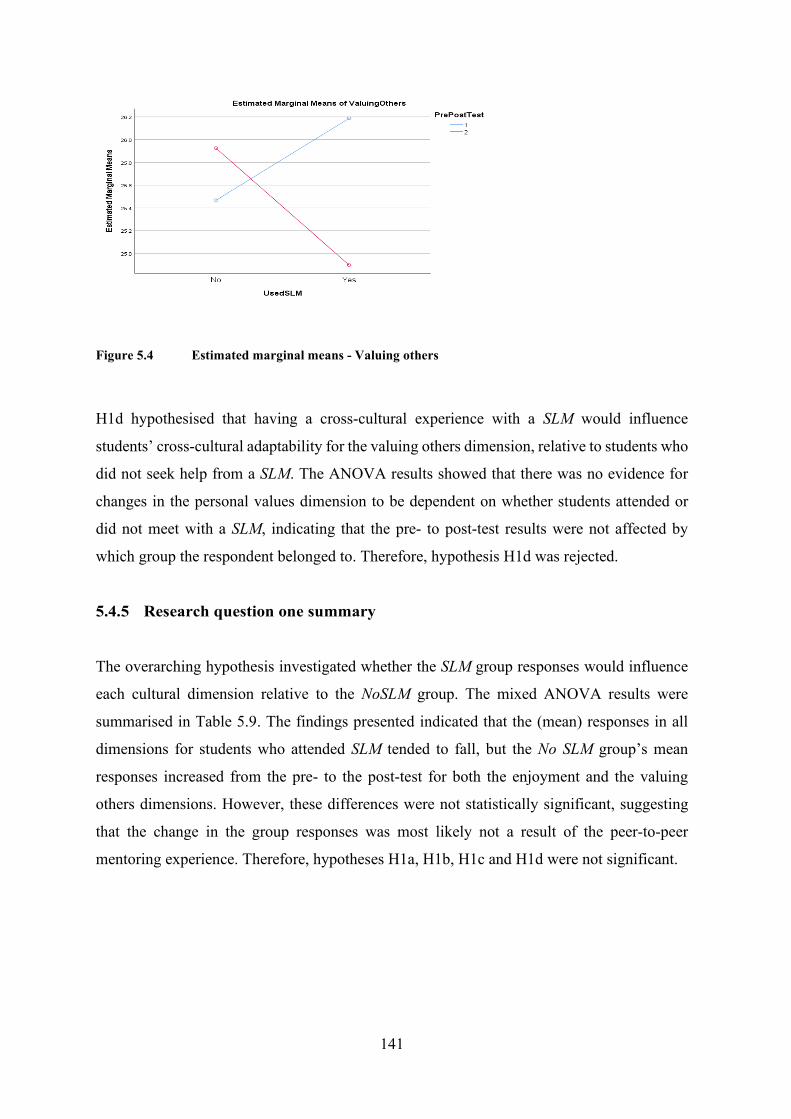
141
Figure 5.4 Estimated marginal means - Valuing others
H1d hypothesised that having a cross-cultural experience with a SLM would influence
students’ cross-cultural adaptability for the valuing others dimension, relative to students who
did not seek help from a SLM. The ANOVA results showed that there was no evidence for
changes in the personal values dimension to be dependent on whether students attended or
did not meet with a SLM, indicating that the pre- to post-test results were not affected by
which group the respondent belonged to. Therefore, hypothesis H1d was rejected.
5.4.5 Research question one summary
The overarching hypothesis investigated whether the SLM group responses would influence
each cultural dimension relative to the NoSLM group. The mixed ANOVA results were
summarised in Table 5.9. The findings presented indicated that the (mean) responses in all
dimensions for students who attended SLM tended to fall, but the No SLM group’s mean
responses increased from the pre- to the post-test for both the enjoyment and the valuing
others dimensions. However, these differences were not statistically significant, suggesting
that the change in the group responses was most likely not a result of the peer-to-peer
mentoring experience. Therefore, hypotheses H1a, H1b, H1c and H1d were not significant.
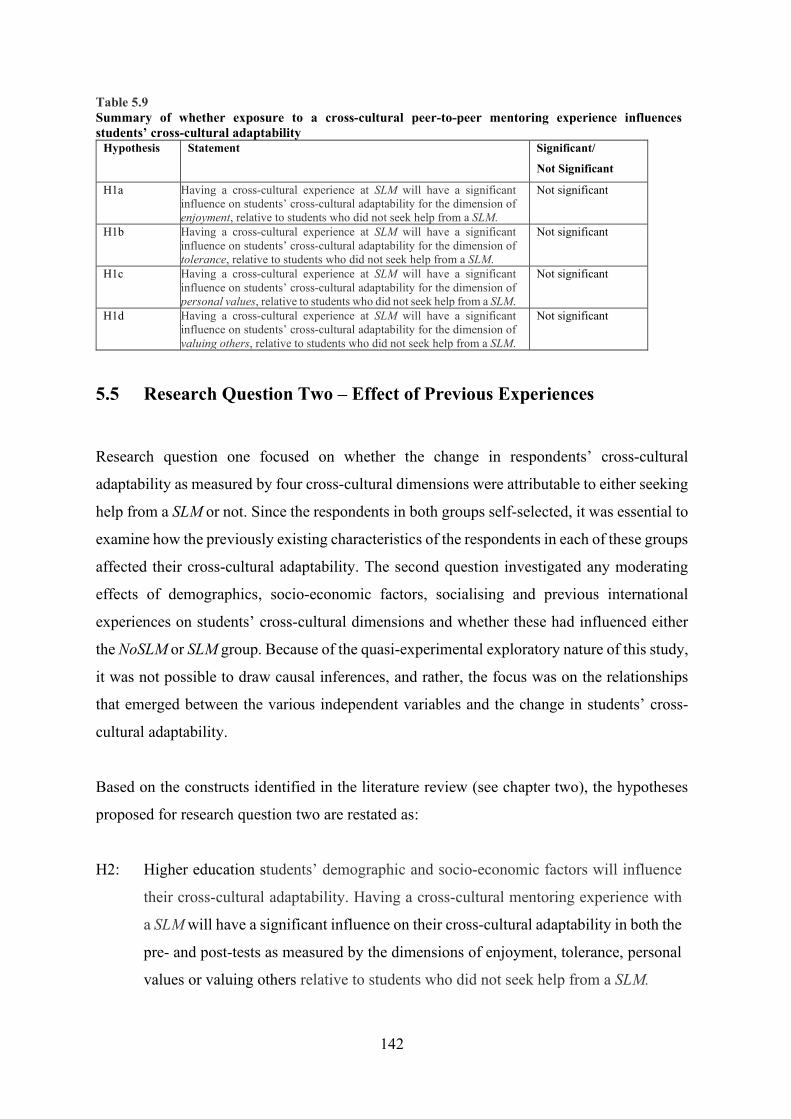
142
Table 5.9 Summary of whether exposure to a cross-cultural peer-to-peer mentoring experience influences students’ cross-cultural adaptability
Hypothesis Statement Significant/
Not Significant
H1a Having a cross-cultural experience at SLM will have a significant influence on students’ cross-cultural adaptability for the dimension of enjoyment, relative to students who did not seek help from a SLM.
Not significant
H1b Having a cross-cultural experience at SLM will have a significant influence on students’ cross-cultural adaptability for the dimension of tolerance, relative to students who did not seek help from a SLM.
Not significant
H1c Having a cross-cultural experience at SLM will have a significant influence on students’ cross-cultural adaptability for the dimension of personal values, relative to students who did not seek help from a SLM.
Not significant
H1d Having a cross-cultural experience at SLM will have a significant influence on students’ cross-cultural adaptability for the dimension of valuing others, relative to students who did not seek help from a SLM.
Not significant
5.5 Research Question Two – Effect of Previous Experiences
Research question one focused on whether the change in respondents’ cross-cultural
adaptability as measured by four cross-cultural dimensions were attributable to either seeking
help from a SLM or not. Since the respondents in both groups self-selected, it was essential to
examine how the previously existing characteristics of the respondents in each of these groups
affected their cross-cultural adaptability. The second question investigated any moderating
effects of demographics, socio-economic factors, socialising and previous international
experiences on students’ cross-cultural dimensions and whether these had influenced either
the NoSLM or SLM group. Because of the quasi-experimental exploratory nature of this study,
it was not possible to draw causal inferences, and rather, the focus was on the relationships
that emerged between the various independent variables and the change in students’ cross-
cultural adaptability.
Based on the constructs identified in the literature review (see chapter two), the hypotheses
proposed for research question two are restated as:
H2: Higher education students’ demographic and socio-economic factors will influence
their cross-cultural adaptability. Having a cross-cultural mentoring experience with
a SLM will have a significant influence on their cross-cultural adaptability in both the
pre- and post-tests as measured by the dimensions of enjoyment, tolerance, personal
values or valuing others relative to students who did not seek help from a SLM.
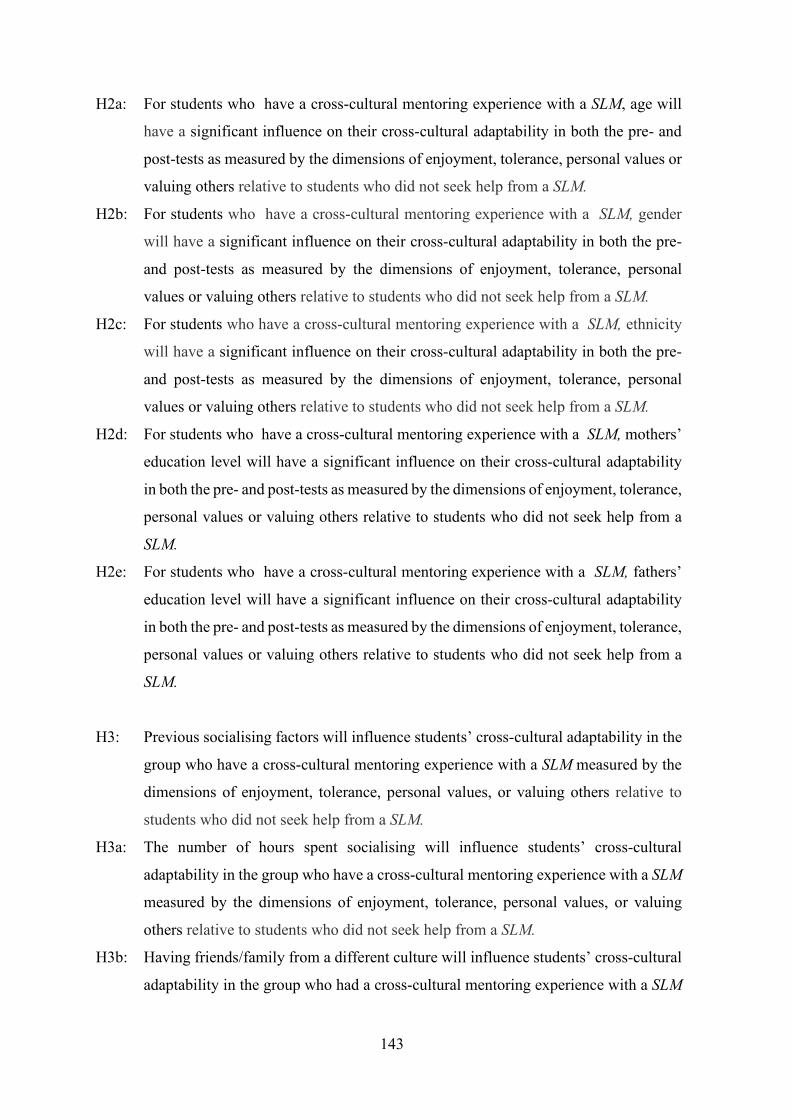
143
H2a: For students who have a cross-cultural mentoring experience with a SLM, age will
have a significant influence on their cross-cultural adaptability in both the pre- and
post-tests as measured by the dimensions of enjoyment, tolerance, personal values or
valuing others relative to students who did not seek help from a SLM.
H2b: For students who have a cross-cultural mentoring experience with a SLM, gender
will have a significant influence on their cross-cultural adaptability in both the pre-
and post-tests as measured by the dimensions of enjoyment, tolerance, personal
values or valuing others relative to students who did not seek help from a SLM.
H2c: For students who have a cross-cultural mentoring experience with a SLM, ethnicity
will have a significant influence on their cross-cultural adaptability in both the pre-
and post-tests as measured by the dimensions of enjoyment, tolerance, personal
values or valuing others relative to students who did not seek help from a SLM.
H2d: For students who have a cross-cultural mentoring experience with a SLM, mothers’
education level will have a significant influence on their cross-cultural adaptability
in both the pre- and post-tests as measured by the dimensions of enjoyment, tolerance,
personal values or valuing others relative to students who did not seek help from a
SLM.
H2e: For students who have a cross-cultural mentoring experience with a SLM, fathers’
education level will have a significant influence on their cross-cultural adaptability
in both the pre- and post-tests as measured by the dimensions of enjoyment, tolerance,
personal values or valuing others relative to students who did not seek help from a
SLM.
H3: Previous socialising factors will influence students’ cross-cultural adaptability in the
group who have a cross-cultural mentoring experience with a SLM measured by the
dimensions of enjoyment, tolerance, personal values, or valuing others relative to
students who did not seek help from a SLM.
H3a: The number of hours spent socialising will influence students’ cross-cultural
adaptability in the group who have a cross-cultural mentoring experience with a SLM
measured by the dimensions of enjoyment, tolerance, personal values, or valuing
others relative to students who did not seek help from a SLM.
H3b: Having friends/family from a different culture will influence students’ cross-cultural
adaptability in the group who had a cross-cultural mentoring experience with a SLM
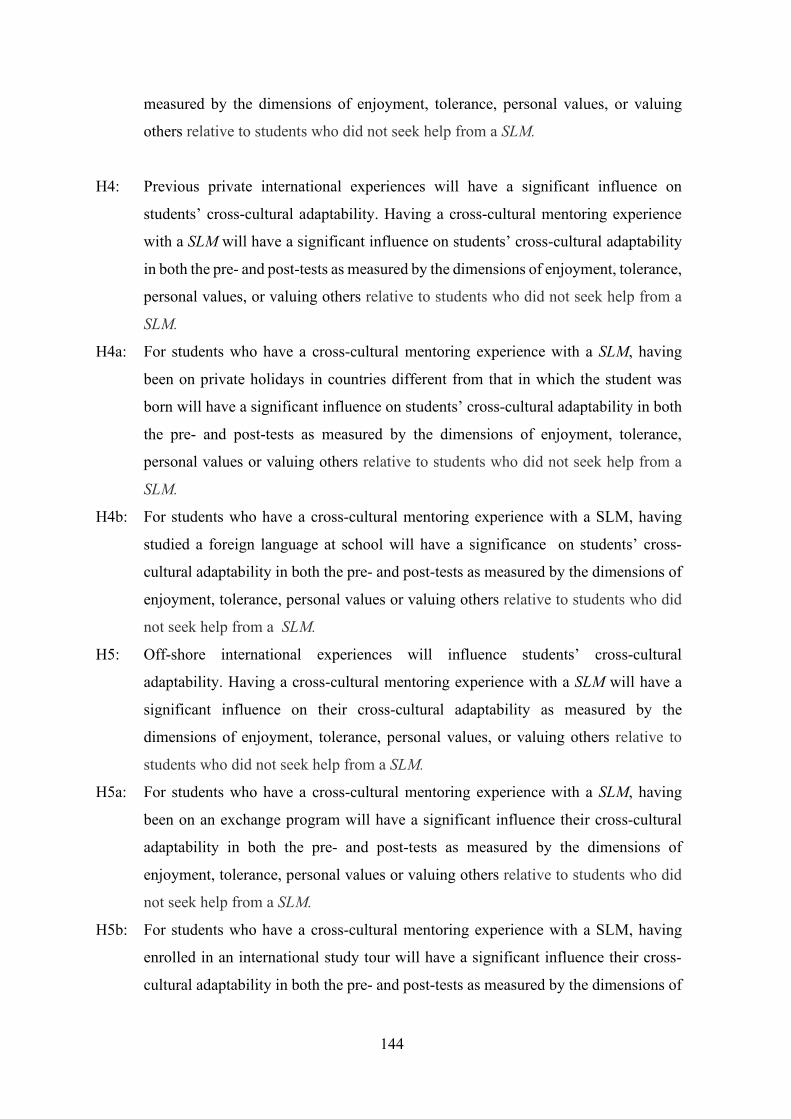
144
measured by the dimensions of enjoyment, tolerance, personal values, or valuing
others relative to students who did not seek help from a SLM.
H4: Previous private international experiences will have a significant influence on
students’ cross-cultural adaptability. Having a cross-cultural mentoring experience
with a SLM will have a significant influence on students’ cross-cultural adaptability
in both the pre- and post-tests as measured by the dimensions of enjoyment, tolerance,
personal values, or valuing others relative to students who did not seek help from a
SLM.
H4a: For students who have a cross-cultural mentoring experience with a SLM, having
been on private holidays in countries different from that in which the student was
born will have a significant influence on students’ cross-cultural adaptability in both
the pre- and post-tests as measured by the dimensions of enjoyment, tolerance,
personal values or valuing others relative to students who did not seek help from a
SLM.
H4b: For students who have a cross-cultural mentoring experience with a SLM, having
studied a foreign language at school will have a significance on students’ cross-
cultural adaptability in both the pre- and post-tests as measured by the dimensions of
enjoyment, tolerance, personal values or valuing others relative to students who did
not seek help from a SLM.
H5: Off-shore international experiences will influence students’ cross-cultural
adaptability. Having a cross-cultural mentoring experience with a SLM will have a
significant influence on their cross-cultural adaptability as measured by the
dimensions of enjoyment, tolerance, personal values, or valuing others relative to
students who did not seek help from a SLM.
H5a: For students who have a cross-cultural mentoring experience with a SLM, having
been on an exchange program will have a significant influence their cross-cultural
adaptability in both the pre- and post-tests as measured by the dimensions of
enjoyment, tolerance, personal values or valuing others relative to students who did
not seek help from a SLM.
H5b: For students who have a cross-cultural mentoring experience with a SLM, having
enrolled in an international study tour will have a significant influence their cross-
cultural adaptability in both the pre- and post-tests as measured by the dimensions of
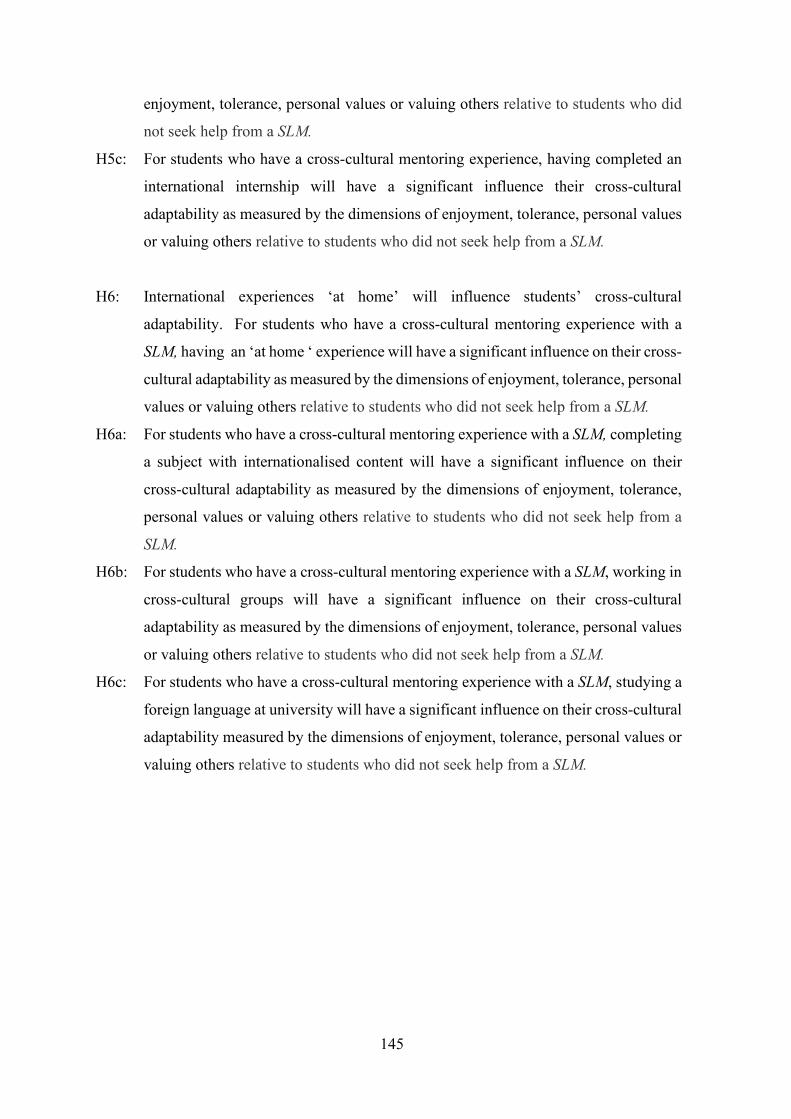
145
enjoyment, tolerance, personal values or valuing others relative to students who did
not seek help from a SLM.
H5c: For students who have a cross-cultural mentoring experience, having completed an
international internship will have a significant influence their cross-cultural
adaptability as measured by the dimensions of enjoyment, tolerance, personal values
or valuing others relative to students who did not seek help from a SLM.
H6: International experiences ‘at home’ will influence students’ cross-cultural
adaptability. For students who have a cross-cultural mentoring experience with a
SLM, having an ‘at home ‘ experience will have a significant influence on their cross-
cultural adaptability as measured by the dimensions of enjoyment, tolerance, personal
values or valuing others relative to students who did not seek help from a SLM.
H6a: For students who have a cross-cultural mentoring experience with a SLM, completing
a subject with internationalised content will have a significant influence on their
cross-cultural adaptability as measured by the dimensions of enjoyment, tolerance,
personal values or valuing others relative to students who did not seek help from a
SLM.
H6b: For students who have a cross-cultural mentoring experience with a SLM, working in
cross-cultural groups will have a significant influence on their cross-cultural
adaptability as measured by the dimensions of enjoyment, tolerance, personal values
or valuing others relative to students who did not seek help from a SLM.
H6c: For students who have a cross-cultural mentoring experience with a SLM, studying a
foreign language at university will have a significant influence on their cross-cultural
adaptability measured by the dimensions of enjoyment, tolerance, personal values or
valuing others relative to students who did not seek help from a SLM.
146
5.5.1 Repeated Measures Multivariate Analysis of Covariance (MANCOVA)
Results
The second research question analysed if any of the students’ previous demographic, socio-
economic factors or previous international experiences affected their responses to the pre- or
post-tests for either group (NoSLM or SLM). It was essential to understand whether any of
these covariates affected their responses after the analysis in research question one found that
there were no significant effects of the peer-to-peer mentoring experience on any of the
cultural dimensions for either group. To investigate the responses for each group within each
dimension further, repeated measures multivariate analyses of covariance (MANCOVAs)
were conducted between the groups (NoSLM or SLM) for each covariate, while controlling
for all other covariates. Analyses of the pre- and post-test responses for each group for each
cultural dimension were also conducted. This analysis showed the effect of each covariate on
each group to determine if the effects were strictly due to each covariate’s influence.
Repeated-measures MANCOVA was selected to best account for responses gathered from the
same students at two separate times (pre- and post-test), but MANCOVA analysis only
showed the influence on the cultural dimensions, they were not directional.
The requirements of MANCOVA were the same as the requirements of ANOVA, which were
assessed in section 5.3. Testing was performed for normality, homoscedasticity,
multicollinearity and singularity, linearity, homogeneity of regression slopes, homogeneity of
variance-covariance matrices and independence of correlations (Miller & Chapman, 2001;
Pallant, 2016; Field, 2013; Stevens, 2009; Tabachnick & Fidell, 2013).
In this study, the responses on the covariates were obtained prior to the peer-to-peer mentoring
experience, ensuring that the peer-to-peer mentoring experience did not influence any
covariate. Students chose which group they attended; therefore, the independence requirement
between the covariates and whether the student was in the NoSLM or SLM group was not
relevant (Keppel, 1991), and could be violated without problems in the analysis (Grace-
Martin, 2019). Tabachnick & Fidell, (2013) agree and state that for MANCOVA analysis,
independence of the covariates and the independent variable (NoSLM or SLM) was not
required as they were expected to be dependent on each other. After assessing the correlations
for each covariate, the Levene’s test for the homogeneity of variances across the two groups
revealed moderate violations (p>0.04). However, as stated, MANCOVA was sufficiently
147
robust to moderate violations of this requirement (Phillips, McAuliff, Kovera & Culter, 1999).
All covariates were therefore included in the analysis reflecting a more accurate estimate of
the relationship between each group and the effect on each cultural dimension. Tabachnick
and Fidell (2013) pointed out that MANCOVAs do not permit casual inference of the effects
of the mentoring experience due to the non-randomly assigned groups.
Differences were assessed in the analysis using the F-test of significance. This assessed the
effects of each covariate on the No SLM and SLM groups and the pre- or post-test responses
for each of the cultural dimensions. Given that predictable variances known to be associated
with the dependent variable were removed, MANCOVA increased the power of the F test.
Within-subjects’ contrasts were used to analyse any effects on the pre- and post-test responses
within each group for all cultural dimensions again controlling for each covariate. The
covariates used in this study were chosen specifically because of their known effects on the
dependent variables (Margavio, Hignite & Moses, 2005).
5.5.2 Differences between the groups - demographic and socio-economic factors
The second set of hypotheses proposed that higher education students’ demographic and
socio-economic factors would influence their cross-cultural adaptability and that the cross-
cultural experience of seeking help from a SLM would have a significant influence on their
cross-cultural adaptability in both the pre- and post-tests as measured by the dimensions of
enjoyment, tolerance, personal values or valuing others, relative to students who did not seek
help from a SLM. Each covariate was analysed to ascertain if any had a significant influence
on the students’ response to the mentoring experience.
Full demographic and socio-economic results were presented in Table 5.10a. Analysis of the
effect of each covariate - between-groups - was conducted for both groups separately,
controlling for all other covariates. Where significant differences in responses were identified
for the various dimensions, Cohen’s (1988) criterion was applied to establish whether the
effect size was small, medium or large.
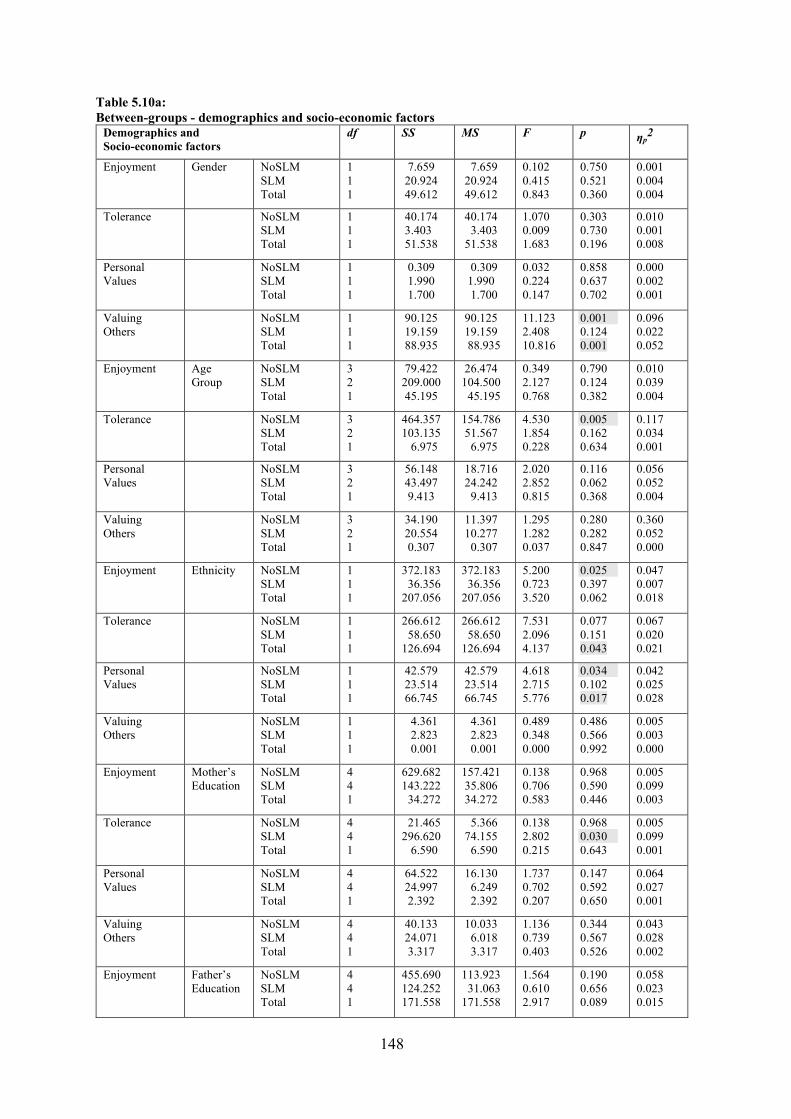
148
Table 5.10a: Between-groups - demographics and socio-economic factors
Demographics and Socio-economic factors
df SS MS F p ηp2
Enjoyment Gender NoSLM SLM Total
1 1 1
7.659 20.924 49.612
7.659 20.924 49.612
0.102 0.415 0.843
0.750 0.521 0.360
0.001 0.004 0.004
Tolerance NoSLM SLM Total
1 1 1
40.174 3.403 51.538
40.174 3.403 51.538
1.070 0.009 1.683
0.303 0.730 0.196
0.010 0.001 0.008
Personal Values
NoSLM SLM Total
1 1 1
0.309 1.990 1.700
0.309 1.990 1.700
0.032 0.224 0.147
0.858 0.637 0.702
0.000 0.002 0.001
Valuing Others
NoSLM SLM Total
1 1 1
90.125 19.159 88.935
90.125 19.159 88.935
11.123 2.408 10.816
0.001 0.124 0.001
0.096 0.022 0.052
Enjoyment Age Group
NoSLM SLM Total
3 2 1
79.422 209.000 45.195
26.474 104.500 45.195
0.349 2.127 0.768
0.790 0.124 0.382
0.010 0.039 0.004
Tolerance NoSLM SLM Total
3 2 1
464.357 103.135 6.975
154.786 51.567 6.975
4.530 1.854 0.228
0.005 0.162 0.634
0.117 0.034 0.001
Personal Values
NoSLM SLM Total
3 2 1
56.148 43.497 9.413
18.716 24.242 9.413
2.020 2.852 0.815
0.116 0.062 0.368
0.056 0.052 0.004
Valuing Others
NoSLM SLM Total
3 2 1
34.190 20.554 0.307
11.397 10.277 0.307
1.295 1.282 0.037
0.280 0.282 0.847
0.360 0.052 0.000
Enjoyment Ethnicity NoSLM SLM Total
1 1 1
372.183 36.356 207.056
372.183 36.356 207.056
5.200 0.723 3.520
0.025 0.397 0.062
0.047 0.007 0.018
Tolerance NoSLM SLM Total
1 1 1
266.612 58.650 126.694
266.612 58.650 126.694
7.531 2.096 4.137
0.077 0.151 0.043
0.067 0.020 0.021
Personal Values
NoSLM SLM Total
1 1 1
42.579 23.514 66.745
42.579 23.514 66.745
4.618 2.715 5.776
0.034 0.102 0.017
0.042 0.025 0.028
Valuing Others
NoSLM SLM Total
1 1 1
4.361 2.823 0.001
4.361 2.823 0.001
0.489 0.348 0.000
0.486 0.566 0.992
0.005 0.003 0.000
Enjoyment Mother’s Education
NoSLM SLM Total
4 4 1
629.682 143.222 34.272
157.421 35.806 34.272
0.138 0.706 0.583
0.968 0.590 0.446
0.005 0.099 0.003
Tolerance NoSLM SLM Total
4 4 1
21.465 296.620 6.590
5.366 74.155 6.590
0.138 2.802 0.215
0.968 0.030 0.643
0.005 0.099 0.001
Personal Values
NoSLM SLM Total
4 4 1
64.522 24.997 2.392
16.130 6.249 2.392
1.737 0.702 0.207
0.147 0.592 0.650
0.064 0.027 0.001
Valuing Others
NoSLM SLM Total
4 4 1
40.133 24.071 3.317
10.033 6.018 3.317
1.136 0.739 0.403
0.344 0.567 0.526
0.043 0.028 0.002
Enjoyment Father’s Education
NoSLM SLM Total
4 4 1
455.690 124.252 171.558
113.923 31.063 171.558
1.564 0.610 2.917
0.190 0.656 0.089
0.058 0.023 0.015
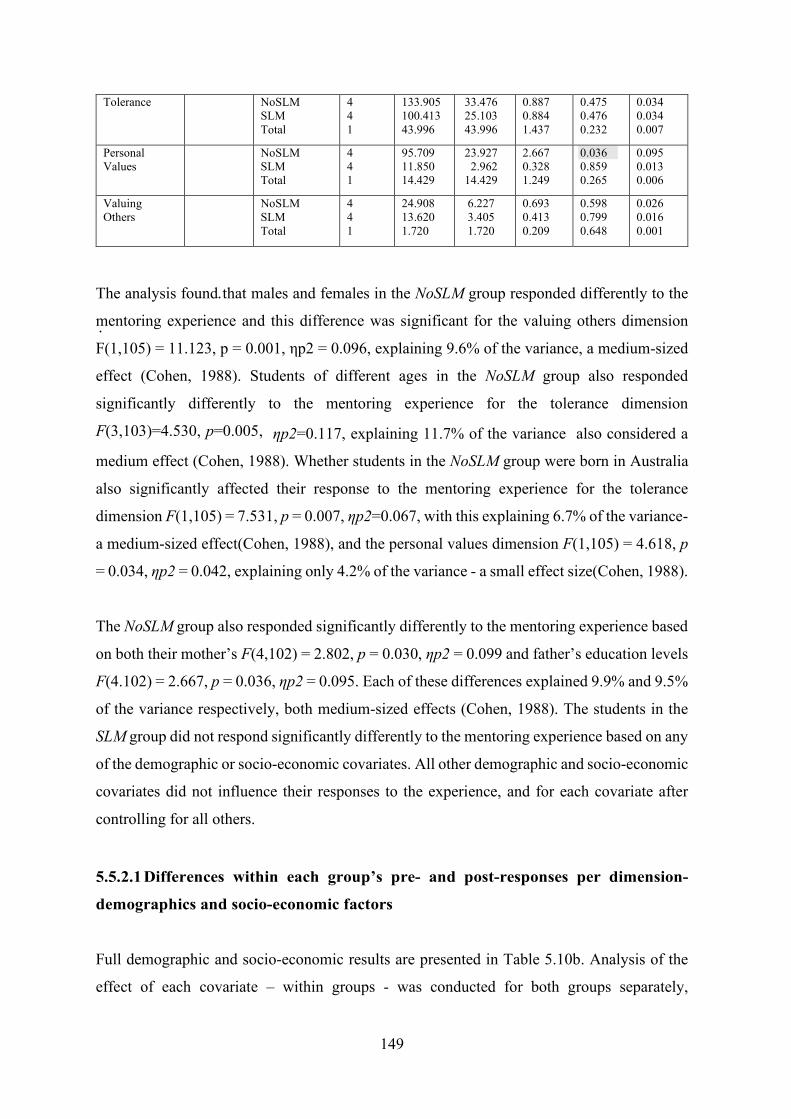
149
Tolerance NoSLM SLM Total
4 4 1
133.905 100.413 43.996
33.476 25.103 43.996
0.887 0.884 1.437
0.475 0.476 0.232
0.034 0.034 0.007
Personal Values
NoSLM SLM Total
4 4 1
95.709 11.850 14.429
23.927 2.962 14.429
2.667 0.328 1.249
0.036 0.859 0.265
0.095 0.013 0.006
Valuing Others
NoSLM SLM Total
4 4 1
24.908 13.620 1.720
6.227 3.405 1.720
0.693 0.413 0.209
0.598 0.799 0.648
0.026 0.016 0.001
The analysis found that males and females in the NoSLM group responded differently to the
mentoring experience and this difference was significant for the valuing others dimension
F(1,105) = 11.123, p = 0.001, ηp2 = 0.096, explaining 9.6% of the variance, a medium-sized
effect (Cohen, 1988). Students of different ages in the NoSLM group also responded
significantly differently to the mentoring experience for the tolerance dimension
F(3,103)=4.530, p=0.005, ηp2=0.117, explaining 11.7% of the variance also considered a
medium effect (Cohen, 1988). Whether students in the NoSLM group were born in Australia
also significantly affected their response to the mentoring experience for the tolerance
dimension F(1,105) = 7.531, p = 0.007, ηp2=0.067, with this explaining 6.7% of the variance-
a medium-sized effect(Cohen, 1988), and the personal values dimension F(1,105) = 4.618, p
= 0.034, ηp2 = 0.042, explaining only 4.2% of the variance - a small effect size(Cohen, 1988).
The NoSLM group also responded significantly differently to the mentoring experience based
on both their mother’s F(4,102) = 2.802, p = 0.030, ηp2 = 0.099 and father’s education levels
F(4.102) = 2.667, p = 0.036, ηp2 = 0.095. Each of these differences explained 9.9% and 9.5%
of the variance respectively, both medium-sized effects (Cohen, 1988). The students in the
SLM group did not respond significantly differently to the mentoring experience based on any
of the demographic or socio-economic covariates. All other demographic and socio-economic
covariates did not influence their responses to the experience, and for each covariate after
controlling for all others.
5.5.2.1 Differences within each group’s pre- and post-responses per dimension-
demographics and socio-economic factors
Full demographic and socio-economic results are presented in Table 5.10b. Analysis of the
effect of each covariate – within groups - was conducted for both groups separately,
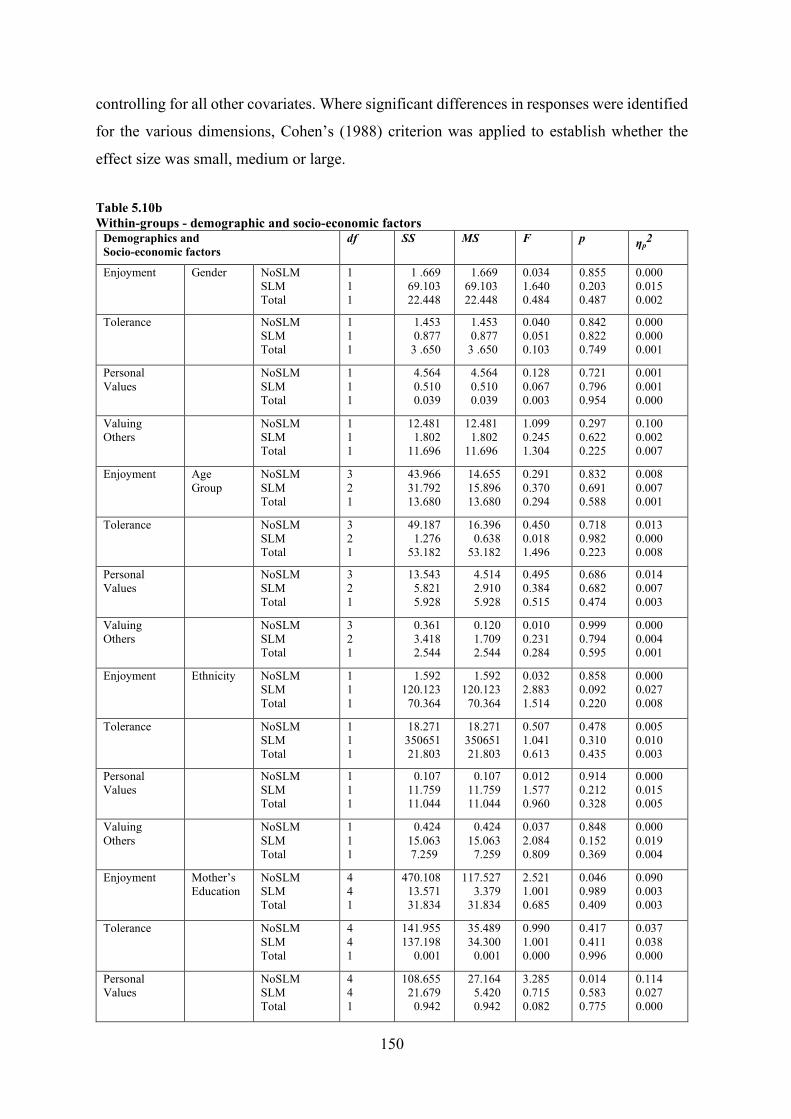
150
controlling for all other covariates. Where significant differences in responses were identified
for the various dimensions, Cohen’s (1988) criterion was applied to establish whether the
effect size was small, medium or large.
Table 5.10b Within-groups - demographic and socio-economic factors
Demographics and Socio-economic factors
df SS MS F p ηp2
Enjoyment Gender NoSLM SLM Total
1 1 1
1 .669 69.103 22.448
1.669 69.103 22.448
0.034 1.640 0.484
0.855 0.203 0.487
0.000 0.015 0.002
Tolerance NoSLM SLM Total
1 1 1
1.453 0.877 3 .650
1.453 0.877 3 .650
0.040 0.051 0.103
0.842 0.822 0.749
0.000 0.000 0.001
Personal Values
NoSLM SLM Total
1 1 1
4.564 0.510 0.039
4.564 0.510 0.039
0.128 0.067 0.003
0.721 0.796 0.954
0.001 0.001 0.000
Valuing Others
NoSLM SLM Total
1 1 1
12.481 1.802 11.696
12.481 1.802 11.696
1.099 0.245 1.304
0.297 0.622 0.225
0.100 0.002 0.007
Enjoyment Age Group
NoSLM SLM Total
3 2 1
43.966 31.792 13.680
14.655 15.896 13.680
0.291 0.370 0.294
0.832 0.691 0.588
0.008 0.007 0.001
Tolerance NoSLM SLM Total
3 2 1
49.187 1.276 53.182
16.396 0.638 53.182
0.450 0.018 1.496
0.718 0.982 0.223
0.013 0.000 0.008
Personal Values
NoSLM SLM Total
3 2 1
13.543 5.821 5.928
4.514 2.910 5.928
0.495 0.384 0.515
0.686 0.682 0.474
0.014 0.007 0.003
Valuing Others
NoSLM SLM Total
3 2 1
0.361 3.418 2.544
0.120 1.709 2.544
0.010 0.231 0.284
0.999 0.794 0.595
0.000 0.004 0.001
Enjoyment Ethnicity NoSLM SLM Total
1 1 1
1.592 120.123 70.364
1.592 120.123 70.364
0.032 2.883 1.514
0.858 0.092 0.220
0.000 0.027 0.008
Tolerance NoSLM SLM Total
1 1 1
18.271 350651 21.803
18.271 350651 21.803
0.507 1.041 0.613
0.478 0.310 0.435
0.005 0.010 0.003
Personal Values
NoSLM SLM Total
1 1 1
0.107 11.759 11.044
0.107 11.759 11.044
0.012 1.577 0.960
0.914 0.212 0.328
0.000 0.015 0.005
Valuing Others
NoSLM SLM Total
1 1 1
0.424 15.063 7.259
0.424 15.063 7.259
0.037 2.084 0.809
0.848 0.152 0.369
0.000 0.019 0.004
Enjoyment Mother’s Education
NoSLM SLM Total
4 4 1
470.108 13.571 31.834
117.527 3.379 31.834
2.521 1.001 0.685
0.046 0.989 0.409
0.090 0.003 0.003
Tolerance NoSLM SLM Total
4 4 1
141.955 137.198 0.001
35.489 34.300 0.001
0.990 1.001 0.000
0.417 0.411 0.996
0.037 0.038 0.000
Personal Values
NoSLM SLM Total
4 4 1
108.655 21.679 0.942
27.164 5.420 0.942
3.285 0.715 0.082
0.014 0.583 0.775
0.114 0.027 0.000
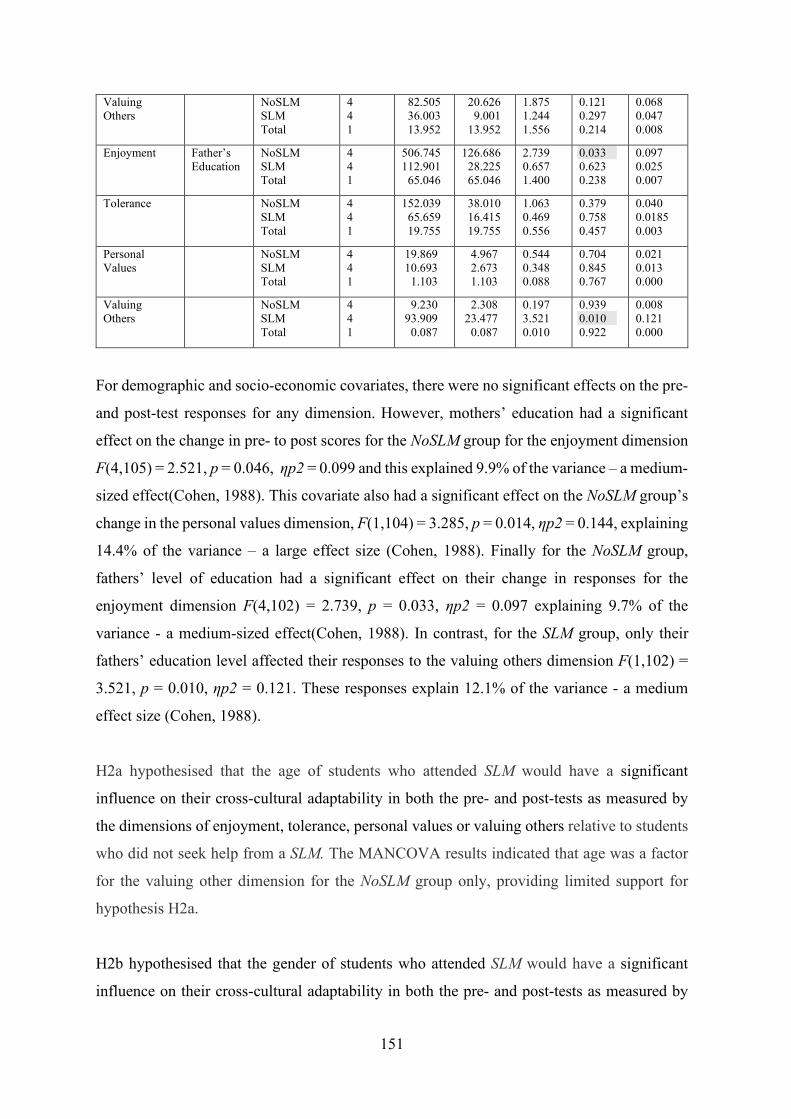
151
Valuing Others
NoSLM SLM Total
4 4 1
82.505 36.003 13.952
20.626 9.001 13.952
1.875 1.244 1.556
0.121 0.297 0.214
0.068 0.047 0.008
Enjoyment Father’s Education
NoSLM SLM Total
4 4 1
506.745 112.901 65.046
126.686 28.225 65.046
2.739 0.657 1.400
0.033 0.623 0.238
0.097 0.025 0.007
Tolerance NoSLM SLM Total
4 4 1
152.039 65.659 19.755
38.010 16.415 19.755
1.063 0.469 0.556
0.379 0.758 0.457
0.040 0.0185 0.003
Personal Values
NoSLM SLM Total
4 4 1
19.869 10.693 1.103
4.967 2.673 1.103
0.544 0.348 0.088
0.704 0.845 0.767
0.021 0.013 0.000
Valuing Others
NoSLM SLM Total
4 4 1
9.230 93.909 0.087
2.308 23.477 0.087
0.197 3.521 0.010
0.939 0.010 0.922
0.008 0.121 0.000
For demographic and socio-economic covariates, there were no significant effects on the pre-
and post-test responses for any dimension. However, mothers’ education had a significant
effect on the change in pre- to post scores for the NoSLM group for the enjoyment dimension
F(4,105) = 2.521, p = 0.046, ηp2 = 0.099 and this explained 9.9% of the variance – a medium-
sized effect(Cohen, 1988). This covariate also had a significant effect on the NoSLM group’s
change in the personal values dimension, F(1,104) = 3.285, p = 0.014, ηp2 = 0.144, explaining
14.4% of the variance – a large effect size (Cohen, 1988). Finally for the NoSLM group,
fathers’ level of education had a significant effect on their change in responses for the
enjoyment dimension F(4,102) = 2.739, p = 0.033, ηp2 = 0.097 explaining 9.7% of the
variance - a medium-sized effect(Cohen, 1988). In contrast, for the SLM group, only their
fathers’ education level affected their responses to the valuing others dimension F(1,102) =
3.521, p = 0.010, ηp2 = 0.121. These responses explain 12.1% of the variance - a medium
effect size (Cohen, 1988).
H2a hypothesised that the age of students who attended SLM would have a significant
influence on their cross-cultural adaptability in both the pre- and post-tests as measured by
the dimensions of enjoyment, tolerance, personal values or valuing others relative to students
who did not seek help from a SLM. The MANCOVA results indicated that age was a factor
for the valuing other dimension for the NoSLM group only, providing limited support for
hypothesis H2a.
H2b hypothesised that the gender of students who attended SLM would have a significant
influence on their cross-cultural adaptability in both the pre- and post-tests as measured by
152
the dimensions of enjoyment, tolerance, personal values or valuing others relative to students
who did not seek help from a SLM. The MANCOVA results indicate that gender is a factor
for the tolerance dimension for the NoSLM group only, providing limited support for
hypothesis H2b.
H2c hypothesised that for students have a cross-cultural mentoring experience with a SLM,
ethnicity would have a significant influence on their cross-cultural adaptability in both the
pre- and post-tests as measured by the dimensions of enjoyment, tolerance, personal values
or valuing others relative to students who did not seek help from a SLM. The MANCOVA
results indicate that ethnicity is a factor for the tolerance and personal values dimensions for
the NoSLM group only, providing limited support for hypothesis H2c.
H2d hypothesised that for students have a cross-cultural mentoring experience with a SLM,
mothers’ education level would have a significant influence on their cross-cultural
adaptability in both the pre- and post-tests as measured by the dimensions of enjoyment,
tolerance, personal values or valuing others relative to students who did not seek help from a
SLM. The MANCOVA results indicate that it is a factor for the enjoyment, tolerance and
personal values dimensions for the NoSLM group only, providing limited support for
hypothesis H2d.
H2e hypothesised that for students have a cross-cultural mentoring experience with a SLM,
fathers’ education level would have a significant influence on their cross-cultural adaptability
in both the pre- and post-tests as measured by the dimensions of enjoyment, tolerance,
personal values or valuing others relative to students who did not seek help from a SLM. The
MANCOVA results indicate that father’s education level is a factor for the personal values
dimensions for the NoSLM group and a factor for the SLM group for the valuing others
dimension, providing limited support for hypothesis H2e.
5.5.3 Differences between-groups – socialising
The third set of hypotheses proposed that higher education students’ the number of hours they
spent socialising or having friends or family from another cultural would influence their
cross-cultural adaptability and that the cross-cultural experience of seeking help from a SLM
would have a significant influence on their cross-cultural adaptability in both the pre- and
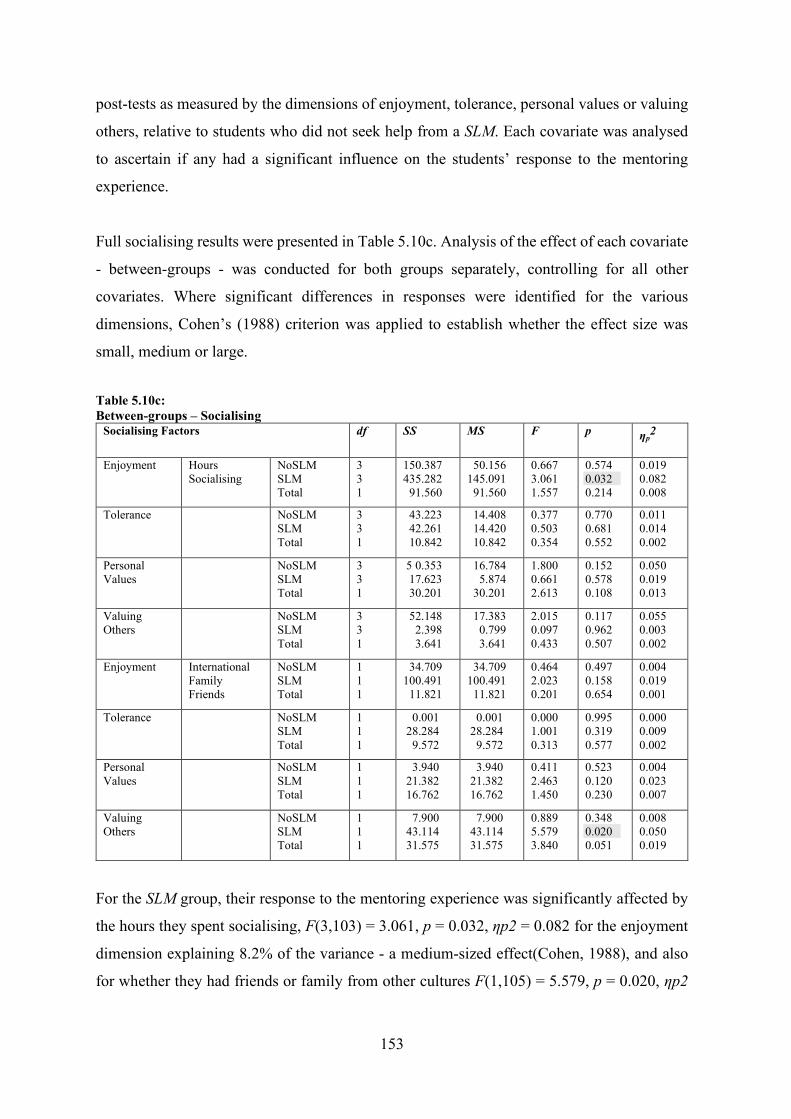
153
post-tests as measured by the dimensions of enjoyment, tolerance, personal values or valuing
others, relative to students who did not seek help from a SLM. Each covariate was analysed
to ascertain if any had a significant influence on the students’ response to the mentoring
experience.
Full socialising results were presented in Table 5.10c. Analysis of the effect of each covariate
- between-groups - was conducted for both groups separately, controlling for all other
covariates. Where significant differences in responses were identified for the various
dimensions, Cohen’s (1988) criterion was applied to establish whether the effect size was
small, medium or large.
Table 5.10c: Between-groups – Socialising
Socialising Factors df SS MS F p ηp2
Enjoyment Hours Socialising
NoSLM SLM Total
3 3 1
150.387 435.282 91.560
50.156 145.091 91.560
0.667 3.061 1.557
0.574 0.032 0.214
0.019 0.082 0.008
Tolerance NoSLM SLM Total
3 3 1
43.223 42.261 10.842
14.408 14.420 10.842
0.377 0.503 0.354
0.770 0.681 0.552
0.011 0.014 0.002
Personal Values
NoSLM SLM Total
3 3 1
5 0.353 17.623 30.201
16.784 5.874 30.201
1.800 0.661 2.613
0.152 0.578 0.108
0.050 0.019 0.013
Valuing Others
NoSLM SLM Total
3 3 1
52.148 2.398 3.641
17.383 0.799 3.641
2.015 0.097 0.433
0.117 0.962 0.507
0.055 0.003 0.002
Enjoyment International Family Friends
NoSLM SLM Total
1 1 1
34.709 100.491 11.821
34.709 100.491 11.821
0.464 2.023 0.201
0.497 0.158 0.654
0.004 0.019 0.001
Tolerance NoSLM SLM Total
1 1 1
0.001 28.284 9.572
0.001 28.284 9.572
0.000 1.001 0.313
0.995 0.319 0.577
0.000 0.009 0.002
Personal Values
NoSLM SLM Total
1 1 1
3.940 21.382 16.762
3.940 21.382 16.762
0.411 2.463 1.450
0.523 0.120 0.230
0.004 0.023 0.007
Valuing Others
NoSLM SLM Total
1 1 1
7.900 43.114 31.575
7.900 43.114 31.575
0.889 5.579 3.840
0.348 0.020 0.051
0.008 0.050 0.019
For the SLM group, their response to the mentoring experience was significantly affected by
the hours they spent socialising, F(3,103) = 3.061, p = 0.032, ηp2 = 0.082 for the enjoyment
dimension explaining 8.2% of the variance - a medium-sized effect(Cohen, 1988), and also
for whether they had friends or family from other cultures F(1,105) = 5.579, p = 0.020, ηp2
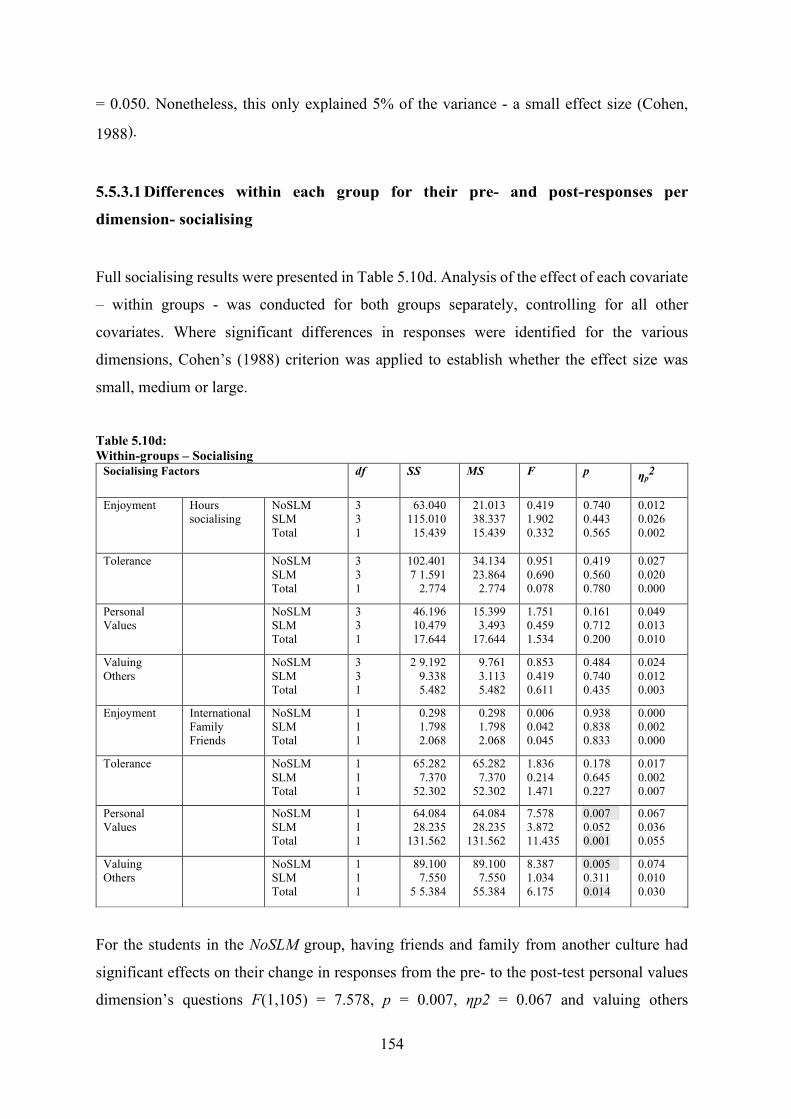
154
= 0.050. Nonetheless, this only explained 5% of the variance - a small effect size (Cohen,
1988).
5.5.3.1 Differences within each group for their pre- and post-responses per
dimension- socialising
Full socialising results were presented in Table 5.10d. Analysis of the effect of each covariate
– within groups - was conducted for both groups separately, controlling for all other
covariates. Where significant differences in responses were identified for the various
dimensions, Cohen’s (1988) criterion was applied to establish whether the effect size was
small, medium or large.
Table 5.10d: Within-groups – Socialising
Socialising Factors
df SS MS F p ηp2
Enjoyment Hours socialising
NoSLM SLM Total
3 3 1
63.040 115.010 15.439
21.013 38.337 15.439
0.419 1.902 0.332
0.740 0.443 0.565
0.012 0.026 0.002
Tolerance NoSLM SLM Total
3 3 1
102.401 7 1.591 2.774
34.134 23.864 2.774
0.951 0.690 0.078
0.419 0.560 0.780
0.027 0.020 0.000
Personal Values
NoSLM SLM Total
3 3 1
46.196 10.479 17.644
15.399 3.493 17.644
1.751 0.459 1.534
0.161 0.712 0.200
0.049 0.013 0.010
Valuing Others
NoSLM SLM Total
3 3 1
2 9.192 9.338 5.482
9.761 3.113 5.482
0.853 0.419 0.611
0.484 0.740 0.435
0.024 0.012 0.003
Enjoyment International Family Friends
NoSLM SLM Total
1 1 1
0.298 1.798 2.068
0.298 1.798 2.068
0.006 0.042 0.045
0.938 0.838 0.833
0.000 0.002 0.000
Tolerance NoSLM SLM Total
1 1 1
65.282 7.370 52.302
65.282 7.370 52.302
1.836 0.214 1.471
0.178 0.645 0.227
0.017 0.002 0.007
Personal Values
NoSLM SLM Total
1 1 1
64.084 28.235 131.562
64.084 28.235 131.562
7.578 3.872 11.435
0.007 0.052 0.001
0.067 0.036 0.055
Valuing Others
NoSLM SLM Total
1 1 1
89.100 7.550 5 5.384
89.100 7.550 55.384
8.387 1.034 6.175
0.005 0.311 0.014
0.074 0.010 0.030
For the students in the NoSLM group, having friends and family from another culture had
significant effects on their change in responses from the pre- to the post-test personal values
dimension’s questions F(1,105) = 7.578, p = 0.007, ηp2 = 0.067 and valuing others
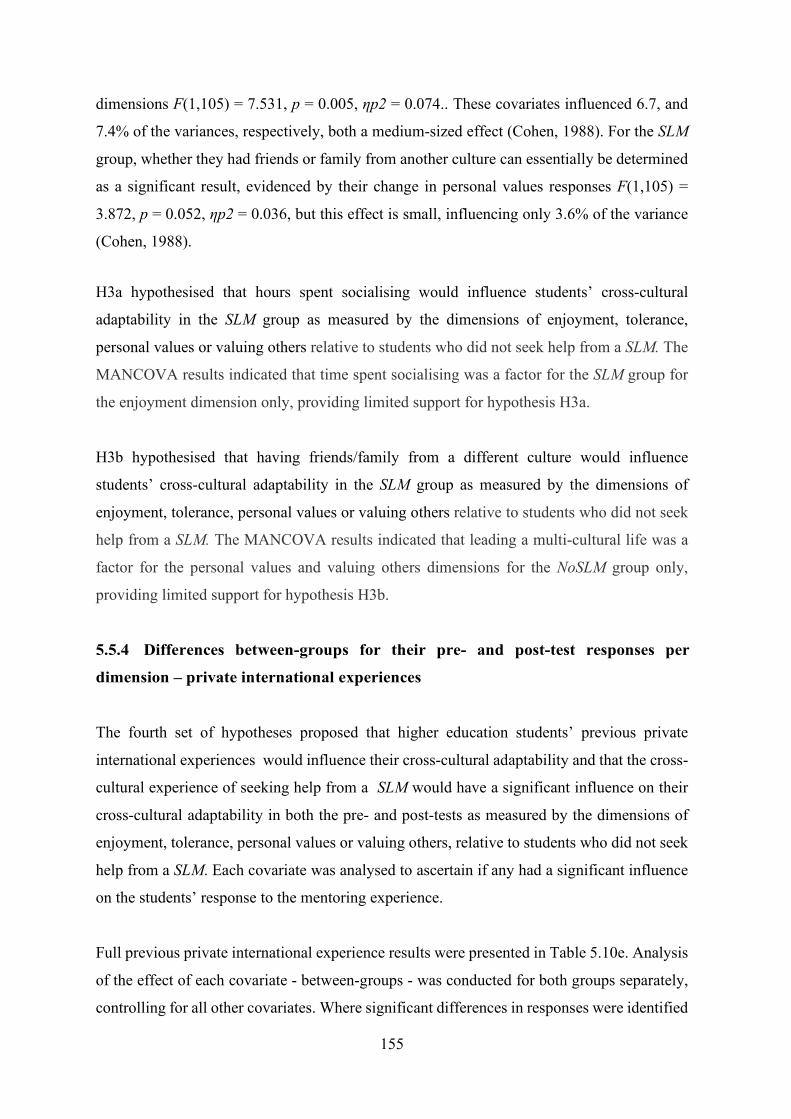
155
dimensions F(1,105) = 7.531, p = 0.005, ηp2 = 0.074.. These covariates influenced 6.7, and
7.4% of the variances, respectively, both a medium-sized effect (Cohen, 1988). For the SLM
group, whether they had friends or family from another culture can essentially be determined
as a significant result, evidenced by their change in personal values responses F(1,105) =
3.872, p = 0.052, ηp2 = 0.036, but this effect is small, influencing only 3.6% of the variance
(Cohen, 1988).
H3a hypothesised that hours spent socialising would influence students’ cross-cultural
adaptability in the SLM group as measured by the dimensions of enjoyment, tolerance,
personal values or valuing others relative to students who did not seek help from a SLM. The
MANCOVA results indicated that time spent socialising was a factor for the SLM group for
the enjoyment dimension only, providing limited support for hypothesis H3a.
H3b hypothesised that having friends/family from a different culture would influence
students’ cross-cultural adaptability in the SLM group as measured by the dimensions of
enjoyment, tolerance, personal values or valuing others relative to students who did not seek
help from a SLM. The MANCOVA results indicated that leading a multi-cultural life was a
factor for the personal values and valuing others dimensions for the NoSLM group only,
providing limited support for hypothesis H3b.
5.5.4 Differences between-groups for their pre- and post-test responses per
dimension – private international experiences
The fourth set of hypotheses proposed that higher education students’ previous private
international experiences would influence their cross-cultural adaptability and that the cross-
cultural experience of seeking help from a SLM would have a significant influence on their
cross-cultural adaptability in both the pre- and post-tests as measured by the dimensions of
enjoyment, tolerance, personal values or valuing others, relative to students who did not seek
help from a SLM. Each covariate was analysed to ascertain if any had a significant influence
on the students’ response to the mentoring experience.
Full previous private international experience results were presented in Table 5.10e. Analysis
of the effect of each covariate - between-groups - was conducted for both groups separately,
controlling for all other covariates. Where significant differences in responses were identified
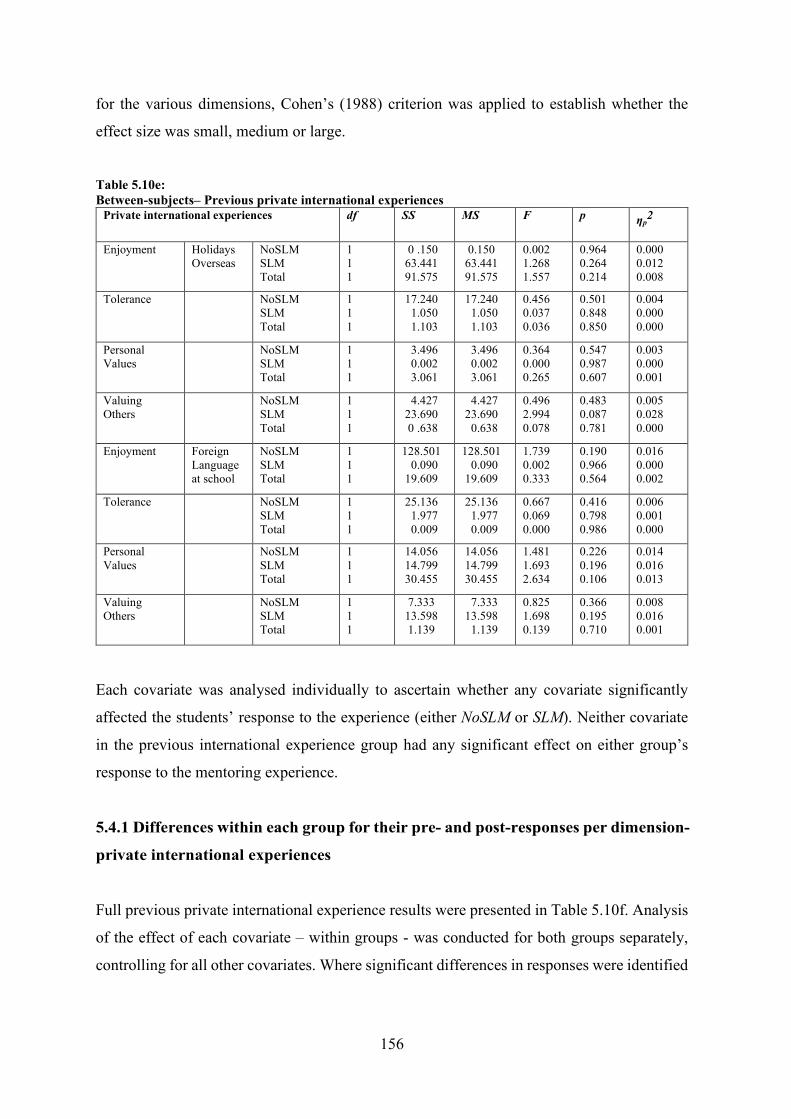
156
for the various dimensions, Cohen’s (1988) criterion was applied to establish whether the
effect size was small, medium or large.
Table 5.10e: Between-subjects– Previous private international experiences
Private international experiences
df SS MS F p ηp2
Enjoyment Holidays Overseas
NoSLM SLM Total
1 1 1
0 .150 63.441 91.575
0.150 63.441 91.575
0.002 1.268 1.557
0.964 0.264 0.214
0.000 0.012 0.008
Tolerance NoSLM SLM Total
1 1 1
17.240 1.050 1.103
17.240 1.050 1.103
0.456 0.037 0.036
0.501 0.848 0.850
0.004 0.000 0.000
Personal Values
NoSLM SLM Total
1 1 1
3.496 0.002 3.061
3.496 0.002 3.061
0.364 0.000 0.265
0.547 0.987 0.607
0.003 0.000 0.001
Valuing Others
NoSLM SLM Total
1 1 1
4.427 23.690 0 .638
4.427 23.690 0.638
0.496 2.994 0.078
0.483 0.087 0.781
0.005 0.028 0.000
Enjoyment Foreign Language at school
NoSLM SLM Total
1 1 1
128.501 0.090 19.609
128.501 0.090 19.609
1.739 0.002 0.333
0.190 0.966 0.564
0.016 0.000 0.002
Tolerance NoSLM SLM Total
1 1 1
25.136 1.977 0.009
25.136 1.977 0.009
0.667 0.069 0.000
0.416 0.798 0.986
0.006 0.001 0.000
Personal Values
NoSLM SLM Total
1 1 1
14.056 14.799 30.455
14.056 14.799 30.455
1.481 1.693 2.634
0.226 0.196 0.106
0.014 0.016 0.013
Valuing Others
NoSLM SLM Total
1 1 1
7.333 13.598 1.139
7.333 13.598 1.139
0.825 1.698 0.139
0.366 0.195 0.710
0.008 0.016 0.001
Each covariate was analysed individually to ascertain whether any covariate significantly
affected the students’ response to the experience (either NoSLM or SLM). Neither covariate
in the previous international experience group had any significant effect on either group’s
response to the mentoring experience.
5.4.1 Differences within each group for their pre- and post-responses per dimension-
private international experiences
Full previous private international experience results were presented in Table 5.10f. Analysis
of the effect of each covariate – within groups - was conducted for both groups separately,
controlling for all other covariates. Where significant differences in responses were identified
157
for the various dimensions, Cohen’s (1988) criterion was applied to establish whether the
effect size was small, medium or large.
Table 5.10f: Within-groups – Previous private international experiences
Private international experiences
df SS MS F p ηp2
Enjoyment Holidays Overseas
NoSLM SLM Total
1 1 1
0.472 138.273 56.710
0.472 138.273 56.710
0.009 3.333 1.221
0.923 0.071 0.271
0.000 0.031 0.006
Tolerance NoSLM SLM Total
1 1 1
4.974 3.305 11.531
4.974 3.305 11.531
0.138 0.096 0.324
0.711 0.758 0.570
0.001 0.001 0.002
Personal Values
NoSLM SLM Total
1 1 1
19.001 8.112 20200
19.001 8.112 20200
2.138 1.083 0.191
0.147 0.300 0.662
0.020 0.070 0.001
Valuing Others
NoSLM SLM Total
1 1 1
0.760 6.681 3.005
0.760 6.681 3.005
0.066 0.914 0.335
0.797 0.341 0.563
0.001 0.009 0.002
Enjoyment Foreign Language at school
NoSLM SLM Total
1 1 1
0.789 72.496 18.369
0.789 72.496 18.369
0.016 1.721 0.395
0.900 0.192 0.530
0.000 0.016 0.002
Tolerance NoSLM SLM Total
1 1 1
13.286 26.241 0.778
13.286 26.241 0.778
0.369 10.764 0.022
0.545 0.384 0.883
0.003 0.007 0.000
Personal Values
NoSLM SLM Total
1 1 1
3.188 8.985 0.476
3.188 8.985 0.476
0.353 1.201 0.041
0.554 0.276 0.839
0.003 0.011 0.000
Valuing Others
NoSLM SLM Total
1 1 1
0.005 5.477 0.206
0.005 5.477 0.206
0.000 0.748 0.023
0.984 0.389 0.880
0.000 0.007 0.000
Results showed that no covariate in the private international experience factors significantly
influenced students’ within-group changes from the pre- to the post-test responses to the
mentoring experience (either NoSLM or SLM) for any of the cultural dimensions, after
controlling for all other covariates.
H4a hypothesised that having been on private holidays in countries different from that in
which the student was born would influence students’ cross-cultural adaptability in the SLM
group as measured by the dimensions of enjoyment, tolerance, personal values or valuing
others relative to students who did not seek help from a SLM. The MANCOVA results
indicated that private overseas experiences did not influence students’ cross-cultural
adaptability. Therefore, hypothesis H4a was not significant.
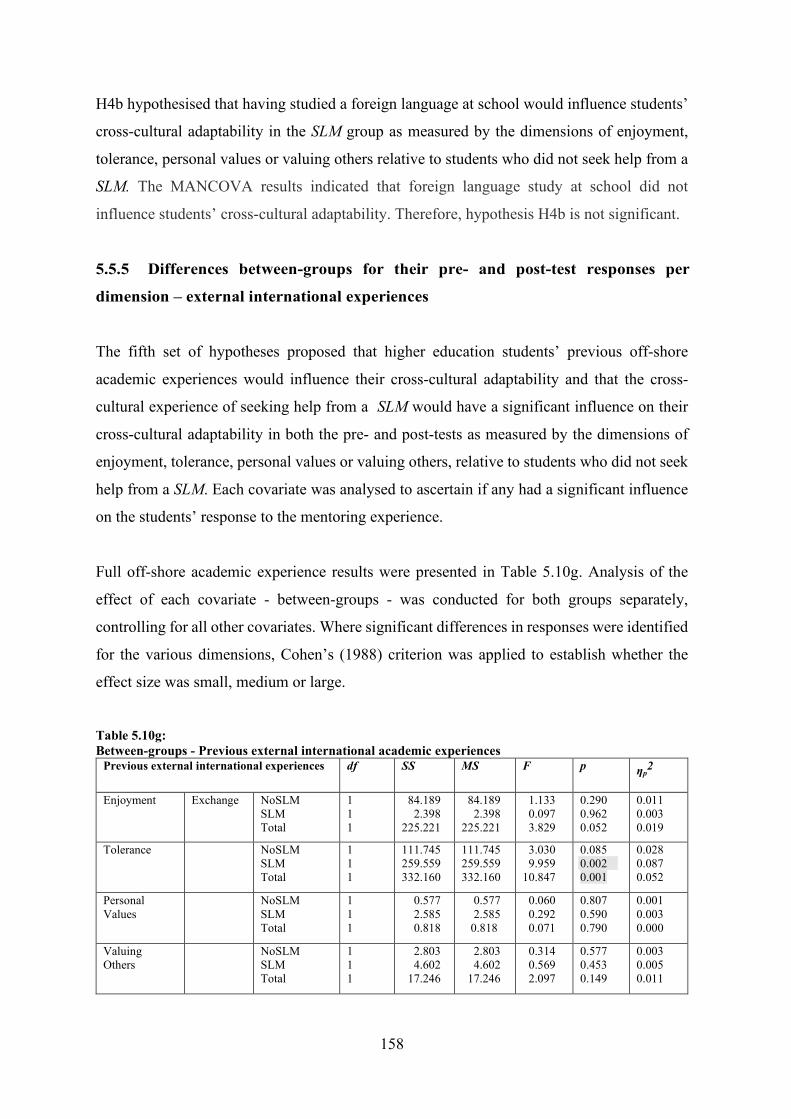
158
H4b hypothesised that having studied a foreign language at school would influence students’
cross-cultural adaptability in the SLM group as measured by the dimensions of enjoyment,
tolerance, personal values or valuing others relative to students who did not seek help from a
SLM. The MANCOVA results indicated that foreign language study at school did not
influence students’ cross-cultural adaptability. Therefore, hypothesis H4b is not significant.
5.5.5 Differences between-groups for their pre- and post-test responses per
dimension – external international experiences
The fifth set of hypotheses proposed that higher education students’ previous off-shore
academic experiences would influence their cross-cultural adaptability and that the cross-
cultural experience of seeking help from a SLM would have a significant influence on their
cross-cultural adaptability in both the pre- and post-tests as measured by the dimensions of
enjoyment, tolerance, personal values or valuing others, relative to students who did not seek
help from a SLM. Each covariate was analysed to ascertain if any had a significant influence
on the students’ response to the mentoring experience.
Full off-shore academic experience results were presented in Table 5.10g. Analysis of the
effect of each covariate - between-groups - was conducted for both groups separately,
controlling for all other covariates. Where significant differences in responses were identified
for the various dimensions, Cohen’s (1988) criterion was applied to establish whether the
effect size was small, medium or large.
Table 5.10g: Between-groups - Previous external international academic experiences
Previous external international experiences df SS MS F p ηp2
Enjoyment Exchange NoSLM SLM Total
1 1 1
84.189 2.398 225.221
84.189 2.398 225.221
1.133 0.097 3.829
0.290 0.962 0.052
0.011 0.003 0.019
Tolerance NoSLM SLM Total
1 1 1
111.745 259.559 332.160
111.745 259.559 332.160
3.030 9.959 10.847
0.085 0.002 0.001
0.028 0.087 0.052
Personal Values
NoSLM SLM Total
1 1 1
0.577 2.585 0.818
0.577 2.585 0.818
0.060 0.292 0.071
0.807 0.590 0.790
0.001 0.003 0.000
Valuing Others
NoSLM SLM Total
1 1 1
2.803 4.602 17.246
2.803 4.602 17.246
0.314 0.569 2.097
0.577 0.453 0.149
0.003 0.005 0.011
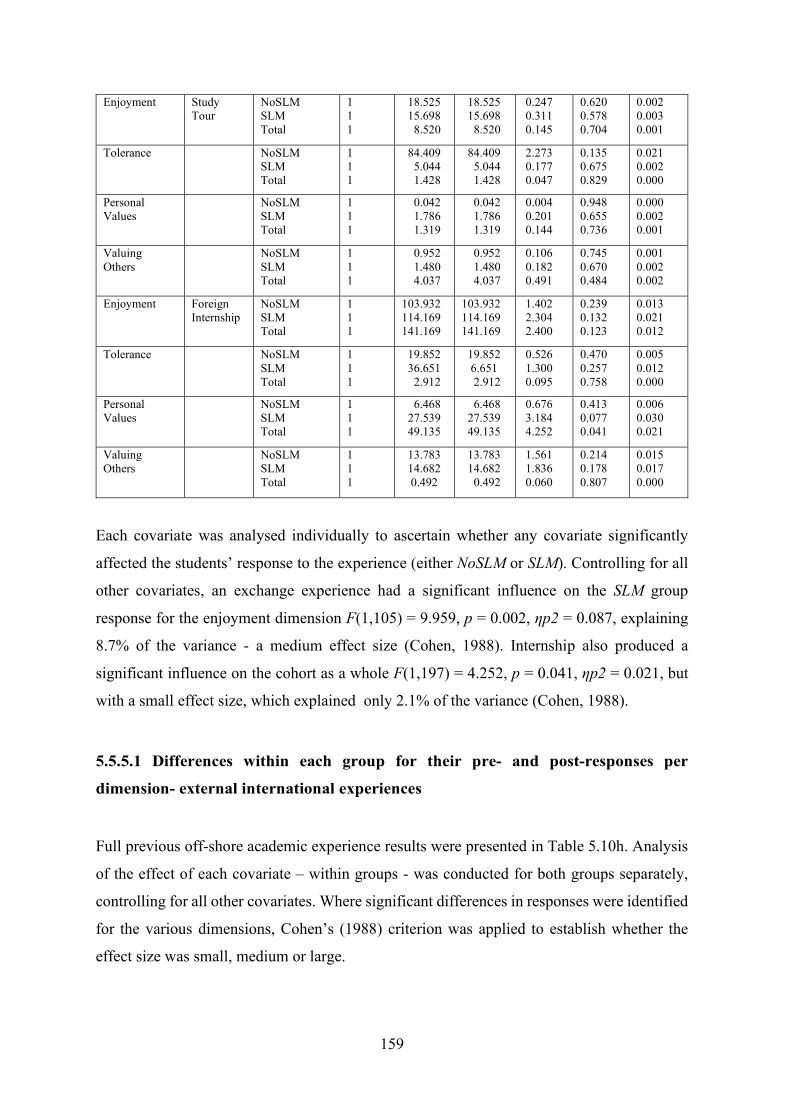
159
Enjoyment Study Tour
NoSLM SLM Total
1 1 1
18.525 15.698 8.520
18.525 15.698 8.520
0.247 0.311 0.145
0.620 0.578 0.704
0.002 0.003 0.001
Tolerance NoSLM SLM Total
1 1 1
84.409 5.044 1.428
84.409 5.044 1.428
2.273 0.177 0.047
0.135 0.675 0.829
0.021 0.002 0.000
Personal Values
NoSLM SLM Total
1 1 1
0.042 1.786 1.319
0.042 1.786 1.319
0.004 0.201 0.144
0.948 0.655 0.736
0.000 0.002 0.001
Valuing Others
NoSLM SLM Total
1 1 1
0.952 1.480 4.037
0.952 1.480 4.037
0.106 0.182 0.491
0.745 0.670 0.484
0.001 0.002 0.002
Enjoyment Foreign Internship
NoSLM SLM Total
1 1 1
103.932 114.169 141.169
103.932 114.169 141.169
1.402 2.304 2.400
0.239 0.132 0.123
0.013 0.021 0.012
Tolerance NoSLM SLM Total
1 1 1
19.852 36.651 2.912
19.852 6.651 2.912
0.526 1.300 0.095
0.470 0.257 0.758
0.005 0.012 0.000
Personal Values
NoSLM SLM Total
1 1 1
6.468 27.539 49.135
6.468 27.539 49.135
0.676 3.184 4.252
0.413 0.077 0.041
0.006 0.030 0.021
Valuing Others
NoSLM SLM Total
1 1 1
13.783 14.682 0.492
13.783 14.682 0.492
1.561 1.836 0.060
0.214 0.178 0.807
0.015 0.017 0.000
Each covariate was analysed individually to ascertain whether any covariate significantly
affected the students’ response to the experience (either NoSLM or SLM). Controlling for all
other covariates, an exchange experience had a significant influence on the SLM group
response for the enjoyment dimension F(1,105) = 9.959, p = 0.002, ηp2 = 0.087, explaining
8.7% of the variance - a medium effect size (Cohen, 1988). Internship also produced a
significant influence on the cohort as a whole F(1,197) = 4.252, p = 0.041, ηp2 = 0.021, but
with a small effect size, which explained only 2.1% of the variance (Cohen, 1988).
5.5.5.1 Differences within each group for their pre- and post-responses per
dimension- external international experiences
Full previous off-shore academic experience results were presented in Table 5.10h. Analysis
of the effect of each covariate – within groups - was conducted for both groups separately,
controlling for all other covariates. Where significant differences in responses were identified
for the various dimensions, Cohen’s (1988) criterion was applied to establish whether the
effect size was small, medium or large.
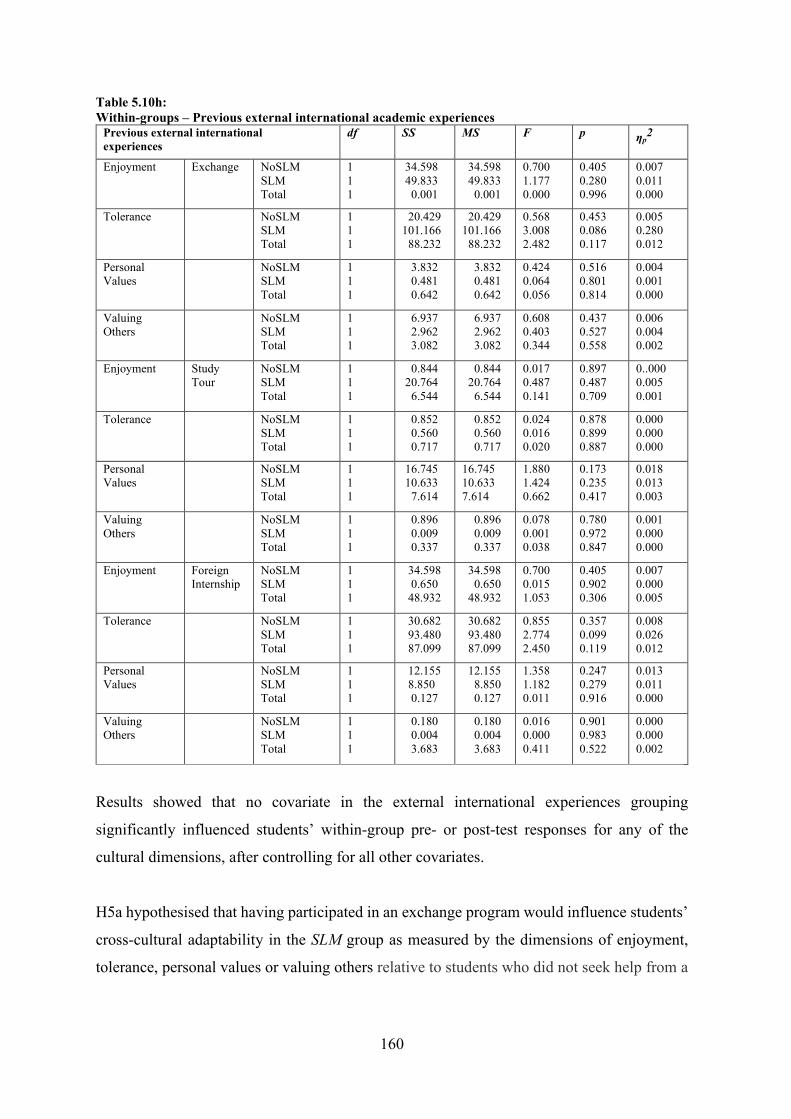
160
Table 5.10h: Within-groups – Previous external international academic experiences
Previous external international experiences
df SS MS F p ηp2
Enjoyment Exchange NoSLM SLM Total
1 1 1
34.598 49.833 0.001
34.598 49.833 0.001
0.700 1.177 0.000
0.405 0.280 0.996
0.007 0.011 0.000
Tolerance NoSLM SLM Total
1 1 1
20.429 101.166 88.232
20.429 101.166 88.232
0.568 3.008 2.482
0.453 0.086 0.117
0.005 0.280 0.012
Personal Values
NoSLM SLM Total
1 1 1
3.832 0.481 0.642
3.832 0.481 0.642
0.424 0.064 0.056
0.516 0.801 0.814
0.004 0.001 0.000
Valuing Others
NoSLM SLM Total
1 1 1
6.937 2.962 3.082
6.937 2.962 3.082
0.608 0.403 0.344
0.437 0.527 0.558
0.006 0.004 0.002
Enjoyment Study Tour
NoSLM SLM Total
1 1 1
0.844 20.764 6.544
0.844 20.764 6.544
0.017 0.487 0.141
0.897 0.487 0.709
0..000 0.005 0.001
Tolerance NoSLM SLM Total
1 1 1
0.852 0.560 0.717
0.852 0.560 0.717
0.024 0.016 0.020
0.878 0.899 0.887
0.000 0.000 0.000
Personal Values
NoSLM SLM Total
1 1 1
16.745 10.633 7.614
16.745 10.633 7.614
1.880 1.424 0.662
0.173 0.235 0.417
0.018 0.013 0.003
Valuing Others
NoSLM SLM Total
1 1 1
0.896 0.009 0.337
0.896 0.009 0.337
0.078 0.001 0.038
0.780 0.972 0.847
0.001 0.000 0.000
Enjoyment Foreign Internship
NoSLM SLM Total
1 1 1
34.598 0.650 48.932
34.598 0.650 48.932
0.700 0.015 1.053
0.405 0.902 0.306
0.007 0.000 0.005
Tolerance NoSLM SLM Total
1 1 1
30.682 93.480 87.099
30.682 93.480 87.099
0.855 2.774 2.450
0.357 0.099 0.119
0.008 0.026 0.012
Personal Values
NoSLM SLM Total
1 1 1
12.155 8.850 0.127
12.155 8.850 0.127
1.358 1.182 0.011
0.247 0.279 0.916
0.013 0.011 0.000
Valuing Others
NoSLM SLM Total
1 1 1
0.180 0.004 3.683
0.180 0.004 3.683
0.016 0.000 0.411
0.901 0.983 0.522
0.000 0.000 0.002
Results showed that no covariate in the external international experiences grouping
significantly influenced students’ within-group pre- or post-test responses for any of the
cultural dimensions, after controlling for all other covariates.
H5a hypothesised that having participated in an exchange program would influence students’
cross-cultural adaptability in the SLM group as measured by the dimensions of enjoyment,
tolerance, personal values or valuing others relative to students who did not seek help from a
161
SLM. The MANCOVA results indicated that such participation was a factor for the SLM group
for the enjoyment dimension only, providing limited support for hypothesis H5a.
H5b hypothesised that having attended an international study tour would influence students’
cross-cultural adaptability in the SLM group as measured by the dimensions of enjoyment,
tolerance, personal values or valuing others relative to students who did not seek help from a
SLM. The MANCOVA results indicated that such a tour is not a factor. Therefore, hypothesis
H5b was not significant.
H5c hypothesised that having completed an international internship would influence students’
cross-cultural adaptability in the SLM group as measured by the dimensions of enjoyment,
tolerance, personal values or valuing others relative to students who did not seek help from a
SLM. The MANCOVA results indicated that completion of an international internship was a
factor for the SLM group for the personal values dimension only, providing limited support
for hypothesis H5c.
5.5.6 Differences between-groups for their pre- and post-test responses per
dimension – internal international experiences
The sixth set of hypotheses proposed that higher education students’ previous onshore
international academic experiences would influence their cross-cultural adaptability and that
the cross-cultural experience of seeking help from a SLM would have a significant influence
on their cross-cultural adaptability in both the pre- and post-tests as measured by the
dimensions of enjoyment, tolerance, personal values or valuing others, relative to students
who did not seek help from a SLM. Each covariate was analysed to ascertain if any had a
significant influence on the students’ response to the mentoring experience.
Full previous offshore international academic experience results were presented in Table
5.10i. Analysis of the effect of each covariate - between-groups - was conducted for both
groups separately, controlling for all other covariates. Where significant differences in
responses were identified for the various dimensions, Cohen’s (1988) criterion was applied to
establish whether the effect size was small, medium or large.
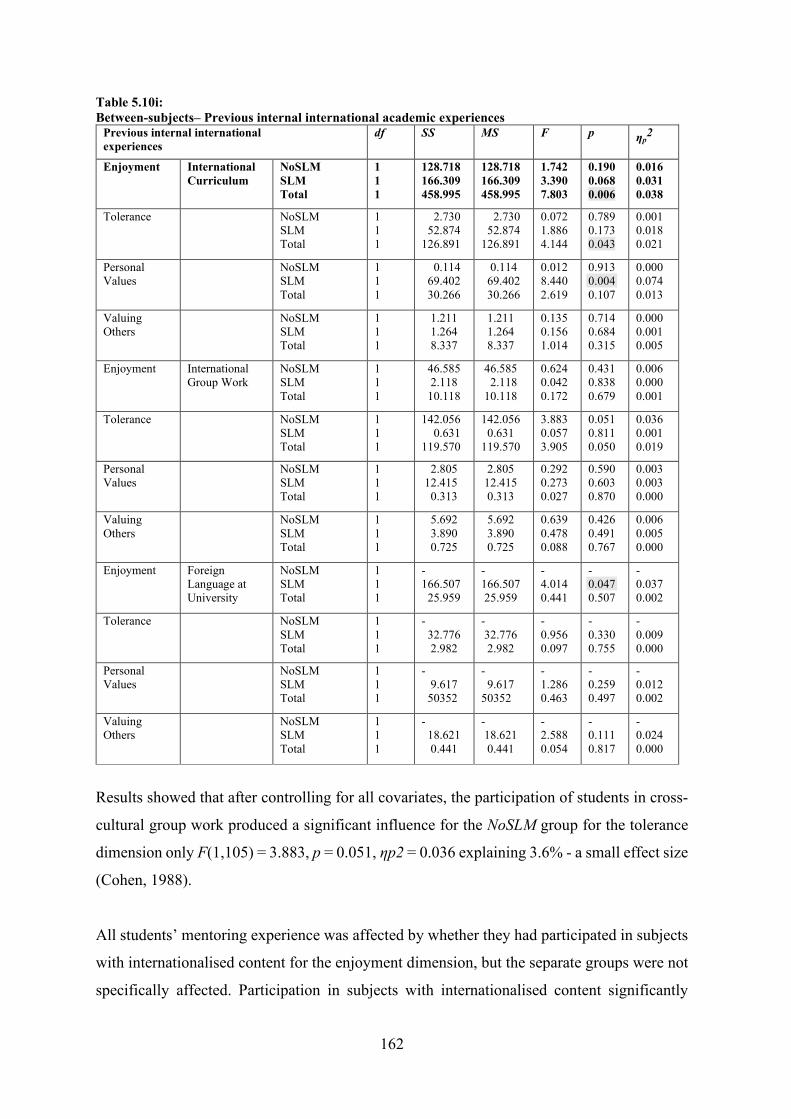
162
Table 5.10i: Between-subjects– Previous internal international academic experiences
Previous internal international experiences
df SS MS F p ηp2
Enjoyment International Curriculum
NoSLM SLM Total
1 1 1
128.718 166.309 458.995
128.718 166.309 458.995
1.742 3.390 7.803
0.190 0.068 0.006
0.016 0.031 0.038
Tolerance NoSLM SLM Total
1 1 1
2.730 52.874 126.891
2.730 52.874 126.891
0.072 1.886 4.144
0.789 0.173 0.043
0.001 0.018 0.021
Personal Values
NoSLM SLM Total
1 1 1
0.114 69.402 30.266
0.114 69.402 30.266
0.012 8.440 2.619
0.913 0.004 0.107
0.000 0.074 0.013
Valuing Others
NoSLM SLM Total
1 1 1
1.211 1.264 8.337
1.211 1.264 8.337
0.135 0.156 1.014
0.714 0.684 0.315
0.000 0.001 0.005
Enjoyment International Group Work
NoSLM SLM Total
1 1 1
46.585 2.118 10.118
46.585 2.118 10.118
0.624 0.042 0.172
0.431 0.838 0.679
0.006 0.000 0.001
Tolerance NoSLM SLM Total
1 1 1
142.056 0.631 119.570
142.056 0.631 119.570
3.883 0.057 3.905
0.051 0.811 0.050
0.036 0.001 0.019
Personal Values
NoSLM SLM Total
1 1 1
2.805 12.415 0.313
2.805 12.415 0.313
0.292 0.273 0.027
0.590 0.603 0.870
0.003 0.003 0.000
Valuing Others
NoSLM SLM Total
1 1 1
5.692 3.890 0.725
5.692 3.890 0.725
0.639 0.478 0.088
0.426 0.491 0.767
0.006 0.005 0.000
Enjoyment Foreign Language at University
NoSLM SLM Total
1 1 1
- 166.507 25.959
- 166.507 25.959
- 4.014 0.441
- 0.047 0.507
- 0.037 0.002
Tolerance NoSLM SLM Total
1 1 1
- 32.776 2.982
- 32.776 2.982
- 0.956 0.097
- 0.330 0.755
- 0.009 0.000
Personal Values
NoSLM SLM Total
1 1 1
- 9.617 50352
- 9.617 50352
- 1.286 0.463
- 0.259 0.497
- 0.012 0.002
Valuing Others
NoSLM SLM Total
1 1 1
- 18.621 0.441
- 18.621 0.441
- 2.588 0.054
- 0.111 0.817
- 0.024 0.000
Results showed that after controlling for all covariates, the participation of students in cross-
cultural group work produced a significant influence for the NoSLM group for the tolerance
dimension only F(1,105) = 3.883, p = 0.051, ηp2 = 0.036 explaining 3.6% - a small effect size
(Cohen, 1988).
All students’ mentoring experience was affected by whether they had participated in subjects
with internationalised content for the enjoyment dimension, but the separate groups were not
specifically affected. Participation in subjects with internationalised content significantly
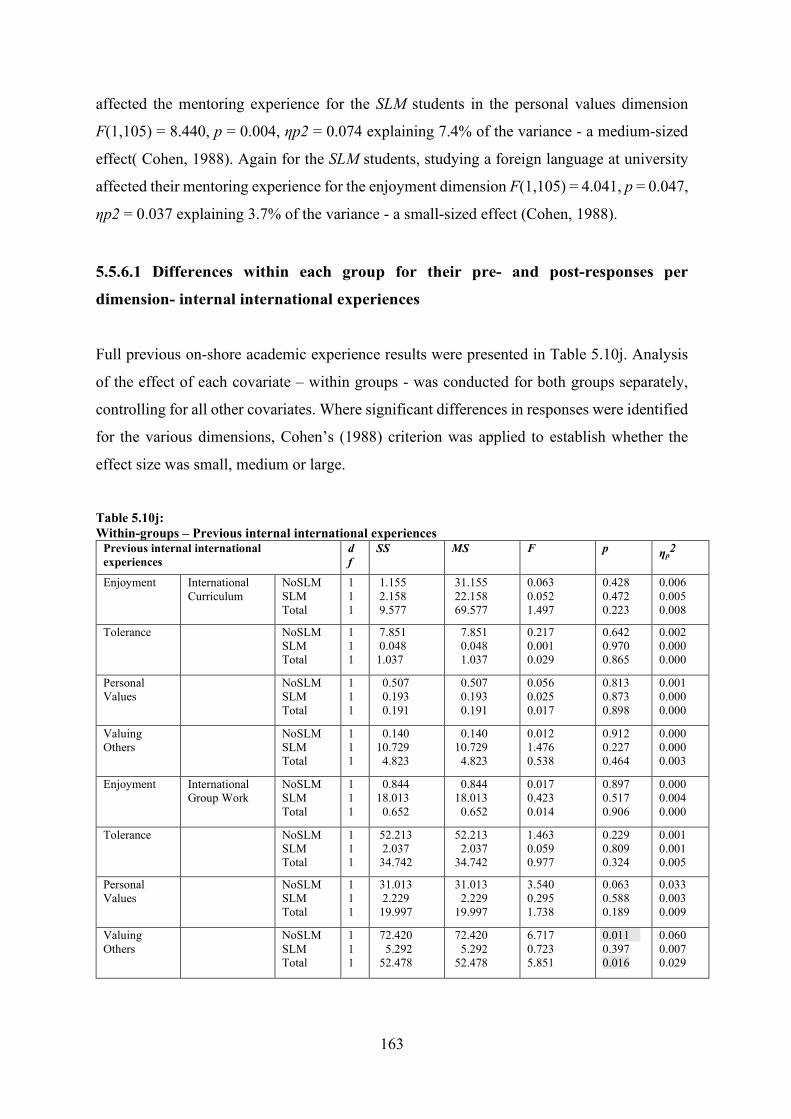
163
affected the mentoring experience for the SLM students in the personal values dimension
F(1,105) = 8.440, p = 0.004, ηp2 = 0.074 explaining 7.4% of the variance - a medium-sized
effect( Cohen, 1988). Again for the SLM students, studying a foreign language at university
affected their mentoring experience for the enjoyment dimension F(1,105) = 4.041, p = 0.047,
ηp2 = 0.037 explaining 3.7% of the variance - a small-sized effect (Cohen, 1988).
5.5.6.1 Differences within each group for their pre- and post-responses per
dimension- internal international experiences
Full previous on-shore academic experience results were presented in Table 5.10j. Analysis
of the effect of each covariate – within groups - was conducted for both groups separately,
controlling for all other covariates. Where significant differences in responses were identified
for the various dimensions, Cohen’s (1988) criterion was applied to establish whether the
effect size was small, medium or large.
Table 5.10j: Within-groups – Previous internal international experiences
Previous internal international experiences
df
SS MS F p ηp2
Enjoyment International Curriculum
NoSLM SLM Total
1 1 1
1.155 2.158 9.577
31.155 22.158 69.577
0.063 0.052 1.497
0.428 0.472 0.223
0.006 0.005 0.008
Tolerance NoSLM SLM Total
1 1 1
7.851 0.048 1.037
7.851 0.048 1.037
0.217 0.001 0.029
0.642 0.970 0.865
0.002 0.000 0.000
Personal Values
NoSLM SLM Total
1 1 1
0.507 0.193 0.191
0.507 0.193 0.191
0.056 0.025 0.017
0.813 0.873 0.898
0.001 0.000 0.000
Valuing Others
NoSLM SLM Total
1 1 1
0.140 10.729 4.823
0.140 10.729 4.823
0.012 1.476 0.538
0.912 0.227 0.464
0.000 0.000 0.003
Enjoyment International Group Work
NoSLM SLM Total
1 1 1
0.844 18.013 0.652
0.844 18.013 0.652
0.017 0.423 0.014
0.897 0.517 0.906
0.000 0.004 0.000
Tolerance NoSLM SLM Total
1 1 1
52.213 2.037 34.742
52.213 2.037 34.742
1.463 0.059 0.977
0.229 0.809 0.324
0.001 0.001 0.005
Personal Values
NoSLM SLM Total
1 1 1
31.013 2.229 19.997
31.013 2.229 19.997
3.540 0.295 1.738
0.063 0.588 0.189
0.033 0.003 0.009
Valuing Others
NoSLM SLM Total
1 1 1
72.420 5.292 52.478
72.420 5.292 52.478
6.717 0.723 5.851
0.011 0.397 0.016
0.060 0.007 0.029
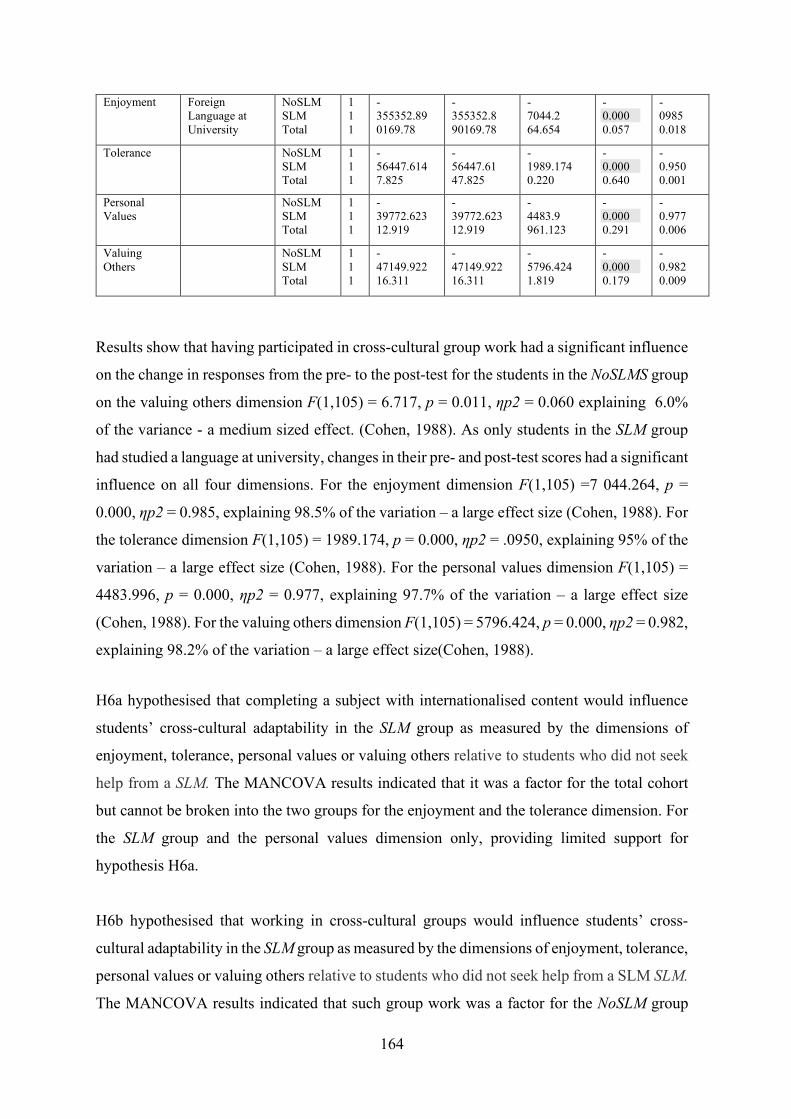
164
Enjoyment Foreign Language at University
NoSLM SLM Total
1 1 1
- 355352.890169.78
- 355352.8 90169.78
- 7044.2 64.654
- 0.000 0.057
- 0985 0.018
Tolerance NoSLM SLM Total
1 1 1
- 56447.6147.825
- 56447.61 47.825
- 1989.174 0.220
- 0.000 0.640
- 0.950 0.001
Personal Values
NoSLM SLM Total
1 1 1
- 39772.62312.919
- 39772.62312.919
- 4483.9 961.123
- 0.000 0.291
- 0.977 0.006
Valuing Others
NoSLM SLM Total
1 1 1
- 47149.92216.311
- 47149.92216.311
- 5796.424 1.819
- 0.000 0.179
- 0.982 0.009
Results show that having participated in cross-cultural group work had a significant influence
on the change in responses from the pre- to the post-test for the students in the NoSLMS group
on the valuing others dimension F(1,105) = 6.717, p = 0.011, ηp2 = 0.060 explaining 6.0%
of the variance - a medium sized effect. (Cohen, 1988). As only students in the SLM group
had studied a language at university, changes in their pre- and post-test scores had a significant
influence on all four dimensions. For the enjoyment dimension F(1,105) =7 044.264, p =
0.000, ηp2 = 0.985, explaining 98.5% of the variation – a large effect size (Cohen, 1988). For
the tolerance dimension F(1,105) = 1989.174, p = 0.000, ηp2 = .0950, explaining 95% of the
variation – a large effect size (Cohen, 1988). For the personal values dimension F(1,105) =
4483.996, p = 0.000, ηp2 = 0.977, explaining 97.7% of the variation – a large effect size
(Cohen, 1988). For the valuing others dimension F(1,105) = 5796.424, p = 0.000, ηp2 = 0.982,
explaining 98.2% of the variation – a large effect size(Cohen, 1988).
H6a hypothesised that completing a subject with internationalised content would influence
students’ cross-cultural adaptability in the SLM group as measured by the dimensions of
enjoyment, tolerance, personal values or valuing others relative to students who did not seek
help from a SLM. The MANCOVA results indicated that it was a factor for the total cohort
but cannot be broken into the two groups for the enjoyment and the tolerance dimension. For
the SLM group and the personal values dimension only, providing limited support for
hypothesis H6a.
H6b hypothesised that working in cross-cultural groups would influence students’ cross-
cultural adaptability in the SLM group as measured by the dimensions of enjoyment, tolerance,
personal values or valuing others relative to students who did not seek help from a SLM SLM.
The MANCOVA results indicated that such group work was a factor for the NoSLM group
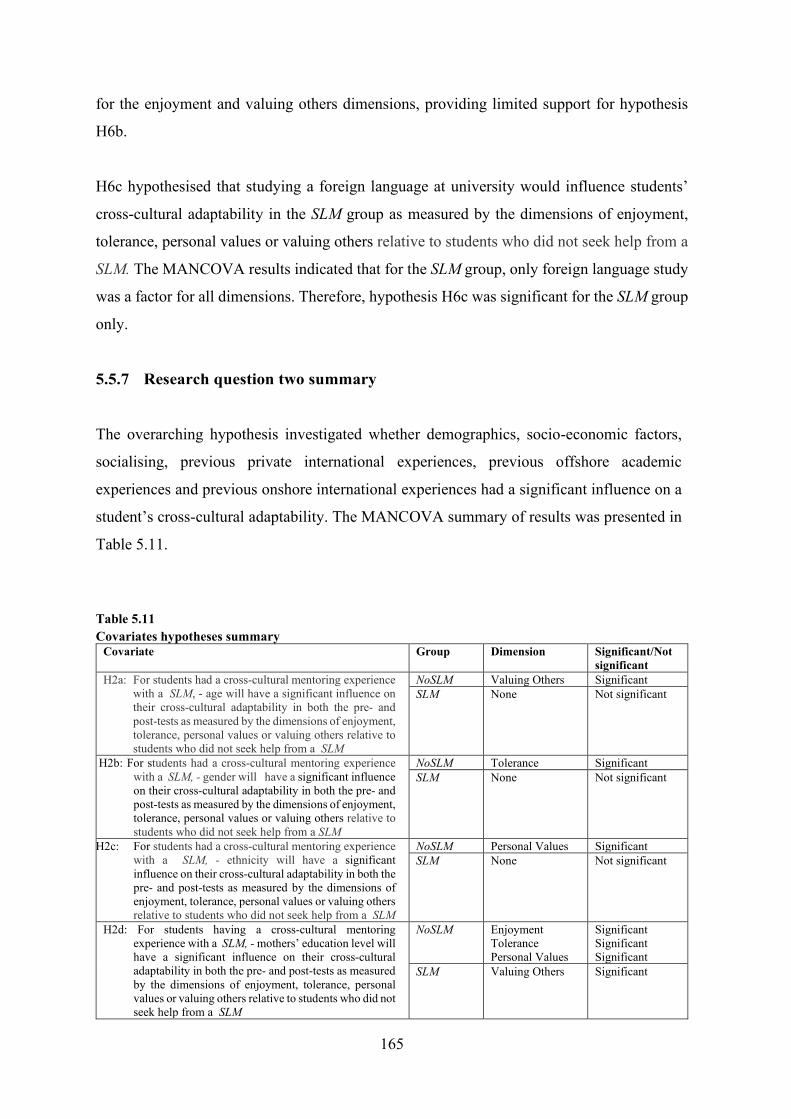
165
for the enjoyment and valuing others dimensions, providing limited support for hypothesis
H6b.
H6c hypothesised that studying a foreign language at university would influence students’
cross-cultural adaptability in the SLM group as measured by the dimensions of enjoyment,
tolerance, personal values or valuing others relative to students who did not seek help from a
SLM. The MANCOVA results indicated that for the SLM group, only foreign language study
was a factor for all dimensions. Therefore, hypothesis H6c was significant for the SLM group
only.
5.5.7 Research question two summary
The overarching hypothesis investigated whether demographics, socio-economic factors,
socialising, previous private international experiences, previous offshore academic
experiences and previous onshore international experiences had a significant influence on a
student’s cross-cultural adaptability. The MANCOVA summary of results was presented in
Table 5.11.
Table 5.11 Covariates hypotheses summary
Covariate Group Dimension
Significant/Not significant
H2a: For students had a cross-cultural mentoring experience with a SLM, - age will have a significant influence on their cross-cultural adaptability in both the pre- and post-tests as measured by the dimensions of enjoyment, tolerance, personal values or valuing others relative to students who did not seek help from a SLM
NoSLM Valuing Others Significant SLM None Not significant
H2b: For students had a cross-cultural mentoring experience with a SLM, - gender will have a significant influence on their cross-cultural adaptability in both the pre- and post-tests as measured by the dimensions of enjoyment, tolerance, personal values or valuing others relative to students who did not seek help from a SLM
NoSLM Tolerance Significant SLM None Not significant
H2c: For students had a cross-cultural mentoring experience with a SLM, - ethnicity will have a significant influence on their cross-cultural adaptability in both the pre- and post-tests as measured by the dimensions of enjoyment, tolerance, personal values or valuing others relative to students who did not seek help from a SLM
NoSLM Personal Values Significant SLM None Not significant
H2d: For students having a cross-cultural mentoring experience with a SLM, - mothers’ education level will have a significant influence on their cross-cultural adaptability in both the pre- and post-tests as measured by the dimensions of enjoyment, tolerance, personal values or valuing others relative to students who did not seek help from a SLM
NoSLM Enjoyment Tolerance Personal Values
Significant Significant Significant
SLM Valuing Others Significant
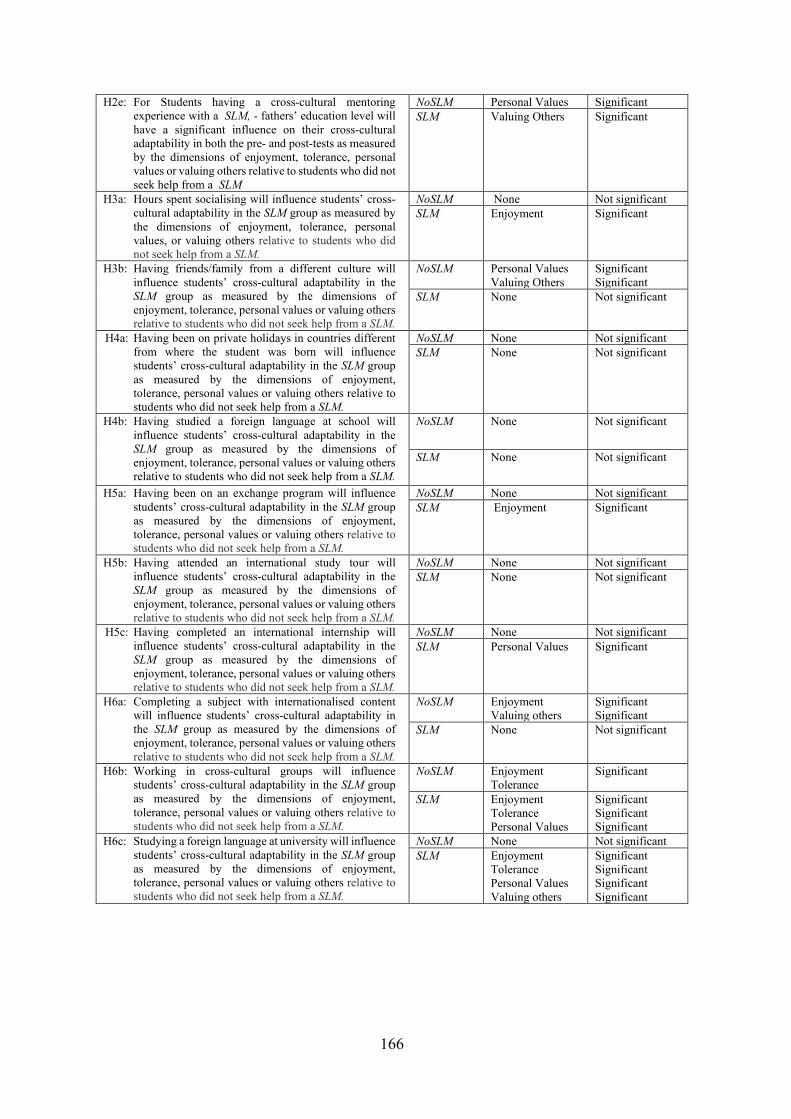
166
H2e: For Students having a cross-cultural mentoring experience with a SLM, - fathers’ education level will have a significant influence on their cross-cultural adaptability in both the pre- and post-tests as measured by the dimensions of enjoyment, tolerance, personal values or valuing others relative to students who did not seek help from a SLM
NoSLM Personal Values Significant SLM Valuing Others Significant
H3a: Hours spent socialising will influence students’ cross-cultural adaptability in the SLM group as measured by the dimensions of enjoyment, tolerance, personal values, or valuing others relative to students who did not seek help from a SLM.
NoSLM None Not significant SLM Enjoyment Significant
H3b: Having friends/family from a different culture will influence students’ cross-cultural adaptability in the SLM group as measured by the dimensions of enjoyment, tolerance, personal values or valuing others relative to students who did not seek help from a SLM.
NoSLM Personal Values Valuing Others
Significant Significant
SLM None Not significant
H4a: Having been on private holidays in countries different from where the student was born will influence students’ cross-cultural adaptability in the SLM group as measured by the dimensions of enjoyment, tolerance, personal values or valuing others relative to students who did not seek help from a SLM.
NoSLM None Not significant SLM None Not significant
H4b: Having studied a foreign language at school will influence students’ cross-cultural adaptability in the SLM group as measured by the dimensions of enjoyment, tolerance, personal values or valuing others relative to students who did not seek help from a SLM.
NoSLM None Not significant
SLM None Not significant
H5a: Having been on an exchange program will influence students’ cross-cultural adaptability in the SLM group as measured by the dimensions of enjoyment, tolerance, personal values or valuing others relative to students who did not seek help from a SLM.
NoSLM None Not significant SLM Enjoyment Significant
H5b: Having attended an international study tour will influence students’ cross-cultural adaptability in the SLM group as measured by the dimensions of enjoyment, tolerance, personal values or valuing others relative to students who did not seek help from a SLM.
NoSLM None Not significant SLM None Not significant
H5c: Having completed an international internship will influence students’ cross-cultural adaptability in the SLM group as measured by the dimensions of enjoyment, tolerance, personal values or valuing others relative to students who did not seek help from a SLM.
NoSLM None Not significant SLM Personal Values Significant
H6a: Completing a subject with internationalised content will influence students’ cross-cultural adaptability in the SLM group as measured by the dimensions of enjoyment, tolerance, personal values or valuing others relative to students who did not seek help from a SLM.
NoSLM Enjoyment Valuing others
Significant Significant
SLM None Not significant
H6b: Working in cross-cultural groups will influence students’ cross-cultural adaptability in the SLM group as measured by the dimensions of enjoyment, tolerance, personal values or valuing others relative to students who did not seek help from a SLM.
NoSLM Enjoyment Tolerance
Significant
SLM Enjoyment Tolerance Personal Values
Significant Significant Significant
H6c: Studying a foreign language at university will influence students’ cross-cultural adaptability in the SLM group as measured by the dimensions of enjoyment, tolerance, personal values or valuing others relative to students who did not seek help from a SLM.
NoSLM None Not significant SLM Enjoyment
Tolerance Personal Values Valuing others
Significant Significant Significant Significant
167
5.6 Conclusion
This study assessed whether cross-cultural peer-to-peer mentoring influenced the cross-
cultural adaptability of the respondents, and whether these changes were significant. Table
5.9 on page 143 summarised the results of research question one. Analysis was also
undertaken to determine whether demographics, socio-economic factors, socialising, previous
private international experiences, external international academic experiences, or internal
international academic experiences influenced the respondents’ cross-cultural adaptability.
Table 5.11 summarised the results of research question two. This study applied the CCAI™
(Kelley & Meyers 1987, 1992) to a different cohort, and used EFA to determine which
questions came together to represent the cultural dimensions. As a result of EFA, the
dimensions were re-defined as enjoyment, tolerance, personal values and valuing others.
Overall, the results suggested that participation in the SLM program did not influence
students’ cross-cultural adaptability, but further MANCOVA testing suggested that in some
circumstances, students’ prior demographic and socio-economic factors, international
academic experiences either abroad or ‘at home’ may have influenced students’ cross-cultural
adaptability, and that different dimensions were affected depending on whether the student
was in the NoSLM or the SLM group. The MANCOVA results illustrated what covariates
were inferential for the cultural dimensions, but they were not able to provide directional
information.
Figure 5.5 showed the proposed conceptual model and the pathways of influence that were
tested during this study. Although hypotheses 1a, 1b, 1c and 1d were found not to be
significant, H2, H5 and H6 were found to have some significant covariates within each
grouping that did influence students’ cross-cultural adaptability.
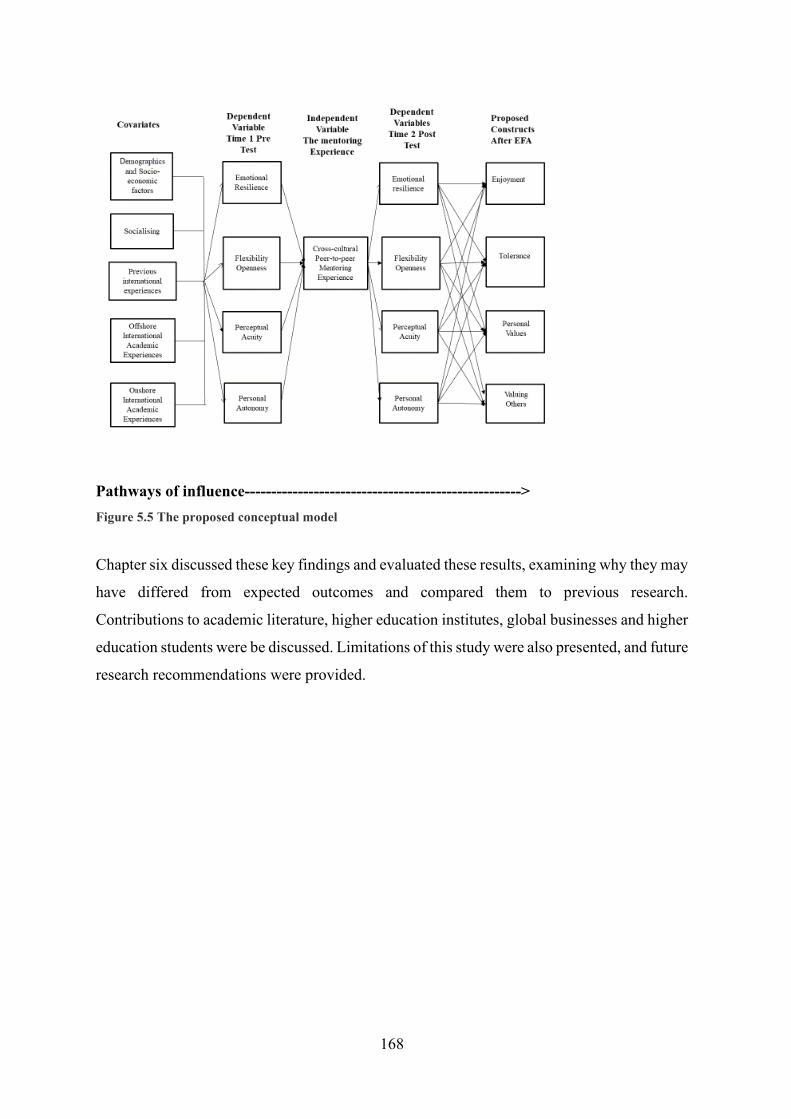
168
Pathways of influence----------------------------------------------------> Figure 5.5 The proposed conceptual model
Chapter six discussed these key findings and evaluated these results, examining why they may
have differed from expected outcomes and compared them to previous research.
Contributions to academic literature, higher education institutes, global businesses and higher
education students were be discussed. Limitations of this study were also presented, and future
research recommendations were provided.
169
Chapter 6
DISCUSSION AND CONCLUSION
6.1 Introduction
Chapter five presented the findings related to the research questions central to the focus of
this quasi-experimental study. It assessed whether cross-cultural peer-to-peer mentoring
influenced the cross-cultural adaptability of the participants. Analysis was also undertaken to
determine whether demographics, socio-economic factors, socialising, previous private
international experiences, external international academic experiences or internal
international academic experiences may have influenced the respondents’ cross-cultural
adaptability as defined by Kelley and Meyers (1987, 1992). The chapter also introduced and
discussed the development of the new measurement instrument (IECCA) for future use. It
also proposed a conceptual model for future consideration as an analytical tool and tested the
six sets of proposed hypotheses.
Chapter six presented an overview regarding the interpretation of the proposed ETPV
conceptual model and a discussion of the analysis presented in the thesis. The purpose of this
chapter was fourfold. First, the chapter presented an overview of the results of hypothesis
testing. Second, it reflected upon the contributions this thesis makes to the literature, both at
a conceptual level and at a practical level in terms of graduates and universities’ pedagogies
and university marketing implications. The third aim of this chapter was to identify the
limitations of this study, and the fourth and final aim of this chapter was to identify and
suggest recommendations and opportunities for future research in this field of study.
This chapter discussed the aims and research questions that were addresses in this study. The
specific aims of this study were:
1. To identify which drivers are the most important in understanding the students’ cross-
cultural adaptability
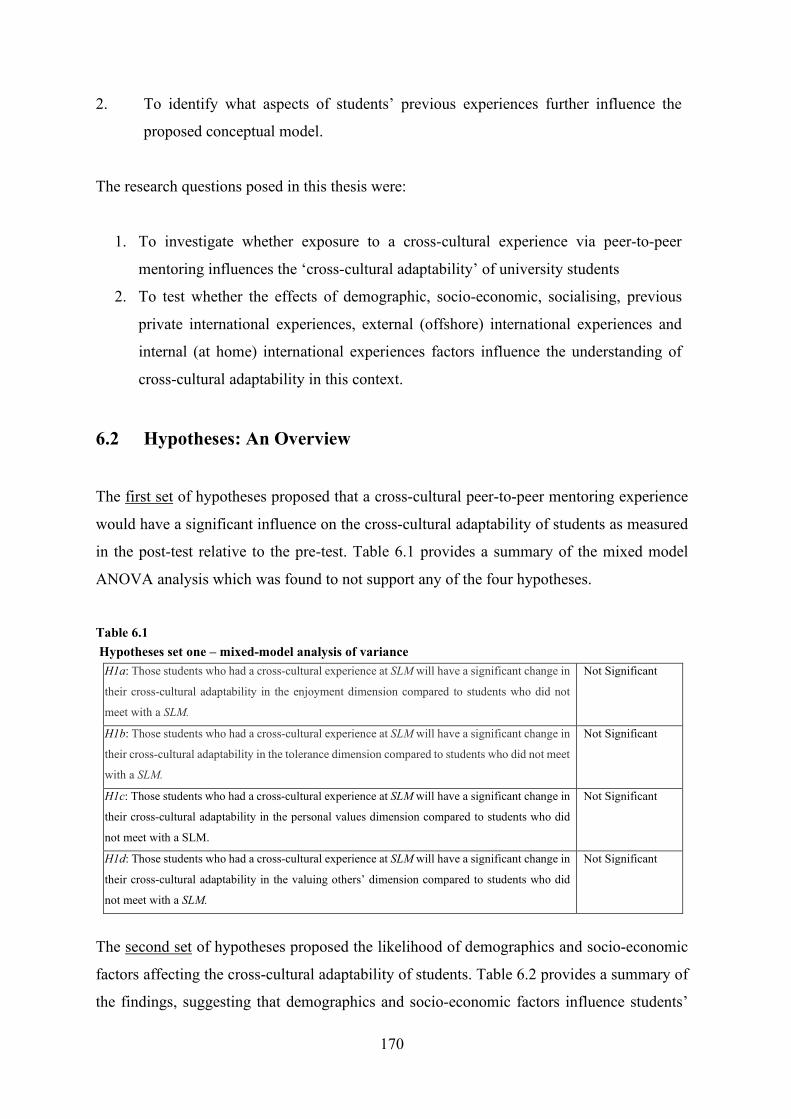
170
2. To identify what aspects of students’ previous experiences further influence the
proposed conceptual model.
The research questions posed in this thesis were:
1. To investigate whether exposure to a cross-cultural experience via peer-to-peer
mentoring influences the ‘cross-cultural adaptability’ of university students
2. To test whether the effects of demographic, socio-economic, socialising, previous
private international experiences, external (offshore) international experiences and
internal (at home) international experiences factors influence the understanding of
cross-cultural adaptability in this context.
6.2 Hypotheses: An Overview
The first set of hypotheses proposed that a cross-cultural peer-to-peer mentoring experience
would have a significant influence on the cross-cultural adaptability of students as measured
in the post-test relative to the pre-test. Table 6.1 provides a summary of the mixed model
ANOVA analysis which was found to not support any of the four hypotheses.
Table 6.1 Hypotheses set one – mixed-model analysis of variance
H1a: Those students who had a cross-cultural experience at SLM will have a significant change in
their cross-cultural adaptability in the enjoyment dimension compared to students who did not
meet with a SLM.
Not Significant
H1b: Those students who had a cross-cultural experience at SLM will have a significant change in
their cross-cultural adaptability in the tolerance dimension compared to students who did not meet
with a SLM.
Not Significant
H1c: Those students who had a cross-cultural experience at SLM will have a significant change in
their cross-cultural adaptability in the personal values dimension compared to students who did
not meet with a SLM.
Not Significant
H1d: Those students who had a cross-cultural experience at SLM will have a significant change in
their cross-cultural adaptability in the valuing others’ dimension compared to students who did
not meet with a SLM.
Not Significant
The second set of hypotheses proposed the likelihood of demographics and socio-economic
factors affecting the cross-cultural adaptability of students. Table 6.2 provides a summary of
the findings, suggesting that demographics and socio-economic factors influence students’
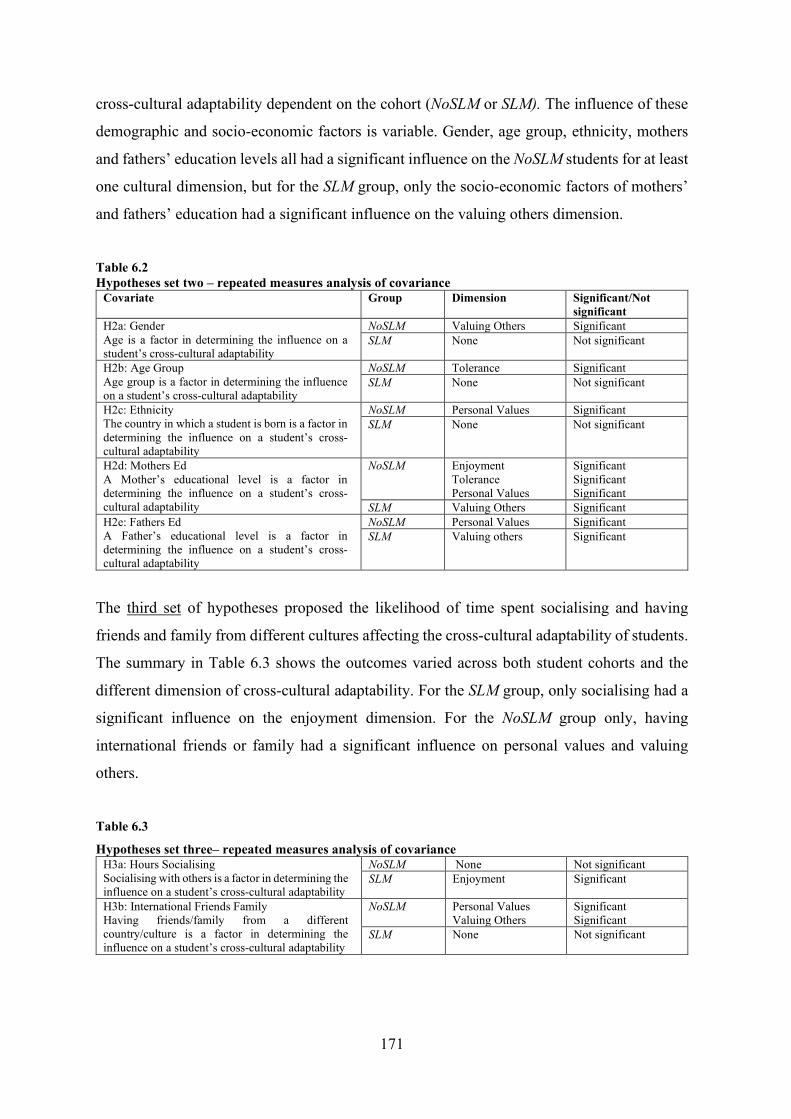
171
cross-cultural adaptability dependent on the cohort (NoSLM or SLM). The influence of these
demographic and socio-economic factors is variable. Gender, age group, ethnicity, mothers
and fathers’ education levels all had a significant influence on the NoSLM students for at least
one cultural dimension, but for the SLM group, only the socio-economic factors of mothers’
and fathers’ education had a significant influence on the valuing others dimension.
Table 6.2 Hypotheses set two – repeated measures analysis of covariance
Covariate Group Dimension
Significant/Not significant
H2a: Gender Age is a factor in determining the influence on a student’s cross-cultural adaptability
NoSLM Valuing Others Significant SLM None Not significant
H2b: Age Group Age group is a factor in determining the influence on a student’s cross-cultural adaptability
NoSLM Tolerance Significant SLM None Not significant
H2c: Ethnicity The country in which a student is born is a factor in determining the influence on a student’s cross-cultural adaptability
NoSLM Personal Values Significant SLM None Not significant
H2d: Mothers Ed A Mother’s educational level is a factor in determining the influence on a student’s cross-cultural adaptability
NoSLM Enjoyment Tolerance Personal Values
Significant Significant Significant
SLM Valuing Others Significant H2e: Fathers Ed A Father’s educational level is a factor in determining the influence on a student’s cross-cultural adaptability
NoSLM Personal Values Significant SLM Valuing others Significant
The third set of hypotheses proposed the likelihood of time spent socialising and having
friends and family from different cultures affecting the cross-cultural adaptability of students.
The summary in Table 6.3 shows the outcomes varied across both student cohorts and the
different dimension of cross-cultural adaptability. For the SLM group, only socialising had a
significant influence on the enjoyment dimension. For the NoSLM group only, having
international friends or family had a significant influence on personal values and valuing
others.
Table 6.3
Hypotheses set three– repeated measures analysis of covariance H3a: Hours Socialising Socialising with others is a factor in determining the influence on a student’s cross-cultural adaptability
NoSLM None Not significant SLM Enjoyment Significant
H3b: International Friends Family Having friends/family from a different country/culture is a factor in determining the influence on a student’s cross-cultural adaptability
NoSLM Personal Values Valuing Others
Significant Significant
SLM None Not significant
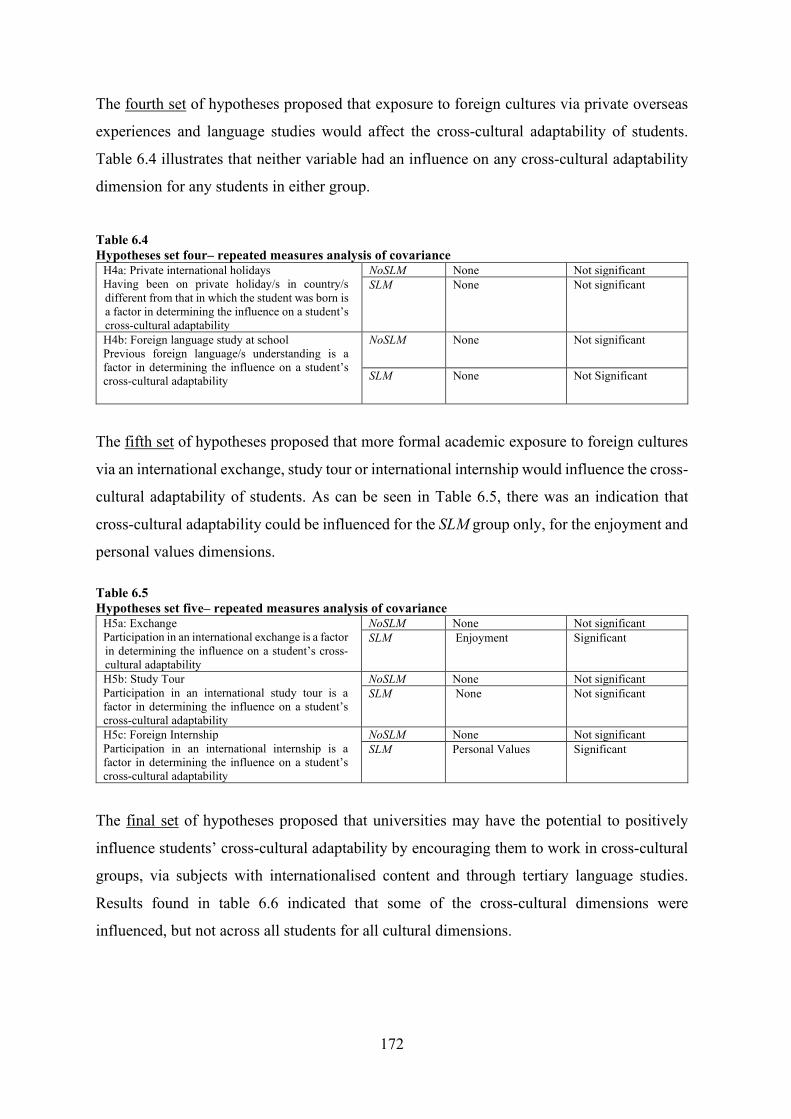
172
The fourth set of hypotheses proposed that exposure to foreign cultures via private overseas
experiences and language studies would affect the cross-cultural adaptability of students.
Table 6.4 illustrates that neither variable had an influence on any cross-cultural adaptability
dimension for any students in either group.
Table 6.4 Hypotheses set four– repeated measures analysis of covariance
H4a: Private international holidays Having been on private holiday/s in country/s different from that in which the student was born is a factor in determining the influence on a student’s cross-cultural adaptability
NoSLM None Not significant SLM None Not significant
H4b: Foreign language study at school Previous foreign language/s understanding is a factor in determining the influence on a student’s cross-cultural adaptability
NoSLM None Not significant
SLM None Not Significant
The fifth set of hypotheses proposed that more formal academic exposure to foreign cultures
via an international exchange, study tour or international internship would influence the cross-
cultural adaptability of students. As can be seen in Table 6.5, there was an indication that
cross-cultural adaptability could be influenced for the SLM group only, for the enjoyment and
personal values dimensions. Table 6.5 Hypotheses set five– repeated measures analysis of covariance
H5a: Exchange Participation in an international exchange is a factor in determining the influence on a student’s cross-cultural adaptability
NoSLM None Not significant SLM Enjoyment Significant
H5b: Study Tour Participation in an international study tour is a factor in determining the influence on a student’s cross-cultural adaptability
NoSLM None Not significant SLM None Not significant
H5c: Foreign Internship Participation in an international internship is a factor in determining the influence on a student’s cross-cultural adaptability
NoSLM None Not significant SLM Personal Values Significant
The final set of hypotheses proposed that universities may have the potential to positively
influence students’ cross-cultural adaptability by encouraging them to work in cross-cultural
groups, via subjects with internationalised content and through tertiary language studies.
Results found in table 6.6 indicated that some of the cross-cultural dimensions were
influenced, but not across all students for all cultural dimensions.
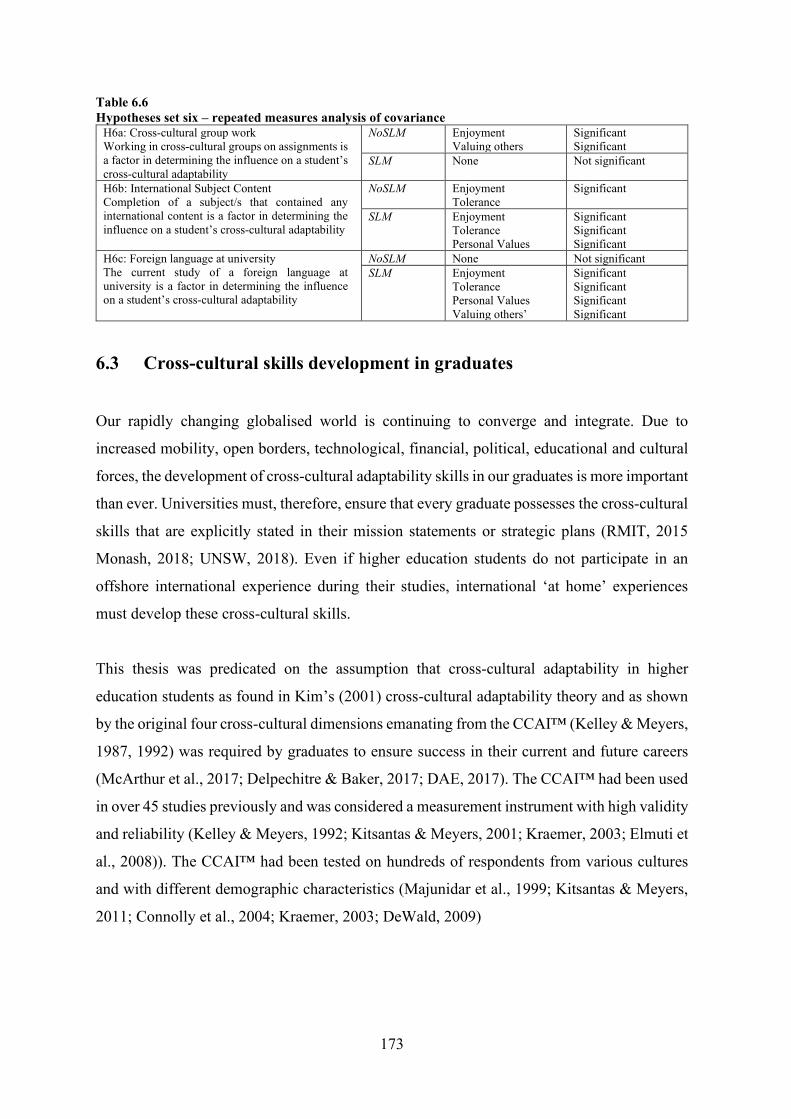
173
Table 6.6 Hypotheses set six – repeated measures analysis of covariance
H6a: Cross-cultural group work Working in cross-cultural groups on assignments is a factor in determining the influence on a student’s cross-cultural adaptability
NoSLM Enjoyment Valuing others
Significant Significant
SLM None Not significant
H6b: International Subject Content Completion of a subject/s that contained any international content is a factor in determining the influence on a student’s cross-cultural adaptability
NoSLM Enjoyment Tolerance
Significant
SLM Enjoyment Tolerance Personal Values
Significant Significant Significant
H6c: Foreign language at university The current study of a foreign language at university is a factor in determining the influence on a student’s cross-cultural adaptability
NoSLM None Not significant SLM Enjoyment
Tolerance Personal Values Valuing others’
Significant Significant Significant Significant
6.3 Cross-cultural skills development in graduates
Our rapidly changing globalised world is continuing to converge and integrate. Due to
increased mobility, open borders, technological, financial, political, educational and cultural
forces, the development of cross-cultural adaptability skills in our graduates is more important
than ever. Universities must, therefore, ensure that every graduate possesses the cross-cultural
skills that are explicitly stated in their mission statements or strategic plans (RMIT, 2015
Monash, 2018; UNSW, 2018). Even if higher education students do not participate in an
offshore international experience during their studies, international ‘at home’ experiences
must develop these cross-cultural skills.
This thesis was predicated on the assumption that cross-cultural adaptability in higher
education students as found in Kim’s (2001) cross-cultural adaptability theory and as shown
by the original four cross-cultural dimensions emanating from the CCAI™ (Kelley & Meyers,
1987, 1992) was required by graduates to ensure success in their current and future careers
(McArthur et al., 2017; Delpechitre & Baker, 2017; DAE, 2017). The CCAI™ had been used
in over 45 studies previously and was considered a measurement instrument with high validity
and reliability (Kelley & Meyers, 1992; Kitsantas & Meyers, 2001; Kraemer, 2003; Elmuti et
al., 2008)). The CCAI™ had been tested on hundreds of respondents from various cultures
and with different demographic characteristics (Majunidar et al., 1999; Kitsantas & Meyers,
2011; Connolly et al., 2004; Kraemer, 2003; DeWald, 2009)
174
6.4 Development of the proposed conceptual model
To date, there have been many theoretical models and foundational theories of cross-cultural
skills development used in past research and applied in different contexts. This study sought
to validate and apply the CCAI™ in an education context by developing a new measurement
instrument (IECCA) and then proposing a new conceptual model (ETPV) that encapsulated
enjoyment, tolerance, personal values and valuing others. The first cultural dimension relating
to the enjoyment of life was the ability to deal with stress and having confidence in everyday
situations. The second was being tolerant of new experiences and having a positive attitude;
The next included maintaining personal values and trusting one’s ability. Finally, valuing
others related to respect for people from other cultures as well as learning about them.
Translated into a measurement instrument, the IECCA measurement instrument was based on
the original CCAI™ questions and was extended to include these pre-existing demographic,
socio-economic, socialising and previous international experiences as factors that were
posited to influence a students’ cross-cultural adaptability. The IECCA was also utilised in a
completely different area, that of peer-to-peer mentoring in a higher education context.
It was hypothesised that the peer-to-peer mentoring experience would have a significant
influence on the cross-cultural adaptability of students who participated in the cross-cultural
mentoring experience compared to those students who did not participate. In addition, it was
hypothesised that pre-existing factors and experiences may have already had a positive
influence on students’ cross-cultural skills (Rokeach, 1973; Shoham et al., 1988; Hurtado et
al., 1998), thereby potentially mitigating the influence of SLMs on those who participated in
the program. These additional questions provided more in-depth analysis when testing the
cross-cultural adaptability of students using the peer-to-peer SLM service. Six sets of
hypotheses were proposed relating to the mentoring experience and the students’ pre-existing
conditions and experiences.
6.5 Contributions of this thesis to literature
The following sections discussed the contributions of this thesis to literature both on an
academic and practical level through proposing a new conceptual model (the ETPV) and the
measurement instrument (IECCA) that emerged from this research.
175
6.5.1 Internal drivers of cross-cultural adaptability
Specifically, this study’s significant contribution was the development of a new measurement
instrument, the International Experience Cross-Cultural Adaptability questionnaire (IECCA),
designed by adding background questions to the original CCAI™. It included relevant
background information, such as students’ previous characteristics and experiences in the
original questionnaire, enhancing the relevance of the IECCA in the context of a peer-to-peer
mentoring in a higher education setting. This newly developed measurement instrument can
be used in other contexts in higher education settings to assess whether other pedagogical
methods have a significant influence on students’ cross-cultural adaptability skills.
6.5.2 External drivers of cross-cultural adaptability - covariates
The addition of the external drivers of cross-cultural adaptability – demographics, socio-
economic factors, socialising and previous international experiences - to the original
questionnaire assisted in developing the new IECCA questionnaire and influenced the
development of the proposed ETPV conceptual model to be tested in future research. These
drivers strengthen the theory of the CCAI™ by including previously unexplored background
information and previous international experiences of the respondents. These additional
questions provided the opportunity to develop a richer understanding of the factors that may
drive cross-cultural adaptability by examining the possible relationship between the four
newly developed and proposed cultural dimensions and the responses from these additional
questions. Analysis of additional background information provided further insight into the
mechanisms that may influence cross-cultural adaptability.
This study found significant influences of demographic, socio-economic, socialising and
previous international experiences on all or some of the four cultural dimensions found as a
result of the IECCA questionnaire and the four cultural dimensions. Each covariate’s
influence on cross-cultural adaptability of higher education students follows.
176
6.5.2.1 Demographics and socio-economic factors
The findings of this study show that being female, older, from a different country than
Australia and having parents from a higher socio-economic SES level all influence their cross-
cultural adaptability. Seminal research by Siddique (1963) reported that there was no
relationship between gender, religion, education of the father, occupation of the father and
local students’ interaction with international students. However, his findings were contrary to
those of Hassan (1961) who showed in his study, that students who came from families of
high status interacted with local (American students) more than international students. This
information can be used by universities to aid them in recruiting more ethnically diverse SLMs
as well as recruiting more female mentors where possible. SES data are collected from all
students when they enrol in a university. This information could be used to recruit students,
but this may be problematic due to privacy requirements.
6.5.2.2 Socialising
The association between the various cultural dimensions and the two socialising factors (hours
spent socialising with others from different cultures and friends/family from other cultures)
supports the finding of existing literature (Allport, 1954; Pettigrew & Tropp, 2006; Kets de
Vries & Mead, 1992; Eichenger et al., 2015; Jon, 2013; McKenzie & Baldassar, 2017).
Although in this study this finding applied only to the NoSLM cohort, building friendships
have previously been found to be essential for cross-cultural skills development (Jon, 2013;
Amit, 2010; Barnick, 2010; Leask, 2004, 2008, 2010, 2016). It may be in the best interests of
universities to continue to create activities outside the formal curriculum that encourage
friendships between local and international students to aid in the development of cross-
cultural sensitivity. Those who participated in SLM may not have considered the mentee-
mentor relationship as friendship forming, potentially supporting the findings from literature
on the lack of friendships developing between local and international students while at
university (Trice, 2004; Gareis, 2015; Bennet et al., 2013) – at least as they apply to the
academic mentoring process. These findings highlight the potential problem of university
reliance on international students to provide a resource for their internationalisation ‘at home’
strategy.
177
6.5.2.3 Private international experiences
Previous research has found that the more cultural experiences people have, the more flexible
they will be to adapt to new cultures (De Verthelyi, 1995; Tomich et al., 2000, Merryfield,
2000). This was not supported by the current research in terms of private holidays. Despite
the extensive body of literature on the influences on students’ cross-cultural adaptability skills
of participating in a SAP for example (Kelley & Meyers, 1987, 1992; Leong , 2007; Kim,
2001; Knight, 2004; Vande Berg et al., 2009; Scharoun, 2016; Castro et al., 2016), the findings
of this study (significant influence only for SLM students and only for one cultural dimension)
tend to support the opposing results from Pederson, Larimer and Lee (2010) and Chang et
al., (2013). This suggests that further research is required to establish whether these
international academic experiences influence students’ cross-cultural adaptability as
requested in studies by Littrell et al., (2005) and Anderson, Lawton, Rexeisen & Hubbard
(2005).
6.5.2.4 External international academic experiences
Offshore programs have long been primary strategies for university students to develop the
cross-cultural skills that employers are demanding (RMIT, 2015; West, 2017), but there had
been few previous studies on the connection between offshore programs and graduate
employability (Crossman & Clarke, 2010; Cai, 2013). This study extended the body of
literature around offshore experiences by finding that they do have a significant influence on
students’ cross-cultural adaptability, but in this study for the enjoyment dimension only. As
cross-cultural adaptability is a critical generic skill, this finding added to literature on this
neglected area of employability skills. Study abroad experiences have been extensively
studied, but usually from the experience of a local participating in an international experience.
This study, therefore, extended the literature in this area as it included the international
inbound students who were completing a study abroad program by studying in Australia as
well as the domestic outbound students.
This study contributed to the body of knowledge on the influence of completing an
international internship by finding that international internships had a significant influence on
the SLM group for the personal values dimension. Even though only eleven students in the
178
SLM group enrolled in an international internship and only four from the NoSLM group were
enrolled, reasons for this would be that many students in this study were in their first and
second year of their degree, and the opportunity to enrol in any of these experiences were
usually offered to students commencing their third or fourth year. Even though the numbers
were low, this was encouraging as this extended the body of literature on international Work
Integrated Learning (WIL) experiences which were an internationally recognised way for
placements in industry to enhance graduate employability (Knight & Yorke, 2004; Peach &
Matthews, 2011; Ferns & Moore, 2012; Smith et al., 2016). This study addeds to the body of
literature on the effects of undertaking a WIL experience in the under-reported international
sphere. It also confirmed the findings of Bollen (1989), whose study defined the six major
factors that students gained from their internship, one of which was the development of cross-
cultural skills.
6.5.2.5 Internal international academic experiences
This study’s findings corroborated previous literature on ‘internationalisation of the
curriculum’ and indicated that ‘at home’ academic factors influenced students’ cross-cultural
adaptability. Although there was some variability between cohorts and dimensions, both
groups were influenced to some degree. It has long been believed that cross-cultural skills
could be developed without international travel (Pruegger & Rogers, 1994; Soria et al., 2014;
Leask, 2011; Leask & Carroll, 2011; Kimmel & Volet, 2012; Leask & Bridge, 2013; Jon,
2013). However, previous researchers raised the need for gains in cross-cultural skills from
the participation in subjects with an internationalised curriculum to be assessed. This study
did assess students’ cross-cultural adaptability after studying internationalised content and
extends our understanding in this area.
The findings that cross-cultural group work had a significant influence on students’ cross-
cultural adaptability, add to the dearth of literature on the interaction of international and
multi-cultural groups at university. A study by Volet and Ang (2012) found that both domestic
and international students prefer working with similar students due to cultural connectedness,
language, pragmatism and negative stereotypes. Research by Volet (1999) undertaken in
Australia found that domestic students had negative attitudes toward culturally mixed groups.
This research found that this defeated one of the primary purposes of attending an
179
international university. Additional research by Summers and Volet (2008) indicated that as
students progressed through their degree, their attitudes to working in culturally mixed groups
became more unfavourable. This study’s findings that cross-cultural group work did
significantly influence students’ cross-cultural adaptability resonated with research by De
Vita (2002) who found that the myth that multi-cultural groups received lower marks than
monocultural groups was incorrect. The results of this study added to the limited research into
the positive effects of cross-cultural group work, and also suggested that academics could
consider requiring multi-cultural groups in their subjects, but most do not want to make these
compulsory (Peacock & Harrison, 2009).
Previous research found that inter-cultural communication competence had positively
influenced cultural adaptation (Lin & Yi, 1997; Redmond & Bunyi, 1993; Sawyer & Chen,
2012), but this study found conflicting results between the influence of university language
study and that of foreign language study at school. These results may be explained by the
students’ more recent language study at university compared with earlier study at school, or
by the difference in fluency attained by a few years of foreign language secondary study
compared to the fluency achieved after 2-3 years of tertiary study (Gregory, personal
communication, October 27, 2019).
As there were international students in the NoSLM group who had studied a foreign language
at school, even though none of these studied a language at university, the findings from this
group refute previous research that learning the language of the foreign country being visited
would influence students’ cross-cultural skills (Reimers, 2008). These findings are of concern
because previous studies had shown that students’ second language skills built relationships
with locals and this enabled students to handle stress and have a more positive outlook on
their international study experience (Hammer et al., 1998; MacIntyre et al., 2001; Yashima et
al., 2004; Tanaka, 2007).
International students are expected to have inter-cultural communication competence when
adapting to a new culture, but this is often not the case (Mckay-Semmler & Kim, 2014; Kim,
2001; Zimmermann, 1995). These differing literacy skills are of global concern in education
as all graduates will be part of a diverse workforce (Hartman, Renquette & Seig, 2018;
Gardner & Perry, 2011; Chang et al., 2013). These divided findings of this study extended the
180
body of knowledge around the connection between language competence and cross-cultural
skills development.
This thesis, therefore, extended the understanding of and provided valuable insight into the
pathways of influence and relationships between students and cross-cultural experiences, both
at home and overseas. Understanding the previous life experiences that each student brought
to the development of cross-cultural adaptability skills would give universities the chance to
tailor the international experiences that they offer to students as well as their pedagogical
development of ‘at home’ international experiences.
6.5.3 Results of the peer-to-peer mentoring experience
Significantly, the results of the peer-to-peer mentoring experience highlight that the SLM
peer-to-peer mentoring experience was an insufficient mechanism for developing student
cross-cultural sensitivity. This study found that the mentoring process, despite having a rich
diversity of student mentors and mentees does not contribute to student cross-cultural
development and may have the reverse effect. Universities hoping to capitalise on their
existing mentoring structures as a vehicle for indirectly influencing student cross-cultural
abilities may need to direct resources to more active approaches such as international
experiences abroad and at home – the external drivers of student cross-cultural adaptability.
However, these findings contributed to the body of knowledge around cross-cultural dyads in
peer-to-peer mentoring. Although there have been many studies on the effects of peer-to-peer
mentoring on higher education students (Kemlo, 2010; Hall & Jaugietis, 2010; Chester et al.,
2013), there have been fewer studies on cross-cultural student mentoring dyads and their
effects on cross-cultural skills development (Arkoudis et al., 2010; Caligiuru & Tarique, 2012;
Woods et al., 2013). Given that previous mentoring literature focused predominately on
western students (Woods et al., 2013; Arkoudis et al., 2010; Caligiuri & Tarique, 2012; Mosey
et al., 2012) the current study was able to extend the focus through the use of both local and
international students (most of whom are from Eastern countries) in an Australian setting.
The decrease in the SLM group’s results from the pre- to the post-test refuted the central
tenants of Allport’s (1954) Contact Theory and may be reflective of the different nature of the
study undertaken, the cohort used or the location of the study. Alternatively, the findings may
181
have reflected students’ academic struggles at the end of the semester. Also plausible is that
students’ academic difficulty increased stereotypes and increased prejudice as a result of their
contact with mentors from a different background during a time when they were least
receptive to differences. Students may have sought SLM support because they were struggling
academically, further changing the dynamics of the relationship. Results highlighted the
complexity of relationship development. This critical finding extended current contact theory
literature (Allport, 1954; Pettigrew & Tropp, 2006), by examining a unique cohort experience,
not necessarily during a positive time, but in a time that students may feel pressured and
insecure in their knowledge. The findings also countered social learning theory (Bandura,
1977) which suggested that casual and informal contact such as that in the SLM area would
positively influence students’ cross-cultural adaptability.
6.6 Managerial / Business contributions
This study investigated whether there was any significant influence on students’ cross-cultural
adaptability by students participating in a cross-cultural peer-to-peer mentoring experience. It
was hypothesised that this informal mentoring experience ‘at home’ would have a significant
influence on each of the four cultural dimensions. It was proposed that this would give
employers additional information on graduates’ cross-cultural adaptability skills after
participating in this cross-cultural experience and thus increase employers’ confidence that
the graduates they employed would be able to work cross-culturally, either locally or globally,
in a diverse workforce.
Even though the original set of hypotheses relating to the peer-to peer-mentoring experience
were not found to be significant, the most significant results were that two direct offshore
experiences and all three ‘at home’ academic experiences provided by the university did have
a significant influence on students’ cross-cultural adaptability. As employers may look
elsewhere for their employees if they perceived that university graduates were not cross-
culturally adaptable and work-ready, these direct academic experiences need to be
emphasised by both graduates and universities to provide evidence that these formal academic
experiences may better prepare graduates for the challenges of global business.
182
6.7 Higher Education contributions
The additional background and experience factors from this study that were found to have an
influence on students’ cross-cultural adaptability and were therefore relevant to universities
were: socialisation, exchanges, international internships, studying subjects with
internationalised content, cross-cultural group work and learning a foreign language at
university. All these factors were considered here.
Cross-cultural social experiences (socialisation, friends), offshore programs (exchange and
internships) and ‘at home’ experiences (internationalised curriculum, cross-cultural group
work, learning a foreign language) all significantly influenced students’ cross-cultural
adaptability. These results were significant for higher education institutions in eight respects.
Firstly, universities are reliant on international students as a critical source of income (OECD,
2017; UA, 2019). Australian universities have relied on these students being part of the
resources for domestic students to develop their cross-cultural skills (Ryan, 2011; McKenzie
& Baldassar, 2017).
Secondly, the lack of interaction between domestic and international students and the
preferences of local students to work with others from their own culture has been reported
extensively (Smith, 2006; Trice, 2004; Gareis, 2012; Bennett et al., 2013; Smart et al., 2000;
Woods et al., 2013). Universities are responsible for international students having rewarding
experiences at university in another country, but because of this lack of personal interaction
with students from other countries, all students are missing out on this vital experience, which
would develop their cross-cultural adaptability skills. Universities should continue any
‘buddy’ program they have implemented between domestic and international students and
that this should continue into higher years; thus, friendships may develop. Local students and
SLMs should receive additional cross-cultural skills training and should be advised of the
benefits they too will receive from the ‘buddy’ or SLM experience. The aim would be to
ensure that local students participate willingly.
Thirdly, studies from Australia have also found that international and local students do not
spend time conversing together (Robertson et al., 2000; Volet & Ang, 1998, 2012; Rosenthal,
Russell & Thomson, 2007; Nesdale & Todd, 1993). This lack of meaningful interaction has
183
resulted in many universities developing ‘at home’ programs (Arkoudis et al., 2010). Some
universities were proposing to build these cross-cultural relationships as outcomes of these
programs (Amit, 2010; Barnick, 2010; Leask, 2004, 2008, 2016). If universities could provide
meaningful ways to develop these relationships through internationalised subjects, cross-
cultural group work, or learning a foreign language at university, then this should develop
students’ cross-cultural skills. Universities should, therefore, encourage students who studied
a foreign language at school to continue this into their university studies. Universities should
also arrange events that included students from all cultures, then both local and international
students may gain the cross-cultural experiences that they expect.
Fourthly, for this to happen, there is a need for the professional development of academics on
how to create cross-cultural groups without alienating domestic students, and to get the most
out of all students. Academics are the facilitators of student interaction (Leask & Beelen,
2009; Soria & Triosi 2004). As a study by McKenzie and Baldassar (2017) showed,
friendships between local and international students may develop freedom and knowledge.
Another study by De Vita (2002) noted that although domestic students believed that working
with international students would lower their subject results, this was not the case. Therefore,
it is recommended that students be placed in mixed groups wherever possible, but without
‘swamping’ the group with too many international students, which incorporated the
suggestion from Peacock and Harrison (2009). International ‘at home’ academic experiences
should also be expanded to include international connections with industry, not only
international internships but increased local internship placements in global companies
located in Melbourne. Virtual industry placements and opportunities for students to work
across countries, time zones, cultures and in multinational teams would also give students
experiences in how global business functions.
Another important finding that emerged from this study was the influence of exchange and
international internships on students’ cross-cultural adaptability. These offshore experiences
were the premier academic experience that have been promoted by universities to develop
students’ cross-cultural skills and have been the subject of many studies (Knight, 2004; Vande
Berg et al., 2009; Sison & Brennan, 2012; Scharoun, 2016; Castro et al., 2016; RMIT, 2015;
West, 2017; Crossman & Clarke, 2010; Cai, 2013; West, 2017). Based on these findings,
universities should provide additional resources for their off-shore programs. The number of
students who had these offshore experiences was small, and the cohort for this study was
184
primarily from first and second-year students who had not been able to enrol in these study
tours. As previous studies proved that shorter offshore programs also develop students’ cross-
cultural skills (West, 2017; Castro et al., 2016) they should be increased in number and offered
to students earlier in their degree. To make these offshore experiences more affordable,
universities’ professional staff in the global program areas should increase their applications
for scholarship funding from Australian and global governments. However, training prior to
departure is essential for all types of offshore programs and should be increased to include
history, geography, politics, language and cultural studies.
Universities can utilise the new IECCA questionnaire to support other pedagogical
developments such as the use of cross-cultural groups during the semester. As the use of these
is the subject of disagreement (Volet, 1999; DeVita, 2002, Summers & Volet, 2008, 2010;
Leask, 2009), additional studies will support or refute the recommendation that academics
make these cross-cultural groups mandatory in their classes. This measurement instrument
can also be used in the study of foreign language learners at other universities to support
claims that foreign language study at university is vital for students’ future career. It can also
be used in the SAP area to add to the existing literature on the effects of these programs on
students and gain more insight into the students’ international experiences. The questionnaire
can be also be used in ‘at home’ pedagogy development. As future ideas such as Artificial
Intelligence and virtual industry experiences become mainstream, their effectiveness on cross-
cultural adaptability development can be assessed. This will also add to robustness checks on
the measurement instrument’s use in higher education, by being used in different areas. The
measurement instrument can also be utilised in contexts other than Higher Education. Schools
and Technical and Further Education (TAFE) Colleges can also use the measurement
instrument to assess the cross-cultural influence of their pedagogical developments. A range
of businesses can utilise this tool to assess whether international exposure has any effect on
their employees. The inclusion of background information in this questionnaire may highlight
other aspects of respondents’ backgrounds that may negatively affect their expatriate
experience before taking up an overseas posting. This could save companies considerable
expense in expatriate failure which has been estimated to be as high as 83% (McFarland,
2006; Crowne, 2013).
If both local and international students are not receiving the cross-cultural experiences and
development of the generic skills that they need in their years at university, then the
185
international relationships and global reputation of the home university may decline
(Czinkota, 2005; Kehm, 2005; Marginson & Van der Wende, 2013), resulting in fewer
students choosing that university over another global one. Employers may also look to
different universities from anywhere in the world, to find graduates who, they perceive, are
cross-culturally adaptable and work-ready. If Australian universities do not develop these
demonstrable skills in their graduates, then students may choose to study elsewhere, and
Australia’s reliance on international students as a source of funds may be at risk. This potential
problem would not only be devastating for Australia’s currently fourth largest export earner,
but also for the domestic economy, which would inevitably result in reduced income from
both international students and local students who choose to study offshore instead.
6.8 Limitations of this thesis
This study took place in one university in one major city – Melbourne, in one state – Victoria,
and not nationwide across Australia, either in different cities, states or regions. Students in
this study came from one of the most multi-cultural cities in Australia. Melbourne, in Victoria,
has received waves of immigrants since the gold rush era of the 1850s, through to current
immigration from many countries around the world.
A broad assumption was that the students in each group (NoSLM or SLM) were similar. All
students responding to the questionnaire were completing (or were mentoring in) the subjects
that were chosen for this study, and they all achieved high school ATAR (university entry)
results of a high enough standard for acceptance into university. SLMs were high achievers as
only those who had received the highest marks (Distinction or High Distinction) were invited
to become mentors. Most mentors also obtained high results on leaving school, which may
have resulted in higher initial cross-cultural scores. This may be due to more interaction with
people from other cultures, or friends or family with whom they spent time. Also, although
many of the students who completed this questionnaire do not have English as their primary
language, the assumption was that they were able to understand the questions and answer
them correctly. Finally, respondents from each of the semesters in 2017 were also assumed to
be a similar cohort, as subjects and experiences were available to all students throughout the
year.
186
This study used the CCAI™ questionnaire which has copyright restrictions. Permission was
granted for this study and would need to be requested for any further use. The questionnaire
was sent to students studying business subjects in Higher Education only and has no
respondents from the business community or other areas such as science, engineering, health,
design, social and urban studies. The final response numbers after the removal of the 20
respondents who had not had a cross-cultural mentoring experience with a SLM (n=214), are
consistent with other studies in this area (Prasad, Showler, Schmitt, Ryab & Nye, 2017; Hua,
Fan, Walker, Hou, Zheng, Debode, 2018). The questionnaire was distributed in week four and
then again in week twelve of the semester. This was only eight weeks apart. As the students
were self-reporting, their responses may have been biased, as they may have inflated their
responses. There was also no information collected on the number of hours that either the
mentor or the mentee had attended the SLM service. This was due to privacy restrictions.
Furthermore, the mentoring experience lasted only eight weeks, and this may be too short to
build relations and friendships between the mentors and the mentees and thus affect cross-
cultural skills development. It is also hard to observe and model new behaviours over eight
weeks, all of which may explain the effects of the mentoring experience reducing the post-
test scores for the SLM group. During the semester, respondents matured both in their age and
as a result of other experiences they may have experienced during the semester. Information
on any additional international experiences by students within the semester was not collected
again in week 12, as most of these experiences take place outside semester. Many respondents
would also have remembered the questions from the pre-test, causing fatigue and adding to
the possibility that their post-test scores may be inflated.
The total cohort for this study was mostly from first- and second-year students. For the group
who did not meet with a SLM, they may not have had the confidence to attend, or they may
have deemed their English skills to be insufficient. They may also think that asking for help
at SLM would result in a ‘loss of face’, as approximately 45% of RMIT’s student base are
international students, many from Asia (Parliamentary Library, 2019). Not many of the
mentees were able to enrol in study abroad programs as these are mostly offered to students
in later years. There was a minimal number of students who were studying a language at
university. This limits the generalisability of the results for this factor.
187
Finally, a common statistical phenomenon ‘regression to the mean’ (RTM) over time may
have been involved in this study, taking already inflated scores in each cultural dimension and
reducing over time to regress towards the mean. RTM occurs when a non-random sample
such as in this study and two imperfectly correlated variables are measured. RTM would have
occurred during this study as the questionnaire was distributed twice and measured the same
factors (Barnett, van der Pols & Dobson, 2004). As first discussed by Galton in 1886, the
more extreme the pre-test scores were from the total population mean, the more room there is
for them to regress to the mean (Morton & Torgerson, 2003). Especially for the SLM group,
this may have been a reason why their scores decreased between the very high pre- and post-
test results.
6.9 Further research recommended
Through the interpretation of results and acknowledgement of limitations, the thesis has
identified several opportunities, all of which suggest directions for future research.
For the proposed ETPV conceptual model to be interpreted into a measurement instrument
that reflects reliability, validity and statistical precision, the use of Confirmatory Factor
Analysis (CFA) is required to determine the construct validity of hypothesis-based testing
instruments. Confirmatory methods attempt through chi square goodness of fit and other fit
indices to optimally match the observed and theoretical factor structures for a given data set
in order to determine the ‘goodness of fit’ of the predetermined factor model. In other words,
a ‘middle ground’ methodology partly which is partly exploratory and partly confirmatory
(Lages and Fernandez 2005) can effectively employ EFA as the initial tool in recovering an
underlying measurement model (in this study the ETPV proposed conceptual model, which
can then be evaluated with CFA (Gerbing and Hamilton 1986). Golob (2003, p. 4) concurs
that ‘exploratory factor analysis is sometimes used to guide construction of an SEM
measurement model’, given the large number of possible combinations in a measurement
model.
Confirmatory methods attempt through chi square goodness of fit and other fit indices to
optimally match the observed and theoretical factor structures for a given data set in order to
determine the ‘goodness of fit’ of the predetermined factor model. In other words, a ‘middle
188
ground’ methodology partly which is partly exploratory and partly confirmatory (Lages and
Fernandez 2005) can effectively employ EFA as the initial tool in recovering an underlying
measurement model (in this study the ETPV proposed conceptual model, which can then be
evaluated with CFA (Gerbing & Hamilton 1986). Golob, (2003, p. 4) concurs that
‘exploratory factor analysis is sometimes used to guide construction of an SEM measurement
model’, given the large number of possible combinations in a measurement model.
The measurement instrument – the IECCA questionnaire, which was created in this study, can
be used for future research into graduate cross-cultural generic skills development after
permission is gained from Kelley and Meyers to use the CCAI™ questions as part of any
future studies. As acknowledged in this study and others (Reichard et al., 2015; Chang et al.,
2013; Deardorff, 2006; Caliguiri, 2006; Bennett, 2004), it is vital that graduates understand
and can provide evidence to their employers of the cross-cultural skills they have accumulated
by the time they complete their studies. This evidence should include details of their offshore
and onshore international experiences and cross-cultural skills test results where they are
available. This will provide employers with evidence of the cross-cultural skills required
(Yorke & Knight, 2004; Jackson, 2013). Possessing these cross-cultural skills will also
enhance graduates’ work-readiness and give these students a competitive advantage over
others without these skills (Brown, 2003; Brown & Hesketh, 2004; Brown & Tannock, 2009;
Brown et al., 2011; Tomlinson, 2008; Bathmaker et al., 2013).
This study found that many students’ previous international experiences do have a significant
effect on their cross-cultural skills development. This suggests that this is where universities
should commit their future resources. The IECCA measurement instrument can be used at
universities both in Australia and globally to investigate the effects of other pedagogical
developments in both offshore and ‘at home’ areas. Replication of this study in alternate
settings will facilitate ongoing refinement of the proposed scales and the investigation of the
pathways of influence suggested by the ETPV model discussed in chapter five.
However, although the conceptual framework suggests a way to understand students’ cross-
cultural adaptability, it is by no means a comprehensive model. Personality constructs such
as attitudes, beliefs, customs, behavioural patterns, motivation, enthusiasm and emotional and
cultural intelligence, identified by prior research as relevant and pertinent in influencing
students’ cross-cultural adaptability may be worth adding to the questionnaire (Meyers et al.,
189
2008; Spitzberg & Changnon, 2009; Fantini, 2005; Cohen, 2007; Bennett, 1993). Adding
extra information about the number of cross-cultural interactions students had with their SLM
mentor during the time that SLM was available (Allport, 1954, Bandura, 1977; Pettigrew &
Tropp, 2006) may produce additional insight into the time that mentors and mentees spend
together. This could provide additional findings from any replication of this study.
Information on students’ grade point average (GPA) was not included in this study, and its
addition may result in more in-depth analysis on whether students with different GPAs have
different cross-cultural adaptability skills.
This thesis provides a platform for further application of the proposed model to investigate
the influence of the new cultural dimensions and associated factors in terms of the importance
of these same factors in comparable educational contexts. This study could be replicated in
the areas of international internships, exchange and study tours as separate cohorts. This may
give more meaningful insights on the cross-cultural skills development of students who
undertake these offshore experiences. Future study of these experiences for a larger cohort
may also result in a greater understanding of whether students who participated are less
prejudiced after the completing of their experience than others from different cultures. It may
also show whether they are influenced by existing stereotypes between the start of their
experience and its conclusion (Allport, 1954). Studies of these experiences will enable
requisite pre-departure training to be strengthened and address these potential issues.
The sample from which this research was based was drawn from a specific university, which
prevents the generalisation of these findings in a broader context. One advantage may be that
the population as a cohort may exhibit similar underlying characteristics, but the results may
differ in other higher education contexts (Worthington & Higgs, 2004). There is also no way
of knowing, without further study, if the significant demographic, socio-economic, socialising
or previous international experiences, originating from this sample, are representative of other
universities.
Building on findings from this thesis, another avenue of future research could be comparing
different faculties and their student academic peer-to-peer mentoring resources. Different
universities may have different cultural cohorts, who either do or do not use the academic
mentoring services provided. The thesis did not distinguish between degrees within the
Faculty of Business in the analysis. The assumption that respondents have similar
190
backgrounds within the Faculty could be further considered as a possible future research
avenue, investigating any variability that may exist. A re-examination of different degrees
may provide further understanding as to why the SLM experience in the model had some
negative findings in comparison to the students who did not meet with a SLM.
Repeating the questionnaire at the university investigated in this study to gain additional
respondents who attended SLM but did NOT have a cross-cultural experience would add to
the understanding of any influence of SLM participation on students’ cross-cultural
adaptability. Also, distinguishing between mentor and mentee within the SLM experience
should be investigated, as many studies in the peer-to-peer mentoring area have discussed the
different effects of mentoring on each of the students involved (Mullen, 1994; Wanberg et al.,
2003; Scandura, 1992; Allen, Russell & Maetke, 1997b; Arkoudis et al., 2010; Caligiuri &
Tarique, 2012). This would provide a specific segment of students (the mentors) to consider
and find whether there are any effects of the cross-cultural mentoring experience on students
from later years in their degree. Mentors are more likely to have completed offshore programs,
for example, due to their being enrolled in later years of their degree.
Further information on respondents’ ethnicity was collected but was not used in this study.
Further analysis of ethnicity with relation to local or international students would give extra
information for segmenting groups in a different way. Ethnicity can be explored further with
additional questions that can be added to the questionnaire to delve into whether the
respondent was a local student who was a first-generation Australian. This may give rich
information on any effects of further ethnic segmentation.
Different methods of analysis could be implemented. This study only utilised quantitative
methods, with ANOVA and MANCOVA analysis and the addition of interviews would give
information on why the respondents answered the questions in a particular manner, and to
explore why the pre-test scores were high across both groups, and how the students in both
groups developed cross-cultural skills during their time at university.
Finally, longitudinal studies would add to research in the development of cross-cultural skills.
Students could be questioned at the start of their degree program and then at the end, usually
three to four years’ later, rather than at the end of only eight weeks. Information on the effect
of all international experiences during their time at university, would enable a greater
191
understanding of the influence of all factors. Longitudinal studies conducted with alumni three
to five years post university would add information on the effectiveness of their cross-cultural
skills development at university and beyond.
6.10 Conclusion
The higher education sector is the fourth largest export industry in Australia, behind iron ore
and coal (DoE, 2019a). In addition, international students added $35.2 billion to Australia’s
economy in 2018 (DoE, 2019a). Employers, universities and other higher education institutes
are looking for graduates who can work in the globally integrated world economy and
participate productively in a diverse workforce (Chang et al., 2013; Caligiuri, 2006; Bennett,
2004). The current and future requirements from businesses have presented new challenges
and opportunities to the higher education sector in meeting these needs.
6.10.1 Employability skills
The focus of Higher Education worldwide is currently on graduate employability skills.
Universities may not be able to guarantee employment but are expected to develop their
graduates’ employability skills (Pegg et al., 2012; Wilton, 2011; Helyer & Lee, 2014).
Professional, discipline-specific, generic, key and non-technical skills (Yorke & Knight,
2004; Jackson, 2013) are vital to strengthening graduate work-readiness. This includes the
ability of graduates to engage with people from different social, ethnic and religious
backgrounds.
6.10.2 Cross-cultural skills development
Universities have tried many ways to develop students’ cross-cultural skills development.
Offshore experiences such as exchange, study tours and international internships are still
the pre-eminent way for global universities to develop these skills (RMIT, 2015; Brewer
& Leask, 2012; Monash, 2019). Undergraduate students as a cohort are recognised as a
relevant and vital segment by tertiary institutions, but few studies have investigated the cross-
cultural skills development of students during their time at university in areas other than study
abroad programs.
192
6.10.3 Results of this study
This study investigated the effects of an ‘at home’ cross-cultural peer-to-peer mentoring
experience on students who attended the SLM academic mentoring service, over eight weeks,
as part of an in-depth understanding of cross-cultural skills development. This quasi-
experiment compared students who did participate in a cross-cultural peer-to-peer mentoring
experience with students who did not participate in the cross-cultural mentoring experience.
In total, 214 respondents were included in this study. The students who did not utilise the
services of the SLM area were analysed separately from the students who did have a cross-
cultural experience at SLM. Those students who attended SLM did not find that the peer-to-
peer mentoring experience affected their cross-cultural adaptability. However, this study did
find that factors such as: age; ethnicity; SES level (as developed from students’ mothers’ and
fathers’ education levels); hours spent socialising; having friends or family from another
country; going on exchange; participating in an international internship; working in cross-
cultural groups; completing a subject with internationalised content and studying a foreign
language at university, all influence the cross-cultural skills development of students.
6.10.4 Contributions of this thesis
This thesis extends an understanding of and provides invaluable insight into the pathways of
influence and relationships between students’ cross-cultural peer-to-peer mentoring
experiences, and introduced the constructs of enjoyment, tolerance, personal values and
valuing others (ETPV) from the new IECCA questionnaire. With the addition of
demographic, socio-economic, socialising, previous international experiences variables to
the IECCA measurement instrument, as influential drivers, this new questionnaire can be
utilised in different pedagogical areas in a tertiary education setting. By developing and
testing this conceptual model (ETPV) and the IECCA questionnaire derived from it,
indispensable contributions may influence universities to change their existing strategies to
ensure they achieve their stated goals.
Armed with this insight, the staff at universities can encourage and support students wanting
to enrol in offshore academic experiences. Enrolment in exchange programs, study tours and
international internships could be accomplished by staff applying for government grants from
193
around the world. This would reduce the students’ costs associated with attendance at offshore
programs. Academics can also enrich their classes by using internationalised content and
cross-cultural group work. Staff can add further cultural information to pre-departure training
for students to develop their cross-cultural skills.
These cross-cultural skills are one of the generic skills that graduates need in this globalised
workforce of the present and future. Findings suggest that one uniform approach to student
cross-cultural skill development may not be appropriate. A multi-pronged approach may be
required where students should be encouraged to develop these cross-cultural skills. Clear
communication to students on the significant benefits of developing their cross-cultural
adaptability will enrich students’ resumes and may result in more considerable employability
skills that both the graduate and employers require.
Marketing departments in higher education wish to reassure current and future students and
their families that their graduates will develop these cross-cultural skills. The development of
students’ skills at university will be a long-term gain for the universities’ global rankings.
This in-depth understanding of the external drivers of cross-cultural adaptability becomes
relevant in appealing to and retaining both local and international students.
If these skills are not developed by the time that students graduate, employers may look
elsewhere for their employees and the university’s global reputation will be tarnished,
reducing the $35.2 billion export income that Australia receives from the fourth highest export
industry in Australia. This would have considerable ramifications on Australia’s economy by
encouraging future university students and their families to investigate other global
universities that they perceive give their family member the requisite cross-cultural
employability skills.
194
Reference List
Abbe, A., Gulick, L. M. V., & Herman, J. L. (2007). Developing cross-cultural competence
in military leaders: A conceptual and empirical foundation. Arlington, VA: US Army
Research Institute for the Behavioral and Social Sciences. Adler, P. (1975). The
transitional experience: an alternative view of culture shock. Journal of Humanistic
Psychology, 15(4), 13-23.
Allen, T. D., Eby, L. T., Poteet, M. L., Lentz, E., & Lima, L. (2004). Career benefits
associated with mentoring for proteges: A meta-analysis. Journal of Applied
Psychology, 89, 127–136.
Allen, T. D. & Poteet, M. L. (1999). Developing effective mentoring relationships: Strategies
from the mentor's viewpoint. The Career Development Quarterly, 48(1), 59-73.
Allen, T. D., Poteet, M. L., & Burroughs, S. M. (1997). The mentor's perspective: A
qualitative inquiry and future research agenda. Journal of Vocational Behavior, 51(1),
70-89.
Allen, T. D., Poteet, M. L., Russell, J. E., & Dobbins, G. H. (1997a). A field study of factors
related to supervisors' willingness to mentor others. Journal of Vocational
Behavior, 50(1), 1-22.
Allen, T. D., Russell, J. E., & Maetzke, S. B. (1997b). Formal peer mentoring factors related
to proteges' satisfaction and willingness to mentor others. Group & Organisation
Management, 22(4), 488-507.
Alon, I. & Higgins, J. M. (2005). Global leadership success through emotional and cultural
intelligences. Business Horizons 48, 501-512.
Allport, G.W. (1954). The nature of pre-judice. Cambridge, MA: Addison-Wesley.
Alreck, P. & Settle, R. (1995). The Survey Research Handbook. Homewood, IL, Irwin.
195
Altshuler, L., Sussman, N. M., & Kachur, E. (2003). Assessing changes in intercultural
sensitivity among physician trainees using the intercultural development
inventory. International Journal of Intercultural Relations, 27(4), 387-401.
Amit, V. (2010). Student mobility and internationalisation: rationales, rhetoric and
“institutional isomorphism”. Anthropology Action, 17(1), 6-18.
Anderson, P.H., Lawton, L., Rexeisen, R. & Hubbard, A.C. (2006). Short-term study abroad
and intercultural sensitivity: A pilot study. International Journal of Intercultural
Relations 30: 457-469.
Ang, S., Van Dyne, L., Koh, C., & Ng, K. Y. (2007). Cultural Intelligence: Its measurement
and effects on cultural judgement and decision making, cultural adaptation, and task
performance. Management and Organization Review 33, 335-371.
Angliss. (2019). High Education Mentoring Programs.
Retrieved from https://www.angliss.edu.au/about/news/news-HE-mentoring-
program-launch-20191/.
Arkoudis, S., Yu, X., Baik, C., Chang, S., Lang, I., Watty, K., Borland H., Pearce, A., &
Lang, J. (2010). Finding common ground: Enhancing interaction between domestic
and international students – Guide for academics. Australian Learning and Teaching
Council.
Arthur, W. Jr. & Bennett, W. (1995). The international assignee—The relative importance
of factors perceived to contribute to success. Personnel Psychology, 48, 99–114.
Aryee, S. & Stone, R. J. (1996). Work experience, work adjustment and psychological
well-being of expatriate employees in Hong Kong. International Journal of Human
Resource Management, 7(1), 150–164.
http://dx.doi.org/10.1080/09585199600000122.
Asbee, S. & Woodall, S. (2000). Supporting access in distance education through student-
student mentoring. Journal of Access and Credit Studies, 2(2), 220-32.
196
Astin, A. W. (2012). Assessment for excellence: The philosophy and practice of assessment
and evaluation in higher education. Rowman & Littlefield Publishers.
Australian Bureau of Statistics. (2019). 3412.0 – Migration, Australia, 2017-18, retrieved
from https://www.abs.gov.au/ausstats/[email protected]/mf/3412.0/.
Babbie, E. R. (1998). The practice of social research (Vol. 112). Belmont, CA: Wadsworth.
Bandura, A. (1977). Self-efficacy: toward a unifying theory of behavioral
change. Psychological review, 84(2), 191.
Bandura, A. (1986). Social foundations of thought and action: A social cognitive theory.
Prentice-Hall, Englewood Cliffs, NJ.
Bandura, A. (2001). Social cognitive theory: An agentic perspective. Annual review of
psychology, 52(1), 1-26.
Banks, J. A. (2001). Cultural diversity and education: Foundations, curriculum, and
teaching (4th ed.). Boston: Allyn & Bacon.
Bardi, A., & Schwartz, S. H. (2003). Values and behavior: Strength and structure of relations.
Personality and Social Psychology Bulletin, 29, 1207–1220.
Barlett, M.S. (1954). A note on the multiplying factors for various chi square
approximations. Journal of the Royal Statistical Society, 16 (Series B), pp 296-298.
Barnett, AG, van der Pols, J. & Dobson, A. J. (2004). Regression to the mean: what is it and
how to deal with it. International Journal of Epidemiology, 34(1), 215-220.
Barnick, H. (2010). Managing time and making space: Canadian students’ motivation for
study in Australia. Anthropology Action, 17(1), 19-29.
Bar-On, R. (1997a). The Bar-On Model of Emotional-Social Intelligence. University of
Texas Medical Branch.
197
Bar-On, R. (1997b). The Bar-On Emotional Quotient Inventory (EQ-i): A Test of Emotional
Intelligence. Toronto, Canada. Multi-Health Systems.
Bates, D., Mächler, M., Bolker, B., & Walker, S. (2014). Fitting linear mixed-effects models
using lme4. arXiv pre-print arXiv:1406.5823.
Bathmaker, A., Ingram, N., & Waller, R. (2013). Higher education, social class and the
mobilisation of capitals: recognising and playing the game. British Journal of
Sociology and Education, 34, 5-6, 723-743.
Beavers, A.S,. Lounsbury, J. W,. Richards, J. K,. Schuyler, W. H., Skolits, G. J., & Esquivel,
S.L. (2013). Practical Considerations for Using Exploratory Factor Analysis in
Educational Research. Practical Assessment, Research & Evaluation, 18(6), 1-13.
Beelen, J. & Jones, E. (2015). Europe calling: A new definition for internationalization at
home Boston College. Center for International Higher Education. International Higher
Education (Chestnut Hill, Mass.) (1995).
Bennett, C. (2003). Comprehensive multicultural education: Theory and practice (5th ed.).
Needham Heights, MA: Allyn & Bacon.
Bennett, J. M., Bennett, M. J., & Allen, W. (1999). Developing intercultural competence
in the language classroom. In R. M. Paige, D. Lange, & Y. A. Yershova (Eds.),
Culture as the core: Integrating culture into the language classroom (pp. 13–46).
Minneapolis, MN: University of Minnesota Pre-ss.
Bennett, M. J. (1993). Towards ethnorelativism: A developmental model of intercultural
sensitivity. In R. M. Paige (Ed.), Education for the intercultural experience (2nd ed.,
pp. 21-71). Yarmouth, ME: Intercultural Press.
Bennett, M. J. (2004). Becoming interculturally competent. In J. Wurzel (Ed.), Toward
multiculturalism: A reader in multicultural education (2nd ed., pp. 62-77).
198
Bennett, R. J., Volet, S. E. & Fozdar, F. E. (2013). “I’d say it’s kind of unique in a way”: the
development of an intercultural student relationship. Journal of Studies in
International Education, 17(5), 533-553.
Berry, J. W., Kim, U., Power, S., Young, M., & Bujaki, M. (1989). Acculturation in plural
societies. Applied Psychology: An International Review, 38, 185-206.
Beye, C. R. (1976). The Iliad, the Odyssey, and the Epic Tradition. Gordian Press Inc.
Bhaskar-Shrinivas, P., Harrison, D. A., Shaffer, M. A., & Luk, D. M. (2005). Input-based
and time- based models of international adjustment: Meta-analytic evidence and
theoretical extensions. Academy of Management Journal, 48, 257-281.
Bilsky, W. (1998). Motives and values: Towards a taxonomic integration of two
psychological constructs. Paper presented at the International Workshop on Values,
Maale Hakhamisha, Israel.
Black, J. S. & Gregersen, H. B. (1999). The right way to manage expatriates. Harvard
Business Review, 77(2), 52–63.
Black, J. S. & Mendenhall, M. (1990). Cross-cultural training effectiveness: A review and a
theoretical framework for future research. Academy of management review, 15(1),
113-136.
Blatterer, H. (2015). Everyday friendships: intimacy as freedom in a complex world.
Basingstoke, UK: Palgrave Macmillan.
Blunsdon, B., Reed, K., & McNeil, N. (2003). Experiential Learning in Social Science
Theory: An investigation of the relationship between student enjoyment and learning.
Journal of Further and Higher Education, 22(1), 93-56.
https://doi.org/10.1080/0729436032000056544.
Bollen, K. A. (1989). Structural equations with latent variables. New York, NY: John Wiley
and Sons.
199
Bornstein, R. F. (1989). Exposure and affect: Overview and Meta-Analysis of research,
1968–1987, Psychological Bulletin, 106(2), 265–289.
Bova, B. (2000). Mentoring revisited: The black woman's experience. Mentoring and
Tutoring, 8(1), 5-16.
Bowman, N. A., & Park, J. J. (2014). Interracial contact on college campuses: comparing
and contesting predictors of cross-racial interaction and interracial friendship. Journal
of Higher Education 85(5), 660-690.
Bradley Jr, A. P. & Adamson, J. (1973). About Empire State College Mentors.
Brand. V. (2009). Empirical Business Ethics Research and Paradigm Analysis Journal of
Business Ethics. 86(4), 429-449.
Braskamp, L. A., Braskamp, D. C., & Merrill, K. C. (2009). Assessing progress in global
learning and development of students with education abroad experiences. Frontiers:
The Interdisciplinary Journal of Study Abroad, 13, 101-118.
Brewer, E. & Leask, B. (2012). Chapter 14. Internationalization of the Curriculum.
Briguglio, C. (2007). Educating the business graduate of the 21st century: Communication
for a globalized world. International Journal of Teaching and Learning in Higher
Education, 19(1), 8-20.
Brislin, R. W. & Yoshida, T. (1994). Improving intercultural interactions. Multicultural
aspects of counseling series. Thousand Oaks, CA: Sage.
Brown, E. L. (2005a). Service-learning in teacher education: Creative strategies for
alternative routes to certification. Equity & Excellence in Education, 38(1), 61-74.
Brown, E. L. (2005b). Using photography to explore hidden realities and raise cross cultural
sensitivity in future teachers. The Urban Review, 37(2), 149-171.
200
Brown, E. L. (2006). Knowing, Valuing, and Shaping One's Culture: A Precursor to
Acknowledging, Accepting, and Respecting the Culture of Others. Multicultural
education, 14(1), 15-19.
Brown, P. (2003). The Opportunity Trap: Education and Employment in a Global Economy.
European Educational Research Journal 2, 142-180.
Brown, P. & Hesketh, A., J. (2004). The Mismanagement of Talent. Oxford: Oxford
University Pre-ss.
Brown, P., Lauder, H. & Ashton, D. (2011). The Global Auction, the Broken Promises of
Education, Jobs and Incomes. Oxford: Oxford University Press.
Brown, P.& Tannock, S (2009). Education, Meritocracy & the Global War for Talent,
Journal of Education Policy, 24. 377-392.
Brown, S. & Jones, E. (2007). Internationalising higher education. London, UK: Routledge.
Budge, K. (2014). Finding Pockets of Agency. In Being “In and Out” (pp. 69-78). Sense
Publishers.
Budner, S. (1962). Intolerance of ambiguity as a personality variable. Journal of Personality,
30(1), 29–50.
Budworth, M. H., & DeGama, N. (2012). Invited Reaction: Factors Affecting Cross-Cultural
Adjustment--Training, Experience, and Individual Differences. Human Resource
Development Quarterly, 23(3), 331-340.
Bunnell, T., Yea, S., Peake, L., Skelton T., & Smith, M. (2012). Geographies of friendships.
Progress in Human Geography, 36(4), 490-507.
Burnett, S.A. & Huisman, J. (2010). Universities’ responses to globalization: The influence
of organizational culture. Journal of Studies in International Education, 14(2), 117-
142.
201
Burns, A. C. & Bush, R. F. (1995). Marketing research. New Jersey: Pre-ntice Hall
Business Industry and Higher Education Collaboration Council. (BIHECC). (August
2007). Graduate Employability Skills, (Commissioned Report).
Byram, M. (1989). Cultural studies in foreign language education. Cleveland, England:
Multilingual Matters.
Byram, M. (1997). Teaching and Assessing Intercultural Communicative Competence.
Clevedon, UK: Multilingual Matters.
Byram, M. (2003). On being ‘bicultural’ and ‘intercultural’. In G. Alred, M. Byram & M.
Fleming (Eds). Intercultural experience and education (pp. 50-66). Tonowanda, N.Y:
Multilingual Matters.
Byram, M., Gribkova, B., & Starkey, H. (2002). Developing the Intercultural Dimension in
Language Teaching: A Practical Introduction for Teachers. Strasbourg: Council of
Europe.
Byrne, B (2005) Factor Analytic Models: Viewing the Structure of an Assessment Instrument
From Three Perspectives, Journal of Personality Assessment, 85:1, 17-32, DOI:
10.1207/s15327752jpa8501_02
Cai, Y. (2013). Graduate employability: A conceptual framework for understanding
employers’ perceptions. Higher Education, 65(4), 457-469.
Caligiuri, P. (2006). The big five personality characteristics as predictors of performance.
Personnel Psychology, 53(1), 67-68.
Caligiuri, P. & Santo, V. D. (2001). Global competence: what is it, and can it be developed
through global assignments?. Human Resource Planning, 24(3).
Caligiuri, P. & Tarique, I. (2012). Dynamic cross-cultural competencies and global
leadership effectiveness. Journal of World Business, 47(4), 612-622.
202
Cant, A. G. (2004). Internationalizing the business curriculum: Developing intercultural
competence. Journal of American academy of Business, 5(1/2), 177-182.
Carman, J. M. (1977). Values and Consumption Patters: A closed loop. Advances in
consumer Research, 5, 403-407.
Carpenter, M.A., Sanders, W.G., & Gregersen, H. B. (2001) ‘Bundling human capital with
organizational context: the impact of international assignment experience on
multinational firm performance and CEO pay’, Academy of Management Journal
44(3), 493–522.
Caruana, V. & Ploner, J. (2010). Internationalisation and Equality and Diversity in Higher
Education: Merging Identities. Project Report. Equality Challenge Unit (ECU).
Castro, P., Woodin, J., Lundgren, U., & Byram, M. (2016). Student mobility and
internationalisation in higher education: perspectives from practitioners, Language and
Intercultural Communication, 16(3), 418-436, DOI: 10.1080/14708477.2016.11680.
Chang, W-W., Yuan, Y-H., & Chuang, Y-T. (2013). The relationship between international
experience and cross-cultural adaptability. International Journal of Intercultural
Relations, 37, 268-273.
Chapdelaine, R. F. & Alexitch, L. R. (2004). Social skills difficulty: Model of culture shock
for international graduate students. Journal of College Student Development, 45(2),
167-184.
Chen, G. M. & Starosta, W. J. (1996). Intercultural communication competence: a synthesis.
Communication Yearbook, 19, 353-383.
Chen, G. M. & Starosta, W. J. (1998). A review of the concept of intercultural awareness.
Human Communication, 2(1), 27–54.
203
Chen, G. M. & Starosta, W. J. (2000). The development and validation of the intercultural
sensitivity scale. Paper presented at the Annual Meeting of National Communication
Association, Seattle, WA. Retrieved from ERIC database (ED447525).
Chen, L. (2002). Perceptions of intercultural interaction and communication satisfaction: A
study on initial encounters. Communication Research, 15, 133-147.
Chen, X. (2012). Culture, peer interaction, and socioemotional development. Child
Development Perspectives, 6(1), 27-34.
Cherbosque, J., Gardenswartz, L., & Rowe, A. (2005). Emotional Intelligence and Diversity
Series. Emotional Intelligence and Diversity Institute. Los Angeles, CA.
Chester, A., Burton, L. J., Xenos, S., & Elgar, K. (2013). Peer mentoring: Supporting
successful transition for first year undergraduate psychology students. Australian
Journal of Psychology, 65(1), 30-37.
Chickering, A.W. & Reisser, L (1993). Education and Identity. Jossey-Bass Inc, San
Francisco, California.
Child, D. (2006). The essentials of factor analysis. (3rd ed). New York, NY: Continuum
International Publishing Group.
Chua, R. (2013). The costs of ambient cultural disharmony: indirect intercultural conflicts in
social environment undermine creativity. Academy of Management Journal, 56(6),
1545-1577.
Church, A. T. (1982). Sojourner adjustment. Psychological bulletin, 91(3), 540.
Churchill, G. & Iacobucci, D. (2002). Marketing Research, Methodological Foundations. 8th
Ed. London. Harcourt Publishing.
Cleveland, H., Mangone., J.G. & Adams, J.C. (1969). The Overseas Americans. McGraw-
Hill, New York, NY.
204
Clifford, V. & Montgomery, C. (2011). Introduction: Internationalising the curriculum for
global citizenship in higher education. Oxford Centre for Staff and Learning
Development (OCSLD).
Cohen, E. (2007). Leadership Without Borders: Successful strategies from world-class
leaders. Singapore: John Wiley & sons (Asia) Pte. Ltd.
Cohen, J. (1988). Statistical power analysis for the behavioral sciences (2nd ed.). Hillsdale,
NJ: Erlbaum.
Collier, M. J. (1996). Communication competence problematic in ethnic friendships.
Communication Monographs, 63, 314-336.
Collings, R., Swanson, V., & Watkins, R. (2016). Peer mentoring during the transition to
university: assessing the usage of a formal scheme within the UK. Studies in Higher
Education, 41(11), 1995-2010.
Collins, E. G. & Scott, P. (1978). Everyone who makes it has a mentor.
Connolly, I. M., Darby, M. L., Tolle-Watts, L., & Thomson-Lakey, E. (2000). The
cultural adaptability of health science faculty. Journal of Dental Hygiene, 74 (2),
102-116.
Conover, W. J. & Iman, R. L. (1981). Rank transformations as a bridge between parametric
and nonparametric statistics. The American Statistician, 35(3), 124-129.
Conyne, R. K. & Clack, R. J. (1981). Environmental assessment and design: A new tool for
the applied behavioral scientist. Praeger publishers.
Cook, T. D. & Campbell, D. T. (1979). The design and conduct of true experiments and
quasi-experiments in field settings. Reproduced in part in Research in Organizations:
Issues and Controversies. Goodyear Publishing Company.
205
Cooper, D. R. & Emory, C. W. (1995). Business Research Methods. Richard D. Irwin. Inc.,
Chicago.
Cooper, V. (2009). “Intercultural Student Interaction in Post-graduate Business and
Information Technology Programs: The Potentialities of Global Study Tours.” Higher
Education Research & Development, 28(6), 557 – 570.
Crose, B. (2011). Internationalization of the higher education classroom: Strategies to
facilitate intercultural learning and academic success. International Journal of
Teaching and Learning in Higher Education, 23(3), 388-395.
Cross, S. (1998). Roots and wings: Mentoring. Innovations in education and training
International, 35(3), 224-230.
Crossman, J.E. & Clarke, M. (2010). International experience and graduate employability:
stakeholder perceptions on the connection. Higher Education. 59, 599-613.
Crotty, M. (1998). The Foundations of Social Research: Meaning and Perspective in the
Research Process. Allen & Unwin, Sydney, Australia.
Crowne, K. A. (2013). Cultural exposure, emotional intelligence, and cultural intelligence:
An exploratory study. International Journal of Cross Cultural Management, 13(1), 5-
22.
Crutcher, B. N. (2007). Mentoring across cultures. ACADEME-BULLETIN OF THE
AAUP, 93(4), 44.
Csikszentmihalyi, M. (1977). Beyond Boredom and Anxiety, second printing. San
Francisco: Jossey-Bass.
Cui, G. & Awa, N.E. (1992). “Measuring intercultural effectiveness: an integrative
approach”, International Journal of Intercultural Relations, 16(2), 311-28.
206
Czinkota, M. R. (2005). Loosening the shackles: The future of global higher education, Paper
presented at the World Trade Organization, Symposium on cross-border supply of
services. Geneva.
Dacre-Pool, L. & Sewell, P. (2007). The key to employability: developing a practical model
of graduate employability. Education+ Training, 49(4), 277-289.
Dalton, M., Ernst, C., Deal, J., & Leslie, J. (2002). Success for the new global manager: What
you need to know to work across distances, countries, and cultures. San Francisco, CA:
Jossey-Bass.
David, K. H. (1976). The use of social learning theory in pre-venting intercultural adjustment
problems. Counseling across cultures, 123-138.
Davidov, E., Schmidt, P., & Schwartz, S. H. (2008). Bringing values back in: The adequacy
of the European Social Survey to measure values in 20 countries. Public Opinion
Quarterly, 7, 420–445.
Davis, D. V., Olsen, A., & Milne, C. (1999). Becoming internationally competitive: The
value of international experience for Australian students. IDP Education Australia.
Davis, S. L., & Finney, S. J. (2006). A factor analytic study of the cross-cultural adaptability
inventory. Educational and Psychological Measurement, 66, 318 - 330.
Deakin University. (2010). Handbook for peer mentors: Peer mentoring program 2010.
Geelong: Author. Retrieved from http://www.deakin.edu.au/hmnbs/Peer 20Mentoring
20Handbook 202010.pdf.
Deal, J.J., Leslie, J., Dalton, M., & Ernst, C. (2003). Cultural adaptability and leading
across cultures. In W.H. Mobley & P.W. Dorfman (Eds.), Advances in global
leadership (pp. 149–166). Oxford: JAI Pre-ss.
207
Deardorff, D. K. (2004). The identification and assessment of intercultural competence as a
student outcome of internationalization at institutions of higher education in the United
States (Doctoral dissertation). Retrieved from ProQuest Dissertations & Theses: Full
Text. (AAT 3128751).
Deardorff, D. K. (2006). The identification and assessment of intercultural competence as a
student outcome of internationalization at institutions of higher education in the United
States. Journal of Studies in International Education, 10, 241-266.
Deardorff, D. K. (2009). Synthesizing conceptualizations of intercultural competence: A
summary and emerging themes. In D. K. Deardorff (Ed.), The SAGE handbook of
intercultural competence (pp.122-123).
Deardorff, D. K. & Hunter, W. (2006). Educating global-ready graduates. International
Educator, 15(3), 72.
DeCarlo, L. T. (1997). On the meaning and use of kurtosis. Psychological methods, 2(3),
292.
DeCoster, J. (1998). Overview of factor analysis. Retrieved from http://www.stat-
help.com/notes.html.
de Dreu, C. K. W., & Boles, T. (1998). Share and share alike or Winner take all? The
influence of social value orientation upon choice and recall of negotiation heuristics.
Organizational Behavior and Human Decision Processes, 76, 253–276.
Deloitte Access Economics. (DAE). (2017). Soft Skills for Business Success. Retrieved from
https://www2.deloitte.com/au/en/pages/economics/articles/soft-skills-business-
success.html.
Delpichtre, D. & Baker, D.S. (2017). Cross-Cultural Selling: Examining the Importance of
Cultural Intelligence in Sales Education. Journal Marketing Education, 39 (2), 94-108.
208
Department of Education. (2018). Section 2 all students. Retrieved from
https://docs.education.gov.au/documents/2018-section-2-all-students.
Department of Education and Training. (2019). International mobility of Australian
university students. Retrieved from
https://internationaleducation.gov.au/research/Research-
Snapshots/Documents/Outgoing%20international%20mobility_HE_2017.pdf.
Department of Education and Training. (2019a). Education export income by country 2018,
May 2019. Retrieved from https://internationaleducation.gov.au/research/Research-
Snapshots/Documents/Export%20Income%202018%20Country%20Infographic.pdf,
Department of Education and Training. (2019b). International Student Data Monthly
Summary, August 2019. Retrieved from,
https://internationaleducation.gov.au/research/International-Student
data/Documents/MONTHLY%20SUMMARIES/2019/Aug%202019%20MonthlyInf
ographic.pdf.
Department of Education and Training. (2019c). The global context of tertiary student
mobility. Retrieved from https://internationaleducation.gov.au/research/Research-
Snapshots/Documents/RS_Global%20context.pdf.
Deutsch, S.E. (1970). International education and exchange. Cleveland OH: Case Western
University.
De Vaus, D.A. (2014). Surveys in social research (6th edn). Sydney: Allen & Unwin.
De Verthelyi, R. F. (1995). International students' spouses: Invisible sojourners in the culture
shock literature. International Journal of Intercultural Relations, 19(3), 387-411.
De Vita, G. (2002). Does assessed multicultural group work really pull UK students' average
down? Assessment & Evaluation in Higher Education, 27(2), 153-161.
209
DeWald, J.P. (2009). Use of the Cross-cultural adaptability inventory to Measure Cultural
Competence in a Dental Hygiene Program, The Journal of Dental Hygiene, 83(3).
Dillman, D. A. (1978). Mail and Telephone Surveys: The Total Design Method. New York:
John Wiley.
Dillman, D. A. (2000). Mail and Internet Surveys: The Tailored Design Method. New York:
Wiley.
Dimitrov, D. M. & Rumrill Jr, P. D. (2003). Pre-test-posttest designs and measurement of
change. Work, 20(2), 159-165.
Dimitrov, N., Dawson, D. L., Olsen, K., & Meadows, K. N. (2014). Developing the
intercultural competence of graduate students. Canadian Journal of Higher
Education, 44(3), 86.
Dinardo, J. (2008). "natural experiments and quasi-natural experiments". The New Palgrave
Dictionary of Economics. pp. 856–859.
doi:10.1057/9780230226203.1162. ISBN 978-0-333-78676-5.
Dodd, C. (2007). Intercultural readiness assessment for pre--departure candidates.
Intercultural Communication Studies, XVI (2), 1-17.
Dolan, S. L. & Cerdin, J. L. (2005). Emotional intelligence as predictor of cultural adjustment
for success in global assignments. Career Development International. 10(5), 375–95.
Dreher, G. F. & Ash, R. A. (1990). A comparative study of mentoring among men and
women in managerial, professional, and technical positions. Journal of applied
psychology, 75(5), 539.
Dreher, G. F. & Cox Jr, T. H. (1996). Race, gender, and opportunity: a study of compensation
attainment and the establishment of mentoring relationships. Journal of applied
psychology, 81(3), 297.
210
Dua, A. (2013). Voice of the graduate. McKinsey and Company. Retrieved from
http://mckinseyonsociety.com/voice-of-the-graduate/.
Earley, P., Soon, A., & Tan, J. (2006). Developing cultural intelligence at work. Stanford,
California: Stanford Business Books.
Earley, P.C. & Mosakowski, E. (2004). Cultural intelligence. Harvard Business Review, 139-
146.
Eby, L. T., Durley, J. R., Evans, S. C., & Ragins, B. R. (2006). The relationship between
short-term mentoring benefits and long-term mentor outcomes. Journal of Vocational
Behavior, 69(3), 424-444.
Edwards, B. J. (1999). The effect of multicultural training on the cross-cultural adaptability
of college students. (Doctoral dissertation, Nova Southeastern University).
Dissertation Abstracts International, DAI – A 60/05, 1428.
Edwards, D., Perkins, K., Pearce, J., & Hong, J. (2015). Work Integrated Learning in STEM
in Australian Universities: Final report. Submitted to the Office of the Chief Scientist.
Eichenger, M., Leslie, J., Dalton, M., Ernst, C., & Deal, J. (2015). Managerial effectiveness
in a global context. white paper, Center for Creative Leadership, Greensboro, N.C
Elmuti, D., Tuck, B., & Kemper, F. (2008). Analyzing Cross-Cultural Adaptability among
Business Students: An Empirical Investigation. International Journal of Management,
25(3) 551-594.
EmamJomeh-Zadeh, S. J., Damirchi, Q. V., Darban, M.Z., & Sharifi, S. (2012). The Cross-
cultural adaptability among university faculties, Interdisciplinary Journal of
Contemporary Research in Business 3(9).
Emmons, R. A. (1989). The personal striving approach to personality. In L. A. Pervin (Ed.),
Goal concepts in personality and social psychology (pp. 87-126). Hillsdale, NJ:
Lawrence Erlbaum.
211
Engle, R.L. & Crowne, K.A. (2014), The impact of international experience on cultural
intelligence: an application of contact theory in a structured short-term programme,
Human Resource Development International, 17(1), 30-46.
Erickson, F. (1997). Culture in society and in educational practices. In J. A. Banks & C. M.
Banks (Eds.), Multicultural education: Issues and perspectives, (3rd ed.) (pp. 32-60).
Needham Heights, MA: Allyn & Bacon.
Ewan, C. (2016). Higher Education Standards in a Disaggregated Learning Environment:
Final report. Canberra: Australian Government Office for Learning and Teaching.
Falchikov, N. (2001). Learning together: Peer tutoring in higher education. Psychology
Press.
Fantini, A. E. (2005). Exploring and assessing intercultural competence. Retrieved from
http://www.sit.edu/publications/docs/feil_research_report.pdf.
Feather, N. T. (1988). Values, valences, and course enrollment: Testing the role of personal
values within an expectancy-value framework. Journal of Educational Psychology, 80,
381–391.
Feather, N. T. (1995). Values, valences, and choice: The influence of values on the perceived
attractiveness and choice of alternatives. Journal of Personality and Social
Psychology, 68, 1135–1151.
Feather, N. T. (1999). Values, Achievement, and Justice: Studies in the Psychology of
Deservingness. New York: Kluwer Academic ⁄ Plenum.
Ferns, S. & Moore, K. (2012). Assessing student outcomes in fieldwork placements: An
overview of current practice. International Journal of Work-Integrated
Learning, 13(4), 207.
212
Ferrari, J. R. (2004). Mentors in life and at school: impact on undergraduate protege´
perceptions of university mission and values. Mentoring & Tutoring: Partnership in
Learning, 12(3), 295-305.
Field, A. (2013). Discovering statistics using IBM SPSS statistics. Sage. Place of publication
Field, L. F. (1990). The effect of multicultural counseling training on multicultural sensitivity
of graduate students. Doctoral dissertation, Indiana State University, Terre Haute,
Indiana.
Fink, G., Holden, N., Kayes, D. C., Kayes, A. B., & Yamazaki, Y. (2005). Essential
competencies for cross‐cultural knowledge absorption. Journal of Managerial
Psychology.
Fisher, R. (2009). Where is culture in cross cultural research? An outline of a multilevel
research process for measuring culture as a shared meaning system. International
Journal of Cross Cultural Management, 9, 25–49.
Floden, R. E. (1996). Educational research: Limited, but worthwhile and maybe a
bargain. Curriculum Inquiry, 26(2), 193-197.
Fox A., Stevenson L., Connelly P, et al., (2010). Peer-mentoring undergraduate accounting
students: The influence on approaches to learning and academic performance. Active
Learning in Higher Education 11(2): 145–56.
Fox, A. & Stevenson, L. (2006). Exploring the effectiveness of peer mentoring of accounting
and finance students in higher education. Accounting Education: an international
journal, 15(2), 189-202.
Fredrickson, B. L. (2001). The role of positive emotions in positive psychology: The
broaden-and-build theory of positive emotions. American Psychologist, 56(3), 218-226
213
Freeman, M. & Kelton, J. (2004). Peer mentoring programs: Enhancing the learning
experience in economics & business. Synergy, 20. Retrieved from http://www.itl.
usyd.edu.au/synergy/article.cfm?articleID=35.
Freudenberg, B., Brimble, M., & Cameron, C. (2009). The building of a professional:
Creating greater career within a degree. The International Journal of Learning, 16(10),
253-266.
Fukasawa, L. (1990). The effect of multicultural counseling training on multicultural
sensitivity of graduate students. (Doctoral dissertation, Indiana State University).
Dissertation Abstracts International, 51, 05A.
Furnham, A. & Bochner, S. (1982). Social difficulty in a foreign culture: An empirical
analysis of culture shock. Cultures in contact: Studies in cross-cultural interaction, 1,
161-198.
Furnham, A. & Bochner, S. (1986). Culture shock: Psychological reactions to unfamiliar
environments. London: Methuen.
Furuya, N., Stevens, M. J., Bird, A., Oddou, G., & Mendenhall, M. (2009). Managing the
learning and transfer of global competence: Antecedents and outcomes of Japanese
repatriation effectiveness. Journal of International Business Studies, 40(2), 200–215.
Galton, F. (1886). Regression towards mediocrity in hereditary stature. The Journal of the
Anthropological Institute of Great Britain and Ireland, 15, 246-263.
Gardiner, C. (1998). Mentoring: Towards a professional friendship. Mentoring & Tutoring:
Partnership in Learning, 6(1-2), 77-84.
Gardner, H. (1983). Frames of mind: The theory of multiple intelligences. New York, NY:
Basic Books.
Gardner, P. D. & Perry, A. L. (2011). The Role of cooperative and work-integrated education
in graduate transition into the workplace. International perspectives of theory, research
214
and practice. In R.K Coll & K.E. Zegward (Eds) International Handbook for
Cooperative & Work Integrated Education (2nd ed), 313-320.
Gareis, E. (2012). Intercultural friendships: Effects of home and host region. Journal of
International and Intercultural Communication, 5(4), 309-328.
Gerbing, D, A. & Hamilton, J, H. (1997). Viability of Exploratory Factor Analysis as a pre-
cursor to Confirmatory Factor Analysis, Structural Equation Modeling, 3(1), 62-72.
Gerighausen, J. & Seel, P. (1982). Regionale Lehrwerke [Regional textbooks]. In H.-J.
Krumm (Ed.), Lehrwerkorshung-Lehrwerkkritik Deutsch als Fremdprache (pp. 23-
35). Munhen: Geothe-Institut Werkheft.
Gershenfield, S. (2014). A review of undergraduate mentoring programs. Review of
Educational Research 84(3), 365-391.
Glickman, L. B., Olsen, J., & Rowthorn, V. (2015). Measuring the cross-cultural adaptability
of a graduate student team from a global immersion experience. Journal of Cultural
Diversity, 22(4), 148-154.
Goetz, T., Nathan, C., Hall, A. C., Frenzel, A., & Pekrun, R. (2006). A hierarchical
conceptualization of enjoyment in students. Learning and Instruction, 16, 323-338.
https://doi.org/10.1016/j.learninstruc.2006.07.004.
Goetz, J. L., Spencer-Rodgers, J., & Peng, K. (2008). Dialectical emotions: How cultural
epistemologies influence the experience and regulation of emotional complexity. In R.
M. Sorrentino & S. Yamaguchi (Eds.), Handbook of motivation and cognition across
cultures (pp. 517-538). Amsterdam, Netherlands: Elsevier.
Gohring, H. (1980). Deutsch als Fremdsprache und interkulturelle Kommunikation [German
as a foreign language and intercultural communication]. In A. Wierlacher (Ed.),
Fremdsprache Deutsch Bd. I (pp 71-91). Munchen: Wilhem Fink Verlag.
215
Goldsen, R. K., Schuman, E. A., & Williams, R. M. (1956). Factors associated with the
development of cross-cultural social interaction. Journal of Social Issues, 12, 26-32.
Goldstein D. L. (1992). A Comparison of the Effects of Experiential Training on Sojourners'
Cross-Cultural Adaptability. Florida: Florida International University.
Goldstein, D. L. & Smith, D.H. (1999). The analysis of the effects of experiential training
on sojourner’s cross-cultural adaptability. International Journal of Intercultural
Relations, 23, 157-173.
Goleman, D. (1995). Emotional intelligence. New York: Bantam Books.
Gollnick, D., & Chinn, P. (2005). Multicultural education in a pluralistic society, (6th ed.).
Upper Saddle River, NJ: Merrill Prentice Hall.
Goodenough, W. (1987). Multiculturalism as the normal human experience. In E. M. Eddy
& W. L. Partridge (Eds.), Applied anthropology in America, (2nd Ed). New York:
Columbia University Press.
Goodlad, J. I., Mantle-Bromley, C., & Goodlad, S. J. (2004). Education for everyone:
Agenda for education in a democracy. San Francisco: Jossey-Bass.
Goodland, S. (1998). Mentoring and tutoring by students. London: BP Educational Services.
Goodman, B., Jones, R., & Macias, M. S. (2007). An exploratory survey of Spanish and
English nursing students’ views on studying or working abroad. Nurse Education
Today, 28(3), 378 – 384.
Gorbunov A.P. (2009). The mission, priorities, objectives and strategies of Pyatigorsk State
Linguistic University as basic elements of the university’s system of quality
management functioning. Pyatigorsk State Linguistic University, Russia.
216
Gothard, J., Downey, G., & Gray, T. (2012). Bringing the learning home: programs to
enhance study abroad outcomes in Australian universities. Australian Government
Office for Learning and Teaching.
Grace-Martin, K. (2019). Retrieved from www.theanalysisfactor.com.
Gregersen, H. B., Morrison, A. J., & Black, J. S. (1998). Developing leaders for the global
frontier. Sloan Management Review, 40, 21–32.
Gregersen-Hermans, J. (2016). From rationale to reality in intercultural competence
development: Working towards the University’s Organizational Capability to Deliver.
Jones, E et.al., (eds). Global and Local Internationalization, 91-96. Sense Publishers.
Griffiths, K., Kopanidis, F., & Steel, M. (2018). Investigating the value of a peer-to-peer
mentoring experience. Australasian Marketing Journal (AMJ), 26(2), 92-98.
Gudykunst, W. B., Nishida, T., & Schmidt, K. L. (1989). The influence of cultural, relational,
and personality factors on uncertainty reduction processes. Western Journal of
Communication (includes Communication Reports), 53(1), 13-29.
Hair, J.F., Black, W.C., Babin, B. J., Anderson, R. E., &Tatham, R. L. (2006). Multivariate
Data Analysis, Pre-ntice Hall, New Jersey.
Hall, R. & Jaugietis, Z. (2011). Developing peer mentoring through evaluation. Innovative
Higher Education, 36(1), 41-52.
Halualani, R. T., Chitgopekar, A., Morrison, J. H. T. A., & Dodge, P. S. W. (2004). Who's
interacting? And what are they talking about? intercultural contact and interaction
among multicultural university students. International Journal of Intercultural
Relations, 28(5), 353-372.
Helyer, R. & Lee, D. (2014). The Role of Work Experience in the Future Employability of
Higher Education Graduates. Higher Education Quarterly, 68(3), 348-372.
217
Hammer, M. R., Bennett, M.J., & Wiseman R. (2003). Measuring intercultural sensitivity:
The intercultural development inventory. International Journal of Intercultural
Relations, 27, 421-443.
Hammer, M. R., Gudykunst, W.B., & Wiseman, R.L. (1978). Dimensions of intercultural
effectiveness: An exploratory study. International Journal of Intercultural Relations,
2, 382-393.
Hannigan, T. P. (1990). Traits, attitudes, and skills that are related to intercultural
effectiveness and their implications for cross-cultural training: A review of the
literature. International Journal of Intercultural Relations, 14(1), 89-111.
Hanson, V. D. (2016). The regrettable decline of higher learning. Retrieved from
https://www.realclearpolitics.com/articles/2016/02/04/the_regrettable_decline_of_hig
her_learning_129558.html.
Harari, M. (1992). The internationalization of the curriculum. Bridges to the future:
Strategies for internationalizing higher education, 52-79.
Harris Jr, J. G. (1977). Department of Psychology, University of Kentucky. Culture
learning: concepts, applications, and research.
Harrison, L. & Potts, D. (2016). Learning abroad at Australian universities: The current
environment. Canberra and Melbourne: Universities Australia and the International
Education Association of Australia.
Harrison, N. (2012). Investigating the impact of personality and early life experiences on
intercultural interaction in internationalized universities. International Journal of
Intercultural Relations, 36(6), 224-237.
Hartman, P., Renguette, C., & Seig, M. T. (2018). Problem-Based Teacher-Mentor
Education: Fostering Literacy Acquisition in Multicultural Classrooms.
Interdisciplinary Journal of Problem-Based Learning, 12(1), 6.
218
Hasan, N. (2016). Positivism: to what extent does it aid our understanding of the
contemporary social world? Qual Quant, 50, 317-325.
Hassan, A. E. B. M. A. (1961). Social interaction between foreign students and Americans
in a mid-western community..
Hawanini, G. (2011). The internationalization of higher education institutions: A critical
review and a radical proposal. Paris, France: INSEAD Working Paper.
Hayward, L. M. & Charrette, A. L. (2012). Integrating cultural competence and core values:
an international service-learning model. Journal of Physical Therapy
Education, 26(1), 78-89.
Hecht, M.L., Larkey, L.K., & Johnson, J.N. (1992). African American and European
American perceptions of problematic issues in interethnic communication
effectiveness. Human Communication Research, 19, 209-236.
Hecht, M.L. & Ribeau, S. (1984). Ethnic communication: A comparative analysis of
satisfying communication. International Journal of Intercultural Relations, 8, 135-
151.
Heilmann, S. G. (2012). A Measurement Invariance Study of a Mentoring Scale: Does
Protégé Race Matter? Journal of Business and Behavioral Sciences, 24(3), 4.
Heirdsfield, A.M., Walker, S., & Walshe, K. M. (2008). Enhancing the first year
experience – Longitudinal perspectives on a peer mentoring scheme. In: Australian
association for research in education – Research impacts: Proving or improving,
Fremantle, WA, Australia, 25–29 November. Retrieved from http://eprints.
qut.edu.au/12150/1/12150.pdf.
Helyer, R. 2011. Aligning higher education with the world of work. Higher Education, Skills
and Work Based Learning, 1(2): 95-105.
219
Herman, J. L., Stevens, M. J., Bird, A., Mendenhall, M., & Oddou, G. (2010). The tolerance
for ambiguity scale: Towards a more refined measure for international management
research. International Journal of Intercultural Relations, 34(1), 58-65.
Hibbins, R. & Barker, M. (2011). Group work with students of diverse backgrounds. Groups
work: A guide for working in groups.
Hofstede, G. (1980). Culture and organizations. International Studies of Management &
Organization, 10(4), 15-41.
Hofstede, G. (1984). Cultural dimensions in management and planning. Asia Pacific journal
of management, 1(2), 81-99.
Hofstede, G. (1991). Cultures and organizations. Intercultural cooperation and its
importance for survival. Software of the mind. London: McGraw-Hill.
Hofstede, G. (2001). Culture’s consequences: Comparing values, behaviors, institutions and
organizations across nations. (2nd Ed.) Thousand Oaks, CA: Sage.
Hofstede, G. (2011). Dimensionalizing cultures: The Hofstede model in context. Online
readings in psychology and culture, 2(1), 8.
Hofstede, G. (2013). Dimensions of national cultures.
Hofstede, G. & Minkov, M. (2010). Long-versus short-term orientation: new
perspectives. Asia Pacific business review, 16(4), 493-504.
Hough, L. M., & Schneider, R. J. (1996). Personality traits, taxonomies, and applications in
organizations. In K. R. Murphy (Ed.), Individual Differences and Behavior in
Organizations (pp. 21–88). San Francisco, CA: Jossey Bass.
House, R., Javidan, M., Hanges, P. and Dorfman, P. (2002), “Understanding cultures and
implicit leadership theories across the globe: an introduction to project GLOBE”,
Journal of World Business, 37(1), 3-1.
220
Howard, G. (1999). We can’t teach what we don’t know: White teachers, multiracial schools.
New York: Teacher College Press.
Hua, J., Fan, J., Walker, A., Hou, N., Zheng, L. & Debode, J. (2018). Examinations of the
Role of Individual Adaptability in Cross-Cultural Adjustment. Journal of Career
Assessment. 1-20.
Hughes, A. & Fahy, B. (2009). Implementing an Undergraduate Psychology Mentoring
Program. North American Journal of Psychology, 11(3).
Hunter, B., White, G. P., & Godbey, G. C. (2006). What does it mean to be globally
competent? Journal of Studies in International Education, 10(3), 267-285.
Hunter, W. D. (2004). Knowledge, skills, attitudes, and experiences necessary to become
globally competent. Lehigh University.
Hurtado, S. (1992). The campus racial climate: Contexts of conflict. The Journal of Higher
Education, 63(5), 539-569.
Hurtado, S., Carter, D., & Sharp, S. (1995). Social interaction on campus: Differences among
self-perceived ability groups. Paper presented at the meeting of the Association for
Institutional Research, Boston, MA.
Hurtado, S., Milem, J. F., Clayton-Pedersen, A. R., & Allen, W. R. (1998). Enhancing
campus climates for racial/ethnic diversity: Educational policy and practice. Review of
Higher Education, 21(3), 279-302.
Hutcheson, G. & Sofroniou, M. (1999). The multivariate social scientist. London, Sage.
Hynes, G. E. (2008). Managerial communication strategies and applications. (pp. 3-4, 15-
17, 27, 207). Boston: McGraw-Hill/Irwin.
221
Inkson, K., Arthur, M. B., Pringle, J., & Barry, S. (1997). Expatriate assignment versus
overseas experience: Contrasting models of international human resource
development. Journal of world business, 32(4), 351-368.
International Education. (2019). Retrieved from
https://internationaleducation.gov.au/research/International-Student-
Data/Documents/MONTHLY%20SUMMARIES/2018/Oct%202018%20MonthlyInf
ographic.pdf
International Education. (2019). Retrieved from
https://internationaleducation.gov.au/research/Research-
Snapshots/Documents/Outgoing%20international%20mobility_HE_2017.pdf.
International Education Exchange. (IIE). 2011. Open Doors 2011: Report on International
Educational Exchange. New York, NY: IIE. Retrieved from
https://www.ieaa.org.au/documents/item/1151.
Jackson, D. (2013). Student Perceptions of the Importance of Employability Skill Provision
in Business Undergraduate Programs, Journal of Education for Business, 88(5), 271-
279.
Jackson, D., Rowbottom, D., Ferns, S., & McLaren, D. (2017). Employer understanding of
work-integrated learning and the challenges of engaging in work placement
opportunities. Studies in Continuing Education, 39(1), 35-51.
Jacobi, M. (1991). Mentoring and undergraduate academic success: A literature
review. Review of educational research, 61(4), 505-532.
Johnson‐Bailey, J., & Cervero, R. M. (2004). Mentoring in black and white: the intricacies
of cross‐cultural mentoring. Mentoring & Tutoring: Partnership in Learning, 12(1), 7-
21.
222
Johnson, C. S. (1989). Mentoring programs. In M. L. Upcraft & J. Gardner (Eds.), The
freshman year experience: Helping students survive and succeed in college (pp. 118-
128). San Francisco: Jossey-Bass.
Jokinen, T. (2005). Global leadership competencies: A review and discussion. Journal of
European Industrial Training, 29, 199–216.
Jon, J-E. (2013). Realizing Internationalization at Home in Korean Higher Education:
Students’ Interaction with International Students and Intercultural Competence.
Journal of Studies in International Education, 17(4) 455-470.
Jones, R. G. (2001). Quantitative Evaluation and Design (QED) Department of Education,
Science and Training (DEST). Retrieved from http://www.dest.gov.au.
Joseph, M. & Joseph, B. (1998). Identifying needs of potential students in tertiary education
for strategy development. Quality Assurance in Education, 6(2), 90-96.
Joseph, M. & Joseph, B. (2000), Indonesian students' perceptions of choice criteria in the
selection of a tertiary institution: strategic implications. The International Journal of
Educational Management, 14(1), 40-44.
Kahle, L. R. (1996), “Social values and consumer behaviour: research from the List of
Values”, The Psychology of Values: The Ontario Symposium, Vol. 8, Lawrence
Erlbaum Associates Publishers, Hillsdale, NJ, pp. 135-50.
Kaiser, H. (1970). A second generation Little Jiffy. Psychometika, 35, 401-415.
Kaiser, H. (1974). An index of factorial simplicity. Psychometika, 39, 31-36.
Kashima, E. S. & Loh, E. (2006). International students’ acculturation: Effects of
international, conational, and local ties and need for closure. International journal of
intercultural relations, 30(4), 471-485.
223
Kassing, J. W. (1997). Development of the intercultural willingness to communicate scale.
Communication Research Reports, 14, 399–407.387-428.
Kealey, D. J. (1996). The challenge of international personnel selection. In D. Landis & R.
S. Bhagat (Eds.), Handbook of intercultural training (2nd ed., pp. 81–105). Thousand
Oaks, CA: Sage.
Kehm, B. M. (2005). The contribution of international student mobility to human
development and global understanding. US-China Review, 2(1/2), 18 – 24.
Kelly, G. (1963). A theory of personality. New York: Norton.
Kelley, C. & Meyers, J. (1987). Manual for CCAI–Cross-Cultural Adaptability Inventory,
Arlington, VA: Vangent.
Kelley, C. & Meyers, J. E. (1992). The cross-cultural adaptability inventory. National
Computer Systems.
Kelley, C. & Meyers, J. (1995). Cross-cultural Adaptability Inventory Manual. Arlington,
VA: Vangent.
Kelley, C. & Meyers, J. (2003). CCAI Sample Report. Chicago: Vangent Inc.
Kemlo, L. (2010). " Students helping students to achieve” This unique student learning
adviser mentors (SLM) program provides first year Higher Education students with a
strong foundation supporting academic success. ICERI Proceedings, 4036-4044.
Keppel, G. (1991). Design and analysis: A researcher's handbook. Prentice-Hall, Inc.
Kets de Vries, M. & Mead, C. (1992). The development of the global leader within the
multinational corporation. Globalizing management: Creating and leading the
competitive organization, 187-205.
224
Kidder, L. & Judd, C. (1986). Research methods in social science. New York, NY: CBS
College.
Kim, R. I. & Goldstein, S. B. (2005). Intercultural attitudes predict favorable study abroad
expectations of US college students. Journal of Studies in International
Education, 9(3), 265-278.
Kim, Y. Y. (2001). Becoming Intercultural: An integrative theory of communication and
cross-cultural adaptation. Thousand Oaks, CA: Sage.
Kim, Y. Y., Izumi, S., & McKay-Semmler, K. (2008). Interpersonal communication in the
context of cross-cultural adaptation. In 56th Convention of the International
Communication Association, Montreal, Canada (pp. 1-34).
Kim, Y. Y., Izumi, S., & McKay-Semmler, K. (2009, November). The role of direct and
mediated interpersonal communication in cross-cultural adaptation: A study of
educated and long-term non-native residents in the United States’. In annual
conference of the National Communication Association, Chicago.
Kim, Y. Y., Lujan, P., & Dixon, L. D. (1998). Patterns of communication and interethnic
integration: A study of American Indians in Oklahoma. Canadian Journal of Native
Education, 22(1), 120.
Kim, Y.Y. & Van Dyne, L. (2012). Cultural Intelligence and International Leadership
Potential: The Importance of Contact for Members of the Majority. Applied
Psychology: An International Review, 61(2), 272-294.
Kimmel, K. & Volet, S. (2012). University students’ perceptions of and attitudes toward
culturally diverse group work: Does context matter? Journal of Studies in International
Education, 16(2), 157-181.
Kimweli, D. M. S. & Richards, A.G. (1999). Choice of a major and student’s appreciation
of their major. College Student Journal, 33(1), 16-43.
225
King, L. A. (1995). Wishes, motives, goals, and personal memories: Relations of measures
of human motivation. Journal of Personality, 63, 985-1007.
Kirkman, B. L., Lowe, K. B., & Gibson, C. B. (2006). A quarter century of culture's
consequences: A review of empirical research incorporating Hofstede's cultural values
framework. Journal of international business studies, 37(3), 285-320.
Kirkman, B. L., Lowe, K. B., & Gibson, C. B. (2017). A retrospective on Culture’s
Consequences: The 35-year journey. Journal of International Business Studies, 48(1),
12-29.
Kitsantas, A. (2004). Studying Abroad: The role of college students’ goals on the
development of cross-cultural skills and global understanding. College Student
Journal, 441-452.
Kitsantas, A. & Meyers, J. (2001). Studying Abroad: Does It Enhance College Student
Cross-Cultural Awareness? Education in Europe. Hogskolverket Studies, 8S, 259-271.
Kline, R. B. (2015). Principles and practice of structural equation modeling. London:
Guilford publications.
Knight, J. (2004). Internationalisation remodeled: Definition, approaches, and rationales.
Journal of Studies in International Education, 8, 5–31.
doi:10.1177/1028315303260832.
Kopanidis, F. Z. (2008). An investigation of undergraduate choice behaviour of a preferred
program, discipline and university: a conceptual model. Royal Melbourne Institute of
Technology.
Kowcha, V., G. (1970). A study of United States students regarding the effects of their
residence in International House of New York. Dissertation Abstracts International,
20(5), 1644.
226
Kraemer, T. J. & Beckstead, J. (2003). Establishing the reliability of using the cross-cultural
adaptability inventory with physical therapist students. Journal of Physical Therapy
Education, 17(1), 27.
Kraimer, M.L., Takeuchi R., & Frese, M. (2014). The global context and people at work:
Special issue introduction. Personnel Psychology, 67, 5-21.
Krajewski, S. (2011). Developing intercultural competence in multilingual and multicultural
student groups. Journal of Research in International Education, 10(2), 137-153.
Kram, K. E. (1983). Phases of the mentor relationship. Academy of Management
Journal, 26(4), 608-625.
Kram, K. E. (1985). Alternatives to mentoring: The role of peer relationships in career
development. Academy of Management Journal 28, 110-132.
Kram, K. E. (1985). Improving the mentoring process. Training & Development Journal.
39(4), 40, 42-43.
Kramer, E. M. (2000). Resentment and racism. Socio-cultural conflict between African and
Korean Americans, 35-70.
Kuh, G. D., Schuh, J. H., Whitt, E. J., Andreas, R. E., Lyons, J. W., Strange, C. C., &
MacKay, K. A. (1991). Involving colleges: Encouraging student learning and personal
development through out-of-class experiences. San Francisco: Jossey-Bass. Lacy, W.
(1978). Interpersonal relationships as mediators of structural effects: College student
socialization in a traditional and experimental university environment. Sociology of
Education, 51, 201-211
Kuppens, P. (2008). Individual differences in the relationship between pleasure and
arousal. Journal of Research in Personality, 42, 1053-1059.
https://doi.org/10.1016/j.jrp.2007.10.007
227
Landis, D. & Bhagat, R. S. (1996). Handbook of intercultural training (2nd ed). Thousand
Oaks, CA: Sage.
Lane, H. W., Maznevski, M. L., & Mendenhall, M. E. (2004). Globalization: Hercules meets
Buddha. In H. Lane, M. L. Maznevski, M. Mendenhall, & J. McNett (Eds.), Blackwell
handbook of global management (pp. 3–25). London: Blackwell Publishing.
Leask, B. (2001). Bridging the Gap: Internationalizing University Curricula, Journal of
Studies in International Education, 5(2). 100-115.
Leask, B. (2004). Internationalisation outcomes for all students using information and
communication technologies (ICTs). Journal of Studies in International
Education, 8(4), 336-351.
Leask, B. (2008). Internationalisation, globalisation and curriculum innovation.
In Researching international pedagogies (pp. 9-26). Springer, Dordrecht.
Leask, B. (2009). Using formal and informal curricula to improve interactions between home
and international students. Journal of Studies in International Education, 13, 205-221.
Leask, B. (2011). Assessment, learning, teaching and internationalisation – engaging for the
future. ALT Journal 11, Summer. 5-20.
Leask, B. (2016). Internationalizing curriculum and learning for all students. In E. Jones et.al,
(eds) Global and Local Internationalization, 49-53.
Leask, B. & Beelen, J. (2009). Enhancing the engagement of international staff in
international education. In Proceedings of a joint IEAA-EAIE Symposium: Advancing
Australia-Europe Engagement, University of New South Wales, Sydney, Australia.
Leask, B. & Bridge, C. (2013). Comparing internationalisation of the curriculum in action
across disciplines: Theoretical and practical perspectives. Compare: a journal of
comparative and international education, 43(1), 79-101.
228
Leask, B. & Carroll, J. (2011). Moving beyond ‘wishing and hoping’: internationalisation
and student experiences of inclusion and engagement. Higher Education Research &
Development, 30(5), 647-659.
Lee, A., Poch, R., Shaw, M., & Williams, R. (2012). Engaging diversity in undergraduate
classrooms: A pedagogy for developing intercultural competence (ASHE Higher
Education Report, 38(2)). San Francisco, CA: Jossey-Bass.
Lee, P.-W. (2006). Bridging cultures: understanding the construction of relational identity in
intercultural friendship. Journal of Intercultural Community Res, 35(1), 3-22.
Leung, M. L. & Bush, T. (2003). Student mentoring in higher education: Hong Kong Baptist
University. Mentoring & Tutoring: Partnership in Learning, 11, 271–286.
doi:10.1080/1361126032000138319.
Leung, K., Ang, S., &Tan, M-L. 2014. “Intercultural Competence.” Annual Review of
Organizational Psychology and Organizational Behavior 1, 489–519.
Leung, K. & van de Vijver, F. J. R. (2008). Strategies for Strengthening Causal Inferences
in Cross Cultural Research: The Consilience Approach. International Journal of Cross
Cultural Management, 8, 145–169.
Leong, C. H. (2007). Predictive validity of the Multicultural Personality Questionnaire: A
longitudinal study on the socio-psychological adaptation of Asian undergraduates who
took part in a study-abroad program. International Journal of Intercultural
Relations, 31(5), 545-559.
Levene, H. (1960). Contributions to probability and statistics. Essays in honor of Harold
Hotelling, 278-292.
Lewin, K. (1936). Principles of topological psychology. New York: McGraw-Hill.
Lewis, J. S. (1948), Partnership for All: A Thirty Four Year Old Experiment in Industrial
Democracy. London: Kerr-Cross.
229
Levinson, D., Darrow, C., Klein, E., & Levinson, M.. McKee, M.B. (1978). The seasons of
a man’s life.
Lim, F. C. B. & Shah, M. (2017). An examination on the growth and sustainability of
Australian transnational education. International Journal of Educational
Management, 31(3), 254-264.
Lin, J.-C. G. & Yi, J. K. (1997). Asian international students’ adjustment: Issues and program
suggestions. College Student Journal, 31, 473–479.
Lin, Y. & Rancer, A. S. (2003). Ethnocentrism, intercultural communication apprehension,
intercultural willingness-to-communicate, and intensions to participate in an
intercultural dialogue program: Testing a proposed model. Communication Research
Reports, 20, 62–72.
Littrell, L. N. & Salas, E. (2005). A review of cross-cultural training: Best practice,
guidelines and research. Human Resource Development Review, 4(3), 305-334.
Lokkesmoe, K.J., Kuchinke, K.P., & Ardichvili, A. (2016). Developing cross-cultural
awareness through foreign immersion programs. Implications of university study
abroad research for global competence development. European Journal of Training
and Development, 40(3), 155-170.
Long, J. (1994). The dark side of mentoring. Paper presented at the Association for
Active Educational Researchers. Paper presented at the Association for Active
Educational Researchers Conference, Newcastle, Australia.
Lukas, B. A., Hair, J. F., Bush, R.P., & Ortinau, D.J. (2004). Marketing Research,
McGraw Hill, Australia.
Lumby, J. (2011). Enjoyment and learning: Policy and secondary school learners’ experience
in England. British Educational Research Journal, 37(2), 247-264.
https://doi.org/10.1080/01411920903540680
230
McArthur, E., Kubacki, K., Pang, P., & Alcaraz, C. (2017) The Employers’ View of Work
Ready Graduates: A Study of Advertisements for Marketing Jobs In Australia. Journal
Marketing Education, 39(2), 82-93.
McCarty, J. A. & Shrum, L.J. (1993). The Role of Persona Values and Demographics
in Predicting Television Viewing Behaviour: Implications for Theory and Application,
Journal of Advertising, XXII(4), 78-101.
McCauley, B. (2014). Intrinsic motivations of mobility play and enjoyment: the smartphone
game experience.
McClelland, D. C. (1985). How motives, skills and values determine what people do.
American Psychologist, 40, 812-825.
McDonald, R.P. (1985). Factor analysis and related methods. Hillside, NJ: Lawrence
Erlbaum Associates, Inc.
McFarland, J. (2006). Culture shock: Don't forget to provide cultural training to employees
heading abroad. Benefits Canada, 30(1), 31.
McKay-Semmler, K. & Kim, Y. Y. (2014). Cross-cultural adaptation of Hispanic youth: A
study of communication patterns, functional fitness, and psychological
health. Communication Monographs, 81(2), 133-156.
McKenzie, L. & Baldassar, L. (2017). Missing Friendships: understanding the absent
relationships of local and international students at an Australian university. Higher
Education 74. 701-715.
McLain, D. L. (1993). The MSTAT-I: A new measure of an individual’s tolerance for
ambiguity. Educational and Psychological Measurement, 53, 183–189.
McNulty, Y. M., & Tharenou, P. (2004). Expatriate return on investment. In Academy of
Management Proceedings (Vol. 1, pp. F1-F6). Briarcliff Manor, NY 10510: Academy
of Management.
231
McPherson, B. & Szul, L. F. (2008). Business students must have cultural
adaptability. Journal of Organizational Culture, Communications & Conflict, 12(2).
McSweeney, B. (2002). Hofstede’s model of national cultural differences and their
consequences: A triumph of faith-a failure of analysis. Human relations, 55(1), 89-
118.
MacIntyre, P. D., Baker, S. C., Clément, R., & Conrod, S. (2001). Willingness to
communicate, social support, and language-learning orientations of immersion
students. Studies in Second Language Acquisition, 23, 369–388.
MacNab, B., Brislin, R., & Worthley, R. (2012), “Experiential cultural intelligence
development: context and individual attributes”, The International Journal of Human
Resource Management, 23(7), 320-1341.
Macquarie University. (2010). Finding someone to help … mentors in arts. Retrieved from
http://www.arts.mq.edu.au/the_faculty/news_and_events/news/finding_some
one_to_help mentors_in_arts.
Malhotra, N., Hall, J., Shaw, M., & Oppenheim, P. (2008), Essentials of Marketing
Research: An Applied Orientation. Pearson Education, Australia.
Manev, I. M. & Stevenson, W. B. (2001). Nationality, cultural distance, and expatriate status:
Effects on the managerial network in a multinational enterprise. Journal of
international business studies, 32(2), 285-303.
Marginson, S. & Sawir, E. (2011). Ideas for intercultural education. Springer.
Marginson, S. & van der Wende, M. (2007). Globalisation and higher education. Paris:
OECD Directorate for Education.
Majumdar, B. & Cuttress, L. A. (1999). Cultural sensitivity training among foreign medical
graduates. Medical Education, 33(3), 177-184.
232
Mäkelä, K. (2007). Knowledge sharing through expatriate relationships: A social capital
perspective. International Studies of Management & Organization, 37(3), 108-125.
Margavio, T., Hignite, M., Moses, D., & Margavio, G. W. (2005). Multicultural effectiveness
assessment of students in IS subjects. Journal of Information Systems
Education, 16(4), 421.
Materniak, G. (1984). Student paraprofessionals in the learning skills center. New Directions
for Student Services, 27, 23-35.
Matross, R.P., Page, R., M., & Hendricks, G. (1982). American students’ attitudes toward
foreign students before and during an international crisis. Journal of College Student
Personnel, 23, 58-65.
Mayer, J.D., & Salovey, P. (1997). What is emotional intelligence? In P. Salovey & D.
Sluyter (Eds.), Emotional development and emotional intelligence: Implications for
educators (pp. 3-31). New York: Basic.
Melbourne University. (2019). Peer Mentoring Program. Retrieved from
https://students.unimelb.edu.au/skills/leadership-opportunities/peer-mentor-program.
Mendenhall, M. E., Kuhlmann, T. M., Kühlmann, T. M., Stahl, G. K., & Stahl, G. K. (Eds.)
(2001). Developing global business leaders: Policies, processes, and innovations.
Greenwood Publishing Group. Where?
Mendenhall, M. E., Osland, J. S., Bird, A., Oddou, G. R., & Maznevski, M. L. (2008). Global
leadership: Research, practice, and development. London and New York: Routledge.
Merryfield, M. M. (2000). Why aren’t teachers being pre-pared to teach for diversity, equity
and global interconnected ness? A study of lived experiences in the making of
multicultural and global educators. Teaching and Teacher Education, 16, 429-443.
Miller, G. A. & Chapman, J. P. (2001). Misunderstanding analysis of covariance. Journal of
abnormal psychology, 110(1), 40.
233
Mills, A., Abbasi, N., McLaughlin, P., Georgiadis, S., Lozanovska, M., Rajagopalan, P.,
Nalewaik, A. (2016). Understanding global student mobility: exploring new ways of
capturing international experiences using in-county overseas students, 40th AUBEA,
2016.
Mischel, W. (1977). The interaction of person and situation. In D. Magnusson & N. S. Endler
(Eds.), Personality at the Crossroads: Current Issues in Interactional Psychology (pp.
333–352). Hillsdale, NJ: Erlbaum.
Mobley, W.H. & Dorfman, P. W. (2003). Advances in global leadership. Volume 3.
Moeller, A. K. & Nugent, K. (2014). Building intercultural competence in the language
classroom.
Mol, S. T., Born, M. P., Willemsen, M. E., & Van Der Molen, H. T. (2005). Predicting
expatriate job performance for selection purposes: A quantitative review. Journal of
Cross-Cultural Psychology, 36, 590–620.
Monash University. (2009). Peer mentor program. Retrieved from
http://www. monash.edu.au/health-wellbeing/get-involved/peer-mentor-program.html
Monash University. (2018). Strategic plan. Retrieved from
http://www.monash.edu.au/anout/who/strategi-plan.
Monash University. (2018). Alignment of outcomes. Retrieved from
http://www.monash.edu/pubs/2018handbooks/alignmentofoutcomes.html
Monash University. (2019). Study Abroad. Retrieved from https://www.monash.edu/study-
abroad.
Montagliani, A. & Giacalone, R.A. (1998), "Impression management and cross-cultural
adaption", The Journal of Social Psychology, 138(5), 28.
234
Morais, D. B., & Ogden, A. C. (2011). Initial development and validation of the global
citizenship scale. Journal of studies in international education, 15(5), 445-466.
Morgan, G. A. (2000). Quasi-Experimental Designs. Journal of the American Academy of
Child & Adolescent Psychiatry. 39, 794–796.
Morton, V. & Torgerson, D. J. (2003). Effect of regression to the mean on decision making
in health care. Bmj, 326(7398), 1083-1084.
Mosey, S., Wright, M., & Clarysse, B. (2012). Transforming traditional university structures
for the knowledge economy through multidisciplinary institutes. Cambridge Journal
of Economics, 36(3), 587-607.
Mueller, K. (1999). A Review of Issues Relating to Teaching English as a Foreign
Language (Doctoral dissertation, University of Manitoba).
Mullen, E. J. (1994). Framing the mentoring relationship as an information exchange. Human
Resource Management Review, 4, 257–281.
Muller, B.-D. (1993). Interkulturelle Kompetenz. Annaherung an einen Begriff [Intercultural
competence: Approximating the term]. Jahrbuch Deutsch als Fremdspache, 19, 63-
76.
Munson, J. M., & McIntyre, S. H. (1979). Developing practical procedures for the
measurement of personal values in cross-cultural marketing. Journal of Marketing
Research, 16(1), 48-52.
Murry, A. (1778). Mentoria: The Young Ladies Instructor, (J.Fry & Co.).
National Gallery UK. (2019). The Grand Tour. Retrieved from
https://www.nationalgallery.org.uk/paintings/learn-about-art/paintings-in-depth/the-
grand-tour.
235
Nesdale, D. & Todd, P. (1993). Internationalising Australian Universities: The intercultural
contact issue. Journal of Tertiary Education Administration, 15(2), 189-202.
Newton, R. R. & Rudestam, K. E. (2013). Your statistical consultant. Sage.
Nguyen, N. T., Biderman, M. D., & McNary, L. D. (2010). A validation study of the Cross‐
Cultural Adaptability Inventory. International Journal of Training and
Development, 14(2), 112-129.
Niland, J. (2016). The Engagement of Australian Universities with Globalization. In L.E.
Weber & J. J. Dunderstadt (eds). Sixth Glion Colloquium.
Nilsson, B. (2000). Internationalising the curriculum. In P. Crowther, M. Joris, M. Otten, B.
Nilsson, H. Teekens & B. Wächter (Eds.), International at home: A position paper (pp.
21-27). Amsterdam, Netherlands: European Association for International Education,
Drukkerij Raddraaier.
Nilsson, B. (2003). Internationalisation at home from a Swedish perspective: The case of
Malmö. Journal of studies in International Education, 7(1), 27-40.
Nisbett, R. E., Peng, K., Choi, I., & Norenzayan, A. (2001). Culture and systems of thought:
Holistic versus analytic cognition. Psychological Review, 108(2), 291-310.
Nishida, M. (1985). Japanese intercultural communication competence and cross-cultural
adjustment. International Journal of Intercultural Relations, 9, 247–269.
Noe, R. A. (1988). An investigation of the determinants of successful assigned mentoring
relationships. Personnel psychology, 41(3), 457-479.
Nunnally, J. C. & Bernstein, I. H. (1994). Psychometric theory (3rd ed.), New York:
McGraw-Hill.
Oberg, K. (1960). Culture shock: adjustment to new cultural environments. Practical
Anthropology, 7, 177-182.
236
Olson, C. L. & Kroeger, K. R. (2001). Global competency and intercultural sensitivity.
Journal of Studies in International Education, 5(2), 116-137.
Organisation for Economic Co-operation and Development (O.E.C.D). (2017). Education at
a glance 2017: OECD indicators. Paris: OECD Publishing, Retrieved from
http://dx.doi.org/10-1787/eag-2017-en.
Ornstein S. & Nelson T. (2006). Incorporating emotional intelligence competency building
into the preparation and delivery of international travel courses. Innovations in
Education and Teaching International 43(1): 41–55.
Ortiz-Walters, R. & Gilson, L. L. (2005). Mentoring in academia: An examination of the
experiences of proteges of color. Journal of Vocational Behavior, 67(3), 459-475.
Osborne, J. & Waters, E. (2002). Four assumptions of multiple regression that researchers
should always test. Practical Assessment, Research &Evaluation, 8(2), 1-9. Retrieved
from https://pareonline.net/
Osfield, K. J. (2008). Internationalization of student affairs and services: An emerging
global perspective. Washington, DC: NASPA.
Osland, J. S. (2008). Overview of the global leadership literature. In M. E. Mendenhall, J. S.
Osland, A. Bird, G. R. Oddou, & M. L. Maznevski (Eds.), Global leadership:
Research, practice, and development. (pp. 34–63). New York: Routledge.
Outhred, T. & Chester, A. (2013). Improving the international student experience in
Australia through embedded peer mentoring. Mentoring & Tutoring: Partnership in
Learning, 21(3), 312-332.
Packard, B. W. L., Walsh, L., & Seidenberg, S. (2004). Will that be one mentor or two? A
cross‐sectional study of women's mentoring during college. Mentoring & Tutoring:
Partnership in Learning, 12(1), 71-85.
237
Paige, R. M. (Ed.). (1993). Education for the intercultural experience. Nicholas Brealey
Publishing.
Paige, R. M. (2006). Culture definition. Maximizing study abroad: A students' guide to
strategies for language and culture learning and use (2nd ed., p. 43). Minneapolis,
MN: University of Minnesota, Center for Advanced Research on Language
Acquisition.Development Quarterly, 51, 335-345.
Paige, R. M. & Goode, M. L. (2009). Intercultural competence in international education
administration. In D.K. Deardorff (Ed.), The SAGE handbook of intercultural
competence, 333-349. Thousand Oaks, CA: Sage.
Paige, R.M., Jacobs-Cassutob, M., Yershovaa, Y.A., & DeJaegherea, J. (2003). “Assessing
intercultural sensitivity: an empirical analysis of the Hammer and Bennett Intercultural
Development Inventory”, International Journal of Intercultural Relations, Vol. 27 No.
3, pp. 467-486.
Pallant, J. (2016). SPSS Survival Manual: A step by step guide to data analysis using IBM
SPSS. (6th Edition). Allen & Unwin.
Parliamentary Library Quick Guide. (2019). Retrieved from
https://parlinfo.aph.gov.au/parlInfo/download/library/prspub/6765126/upload_binary/
6765126.pdf;fileType=application%2Fpdf#search="overseas%20students%20in%20
Australian%20higher%20%20a%20quick%20guide".
Patrick, C., Peach, D., Pocknee, C., Webb, F., Fletcher, M., & Pretto, G. (2009). The WIL
report: A national scoping study. Brisbane: Australian Learning and Teaching
Council.
Peach, D. & Matthews, J. H. (2011) Work integrated learning for life: encouraging agentic
engagement. In HERDSA Conference 2011: Higher Education on the Edge, 4-7 July
2011, Radisson Resort, Gold Coast, QLD.
238
Peacock, N. & Harrison, N. (2009). “It’s So Much Easier to Go with What’s Easy”
“Mindfulness” and the Dissubject Between Home and International Students in the
United Kingdom. Journal of Studies in International Education, 13(4), 487-508.
Pederson, P. (1991). Counseling international students. The Counseling Psychologist, 19(1),
10-58.
Pedersen, E. R., Larimer, M. E., & Lee, C. M. (2010). When in Rome: Factors associated
with increased drinking among college students studying abroad. Psychology of
Addictive Behaviors, 24(3), 535–540.
Pegg, A., Waldock, J., Hendy-Isaac, S., & Lawton, R. (2012). Pedagogy for Employment.
The Higher Education Academy.
Peng, C.J., Lee, K.L. & Ingersoll, G.M. (2002). An Introduction to Logistic Regression
Analysis and Reporting, The Journal of Educational Research, 96(1), 3-14.
Peng, K. & Nisbett, R. E. (1999). Culture, dialectics, and reasoning about contradiction.
American Psychologist, 54(9), 741-754.
Petrides, K. V. (2009a). Psychometric properties of the trait emotional intelligence
questionnaire (TEIQue). In Assessing emotional intelligence (pp. 85-101). Springer,
Boston, MA.
Petrides, K. V. & Furnham, A. (2009b). Technical manual for the trait emotional intelligence
questionnaires (TEIQue).
Pett, M., Lackey, N., & Sullivan, J. (2003). Making sense of factor analysis. Thousand Oaks:
Sage Publications, Inc.
Pettigrew, T. F. (1998). Intergroup contact theory. Annual Review of Psychology, 49, 65-85.
Pettigrew, T. F. & Tropp, L. R. (2006). A meta-analytic test of intergroup contact theory.
Journal of Personality and Social Psychology, 90(5), 751-783.
239
Pettigrew, T. F. & Tropp, L. R. (2008). How does intergroup contact reduce pre-judice?
Meta‐analytic tests of three mediators. European Journal of Social Psychology, 38(6),
922-934.
Pettigrew, T. F., Tropp, L. R., Wagner, U., & Christ, O. (2011). Recent advances in
intergroup contact theory. International journal of intercultural relations, 35(3), 271-
280.
Phatak, A. V. (1992). International dimensions of management. London, United Kingdom:
PWS Kent Publishing.
Phillips, J. M. (2011). Integrating service learning into the classroom: Examining the extent
to which students achieve subject objectives and a sense of civic responsibility by
engaging in service learning. Edgewood College.
Phillips, M. R., McAuliff, B. D., Kovera, M. B., & Cutler, B. L. (1999). Double-blind photo
array administration as a safeguard against investigator bias. Journal of Applied
Psychology, 84(6), 940.
Ping, C. J. (1999). An expanded international role for student affairs. New Directions for
Student Services, 86, 13-21.
Pitts, M. J. (2009). Identity and the role of expectations, stress, and talk in short-term student
sojourner adjustment: An application of the integrative theory of communication and
cross-cultural adaptation. International Journal of Intercultural Relations, 33(6), 450–
462.
Prasad, J., Showler, M. B., Schmitt, N., Ryan, A. M., & Nye, C.D. (2017). Using Biodata
and Situational Judgment Inventories across Cultural Groups. International Journal of
Testing, 17(3) 210-233.
PricewaterhouseCoopers Australia (PwC), (2016). Australia Higher Education Workforce of
the Future: Report. Australian Higher Education Industrial Association.
240
Pruegger, V. J., & Rogers, T. B. (1994). Cross-cultural sensitivity training: Methods and
assessment. International Journal of Intercultural Relations, 18(3), 369-387.
Ragins, B. R. & Scandura, T. A. (1997). The way we were: Gender and the termination of
mentoring relationships. Journal of Applied Psychology, 82(6), 945-953.
Razali, N. M. & Wah, Y. B. (2011). Power comparisons of shapiro-wilk, kolmogorov-
smirnov, lilliefors and anderson-darling tests. Journal of statistical modeling and
analytics, 2(1), 21-33.
Redmond, M. V. & Bunyi, J. M. (1993). The relationship of intercultural communication
competence with stress and the handling of stress as reported by international
students. International Journal of Intercultural Relations, 17(2), 235-254.
Reichard, R., Serrano, S., Condren, M., Wilder, N., Dollwet, M., & Wang, W. (2015).
Engagement in Cultural Trigger Events in the Development of Cultural
Competence. Academy of Management Learning & Education, 14(4), 461-481.
Reimers, F. (2008). Educating for global competency. In J. E. Cohen & M. B. Malin (Eds.),
International perspectives on the goals of universal basic and secondary education
(pp.183-202). New York, NY: Routledge.
Remmert, A. A. (1993). The impact of multicultural in-service education on the cross cultural
adaptability of public school teachers. Doctoral dissertation, Florida State University,
Tallahassee, FL.
Resnik, P., & Schallmoser, C. (2019). Enjoyment as a key to success? Links between e-
tandem language learning and tertiary students’ foreign language enjoyment. Studies
in Second Language Learning and Teaching, 9(3), 541-564.
Reuber, A. R. & Fischer, E. (1997). The influence of the management team's international
experience on the internationalization behaviors of SMEs. Journal of International
Business Studies, 28(4), 807-825.
241
Reymont, R. & Joreskog, K.G. (1993). Applied factor analysis in the natural sciences. New
York: Cambridge University Press.
RMIT University. (2010). Mentors assisting the transition experience (MATE).
Retrieved from http://www.rmit.edu.au/browse;ID=meu9mja9iy8r1.
RMIT. (2015). Ready for Life and Work: RMIT’s Strategic Plan to 2020.
Roberts, B. W. & Robins, R. W. (2001). Broad dispositions, broad aspirations: The
intersection of personality traits and major life goals. Personality and Social
Psychology Bulletin, 26, 1284-1296.
Roberts, C., Byram, M., Barro, A., Jordan, S., & Street, B. (2001). Language learners as
ethnographers. Bristol: Multilingual Matters. Saito, K., Dewaele, J.-M., Abe, M., &
In’nami, Y. (2018).
Roccas, S. & Sagiv, L. (2010). Personal values and behavior: Taking the cultural context into
account. Social and Personality Psychology Compass, 4(1), 30-41.
Roccas, S., Sagiv, L., Schwartz, S. H., & Knafo, A. (2002). The big five personality factors
and personal values. Personality and social psychology bulletin, 28(6), 789-801.
Rohan, M. J. (2000). A rose by any name? The values construct. Personality and Social
Psychology Review, 4, 255-277.
Rohner, R. P. (1984). Toward a conception of culture for cross-cultural psychology. Journal
of Cross-Cultural Psychology, 15, 111–138.
Rokeach, M. (1973) The nature of human values, The Free Press, New York, NY
Rokeach, Milton J. "The Role of Values in Public Opinion Research," Public Opinion
Quarterly, 32 (Winter 1968-9), 547-9. The Nature of Human Values. New York: The
Free Press, 1973.
242
Root, E. & Ngampornchai, A. (2012). “I Came Back as a New Human Being”: Student
Descriptions of Intercultural Competence Acquired Through Education Abroad
Experiences. Journal of Studies in International Education, 17(5) 513-532.
Rosenbusch, K., H. (2014). Integrated approach to building intercultural competence.
Learning and Performance Quarterly, 2(3).
Rossi, P. H. & Freeman, H. E. (1985). Evaluation: A systematic approach (3rd ed). Beverly
Hills, CA.
Rossi, P. H., Lipsey, M. W., & Freeman, H. E. (2004). Evaluation: A Systematic
Approach (7th ed.). SAGE.
Rose-Redwood, C. & Rose-Redwood, R. (2018). Fostering Successful Integration and
Engagement Between Domestic and International Students on College and University
Campuses. Journal of International Students, 8(3). 1267-1273.
Robertson, M., Line, M., Jones, S., & Thomas, S. (2000). International students, learning
environments and perceptions: A case study using the Delphi technique. Tertiary
Education Research & Development, 19(1), 89–102.
Rosenthal, D. A., Russell, J., & Thomson, G. (2007). Social connectedness among
international students at an Australian university. Social indicators research, 84(1),
71-82.
Ruben, B. D. & Kealey, D. J. (1979). Behavioral assessment of communication competency
and the prediction of cross-cultural adaptation. International Journal of Intercultural
Relations, 15, 15–47.
Russell, J., Rosenthal, D., & Thomson, G. (2009). The international student experience:
Three styles of adaptation. Higher Education, 60, 235–249.
Ryan, L. (2011). Migrants’ Social Networks and Weak Ties. Sociological Review, 59 4) 707-
724.
243
Safta, M. (2011). Naming the elephants in the room: Reflections on and insights into working
in a multicultural dementia care environment. Report by Alzheimer’s Australia WA.
Sagiv, L. & Schwartz, S. H. (1995). Value priorities and readiness for out-group social
contact. Journal of Personality and Social Psychology, 69, 437–448.
Salovey P., Mayer, J. D., Caruso, D., Lopes, P. N., Lopez, S. J., & Snyder, C. R. (eds) (2003)
Measuring Emotional Intelligence as a Set of Abilities with the Mayer-Salovey-Caruso
Emotional Intelligence Test. Washington, DC: American Psychological Association.
Sambharya, R. B. (1996). Foreign experience of top management teams and international
diversification strategies of US multinational corporations. Strategic Management
Journal, 17(9), 739-746.
Sanchez, R. J., Bauer, T. N., & Paronto, M. E. (2006). Peer-mentoring freshmen:
Implications for satisfaction, commitment, and retention to graduation. Academy of
Management Learning & Education, 5(1), 25-37.
Sandel, T. L. & Liang, C. H. (2010). Taiwan's fifth ethnic group: A study of the acculturation
and cultural fusion of women who have married into families in Taiwan. Journal of
International and Intercultural Communication, 3(3), 249-275
Sandel, T. L. (2014). “Oh, I’m here!”: Social media’s impact on the cross-cultural adaptation
of students studying abroad. Journal of Intercultural Communication Research, 43(1),
1-29.
Santos, S. J. & Reigadas, E. T. (2002). Latinos in higher education: An evaluation of a
university faculty mentoring program. Journal of Hispanic Higher Education, 1 (1),
40-50.
Sattler, D. & Kerr, N. L. (1991). Might vs. morality explored: Motivational and cognitive
bases for social motives. Journal of Personality and Social Psychology, 60, 756–765.
Sawyer, R. & Chen, G. M. (2012). The impact of social media on intercultural adaptation.
244
Scandura, T. A. (1992). Mentorship and career mobility: An empirical investigation. Journal
of organizational behavior, 13(2), 169-174.
Scharoun, L. (2016). Short-term study tours as a driver for increasing domestic student
mobility in order to generate global work-ready students and cultural exchange in Asia
Pacific, Perspectives in International Higher Education, 20(2-3), 83-89.
Schmitt, T. A. (2011). Current methodological considerations in exploratory and
confirmatory factor analysis. Journal of Psychoeducational Assessment, 29(4), 304-
321.
Schwartz, S. H. (1992). Universals in the content and structure of values: Theoretical
advances and empirical tests in 20 countries. In M. P. Zanna (Ed.), Advances in
experimental social psychology. (Vol. 25, pp. 1-65). New York. Academic Press.
Schwartz, S. H. (2006). Les valeurs de base de la personne: The´orie, mesures et applications
[Basic human values: Theory, measurement, and applications]. Revue Francaise de
Sociologie, 42, 249–288.
Schwartz, S. H. & Bardi, A. (2001). Value hierarchies across cultures: Taking a similarities
perspective. Journal of Cross-Cultural Psychology, 32, 268–290.
Schwartz, S. H., Sagiv, L., & Boehnke, K. (2000). Worries and values. Journal of
Personality, 68, 309–346.
Schwartz, S. H. & Sagiv, L. (1995). Identifying culture-specifics in the content and structure
of values. Journal of Cross-Cultural Psychology, 26, 92-116.
Scott, J.E., & Lamont, L.M. (1977). ‘Relating consumer values to consumer behaviour:
a model and method for investigation’, in Greer, T.W. (Eds), Increasing Marketing
Productivity, American Marketing Association, Chicago, IL, pp. 283-288.
Seligman, C., Olson, J. M., & Zanna, M. P. (Eds.). (1996). The psychology of values: The
Ontario symposium (Vol. 8). Mahwah, NJ: Lawrence Erlbaum.
245
Selmer, J. (2002). Practice makes perfect? International experience and expatriate
adjustment. Management International Review, 42(1), 77–87.
Shaffer, M. A., Harrison, D. A., & Gilley, K. M. (1999). Dimensions, determinants, and
differences in the expatriate adjustment process. Journal of International Business,
30(3), 557-581. doi:10.1057/palgrave. jibs.8490083
Shaftel, J., Shaftel, T., & Ahluwalia, R. (2007). International educational experience and
inter- cultural competence. Journal of Business & Economics, 6(1), 25-34.
Sharma, M.P. & Jung, L.B. (1985) How cross-cultural social participation affects the
international attitudes of U.S. students. International Journal of Intercultural
Relations. Vol. 9 pp 377-387.
Shi, L. & Wang, L. (2014). The Culture Shock and Cross-Cultural Adaptation of Chinese
Expatriates in International Business Contexts. International Business Research, 7(1).
Shoham, A., Florenthal, B., Rose, G.M., & Kropp, F. (1998), ‘Differences in Value
Importance: The impact of Age and Gender in the Israel Population’ Advances in
Consumer Research Vol 25 pp. 468-474
Shyryaeva, T. & Trius, L. (2013). A call for cultural awareness and tolerance in higher
education. The case of Pyatigorsk State Linguistic University, North Caucasus,
Russia. Revista de cercetare si interventie sociala, 43, 255.
Siddique, P. (1963). American graduate students 'attitudes toward and interaction with
foreign students at Southern Illinois University at Carbondale. Unpublished master's
thesis, SIUC, Carbondale.
Simkhovych, D. (2009). The relationship between intercultural effectiveness and perceived
project team performance in the context of international development. International
Journal of Intercultural Relations, 33 (5), 383-390.
246
Sison, M. & Brennan, L. (2012). Students as global citizens: strategies for mobilizing student
abroad, Journal of Marketing for Higher Education, 22(2), 167-181.
Sivakumar, K. & Nakata, C. (2001). The stampede toward Hofstede's framework: Avoiding
the sample design pit in cross-cultural research. Journal of international business
studies, 32(3), 555-574.
Smart, D., Volet, S., & Ang, G. (2000). Fostering social cohesion in universities: Bridging
the cultural divide. Canberra: Commonwealth of Australia.
Smith, A. L. (2013). Mentoring in the Moment: Influences of online cultural mentoring on
in-country learning and intercultural competencies, (Doctoral dissertation, University
of Minnesota).
Smith, C., Ferns, S., & Russell, L. (2014). The impact of work integrated learning on student
work-readiness. Retrieved from http://hdl.voced.edu.au/10707/337518.
Smith, C., Ferns, S., & Russell, L. (2016). Designing Work-Integrated Learning Placements
That Improve Student Employability: Six Facets of the Curriculum That Matter. Asia-
Pacific Journal of Cooperative Education, 17(2), 197-211.
Smith, C., Ferns, S., & Russell, L. (2019). Placement Quality Has a Greater Impact on
Employability than Placement Structure or Duration. International Journal of Work-
Integrated Learning, 20(1), 15-29.
Smith, H. P. (1955). Do intercultural experiences affect attitudes? The Journal of Abnormal
and Social Psychology, 51(3), 469.
Smith, K. (2006). Facilitating dialogue for a more inclusive curriculum. Reflecting
Education, 2(1), 103-120.
Smith, P. B. (2002). Culture’s consequences: Something old and something new. Human
relations, 55(1), 119-135.
247
Snyder, M. & Ickes, W. (1985). Personality and social behavior. In G. Lindzey & E. Aronson
(Eds.), The Handbook of Social Psychology. (3rd edn, Vol. 2, pp. 883–948). New York:
McGraw-Hill.
Solomon, C.M. (1995), ‘Repatriation: Up, Down or Out?’ Personnel Journal, 74(1), 28 – 35.
Soria, K. (2015). “Institutional and Instructional Techniques to Promote Undergraduates’
Intercultural Development: Evident from a Multi-institutional Student Survey. In
Williams. R. D. & Lee, A. (eds). Internationalizing Higher Education, 47-59.
Soria, K.M. & Triosi, J. (2014). Internationalization at home alternatives to study abroad:
implications for students’ development of global, international and intercultural
competencies. Journal of Studies in International Education, 18(3), 261-280.
Spencer-Rodgers, J., Boucher, H. C., Peng, K., & Wang, L. (2009). Cultural differences in
self-verification: The role of naïve dialecticism. Journal of Experimental Social
Psychology, 45, 860-866.
Spencer-Rodgers, J. & Peng, K. (2004). The dialectical self: Contradiction, change, and
holism in the East Asian self-concept. In R. M. Sorrentino, D. Cohen, J. M. Olsen, &
M. P. Zanna (Eds.), Culture and social behavior: The Ontario Symposium (Vol. 10,
pp. 227-250). Mahwah, NJ: Lawrence Erlbaum.
Spencer-Rodgers, J., Williams, M. J., & Peng, K. (2010). Cultural differences in expectations
of change and tolerance for contradiction: A decade of empirical research. Personality
and Social Psychology Review, 14(3), 296-312.
Spini, D. (2003). Measurement equivalence of 10 value types from the Schwartz value
survey across 21 countries. Journal of Cross-Cultural Psychology, 34, 3–23.
Spitzberg, B.H. & Changnon, G. (2009). Conceptualizing intercultural competence. In D.
Deardoff (Ed.). The Sage Handbook of Intercultural Competence. Los Angeles, CA:
Sage.
248
Statistics Solutions, (2013). Data analysis plan: Repeated Measures ANCOVA. Retrieved
from http://www.statisticssolutions.com/academic-solutions/member-
resources/member-profile/data-analysis-plan-templates/data-analysis-plan-repeated-
measures-ancova/
Stevens, J. (2009). Applied multivariate statistics for the social sciences (5th edn). Mahwah,
NJ: Lawrence Erlbaum.
Stone, N. (2006a). Navigating other cultures: Responses from an Australian university
to the challenges of ‘internationalising the student experience’. Journal of Studies
in International Education, 10(4), 311-318.
Stone, N. (2006b). Conceptualising intercultural effectiveness for university teaching.
Journal of Studies in International Education, 10(4), 334-356.
Straffon, D. A. (2003). Assessing the intercultural sensitivity of high school students
attending an international school. International journal of intercultural
relations, 27(4), 487-501.
Stronkhorst, R. (2005). Learning outcomes of international mobility at two Dutch institutions
of higher education. Journal of Studies in International Education, 9(4), 292-315.
Suhr, D. D. (2006). Exploratory or confirmatory factor analysis?
Summers, M. & Volet, S. (2008). Students; attitudes towards culturally mixed groups on
international campuses: impact of participation in diverse and non-diverse groups,
Studies in Higher Education 33(4), 357-370.
Summers, M. & Volet, S. (2010). Group work does not necessarily equal collaborative
learning: evidence from observations and self-reports. European Journal of
Psychology of Education, 25(4), 473-492.
Surdam, J. C. & Collins, J. R. (1984). Adaptation of international students: A cause for
concern. Journal of College Student Personnel, 25, 240–245.
249
Suutari, V. & Burch, D. (2001). The role of an on-site training and support in expatriation:
Existing and necessary host-company practices. Career Development International,
6(6), 298-311.
Swagler, M. A. & Jome, L. M. (2005). The Effects of Personality and Acculturation on the
Adjustment of North American Sojourners in Taiwan. Journal of Counseling
Psychology, 52(4), 527.
Tabachnick, B.G. & Fiddell, L.S. (20007). Using Multivariate statistics (6th Ed). Boston:
Pearson Education
Tabachnick, B.G. & Fiddell, L.S. (2013). Using Multivariate statistics (6th Ed). Boston:
Pearson Education
Taguchi, N. (2015). Cross-cultural Adaptability and Development of Speech Act
Production in Study Abroad. International Journal of Applied Linguistics, 25(3),
343–365.
Taguchi, N., Xiao, F., Li, S. (2016). Assessment of study abroad outcomes in Chinese
as second language: gains in cross-cultural adaptability, language contact and
proficiency. Intercultural Education, 27(6), 600-614.
Takeuchi, R., Wang, M., & Marinova, S. V. (2005). Antecedents and consequences of
psychological workplace strain during expatriation: A cross‐sectional and longitudinal
investigation. Personnel Psychology, 58(4), 925-948.
Tan, J. B. & Yates, S. (2011). Academic expectations as sources of stress in Asian
students. Social Psychology of Education, 14(3), 389-407.
Tan, P.Y.M. (1997). Home and away: An ethnography of Singaporean students at
Murdoch University. Unpublished Honours thesis. Murdoch University, Western
Australia.
250
Tanaka, K. (2007). Japanese student’s contact with English outside the classroom during
study abroad. New Zealand Studies in Applied Linguistics, 13, 36–54.
Tang, J. (2001). Towards Understanding the Role of Emotional Intelligence in Cross Cultural
Adaptability in Adults. Doctoral Dissertation, California School of Professional
Psychology, Los Angeles.
Teichler, U. (2007). Does higher education matter? Lessons from a comparative graduate
survey. European Journal of Education, 42(1), 11–34.
Tenenbaum, H. R., Crosby, F. J., and Gliner, M. D. (2001). Mentoring relationships in
graduate school. Journal of Vocational Behavior; 59(3), 326-341.
Thomas, D. & Inkson, K. (2004). Cultural intelligence. People skills for global business. San
Francisco: Berrett-Koehler Publishers.
Thomas, L. (2012). Building student engagement and belonging in Higher Education at a
time of change. Paul Hamlyn Foundation, 100.
Thurstone, L.L. (1947). Multiple factor analysis. Chicago: University of Chicago Pre-ss.
Tierney, W. (1992). An anthropological analysis of student participation in college. Journal
of Higher Education, 53, 687-700.
Tinto, V. (1993). Leaving college: Rethinking the causes and cures of student attrition.
Chicago: University of Chicago Pre-ss.
Tomich, P., McWhirter, J. J., & King, W. E. (2000). International student adaptation: Critical
variables. International Education, 29(2), 37.
Tomlinson, M. (2008). The Degree is Not enough. Students Perceptions of the Role of
Higher Education Credentials for Graduate Work and Employability. British Journal
of Sociology of Education 29, 49-61.
251
Trice, A. (2014). Mixing it up: International graduate students’ social interactions with
American students. Journal of College Student Development, 45(6), 671-687.
Trius L.I. (2011). Historic and cultural material use in the development of specialists’ in
tourism professional intercultural communicative competence. Professional
communication: actual issues in linguistics and methodology. Pyatigorsk State
Linguistic University, Russia, 247-256.
Tsai, J. L., Knutson, B., & Fung, H. (2006). Cultural Variation in Affect Valuation.
Personality Processes and Individual Differences, 90(2), 288-307.
https://doi.org/10.1037/0022-3514.90.2.288.
Turner, Y. (2006). Chinese students in a UK business school: Hearing the student voice in
reflective teaching and learning practice. Higher Education Quarterly, 60, 27-51.
Ujitani, E. & Volet, S. (2008). Socio-emotional challenges in international education: Insight
into reciprocal understanding and intercultural relational development. Journal of
Research in International Education, 7(3), 279-303.
Universities Australia. (2019). Universities Australia Data Snapshot. Retrieved from
https://www.universitiesaustralia.edu.au/wp-content/uploads/2019/06/Data-
snapshot-2019-FINAL.pdf.
Universities Australia, BCA, ACCI, AIG & ACEN. (2015). National strategy on Work
Integrated Learning in university education. Retrieved from
http://cdn1.acen.edu.au/wpcontent/uploads/2015/03/National-WIL-Strategy-in-
university-education-032015.pdf.
University of British Columbia. (2010). International peer program. Retrieved from
http://www.students.ubc.ca/international/get-involved/international-peer-program/
University of Melbourne. (2010). International student services: The University of
Melbourne. Retrieved from http://www.services.unimelb.edu.au/international/.
252
University of NSW. (2019). Graduate Capabilities. Retrieved from
https://teaching.unsw.edu.au/graduate-capabilities.
University of South Australia. (2019). PALS. Retrieved from
https://i.unisa.edu.au/students/student-support-services/study-support/study-help-
pals/
Vande Berg, M., Connor-Linton, J., & Paige, R. M. (2009). The Georgetown Consortium
Project: Interventions for student learning abroad. Frontiers: The Interdisciplinary
Journal of Study Abroad, 18, 1-75.
Veloutsou, C., Paton, R., & Lewis, J. (2005), ‘Consultation and reliability of
information and sources pertaining to university selection; some questions answered’
International Journal of Educational Management (19) 279- 291.
Vogt, W. P. (1997). Tolerance and education. Learning to live with diversity and difference.
Thousand Oaks, CA: Sage.
Volet, S. & Ang, G. (2012). Culturally mixed groups on international campuses: an
opportunity for inter-cultural learning. Higher Education Research and Development
31(1), 21-37.
Volet, S. & Tan-Quigley, A. (1995). Daring to be different: Unspoken agendas in
interactions between international students and general staff at university. Paper
presented at the International students advisors network of Australia (ISANA)
Conference, Fremantle, Australia.
Volet, S. E. (1999) Internationalisation of higher education: Opportunities for intercultural
development of Chinese and Australian students. In Education of Chinese: The global
prospect of national cultural tradition. Ed. J. Lu, 240-56. Nanjing University Pre-ss.
Volet, S. E. & Ang, G. (1998). Culturally mixed groups on international campuses: An
opportunity for inter-cultural learning. Higher Education Research and Development,
17, 5–23. doi:10.1080/0729436980170101
253
Victorian Tertiary Admissions Centre. (VTAC). (2019). Scaling and the ATAR. Retrieved
from http://www.vtac.edu.au/results-offers/atar-explained/scaling.html.
Wächter, B. (2003). An introduction: Internationalisation at home in context. Journal of
studies in international education, 7(1), 5-11.
Wagner, U. & Machleit, U. (1986). Gastarbeiter in the Federal Republic of Germany: contact
between Germans and migrant populations (pp. 59–78). Contact and conflict in
intergroup encounters. Oxford: Blackwell, 85.
Waistell, J. (2011). Individualism and collectivism in business school pedagogy: A research
agenda for internationalising the home management student. Higher Education
Research & Development, 30(5), 595-607.
Watkins, M. W. (2000). Monte Carlo PCA for parallel analysis [computer software]. State
College, PA: Ed & Psych Associates, 432-442.
Welch, D. (2003). Globalisation of Staff Movements: Beyond Cultural Adjustment,
Management International Review, 43(2), 149–169.
Western, J., McMillan, J., & Dorrington, D. (1998). Differential Access to Higher Education:
The measurement of socioeconomic status, rurality and isolation, Retrieved from
http://www.voced.edu.au/10707/109759.
Westfall, P. & Henning, K. S. (2013). Understanding advanced statistical methods.
Chapman and Hall/CRC.
Westwood, M. J. & Barker, M. (1990). Academic achievement and social adaptation among
international students: A comparison groups study of the peer-pairing
program. International Journal of Intercultural Relations, 14(2), 251-263.
Wallenberg-Lerner, H. (2013). Affective Components Perceived to be Important in Today’s
Global Society From a Cross-Cultural Perspective. Dissertation. University of South
Florida.
254
Wanberg, C. R., Welsh, E. T., & Hezlett, S. A. (2003). Mentoring research: A review and
dynamic process model. Research in personnel and human resources management, 22,
39-124.
Ward, C. & Kennedy, A. (1996). Crossing cultures: the relationship between psychological
and socio-cultural dimensions of cross-cultural adjustment. In Pandey, J., Sinha, D., &
Bhawuk, D. P. S. (Eds.), Asian Contributions to Cross-cultural Psychology. New
Delhi: Sage Publications.
Weigl, R. C. (2009). Intercultural competence through cultural self-study: A strategy for
adult learners. International Journal of Intercultural Relations, 33(4), 346–360.
Wessel, T. (2009). Does diversity in urban space enhance intergroup contact and tolerance?
Georafiska Annaler: Series B, Human Geography 91(1), 5-17.
West, C. (2017). Leveraging global experiences in the job market. International Educator,
Jan+Feb.
Whitehead, J.M., Raffan, J., & Deaney, R. (2006). ‘University Choice: What influences the
Decisions of Academically Successful Post-16 Students? Higher Education Quarterly
Vol 60, No 1, pp. 4-26
Wilder, C., Sherrier, J., & Berry, W. (1978). Learning Activity Proposal for PDA 101
(Pluralism and Diversity in America) Membership on Values and Attitudes. Journal of
College Student Personnel, 19, 445-449.
Willard, J. (2010). Global competency. Retrieved from
http://www.nafsa.org/_/file/_/global_competency_2.pdf
Williams, T. R. (2005.) “Exploring the Impact of Study Abroad on Students’ Intercultural
Communication Skills: Adaptability and Sensitivity.” Journal of Studies in
International Education 9, 356–371.
255
Wilton, N. (2011). Do Employability Skills Really Matter in the UK Graduate Labour
Market? The Case of Business and Management Graduates. Work, Employment and
Society, 25(1), 85-100.
Winch, J. (2017). Is enjoyment still important in university second language
education? Global Journal of Educational Studies, 3(2), 51-61.
Windham International & National Foreign Trade Council. (1999). Global relocation trends
1999 survey report. New York, NY: Windham International.
Winnel, M. (1987). Personal goals: The key to self-direction in adulthood. In M. Ford & D.
Ford (Eds.), Humans self-constructing systems: Putting the framework to work (pp.
261-287). Hillsdale, NJ: Lawrence Erlbaum.
Wiseman, R.L. & Abe, H. (1986). Cognitive complexity and intercultural effectiveness:
Perceptions in American –Japanese dyads. In M.L. McLaughlin (Ed.), Communication
yearbook 9 (pp.611-622). Beverley Hills, CA: Sage.
Woods, P., Poropat, A., Barker, M., Hills, R., Hibbins, R., & Borbasi, S. (2013). Building
friendship through a cross-cultural mentoring program. International Journal of
Intercultural Relations, 37(5), 523-535.
Worthington, A. & Higgs, H. (2004). ‘Factors explaining choice of an economics major: The
role of student characteristics, personality and perceptions of the profession’.
International Journal of Social Economics 31(5/6), 593-613.
Yamazaki, Y., & Kayes, D.C. (2004). An experiential approach to cross-cultural learning: A
review and integration of competencies for successful expatriate adaptation. Academy
of Management Learning and Education 3(4), 362-379.
Yashima, T., Zenuk-Nishide, L., & Shimizu, K. (2004). The influence of attitudes and affect
on willingness to communicate and second language communication. Language
Learning, 54, 119–152.
256
Yong, A.G. & Pearce, S. (2013). A Beginner’s Guide to Factor Analysis: Focusing on
Exploratory Factor Analysis. Tutorials in Quantitative Methods for Psychology, 9(2),
79-94.
Yorke, M. & Knight, P. (2004). Embedding employability into the curriculum. York,
England: Higher Education Academy.
Yu, H. (2012). Intercultural competence in technical communication: A working definition
and review of assessment methods. Technical Communication Quarterly, 21(2), 168-
186.
Zajonc, R. B. (1968). Attitudinal effects of mere exposure. Journal of personality and social
psychology, 9(2p2), 1.
Zaltman, G., LeMasters, K., & Heffring, M. (1982). Theory construction in marketing: Some
thoughts on thinking. John Wiley & Sons.
Zhao, J. & Gallant, D. J. (2012). Student evaluation of instruction in higher education:
Exploring issues of validity and reliability. Assessment & Evaluation in Higher
Education, 37(2), 227-235.
Zielinksi, B. A. Z. 2007. “Study Abroad Length of Program Influence on Cross-Cultural
Adaptability.” Unpublished master’s thesis, Virginia Polytechnic Institute and State
University, Blacksburg, VA.
Zikmund, W. G. (1997). Business Research Methods, 5th Ed. Fort Worth TX: Dryden.
Zimmermann, S. (1995). Perceptions of intercultural communication competence and
international student adaptation to an American campus. Communication Education,
44, 321–335.
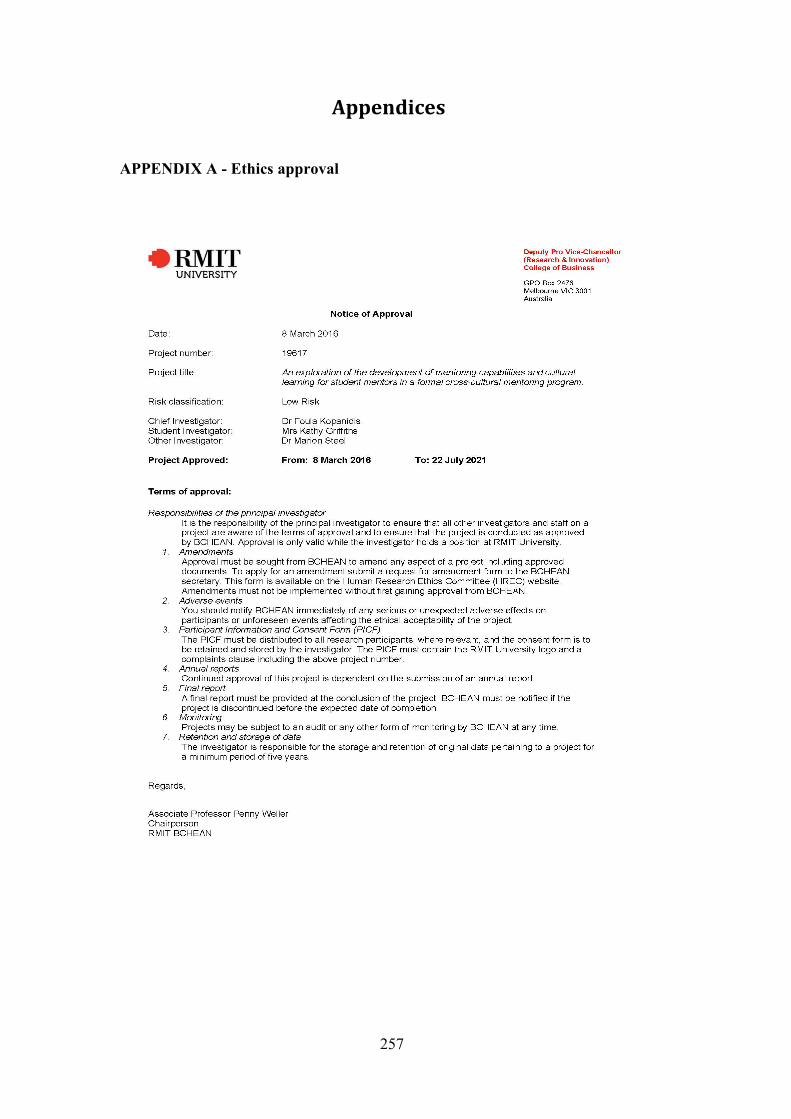
257
Appendices
APPENDIX A - Ethics approval
258
APPENDIX B – Permission from the Head of School to question students from the Economics, Finance and Marketing School at RMIT University On 23 February 2016 at 15:10, Kathleen Griffiths wrote:
Hi Tim,
I previously got your permission to use RMIT students in my PhD study, but my project has changed since then. So, again as part of my PhD studies, I am wishing to use some of the students enrolled at RMIT. They will form part of a quasi-experiment and I will be administering two questionnaires in a pre- and post- test.
None of these students are mine as they all come from the SLM area.
Please let me know of your approval so that I can attach it to my ethics application.
Many thanks
Kathy
Mrs. Kathleen Griffiths (BEc., M.B.A., MEd) Subject Co-ordinator and Lecturer in Global Marketing Subject Co-ordinator Internships RMIT University Building 80 Level 10 From: Tim Fry Date: 23 February 2016 at 15:10 Subject: Re: PhD From: [email protected] To: Kathleen Griffiths <[email protected]> Happy to approve _____________________________________________________ Tim R.L. Fry Professor of Econometrics and Head of School School of Economics, Finance & Marketing RMIT University
259
APPENDIX C – Permission from the Manager of the Student Learning Advisor Mentors (SLM) at RMIT University From: Lila Kemlo Date: 5 November 2015 at 11:09:59 AM AEDT To: Kathleen Griffiths Cc: Marion Steel, Foula Kopanidis Subject: RE: Use of the SLM students in my research Hi Kath, This email confirms that I have agreed that you are able to use the SLM team as a part of the research that you require for your PhD. Cheers Lila
260
APPENDIX D – Plain Language Statement PARTICIPANT INFORMATION AND CONSENT FORM (PICF)
INVITATION TO PARTICIPATE IN A RESEARCH PROJECT
PARTICIPANT INFORMATION
Project Title: “The influence of a cross-cultural peer-to-peer mentoring experience on “international mindedness” of higher education students.
Investigators:
1. Dr. Foula Kopanidis (Senior Lecturer in Marketing, Chief investigator)
School of Economics Finance and Marketing
2. Dr. Marion Steel (Lecturer Marketing, co-investigator) School of Economics Finance and Marketing
3. Kathleen Griffiths (PhD Candidate, student researcher) School of Economics, Finance and Marketing
261
Dear SLAMs Mentor/Mentee,
You are invited to participate in a research project being conducted by RMIT University. Please read this sheet carefully and be confident that you understand its contents before deciding whether to participate. If you have any questions about the project, please ask one of the investigators.
The RMIT Human Research Ethics Committee has approved this project. This project is being done as part of Kathleen’s work for her Doctor of Philosophy Studies here at RMIT. This research project will investigate the functional outcomes of a cross-cultural formal peer-to-peer mentoring experience on students’ international orientation.
Who is involved in this research project? Why is it being conducted?
This research project is led by Dr Foula Kopanidis, Dr Marion Steel and Ms Kathleen Griffiths of the School of Economics, Finance, and Marketing, RMIT University.
Lila Kemlo, the SLAMs Manager, has been fully briefed on the project and has given her permission for us to contact her SLAMs students. All emails to you will go through Lila for distribution.
Why have you been approached?
This project is investigating the outcomes of a cross-cultural SLAMs mentoring experience students’ international/global mindedness. Therefore, it is important to obtain the opinions and ideas of people who are involved in the mentoring experience in Melbourne. You have been asked to participate based on your involvement in the SLAMs mentoring experience.
What is the project about?
The project aims to:
• Understand the effects of the cross-cultural SLAMs peer-to-peer mentoring experience on international/global mindedness
If I agree to participate, what will I be required to do?
You will be asked to complete an online questionnaire that covers your international/global mindedness PRIOR to commencing any SLAMs mentoring. This will give the researchers a baseline on your international/global mindedness. The questionnaire will then be distributed again at the completion of the semester. An anonymous identifying tag (eg. Respondent 1 = R1) will be on your questionnaires to match them with your first questionnaire. After the second questionnaire has been matched with the first, the anonymous identifying tag will be removed. Each questionnaire should take about 15-20 minutes to complete. Your participation is completely voluntary. You can choose to answer all questions or be selective while answering the questions based on your comfort level. You can withdraw from the questionnaire at any time if you feel it is uncomfortable.
262
To thank you for your time in responding, you are invited to enter a draw for either a $100 Coles Myer voucher or a $100 iTunes voucher. If you wish to enter the draw, you will be asked to enter a separate part of the questionnaire to submit your student number and mobile number. After the draw has been held, this information will be destroyed. This part of the questionnaire has no link or bearing to the main part of the questionnaire, so there are no identifying elements.
What are the possible risks or disadvantages?
There are no perceived risks resulting from your participation in the questionnaires outside your normal day-to-day activities. No personal or sensitive information will be collected. If you are unduly concerned about your responses to any of the questions or if you find participation in the project distressing, you should contact Dr. Foula Kopanidis or Dr. Marion Steel as soon as convenient. Dr. Kopanidis and Dr. Steel will discuss your concerns with you confidentially and suggest appropriate referral services, if necessary What are the benefits associated with participation?
This study will provide information on whether the use of the SLAMs peer-to-peer mentoring experience between students from different countries results in an increase in your international/global mindedness. Industry expects that students are able to cope in a diverse cultural environment for their long-term global employment. What will happen to the information I provide?
All the information you provide will be handled in a confidential manner. Your information will only be disclosed if: (1) it is to protect you or others from harm; (2) if specifically required or allowed by law; or (3) you provide the researchers with written permission. The results of the research will be presented in an aggregated and de-identified form. No individual will be identified unless we have express written permission. A summary of findings/results from this research is expected to be published and disseminated via report/s and presentation/a, as well as to the wider community via journal/conference publications/presentations. A publication is an Appropriate Durable Record (ADR), and any publications developed as a result of this project will enter the RMIT Repository (a publicly accessible online library of research papers). Please note that the data you provide will be kept securely by the RMIT researchers (physically in locked offices, and digitally via password protected computers and folders) for 5 years after publication, before being destroyed, and will not be handed over to any third parties. Only the research investigator, co-investigator and student researcher will have the access to that information The final research paper/s will remain online and/or in print. The information you provide may be used in future projects and publications, however, this information will remain anonymous.
What are my rights as a participant?
You have the right to:
• The right to withdraw from participation at any time
263
• The right to have any unprocessed data withdrawn and destroyed, provided it can be reliably identified, and provided that so doing does not increase the risk for the participant.
• The right to have any questions answered at any time.
Whom should I contact if I have any questions?
If you have any queries related to your participation or the research please contact Dr. Foula Kopanidis, Dr. Marion Steel or Kathleen Griffiths on the given contact details. We will be grateful to assist you with your queries
Yours sincerely
Dr Foula Kopanidis (Senior supervisor)
PhD, M.Ed, B.Bus (Marketing),GradDip., B.Ed, Dip.T
Email: [email protected]
Dr Marion Steel (Joint supervisor)
PhD, M.Train &Dev, B.Bus
Email: [email protected]
Ms Kathleen Griffiths (Research student)
M.Ed., M.B.A., B.Ec.
Email: [email protected]
If you have any concerns about your participation in this project, which you do not wish to discuss with the researchers, then you can contact the Ethics Officer, Research Integrity, Governance and Systems, RMIT University, GPO Box 2476V VIC 3001. Tel: (03) 9925 2251 or email [email protected]
By ticking this box and proceeding onto the next page (the beginning of the questionnaire), I agree to take part in the above RMIT University project. I have read the above statement (and have printed/saved it for my records) and understand the research project. I understand that my participation is voluntary – that I can choose not to participate in part or all of the project, and that I can withdraw at any state of the project without giving any reasons and without being penalized or disadvantaged in any way.
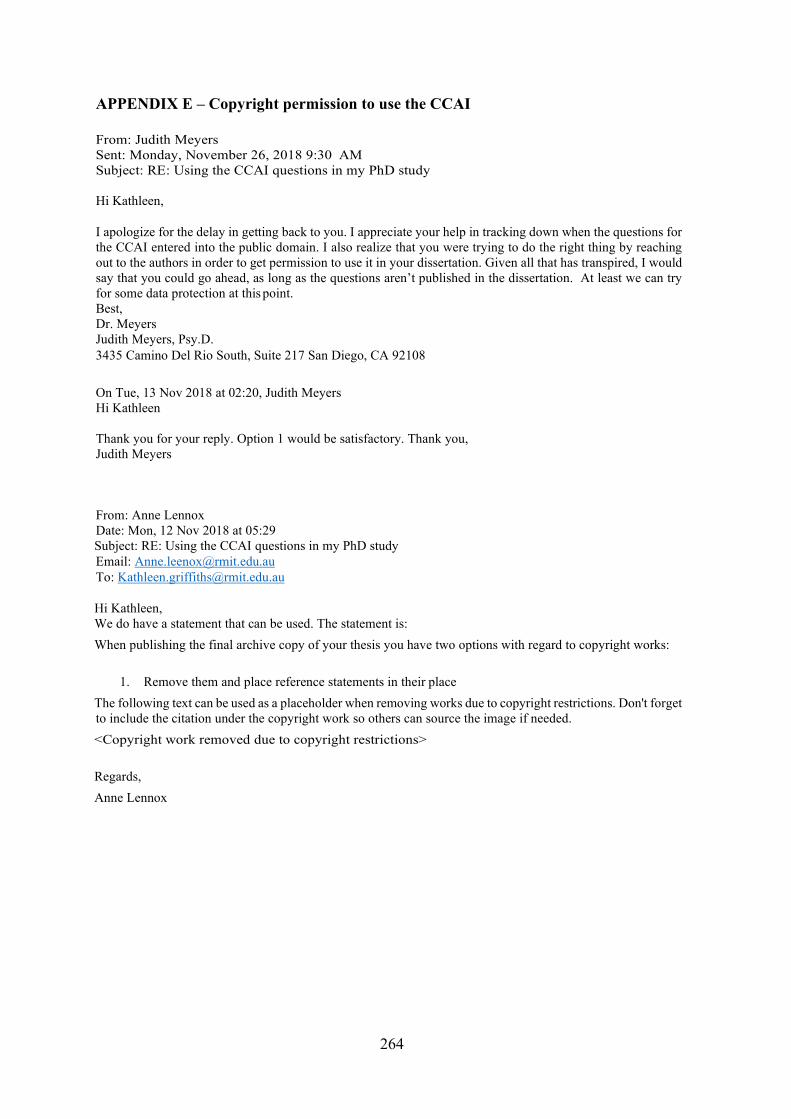
264
APPENDIX E – Copyright permission to use the CCAI From: Judith Meyers Sent: Monday, November 26, 2018 9:30 AM Subject: RE: Using the CCAI questions in my PhD study Hi Kathleen, I apologize for the delay in getting back to you. I appreciate your help in tracking down when the questions for the CCAI entered into the public domain. I also realize that you were trying to do the right thing by reaching out to the authors in order to get permission to use it in your dissertation. Given all that has transpired, I would say that you could go ahead, as long as the questions aren’t published in the dissertation. At least we can try for some data protection at this point. Best, Dr. Meyers Judith Meyers, Psy.D. 3435 Camino Del Rio South, Suite 217 San Diego, CA 92108 On Tue, 13 Nov 2018 at 02:20, Judith Meyers Hi Kathleen Thank you for your reply. Option 1 would be satisfactory. Thank you, Judith Meyers
From: Anne Lennox Date: Mon, 12 Nov 2018 at 05:29 Subject: RE: Using the CCAI questions in my PhD study Email: [email protected] To: [email protected] Hi Kathleen, We do have a statement that can be used. The statement is: When publishing the final archive copy of your thesis you have two options with regard to copyright works:
1. Remove them and place reference statements in their place The following text can be used as a placeholder when removing works due to copyright restrictions. Don't forget to include the citation under the copyright work so others can source the image if needed. <Copyright work removed due to copyright restrictions> Regards, Anne Lennox
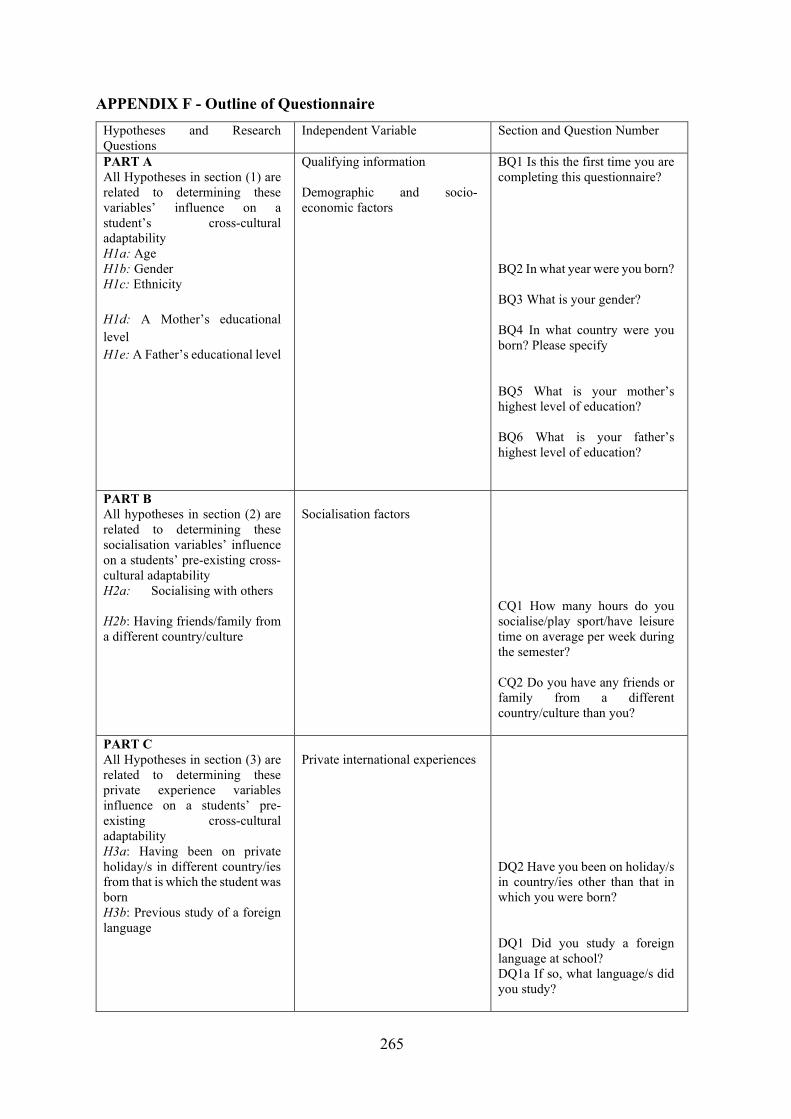
265
APPENDIX F - Outline of Questionnaire Hypotheses and Research Questions
Independent Variable Section and Question Number
PART A All Hypotheses in section (1) are related to determining these variables’ influence on a student’s cross-cultural adaptability H1a: Age H1b: Gender H1c: Ethnicity H1d: A Mother’s educational level H1e: A Father’s educational level
Qualifying information Demographic and socio-economic factors
BQ1 Is this the first time you are completing this questionnaire? BQ2 In what year were you born? BQ3 What is your gender? BQ4 In what country were you born? Please specify BQ5 What is your mother’s highest level of education? BQ6 What is your father’s highest level of education?
PART B All hypotheses in section (2) are related to determining these socialisation variables’ influence on a students’ pre-existing cross-cultural adaptability H2a: Socialising with others H2b: Having friends/family from a different country/culture
Socialisation factors
CQ1 How many hours do you socialise/play sport/have leisure time on average per week during the semester? CQ2 Do you have any friends or family from a different country/culture than you?
PART C All Hypotheses in section (3) are related to determining these private experience variables influence on a students’ pre-existing cross-cultural adaptability H3a: Having been on private holiday/s in different country/ies from that is which the student was born H3b: Previous study of a foreign language
Private international experiences
DQ2 Have you been on holiday/s in country/ies other than that in which you were born? DQ1 Did you study a foreign language at school? DQ1a If so, what language/s did you study?
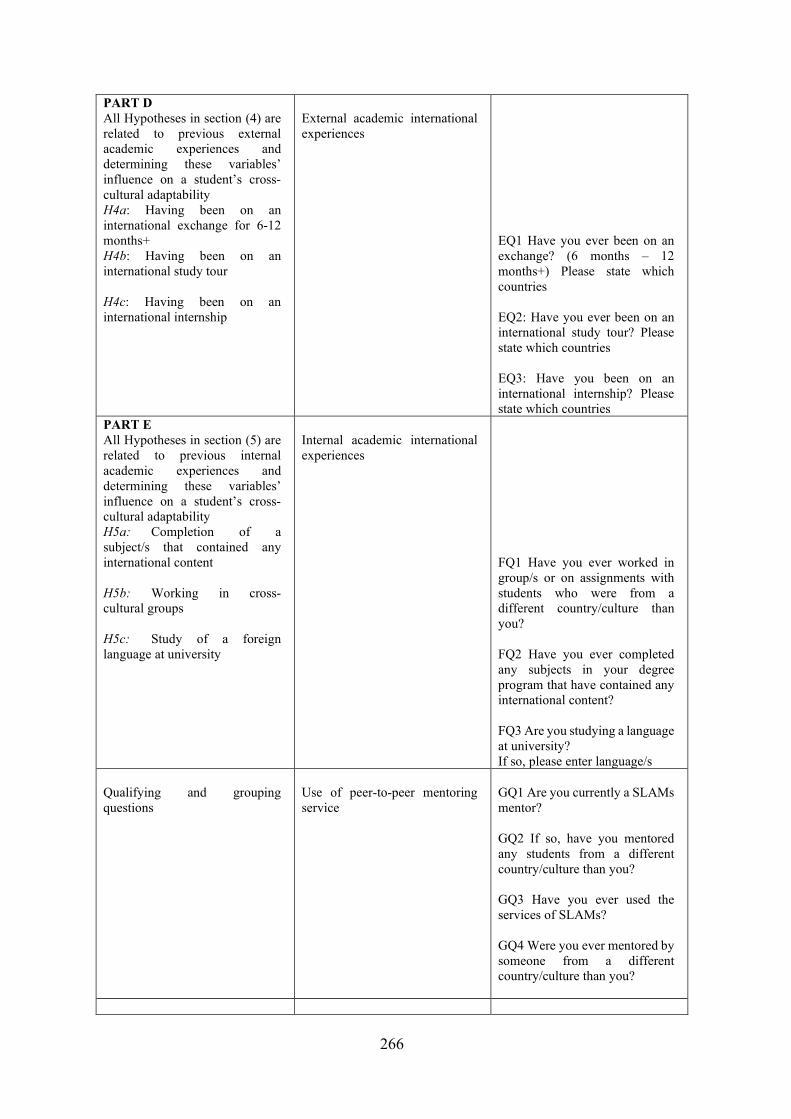
266
PART D All Hypotheses in section (4) are related to previous external academic experiences and determining these variables’ influence on a student’s cross-cultural adaptability H4a: Having been on an international exchange for 6-12 months+ H4b: Having been on an international study tour H4c: Having been on an international internship
External academic international experiences
EQ1 Have you ever been on an exchange? (6 months – 12 months+) Please state which countries EQ2: Have you ever been on an international study tour? Please state which countries EQ3: Have you been on an international internship? Please state which countries
PART E All Hypotheses in section (5) are related to previous internal academic experiences and determining these variables’ influence on a student’s cross-cultural adaptability H5a: Completion of a subject/s that contained any international content H5b: Working in cross-cultural groups H5c: Study of a foreign language at university
Internal academic international experiences
FQ1 Have you ever worked in group/s or on assignments with students who were from a different country/culture than you? FQ2 Have you ever completed any subjects in your degree program that have contained any international content? FQ3 Are you studying a language at university? If so, please enter language/s
Qualifying and grouping questions
Use of peer-to-peer mentoring service
GQ1 Are you currently a SLAMs mentor? GQ2 If so, have you mentored any students from a different country/culture than you? GQ3 Have you ever used the services of SLAMs? GQ4 Were you ever mentored by someone from a different country/culture than you?
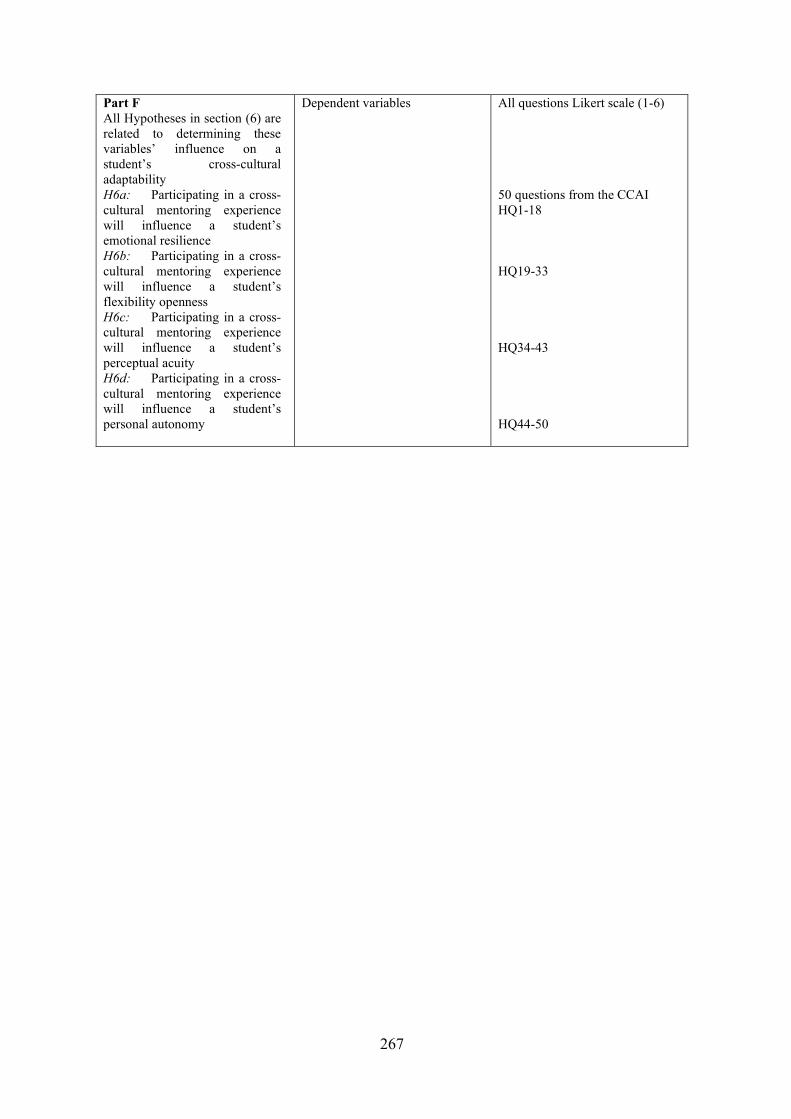
267
Part F All Hypotheses in section (6) are related to determining these variables’ influence on a student’s cross-cultural adaptability H6a: Participating in a cross-cultural mentoring experience will influence a student’s emotional resilience H6b: Participating in a cross-cultural mentoring experience will influence a student’s flexibility openness H6c: Participating in a cross-cultural mentoring experience will influence a student’s perceptual acuity H6d: Participating in a cross-cultural mentoring experience will influence a student’s personal autonomy
Dependent variables
All questions Likert scale (1-6) 50 questions from the CCAI HQ1-18 HQ19-33 HQ34-43 HQ44-50
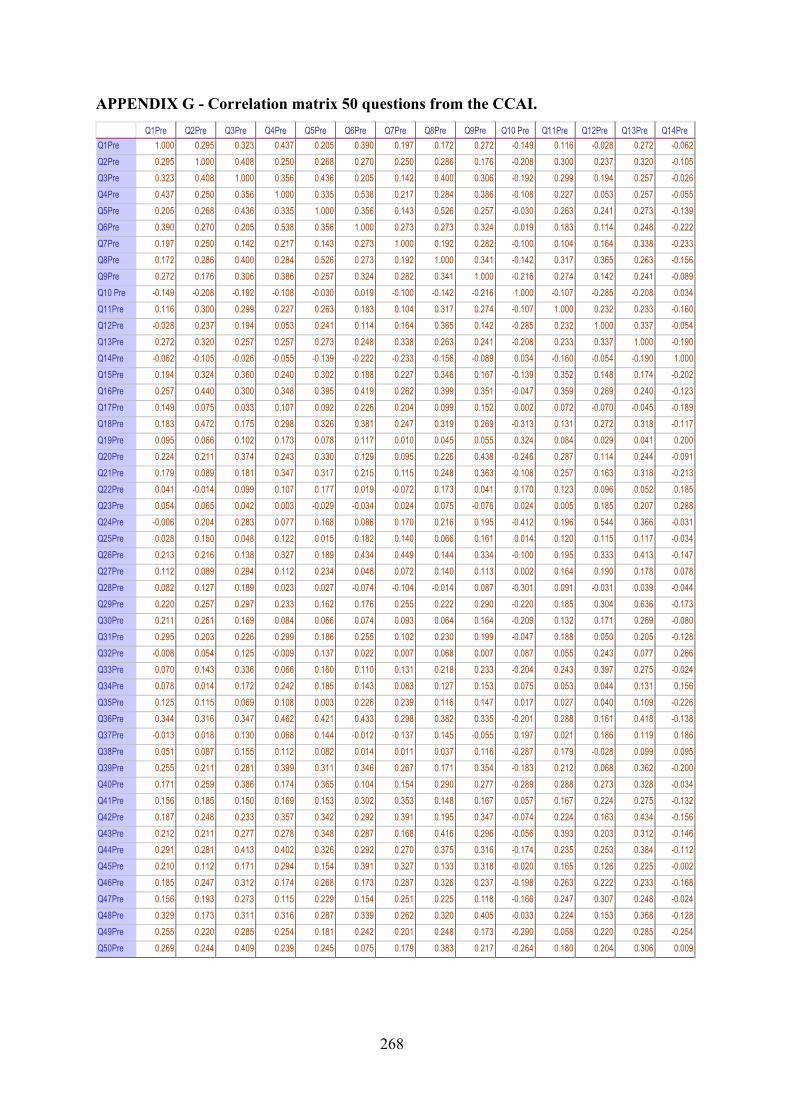
268
APPENDIX G - Correlation matrix 50 questions from the CCAI. Q1Pre Q2Pre Q3Pre Q4Pre Q5Pre Q6Pre Q7Pre Q8Pre Q9Pre Q10 Pre Q11Pre Q12Pre Q13Pre Q14Pre
Q1Pre 1.000 0.295 0.323 0.437 0.205 0.390 0.197 0.172 0.272 -0.149 0.116 -0.028 0.272 -0.062Q2Pre 0.295 1.000 0.408 0.250 0.268 0.270 0.250 0.286 0.176 -0.208 0.300 0.237 0.320 -0.105Q3Pre 0.323 0.408 1.000 0.356 0.436 0.205 0.142 0.400 0.306 -0.192 0.299 0.194 0.257 -0.026Q4Pre 0.437 0.250 0.356 1.000 0.335 0.538 0.217 0.284 0.386 -0.108 0.227 0.053 0.257 -0.055Q5Pre 0.205 0.268 0.436 0.335 1.000 0.356 0.143 0.526 0.257 -0.030 0.263 0.241 0.273 -0.139Q6Pre 0.390 0.270 0.205 0.538 0.356 1.000 0.273 0.273 0.324 0.019 0.183 0.114 0.248 -0.222Q7Pre 0.197 0.250 0.142 0.217 0.143 0.273 1.000 0.192 0.282 -0.100 0.104 0.164 0.338 -0.233Q8Pre 0.172 0.286 0.400 0.284 0.526 0.273 0.192 1.000 0.341 -0.142 0.317 0.365 0.263 -0.156Q9Pre 0.272 0.176 0.306 0.386 0.257 0.324 0.282 0.341 1.000 -0.216 0.274 0.142 0.241 -0.089Q10 Pre -0.149 -0.208 -0.192 -0.108 -0.030 0.019 -0.100 -0.142 -0.216 1.000 -0.107 -0.285 -0.208 0.034Q11Pre 0.116 0.300 0.299 0.227 0.263 0.183 0.104 0.317 0.274 -0.107 1.000 0.232 0.233 -0.160Q12Pre -0.028 0.237 0.194 0.053 0.241 0.114 0.164 0.365 0.142 -0.285 0.232 1.000 0.337 -0.054Q13Pre 0.272 0.320 0.257 0.257 0.273 0.248 0.338 0.263 0.241 -0.208 0.233 0.337 1.000 -0.190Q14Pre -0.062 -0.105 -0.026 -0.055 -0.139 -0.222 -0.233 -0.156 -0.089 0.034 -0.160 -0.054 -0.190 1.000Q15Pre 0.194 0.324 0.360 0.240 0.302 0.188 0.227 0.346 0.167 -0.139 0.352 0.148 0.174 -0.202Q16Pre 0.257 0.440 0.300 0.348 0.395 0.419 0.262 0.399 0.351 -0.047 0.359 0.269 0.240 -0.123Q17Pre 0.149 0.075 0.033 0.107 0.092 0.226 0.204 0.099 0.152 0.002 0.072 -0.070 -0.045 -0.189Q18Pre 0.183 0.472 0.175 0.298 0.326 0.381 0.247 0.319 0.269 -0.313 0.131 0.272 0.318 -0.117Q19Pre 0.095 0.066 0.102 0.173 0.078 0.117 0.010 0.045 0.055 0.324 0.084 0.029 0.041 0.200Q20Pre 0.224 0.211 0.374 0.243 0.330 0.129 0.095 0.226 0.438 -0.246 0.287 0.114 0.244 -0.091Q21Pre 0.179 0.089 0.181 0.347 0.317 0.215 0.115 0.248 0.363 -0.108 0.257 0.163 0.318 -0.213Q22Pre 0.041 -0.014 0.099 0.107 0.177 0.019 -0.072 0.173 0.041 0.170 0.123 0.096 0.052 0.185Q23Pre 0.054 0.065 0.042 0.003 -0.029 -0.034 0.024 0.075 -0.076 0.024 0.005 0.185 0.207 0.288Q24Pre -0.006 0.204 0.283 0.077 0.168 0.086 0.170 0.216 0.195 -0.412 0.196 0.544 0.366 -0.031Q25Pre 0.028 0.150 0.048 0.122 0.015 0.182 0.140 0.066 0.161 0.014 0.120 0.115 0.117 -0.034Q26Pre 0.213 0.216 0.138 0.327 0.189 0.434 0.449 0.144 0.334 -0.100 0.195 0.333 0.413 -0.147Q27Pre 0.112 0.089 0.294 0.112 0.234 0.048 0.072 0.140 0.113 0.002 0.164 0.190 0.178 0.078Q28Pre 0.082 0.127 0.189 0.023 0.027 -0.074 -0.104 -0.014 0.087 -0.301 0.091 -0.031 0.039 -0.044Q29Pre 0.220 0.257 0.297 0.233 0.162 0.176 0.255 0.222 0.290 -0.220 0.185 0.304 0.636 -0.173Q30Pre 0.211 0.261 0.169 0.084 0.066 0.074 0.093 0.064 0.164 -0.209 0.132 0.171 0.269 -0.080Q31Pre 0.295 0.203 0.226 0.299 0.186 0.255 0.102 0.230 0.199 -0.047 0.188 0.050 0.205 -0.128Q32Pre -0.008 0.054 0.125 -0.009 0.137 0.022 0.007 0.068 0.007 0.087 0.055 0.243 0.077 0.266Q33Pre 0.070 0.143 0.336 0.066 0.160 0.110 0.131 0.218 0.233 -0.204 0.243 0.397 0.275 -0.024Q34Pre 0.078 0.014 0.172 0.242 0.185 0.143 0.083 0.127 0.153 0.075 0.053 0.044 0.131 0.156Q35Pre 0.125 0.115 0.069 0.108 0.003 0.226 0.239 0.116 0.147 0.017 0.027 0.040 0.109 -0.226Q36Pre 0.344 0.316 0.347 0.462 0.421 0.433 0.298 0.382 0.335 -0.201 0.288 0.161 0.418 -0.138Q37Pre -0.013 0.018 0.130 0.068 0.144 -0.012 -0.137 0.145 -0.055 0.197 0.021 0.186 0.119 0.186Q38Pre 0.051 0.087 0.155 0.112 0.082 0.014 0.011 0.037 0.116 -0.287 0.179 -0.028 0.099 0.095Q39Pre 0.255 0.211 0.281 0.399 0.311 0.346 0.267 0.171 0.354 -0.183 0.212 0.068 0.362 -0.200Q40Pre 0.171 0.259 0.386 0.174 0.365 0.104 0.154 0.290 0.277 -0.289 0.288 0.273 0.328 -0.034Q41Pre 0.156 0.185 0.150 0.169 0.153 0.302 0.353 0.148 0.167 0.057 0.167 0.224 0.275 -0.132Q42Pre 0.187 0.248 0.233 0.357 0.342 0.292 0.391 0.195 0.347 -0.074 0.224 0.163 0.434 -0.156Q43Pre 0.212 0.211 0.277 0.278 0.348 0.287 0.168 0.416 0.296 -0.056 0.393 0.203 0.312 -0.146Q44Pre 0.291 0.281 0.413 0.402 0.326 0.292 0.270 0.375 0.316 -0.174 0.235 0.253 0.384 -0.112Q45Pre 0.210 0.112 0.171 0.294 0.154 0.391 0.327 0.133 0.318 -0.020 0.165 0.126 0.225 -0.002Q46Pre 0.185 0.247 0.312 0.174 0.268 0.173 0.287 0.326 0.237 -0.198 0.263 0.222 0.233 -0.168Q47Pre 0.156 0.193 0.273 0.115 0.229 0.154 0.251 0.225 0.118 -0.166 0.247 0.307 0.248 -0.024Q48Pre 0.329 0.173 0.311 0.316 0.287 0.339 0.262 0.320 0.405 -0.033 0.224 0.153 0.368 -0.128Q49Pre 0.255 0.220 0.285 0.254 0.181 0.242 0.201 0.248 0.173 -0.290 0.058 0.220 0.285 -0.254Q50Pre 0.269 0.244 0.409 0.239 0.245 0.075 0.179 0.383 0.217 -0.264 0.180 0.204 0.306 0.009
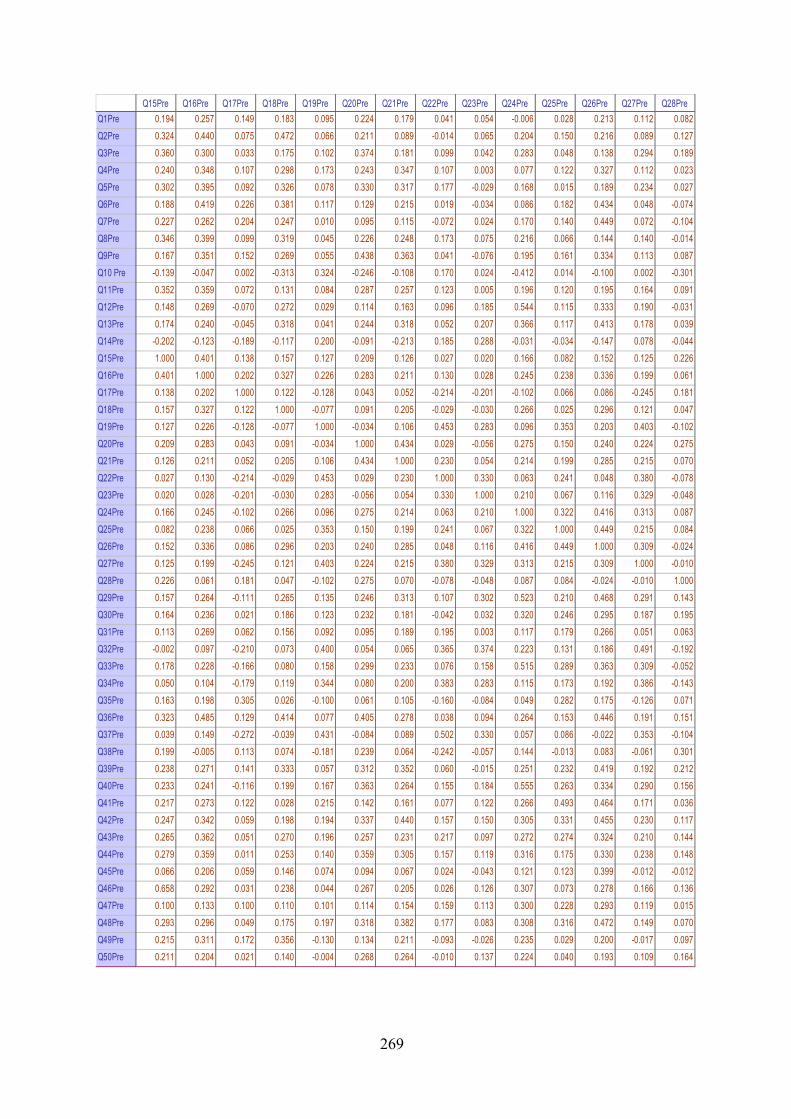
269
Q15Pre Q16Pre Q17Pre Q18Pre Q19Pre Q20Pre Q21Pre Q22Pre Q23Pre Q24Pre Q25Pre Q26Pre Q27Pre Q28Pre Q1Pre 0.194 0.257 0.149 0.183 0.095 0.224 0.179 0.041 0.054 -0.006 0.028 0.213 0.112 0.082Q2Pre 0.324 0.440 0.075 0.472 0.066 0.211 0.089 -0.014 0.065 0.204 0.150 0.216 0.089 0.127Q3Pre 0.360 0.300 0.033 0.175 0.102 0.374 0.181 0.099 0.042 0.283 0.048 0.138 0.294 0.189Q4Pre 0.240 0.348 0.107 0.298 0.173 0.243 0.347 0.107 0.003 0.077 0.122 0.327 0.112 0.023Q5Pre 0.302 0.395 0.092 0.326 0.078 0.330 0.317 0.177 -0.029 0.168 0.015 0.189 0.234 0.027Q6Pre 0.188 0.419 0.226 0.381 0.117 0.129 0.215 0.019 -0.034 0.086 0.182 0.434 0.048 -0.074Q7Pre 0.227 0.262 0.204 0.247 0.010 0.095 0.115 -0.072 0.024 0.170 0.140 0.449 0.072 -0.104Q8Pre 0.346 0.399 0.099 0.319 0.045 0.226 0.248 0.173 0.075 0.216 0.066 0.144 0.140 -0.014Q9Pre 0.167 0.351 0.152 0.269 0.055 0.438 0.363 0.041 -0.076 0.195 0.161 0.334 0.113 0.087Q10 Pre -0.139 -0.047 0.002 -0.313 0.324 -0.246 -0.108 0.170 0.024 -0.412 0.014 -0.100 0.002 -0.301Q11Pre 0.352 0.359 0.072 0.131 0.084 0.287 0.257 0.123 0.005 0.196 0.120 0.195 0.164 0.091Q12Pre 0.148 0.269 -0.070 0.272 0.029 0.114 0.163 0.096 0.185 0.544 0.115 0.333 0.190 -0.031Q13Pre 0.174 0.240 -0.045 0.318 0.041 0.244 0.318 0.052 0.207 0.366 0.117 0.413 0.178 0.039Q14Pre -0.202 -0.123 -0.189 -0.117 0.200 -0.091 -0.213 0.185 0.288 -0.031 -0.034 -0.147 0.078 -0.044Q15Pre 1.000 0.401 0.138 0.157 0.127 0.209 0.126 0.027 0.020 0.166 0.082 0.152 0.125 0.226Q16Pre 0.401 1.000 0.202 0.327 0.226 0.283 0.211 0.130 0.028 0.245 0.238 0.336 0.199 0.061Q17Pre 0.138 0.202 1.000 0.122 -0.128 0.043 0.052 -0.214 -0.201 -0.102 0.066 0.086 -0.245 0.181Q18Pre 0.157 0.327 0.122 1.000 -0.077 0.091 0.205 -0.029 -0.030 0.266 0.025 0.296 0.121 0.047Q19Pre 0.127 0.226 -0.128 -0.077 1.000 -0.034 0.106 0.453 0.283 0.096 0.353 0.203 0.403 -0.102Q20Pre 0.209 0.283 0.043 0.091 -0.034 1.000 0.434 0.029 -0.056 0.275 0.150 0.240 0.224 0.275Q21Pre 0.126 0.211 0.052 0.205 0.106 0.434 1.000 0.230 0.054 0.214 0.199 0.285 0.215 0.070Q22Pre 0.027 0.130 -0.214 -0.029 0.453 0.029 0.230 1.000 0.330 0.063 0.241 0.048 0.380 -0.078Q23Pre 0.020 0.028 -0.201 -0.030 0.283 -0.056 0.054 0.330 1.000 0.210 0.067 0.116 0.329 -0.048Q24Pre 0.166 0.245 -0.102 0.266 0.096 0.275 0.214 0.063 0.210 1.000 0.322 0.416 0.313 0.087Q25Pre 0.082 0.238 0.066 0.025 0.353 0.150 0.199 0.241 0.067 0.322 1.000 0.449 0.215 0.084Q26Pre 0.152 0.336 0.086 0.296 0.203 0.240 0.285 0.048 0.116 0.416 0.449 1.000 0.309 -0.024Q27Pre 0.125 0.199 -0.245 0.121 0.403 0.224 0.215 0.380 0.329 0.313 0.215 0.309 1.000 -0.010Q28Pre 0.226 0.061 0.181 0.047 -0.102 0.275 0.070 -0.078 -0.048 0.087 0.084 -0.024 -0.010 1.000Q29Pre 0.157 0.264 -0.111 0.265 0.135 0.246 0.313 0.107 0.302 0.523 0.210 0.468 0.291 0.143Q30Pre 0.164 0.236 0.021 0.186 0.123 0.232 0.181 -0.042 0.032 0.320 0.246 0.295 0.187 0.195Q31Pre 0.113 0.269 0.062 0.156 0.092 0.095 0.189 0.195 0.003 0.117 0.179 0.266 0.051 0.063Q32Pre -0.002 0.097 -0.210 0.073 0.400 0.054 0.065 0.365 0.374 0.223 0.131 0.186 0.491 -0.192Q33Pre 0.178 0.228 -0.166 0.080 0.158 0.299 0.233 0.076 0.158 0.515 0.289 0.363 0.309 -0.052Q34Pre 0.050 0.104 -0.179 0.119 0.344 0.080 0.200 0.383 0.283 0.115 0.173 0.192 0.386 -0.143Q35Pre 0.163 0.198 0.305 0.026 -0.100 0.061 0.105 -0.160 -0.084 0.049 0.282 0.175 -0.126 0.071Q36Pre 0.323 0.485 0.129 0.414 0.077 0.405 0.278 0.038 0.094 0.264 0.153 0.446 0.191 0.151Q37Pre 0.039 0.149 -0.272 -0.039 0.431 -0.084 0.089 0.502 0.330 0.057 0.086 -0.022 0.353 -0.104Q38Pre 0.199 -0.005 0.113 0.074 -0.181 0.239 0.064 -0.242 -0.057 0.144 -0.013 0.083 -0.061 0.301Q39Pre 0.238 0.271 0.141 0.333 0.057 0.312 0.352 0.060 -0.015 0.251 0.232 0.419 0.192 0.212Q40Pre 0.233 0.241 -0.116 0.199 0.167 0.363 0.264 0.155 0.184 0.555 0.263 0.334 0.290 0.156Q41Pre 0.217 0.273 0.122 0.028 0.215 0.142 0.161 0.077 0.122 0.266 0.493 0.464 0.171 0.036Q42Pre 0.247 0.342 0.059 0.198 0.194 0.337 0.440 0.157 0.150 0.305 0.331 0.455 0.230 0.117Q43Pre 0.265 0.362 0.051 0.270 0.196 0.257 0.231 0.217 0.097 0.272 0.274 0.324 0.210 0.144Q44Pre 0.279 0.359 0.011 0.253 0.140 0.359 0.305 0.157 0.119 0.316 0.175 0.330 0.238 0.148Q45Pre 0.066 0.206 0.059 0.146 0.074 0.094 0.067 0.024 -0.043 0.121 0.123 0.399 -0.012 -0.012Q46Pre 0.658 0.292 0.031 0.238 0.044 0.267 0.205 0.026 0.126 0.307 0.073 0.278 0.166 0.136Q47Pre 0.100 0.133 0.100 0.110 0.101 0.114 0.154 0.159 0.113 0.300 0.228 0.293 0.119 0.015Q48Pre 0.293 0.296 0.049 0.175 0.197 0.318 0.382 0.177 0.083 0.308 0.316 0.472 0.149 0.070Q49Pre 0.215 0.311 0.172 0.356 -0.130 0.134 0.211 -0.093 -0.026 0.235 0.029 0.200 -0.017 0.097Q50Pre 0.211 0.204 0.021 0.140 -0.004 0.268 0.264 -0.010 0.137 0.224 0.040 0.193 0.109 0.164
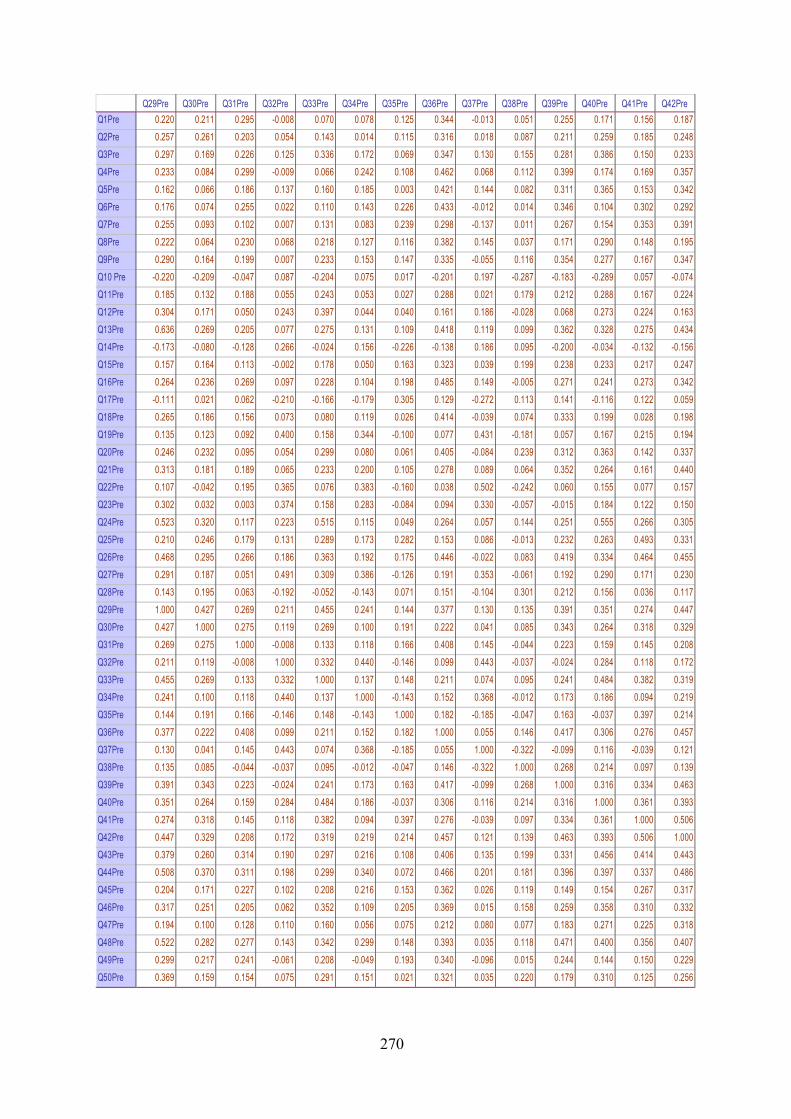
270
Q29Pre Q30Pre Q31Pre Q32Pre Q33Pre Q34Pre Q35Pre Q36Pre Q37Pre Q38Pre Q39Pre Q40Pre Q41Pre Q42Pre Q1Pre 0.220 0.211 0.295 -0.008 0.070 0.078 0.125 0.344 -0.013 0.051 0.255 0.171 0.156 0.187Q2Pre 0.257 0.261 0.203 0.054 0.143 0.014 0.115 0.316 0.018 0.087 0.211 0.259 0.185 0.248Q3Pre 0.297 0.169 0.226 0.125 0.336 0.172 0.069 0.347 0.130 0.155 0.281 0.386 0.150 0.233Q4Pre 0.233 0.084 0.299 -0.009 0.066 0.242 0.108 0.462 0.068 0.112 0.399 0.174 0.169 0.357Q5Pre 0.162 0.066 0.186 0.137 0.160 0.185 0.003 0.421 0.144 0.082 0.311 0.365 0.153 0.342Q6Pre 0.176 0.074 0.255 0.022 0.110 0.143 0.226 0.433 -0.012 0.014 0.346 0.104 0.302 0.292Q7Pre 0.255 0.093 0.102 0.007 0.131 0.083 0.239 0.298 -0.137 0.011 0.267 0.154 0.353 0.391Q8Pre 0.222 0.064 0.230 0.068 0.218 0.127 0.116 0.382 0.145 0.037 0.171 0.290 0.148 0.195Q9Pre 0.290 0.164 0.199 0.007 0.233 0.153 0.147 0.335 -0.055 0.116 0.354 0.277 0.167 0.347Q10 Pre -0.220 -0.209 -0.047 0.087 -0.204 0.075 0.017 -0.201 0.197 -0.287 -0.183 -0.289 0.057 -0.074Q11Pre 0.185 0.132 0.188 0.055 0.243 0.053 0.027 0.288 0.021 0.179 0.212 0.288 0.167 0.224Q12Pre 0.304 0.171 0.050 0.243 0.397 0.044 0.040 0.161 0.186 -0.028 0.068 0.273 0.224 0.163Q13Pre 0.636 0.269 0.205 0.077 0.275 0.131 0.109 0.418 0.119 0.099 0.362 0.328 0.275 0.434Q14Pre -0.173 -0.080 -0.128 0.266 -0.024 0.156 -0.226 -0.138 0.186 0.095 -0.200 -0.034 -0.132 -0.156Q15Pre 0.157 0.164 0.113 -0.002 0.178 0.050 0.163 0.323 0.039 0.199 0.238 0.233 0.217 0.247Q16Pre 0.264 0.236 0.269 0.097 0.228 0.104 0.198 0.485 0.149 -0.005 0.271 0.241 0.273 0.342Q17Pre -0.111 0.021 0.062 -0.210 -0.166 -0.179 0.305 0.129 -0.272 0.113 0.141 -0.116 0.122 0.059Q18Pre 0.265 0.186 0.156 0.073 0.080 0.119 0.026 0.414 -0.039 0.074 0.333 0.199 0.028 0.198Q19Pre 0.135 0.123 0.092 0.400 0.158 0.344 -0.100 0.077 0.431 -0.181 0.057 0.167 0.215 0.194Q20Pre 0.246 0.232 0.095 0.054 0.299 0.080 0.061 0.405 -0.084 0.239 0.312 0.363 0.142 0.337Q21Pre 0.313 0.181 0.189 0.065 0.233 0.200 0.105 0.278 0.089 0.064 0.352 0.264 0.161 0.440Q22Pre 0.107 -0.042 0.195 0.365 0.076 0.383 -0.160 0.038 0.502 -0.242 0.060 0.155 0.077 0.157Q23Pre 0.302 0.032 0.003 0.374 0.158 0.283 -0.084 0.094 0.330 -0.057 -0.015 0.184 0.122 0.150Q24Pre 0.523 0.320 0.117 0.223 0.515 0.115 0.049 0.264 0.057 0.144 0.251 0.555 0.266 0.305Q25Pre 0.210 0.246 0.179 0.131 0.289 0.173 0.282 0.153 0.086 -0.013 0.232 0.263 0.493 0.331Q26Pre 0.468 0.295 0.266 0.186 0.363 0.192 0.175 0.446 -0.022 0.083 0.419 0.334 0.464 0.455Q27Pre 0.291 0.187 0.051 0.491 0.309 0.386 -0.126 0.191 0.353 -0.061 0.192 0.290 0.171 0.230Q28Pre 0.143 0.195 0.063 -0.192 -0.052 -0.143 0.071 0.151 -0.104 0.301 0.212 0.156 0.036 0.117Q29Pre 1.000 0.427 0.269 0.211 0.455 0.241 0.144 0.377 0.130 0.135 0.391 0.351 0.274 0.447Q30Pre 0.427 1.000 0.275 0.119 0.269 0.100 0.191 0.222 0.041 0.085 0.343 0.264 0.318 0.329Q31Pre 0.269 0.275 1.000 -0.008 0.133 0.118 0.166 0.408 0.145 -0.044 0.223 0.159 0.145 0.208Q32Pre 0.211 0.119 -0.008 1.000 0.332 0.440 -0.146 0.099 0.443 -0.037 -0.024 0.284 0.118 0.172Q33Pre 0.455 0.269 0.133 0.332 1.000 0.137 0.148 0.211 0.074 0.095 0.241 0.484 0.382 0.319Q34Pre 0.241 0.100 0.118 0.440 0.137 1.000 -0.143 0.152 0.368 -0.012 0.173 0.186 0.094 0.219Q35Pre 0.144 0.191 0.166 -0.146 0.148 -0.143 1.000 0.182 -0.185 -0.047 0.163 -0.037 0.397 0.214Q36Pre 0.377 0.222 0.408 0.099 0.211 0.152 0.182 1.000 0.055 0.146 0.417 0.306 0.276 0.457Q37Pre 0.130 0.041 0.145 0.443 0.074 0.368 -0.185 0.055 1.000 -0.322 -0.099 0.116 -0.039 0.121Q38Pre 0.135 0.085 -0.044 -0.037 0.095 -0.012 -0.047 0.146 -0.322 1.000 0.268 0.214 0.097 0.139Q39Pre 0.391 0.343 0.223 -0.024 0.241 0.173 0.163 0.417 -0.099 0.268 1.000 0.316 0.334 0.463Q40Pre 0.351 0.264 0.159 0.284 0.484 0.186 -0.037 0.306 0.116 0.214 0.316 1.000 0.361 0.393Q41Pre 0.274 0.318 0.145 0.118 0.382 0.094 0.397 0.276 -0.039 0.097 0.334 0.361 1.000 0.506Q42Pre 0.447 0.329 0.208 0.172 0.319 0.219 0.214 0.457 0.121 0.139 0.463 0.393 0.506 1.000Q43Pre 0.379 0.260 0.314 0.190 0.297 0.216 0.108 0.406 0.135 0.199 0.331 0.456 0.414 0.443Q44Pre 0.508 0.370 0.311 0.198 0.299 0.340 0.072 0.466 0.201 0.181 0.396 0.397 0.337 0.486Q45Pre 0.204 0.171 0.227 0.102 0.208 0.216 0.153 0.362 0.026 0.119 0.149 0.154 0.267 0.317Q46Pre 0.317 0.251 0.205 0.062 0.352 0.109 0.205 0.369 0.015 0.158 0.259 0.358 0.310 0.332Q47Pre 0.194 0.100 0.128 0.110 0.160 0.056 0.075 0.212 0.080 0.077 0.183 0.271 0.225 0.318Q48Pre 0.522 0.282 0.277 0.143 0.342 0.299 0.148 0.393 0.035 0.118 0.471 0.400 0.356 0.407Q49Pre 0.299 0.217 0.241 -0.061 0.208 -0.049 0.193 0.340 -0.096 0.015 0.244 0.144 0.150 0.229Q50Pre 0.369 0.159 0.154 0.075 0.291 0.151 0.021 0.321 0.035 0.220 0.179 0.310 0.125 0.256
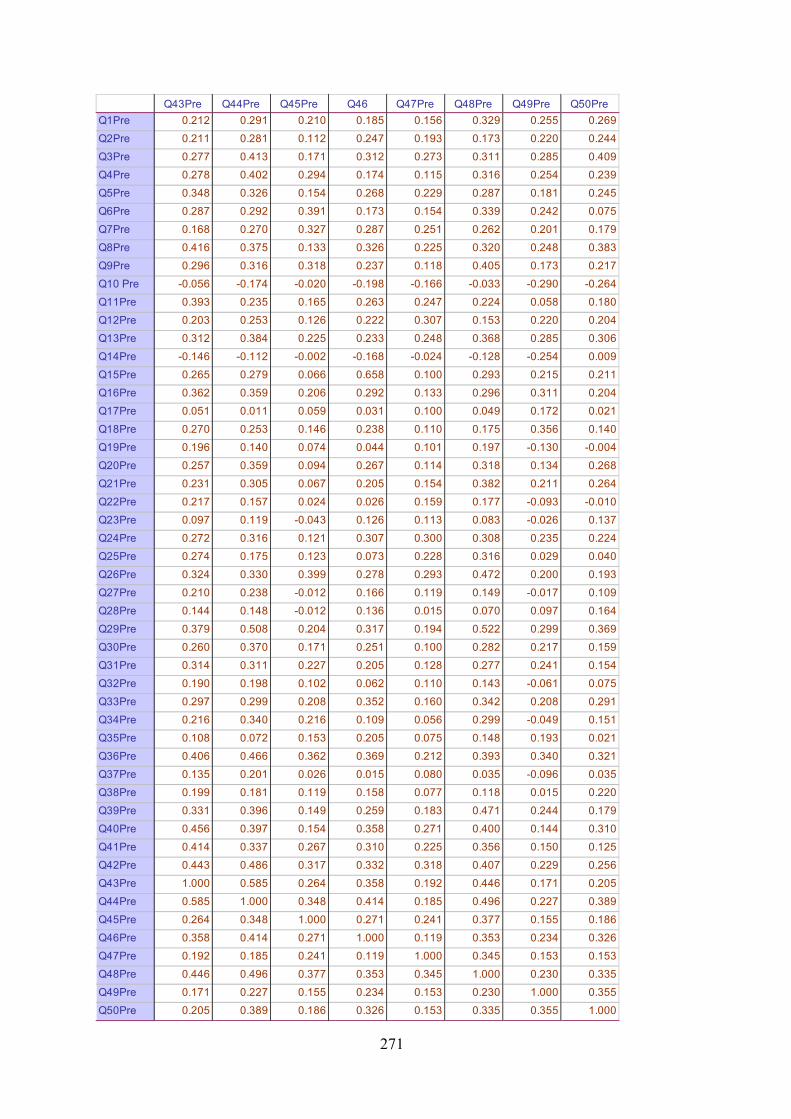
271
Q43Pre Q44Pre Q45Pre Q46 Q47Pre Q48Pre Q49Pre Q50PreQ1Pre 0.212 0.291 0.210 0.185 0.156 0.329 0.255 0.269Q2Pre 0.211 0.281 0.112 0.247 0.193 0.173 0.220 0.244Q3Pre 0.277 0.413 0.171 0.312 0.273 0.311 0.285 0.409Q4Pre 0.278 0.402 0.294 0.174 0.115 0.316 0.254 0.239Q5Pre 0.348 0.326 0.154 0.268 0.229 0.287 0.181 0.245Q6Pre 0.287 0.292 0.391 0.173 0.154 0.339 0.242 0.075Q7Pre 0.168 0.270 0.327 0.287 0.251 0.262 0.201 0.179Q8Pre 0.416 0.375 0.133 0.326 0.225 0.320 0.248 0.383Q9Pre 0.296 0.316 0.318 0.237 0.118 0.405 0.173 0.217Q10 Pre -0.056 -0.174 -0.020 -0.198 -0.166 -0.033 -0.290 -0.264Q11Pre 0.393 0.235 0.165 0.263 0.247 0.224 0.058 0.180Q12Pre 0.203 0.253 0.126 0.222 0.307 0.153 0.220 0.204Q13Pre 0.312 0.384 0.225 0.233 0.248 0.368 0.285 0.306Q14Pre -0.146 -0.112 -0.002 -0.168 -0.024 -0.128 -0.254 0.009Q15Pre 0.265 0.279 0.066 0.658 0.100 0.293 0.215 0.211Q16Pre 0.362 0.359 0.206 0.292 0.133 0.296 0.311 0.204Q17Pre 0.051 0.011 0.059 0.031 0.100 0.049 0.172 0.021Q18Pre 0.270 0.253 0.146 0.238 0.110 0.175 0.356 0.140Q19Pre 0.196 0.140 0.074 0.044 0.101 0.197 -0.130 -0.004Q20Pre 0.257 0.359 0.094 0.267 0.114 0.318 0.134 0.268Q21Pre 0.231 0.305 0.067 0.205 0.154 0.382 0.211 0.264Q22Pre 0.217 0.157 0.024 0.026 0.159 0.177 -0.093 -0.010Q23Pre 0.097 0.119 -0.043 0.126 0.113 0.083 -0.026 0.137Q24Pre 0.272 0.316 0.121 0.307 0.300 0.308 0.235 0.224Q25Pre 0.274 0.175 0.123 0.073 0.228 0.316 0.029 0.040Q26Pre 0.324 0.330 0.399 0.278 0.293 0.472 0.200 0.193Q27Pre 0.210 0.238 -0.012 0.166 0.119 0.149 -0.017 0.109Q28Pre 0.144 0.148 -0.012 0.136 0.015 0.070 0.097 0.164Q29Pre 0.379 0.508 0.204 0.317 0.194 0.522 0.299 0.369Q30Pre 0.260 0.370 0.171 0.251 0.100 0.282 0.217 0.159Q31Pre 0.314 0.311 0.227 0.205 0.128 0.277 0.241 0.154Q32Pre 0.190 0.198 0.102 0.062 0.110 0.143 -0.061 0.075Q33Pre 0.297 0.299 0.208 0.352 0.160 0.342 0.208 0.291Q34Pre 0.216 0.340 0.216 0.109 0.056 0.299 -0.049 0.151Q35Pre 0.108 0.072 0.153 0.205 0.075 0.148 0.193 0.021Q36Pre 0.406 0.466 0.362 0.369 0.212 0.393 0.340 0.321Q37Pre 0.135 0.201 0.026 0.015 0.080 0.035 -0.096 0.035Q38Pre 0.199 0.181 0.119 0.158 0.077 0.118 0.015 0.220Q39Pre 0.331 0.396 0.149 0.259 0.183 0.471 0.244 0.179Q40Pre 0.456 0.397 0.154 0.358 0.271 0.400 0.144 0.310Q41Pre 0.414 0.337 0.267 0.310 0.225 0.356 0.150 0.125Q42Pre 0.443 0.486 0.317 0.332 0.318 0.407 0.229 0.256Q43Pre 1.000 0.585 0.264 0.358 0.192 0.446 0.171 0.205Q44Pre 0.585 1.000 0.348 0.414 0.185 0.496 0.227 0.389Q45Pre 0.264 0.348 1.000 0.271 0.241 0.377 0.155 0.186Q46Pre 0.358 0.414 0.271 1.000 0.119 0.353 0.234 0.326Q47Pre 0.192 0.185 0.241 0.119 1.000 0.345 0.153 0.153Q48Pre 0.446 0.496 0.377 0.353 0.345 1.000 0.230 0.335Q49Pre 0.171 0.227 0.155 0.234 0.153 0.230 1.000 0.355Q50Pre 0.205 0.389 0.186 0.326 0.153 0.335 0.355 1.000
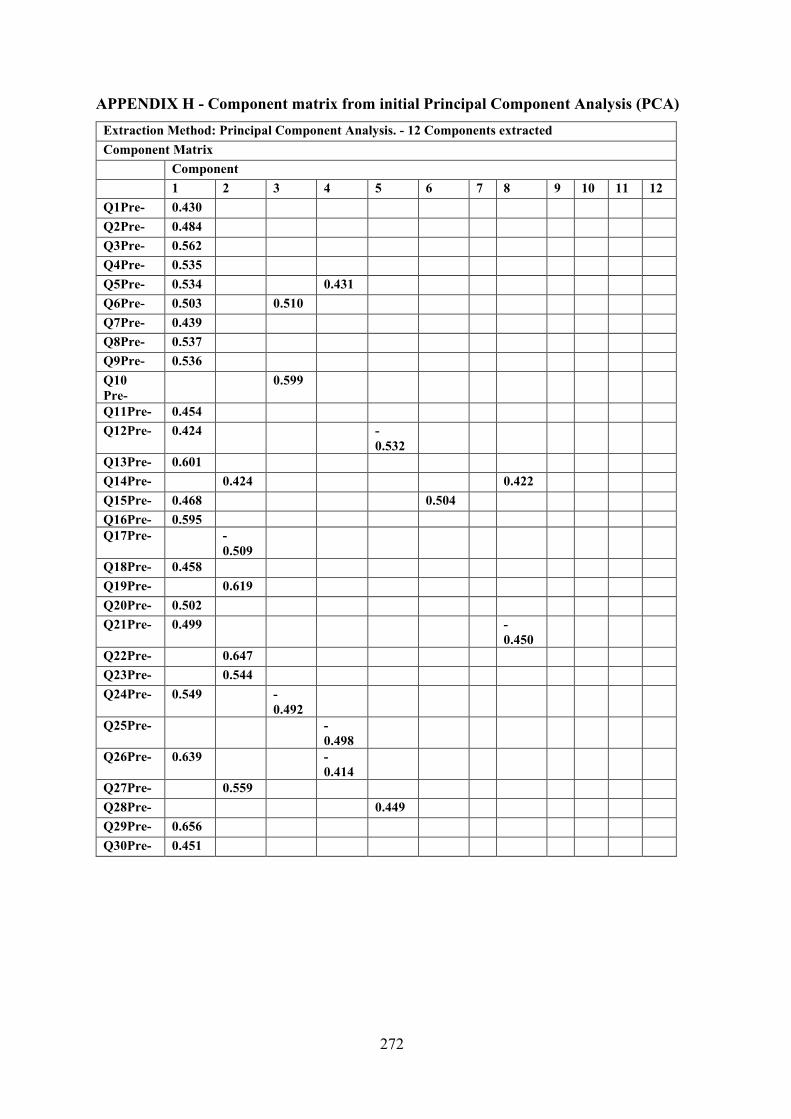
272
APPENDIX H - Component matrix from initial Principal Component Analysis (PCA) Extraction Method: Principal Component Analysis. - 12 Components extracted Component Matrix
Component 1 2 3 4 5 6 7 8 9 10 11 12 Q1Pre- 0.430 Q2Pre- 0.484 Q3Pre- 0.562 Q4Pre- 0.535 Q5Pre- 0.534 0.431 Q6Pre- 0.503 0.510 Q7Pre- 0.439 Q8Pre- 0.537 Q9Pre- 0.536 Q10 Pre-
0.599
Q11Pre- 0.454 Q12Pre- 0.424 -
0.532
Q13Pre- 0.601 Q14Pre- 0.424 0.422 Q15Pre- 0.468 0.504 Q16Pre- 0.595 Q17Pre- -
0.509
Q18Pre- 0.458 Q19Pre- 0.619 Q20Pre- 0.502 Q21Pre- 0.499 -
0.450
Q22Pre- 0.647 Q23Pre- 0.544 Q24Pre- 0.549 -
0.492
Q25Pre- -0.498
Q26Pre- 0.639 -0.414
Q27Pre- 0.559 Q28Pre- 0.449 Q29Pre- 0.656 Q30Pre- 0.451
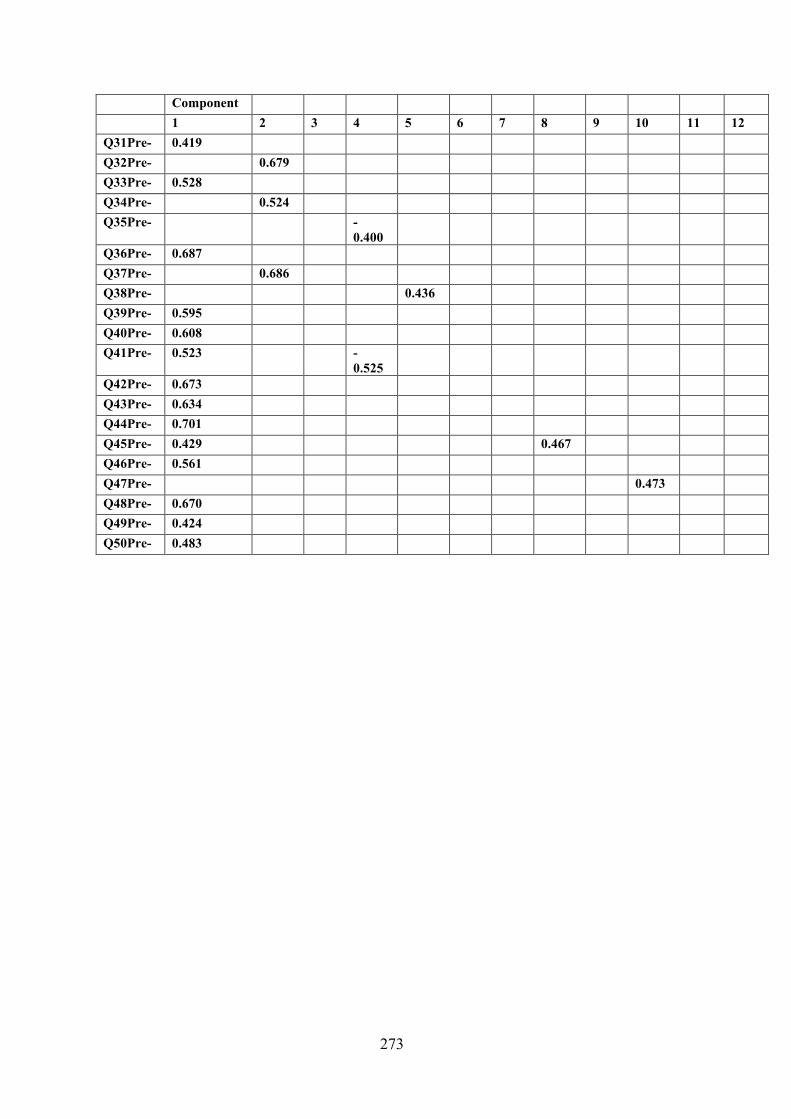
273
Component 1 2 3 4 5 6 7 8 9 10 11 12 Q31Pre- 0.419 Q32Pre- 0.679 Q33Pre- 0.528 Q34Pre- 0.524 Q35Pre- -
0.400
Q36Pre- 0.687 Q37Pre- 0.686 Q38Pre- 0.436 Q39Pre- 0.595 Q40Pre- 0.608 Q41Pre- 0.523 -
0.525
Q42Pre- 0.673 Q43Pre- 0.634 Q44Pre- 0.701 Q45Pre- 0.429 0.467 Q46Pre- 0.561 Q47Pre- 0.473 Q48Pre- 0.670 Q49Pre- 0.424 Q50Pre- 0.483
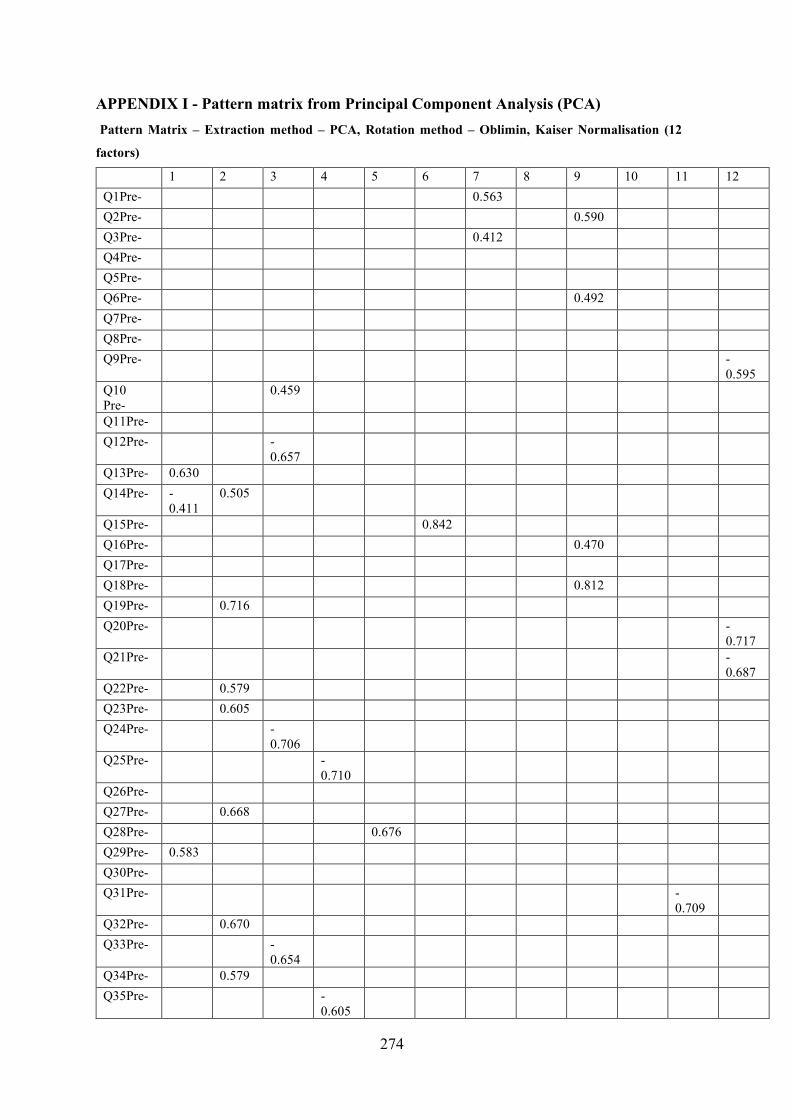
274
APPENDIX I - Pattern matrix from Principal Component Analysis (PCA) Pattern Matrix – Extraction method – PCA, Rotation method – Oblimin, Kaiser Normalisation (12
factors) 1 2 3 4 5 6 7 8 9 10 11 12 Q1Pre- 0.563 Q2Pre- 0.590 Q3Pre- 0.412 Q4Pre- Q5Pre- Q6Pre- 0.492 Q7Pre- Q8Pre- Q9Pre- -
0.595 Q10 Pre-
0.459
Q11Pre- Q12Pre- -
0.657
Q13Pre- 0.630 Q14Pre- -
0.411 0.505
Q15Pre- 0.842 Q16Pre- 0.470 Q17Pre- Q18Pre- 0.812 Q19Pre- 0.716 Q20Pre- -
0.717 Q21Pre- -
0.687 Q22Pre- 0.579 Q23Pre- 0.605 Q24Pre- -
0.706
Q25Pre- -0.710
Q26Pre- Q27Pre- 0.668 Q28Pre- 0.676 Q29Pre- 0.583 Q30Pre- Q31Pre- -
0.709
Q32Pre- 0.670 Q33Pre- -
0.654
Q34Pre- 0.579 Q35Pre- -
0.605
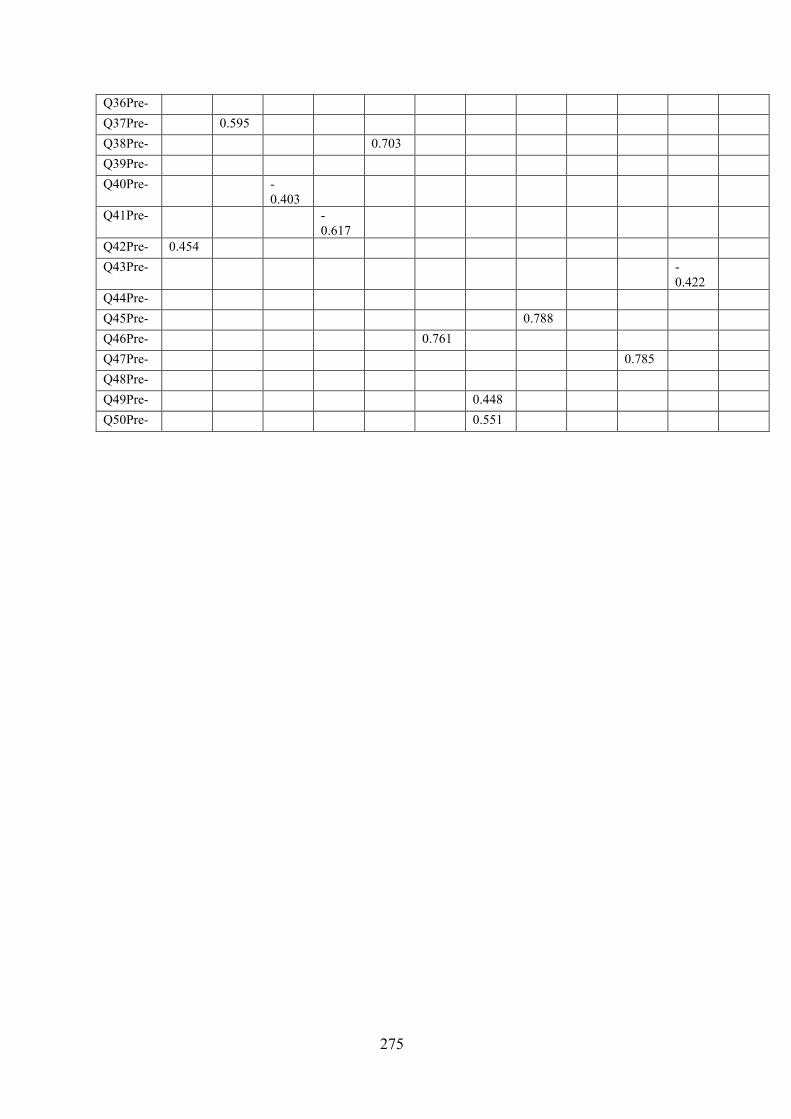
275
Q36Pre- Q37Pre- 0.595 Q38Pre- 0.703 Q39Pre- Q40Pre- -
0.403
Q41Pre- -0.617
Q42Pre- 0.454 Q43Pre- -
0.422
Q44Pre- Q45Pre- 0.788 Q46Pre- 0.761 Q47Pre- 0.785 Q48Pre- Q49Pre- 0.448 Q50Pre- 0.551
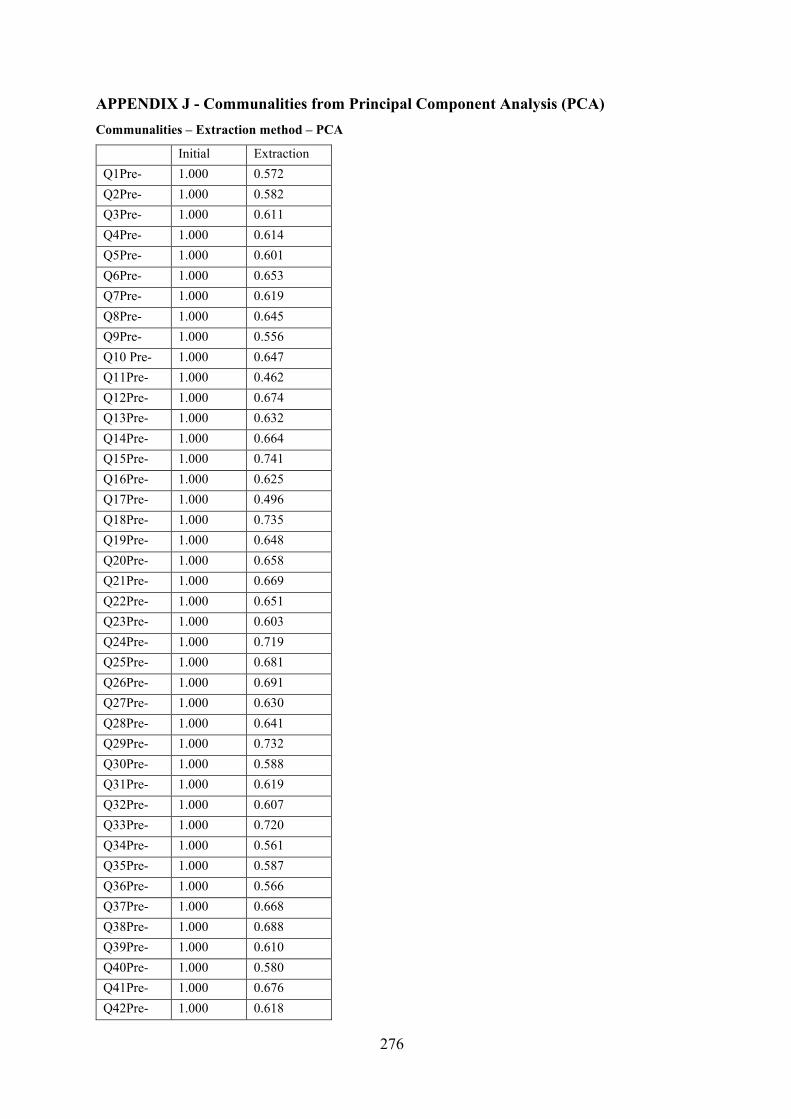
276
APPENDIX J - Communalities from Principal Component Analysis (PCA) Communalities – Extraction method – PCA
Initial Extraction Q1Pre- 1.000 0.572 Q2Pre- 1.000 0.582 Q3Pre- 1.000 0.611 Q4Pre- 1.000 0.614 Q5Pre- 1.000 0.601 Q6Pre- 1.000 0.653 Q7Pre- 1.000 0.619 Q8Pre- 1.000 0.645 Q9Pre- 1.000 0.556 Q10 Pre- 1.000 0.647 Q11Pre- 1.000 0.462 Q12Pre- 1.000 0.674 Q13Pre- 1.000 0.632 Q14Pre- 1.000 0.664 Q15Pre- 1.000 0.741 Q16Pre- 1.000 0.625 Q17Pre- 1.000 0.496 Q18Pre- 1.000 0.735 Q19Pre- 1.000 0.648 Q20Pre- 1.000 0.658 Q21Pre- 1.000 0.669 Q22Pre- 1.000 0.651 Q23Pre- 1.000 0.603 Q24Pre- 1.000 0.719 Q25Pre- 1.000 0.681 Q26Pre- 1.000 0.691 Q27Pre- 1.000 0.630 Q28Pre- 1.000 0.641 Q29Pre- 1.000 0.732 Q30Pre- 1.000 0.588 Q31Pre- 1.000 0.619 Q32Pre- 1.000 0.607 Q33Pre- 1.000 0.720 Q34Pre- 1.000 0.561 Q35Pre- 1.000 0.587 Q36Pre- 1.000 0.566 Q37Pre- 1.000 0.668 Q38Pre- 1.000 0.688 Q39Pre- 1.000 0.610 Q40Pre- 1.000 0.580 Q41Pre- 1.000 0.676 Q42Pre- 1.000 0.618

277
Q43Pre- 1.000 0.678 Q44Pre- 1.000 0.648 Q45Pre- 1.000 0.684 Q46Pre- 1.000 0.698 Q47Pre- 1.000 0.703 Q48Pre- 1.000 0.601 Q49Pre- 1.000 0.531 Q50Pre- 1.000 0.606
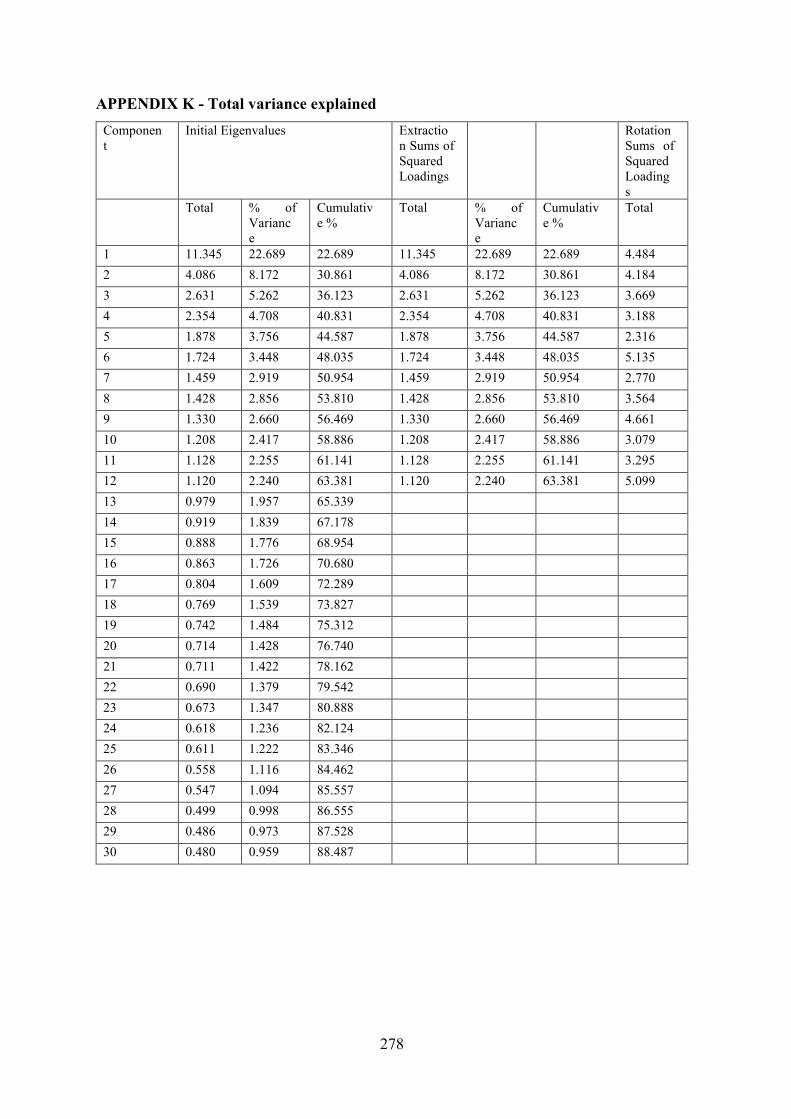
278
APPENDIX K - Total variance explained Component
Initial Eigenvalues Extraction Sums of Squared Loadings
Rotation Sums of Squared Loadings
Total % of Variance
Cumulative %
Total % of Variance
Cumulative %
Total
1 11.345 22.689 22.689 11.345 22.689 22.689 4.484 2 4.086 8.172 30.861 4.086 8.172 30.861 4.184 3 2.631 5.262 36.123 2.631 5.262 36.123 3.669 4 2.354 4.708 40.831 2.354 4.708 40.831 3.188 5 1.878 3.756 44.587 1.878 3.756 44.587 2.316 6 1.724 3.448 48.035 1.724 3.448 48.035 5.135 7 1.459 2.919 50.954 1.459 2.919 50.954 2.770 8 1.428 2.856 53.810 1.428 2.856 53.810 3.564 9 1.330 2.660 56.469 1.330 2.660 56.469 4.661 10 1.208 2.417 58.886 1.208 2.417 58.886 3.079 11 1.128 2.255 61.141 1.128 2.255 61.141 3.295 12 1.120 2.240 63.381 1.120 2.240 63.381 5.099 13 0.979 1.957 65.339 14 0.919 1.839 67.178 15 0.888 1.776 68.954 16 0.863 1.726 70.680 17 0.804 1.609 72.289 18 0.769 1.539 73.827 19 0.742 1.484 75.312 20 0.714 1.428 76.740 21 0.711 1.422 78.162 22 0.690 1.379 79.542 23 0.673 1.347 80.888 24 0.618 1.236 82.124 25 0.611 1.222 83.346 26 0.558 1.116 84.462 27 0.547 1.094 85.557 28 0.499 0.998 86.555 29 0.486 0.973 87.528 30 0.480 0.959 88.487
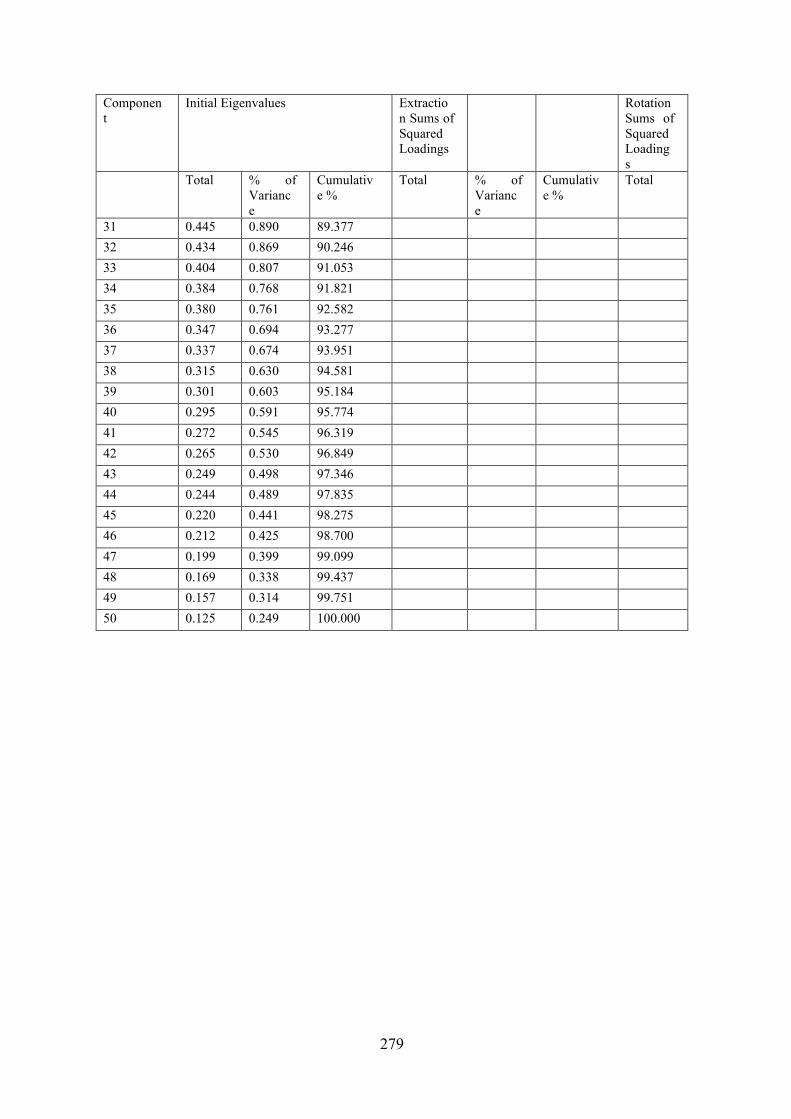
279
Component
Initial Eigenvalues Extraction Sums of Squared Loadings
Rotation Sums of Squared Loadings
Total % of Variance
Cumulative %
Total % of Variance
Cumulative %
Total
31 0.445 0.890 89.377 32 0.434 0.869 90.246 33 0.404 0.807 91.053 34 0.384 0.768 91.821 35 0.380 0.761 92.582 36 0.347 0.694 93.277 37 0.337 0.674 93.951 38 0.315 0.630 94.581 39 0.301 0.603 95.184 40 0.295 0.591 95.774 41 0.272 0.545 96.319 42 0.265 0.530 96.849 43 0.249 0.498 97.346 44 0.244 0.489 97.835 45 0.220 0.441 98.275 46 0.212 0.425 98.700 47 0.199 0.399 99.099 48 0.169 0.338 99.437 49 0.157 0.314 99.751 50 0.125 0.249 100.000
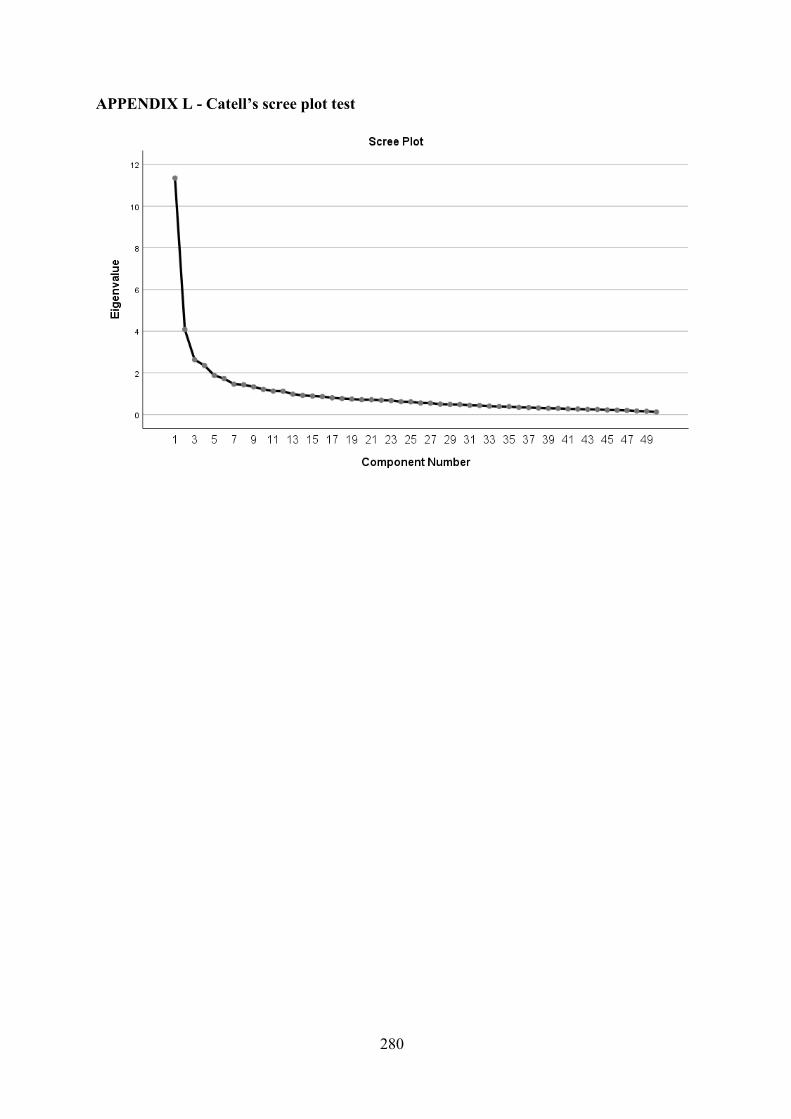
280
APPENDIX L - Catell’s scree plot test
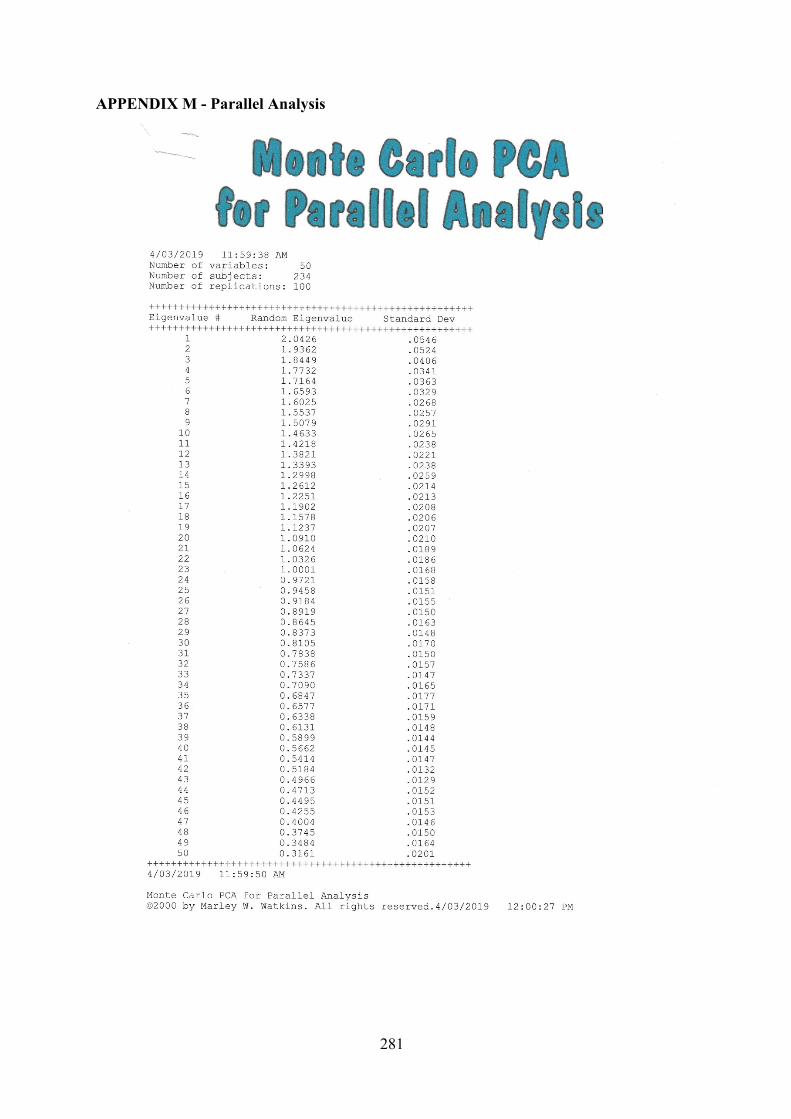
281
APPENDIX M - Parallel Analysis
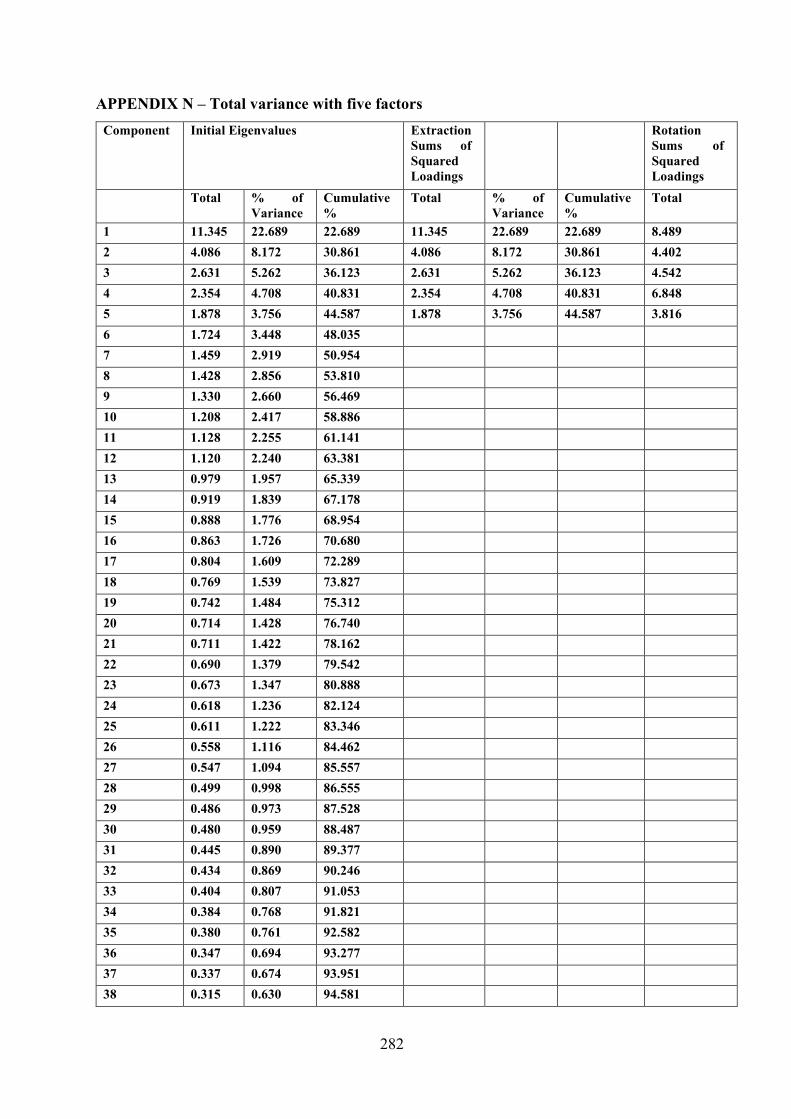
282
APPENDIX N – Total variance with five factors Component Initial Eigenvalues Extraction
Sums of Squared Loadings
Rotation Sums of Squared Loadings
Total % of Variance
Cumulative %
Total % of Variance
Cumulative %
Total
1 11.345 22.689 22.689 11.345 22.689 22.689 8.489 2 4.086 8.172 30.861 4.086 8.172 30.861 4.402 3 2.631 5.262 36.123 2.631 5.262 36.123 4.542 4 2.354 4.708 40.831 2.354 4.708 40.831 6.848 5 1.878 3.756 44.587 1.878 3.756 44.587 3.816 6 1.724 3.448 48.035 7 1.459 2.919 50.954 8 1.428 2.856 53.810 9 1.330 2.660 56.469 10 1.208 2.417 58.886 11 1.128 2.255 61.141 12 1.120 2.240 63.381 13 0.979 1.957 65.339 14 0.919 1.839 67.178 15 0.888 1.776 68.954 16 0.863 1.726 70.680 17 0.804 1.609 72.289 18 0.769 1.539 73.827 19 0.742 1.484 75.312 20 0.714 1.428 76.740 21 0.711 1.422 78.162 22 0.690 1.379 79.542 23 0.673 1.347 80.888 24 0.618 1.236 82.124 25 0.611 1.222 83.346 26 0.558 1.116 84.462 27 0.547 1.094 85.557 28 0.499 0.998 86.555 29 0.486 0.973 87.528 30 0.480 0.959 88.487 31 0.445 0.890 89.377 32 0.434 0.869 90.246 33 0.404 0.807 91.053 34 0.384 0.768 91.821 35 0.380 0.761 92.582 36 0.347 0.694 93.277 37 0.337 0.674 93.951 38 0.315 0.630 94.581
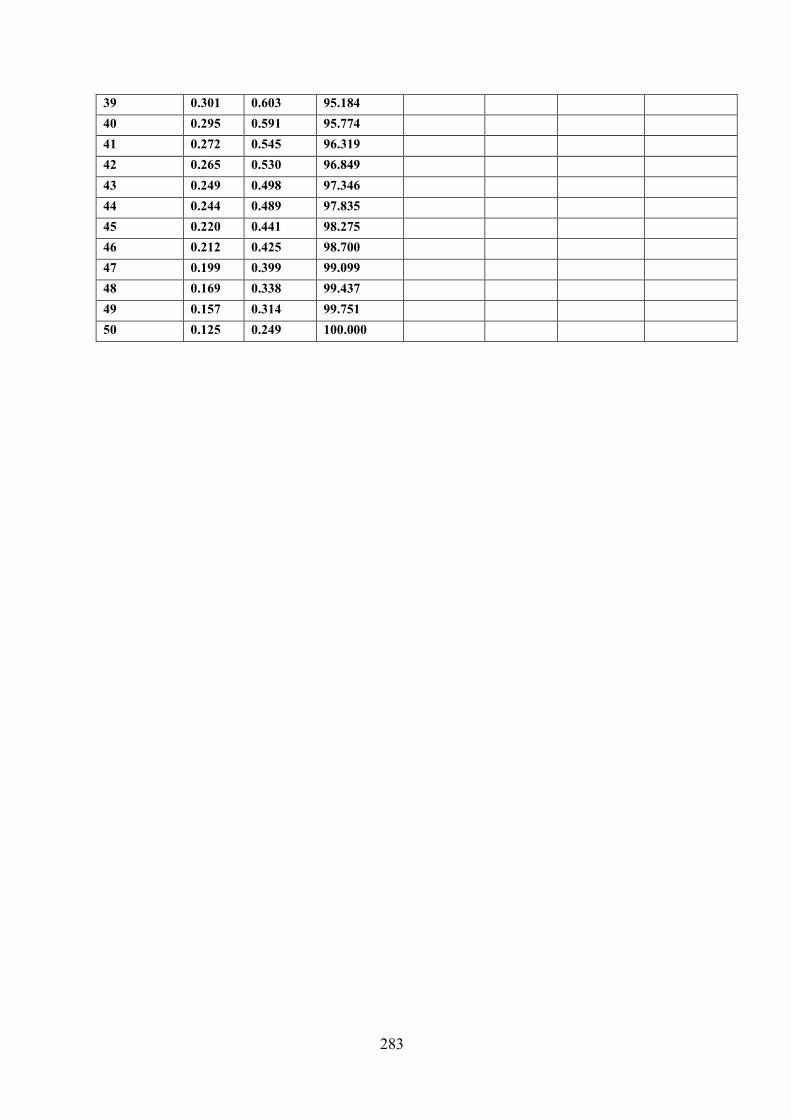
283
39 0.301 0.603 95.184 40 0.295 0.591 95.774 41 0.272 0.545 96.319 42 0.265 0.530 96.849 43 0.249 0.498 97.346 44 0.244 0.489 97.835 45 0.220 0.441 98.275 46 0.212 0.425 98.700 47 0.199 0.399 99.099 48 0.169 0.338 99.437 49 0.157 0.314 99.751 50 0.125 0.249 100.000
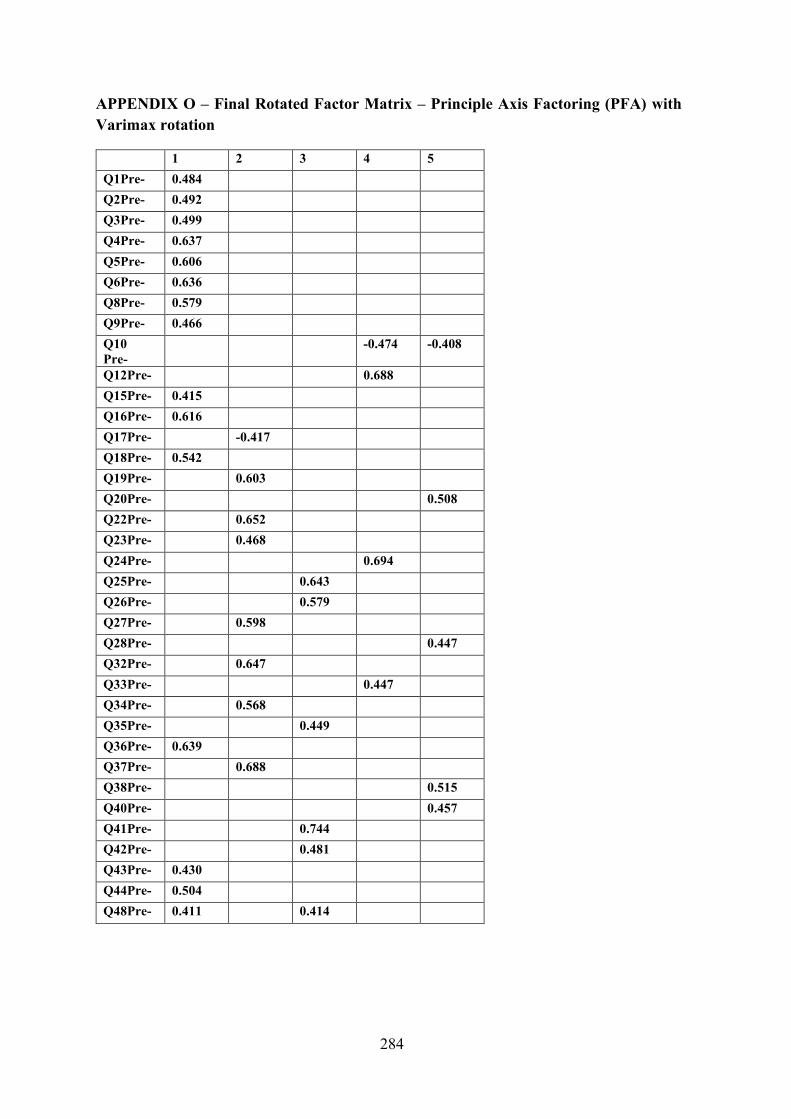
284
APPENDIX O – Final Rotated Factor Matrix – Principle Axis Factoring (PFA) with Varimax rotation
1 2 3 4 5 Q1Pre- 0.484 Q2Pre- 0.492 Q3Pre- 0.499 Q4Pre- 0.637 Q5Pre- 0.606 Q6Pre- 0.636 Q8Pre- 0.579 Q9Pre- 0.466 Q10 Pre-
-0.474 -0.408
Q12Pre- 0.688 Q15Pre- 0.415 Q16Pre- 0.616 Q17Pre- -0.417 Q18Pre- 0.542 Q19Pre- 0.603 Q20Pre- 0.508 Q22Pre- 0.652 Q23Pre- 0.468 Q24Pre- 0.694 Q25Pre- 0.643 Q26Pre- 0.579 Q27Pre- 0.598 Q28Pre- 0.447 Q32Pre- 0.647 Q33Pre- 0.447 Q34Pre- 0.568 Q35Pre- 0.449 Q36Pre- 0.639 Q37Pre- 0.688 Q38Pre- 0.515 Q40Pre- 0.457 Q41Pre- 0.744 Q42Pre- 0.481 Q43Pre- 0.430 Q44Pre- 0.504 Q48Pre- 0.411 0.414
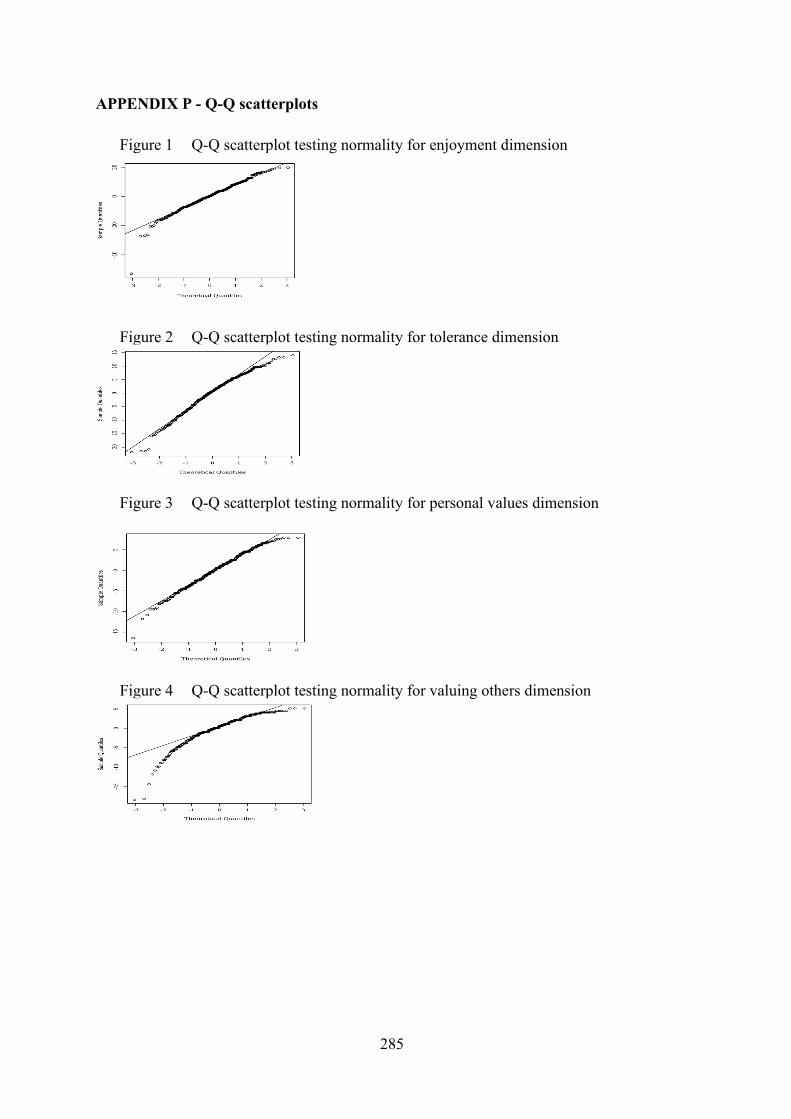
285
APPENDIX P - Q-Q scatterplots
Figure 1 Q-Q scatterplot testing normality for enjoyment dimension
Figure 2 Q-Q scatterplot testing normality for tolerance dimension
Figure 3 Q-Q scatterplot testing normality for personal values dimension
Figure 4 Q-Q scatterplot testing normality for valuing others dimension
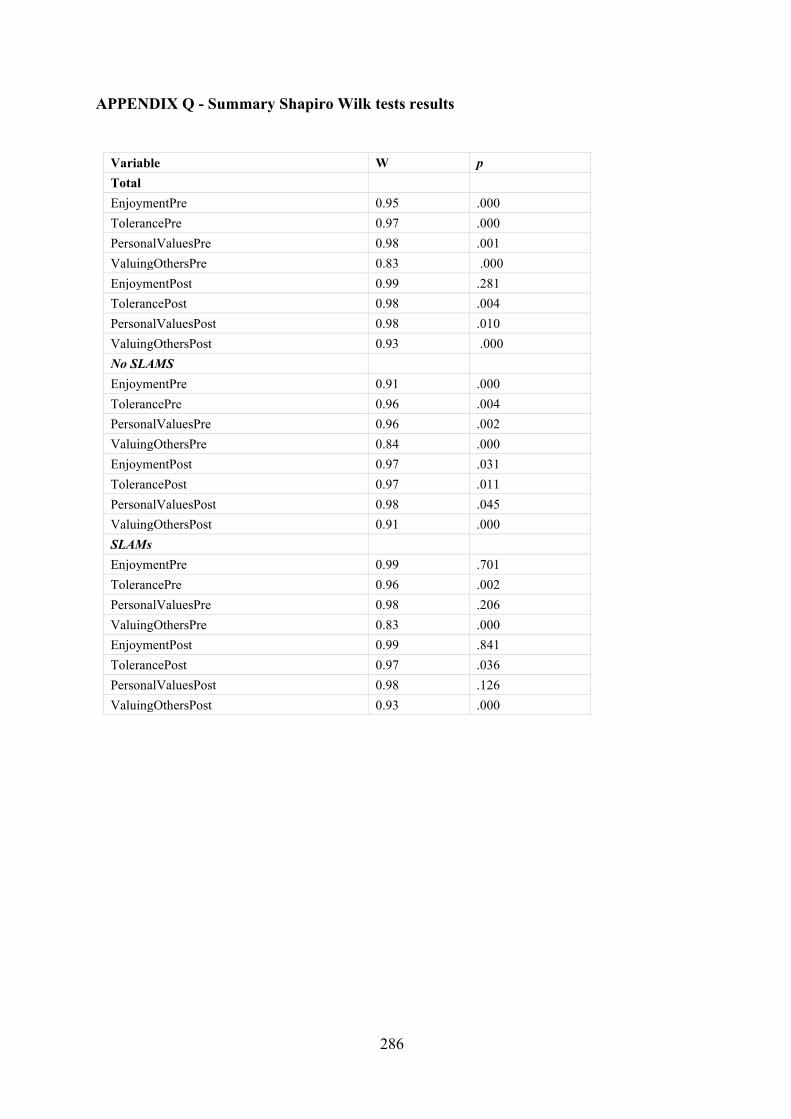
286
APPENDIX Q - Summary Shapiro Wilk tests results
Variable W p Total EnjoymentPre 0.95 .000 TolerancePre 0.97 .000 PersonalValuesPre 0.98 .001 ValuingOthersPre 0.83 .000 EnjoymentPost 0.99 .281 TolerancePost 0.98 .004 PersonalValuesPost 0.98 .010 ValuingOthersPost 0.93 .000 No SLAMS EnjoymentPre 0.91 .000 TolerancePre 0.96 .004 PersonalValuesPre 0.96 .002 ValuingOthersPre 0.84 .000 EnjoymentPost 0.97 .031 TolerancePost 0.97 .011 PersonalValuesPost 0.98 .045 ValuingOthersPost 0.91 .000 SLAMs EnjoymentPre 0.99 .701 TolerancePre 0.96 .002 PersonalValuesPre 0.98 .206 ValuingOthersPre 0.83 .000 EnjoymentPost 0.99 .841 TolerancePost 0.97 .036 PersonalValuesPost 0.98 .126 ValuingOthersPost 0.93 .000
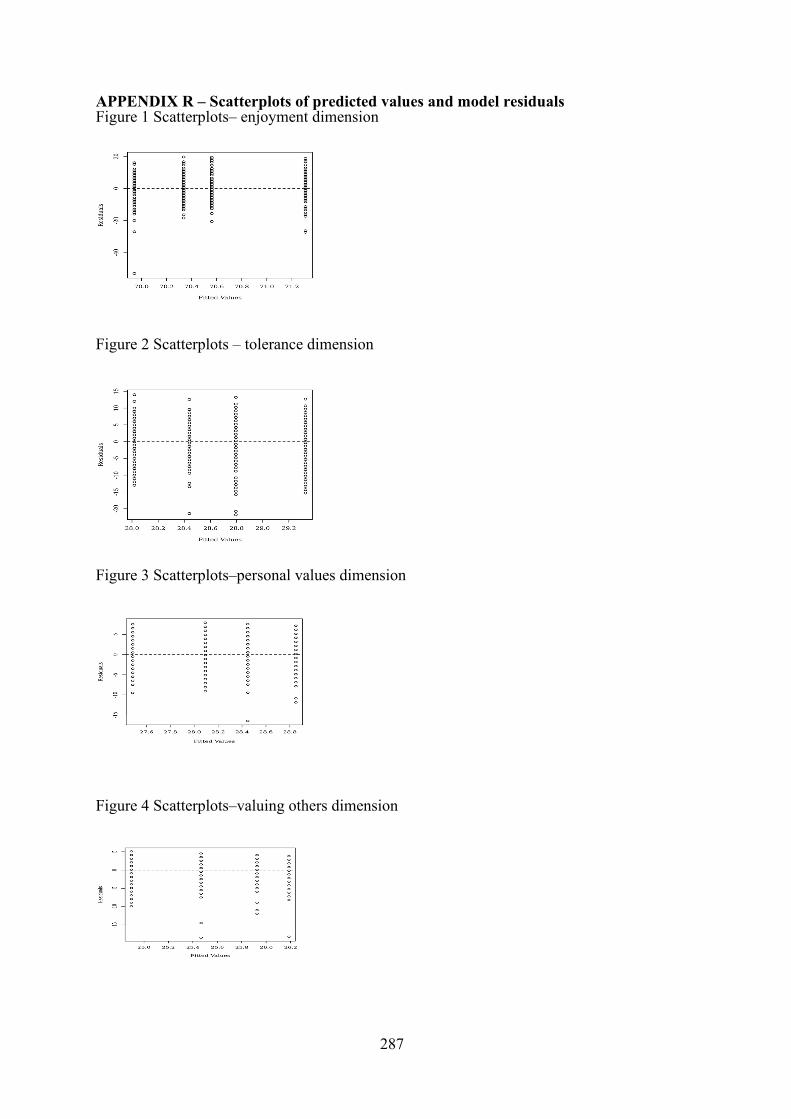
287
APPENDIX R – Scatterplots of predicted values and model residuals Figure 1 Scatterplots– enjoyment dimension
Figure 2 Scatterplots – tolerance dimension
Figure 3 Scatterplots–personal values dimension
Figure 4 Scatterplots–valuing others dimension
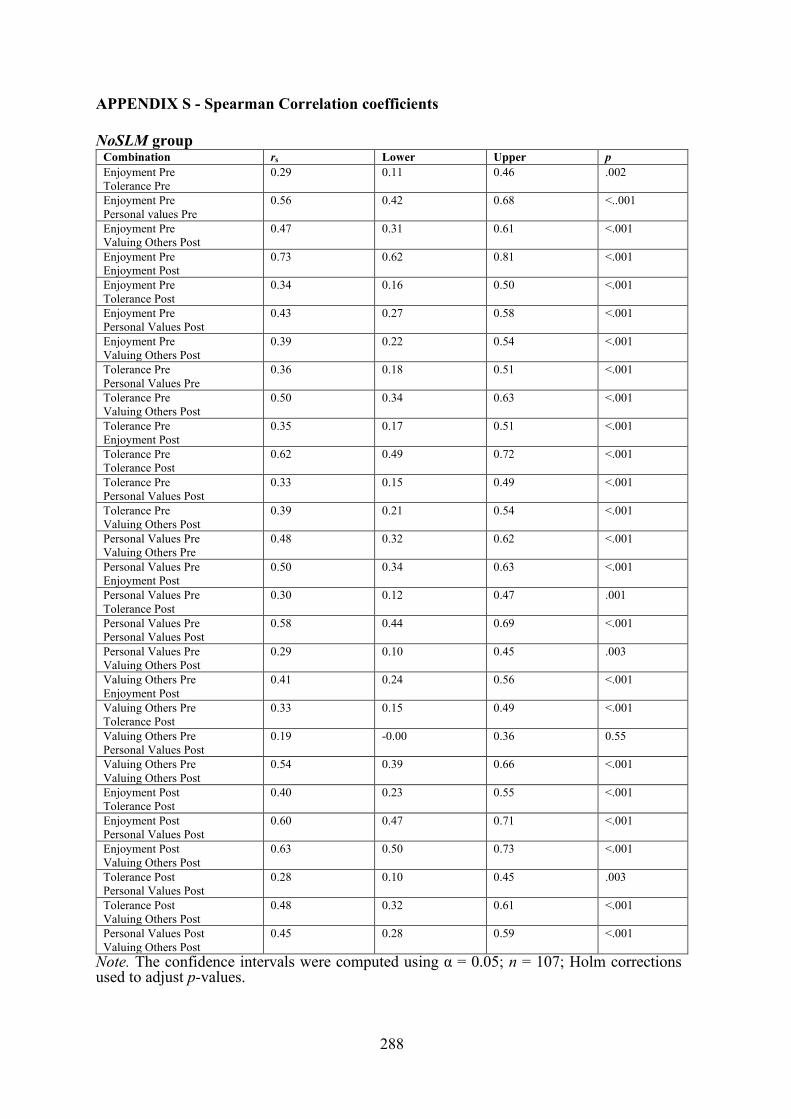
288
APPENDIX S - Spearman Correlation coefficients NoSLM group
Combination rs Lower Upper p Enjoyment Pre Tolerance Pre
0.29 0.11 0.46 .002
Enjoyment Pre Personal values Pre
0.56 0.42 0.68 <..001
Enjoyment Pre Valuing Others Post
0.47 0.31 0.61 <.001
Enjoyment Pre Enjoyment Post
0.73 0.62 0.81 <.001
Enjoyment Pre Tolerance Post
0.34 0.16 0.50 <.001
Enjoyment Pre Personal Values Post
0.43 0.27 0.58 <.001
Enjoyment Pre Valuing Others Post
0.39 0.22 0.54 <.001
Tolerance Pre Personal Values Pre
0.36 0.18 0.51 <.001
Tolerance Pre Valuing Others Post
0.50 0.34 0.63 <.001
Tolerance Pre Enjoyment Post
0.35 0.17 0.51 <.001
Tolerance Pre Tolerance Post
0.62 0.49 0.72 <.001
Tolerance Pre Personal Values Post
0.33 0.15 0.49 <.001
Tolerance Pre Valuing Others Post
0.39 0.21 0.54 <.001
Personal Values Pre Valuing Others Pre
0.48 0.32 0.62 <.001
Personal Values Pre Enjoyment Post
0.50 0.34 0.63 <.001
Personal Values Pre Tolerance Post
0.30 0.12 0.47 .001
Personal Values Pre Personal Values Post
0.58 0.44 0.69 <.001
Personal Values Pre Valuing Others Post
0.29 0.10 0.45 .003
Valuing Others Pre Enjoyment Post
0.41 0.24 0.56 <.001
Valuing Others Pre Tolerance Post
0.33 0.15 0.49 <.001
Valuing Others Pre Personal Values Post
0.19 -0.00 0.36 0.55
Valuing Others Pre Valuing Others Post
0.54 0.39 0.66 <.001
Enjoyment Post Tolerance Post
0.40 0.23 0.55 <.001
Enjoyment Post Personal Values Post
0.60 0.47 0.71 <.001
Enjoyment Post Valuing Others Post
0.63 0.50 0.73 <.001
Tolerance Post Personal Values Post
0.28 0.10 0.45 .003
Tolerance Post Valuing Others Post
0.48 0.32 0.61 <.001
Personal Values Post Valuing Others Post
0.45 0.28 0.59 <.001
Note. The confidence intervals were computed using α = 0.05; n = 107; Holm corrections used to adjust p-values.
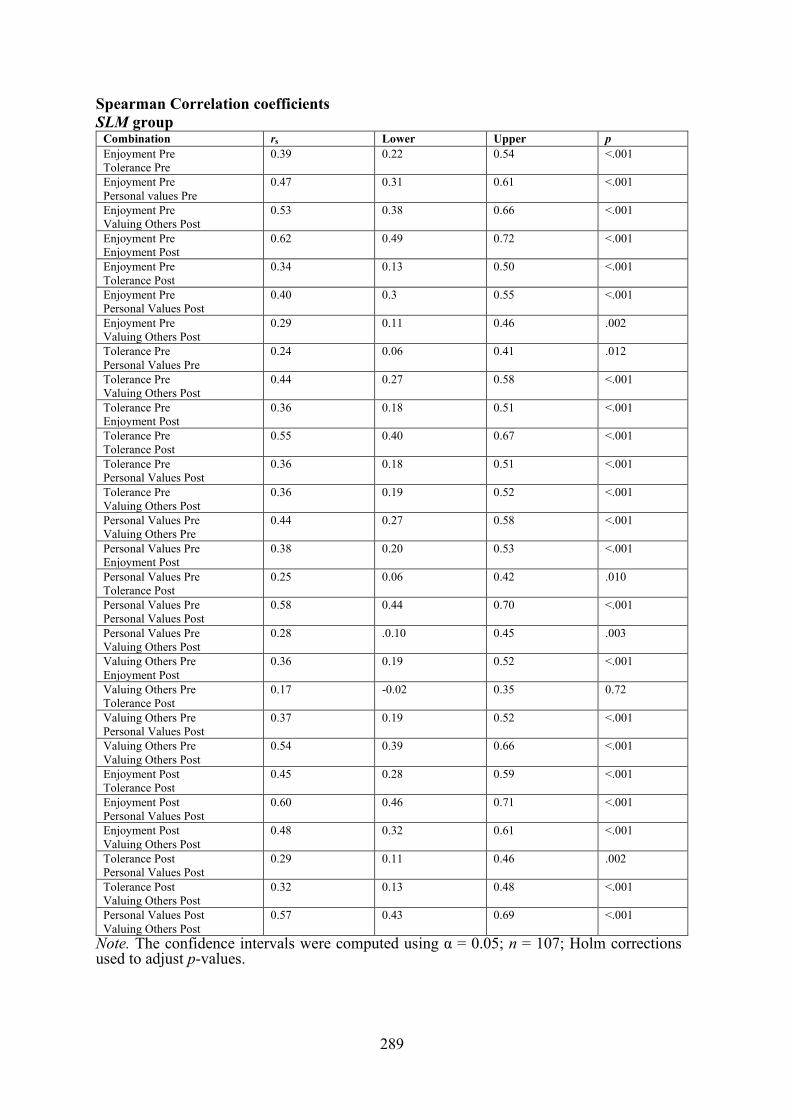
289
Spearman Correlation coefficients SLM group
Combination rs Lower Upper p Enjoyment Pre Tolerance Pre
0.39 0.22 0.54 <.001
Enjoyment Pre Personal values Pre
0.47 0.31 0.61 <.001
Enjoyment Pre Valuing Others Post
0.53 0.38 0.66 <.001
Enjoyment Pre Enjoyment Post
0.62 0.49 0.72 <.001
Enjoyment Pre Tolerance Post
0.34 0.13 0.50 <.001
Enjoyment Pre Personal Values Post
0.40 0.3 0.55 <.001
Enjoyment Pre Valuing Others Post
0.29 0.11 0.46 .002
Tolerance Pre Personal Values Pre
0.24 0.06 0.41 .012
Tolerance Pre Valuing Others Post
0.44 0.27 0.58 <.001
Tolerance Pre Enjoyment Post
0.36 0.18 0.51 <.001
Tolerance Pre Tolerance Post
0.55 0.40 0.67 <.001
Tolerance Pre Personal Values Post
0.36 0.18 0.51 <.001
Tolerance Pre Valuing Others Post
0.36 0.19 0.52 <.001
Personal Values Pre Valuing Others Pre
0.44 0.27 0.58 <.001
Personal Values Pre Enjoyment Post
0.38 0.20 0.53 <.001
Personal Values Pre Tolerance Post
0.25 0.06 0.42 .010
Personal Values Pre Personal Values Post
0.58 0.44 0.70 <.001
Personal Values Pre Valuing Others Post
0.28 .0.10 0.45 .003
Valuing Others Pre Enjoyment Post
0.36 0.19 0.52 <.001
Valuing Others Pre Tolerance Post
0.17 -0.02 0.35 0.72
Valuing Others Pre Personal Values Post
0.37 0.19 0.52 <.001
Valuing Others Pre Valuing Others Post
0.54 0.39 0.66 <.001
Enjoyment Post Tolerance Post
0.45 0.28 0.59 <.001
Enjoyment Post Personal Values Post
0.60 0.46 0.71 <.001
Enjoyment Post Valuing Others Post
0.48 0.32 0.61 <.001
Tolerance Post Personal Values Post
0.29 0.11 0.46 .002
Tolerance Post Valuing Others Post
0.32 0.13 0.48 <.001
Personal Values Post Valuing Others Post
0.57 0.43 0.69 <.001
Note. The confidence intervals were computed using α = 0.05; n = 107; Holm corrections used to adjust p-values.
Related Documents


![[RELO Andes] Webinar peer coaching & mentoring](https://static.cupdf.com/doc/110x72/55b85f19bb61eb6b708b45fb/relo-andes-webinar-peer-coaching-mentoring.jpg)


