Documents as multiple overlapping windows into a grid of counts Alessandro Perina 1 Nebojsa Jojic 1 Manuele Bicego 2 Andrzej Turski 1 1 Microsoft Corporation, Redmond, WA 2 University of Verona, Italy Abstract In text analysis documents are often represented as disorganized bags of words; models of such count features are typically based on mixing a small number of topics [1,2]. Recently, it has been observed that for many text corpora documents evolve into one another in a smooth way, with some features dropping and new ones being introduced. The counting grid [3] models this spatial metaphor liter- ally: it is a grid of word distributions learned in such a way that a document’s own distribution of features can be modeled as the sum of the histograms found in a window into the grid. The major drawback of this method is that it is essentially a mixture and all the content must be generated by a single contiguous area on the grid. This may be problematic especially for lower dimensional grids. In this paper, we overcome this issue by introducing the Componential Counting Grid which brings the componential nature of topic models to the basic counting grid. We evaluated our approach on document classification and multimodal retrieval obtaining state of the art results on standard benchmarks. 1 Introduction A collection of documents, each consisting of a disorganized bag of words is often modeled compactly using mixture or admixture models, such as Latent Semantic Analysis (LSA) [4] and Latent Dirichlet Allocation (LDA) [1]. The data is represented by a small number of semantically tight topics, and a document is assumed to have a mix of words from an even smaller subset of these topics. There are no strong constraints in how the topics are mixed [5]. Recently, an orthogonal approach emerged: it has been observed that for many text corpora documents evolve into one another in a smooth way, with some words dropping and new ones being introduced. The counting grid model (CG) [3] takes this spatial metaphor – of moving through sources of words and dropping and picking new words – literally: it is multidimensional grid of word distributions, learned in such a way that a document’s own distribution of words can be modeled as the sum of the distributions found in some window into the grid. By using large windows to collate many grid distributions from a large grid, CG model can be a very large mixture without overtraining, as these distributions are highly correlated. LDA model does not have this benefit, and thus has to deal with a smaller number of topics to avoid overtraining. In Fig.1a we show an excerpt of a grid learned from cooking recipes from around the world. Each position in the grid is characterized by a distribution over the words in a vocabulary and for each position we show the 3 words with higher probability whenever they exceed a threshold. The shaded positions, are characterized by the presence, with a non-zero probability, of the word “bake” 1 . On the grid we also show the windows W of size 4 ⇥ 5 for 5 recipes. Nomi (1), an Afghan egg-based bread, is close to the recipe of the usual pugliese bread (2), as indeed they share most of the ingre- dients and procedure and their windows largely overlap. Note how moving from (1) to (2) the word 1 Which may or may not be in the top three 1

Welcome message from author
This document is posted to help you gain knowledge. Please leave a comment to let me know what you think about it! Share it to your friends and learn new things together.
Transcript

Documents as multiple overlapping windows into a
grid of counts
Alessandro Perina
1Nebojsa Jojic
1Manuele Bicego
2Andrzej Turski
1
1Microsoft Corporation, Redmond, WA
2University of Verona, Italy
Abstract
In text analysis documents are often represented as disorganized bags of words;models of such count features are typically based on mixing a small number oftopics [1,2]. Recently, it has been observed that for many text corpora documentsevolve into one another in a smooth way, with some features dropping and newones being introduced. The counting grid [3] models this spatial metaphor liter-ally: it is a grid of word distributions learned in such a way that a document’s owndistribution of features can be modeled as the sum of the histograms found in awindow into the grid. The major drawback of this method is that it is essentiallya mixture and all the content must be generated by a single contiguous area onthe grid. This may be problematic especially for lower dimensional grids. In thispaper, we overcome this issue by introducing the Componential Counting Grid
which brings the componential nature of topic models to the basic counting grid.We evaluated our approach on document classification and multimodal retrievalobtaining state of the art results on standard benchmarks.
1 Introduction
A collection of documents, each consisting of a disorganized bag of words is often modeledcompactly using mixture or admixture models, such as Latent Semantic Analysis (LSA) [4] andLatent Dirichlet Allocation (LDA) [1]. The data is represented by a small number of semanticallytight topics, and a document is assumed to have a mix of words from an even smaller subset of thesetopics. There are no strong constraints in how the topics are mixed [5].Recently, an orthogonal approach emerged: it has been observed that for many text corporadocuments evolve into one another in a smooth way, with some words dropping and new onesbeing introduced. The counting grid model (CG) [3] takes this spatial metaphor – of movingthrough sources of words and dropping and picking new words – literally: it is multidimensionalgrid of word distributions, learned in such a way that a document’s own distribution of words canbe modeled as the sum of the distributions found in some window into the grid. By using largewindows to collate many grid distributions from a large grid, CG model can be a very large mixturewithout overtraining, as these distributions are highly correlated. LDA model does not have thisbenefit, and thus has to deal with a smaller number of topics to avoid overtraining.
In Fig.1a we show an excerpt of a grid learned from cooking recipes from around the world. Eachposition in the grid is characterized by a distribution over the words in a vocabulary and for eachposition we show the 3 words with higher probability whenever they exceed a threshold. The shadedpositions, are characterized by the presence, with a non-zero probability, of the word “bake”1. Onthe grid we also show the windows W of size 4 ⇥ 5 for 5 recipes. Nomi (1), an Afghan egg-basedbread, is close to the recipe of the usual pugliese bread (2), as indeed they share most of the ingre-dients and procedure and their windows largely overlap. Note how moving from (1) to (2) the word
1Which may or may not be in the top three
1

grainrice
cook
typecooker
resultant
goodwant
doesnt
methodusual
however
becausebeings
donttarka white
brandypour
chocolatepeak
mascarpone
gradual
chocolatefol
slowlycleardishrun
startchange
sit
wayindian
try
indianknowgoing
generationtheykept
onlyexcellence
quiteelectric
meringuerum
yolk
beat granulatedcutletpour
gentlypicklift
backfull
persian
mayreheat
vary
usefulgiven
section
lookneeded
completion
storetasty
normalcontainer
airtight
electricextractmixer
vanillaspeeds
wire
beat cakeegg
springformspoonfulcarefully
pour
bottomwooden
procedurespatulaquickly
roundnonstickspread
dosa leastpancaketexture
biscottigriddlealways
crepeairtight
long
almondpeach
rackcinnamon
sugar
butterrind
confectioners alternativepanful
largersideinvert
upside
omeletslideslip
cylinderspatulasecond
logapartment
griddle
cookiebiscuitpretzel
siftgrease
paperparchment
golden
foldpressingmoisten
egg
breadcrumbpanful
crumbbread
toothpickcrumbcrusty
eggbeaten
lightlyaltogether
onenaanturn
handfulincorporate handful
rotidiameter
round
inchtogether
sheet
pastryegg
pressingsheet
border
sidesalt
mixturepourside
browndish mixture
sheetadditional beat sticky
shapebrushdivide
rollrectangle
cutsealedge
edge
sheetplace
removablechives
preheat
minuteovenproof
preheatmiddle sheet
rack
bowlturn
mixerbulk
doughkneadboard
divideshape
surfacetowel
centerform
foldseal
removableplace degree
oven
ovenpreheat bake preheat
baguette
workbowlrise
smootheknead elastic
circledoughcloth
damproundcenter
togetherformleft
squaretrianglraviol
setasidecenter
centerarrangepreheat
oil dishgrease
spraycornmeal
pizzaloaf
surface
loavesdouble
sprinkle
ballyeast
rise
warmball
palm
usefulequalbun
start
bit
workwrapper
linzest
puddinghalf
mixcompletion
coolpour
pattern
coolinsert
traysharp
resemblance
formsurface
looselong
moist
machinebread
feel
startersize
desirableamount
thoroughlykitchenready
amountfeeding
neat
bakeoven
Noni Afghan Bread Brown Bread Ceasar Salad Pizza di NapoliGrecian Chicken
Gyros Pizza
'dough'
'roll' 'ball' 'shape' 'yeast' 'knead' 'rise' 'bread' 'egg'
'dough' 'roll' 'yeast' 'knead' 'shape' 'desirable' 'water' 'divide'
'keep' 'water' 'aside' 'add' 'smoothe' 'minute' 'lukewarm' 'remain'
'fry' 'sauce' 'deep' 'oil' 'hot' 'golden' 'mix'
'lettuce' 'salad' 'slice' 'garnish' 'dressings' 'beans' 'mix'
'cheese' 'place' 'melt' 'basil' 'cover' 'bag' 'broil'
'chicken' 'marinade' 'shallow' 'hot' 'coat' 'refrigeration' 'heat'
'crust' 'evenly' 'spread' 'edge' 'pressing' 'center' 'place' 'feta' 'mixture' 'useful'
a)
b)
Si
Wj
(1)
(2)
(3)
(4)
(5)
[...][...]
[...]
Figure 1: a) A particular of a E = 30 ⇥ 30 componential counting grid ⇡i learned over a corpusof recipes. In each cell we show the 0-3 most probable words greater than a threshold. The areain shaded red has ⇡(
0bake
0) > 0. b) For 6 recipes, we show how their components are mapped
onto this grid. The “mass” of each component (e.g., ✓ see Sec.2) is represented with the windowthickness. For each component c = j in position j, we show the words generated in each windowcz ·
Pj2Wi
⇡j(z)
“egg” is dropped. Moving to the right we encounter the basic pizza (3) whose dough is very simi-lar to the bread’s. Continuing to the right words often associated to desserts like sugar, almond, etcemerge. It is not surprising that baked desserts such as cookies (4), and pastry in general, are mappedhere. Finally further up we encounter other desserts which do not require baking, like tiramisu (5),or chocolate crepes. This is an example of a“topical shift”; others appear in different portions of thefull grid which is included in the additional material.The major drawback of counting grids is that they are essentially a mixture model, assuming onlyone source for all features in the bag and the topology of the space highly constrains the documentmappings resulting in local minima or suboptimal grids. For example, more structured recipes likeGrecian Chicken Gyros Pizza or Tex-Mex pizza would have very low likelihood, as words related tomeat, which is abundant in both, are hard to generate in the baking area where the recipes wouldnaturally goes.
As first contribution we extend here the counting grid model so that each document can be rep-resented by multiple latent windows, rather than just one. In this way, we create a substantiallymore flexible admixture model, the componential counting grid (CCG), which becomes a directgeneralization of LDA as it does allow multiple sources (e.g., the windows) for each bag, in a math-ematically identical way as LDA. But, the equivalent of LDA topics are windows in a counting grid,which allows the model to have a very large number of topics that are highly related, as shift in thegrid only slightly refines any topic.Starting from the same grid just described, we recomputed the mapping of each recipe which nowcan be described by multiple windows, if needed. Fig. 1b shows mappings for some recipes. Alsothe words generated in each component are shown. The three pizzas place most of the mass in thesame area (dough), but the words related to the topping are borrowed from different areas. Anotherexample is the Caesar salad which have a component in the salad/vegetable area, and borrows the
2
croutons from the bread area.By observing Fig.1b, one can also notice how the embedding produced by CCGs yields to a sim-ilarity measure based on the grid usage of each sample. For example, words relative to the threepizzas are generated from windows that overlap, therefore they share words usage and thus they are“similar”. As second contribution we exploited this fact to define a novel generative kernel, whoseperformance largely outperformed similar classification strategies based on LDA’s topic usage [1,2].We evaluated componential counting grids and in particular the kernel, on the 20-Newsgroup dataset[6], on a novel dataset of recipes which we will make available to the community, and on the re-cent “Wikipedia picture of the day” dataset [7]. In all the experiments, CCGs set a new state of theart. Finally, for the first time we explore visualization through examples and videos available in theadditional material.
2 Counting Grids and Componential Counting Grids
Uw
/Tw
c)
T
ln
kn
wn
S
D
N
T D
Z = |Vocabulary|
wn = ‘Pizza’
Skn
ln=(5,3)
kn=ln +(0,3)
Pick
a w
indo
w W
fro
m T
Pick
a lo
catio
n w
ithin
the
win
dow
W
Pick a word from the distribution Sk
b)a)
Figure 2: a) Plate notation representing the CCGmodel. b) CCG generative process for one word:Pick a window from ✓, Pick a position within thewindow, Pick a word. c) Illustration of UW and⇤
W✓ relative to the particular ✓ shown in plate b).
The basic Counting Grid ⇡i is a set of distribu-tions over the vocabulary on the N -dimensionaldiscrete grid indexed by i where each id 2[1 . . . Ed] and E describes the extent of thecounting grid in d dimensions. The index z in-dexes a particular word in the vocabulary z =
[1 . . . Z] being Z the size of the vocabulary. Forexample, ⇡i(
0Pizza
0) is the probability of the
word “Pizza” at the location i. Since ⇡ is a gridof distributions,
Pz ⇡i(z) = 1 everywhere on
the grid. Each bag of words is represented by alist of words {wt}Tt=1 and each word w
tn takes
a value between 1 and Z. In the rest of the pa-per, we will assume that all the samples have Nwords.Counting Grids assume that each bags followa word distribution found somewhere in thecounting grid; in particular, using windows ofdimensions W, a bag can be generated by firstaveraging all counts in the window Wi startingat grid location i and extending in each direc-tion d by Wd grid positions to form the histogram hi(z) =
1Qd Wd
Pj2Wi
⇡j(z), and then generatinga set of features in the bag (see Fig.1a where we used a 3⇥ 4 window). In other words, the positionof the window i in the grid is a latent variable given which we can write the probability of the bagas
p({w}|i) =Y
n
hi,z =
Y
n
�1Qd Wd
·X
j2Wi
⇡j(wn)�,
Relaxing the terminology, E and W are referred to as, respectively, the counting grid and the win-dow size. The ratio of the two volumes, , is called the capacity of the model in terms of anequivalent number of topics, as this is how many non-overlapping windows can be fit onto the grid.Finally, with Wi we indicate the particular window placed at location i.
Componential Counting Grids As seen in the previous section, counting grids generate wordsfrom a distribution in a window W , placed at location i in the grid. Windows close in the gridgenerate similar features because they share many cells: As we move the window on the grid,some new features appear while others are dropped. On the other hand componential models, like[1], represent the standard way of modeling of text corpora. In these models each feature can begenerated by a different source or topic, and documents are then seen as admixtures of topics.Componential counting grids get the best of both worlds: being based on the counting grid geometrythey capture smooth shifts of topics, plus their componential nature, which allows documents to begenerated by several windows (akin to LDA’s topics). The number of windows need not be specifieda-priori.
Componential Counting Grids assumes the following generative process (also illustrated by Fig.2b.)for each document in a corpus:
3

1. Sample the multinomial over the locations ✓ ⇠ Dir(↵)
2. For each of the N words wn
a) Choose a at location ln ⇠ Multinomial(✓) for a window of size W
b) Choose a location within the window Wln ; kn
c) Choose a word wn from ⇡kn
As visible, each word wn is generated from a different window, placed at location ln, but the choiceof the window follows the same prior distributions ✓ for all words. It worth noticing that whenW = 1⇥ 1, ln = kn and the model becomes Latent Dirichlet Allocation.The Bayesian network is shown in Fig.2a) and it defines the following joint probability distribution
P =
Y
t,n
X
ln
X
kn
p(wn|kn,⇡) · p(kn|ln) · p(ln|✓) · p(✓|↵) (1)
where p(wn = z|kn = i,⇡) = ⇡i(z) is a multinomial over the vocabulary, p(kn = i|ln = k) =
U
W(i � k) is a distribution over the grid locations, with U
W uniform and equal to (
1|W | ) in the
upper left window of size W and 0 elsewhere (See Fig.2c). Finally p(ln|✓) = ✓(l) is the priordistribution over the windows location, and p(✓|↵) = Dir(✓;↵) is a Dirichlet distribution ofparameters ↵.
Since the posterior distribution p(k, l, ✓|w,⇡,↵) is intractable for exact inference, we learned themodel using variational inference [8].We firstly introduced the posterior distributions q, approximating the true posterior as qt(k, l, ✓) =q
t(✓) ·Qn
�q
t(kn) · qt(ln)
�being q(kn) and q(ln) multinomials over the locations, and q(✓) a Dirac
function centered at the optimal value ˆ
✓.Then by bounding (variationally) the non-constant part of logP , we can write the negative freeenergy F , and use the iterative variational EM algorithm to optimize it.
logP � �F =
X
t
⇣X
n
� X
ln,kn
q
t(kn) ·qt(ln) · log ⇡kn(wn) ·UW
(kn� ln) ·✓ln ·p(✓|↵)��H(q
t)
⌘
(2)where H(q) is the entropy of the distribution q.Minimization of Eq. 2 reduces in the following update rules:
q
t(kn = i) / ⇡i(wn) · exp
⇣ X
ln=j
q
t(ln = j) · logUW
(i� j)⌘
(3)
q
t(ln = i) / ✓
t(i) · exp
⇣ X
kn=j
q
t(kn = j) · logUW
(j� i)⌘
(4)
✓
t(i) / ↵i � 1 +
X
n
q
t(ln = i) (5)
⇡i(z) /X
t
X
n
q
t(kn = i)[wn=z] (6)
where [wn = z] is an indicator function, equal to 1 when wn is equal to z. Finally, the parameters ↵of the Dirichlet prior can be either kept fixed [9] or learned using standard techniques [10].
The minimization procedure described by Eqs.3-6 can be carried out efficiently in O(N logN)
time using FFTs [11].
Some simple mathematical manipulations of Eq.1 can yield to a speed up. In fact, from Eq.1 onecan marginalize the variable ln
P =
Y
t,n
X
ln=i,kn=j
p(wn|kn = j) · p(kn = j|ln = i) · p(ln = i|✓) · p(✓|↵)
=
Y
t,n
X
ln=i,kn=j
⇡j(wn) · UW(j� i) · ✓(i) · p(✓(i)|↵i)
=
Y
t,n
X
kn=j
⇡j(wn) ·⇣ X
ln=i
U
W(j� i) · ✓(i)
⌘· p(✓(i)|↵i) =
Y
t,n
X
kn=j
⇡j(wn) · ⇤W✓t · p(✓(i)|↵i)(7)
4

where ⇤
W✓ is a distribution over the grid locations, equal to the convolution of UW with ✓. The
update for q(k) becomesq
t(kn = i) / ⇡i(wn) · ⇤W
✓ (i) (8)In the same way, we can marginalize the variable kn
P =
Y
t,n
X
ln=i
✓(i) ·⇣ X
kn=j
U
W(j� i) ·⇡j(wn)
⌘·p(✓(i)|↵i) =
Y
t,n
X
ln=i
✓(i) ·hi(wn) ·p(✓(i)|↵i) (9)
to obtain the new update for qt(ln)
q
t(ln = i) / hi(wn) · ✓t(i) (10)
where hi is the feature distribution in a window centered at location i, which can be efficientlycomputed in linear time using cumulative sums [3]. Eq.10 highlights further relationships betweenCCGs and LDA: CCGs can be thought as an LDA model whose topics live on the space definedby the counting grids geometry. The new updates for the cell distribution q(k) and the windowdistribution q(l), require only a single convolution and, more importantly, they don’t directly dependon each other. The model becomes more efficient and has a faster convergence. This is very criticalespecially when we are analyzing big text corpora.The most similar generative model to CCG comes from the statistic community. Dunson et al. [12]worked on sources positioned in a plane at real-valued locations, with the idea that sources withina radius would be combined to produce topics in an LDA-like model. They used an expensivesampling algorithm that aimed at moving the sources in the plane and determining the circularwindow size. The grid placement of sources of CCG yields much more efficient algorithms anddenser packing.
2.1 A Kernel based on CCG embedding
Hybrid generative discriminative classification paradigms have been shown to be a practical andeffective way to get the best of both worlds in approaching classification [13–15]. In the context oftopic models a simple but effective kernel is defined as the product of the topic proportions of eachdocument. This kernel measures the similarity between topic usage of each sample and it proved tobe effective on several tasks [15–17]. Despite CCG’s ✓s, the locations proportions, can be thoughtas LDA’s, we propose another kernel, which exploits exactly the same geometric reasoning of theunderlying generative model. We observe in fact that by construction, each point in the grid dependsby its neighborhood, defined by W and this information is not captured using ✓, but using ⇤
W✓
which is defined by spreading ✓ in the appropriate window (Eq.7).More formally, given two samples t and u, we define a kernel based on CCG embedding as
K(t, u) =
X
i
S(⇤W✓t (i),⇤W
✓u(i)) where ⇤
W✓ (i) =
X
j
U
W(i� j) · ✓(j) (11)
where S(·, ·) is any similarity measure which defines a kernel.In our experiments we considered the simple product, even if other measures, such as histogramintersection can be used. The final kernel turns to be (⇥ is the dot-product)
KLN (t, u) =
X
i
⇤
W✓t (i) · ⇤W
✓u(i) = Tr
�⇤
W✓t ⇥ ⇤
W✓u
�(12)
3 Experiments
Although our model is fairly simple, it is still has multiple aspects that can be evaluated. As agenerative model, it can be evaluated in left-out likelihood tests. Its latent structure, as in other gen-erative models, can be evaluated as input to classification algorithms. Finally, as both its parametersand the latent variables live in a compact space of dimensionality and size chosen by the user, ourlearning algorithm can be evaluated as an embedding method that yields itself to data visualizationapplications. As the latter two have been by far the more important sets of metrics when it comes toreal-world applications, our experiments focus on them.In all the tests we considered squared grids of size E = [40⇥ 40,50⇥ 50, . . . ,90⇥ 90] and win-dows of size W = [2⇥2,4⇥4, . . . ,8⇥8]. A variety of other methods are occasionally comparedto, with slightly different evaluation methods described in individual subsections, when appropriate.
5
0 0.2 0.4 0.6 0.8 10
0.2
0.4
0.6
0.8
1
Percentage
Erro
r rat
e
Capacity N�/ No. Topics
Clas
sific
atio
n Ac
cura
cyCl
assif
icat
ion
Accu
racy
Correspondence LDA
LDA + Discr. Classifier
Multimodal Random Field model
Componential Counting Grid
a) “Same”-20 NewsGroup Results
b) Mastercook Recipes Results
c) Wikipedia Picture of the Day Results
101 10265
70
75
80
85
90
101 10220
30
40
50
60
70
80
Counting Grid (q(l) )LDA (T)
Componential Counting Grid (/) Componential Counting Grid (T)
Capacity N�/ No. Topics
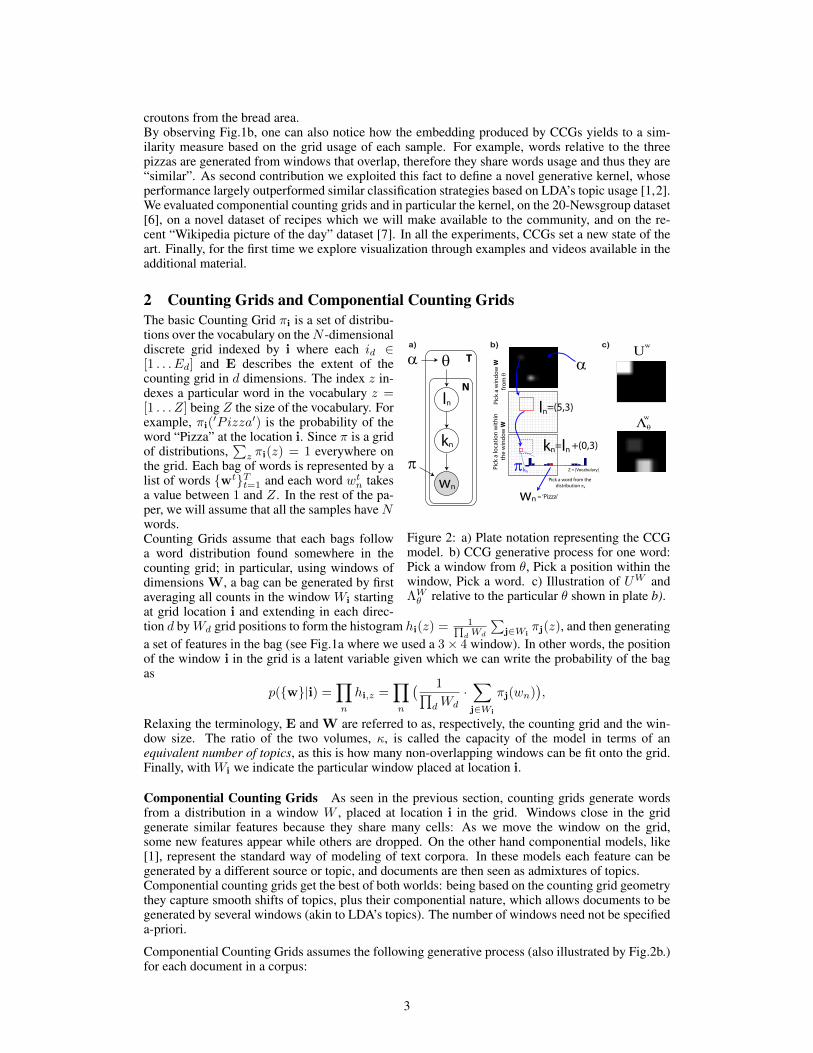
Figure 3: a-b) Results for the text classification tasks. The Mastercook recipes dataset is availableon www.alessandroperina.com. We represented the grid size E using gray levels (see thetext). c) Wikipedia Picture of the day result: average Error rate as a function of the percentage ofthe ranked list considered for retrieval. Curves closer to the axes represents better performances.
Document Classification We compared componential counting grids (CCGs) with counting grids[3] (CGs), latent Dirichlet allocation [1] (LDA) and the spherical admixture model [2] (SAM), fol-lowing the validation paradigm previously used in [2, 3].Each data sample consists of a bag of words and a label. The bags were used without labels to traina model that capture covariation in word occurrences, with CGs mostly modeling thematic shifts,LDA and SAM modeling topic mixing and CCGs both aspects. Then, the label prediction task isperformed in a 10-folds crossevaluation setting, using the linear kernel presented in Eq.12 whichfor LDA reduces in using a linear kernel on the topic proportions. To show the effectiveness of thespreading in the kernel definition, we also report results by employing CCG’s ✓s instead of ⇤W
✓ . ForCGs we used the original strategy [3], Nearest Neighbor in the embedding space, while for SAMwe reported the results from the original paper. To the best of our knowledge the strategies just de-scribed, based on [3] and [2], are two of the most effective methods to classify text documents. SAMis characterized by the same hierarchical nature of LDA, but it represents bags using directional dis-tributions on a spherical manifold modeling features frequency, presence and absence. The modelcaptures fine-grained semantic structure and performs better when small semantic distinctions areimportant. CCGs map documents on a probabilistic simplex (e.g., ✓) and for W > [1 ⇥ 1] can bethought as an LDA model whose topics, hi, are much finer as computed from overlapping windows(see also Eq.10); a comparison is therefore natural.As first dataset we considered the CMU newsgroup dataset2. Following previous work [2, 3, 6]we reduced the dataset into subsets with varying similarities among the news groups; news-
20-different, with posts from rec.sport.baseball, sci.space and alt.atheism,news-20-similar, with posts from rec.talk.baseball, talk.politics.gun andtalk.politics.misc and news-20-same, with posts from comp.os.ms-windows,comp.windows.x and comp.graphics. For the news-20-same subset (the hardest), in Fig.3awe show the accuracies of CCGs and LDA across the complexities. On the x-axis we have the dif-ferent model size, in term of capacity , whereas in the y-axis we reported the accuracy. The same can be obtained with different choices of E and W therefore we represented the grid size E usinggray levels, the lighter the marker the bigger the grid. The capacity is roughly equivalent to thenumber of LDA topics as it represents the number of independent windows that can be fit in the gridand we compared the with LDA using this parallelism [18].Componential counting grids outperform Latent Dirichlet Allocation across all the spectrum and theaccuracy regularly raises with independently from the Grid size3. The priors helped to preventovertraining for big capacities . When using CCG’s ✓s to define the kernel, as expected the accu-
2http://www.cs.cmu.edu/afs/cs.cmu.edu/project/theo-20/www/data/news20.html3This happens for “reasonable” window sizes. For small windows (e.g, 2 ⇥ 2), the model doesn’t have
enough overlapping power and performs similarly a mixture model.
6

Table 1: Document classification. The improvement on Similar and Same are statistically sig-nificant. The accuracies for SAM are taken from [2] and they represent the best results obtainedacross the choice of number of topics. BOW stands for classification with a linear SVM on thecounts matrices.
Dataset CCG 2D CG 3D CG LDA BOW SAM⇤
[3] [3] [1] [2]Different 96,49% 96,51% 96,34% 91,8% 91,43% 94,1%Similar 92,81% 89,72% 90,11% 85,7% 81,52% 88,1%Same 83,63% 81,28% 81,03% 75,6% 71,81% 78,1%
e
tofuwokstirfry
cornstarchwok
mixcornstarch
lightcoatapply
donetawasizzler
stirfrychowshoot
tbsscallionginger
sherrysoya
chestnut
piecewhitecut
noodlevein
setasidegarlic
sauceaside bite
peppercorndevein pink
chicken
stock remaincarrotcelery
removableaddfryer tongue
reducebringingboil
boilsimmerbringing
coverreturn
potslottedlower
marinationpiecepanfry
shallowafghanprovide
grillrefrigeration
brush muslin
twocurdleast
clothpaneer
putpourleave
breastwingsskin
marinadsauerkraut
savecoalbaste
skewercheesecloth
tie
charcoaloutsidewood
thread leavelength
bonepiece
dripskim
hourovernightmarinade
cavitycarcasses
turnsecure
preferablesmokercube
cubeawayterrine
packlength
roughlyfreshlychop
duckcut
turnip
fatrender
excessive
porkribhare
meathour
kabobturn push
crock
inchlongorder
tightlycrockpotinch
shreddingjackrefry
removablepot
kidney
largeremovable
fat
sausagegoose
cassoulet
case stufftogetherspice
mix widemix ground lamb
sixburrito
brown cookslightlysaltcook
pumpkinmixture
spicetava
grinderketchup
restgroundelectric
mixownersaint
chicken
chicken
chicken
wing
keo snowlettucebedsthin
thinbeef
couple
porkrib
saucesweetoptionalmsg
poundasianbeef
peanutwok
condimentcuisine
rootpaste
ginger
thaiprik
aromaticgrass
lemongrasstabletomcurry
chilicoconutgalangal
shrimpdeveinchili
soupe shallotsoupetureen
mortarpestlesambal
brothladlefulsoupe
nectarintend
gentlebringing
broccoli roux boil
a)
b)
c) Zoom
Si
Figure 4: A simple interface built upon the word embedding ⇡.
racy dropped (blue dots in Fig.3).Results for all the datasets and for a variety of methods, are reported in Tab.1 where we employed10% of the training data as validation set to pick a complexity (a different complexity have beenchosen for each fold). As visible, CCG outperforms other models, with a larger margin on the morechallenging same and similar datasets, where we would indeed expect that quilting the topics tocapture fine-grained similarities and differences would be most helpful.As second dataset, we downloaded 10K Mastercook recipes, which are freely available on the webin plain text format. Then we extracted the words of each recipe from its ingredients and cookinginstructions and we used the origin of the recipe, to divide the dataset in 15 classes4. The resultingdataset has a vocabulary size of 12538 unique words and a total of ⇠1M tokens.To classify the recipes we used 10-fold crossevaluation with 5 repetitions, picking 80 random recipesper-class for each repetition. Classification results are illustrated in Fig. 3b. As for the previous test,CCG classification accuracies grows regularly with independently from the grid size E. Com-ponential models (e.g., LDA and CCGs) performed significantly better as to correctly classify theorigin of a recipe, spice palettes, cooking style and procedures must be identified. For example whilemost Asian cuisines uses similar ingredients and cooking procedures they definitely have differentspice palettes. Counting Grids, being mixtures, cannot capture that as they map a recipe in a singlelocation which heavily depends on the ingredients used. Among componential models, CCGs workthe best.
Multimodal Retrieval We considered the Wikipedia Picture of the Day dataset [7], where the taskis multi-modal image retrieval: given a text query, we aim to find images that are most relevant to it.To accomplish this, we firstly learned a model using the visual words of the training data {wt,V },
obtaining ✓
t,⇡
Vi . Then, keeping ✓
t fixed and iterating the M-step, we embedded the textual words{wt,T } obtaining ⇡
Wi . For each test sample we inferred the values of ✓t,V and ✓
t,W respectivelyfrom ⇡
Vi and ⇡
Wi and we used Eq.12 to compute the retrieval scores. As in [7] we split the data in 10
4We considered the following cuisines: Afghan, Cajun, Chinese, English, French, German, Greek, Indian,
Indonesian, Italian, Japanese, Mexican, Middle Eastern, Spanish and Thai.
7
folds and we used a validation set to pick a complexity. Results are illustrated in Fig.3c. Althoughwe used this simple procedure without directly training a multimodal model, CCGs outperformLDA, CorrLDA [19] and the multimodal document random field model presented in [7] and sets anew state of the art.The area under the curve (AUC) for our method is 21.92±0.6, while for [7] is 23.14±1.49 (Smallervalues indicate better performance). Counting Grids and LDA both fail with AUCs around 40.
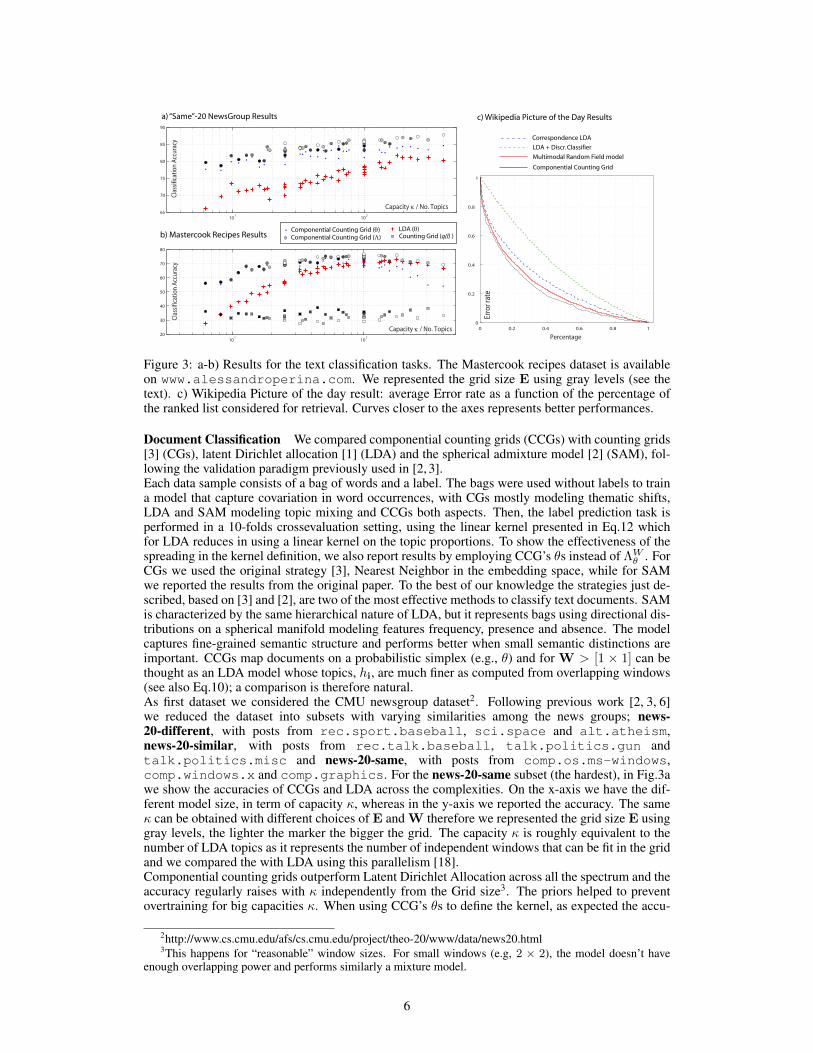
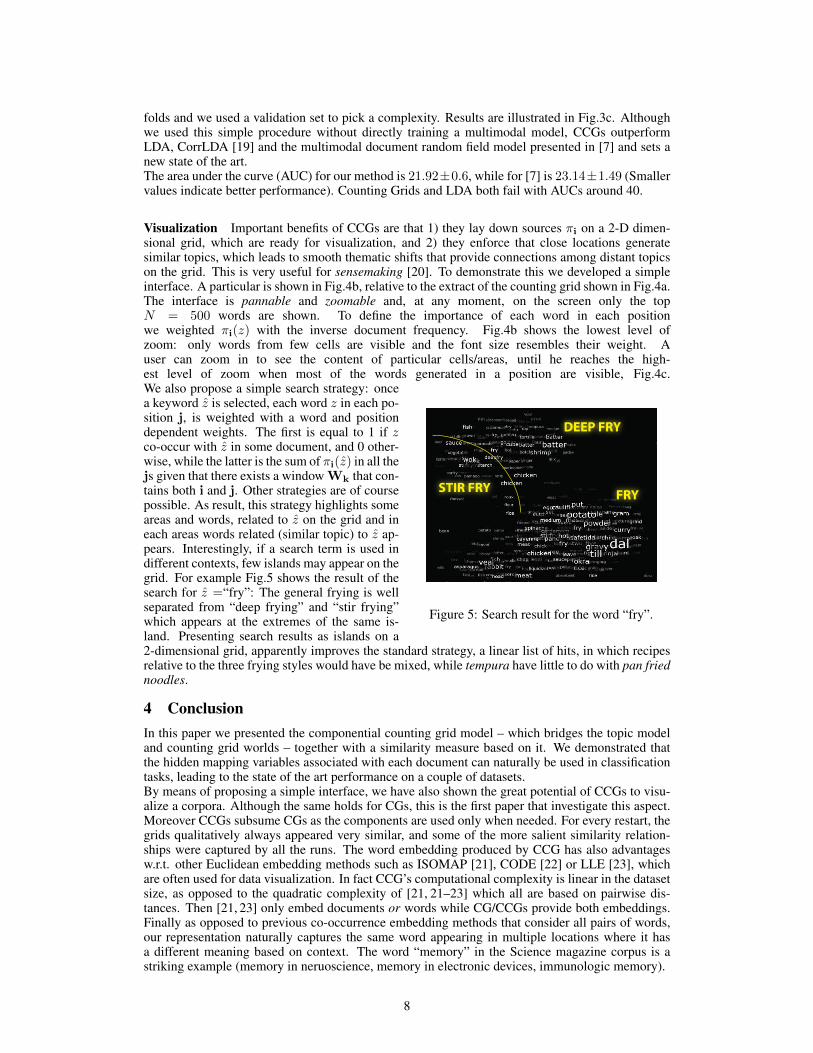
Visualization Important benefits of CCGs are that 1) they lay down sources ⇡i on a 2-D dimen-sional grid, which are ready for visualization, and 2) they enforce that close locations generatesimilar topics, which leads to smooth thematic shifts that provide connections among distant topicson the grid. This is very useful for sensemaking [20]. To demonstrate this we developed a simpleinterface. A particular is shown in Fig.4b, relative to the extract of the counting grid shown in Fig.4a.The interface is pannable and zoomable and, at any moment, on the screen only the topN = 500 words are shown. To define the importance of each word in each positionwe weighted ⇡i(z) with the inverse document frequency. Fig.4b shows the lowest level ofzoom: only words from few cells are visible and the font size resembles their weight. Auser can zoom in to see the content of particular cells/areas, until he reaches the high-est level of zoom when most of the words generated in a position are visible, Fig.4c.
FRY
DEEP FRY
STIR FRY
Figure 5: Search result for the word “fry”.
We also propose a simple search strategy: oncea keyword z is selected, each word z in each po-sition j, is weighted with a word and positiondependent weights. The first is equal to 1 if z
co-occur with z in some document, and 0 other-wise, while the latter is the sum of ⇡i(z) in all thejs given that there exists a window Wk that con-tains both i and j. Other strategies are of coursepossible. As result, this strategy highlights someareas and words, related to z on the grid and ineach areas words related (similar topic) to z ap-pears. Interestingly, if a search term is used indifferent contexts, few islands may appear on thegrid. For example Fig.5 shows the result of thesearch for z =“fry”: The general frying is wellseparated from “deep frying” and “stir frying”which appears at the extremes of the same is-land. Presenting search results as islands on a2-dimensional grid, apparently improves the standard strategy, a linear list of hits, in which recipesrelative to the three frying styles would have be mixed, while tempura have little to do with pan fried
noodles.
4 Conclusion
In this paper we presented the componential counting grid model – which bridges the topic modeland counting grid worlds – together with a similarity measure based on it. We demonstrated thatthe hidden mapping variables associated with each document can naturally be used in classificationtasks, leading to the state of the art performance on a couple of datasets.By means of proposing a simple interface, we have also shown the great potential of CCGs to visu-alize a corpora. Although the same holds for CGs, this is the first paper that investigate this aspect.Moreover CCGs subsume CGs as the components are used only when needed. For every restart, thegrids qualitatively always appeared very similar, and some of the more salient similarity relation-ships were captured by all the runs. The word embedding produced by CCG has also advantagesw.r.t. other Euclidean embedding methods such as ISOMAP [21], CODE [22] or LLE [23], whichare often used for data visualization. In fact CCG’s computational complexity is linear in the datasetsize, as opposed to the quadratic complexity of [21, 21–23] which all are based on pairwise dis-tances. Then [21, 23] only embed documents or words while CG/CCGs provide both embeddings.Finally as opposed to previous co-occurrence embedding methods that consider all pairs of words,our representation naturally captures the same word appearing in multiple locations where it hasa different meaning based on context. The word “memory” in the Science magazine corpus is astriking example (memory in neruoscience, memory in electronic devices, immunologic memory).
8

References
[1] Blei, D., Ng, A., Jordan, M.: Latent dirichlet allocation. Journal of machine Learning Research 3 (2003)993–1022
[2] Reisinger, J., Waters, A., Silverthorn, B., Mooney, R.J.: Spherical topic models. In: ICML ’10: Proceed-ings of the 27th international conference on Machine learning. (2010)
[3] Jojic, N., Perina, A.: Multidimensional counting grids: Inferring word order from disordered bags ofwords. In: Proceedings of conference on Uncertainty in artificial intelligence (UAI). (2011) 547–556
[4] Hofmann, T.: Unsupervised learning by probabilistic latent semantic analysis. Machine Learning Journal42 (2001) 177–196
[5] Blei, D.M., Lafferty, J.D.: Correlated topic models. In: NIPS. (2005)[6] Banerjee, A., Basu, S.: Topic models over text streams: a study of batch and online unsupervised learning.
In: In Proc. 7th SIAM Intl. Conf. on Data Mining. (2007)[7] Jia, Y., Salzmann, M., Darrell, T.: Learning cross-modality similarity for multinomial data. In: Proceed-
ings of the 2011 International Conference on Computer Vision. ICCV ’11, Washington, DC, USA, IEEEComputer Society (2011) 2407–2414
[8] Neal, R.M., Hinton, G.E.: A view of the em algorithm that justifies incremental, sparse, and other variants.Learning in graphical models (1999) 355–368
[9] Asuncion, A., Welling, M., Smyth, P., Teh, Y.W.: On smoothing and inference for topic models. In: InProceedings of Uncertainty in Artificial Intelligence. (2009)
[10] Minka, T.P.: Estimating a Dirichlet distribution. Technical report, Microsoft Research (2012)[11] Frey, B.J., Jojic, N.: Transformation-invariant clustering using the em algorithm. IEEE Trans. Pattern
Anal. Mach. Intell. 25 (2003) 1–17[12] Dunson, D.B., Park, J.H.: Kernel stick-breaking processes. Biometrika 95 (2008) 307–323[13] Perina, A., Cristani, M., Castellani, U., Murino, V., Jojic, N.: Free energy score spaces: Using generative
information in discriminative classifiers. IEEE Trans. Pattern Anal. Mach. Intell. 34 (2012) 1249–1262[14] Raina, R., Shen, Y., Ng, A.Y., Mccallum, A.: Classification with hybrid generative/discriminative models.
In: In Advances in Neural Information Processing Systems 16, MIT Press (2003)[15] Jebara, T., Kondor, R., Howard, A.: Probability product kernels. J. Mach. Learn. Res. 5 (2004) 819–844[16] Bosch, A., Zisserman, A., Munoz, X.: Scene classification using a hybrid generative/discriminative
approach. IEEE Trans. Pattern Anal. Mach. Intell. 30 (2008) 712–727[17] Bicego, M., Lovato, P., Perina, A., Fasoli, M., Delledonne, M., Pezzotti, M., Polverari, A., Murino, V.:
Investigating topic models’ capabilities in expression microarray data classification. IEEE/ACM Trans.Comput. Biology Bioinform. 9 (2012) 1831–1836
[18] Perina, A., Jojic, N.: Image analysis by counting on a grid. In: Proceedings of IEEE Computer SocietyConference on Computer Vision and Pattern Recognition (CVPR). (2011) 1985–1992
[19] Blei, D.M., Jordan, M.I.: Modeling annotated data. In: Proceedings of the 26th annual international ACMSIGIR conference on Research and development in informaion retrieval. SIGIR ’03 (2003) 127–134
[20] Thomas, J., Cook, K.: Illuminating the Path: The Research and Development Agenda for Visual Analyt-ics. IEEE Press (2005)
[21] Tenenbaum, J.B., de Silva, V., Langford, J.C.: A Global Geometric Framework for Nonlinear Dimen-sionality Reduction. Science 290 (2000) 2319–2323
[22] Globerson, A., Chechik, G., Pereira, F., Tishby, N.: Euclidean embedding of co-occurrence data. Journalof Machine Learning Research 8 (2007) 2265–2295
[23] Roweis, S.T., Saul, L.K.: Nonlinear dimensionality reduction by locally linear embedding. SCIENCE290 (2000) 2323–2326
9
Related Documents
![Documents as multiple overlapping windows into grids of counts · The counting grid model (CG) [3] takes this spatial metaphor – of moving through sources of words and dropping](https://static.cupdf.com/doc/110x72/60fcfb4dbbf63264b9440d4f/documents-as-multiple-overlapping-windows-into-grids-of-counts-the-counting-grid.jpg)


![Fast Global Registration - Vladlenvladlen.info/papers/fast-global-registration.pdfJoint global registration of multiple partially overlapping surfaces has also been considered [7,20,39].](https://static.cupdf.com/doc/110x72/6107ae625e2ed37ec6408e9c/fast-global-registration-joint-global-registration-of-multiple-partially-overlapping.jpg)