DOCUMENT RESUME ED 206 703 TM 810 605 AUTHOR Benrud, C. H.; And Others TITLE Sampling and Weighting Activities for Assessment Year 11. Final Report on National Assessment of Educational Progress. - INSTITUTION Research Triangle Inst., Research Triangle Park, N.C. SPONS AGENCY Education CommissiOn of the States, Denver, Colo. National Assessment of Educational Progress.: National Center for Education Statistics (ED), Washington, D.C.: National lest. of Education JED). washinuton, D.C. REPORT NO., NAEP-11-S11-47; RT/-1967-00-02F PUB DATE Jun 81_ CONTRACT OEC-0774-0506 GRANT N/E-G-80-0003 NOTE 236p. !DRS PRICE MF01/PC11 Plus Postage. DESCRIPTORS' Computer Oriented. Programs; *Educational Assessment: Elementary Secondary Education: *methods: *National Competevy Tests: -*Sampling; Testing; Testing Pragramf IDENTIFIERS *National Assessment of Educational Progress ABSTRACT Sampling activities for Tear 11 of the National issesseent of Educational Progress began in 1977 when plans were begun f, Years,11-14. In MeAl__1279 the sample was selected and through allocated. In-school secondaryttple selection activities were carried out during May ust, 1979, and in- school assignment and field support activities were begun in Auguatcand continued into 1980. Sample weight computation activities began in January and pontinued through August 1980. The Supplftentary Frame secondary sample was selected in Jgly and August 1979, and the, third -stage sample of discontinuers and early graduates was selected during March through Ray 1980 and administered in June through August. Supplementary Frame weights were computed in September through November 1990. This report documents the tear 11,in-school sampling and weighting activities, and the Suppleaentarf Frade activities. Primary type of information provided by the report: Procedures (Sampling) (Weighting) . (Aulthor/BW) *********************************************************************** Reproductions supplied by EDRS are the best that can be made from the original document. ***********************************************************************

Welcome message from author
This document is posted to help you gain knowledge. Please leave a comment to let me know what you think about it! Share it to your friends and learn new things together.
Transcript
DOCUMENT RESUME
ED 206 703 TM 810 605
AUTHOR Benrud, C. H.; And OthersTITLE Sampling and Weighting Activities for Assessment Year
11. Final Report on National Assessment ofEducational Progress.
- INSTITUTION Research Triangle Inst., Research Triangle Park,N.C.
SPONS AGENCY Education CommissiOn of the States, Denver, Colo.National Assessment of Educational Progress.:National Center for Education Statistics (ED),Washington, D.C.: National lest. of Education JED).washinuton, D.C.
REPORT NO., NAEP-11-S11-47; RT/-1967-00-02FPUB DATE Jun 81_CONTRACT OEC-0774-0506GRANT N/E-G-80-0003NOTE 236p.
!DRS PRICE MF01/PC11 Plus Postage.DESCRIPTORS' Computer Oriented. Programs; *Educational Assessment:
Elementary Secondary Education: *methods: *NationalCompetevy Tests: -*Sampling; Testing; TestingPragramf
IDENTIFIERS *National Assessment of Educational Progress
ABSTRACTSampling activities for Tear 11 of the National
issesseent of Educational Progress began in 1977 when plans werebegun f, Years,11-14. In MeAl__1279 the sample was selected and
throughallocated. In-school secondaryttple selection activities werecarried out during May ust, 1979, and in- schoolassignment and field support activities were begun in Auguatcandcontinued into 1980. Sample weight computation activities began inJanuary and pontinued through August 1980. The Supplftentary Framesecondary sample was selected in Jgly and August 1979, and the,third -stage sample of discontinuers and early graduates was selectedduring March through Ray 1980 and administered in June throughAugust. Supplementary Frame weights were computed in Septemberthrough November 1990. This report documents the tear 11,in-schoolsampling and weighting activities, and the Suppleaentarf Fradeactivities. Primary type of information provided by the report:Procedures (Sampling) (Weighting) . (Aulthor/BW)
***********************************************************************Reproductions supplied by EDRS are the best that can be made
from the original document.***********************************************************************
-
, r L'.1 ,,:, . .,..-- P. ', -'-'' '''';2.;* ",';',,,..'F.r .--, -" -I. , c"..."1".-1.", '., 71; .--
0u_az,i ..,.7 '..- -tt ".. - . .-.
;:_-_--4- .,-....2:7. ,,,,,. f ,,- . ....., :7:4- -T. :, -4 . ..;4 -V
r,47 .,c' ' 6"-? '."?.:...-14.4..:11;Jr':" " e `- , -- k-,- .,
' -
, -'6.. . ...... 7, : . . :
.
4,
-- . . ."'"1 -- ...-.........- ':::- -": 4::
_... 5.....
Pi.
r.R71/1967/00-02F
U S DEPARTMENT OF EDUCATIONNATIONAL INSTITUTE Of EDUCATION/
EDUCATIONAL RESOURCES INFORMAT2NCENTE
h6 dx J Ten t P,Rcluced as
,ecerved Iorn he peson orgar.zatan
ongteating
Minor cha made to 'reprove
Iepr Cit.JC,AD
Pants of v Nor opinions stated Er, tem docume,' co no, n ennno,n.r rep,e9a offic.a NIEposoor or pac
FINAL REPORT ON NATIONAL ASSESSMENT OF EDUCATIONAL PROGRESS
SAMPLING AND WEIGHTING ACTIVITIESFOR ASSESSMENT YEAR. 11
by
C. H. BenrudJ. R. ChromyA. F. ClemmerB. L. Jones41. E. RichardsonD. H. Whitehorne
No. II-SW-47
Prepared forNational Assessment of Educational Progress
fJune 1981
ti
R E S E A R C H TR4A.NGLE. PARK, NORTH CAROLINA 2.7 Z.0 9
1
r.
LI
file work upon which this publication is based was performed pursuant to
Grant NIE-G-80-0003 of the National Institute of Education. does not,
however, necessarily reflect the views of that agency
ti
. 4

(10
SOCIAL AND STATISTICAL' SCIENCES
0'W. C. Eckerman, Vice President for Social Scien6esD. G. Horvitz, Vice President for Statistical Sciences
ti
Statistical Sciences Group
D. G. Horvitz, Vice PresidentB. V. Shah, Chief Scientist
R. H. Thornton, Director,-Computer Applications CenterW. K. Poole, Director, Statistical Methodology and AnalysIshCenter
Moore, Director; Survel± Operatiops CenterJ. R. ChromiDirector, Sampling Research and Design Center
-4.
SAMPLING AND WEIGHTING PROJECT STAFF
J. R. Chromy, Project DirectorR. E. Folsom, Ass"ociate Project Director for Sampling
W. K. Grogan, Jr., Associate Project Director for Administration
C. ,H, Beizud, DOC,'TOC, and STOC Classification Task Leader-f!: F. Clemmer, In-School Sample Selection and Weighting Task Leader
B. L. Jones-, Supplementary. Frame Task LeaderJ. E. Richardson, Consultant, Computer Systems TaskD. H. Whitehorne, Computer Systems Task Leader
A. Burt, Statistical AssistantD, oazed, Junior Programmer
P. M. Nora Statistical Assistant $,
14.,+ Rowland, ort Staff Supervisor
Other RTI staff participated in selected project activities when requested.The report was authored by C. H. Bensud, J. R. Chromy, A. F. Clemmer,B. L. Jones, J. !. Richardson, and D. H. Whitehorne.
This-report was coordigated by Laurine,Johnson, typed by Martha Clegg and PatParlyer and proofread.by Phyllis Norris.

t, r TABLE 'OF CONTENTS
1_. .
..2 Page
LIST OF TABLES vi
1: LIST OF FIGURESN
1
ix. r
... .
1 INTRODUCTION -1
1.1 OverallNational Assessment Objectives 1
1.2 Historical Overview,of National Assessment..
3
1.3 Subpopulation Representationie
7
'1.4, Overview of Sampling Activities 8
1.5 Report' Organization 11II
II REFERENCES FOR CHAPTER 1 12
2. IN-SCHOOL ASSESSMANT p 13 ""'"--.
2.1 Introduction 131
2.1.1 Target Population 13
2.1.2 Sample Design-Objectives 16
2.2 Primary Sample 16
2.3 Secondhry Frame Construction and Selection ofSample Schools 20
2.3.1, Secondary-Frame Construction .. 20
2.3.1.1 Validation of Completeness ofSchool Frame 21
2.30.4 ValidatiOn of Completeneso of-SchoolFrame for Oversampled Populations 21
2.3.2 Selection of Sample Schools: . . . 22
2.3.2.1 Oversimpling Lbw Metropolitan andExtren Rural Schools 22
2.3.2.2 Stratification and Selection ofSample Schools 24
2.4 Package Assignment and Field Operation's 25
2.4:1. Package Asfignment 25
2.4.1.1 Introduction 25
2.4.1.2 Package.Identification Number 28
2.4.1;3 School Sample Adjustments 32
2.4.1.4 1.10e of the Principal's Questionnaire
Data 34
Package Allocation 43
)-s
a
1.
(v)
TABLE OF CONTENTS (continued)
Page
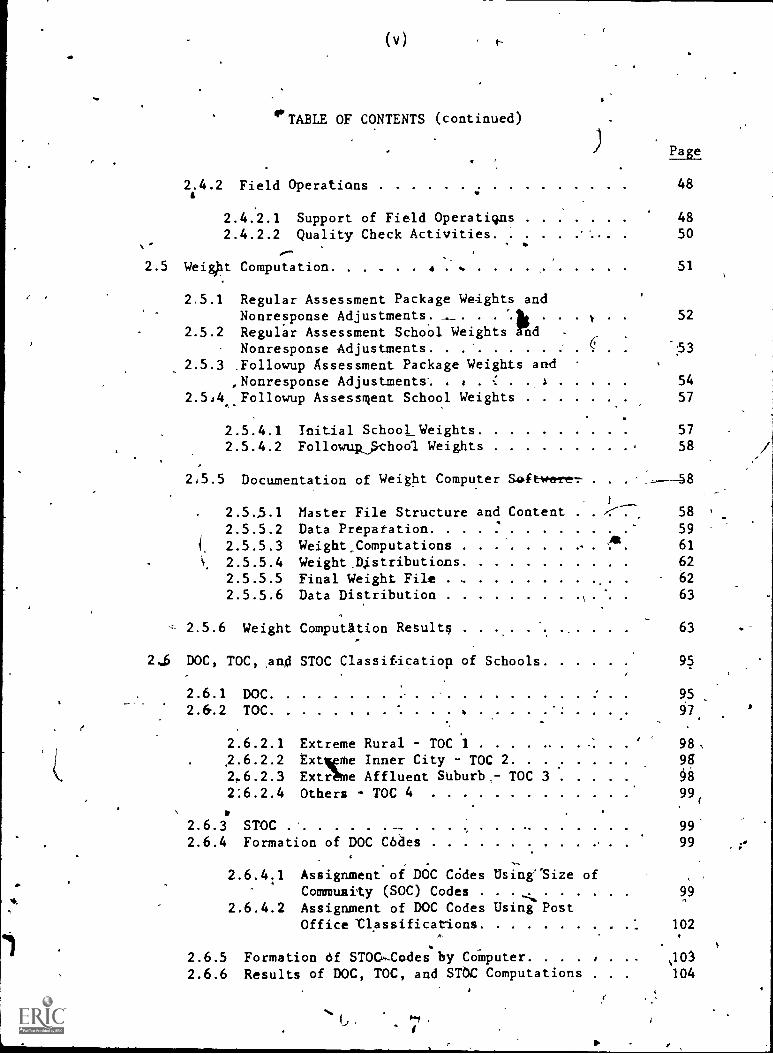
2.4.2 Field Operations 48A
.
2.4.2.1 Support of Field Operatiqns 48
2.4.2.2 Quality Check Activities 50
2.5 Weigpt Computation. . . . . . 51
2.5.1 Regular Assessment Package Weights andNonresponse Adjustments. . .
ri52
2.5.2 Regular Assessment School Weights d
Nonresponse Adjustments 62.5.3 .Followup Assessment Package Weights and
,Nonresponse Adjustments. 54
2.5,4 Followup Assessment School Weights 57
2.5.4.1 Initial School Weights2.5.4.2 Followup.fichool Weights
2,5.5 Documentation of Weight Computer . .
57
58
58
2.5.5.1 Master File Structure and Content . . 58
2.5.5.2 Data Prepatation 59
2.5.5.3 Weight,*Computations2.5.5.4 WeightAistributions2.5.5.5 Final Weight File
61
62
62
2.5.5.6 Data Distribution 63
,-- 2.5.6 Weight Computation Results
2,6 DOC, TOC, ,anti STOC Classificatiop of Schools 95
63
2.6.1 DOC2.6.2 TOC
95
97.
2.6.2.1 Extreme Rural - TOC 1 ..... . . 98,2.6.2.2 ExtlEte Inner City - TOC 2 9g
2,6.2.3 ExtrIme Affluent Suburb - TOC 3 98
2:6.2.4 Others - TOC 4 99
2.6.3 STOC 99'2.6.4 Formation of DOC Codes 99
, -
2.6.4.1 Assignment of DOC COdes Usine'Size ofCommunity (SOC) Codes
2.6.4.2 Assignment of DOC Codes Using PostOffice 'Classifications 102
2.6.5 Formation df STOC,,,,Codes by Computer. . . . . ,101
104
k.
2.6.6 Results of DOC, TOC, and STOC Computations . .
1

TABLE OF CONTENTS (continued)
Page
2.6.6.1 Age Class 1, 9- Year -Olds. 104
2.6.6.2 Age Class 2, 13-Year-Olds 117
2.6.6.3 Age Class 3, 17-Year-Olds r 118
2.7 Historical File2.8 Year 11 Efficiency Study2.9 Response Experience2.10 Accessibility Status of 17-Year-old Nonrespondenti. .
2.11 Special Problems and Recommendations
143
143143
150
152
REFERENCES FOR CHAPTER 2 153
3. SUPPLEMENTARY TRAM ASSESSMENT 154
3:1 Overview , 154
3.2 Sampling Plan Development 155
3.3 School Selection / .0, 156.
3.4 Dropout and Early Graduate Ffame Constructionand Sample Selection 157
v-.1.5 Package 4sfinment, . ,-4- . . .
'3.6 Suppor-of Field OpeOitions . ..
*
3.7 WeigbeComputations
3.7%1 Program Development and Data Preparation/3.7.2 Weights for School DiscOntinuers . . .
3.7.3 Weights for Early Graduates3.7.4 Weight Editing and Tape Preparatio
3.7.5 Level of the Estimates
"161 .
162.
162
162
168
171
172
3.8 DOC, TOC, and STOC Classification 174
3.9 Response Experience 174
3.10 Special. Problems and Recommdndatioli 180
APPENDIX A:
APPENDIX B:
Year 11 Principal's Questions
Year 11 School Worksheet .
A-1
B-1
APPENDIX C: Year 11 In-School Weight/Tppe Format C-1
APPENDIX D: PSU Control Sheet.. . 1/ D-1
APPENDIX E: Computer Prepared P -. age Assignment Forms E-1
APPENDIX F: NAEP Primal y Samp, for Year 11 F -1-
APPENDIX G: Age Class 3 N i''espondent Form G-1
4
b

r
r.
Table
LIST OF TABLES
Page
1-1 National Assessment reporting cltegories 9
-2 DefinitiOns of 14tional Assessment regional subpopialatious.
2-1 Year 11 in-school NAEP packages age class and type ofpackage
-. 14
,e.2-2 Pladned sample fizes'by age class 14
2-3 Definitions-Of target populations and -range of age foreligibles 15
4 2-4 Sample allocation by region and noc Categories 18
2-5 Allocation in terms of 1-, 2-, and 3-replicate units. . 19
2-6 Anticipated maximum number of packages to be administeredin Years 11 through 14, 23
2-7 Number of Year 11 packages by age class and composition . 26
. 2' -8 Schedule for Year 11 package assignment and related fieldactivities, 30
2-9 Year 11 District Supervisor package identification ranges . 31
2-10 Year 11 new schools and sample schools with grade rangechanges admitted to the sample on a probability basis'. . . 33
2-11 Summary of Year 11 sample school nonparticipation 35
2-12 Numbers of Year 11 replacement schoOls . . 36
2-13 Prediction equations to deterane number of age classeligibles in sample schools 39
2-14 Expected student response rate by size of community (SOO . 47
2-15 Summary of.9-year-old package weights in Year 11 64
2-16 Summary of 13-year-old package w;.ights in Year 11 '65
2-17-- Summary of 17-year-old regular respondent package weightsin Year 11 66
2-18 Summtliry of 7-year-old initial respondent package weightsin Year 11i- 67
(Pt 9

.4
LIST OF TAITES (continued)
L Table Page
2-19 Summary of 17-year-old followup respondent package weights
in Year 1168
2-20 Comparison of population and sample percentages in standby
schools by age class 69
40'Summary of planned and actual sample sizes in Year 111ff
National Assessment 71
2-22 Frequency distribution in number of respondents for 9 -year-
old package weights in all Year 11 schools 12 -
2-23 Frequency distiibution in number of respondents for 13-
', year-old package weights in all Year 11 schools . . . .
2 -i4 Frequency distribution in numbeY of respondents for 17-
year -old regular respondent package weights in all Year 11
schools74
2-25 Frequency distribution in number of respondents for 17-
year -old initial respondent package weights in all Year 11
schools 75
2-26 Frequency distribution in number of respondents for 17-
year -old followup respondent package weights in all Year .11
schools76
2-27 Frequency distribution in num4per of respondents for 9-year-
old package weights in Year 11 standby schools 77..
2-28 Frequency distribution idnumber of-respondents for 13-
year -old package weightt irk Year 11 standy schools 78
2-29 Frequency distribution in number of respondents for 17-
year -old regular respondent package weights in Year 11
standby schOols 79
.
2-30 Frequency distribution in number of respondents for 17-
year-old initial respondent package weights in Year 11
standby schools. 80'
2-31 Frequency distribution in number or respondents for 17-
year old follpwup respondent package weights in Year 11
standby schooli 81
2-32 'Explanation for small and large package and school weights
for 9-year-olds in Year 11 82
33' Explanation for small and large package and schooj. weights
-77for 13'-year-olds in Year 11 .
83
0
1.
r
.
Table
.LIST OFTABLES (continued)
Page
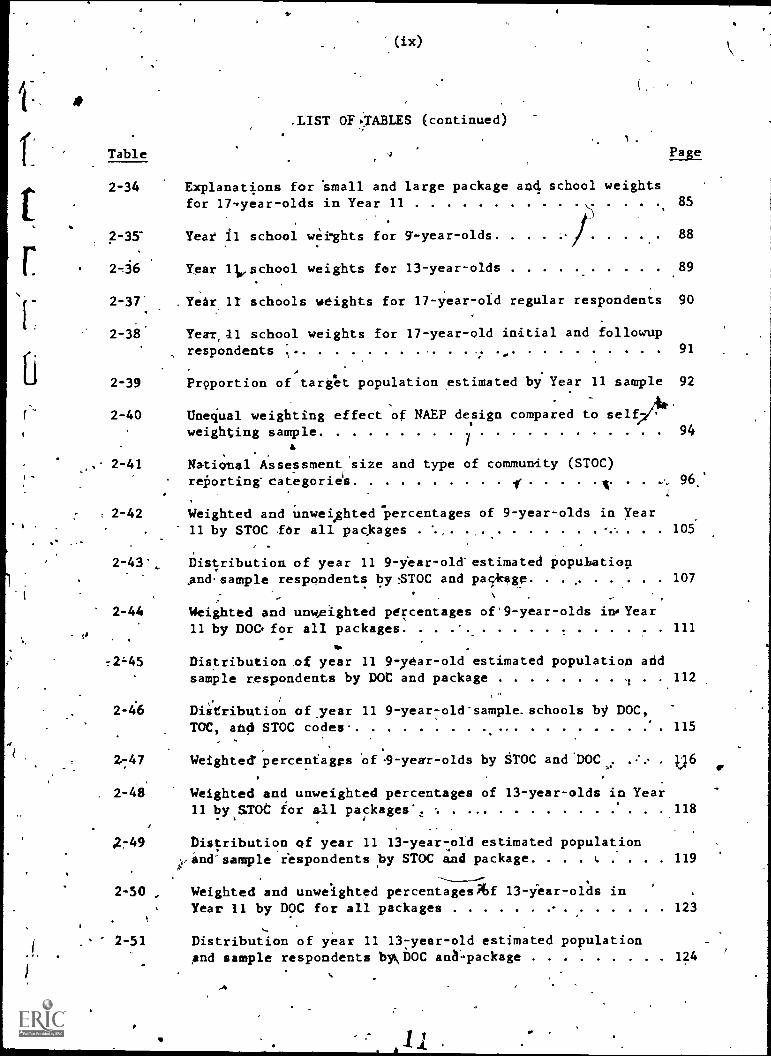
2-34
2 -35
Explanations for small and large package and school weightsfor 17 "year -olds in Year 11 85
Year 11 school weights for 9-year-olds/
88
2 -36 Year 1L,School weights for 13-year-olds 89
2-37 ,Year II schools weights for 17- year -old regular respondents 90
2-38' Yearal school weights for 17-year-old initial and followuprespondents 91
2-39 Proportion of target population estimated by Year 11 sample 92
2-40 Unequal weighting effect of NAEP design compared to selfe7fr'
weighting sample 94
2-41 National Assessment size and type of community (STOC)
reborting'categorie's 1' A 96:
2-42 Weighted and unweighted "percentages of 9-year-olds in Year11 by STOC for all packages ,
105
Distribution of year 11 9-year -old' estimated PopulationAnd-sample respondents by :STOC and pa5RAge 107
2-44 Weighted and unweighted percentages of'9-year-olds inYear
c,11 by DOCfor all packages 111
!,,2=45 Distribution nf year 11 9-year-old estimated population andsample respondents by DOC and package . . 112
2 -46 Dit;tribution of,year 11 9-year 7old-sample.schools by DOC,
TOC, aft0 STOC codes. . . . 115
2747 Weighted` percentages of .9-year-olds by STOC and DOC . . 1.16-, .
2-48 Weighted and unweighted percentages of 13-year-olds in Year11 by STOC for all packages', 118
,27-49 Distribution of year 11 13-year - old estimated population
,t-'
,inesamplerespondents by STOC and package. . . . (. . . . . 119
-------2-50 , Weighted and unwelghted percentagesf 13-Year-olds in
Year 11 by DOC for all packages - 123
. 2-51 Distribution of year 11 137year-old estimated population -
and sample respondents bykDOC ana'-package 124
..

LIST OF TABLES (continued)
Tables* Page
2-52 Distribution of year 11 13-year-old sample schools bY'DOC,*TOC, and STOC codes 128
2-53 Weighted percentages of 13-year-olds by STOC and DOC. , . . 129
2-54 Weighted'and unweighted percentages of 17-year-olds in Year
11 by STOC for all packages 130
2-55 Distribution of year 11 17-year-old estimated population.ink! samilA respondents by STOC and package it 131
2-56 Weighted and unweighted percentages of 17-year-olds in Year
11 by DOC for all packages 135
2-57 Distribution of year 11 17-year-old estimated populationand sample respondents by DOC and package 137
2-58 Distribution of year 11 17-year-old sample schools,by DOC,TOC,'and STOC codes 140
2-59 Weighted percentaget of 17- year -ol'ds by STOC and DOC. . 141
( 2-60 Distribution of Year 11 estimated population and sample,respondents by STOC, region and age . . R 142
2-64 Number of schools selected in Yeai 11 sample 144
2-62 Nuafber of schools added to initial Year 11 secondary sample- ---1,
. after initial secondary Sample selection 144
l
2-63 . Summary of, school response in Year 11'sample -:146*
2-64 Summary-of school cooperation in Year 11 sample 147
2-65 'Numbers-and percents of sessions completedopackagesadministered, and students assessed Year 11 regular
assignments 148
2-66 Numbers of percents of sessions Completed, packagesaaminsltered, and stuents assessed Year 11 standby assign- .
ments . . 149
2-67 Accessibility status for sample of nonresponding
17-year-olds 151
3-1 Year 11 Supplementary Frame_sample schoole4by regiom. . . 157
3-2 Values C , school nonresponse adjustment by region and
,SOCrr,s 166

',SupplementaryFrame survey
estimates of population and
'Census-basedpopulation estimates,
by assessmentyear .
Year 11 SupplementaryFrame
Year 11 SupplementaryFrame-assessment
field xesu;ts with
'comparativepercentage'
results for Year 07. . . .
1
Year 11 SupplementaryFrame assessment package tilnAle size
bi.studentsampling frame .
is
lb
\s1.. INTIODUCTION
This report is submitted to the, National Assessment of Educatiohal
Progress (NAEP) and constitutes. the final report for assessment Year 11.
The report covers in-school and supplementary frame sampling activities in
the eleventh operational year of.Nationai Assessment. Out-of-4chool sampl-
ing activities for Young Adults were not carried out during Year'll because4,
of reduced funding. 5
1.1 Overall National Assessment Objectives
The A.ong-term objective of the National Assessment of Educational
Progress is to assess the progress of education of selected' population
groups. This objective hak required the development and implementation
1a continuing program of data collection, analysis,.and reporting.
of
. The immediate products.of the National Assessment program are statisti-,
cal data series describing the knowledge, skills, and attitudes of selected
population groups. A stated objective of National Assessment:has been to
present educational outcome data which maybe readily understood by the lay.
irpublic as well as b ssional researchers, educators, and legislators..
This has brought .aboatNa-departure from traditional edhcational measurement
procedures which are directed toward individual performance on a battery of
exercises. The National Assessment data areused to present estimates of
population group Performance.on specific exercises. This shift in the
method .of data acquisition and presentation has required deVelopment-of
unique sample selection,.data collection, and analysis procedures.
The National Agsessment program has focused on major population sub-,
groups and of specified subject matter areas. The special populations
14
-2-
targeted by National Assessment are restricted to four.age classes (1,2,3,
and 4): 9-year-oldS, J3-year-olds, 17-year-olds, and,young adults (26-35
years of -age), respectively. Nine year-olds, 13-year-olds, and 17-year-
olds are assessed in school. In'addition, 17-year-olds no longer enrolled
in school are assessed in their homes, as are young adults. The assessment
of young adults was suspended in Year 06, and was resumed as a separate
undertaking in Year 08 only. Additionally, the assessment of out-of-school
17-year-olds was. suspended
Other population subgroups
region-, sex, race, level of
in-Year 08, and not resumed until Year 11.
can be defined within each age class (e.g.,
parents' education, and community type); these
subgroups are discussed in some detail in section 1.3.
The subject 'matter areas assessed through Year 11 have included:
Year
Year
Year
Year
Year
Year
Year
Year
01 7 Science, Citizenship, and Writing;
02 - Reading and Literature';
03 ~` Music and Social Studies;
04 - MathematiCs and the reassessment of Science;
05 Career and Occupational Development and the reassessment of
Writing;
06 - Art and the reassessment of Reading;
07 - Basic Mathematics and the reassessment of Citizenship and
**Social Studies (combined);
08 - Reassessment of Science at all age classes; assessment of
Health and Energy and reassessment of Reading at Age Class 4;1
V Year 05 out-of-schoolDevelopment only.
In Year 07, Basic17-year-olds only.
assessment,..' included Career, and Occupational
Mathematics exercises were., administered to 13- and

,
Year 09 - Reassessment of Mathematics at all in-school a
Year 10 -.Reassessment of Music, Art, and Writing;
e classes;
.C\
*
Year 11 - Re'asse'ssment of Reading,Literature, and Art .
Years OS 44 06, supplemental Mini-Assessments of Functional
Literacy (MAFL) were also conducte0 for 17-year-olds. In Year 06, Index of
Basic Skills packagesVele additionallyadministered to 17-year-olds; in
Year 08, Basic Life Skil4Ipackages were administered to 17-year-olds; in
Year 09, 17-year-olds 4Aere asseses4--in Consumer Skills; And in Year 10,
Attitudes and Achievement in Mathematics packages were additionally admin-
istered to 13-year-olds and twelfth graders.
1.2 Historical Overview of National Assessment
'National Assessment hasundergone a mild evolution over the period of
its brief -history4.' Special adjustmentsin sampling and field procedures
have been made every yearaccommodate the special requirements of exer-
cise administration in new subject matter areas. The sampling of 17-year-
-,
olds not enrolled in school ikfted from a household sample approach to a
MulfipleNjrame, approach to a school dropout and early graduate fraMe
approach over the first five years of assessment.
/-
In Year 01, 17-year-olds not enrolled in school were located in the
household sample only. The sample of out-of-school 17-year-olds is called
the Supplementary Frame sample. Several potentill method; of obtaining
lists of out:of-school 17-year-olds were investigated before the Year 05
SP
procedure was finalized. Some of these potential lists included an area
household frame, secondary school records, colleges, military service
induction centers,, Neighborhood Youth Corps, Job Corps, and the Employment
Security Commission. In Year 05, the decision was made to obtain early
.*In Year 11,Art exercises were administered to 13-year-olds only.
-4-
graduate and dropout lists from a subsample of the schools selected'for
17-year-old assessment. The examinations of these potential lists are
dOcumented elsewhere ill, [2].
A number of modified field procedures were initiated in the \Year 02
out. -of- school assessment as a result of the Year'01 experience. The require-
.ment.of including all States in the in-school sample necessitated mor
sample design-changes in Year 02; further sample design modifications were
initituted in Year 05 to meet this -requirement and also provide simple,
relatively unbiased methods of- estimating sampling error
In Year 64, a study to align National Assessment sample stratification
more closely with NAEP reporting categories was undertaken. Some valuable
by-products-of this study iyncluded (1) the definition -of Census low-income
areas as a stratification tool to ±solate the low metropolitan.subpopula-,
14 a
tion, (2) the use of Census estimates of the percent rural 17-year-olds to
define the extreme rural subpopulations, and (3) the development of a
standardized set of procedures, including computer software, to classify
respondents into size and type of community reporting categories.
The Year-06 assessment included a,number of experimental studies of
alte'rnate meths ofladtinistration, which had an impact on how field
Aprocedures were conduched as part of t he 17-year-pld assessment. .0ne study
-1explored the operationaffeasibility of a modified student selection proce-,
dure. As a result, of this substudy, it was decided to modify the student
selection procedure in Year 07 from a systematic sample to a'simpl,e,random
sample. Additionally, the simple random sampling approach allowed 'schools
to use pre-existing lists of eligibles (i.e., computer printouts, classroom
rosters) to the fullest extent. A second feasibility study conducted in
Year 06, involving a subsample of 48 schools, tested three different package
1 "

-5-
'Oboe use .of alternates. This study was carried out IS a statistically valid
administration plans designed to increase the number of respondents without4
experimental design .so the response rates and - cost factors could be
ti
compare'dand any observed differencecould be evaluated.against the experi-
mental error.' At a resultof this substudy, a procedure to followup non-
respondents on the day after package administration was adopted in Year 07.
A number of'more formal self-evaluationprojects have been conducted.
These projects included sample efficiency studies, a quality check resurvey
of the household sample in Year 01, and a followup study of nonresponding
in- school 17-year-olds in Year 04. Beginning in Year 04, the quality of
*,
the collected data has been assessed through annual probability samples of
* -schools. Following the Years 06, 07, and 08 assessments, NAEP and RTI
held a District Supervisorsdebriefing conference to obtain recommendations
for future NatiOnal Assessment years. Meetamags of this type supply valuable
- insight to planning subsequent assessments.
'Additionally, in 'tear 06 RTIparticipated with NAEP in developing a
coordinated four-year school sampling design which achieved broad dispersion
of the sample over the four-year period, yet avoided many of the problems
encountered in the past when.the same schools were selected in successive
years through independent annual samples.- The proposed design also reduced
the number of travel podts in any single year's sample. This change was
motivated by the reduced funding level and associated, reduction in package
administration loads anticipated for subsequent assessments. Cost and
variance analyses, indicated that such a reduction -in primary sampling
,points would improulwdesign efficiency'. Reducing the number of travel
0.Because of cost considerations, a nonprobability sample of schools was
examined in Year '05.

-6-
points became a viable option as a result of the relaxation of the all-state
repres7tation requirement in Year V.
two design modifications wereadopted in Year 07. First, a multistage
reallocation procedure based on the school frame data was adopted. The
procedure reassigned the 162'replicates in Year 07 to P$Us proportional to
revised 17-year-old size measures based on estimated 17-year-old school
enrollments developed from the school frame.
Secondly, in Year07 a ranking of schools based on parents' occupation
and DOC classification was made prior to package assignment. This ranking
was used to identify the oversampled substratum within each PSU. The group
package sample size-for each oversampled and nonoversampled school within
each substrAtumWasthen determined from dge class enrollment estial$:es on
Principal's Questionnaires and from previouslycomputed student response
rates by size and type of community. This procedure allowed adjustments to
be made for schools which, at sample selectioni'may-haveabeen misclassified
into the .ersampled substratum.
three.,additional design modifications wereincorporated in Year 08.
First, the 17-year-bld student samples were selected in a PSU at the same
time that the 9-year-old student samples were selected,. Nine- and seventeen-,
year-old respondents wee assessed, at the usual time; however, the new
procedure eliminated some of the school burden by giving 17-year-old schools
more time to prepare for *assessment.
Secondly, student sample weights were equalized separately within the
oversampled substiatum 4and within the remainder at the student selection
level by varying the sample size. 'Group sample sizes ranged fionl'10 to 35.
Thirdly, the Year 0$ Quality Check sample was selected across all
three age clawes. Previously only schools at a particular age class had
r.
I
77 -
'been included in the quality check sample each year. This new procedure
enablqd 'RTI's National AssessmentAdministration Center to detect more
.r.
#.rapidly any irregularities in the collection of National Assessment data.
A$ a, result of recommendation from the District Supervisor's debriefing
conference, thqscaakimum group sample size* in Year 09 was reduced from 35 td
25 students. Similarly, the minimum was increased from 10 to 16. Expected
sampld weight sums and sample sizes for various maxima and minima were
examined prior to the decision. It was foUnd that the maximum group size
could be reduced without appreciably altering the targeted sample size
while still equalizing the sample weights.
In Year 10, the method of estimating the number of eligibles per
school" as refined. Previously, eligibles were estimated using the school
grade by grade enrollment and 1970 estimatces of the proportion of eligibles
Per grade ineach State. Using the Year 09 response data and Principal's
Questionnaire data, regression equations were developed in Year 10 to
y
predict estimated eligibles by school, for each age class.
In Year 11, a coordinated four-year primary sample was selected. The
sample was selected in March 1979 and was preceeded by an 18-month planning
effort. During theeplanniug period, primary designs from the first ten
years were examined iff terms of strengths and weaknesses, design efficiency,
studies conducted in rear '7 were re-examined, and the direction of the
sample over the next four years was discussed. The sampling procedures are
documented elsewhere [31.
1.1 Subpopulation Representation
National Assessment reports results for a variety of subpopulations.
Besides the three in-school age groups, reported subpopulations include
within each age level four geographi0. regions, sex, race, grade, four.
2u

levels of parents' education, and seven-pAiz_e and type of--- community (STOC)
categories. These reporting groups are lisKed.in table 1-1.
The geographic regions referred, to in table 1-1 are those used by the
Office of Business Economics, Department of Commerce.. Table 1-2 defines
NAEP's regions in terms of the sets, Of'Statei which comprise the four
geographic areas.
The size' and type of community categorization mentionedt'intable, 171
refers to a postclassification of schools in terms of the residential
distribution and parental occupation of attending students. A detailed
description orthe STOC classification procedures is presented in sectionI
2.6.
A major objective of .the National Assessment.suAy design is to
guarantee adequate sample representati for-the reporting subpopulations
listed in table 1-1. Such representatkon.is essential if reasonably precise
comparisons among these subpopulatiOns are to be.made within a given assess-,
ment year and with previous years when the same subject areas were assessed.
1.4 Overview of Samplin Activities
Sampling activities for Year 11 began in 1977 when plans were, begun
for the selection of a coordinated four-year primary sample to be allocated
to Years .11-14. In March, 1979 the sample "was selected and allocated.
In-school.secondary sample selection activities were carried out.during May
th'rough August, 1979, and in-school package assignment and field support
activities were begun in August and continued into 1980. ample weight
computation activities blpen in January a'nd continued through August 1980.
The Supplementary Frame secondary sample was selected in July and August
1979, and the third-stage sample-of discontinuers and-early graduates was
selected during March through May 1980 and adpinistered in June through1

-9-
Table 1-1. National Assessment reporting categories
'Clifssif cation
Number ofsubgeoups Subgroup names.
Age /level
ace
Geographic region
Level of parentaleducation
3 9-, 13-, 17-year-olds
2 Male, Female
4 White; Bleck, Hispanic, Other
4 Northeast, Southeast, Central,
West
4 No high schoolSome high schoolGraduate high schoolPost high school
Size and type, of 7 Low metropolitan (extreme inner
city)High metropolitan (extremeaffluent suburb)
Extreme ruralMain big city iremainder of
big city)Urban fringe (suburban fringe)
Medium citySmall places (small city)
Grade 3 (9's, 13's) 3,4, Othet7,8, Othef
4 (17's) 10,11,1/, Other
community (STOC)
I
'

1
-107-
Table 1 -2. pefinitions of Natimal. Assessment regional subpopulations
Northeast Southeast
DelawareConnecticutMaine - .
iftw Hampshire
Rhode IslatdVermobt
District of ColumbiaMaryland
MassachusettsNew- Jersey
PennsylvaniaNew York
Central West
ArkansasFloridaVirginia !
West VirginiaAlabamaGeorgia'
XentuckyLouisianaMississippiNorth CarolinaSouth-Carolina,
Iowa
KadVas,
NebraskaNorth DikotaSouth DakotaMinnesotaMissouriIllinoisIndianaMichiganWisconsinOhio
IK
AXaskaHawaiiIdahoMontanaNevadaWyomingArizonaOregonUtahColoradoNew MexicoOklahoma
CaliforniaTexas
Washington
4
4.0
I
11. i
tv
41 .
i
August. Supplementary Frame weights were computed in September through
November 1980.
1.5 Report Organizationt.?!
..
'Chapter 2 of:this report documents the Year 11.in-school sampling and. ,
- t la
weighting -actilrities. Supplementary Frame activities are described ionwil
Chapter 3. A list of references is included at the end of each chapter.
4,A
1
k
,
.
I
I
.
Il 4......,f
\
l
-Al
L
...
-12-/4
v
REFERENCES FOR CHAPTER 1
[1] Moore, R. P. and B. L.. Jones, Study of Alternative Sampling framesfar Out-of-School 17-Year-Olds. RTI Project 25117688-1 TechnicalReport No. 1, December 1971.
[2] Moore, R..
P. and B. L. Jones. Multiple Frame Sampling for Out-of-School Seventeen Year-Olds in Year 03 of National Assessment, RTI.Project 25U-796-3, Technical Report No. 1, February 1973.
L3] Chromy, James R., B. L. Jones, and Anne F. Clemmer.. Year 411 1 riallry. Sample for'tke National Assessment of Educational Progress.project 25U-1764. Final Report, June 1980.
a

U
4
2. IN-SCHOOL ASSESSMENT
2.1 Introduetion
The subject areas assessed in Year 11 were Reading, Literature, and
Art., Reading and Literature had-been previously assessed in Year 02, and
Reading had been reassessed in Year 06. Att had been assessed in Year 06
00,
and reassessed in Year 10. Year'll Art exercises were administered to
,
13-year-olds only. 'Table 2-1 summarizes the n'amber of Year 11 packages by
age class and type'of package. Planned sample sizes by ajk classrare shown
in table 2-2. .
2.1.1 Taxget Population ve
The target population_ specified for in-school assessment included
9- year -olds, 13- year -olds, and 17-year-olds enrolled in either public or
private schools at,the time of assessment. Table 2-3 presents the specific
age definitions prescribed for a ssessment Year 11 and the range of age for
eligibles inthe school sample.
The target populations defined by birthdate ranges in table 2-3 were
restricted by excluding persons who were functionally handicapped to the
.extent that they could not participate in the assessment as it was normally
conducted. Specific groups excluded were:
(1) Non-English speaking persons;
2) Respondents identified as nonreaders during the assessment;
(3) Persons* physically or mentally handicapped, including EducableMentally Retarded (EMR), in such a way that they could not res-pond to NAEP exercises as they were normally administered;
(4) Students attending Rublic an4 private schools established for thephysically handicapped and/or mentally-retarded.
In addition to these groups which were judged incapable of responding
properly; 9- and 13-year-olds not enrolled in public or private schools at

Table 2-1.
Agecolass
S
.iepr 11-ip-school NAEP liackages by age classand type of package
Reading and Literature Reading, Literature, and Art
1 (9-year-olds) 11
V 14J
3 (17-year-olds) 14
\ 01Tab ler,-2-2. Planned sample sizes by age class
b
4
Sample Total- . Number , size/ sample
Age'class 1Df-packages page size
1 (9-yea'r-olds). -
.11- 2,592 28,512
2 (13-year-olds) 15 2,592 38,880
3 (17-year-olds) 14' 2,592 36,288
a
0
lia

r.
T
(
yap
-15-
. Table 2-3. .initions of target populationsrange of age for eligibles
Age group Survey period Eligible birthdatesP
9-year-o
13-year-olds
17-year-olds
1/02/80 to 3/02/80 Calenda?year 1970'
10/099 to 12/15/79 Calendar year 1966
3/05/80 to 5/04/80 10/01/62 to 9/30/63
MinimumEligible age range
Mid-range Maximum
9-year-olds *
/
13-year-olds
17-Yeai-olds.
9 yrs. 1 mo.- 01
12 yrs. 912 mos.
16 yrs. 6 mos.
9 yrs. 71/2 mos. 10 yrs. 2 mos.
(
13 yrs. 41/2 mos. 13 yrs. 111/2 mos.
17 yrs. 11 mo. 17 yrs. 7._mos.
2s

N
-16-
or
the time of assessment were excjuded. Out-df-school 9- and 13-year-olds
represent such a small fraction of their respective age groups that it was
not worthwhile to pursue them. Other general NAEP sample design specifica-
tions are mentioned in the following paragraphs.
1
2.1.2 Sample Design Objectives
The following were-the major objectives of the four-year sample design
implemented beginning in Year 11:44
(1) Insure that at least one PSU was present in earegion by size
of community category annually.
(2) Reduce the geographic size of PSUs.
( ) Redefine sampling size of community stratification to more cloiely
align with reporting size and type of community 'definitions.
(4 )pversample low income-anfextreme rural areas to insure adequate
sample representation for the reporting subpopulations.'
(5) Insure that a school would appear in the sample no more than once
every four years.
(6). Facilitate simple and relatively unbiased estimates- of sample
variance.
(7) Permit samples,of.either (a) 75 PSUs with 550 schools at each age
live' or (b) 100 PSUs with 1000 schools at each age level.
2.2 Primary Sample -41,
p
To achieve the major objectives stated in section 2.1.2, a four-year
piimary sample wasdesigned and implethented. The primary sample selection
was completed in March 1979 and documented in a separate final report to
ECS
Counties and 1970 Census - recognized county-equivalent independent
cities, or clusters of these, comprised the primary sampling frame. Twenty
major strata were defined by crossing the four geographic regions with five
sampling description of community (SDOC).levels. The five SDOC categories
are defined as follows:
f.
1
it
-17-
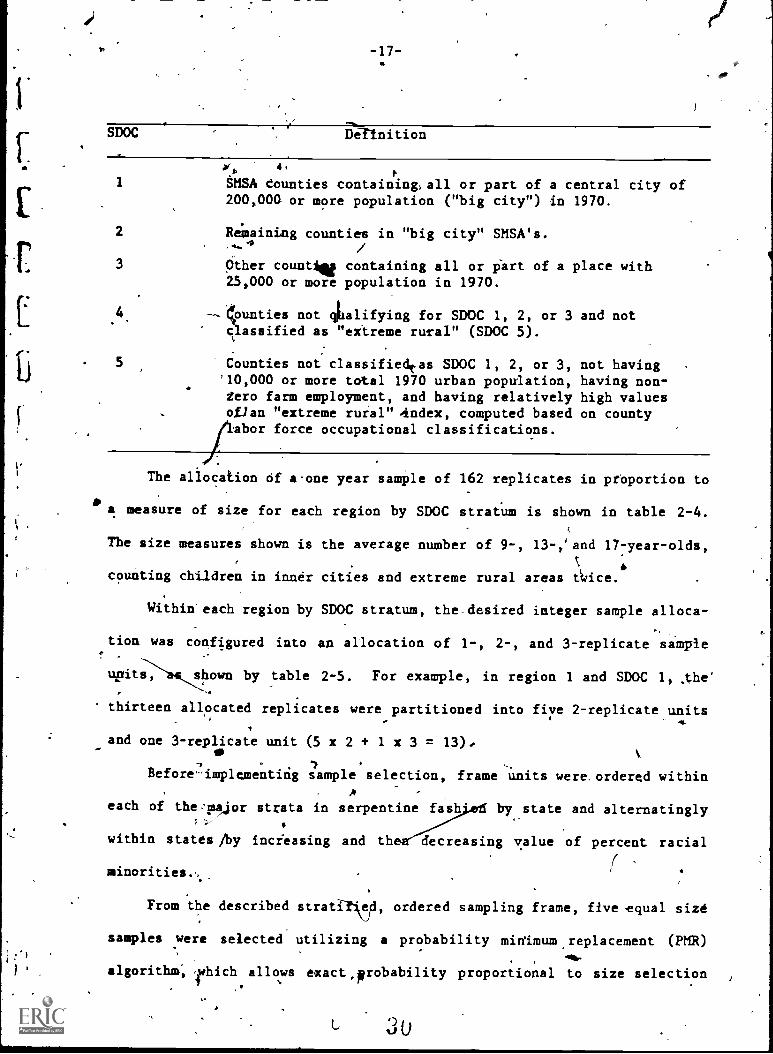
SDOC Lellnition
0, 4,
1 SMSA Counties containing, all or part of a central city of200,000 or more population ("big city") in 1970.
2 Remaining counties in "big city" SMSA's.
3 Other count* containing all or part of a place with25,000 or more population in 1970.
4 --q7unties not qlialifying for SDOC 1, 2, or 3 and notclassified as "extreme rural" (SDOC 5).
5 Counties not classifiedtas SDOC 1, 2, or 3, not having'10,000 or more total 1970 urban population, having non-
.
zero farm employment, and having relatively high valuesofJan "extreme rural" 4ndex, computed based on county
Tabor force occupational classifications.
The allocation of aone year sample of 162 replicates in prOportion to
a measure of size for each region by SDOC stratum is shown in table 2-4.
The size measures shown is the average number of 9-, 13-,'and 17-year-olds,
counting children in inner cities and extreme rural areas tkiice.
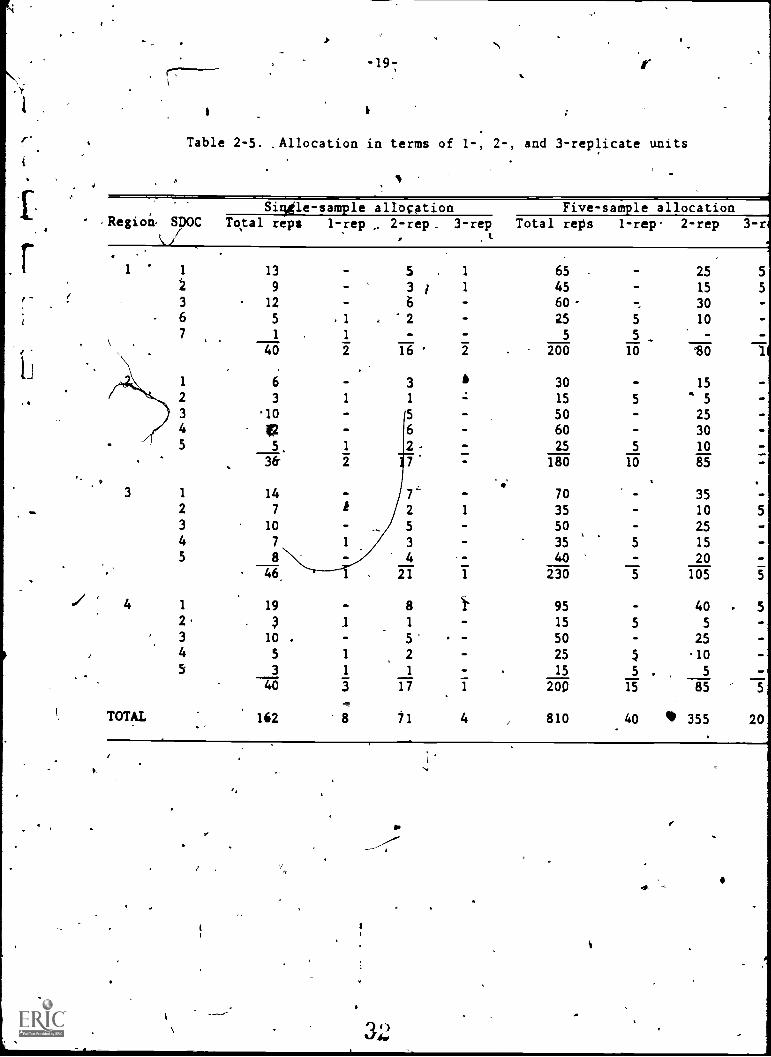
Within each region by SDOC stratum, the desired integer sample alloca-
tion was configured into an allocation of 1-, 2-, and 3-replicate sample
upitsa, shown by table 2-5. For example, in region 1 and SDOC 1, he
thirteen allocated replicates were partitioned into five 2-replicate units
and one 3-replicate unit (5 x 2 + 1 x 3 = 13).
Before-implementing sample selection, frame units were. ordered withinA
each of the-major strata in serpentine fas by state and alternatingly$
within states /by increasing and then decreasing value of percent racial
(
From the described strati eji, ordered sampling frame, five 'equal size
samples were selected utilizing a probability midimum replacement (PMR).41a.
algorithm which_ allows exact,probability proportional to size selection
U ti
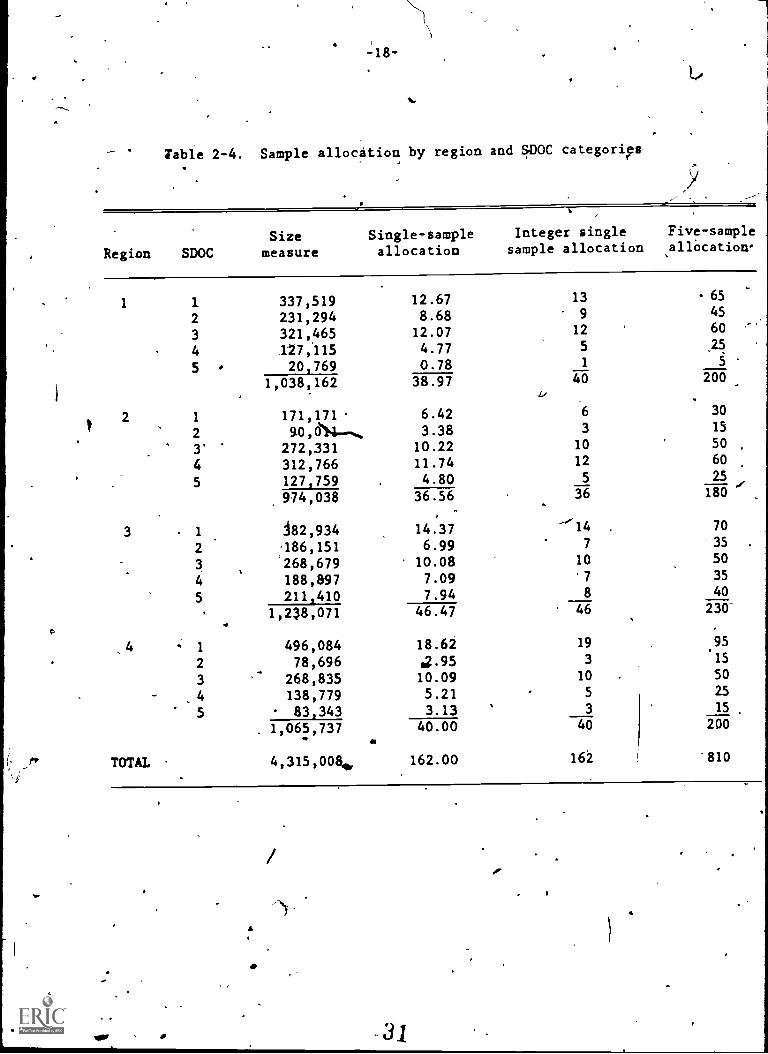
Table 2-4. Sample allocation by region and SDOC categorips
Region SDOCSizemeasure
Single-sampleallocation
Integer single Five-sample
sample allocation allocation-
1 1 337,519 12.67 13 - 65
2 231,294 8.68 9 45
3 321,465 12.07 12 60
4 127115 4.77 5 25
5 20,769 0.78 1 5
1,038,162 38.97 40 200Li
2 1 171,171 6.42 6 30
2 90,641- 3.38 3 15
3' 272,331 10.22 10 50
4 312,766 11.74 12 60
5 127,759 4.80 5 25
974,038 36.56...-
18036
3 1 i82,934 14.37 -`14 70
2 '186,151 6.99 7 '35 .
3 268,679 10.08 10 50
4 188,897 7.09 '7 35
5 211,410 7.94 8 40
1,238,071 46.47 46 230-
4 = 1
2
496,08478,696
18.62
*2.95
19
3
.9155
3-
268,835 10.09 10 50
4 138,779 5.21 5 2.5
5 83,343 3.13 , 3 15
1,065,737 40.00 40 2Q0
TOTAL 4,315,0084, 162.00 162 -810
31
r'
Regioil
1
3
4
TOTAL
-19-
Table 2-5. .Allocation in terms of 1-, 2-, and 3-replicate units
Sirgle- sample allocation Five-sa le allocationSDOC Total reps 1-rep , 2-rep_ 3-rep Total reps 1-rep- 2-rep 3-r
1 13 5 . 1 65 25 5
9 - 3 / 1 45 - 15 53 12 6 60 - 30 -
6 5 . 1 2 - 25 5 10 -
7 1 1 - 5 5
40 2 16 2 200 10 '80
1 6 - 3 30 - 15
2 3 1 1 15 54
NO
3 10 - 5 50 - 254 47 - 6 60 - 305 5, 1 2 25 5 10
3& 2 180 10 85
.
1 14 -._
- 70 35 -
2 7 1 2 1 35 - 10 5
3 10 - 5 50 - 25 -4 7 1 3 - 35 5 15 -
5 8 4 40 - 20._.
446 1 21 1 230 5 105
1 19 - 8 Y 95 - 40 . 52 1 1 - 15 5 5 -3 10 . - 5' 50 25 -4 5 1 2 25 5 105 3 1 1 - 15 5 . 5 -
40 3 17 1 20P 15 85 5
162 8 71 4 , 810 40 110 355 20
32(

-20- t,- I
withof a fixed number of units from a frame with units of unequal size. Four
of the samples were randomly assigned to the assessment years 11 through
14. The primary- sample utilized for Year 11' of National Assessment is
listed in Appendix F. The fifth sample was reserved to.serve as a source
of replacements for refusing primary units and a possible supplemental
sample under a large sample opticin
The procedure used for selecting the .five equal sized primary,samples
did not preclude the possibility that some (tame units mightloi selected
more than%once. Further, the method of assignment of multiple selections
to the five samples (years) did At ensure balance by year, thus a, sample
PSU could be assigned twice to
primary sample was .examined
occurred. Three occurrences w4 e identified across the entire five-part
sample land revisions were
one year and not at all in another. The
etermine how many, times .this situation
to balance the sample by year in these
instances. Only on1I of the adjustments affected thesYear 11 primary sample.
None of the PSUs selected for the special augmentation/replacement.
sample:were retuired for PSU replacement in Year 11.
2.3 Secondary Frame Construction and Selection of Sample Schools
2.3.1 School Frame-Construction
For all Yer 11 primary sampling units, all public and private schools
were enumerated. The grade range, total enrollment, and certain identify-
ing data were obtained for each school. A computer tape containingAthe
. desired data was obtained from Curric419 Information Center (CIC), CIC is
a Denver-based organization that gathers information pertaining to public
and private schools in the United States, Using the grade range.and total
enrollment data, an estimate of the number of age class eligibles in each
school was made.
*('
4

1
f.
-21-
2,3-1.1 Validation'of Completeness of School Frame.
As noted in the preceding section, ad estimate of the number of age
class 'eligibles for each school was obtained using the grade range and
total enrollment data. An estimate of the number of age class eligibles in
each 'PSU was obtained by summing these estimates across schools. The
estimate of the 17-year-olds obtained by'this method was compared with an
estimate of the 17-year-old population used at the primary level of sample
selection. If the two estimates of eligible 17-year-olds differed consider-
ably andjor the relations among the three age class totals were determined
atypical, the following further checks were made. Estimates of age class
eligibles and primary sampling frame totals for PSUs selected from the same*it
State in the previous year's, assessment were examined to see if similar
/
discrepancies occurred. If necessary, it was verified that estimates
appeared for each eligible school in each PSU and that correct data and
methods were utilized in estimating the age clans eligibles for each school.
2.3.1.2 Validation of Completeness of School Frame for Oversampled
Populations
If a' primary unit contained a population to be oversampl d, estimates
were computed of: (a) the total age class eligibles in the oversampled
population and (b).the percent of age class eligibles in the oversampled
population.
If the primary unit contained schools classified as low metropolitan
and the estimated percent of age class eligibles in these schools was
judged too large or too small, the classification of these schools was
reexamined. Schools were reclassified from low metropolitan to nonlow
metropolitan status in accordance with prescribed directives. These
reclassification procedures are detailed elsewhere [9].
"9'10'1

122-A
,If the primary°, unit contained an extreme rural popul ion, it was
verified that the estimated percent
for each county in the 1111-'
4
rural population was pr
2.3.2 Selection of Sample Schools
erlya recorded
To achieve simple, unbiased variance estimatisnj the;school frame in
self.'-representing,PSUs was stratified into two- ancyrthree-r4plicate areas
containing populations of similar types. -Yor 4 ample, in a particularr4#f
self-representing unit, one two-replicate.area Wight Consist of low metro -
,and remainder of the city schools; th .
secoadlarea containing onlyiblitan
schools
cater.
from outside the city limitse
could ttcount for another,two repli-
,t;
To simplify estimation of the withW PS1./'
self-representing SMSAs, schools11
were Selected
viritsce contfitution front.
to provide two-or three
knonoverlapping one- replioate subsampleewhich woufd.easi)1 accommodate the
paired selection.variance scheme. Sfinools in seTected"PSUs were'
accommodate the number of packages lipecified in tAle=6. Tthle.0. 8
the
chosen to
2-6 lists
anticipated maximum number ot packages to_beoadministered.in Years 11.7
through 14. For those primary6its selected for 2 or 3 years, the schools
,necessary for the total maximum allocation for °Ike year Were determined and
doubled or tripled as.
required. pumbers,of selec ted schools were.
quadrupled to accommodate; the four year period. Sin4;the number of :pack-:.
ages'specified for Year 11 assessment was not the same as ta4e 2-6, it was
necessary to subsample 'the Year 11
conftguration.
2.3.2.1 Over .lin Lo
School strist were'defined in terias of 1970 Census data to°,aversample
4,6
schools to conform to the.Year 11 package..
YMetro olitan and Extreme Itwal Sc ools
11
.$
the low metrop itan type of community. Low metropolitan schOl were
'-\)

I I
1 1
0
-23-
Table 2-6. Anticipated maximum number of packages to beaddinistered in 'Sears 11 through 14
Age
9-year-olds
13-year-olds
17-year-olds
Number of Number of. group packages
13
15
1 18
individual packages
0
0

I
-24-
t'ose scools located in the CeAsus Employment Survey (CES) low. incomeAA
I
areas. CES low income areas were defined in section .2.1. LefroMetropolitan
4schools were oversampled at a rate of approxims ly two-to-o
)
e in relation
to nonextreme schools.
Extreme rural schools were defined as schools located in nonSMSA
counties where the extreme rural indices computed fromHoccupational statis-
tics were aboVe specified values. Oversampling of extreme rural schools
was accomplishe4 at the primary sa stage.
2.3.2.2 Stratification and Se ection of Sample Schools
Within each' oversampl and nonoversampled stratum, sichools were
further stratified by ,estimated number of eligibles. Within each size
stratum, schools with a small number of age class eligibles were clustered
in groupt of two or three schools until the cluster of schools could cone&
tivelytake the number of packages assigned to larger schools in the stratum.
The schools were ,clustered such that the total number of age class eligibles
in each cluster was apiroximately equal. The probability with which each
school in the cluster was selected was
where
P(SchoolIPSU)
k
n ill Si
S
n = total number of schools to be selected from the stratum;
total'number of schools in the cluster;
Si = number of age class eligibles in school-i;
S = total number of age class eligibles in the stratum.
Schools or school clusters were selected without replacement using
Sampford's probability propohidnal to size and without, replacement sampling
technique. 37

r
fi
2
-25-
2.4 Package Assignment and Field Operations
2.4,1 .Package,Assignment
2.4.1.1 Introduction
The National Assessment of Educational Progress (NAEP) in-school
sample was selefted in several stages,. The selection procedures for first-(
stage sampling units (counties or multi-county areas) and for second-stage
sampling units (schools) were documented in sectj.o1ns 2.2 and 2.3. The
selection procedures for third-stage sampling units are documented in this
section. Since a probability sample of students is required for each NAEP
package, the sampling process involved three steps within each school:
(1) Selection of a probability student same;
(2) Partitioning of the student samfle into subsamples;
(3) RandOm assignment of NAEP packages to the student subsamples.
In Year 11, the total. assignment across all age classes consisted of
40 unique group packages. This compares to total assignments of 35 group
packages in Year 09 and 41 group packages in Year 10. All Year 1], packages
contained some combination of Reading and Literaure exercises. There also
were seven Art exercises in one Year 11 Age Class 2 package. At each age
class, three Year 11 packages were made up of exercises recycled from Years
02 And 06; all otlier Year 11 packages were made up of exercises which had
not been administere4 in previous years. Table 2,-7 shows the distribution
of Year 11 packages by composition (either new or recycled exercises) and
by age class.
Student selection and package assignment procedures require a current
updating of student enrollment, grade 'range, and related information for
all sample "schools. This requisite information is obtained by the District
38

-26-
Table 2-7. Number of Year 11 packages by age classand composition
Age Class
Number of PackagesAll Recycled All New TotalExercises Exercises Packages
1 3 8 11
2 3 12 15
3 11 14
Total 9 31 40
3:3

-27-
Supervisors (DSs) during introductory meetings with superintendents, princi-
pals, and/or their representatives. During these introductory meetings,
new schoolg in selected districts and sample,schdas with grage range
changes are reported to the District Supervisor._ This information is
relayed to the Research Triangle Institute (RTI) Sampling Research and
Design Center (SRDC). Using probability procedures, new schools are
admitted tad` the sample and sample schools with grade range changes are
readmitted to the sample.
Stude1t selection and package assignment instructions are then
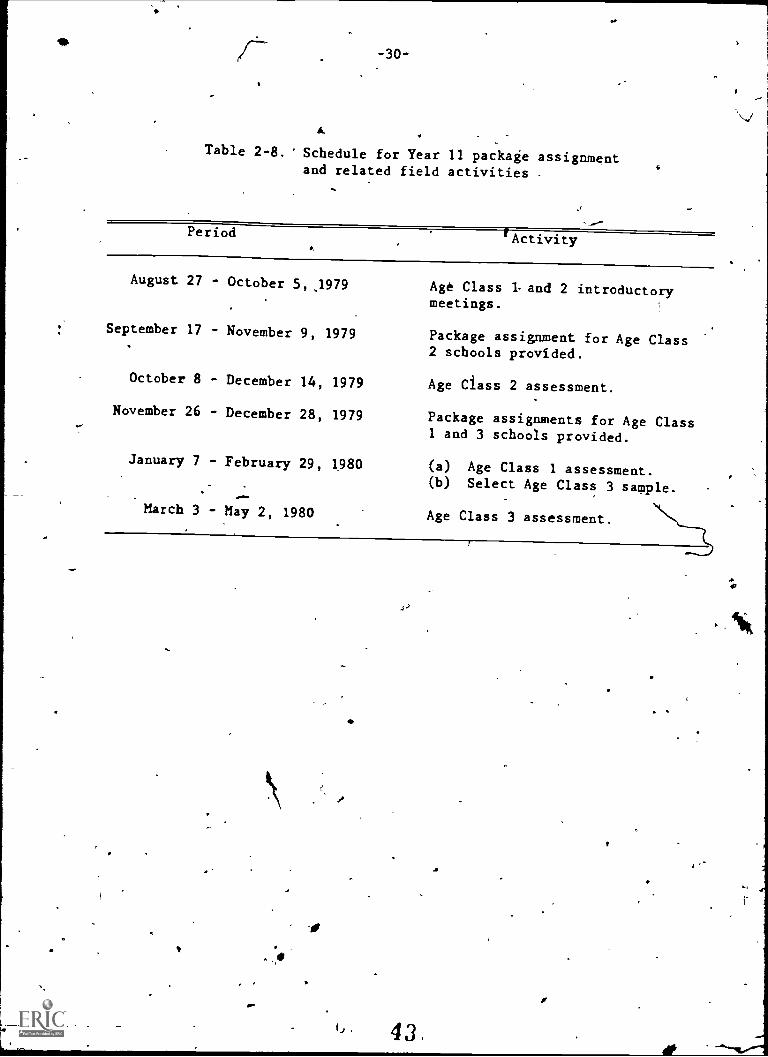
prepared on a flow basis and coordinated with the field operation. Table
2-8 shows excerpts from the Year 11 schedule for in- school administration
and sampling. In order to elimiAete some of the assessment burden on
17-year-old schools, the 17- year -ol student samples were selected in a PSU
at the same time that 9-year-ol assessment was conducted. This procedure
allowed 17-year-old schools more time to prepare for assegsitlefit. As a
result of this change, it was necessary toIt pross 9 -'mod 17-year-old
package assignments simultaneously in December and -January as noted in
table 2-8. Included the Age Class 3 package assignments were additional
instructions to supplement the student sample with students who might have
entered school since the Age Class 3 student sample was selected.
A new procedure of chedking in packages using District Supervisor
identification numbers rather than PSU based package identification numbers
was initiated in Year09 and continued in Years'10 and 11. This procedure
is explained in section 2.4.1.2. Procedures to update the school sample
are documented in section 2.4.1.3. Section 2.4.1.4 documents the method by
c"'"-
which the number of eligible students in each school is estimated and how
the Principal's Questionnaire data are used to restratify each school by
'2A0

4.
1
-28-
,type of comniunity (TOC). The actual allocation and assignment of,packages
o, schools is dOcumenfed in section 2.4.1.5. 11
To initiate tht package assignment procedure for a given PSU, certainI
=
data pretaining to that PSU must be collected and transmitted to the RTI
sampling staff. Thise dati arc collected on specific forms, which include
the PSU Control Sheet and the Principal's Questionnaire. opits of theses
forms are Ocluded s appehdixes 1 and A, respectively. Additionally a110.
completed-set of computer prepared package assignment forms'is included as
appendix E.
2.4.1.2 Package Identification Numbers
.Within each iprimary sampling unit (PSU), each group package was admin--. 14istered one,, two of three times; therefore, either one, two or three hart
_--
shells containing 18 to 24.copies of each grouppackage were distributed in
each -PSU. Unique ranges of package identification numbers were assigned to
package copies. within each hardshell. The package identification numbers.
were used- to link the respondent to the package administered within each
school; however' the particular ackages. to which an individval fesponded
-can be detected only from records which never leave 4e school.
in Year 11, each District-Supervisor was assigned a package identifi-
cation number r based on the number of package administrations in
primary sampling units- under his supervision. Table -.2 -9 lists the Year 114 ..
..
District Supervisor package identification ranges by age class. Pre-.., .
et4 assigning the ranges enabled Westinghbuse DataScort Systems to print the
package jdentifiCation numbeis. Previous 1 Year 09, District Supe ors
had manually, coded the package 'identification numbers on each package. Thet
9.
. new procedure provided more time for the District Supervisors to perform
al= tasks such as monitv sessions, teview exercise administrators' work,
etc..

-29-
Package identification numbers were uhique within a school and linked
.respondents to packages within a school. Again, the form's linking the
respondents to the pirticular package,administration,neyer left the school.
''
A
4
0
-30-
A
Table 2 -8.' Schedule for Year 11 package assignmentand related field activities
Period rActivity
August 27 - October 5, .1979 Age Class and 2 introductorymeetings.
September 17 - November 9, 1979 Package assignment for Age Class2 schools provided.
October 8 - December 14, 1979 Age Class 2 assessment.
November 26 - December 28, 1979 Package assignments for Age Class1 and 3 schools provided.
January 7 - February 29, 1980 (a) Age Class 1 assessment.(b) Select Age Class 3 sample.
March 3 - May 2, 1980 Age Class 3 assessment.
0
.4?
43.
a
Table 2-9: Year 11 District Supervisor packageidentification ranges
. ..
6
-32-
2.4.1.3 School Sample Adjustments )it ,
%I
2.4.1.3.1 Updating*Sample for New Informations,
.1.-,
4In Year 11, sample schools were selected on the basis of the most
7'21cent information available. However, when selected districts and schools
were contacted by thi\District Supervisor, new schools may have been found.
In addition, sample schools were sometimes Found to have closed or to have
J
-slIN changed grade ranges such that the schools no longer contained eligibles
for the particular age classes for which they were selected. These changes
were reported to the RTI sampling staff and the file schools was updated
to reflect the current information.
New schools which were reported to the RTI sampling staff were admitted
to the Year 11 sample on a, probability basis. The sampling procedures, by
which this task was accomplished are documented elsewhere 141.
Procedures were also followed to properly handle schools that became
eligible for a new target age group sample due to grade range change.
In Year 11 an additional ..three schools were selected into the sample
as a result of these updating procedures. Table 2-10 lists the number of
new schools that were added to tire sampling frame and the number of these
schools which. were,seleeted. The same information is also given for sample
schools with grade range changes.
2.4.1.3.2 Sample Adjustments for School'Nonparticipation
2.4.1.3.2.1 Reasons for Nonparticipation
Nonparticipating schools may be. classified into these three main
categories:
(1) Closed scholia;
(2) SchoOls lacking age class eligibl(s;
(3) Refusils.
4
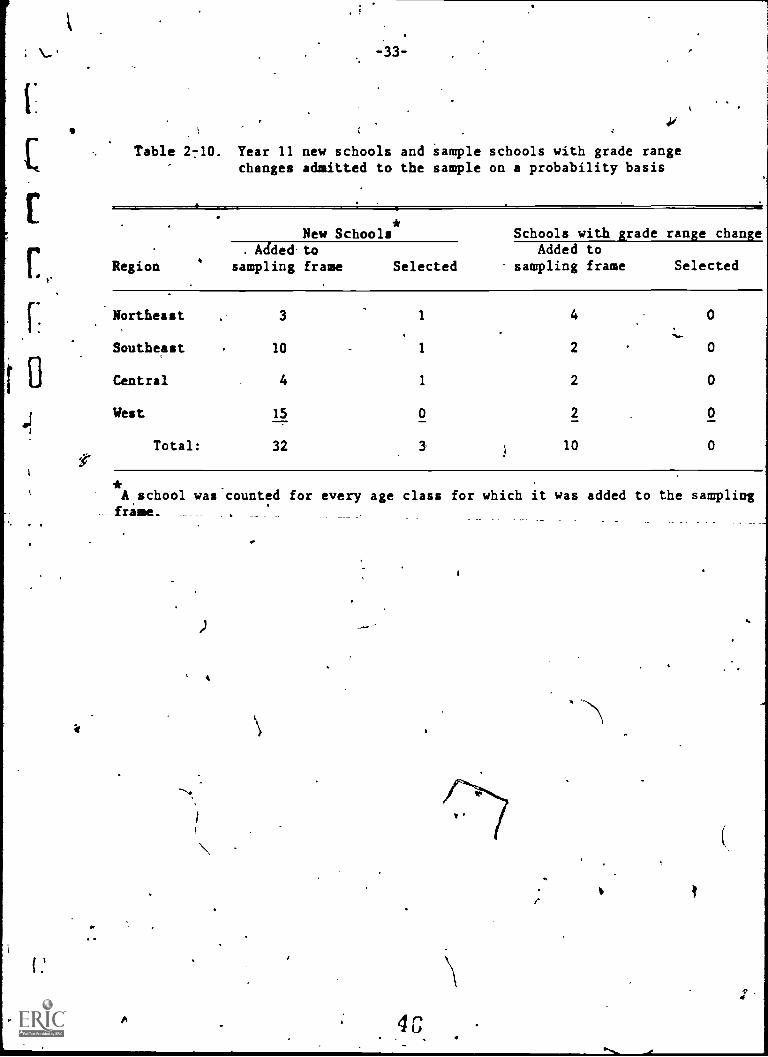
-33-
Table 2 -10. Year 11 new schools and sample schools with grade rangechanges admitted to the sample on a probability basis
New Schools* Schools with grade range changeAddectto Added to
Region sampling frame Selected sampling frame Selected
Northeast 3 1 4 0
Southeast 10 1 2 0
Central 4 1 2 0
West 15 0 2 0
Total: 32 3 10
*A school was counted for every age class for which it was added to the sampling!rase-
A
4
4C
V
p

4
-34-
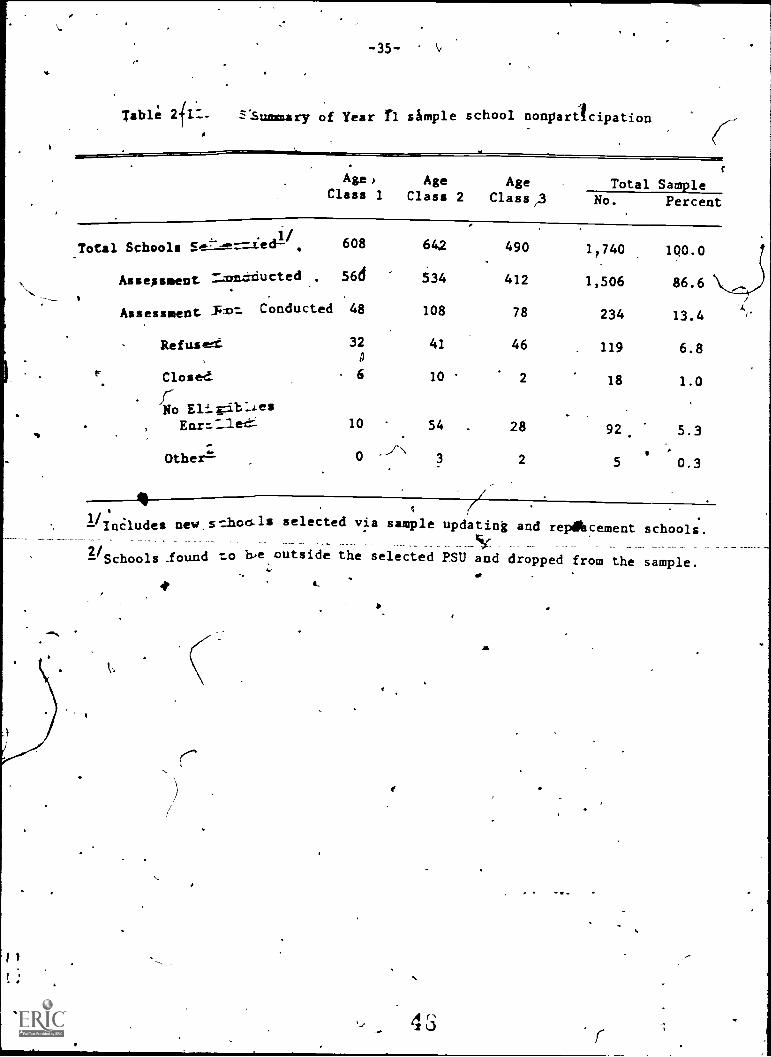
Table 2-11 rizes school nonparticipation in Year 11 of National
Assessment by age ''c ass. Approximately, 13 percent of the selected, schoolsA
did not, participate in assessment. Percentages in each nonparticipation
category are also shown in table 2-11 for the oterall sample.
2.4.1.3.2.2 Selection of Additional Schools as a Result of Original
Sample School jlefusals
In Years 01 through106, approximately 1,000 schools were selected per
age class. In an effort to keep travel costs tp a minimum, the Year (7'
through 11 scl2oo 1. samples were designed so that Approximately 500 schools.
were selected per age class. As a result,.the Year' 07 through 11 schools
were assigned more packages. per school than in previous year.. Since the
number of Year 11 sample schools was considerably reduced, school refusals
were especially critical. In manyAllises, the refusal of a school resulted
in not enough schools remaining in the PSU to take the allocated packages
and maintain group sample sizes of 16. As schools refused, the remaining
schoolt2in the PSU were examined. If not enough schools remained to main7
tarn group sample sizes of 16, then replacement schools were selected. A
total of 51 replacement schools,were selected. These schools are listed by
age class and region in table 2-12.
2.4.1.4 Use of the Principal's Questionnaire Data
Dita from the Principal's Questionnaire for selected and participating
school were uspe far a number of different purposes. Some of these
purposes included estimation of the number of age class elig/bles in,each
school; determination of the member of split or modular_ sessions for each
school; and estimation of the type of community (TOC), derived size of
community (HOC), and size and type of community (STOC) indices for each
sample school. A detailed explanation ts to how the ppncipalis
4;
-35-e
Table 211:- S:Summary of Year fl simple school nonparticipation
AgeClass
1/Total Schools co---L.=r--ied 608
Assessment r..immanucted . 566
Assessment _PDT. Conducted 48
Refuseet 32
r Closed 6
/1 Includes new.sshon-ls selected via sample updating and repObcement schools._
a/Schools _found to h.e outside the selected PSI) and dropped from the sample.
No Elig:fi.b:.J.es
Enrs:_lee. 10
Other= 0
Age1 Class 2
AgeClass,3
Total SampleNo. Percent
642 490 1740 190.0
534 412 1,506 86.6
108 78 234 13.4
41 46 119 6.8
10 2 18 1.0
54 . 28 92 5.3
'-j-\ 3 2 5 0.3

-36-
Table 2-1 , Numbers of Year 11 replacement schools411
tion/ortheast
Southeast
Central
West
Total
Age C=lass 1
1 1
0
123
5
Age Class 2 Age Class 3 Total
6 6 l'3
4 2 7
3 . 2 5
4 i 26
17 19 51
ifr
-37-
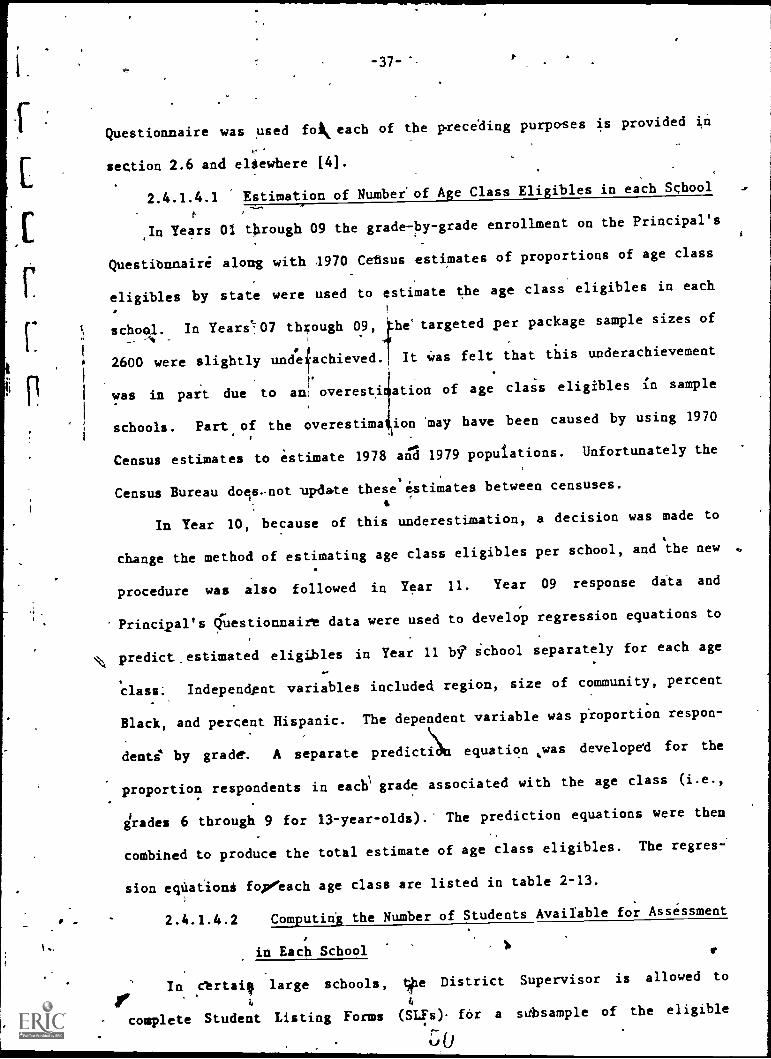
Questionnaire was used fokeach of the preceding purposes is provided in
section 2.6 and eltewhere [4].
2.4.1.4.1 Estimation of Number'of Age Class Eligibles in each School
In Years 01 though 09 the grade-by-grade enrollment on the Principal's
Questionnaire along with 1970 Cetsus estimates of proportions of age class
eligibles by state were used to estimate the age class eligibles in each
school. In Yearstf07 th;ough 09, he targeted per package sample sizes of
-
2600 were slightly undeiachieved., It was felt that this underachievement
was in part due to an!'overesti ation of age class eligibles in sample
schools. Part of the overestimaion 'may have been caused by using 1970
Census estimates to estimate 1978 an 1979 populations. Unfortunately the
Census Bureau does-not update these estimates between censuses.
In Year 10, because of this underestimation, a decision was made to
change the method of estimating age class eligibles per school, and the new
procedure was also followed in Year 11. Year 09 response data and
Principal's qUestionnairt data were used to develop regression equations to
predict, estimated eligibles in Year 11 b? school separately for each age
class: Independent variables included region, size of community, percent
Black, and percent Hispanic. The dependent variable was Proportion respon-
dents by grade. A separate predict& equation was developed for the
proportion respondents in each' grade associated with the age class (i.e.,
grades 6 through 9 for 13-year-olds).' The prediction equations were then
combined to produce the total estimate of age class eligibles. The regres-
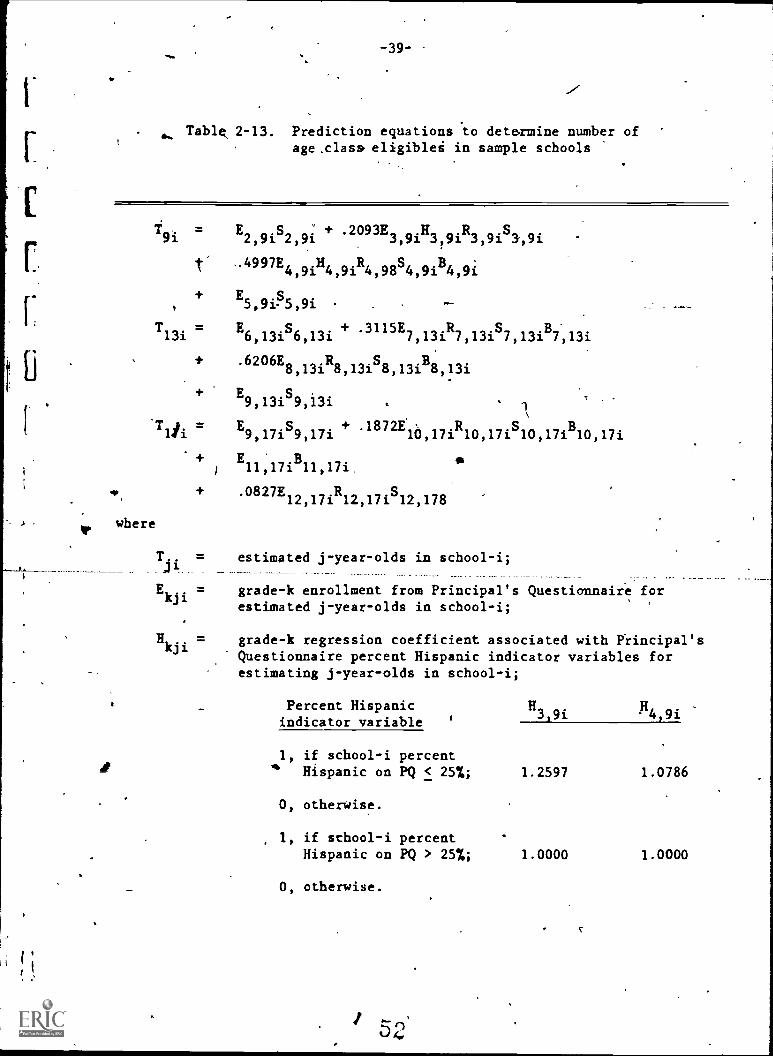
sion equation* fop"each age class are listed in table 2-13.
- 2.4.1.4.2 Computing the Number of Students Available for Assessment
Ln Each School
In etrtai, large schools, Vie District Supervisor is allowed to
complete Student Listing Forms (SLFs). for a subsample of the eligible

/a
-38-
I
students rather than ill. SLFs are forms on which all eligible students
for a particular samplft school are listed. Whether subsampling of the
student list in the sample school is allowed is noted on the PSU Control
Sheet by a digit other, than one (1) appearing in column 9 of the form. The
number appearing in column 9 is the count interval to be used in the sub-
sampling process. Column 8 lists the start number for bhe subsampling
process. The procedure by which the entries' in column 8 and 9 are computed
are documented elsewhere [4].
2.4.1.4.3 Restratifying Sample Schools Based on the TOC Index.
Within each PSU sample schooli were ranked on the basis of their TOC
index from most extreme to least extreme type of community. The TOC index
for each school is computed from data supplied on the Principal's
Questionnaire.. The procedure to compute the TOC index is documented in
section 2.6.2. The derived size of community (DOC) was input to the package
assignment computer software. The DOC ,_index is a means of classifying
schools as to size of place and locjikon with respect to urbanized areas of
large cities. Using the DOC index and the TOC indexitchools were ranked
from most extreme to least extreme type of community.
For each schog, the expanded enrollment was computed as the estimated
number of age class eligibles divided by the selection probability for the.
school liven the PSU. The expanded enrollment was summed over all schools
to obtain a quantity called the total expanded school edrollment for the
PSU. In addition, two quantities which were computed at the time the
secondary sample was selected utilized in the restratification protess.
These quantities were:
A = the frection of the age class eligibles lotted in theoversampled region of the PSU;
-39-
Tablk 2-13. Prediction equations to determine number ofage.class eligiblei in sample schools
. .H .R19i
E2,9i
S + 2093E2,9i 3,91 3,91 3,91
S1,9i
-4997E H R S .114,9i 4,9i 4,98 4,91 4,9i
where
+E5,9iS5,9i
T13i = E .S + .3115E R S .86,131 6,13i 7,13i 7,13i 7,131 7,13i
+ .6206E R S .B8,13i 8,131 8,131 8,13i
+ E S9,13i 9,13i
Tlii = E9,17iS9,17i + .1872Ela,17iR10,17iSio07010,17i
+ E B11,17i 11,17i
.0827E12,17i
R12,17012,178
T.. = estimated j-year-olds in school-i;J1
Ekji
= grade-k enrollment from Principal's Questionnaire forestimated j-year-olds in school-i;
Hkjigrade-k regression coefficient associated with Principal'sQuestionnaire percent Hispanic indicator variables forestimating j-year-olds in school-i;
Percent Hispanic H3,9iindicator variable
1, if school-i percent11 Hispanic on PQ < 25%;
0, otherwise.
1, if school-i percentHispanic on PQ > 25%;
0, otherwise.
H4,9i
1.2597 1.0786
1.0000 1.0000

-40-
Table 2-13. ,Prediction equations to determirtenumber of
age class eligibles in sample schools
-(continued)
Rkji
= grade-k regression coefficient associated with region
indicator variable for estimating j-year-olds in school-i;
t. .
indicator variable
R---2---
!2 ill:
R8 17iRegion R4 9i 13i
R10 12,17i
R
4
1, if school-i in
.
Northeast Region; 0.6588 1.1309 0.6875 1.2328 0.7766 1.5433
0, -otherwise.
1, if school-i in. Southeast Region; 0.8174 1.0639 1.1069 0.6114 1.1116.0.7627
0, otherwise.
1, if school-i inCentral Region; 1.0471 0.9791 1.0430 1.1013 0.6876 0.6760
0, otherwise.
1, if school 1:4400 1-;0000- 1-4040. 1- 0000 1.0000
West Region;
0, otherwise.
Ski = grade-k regression coefficient associated with size of
community (SOC) indicator variable for estimating j-year-olds
in school-i;....
. SOC S2 9i
S3 9i 54 gi
ss 41. S6 13i
S, 0 .7,13
indicator variable --i-- --I.--
1, if school-i in 0.0110 0.8005 1.116 0.0137 0.0227 0.784
\0
0, otherwise.
1, if school-i in 0.0059 0.7669 1.1077 0.0059 0.0300 0.948
SOC 2;
0, otherwise.

f.
I
V
-41-
Table 2-13. Prediction equationsuto determine number ofage class eligibles in sample schools
(continued)
S3 9iSC
916-.
S6 13is7
s4 9i
S541 13iO S2
indicator variable
1, if school-i in 0.0071 1.0088SOC 3;
0, otherwise.
if school-i inSOC 4;
0, otherw
1, if school-i inSOC 5;
0, otherwise.
0.0070 1.1729
0.0162 1.0000
indicator vspc
ariable
_S8 13i
s9 13i
1 if school-i inSOC 1;
.0, otherwise.
1, if school-i inSOC 2;
0.9949 0.0136
1:114; 0.0080
0, otherwise.
1, if school-i in 0.9901 0.0042SOC 3;
0, otherwise.
1, if school-i in 0.9704 0.0059SOC. 4;
0, otherwise.4.
1, if school-i in 1.0000 .0.0010SOC 5;
0, otherwise.
54
1.0514 0.0050 0.0193 1.0512
0.9954 0.0028 0.0210 1.2352,
/1"Nks%%4e,
1.0000 0.0043 0.0291 1.0000
s9417i
s,10 17i
s12 17i
0.0246
0.0171
0.7062
0.6848.
.3561
1.0137
0.0072 0.9373 0.8831
0.0109 0.2324 0.8395
-gob
0.0220 1.0000 1.0000
4

Ilk
a
-42-
0_Pred ctionAbquations to determine niEber ofage c ss eligibles in sample schoolI
(continued)
Igrade-k regression coefficient associated with Principal'sQuestionnaire percent Black indicator variable for estimatingj-year-olds in schodI-;i;Of
PerceneBla4 4indicator *ariable
1, if school-i % Blackon 'PQ ism' to 24%;
0, otherwise.
. ,. if schoolti-% Black1(li
,
PQ is 25 to 49%;
;02 0, otherwise.
if.school-i 7, Blackon fQ is- 50 to ra;
it10, otherwise.
1,, if school -i % Black.0 is 75 to 100%;
0, otherwise.ti
411.
V
BB4;91 ' 133_B8 13i
B10 17i
1:1443 0.7963 1.1074 0.754,1
.
1.0729 .9382 0.8883 1.1933
0.8860 I.2928 0.7949 1.7700
1.b000 1.0080 1.0000 1:0000
1'
1,17i
0.5574 41011:
Art 0.5631
0.5833

4
-43- .
1116,411r.
the fraction of the age class eligibles located in the
nonoversampled region of theiSU;:17
= .1 - A.
An oversampled poststratum was formed by summing the exp4nded enrollment
4
for each school down the list of ranked schools, until this sum exceeded
A times the total expanded school enrollment for the PSU. The oversampledIt
stratum then consisted of all schools included in this sum. The
remaining schools were placed in the nonoversampled poststratum. A fraction
of the total number of group packages for the replicate and the age class
was then allocated to the oversampled! poststratum. This fraction was
ZA +2A
Bwhere A and B were defined earlier. The remainder of the packages
were allocated to the nonoversampled poststratum.
*
It should be 'noted that when A, the fraction of the age class eligibles
`located in the oversampled region of the PSU, equals one (1.0000), then B
equals zero (0.0000), and all schools are placed in the oversampled post-
stratum.' Furthermore, all Packages aYe allocated to the oversampled pc4t-t
stratum. When A equals zero (0.0000), then B equals one (f.D000) and all
schools are placed in the nonoversampled poitstratum. All packages for the
replicate and the age class.are then allocated to the nonoversampleil post-
stratum.
2.4.1.5 Package Allocation
2:'4.1..44 Standby Schools.19
4
Schools having fewer than the designated number of eligible respon-
dents for the administration of a group package were specified as standby .
schools. Each tandby school, receilld at most one group administered
1/dpackage from the planned number of group administered packages for the PSU.
Many standby schools received only some portions of a group admiistered
rs 5 6

-44-a
package. The determination as to whether a standby schSbl was to receive
16 copies of the package to be administered-or a action of this number -
was made to be consistent with the weights for other packages in the PSU.
All standby schools from each PSU w e placed together .as a separate
part of the nonoversampled poststratum (or oversampled poststratum if a
nonoversampled poststratum was not defined for the PSU). -Oversampled and
Onoversampledpoststrata have been previously defined in section 2.4.1.4.2
The standby schools ks a group were allocated packages from the total
packages allotted to the nonoversampled poststratum in proportion to the
aggregate expanded enrollment for all standby schools. The package allo-
c i n for the standby schools as a group was then apportioned ;Along the
idual standby schools in proportion to their expanded enrollment.
When it was pecessary to apportion the 16 copies of the package among
several standby schools, each school's proportionate share .of the copies
vas computed In terms= of expanded enrollment.
2.4.1.5.2 Checking-the Feasibility of the Tentative Package
41
Allocation.
For nonstandby schools within each poststratum, the tentative package
allocation was compared with the maximum number of packages which that
school could absorb. When a package allocation for a given school, was
determined to requiri more eligibles than were present in till school, the
package allocation for the school was reduced to the maximum that school
could take, and the remaining packages were proportionately allocated among
the remaining schools. The procedure by which these remaining packages
were allocated is detailed elsewhere [4).
2.4.1.5%3 Assigning Packages to tchools. Olfe the package allocation
was determined for each school in theySU, the actual package numbers were
5"
1
1
-45.'
,assigned from a'random permutation of thecligits 1 through ki, where ki Nas
the number of distinct group packages for age.class-i. The group package
numbers were-assigned to. the TOC-ordered sampleschools from the random
verm'ufation according to the number. of group Packages assigned to each
school. The randtm permutation was used once and then repeated in a two-
replicatereplicate PSUI it was used once and repeated twice in a three-replicate
Psi .
Finally-, the package assignment foreach school in a PSU was printed
by the computer. A package assignment summaryform was also prineed. An
example of the school package issignment.formandthepackage assignment
)
summary form are included in appendix
2.4.1.5.4' Student Selection Procedures.
A simple random sampling procedure was used to select sample students."
'The Student Zisting Form (SLF) was an 8k" by 111v-formliSting up to 25
studeqts per form. The listed students were numbered consecutively and
\
sample students,wereselected using a random number table provided oh)the
pa-Ckage assignment form (see appendix E).*The student selection procedure'
i.Odocumented elsewhere [S] (6].
In Year 11, the group session sample size per school varied from 16 to
25. The sample size was varied in order to control sample size by type of
t community (i.e., different types of commUnities-yieId different respOnse
rates). Croup session .sizes were also varied for, the related purptose of
equalizing student weights separately withih theoversampled and non er-
r
sampled strata.
The group sample'size for each school waS computed. Let Z be an
estimate of the target population. The group package sample size for
school-i was then computed as

v
4
where
S.1
G
f G R.1
P.1g.M1
2,592for
z
5,184z
-46-
nonoversampled substratum;
°verses:pled substratum;
(2.1)
the number of group administrations for one replicate(i.e., for 9-year-olds, G = 11; for 13-year-olds,G = 15; and for 1Z-year-olds, G = 14;
R.1
= the. number of age class eligibles for school-i;
P. P(PSU) x P(School-i PSU);
githe number of group administrations assigned to
school-i;
M response rate by SOC as computed from table 2-14.
to Year 11, the group sizes in equation 2.1 were updated prior to
student Selection when the true age class enrollments, say Ni, had been
ascertained. Knowing the Principal's Questionnaire enrollment estimates
R., the1
updated
packagesampleisizeS.as computed from equation 2.1 permitted the
9timate to be made as
ni
= Si. (Ni 4)
with roudaing to the nearest integer. Upper and lower bounds for the n.1
..-.
were set to avoid adding additional group administrations on one end and
7.' A
fa ling short of the targeted- size on the other. The upper and lower
bounds were set at 25 and 16, respectively. A table was proviled on the
package assignment form which gave tt ...pdjnsted group session size associ-
ated with specified ranges orNi. (See appendix E.)
As noted earlier, an additional package assignment form wai'prepared
for 17-year-old assessment (see appendix E). This fort allowed studehts
who had entered school after the 17-year-old sample had been selected and
.5 ,
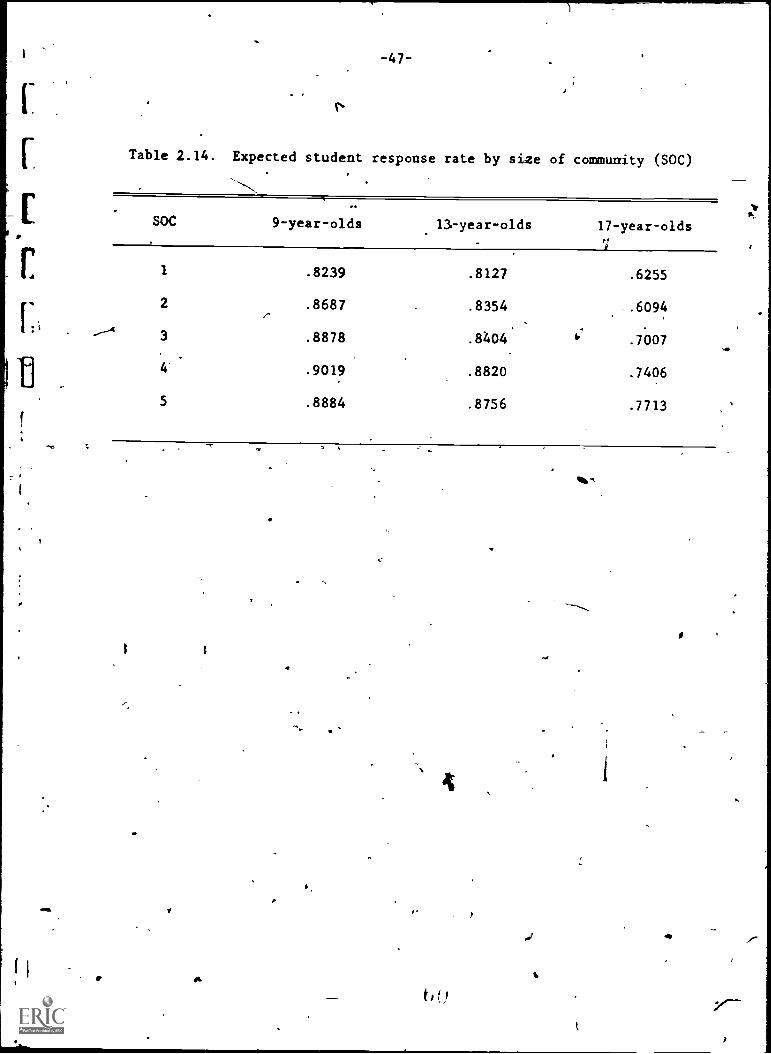
-47-
p
Table 2.14. Expected student response rate by size of community (SOC)
SOC 9-year-olds 13-year-olds
lr
17-year-olds
1 .8239 .8127 .6255
2 .8687 .8354 .6094
3 .8878 .8404 .7007
.9019 .8820 .7406
5 .8884 .8756 .7713
t.)

-48-
before assessment had been conducted a chance. to enter the sample. The
17-year-old student samples were select%d during the 9-year-old assessment
to allow 17-year-old schools more time to prepare for assessment. The
additional stude4ts were sampled at the same rate the original samples were
selected. litablejas prepared for tile package'assignment form applying
this sampling ralVto additional numbers of eligibles up to 30. Additionalf
tables of random 'numbers were supplied on the fbrm. Once the number of
additional eligibles to be selected was determined from the table, the
eligibles were selected by numbering the list of additional eligibles and
applying the supplementary table of random numbers. The packageordering
which appeared on the o ginal package assignmedt form was reversed on the
supplementary form and use to assign th. .itional selected eligibles to
packages. Packages are usually af. : ste 'allowing the administration -
order. Reversing this order allowed the scho. more time to contact addi-
tional students selected through the updating p ocess.
2.4.1.5.5 Assessment Completion Rates.
The target sample size for each package was ,592 respo. ents. The
actual sample sizes per package in Year 11 are recorded in table 2-21. For
9-year-olds, the actual sample sizes varied frost 1 to 5 percent above the
ktarget. fir 13-year-olds, the
-percent abovli
the target. For 17-year-o,d
drfrom 3 percent belo the target to 2 percent
sample varied from S to 12
, the actual sample sizes varied
above.
2.4.2 Field Operations
2.4.2.1 Support of Feld Operations
Field support activities are designed to assist the field staff to
collect gliality data. Field support _activities for Year 11 were as
follows:
61

I,
f
First, RTI's sampling staff wrote letters, made visits, and/or made
phone calls to selected school, district, and State officials to obtain
their cooperation on an as-needed basis as requests for assistance were
received from the field operations staff. When aMbiguitiEt arose, it was
also the RTI sampling staff's responsibility to'determine, by checking
secondary frame listings, precisely which school buildings were selected
into the sample.
Second, the RTI sampling-staff altered package assignments as required,
because of a'school refusal or a shortage in number o eligible studentsfin
a given school. Notice of such changes were transmitted to National
Assessment, the Scoring Cohtractor, 1D'strict Supervisor (DS), and thewJ
field staff. The RTI sampling and survey operations staffs cooperated to
resolve discrepancies or missing information on Principal's Questionnaires
br PSU Control Sheets received from the field. Such discrepanciei were
resolved by mail or telephone. Copies of Principal's Questionniaies and
PSU Control Sheets can be found in appendixes A and D, respectively. A
*Third, many sample schools, particularly those in Age Class 3, were
found to contain modular sessions or several separate sessions. These
sessions were termed split sessions, and each session was entered on the
computerized file of schools.
Fourth, machine readable files were updated througho he year to
reflect changes in school personnel, in school enrollment, in grade range,
in school participation status, and in district personnel. These updates
(/
were gineraly made before the ,package assignment was determined for each
A.PSU and each age class.

-50-
Fifth, lists of selected. schools, package identification numbers, and.
PSU Control Sheets were carefully proofed before delivery to RTI's NAAC
staff for distribution in the -field.
Sixth, the editing, codfng, keypunching, and checking of all school
worksheet data fori all three 'age classes were,a part of the field support
activities. Production of sample completion ,reports by PSU, Tion, and
District Supervisor for each age class was a further field support activity.
The school worksheet -data were the input daia for these reports. School
worksheet, data were also used to compute the weights for each age class.
Lastly, it was often necessary-for the sampling staff / to consult with
I
NAEP, DataScore, or RTI's NAAC staff and to prepare position papers and
working papers and to participate in ,ccasional special projects as a
result of such consultations. These activities, too, were a part of the
general field support activities.
2.4.2.2 QualityrCheck Activities.
In Year 11, .a probability Sample of 40; schools .was selected for a
quality check., Schools were selected from all three age classes to contin-
uously monitor the activities of the field staff. The purpose of the
quality check was to ascertain the quality of the Natioeal Assessment data
being collected by RTI and subcontractor, Westinghouse DataScote Systems.
More specifically; quality check activities kere conducted to determine:
(1) The accuracy of field staff transfer of student identifying data-from the Student Listing Forms (SLFs) to completed packages;
(2) The extent to which prescribed procedures had been employed inadministering packages;
The extent to \411411 SLFs had,been completed for all eligiblestudents enrolled `In sample schools prior to sample selection.
X'

f. a
The quality check sample was designed to Aiovide:
(1) At least one school per age class for each District Supervisor; 4
(2) -A ratio estimate of-....thecompleteness of the student sampling
frame across all age classes.
(3) .An estimate of the variance of the ratio estimate in item 2.
above.
A final 'report summarizing Year 11 quality check activities was prepared
And delivered to National Assessmen
2.5 Weight Computation
Octobe 1980 [7].
JN.,..)
School and package weights adjusted for nonresponse for each age class
were computed. School weights are appropriate for weighting background
data collected from all students-in a school. .-Smfkage weights along with
student ;esponse data provide ratio estimates of the population members whp
respond in alternative ways to National Assessment exercises. School and
package weights were computed as the reciprocals of appropriate selection
probabilties. The weights are computed using formulas and nonresponse
adjustments previously approved by National Assessment staff.
Following the assessment of each age class, a tape containing student
sample ,sizes by package was received from Westinghouse DataScore Systems.
Student sample sizes recorded from the School Worksheets were reconciled.
7Tapes containing the sample weights for each age class were mailed to
DataScore where the weights were merged with the lesponse data. Copies of
the merged &la tape were sent to National Assessment for analysis purposes
4nd to RTI for efficiency studies.
At the same time that the respective weight tape for each age class
was maped.to DataScore, intermediate documentation was mailed to NAEP for
review. The intermediate documentation inquded weight sums, weight distri-
buttons, by magnitude of weight, and explanations for atypically small and
t.
large weights.
6

-52-
Package and school weights are discussed in greater detail in -the
sections which follow. The formulas used to compute package and school
weights are reviewed in sections 2.5.1 through 2.5.4. The weight'computa-
tion software is documented in section 2.5.5. In section 2.5.6, the resul-
tant weights are summarizeda/1d compared with known population totals for
^an assessment of the accuracy of the sample.
2.5.1 Regular Assessment Package Weights and Nonresponse Adjustments.
Weights for 9-, 13-, and 17-year-olds assessed in the regular in-school
assessment were computed for Year 11 following procedures similar to those'
employed in previous year-s-.--..
Waij'
the weights for package-a administered, in school-i to student -j,
is defined as the.inverse of Paif the probability that student -j in
school-i is selected to take package-a, multiplied by appropriate adjust-
ments for student, school, and PSU nonresponse. The weights can be
expressed as
where
aij
//
Wai
ar
A.1
Palj
n .
al
n'
ai
the weight--for package -a administered tospOdent j of school-i;
the probability of selecting student-j ofschool-i for packige-a;
nal
, = the umber of students'selected fOr school-ifor package-a;
nai = the,number of respondents to package-a fromschool-i;
A.1
the combined adjustment factor for school andP9U nonresponse.
f;
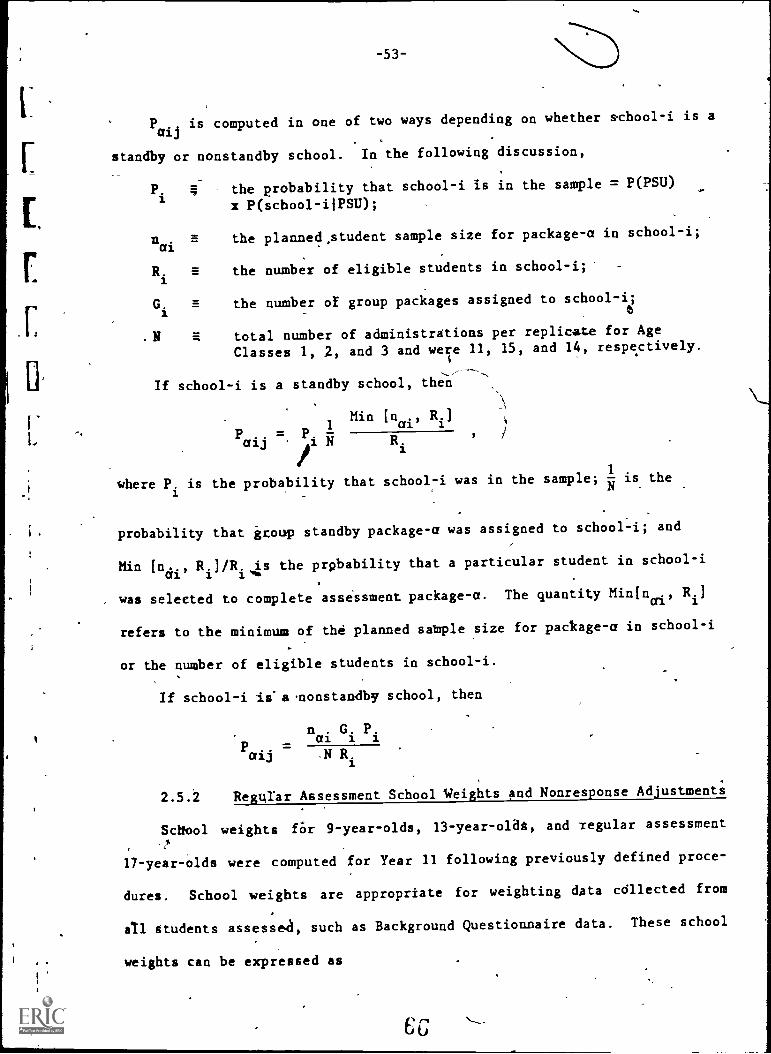
-53-
Paijis computed in one of two ways depending on whether school -i is a
standby or nonstandby school. In the following discussion,
Pi the probability that school-i is in the sample = P(PSU)
x P(school-i1PSU);
nai
s the planned,student sample size for package-a in school-i;
Ri E the number of eligible students in school-i;
Gi E the number of group packages assigned to school-i;t
.N F. total number of administrations per replicate for Age
Classes 1, 2, and 3 and were 11, 15, and 14, respectively.
0--
t
If school-i is a standby school, then
P P.N R.1
Min (11al
., R.]1
/
whereB.is the probability that school-i was in the Isample-'
is theN
probability that group standby package-a was assigned to school-i; and
Min Endi, Ri]/Ri,ls the prpbability that a particular student in school-i
was selected to complete assessment package-a. The quantity Min]nai, Ri]
refers to the minimum of the planned sample size for package-a in school-i
or the number of eligible students in school-i.
If school-i is'aonstandby school, then
nai
G.1
P.
Paij
=.N R.
1
2.5.2 Regurar Assessment School Weights and Nonresponse Adjustments
School weights /Or 9-year-olds, 13-year-oldt, and -regular assessment
17-year-olds were computed for Year 11 following previously defined proce-
dures. School weights are appropriate for weighting data collected from
all students assessed, such as Background Questionnaire data. These school
weights can be expressed as
cc ti

-54-
-A. R.1. 1
S11 P. In. '
where
it
A. = the combined adjustment factor for school and PSU nonresponse;
1
P.1
= the probability of selecting school-1 = P(PSU) x.
P(school-iIPSU);
R.1
= 4the number of eligible students in school-i;
m1 . = the number of respondent& in school-i.
The value m.1was computed as
G.
m. = II n'.. ai
at'.
where. G.1
is the number of group packages assigned to school-i and n'i
isa
the number of respondents to package-a from
Thecombirtedadjustmenifactor,A.kfor school and PSU nonresponse was
-1
calculated as
Ai
= and I.1
I if a. > 0,1
0 otherwise.
In computing, the subscript-i indexes all sample schools in the PSU. These
formulas and specific nonresponse adjustment procedures are detailed in a
working paper [2).
2.5.3. Followup Assessment Package Weights and Nonresponse Adjustments
A nonrespondent followup assessment of Year 11 Age Class 3 was con-
ducted in March and April of 1980. Basically, the followup procedures
4
consisted of returning to all 17-year-old sample schools achieving less

It
than a 75 percent student response rate on a day following regular assess-.
sent. One or two packages for each Class 3 school had been designated as
followup packages using probabilitX sampling procedures.. When the District
Supervisor returned-to the school, he administered the deignated packages
to 41 selected students who were located and had not been previously
assessed.
Development of weighting methodology- for followup respondents is
documented elsewhere [3]; this section formulates the weighting procedures
associated with the Year 11 in-schocIllionrespondent followup assessment of1011
. 17-year-old students.
For initial respondents_ (students who participated without followup
contact) in followup schools, package weights were computed as
A.
F Fal(c) aij
. aij ,
-S
f where Fai(c)
is a weighting class nonresponse adjustment factor describedI. .i.,,
.
..later in this section.
The weight formulation which follows is applicable only to respondents
'who did not initially participate in followup schools. Since there were 14
distincegroup packages administeied to 17-year-olds, the weight fOr follow-_
up package-a administered school-i to student-j is
PA: 14 R. R.1. wF A
Pi GFF . .
K. Fn /
al(c1) aijFai(c) '
al
wkiere I.Pi the probability of selecting school-i = P(PSU) x
P(school-iIPSU);_14
K = the total number of_students selected for group packageadministration in schoil-i, namely,
6S

1.--
0
G.
.
.Ai= I
(
ft
_ 3.
nai ;
.
.. aei
..Ni
i
\_ /
rat number of regular packagesassigned to sehool-i;
,
--,_
= the =number of followup packagesassigned \to
school-i;s,,...s.,.
Ri*
= the number of eligible students inschool-i;n
F.
the :number offollowup students assigned to
package-a
alin school -i;
-56-
,
lb
G.1
RI the .umber ofeligible,followup students in
school-i.The value R misay becomputed' as
G.,.Iji..-- II (n
ai - n'ai
)h
Weighting class nonrponseadjustment1 are based
on computing theratio",of the sum of weights
for all samplestudents' to the sum of weights
4) forrespondents within a category
or class;Weighting class
adjustments41(
are the form ofnonrespbnse adjustment used for Year 11 weights in followup
schools. A weightisg class-c was definedfor each
package-a as
,./IW niic aij ai=Fai(c)
I WI n t. *I . WP n 'F.
aij alaij al
.
t.'
where n Fis the number of
followuprespondents to
package-a inschool-L.
To controlthe/number of students who might
attehd a followupsession, the
number'of followup students selected for package-a inschool-i (nai) was at
'Fmost 40. The numbers nai and n
ai were obtained bydividing the actual
numbers of followup students selected and assessed by thesampling
fractionrequired to At-ample
to 40.
.1%
Theweighting rlass-c for
package-a was definedas all
followup schoolswhere package-a was administered.
Subsets of this total set were also

°"
f.
r
I4
-57-
considered based on region, size oilcommunity, and region by size of commun-
ity. All subsets were rejected because no subset contained at least 2
schools where followup was planned to be conducted.-
15.4 Follownp Assessment School Weights
02.5.4.1 Initial School Weights
Initialithool weights were formed by removing the number of respond-
ents frdm the regular school weight and substituting the number of students
selected, i.e.,
m.1
SI = S1 i K.
1
The value K. is the number of students selected from school-i and is1
computed_' as
K.11
n .
1 al.aci
where q.al411
. is the number of students selected from school-i for paokage-a.
The comparable,nonresponse adjustment is
K. .. .
m + m1 1
wherela/Pithermberoffonwuprespondentsskinschool-i;jis the sum
ofVgioverallfollowuppackages;aruirtaiwas previously obtained by
dividing the actual number of followup students assessed by the sampling
lbinNval required to subsample to 40. The nonresponse adjustment is
applied to the initial school weight to obtain-
a
mi K.. ro.IA 1
S. =Si K Si1, K.
m.+ mF.1 F
m. + m.1! 1 1 i

-58-
15.
2.5.4.2 - Followup School Weights
The followup school weight can be expressed as
EAl R1 Al R1
SI -1 1
P. K. F=
1
P. K.= S.
1
1
K.=
* ISi
1 1 R. 1 1 11
.7
where R. = the1
number of eligible-followup students in school-i. Thus,
the nonresponse adjusted followup school weight is
A. R. K. A. R. m.FA 1 1 1 1 1 1 IASi = =
Si= S.
1 P. K. F P. F 1 F 1
1 1 m. + m. . i En. + m. m. + m.
2.5.5 Documentation of Weight Computer Software.
i i
1
1 1 1 1
1
'Package weights and school weights were calculated for each school
that participated in National Assessment. Extensive editing of the input
data preceded the weight calculations. Data obtained at the time of .SUa
definition and selection were brought together with data collected through-
out the assessment year to produce the weight files; the sources of data
ranged from school principals to Census files. The large volume of data
processed during anassessment year required that efficiency and ease of
use be prime considerations in file construction and data handling prdie-
-dures. The calculation of weights and the production of the weight tar
were the final steps in the process.
2.5.5.1 Master File Structure and Content.4
bk
rThemlster file contains data for all schools and districts selected
for Year 11. There'is'a single record for every unique school and district
record for every unique district in the sample. The master file is basi-,
cally a name and address file; however, some additional information is
contained on the school records for each age class in which the school is
to participate.
hi
L
ti
-59-
Machine readable tables were prepared describing the variables on the
school and districIitrecords, the positions of the Variables on the records,
and the laigt of each variable. The tables are used as input to subrou-
tines which read and update the data in the master file as requested.
A district or random access method of procedding the master file is
used; therefore, directories containing pointers to the various records are
required. The directory of PSUs has pointers to the various PSU direc-
tories, and the directory for a single PSU has pointers to the data records
for the schools and districts in the PSU.
2.5.5.2 Data Preparation
%
In preparition for the computation of woights, data must be `drawn
together from several. different sources. The data sources are elaborated
in the sections which follow. Data were collected from the field and
generated in machine readable form at RTI throughout the assessment year.
When the assessment for each age c ass was completed, data were sent to RTI
from DataScore for reconciliation.
2.5.5.2.1 Principal's Questionnaire, Package Assignment, and School
Worksheet Data Files414
.Principal's Questionnaire data were4
Collected from the school princi-
pals for every participating school and recorded on a disk file as input to
the package assignment and weight programs. The, data were edited for4
consistency, and'-validity checks were performed whereappropriate: An,
example of the Principal's Questionnaire is included as appendix A.
A record was generated by the package assignment' program for every
participating school. This record contained the package nulpers which were
to be administered in the school at the time of assessment. Upon comple-
tion of =assessment in a school, the District Supervisor filled in 'and
1.4

-60-
I
returned to Rtl: a copy of the Schtl Worksheet; an example of the. School
Worksheet is included as appendix B. The data entered were as follows:
(A) Package numbers for packages administered;
(B) Planned and actual package sample size;
(C) Total number of eligible studenislin the school;
(D) Number of ,students identified by the school as non-English
speaking, emotionally or mentally retarded, or functionally
disabled;
a(E) Number of nonreaders;
(F) Number of Student Listing Forms (SLF).
A disk file was created containing the information extracted from ti
SchOol Worksheet. The allocation of packages indicated on the School
Worksheet file was Compared with the assignment generated by the package
assignment pr gram; inconsistencies were resolved. Consistency checks were
Aso performed on the number of sample students.
2.51.2.2 Data Frpm DataScore.
Data tapes containing the sample size .r)reOrded by DataScore were
received at RTI. Tly 13-, 9-, and f7-year-old tapes were received on
-February 26, April 7, and June 23, 1980, respectively. DataScore's data
tapes were compared with RTI's School Worksheet data files fot consistency;
discrepancies we cotrected as appropriate.
2.5.5.2.3 Nonresponse Adjustments for Lost Packages.
When a package was assigned to a.school in which age class eligibles
were present but no packages were administered, th41Kkage was considered
lost. 'Apt adjUstment for the lost package was made to the package weigh;
for that package in another school where the package was administered.' The
adjustment was made to. the appropriate package weight in another school in
6

the
-61-
sane __PL7r. 'or to a school in another PSU. Specific computetional pro-/
cedures for =king these . nonresponse adjustments are Arocumented elsewhere-
[2].
a
2.5.5.2.3-1 Input.
Input required for the-computation of nonresponse adjustments for lost
packages included the master file,. the tables'and direCtories needed.for
processing the master file, the package assignment data, the School Work-
sheet data,land a table of PSU selection probabilities.V
2.5.5.2.3.2 Output.
The output from the computation of the nonresponse adjustments was a
file of variable length records containing the PSU number, the package
number, and the adjustment for each package where appropriate-. 1In addi-
tion, a table was , printed listing component parts for each adjustment
factor,
2.5.5.3 Weight Computations.1
A package weight was computed for all packages which were admini-
stered; a school weight was computed if a school had at least one respon-
dent. Calculation of the weights took place after all basic editing of the
input data had been completed; in addition, a final edit was performed at
the time the weights were calculated.
2.5.5.3.1 Input.
The computation of weights required: (1) Principal's Questiolitiaire
data, (2) package assignment data, (3) School Worksheet data, (4) the
master file along with its associated tables and diiectories, (5) PSU
selection probabilities, ,and (6) nonresponse adjustments when necessary.
25.5.3.2 Output.
The primary output of the weight computation procedure. was the prelim-
inary weight file containing one record for each package administered. A
I 'I

4
-62-
summary of the weight calculations and selected data items for a school
were printed by PSU. rin addition, any errors that were detected in the
data were indicated in a printout. Also, a list of refusal schools was
printed so that a final check-
could be made as to whether appropriate
nonresponse adjustments had been made.
2.5.5.4 Weight Distributions
Once the preliminary weight file had been generated containing a
package and school weight for each tecord, a subfile of school weights as
produced containing one record for each school in which a package was
administered. Each of these files was used as input to the weight distribu-
tion program.
2.5.5.4.1 Purpose
The ordered listing of weights by package provided a means of easily
.spotting large and small weights. Statiitics such as sample size, mean,ti
standard deflation, etc., were computed for each package.
2.5.5.4.2 Procedure
,file was sorted by package and magnitude of weight before it was
used as input to. the weight distribution program. Sums of weights and
numbers of respondents were calculated for use in computing the required
statistics. A printout by package wad produced with the following items
listed for each:school:. (1) PSU number, (2) school number, (3) number of
respondents, (4) package weights, and (5) indication of standby status.
Statistics and a frequency distribution mere printed for each package.
2.5.5.5 Final Weight File
At this point .he remaining updates to data on the weight record were.
made. Errors detect during till calculation of the weights and generationA
of the preliminary weight file as well as errors detected in the weight

-63-
distributions were corrected. Once these changes had been made the result-
-)
ing file constituted the final weight file.
2.5.5.6 Data Distribution
RTI maintains two copies on tape of the package assignment file, the
Principak's QUistionnaire file,- the School Worksheet file, and the final
weight file. In addition, a tape of the final weight file for each age
class was mailed to DataScore. DataScore then merged /the weight and
response data tapes. A copy of the final merged tape was tailed to National
Assessment staff. Weight tapes for 13-, 9-, and 17-year2oi4s were mailed
to DataScore on April 9, April 29, and August 15, 19$0 respectively. The
format for the Year 11 weight tape is included as appendix C.
2.5.6 Weight Computation Results
.Tables 2-15 through 2-19 summarize the sample sites for,the packages
at ach age class. They also list the sum of the weights for each package,
the average weight, the standard deviation, and the minimum and,maximum
weight for each package. Seventeen-year-old summaries are thcluded for
regulair, initial, and followup respondents. In each case, the classifica-
tion is for all schools and for standby schools only. The sung of the
weights for the "all school" classification for each package is an estimate
of the target population for each age class. An average of these weight
sums represents another estimate-of the target population. Similarly for
the standby schools, the sum of weights for each.package is anestimate of
the target population in standby schools. Taking an average, of these
separate estimates yields an estimate of the target population in standby
schools. These_ estimates are summarized in table 2-20. Since the popula-
'4tion and sample percentages in table 2-29 are relatively close, the sample
appears to represent students from standby'schools in proportion to but
4- . slightLy,lower than the population proportions.
76

Table 2-15. summary of '§-year:-old package weights in Year 11
3ACICAGE
MUmPERSAMPLESlir
SUM OFlEIrwTS
ALL
AVERAGEWEIGHT
SCHOOLS :/
STANDARbOEVIAT108
.MI41MUMVEI*IT
MAXIMUMwricHT
PACKAGE'umdca
SAMPLESIZE
SUM OFWEIGHTS
STA4DOY
AVERASEWEIGHT
SCHOOLS
;TAN)AR)OVI4TION
MINIMUMWEIGHT
MAXIMUMJEISHT
O1 2619 1492735. 1111. 1189.5S1.
111.69 64.15.54 01 8 45030. 5629. 1.91 5528.79 5629.79
02 2673 3544989. 1326. 135.1c1 105.04 7177.91 02 49 176771. 3608. 1050.39 5622.96A
OS 2413 104!748. 1166. 1790.53 127.17 4769.17 05 8 11531. 1441. 1319.60 728.67 3579.33.
94 2548 3714265. ,14)3. 1054.61 111.60 7276.54 04 34 33992. 1000. 372.70 594.90 1441.32
05 2677 317".17%. 1207. 785.76 155.16 5271.19 05 1 4999. D. / D.0 4999.43 4993,43 c'N
.c-L
i
06 2425 1530'01. 1350. 981.31 119.14 6144'08 06 31 116035. 3743. 2091.62 764.29 5240.38
07 2467 1C9Cf89. 1159. 730.15 137.35 4638.64 07 3 4480. 1493. 0.58 1493.19 1493.33
08 4 266S 3341257. 1264. 1353.54 ;21.44 5630.47 ftil 0 O. O. 0.0 0.0 0.0 .
:9 265C 3516756. 1327. 1260.17 143.16 9549.27 09 12 64139. 5345. 2.25 5344.87 5344467
10 2711 43087185. 439. 693.04 119.04 4552.39 % le e 0. 0. 0.0 0.0 0.0
11 2623 3165933. 124. 817.115 .127.54 4396,16 11 0 0. 0. 3.0 0.0 0.0
\t
.Ik,
1.1 'et
I*
, D

.de
77, 7"1 rail;
table 2-16. Summary of 13-year-old package we
PACKAGEMUHBEn
SAMPLESIZE
SUM of
wpGm73
ALL SCOOL8
AVERAGE SIONARDWEIGHT DEVIATION
* *
MINIMUMHEIGHT
* * *
MAXIMUMHEIGHT
PACKAGENUMBER
* r *
SAMPLESIZE
01
02
03
04
0$
ne
2714
2785
2766
2759
271E
2760.
3340402.
3461420.
3253185,
3260495.
3274847,
3181717,
1217,
-1E43,
1176,
1182,
1208,
1153.
715:77
844;94
665 ;02
745,54
111:74
626,74
186*75
E01,05
140,15
171,66
157,294
175,10
6345,34
10957,22
4449,33
6224,25
5101,04
6844,81
01
02
03
04
05'
06
23
35
18
0
0
4
47 E73* 3335710, 1220, 707;47 144,54 4559,46 07 13
08 2710 3060408. . 1126, 674,33 175,92 6678.06 08 29
09 2857 1380816, 103, 61.24 236.11/ 6064,69 09 17'
10 2731 34fS047, 1254, 869.73 175,06 7744,85 -JO 15
II
it
i3'
274?
Evir
2786
/1452E0,
3342019.
1347875.
1259,
1216,
1209,
849.96
!31,84
13v.98
175,4
182,38
181'56
11312,42
'4702,32
8126.05
11'
12
13
17
11
7
14 277? 337E724. 1217. (12,1% 161,11 41566,31 141
i3 2414 3352289. 11501 546;58 07,56 4946,38 IS 3,
ghts in Year 11
.-C".
r * * STANDBY SCH000 * r r * 4
SUM OF tAYERAGE STANDARD MINIMUM MAXIMUM
WEIGHTS WEIGHT DEVIATION WEIGHT WEIGHT
74086, 3221,
193646, 5533,
69164, 3842,
0, Or
0,
23490, 5873,
71E77,
41154 3143*
97741, 5749,
78500, 5233,
105171, 6187,,
262058: 2362,
51084, 7298,
24416, 6104,
20899e 6966,
P".
2146,47
2807,06 2026,90
6345,34
10951,22
1135,72 3301,35 4664.33
0,0 0,0 0.0
0,0 0,0 0.0
1186,19 4431,31 6844,81
297,27 5001,07 6252,50 0'tr
2425,70 844,43 6678,06
15601 5001,93 5904,66
384,03 5017,83' 6174,20'
2D19,61 4582,11 11372.42
361,80 2004,11 26,401
565,85' 6966,0. 814,03
1641,57 5283,0 8566,31
3,38' 6966,38 6964,38

Table 2-17. Summary of 17-year-old regular responsdent package weights in Year 11
2ACKAGEYUMbEl
StmPLE:In
.
Sull 0F
cl;HTS
ALL
EvENLCEwE1GHT
Se,m0OLS
STANDA68DEVIATION
21,i1mUmwEIGHT
MAXIMUMWEIGHT
PACKAGENUM9E4
SAMPLESIZE
SUM OFdEIGHTS
STAND8Y
AVERAGEW:15M1
SC40115
STAVDAIDDEVIATION
mpilmi46.:13H7
mAxImu4a:1;1T
1 14',2.
1204713. 1263. 11C1.32 271.2 .9181.97 01 12- 38388. 5199. 1.98 3190.99 3194.58
:2 1508 1951118. 1229. 1138.73 271.1%2 11812.31 02 17 41464. 2439. 201.5.29 1535.43 9:E5.95
31630 ;,3bne,7. 1317. 1425.23 253.31 102^2.18 55 22 69031. 5158*. 14C1.69 22:2.8i 514:.94
:4 1621 i968182. 121,. 704.01 197.97 4722.14 04 ' 10 , 29765. 2'977. 2155.94 590.72 4567.04
:5 1611 1176. 528.*:2 271.52 30G3.39 (15 0 O. 1. 1.: C.2 1.:,
.18933. 0
,1 1526 1808884. 1112. 4E1.30 231.16 , 2443.60 OS 6 131117. 2194. 5.27 2197.75 2197.75
164:, 2:57963.1 1223. 1744.84 '23r.96 10202.18 E7 11 36734. 3339. 5.58 3319.41 1539.44
'H, 161.0 1827y5S. 1101. G79.20 '151.47 3513.58 OS 4 1573. 393. 5.24 343.3? 395.32 crcr,
r9
li
:539
1177
1988145.
1894394.
1292.
1223.
711.41
1131.3C
25P.41
257.87
8572.77
1E2E2.18
99
ID
0
14
, O.
44015.
0.
5144.
7.6
2221.54
0.0
658.79
5.5
55:9.45
11
12
1647
1637
21452,5.
1831721.
1303.
1122.
866.22.
540.1'3
266.7"
16!,.24
6'65.78
3999.71
11,
12
13
1
5259.
4000.
. 404.
0.
1.24
1.0
404.49
3999.71
4,,A.4h
5999.71
13 1518 1225714. 1142. 458.86 268.24 3137.91 13 n 0. C. 5.0 5.1 0.1
14 1010 2115187. 1283. 1176.16 207.07 112E2.18 14 0 n. 0. 5.0 0.5 1.0
bi
,
*

AACKAGZ4UMBFR
64 N
33
44
:5
,E
.19
/
r
ot
e.
SIMPLE'517f
912
715%
707
.712
43
817
(6
819
818
101
7'14
771
783
831
4 -
Table 2-18.'Summary of 17-year-old initial respondent package weights in Year 11
711.
"1 %. ALL S:HOOLSSTASTANDBY ATHO3LS
SUM OF AVERAGE STANDARD MINIMUM MAXIIIILM PAC4AGE SAMPLi SUM OF AV:RASE ST41)4R3 MINIMJM
WIGHTS WEIGHT /MAHON WEIGHT WEIGHT HUMBER SIZE WEIGHTS WEIGHT DEWIITION WEIGH(
if
",1,
t7
11143.?9. #1235. 497.80 I49.59 232C.I6 . 31. 0 _Et._ r. 3.0 C.:
.
i
..,
;)819442.. 131" 1128.44 164.35 8626.81 12 0 O. O. 3.0 7.0
a..
878394. 1239./. 545.99 1386(.9 2952.C9 13, C O. M. 1.0 r.1
1001189.0 126/V/'''''''' 507.72 153.12 2624.101 04 0 O. G. 3.0 8.0
ci66589. 1.21". 5 79 I44.P7 5189.66 35 I 5190. 0. 3.7 5189.55
1%92515. 1337. 5 .52 157.02 2551.61 0 06. 0 C. O. 3.0 o.n
961705. '13971.. 1131.114 145.74 8524.16 07 O. C. 3.0 _ . 0.3
1028E9. 593.83 155.26 3629.511, G9 0 O. O. 3.3 1.1
1'.51788. 1286. J 548.25 217.,40 3523.29 09 0,, O. 0., 0.0 Car 4
/
997426. 1161. 441.12 275.21 -2621.23 13 0` O. 0. 4.0. 0.0,ti
.1117961. 1451. ,1235.,38 214.12 10011.63 . 11 0 O. O. 0.0 C."
1134430: 14911 1199.68. 233.32 ' 8893.7213.72 12 V41; r;O. .0. 4.0 0.1
.%
27764. +1185. 1° 89.58 192.11 29j5,78 II C 0. 0;' 3.0 0.1
112247(.: 1351. 1060.84 111.86 9313.52 ' 14 0 O..
O. 1 0.0 0.0
MAXIMUMdEIGHT
Z.1
j.0
-.
3.0
5103.66
_ s,z!ollo
7..0
.2
- :.0
11o9
0.0
-11P0.0'
3.0
I.. 0.
,
_ .
1/4e.
r
0
-04

Tible 2-19. Summary of 17- year -old followup respondent package weights in Year 11
.)7.04AGC Sh4PLf SUM A1F ;,11r6liSE STAND/44n MINImUM MAXIMUM PACiAGE SAMPLE SUM UF AVERAGE STOOARO u1N1xj4 MAXIMUM
4JEcEi 1ZU wLICHTS VCICHT! 3EVIATIGN WEIGHT WEIGHT NUM3E3 512E 2E1GHTS WEIGHT DEVIATION WEIGH! 4:1Sr4t
'190 242691. 1717. 192.19 "..76.22 2114.51 :1 0 1. 1.0 0.0 :.0
.2 :27 !46674. 7C1.95 561.77 3381.37 0 3. O. 0.3 C.1 .1
3 173 25P414.4
493.^7 37)r.28 03 0 0. 3. 3.0 ..0
4 127 132444. 1437. '50.' 2521.80 04 0 O. O. 3.0 0.1
214 284'161. 8.25 229.35 5189.56 :5 1 5193. 1. J.0 51119.65 5189.66
Jr
ALL G:HoGis
14a2-31. 1,97.4 425..b 744.97 1926.90 Is 0. C. 3.2 J.1 C00
17 211 32Z052. 1517. 1722.16, 289:71 14A98.42 17 0. 1. 3.1 ' 0.1 2.3
FI 14;! 1813 4. 1311. 673.'3 155.26 4357.43 IN 0 O. 1. 1.0 c.r . J.0
r: 110 184921. '127N. 489.93 'J33.77 1875.09 13 0 0. A. 3.0 C.? 3.0
I193 3C1375. 1561. 6J4.69 573.:1 3C1C.2 1) C O. I. 0.0 1.0 t.!
11 -147 20057. 14.146 Si.m7 219.89 2521 8. 11 0 O. 1. 0.0 3.0 0.0
.
17 187 :A72"1. 1429. 1159 4'6 3.56.30 8739.0 12 0 . O. 1. 3.0 0.j "1. \
I) 256 315605. 1234. 528.41. 298.15 231 °.61 13 4
.
0. O. 3.0 0.0 .0
14 1
1
153 189422: 1238.
-
e431,51. 462.11
.
1886.17 14 01- O.
.
0. D.0
a_
6.T C.0
4
e
_____%
70i
STANDBY SC40)LS
0
Kr'
0
w
-1
t
aI

4-
7
*r..1
.. 4 -
Table 2-20. Comparison of population and sample percentages
in standby schools by age class
Category
Average weightsumPopulation Sample respondents
Sample
percentagepercentage
All Standby in standby All Standby in standby
schoolS schools schools schools schools schools
9-year-olds0
.
13 -yeast -olds
17-year-olds
3,339,332
3,298,143
1,957,038
41 544
61,794
.20,244
1.2%
1.9%
1.0%
29,103
41,574
22,529
146
196
110
0.5%
0.5%
0.5%
regular respondents :. 4.- f*
* I'
I7-year-oldsinitial respondents
1,029,567 .371 0.0% 11,085 ,1 0.0%
Cr.%4D'i
,
k. ^ *
17-year-olds --t"'
followup respondents
244,305 1 201 0.1%. 41,495 1 0.0%
A
Less than 0.05%.
0
0

-70-
The actual sample sizes compared with the planned sample sizes are
reported in Table- 2-21. rcentage differences between planned and actual
sample sizes varied froa. 4 ptrcebt below to 12 percent above 'the plAnned
4,
sample size.
Tables 2-22 through 2-26 present frequency distribution of package
weights y size of weight for all schools.Separate'tables are presented
for,9-, 3-,land 17-year-old regular respondents and for L7-year-old initial
and foll wup respondents. The entries for each package are numbers of
respondents for the pg(kage whste weights.W1 within the specified range.
Tables 2-27 through 2-31 sow comparable distributionsfor respondents
selected frog') standby schools only. All package weights in excess of 7,000
and all package weights less than 100 are documented in Tables 2-23, 2-33,
and 2-34. All school weights in excess of 600 and all school weights leis/
than 10 are alsodocumented in these tables.
p.
ti
ti

41.
7-1 r'si 7",
A.
Table.2-21. Summary of planned and actual sa e sues in Year 11 pf National Asseisment
Packagenumber
a.Age 9
Plannedsamplesize
Actual '
samplesize.
Percent*difference
Plannedsamplesize,
01 2592 2609 +1% 2592 /
02 2592 2673 +3% 2592
03 2592 2613 +1% 2592
04 2592 2648 +2% 2592
05 2592 2627 +1% 2592
06 2592 2620 +1% 2592
07 2592 2667 +3% 2592
08 2592 2665 +3% 2592
09 2592 2650 --+2% 2592
10 2592 -.... 2711 +5% V2592
11 2592 2620 +I% 2592
12 NA NA- NA ,.2592
13 NA NA NA 2592
14 '-NA NA NA ,=.2542"
15 NA NA NA ( 2592
Age 13
Actualsamplesize
2786
2785
2766
2759
2712
2760
2734
2719
2857
2731
2742or
2749
2786
2772
2916
%.
Age 17
-+J
-1
i Percentdifference
Plannedsamplesize
Actualsamplesize
Percent *
difference
+7%
+7%
47%
+6%
+5%
+6%
t5%
+5%
+10%
+5%
+6%
+6%
,., +7%
+7%
+12%
J
41Ik
.4.
2592
2592
2592
2592
2592
/592
25p*
2592
2592 .
25,9k
2592
2592
2592
2592
NA
$
2584
2545
2580
' 2546
2608
2588
2579
2611
2502
2543
2578
2637
2633
NA
-.0%
-2%
-0%
-2%
+1%
-0%
-1%
+1%
-3%
-3%
-1%
+0%
+2%
+2%
NA,
*(Actual sample size - Planned sample, size)/Planned sample size.
IL I
_ /. ..... i, ,J
t

0
Table. 2-22. Frequency distribution in number of respondents for 9-year-old package _weights in all Year 11 schools
a'
7ACriGE 1.- InJ.- b03.- 1000.- 15^C.- 2n00.- 2503.- 3000.- 4300.- 5000.- 6000.- 7000.-
'410'13E9
/UPP:R 93. 4 e37. 919. 1499. ;999. 2499. 2999. 3999. 4999. 5993. 6999.4
01 : 4':2 756 781 .13 107 117 82' 55 37 1) 0
C2 : 36' '841( 697 159 15P 114 148 0 20 1 9
.
03 n 387 9R9 631 ?5P 211 33 74 39 n
04 : 239 9n4 717 376 189 81t
108 ''' 0 18 33.
14
05 e Pt: 8',5 9 ?II ,no . 151 0 91 17 19 3 0
ni., 0--1
320 813 ?497 325 232 53 1C4 34 21 21 0
t.,
071 334 102 3 677 359 114 74 74 15. 3 o 4, 0
08 1 3f,9 94:- 715 72.91136 45 74 75 49 0
,3
09 1 3f 37? rt., 759 224 176 - 56 32 68 0 22
10 0 267 1044 P88 763 124 63 47 22 0 ti 0
iI I 0 335 765 366 71 42 136 25 0 0 0
"..
11 "I 7-I As i
4
a
# 00
A
e
(1 ''4,, ,o)
1
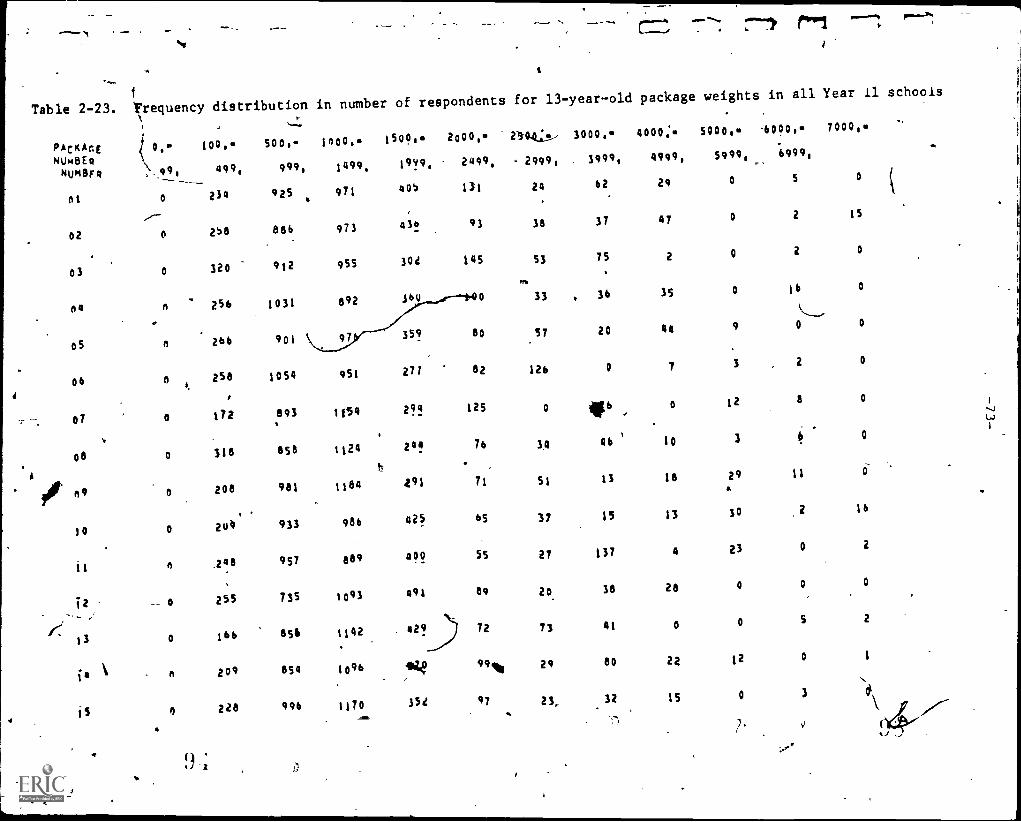
f
Table 2-23. 'requency distribution in number of respondents for 13-year-old package weights in all Year 11 schools
PACKA(.4
NO48E4NUM8,9
i
0,\ 99,
100.
499,
500999,
1000.-
1499,
01 0 234 925 971
02 0 2S8 886 973
03 0 320 912 955
till n 256 1031 892
05 n 266 901
06 0 258 1054 951
4
07 0 02 893 1fs9
08 o 318 858 1124
Ah
00t 09 o 208 981 1184
,
10 0 209 933 986
11 0 ,260 957 889
i2 __ 0 255 73S 1093
13 0 166 856 1142
14 0 209 854 1096
0 228 996 1170
1500
1919,
405
434
302
360
359
277
299
491
425
400
491
- 429
lige
351
38
145 53
0 33
80 57
82 126
125 0
244 76 3.446 10 3 0
71 51
65 37
55 27
89 20.
2000 2114;!..,
2499, . 2949,
13t 24
72 73
9 0 fill 29
97 23,
3000.
3999,
62
37
75
. 36
20
0
13
15
137
38
41
80
32
4000:
4999,
50001
5999,
-6000,e
6999,
29 0 S
47 0 2
a 0 2
35 0 16
'.._,44 9 0
1 3 2
0 12 8
16 29 11
13 30 2
4 23 0
28 0 0
0 0 5
22 12 0
15 0 3
7.
7000,
0
IS
o
0
0
0
0
16
2
0
2
1

al
'Table 2-29. Frequency distribution in number of respondents for 17-year-old
regular respondent package weights in Year'll standby schools ,
,
2,,ote6r :.- 1-.0.- r3C.- 1009.- 150:.,- 2:06.- 2507.- 3300.- 4000.-It t4LitpNumheR 99. 494. 43o. 44Q9. 1'199. 2499. 2999. 3999. 4999.
a 3 r 0 : 3 12 0
'1 . 1 , *C 15 C 0 P 0
7 r. 0 15
: 63
5
0
:6c 0 6 0
:7 1 0'11 n-
m0 e 0 0 0
0 0 0o
IC n0 0 0
11
1.2
0 13 rt
rt
0 0 0 C
3
130
0 0
14 0 30
0
S
5300.- 6000.-
5999. 6999..
0 ci
7\ .
C
0
)

. Table 2 -4. Frequency distribution in nu;114r of respondents fo;, 17-year -qld
regular respondent package weights in all Year 11 schools,
.4CK4GC
I.-'CO.-
IJM,CA,NUMBEP . 499.
01 P 73
12 3 136
:3 P 139
153
-6 1,7
0 137
n 239
'9 C 97
1'1 95
11 4, IA* 117
12 C 137
13 C 81
4
14 )7
500,
991.7o
10CC..*
1499.
1500.
1999.
2000ow
2499.
2500...
' 2939..
300C..
3993.
4000.-
4999.
5300,
5993.
6339:-
S319.
700D...
404 711 128 19 ' 0 43 0 3 4 2n
514 661 221 25 0 11 0 0 1 19
466 718, 211 90 3 28 13 7 7 18
539 612 145 103 27 18 0
_.499 656 2C3 71 33 '19 0 0 3
21 621 179 55 '23 0 C 3 a
46 9
4484 872 121 15 10 23 0 0 i 18
545 651 175 29 19 43
391 667 266 36 79 0 , 13
429 641 254. R~ 32 ^ 0 8 IA
45^ 116 221 62 16 .5 ' 42 19 0
.
577 654 1 ^C 63 0 21
53'3 698 2(.3' 6 0 10 0 3
40
521 617 VP* 7# 9 16 0 '' 0 0 to
4._./ I I4

-7-
Table 2-25. Yrequency distribution in number of respondents for lir-year-old
initial respondent package weights-in all Year 11 schools
2.1CKA:.,T43n9C14U1tUEF
0.- 130.,-
4C9.
,510.-
9,9.
100u.-
1159.
1533.-
1999.
2000.-
2499.
25C3.-
2999.i
/3300.-
399.....,
9.
4000.-
4999.
5300.-.
5999.
6090.k
5999.
70310.-
:1 ' .90.
S 74 2285
109 76 3 0 0 .13 7 )---0.,
1,-: 43 235 21e 167 28 0 0 0 9..
7
f ..
14
N
54 19E 237 159 51 14
rel 55 173 340 171 38 15 0 J 3
15 195 145 321 1'3 0 7 9 1
C6 56 ,19S 226 245 77 17 0 0
'7 1 34 178 25! 19G C 19 OP0 C x7 14
R 52 198 3'C 147 9 0 107 0 3 0. 0
C
'9 r, I 45 243 286 238 36 0 10, 0 C r
71 223 366 174 IC 9 0 0 n
0 54 161 3:3 197 43 0 13 0 C C i 13
/
74112 ' 34 139 282 215 58 a- 0 16
13 C 74 179 349 160 9 12 0 0 0 7
14Jib
231 325 197 32 14, 1 0 0 0 12
"4-J

Table.2-26. Frequency distribution in number of respondents fy.11-yearrold followup
respondent package weights in 'all Year 11 schools
14CK4G1uvliCR,Pi1ImuCR
, 0.-
99.
ice..
'440.--__
Loj.A
479.
inc;.....
1499:
1511..4.
1n91.
N 2130.-
2499.
7500.-.
2199.
3300.-
3999.
4300...
4999.
5300...
5999.
6010.-
6494.
7000..
.1_,11 / .1 1 53 U5 .0 2:', 0 r
.
0 0 7 7
0 CA I h4 34 75 27 n 17 o 0 0
:347 22 46 13 70 1 0 0 3
3 18 , 24 24 , 28 IB 15 1 0 '3
5 0 14 31 86 72 31
76 3' 10 .
iA' 43 73 r 0 r 0 ) 3 0
. I71
, IS 411 ., 83 3,1 12 0 ii 0 r 11
A
(N 3 27 73 11 22 3 3 1
'10 3 44 42 69
I" CA 53 7e 41 36 A3 !I 0
A
11 0 14 ip 'I 36 41' 23 10 a.
. 0 a1
12 J In ili 77 41 13 U 0 i 0 7 0 3
13 . 0 27 61 99 55 14 0 .4).
0 1 o
14 U. ' 21 29 51v.
53 3 c 0 o o 7( o
-
4
40.4.4.44.

I"
$
Table 2-27. Frequencydistribution in number of respondenes,for 9-year-old,
package weights 41\Year li standby schools
'ACK ACCvu.eorm
0.- 100.: 503.-
VUMLICR 99. 44099 999..
01 1 5
02 C 3
C3 1 C 6
C4 0 0 21
05 0 0,
06 0 0 1)
37 . 0 0
08 0 a J
09 0 0 0
10 . 0 0 0
11 n . 0 3.
PI ,/1
looc.-
1499.
0
14
0
13
-o
C
3
(7\
0
0
n
1500.-.
2000.-
2500.- s000.- 6000.- 74300Z
1999 2499. 2999. 3999. 4999. 5999. 6999.
0 0 0 0 .00
0 0 0 15 0 20 3
0 0 2, 0 0 0
0 0 0 aI
40
)0 0 1
0 0
,
0 0 3 o a 21 0 0 J
CF-......"` 3 0 0 3 0 0
0 / 0 0 0 0 0 0
0 0 0 0 12 0 r
0 0 0 0 0 0 5 0
2
0
,
0 0 0 - 0 0 0 0
I
.
1 i
A

V
Table 2-28. Frequency distribution in number of respofidents for 13-year-oldpackage weights in Year 11 standby schools,
,PACKAfq ..0. 100. 500,1 1000, '1500181 2000 , 2500: 3000,NUmBER
NUmBni 09, 499, 999, 1999.. 1999, 2499, . 2999, 3999,
01
02
03
09
05
06
07
08
09
-10
i4
is
1
4000,'
4499,
0 0.
0 10 II 0 0s
6
n o 0 0 _(.2 1.0 0 0 6
0 0 0 U 0 0 14 2
n 0 0 0 U 0 0 0 b
0 0 0 . 0 U o . 0 0 0
0 0 0 0 0 0 1
.0 0 0 "9 0 0 o
0 0 13 1 0 0 6 0
nu 0 0 0 0 0 0$ 0 0
n 0 0 0 9 0 0
0 0 0 0 9 0 0 0 4
0 0 0 0 9 5 6 0 0
*0 0 0 0 0\. 0 0 0 0
...n o 0 0 9 0 0 . 0 0
0 0 0 '0 0 0 0
I
tM
50005999,
611001
6999,
1000,.
, 0 5 0-
0 2 IS
0 2 0
o .0 0
0 0 0
1 2 0
12 '0
..3 6 '0
11 0 0
13
11 0 2
0 0 0
0 S 2
3 0 1.
0 3 0
101011M%
1
Mo.
03

J
OACKAGI4k1/14( 9 .
`11.1tthER
12r t'
3.
I
S
.7
'9
10'
11
1.23
Table,2.-30. Frequency distribution in number, of respondent for. 17=yearoldinitial respondent package weights in Year 11 standby schools
,94. 449,
A
L
1)
1.
n
/0
C 0
4
4
-999.1
a
n
2.
...
1 ,'\
1
3
11''
0 ,
:1499.
b
c
r
c
o
G
C
C
0-
0
0
151:^.-
''
,
it'
1059.
C
-.+
0
.. 1 _
,
...0
el
C
0
C
0
3
fi
0
21 rC.-
2499.
a
0
- 3
n
0
)31"1
(70:
0
0
.0
0
2500.-.
2999.
0
7
..-
a
a
C
3
1
11
0
3706.-
3999.
1
e
.0
C
0
.:0
'IP0
. 0
r
J
0
i
4999.
0
n
n
0
, 0 .
0
0
3
o
0
0
0
5999.1
.. 0
,
n
...1
1
C
r
C
0
1
0
603Ciiii '730'
63)9.
e
.....
1
2
0
)
3
V3
3
3
a
r,
c ?.r
I
a
1 .
C
1
n
0 1
cn
p
r --- ......
.1
Table 2-31. Frequency aistribution in number of respondents
weights in Year 11 standby schools,
ti
1
it
r"I
for 1'1- year -old followup' respondcAt package
OMITTED DUE TO CONFIDENTIALITY
dc
le

IF
Table 2-32,Explanation for small and large packaie'ind School weights for 9-year-olds'in Year 11
I
I
OMITTED DUE TO CONFIDENTIALITY
r
IN
....--Ob.." POW"

r-t,"1 .
Table 2-33-
Explanation for small and large package and school weights for 13- year -olTs in Yeart 11
OMITTET,DUE, TO CONFIDENTIALITY
4
Table 2-33
ixplagation for small and lar e package and school weights for 13-year-olds in Year 11
(continued)
4o
OMITTED DUE TO CONFIDENTIALITY
1
- if, tin
: ).
Explanations Cr small andjirge:package;end school weights for 17-year-olds in Year 11
Table 2-34
t1
OMITTEQ DUE TO-tONFIDENTIALITY6
15
4,
Explanations for small and large package and school weights for 17-year-olds in Year 11{continued)
ti j Table 2-34
I-
OMITTED DUE TO CONFIDENTIALITY'
16
of

-87-
Tables 2-35 through 2-38 are frequency distributions of school weightsNS,
in cumber of respondents for all schools and standby schools. Classifica-
tion is by 9-, 13-, Ihd 17-year-old regular respondents and by 17-year-old
I ,initial and* followup' respondents. The total numbers of respondents forA
these classifications according to tables 2-35 through 2-38 were, respect-
ively, 29,103, 41,574, 22,529, and 13,580. These totals agree,with the
sample size totals in table 2-20. All schodl weights in excess of 600 and
all school weights less' than 10 are documented in tables 2-32, 2-33 and
2-34. The sums of school weights for the age claises are'aummarized in
table 2-39. These figures were extracted from tables 2-35 through 2-38.
The figure in each case i an estimate of the age class target population.
It can be seen from this table that the weights estimated 103, 97, and'96
percent of the 9-, 13-, and 17-year-old target population, respectively,
estimated from Census data.
as
where
The proportion correct responses to NAEP exercise-k can be estimated .
Pk
Sak
n'laik
aijk aijki=1 j=1
Sak 'n
i=1
waijk aik
1
n' = the number of students in school-j taking exercise-k inpackage-a; -
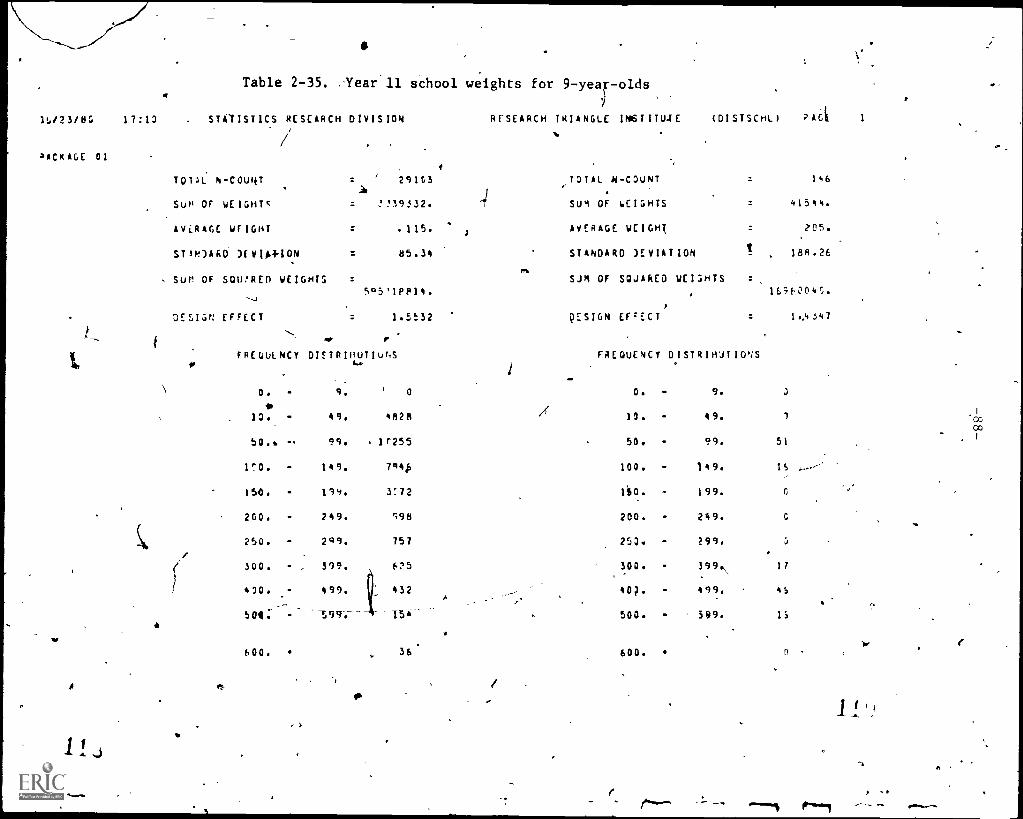
Table 2-35. .Year 11 school weights for 9-yeavolds
1t./23/8S 17:13 STATISTICS RESEARCH DIVISION RESEARCH TRIANGLE INSTITUJE (DISTSCHL1 ?AGE 1
//
ACKAGE 01
7014L N-COURT
SIJH Or wEIGH
AVERAGE WEIGHT
ST3H)AA6 pEVIHON
SUP Of SOWRED WEIGHTS
DESIGN EFFECT
291C3
= .!:,39332.
.115.
85.34
505'1PP14.
1.5532
,TOTAL N-COUNT
SUR OF WEIGHTS
AVERAGE WEIGHT
STANDARD )EVIATION
a.
SJR OF SCIJAkED WEIGHTS
DESIGN EFFECT'
146
41544.
755.
! , 188.26
16;60040.
1..4 .547
F RE (JUL NCTt 0Dis7RilioluNs FREQUENCY DISTRIHJTIONS
O. - 9. 0 0. 9.
13. - 49. 4R2R 10. 49. 71
CO
50.6 99. 11'255 50. 99. 51
10. 149. 794¢ 100. 149. 15
154. 199. 3:72 1i0. 199.
200. 249. 198 200. 249.
250. 299. 757 253. 299.
300. - 399. 6:15 300. 399., 17
410. - 499. 1 432 403. 499. 45
504: --- 15i' 500. 599. 15
600. e 36 600. tl
A
11;
ec
1

Table 2-36. Year 11 school weights for 13=year-olds
o9;01,84 1913T STATISTICS RESEARCH DIVISION
pAcKAnE 01
TOTAL NCOUNT
8UH/6F WEIGHTS
AVERAGE WEIGHT,,
STANDARD DEVIATION
SUM OF SQUARED WEIGHTS
DESIGN EFFECT
4_11514
1244141,
- 74.
4.16'187
3529498414
1,5490
7
RESEARCH TRIANGLE INSTITUTE
n.
(DISTSCML) PAGE i
TOTAL N.COURT
SUM OF WEIGHTS
AVERAGE WEIGHT
STANDARD DEVIATION
SUM OF SQUARED WEIGHTS
\--"DESIGN EFFECT
196
617941.
315,
a 151,26
2394;499,
1,2290
Ofw-
f
FREQUENCY DISTRIBUTIONS FR EQUENCY DISTRIBUTIONS
.
U.0, .9, 0 0, 9, 0*
kc
10, 49, 1114 10, 49, 0
5 1---\, 99, 24452 50, 99, 24
100, 144, 641u4 100, 149, 15
ISO, 199. 873' 150, 199, 6.200, 249, 444 200, 249, 14
250.' 2994 33S 25D, 299, IS.1.
300, 399, 235 3001. 399, TO
400, 499; 55 400, 499. 28
SOO, 599, 11 500, WI 15'
600, S *00, S
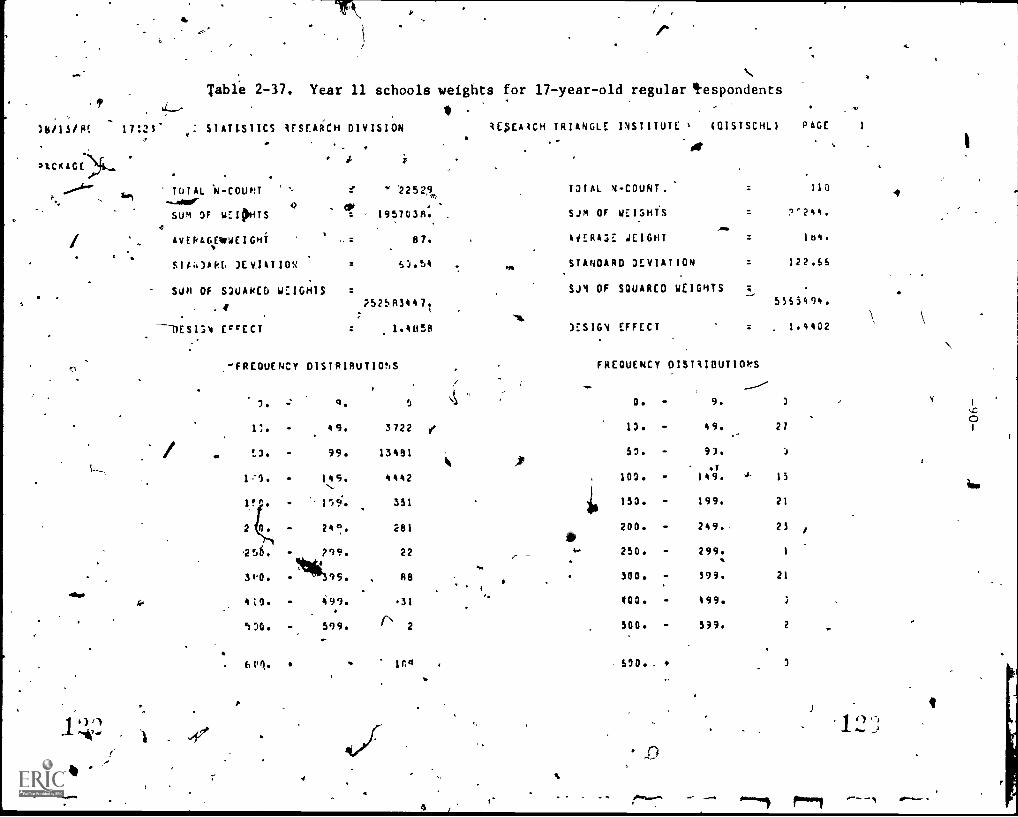
Table 2 -37. Year 11 schools weights for 17-year-old regular tespondents
$ ,
)8115/or. 17:21' STAT1SlICS irsrAicH DIVISION lEgAICH TRIANGLE INSTITUTE , 4DISTSCHL)
.0,4-* TOTAL 'N - COUNT e ' 22529,,, um -oar-
47
SUM OF w:104-4TS et , 195703a. .
4
/ AvERAGIpoWEIGmi,
= 87.
0
STA43API. 1EVIATION
SUM OF SlUARED W:IONTS
.
EorECT
5).54
7525115447.
1.,1118
PAGE 1
T3TAL N-COUNT. ila
Sim OF WEISHTS
4,44:1143E JEIGHT id4.
STANDARD DEVIATION = 122.55
SP, OF SQUARED WEIGHTS ;
5553494.
1ESION EFFECT = . 1.4402
-FREQUENCY DISTRIBUTIONS
3.
FREQUENCY DISTIIOUTIOkS
- -------
O. 9. 3 0 v1
1:. A9. 3722 we 13. 49. 21 1
E3. 99. 13481 51. 93. )
.1
1A9. 4442 103. 149. .k. 15ift
1'2. 159% 351 153. - 199. 21
210. 2A °. 281 200. - 2449.. 25 /
256. 799. 22 250. - 299. 1
Ilk31,0. 99. 148 300. - 599. 21
403. 499. 31 COO. - 499. 3
510. 599. r- 2 500. - 599. 2
6(1.. 1C # 510., 3
3

'8/13/8
,AtKAGE 91
?"1
Table Z-38. Year 11 school weights for '17-year-old initial and followup respondents
.^.
17:22 STATISTICS iESEAREH DIVISION iESLAitH TRIANGLE INSTITUTE (01SIsCHLT PAGE I
TOTAL N-COUNT = 138,
SUS' 0 wEIGOIS = 1273p7:.
4vERA6E 4E100 94.
ST44)A10 )1VIAWN 1158.54
SUM OF SWJAPED wEIGHTS =
1R34548356(,.
()ESL -in EFFECT = 153.5243
ArT3TAL N-COJNT
SJ4 3F WEIGHTS = 572.
AVERAGE dEIGHT = 2t6.
STANDARD DEVIATION = 41'4.56
SJM OF SQUARED WEISHTS327344."
EFFECT = 2.3ooD
FREQUENCY
..-/
DISTRIRuTIONS
. A
t ....
FiEDIYENTCY DitTlIBUTIONS
0. - 9. f 0. - 9,
/ I:. 49. .1 10. - 49. v
50. *9. ig 53. - 99. 1
\_.
110. .149. Q 100. .: . 149. 3
150. - 199. t 150. 199.
210. - 249.. 15 200. - 249.
25C. 299.. C 250. - 299. 1
300. - 399. '15 ' 300. - 399. I
C
410. - 499. 14 400. - 499. 3
.5CO. - 591. 7 500. - 10 599. 2
670. 13520 600.
1 0 :-J. -

Table 2-39. Proportion of target population estimatedby Year 11 sample'
9-year-ol 13-year-olds
.7 year -old
regular,initial
and followuprespondents
f
1970 Cens s estimate oftotal p pulation
* 3,458,333 3,639,614 3,982,310
Proportio of age classenrolled in school.
.99 .99 .90
Proportion of age class enrolledwho are in grade's surveyed
.99 .98 .98
Proportion NAEP-eligible*
.96 .96 i .96
Target population estimatefrom Census data
1
.3,253,432 3,389,907 3,371,902
Target population estimate'from school weights
3,339,332 3,298,143 3,230,910
Proportion of target populationestimated by sample
1.03 .97 .96
stimated from Year 09 data.
4/
1
.
_

Xaijks
4
waijk
Sak
-93-
1, if student-j's response bo exerci kin package-aadministeredin school-i was rect;
0, otherwise;
the weight for the package-a containing exercise-kadministered in school-i to student-j;
the total number of schools where the package-acontaining exercise-k was administered..
/The effect of unequal weighting on the variance of NAEP estimatert\y:
can b6' approximated by the following ratio:
akn
1=1 W!n.
ijk alkI
I.S
ak
.
1=1
I Waijk
n
1where n is the package sample size, i.e.,
Sak'
1 n'.k
.
ali1
This statistic approximated the unequal weighting effect of t0 NEAP design
as colpared to a self-weighting sample. Ideally, the ratio should be
1.000'. Table 2 -40 lists'this ratio..tor each package at each age class.
The ratio ranges ,from 1.1612 to 1.9014. .T110-)average ratio. is 1.5415,
1.3634 and 1.4773 for 9-, 13-1 and 17- year -olds; respectively.

4.
al6
Table 2-40. Unequal weighting effect of gAEP design comparedto self-weighting sample
9-year,-olds If 13- ear -olds X17-year -olds 4Package.numbtr Ratio Package number 'Ratio Package number Ratio I
1
.
01 ..., 1 .6621 01 1.3458 01 1.759602 1.4970 02 1.5242 02 1.8585,03 \N 1.4598 03 1.3235 03 1.729104 .1.5649 04 1.3978 04 1.339305 1.4238 05 1.3473 05 ' 1.201606 1.5282 06 1.2955 06 1.1718,07 '1,3968 07 1.3361 07 1.727108 1.6942 08 1.3587 08 1.276409 1.9014 09 1.4246. 09 1.302210 1.3703 10 1.4808 . .. 10 . 1.780211 1.4575 11 1.4556 11 1:4416
1 12 1.2700 12 . 1.2315Average 1.5425 13 1.2802 13 1.1612
14 . 1.3425 14 1.703115 1.2692
*
J Average _ 1.3634 Average 1.)73
N
II
Mow

-95-
2.6 Mkt TOC, and STOC Classification cif Schools
WNational Assessment reports results by the following seven..size and
type of community (STOC) categories: extreme rural, low metropolitan, high
metropolitan, Main big city, urban fringe, medium city, and small places.
These categories are defined in Table 2-41. Assignment of NAEP respondents
to STOC categories is a form of poststratification by school based on (1)
size and .location of place as determined from Census data, maps, and ZIP
code information, and (2) estimated percentage distributions of students by
location of lgole community and parental occupation category. In the determi-,
nation pf STOC categories, sample schools were first classified by derived
size of community (DOC), a set of four categories based on size of place
Aand location with respect to urbanized areas of large cities. In order to
identify Sehools in the three extreme types of coiiunity, each school was
assigned to one of four TOC categvies. The STOC classifications were made
ti
by considering the DOC and TOC classifications together, Detailed descrip-
tion of procedures for determining DOC, TOC, and STOC classifications
follow in section 2.6.1 through 2.6.5. Results.of the DOC, TOC, and STOC
classification are reported separately by age class in section 2.6.6.
2.6.1 ,Rst
The following definitions ot were used in Year 11:
Code Class Limits
1 . Big City (BC) : Within the city limits of a city withpopulationli greater than or equal to
200,000; within the city limits of one1 of two or more central cities of an
urbanized area (UA) with combined popula-tion greater than or eqiial to 200,000. ,
Urban Fringe
.
Outside the city 'limits but within theUA of a Big'City (BC).

*4
-96-
Table 2 -41. Kati
ccmmu
1
nal assessment sizeld type'ofty (STOC) reporting categories
4ze.and type ofcommunity STOC) Reporting
categories, category Description'
1
2 :
Extreme rural
Low metro
3 High metro
4 Main big city
5 Urbin fringe
6 Medium city
Small place
Sample schools o segmentst in commiitieswith a population less than 10,000 and inthe 90-99th percentiles of the extremerural index.
Sample schools or segments in a citytt orthe urbanized area of a city with a popula-tion greater than 200,000 and in the 90-99th percentiles of the low metro index.
Sample schools or segments in a city or theurbanized area of a city with a populationgreater than 200,000 and in the 90-99thpeceTles of the high metro index.
Sample schools or segments within the citylimit y of a city with a population greaterthan 200,000 and not classified as highmetro or low metro.
Sample schools or segments in the urbanizedarea of a big city but outside the citylimits and not classified as low metro orhigh metro.
Sample schools or segments in a city witha population between 25,000 and 200,000not located in the urbanized area of abig city.
Sample schools or segments in a communitywith a population less than 25,000 notlocated in the urbanized area of a bigcity or classified as extreme rural.
* Portions of this table excerpted from General Infqrmation Yearbook,NationalAssessment of Educational Progress, Report No. 03/04-GIY. December 1974.
t The segments mentioneI here relate to area segments from the household samplesof'young adults conducted in Year 01 through 05 and Year 08.
In this table the term "city" can also mean twin or triplet central cities ofan urbanized area.
1

-97-
1 3Medium City (MC) Within the 'city limits of a place with
total population greater than or equalto 25,000 but less than 200,000; thisplace mus'not be in the UA of a BC.
4 Small Place (SP) Open country or a place with a totalpopulation less than 25,000; this placemust not be in the UA of a BC.
2.6.2 TOC
TOC codes were assigned on the bapis of percentage.distributions
obtained/from Principal's Questionnaire data, together with consideration'
of the DOC codes already assigned. An example f a Printipal's Questionnaire
is included as Appendix A.
Answers to Question 2 of the PrinCipal's Questionnaire for each agg
class provided principal's estimate, of the proportions of the studentsI
living in each of three size-of-community categories:
Code Description
k In a rural' area (a total population .of less than 2,500).
In a place with a population of 2,500 to 10,000.
C In a place with a population of over 10,000.
Replies to Question 3 gave the principals" estimates of percentages
of parents in each of six occupation categories:
Code Description
Professional or managerial personnel.
B I Sales, clerical, technical, or skilled workers.
' Factory or other blue collar workers.
D Farm workers.
Not regularly employed.
On welfare.

For each of the three age groups, the following procedure was used to
assign schools to the four TOC categories:
2.6.2.1 Extreme Rural - tOC 1. ,Each school was assigied a rural
index. based on occupation percentages, DOC code, and size of community.
The index was calculated by the use of the.formula ED -
letters represent the percentages coded from question 3 of
2A) Y; the
tte Principal".
Queitionnaire; high values of this index result from relatively highpercent-
ages'of persons employed in agriculture and relatively low percentages in
professional, managerial, and blue c)aellar jobs.subject to the constraints
that
(A) the school had to be DOC 4;
(B) the percentage farm workers had to be nonzerogory D on the Principal:a Questionnaire);
(C) the size-of-community percentages had to beareas and zero for all other categories(Question 2, categories A and B, respectively,Questionnaire).
(Question 3, cate-
nonzero for ruralexcept small townon the Principal's
Schools not qualifying were assigned indices of (-200). Schools were
then arrayed in descending order of rural index with cumulatiVe sample
4sizes recorded, and schools included in the first 10 percent of total
sample size were assigned a TOC code of 1.
2.6.2.2 Extreme Inner City-- TOC 2. The same method used for TOC 1
was used for TOC 2, with the formula (E + F - A) providing high inner city
index values for schools with relatively high percentages unemployed and on
welfare and relatively low percentages in professional and managerial
occupations. The only constraint was that the school had to be in either
DOC category 1 or 2.)
2.6.2.3 Extreme Affluent Suburb - TOC 3. The method and constraint
used Were the same as for TOC.2, with the formula [A - (C + E + F))6
.1 r-0)
providing high
percentages of
-99-
4
affluent suburb indices for schools with relatively highaprofessional' and managerial
personnel and relatively lowpercentages of blue collarworkers, agricultural workers, unemployedpersons, and welfare recipienti.
2.6.2.4 Others - TOC 4. All schools not assigned to categories 1, 2,or 3 wereclassified as TOC 4.
2.6.3 STOC
STOC categorieswere defined to represent simple combinations of DOCand TOC codes:
TOC 1 = STOC41TOC 2 = STOC 2TOC 3 = STOC 3
DOC 1 + TOC 4 = $TOC 4DOC 2 + TOC 4 ='STOC 5DOC 3 + TOC 4 = STOC 6DOC 4 + TOC 4 = STOC 7
2.6.4 Formation of DOC Codes
By the time that the STOCcategories for Year 11 were to be defined,the basic
information for each school and the replies to the questions onthe Principal'sQuestionnaires had been recorded on disk. For each of thethrill, age groups a printout of school
identification data, addresses, andZIP codes was made, and DOC codes were then defined on the basis of 1970census populations and locations,as shown by census sups, road saps, ZIPco4e saps, and theNational ZIP Code Directory.
For efficiency in the assignment of DOC codes, a set ofstandardized'procedures was developed and used.
2.6.4.1 Assignment of DOC Codes Using Size of Community (SOC) Codes.Using a list of PSU numbers and the names of countiesincluded, the particu-lar procedure .to be followed for each PSU WA% determined and recorded.
I
-100-
A. For each PSU classified as SOC 1, as indicated by the second
digit of the PSU number, the DOC code was determined on the basis of post
office Sddress, ZIP code, ZIP code map, census map of the urbanized area,
and populations of places not in the urbanized area, using the flow chart 1
shown in figure 2-1.
B. For each PSU classified is SOC 2 or SOC 3, the total population
of the SMSA central city or cities' wasAbtained from a 1970 census report,
and for thse with cities having.4ota1 populations of 200,000 and over the
same procedure was followed as for SOC
C. For each remaining PSU classified as SOC (2'or SOC 3, names of
places "with populations of 25,000 and over were obtained from a census
report, and using a ZIP code directory, each place was identified as to
whether it had a single ZIP code or more than one ZIP code; the names of
the places and the ZIP Lode information were recorded.
1. All schools in places with populations of 25,000 or overhaving a single ZIP code were classified as DOC 3.
2. For each, school in a place with more than one ZIP code, theZIP code, the ZIP code map, and a map showing the cityLimits were used to establish its location; if the schoolwas located inside the city limits, the classification wasDOC 3; if the school was located outside the city limits,the classification was DOC 4.
3. All other schools were classified as DOQ 4.
r\'''N------,
D. For PSUs classified as SOC 4 end SOC 5, county populations we e
obtained from census reports; for each PSU with every county under 25,000----N,
total population, all schools were classified as DOC 4.
E. For SOC 4 or 5, PSUs with one or more counties whose populations
were 25,000 or over, the procedure for SOC 2 or 3 outlined previously in C
WAS used for the assignment of DOC 3 or DOC 4.
tr"
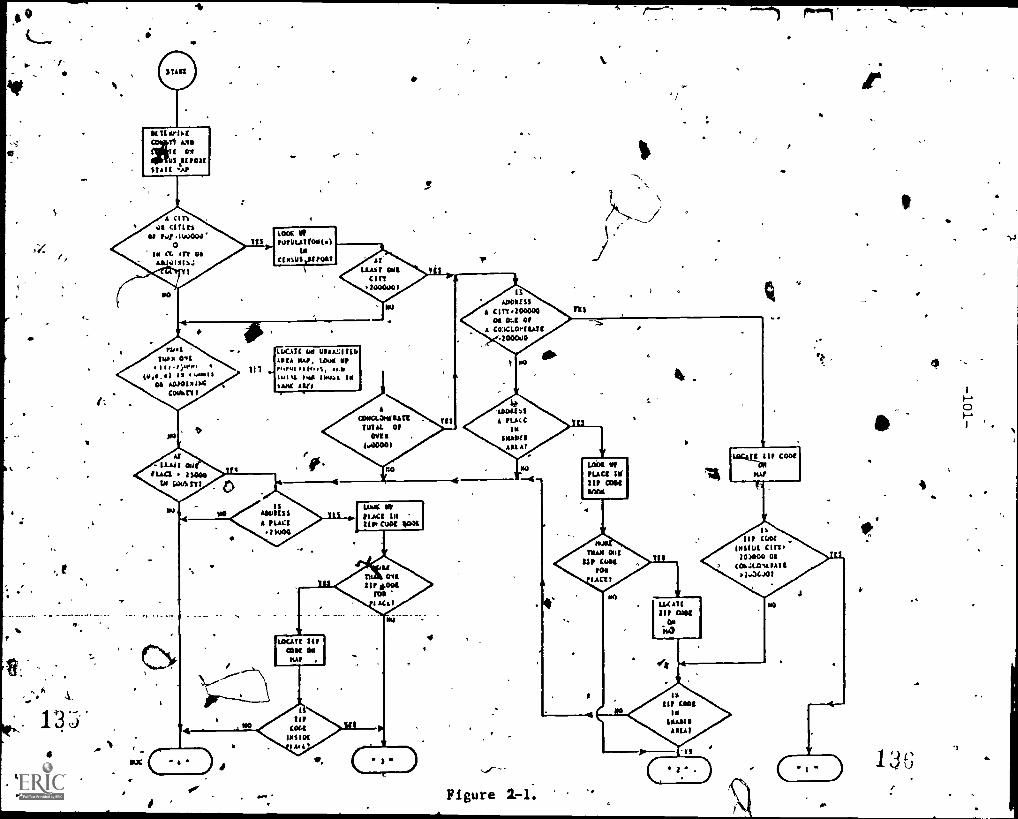
a,
0
1
LOOK VII fOtULATroli(s)
CCoSOyffOlt
V
IS
AlsOlffiR
A CITY400000OR 0.E Of
A coucorturc10ocua
P11
4.
r",
MetRuss Oil.114-10oso
10.0.sI Is 4,410ti
DS AAJOIsISCCOWRII f
LOGIC UV UORAMIIII.tots MAI. legs of
U rfo41Ailow ALI,lolki. t.IN ilitna II
)AMC Alifi.
A
CONCLAVIRArtTUTU Of
Iv00001
WORIsSPLACEII
MAWSARAM
AT
- IRAS suStan CROW
El catrArtt
1.00( UP
PLACE 10RIP CONMCA
W4C4EL01,11 COW
kAl
Wet WrtAa IIIRIP Con ROW
4
IVAN 001
RJR COO(
LACE,
LOCAtt CifODOR GORAF ,
4
A
1
ZIP
COLE
IM IDE
AI I
IS
ZIP COINIISAW,ASLAt
Figure 2-1.

eso
-102-
2.6.4.2 Assignment of DOC Codes Using Post Office Classifications.
Using a computer printout of the n 'kmes and addresses rf.,Ithe sample schools,
the subsequent instructions were Lon
A. Using a computer printout list, the following steps were takin:
1. Lines were drawn to separate and identify each PSU;
2. The assigned procedure for each PSU was identified andrecorded;
3. For each school not requiring the use of a ZIP code, the DOCcode was recorded at the left of the page just before thePSU number.
ti
B. For each school not assigned a DOC code,
1. The post office address (except names of SOC 1 centralcitie-and other obvious ones) was located in the ZIP codedirectory;
2. If the Ilbst office address was a branch, e.g., "branch ofBoston," then the Appropriate branch name was recorded;
3. If the post office address was a station, e.g., "BostonStation," then the appropriate station name was recorded;
4. If the post office address was a "regular" post office and
(a) If only one ZIP code was recorded, then a "1" was-recorded;
(b) If more than one ZIP code was recorded, then a ">2" was. -recorded.
C. For each school not assigned a DOC code after step B, a location40
was determined as follows:
1. If the pchool had been marked ">2",- using a ZIP code map, acheck was made to see whether the school was located insideor outside the city limits of the place involved;
2. If the school had been marked "1", it was assumed that the'school was located within the City limits of the place;
.3. A DOC code was assigned on the basis of location:
If the school- was located inside a ciNOWOr UA conglome-rate with a population bf 200,000 or over, then theschool was assigned a DOC code of "1";
(a)
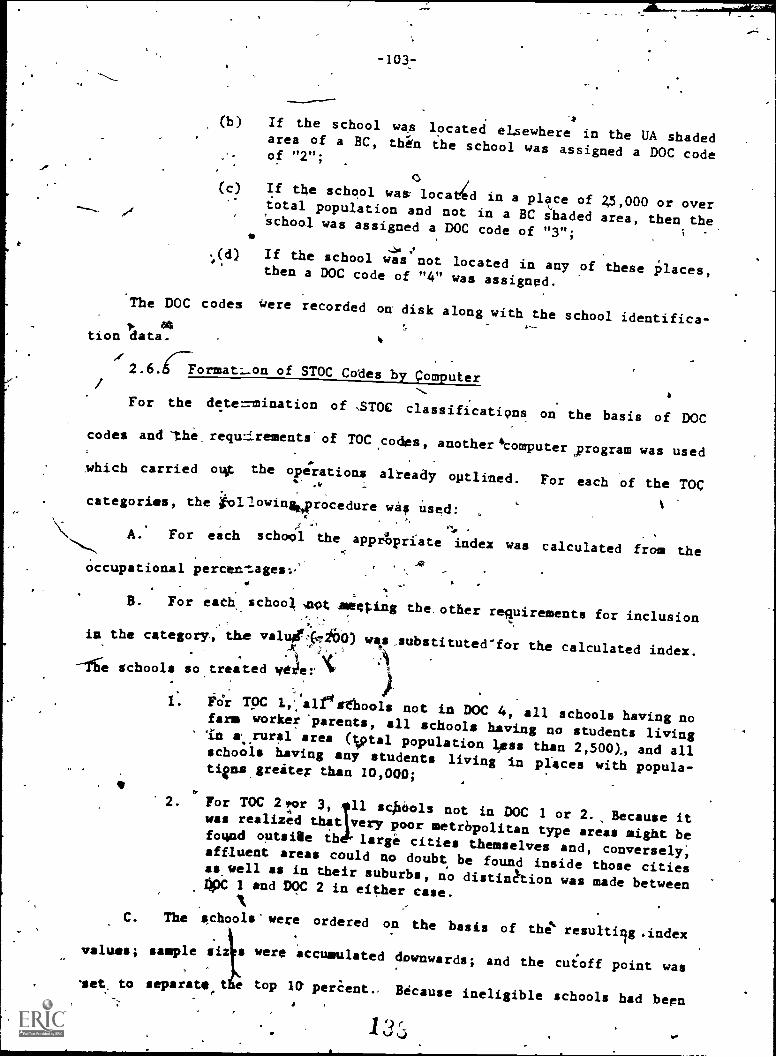
-103-
(b) If the school was located elsewhere in the UA shadedarea of a BC, thin the school was assigned a DOC codeof "2";
o(c) If the school was: tlocad in a place of 25,000 or overtotal population and not in a BC shaded area, then the`school was assigned a DOC code of "3";
.,(d) If the school was not located in any of these places,then a DOC code of "4" was assigned.
The DOC codes Were recorded on' disk along with the school identifica--Oktion data.
ti
2.6.CFormat.:..-on of STOC Codes by Computer
For the determination of ,STOC classifications on the basis of DOC
codes and -the_ reqw:irements' of TOC codes,anotheratomputeryrogram was used
which carried 04p the operations already outlined. For each of the TOC
categories, the inllowinkprocedure well used:
A. For each school the apprtpriate index was calculated from theA'
occupational percentages:,
B. For each school 4114 .sweating the, other requirements for inclusion
in the category, the vale/ :41:10)we,s,substituted-for the calculated index.fJ .
. A114Tie schools so treated yt ey
11 For TOC 1,a1f4sthoolsnot in DOC 4, all schools having nofarm worker parents, all schools having no students livingin m rural area (Iptal population
Less than 2,500),, and allschools having any students living in places with popula-tiensgreiter than 10,000;...
2. For TOC 2rr 3, 11 schools not in DOC 1 or 2., Because itwas realized that very poor metropolitantype areas might beIfound outsi$e th large cities themselves and, conversely;affluent areas could no doubt be found inside those citiesas well as in their suburbs, no distination was made betweenDpc I and DOC 2 in either case.
"Ik.-
C. The schools-were ordered on the basis of the resultiig *index
values; sample siz s were accumulateddownwards; and the cutoff point was, -
*set, to separate, time top 10. perient,Because ineligible schools had been
1 `4rvie.)

-104-
moved to the bottom of the list, all of the schools in the top 10 percent
were eligible, and no substitutions were ecessary.
Both the DOC and the STOC codes were recorded on disk and added to the
weight record at the time the weight's were calculated.
2.6.6' Results of DOC, TOC, and STOC Computations
2.6.6.1 Age Class 1, 9-Year-Olds. Table 2-42 presents weighted and
unweighted percentages of Age Class 1 !eligibles for STOC for all packages
and provides comparisons of Year 11 percentages with those for Year 10.
Unweighted percentages for STOC,1, 2, and 3 are not precisely 10 percent
because STOC codes were determined for individual schools rather than for
individual respondents. Thus within each school all of the respondents
were assigned iNesame STOC code. It was not possible to-iea4sign STOC
.
qv codes within scipols so That exactly 10 percent of the respondents would be
categorised as each of STOC 1, 2 and 3. Weighted percentages fr,STOC 1
are lower than the unweighted percentages because of oversampling in rural
Areas; sitiailart,- STOC 2 and STOC 4 weigOted percentages are lower than
unweighted percentages because low-income urban areas were oversampled;
other weighted percentages are relatively.high because of the resulting
uaeriamp/ing involVed. 'The *largest differences in both weighted and;
unweighted percentages for Years 10 and 11 are the decreases for STOC 4 and
`the increases for STOC 6 and STOC 7. These changes can be attributed in
part to sampling differences in the first-stage sample units. The primary4
sample foi assessment Years 07 through 10 was selected ,in Year 07. Primary
units were assigned to years using a randoaiiitOcedure. The Year 10 sample
received a relatively high proportion of primary units in cities of over
200,000 population and relatively 1 wproportions in smaller cities and
rural areas.

-105-
Table 2-42. Weighted and 4nweighted percentages of9-year-olds in Year 11 by STOC.for allpackages.
3
ATI packages
Year 11. Year 10 Year 11 Year 10,
Unweighted Unweighted Unweighted Weighted Weighted - WeightedSTOC sum- percent percent sum percent percent
1 2,924
2 2,899
3 2,893
4 2,693
5 2,871 1
6r
3,004
11,819
Total .29,103
10.
10.
?.9
9.3
9.9
10.3
40.6
100.0
10.0 321,457' 9.6 8.7
10.0' 204,8561 6.1 8.6
10.1 345,564 40.0.4 10.1
16.9 267,692 8.0 13.1
9.9 364;651 10.9. 10.5
9.4 466,956 14.0 11.8
7 33.7 1,368,391 41.0 37.2
100.0 3,339,567 100.0 100.0
A
,11

:106-
-When a new primary sample was selected for-Year 11 to Year 14, annual
region-by-size-of-community cotitroi was maintained when allocation to the4.
four years was carried out. Table 2-43'lists Year 11 weighted sand unweight-,
. .ed percentages of Age Glass 1 eligibles by STOC for each of the seven
packages. Percentages by STOC for each of the four NAEP regions will be
1found ifi Table 2-60'.
Table,2-44 presents Year 10'and 11 weighted and unweighted percentages ,
of Age Class 1 eligibles by DOC for all packages. Changet from Year 10
again reflect the change in primary sample makeup; DOC 1 shows decreases
from Year 10to 11 and DOC 3 and 4 show incrrases.
Table 2-45 lists Year 11 weighted.and unweighted percentages by DOC
and package. Table 2-46 lists of Year 11 Age Class 1 sample
_schools by DOC, TOC, and 430C classification. The 14.3 percent in STOC 1,
which includes only 10.0 percent of the respondents, reflects the below-.
_average size of schools Ln the extreme rural areas. In STOC 3, 5, and 7,
school percentages smaller than respondent percentages indicate schools
larger than average.
Table 2-47 shows comparisons of Year 10 and Year 11 weighted percent-.
ages of Age Class 1 eligibles cross-classified by STOC and DOC, using
school weights. In each of the two years STOC 1 (extreme rural) was obtain-
:
ed entirely from DOC 4 by definition. The major iirt of STOC 2 (low metro.;
politan) came from DOC 1, with a lesser part from DOC 2. Conversely, the
major portion of STOC 3 (high metropolitan) came from DOC 2 and a. lesser
portion from DOC 1. STOC 6 and DOC 3 are identical, and STOC and 7
are the nonextreme sectors of-010C.-1,1-2, and 4. . Again, changes in percent-
ages can be attributed to sample variabilities.
141
",
/1

Table 2-.43 Distribution of yedr 11 9-year-oldestimated population and samplerespondents by STCC and package
Package no. 1
STOC Estimate Percent Respondents Percent1 393218." 11.3 251. 10.02 167654. 4.8 2.94. 11.33 344373. 9.9 246. 9.44 241238. 6.9 235. 9.05 321163.. 9.2 242. 9.36 469683. . 13.4 279. 10.77 1555409. 44.5 1352. 40..3
Total '3492735. 100.0 2509. 100.9
Package no. 2
STOC Estimate Percent Respondents Percent1 248325. 7.0 238. 8.92 176581. 5.0
_
243. 9.13 478998. 13.5 420. 15.74 233522. 6.7 182. 6.85 300527. 8.5 253. -'9.56 e827233. 23.3 386. 14.47 1274803. 36.& 951. 35.6
A. Total' 3544989. 100.0 2673. 103.0,C
Package no. 3
STOC Estimate.
Perc nt Respondemts Percent1 248383. 8 1 268. 10.32 162948. 5 3 246. 9.43 264339. 8 7 183. 6.94 -197072. 6 5' 218. 8.35' 486823. 16. 368. 14.16 328572. 10.i 248. 9.57 1357911. 4.4.6 .1385. 41.5
Total- 3045748. 100.0 .42613. 100.0
Package no. 4
STOC Estimate Percent Respondents Percent1 378415. 10.2 323. 12.22 , 197343. 5.3 206. - 7.93 , 426264. 11.5 313. 11.8
,4 312243. 8.4 297. 11.25 371343. 10.0 249. 9.46 561468. 15.1 320. 12.1/ 1467589. 39.5 940. 35.5
Total 3714865. 100.0 2548. 100.0
112

*Se
Table 2-43. (contipued)
Pack'age no. 5
STOC :stimate.Percent Respondents Percent1 163780. 5.2 178. 6.92 249324.' 7,9 231. 8.83 409162. 12.9 305. 11.64 204113. . 6.4 207. 7.95 398299. 12.5 274. 10.46 326260. 10.3. 234. 8.97 1419136. 44.8 1198. 45.6
Total 3170074. 100.0 2627. 100.0
Package no. 6
STOC Estimate Percent Respondents Percent1-* 286535. 8.1 249. 9.52 254305. 7.2 288. 11.03 389159. 11.0 314. 12.04 252495. 7.1 . 205. 7.85 251657. 7.1 190. 7.36 550627. 15.6 296. 11.37 1552:23. 43.9 1378. 41.1
Total 3536831. 100.0 2620. 100.0
Package no. 7
STOC Estimate Percent i Respondents Percent1 225191. 7.32 31873C._ .10.33 e 325680 10.64 32710. 9.8
<-.-i5 70809. 8.76 4C0843. 1 .07 245926. 4 3
Total 3*90889. 100.
410/Package `no. 8
. STOC Estimate Percent1 449995. 13.4? 157869. 4.73 317792. '9.44 298333. 8.85 474319. 14.16 326649. 9.77 1344300. 39.9
Total 3369257. 100.:
208. 7.8349. 13.1239. 9.0.285. 10.7.,
7.69.4'
203.251.
1132. L 42.42663. 100.0
Respondents Percent272.
.23C.200.332.284.207.
1140.2665.
-10.28.67.512.410.77.3
42.9100.3

,-?09-
Table 2-43
Package no. 5
STOC Estimate1 1637t0.2 249324.'
Percent5.27.9
3. -40-9162. 12.94 204113. 6.45 398299. 12.56 326260. 10.3
, 7 1419136. 44.8Total 3170074. 100.0
Package no. 6
ST0C Estimate Percent
(continued)
Respondents Percent178. , 6.9231. 8.8
, 305. 11.621)7. 7.9.274. 10.4234. 8.9
1198. 45.62627.E 100.0
1
Resp&mOnts Percknt1 286535. 8.1 249. 9.52
3
254305.389159.
7.211.0 t
288.314._
11.012.0
4 252495. 7.1 205. 7.85 2516514, 7.1 190. 7.36 5406?7. .- 15.6 296. 11.37 1552023. 43.9 1078. 41.1
Total 536801. 100.0 -, 261. 100.0
Package no. 7
STOC Estimates Percent Respondents Percent1 225191. 7.3 208. 7.8
/ /.318730.32668C.
.10.34 0.6 .
349.239.
13.19.0
/ 4 302710. 9.8. 285. 10.7' 5 270809.. ...8e7, .'203. 7.6
64C0843. 11.0 251. / 9.4
/ 7 1245926. 40.3 1132. . 42.4TOtat 3090889. 100.0 2667. 100.0
Package no. 8STOC Estimate Percent
.
Respondents Perceht"'-1 449995. 13.4. 272. 10.2
2 4.7 23C. 8.63 . 317792.- 9.4 200. 7.54 298333. 8.8 332. 12.45 474319. 14.1 284.., 10.7
. 6 326649. 9.7/
2071. 7.97 1344300. 39.9 , 1140. 4%.9
Total 3369257. M.", 2665. 100.3
1-4.r\l N
ft
4
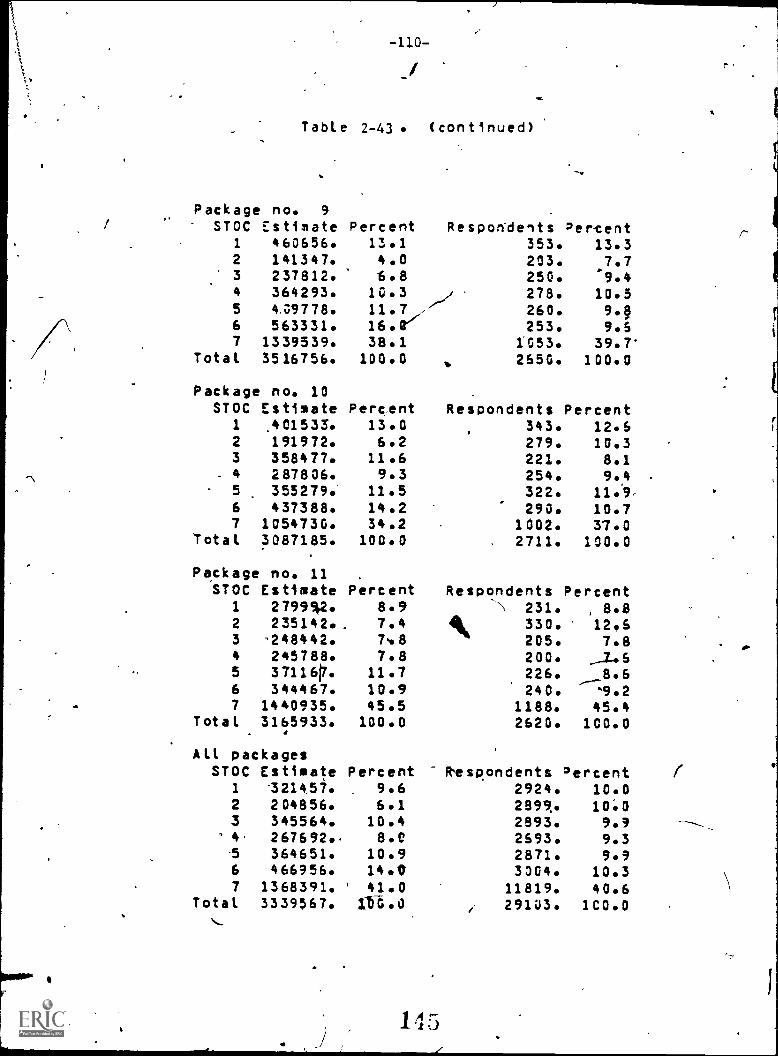
1
Table 2-43. (continued)
Package no. 9
STOC Estimate Percent Resporidents Pervent1 460656.2 141347.3 237812.
13.14.06.8
353.203.250.
13.3
7.7.94
4 364293. 10.3 278. 10.35 4.09778. 11.7, 260. 9.86 563331. 16.0' 253. 9.67 1339539. 38.1 1053. 39.7'
Total 3516756. 100.0 2650. 100.0
Package no. 10STOC Estimate Percent Respondents Percent
1 .401533. 13.0 343. 12.62 191972. 6.2 279. 10.33 358477. 11.6 221. 8.1
- 4 287806. 9.3 254. 9.45 355279. 11.5 322. 11.9,6 437388. 14.2 290. 10.77 1054730. 34.2 1002. 37.0
Total 3087185. 100.0 2711. 100.0
Package no. 11 .
STOC Estimate Percent Respondents Percent1 2799%2. 8.9 231. , 8.82 235142._ 7.4
41/4330. 12.6
3 '248442. 7'.8 205. 7.84 245788. 7.8 200. 2..65 3711617. 11.7 226. 8.66 344467. 10.9 240. '1.27 1440935. 45.5 1188. 45.4
Total 3165933. 100.0 2620. 100.0
All packagesSTOC Estimate Percent R'espondents percent
1 1214,57. 9.62 204856. 6.13 345564. 10.4
' 4, 267692.. 8.0-5 364651. 10.96 466956. 14.07 1368391. ' 41.0
Total 3339567. ab.o
2924. 10.02999.. 10.02993. 9.92693. 9.32871. 9.93304. 10.3
11819. 40.629103. 1C0.0
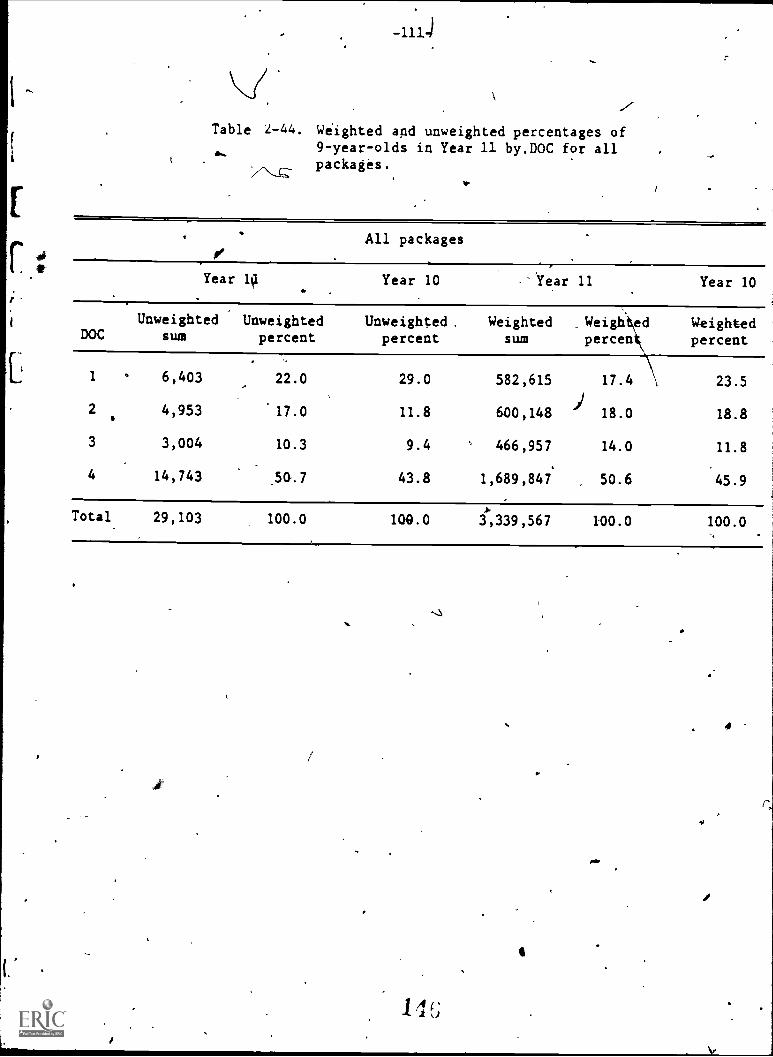
Table 2-44. Weighted and unweighted percentages of9-year-olds in Year 11 by.DOC for allpackages.
All packages
Year Year 10 'Year 11 Year 10
.
IUnweighted Unweighted Unweighted, Weighted _Weigh ed Weighted
DOC sum percent percent sum percen percent
[- 1 6,403 22.0 29.0 582,615 17.4 23.5
2 4,953 17.0 11.8 600,148 18.0 18.8
3 3,004 10.3 9.4 466,957 14.0 11.8
4 14,743 .50.7 43.8 1,689,847 50.6 45.9
Total 29,103 100.0 100.0 3,339,567 100.0 100.0
per
*
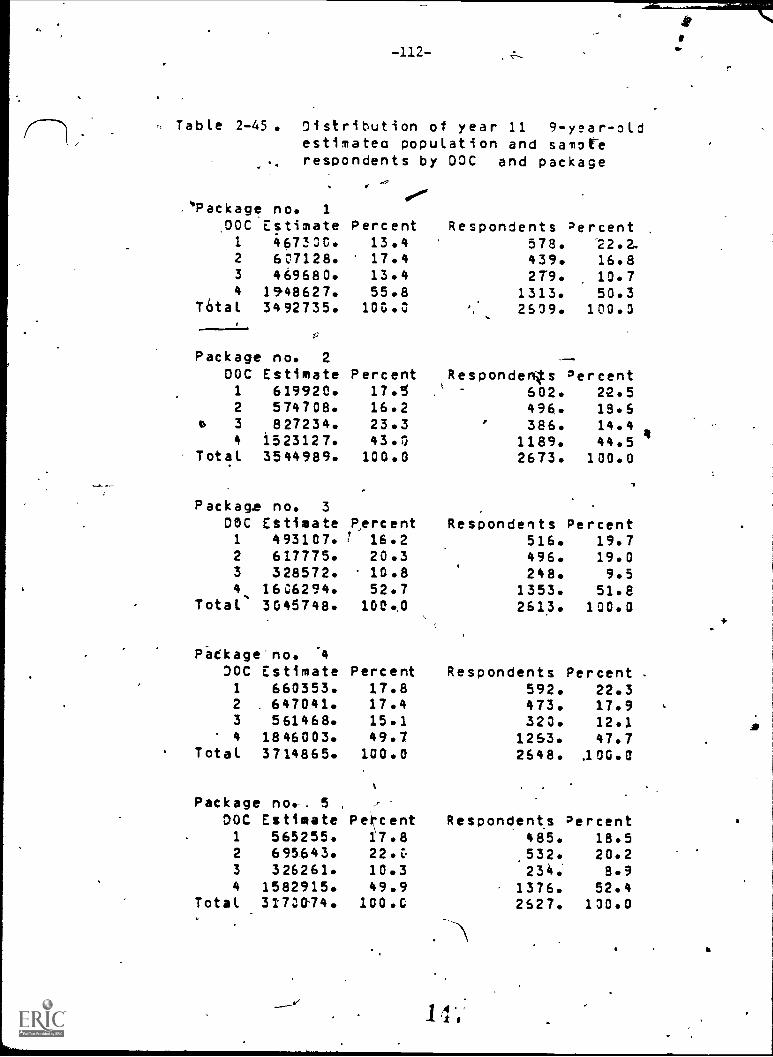
-112-
Table 2-45. Distribution of year 11 9-year-oldestirnatea population and samoUerespondents by DOC and package
_
*Package no. 1
DOC Estimate Percent Respondents 'ercent1 467330. 13.4 578. 22.2.2 607128. 17.4 439. 16.83 469680. 13.4 279. 10.74 1948627. 55.8 1313. 50.3
Total 3492735. 100.3 2539. 100.0
Package no. 2 --
DOC Estimate Percent Respondeqs 'ercent1 619920. 17.5 k 602. 22.52 574708. 16.2 496. 18.6
o 3 827234. 23.3 386. 14.44 1523127. 43.0 1189. 44.5
Total 3544989. 100.0 2673. 100.0
Package no. 3
DOC EStimate Percent Respondents Percent1 493107. , 16.2 516. 19.72 617775. 20.3 496. 19.03 328572. 10.8 248. 9.54 16C6294. 52.7 1353. 51.8
Total 3045748. 1004 2613. 100.0
Package' no.DOC Estimate Percent Respondents Percent
1 660353. 17.8 592. 22.32 . 647041. 17.4 473. 17.93 561468. 15.1 320. 12.14 1846003. 49.7 1263. 47.7
Total 3714865. 100.0 2648. .100.0
Package now, 5 ,
DOC Estimate Pecent Respondents Percent1 565255. 17.8 485. 18.52 695643. 22.r., 532. 20.23 326261. 10.3 234; 8.94 1582915. 49.9 1376. 52.4
Total 3173E1'74. 100.0 2627. 130.0
1 A
4
.

-413-
Table 2 -4J ( con t i nu e d ),
Package no. 6
DOC Estimate Percent .Respondents 2ercent1 571821.2 575795.3 550627.
_ 4 1838558.Total 3536831.
a
16.2 547. 20.916.3 450. 17.415.5 296. 11.352.0 1327. 50.100.0 2620. 100.0
Package not 7
DOC Estimate Percent1 725771. 23.52 493158. 15.93' 400843. 13.04 1471117. 47.6
Total 3:150889. 100.0
Respondents percent706., 25.5370. 13.9251. 9.4340. 53.2
1667. 130.0
Package no. 8
DOC Estiorati Percent Respondeis Percent1 593874. -17.6 537. 23.92 654439. 19.4 409: 15.33 326649. 9.7 207, 7.04 1754295. 53.3 1412. 53.0
Total 3369257. 100,40 2665. 100.0
Package np. 9
DOC- Estimate Percent
v
Respondenls Percent1 536779. 15.3 4550." 20.92 616451. 17.5 441. 16.53 563332. 16.0 253. 9.54 1800194. 51.2 ,1406. 53.1
Total 3516756. 1110.0 '2550. 100.0
Package no. 10DOC Estimate Percent
1 651256. 21412 5422.78.7 17.63 437388. 14.14 1456263. 47.2
Total 33.871854 lu.p
(
Riispondents 3ercent
/I
530. -23.2445. 16529b. 10.7
1345: 49.54711. 1(10.0
4
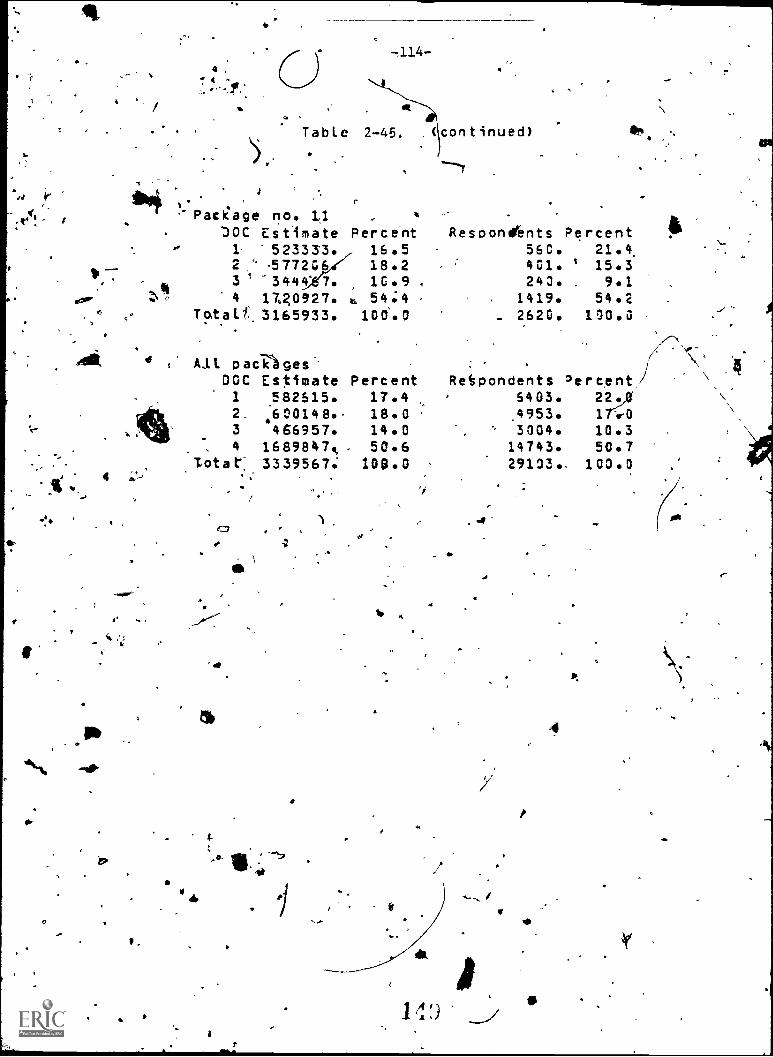
1
'1Z 0
4,-.114-
Table 2-45.
a
1
Package no. LI*DOC Estimate Percent
(continued)
Resooneltents Percent
ear r.0
2
3
4
To.tall:
523333.4* 5772C"3444' 7.17,,20427.
3165933.
16.518.216.9
41, 54;4 -
100.0
560.401.243.
1419._ 2620.
21.4.15.3
. 9.154.2
100.0
I
at.
4
19
pac)Tages.'00C Estimate Percent1 582615. 17.42. 4630148. 18.03 466957. 14.04 1689847., 50.6
Total": 3339567. 100.0
Retpondents Percent)6403. 2244953. 1r...0
3004. 10.314743. 50.729133.. 100.0
a
O
0
e
f4

;,
Table 2-46, Distri3Oution of year -11 9-year=old sample
schools by DOC, TOC, anc STOC codes
)1/1
COde ,
1
2
3
4
5
6
7
Total
40
.
No.
DCC
Pct.
TCC
No. Pct. No,
STC1C
Pct.
119 21.2 * 80 14.3 80 14.3
82 14.6 52 9.3 52 9.3
63 11.2 50 8.9 50 8.9
297 53-.0 379 67.5 52 .9.2
X X X X 47 k8.4
X X X X -63 21.2
X X X X 217 38.7
561 100.0 561 100.0 561 100.0
. .4
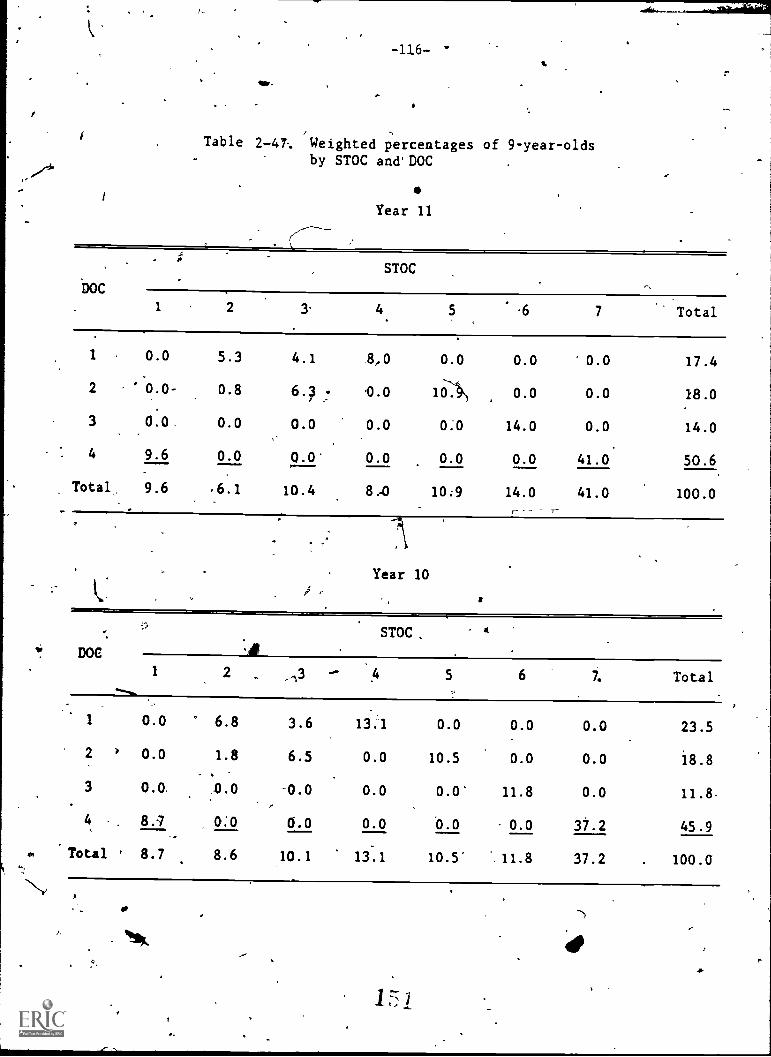
-116- '
Table 2-47. Weighted percentages of 9-year-oldsby STOC and' DOC
S
Year 11
DOC
STOC
1 2 3. 4. 6 7 Total
1 0.0 5.3 4.1 8,0 0.0 0.0 0.0 17.4
2 * 0.0- 0.8 6.? .0.0 10 0.0 0.0 18.0
3 0.0 0.0 0.0 0.0 0.0 14.0 0.0 14.0
4 9.6 0.0 0.0' 0.0 0.0 0.0 41.0 50.6
Total, 9.6 .6.1 10.4 8.0 10.9 14.0 41.0 100.0.-- -
Year 10
STOC,
DOC
1 2 5 6 7. Total
1 0.0 6.8 3.6 13.1 0.0 0.0 0.0 23.5
2 0.0 1.8 6.5 0.0 10.5 0.0 0.0 18.8
3 0.0. -0.0 0.0 0.0' 11.8 0.0 11.8-
4 8.7 0:0 6.0 0.0 O.0 0.0 37.2 45.9
'Total ' 8.7 8.6 10.1 13.1 10.5. 11.8 37.2 100.0
'1*
151
2.6.6.2- 'Age Class 2, 13-Year-Oldq. Table 2 -48 presents Year 10 and 11
weighted and unweighted percentages, of Age Class 2 eligibles by STOC for
all. packages. As in Age Class 1, there have been decreases in STOC 4
percentages and increases, in those forSTOG 6 and 7. In this case there
has also been a decrease for STOC 5. Weighted and unweighted percentages
by4package are presented in table 2-49. Percentages bfor,each of the four
NAEP regions are'shown in 'table 2-60.4
'Table 2-50 presents Year 10 and 1 weighted and unweighted percentages
of Age Class 2 eligibles by DOC for:all packages. Changes from Year 10
again reflect the change in primary sample, makeup; DOC 1 and 2 show0
decreases from Year 10 to 11 and DOC3 and 4 show.incretaes.
Table 2-51 lists Year 11' weighted and unweighted percentages by DOC
and package. Table 2-52 presents Yeir 11 number of Age Class 2 sample
,schools by DOC, TOC; and STOC. Table 2-53 shows comparisons of Year 09 and
10 Age Class 2 weighted percentages of respondents by STOC and DOC using
\Aschool weights. Again the major part of STOC 2 for each Year was obtained
from DOC 1.
2.6.6.3 Age Class03, 17-Year-Olds. Table 2-54 provides Year 10 and
11 comparisons for weighted and unweighted percentages of Age Class 3'
eligibles by STOC for'all packages. As with 9- and 13-year7oldsq decreases
occurted in percentages for STQC 4 and increases for STOC 6 and 7. The
change is again- due to the random allocation of the sample for Year 10.
Table 2-55 gives Year 11 weighted and unweighted percentlges by STOC for
each of the Age Class 3 packages Percentages for all packages by STOC for
each region will be found in table-2-64.
Table' 2-56 presents "comparisons of Year 10 and 11 weighted and
unweighted percentages of Age Class 3,,elitibles by DOC for all .packages.
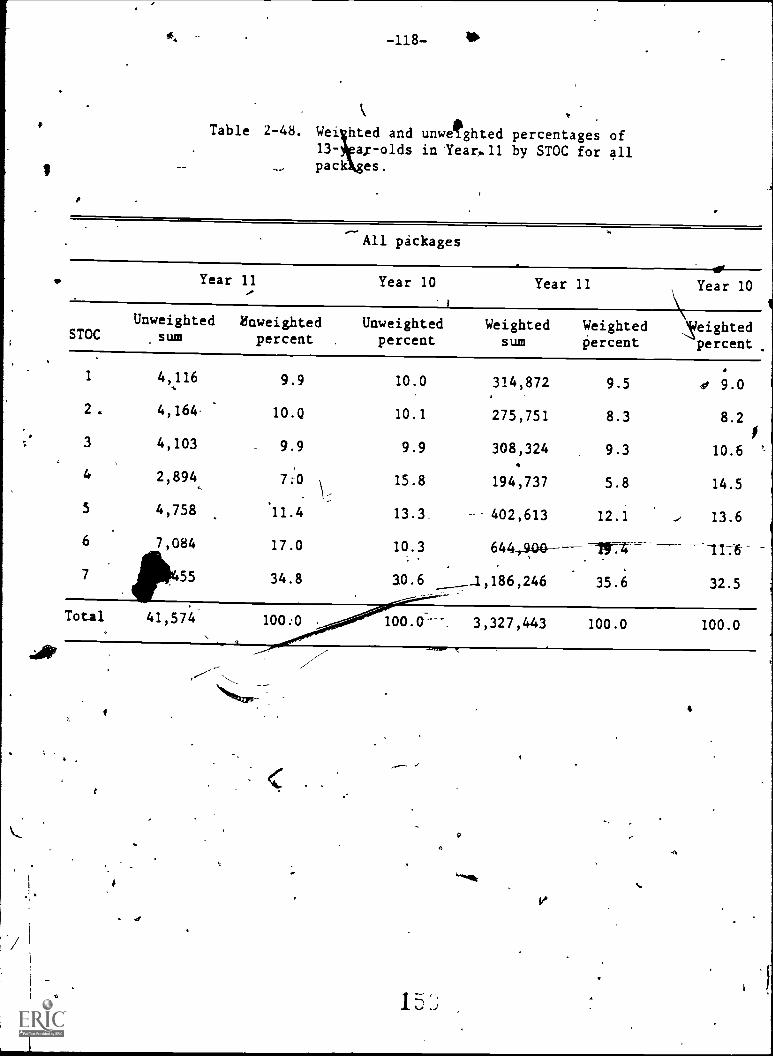
-118--
"Table 2-48. Wei hted and unwellghted percentages of
13- a; -olds in'Year,11 by STOC for allpac es.
All packages
Year 11 Year 10 Year 11 Year 10
Unweighted &weighted Unweighted Weighted Weighted ,"teightedSTOC sum percent , percent sum percent percent
1 4,116 9.9
2. 4,164 10.Q
3 4,103- 9.9
4 2,894 7;0
5 4,758 '11.4
6 7,084 17.0
7 4111,455 34.8
Total 41,574' 100:0
10.0 314,872 9.5 0 9.0
10.1 275,751 8.3 8.2
9.9 308,324 9.3 10.6 '
15.8 194,737 5.8 14.5
13.3 402,613 12.1 .. 13.6
10.3 644_,_,40*-- 71F-74 -11:6--
30.6 1,186,246 35.6 32.5
100.0 3,327,443 100.0 100.0
.,.171111=-
9
VS.

4
1
-119-
Table r2 -49. Dist ibution of year 11 13-year-oldestimated population- and sampleRespondents by STOC and package
4 Package no: 1-STOC Estimate Percent
,
Respondents Percent1 395868. 11.7 310. 11.12- 399339. 11.8 335. 12.03 301200. 8.9 288." .10.34 201377. 5.9 175. 6.35 381314. 11.2 288. 10.46 641546. 18.9 449. 16.17 1069758. 31.6 941. 33.8
Total 3390402. 100.0 2786. 100.0.
Package no. 2
STOC Estimate Percent Respondents Percent1 302746. 8.7 220. 7.9
319242. 9.2 326. 11.73 -z,248235. g16. -.7.8..4 229326. 6.6 198. 7.15 43816'9. 12.7 299. 11.76 532377. 15.4 415.' 14.97 11391325. 40.2 1111. 39.9
Total 3461420. 100.0 2785. 100.0
Package no. 3
STOC Estimate Percent -7.A.espondents Per6ent1 216453. 6.7 217. 7.82 227835. 7.0 293. 10. -6.,_
376803. 11.6- ,----7 316. 11.4
-.' 37977. 11.7 251. 9.1150006. 4.6 i 171. 6.5
)76 7074,7. 21.7 537: 19.4-7 94834. 36.7 11973. 35.2
Total 143185. 100.0 . 766. 100.0
Package nl 4
STOC Es mate Percenta
Aspondents Percent1 315412. 9.7 263. 9.52, 245326. 7.5 243. 8.83 337501. ,10.3 332. 12.04 '238781. 7.3 '223. 8.1
. 5 354801. 10.9 279. 10.16 593113. 18.2 432. 15.77 1175561. 36.1 987. 3'5.8
Total 3260455. .10,0.0 2759.- 100.0
IWO

e
-120-
Tabl* 2-49 (continued)
,Packag; no. 5
'STOC, Estimate Percent Respondents Percent
1 290375. 8.9 304. 11.2
2 330127. 10.1 301. 11.1
3
'4
314545.88367.
9.62.7
welea242.
. 115.8.9-4.2
5 420437. 12.8 338, 12.5
6 692f92. 21.1 480. 17.7
7 1138804. 344 932. 34.4
Total 3274847. 100.6 2712. 100.0
Package no. 6oSTGC Estimate Percent .Respondents Percent
1 212'821. 6.7 161. 5.8
2 224956. 7.1 226. 8.2
306812. 9Ap acto. 1&.9
4 137398. 4.3 171. 6.2
5 376960. 11.8 323. 11.7
6 651887. 20.5 488. 17.7
7 E1270883. 40.0 1091. 39.5
Total 3181717. 100.0 2760. 100.0
Package ho. 7
STOC Estimate Percent Respondents Percent1 349549. 10.5 316. 11.6
,2 -192259. 5.8 249. 9.1
3 325947. 9.8 233. 8.5
4 -249158. 7.5 229. 8.4
5 389195. 11.6 339. 12.4
4, 622329. 18.6 425. 15.5
7 1207273. 36.2 943. 34.5
Total 3335710.. 100.0 2734.y 100.0
Package no. 8
STOC Estimate Percent ,Respondents Percent
1 341675. 21.2 334. 12.3
2 276112. 9.0 266., 9.8
3 220035. 7.2 241. 8.9
4 179303. 5.9 213. 7.8
5 376373. 12.3 287. 10.5
6 564426. 18.4 431. 15.9
7 1102984. 436.0 947. 34.8Total' 3060908. 100.0 2719. 100.0
155

r
r
-121-
Table 2-49. (continued)
Package no... TSTCC Estimate Percent Respondents Percent
1 346315. 10.3 299. 10.52 258705. 7.7 306. 10.73 374987. 11.1 310. 10.84 217222.5 332126. 9.8
196.307.
6.910.7
6 626769. 18.5' 497. 17.47 1224692. 36.2 . 942. 33.0
''Total 3380816: 100:0 2857. 10' .0
Package no. 10STOC'Estimate percent Respondents Percents
1 299065. 8.7 234. 8.52 158072. 4.6 174. 6.43 235336.4 195521.
6.95.7
205. 7.5194. of
5 561923. 450.1 16.5.6 597715.
_16.417.5 436. 16.0
7 1377415. 40..2 1.038. 38.0tal 3425047. 100.0 2731. 100.0
4,
Package no.+11STOC Estimate Percent Respondents Percent
4
1 307815. 8.9 257. 9.42 307148. 8.9 270. 9.83 324,152. 9.4 292. 10.74 200021. 5.i 185. -6.75 414883. 12.0 340. 12.46 622560. 18.0 432. 15.87 1275327. 37.0 966. '.35.2
,Total 3452206., 100.0 2742. 100.0
Package no. 12.STOC Estimate Percent Respondents Percent
1 271160.
8fj
233. 8.52 279600. .4 305. 11.13 279584. .4 210. 7.64 149243. 4.5 144. 5.25 534672. 16.0 407. 14.86 690373. 20.6 517.
14S4,416\
18.87
Total1137378.3342010.
34.0.100.0
33.2 9.
34.0100.0
15

a
414
. -122-
Table 2-49. (continuedi
Package no: 13STOC Estimate Percent Respondents Percent.
1 332086. 9.9 334. 12.0
2 3083.91. 9.2 261. 9.3
3 353083. 10.5339. 12.2
4 253768. 7.5 242. 8.7
5 348381. 10.3262. 9.4
6 672674. 20.0481. 17.3
e 7 1099492. 32.6867. 31.1.
Total 3367875. 100.0 2786. 100.0
Package no. 14STOC Estimate Percent
.
Respondents Percent
1 377762. 11.2319. 11.5
2 304366. 9.0 311. 11.2
3 125630. 9.6 303. 10.9
4 220235; 6.5 186. 6.7
5 -335759. 10.0282. 10.2
6 1 693524. 20.6t... 488. 17.6
4-7 1115448. 33.1
883. 31.9
Total 3372724. 100.0 2772. 100.0
Package no. 15
STOC Estimate Percent Respondents Percent
1 363975. 10.8 315. 10.8
2 304791. 9.1 298. 10.2
3 300702. 9.0,276. 9.5
'4 211329. 6.3 244. 8.4
5 394448. 11.8306. 10.5
6 764517. 22.4576. 19.7
7 1012518. 30.2 901. 30.9
Total 3352280. 100.8 2916. 100.0
ALL packagesSTOC Estimate Percent" Respondents Percent
1 314872. 9.5 4116. 9.9
2 275751. 8.3 4164. 10.0
3 308324. 9.3 4103. 9.9
4 194717.' 5.8 2894. 7.0
5 402613. 12.1 4758. 11.4
6 644900., 19.4 7084. 17.0
7 1186246. 35.6 14455.0 34.8
Total 3327443. 100.0 41574. r00.0
15'T

r
1
-1p23-
a
Tablet 2-50. Weighted and unweighted percentages of13- year -olds in Year 11 btDOC for all
packages.
All packages
Year 11 Year 10 Year 11 Year 10*
Unweighted Unweighted Unweighted Weighted. Weighted Weighted
DOC sum percent percent sum percent percent
1 7,645 18:4 28.0 511,133 15.4 24.2
2 8,274 19.9 21.1 670r292 20.1 22.7
3 7,Q84 17.0 10.4 644,900 19.4 11.6
4 18 1144,571 .7 40.5 1,501,1448 45.1 41.5'
Total 41,574 100.0 100.0 3,321,443 100.0 100.0
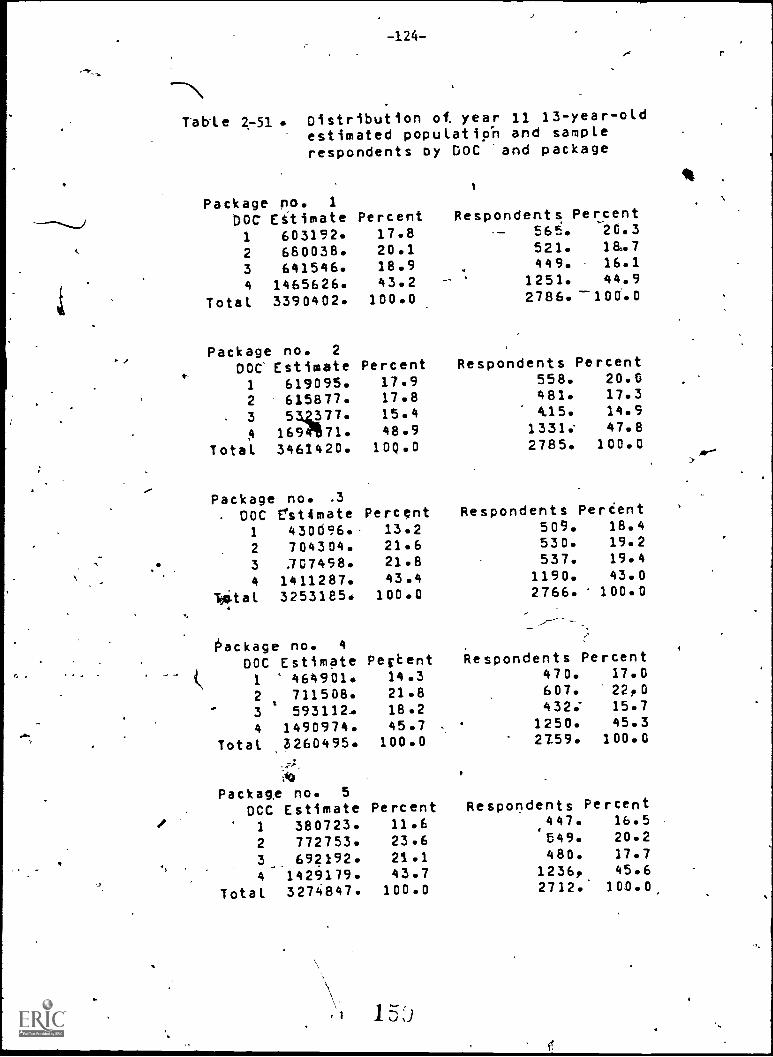
-124--
Table 2-51* Distribution of, year 11 13-year-oldestimated population and samplerespondents ay DOC and package
Package pd. 1
DOC Etimate Percent Respondents Percent
1 603192. 17.8 -- 565. 20.3
2 660038. 20.1 521. 1&.7
3 641546. 18.9 449. 16.1
4 1465626. 43.2. 1251. 44.9
Total 3390402. 100.0 2786. -100.0
Package no. 2
DOC Estimate Percent Respondents Percent
1 619095. 17.9 558. 20.0
2 615877. 17.8 481. 17.3
3 54Z377. 15.4 4.15. 14.9
4 16901171. 48.9 1331: 47.8
Total 3461420. 100.0 2785. 100.0
Package- DOC
no. .3
rstlimate Percent Respondents Perient
1 430096. 13.2 509. 18.4
2 704304. 21.6 530. 19.2
3 .707498. 21.8 537. 19.4
4 1411287. 43.4 1190. 43.0
Nital 3253185. 100.0 2766. 100.0
Package no. 4
DOC Estimate Perbent Respondents Percent
1 464901. 14.3 470. 17.0
2 711508. 21.8 607. '22.0
3 593112-* 18.2 432: 15.7
4 1490974. 45.7 1250. 45.3
Total ,3260495. 100.0 2159. 100.0
Package no. 5
OCC Estimate Percent Respondents Percent
1 380723. 11.6 447. 16.5
2 772753. 23.6 549. 20.2
3_. 692192. 21.1 480. 17.7
4 1429179. 43.7 1236, 45.6
Total 3274847. 100.0 2712. 100.0,

X
-125-
'Table 2-51. (continued)
Package no. . 6
DOC Estimate Peteent1 412014. 13.02. 634112. ,19.93 651887.W 20.54 1483704. 46.6
Total 3181717. 100.0
Respondents Percent442. .16.0578. 20.9488. 17.7
1252. 45.4'2760./ 1,00.0
ow
Package no. 7
DOC Estimate Percent' Respondents Percent
1 526603. 15.8 505., 18.5
2 629956. 18.9 545. 19.9
3 622329. 18.6 425. 15.5
4 1556822. 46.7 1259. 46.1
Total 3335710. 100.0 2734. 100.0
Package no. _8
DOC Estimate Percent Respondents Percent
1 483692. 15.8 535. 19.7
2 568130. 18.6 472. 17.3
3 564426. 18.4. 431. 15.9
4 1444660. 47.2 1281. 47.1
Total 3060908. 100.0 2719. 100.0
Package no. 9,00C Estimate Percent.1 592776. 17.5
2 590264." 17.53 '61"6/69. 18.54 1571007. 46.5
Total 3380816. 100.0
Respondents557.562.497.
1241._.2857.
Percent-19.5.19.717.443.4
100.0
Package no. 10DOC Esti'mate Perceni Respondents Percent
1 382116'. 11.2 384. 14.1
2 708736. 22.4 639. 23.4
3 597716. 17.5 436. 15.9'
4 1676479. 48.9 1272. 46.6
Total 3425047. 100.0 2731. 100.0
1G4.
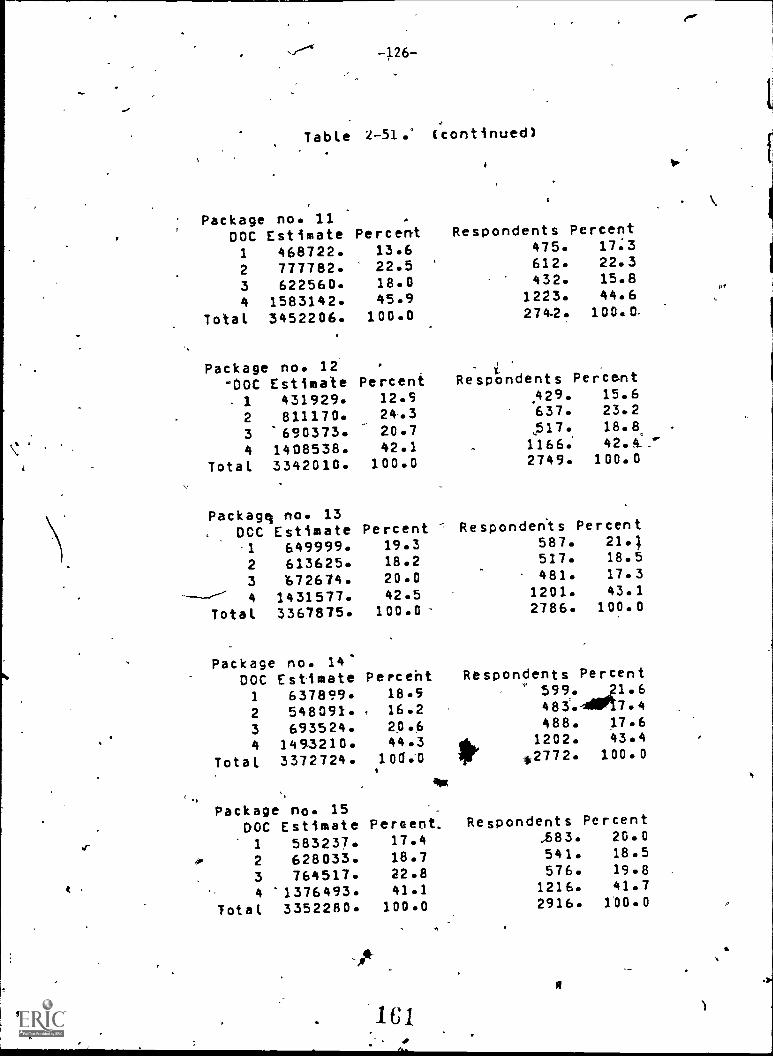
S
-q26-
Table 2-51.' (continued)
10'
Package no. 11DOC Estimate Percent Respondents Percent
1 468722. 13.6 475. 17.3
2 777782. 22.5 612. 22.3
3
4
622560.1583142.
18.045.9
432.1223.
15.844.6
ne
Total 3452206. 100.0 274.2. 100.
Package no. 12-DOC Estimate
1 431929.2 811170.3 690373.4 1408538.
Total 3342010.
Packagq no. 13DCC Estimate
Percent12.924.320.742.1
100.0
Percent "7
Respondents429.637.517.1166.2749.
Respondents
Percent15.623.218.8,42.4
100.0
Percent
1 649999. 19.3 587. 21.1
2 613625. 18.2 517. 18.5
3 1572674. 20.0 481. 17.3
4 1431577. 42.5 1201. 43.1
Total 3367875. 100.0 2786. 100.0
Package no. 14'DOC Estimate Perceht Respondents Percent
1 637899. 18.5 599.
2 548091. 16.2
_21.6483.411,17.4
3 693524. 20.6 488. 17.6
4 1493210. 44.3 1202. 43.4
Total 3372724. !Dd.-0 *2772. 100.0
0
Package no. 15DOC Estimate
1 583237.2 628033.3 764517.4 '1376493.
'Total 3352280.
Percent.17.418.722.841.1
100.0
Respondents583.541.576.
1216.2916.
Percent20.018.519.841.7
100.0

e
Si
e
-127-
Table 2-51.. (continued)
,.,
All 'packagesDOC Estimate Percent Respondents Percent
1, 51Y133. '.15.4 7645. 18.4
2 670292. 20.1 8274. 19.9
3 644900. 19.4 7084. 17.0
4 1501118. '45.1 18571. 44.7
Total 3327443. 100.0 41574. 100.0
'V
/
7-
....1.4
e
i
*4

4
r'
r
*
-128-
IP
Table 2-52* DistributionqAf year 11 .13-year -old sampleschools by Dot, IOC, 4.ric STOC codes
Code
boc
No..
..
i
,
Pct.
.
7,0C0 ,
No., 'Pct: Pct.
1 ,120 22.3 86 16.0 8 16.0
2 81 15.1 59 11.0 59 11.0
3 74 130 53 9.9 53 1.8
4 2112 48:8 339 63.1 44 8.2
5 X X X X 45 8.4
6 X X X - X -74 '13.8* 7 X , X ,X f'' ° X , 176 32.8
0
Total 537 100.0 537 100.0Jr
537 100.0
4
0
.1

f.
ck,
4
Table 2_53 Weighted -pereentage-s- of.,13-year-_olds_
by STOC and DOCa.
Year 11'
DOC
I
1 0.0 6.3 3.,4 5.9 0.0 0.0 0.0..
15.6
2 0.il 2.1 5.7 , 0.0 12.0 0.0( 0.0 19.8
NO 0.0 0.0 0.0 .0.0 0.0 19.4 0.0 19.4
4. 9.5. 0.0 o.o . b.o 0.0' 0.0 35.7 45.2
Total 9.5 8.4 . 9.1 5.9 12.0 19.4 3517 100.0
DOC
1 2 3 4 .5 6 7 Total
STOC
Year 10
STOC
1 2 4 5 6 7 Total
1 0.0 '5.8 3.9 14.4 0.0 0.0 0.0 24.1
2 0.0 2.3 6.8 0.0 13.7 ' 0.0 0.0 22.8
id 3 . 0? 0.0 0.0 0.0 0.0 11.6 0.0 11.6
4 8.9 0'.0 _ Q.0 0.0 0.0 0.0 32.6 41.5
Total. 8.9 8.1 10.7 14.4 13.7 11.6 32.6 1 100.0...
A'
1 C

-130-
Table 2-54. Weighted and unweighted percentages of17-year-olds in Year 11 by STOC for allpackages.
All ,packages
Year 11 Year 10 Year 11 Year 10
Unweiglited Unweighted Unweighted Weighted Weighted Weighted
STOC : sum percent percent sum percent percent
1 3,452 9.6 9:5 253,550 7.9 7.8
2 3,896 10.8 11.1 279,427, 8.6 10.7
3 3,641 10.1 10.0 388,867D 12.0 9.5
4 2,368 6.5. 13.2 141,350 4.4 11.0
5 3,686 1 10.2 13.6 396,121 11.4 16.3
6 6,730 18.6 10.1 635,086 19.6 12.0
7 12,336 34.2' 32.5 1,167,197 36.1 32.7
Total 36,109 100.0 100.0 3,254,598 100.0 100.0

........... .... -^
S.
Table 27
-131-
Distribution of year 11 17-year -,oldestimated population and samplerespondents by STOC and package
Packack:,..L. no. 1
-.STOC: Estimate Percent Respondents ercent1 327816. 10.1 - 309. 12.02 192636. 6.0 216. 8.43 454187. 14.0 231. '8.9256978. 7:9 278. 10.75 337647. 9.5 252. 9.8s 619389. 19.1 473. 18.3 20/7 1C83125. 33.4 825. 31.9Total 3241778. 100.0 2584. 1.4.4,q/
packacse no. '.?STOC= Estimate PerceVIt
Respondents Percent1 227854. 6.9 220. 8.62 205422. 6.3 221. 8.73 563269. 17.2 287. 11.34 .111794. 3.4 156. 6.15 367763. 11.2253..4' 10.06 620153; 18.9 448. 17.67 11182859. 36.1 960. 37.7Total 3279214.. 100.0 2545. 100.0
Package no. 3 .
STOC Eltimate. Percent1 309492. 9.22 303804. 9.03 554845. 16.54 150770. 4.55 277991. .26 551335. 16:57 1225825. 36.3
Total 3373762. 102.0
Package no. 4
STOC Estimate1 248181.2 , 312391.3 319600.4 123465.5 344889.6 560344..7 1245243.
Total' 3151813.
Percent7.99.8
10.13:9
11.'0
17.839.5100.0
Respondents Percent279. 12.8,319: 12.4
411 298. 11.5159. 6.2202. * 7.8429. 16.6V94. 34.7
2580. 180.3
Respondents Percent/78. ,10.9325. 12:3236. 9.3.156. 6.1290. 11.4420. 16.5861. 33.8
2546. 102.0

-132-
4
Table 2-55. (continued)
Package no. 5
STOC Estimate Percent Respondents Pircent1 220354. \7.02 267830. 8.53\ 268382. 8.54 \ 97446. 3.15 ,394267. 12.56 .652001. 20.87 1244803. 39.6
Total 3145083. 100.0
Package Ito. 6
STOC Estimate1 185708,2' 280980.3 267254.4 207392.5 3480.19.6 712375.7 .1C449C4.
Total 3046632.
194. 7.5303. 11.6
;N 247. 9.5139. 5.3290. 11.1499. 19.1
. 946. 35.92608. 1C0.0
Percent Respondents Percent6.1 219. 8.5
253. 9.98.8 234. 9.06.8 239. 9.2
41.4 276. 10.725.4 516. 19.934.3 851. 32.9100.0 2588.- 100.0
Package no. 7
7TOC Estimate Percent1 184282. 5.52 318487. 9.53 430066. 2.9,4 115986. , 3.45 .5094W- 15.36 71C419. 21.37 172964. 32.1
Total 333970Thp-__100.6
Package ncp 8
STOC Estimate, Percent1 348781.. 11.42 200468. 6.63 244691. 8.04 115377. 3.85. 11143.88._ 12.66 755919. '24.87 1r00222. 32.8
Total 3049846. 100.0
Respondents Percent220. 8.6482. 10.9230. 8.9134. 5.2271. 10.557.A. 22.2969. 33.7
2579. 100.0
.
Respondents Percent_284. 10.9236. 9.0225. 8.6149.319. 12.2602. 23.1 -1
796. 30.52511. 1:n.3 \

f.
O
-133-
Table 2-55. (continued)
Package no. 5".
STOC Estimate1 23095.
Percent Respondents251.
Percent'10.0
2 260799. 8.1 236. 9.4
3 402143. 12.5 318. 12:.7
4W 116829. 3.6 157. 6.3
5 276911. 8.6 21C. 8.4
6 764391. 23.7 534. 21.4
7 1173680. 36.4, 796. 31.8
Total 3224852. 100. 2502. 130.0
Package no. 1'O
STOC Estimate Percent1 232566. * 7.3
2 334795. 10.53 491208. 15..4
4 158964. 5.05 324640. 10.26
15C1CO3. 15.7
7 143920. 35.9Total 5186196. 10C.0
Package no. 11STOC Estimate Percent
1 302919._ 8.72 321393. 9.23 338923. 9.74 85C61. 2.
5 476348. 13.
6 629259. 18.E7 1336665. 38.3
Total 3490568. 100.0
Responden#s Percent.194. 7.7289. 11.4280. 11.1,
6.1'-
154:2921 .11.6409. 16.2905. 35.9
2523. 130.0
spondents Perctnt244. 9.5306. 11.9270. 1D.5111. 4.32874 11.1477.- 18.5883. 34.2
257E. '100.0
Package no..12STOC Estimate Percent Re'spondents Percent
1 179518. 5.5 216. 8.3
2 323518. 9.9 361. 13.09
3 336701. 10.3 267. 10.3
4 165192. 5.1 188. . 7.3
5 370284. 11.4 195.' 7.5
6 5E6239. 18.4 384. 14.8
7 1296899. 39.8 984. 37.9
Total 3258351. 100." 2395. 100.3
1

., -134-
Table 2-55. (continued)
Package no. 13STOC Estimate Percent Respondents Percent
N...
1 325440. 10.6 320. 12.1
2 308661. 10.1 309. 11.7
3 252631. 8.2 231. 8.8
4 146409. 4.8 195. 7.4
5 315546. 10.3 . 245. 9.3
6 5598C5. 18.2 429.. 16.3
7 116592. 37%8 9C8. 34.4
Total 3069084. 100.0 2637. 100.0
Package no. 14STOC Estimate Perce Respondents Percent
1 226691. 68.5
2 283389. 8.2 :2540. 9.9
3 523244. 15.2 287. 10.9
4 129235. 3.8 153. 5.9
5 469560. 13.7 304. 11.5
6 f668814. A9.5 537. 20.4
7 1129854. 33.3 868. 33.0
Total 3427487. 120.0 2533. 100.0.
ALL packages .
STOC Estimate Percent Respondents Percent
1 253550. 7.9 3452. 9.6
2 279427. 8.6 3896. 10.8
3 358867. 12.:0 3541.a 10.1
a 4 141353. 4.4 2368.0 6.5
5 369121. , 11.4. 3686. 10.2
6 645186. fTrit'-'74 6730. 18.6
7 116719,,7. 36.1 12336. 34.2
Total 3234598. 100.0 36139. 130.0

r.
r.
n
.... ....
-135-
Table 2=56. Weighted and unweighted percentages of
17-year-olds in Year 11 by DOC for all
packages.
r\
All packagesi
Year 11 Year 10 Year 11 Year 10
Unweighted Unweighted Unweighted Weighted Weighted Weighted
DOC sus percent ,., percent sum percent percent
1 7,517 20.8 26.6 503,260 15.6 21.5
2 6,074 16.8 21.3 675505, 20.9 26.1
3 6,730 18.7 10.1- 635,086 19.6 12.0
4 15,788 43.7 .42.0 1,420,747 43.9 40.4
Total 36,109 100.0 100.0 3,234,598 100.0 100.0
1;4
-136-
DOC 1 and 2 showed decreases, while DOC 3 and 4 experienced ,increases as
results of the change in sample allocation procedure. Table 2-57 lists
%
Year 11 weighted and unweighted,percentages by DOC and package. Table 2 -58
presents percentages of Year ll'Age Class 3 sample schools by DOC, TOC, and
STOC.6
Table 2-59 shows Year 10 and 11 weighted percentages of Age Class 3
e ibles by STOC and DOC. As in each 'of the other, two age classes, the
jor part Qf STOC 2 has come from DOC 1 and the remainder from DOC 2, with
the converse true for STOC 3.
As already indicated, table 2-60 presents Year 11 weighted and
unweighted percentage of Age Class 1 2, and 3 eligibles by STOC.for all
4
packages in each region.t
I
I A.
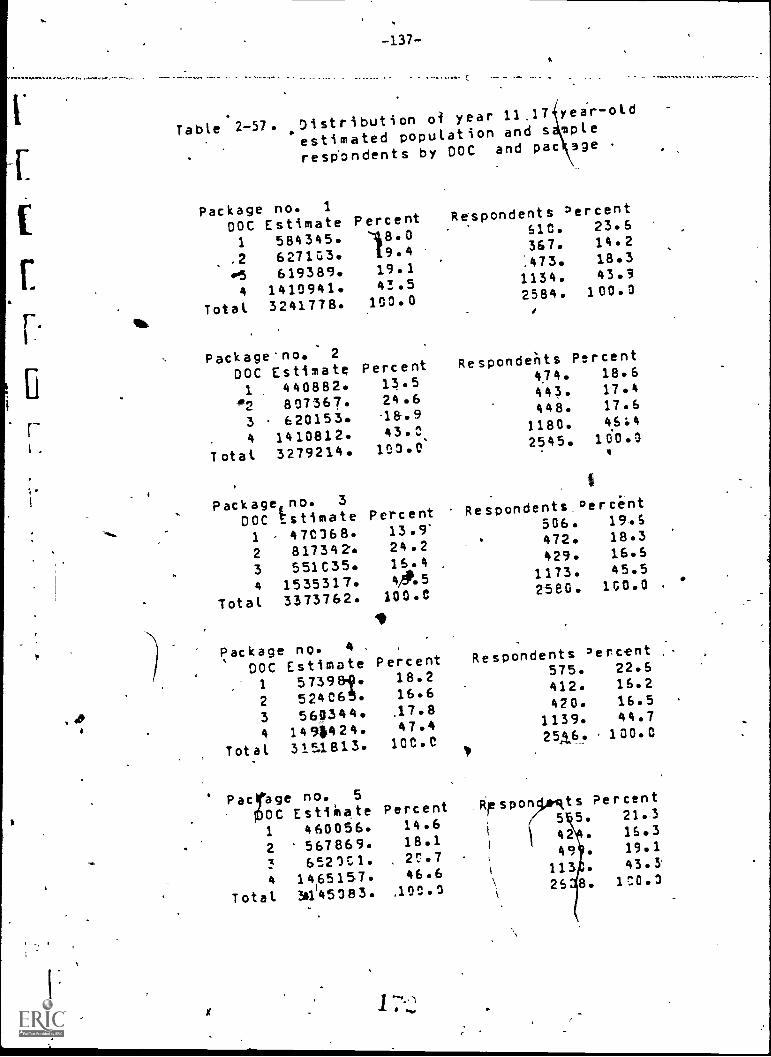
r.
-137-
C
Table 2-57.Distribution of year 11.17 year-old
estimatedpopulation and s mple
respondents by DOC and pac age
Package no. 1
00C Estimate Percent Respondents 2ercent
1 584345. 18.0 610. 23.6
.2 627103. 19.4 367. 14.2
05 619389. 19.1 :473. 18.3
4 1410941. 43.5 1134. 43.9
Total 3241778. 103.02584. 100.0
Packageno. 2
DOC Estimate Percent Respondents Percent
1 , 440882. 13.5 474. 18.6
.2 807367. 24.6 443. 17.4
3 620153. 18.9 448. 17.6
4 1410812. 43.3, 1180. 46;4
Total. 3279214. 103.0 2545. 100.0
Package no. 3
DOC estimate Percent Respondents percint
1 470168. 13.9' 506. 19.6
2 817342. 24.2 472. 18.3
3 551C35. 16.4 429. 16.6
4 1535317. 4/4/.51173. 45.5
Total 3373762. 100.0 2580. 100.0
Package no. 4
DOC Estimate
.
Percent Respondents 2ecent
1 573999. 18.2 575. 22.6
2 524365. 16.6 412. 16.2
3 569344. J7.8 420. 16.5
4 1491424. 47.4 1139. 44.7
Total 3151813. 100.0 25.16. ' 100.0
Pacrage no. 5
0C Estimate Percent
1 460056. 14.6
2 567869. 18.1
3 652131. 2C.7
4 1465157. 46.6
Total 31145183. 100.3
K
_Flipesponpmts Percent
,/ 5 5. 21. -3
E,I 42 16.3
49 . 19.1
113 43.3
26 8. 1C0.0

-138-
Table 2-57 (continued)
Pack-age no. 6
DOC Estimate Percent Respondents Percent
1 560570. 18.4 582. 22.5
2 543075. 17.8 420. 16.2
3 712375. 23.4 516. 19.9
4 .1230612. 40.4 1170. 41.4
Total 3048632. 100.0 2588. 100.0
Package no. 7
DOC Estimate Percent Respondents' 'Percent
1 459056. 13.7 466. 18.1
2 912919. 27.3 451. 17.5
3 710479. 21.3 573. 22.24 12572.46. 37.7 1089. 42.2
Total 3339700. 10C.0 2579. 100.0
'Packagegno., 8
"DOC E'stimafe Percent Respondents Percent1 409298.t 13.4 491. "18.82 5,35626. '17.6 438. 16.8
3 755919. . 24.8 602. 23.3
4 1349203., 44.2 1080. 41.4
Total 3049846. 100.0 2611. 100.0
Package no. 9
DOC Estimate Percent Respondents Percent1 - 511338. s 15.9 537. 21.5
2 545344. 16.9 "384.-' 15.3
3 764391. 23.7 534. 21.3
4 1403779. '43.5 1047. 41..9
Total 3224852. 100.0 2502. 100.3
Package no. 10.DOC Estimate Percent Respondents Percent
1 502659. 15.8 501. 19.6
2 8C6948. 25.3 514. 20.4
3 5C1204. 15.7 409. 16.2
4 137,1135. 43.2 1099. 43.6
Total 3166196. 103.0 2523. 100.3

is
r- -
-139-
Table 2-57 (continued)
Package no. 11-DOC Estimate Percent Respondents Percent
'A1 426159. 12.2 476. 18.5.
2 795565. 22.8 '498. 5 19.33 29259. 18.0 477.....1854 1 9585.tq' 47.0 1127. 43.7
Total 34 C568. 100.0 2578. 100.0
Package no. 12 &-
DOC Estimate Percent Respondents Percent
.
1 624554. 19.2 664. '25.6
2 571141. 17.5 347. 13.43 586239. 18.: 384. 14.9,4 1476417. 45.3 1200. 46.2
Total 3258351. 100.5 2595. 100.0
Package no. 13DCC Estimate Percent Respondents Percent
1 51663C. 16.8 569. 21.62 56618. 16.5 411. 15.63 559804. 18.3 429. 16.24 1486032. .48.4 1228. , 46.6
Total 3069084. 100.0 2637. 100.0
Package no. 14DOC Estimate1 556047.
Percent14,8
Respondents Percent511. 4,19.4
2 896C81. 26.1 493.A7 18.73 66,8814. 19.5( 537. 26.44 1356545. ,39.6 1092. 41.5
Total 3427487. 100.0 2633. 100.0
All packagesDOC Estimate Percent Respondents Percent1 503266.' 15.6 7517.L- 20.8,,2, 6755C5. 20.9 6074. 16.93 635)8'6. ;19.6 6730. 18.74 1420747. 43.9 15788. 43.7
Total 323459e. 130eC 36109. 103.3
17j

-140-
Table 2-5t3. Distribution of year 11 17-year-old sample
-schoo-ts by DOC. TOC, anc STDC codes
Dec TCC STOC
Code No. Pct. No.
c
Pct. No. Pct.
1 102 23.5 70 16.1 70 16.1
2 68 15.6 63 14.5 63 14.5
3 53 1.2.2 38 8.7' 38 8.7
4 212 48.7 204 60..7 31 7.1
5 X X X X 38 8.7
6 X . X . X X 53 12.2
7 X X X X 142 32.7
Total 435 100.0 435 100.0 . 435 100.0

c
-141-
Table 2-59. Weightedpercentages of 17-year-olds
by STOC and DOC
DOC1 2
1 0.0 7.5
4
2. 0.0 , 2.2
3 0.0 0.0
4 7.8 0.0
Total 7.8 9.7..
AMY
1
. 0.0 8 2
2 , 0.0 3.7
3 0.0
4 7.5
Total 7.5 11.9
I
0.0
Year 11
STDC
4 5 6 7Total
4.5' 4.4 0.0 0.0 0.0 16.4
7.4 0.0 11.5 0.0 0.0 21.1
, 0.0 0.0. 0.0 19.5 0.0 19.5
0.0 0.0 0.0 0.0 35.2 43.0
: 11.9 4.4 11.5 19.5 35.2 100.0
U
Year 104
STOC
3 4 5 .6 7 Total
3.5 '11.0 0.00.0 22.7
6.2 0.0 15.5 0.0 0.0 25.4
0.0 '0.0 0.0 11.7 0.0 11.7.
0.0 0.0 0.0 0.0 32.7,40.2
9.7 11.0 15.5 11.7 32.7 100.0

.Table Y -60. Distributionfof,Year.
11 es ated populationand sample respondents by STOC,
region and age.
Region /STOC1
2
Ep,t ma ed population
35
lb.
Northiest- ,No. 41,779 81,134 76,109 49,367 65,052
Pct. ,5.6 11 10.1 6.6 8.7
Southeast Nilit* P' 4,230 9,727 51,8
-
,29
Pct, 12.5 1.2 6.6 5.1 7
Central No. - 1201'602 .34,353 53,885 96,072 104,134
Pct.' 14.2 14:2 f,.;11.3 12.2
West No. . 60,646 77,644, 163,232 82,419 135,167
rpt.4 6. 8.1 17.2 .8.7 14.2
Total No. 321,457 204,856 34 , 267,692 364,651
Pct. 9 IN66.14, 10.4 8.0 10.9
Northeast
0
Southess,,,
No.
Pct.
No.
Pct.
45,522 90,632 71,817 50,404 80,271
5.6 11.3 8.9 6.3. 10.0
92,468 44,615 28,359 31,930 79,990
11.4 5.5 3.5 3.9 9.9
Central No. 129,285 45,985
Pct. 15.2 5.2
Wept . No 47,597
Pct. , 5.5
Totll No, 314,872
-v.Pct.., 9.5
Wortheast No. 27,682
Pct. 3.9
Southeast No. 9,,248Pct. 12.7
01
Ilentral 'No: 93,092
Pct. 4i%\ 10.1
West No. 37,528
PO.. 4.4,
.
Total No. 253,550
Pct. 7.4. .,
110,62575,395ft. 62,498
13:0 . 8.9 7.4
96,459 97,523 37,008 179,854.
11.2 11.3 I 4.3 20.8
275,751 308,324 194,757 402,613
8.3 9.2 ON 12.1
101,465 43,366 21,778
/ 14.2 / 8.8 3.
-11511;826. 24,279 26-;102.
'2.4"\ 3.8 3.5
.10,554' 135,870 28,481
7.7 14-8 3111!
*87,5824 161,352 *59;988
10.3 19.0 ' 7.0
279,427 388,467 1711,340
8.6 12.0 4..4
a.6
Total2
9-Year-Olds
106,756 327,867 750,064297 1,291.
14.2 43.7 100.04.3 18.7
159,575 366,374 785,876980 180
20.3 46.6 100.014.4 *2.6
115,307 326,806 85'1,1591,180 541
13.6 38.4 100.014.6 6.7
85,318 347,344 952,468462 887
8.9 36:5 100.06.4* 12.2-
466,956 1,368,391- 3,539,5672,924 2899
14.0 41.0 100.0 10.0 10.0
13-Year-Olds
151,792 .313,-916804,354 547 1,600
18.9. 39.0 100.0 5.3 .15.5
174;229 359,938 811,589.. . 1;096 654
21.5 44.3 A 100.0 11.5 6.9
153,3.29 273,911 849,028 1,87p 8Q9
324 100.0 16.1 4.0
165,550 238,481, 862,472603 1,101
19.2 27.110.9
644,900 1,186,246 3,327,4434,116 4,164
IC 4 35.6 100.09.9 10.0
.17;0410rOldi
74,897 137,545. 284,032 . 715,765353 1,755 663 462 810 1,385 3,023 8,451,
10.5-' 19.2 A9.7 , 100.0 A.2 20.7 ' 7.8 .,5.5 9.6 16.4 35.8 100.
83,737 8148,228 348,1771 749,594. 1,132 253 50.7 461 432 1,528 3,494 7,827
111- 19:8 46.4 - 100,0 -114,5 3.2 '0.5 5'.9 5.8 19:5 44,6 100.0
-A.-, .
98,825 '175)990 315,9.14 918,727 1,591 896 805 595 1,201 2,034' -13,169 -10,149._
10.7 19.2 34. 100,0 .; 15!2 8t5 07.7 5.7 11.4 19.4 32.1 100.0
. 0..
-114,604'.173,32,3219,674
850,509, * 41 368 - 992. 1,666 ' 850 -1,223 1,783 450 1,312
13t.? 20.4 25.8 100.0 .
,
3.9 10.6 17.9 9.1 13.1 '19.1 2 ,3 100.0
..
9,121 635,086- 1,167,197 3,234,5983,452 3,896 3,641 2,368 3,686 fi1730 12,336 36,109
11.11. 19.6 36.1 100.0 -. 9.6 10.8 10. 6.5 b.2 18.6 34.2 100.0,--
Respondents
3 4 5* 6 7 Total
599
8.6
rld420 616 3,101
6:1 8.9 44.8
6,917
100 0
483 458 577 1,126 3,022 6,826
7.1 6.7 8.4 16'.5 44.3 100.0
451 885 891 698 3,434' 8,080
5.6 11.0 11.0 8.6 42:5 100.0
1,360 757 983 564 4,262 7,280
18.7 "'10.4 3.5 7.7 31.1 100.0
2,891 2,693 ,2,871 3,004 11,819 29,103
9.9 9.3 9.9 10.3 40,6" 100.0
980 998 923 1,781 3,523 10,352
9.5 9.6 8.9 17.2 34.0 100.0
f
389 419 813 1,734 4,407 9,512
4.1 4.4 8.6 18.2 46.3-100.0 hop
1;383 796 730 1,8-70_4,161 11,625
11.9 6.8 6.3 16?.1 33.8' 1100.0
1,351 681 2,292. 1,693 2,364 10,085
1'3.4 6.8, 22.7 16.8 23.4 100.0
4,103 2,894 4,758 7,084 14,455 41,574
9.9 7.0 11.4 17.b 34.8 100.0
F
1
1

r
S
-143-Au.
442.7 Historical File 4111
ji historical computer Tile of, districts and schools selected for
National Assessment in Years. 04 through 06 was created during operational
Year 07. In Year 08, this file was updated to include districts and schools
selegted,for assessment in Years 07 and. 08.' Due tp budgetary constraints
t historical file was not updated to include districts and schools select-
ed fot assessment in Year 09 or 10. Neither were STOC codes addito the.
file for schools selecVd for assessment -iiYears 04 through 08. In Year
A
11, work was begun on updating'the file for Years 9, 10, and 11 to beor
completed in Year 13. r-3
2.8 Yeas 11 Efficienc*j Studies
-Work on Yea-r -11 _Efficiency Studies was begun in late 1980, to be
completed in 1981.
2.9 Response Experience
The schools selected in Year 11 are clis.sified in table 2-61 by region
and age class. As noted, these figure% included schools Which'wereSele-cted
for participation in Year 11 after the initial secondary sample had been
selected (i.e., new schools, sampki schoOls with grade range changes which,.
were added to the sample, and °replacement schools). A total of 1;740
schools vas selected for -the Tear 11 ;ample: 608 for Age-Clasepl, 642 for
Age Class 2,, and 490 for Age Cliass 3.,
The schools which were Added to -the initial Year 11 secondary sample
arc classWied by region and age class in" table 2-162- Of the 54 schools
I
F
adde three were selected as a.reSult of sampleupdatingiperations The
..,
---...._ tipditing operation; consisteeof the following' activities: ) ne/s is ) I
/M
with eaigibles in selecil.ed districts were given a chance to eAter1
sample on .a probability basis; (2) sample schools which had undergone grade
t
17J

'Table 2-61. Number of schools selected in Year 11 sample!1
Region 1 Region 2 Region 3 Region 4 Total
Age /pips 1 138 -135 191 154' 608
Age Class 2 154 145 192 151 642
Age Class 3 107 103 145 135 490, A
Total Year 11 Sample 399 373 528 440 1,740 -
1/Includes schools selected for participation in Year 11 after the initial
secondary samplhad been drawn.
Table 2-62. Number of schoolS addedto initial Year 11 scondaryllikample after
initial iecondary,sample selection
Region_ _ Region _ Region __ Total
Age Class 1 i 2 1 0 13 16.
Age Class 2 6 4 4 , .4 18I
Age Class 3i
2 9 20
24Wotal'Year 11 Sample 14
408 6 t 26 , 547
/
1/
Three were selected as a result of sample updating operations.
b
,
4 '
A
-145-.00
w
range -changes- such that they now-had eligibles for a previously uncQnsider-
ped age class were also given a c to enter the sample on a probability
basis. The remaining 51 of the 54 additionk schools were selected as
replacements for refusals.
1
Table 2-67 summarizes the Year 11 school response experience by age
class. For Age Class 1, 92.1 percept of the selected schools participated;
83.2 percent of the selected schools participated at Age Class 2; and 84.1
percent participated at Age Class 3. Across the entire sample, a total of
86.6 percent of the selected schools participated. Schools were classified0
as nonparticipants either because they ,-efused, were closed, had no eligible.
respondents, or for other reasons. Classification of selected schools by
these nonparticipation categories is also included in table 2-63.
Year 11 school cooperationis,summarized in table 2-64. Based.on the
originally selected schools, less those schools which were found to be
closed or no longer have in-range grades, the Year 11 cooperation rate was
92.13 percent.
JlTables 2-65 and 2-66 present summary data, by age class, on the number
and. percentages of sessions completed and students assessed during Year 11.
Table 2-65 shows data'nly for regular assignments, while table 2-66 presents
summary data only for standby assignments. Included in these tabl4s are1
the results of the no4espondent followup conducted 4n Age Class 3 assessment.
Session soompletion rates for regular assignments ranged from 98.8 to
100.0, percent. Session completion rates for standby assign4nts ranged
from 72.7 to 89.5 percent. Students assessed in regular assignments ranged
from 78.9.to 90.1 percent. Students assessed in standby assignmentsaranged
from 88.5 to 93.3 percent.
F

146
Table 2-63., Summary of school response in Year 11 sample
a
Age Class 1 \ Age Class 2 e t)1:68 3 ' Total Sample
Percent Percent,
No. of Total . No. of Total
AssAiment 560 92.1 534Conducted
Refused 32 . 5.3' 41
'Closed 6 1.0 10
No Eligibles 10 1.6 ,54Enrolled
Other 0 0.0 31/
TOtal Selected 608 100.0 642
83.2
6.4
1.6
8.4
0.4
100.0
No.
Percent.of Total No.
Percentof Total
412 84.1 1,506 86.6
46 9.4 119 6.8
2 0.4 18 1.0
28 5.7 92 5.3
23-1:ir 0.4 5 0..3.7490 100.0 1,740 100.0
Pr
1 1 One school selectid in the sample for the Northeastern Region was not inexistence; also, two schools in the sample for the Central Region were foundto be in nontample counties and, thug, were eliminated from the Year 11 sampleof schools.
2/These schools were found to be situated in a county outside of the PSU in
Which they merezielec-ted-and were dropped from the sample.
7
40
1
1
S

147
Table 2-64. Summary of school cooperation in Year 11 sample
, Ageipr Class 1
AgeClass 2
AgeClass 3
TotalSample
No. of originally selectedschools (A)
No. of original out-of-rangeor closed schools (B)
No. of original refusalschool4 (C),
(A-B)-CCooperation
590
ti
8.
32
9415%
623
16
41
93.2%
467
6
44
90.5%
1,680
30
117
92.9%.rate(A-B)
S
r
f
_AP
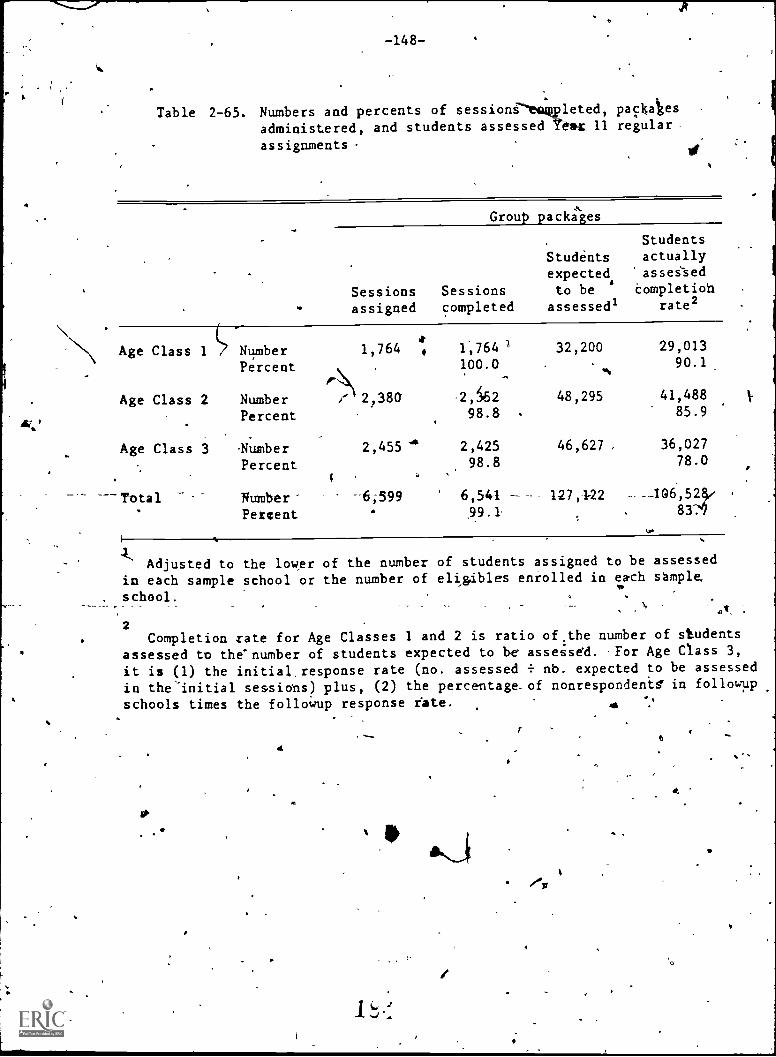
t,
-148-
Table 2-65. Numbers and percents of session-P'eauleted, pachaies
administered, and students assessed rear 11 regular-
assignments
Group packages
Sessionsassigned
Sessionscompleted
Studentsexpected.
to beassessedl
Studentsactuallyassesed
completiohrate2
\\ .
N\ Age Class 1 ,
Age Class 2
Age Class 3
--Total
NumberPercent
NumberPercent
-Number
Percent
Number-Percent
1,764
2138d
2,455 'a
4
-6;399'
4: 1,7641100.0
-2,5162
98.8 ,
2,425
98.8
6,54199.1.
32,200
wt
48,295
46,627 ,
127,422
29,01390.1
41,48885.9
36,02778.0
--1G6,524/83:/
Adjusted to the lower of the number of students assigned to be assessed
in each sample school or the number of eligibles enrolled in each sample.
school.
2Completion rate for Age Classes 1 and 2 is ratio of,the number of students
assessed to the'number of students expected to be assessed. For Age Class 3,
it is (1) the initial, response rate (no. assessed nb. expected to be assessed
in the initial sessions) plus, (2) the percentage. of nonrespondenif in followup
schools times the followup response rate. 4
4
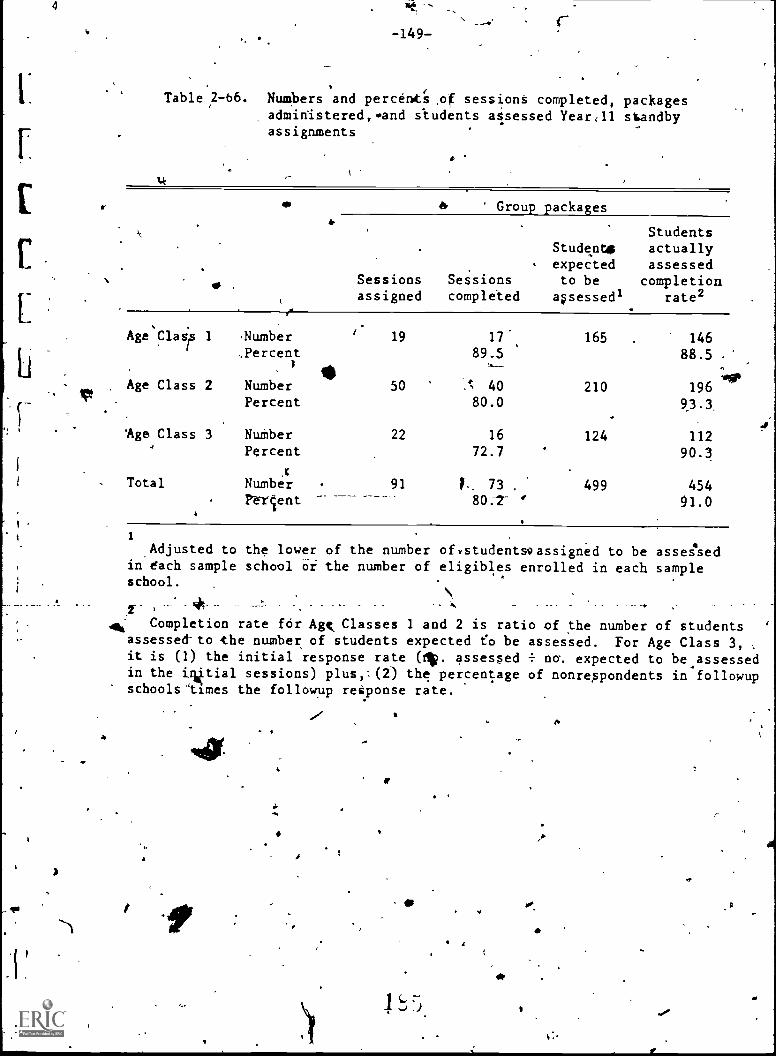
1
f
4
-149-I
Table 2 -b6. Numbers and percents nf sessions completed, packagesadministered,and students assessed Year;11 standbyassignments
et
6 ' Group packages
Sessionsassigned
Sessionscompleted
Student*expectedto be
a;sessedl
Studentsactuallyassessedcompletion
rate2
Age.
Clay 1 'Number .19 17' 165 . 146
,Percent1
89.5 88.5
.olp. Age Class 2 Number
AP50 't 40 210
:
196Percent 80.0 93.3.
Age Class 3 NuMber 22 16 124 112Percent 72.7 90.3
Total Number 91 V. 73 499 454Perient 80.-7 ' 91.0
/VP
a
1
Adjusted to the lower of the number ofvstudentsvassigned to be assessedin each sample school or the number of eligibles enrolled in each sampleschool
Alia- Completion rate for Agt Classes 1 and 2 is ratio of the number of studentsassessed-to the number of students expected to be assessed. For Age Class 3it is (1) the initial response rate (40. assessed no. expected to be assessedin the iiktial sessions) plus,:(2) the percentage of nonrespondents in followupschools times the followup response rate.
1
-150-
2.10 Accessibility Status of 17-Year-Old Nonrespondents
In Year 11, three nonrespondents per 17- year-old school were selected
and a form was completed for them to determine whether they were accessible
or Agaccessible. In nonfollowup schools, an initial package was selected
.and three nkrespondents were selected. In 'folrowuP schools, a foilowup04 )
package waiidentified from which the three nonrespondents were'selected.
The nonrespondent package was identified on a separate package assignment
form for each school. This form also included random numbers for selection
of sample individuals.
aNonrespondents to each nonrpondent package were numbered downthe
right hand side.of the Group Administration Schedule (GAS). Some schools
noted that s ected students were dropouts, transfers, or ineligibles after
/fr assessment Some District Supervisors were omittin
s
tudents from
nonresponse form and others Were including them. To keep field proce-
'dures simple, all dropouts, transfers, and ineligibles were numb red whether,
located before drifter -Ass'essmeitt.' A copy- of th GAS tearoff
ning the numbered frame'was mailed to RTI along with-the nonreslloondent
\\___form. Selected nonrespondents were identified'by line number on the non
they were
sform (see appendix 6) and by having their frame number circled on
the GAS tearoff. All selected nonrespondents who were noted as transfers,
dropouts, dr ineligible before assessment were lined opt and were sot
included in the sample which was tabulated. All transfers; dropouts, and
ineligibles after assessment were hot lined out and were included in the
tabulation.
1116 .
Table 2-.67 summarizes the results. of the tabulation of accessibility
status for the sample of 958 17-year-old nonrespondents. InacceSsible
students were counted as those who were ineligible, not enrolled, temporari-.,
ly away but Apectedrto return, temporarily away but not expected to return,

4..144404
Table 2-67. Accessibility Status for Sample of Nonresponding 17-Year-Olds
Region
No. enrolled, No. enrolled,No.
No. No. attended more than temp. away, but No. enrolled don't
ineligible not enrolled ,1 day-in last 30 7 expect to return not return know Total
Northeast
Southeast
,..,.#
West
Total
aelL,
4
3
13
11
9
S
11
39
200
2E41
225
0
8
21
13
1
1)
4
18860'
Inaccessible students
Ineligiple
Not' enrolled
Temp. away -Temp. away -Temp. away
13
39return 21
not return 18I don't know 7
98
.
Percentage of nonrespondents who were inaccessible,=
oft
R
4 232
0 1112
2q/
1
2 253
7 958
. 0 :7 0 4098
958 2x 100 != 10% (No Show Study = 21%).
'4

-7+
4
4
-152:
and temporarily away oand not known whether they would return or not. A
total of 98 or 10% (98/958), of the tabulated nonrespondents were 'Classified
as inaccessible. Igpthe Year 10 pretest of this procedure for checking the
attendance status of nonrespondents, the inaccessible percentage was 13%;
in the No-Show study conducted in Year 04, the percentage inaccessible was
21%.
It is posSible that the decline in the percentage. inaccessible since
Year 04 is due t6 implementation of procedures for,up-nting the student .
sampling frame prior to sample selection. When the No-Show study was
#
conducted, the 17-year-old sample was not selected early and updated.
Updating tfie sample likely has rained the schools to clean the lists more
thoroughly for inaccegYibles.
*2.11 Special Problems and Recommendations
The Iollowup procedures implemented for 17-year-olds appear to have
been effective in increasing the 'response rate to an' acceptable level.
Similar procedures should continue to be .followed.
4. ,
4
vo-153-
REFERENCES FOR CHAPTER 2
[1] Chromy, James R. and Anne F. Clemmer, Year 11 Primary Sample for theNational Assessment of Educational Progress. RTI Pro'Act 255U-1764,Final Report, June 1980.
[2] Sampling Department Staff. Formulation of Age Class 2 Weights--NAEP
Year 03 In-School Survey. Working Paper No. 4 (Revised), RTI Project
No. 25U-688. June 1972.
[3] Clemmer, Anne F. Formulation for Age,17 Nonrespondent Followup/Weights in NAEP Year 10 In-School Sample. (Revise RTI/1772/00-01 I,
July 1979.
[4] Clemmgr, Anne F.- NAEP Year 05 In-School Package Assignment Procedure.Working Paper.No. 4, RTI Project No. 255U-918, September 1974.
[5] District Supervisor Manual, Year 10. July 1978.
[6] Clemmer, Anne F., Lefler, and J. E. Richardson. NAEP Year 07
In-School Package Assignment Procedure. Working Paper No. 1, RTI
Project No. 255U-1379, January 1977.
[7] Final Report of Year 11 In-School Quality Check Activities! October,
1980- RTI/1967/00-01F.
[8]_ Clemmer_, Anne F. Year 07 Secondary and Tertiary Saale Design forthe National Assessment of Educational Progress. Working Paper No. 8,
OP
RTI Project Hd. 255U-1061, April 1975.
len
Nog
. -

14,
-154=
3r SUPPLEMENTARY FRAME, ASSESSMENT
3.1 Overview
It is estimated that perhaps 9 to 10 percent of all 16-1/2 to 17-1/2-year-
olds are not enrolled in secondary schools when the in-school Age Class 3
assessment is conducted, and the Supplementary-Frame assessment is designed
to collect NAEP data from a probability sample of this portion of the Age
Class 3 population. For Year 11, the Supplementary Frame assessment target
population was operationally defined as individuals born in the. period
October 1, 1962 through September 30, 1963, and not enrolled in NAEP-
eligible elementary or secondary schools anytime during March or April.
1980-. Excluded from the target population were 'nonreaders, non-English
speaking individuals, persons living out of the country,'and individuals
hemedincapable. of giving meaningful responses due to mental or physical
impairment.
As in previous years, the NAEP Age Class 3 in-school sample served as46
r
the basis for the Supplementary 4racoe . The NAEP Age Class 3 schools
in eath ,of the 83 Year 11 PSUs were led at 4 rate of one-half to -iden-,
P
tify the Supplementary Frame school subsample. A total if 209'schools were
asked to partielgate for this phase the assessMent by providing listi of
potentially eligible discontinuers fop. the three most recent school wars
and, for schooli having twelfth grades, lists.of potentially eligible early_ .
graduates. CoOpeiation was received from 207, or 99 percent, of tie
schools asked to participate for list compilation. After receipt fromithe
schools, the dscontinuer and early graduate'lists were screened to eli-
'minate.persons with ineligiblebirthdates, and duplicate listings, and to« A
1
A
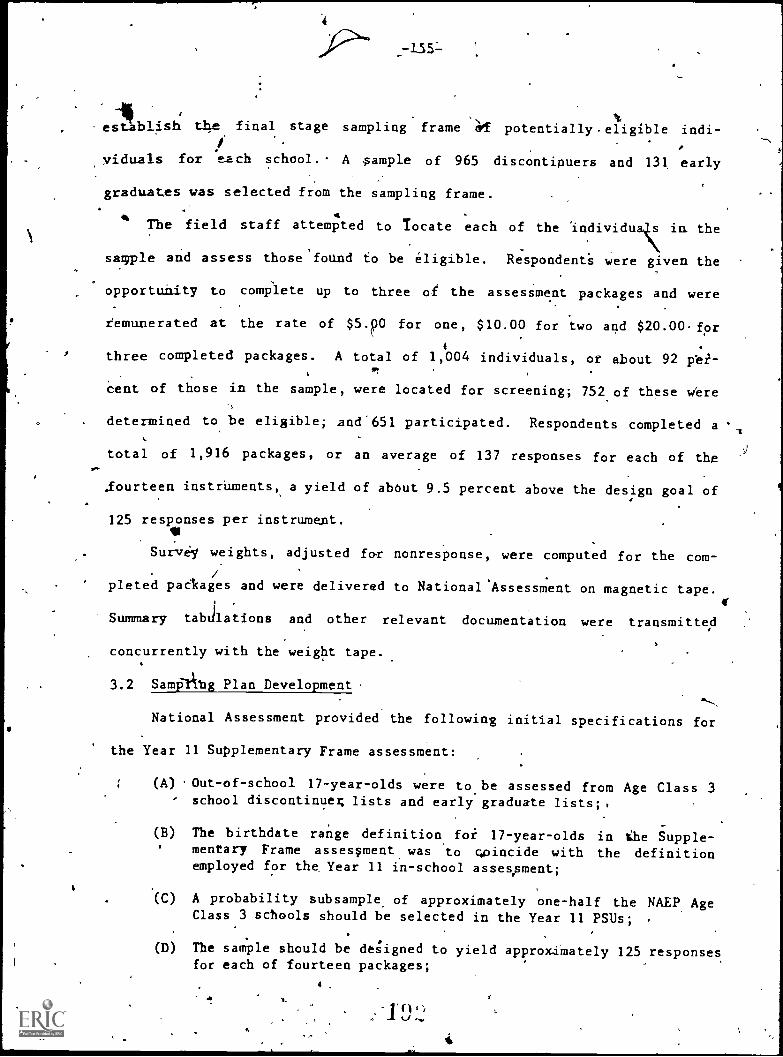
1
1111M11
establish the final stage sampling frame df potentially. eligible indi-
viduals for each school. A .sample of 965 discontipuers and 131 early
graduates was selected from the sampling frame.
The field staff attempted to locate each of the 'individuals in the
sample and assess those found to be eligible. Respondents were given the
opportunity to complete up to three ol the assessment packages and were
remunerated at the rate of $s.po for one, $10.00 for two and $20.00for
4
three completed packages. A total of 1,004 individuals, or about 92 pe -ot
cent of those in the sample, were located for screening; 752 of these were
determined to be eligible; and'651 participated. Respondents completed a
total of 1,916 packages, or an average of 137 responses for each of the
.fourteen instruments, a yield of about 9.5 percent above the design goal of
125 responses per instrument.
Survey weights, adjusted for nonresponse, were computed for the com-
pleted packages and were delivered to National' Assessment on magnetic tape.
Summary tandlations and other relevant documentation were transmitted
concurrently with the weight tape.
3.2 SamOkhg Plan Development
National Assessment provided the following initial specifications for
the Year 11 Supplementary Frame assessment:
(A) 'Out-of-school 17-year-olds were to be assessed from Age Class 3school discontinues lists and early graduate lists;,
(B) The birthdate range definition for 17-year-olds in the Supple-mentary Frame asses;ment was to cooincide with the definitionemployed for the Year 11 in-school assessment;
41'
(C) A probability subsample of approximately one-half the NAEP AgeClass 3 schools should be selected in the Year 11 PSUs;
(D) The sample should be deLgned to yield approx4mately 125 responsesfor each of fourteen packages;
4.
S

t. -156- 4--
(E) Respondents should be permitted to complete up'to three of /the
Age Class 3 packages.
(The same idg plan for the Supplementary Frame a sessment was developed
l* in accordance with.the foregoing specifications based on the Year 07 survey
. .
experience andtexpected-Year 11 results.
a
The specifications called for 125 responses for each of\the ;fourteen
IP
instruments, or approximately 1,750 completed packages, in total. Respond-.
ents wela expected to complete an average of 2,90 packages and the expected
.1
overall participation rate was 55 percent, hence, the'sample was designed
to contain
1,750= 1,096
(2.90)(0.55)
potentially eligible individuals,
3.3 School Selection1
A half-sample of the NAEP Age Class'3 schools was selected in each PSU
to comprise the Supplementary Frame school-sample. .Within each of the
PSUS, the NAEP Age Class 3 sample schools were divided into Jo sets, which
were Salanced to the extent possible on the number of schools, size of
schools,SES strata, and 17-year=old enrollment. One of the two groups was
selected from each PSU with probability equal to one-half. The Supplement-,. I rt
.---
ary'Frame schools were designated the school data files and on the List--I (
of,Schools Selected for each P which were mailed to the ,District Super-
visor prior to initjal meetings with scho principals.
rli...
ApproxiMately half of the new sch s subsequently identified and
\chosen for addition to the NAEP Age Class 3 sample were selected for inclu-<
sion in the Supplementary Frame sample. The number of Supplementary Frame
schools by region is presented in table 3-1.

f
,,..0* -157-
Ta 3-1. Year ei Supplementary Frame sample schools by region
Legion I.
TotalSupplementaryFrame schools
Dropped NAEP Asked
from sample refusal, to participate
, Northeast 53 . 2 6 45
.e
.
Southeast 54 4 3 '447
Central 71 2 4 65
Vest 61 2 , 7 52
Total 239 10c 20 209
Closed, no Age Class 3 grade, or no eligible enrollMent.
f4 .
Since the total school sample for 17-year-olds adequately represents
the various subpopulations of interest, a 50 percent subsample of the.f
schobls, selected with equal probabilities, also is representative of the
subpopulgtions.
3.4 Dropout and Early Graduate Frame'Construction and Sample Selection
Supplementary Ftame sample schools were asked to provide.lists of
individuals whose birthdates .were in the,range which defined Yeay 11 17-,
t
year-olds (10/1/62 through 9/30/63), and'whb left school during any of the
academic years 1977-78,, 1978-79, or 1979-80. The listing was to incrude
.
students who failed to return to school following summer vacation and who
were not known to have enrolled in another school. Di*ontinuers whoie
birthdates were unknown were also'listed. Not to'be included in the list.
ing were itudenti who reer4ered school and who wee enrolled at the time of
Age Class 3 assessffient, nor students who transferred directly to ,other
schools. For each listed individual, the last known address was obtained,
and whenever possible,, the birthdate and Xhe parents' names and, address.
10

-158-
- Supplementary Frame sample schools. which had a twelfth grade were
' .
4siced to provide a listiof persons' whose birrthdates were in the range which
definisd_Year 11 17-year-olds, and who had graduated ptior to the Year 11
Age Class 3 in-school assessment. Subsampling -was dsed for searching'
school graduate records for the desired early graduates in large schools.
Twoof the four alphabet sectors A-D, E-K, L-1, and S-Z was selected using
simple random sampling. 'In scholls with more than 250 graduates per year,
only the records- graduates whose last names fell within either of the-
.
prescribed alphabet sectors needed' to be searched for early graduates. In
smaller schools all graduate records were to be searched for the early.
4
giaduates. For eftrly graduates identified through this screehing process,
the schools were asked to provide addresses,'birthdates, and parents' names
and addresses.
The school iscontinuer and ekarly graduate lists were forwarded to
RTI's sampling staff after receipt from the field. Receipt of the lists
was recorded. and` a record was made of requested information which was not
provided due to refusal, nonavailability, or other reasons. The lists were
reviewed for legibility and adherence to list acquisition' specifications,
and any resulting' problems or .questions were reported to RTI's National
Assessment Administration Center for resolution.
The discontinuer and early graduate list's from each school were cleri-
cally scanned to identify And delete ineligible individuals and duplicates,
and_the edited lists were serially'numbered to facilitate sample selection.
Since PSUs and schools were selected with probabilities approximately
proportional to the estimated number of 17-year-olds, an equal allocation
of- sample individuals to replicates was used. The Year 11 PSU sample was
comprised of eight one-replicate PSUs, 71 two-replicate PSUs and four'11

-159-
three-replicate PSUs. Therefore, the desired sample of 1,096 individuals
could potentially' be allocated to total of 162 replicates, yielding an
average allocation'of 6.77 sample individuals per replicate. It was anti-
cipated, 1$ v
cipated, however, that for some PSUs no lists of discontinuers or early
..,4 4, ,
.
graduates Would be submittddfN
. M'1due either to '1 sample schools refusing orr40 *
reporting that their records disclosed no age eligibleii 'viduals. It w#s
.1
also aVAcipated tat some further loss would be expeerenced due to cases
NNN in which the number of potentially eligible individuals reported would be
less than the sample allocation for the PSU. Rather'than fix a.specific
allocation of_ the sample based on prereceipt estimates these anticipated
losses, an iterative allocation plan was employed. An initial "allocation
of the desired 1,096 sample cases-to PSUs based. on number of replicates was
performed incorporating the listing results known at that/Le.- Then, as
the list compilation proceeded and specific instances of loss from the
desired allocations were identified, the temple allocation.was adjusted to
assure that the target yield of 1,096 sample cases would be achieved. This
allocation adjustment procedtire was repeated several times as sample selsc-
tion proceeded, with adjustments being made only for PSUs in which student'
sampling was yet to be performed.
In the final allocation, most one-replicate PSkJs were allocated 7 or 8
cases; most two-replicate PSUs were allocated 14 or 15 cases; and mostti
three-replifate PSUs were `assigned 21 or 22 cases. The final average
replicate allocationwas 6.85 (1,096 160) cases, since in one two- repli-
cate PSU no sample was pOssible because all three Supplementary Frame
sample schools were NAEPrefusals. A reduced sample was necessary in eight
PSUI due to listing cshortaies, and in these cases all listed individuals
were included in the sample.
1)

4
E -160-
Within PSUs, the student sample was allocated to the two sampling
frames (discontinuer,listi and early graduate lists) using a, strategy Which.
optimized the'number of the scarce early graduates'in the sample. /n most
PSUs, early graduates were included in the sample with certainty:- Ip order
to control representation from both frames, however, early graduates were
not permitted .po constitute more than half a PSU's sample= allocation,
unless the total nuMbei of potentially eligible Apscontinuers reported for
the PSU was, insufficient to fill out the specified sample allocation.
Within each PSU, the discontinuer sample was allocated to schools
using a procedure which approximately equalized the overall inclusion
probabilities of sample discontinueis in the PSU. A similar procedure was
used for allocating the early graduate sample, whenever necessary. Simple
random 'selection was used to specify sample individuals within schools.
The described allocation and selection procedur.s were implemented and
a sample of 1,096 individuals was selected-965 disconinuers and 131,early
graduates. A field instrument, the Individual Screening Questionnaire
(ISQ), was prepared for each sample individual. Information entered on the
ISQ included the individual's name, last known address, parents' names and
address, individual's birthdate and date left school, as reported from
school records. Any peripheral information provided from the school
records which might have been helpful in locating the .seleCted individual
. -
was also recorded. All sadple selection and ISQ preparation was completed
by June 6, 1980.
315 Package Assignment
National Assessment speclified that the Year 11 Supplementary Frame
assessment be conducted tiling the 14 Year 11 Age Class 3 in-school Reading/
Literature packages. Each respondent was, to be permitted to complete up to

three packages, including associated package supplements. A background
'questionnaire' was to be edministered- to each respondent prior to package4
administration to ensure its complefion..
Package assignment specifications were provided by National Asiessment
and, consisted of a listing of 110-ordered package triplets or sets, which
conformed to a complex set of packaging_ protocol constraints. Procedures
',were to be implemented by RTI which made, assignment of any of ,he 110
triplets to a respondent equally 'likely.
RTI's National Assessment Administration Center (NAAC) prepared a list
of Interviewer ID numbers and the number of package sets-to be 'assigned toI
each. Using. these specifications, 1,100. package assignment labels were
generated, divided into 32 interviewer sets. The package assignment labels
were delivered to NAAC on April 29 for use in preparation of the field
materials.
Each label designated the set of three packages to be assigned to a
respondent and prescribed the order of administration for the packages. A
unique four-digit number was.given to each b 1 and served to identify the
respondent to whom the package set was administered. Package sets were to
be Issigmed to .respondents` in the sequence of the label identification
numbers.
The packaging protocol constraints yielded, an unequal probability
allocation of packages. For three - packagepondents, the prbbability of
assignment of packages 1-3 was .0667; the probability of assignment'of
packages 4-14 was .0727. For respondents who completed only one or two
packages, the package assignment probabilities were much more unequal.
3.6 Support of Field Operations
Continuou'i support of the'kield operations was. provided during' the\'
.planning and conduct of the Year 11 Supplementary Frame assessment. The
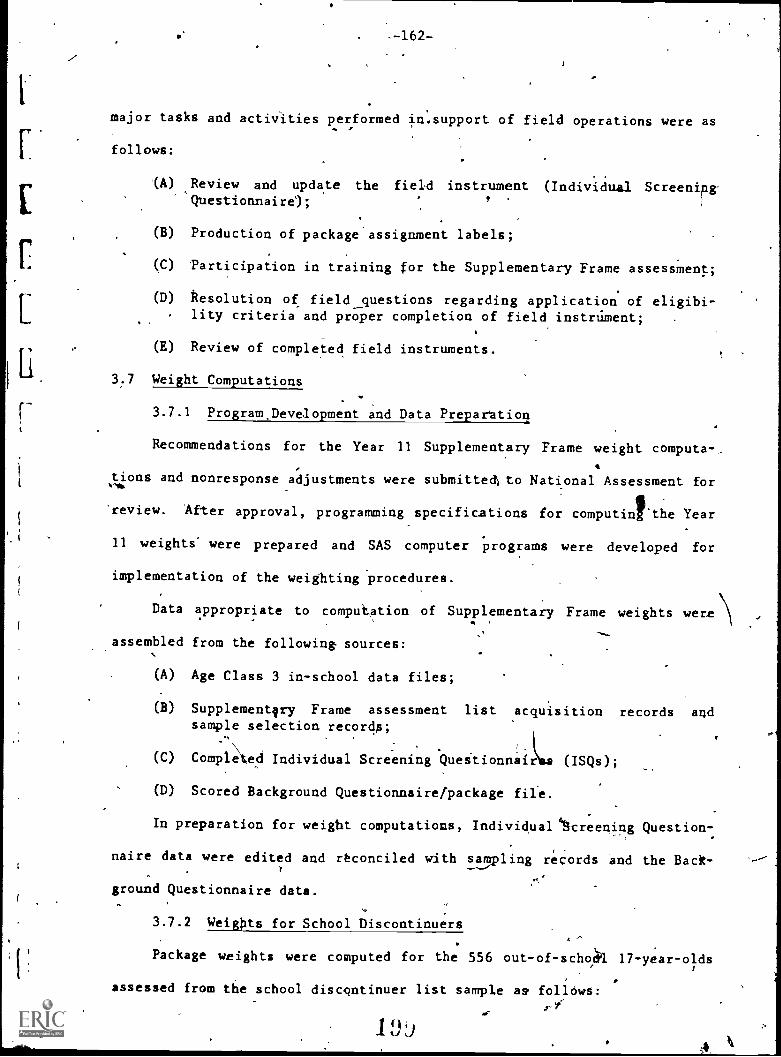
r.
-162-
major tasks and activities performed in,support of field operations were as..
follows:
fA) Review and update the field instrument (Individual ScreeningQuestionnaire); /
(B) Production of package assignment labels;
(C) Participation in training for the Supplementary Frame assessment;
(D) Resolution of field_ questions regarding application of eligibi-lity criteria and proper completion of field instrument;
(E) Review of completed field instruments.
3:7 Weight Computations
3.7.1 Program.Development and Data Preparation
Recommendations for the Year 11 Supplementary Frame weight computa-,
tions and nonresponse adjustments were submitted) to National Assessment for
'review. After approval, programming specifications for computilthe Year
11 weights' were prepared and SAS computer programs were developed for
implementation of the weighting procedures.
Data appropriate to computation of Supplementary Frame weights were\\
. .
assembled from the following sources:
(A) Age Class 3 in-school data files;
(B) Supplementyry Frame assessment list acquisition records andsample selection records;
(C) Completed Individual Screening Queitionnair (ISQs);
(D) Scored Background Questionnaire/package file.
In preparation for weight computations, Individual creening Question
naire data were edited and rbconciled with sling records and the Back-
ground Questionnaire data.
3.7.2 Weights for School Discontinuers
Package weights were computed for the 556 out-of-schok 17-year-olds
assessed from the school discqntinuer list sample as follows:
.1 !i
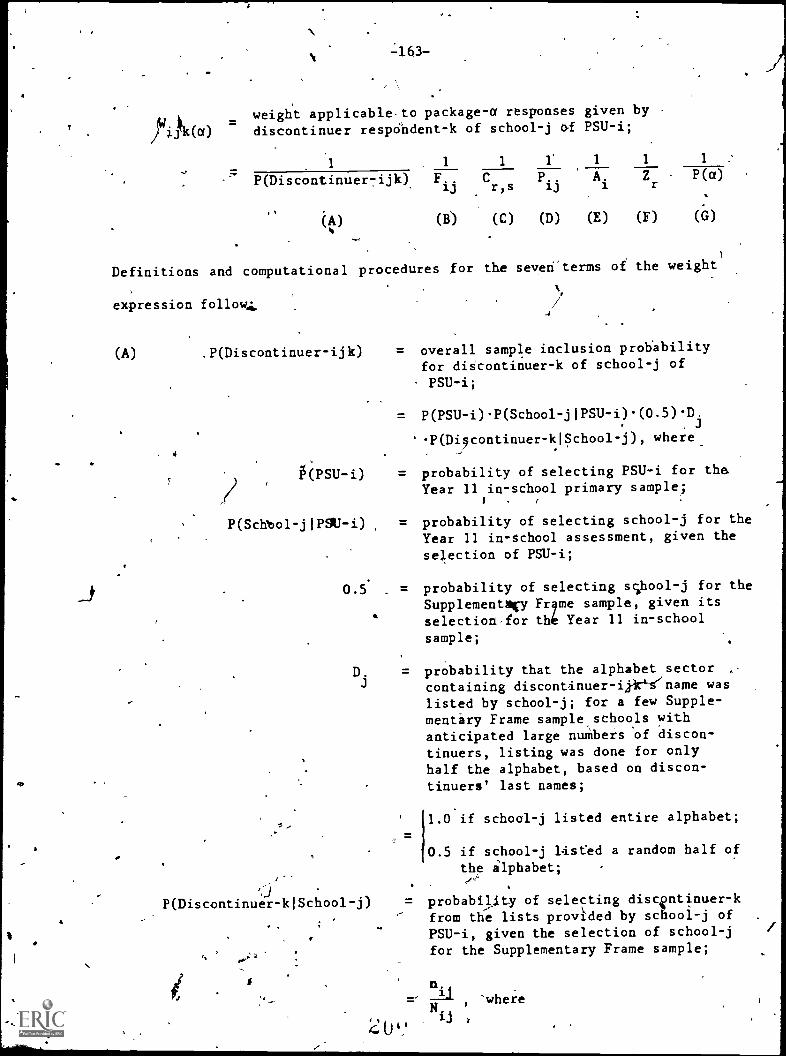
weight applicable to package-a responses given by7 discontinuer respOhdent-k of school-j of PSU-i;
41.
illabimommour
1 1 1 1. 1 1 1
P(Discontinuer-ijk) F. Cr P. A. Zr . P(a)lj ls Pi' 1
(B) (C) (D) (E) (F) (G)
Definitions and computational procedures for the seven'terms of the weight
expression follow,:
(A) .P(Discontinuer-ijk) = overall sample inclusion probabilityfor diicontinuer-k of school-j of
PSU-i;
= P(PSU-O-P(School-j1PSU-i)(0.5)-Di
.P(Dicontinuer-k1School-j), where.4
(PSU -i) = probability of selecting PSU-i for the
Year 11 in-school primary sample;(
P(Schbol-jIPSU-i) = probability of selecting school-j for the
Year 11 in-school assessment, given theselection of PSU-i;
0.5 = probability of selecting school -j for the
Supplementicy Fr me sample, given itsselection -for th Year 11 in-school
sample;
D. = probability that the alphabet sector ,-
containing discontinuer-iile-ename waslisted by school-j; for a few Supple-mentary Frame sample schools withanticipated large nuMbers of discon-tinuers, listing was done for onlyhalf the alphabet, based on discon-tinuers' last names;
1.0 if schoal-j listed entire alphabet;
0.5 if school-j listed a random half ofthe alphabet;
P(Discontinuer-k(School-j) = probability of selecting discentinuer-kfrom the lists provided by school-j of .
PSU-i, given the selection of school-jfor the Supplementary Frame sample;
I
=' whereNii
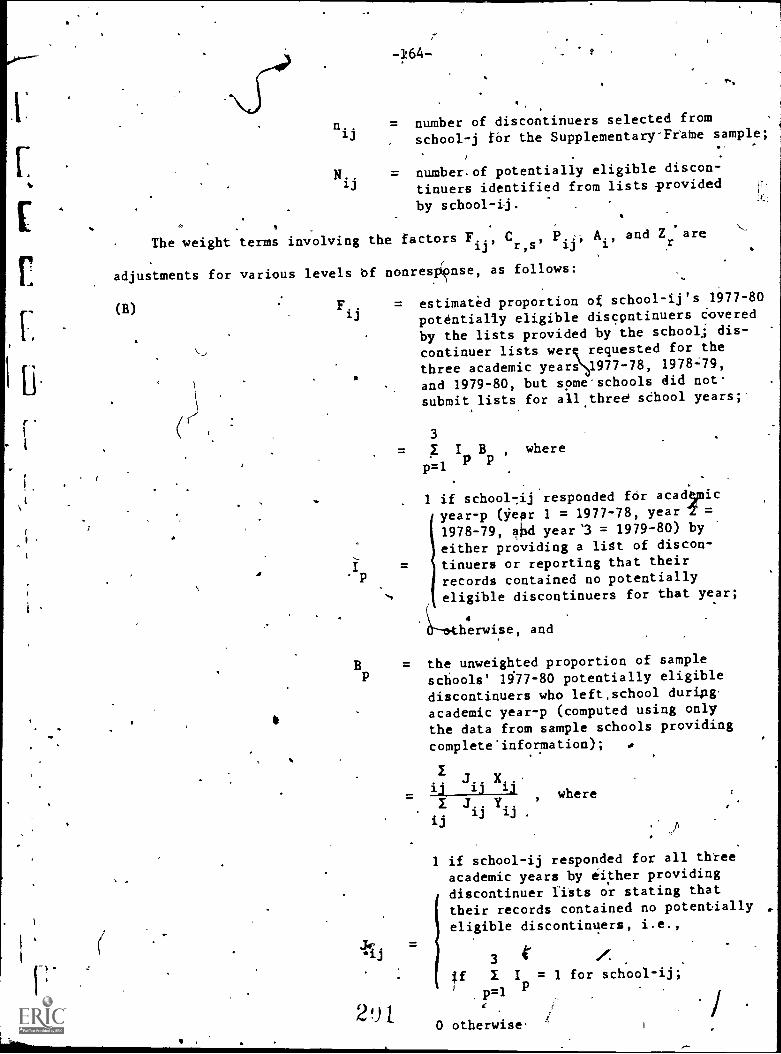
- 1!64-
= number of discontinuers selected from
school-j for the Supplementary'Fiaine sample;
= number.of potentially eligible discon-
tinuers identified from lists provided
by school-ij.
The weight terms involving the factors F.., C , P.:, A., and Zrare
1j r,s ij 1
adjustments for various levels bf nonresi4nse, as follows:
(B) F13.. = estimated proportion of school-ij's 1977-80
potentially eligible discontinuers covered
by the lists provided by the school.; dis-
continuer lists wer requested for the
three academic years 1977-78, 1978=79,
and 1979-80, but some-schools did not
submit lists for all three' school years;.
3
= I IP
BP
, where
p=1
1 if school-jj responded for acad% mic
year-p (year 1 = 1977-78, year '2' =
1978-79, liati year '3 = 1979-80) byeither providing a list of discon-
= tinuers or reporting that their
records contained no potentiallyeligible discontinuers for that year;
4
herwise, and
Bp = the unweighted proportion of sample
schools' 1977 -80 potentially eligiblediscontinuers who left,school during'
academic year-p (computed using only
the data from sample schools providing
complete'information);
. J.12 13
. X..,where
I J . YJ.ij
ij
''Ii) =
If I I = 1 for scho ol-ij;
.1:1=1 P
0 otherwise'291.
1 if school-ij responded for all three
academic years by either providingdiscontinuer lists or stating that
their records contained no potentially ,
eligible discontinuers, i.e.,
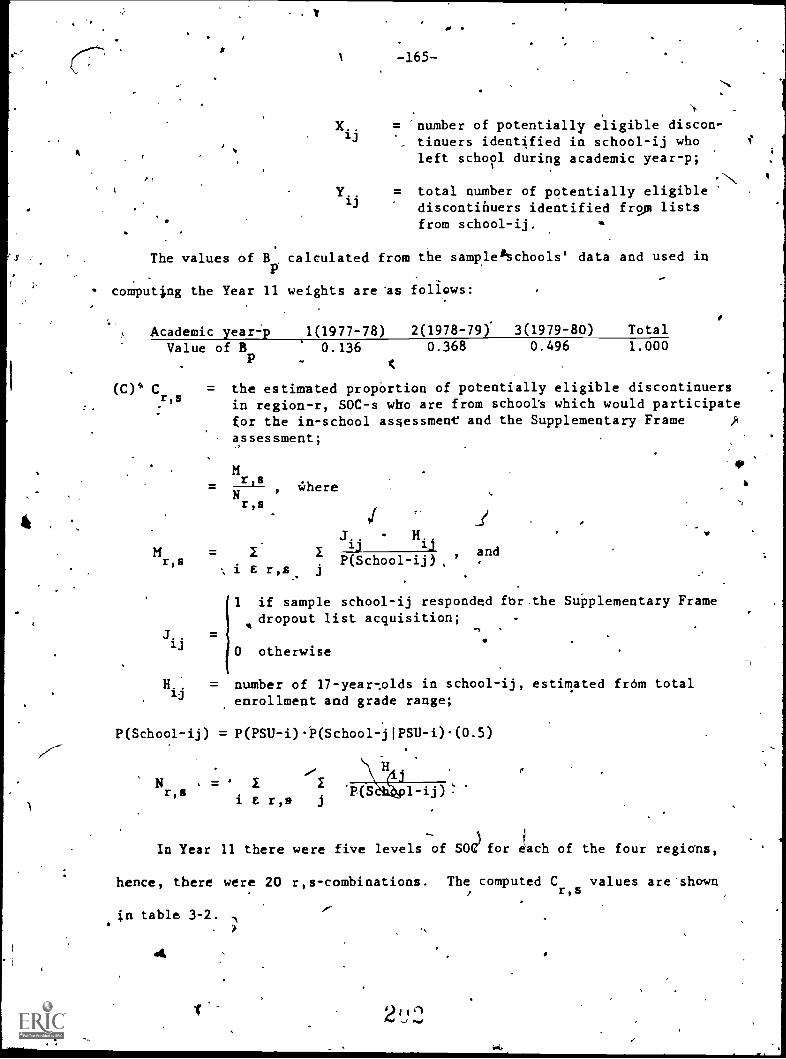
#
4
. V
1
X..13
Y13..
f
-165-
= "number of potentially eligible discon-tinuers identified in school-ij who i'
left school during academic year-p;
= total number of potentially eligiblediscontifiuers identified flop listsfrom school-ij. *
The values of BIs
calculated from the sample schools' data and used in
computing the Year 11 weights are as follows:
Academic year-p 1(1977-78) 2(1978-79). 3(1979-80) Total
Value of B 0.136 0.368 0.496 1.000P .
= the estimated propOrtion of potentially eligible discontinuersin region-r, SOC-s who are from school's which would participatefor the in-school assessment and the Supplementary Frame )0
assessment;,
Mr,s
N .
r,s
Where
i. I
J. H.
M = 1 I13 ij
and
i E r,sr,s P(School-ij)
j
,
1 if sample school-ij responded fbr.the Supplementary Framedropout list acquisition;J=
ij0 otherwise
Hij = number of 17-year-.olds in school-ij, estimated from totalenrollment and grade range;
P(School-ij) = P(PSU-OP(School-jIPSU-i)(0.5)
N . =r,s P
i & r,s j
In Year 11 there were five levels of SOC) for each of the four regions,
hence, there were 20 r,s-combinations. The computed C values are shown/ r,s
in table 3-2..
. )
,-
4
4

I
1,66-
Table 3-2.Values, of Cr
sschool'nonresponse.adjustment
by region and SOC
.1
,
-Region (r1
2
SOC (s)
3 -4 5
'
heast (1) 1.0000 ' : .6134i6 16 1.0000 f.000ci
Southe (2)..7649 .530 . , 1,0000 , 1.0000
1.0000
,,,
Central ,(3) 1.0000 -''''.9808.9921
.960 -_ .8765
.8196 - 1.0000 , w3 ..6644 1.0000
-sk e
West (4) v. t
(D) tj= propp-tion ofsample discontinuers
from school-ij forwhom
eligibility status was dined;
Iijk
1k E.:
i Iijk
=where'
U.&
ij
1 if eli=gibilitystatus was determined for discontinuer-ijk;
otherwise
nij = .numb 'r of potentially eligible discontinuersselected from
school-ij;
(E) A. = .estimatedproportion of potentially eligible discontinuers
in
PSU-t whioare in schools for which eligibilitystatus could be
determined for some discontin er;
Qi=
R.'where
Kijk
r1 Q = I .
and
i j,k t iP(Discontinuevzijk)-F. tj
-`Cr,s
6
.
:".. 1 if P. > 0, i.e.,, if eligibility status was determined
.\
.
for some discontinuer from school-ij;
K.tik 0 otherwise
P(Discontinuer-ijk),F. end C are as previously
defined, and
r,s
*41161
R = ) 1j,k t i
P(Discontinuegrijk).F ij.0r,s

(F) Zr = estimated proportion of eligible discantinUers in regipn-r
who would complete ate or more NAEP packages;
Po Xr
=Yr
where
- V: E.ijk ijk
Xr' 11 P(Discontinuer-ilk):F..-C P..A.i & r j,k j r,s ij
and
1 if discontinuer-ijk was determined to be eligible;,Vijk0"lotherwise
4 1 if discontinuer-ijk was determined to beeligible antcompleted one or more NAEP packages;,
Eijk =
0 otherwise
P(Discontinuer-ijk), F.j
, C , P.. and A. are as previously defined; andr,a
Vijk
Yr
=
i E r kP(Discontinuer-ijk)-F..0
j, r,s 11j
(G) P(a) = probability that respondent dis'continuer-ijk woilld complete
package-a (a'= given that he complered C packages(C = 1, 2, or 3); these probabilities are shown in the tablebelow;
t
PaCkag2 3
P(a)IC
C
,1 - 5 1/5 1/5 1/5
44-11, '13, 14 3/110 3)110 12/55
12 7/55 12/5 12/55
A school weight, U. was also computed for each discontinuer respond-
ent as follows:
1
s
1 1 1 1 1 1
bijk=
P(Discontinger-ijk)- F. -C P. A. Zwhere
lj r,s 1J 1 r
tehip of the weight exprelsion are as previously defined. The school
2,

-r4
C
-168-
weights are those appropriate for weighting datp 'collected uniformly from
all respondents, such as Backgeouild Questionnaire 'Etta.
3.7.3 Weights for Early Gradu /tes
Package weights we computed for the 95 out-of-school 17-year-olds
( assessed from the early graduate list sample as follows:
Wijk(a)
= weight applicable to package-a responses given by respondentearly gradnate-k of school-j of PSU-i;
.
1 1 1 1 ' 1_
.P(Graduate-ijk) C Pj A , P(a)i4
.. (A) (B) '' (t) (D), (E) (F)
The terms of the weight expression are generally analagous to those
used for computing discontinuer weights, but computational procedures vary
for some,of the terms. Definitions of the weight expression terms follow:
P(Graduate-jjk) overall sample inclusion probability forearly graduate-k of school-j of PSU-i;
P(PSU-0P(School-j1PSU-i).(0.D. C.*J
P(Graduate-k1School-j); where
P(PSU-i) probability of selecting PSU-i for'theYear 11 in-school primary sample;,
P (School7jIPSU-i) = probability of selecting school-j for theYear 11 in-school assessment, given theselection of PSU-i;
0.5 = probability of selecting school-j for theSupplementary Frame sample-1, given itsselection for the Year' 11 in-school sample;
D. = probability that school -j was asked toprovide lists containing graduate-k's name;small/schools were asked to list'all earlygraduates; large schools were asked toprovide lists's:5f early graduates whose lastnames were contained within two randomlyselected alphabet sectors from the followingfour:-4A-D, £-X, L-R, S-2;
1.0 if school-j listed entire alphabet;
0.5 if school7j listed a random half of.'2t-) the alphabet;"
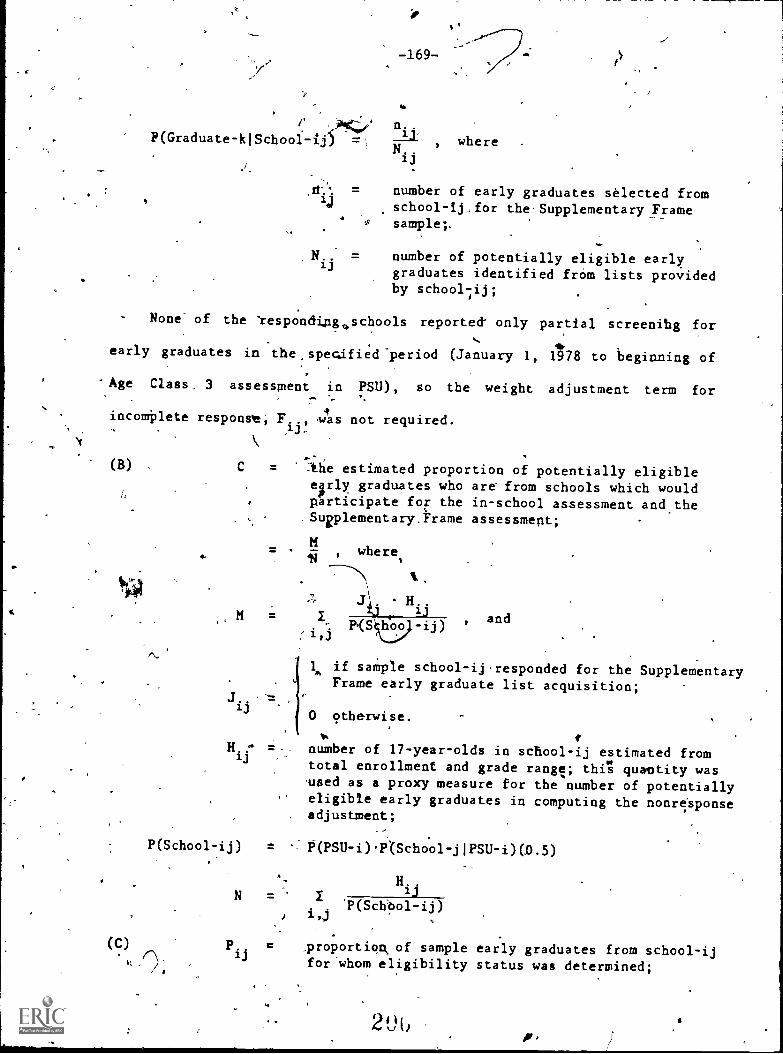
F(Graduate-kiSchool-%j
it
-169-
=
where
number of early graduates selected fromschool-ij_,for the-Supplementary Framesample;.
1number of potentially eligible earlygraduates identified from lists providedby school-iij;
None- of the 'respondipg,schools reporte only partial screening for
early graduates in the.spen.ifiedaperiod (January 1, 1978 to beginning of
'Age Class, 3 assessment in PSU), so the weight adjustment term for
incomplete responsle, F. , vas not required.
(B)
4
ti
C = -Titie estimated proportion of potentially eligibleearly graduates who are from schools which wouldparticipate for the in-school-assessment and the.Sugplementary4rame assessment;
H
Hij
where
7,
.q H.j
P ' (
and
I, if sample school-ijresponded for the SupplementaryFrame early graduate list acquisition;
0 otherwise.
number of 17 -year -olds in school-ij estimated fromtotal enrollment and grade range; thil quantity wasused as a proxy measure for the number of potentiallyeligible early graduates in computing the nonre'sponse
. adjustment;
P(School -ij) = P(PSU-i)P(School-jIPSU-i)(0.5)
NH. ,
ij
'P(Schbol-ij)i,j
P. _proportion, of sample early graduates from school-ijfor'whom eligibility status was determined;
ir

(D)
(E)
Iijk
=lj
.
L-170-
k E ijk
n.. a '
.13where
if eligibility statug'was determined for.earlygraduate-ijk;
0 otherwipe
number of potentially eligible early graduatei..selected from school-ij;
A = estimated proportibn of early graduates who arein schools for which eligibility statuscould bedetermined for some early graduate;
2 where
jKi
. k
. P(Graduate-ijk)C 'IJ L.and
I if P. > 0 for school-ij, i.e., if eligibility.ij
tistatus was determined for some sample early
Ki graduate from school-ij;
0 otherwise
0(Graauate-ijk) and C are as previously defined, and
R- P(Graduate-ijk)C
i,j,k.
estimated proportion of eligible early graduatesin region-r who would complete one or more NAEP
packages;
1
r
Yr
where.
V.. Eijk ijk
Xre
1 OTOraduate-ijk)CP A1 r j;k
Vij..k
Eijk
and
1 if graduate-ijk was determiqed to be eligible;
0 otherwise.
if graduate-ijk was determined to be eligibleand completed one or more NAEP packages;
0 hherwise.
20"4
5
fi
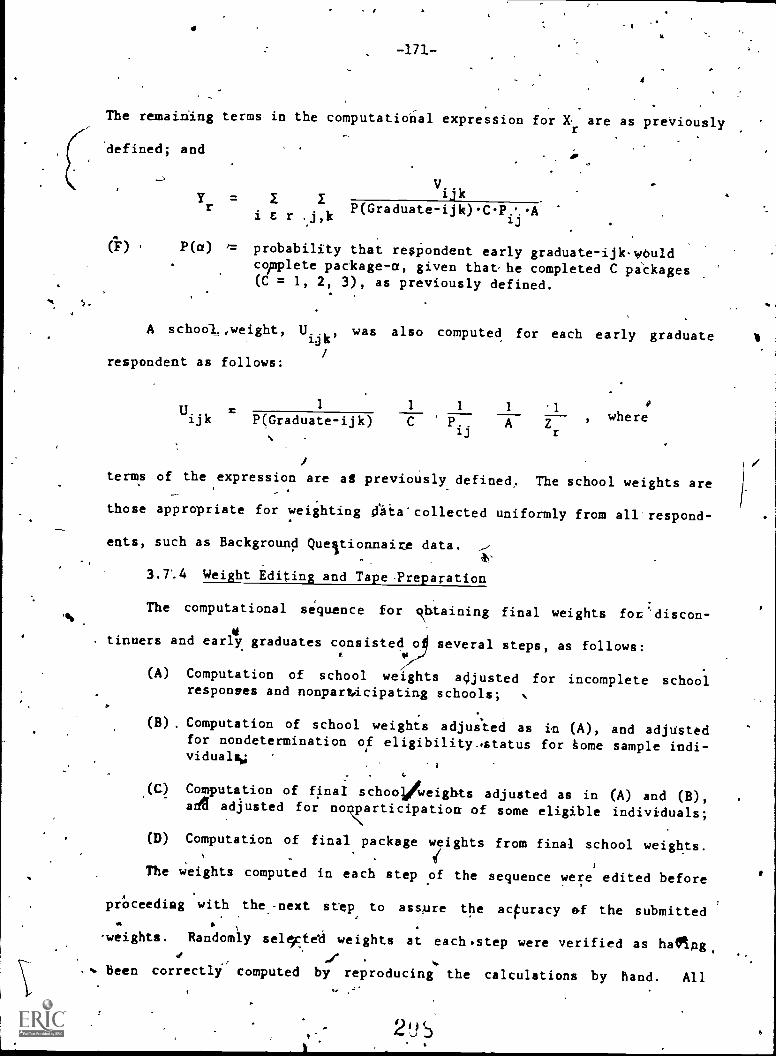
%
-171-
4
The remaining terms in the computational expression for X,r, are as preViously
-
defined; and
VijkY
ri e r .j,
1k P(Graduate-ijk)-C.P.'
ij
P(a) /-= probability that respondent early graduate-ijkwOuldcopplete package-a, given that he completed C paCkages(C = 1, 2, 3), as previously defined.
A school.,weight, Uijk' was also computed for each early graduate
respondent as follows:
1 1 1 1 1Uijk =P(Graduate-ijk) C P.. A Z
r
where
terms of the expression are aS previously defined. The school weights are
those appropriate for weighting cfnia"collected uniformly from all'respond-.
eats, such as Background Queltionnaire data.
3.7*.4 Weight Editing and Tape-Preparation
The computational sequence for ckhtaining final weights for'discon-
tinuers and early graduates consisted o several steps, as follows:
(A) Computation of school weights adjusted for incomplete schoolresponses and nonparticipating schools;
(B) Computation of school weights adjusted as in (A), and adjUstedfor nondetermination oaf eligibility..status for tome sample indi-vidualso;
(C.) Computation of final school/Weights adjusted as in (A) and (B),adg adjusted for nopparticipation of some eligible individuals;
(D) Computation of final package weights from final school weights.j
The weights computed in each step of the sequence were edited before
proceeding with the -next step to assure the acfuracy of the submitted
-weights. Randomly sel5c,ted weights at each.step were verified as hal.ng..r
. been correctly computed by reproducing the calculations by hand. All
2 w

r.
-172-
atypically large fights were similarly verified.
tabulations and summary statistics were obtained
package weights.. All discontinuer package weights
Listings, frequency
for, final school.mnd
exceeding 10,000were'
identified and reasons for their sual sizes were documented; there were
no atypically large early g,K uate weights. Large weights'were generally
due to lower than usual hin-school selection rates and/4 respondents ,
who completed only otiV-or wo of the asseksment packages.
The Supplementary Frame weight tape was prepare in accordance with
the format established by RTI, National Assessment and Westinghouse Data--
Score Systems (WDSS) for reporting all Year 11 weights. A backup cdpy of
the tape was prepared for retention at RTI, and the weight tape was sent to
-WDSS on October 10, 1980. Concurrently, appropriate documentation
summary tabulations were delivered to National Assessment.
3.7.5 Level- of the EstimatesI
'Population totals for out-of-school 17-year-old
and
discontinuers and
early graduates were estimathd by summing thh Year 11,Supplementary, Frame
assessment adjusted sc weights for respondents, and'these estimates are
shown in table 3-3 wits res is from preceding yearn. AEPresented in
the:table are Census-based estimates of the survey populationi
proportions of the populations estimated by the survey data.
and the
The Year 11 survey estimate of the discoptinuer frame out-of-school
17-year-old po011etion, 305,075, is 47.2 percent above the .estimate ob-,
tained in the -last Supplementary Frame assessment conducted in 1976
(Year,07). This increase results directlyfrom a significant rise in the
average number of discontin e5s reported by participating schools, from4 .
19.2 in Year Q7 t . in Year 11. Since there is do evidence that the
discontinuer populatioh has shown an actual increase over this period, the

.
-173-
7
Table 3-3. Supplementary Frame survey estimates of population andensus-based population estimates, by.assessment year
jssessment Year
o. 05 06 07 11
(1974) (1975) (1976) (1980)
Survey estimates:
17-year -old
Discontinuers 233,532 223,908 197,588 305,075
17-Year-oldEarly Graduates 16,540 15,285 16,489 10,024
Total out -of- school
17-year-olds 250,072 239,193 214,077 315,100
Census estimates:/
1/'17- year -olds (000's)- 4,241
4
4,175 4,280 4,100
Eligible out-of-school
17-year-olds-2
3863'79 380,760 390,336 373,920
Proportion of eligible.
.
, population estimated bySupplementary F ame data' 0.647 0.628 0.548 0.843
1/ From Current Population Reports, Population Characteristics, SeriesP-20.
2/Computed as (Census 17 yr.-olds) x 0:095 x 0.96, where 0.095 is the
_estimated proportion of'17-year-olds not. enrolled in grades K-12 in theperiod 1974 -1980, and 0.96 is the estimated proportion of 17-year-oldseligible for National Asseisment.
J
4
0
210
I.
1,3_ *1
-174-
'larger average :.-_=a3er of names listed could be due to better record keeping
,by the schools a =d more thorough list preparation for Supplementary Fame.
Thel Year 11 survey estimate, of the early graduate frame out-of-school
17-year-old +opu14tion was 10,024, 39.2 percent below the rear 07 estimate.
However, the unweighted average number of early gradUates reported by
participating schools showed very little .chang6 between Year 07 and Year
11. Since early graduate survey estimates are based on very small samples,
the observed year to year differences are likely within the range of sampl-
ing error.4
The estimated total out-of-school 17-year-old population fromihe Year
11 survey, 315,100, is 84 percent of the Census based 'estimate and repre-
sents the highest estimated level of coverage for any of the Supplementary
Frame surveys.
3.8 DOC, TOC, and STOC Classification
No separate determination of DOC, TOC, and STOC was made for Supple-',
mentary Frame respondents. Rather, the opt-of-school l7-year -olds selected
from a particular school were given the same DOC-TOC-STOC cptegorization as
they respondents for the Age Class 3 in-school assessment in tat school.
The DOC- TOC -STOC determination for Year 11 in-school. respondents is dis-
cussed in Chapter 2 of this report
3.9 Response Experience
Response experience-data for the Year 11 Supplementary Frame samVle
schools Irispresented in table 3-44 while response experience for sample
Aiscontinuers and early graduates appear in/table 3-5.
A total of 209 NAEP Age Class 3 schools were asked to participate for
the Supplementary Frame assessment. As shown in table 3-4, two of .the
schools'asked, or 1.0 percent refused to provide discontinuer lists or
211
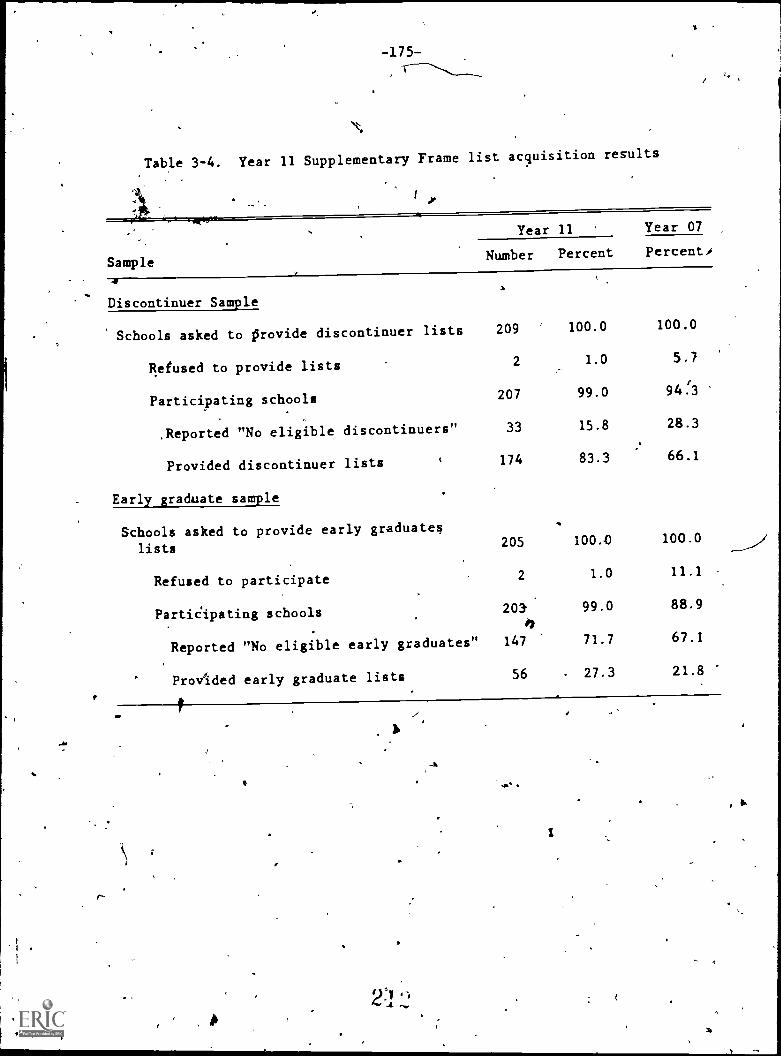
I
-175-(
Table 3-4. Year 11 Supplementary Frame list acquisition results
Sample
Year 11 Year 07
Number Percent Percent'
4
Discontinuer Sample
Schools asked to provide discontinuer lists
Refused to provide lists
Participating schools
209
2
207
100.0
1.0
99.0
100.0
5.7
94f3
,Reported "No eligible discontinuers" 33 15.8 28.3
Provided discontinuer lists( 174 83.3 66.1
Early graduate sample
Schools asked to provide early graduates
lists205 100.0 100.0
Refused to participate 2 1.0 11.1
PartiCipating schools 203 99.0 88.9
Reported "No eligible early graduates" 147 71.7 67.1
Provided early graduate lists 56 27.3 21.8
211 -ft
I
_______/
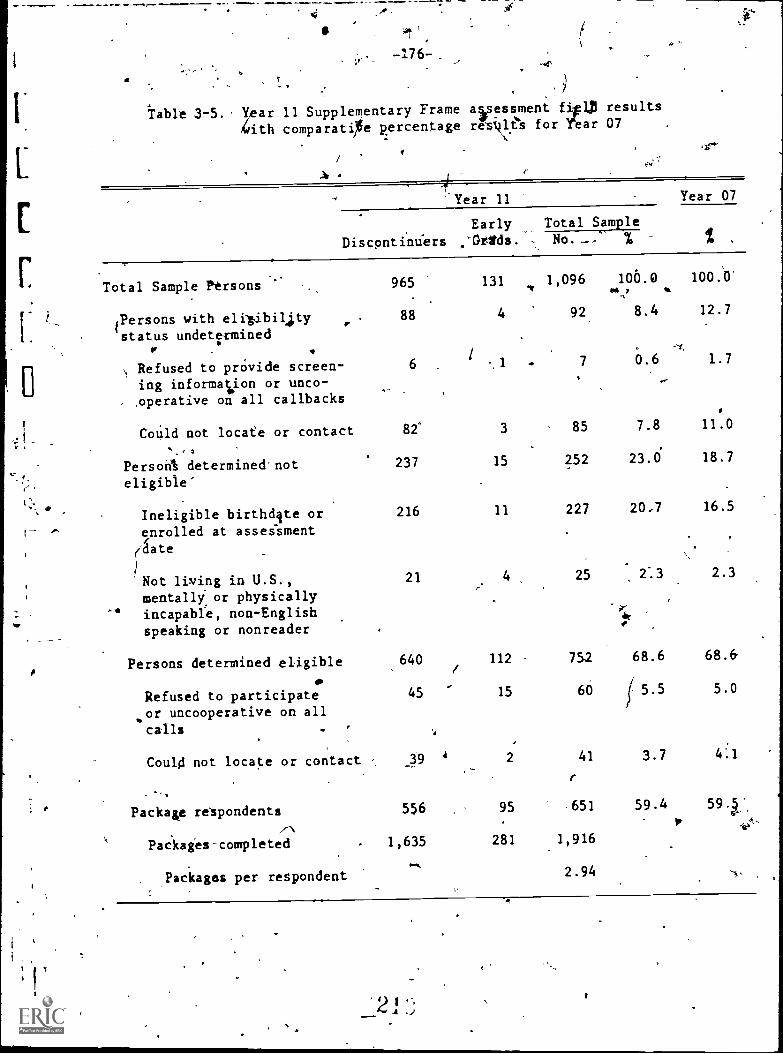
de
Table 3-5. year 11 Supplementary Frame assessment fir]. results
4ith comparatOe percentage revkli,s for Year 07
A# 4
#'
Year 11 Year 07
Early Total Sample
Discontinders .°Gittds. % %
Total Sample Ptrsons
Persons with eligibility .
status undeterminede . .
Refused to prOvide screen-ing information or unto-,operative on all callbacks
CoUld not locate or contact.
,
Person% determinednoteligible'
Ineligible birthdjte orenrolled at assessment
(date
Not living in U.S.,mentally or physicallyincapable, non-Englishspeaking or nonreader
Persons determined eligible
to
Refused to participateor uncooperative on all
calls
Could not locate or contact
Package respondents
Packages-completed
Packages per respondent
965 131 1,096
88 4 92.
6 7
82' 3 85
237 15 252
216 11 227
21 25
640 112 752
45 15 60
4 2 41
556 95 -651
1,635 281 1,916
2.94
106.0 100.0'4g y Ilk
8.4 12.7
0.6 1.7
ye
7.8 11.0
23.0 18.7
207 16.5
2.3 2.3
68.6 68.6
15.5 5.0
3.7
59.4
2 ,)

repdrted that the 1pecessary records were not available. There were also 20
schools selected in the initial Supplementary Frame subsample which were
not asked toparticipate for 'list acquisition due to their refusal for the
in-school-assessment (table 3-1). The overall school nonparticipation rate
for Yean11, therefore was
s(20 + 209-L 22x 100) = f
229x 100) = 9.6%
Of the 207 schools which agreed to participate, 33, or-15.9 percent, report-
ed that their .records disclosed no age eligible discontinuers for the
period' specified, i.e., submitted empty lists, while the remaining 174
schools, or 84.1 pe;cent of those participating, provided nonempty lists of
discontinuers for it least one school year. A total of 7,081 potentially
eligible discontinuers was identified from the lists submitted.
There were 205 Supplementary Frame sample schools asked to participate
which had twelfth grades, and these schools were asked to provide both
discontinuer and ear graduate lists. As shown in table 3-4, two,schools,
or 1.0 percent, refused to search their records for the early graduates or
reported that the necessary records were not available% When refusals for
in-school assessment are considered, the overall school nonparticipation
rate for the early gKaduate phase of the study was:
(205 X 100), = (223 X 100) '= 9.8% :
Of the 203 41chools which 'agreed to participate, 147, or 72.4 percent,
reported that their records disclosed none of the scarce age-eligible.early
graduates within the specified alphabet sectors. Nonempty lists were
received from 56 study schools, 'and these schools listed a total of '172
potentially eligible early graduates.

f.
L
-178-
Talge 3-5 presents the final results from the field location, scrawl-
'
ing, and package administration. The sample. was comprised of 965 potenti-
ally eligible diseiontinuers and 131 early graduates, or 1,096 sample
viduals/in total. For 92, or 8.4 percent, of those in the sample, inter-
viewers were unable to obtaideligibility screening information. Failure
to locate or contact.the sample individual or a close fami y member account-
s--,
...___
ed for 85, or 9 .4 percent, of these cases. A total 0 252, individualt,, ..._,
4'
23.0 percent of those in t sample, were determined to be ineligible for
assessment. In 227, or 90.1 percent of these cases, ineligibility was due
to an out-of-:range birthdate or to enrollment in school during the time of
Year 11 Age MIT; 3 in-school assessment. The 252 individuals categorizedVW.
as ineligible represent 25.1 percent of the 1,004 sample persons for whom
eligibility screening was completed. A total of 752 individuals were
detetmined to be eligible for the assessment, and 651,.or 86,6 percent, of4
these participated. Nonparticipation was due to refusals in 60 cases,
while failure to locate the individual accounted for the balance of theq
nonparticipating eligible individuals. The 651 participants represent 59.46
percent of all sample individuals, this result is almost identical to the
Year 07 overall rate of participation.
The desired package yield was 125 responses for each of the 14 packages,
or approximately L1,750 completed packages, in total. Table 3-6 presents
the number of responses obtained in the Supplementary Frame assessment for
the 14 Age Class 3 packages, by sampling frame. Actual survey response was
1,916 completed packages, or an average of'136.9 responses per instrument--
a yield 9.5 percent above the design goal. The package overage is primarily
attributable to the higher-than-anticipated level of participation achieved
in the study--59.4 percent achieved versus 55.0 percent estimated in pre-
survey planning.
2 4

f
-179-,
Table 3-6. Year 11 Supplementary Frame assessment package sampleysize by student sampling frame
Package
i4
Discontinuer. Early graduate Total
frame responses frame' responses responses
1
2
3
4
5
6
7
8
9
10
11
12
13
14
Total
114
111
104
110
120
120
125
112
121
116
119
123
120
120
1,635
18
19
25
29
21
22
2
21
' 20
21
24
15
15
19
-281
132
130.
129
139
141
142
137
133
141
137
143
138A
135
139
1,91.6
2:6
r
1

-180-
1,f, ,4_,
0 IP 0
* .
3.10 Special Pioblems and Recommendations
There were no specia4L problems encountered during conduct oe the
3101'
r
a
Suppleaientary Framekamplingiandweighting activities.
Based on Year 11 experience, the followingrecommendations are made
for future Supplementary Frame sampling:
(A) The iterative procedure describ d in section 3.4 for adjusting the
student sample allocations. to PSUs through'ut listcollection so as to
achieve the desired total sample size should be employed.
(B) Students who leave school during March or April of-the current assess-
/meat year shoul4 be deleted ,from the sampling frame as ineligible
O(enrolled during March or April)
It
Such students wereincluded in the
.ir
frame for Year 11,since it was thoUght that sc ools might tend to
retain d scontinuers on rolls some time past t eir actual date of
:
leaving schoollOut Year 11 field results did not show this to be the
4.
case. Sample discontinderswith March br April left school were
almost always classified as ineligible during screening by virtue of a
"yes': answer to the,qiestion, "Where you enrolled in....school anytime
durin4March or April, 1980":
4-(C) *most 25 pertent of tpe schools'from whom lists were received report-
.a' ed 50 or more di ontinuers. If SupplementaryFramt sample size
requirements are not substantiallyincreases in future assessments,
provision should be made to allow subsampling by alphabet sectors for
discontinuer listcompilati, as is done for early graduates.
ef

Year 11 Principal's Questionnaire _
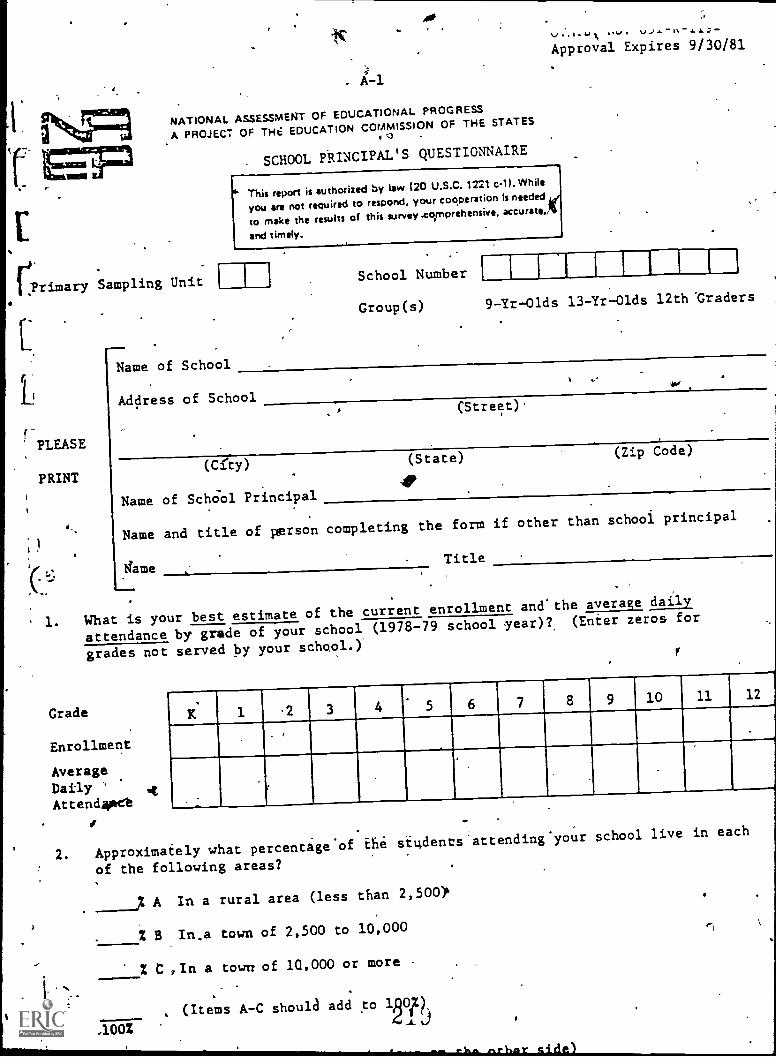
Approval Expires 9/30/81
is NATIONAL ASSESSMENT OF EDUCATIONAL PROGRESS
A PROJECT OF TH6 EDUCATION COMMISSION OF THE STATESI C3
SCHOOL PRINCIPAL'S QUESTIONNAIRE
This report is authorized by law (20 U.S.C. 1221 c1). While
you are not required to respond, your cooperation Is needed Ad.
to make the results of this survey.corprehensive, accurate,A
and timely.
Primary Sampling UnitSchool Number
Group(s) 9 -Yr -Olds 13 -Yr -Olds 12th "Graders
Name of School
Address of School
r-
PLEASE
(Street).
(City)
Name of School Principal
(State)
AP
(Zip Code)
Name and title of person completing the form if other than school principal
sameTitle
1. What is your best estimate of the current enrollment and.the average daily_
attendance by grade of your school (1978-79 school year)?. (Enter zeros for
grades not served by your school.).
Grade 1 3 4 5 6 7 8 9 10 11
Enrollment
AverageDailyAttend4oct
I2. Approximately what percentage.of tie siLidents attending your
school live in each
of the following areas?
X A In a rural area (less than 2,500
B In.a town of 2,500 to 10,000
--- X C In a town of 10,000 or more--
(Items A-C should add to 1Q0i%)
.100X4A.

A-2
3.- Approximately what percentage, of the students attending your school are children
of
A Professional or managerial personnel
% B Sales, clerical, technical or skilled workers
% C Factory or, other blUe collar workers
-% D Farm workers
Z E Persons. not regultarly116ployed
% F Persons on welfare
100%
(Items A-F should add to 1003).
4. Approximately what pentage of the sIdents attending your school are
% A Ameritan:Indian or Alaskan Native
% B Asian OT Pacific Islander
C Hispanic, regardless of race (Mexican, Puerto Rican, Cuban, Central
or South Americad or other Spanish culture or origin)
% .D Black and npt Hispanic
,4
% E White and not Hispanic
(Items A-E should add to 100%)
100%
5. Does your school qualify for ESEA Title- assistance?
Yes - If Yes,-approximately what number Of students qualify for
and what numberrof students aie receiving ESEA Title I assistance?
' No
Approximpte number of students qualifying for ESEA
Tit1e I assistance
Approximate number of studen receiving ESEA Title I
assistance
THANK YOU FOR YOUR COOPERATION
N

I
li
I
0
.. ,
IP.
I
APPENDIX B
Year 11 School Worksheet
.._v
/..
I.
...
a
(
,
4 , k

B-1,SCHOOII WORKSHEET
(Complete for each school- for which you receive a,PaciCage Assignment Forp)PSU Number School Number
Complete Parts A - D only after crossing out names of students listed on the SLF who are,ineligible for any reason.
A. How many students were identified by the school as:
1. Non-English speaking? 2. EMR?
B. How many names were crossed out for students:
'1. With out -of-range birthdates? 2. No longer enrolled?
3. Who were ineligible for any other reason(s)? (Specify reason(s) in Part F.)40C. What was the source used to complete SLF?
D. Sampling
1. -6Ubsamplin0 not used:
a. Total count of eligible students list on SLF
2. Subsampling used:
a. Total count of eligible students listed on SLF a.b. Enter sampling interval from Item 2 of Package Assignment Form b.c.- Mu1tiply Item a. by Item b.
c.E. Complete after packages have beep administered in the school.
Pkg. No. Pkg. 'No. Pkg. No. Pkg. No.No. Completed 4o. Completed No. Completed No. Completed
3. /Functionally disabled?
F. Indicate any problems related to sampling' or obtaining quorums. Explain in full whenan assigned package administration is not given?' Indicate self-identified nonreadersby package and ID numbert. (If additional space is needed, continue on a separatesheet. and attach to RTI copies.)
G. Coordinator
District Supervisor: Date Completed:
f----
Disposition: White copy to MRC;-yellow and pink copies to RTI immediately up.... complethon of all work in the PSU; goldenrod copy retained by DS:-
9.),-,. A.A....


,
Location
C-1
\
.National Assessm;nt of Educational-Progress-YrIr 11 Wcigtt TapeFor-max
' (Prepared 12/27/70' .
4
Name Description1
1 AGE Age Gioup Code: 1 9-year-olds2 13-year-olds:.
3 17-year-olde,3 Supplementary Frgme
*R-3 PACKAGE Package Number: 01,02..10,110.2,13,14,15
4-6 PSUID PSU Numb*r: (3-digit) Obtained as, leading zero,ad4 2-digit PSUnumber.
7-8 SCHOOL School Number:* (2-digit) Age Group. 1*01-9.Age Group' 2*31-59
c Age Group-,=61-89
Wick Digit: (1-digit) Check digit iS a fu.ction o{ 2-digit PSUand 2-digit school nunlber. ''''. i
it/ ,
19 INOUT Supplementary Frame tape, type indicitor: 0 91s,1316,17's in schoo
) .A.
. ..
pplementary Frame
9 PSUSCHC
p
ti
11-14 Assessee Number: 0000 9113,1318,17's in scfiol
STUDID>0000 Suppler:sesta-a-Frame-
15 Zero (0).
16 STOC 1/1.Extreme rural..
0
17-19 COUNTY
2 Low metro3 High metro4 Main big city5 Urban fringe6 Medium city7 Small place
County (197Q FIPS code): >000
1/TOC may be obtained from-STOC as follows:
TOC: 1 Extreme rural2 Dow metro3 High metro
. 4 4 Othaks"
2`).1
40'
STOC: 1 Extreme rural2 Low metro3 High metro4 Main big city5 Urban fringe .6 Medium city7 Small place

-
4
A
Location Name Descri t
6*
spa r
211044 ZIPCODE ZIP Code: ,>00000
.25-26' GRDLOW /
C -2
See Federal Information Processing Standards Publication-.(FIPS PUB 6-1) , Counties and County tquvalents of_the
States of the United States', U. S. epartment of'Commerce,National Bureau ofStandards June 5, 1970.
21-28
29-34
_
Lowest Grade in School:-2/
00,0 .41,12; 00 = kindergarten,01 = 1st grade, 02 = 2nd grade etch.
GRDHIGH Highest Grade in School:?' 00,01,...,11,12; 00 = kindergarten,
01 = 1st grade, 02 = 2nd grade, etc.
PSU
3517 PRINO1A
38 -40 FRIN018
41143 ,fPRINO1C
44 46y :TRINO1D
47-49 RINO1E
pRINO1F
53-55 :PRINO1G.
PSU numbers (6-digit): Six-digit PSU numberis included because (1) it is the only place where samplingsize of community (SOC) is reported; and (2) it will provi.desimilar PSU numbers when comparing data across years.
School Principal's Questionnaire Question 1: What is yourbest estimate of the average daily attendance by grade- of
your school (1978-79 school year)?
KindergartenI
1st grade
2nd grade
3rd grade
4th grade
Sth grtde
6th grade
V
-"A grade range will be supplied for every school. In most cases, the grade
6.
range is obtained from the principal's Questionnaire. In those rare instances -
wherethis information is not provided on the Principal's Questionnaire, the dataare imputed from education directories.
0 -....,
Special cases Location 25-26 Location. 27-28
A School havipg 6th grade only
_A school 01.0( split grade range
of 1-3 and.5-6
06
.
01
06
06
22'5
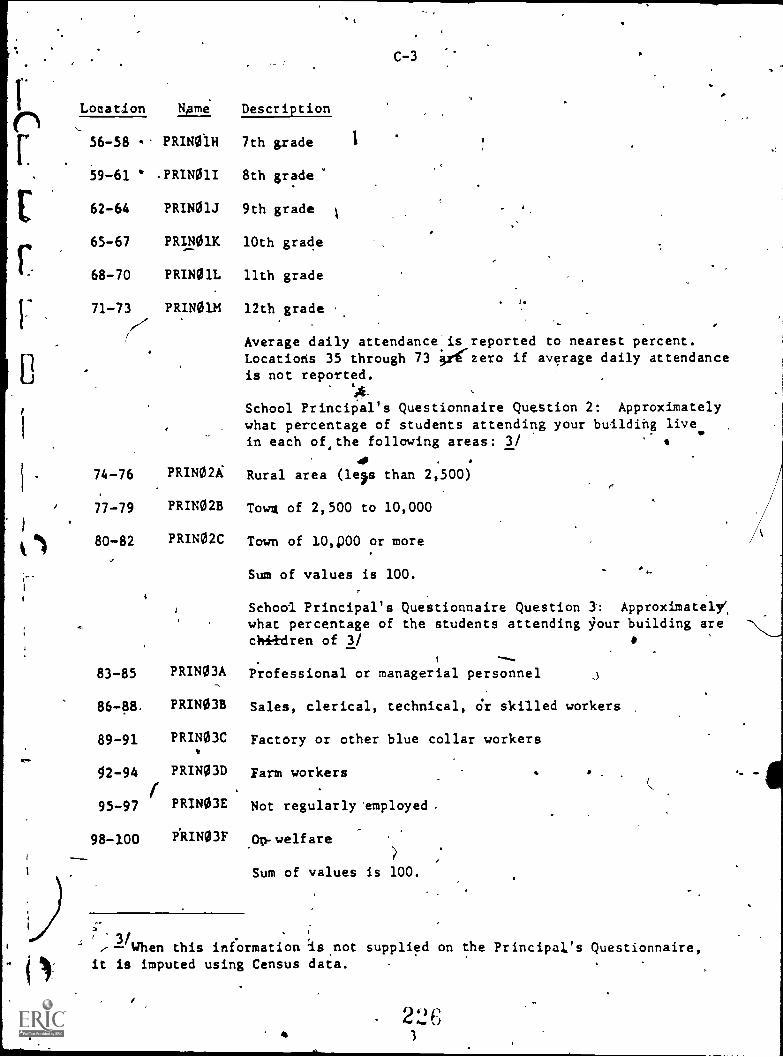
t
C-3
Location N4ame Description
56-58 - PRIN01H 7th grade 1
. ,
59-61 ,PRIN01I 8th grade
62-64 PRIN01J 9th grade
65-67 PRIN01K 10th grade
68-70 PRINOlL 11th grade
71-73 PRIN01M 12th grade
Average daily attendance is reported to nearest percent.Locatiohs 35 through 73 pzero if average daily attendanceis not reported.
School Principal's Questionnaire Question 2: Approximatelywhat percentage of students attending your building live.in each of,the following areas: 3/
74-76 PRIN02i Rural area (lets than 2,500)
77-79 PRIN02B Tow* of 2,500 to 10,000
80-82 PRINO2C Town of 10,p00 or more
Sum of values is 100.
83-85
86-88.
89-91
g2-94
95-97
98-100
I
PRINO3A
PRINO3B
PRINO3C
PRINO3D
PRINO3E
AINO3F
School Principal's Questionnaire Question Approximately',
what percentage of the students attending your building areciti+dren of 3/
Professional or managerial personnel
Sales, clerical, technical, or skilled workers
Factory or other blue collar workers
Farm workers
Not regularly employed,
op- welfare
Sum of values is 100.
c
3/When this information as not supplied on the Principal's Questionnaire,
it is imputed using Census data.
04

f
.
C-4
Location Name Description
School Principal's Questionnaire Question 4: Approximately
what percentage of the students attending your school are 3/
101-103 PRINO4A .American Indian or Alaskan Native.
104-106 PRINO4B. Asian or Pacific Islander
.101-109 PRINO4C Hispanic, regardless of race ( Mexican, Puerto Rican, Cuban,Central or South American or other Spanish cultUre or origin)
110 -7,11 PRIN44D, Black and not Hispanic
113-115 PRINO4E White and not Hispanic
Sum of values is 100.
Sdhool Principal's Questionnaire Question 5: Does yourschOol.qualify for ESEA Title I assistance?
116 PRINO5A 0, No respons
117-120 PRINO5B
121-124 PRINO5C
125 STANDBY
4 126-130 SPOPCNT
.../
131-139 STSWGT
i40-148WEIGHTT
149-150 ELIGCNT
1 Yes2 No
If yes, approximately what number-of students qualify for andwhat number of students are receiving ESEA Title I assistance?
Approximate number of students qualifying for ESEA Title I
assistance.
Approximate number of students receiving ESEA Title I assistan&e.
Type of package: 0 Regular1 Standby
Number of students in student sampling, frame'as reported onSchool Worksheet: 00000 Supplementary Frame
>00000 9's,13's, 17's in school
Reconciled, regular assessment student-level school weight to be uswhen data file'contains one record per student(F9.2); >000000000
Reconciled regular assessment package weight (F9.2):>000000000
A
Number of regular eligible respondents (i.e., respondents in
-/ .correct age domain, non-EMR, English speaking, etc.) or numberof eligible respondents to followup assessment.
00 Supplementary Frame>00 J11411 others
151 DOC DOC: 1 Big city2 Urban fringe3 Medium city
.4 Small place

4
Location Name.
C-5
Description
152 FRAME Frame: 0 9's,13's,17's in school2=b=Age Group, 3 school dropout list frame
a
3=h=Early graduate list frame
153-154' -STATE State code (1970 FIPS code): >00 (for Supplementary Framestudy, theiState,code was obtained from the school which--provided the original dropout list.) See attachment foidefinition of State codes.
Ao155-159 STOTCNT School total euollment: >00000 (For Supplementary Frame.
Study the total enrollment was obtained from the school whichprovided the original dropout list.)
160 SPUBPRV Public/Private school ,code: (For Supplementary Frame Study,the public/private school code was obtained from the schoolwhich provided the original dropout list.)
1 = Public a
2 = Private Catholic3 = Private Non-Catholic
161 SES ,Socioeconomic Status (SES) School code: (For SupplementaryFrame Study,-the SES code was obtained from the school whichprovided the original dropout list.)
1 = Low metropolitan for SOC 1,2,3 PSU; extreme rural 'forSOC 4,5 PSUs.
2 = Remainder of city for SOC 1,2,3 PSU; not applicable forSOC 4,5 PSUs.
3 = Remainder of PSU for allPSUs.
162-165 'ISVARES In,school variance estimation code for PSUiechool. (For Supple-mentary Frame study, the in- school, variance estimation code wasobtained from the school which provided the original dropout list.
abbe where
REGOBE
a = PSU-school regional code (1, 2, 3, 4, 9)bb = stratum within regionc = replicate /within stratum and region.--
PSUL-schools with same region and stratum within region code areto be paired for variance estimation purposes. In some cases,there may be three members in the group.
Office of Business Economics (OBE) regional code by school.(For Supplementary Frame, the OBE regional code and Censusregional codes were obtained from the school which providedthe original dropout list:)
1 = Nerth Atlantic2 = Southeast

Location Name
167
C-6
1-=ccr_nription
3 Great Lakes and Plains4 West and Southwest(Sew attachment for States in these regions.)
REGCE14 Gen's-sus regional code by school:
.4
1 == New England.2 1.= Middle Atlantic
3 == 'ast North Central. 4 = Jest North Central
5 ..., South Atlantic
6== East South Central7 = West South Central8 == Mountain9 == Pacific
(See attachment for States in these regions.)
168-169 INELCNT Numt,er of ineligible respondentstoregular assessment
respondents in incorrect age domain, EMR, non-Eng"......ish speaking, etc.) or number of ineligible respondentsto EEollowup assessment.
00 Supplementary Frame>00
170 -176 LEACODE Locl Education Agency (LEA) codes.--4/
A 7-digit codedeveloped by the National Center for Education Statistics-(NC-1-ZS) which uniquely identifies public school districtswir;.7.in each State. (For private schools, LEA code is zero).The first two digits of the LEA code identify the State andthe last S digits identify the district wjthin the state.For Supplementary Frame Study, the LEA code is providedfor the school which supplied the original dropout list.>00:0000
177 SEVENI
178-186 SCHWGT4,.nocr
Internal Labels:
DSN=RTI.WT.a.YYywhere a=age
0, if regular 17-Year-old respondentor 9 or 13-year-old respondent;1, if initial 17-year-old respondent;1, if 17-year-old fullowup respondent.
Reconciled regular assessment tchool-level school weig to beused when data file contains one record per school (F9.2 ): 4 x0000(
N-9s
T-13s
I-17s- In-school and nonrespondent followup0-17s Supplementary Frame.
yy = Assessment Year.
2`)9
±JForFor a list of the codes, see Universes of 0 eratin and Non-o eratin

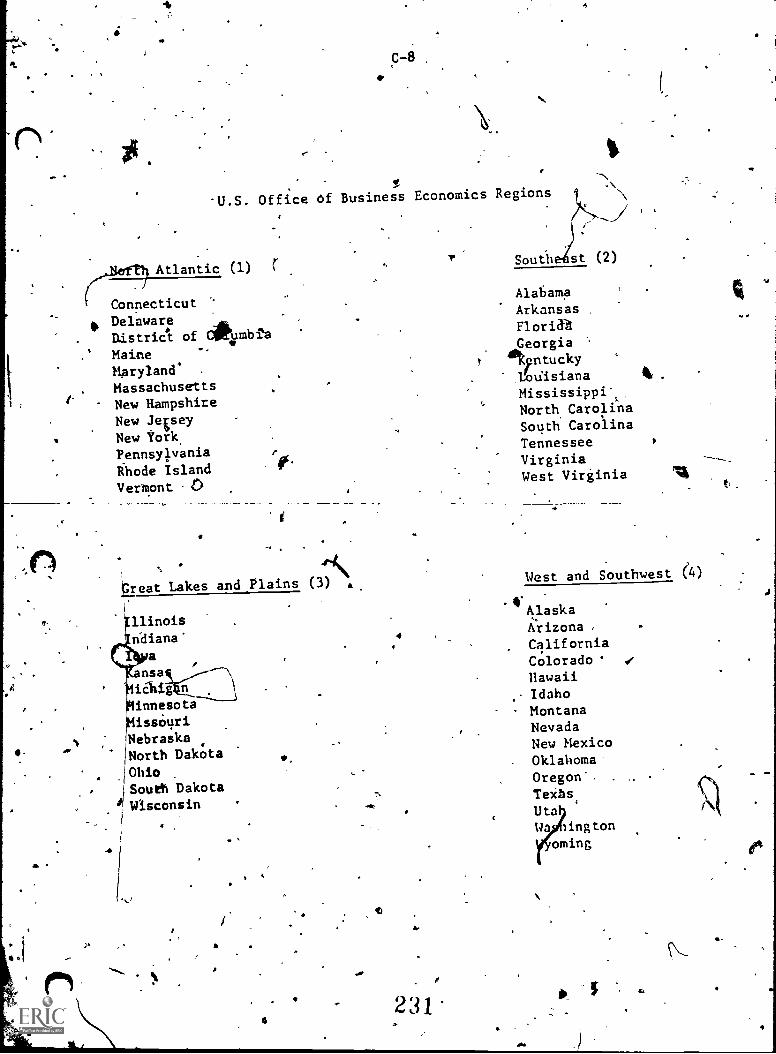
I-
a
C -8
5
-U.S. Office Of Business Economics Regions
7,4Efp4 Atlantic (1)
ConnecticutDelawareDistrict of 6016mbi'a
Mai;le
Mary/and' .
MassachusettsNew HampshireNew JerseyNew York.
PennsylvaniaRhode IslandVermont -0----------
44\
pleat Lakes and Plains (3) ,
F
llinois
ddiana'
ansa
iatig
innesotaissauri
NebraskaiNorth Dakota
10bioSouth Dakota
41 Wisconsin
I
231'
Southeast (2)
AlabamaArkansasFlorinGeorgia
414ntucky.1roulsiana
MississippiNorth CarolinaSouth CarolinaTennesseeVirginiaWest Virginia
West and Southwest (4)
AlaskaArizonaCaliforniaColoradoHawaiiIdahoMontanaNevadaNew MexicoOklaomaOregon-.Teihs,
UtaW lington
oming

k:r
4
I
Wm-
0
N...
-New England (1)
ConnecticutMaineMassachusetts.New-HampshireRhode IslandVermont
East North Central (3)
IllfboisIndianaMichiganOhioWisconsin.
South Atlantic (5)
DelawareDistrict of ColumbiaFloridaGeorgiaMarylandNortillCarolina.South CarolinaVirginiaWist Virginia
Test South Central (7)
ArkansasLouisianaOklahomaTexas
PDific (9)
'AlaskaCaliforniaHawaii
OregonWashi6gton
fa
C -9
A
Census Regions
%h.
4
4
ft
Middle Atlantic (2).
New JerseyNew YorkPennsylvania
West North Central (4)
IowaKansasMinnesotaMissouriNeb.raska
North DakotaSouth, Dakota
*
East South Central (6)
Alabama,Kentucky
MississippiTennessee
Mountain (8),
Arizona.ColoradoIdahoMontanaNevadaNdW Mexico'UtahWyoming


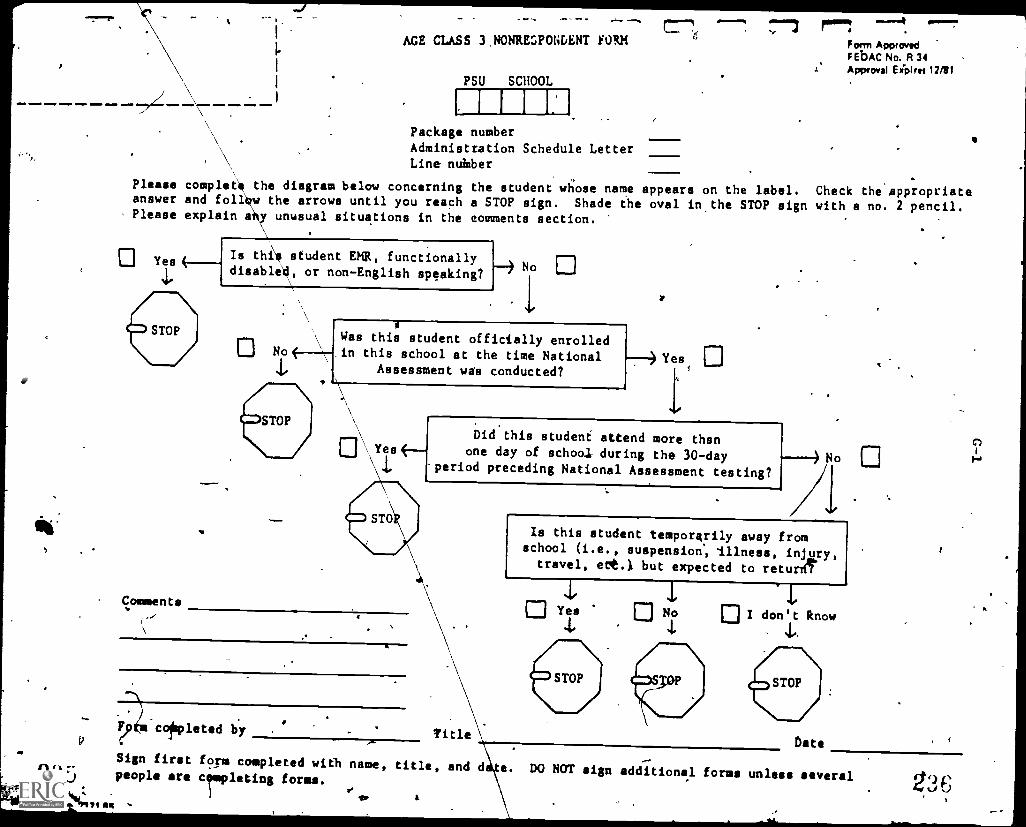
11
AGE CLASS 3,NONRESPONDENT PORM
PSU SCHOOL
Package number
Administration Schedule LetterLine number
Form ApprovedF EbAC No. F131Approval EXpIrel 12/81
Please complete the diagram below concerning the student whose name appears on the label. Check the Appropriateanswer and follew the arrows until you reach a STOP sign. Shade the oval in the STOP sign with a no. 2 pencil.Please explain a unusual situations in the eomments section.
Yes
le
Comments
Is thie student EKE, functionallydisabled, or non-English speaking? ) No
1
No (---*Was this student officially enrolledin this school at the time National
Assessment was conducted?
Did this student attend more thanone day of school during the 30-day
period preceding National Assessment testing?
Fp ctlipleted by
Is this student temporsrily away fromschool (i.e., suspension', Illness, injury,travel, eet.) but expected to return~!
1Yes No I don't know
TitleData
Sign first form completed with name, title, and d. e. DO NOT sign additional forms unless several235 people are Impleting forms.
ev'11111
Related Documents


