DOCUMENT RESUME ED 388 743 UD 030 670 AUTHOR Rainwater, Lee; Smeeding, Timothy M. TITLE Doing Poorly: The Real Income of American Children in a Comparative Perspective. Luxembourg Income Study. Working Paper No. 127. INSTITUTION CEPS/INSTEAD, Walferdange (Luxembourg).; Syrac.use Univ., N.Y. Maxwell Graduate School of Citizenship and Public Affairs. . SPONS AGENCY National Science Foundation, Washington, D.C.; Russell Sage Foundation, New York, N.Y. PUB DATE Aug 95 CONTRACT SBR-90-22192; SBR-93-21507 NOTE 46p.; Some pages and figures may not reproduce well due to light type. PUB TYPE Reports Evaluative/Feasibility (142) EDRS PRICE MFOI/PCO2 Plus Postage. DESCRIPTORS *Children; Comparative Analysis; Demography; Foreign Countries; *Income; International Studies; *Living Standards; Low Income Groups; Minority Groups; *Poverty; *Public Policy; *Socioeconomic Status; Tax Allocation IDENTIFIERS Australia; Canada; Europe; Scandinavia; *United States ABSTRACT This paper investigates the real living standards and poverty status of U.S. children in the 1990s compared to the children in 17 other nations, including Europe, Scandinavia, Canada, and Australia. The analysis is based on the Luxembourg Income Study database. It was found that American children have lower real spendable income than do comparable children in almost every other nation studied. In contrast, high income U.S. children are far better off than their counterparts in other nations. Persistently high child poverty rates were also found in the United States when compared with other nations. Demographic factors and the effectiveness of tax and transfer policies in reducing child poverty are also explored, and the paper concludes with a discussion of results and their policy implications. An appendix presents two tables of countries studied and poverty figures. (Contains 3 text tables, 8 figures, and 28 references.) (Author/SLD) *********************************************************************** * Reproductions supplied by EDRS are the best that can be made from the original document. ***********************************************************************

Welcome message from author
This document is posted to help you gain knowledge. Please leave a comment to let me know what you think about it! Share it to your friends and learn new things together.
Transcript

DOCUMENT RESUME
ED 388 743 UD 030 670
AUTHOR Rainwater, Lee; Smeeding, Timothy M.TITLE Doing Poorly: The Real Income of American Children in
a Comparative Perspective. Luxembourg Income Study.Working Paper No. 127.
INSTITUTION CEPS/INSTEAD, Walferdange (Luxembourg).; Syrac.useUniv., N.Y. Maxwell Graduate School of Citizenshipand Public Affairs.
. SPONS AGENCY National Science Foundation, Washington, D.C.;Russell Sage Foundation, New York, N.Y.
PUB DATE Aug 95CONTRACT SBR-90-22192; SBR-93-21507NOTE 46p.; Some pages and figures may not reproduce well
due to light type.PUB TYPE Reports Evaluative/Feasibility (142)
EDRS PRICE MFOI/PCO2 Plus Postage.DESCRIPTORS *Children; Comparative Analysis; Demography; Foreign
Countries; *Income; International Studies; *LivingStandards; Low Income Groups; Minority Groups;*Poverty; *Public Policy; *Socioeconomic Status; TaxAllocation
IDENTIFIERS Australia; Canada; Europe; Scandinavia; *UnitedStates
ABSTRACTThis paper investigates the real living standards and
poverty status of U.S. children in the 1990s compared to the childrenin 17 other nations, including Europe, Scandinavia, Canada, andAustralia. The analysis is based on the Luxembourg Income Studydatabase. It was found that American children have lower realspendable income than do comparable children in almost every othernation studied. In contrast, high income U.S. children are far betteroff than their counterparts in other nations. Persistently high childpoverty rates were also found in the United States when compared withother nations. Demographic factors and the effectiveness of tax andtransfer policies in reducing child poverty are also explored, andthe paper concludes with a discussion of results and their policyimplications. An appendix presents two tables of countries studiedand poverty figures. (Contains 3 text tables, 8 figures, and 28references.) (Author/SLD)
***********************************************************************
*Reproductions supplied by EDRS are the best that can be made
from the original document.***********************************************************************
Working Paper No. 127
DOING POORLY: THE REAL INCOMEOF AMERICAN CHILDREN IN ACOMPARATIVE PERSPECTIVE
Lee Rainwater and Timothy M. Smeeding
LUXEMBOURG INCOME STUDYWorking Paper Series
U S DEPANTMENT Or EDUCATION00.ce of Eclucahonat Research and ImprovementEDUCATIONAL RESOURCES INFORMATION
CENTER (ERIC)I Tms document has been reproduCed .11tere.ved Iron, the Person Or OP;panttat,Onor.timalmb tt
erAno, changes have been made to .rnproeefROduChon duahty
Po.nts Of v.e or ocamons stated .n Ih5 doCmenl do not necessanhe represent offic.atOE Ph DOsrtIOn or oollCy
PERMISSION TO REPRODUCE THISMATERIAL HAS BEEN GRANTED BY
Actr5a4,1- Avsinv\(
TO THE EDUCATIONAL RESOURCESINFORMATION CENTER IERIC1'
A Division of ('EPS/INSTEAI)centre d"....dde.% de Pop/dor/0m. de ,9auvre1(; er de Politique.s Socio-I.,ralomiques
lrarrnanonal Networks lor Simile% in lechnolooe Enthralment. ,Alletnonte. Development
BEST COPY AVAILABLE
Ael
Working Paper No. 127
DOING POORLY: THE REAL INCOMEOF AMERICAN CHILDREN IN ACOMPARATIVE PERSPECTIVE
Lee Rainwater and Timothy M. Smeeding
Maxwell School of Citizenship and Public AffairsSyracuse University
Syracuse, New York 13244-1090
August 1995
LIS is a division of the Center for the Study of Population, Poverty andPublic Policy (CEPS)/International Networks for Studies in Technology,Environment, Alternatives, Development (LNSTEAD) in Walferdange,Luxembourg.

Luxembourg Income Study
Timothy M. Srneedin2John CoderLee RainwaterHeinz StapfKoen VlemincicxMichael FOrsterCaroline de TombeurInge O'Connor
Debra BaileyCheryl MintonMarc CigrangUwe Warner
Margaret AustinGina Husak
Staff
Project DirectorTechnical DirectorResearch Director
Operations ManagerInstitutional and Technical Documentation SpecialistLuxembourg Employment Study (LES) Co-ordinator
Administrative Assistant, LIS at CEPS/LNSTEADAdministrative Assistant, Syracuse University
Staff Associates
Syracuse UniversityHarvard University
LIS at CEPS/INSTEADLIS at CEPS/INSTEAD
Syracuse UniversityAdministrative and Support Staff
Administrator and l3udget.OfficerAdministrative Secretary
Luxembourg (CEPS/INSTEAD)Administrative and Support Staff
Gaston Schaber PresidentEvelyn Houu-nann Budget OfficerUl li Kohl Administrative Coordinator
Contact:
Inge O'ConnorMaxwell School426 Eggers Hall. Syracuse UniversitySyracuse, NY 13244-1090United States of AmericaTelephone: (315) 443-4526Fax: (315) [email protected]
Caroline de TombeurLIS at CEPS/1NSTEADB.P. 65L-7201 WalferdangeLUXEMBOURGTelephone: (352) 33 32 33 518Fax: (352) 33 25 [email protected]
a
1
CONLN[ENTS APPRECIATED
DOLNG POORLY: THE REAL INCOME
OF AMERICAN CHILDREN EN A
COMPARATIVE PERSPECTIVE
Lee RainwaterHarvard University
Luxembourg, Income Study(lrefaisr.harvard.edu)
Timothy M. SmeedingSyracuse University
Luxembourg Income Study(tmsmeedingrdmaxwell.syr.edu)
August 1995
The research undertaken here was undertaken while Rainwater and Smeeding were fellowsat the Center for Advanced Study in the Behavioral Sciences at Stanford University. Theauthors are grateful to Barbara Boyle Torrey for helpful comments, and to the NationalScience Foundation for support provided by SBR 90-22192 and SBR 93-21507, the RussellSage Foundation which also provided financial support, and to the Luxembourg governmentand other national sponsors which make LIS possible. The authors alone retainresponsibility for all errors of omission and comission..

Abstract
This pa2er :he real arid cover:v status of United States children
.
:r. :he I 39,.-..,s zompareci to :he ch'idren :n : ozner nauons. :n,..ua,ng. Europe. Scandinavia. Canada.
and Australia We f.nd that Arnerican low-income children h'.ive lower real spendable income than
do comparable children in almost every other nation studiej. In contrast, high income United States
children are far better off than are their counterparts in other nations. We also rind persistently high
child poverty rates in the United States compared with other nations. Demographic factors and the
effectiveness of tax and transfer policies in reducing, child poverty are also explored. The paper
concludes with a discussion of results and their policy implications.
I. Introduction
Both pc-, e :7.c7easezi :he Unite.-1 States since the
amo-: B. the standar:: United States z'hild pc.. erty has
steidilv since :he irs ari has co---ued to nse to in the 19C.s The zuestion is whether
these most recent increases :71 child poverty have been endemic in the rest of :he industrial
economies or whether they a.-e unique to the United States Cross-national comparisons of economic
well-being are usei for 1ea7ning how one natiori is alike or different from other comparable
nations, because countries which face similar economic and demographic issues may use different
policy instruments to address these issues and may have very different outcomes. We have visited
this topic before (Srneedincg and Torrey, 1988; Forster, 1994; Smeeding, 1992; Rainwater and
Smeeding, 1994) and found that the United States has much higher child poverty rates than do other .
high-income countries In this 7aper we ex-tend this work and more generally address the real living
standards of United States c'rildren in a comparative context from the 1970s to the 1990s.
This paper compares ti-le economic well-being of children in the I9SOs and 1990s in IS
countries. 14 in E.:rope (A..:s:ria. Belgium. Denmark. Finland, France, Germany. Ireland. Italy.
Luxembourg. Netherlands, Norway, Sweden, Switzerland, and the United Kingdom) and four
elsewhere (Australia. Canada. Israel and the United States). The analysis is based on the
Luxembourg Income Study (LIS) database (Srneedin, Rainwater and O'Higgins, 1990; LIS Users
Guide, 1995).
The plan of the paper is straightforward. We begin by identifying the terms and concepts
that we use in the paper under the heading measurement issues. In the third section we examine
cross-national differences in real living levels. Most people who want to know about child poverty
are interested in children's "real incomes" (purchasing parity adjusted spendable income) as well

as their re:at:\ e .7c% statt:s Ard so e consider :he real standa:d of livina of .A.rnetican children
:e and :ov, incorne le% e:s as co:int:sat-ea' to their counterpar:s in other countries
17. 7:7. f :he :acer e\arnine els and trends in child pover:v over the
1907-13 time sp2..n We a:so in%estio.ate :he role of demographic forces in explaining the
differences in po% e:-.. (children in 1-Ao-parent and single-parent families), and the role of market
income and income transfers :71 preventing child poverty These analyses offer the first glimpse of
child poverty in the 1990s as seen from the perspective of the Luxembourg Income Study database.
The final section swrsnarizes our results and their policy implications.
Measurement Issues
Economic well-being refers to the material resources available to households.' The concern
with these resources is not -vith consumption per se but rather with the capabilities they Clive
household members to participate in their societies (Sen, 1992). These capabilities are inputs to
social activities and. participation in these activities produces a given level of well-being (Rainwater,
1990; Coleman and Rainwater. 197S)
All advanced industrial societies are highly stratified socially. Some individuals have more
resource's than others. The oppornmities for social participation are vitally affected by the resources
that the family disposes particularly in nations i the United States where there is heavy reliance
on the market to purpose such social goods as health care, education and child care services
(Rainwater, 1974). Money income is the central resource in these societies. But there are still other
important kinds of resources such as social capital (Coleman, 1988) and noncash benefits.
1We use the terms household and family interchangeably. Our formal unit of aggregationis the householdall persons living together and sharing the same housing facilitiesin almost allnations. In Sweden and Can icia the "household" refers to a more narrow definition of the "family"unit.
8
3
oaoer. 'Ae are ,:cr:cemed mone:. income Detai:ed comparase
evs:s in,:o7ne. on :2xes an,-1 on cer:ain kinds of :ransfers Ahisfh ha% e a
zashl:ke znarac-.er. exa=le a::oAance: or fce assistance or food stamcs.. for the IS
nal:ens hich \.e w rr.eszieate Uafor.unately v.e cannot take into account the major in-kind
benefits which are available in mos: countriesfor example. health care, day care and preschool.
general subsidies to housing and. :he like To the extent that the level and distribution of these
resources is different in different countries our analysis of money income must be treated with some
caution. However, they would be unlikely to change the conclusions reached in this paper. In fact,
they may even exacerbate :hem. (See Smeeding, et al, 1993 for an analysis that includes these
benefits 1
Income and Needs
Families differ not only in terms of resources but also in terms of their needs. We take the
differing needs becase of household size and the head's stage in the life course into account by
adjustina income for fami. size esinu an equivalence scale The adjustment for household size is
desianed to account for the different requirements families of different sizes have for participating
in society at a given level. Different equivalence scales will yield different distributions of well-
being. Several studies in Europe. the United States and Australia point to an equivalence scale which
implies rather dramatic economies of scale in the conversion of money incomes to social
participation among families with children (Buhmann, et al, 1988, Bradbury, 1989; Rainwater,
1990). Analysis of some of these surveys also suggests that there are important variations in need
as a function of the head of the household's age.
Drawing on these studies we have used an equivalence scale which defines need as the
product of the cube root of family size multiplied by a factor which sees need as increasing rouehly

ear :.07 :o :he rn:c.: an,'- :hen .-lecreasinQ a: :he sarre rate Hence. we
a:en: :71.2:me :he
=4 45
That is. equivalent income (ET) is defined as an individual's family disposable income (Y) divided
by :he product of the cube 7,-.`ot of the family's size (5) and .99 compounded by the number of years
difference between :ne head's age (A) and 45 The reader should keep in mind that ali money
income estimates in :ne paper are based on adjusted or equivalent income calculated according to
the above formula.
Having_ defined equivalent income in this way we determine the median of all individuals
in each country.. We then examine the distribution of incomes of households with children in
relation to the median for ail individuals. In this analysis we tabulate the percentage of children who
have given characteristics. not the percentage of families with children. In technical terms, our
calculations are weighted by the number of children in each family
Real Incomes
We beri the analys:s with an examination of the real incomes of children. Here we define
children as persons under age 18. While we use a relative poverty line standard-50 percent of
median equivalent disposable incometo calculate poverty rates, we are also concerned with
absolute or real levels of ci-dld well-beina. In order to investigate this issue, we have converted the.
median incomes of all persons in each country fo units of equal purchasing power in the same year
using information found in the Penn World table for that year (Summers and Heston, 1991). After
converting all incomes to real incomes we analyze our national differences by expressing national
amounts as a pe:c.ent of the United States median for all persons in the year of the survey. This
gives us the living standards for middle-income childrenthe 20 percent of children whose income
are around the median (10 percent of them below and 10 percent above). We also present results
1
for eacn s median .o,A-Incorne v:ne rr.ed:an of :he 2: 7er,:en: ":ne ir,come)
and median znild :ne of tne 2.2 oeroen: t'ne 'aignes: income)
Po% erty Rates and .Anti-Pos erry Programs
Turning to pover:\ rates. '.e examine results for three groups(. al ail children. (13) children
in two parent families and (31 children in families headed by a solo mc-her or lone parent. This
zroup is defined as a family headed by a single mother who is not currently living, as marriedthere
may or may not be other adults in the familybut who has children under 18 living in the
household. Our poverty measure is relative: the percent of children living in households with
income below half of the national median in line with a well-established theoretical perspective on
poverty (Sen. 1992. Townsend. 1979). Such a measure is now commonly calculated by the
European Commission (Hagenaars et al., 1994), by the OECD (FOrster, 1993) and by other
international groups
The official United States government poverty estimates differ from ours because they are
based on gross (pre-tax but post-transfer) money income and on an absolute poverty measure
developed in the early 196C.s. The United States poverty line at that time was about half of median
income, but fell to 40 percent of the median by the mid-1980s.: The method of counting income
(disposable income including tax benefits from the Earned Income Tax Credit (EITC) or near cash
benefits from food stamps) and poverty (relative to the national median) used in this paper are much
closer to the recent National Academy of Sciences recommendations for income and poverty
measurement (Citro and Michael, 1995) than is the current method used by the United States
aovernment..
2The United States measures can be found in U.S. Bureau of the Census (1995). PreviousLIS-based research using a 40 percent of median cutoff and different equivalence scales, has resultedin the same results that are shown in Section IV (see Smeeding, 1992; FOrster, 1993)
6
We a:so exarn.ne the tixes and :7ansfers e:1-be!7:1 Firs:. %N.e
es-r-ate :ne percent of ::".,:o7res be o.. h,lf of adiusted median disposable income
based on :heir adjus:ed mar., instomes Nlar:e: incomes. or tge-aoN.emmen: incomes, include all
forms of earninizs waces and salaries and self-employment income) plus capital income.
occupational pension beneE:s. and private transfers such as child support In short, market incomes
include evervthini2 but g_overinment transfers and taxes. Second. we make the same estimate based
on their after-tax and transfer incomes (defined as post-government or disposable income). Such
a comparison tells the reader how universal benefits, social insurance, and "welfare" programsthe
social safety nethelp prevent child poverty. It also tells us how the tax system, including negative
taxes such as refundable child tax credits and the United States' EITC, help raise the incomes of
some families relative to others
Database
The database used to ca.:7-y out this analysis is the Lux-ernbourg Income Study (1.1S1 database
which now contains information on child poverty for 25 nations in 65 databases covering_ the 1967
to 1993 period (LIS User Guide. 1995) Because of the recent addition of the 1990s data to LIS, and
the addition of several new nations (e.g.., Denmark, Finland) we are now able to analyze both the
level and trend in poverty and low incomes for a considerable period. Appendix Table 1 gives the
years of data available from LIS. with the nations and years used in this study given in bold. As LIS
continues to add datasets an even more complete picture of the comparative well-being of United
States children will emerge. For now, these data will give us the first glimpse at child poverty in
the 1990s.
BES I WE' Y LL
III. Real Leels of Li% ing
wc-:d .econornic at least in zieveloped zounti-ies) is mos:
onuciall% a the 17-1:-;:'.1CIL:a.'s e position the distribution of income. real levels of
living are also important in corripanng income and well-being Interest in real income goes beyond
the situation of poor chi!drenin comparative studies one also wants to know about the real
standard of living of average and well-off children as well.
Comparisons of real gross domestic product and aggregate consumption often show that the
United States has the "highest standard of living" among major modern nations. Thus, the question
of whether this state of affairs extends to measures of after-tax adjusted disposable income arises.
While the purchasin g. power parities (PPPs) used to make such adjustments are based on differences
in consumption patterns arnong nations, they are designed to be used with macroeconomic concepts:
aggregate output (GDP) and agcregate consumption as defined by national and international income
accountants. Cross-national differences in types of "consumption" which are tax financed versus
hoUsehold expenditure financed 2.:e not taken into account. Because countries differ in the way that
they finance such goods as health care and education, and because they differ in the extent to which
specific types of consumption are tax subsidized, e.g , owned versus rented housing, the PPPs used
here are less than ideal for adjusting disposable income for control over resources across countries.
Yet they are the best tool we have to make such comparisons. The "real incomes" measures below
should therefore be seen as measures of net spendable income rather than measures of total
consumption for children, the lar2est difference between the two concepts being goods ard services
such as health care, day care, and education which are provided at different prices in different
nations.
Figures 1, 2, and 3 address this issue (also see Table 1, columns 4, 5 and 6, on which Figures
1, 2 and 3, respectively, are based). We present here the results for the most recent LIS data point
BEST COPY AVM ABLE

8
eich com:are :he real s2e7.;.laoe ,s±:s-,:csa.o;e1 :ncomes of weii--,:T..ave.racze and lo,.v
:ncome chcren :he L._::e4 cllildren in 1- other nal:ons The
.-k-me:-:can c a Terson flmik had a farnii% income of Sl;4.o.-5
In fac:. .--Vmehcan cl-ildren who are in families in the upper 20 precent of the income
distribution do very well indeed (Figure l They have much higher standards of living as measured
by real spendable income than do similarly situated children in all countries, with only Switzerland
and Canada being within 20 percent of the United States level. Scandinaviae.g., Denmark,
Swedenhas high income children who live in families with three-quarters the income of the
average American child. The only nations whose -rich- children live in households with incomes
which are less than .50 percent of that found in the United States are Israeli and Irish children. Given
that Israel and Ireland have. by far. the lowest overall real standards of living of the nations observed
here, this is to be expected.
Focusing on children in the middle 20 percent (Figure 2) we find that only in Denmark and
in Canada are children as we:l off as are American children, although Swedish and Swiss children
are almost as well off. The average child in Belgium, Germany, Norway and Finland is only 90
percent as well off, and 80 percent or less as well off in countries like Austria, Italy, France. On the
other hand, in only three countries is the average child less than three-quarters as well-off as in the
United Statesthe United Kinadom at 72 percent, Israel at 52 percent and Ireland at 43 percent.
At the lower end of the distribution we find a very different and surprising picture. Both
national (U.S. Bureau of the Census, 1995) and international (see next section) evidence suagests
3For the statistically inclined, we examine the lowest, middle and highest quintiles ofchildren. We present the income of the average child in each group (that is the 10th, 50th and 90thpercentile point) for each countryadjusted in real dollars for the year of the national survey usingthe Penn World tablesas a ratio to the comparable percentile point in the United Statesdistribution. See notes to Table 1 for a more complete explanation of how the comparisons weremade.
BEST COPY AVAILABLE 1,1

United Szat,
SwitzerlandCanada
GermanyLuxembour,2
Australia
DenmarkSwedenFrance
Ital%
United King.dornNorwa%
NetherlandsFinlandAustria
IsraelIreland
Notes:Source:
: . \ '. HILDREN LN 11:11HOLDS
.....11111111111111111'1
-r,
_ - _ ,
77- Efaill11111
. .- ..
-147.4-- """'
0 20 40 60 80 100
Based on Table See Note f.iHe I for explanation.Luxembourtz Hcc
rIEST COPY AVAILABLE
1 j
United Sta;:f
Denma:-.s.
Cana.L:
Swede:Switzerland
BelgiumNorway
German:.Fin lan,-1
AustraliaLuxembourzNetherlands
AustriaFrance
hal .United Kingzdorn
IsraelIreland
Notes:Source:
\ .. CHILDREN LN lit
%: <EHOLDS
.;:"itallill111111111
-!-,
. VIM
75:1' :.:.";.&t:
. . ..
Based on TaheLuxembour_: I ,
BEST COPY AVAILABLE
41) ou SO 100 120
Iiddle Income U. S. Child = 100
, . r
. .
r. 1.,.He 1 for explanation.
COMPARISONS OF RE \ THE POOREST HOUSEHOLDS
United States .
SwedenFinland
DenmarkBelaiumNorwa:.
LuxembourzGermany
NetherlandsAustriaCanadaFrance
ItalyUnited Kinzdom
AustraliaIsrael
Ireland
a ;04
. ;
F -4'-r-
z .- : .1
100 200
Poor U. S. Child = 100
Notes: Based on Table 1. C. . 1..Crle 1 for explanation.Source: Luxembourg
dEST COPY AVAILABLE 17

1
TABLE 1. RATIO OF LONA,. MIDDLE AND HIGH LNCOME CHILDREN'S REALDiCOME TO UNITED STATES MEDIA.N ENCOME Di 1991
Country (Near)
Ratio to United State. Median Ratio to Comparable United States Children
Lo..est :0 Middle 20 Hioheit 20
Percent Percent Percent
III i2) (.3.1
Lowest 20 Middle 20 Hi2hest 20
Percent Percent Percent
141
: .
1S4 .1'
Ausira:ia s',.., 1 -; - __ .
1 : -1:z 8 I'15 1 - .
8-. 4'; 7.-!: ^
.,..1 '.3(.
Eiel:r.arn ..92 4S 1 SI ,:., :36 3 152.5 9: S -- i- .
Canada (91 3-; 4 SS 3 162 C 125 9 100 2 85.7
Denmark ..91 . 49 8 . 90 133 6 157.8 192 8 70 7
Fand ("91; 4c, 9 -S S 121.1 158.2 89 4 64 1
_r rance ,84'; 3- 5 -.'.- 3 129 3 118 9
_ . _ 68.4
. g ,-- -9.2: Germany (IS9 .. 14-) D 139.6 89 .6 -9 2
Ireland ::87. :9 3 3- 9 78 4 61 1 43 0 =1 5
Israel 86) 22 - 46 1 96 1 -2 1 52.3 51 0
Ita:y (91!, - -36 2 76.3 , 114 9 -; -_ _ 6- 6
Luxzimbour.s.: 85.1 4-: -.. : S 1.1j. 4 1=0 6 53 -6 4
! The Nether:a1s i9 : -11 -.) -3 5 122.9 132.8 833 65 0
Nor.vay (91 , 47 S -9 2 126 4 151.7 89 9 66.9
Sweden (92) 54.3 36 5 133.1 1-2 0 98.1 70.5
Switzerland (8.2)i
5= 3 ,R.-: -! - - :
171.6 172.1 97.2 90.8
Untzed Kin2dom i.86) 31 4 63 8 126.7 105 8 72 3 67 0
Note. Table to be read as follows:Columns 1-3: Given that in Australia the median real income of all persons is 82.7 percent of the United States
median in 1991 and that the Ausu-alian child median is 93.0 percent of the overall Australian median and that
the 10th percentile point (the middle child in the lower 20 percent) for children's income is 43.2 percent of the
median of all Australian children, the average low income Australian child has a real spendable equivalent
income equal to .827 * .930 432 of the United States overall median equivalent income-this amount is equal
to 33.2 percent.Columns 4-6 The ratio of low-income Australian children's equivalent income to that of low-income United
States children is equal to 33.2131.5-this is 105 3 percent. !
The Penn World tables used to make these conversions automatically adjust for national changes in consumer
prices, thus making all comparisons in terms of United States dollars in the year of the survey in each nation.
Source. Luxembourg Income Study
1"J
:ha: :he To% ra:e Lr..:ed on:Idren is in :he nel:nbornood of 2.: percent We compare the
real spendaO:e incornes of:he poor .krner.can onildthe one at the median of die bottom 20
Percent---wi:n :na: of t:arae inccrne onl:dren in other countries in Ficaire 3 We
immediatek see that in six coLntnes low income cilildren have real standards of living at least 50
percent higher that in the United StatesSwitzerland, Sweden, Finland. Denmark. Belgium and
Norway And in four other count:ies (Germany. Luxembourg, Netherlands, and Austria) low income
children are at least 30 percent better off than in the United States. Only in Israel and Irelandthe
two nations with the lowest GDP per capita of those studieddo low income children have a lower
real standard of living than do children in the United States.
In other words. while :he United States has a higher real level of income that most of our
comparison countries it is the high and middle income children who reap the benefits (and much
more the former than the latter ). Low income American children suffer in both absolute and relative
terms. The average low income child in the other 17 countries is at least one-third better off than is
the average low-income Arne7ican child (see also Table 1)
IV. Evidence on Child Poverty: Level and Trend
We shift now to measures of relative income within each country to examine both the level
and trend in child poverty across the 18 developed nations for which we have data In order to have
really solid evidence on patterns of change in these measures it would be desirable to have multiple
observations over several decades for a large number of nations. Unfortunately a database with data
for several countries over long periods of time does not yet exist. However, LIS has made efforts
to bring in earlier datasets from the later 1960s and 1970, s and also to pursue continual updating of
datasets to the later 1980s and early 1990s to provide a better data base for determining trends as
well as levels of poverty in advanced nations.
1

Ta Pie 2 prc..-..j.es \ ra:es. livino
households '.vIth rcces beiov, hai of :he median " We ha% e split the estinia:es into six periods.
Pefore :z-s- lc,co-1,S.S. and 19So, or later FOr 14 nations. we
have obser%,ations for child po% erty at tiAo or more points in time (although in some cases the time
lapse is short) For eight of these countries we have observations at three points in time. and four
or five points for a :ew We must therefore interpret changes in a verv tentative way We have
included the nations we have in three groupings. A. United States; B: Western Europe and C: Other
Developed Nations.
Level of Poverty
Table 2 and Figure -1 s'mmarize the most recent year for which child poverty estimates are
available for each na:ion. Child poverty rates throughout Western Europe are below 10 percent,
with the exception of 12.0 percent in Ireland, also the poorest nation in real terms, of the Western
European nations obser-ved here And in the other Western nations, most recent child poverty rates
range from 11 1 percent in Israel to 14.0 percent in Australia. Clearly the United States rate of 21.5
percent stands out as the largest percentage of children in poverty among the nations observed here
(Figure 1).5
'While we have not performed sensitivity tests for poverty rates at 40, 50, or 60 percent ofmedian or for different equivalence scales, previous LIS-based research has demonstrated therobustness of our child poverty results for a wide range of poverty measures and equivalence scales(FOrster, 1994; Smeeding. 1992).
5L1S datasets not used in this comparison include those for Russia, a set of transitioncountries of Central Europe (Czech Republic, Hungary, Slovak Republic), and the Republic ofChina/Taiwan. All of these nations have child poverty rates below 15 percent of median incomewhen child poverty is measured in this same way.

FIGURE 4
CHIL:, : RT`i RATES EN" 18 CO-C-NTRIESL4
United S:a:e.s
Australi:Canad::Ireland
IsraelUnited Kincrdor:-.
ItalyGelinany (Wes:
FranceNetherlands
Norwa:.Luxernbourz
Belaiurr..Switzerlanc:
DenmarkSwedenFinland
11.11111111111111111111111
M1111111111=11111
0 5 10 15 20 25
% of Children
'Poverty is defined as percer ,:..:H:dren living in families with adjusted disposable incomes less than50 percent of adjusted median inc r all persons Income includes all transfers and tax benefits.
byear for each estimate is rnc %ear in Table 1.
iEST COPY AVAILABLE4.r;' .1

I I
Trend
The IzS:s as no: a beh-.cd ::: n:zh. :he 7e!a::ve ezonornic A ell-being of children in any of
:hese count:7es was ::::-eat:\ in countries. ther-e a7e hints of impi-oN.en-ient fi-om the
19-Os throuoh the 19SOs to the l99Os (see Canada and SVeden in Table 2).. But overall we have a
picture of either stability or deterioration in the childi.-m.s economic well-beina In the United
States. Israel. and the United Kinadom there is a clear trend toward a worsenin g. situation for
children, thouah the most recent poverty rate for the United States suaaests a levelina off of the
previous increases. The 1990s results for Israel and the United Kingdom are not yet available. Over
an 18 year period. from 1969 to 1986. the child poverty rate increased from 5.3 percent to 9.9
percent in the United Kinadorn and in the United States from 13.1 percent to 22.9 percent, before
fallina to 21.5 percent in 1991 In Israel, too, there was a deterioration during the first half of the
1980s. All of the Scandinavian countries have been able to have kept child poverty below five
percent, and many other Europe= nations keep it in the 5 to 6 percent ranae over the 1980s and into
the 1990s.5
It needs to be emphas:zed that levels and trends in child poverty rates do not simply mirror
levels and chanaes in overall income inequality in these nations. While the United States has the
highest level of inequality among the nations observed here, Switzerland ranks third in overall
inequality but very low in terms of child poverty (Gottschalk and Smeeding, 1995, Fiaure 3). And
while patterns of increasing income inequality in the United States and in the 'United Kingdom are
correlated with their rising child poverty rates over the longer term, the timing of increases in each
nation are quite different. Inequality in the United States has continued to increase from the middle
6Note that in both Germany and the Netherlands the data sets used in earlier periods aredifferent from those used in later periods. Thus, the observed trend to higher poverty rates in thesenations may be attributed to different datasets, not to true increases in child poverty. Moreover, athe worst, both of these nations have child poverty rates in the six percent range.
AVAILABLE

1
1
1
1
T -03LE 2. LEVEL AND TREND LN CHILD POVERTY RATES:' 196%1992
7ation
Period 1 Period 2 Period 3 i Period 4 Period 5 Period 6
\ ear lifSune. < 19-1 19-2-19-5 ; 19-6-1981 1 1982-1985 1986-1988 089--
-_: 5
Wes: E.41:57e
-, : 3 8
2 9, 5 -_
, D---rnark 8. 92 5 3 3 3
France '9. 84 6 3 6.5
Germany (West., 73. S. 83,84. S9 1 4 0 3 2 4854 6 8
I Ireland S" 12 0
:talv Ss. 9: I10 8 9.6
Luxembour2 85 4 1 .
The Netherlands . 83. 8" 91',
5-
_ 3.6 16 2
Nor.vav "9, 86. 91 3 8 3.8 4.6
Sweden 6". 5. 81. S". 92 -; ;_ _ 1.9 3 9 3 ::.-, --
Switzerland s: 3 3
. Uni:ed Kinsdsrn ;9. "-I. "9. 86 5 3 7.0 8 5 9 9
C. Other.
Australia 82, 86, 90 14.0 13.1 14.0
Canada 71,75,81,87.91 13 2 14.6 13.9 13 6 13.5
Israel 79, 86 8.2 11 1
'Poverty is defined as percentage of children livinz in households with adjusted disposable minus less than 50 percent of
median adjusted disposable income for all persons. Income includes all transfers and tax benefits.
bThe slash (/) for Germany indicates that the German Survey for 1973-1983 is different from that for 1984 and 1989,
hence one cannot denve overall trend estimates from 1973 through 1989 from these figures.
'The slash (/) for The Netherlands indicates that the survey for 1983 and 1987 differs from the 1991 survey, hence one
cannot derive trend estimates for 1983-1991 from these figures.
Source. Luxembourg Income Study.
BEST COPY AVAILABLE

throu,:h :he s he cnild h.as remained constant or has t'alien bv ()Ur
sure o%er this sahne \Ian\ nations o-se:-..ed here have sustained lar..ze increases in
inedualit% the -4S:s .:har.e in er:v. e . Sweden and Australia
(Gottschalk and Srneedins.z. Tables 5 and 0.)
Az the \,..ery leas: :hese multiple year observations sugszest that the finding, from the various
LIS datasets are not aril-acts of particular years of our samples. We tind that the countries that have
low poverty rates in our latest samples have low rates in the earlier periods as well. Those with
middling_ rates are in the middle earlier and the higher rate countries are higher in early periods.
Differences. Between Two-Parent and Solo-Mother Families
A child's chances of being poor in the United States differs dramatically depending on
whether he or she lives in a one or two parent family (Table 3). A child in a two-parent United
States family has only about a 1 I percent chance of being poor as compared to a 60 percent chance
if the child lives wit'n a lone parent who is a mother. In fact. in all countries studied, one's chance
of being poor in a one-parent tr.:Ther family is much higher than in two parent families.
Because so few children in most countries live in solo mother families the difference across
countries in the percent of children living in solo mother families has little to do with the difference
in total child poverty rates. Only in the cases of Australia, Canada, and the United States would total
poverty rates be noticeably lower if the proportion of solo mother families was the averne for these
17. countries. In other counties with greater than 10 percent of children in solo mother families
(Denmark, Norway, Sweden, United Kingdom), the poverty rates for single parent children are close
enough to couples rates to not make a great deal of difference in the overall poverty rate. And
demography is clearly not destiny; children in solo mother families in Denmark, Finland (7 percent
poverty rate) and Sweden (5 percent poverty rate) do better than children in two parent families in
many of the nations studied.
i3EST COPY AVAILABLE2,1

1
TABLE 3. POVERn RATES FOR CHILDREN BY FAMILY TYPE'
Children in Children in Single
1-%%0-Parent Parent. Solo Percent of Children in
Countn 'Year All Children F.tmilNs Mother Farad.' Solo Mother Families"
: 2: 4 59 5I
,Aust.-al:a 9.- , i 5r.-; 2 : 4
t
; i-3e:,:-........m ..',:. 3 5 -, -
:.) ::._ _ '- 50 2. 11 4
t
!
Denmark (91 3 3 2 5 7 3 14.3
, ,
1 Eriland 1.9: ) z.- ._;1 9 - 9.5
: ::-ance .84 4 z.- - 5 _), 22.6 6 5
1
1 Ge:-.7...anY . '3; 5 5 -. -2 9 i, 9 9
I Ireland 1.87) 10.5 40 5 5.3
g
israel .86' . 10.3 27.5 5 1
ltav91 1 , .-, --- 9 5 13.9 4 4
I LUN: ..-_':-:':E o ur 0. S 5 i 1 A 10 0 6.8
e Nethe7lands , 91 . . _ 3 1 39 5 8 a
Norway .,9 1 ) 4 .:: 1.9 18.4 15 4
Sweden (9' ) ,,
- -- -, ,... .- 5.2 14.6
Switzerland (82) 3 3 1 0 25.6 6.9
United Kingdom (861 9 9 8 4 1S.'' 13 0
'Poverty is defined as in Table 2bChild poverty rates in two-paren: families are for those children living in situations where there are only two
adults who are married, or are living together as married.'Single parent/solo mother families are children living in those situations where one female adult resides in the
household. Other adults (e.g., older children) may also occupy the residence.°Because some children live in other types of situations, e.g., in multiple family unit households or in lone
father units, the weighted averages of children in solo mother and two-parent households do not add to the "all
children" total.Source Luxembourg Income Study database.
,iEST COPY AVAILABLE

13
CPrnpar:n:.: :h.e pc% eh:-. 7:1:es 0:s ,:h:ldren in pai-ent families and in solo mother families
we note a g.roup cf ,:pun:hles w-ith :ow rates for Poth tyPesSN.keden. Finland. Belgium.
De=ark_ arIC: has child cove:-:,.. rates in solo mother hey.veen
rou,thiv 20 and 4: percent t zoers a wide ranc'e of rates in two parent familiesGeriany.
Switzerland. and Nor-way ha% e quite low two parent rates France has a middling rate and Israel,
Italy. and the United Kingdom higher rates for children in two-parent households.
The combination or-difference in the poverry rates of children in two parent compared to solo
mother families and the smaller differences in the percentage of children who live in solo mother
families has an important effect on the family type composition of the poor.7 In five countries more
than half of poor children live in solo mother familiesthe United States, Australia. Germany,
Switzerland, and Norway wit:: Canada coming close at around 40 percent. At the other extreme,
fewer than 15 percent of poor children are in solo mother families in the Netherlands, Belgium, Italy,
and Israel. Children in solo mother families make up between 15 and 30 percent of the poor in
Luxembourg, Ireland. France. :he United Kingdom, and Sweden Thus, the rate or 5=!minization of
poverty varies dramatically across these countries baSed on both the poverty rate for children in
single parent units and on the percentage of children living in each type of unit.
In summary. 1 of every 8 American children is a poor child living with a solo mother. Fewer
than 1 in 100 children are in the same situation in Sweden, the Netherlands, Luxembourg, Italy,
Finland, and Belaium. In the United States 1 very 10 children is a poor child living in a two
parent family and this ratio is not too different in three other countriesIreland, Israel, and Italy.
In contrast, the ratio is about 1 in 50 in Finland, Germany, Norway, Sweden, and Switzerland.
'The figures on the demographic composition of poor children are not shown but areavailable from the authors
14
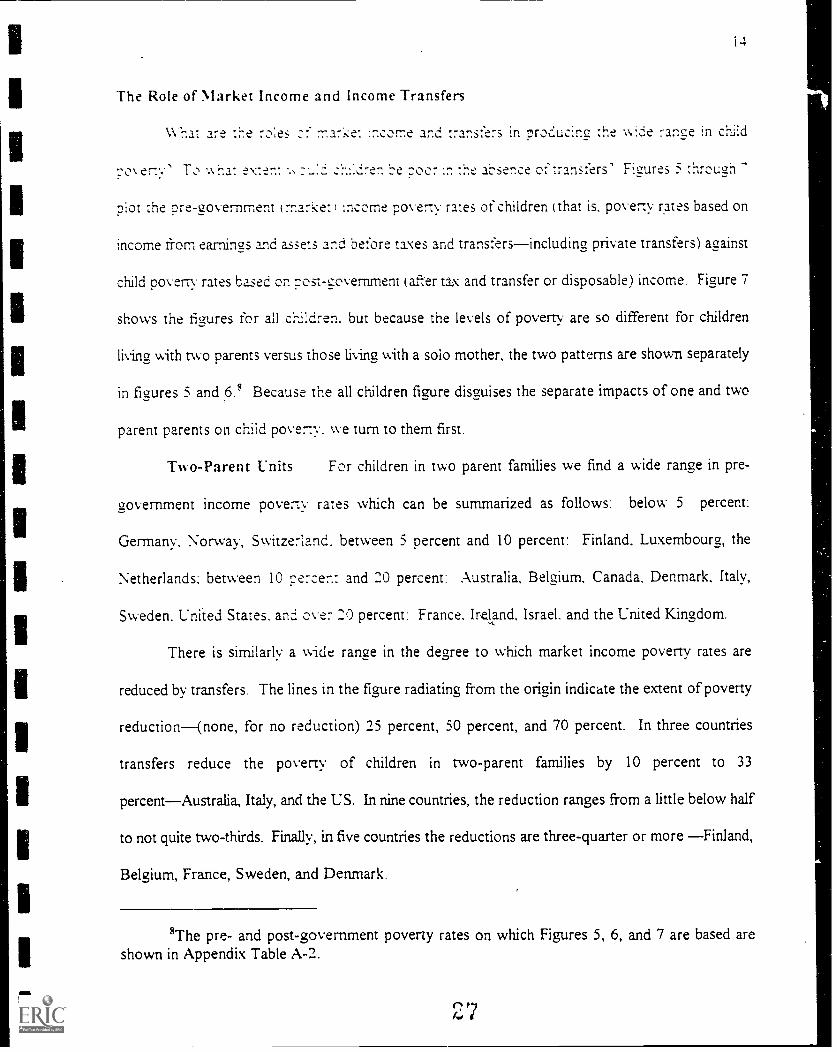
The Role of Market Income and Income Transfers
W1lat are :e rz,:es 7na:-.?;e: :ncome and transfers in proc:uc:ng the 'Aide rance in child
po% er:y' o v,na: extent in :he 2.i.-sence of transfers' Figures 5 through
plot :he pre-government (market) income poverty rates of children (that is. poverty rates based on
income fi-om earnings and assets and before taxes and transfersincluding private transfers) against
child poveny rates based on post-government (after tax and transfer or disposable) income Figure 7
shows the figures for all children. but because the levels of poverty are so different for children
living with two parents versus those living with a solo mother, the two patterns are shown separately
in figures 5 and 6.8 Because the all children figure disguises the separate impacts of one and two
parent parents on child pover:y, we turn to them first.
Two-Parent Units For children in two parent families we find a wide range in pre-
government income poveny rates which can be summarized as follows: below 5 percent:
Germany, Norway, Switze7land. between 5 percent and 10 percent: Finland. Luxembourg, the
Netherlands: between 10 pe7cen: and 20 percent: Australia, Belgium. Canada, Denmark, Italy,
Sweden. United States, and ove: 20 percent: France. Ireland, Israel. and the United Kingdom.
There is similarly a wide range in the degree to which market income poverty rates are
reduced by transfers. The lines in the figure radiating from the origin indicate the extent of poverty
reduction(none, for no reduction) 25 percent, 50 percent, and 70 percent. In three countries
transfers reduce the poverty of children in two-parent families by 10 percent to 33
percentAustralia, Italy, and the US. In nine countries, the reduction ranges from a little below half
to not quite two-thirds. Finally, in five countries the reductions are three-quarter or more Finland,
Belgium, France, Sweden, and Denmark.
8The pre- and post-government poverty rates on which Figures 5, 6, and 7 are based areshown in Appendix Table A-2.
.3 0
5cp
cc
0
>0
1o.) 5
1 0
4c-i)
5
FIGURE 5
PRE- AND POST-GOVERNMENT POVERTY RATES:CFEELDREN LN TVk 0-PARENT FAMILIES
None
U SI R
A
UK
75%
0 5 10 15 20 25 30Pre-Government Poverty Rate
Notes: See Appendix Table A-2 for numerical coofdinates of each country point.* = percentage reduction from pre-government poverty to post-government poverty.
Source: Luxembourg Income Study.

The :s tna: t.r.e e\hreme:,. :ok market :n.:brne based poverb.. rates for children in
Nor-Aay and -.:%%.1-..2er:a.nc: re redl.:bect to an e..er: cr rates tn., sizovernment prolzrarhs. and :he three
count:hes '.7:7. 5 to : = percent rnark-et :ncorne Pased tr::. rates lind their disposable income rates
reduced to beiCA T.,,erzen, For the rest of the count:hes there is an even greater deal of movement.
Beurn has a higher market Ihcome pover:y rate than :he other countries in group C. but it transfers
produce a very lo v. disposabie income rate of less than 5 percent. The shiri for Canada is not as
dramatic, but still considerabie compared to the United States or Italy or Australia.
There are also differences in the disposable income poverty rates among the countries with
the highest market rates (above 20 percent). French children in two-parent families improve their
situation a great deal through transfers. and children in the United Kingdom and Ireland improve
more than those in Israel
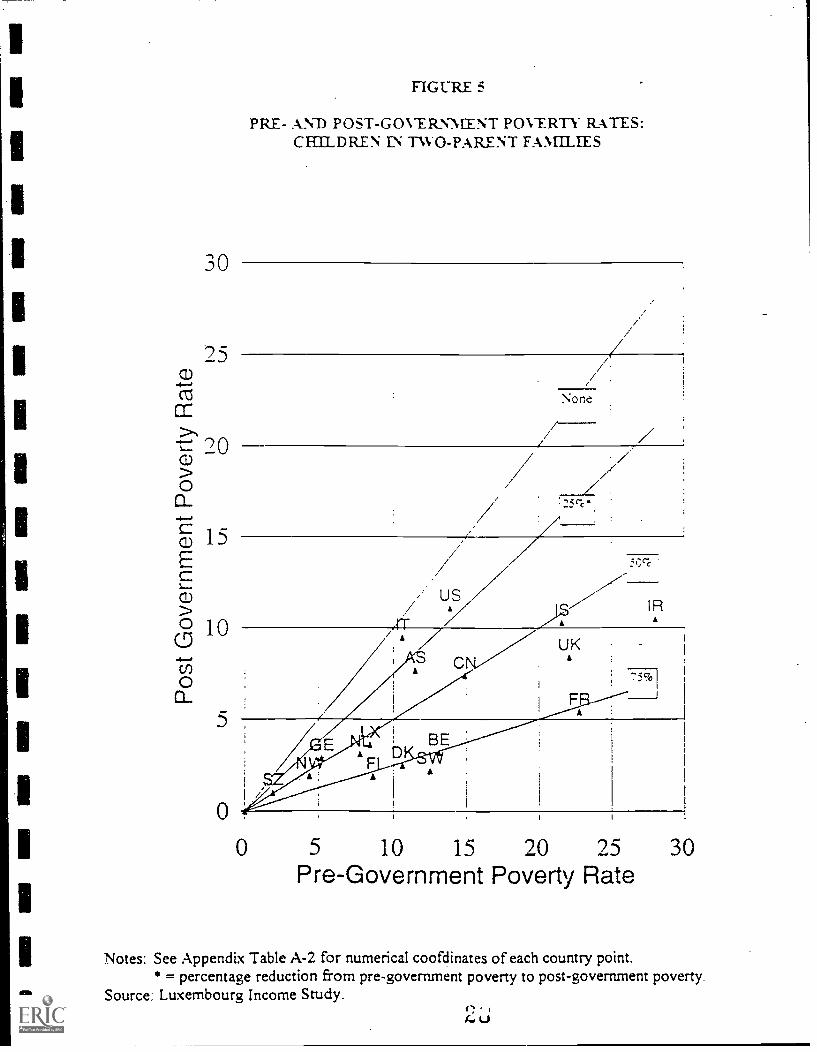
Solo-Parent Units Next, Figure 6 shows that the antipoverty affect of transfers for
children in solo mother fami:ies is quite different from that of two-parent families. The pre-
government poverty rates in a:: countries are very high. Only four have rates below 50 percent and
two have rates close to SO percent. Market income poverty rates for children in one-parent families
are as follows: between 33 percent and 45 percent: Switzerland, Italy, Finland. Germany; between
55 percent and 62 percent: Luxembourg, Belgium, France, Denmark, Sweden, Norway, Germany,
Israel; between 68 percent and 73 percent: Canada, United States, Australia; Ireland; and between
70 percent and 80 percent: Netherlands, United Kingdom.
The antipoverty effect of transfers varies more widely across the countries in this case than
for children in two-parent units. While only three counties had reductions in two-parent poverty of
75 percent or more, we find that much reduction for solo mothers' children in six countries.
However, there are also more countries with rates of poverty reduction around 25 percent or less for
mother-only than for two-parent families.
,iFST coPY AVA1LABLE`2q.)
SO
FIGURE 6.
PRE- AND POST-GOVERNMENT POVERTY RATES:CHILDREN EN SOLO MO I ELER FAMILEES
None
:15c7c"
U SA
AS
IR, NL
0 20 40 60Pre-Government Poverty Rate
80
Notes: See Appendix Table A-2 for numerical coofdinates of each country point.* = percentage reduction from pre-government poverty to post-government poveri
Source: Luxembourg Income Study.
BEST COPY AVAILABLE et;
The 7e.SL.T. :7: :he 7i-o7or:lor. c:crer. 7:loved cu: of :ransfers
:s a ve:-. e ranze income ra:es
12.0 \ ernment rates 1.:no:ei- ranceL' across a faii-Iv rans2e of market income ratessee
Finland, Denmark. BeIgi.,:m. 1.:xembourg. and Sweden. We find greater di\ ersity in market rates
for the six countries witn disposable income rates ranging from 14 percent ( Italy) to 27 percent
(Israel). Switzerland and Italy are among the nations with the lowest market based rates, Norway.
France, and Israel are in the middle, and the United Kingdom has a high pre-government income
based poverty rate for children in solo mother families. Disposable income poverty for children in
mother-only families tends to 'De highest in those countries where the antipoverty reduction is only
around 25 percent. The correlation between market income based poverty and disposable income
based poverty among children. in solo mother families is only 0.40, much less than the 0.73 rate for
children living with r.vo parents
All Children The picture for all children combines the two groups, along with children
living in other circumstances e (2., multi-family households and single-paren: units headed by a
man). We immediately see tnat the range of pre-government poverty rates is much less for all
children than for the two separate groups. Other than Switzerland and Germany, all nations have
pre-government child poverty rates that range from 12 percent to 30 percent, indicating that broadly
similar child poverty problems face most advanced national governments. What differs is national
governments' abilities to address these problems. The rate of poverty reduction is only about 25
percent in the United States, Australia, Italy, Germany, and Switzerland. It is 75 percent or greater
in France, Belgium, Denmark, Sweden, and Finland. Some nations with high child poverty rates
based on market income are able to use taxes and transfers quite effectively to reduce child poverty.
These include France. Ireland, and the United Kingdom. Australia, Canada, and Israel have middle-
range child poverty rates in terms of market income and reasonable rates of decline from tax and
BEST COPY AVAILABLE

300
cr -)5
a_ /0ecD
E
>010
FIGURE 7
PRE- AND POST-GOVERNMENT POVERTY RATES:ALL CHTI DREN
None .
0 5 10 15 20 25 30 35Pre-Govemment Poverty Rate
Notes: See Appendix Table A-2 for numerical coofdinates of each country point.= percentage reduction from pre-government poverty to post-government poverty.
Source: Luxembourg Income Study.
32

;roc-7ns C ':er na::ons ra:es below 20 percent
:0 7ej.....:ce :'nose ra:es :o 1: :.s.erzen: or !owe:-
O erall Spending Patterns
These findir.as corre!a:e ell %ith overall cash social expenditures on the nonaaed as a
percent of GDP in 1985 (or 1990,91) as shown in Fiaure S Low transfer societies (Australia, Italy,
United States) produce lesser reductions in child poverty in any aiven year than do hiah transfer
societies (Scandinavia. Northern Europe). Nations that have manaaed to produce a downward trend
in child poverty are either those that spend a lot (e.a.. Sweden) or those whose spending has
increased throuah the 1980s (e g., Canada).9
Transfer Income Packages
insiaht into .r.ow poor families escape poverty will come from examining most particularly
the income packaaes of families who are at highest risk of poverty. Because we define the poverty
line as 50 percent o::he equivalent median, by definition, half of families have equivalent incomes
above twice the pover-ty line We consider those individuals with disposable incomes below the
median to be at risk of poverty. The income-packaaina institutions of each countty determine the
share of this half of the population who in fact end up with incomes below the poverty line. Based
on figures not shown here, transfers to two-parent families amount to more than 25 percent of
median income (50 percent of the poverty line) in Sweden and Ireland, and to more than 20 percent
in the United Kingdom, Belgium, Finland, and France.1° At the other extreme, transfers amount to
around 10 percent or less in Australia, Luxembourg, Norway, the US, Italy, and Switzerland. As
Germany, Norway and Switzerland demonstrate, full employment at adequate wages can produce
'Because they are not OECD countries, Switzerland and Israel are not shown in Figure 8OECD information on Ireland and Austria was not available.
10These figures can be obtained from the authors.
3 0"

C-n1 P
m (11 s3P
111.1. .(1,66 1(ID
:10
sinntmq tiotittitipa pun 'sitpuati quum
i's sontA
pim r-iiitt alp oi sluatm
i 'piasvilinsA
'swap sim
atirnanspll Jagio pun
..11.1)"."1A
1111111 'itolipsumittion ittattiA
nitlilmtni
thmom
oul 110111,c01,1111., 's0:11,\ rts ociTtipsip
siumm
q listraas;gi
tnft5"
'11o
1.1r,.
1)
16/0661 tiNy `S861 '0861 N
I l(I) AO
SV W
I9VN
ON
1ILI. 9N
011IV N
o1,1,31,1,011d 'IN/130s
8 A111191;1
EN
MB
MI N
M1.111
- II
-Vt9 1
a.)111t1Se.
;')(1N
NM
MB
NW
MI R
S NM
MN
MI
18
. ,
.ow chld pose.., ...a_ Ke. ...us .essehina :ne bercentaze ot incomes. made ',ID
by ti-ansfers How e..er. :7 soc:e::es %yth her nonembiovirent and low %%aces. tax and transfer
benerits are needed :o reduce child To% et-:\ to acceptable levels for :wo-parent families wi:h
children
As one shou:d expec:. averaze transfers to solo-motherfamilies at risk of poverty comprise
a z-eater share of their disposable income than is the case for two-parent families. In four countries
they amount to 40 percent or more of median equivalent income (or 80 percent of the poverty
line)the Netherlands, the United Kingdom, Sweden. and Luxembourgand are almost that high
in Ireland and Belgium. A: the low end we find Switzerland. the United States, Italy, Finland,
Germany. and Canada less than 25 percent of disposable incomes for at risk solo parent
families coming, from transfers.
Summary
The estimates of market and disposable income poverty presented at the end of this section
add factual evidence and e\planation to the pattern of poverty rates found in the initial tables (2
and 3) in this section of :he paper. Despite the wide variation in level and trend of child poverty
across the 18 nations studied here, Almost all national governments face substantial numbers of
children who would be poor without government tax and transfer policy intervention. Some mix
market income and transfers more effectively than do others. And children livirm with single
parents always do less well than children living with both parents. Most societies provide a mix of
tax and transfer benefits that, when coupled with market earnings, reduce child poverty to very low
levels. But not all nations do so well. In particular, the overall high rate of both pre- and post-
government poverty in the United States is troubling.

19
V. Summary of Results. Policy Implications and Conclusions
The results 7,7er Ln:tec. S:,:es -income cniiciren ha% e a lo..er real
:he:: c erras:n almos: other nat:on ie This real income
deficit is mirrored in our hign relative r.,oer-tv rates. and in our low and falling social expenditure
le els (Figure 8) Because our measure of poverty is much closer to that recently recommended by
the National Academy of Sciences than to the "otliciar United States poverty measures used by the
federal government (e.g.., U.S Bureau of Census. 1995) we were able to chart the impacts of two
of the most effective anti-poverty devices for children in the United States, food stamps and the
EITC. Between 1986 and 1991. we observed a modest decline in relative child poverty in the United
States from 22 9 percent to 21 5 percent. because of increases in spending for food stamps and the
EITC over this period, and a:so because of the higher zero bracket amount and personal tax
exemptions which emerged from the Tax Reform Act of 1986." These findings emerged despite
the overall decline in United States spending for social programs for the nonaged noted in Table 8,
and widening overall income inequality in the United States over this same period.
In contrast to our low-Lncome children, our high-income children are better off than their
counterparts in every nation st-udied. The wide variance in child well-being found in the United
States mirrors the high level of overall income inequality in our nation. This pattern is not found
in other nations. While their inequality is less than in the United States, children living in families
at the bottom of the distribution enjoy living standards which are significantly above those found
for similar children in the United States, even in nations where overall income inequality has
increased during the 1980s.
"In contrast, the official United States government figures, which do not count theseprograms, indicate child poverty rates of 20.5 percent in 1986 and 21.8 percent in 1991 (U.S. Bureauof the Census, 1995, Table D-5, page D-17).
3EST COPY AVAILABLE 3 7

Policy Implications
Cornrhon ch:ehs fac.e all of :he na:ions
20
The social. ecor.ornic. and
ernocra-:h.:c forces 'A.:I:cr. are proceilir,c hich Uni:eC S:a:es chiid ;..o% env are affecting the parents
of children ill each nation sa;clied here to a greater or lesser ex-tent Divorce, out-of-wedlock births,
and single-parent families are growina in every nation studied. Similarly, the labor force
participation of womenboth spouses and single parentsare rising rapidly in every nation studied
here (Smeedina, Rainwater and Danziaer, 1995). These forces may have important neaative effects
on children which can produce hiah market income based poverty rates and which need to be
addressed by social policy
What is uncommon a.:::out the United States is its relatively poor response to the problems
which these social forces have produced. While social policy in Europe, Scandinavia, and even
Canada.. has worked hard to keep child poverty low, or to reduce it further (e. R., Blank and Hanratty.
1992; Commission of the Eiropean Community, 1993. 1994), the United States is soundina a social
policy retreat. While there is -.%:::espread aareement that all parents with school-age children should
work in the marketplace. anzi :hat welfare should be reformed, there is little or no aareement how
to help parents find a g.00d job and even less agreement on how to help them keep a job once they
have found it. Unlike the other nations shown here, there is much less in the way of public support
for both working and nonworking, parents in the United States than is found in other nations. Two
examples help illustrate this dilemma, child allowances and guaranteed child support for single
parents.
Every nation studied here has some form of child or family allowance save the United States.
While the U.S. House of Representatives has passed an additional $500 per child tax credit for
"middle income" children, this will provide zero help to the one-third of United States children who
live in families with little or no federal income tax liability. For about the same cost as the added
t3EST COPY AVA1LABLE

S5:(2 per ehm.r.a:e :ne federal persona: :ncorne :1\ .-ieduction for
:er crej.i: for all .:hildren. regardless of :heir
parents ncorne le.. el cucri c'nange cou:d benef.: !ow income children
Both divorce and sirive parenthood are high in :he United States, and have been rising at an
even more rapid pace in Europe than in the United States While 23 percent of all United States
families with children were headed by a single parent in 1990. as compared to 9 percent in 1960,
these rates have uown from about the same 9 percent base in 1960 to 15 percent in Canada and the
Netherlands. 13 percent in France and Sweden, and 14 percent in Germany, all by 1990
(McClanahan and Sandefur, 1994, Table 14) Many of these nations also face the same problem that
the United States faces with respect to lack of payment of child support by the absent father. The
European reaction has been to institute a minimum auaranteed level of child support to sinale
mothers (and fathers) in cases where the absent parent cannot or will not pay child support. This
guaranteed income allows a single parent to be able to czo out and find a job, keep a job, pay for
some portion of subsidized c.n.ild care and otherwise substitute for the lack of a panner who can
share work and cEd rearing. responsibilities. Such programs as these are sometimes restricted to
mothers who have legitimate child support orders but are not being paid, and are not terribly
generous, e.g , guaranteeing annual support on the level of S1500 per child. But they do provide a
reasonable minimum level of support for the children involved once combined with work and related
programs (e.g., child allowances, food stamps, and the EITC). The cost of such a program in the
United States has been estimated to be $10 to 15 billion, and much less if the program helps single
mothers to go to work and to become independent of the welfare system (Kim, Garfinkel and
Meyers, 1994). If we want low-income mothers to go to work, we must find ways to reward work
and, for single mothers, ways to provide the support that the absent parent cannot, or will not,
provide.
3EST COPY AVAILABLE

These :'.o l'70Crams--c'r.:::: allowances and c-uaranteed child succortare oniv two
exarnbies of how the T:r.::ed .-"states can learn fi-orn other rxions Bet there is no one simzle mazic
bullet by which eve7. hanciles :he .7roblem of child ^oertv Moreover. other nations can
learn from :he United States as well The EITC is a uniquely American invention which helps make
\\.ork pav by tarieting assistance to low wa2e families. Other nations such as the United Rn2dom
and Australia are enactina their own forms of the EITC And food stamps are another uniquely
American pro2ram which is effective and worthy of consideration by other nations. The point we
are making_ is a simple one every nation fiahts child poverty in its own way, America included. The
difference is that every other nation has produced better results in fi2htinzt child poverty than has
the United States.
Conclusion
All nations bectin with the issue of preventing severe poverty and disadvanta2e for at-risk
children. The major difference we note is that other nations are able to produce lower levels of child
poverty than in the United States. It follows that child poverty is neither intractable nor intransigent.
The United States had an eider poverty problem in 1970 which it markedly reduced through
increased social security spendin2 and greater efforts on the part of the a2ed to save and invest. It
now has a child poverty problem which produces an intolerably low real standard of living for a
large number of American children. Our high-income children do very well in real terms compared
to similar children in other nations. No one wants to take away these advantages for which the
parents of these children work long and hard. What is needed is a reasonable response to the real
needs of low-income American children. And as other nations have shown, there is an answer that
we can find if we have the national will to face up to the sobering facts presented in this paper.
'1-i COPY AVAILABLE
fi0

References
B c.Sc. "Farn.' S:ze and `E.% aivations of Income and W.
Buhmann. B . L Rainv,a:er. G Scnmaus. and T Smeeding 1988 "Equivalence Scales. Well-Being,Inequality and Pover:y.- Revie ofincome and Wealth, June: 115-142
Citro, C. and R T NLchae: eds ) 1995 Measuring Poverty .4 New Approach Washington, DC:National Acadern Press
Coleman, J. 1988 "Socia: Capital in the Creation of Human Capital," American Journal ofSociology, 94 595-S120
Coleman. J. .-1,nd L. Rainwa:er 1978. Social Standing in America. New York: Basic Books.
Commission of the E.,1ropear Communities. 1994. "The Demographic Situation of the EuropeanUnion.- Repor: COM( 94.) 595 final. Brussels. Belgium, December.
1993. Soc:o,' Pr.we,:rion in Europe, 1993. Directorate General for Employment, IndustrialRelations and Social Affairs. Brussels, Belgium
Forster, NI. 1993 "Corncaring Poverty in 13 OECD Countries: Traditional and SyntheticApproaches.- in Social Policy =10, Paris: OECD, October.
Gottschalk. P and T Srr.eedin;:. 1995 "Cross-National Comparisons of Levels and Trends inInequality.- LIS Work:nc.: Paper =127, NIay 1995
Hagenaars, A. K. DeVos and A Zaidi. 1994. -Patterns of Poverty in Europe.- Paper presented tothe 23rd General Conferer.ce of the IARIW, St. Andrews, Canada, August.
Hanratty, NI. and R Blank. 1993. "Down and Out in North America: Recent Trends in PovertyRates in the U S. and Canada," Ouarterly Journal of Economics, 10(February): 233-257.
LIS User Guide 1995 "User's Guide to The Luxembourg Income Study," LIS Working Paper No.7, July.
McLanahan, S. and G. Sandefur. 1994. Growing Up with a Single Parent. Cambridge: HowardUniversity Press).
Organisation for Economic Co-operation and Development (OECD). 1994. "New Orientations forSocial Policy." Social Policy Studies No. 12, Paris: OECD.
Rainwater, L. 1974. What Money Buys. New York: Basic Books.
Rainwater, L. 1990. "Poverty and Equivalence as Social Constructions," LIS Working Paper No 91.
BEST COPY AVAILABLE41
Ra:nw .rer. L and T . -Le Ec-onomiciue des Enfants Une Pers-,.-ectiveC0717.
Sen.:\ Camb7-..de ard Uni...ersitv Press
-smeeding. T :902 "L. S and Income Se.7.: :n a Cross-National Perspective The Waron Po% ert; W'na: Worked Cha:lenge. January "February 16-23
Smeeding. T . editor 10,95 Chiuren Rich Countries Syracuse. \Y. Syracuse Universityand Russel: Sage Foundation. mimeo
Smeeding and Torrey 19SS -Poor Children in Rich Countries.- Science. Vol. 242: 873-877
Smeeding, T.. L. Rainwater. and NI. O'Higgins, editors. 1990. Poverty. Inequality and IncomeDistribution in ComDaranve Perspective: The Luxembourg Income Study. London:Han-ester Wheatsheaf. and Washington, DC: Urban Institute Press..
Smeeding. T et a: 1993 "Noncash Income. Living Standards and Inequality: Evidence from theLuxernbouru Income Study.- Review of Income and Wealth, September: 229-256.
Smeeding. T . S. Danziger. and L. Rainwater. 1995. "The Western Welfare State in the 1990s:Toward a New Mod& of Anti-Poverty Policy for Families and Children.- LIS WorkingPaper =125 Luxem..: ourg Income Study, Luxembourg.
Summers, R. and A Hestcn 1991. "The Renn World Table (Mark 5): An Expanded Set ofInternational Comoa:-.sons, 1950-1989,- Quarterly Journal of Economics, May: 327-368
Townsend. P 197;. Pover:-. in the United Kingdom Harmendsworth: Penguin Books.
U.S. Bureau of the Census. 1;95. -Income Poverty and the Valuation of Noncash Benefits: 1993,"Current Population Reports, Series P-60, No. 188. Washington, DC: U.S. GovernmentPrinting Office, February.
Yim, R., I. Garfinkel, and D Meyer. 1994. "Interaction Effects of a Child Tax Credit, NationalHealth Insurance. and Assured Child Support." Institute for Research on Poverty DiscussionPaper =1047-94 Madison University of Wisconsin
jEST nOPY AVAILABLE
4 144
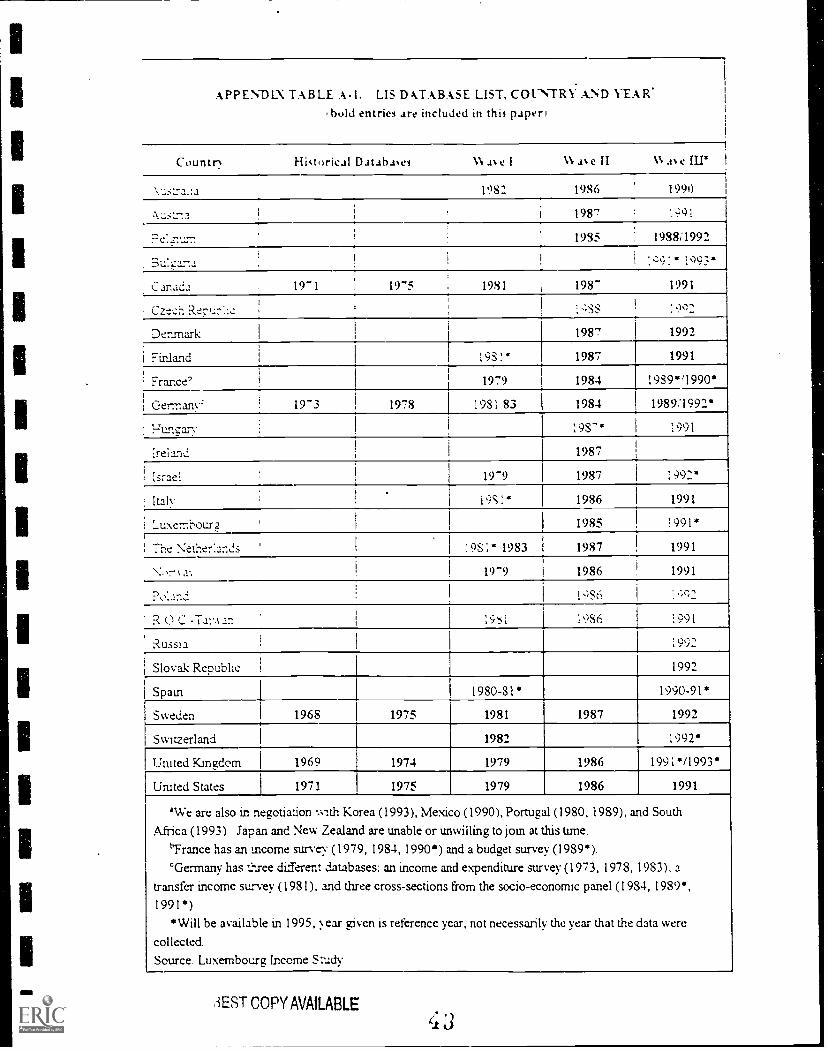
APPENDLN TABLE A-1. LIS DATABASE LIST. COUNTRN7AND YEAR'.bold entries are included in this paperl
Countr% Hktorical Databases N.% a% e II N as e nr
1986 1994)
1987
F'el.inurn 1985 1988;1992
I :901.* 1993*
Car.ada 19-1 19-5 1981 198- 1991
Czech
Denmark 1987 1992
Finland 19S1 1987 1991
FranceJ
1979 1984 1959*'1990*
Germany' 19-3 1978 1981 83 1984 19891992*
1-1.unga.r... :98' 1991
1reian,1 1987
Israel 19-9 1987
' Italy 198:* 1986 1991
i Luxembourg ' 1985 1991*
! The Netherlands ' : 98 : 1983 1987 1991
19-9 1986 1991
198.6 l :2
R 0 C -Tx:A an 19NI 1986 1991
Russia :99'
Slovak Repubhc 1992
Spain 1980-81* 1990-91*
Sweden 1968 1975 1981 1987 1992
Switzerland 1982 1992*
uiuted Kingdom 1969 1974 1979 1986 1991*11993*
United States 1971 1975 1979 1986 1991
'We are also in negotiation Y.-..th Korea (1993), Mexico (1990), Portugal (1980,1989), and South
Africa (1993) Japan and New Zealand are unable or unwilling to join at this time.LTrance has an income survey (1979,1984,1990*) and a budget survey (1989*).'Germany has three different databases: an income and expenditure survey (1973,1978,1983), a
transfer income survey (1981). and three cross-sections from the socio-economic panel (1984,1989*,1991")
Will be available in 1995, year given is reference year, not necessarily the year that the data were
collected.
Source. Luxembourg Income Study
iES-f* COPY AVAILABLE
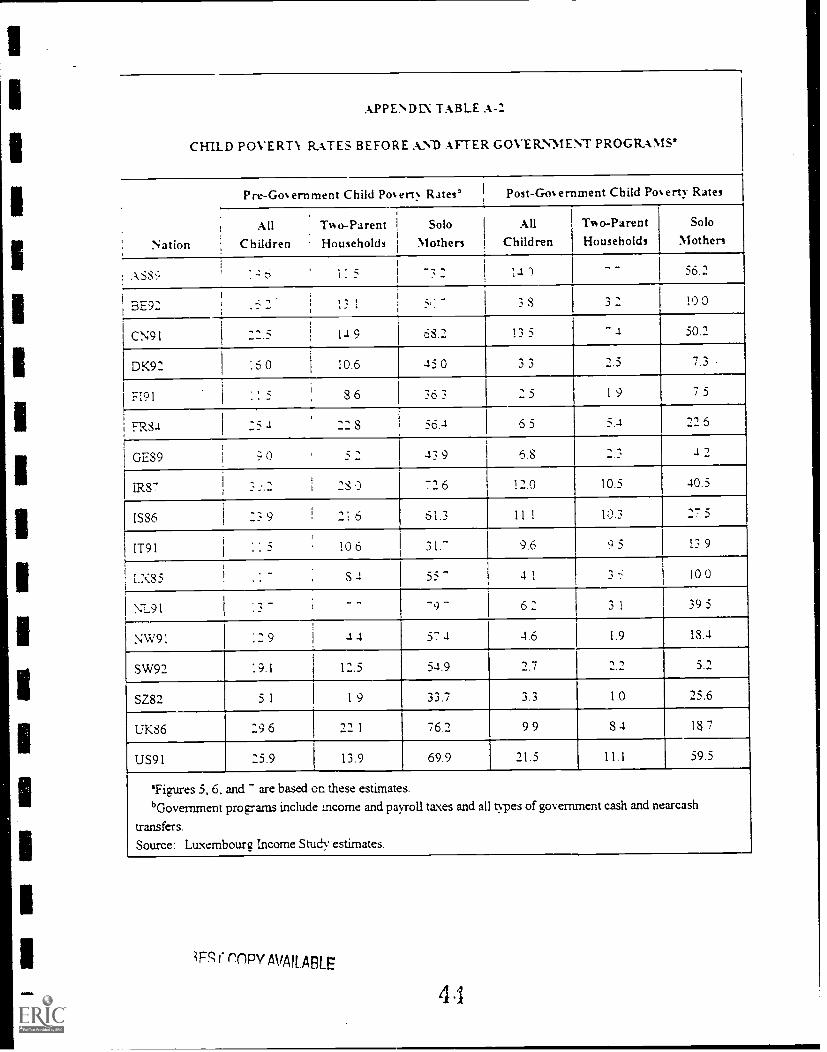
APPENDLX TABLE A-2
CHILD POVERTY RATES BEFORE AND AFTER GOVERNMENT PROGRAMS'
Nation
Pre-Goernment Child Poert Rates Post-Gosernment Child Poerty Rates
All Two-Parent Solo All
Children Households Mothers ChildrenTwo-Parent Solo
Households Mothers
. ASS9 : 6 1: 5_
., _ 14 ')- 56.2
BE92 -;.
-_ _ 13 1 5!: 3 8 3 2 10 0
CN91 :2.5 14 9 68.2 13 i._
.i. 50.2
DK92 I :5 0 10.6 45 0 3 3 2.5 7.3
F191 1 , ;!
8 6 36 3 2 5 1 9 7 5
1
FR84 I :5 4 :2 8 56.4 6 5 5.4 22 5
_ _GE89 ;9 0 - 43 9 6.8 2.3 4 1
:
28 0 72 6 12.0 10.5 40.5
IS86 1 :3 9 ! " 6 61.3 11 1 10.3 :7 3
IT91 .;
. _ 10 6 31.- 9.6 9 5 13 9
1.X85 . 8 4 55 4 1 3 -.' 10 0
N1911 . =
_ -9 6 2 3 1 39.5
NW91 : 2 9 -I 4 57 a 4.6 1.9 18.4
SW92 :9.1 12.3 54.9 2.7 _1 ._, 5.2
SZ82 5 1 1 9 33.7 3.3 1.0 25.6
1.51(86 29 6 22 1 76.2 9 9 8 4 18 7
US91 25.9 1 13.9 69.9 21.5 11.1 59.5
'Figures 5, 6, and are based on these estimates.
bGovernment progams include income and payroll taxes and all types of government cash and nearcash
transfers.Source: Luxembourg Income Study estimates.
IFS I* mpy AVAILABLE
4,1

ME LUXEMBOURG INCOME STUDYWORKING PAPERS
la partial list of those most recently available)
102. 'Cornbinin2 Consis.,.-27icy With Simplicity When Estimating. Tax Incidence: AlternativeAssumptions arid Fir.j.ings for Three Countries," by Clive Bell and Christoph B. Rosenberg,September 1993.
103. "International Perspectives on Income Support for Families with Children," by Shelly A. Phipps,September 1993.
104. "Three Worlds of Old-Age Support Decornmodification: A Comparative Analysis of Old-AgeSupport and Inequality." by Brian A. Gran, October 1993.
105. "Old Age Poverty in Selected Countries of the European Community Are WomenDisproportional ly Affected?", by Heinz &apt*, February 1994.
106. "An International Comparison of Married Women's Labor Supply," by Christin Knudsen and H.Elizabeth Peters, January 1994.
107. "Retirement and Growing Old: Which Model of Protection?", by Berhard Delhausse, SergioPerelrnan, and Pierre Pestieau, March 1994.
108. "Poverty and Labor Malket Change: Canada in Comparative Perspective," by Shelley A. Phipps,April 1994.
109. "The Welfare State alid Inequality: Still No Answers to the Big Questions," by Axel WestPedersen, March 1994
110. "Income Inequality Decomposition by Incor Source and the Breakdown of InequalityDifferences Between Two Population Subgroups," by Yves Fluckiger and Jacques Silber, May
1994.
111. "The Differential Impact of the Global Economy on Men and Women Employed in SelectedIndustrial Sectors Which Experience High Levels of International Competition: A Cross-NationalComparison," by Russell L. Long, May 1994.
112. "The Gender Poverty Gap: What Can We Learn From Other Countries?" by Lynee M. Casper,Sara S. McLanahan, and Irwin Garfinkel, June 1994.
113. "A Cross-National Analysis of the Wages of Part-Time Workers: Evidence from the UnitedStates, United Kingdom, Canada and Australia" by Janet C. Gornick and Jerry A. Jacobs, June1994.
114. "Family Poverty and the Labour Market - An International Comparison of Labour MarketParticipation and Working Time Arrangements Based on Analysis of Micordata from theLuxembourg Income Saidy" by Michael F. Förster, July 1994.
115. "The American Family in 1990: Growing Diversity and Inequality" by Sara McLanahan andLynne Casper, July 1994.
116. "A Cross-National Comparison of Education and Earnings" by Inge O'Connor, July 1994.
,:)EST COPY AVMLABLE

117. "Relative Inequality and Poverty in Germany and the United States Using AlternativeEquivalence Scales" by Richard Burkhauser. Timothy Smeeding, and Joachim Merz, November1994.
118. "Changes in the Structure of Family Income Inequality in the United States and OtherIndusuialized Nations during the 1980s' by McKinley Blackburn and David Bloom, November1994.
119. "Finnish Poverty A Cross-National Comparison by Veli-Matti Ritakallio, December 1994.
120. "Income Distribution in Advanced Economies: The Evidence from the Luxembourg IncomeStudy" by Anthony Atkinson. Lee Rainwater, and Timothy Srneeding, May, 1995.
121. "Income Distribution in European Countries" by Anthony Atkinson, Lee Rainwater, and TimothySmeedine, May. 1995.
112. "The Distribution of Welfare: Inequality, Earnings Capacity, and Household Production in aComparative Perspective" by Peter Saunders, Inge O'Connor, and Timothy Smeeding, December1994.
123. "Immigrants and the Distribution of Income: National and International Comparisons," by PeterSaunders, December 1994.
124. "Lorenz and Stochastic Dominence Comparisons of European Income Distributions" by John A.Bishop, John P. Formby. and Ryoichi Sakano, January 1995.
125. "Working But Poor: A Reassessment," by B. Delhausse, July 1995.
126. "Cross-National Comparisons of Levels and Trends in Inequality," by Peter Gottschalk andTimothy Smeeding, July 1995.
127. "Doing Poorly: The Real Income of American Children in a Comparative Perspective," by LeeRainwater and Timothy M. Smeedin2, August 1995.
128. -The Western Welfare State in the 1990's," by Timothy M. Smeeding, Sheldon Danziger, andLee Rainwater, August 1995.
129. "Incomes in East-Central Europe: Distributions, Patterns and Perceptions," by Jiff Ve6erna,September, 1995.
130. "Growth, Inequality and Social Institutions," by Andrea Brandolini and Nicola Rossi, September,1995.
131. "The Economic Well-Being of Never-and Ever-Married Single Mother Families: A Cross-National Comparison," by Ann Nichols-Casebolt and Judy Krysik, September, 1995.
132. "Rowing Between Scylla and Charybdis: Income Transitions in Central European Households,"by Barbara Boyle Torrey, Timothy M. Smeeding, and Debra Bailey, October, 1995.
133. "Income Distribution in Europe and the United States," by Anthony B. Atkinson, October, 1995.
134. "Gender Wage Differentials: New Cross-Country Evidence," by T. Callan and S. Adams,October, 1995.
The basic charge per paper is $5.00 or 150 Belgian francs for each working paper which includescopying, mailing and handling costs.
46
Related Documents