DOCUMENT RESUME ED 357 425 EA 024 808 TITLE Indonesia: Microcomputer Applications for Education Planning and Management: A Modular Training Program. Module I-IV. INSTITUTION Florida State Univ., Tallahassee. Learning Systems Inst.; Improving the Efficiency of Educational Systems Consortium. SPONS AGENCY Agency for International Development (IDCA), Washington, DC. Bureau for Research and Development.; Ministry of Education and Culture (Indonesia). PUB DATE [921 NOTE 228p. PUB TYPE Guides Non-Classroom Use (055) EDRS PRICE MF01/PC10 Plus Postage. DESCRIPTORS Educational Administration; Educational Planning; Elementary Secondary Education; Foreign Countries; *Information Management; *Information Systems; Information Utilization; *Management Information Systems; *Microcomputers; *Training Methods IDENTIFIERS *Indonesia ABSTRACT This program contains four training modules on the development and use of the education management information system. It is designed primarily for planners and administrators at the provincial level in Indonesia, who are responsible for collecting, processing, and analyzing statistics for educational planning and management. The purpose of the program is to facilitate the use of microcomputers to increase the speed of access, flexibility, and versatility of this information. The training modules cover the basic framework of an integrated management information system, demonstrate setting up and using a system, show how interactive models can be developed on microcomputers, and illustrate how computer systems can be modified to cope with changes using readily-available, user-friendly software. Modules I-IV cover basic concepts and computer applications to educational planning management, development of the educational management information system, use of the management informai:on system for management concrol, and use of the management information system for education planning. OPT) *********************************************************************** Reproductions supplied by EDRS are the best that can be made from the original document. ***********************************************************************

Welcome message from author
This document is posted to help you gain knowledge. Please leave a comment to let me know what you think about it! Share it to your friends and learn new things together.
Transcript
DOCUMENT RESUME
ED 357 425 EA 024 808
TITLE Indonesia: Microcomputer Applications for EducationPlanning and Management: A Modular Training Program.Module I-IV.
INSTITUTION Florida State Univ., Tallahassee. Learning SystemsInst.; Improving the Efficiency of EducationalSystems Consortium.
SPONS AGENCY Agency for International Development (IDCA),Washington, DC. Bureau for Research and Development.;Ministry of Education and Culture (Indonesia).
PUB DATE [921
NOTE 228p.PUB TYPE Guides Non-Classroom Use (055)
EDRS PRICE MF01/PC10 Plus Postage.DESCRIPTORS Educational Administration; Educational Planning;
Elementary Secondary Education; Foreign Countries;*Information Management; *Information Systems;Information Utilization; *Management InformationSystems; *Microcomputers; *Training Methods
IDENTIFIERS *Indonesia
ABSTRACT
This program contains four training modules on thedevelopment and use of the education management information system.It is designed primarily for planners and administrators at theprovincial level in Indonesia, who are responsible for collecting,processing, and analyzing statistics for educational planning andmanagement. The purpose of the program is to facilitate the use ofmicrocomputers to increase the speed of access, flexibility, andversatility of this information. The training modules cover the basicframework of an integrated management information system, demonstratesetting up and using a system, show how interactive models can bedeveloped on microcomputers, and illustrate how computer systems canbe modified to cope with changes using readily-available,user-friendly software. Modules I-IV cover basic concepts andcomputer applications to educational planning management, developmentof the educational management information system, use of themanagement informai:on system for management concrol, and use of themanagement information system for education planning. OPT)
***********************************************************************Reproductions supplied by EDRS are the best that can be made
from the original document.***********************************************************************

rs. .40 444).**
EDUCATIONAL POLICY AND
PLANNING PROJECT
Pusat Informatika
rti Balitbang Dikbud
ok%0DUARTMEN PENDIDIKAN
'k DAN KEBUDAYAANtk)
A GOVERNMENT OF INDONERA USAID PROJECT
INDONESIAMicrocomputer Applicationsfor Education Planning andManagement A ModularTraining Program
MODULES I - IV
U.S. DEPARTMENT OF EDUCATIONOffice of Educational Research and Improvement
EDUCATIONAL RESOURCES INFORMATIONCENTER (ERIC)
: This document has been reproduced asreceived from the person or orgemzationoriginating it
C Minor changes have bean made to improvereproduction quality
Points of view or opinions slated in this docu-ment do not necessarily represent officialOERI position or policy
Center for Infomiatics
Office of Educational and Cultural Research and Development
MINISTRY OF EDUCATION
AND CULTURE
Jakarta, Indonesia
2

EDUCATIONAL POLICY AND
Pusat Infoimatika
Balitbang Dikbud
DEPARTMEN PENDIDIKAN
DAN KEBUDAYAAN
PLANNING PROJECTA GOVERNMENT OF INDONESIA - USA1D PROTECT
INDONESIAMicrocomputer Applicationsfor Education Planning andManagement: A ModularTraining Program
MODULE IBasic Concepts and Computer
Applications to Educational
Planning and Management
Center for Informatics
Office of Educational and Cultural Research and Development
MINISTRY OF EDUCATION
AND CULTURE
Jakarta, Indonesia
3

Pusat Informatikl
13alitbang Dikbud
EDUCATIONAL POLICY AND
PLANNING PROJECT
DEPART EN PENDIDIKAN
DAN KEBUDAYAAN
A. GOVERNMENT OF INDONESIA - USAID PROJECT
INDONESIAMicrocomputer Applicationsfor Education Planning andManagement A ModularTraining Program
MODULE IBasic Concepts and Computer
Applications to Educational
Planning and Management
-1111111
Center for Informatics
Office of Educational and Cultural Research and Development
MINISTRY OF EDUCATION
AND CULTURE
Jakarta, Indonesia
4
PREFACE
The Educational Policy and Planning (EPP) Project is a seven year project conductedjointly by the Indonesia Ministry of Education (MOEC) and the United States Agencyfor International Development (USAID). The overall project objective is to improve thequality of education in Indonesia by assisting the MOEC, through the Office ofEducational and Cultural Research and Development (Balitbang Dikbud), to formulatebetter policies and long-term plars. The project aims to improve policy formulation andlong-term planning by improving the timeliness, relevance and accuracy of educationaldata collection, the subsequent analyses of such data, and theirultimate use for policy anddecisionmaking.
There are three major components of the EPP Project: (1) development of anintegrated managerient informations system (MIS) within the MOEC, (2) enhancementof MOEC policy research and analysis capacity, and (3) support for MOEC institutionaldevelopment at the national and provincial level through training and technical assis-tance. EPP technical advisory staff work closely with counterpart Indonesian staff as partof a collaborative process of developing institutional capacity.
Dr. BoedionoHead, Center for Informatics
Office of Educational and Cultural Research and DevelopmentDepartment of Education and Culture
Republic of Indonesia
The EPP Project in collaboration with the USAID Improving the Efficiency ofEducational Systems (TEES) Project, publishes EPP documents in order to disseminatethis knowledge and extend its usefulness. EPP has carried out a series of policy studiesdesigned to provide answers to key questions facing Indonesian educators. Theseinclude:
The Quality of Basic EducationThe Quality and Efficiency of Vocational/Technical EducationThe Strengthening of Local Education CapacityDeveloping Indicators of Educational EfficiencyTeacher Education IssuesCurriculum Reform and Textbook ProductionEducation, Economic, and Social Development
This series has been planned under the direction of Moegiadi, Balitbang Dikbud, andBoediono, Center for Informatics, Balitbang Dikbud and Simon Ju, EPP Chief of Party.
Editors for the series are Abas Gozali, Reta Hendrati Dewi, Center for Informatics,40 and Jerry Messec, TEES, Florida State University.
5
INTRODUCTION TO EPP TRAINING MODULES ON THEDEVELOPMENT & USE OF MIS ON MICROCOMPUTERS
1.0 PULIMSZI
1.1 These training modules on the development and use of the education management informationsystem are primarily designed for planners and administrators at the provincial level, who are responsiblefor collecting, processing and analyzing statistics for educational ,:lsiming and management. The mainfeature of the modules is the use of microcomputers to enhance the speed, flexibility, and versatility inthe use of information.
1.2 The purposes of the modules are as follows:
To introduce to the participants the basic framework of an integrated education managementinformation system which could w !tied to serve the varied needs of different users;
To demonstrate how such a system could be set up, making use of microcomputers, and howdata could be retrieved for analytical purposes;
To show how an interactive models) for diagnostic, forecasting, planning and budgetingpurposes could be developed on microcomputers; and
To show, as well, how the computer system and the models could easily be modified to copewith unforeseen changes in requirements, with the help of user-friendly software packagesabundantly available on the market.
2.0 The Hierarchies of Infonnatim
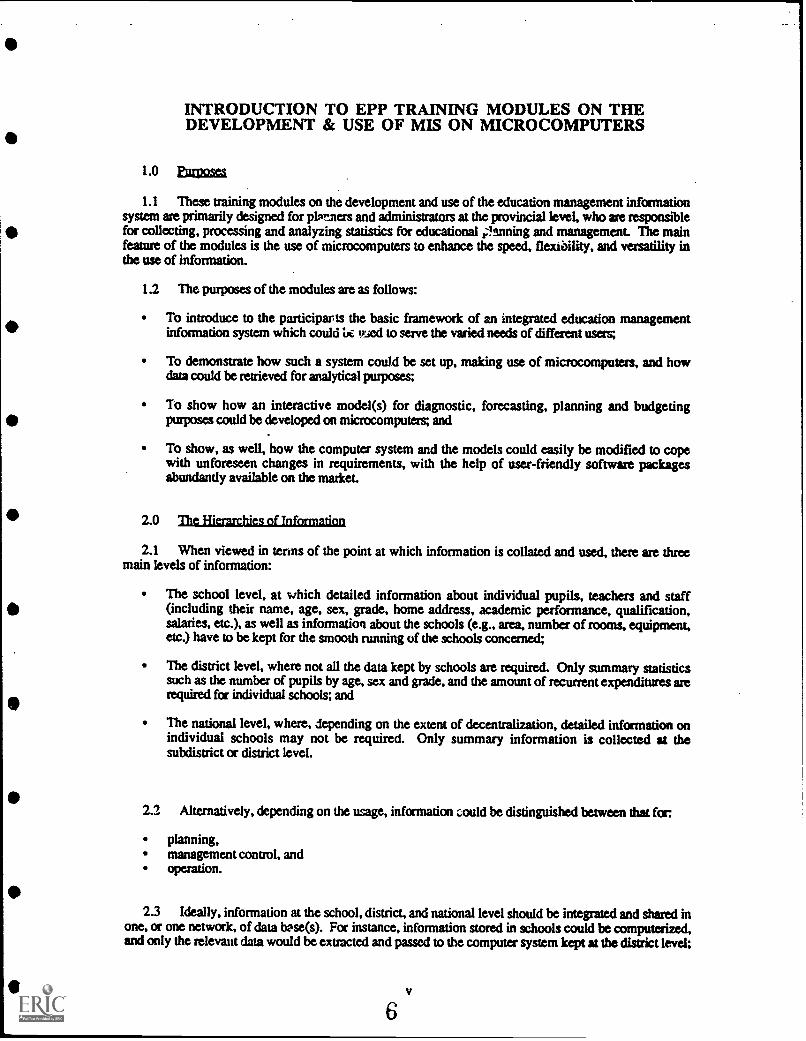
2.1 When viewed in terms of the point at which information is collated and used, there are threemain levels of information:
The school level, at which detailed information about individual pupils, teachers and staff(including their name, age, sex, grade, home address, academic performance, qualification,salaries, etc.), as well as information about the schools (e.g., area, number of rooms, equipment,etc.) have to be kept for the smooth running of the schools concerned;
The district level, where not all the data kept by schools are required. Only summary statisticssuch as the number of pupils by age, sex and grade, and the amount of recurrent expenditures arerequired for individual schools; and
The national level, where, depending on the extent of decentralization, detailed information onindividual schools may not be required. Only summary information is collected at thesubdistrict or district level.
2.2 Alternatively, depending on the usage, information could be distinguished between that for
planning,management control, andoperation.
2.3 Ideally, information at the school, district, and national level should be integrated and shared inone, or one network, of data base(s). For instance, information stored in schools could be computerized,and only the relevant data would be extracted and passed to the computer system kept at the district level;
6

and the similar procedure could apply to the flow of information between the district and national level.This could help avoid a lot of duplication of work, and solve the problems of quality of data and the timelag in producing the information. With the use of individualized data bases, more accurate informationcould be made available about pupil and teacher flow, which is extremely useful in planning schoollocation, and teacher demand and supply. The individualized data base could also reduce considerably thedata problems confronting educational researchers, especially those engaged in longitudinal studies.
2.4 Similarly, the same can be said of information for planning, management control andoperation. For instance, a simple ledger accounting system, if carefully designed and computerized,could provide a wealth of information useful in monitoring spending, analyzing cost structure andefficiency, as well as for forecasting and planning educational expenditures.
2.5 For the purpose of the present training modules, it is not proposed to cover the entirespectrum of the information system as discussed above, which would be clearly beyond the scope of thistraining program. Attention will mainly be focused on the following:
The flow of information from schools to the provincial and central offices via the usual channelof school surveys conducted by the Balitbang; and
The use of such information for planning and administrative purposes at the central as well asprovincial level.
Once the participants have mastered the basic principles and techniques discussed in this trainingprogram, they should have relztively little difficulties to applying them to different informationenvironments in their daily work.
3.0 SklialllUtlifactilk.Milddll
3.1 There will be four modules in this training program, which are as follows:
Module I: Overview of basic concepts and computer applications in educational pinning,management, and research;
Module II: The develoaxnent of the Education Management Information System;
Module III: The use of the Education Management Information System for manavmentcontrol; and
Module N: The use of the Education Management Information System for planning.
4.0 The Structure of Instructional/Learning Process
4.1 Much of the emphasis placed in this training program is the use of microcomputers andsoftware packages. Although data base and spreadsheet programs for data files creation and manipulationand modeling have already been designed for the participants, they inevitably have to understand andpractice the techniques in the use of microcomputers and software packages. With the availability ofmany user-friendly software packages and utility programs, computer programming could be Lot to aminimum. It is also the aim of this training module to show to the participants that understanditig thebasic principles and operating system of the various software packages would be sufficient to eniblethem make full use of the information available to them for planning, management and research. orthose participants who have a keen interest in computer programming and in mastering the softwarepackage, this training module will prepare them for further improving their computer skills bypracticing the techniques demonstrated in this program.
vi

4.2 It is recognized that the design of a management information system should be largely useroriented. It should start by looking at the potential uses of information rather than for the collection ofinformation per se. However, it would be deceptive to assume that all potential uses of informationcould be foreseen at the time a management information system is constructed. Furthermore, therequirements and practices in educational planning and management in Indonesia vr_ry considerably fromprovince to province. Thus, it is almost impracticable to include the specific requirements of each andevery province in designing the training modules.
4.3 Naturally, participants to the training program would come from different divisions of theprovincial education offices. Some of them may mainly be concerned with say planning and budgeting,while others in the supervision of schools or other management functions. Some may be involved onlyin data collection. Consequently, not all parts of the traini.sg program would be of equal interest to theparticipants.
4.4 Taking into account the above considerations, the approach adopted in the design of thetraining materials is as follows:
APPLICABILITY is emphasized in the training program. Wherever possible, practical sessionson microcomputer applications are included in the modules an that the participants can have"hands-on" experience in the course. They will also be invited to try to include some of theirdaily planning, management and research tasks into the practical sessions, making use of someof the techniques and methods discussed in the training program;
FLEXIMLITY will be introduced in the design of the training materials an that alternate designsand applications of the management information system will be tested during the practicalsessions, making full use of the versatility and flexibility of a computerized data base and thecomputer software packages; and
a MODULAR approach will be adopted in the course so that each module is as self-contained aspossible.
4.5 The structure of the instructional and learning activities for each of the four modules will thusbe arranged as follows:
Overall Objectives of each of the modules will first be stated so that instructors are aware of thewhile purpose of the module as well as the knowledge which is expected to be imparted duringthe instructional and learning processes;
Module Performance Objectives will also be stated to enable the instructors to assess the extentto which the behavior of learners would be changed upon completion of the module. Morespecific performance objectives will also be given for different instructional units within amodule;
The actual instructional and learning processes are divided into four phases as follows:
Instructional activities where the instructors will present to the learners the teachingmaterials for the module and unit concerned. The teaching materials will cover the basicconceptual issues related to the topic in question, and fundamentals of computer applicationsthat will be demonstrated, highlighting strengths and weaknesses of such applications;
User manual where the instructors will carry on with the presentation, but usingmicrocomputers to demonstrate the various applications in planning, management, andresearch. The detailed step-by-step procedures required to be followed in developing andusing the different computer applications will be described in this user manual section.Therefore, this section is designed for both the instructors and the learners;

Laving activities where the interaction between the instructors and learners will take place.The learners will be asked to:
practice the techniques in developing and using the data bases or models demonstratedby the instructors;
then the participants will be divided into your A) discuss the concepts, approaches andmethods used in the training materials. During the group discussion, they will beasked to suggest alternative approaches to the development and use of the managementinformation system;
based on the alternative designs suggested, the learners will, under the guidance of theinstructc.-s, actually develop a new management information system and differentmodels of computer applications;
Post-assessment where the instructors will attempt to evaluate the extent to which thelearners have been able to have a firm grasp of the contents of the training materials. Anumber of questions and assessments have been proposed in the unit, and individual learnerswill be asked to do the assignments themselves.
5.0 Choice of
5.1 With the rapid development in computer technology, it is difficult to choose softwarepackages which are both the most up- to-date and are familiar to both instructors and learners. Therefore,the factors used in choosing a computer software are the power of the software, the ease of WC and itsPoPulazitY-
5.2 Two types of computing functions are required for these training modules:
data base management; andspreadsheet applications.
A number of software packages have been very successful in integrating data base management withspreadsheet applications, and some statistical functions. However, these packages have limitationswhich dictate against using them in the training program. Nearly all of these packages are memory (orRAM) based, thus severely limiting the size of tire data base that could be handled by the package. Theavailability of RAM banks or boards can increase the memory capacity of a 16-bit computer hire an IBMPC/XT or compatible to something like 8 mega-bytes. However, these are not yet very popularlyused. Furthermore, most of these integrated softwares are not designed to handle relational data bases, afeature which is required in developing the management information system proposed in this trainingprogram. As a result, two separate software packages have been used in this training program, with eachperforming one of the two functions mentioned above.
5.3 A large number of data base and spreadsheet packages are available. The choice of one set ofpackages does not imply that the others available in the market are not suitable. The followingpackages are chosen for reasons given below:
DBASE III (version 1.1 or 2) has been chosen for data base management. There are other database packages which are as powerful as DBASE III, like RBASE 5000 and KNOWLEDGE 2.DBASE III is chosen mainly because it is lik.re user-friendly with its assistant facilities. Otherequally if not more powerful softwares like REVELATION and INFORMIX could be adopted inthe training program. But it appears DBASE III is more popularly used in IBM PCs or thecompatibles. In any case, the adoption of DBASE III in this training program does not precludethe participants from adapting the methodology and approach used in the training program toother data base management software, including newcomers like PARADOX (version 1.1); and
viii
9
41

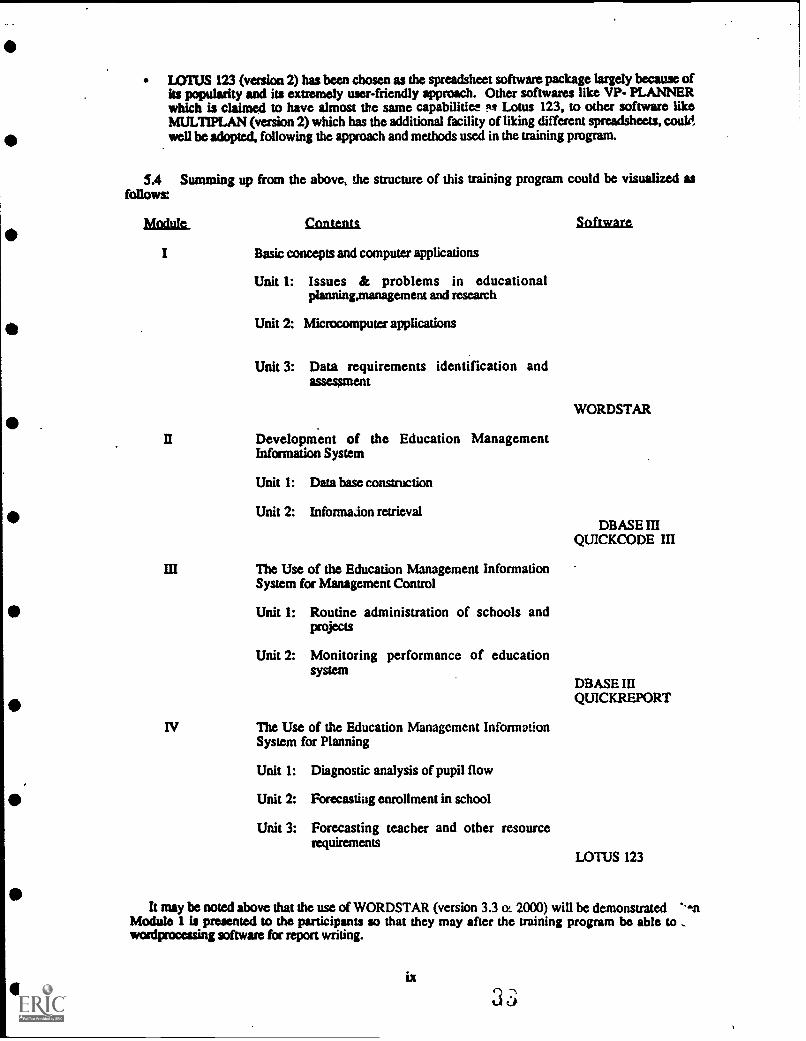
LOTUS 123 (version 2) has been chosen as the spreadsheet software package largely because ofits popularity and its extremely user-friendly approach. Other software* like VP- PLANNERwhich is claimed to have almost the same capabilities as Lotus 123, to other software likeMULTIPLAN (version 2) which has the additional facility of liking different spreadsheets, couldwell be adopted, following the approach and methods used in the training program.
5.4 Summing up from the above, the structure of this training program could be visualized asfollows:
Module, Contents. Software
I Basic concepts and computer applications
Unit 1: Issues & problems in educationalplanning,management and research
Unit 2: Microcomputer applications
Unit 3: Data requirements identification andassessment
II Development of the Education ManagementInformation System
Unit 1: Data base construction
Unit 2: Information retrieval
III The Use of the Education Management InformationSystem for Management Control
Unit 1: Routine administration of schools andProjects
Unit 2: Monitoring performance of educationsystem
IV The Use of the Education Management InformationSystem for Planning
Unit 1: Diagnostic analysis of pupil flow
Unit 2: Forecasting enrollment in school
Unit 3: Forecasting teacher and other resourcerequirements
WORDSTAR
DBASE MQUICKCODE III
DBASE IIIQUICKREPORT
LOTUS 123
It may be noted above that the use of WORDSTAR (version 3.3 or 2000) will be demonstrated whenModule 1 is presented to the participants so that they may after the training program be able to usewoniprocessing software for report writing.
ix

Table of Contents
Module I
L Introduction 11. General Module Objectives 1
2. The Organization of the Module 1
II. Unit 1: Issues and Problems in Educational Planning and Management 23. Performance Objectives 24. Instructional Activities 25. Learning Activities 4
III. Unit 2: Microcomputer Applications 56. Performance Objectives 57. Instuctional Activities 58. Learning Activities 6
IV. Unit 3: Data Requirement Identification and Assessment 79. Learning Objective 7
10. Instuctional Activities 711. Learning Activities .1312. Post-Assessment .14

0
Module I
Introduction to Basic Concepts and Computer Applicationsto Educational Planning and Management
I. Introduction
1. General Module Objectives
1.1 The purpose of this module is to present to the participantsthe basic concepts and an introductory discussion on:
(a) Some of the issues and problems in educational planning andmanagement, in as far as the availability and uses ofinformation are concerned;
(b) The potentials in the application of microcomputers ineducational planning and management;
(c) The considerations in selecting data items for inclusion intoan educational management information system, based on anassessment of the requirements of different users.
1.2 Module Performance Objectives. On completion of this module,the participants are expected to be able to:
(a) Explain the basic issues and problems confronting plannersand administrators on the use of information for planning andmanagement;
(b) List the potential applications of microcomputers ineducational planning and management;
(c) Make an assessment of the data requirements for planning andmanagement, which could be used as the basis for designing aneducation management information system.
2. The Organization of the Module
2.1 The module is organized into three units as follows:
(a) Unit 1 gives an introductory discussion on the problems andissues confronting educational planners and administrators,especially in regard to the availability and use ofinformation;
(b) Unit 2 introduces some of the potential applications ofmicrocomputers in educational planning and management;
1
ti,
(c) Unit 3 is on user-need identification and the assessmentprocess in the design of an e -lcatim management informationsystem, where the various potential uses and applications ofthe management information system will be identified. Thiswill lead to a discussion on the resulting data requirementsfor the information system.
2.2 It is hoped that this module could serve to present toparticipants an overview of what will be discussed in much greaterdetail in the subsequent modules. The discussion on the assessmentof data need will also prepare participants for Module II on theconstruction of the information system, and Modules III-IV on theapplications of the information system in planning and managementrespectively. This will enable participants to appreciate theclose interrelationship between data collection and the use ofdata collected. Furthermore, it is also hoped to underscore inthis module the flexibility and versatility that one could havein constructing a computerized data base and in the manipulationof the data, making use of software packages like DBASE III,QUICKCODE III anu LOTUS 123.
II. Unit 1: Issues and Problems in Educational Planningand Management
3. Performance Objectives
3.1 On completion of this unit, the participants should be ableto:
(a) U.derstand the difficulties of educational planners andadministrators in understanding and responding to problemsand malfunctions in the education system;
(b) Appreciate the importance of havinr, accurate, complete andtimely information for educational planning and management.
4. Instructional Activities
4.1 The main purpose of this unit is to introduce to participantshe basic concepts and key issues and problems confrontingeducational planners and administrators. It is not difficult tocraw up a list of problems and issues. However, it would be hardto make up an exhaustive list. Given the diver:Aty and complexityof the subject matter, it is clearly beyond the scope of thismodule. Therefore, the objective is to, by going through some ofthe issues and problems in educational planning and management,highlight the need of planners and administrators to understand
2
13

quickly changing circumstances and requirements in the educationsystem, and to devise remedial measures accordingly.
4.2 The Process of Planning and Management
4.2.1 The processes of educational planning and managementare very much interrelated. This is a point well understoodby nearly all planners and administrators. Planning proposesthe targets and programs for policy-making. These targetsand programs are drawn up on the basis of feedback fromexperience in management and from research findings,supplemented by the diagnostic analysis undertaken by theplanners themselves. Management places its concern on seeingthat programs are implemented as planned, and that targetsset could be met within the time horizon planned and theresources allocated. Management also has the function ofkeeping the education system under control. It is an ongoingprocess of planning, policy-making, implementation,management, and evaluation, with results of one stage leadingto another. Whr.t has to be added to this process isresearch. Diszussion on the role research activities arebeyond the scope of this training programme and are thereforenot included in this module.
4.2.2 In real life, the description presented aboverepresents an ideal which is difficult to achieve. Plans aredrawn up and implemented long before proper evaluation takesplace. Furthermore, circumstances change long before anyeducation plan is approved and implemented. This is partlydue to the long planning, budgetary and legislativeprocedure, and partly due to the fact that variablesaffecting education such as employment opportunities,available financial resources and student demand arechanging rapidly. Thus, the process of formulating plansbased on experience from implementation and the managementprocess is often unrealistic at all.
4.3 The Information Gap. One of the crucial difficulties inplanning, management and research is what may be called the"information" gap. The "gap" may include:
(a) The ignorance of educational planners and researchers aboutthe so-called "black box" process in education. Planners andeducators are far from being able to understand what ishappening in the classrooms which makes children of differentbackgrounds, aptitude, and abilities to become educated as acitizen, employable as a worker and satisfied as a consumerof the education services;
(b) The uncertainty about the future as regards the behavior ofthe pupils, parents and employers;
3

(c) The delay in getting, if any, and the lack of perfectknowledge about what is happening within the educationalsystem, and outside the school system. For example, there isa gap between what is planned in the central educationministry and what is being implemented at the regional orschool level. The delay in obtaining information which maynot be accurate at all about the relationship between theeducation sector and the labour market would placeeducational planners and administrators in a bad position todevise remedial measures.
4.4 The Challenge of Planners and Administrators
4.4.1 The challenge posed to planners and administrators isthe need to respond quickly to changing circumstances. Thismeans that planners and administrators have to be able to:
(a) Understand the problems based on accurate and timelyinformation;
(b) Assess quickly the implications of any changes in theeducation plans, the alternative solutions which areopen and the implications of-the alternative solutions.
4.4.2 The need for timely, complete and accurateinformation is especially for education systems wheremultiple actors are involved in taking policy, program,budgetary, and practical (implementation) decisions. In manycountries, planners, and policymakers are only responsiblefor setting the targets, formulating the overall educationalprogrammes and allocating the budget. The actualimplementation of the programmes could be in the hands ofadministrators at the regional levels, school heads oradministrators of educational institutions. It is thereforeessential to see that programmes are implemented and plannersand the actual experience of implementation could be fed backto the central planners and policymakers.
5. Learning Activities
5.1 This unit mainly serves as an introductory discussion leadingto Units 2 and 3, as well as the other Modules in this trainingprogramme. Therefore, the participants are expec:ed to join inthe discussion, giving real life experience they leaveencountered on the various issues and problems discussed inthis Unit. In particular, the participants are requested to:
(a) List incidents where educational plans have to be formulatedor even implemented before research results are available.Then the participants will examine what would be the
4
411
15

consequences if the research results turn out not to be whatis anticipated or assumed in the educational plans.
(b) List areas of "information gaps" and suggest means ofbreaking the "gaps."
(c) Develop an "ideal" process of policy formulation and comparethis "ideal" to a description of how educational policies arecurrently formulated in your country.
III. Unit 2: Microcomputer Applications
6. Performance Objectives
6.1 The purpose of this unit is to explore the use ofmicrocomputers in helping educational planners and administratorsin solving some of the problems highlighted in Unit 1 above. Oncompletion of this unit, the participants should be able to:
(a) Appreciate the potential of microcomputers in facilitatinginformation exchange and processing, thus overcoming some ofthe problems encountered in educational planning andmanagement;
(b) List some of the potential uses of microcomputers ineducational planning and management.
7. Instructional Activities
7.1 The Sharing of Information. In a typical organization,information flow from the operation to the management level ischaracterized by the summarizing and abstracting process wherebyinformation is selectively filtered as it is passed through theorganizational hierarchy. In an education system, the schooladministrators have detailed information about the pupils, teachersand facilities in the schools. Summary information will be passedto the educational administrators at the district level. Thesedistrict administrators normally do not have access to informationabout individual pupils, like their academic performance, theireducational life history, their socioeconomic background and theirdistrict of residence. Similarly, only sketchy information isavailable on individual teachers in schools. Usually, they do notknow the quality of teaching of teachers, what subject they teach,their teaching load, their teaching experience and the grades theyare teaching. In no way are the district administrators able toassociate characteristics of individual teachers with thecharacteristics of the pupils taught by individual teachersconcerned. In short, they do not know what is happening within a
5

school. For a more remote planner or administrator in the centralministry of education, much less information is available onindividual schools, not to mention individual teachers. Withoutaccess to such information, it is not conceivable that the centralplanners and administrators can formulate policies that areultimately meant to affect the quality of teaching and learningwithin individual schools. Similarly, the district administratorscould hardly monitor and control the performance of pupils,teachers and schools in order to enhance school/classroomeffectiveness and efficiency.
7.2 The use of microcomputers facilitate tremendously thesharing of the same information around school administrators,district and central planners, and administrators. Little effortwould be involved in transferr:ng data files from schools to thedistrict education offices and to the central ministry ofeducation, as well as providing comparative feedback onperformance to districts and schools.
7.3 Deconcentration of Planning/Administrative Functions.District administrators know the problems in their district betterthan their counterparts in the central ministry of education. Yetit is their counterparts -.,ho formulate and decide the educationalprogrammes for their districts. The concentration of planningactivities is partly due to the need to have efficiency inplanning, and patl..,y due to the fact that the districtadministrators do not have the skill and the necessary support likecomputing facilities to enable them to take over the planningtasks. With the use of microcomputers, even some of the morecomplicated forecasting and planning models could be performed onthe microcomputers installed in the district education offices.Furthermore, by using the same software developed by the centralministry of Lducation, uniformity and standards could be maintainedacross different districts.
7.4 Reduction in Planning Lead time. With the use ofmicrocomputers, the lead time required to assess the implicationsof any changes in the education policies, or of different planningalternatives is drastically reduced. This enables planners andadministrators to respond quickly to new problems and to try out alarger number of alternatives before a decision is taken.
8. Learning Activities
8.1 This is an introductory unit, the purpose of which is tosimply explore the potential uses of microcomputers in educationalplanning, management, and research, without technically discussingactual microcomputer applications which would be dealt with inModules II-IV. The participants, nevertheless, will be invited to:
6
17

(a) Comment on the potential benefits that could be derived fromthe use of microcomputers in educational planning andmanagement;
(b) List potential applications of microcomputers, first from thepoint of view of national level planners and decisionmakers,then from the perspective of provincial, district, and schoollevel planners, administrators, and practitioners.
IV. Unit 3: Data Requirement Identification and Assessment
9. Learning Objectives
9.1 The main purpose of this section is to sensitize participantsas to the close interrelationship between the use of statistics forreport, management control, and planning, and the data collectionactivities. After going through this unit, the participantsshould:
(a) have a basic grasp of the principal considerations governingthe choice of data items in a data collection activity;
(b) be able to adapt their data collection procedure to thechanging requirements of planners and administrators.
9.2 Discussion in the section will also lead logically to ModuleII on the construction of the educational management informationsystem geared to the needs of planners and administrators.
10. Instructional Activities
10.1 The Approach to be Adopted in Data Base Construction. Thedevelopment of an Education Management Information System couldfollow a "top-down" or "bottom-up" approach, each has its meritsand demerits. In this module, both approaches will be adopted:
(a) First of all, the "top-down" approach will be used in findingout the sort of tasks required to be undertaken by plannersand administrators in the central government. This will leadto an assessment of the statistical information required tohelp them perform these tasks;
(b) The data requirements will be examined again from a "bottom-up" perspective, by looking at the specific tasks required tobe performed by the provincial officials who are often thoseactually responsible for collecting the data needed by
71I 0

planners and administrators in the central government. It ishighly desirable to have a management information systemcreated at the provincial level which produces immediatebenefits to the provincial planners and administrators instreamlining their planning, management and data collectionactivities.
10.2 The Tasks of Central Planners and Administrators
10.2.1 The tasks of the central planners/administrators, asfar as the use of statistics are concerned, could be groupedinto three categories:
(a) Stocktaking:
(1) What are the inputs into the education sector, interms of:
the number of schools and places provided;the number of teachers available;school facilities, such as textbooks available;their geographic distribution;
(2) What are the outputs (or the performance) of theeducation sector, e:cpressed in terms of:
the number of children being educated;their distribution by grade;their distribution by geographic district;the number of children passing school leavingexaminations;
(b) Diagnosis:
(1) The access to and efficiency of educationprovision, which could be gauged by suchindicators as:
the school enrollment ratio;the progression rate of pupils in thedropout rates;repetition rates;
system;
(2) The utilization of resources in the educationsector such as:
the rate of utilization of school buildings;the occupancy rate of classrooms;the financial resources required, actuallyavailable, and spent by schools;
(3) The quality of education, reflected by proxyindicators like:- the average class size;- the pupil/teacher ratio;- the proportion of qualified teachers;
8

0
0
- teacher examination results;- pupil examination results;- average costs of pupils and cycle costs;
(4) The question of disparity, which could beapproached by repeating the analysis in (1)-(3)above for:- different regions or districts, as far as
regional disparity is concerned;- different types of schools, reflecting
disparity viewed from another perspective;
(c) Forecasting and Planning:
(1) the number of school leavers who will becompleting a specified level of education;
(2) the likely size of the student population based ona given set of assumptions as regards the futurepopulation size for the school-age group, rates ofprogression in the school system, etc.;
(3) the requirements for teachers, school buildingsand other inputs into the school system, and theestimated recurrent and nonrecurreat costsrequired, in meeting the prc.,jacted demand 'oreducation under different sets of policyobjectives or assumptions;
(4) the required geographical distribution ofeducational facilities (including new schoolbuildings to be constructed) in meeting givenpolicy objectives (e.g., those aimed at reducingregional disparities in educational provision).
10.2.2 The diagnostic and planning techniques ((b) & (c)above) which could be employed are described in Module IV(The use of the Education Management information System forPlanning) and Module III (The use of the Education ManagementInformation System for Management Control). In the laterpart of this Module, the types of reports that could beproduced from the data base for stocktaking purposes ((a)above) will be discussed.
10.3 The Requirements of Provincial Planners/Administrators
10.3.1 The tasks of the provincial officials will mainly beconcerned with the management of schools, including themonitoring of standards, performance, etc., of individualschools, and the distribution of physical and other resourcesallocated by the central government between schools andsubdistricts. Their tasks embrace the following:
9
4#v
(a) Reporting
(1) The compilation of the routine statistical returnswhich form the basis of data input to thestatistical system in the Ministry;
(2) The compilation of reports on the number ofpupils, number of schools, and number of teachersby type of schools and by subdistrict;
(b) MakAgemcnt Control
(1) Analysis of resource utilization and allocation atthe subdistrict level, similar to paralraph5.1(b)(2) above;
(2) The analysis of resource allocation and spendingat the school level. This includes, say, theestimation of the amount: of recurrent subsidy towhich the schools are entitled, based on prevailingunit costs or standards and information stored inthe data base on the enrollment size, number ofclasses, etc., and comparing the amount with thatactually available to the schools concerned;
(3) The production of special reports on those schoolswhose standards of operation, extent of resourceutilization and availability fall below givendistrict or national norms. Examples are:
- names and locality of schools with theirpupil/teacher ratio exceeding a given norm;
- names and locality of schools with utilizationrates higher than 50%;
names and locality of schools with the averageexpenditure per pupil smaller than a givennorm;
- examination results;
- average costs per pupil and cycle costs;
(4) Analysis of performance of the education system inthe province, as reflected by such proxyindicators as repetition rate, promotion rate, theinput/output ratio, etc. It is noted that thissort of analysis using the grade cohort survivalmethod has to be treated with caution, unless
10

additional information is available on themigration of students between provinces;
(c) Planning
(1) Results of the analysis in (a) and (b) above willgive useful indicators as to which schools orsubdistricts additional resource inputs (e.g., newclassrooms, new library books, more teachers) arerequired, and their priority in terms of need.With additional information on the existing andanticipated future distribution of the school-agepopulation, a model of school location planningcould be developed.
(2) Based on the analysis of the performance of theschool system, and with additional demographicinformation on the future size of the school-agepopulation, it is possible to project the likelydemand for school places at the provincial level,making use of the flow model adopted in (b)(3)above. The flow model can also be extended to .
estimate additional expenditures, classrooms andteachers required to cope with the anticipatedincrease in demand. Such kinds of forecasts areuseful in drawing up budget requests to thecentral government, and in planning for otherresource inputs such as teachers, library booksand other equipment, etc.
10.4 Information Items Required for the Data Base
10.4.1 This subsection examines those information itemswhich are considered to be required in helping planners andadministrators to perform the tasks mentioned in paragraph6 above. The information items required could broadly beclassified into three main categories:
(a) Pupil data,(b) Teacher data, and(c) School data.
The above information items could further be distinguishedbetween stock and flow data. For the purpose of this module,only the primary level of education is concerned. Theapproach adopted in this module could easily be adapted forjunior as well as senior secondary levels.
10.4.2 Pupil Data
(a) Stock data: The following data items (new data itemswhich are not presently collected in the regular surveys
11

of schools, proposed to be included are marked withasterisks (*)):
- school code (incorporating codes for type of schools,district of schools)
- morning, afternoon or combined session- school year- number of pupils by grade and by age- number of pupils by religion- number of operating classes by grade
(b) Flow data: The following data items are proposed:
- school code- morning or afternoon cession- school year- number of repeaters by grade and *by sex- number of grade 1 entrants by age and *by sex- *number of new entrants (other than grade 1) by sex
and by grade (This is particulaxly useful ifinterschool student mobility is significant.)
- number of grade 6 pupils entering and passing therelevant school leaving public examinations
- *number of graduates promoted by junior secondaryschools by types
10.4.3 Teacher Data. Only the stock data are proposed asstatistics on teacher mobility are difficult to collect,without having to design a rather complicated questionnairefor schools to complete. Estimation of teacher wastagescould still be done by making use of stock data over time andinformation on the number of graduates from teacher trainingcolleges. (The best method to collect information on teacherflow is to construct an individualized teacher statisticalsystem. This system could be extended to include usefulinformation on the subjects taught or could be taught byteachers, and other personnel information required forfinance and management functions. For the purpose of thismodule, it is not proposed to explore the possibility ofsetting up such a teacher data base.) The followinginformation items are proposed for the teacher file:
- school code- morning or afternoon school- school year- number of teachers
* by sexby whether public or nonpublicby academic qualificationsby type of teachers (for primary:
head, class, religion & sport)- number of nonteaching staff
12
23
El
a
a
by public or nonpublicby type (administrative, clerical, other staff)
10.4.4 School Data. Only stock data are concerned in thismodule, as flow data are usually available from sources Akethe development or capital programme. Efforts will be madeto develop a flow data file which would be useful in, say,school locational planning at the district level. Thefollowing data items are proposed for the stock data:
- name of school- address of school- school code- morning, afternoon or combined session- number of classrooms by whether owned by not
by condition (good, fair, bad)- *whether has library and number of library books- *total incomes broken down by
parental contributiongovernment subsidysubsidy from provincial /local authoritiesother contributions from societyoperating surplus from school activities
- *total recurrent expenditure broken down byteacher salariessalaries for nonteaching staffgrants to students (if applicable)other charges
- *total nonrecurrent expenditure- *estimated expenditure required to provide the
desired services, by recurrent and nonrecurrent
11. Learning Activities
11.1 Agenda for Group Discussion. The purpose of groupdiscussion is to facilitate a more in-depth discussion of therelevance of the planning and management tasks, as well as dataitems suggestei in the course. The ultimate objective is to arriveat different possible designs for the management information systemand its potential applications, so that the trainees could developusing the methodology and procedures which will be discussed inModule II.
11.2 It is advisable to divide the trainees into smaller groups inorder to enlist the active participation of each and every trainee.They will be asked to:
(a) Comment on the relevance of the tasks of the central andprovincial planners and administrators outlined in the coursecontent;
13 0

(b) Comment on the sufficiency of the data items listed in thecourse content, and the practicability of collecting thesedata in their own district;
(c) Suggest additional tasks for both the central and provincialplanners and administrators which are not covered in thecourse content;
(d) Suggest additional data items required to be collected, ifany, in order to help the planners and administrators tosatisfactorily perform the additional tasks as suggested in(c) above.
12. Post-Assessment
12.1 The purpose of these exercises is to evaluate to what extentthe participants have understood the course content outlined above,and help the trainers in deciding the pace of the discussion, ineliciting subject matters in which the trainees have keenerinterests, and points which require further elaboration.
12.2 The suggested questions for the learners to answer are asfollows:
(a) What data items are required to be collected in order toestimate the number of dropouts by grade in primary schoolsfor:
the country as a whole?a given district?
(b) In planning the number of additional primary schools requiredto be built, what are the data items which planners have totake into account? What further data items are needed tohelp planners decide the location of these additionalschools?
(c) Suppose you are given the task of preparing a planningproposal for the introduction of an inservice teachertraining programme, what data items would you need in:
your argument for the desirability of and possibly theurgency in implementing a programme of inservice teachertraining?
your estimation of the likely demand for the training?
14

EDUCATIONAL POLICY AND
Pusat Informatika
Balitbang Dikbud
DEPARTMEN PENDIDIKAN
DAN KEBUDAYAAN
INDONESIAMicrocomputer Applicationsfor Education Planning andManagement: A ModularTraining Program
MODULE IIDevelopment of the
Educational Management
Information System
Center for Informatics
Office of Educational and Cultural Research and Development
MINISTRY OF EDUCATION
AND CULTURE
Jakarta, Indonesia

EDUCATIONAL POLICY AND
PLANNING PROJECT
Pusat Informaiika
Balitbang Dikbud
DEPARTMENT PENDIDIKAN
DAN KEBUDAYAAN
A GOVERNMENT OF INDONESIA - USK) PROJECT
INDONESIAMicrocomputer Applicationsfor Education Planning andManagement: A ModularTraining Prograi.i
MODULE IIDevelopment of the
Educational Management
Information System
Center for Informatics
Office of Educational and Cultural Research and Development
MINISTRY OF EDUCATION
AND CULTURE
Jakarta, Indonesia
2 7

PREFACE
The Educational Policy and Planning (EPP) Project is a seven year project conductedjointly by the Indonesia Ministry of Education (MOEC) and the United States Agencyfor International Development (USAID). The overall project objective is to improve thequality of education in Indonesia by assisting the MOEC, through the Office ofEducational and Cultural Research and Development (Balitbang Dikbud), to formulatebetter policies and long-term plans. The project aims to improve policy formulation andlong-term planning by improving the timeliness, relevance and accuracy of educationaldata collection, the subsequent analyses of such data, and theirultimate use for policy anddecisionmaking.
There are three major components of the EPP Project: (1) development of anintegrated management informations system (MIS) within the MOEC, (2) enhancementof MOEC policy research and analysis capacity, and (3) support for MOEC institutionaldevelopment at the national and provincial level through training and technical assis-tance. EPP technical advisory staff work closely with counterpart Indonesian staff as partof a collaborative process of developing institutional capacity.
Dr_ BoedionoHead, Center for Informatics
Office of Educational and Cultural Research and DevelopmentDepartment of Education and Culture
Republic of Indonesia
The EPP Project in collaboration with the USAID Improving the Efficiency ofEducational Systems (TEES) Project, publishes EPP documents in order to disseminatethis knowledge and extend its usefulness. EPP has carried out a series of policy studiesdesigned to provide answers to key questions facing Indonesian educators. Theseinclude:
The Quality of Basic EducationThe Quality and Efficiency of VocationallFechnical EducationThe Strengthening of Local Education CapacityDeveloping Indicators of Educational EfficiencyTeacher Education IssuesCurriculum Reform and Textbook ProductionEducation, Economic, and Social Development
This series has been planned under the direction of Moegiadi, Balitbang Dikbud, andBoediono, Center for Informatics, Balitbang Dikbud and Simon Ju, EPP Chief of Party.
Editors for the series are Abas Gozali, Reta Hendrati Dewi, Center for Informatics,and Jerry Messec, IEES, Florida State University.
0 Th4, 23

INTRODUCTION TO EPP TRAINING MODULES ON THEDEVELOPMENT & USE OF MIS ON MICROCOMPUTERS
1.0 Expo=
1.1 These training modules on the development and use of the education management informationsystem are primarily designed for planners and administrators at the provincial level, who are responsitfor collecting, processing and analyzing statistics for educational planning and management. The mainfeature of the modules is the use of microcomputers to enhance the speed, flexibility, and versatility inthe use of information.
1.2 The purposes of the modules are as follows:
To introduce to the participants the basic framework of an integrated education managementinformation system which could be used to serve the varied needs of different users;
To demonstrate how such a system could be set up, making use of microcomputers, and howdata could be retrieved for analytical purposes;
To show how an interactive model(s) for diagnostic, forecasting, planning and budgetingpurposes could be developed on microcomputers: and
To show, as well, how the coi.lputer syitein and the models could easily be modified to copewith unforeseen changes in requirements, with the help of user-friendly software packagesabundantly available on the market.
2.0 The Hierarchies of information
2.1 When viewed in terms of the point at which information is collated and used, there are threemain levels of information:
The school level, at which detailed information about individual pupils, teachers and staff(including their name, age, sex, grade, home address, academic performance, qualification,salaries, etc.), as well as information about the schools (e.g., area, number of rooms, equipment,etc.) have to be kept for the smooth running of the schools concerned;
The district level, where not all the data kept by schools are required. Only summary statisticssuch as the number of pupils by age, sex and grade, and the amount of recurrent expenditures arerequired for individual schools; and
The national level, where, depending on the extent of decentralization, detailed information onindividual schools may not be required. Only summary information is collected at thesubdistrict or district level.
2.2 Alternatively, depending on the usage, information could be distinguished between that for:
planning,management control, andoperation.
2.3 Ideally, information at the school, district, and national level should be integrated and shared inone, or one network, of data base(s). For instance, information stored in schools could be computerized,and only the relevant data would be extracted and passed to the computer system kept at the district level;
2J

and the similar procedure could apply to the flow of information between the district and national level.This could help avoid a lot of duplication of work, and solve the problems of quality of data and the timelag in producing the information. With the use of individualized data bases, more accurate informationcould be made available about pupil and teacher flow, which is extremely useful inplanning schoollocation, and teacher demand and supply. The individualized data base could also reduce considerably thedata problems confronting educational reseturhers, especially those engaged in longitudinal studies.
2.4 Similarly, the same can be said of information for planning, management control andoperation. For instance, a simple ledger accounting system, if carefully designed and computerized,could provide a wealth of information useful in monitoring spending, analyzing cost structure andefficiency, as well as for forecasting and planning educational expenditures.
2.5 For the purpose of the present training modules, it is not proposed to cover the entirespectrum of the information system as discussed above, which would be clearly beyond the scope of thistraining program. Attention will mainly be focused on the following:
The flow of information from schools to the provincial and central offices via the usual channelof school surveys conducted by the Balitbang; and
The use of such information for planning and administrative purposes at the central as well asprovincial level.
Once the participants have mastered the basic principles and techniques discussed in this trainingprogram, they should have relatively little difficulties to applying them to different informationenvironments in their daily work
3.0 Organization of the Modulea
3.1 There will be four modules in this training program, which are as follows:
Module I: Overview of basic concepts and computer applications in educational planning,management, and research;
Module 11: The development of the Education Management Information System;
Module III: The use of the Education Management Information System for managementcontrol; and
Module IV: The use of the Education Management Information System for planning.
4.0 The Structure of InstructionaVLearning Procesa
4.1 Much of the emphasis placed in this training program is the use of microcomputers andsoftware packages. Although data base and spreadsheet programs for data files creation and manipulationand modeling have already been designed for the participants, they inevitably have to understand andpractice the techniques in the use of microcomputers and software packages. With the availability ofmany user-friendly software packages and utility programs, computer programming could be kept to aminimum. It is also the aim of this training module to show to the participants that understanding thebasic principles and operating system of the various software packages would be sufficient to enablethem make full use of the information available to them for planning, management and research. Forthose participants who have a keen interest in computer programming and in mastering the softwarepackage, this training module will prepare them for further improving their computer skills bypracticing the techniques demonstrated in this program.
vi
36

4.2 It is recognized that the design of a management information system should be largely useroriented. It should start by looking at the potential uses of information rather than for the collection ofinformation per se. However, it would be deceptive to assume that all potential uses of informationcould be foreseen at the time a management information system is constructed. Furthermore, therequirements and practices in educational planning and management in Indonesia vary considerably fromprovince to province. Thus, it is almost impracticable to include the specific requirements of each andevery province in designing the training modules.
4.3 Naturally, participants to the training program would come from different divisions of theprovincial education offices. Some of than may mainly be concerned with say planning and budgeting,while others in the supervision of schools or other management functions. Some may be involved onlyin data collection. Consequently, not all parts of the training program would be of equal interest to theparticipants.
4.4 Taking into account the above considerations, the approach adopted in the design of thetraining materials is as follows:
APPLICABILITY is emphasized in the training program. Wherever possible, practical sessionson microcomputer applications are included in the modules so that the participants can have"hands-on" experience in the course. They will also be invited to try to include some of theirdaily planning, management and research tasks into the practical sessions, making use of someof the techniques and methods discussed in the training program;
FLEXIBILITY will be introduced in the design of the training-materials so that alternate designsand applications of the management information system will be tested during the practicalsessions, making full use of the versatility and flexibility of a computerized data base and thecomputer software packages; and
a MODULAR approach will be adopted in the course so that each module is as self-contained aspossible.
4.5 The stracture of the instructional and learning activities for each of the four modules will thusbe arranged as follows:
Overall Objectives of each of the modules will first be stated so that instructors are aware of thewhile purpose of the module as well as the know ledn which is expected to be imparted duringthe instructional and learning processes;
Module Performance Objectives will also be stated to enable the instructors to assess the extentto which the behavior of learners would be changed upon completion of the module. Morespecific performance objectives will also be given for different instructional units within amodule:
The actual instructional and learning processes are divided into four phases as follows:
Instructional activities where the instructors will present to the learners the teachingmaterials for the module and unit concerned. The teaching materials will cover the basicconceptual issues related to the topic in question, and fundamentals of computer applicationsthat will be demonstrated, highlighting strengths and weaknesses of such applications;
User manual where the instructors will carry on with the presentation, but usingmicrocomputers to demonstrate the various applications in planning, management, andresearch. The detailed step-by-step procedures required to be followed in developing andusing the different computer applications will be described in this user manual section.Therefore, this section is designed for both the instructors and the learners;
vii

14amingnclittio where the interaction between the instructors and learners will take place.The learners will be asked to:
practice the techniques in developing and using the data bases or models demonstratedby the instructors;
then the participants will be divided into groups to discuss the concepts, approaches andmethods used in the training materials. During the group discussion, they will beasked to suggest alternative approaches to the development and use of the managementinformation system;
based on the alternative designs suggested, the learners will, under the guidance of theinstructors, actually develop a new management information system and differentmodels of computer applications;
post-assessment where the instructors will attempt to evaluate the extent to which thelearners have been able to have a firm grasp Of the contents of the training materials. Anumber of questions and assessments have been proposed in the unit, and individual learnerswill be asked to do the assignments themselves.
5.0 Choice of Computer Software Packages
5.1 With the rapid development in computer technology, it is difficult to chow- softwarepackage,: which am both the most up- to-date and am familiar to both instructors and learners. Therefore,the factors used in choosing a computer software are the power of the software, the ease of use and its
PoPularitY.
52 Two types of computing functions are required for these training modules:
data base management; andspreadsheet applications.
A number of software packages have been very successful in integrating data base management withspreadsheet applications, and some statistical functions. However, these packages have limitationswhich dictate against using them in the training program. Nearly all of these packages are memory (orRAM) based, thus severely limiting the size of the data base that 1,ould be handled by the package. Theavailability of RAM banks or boards can increase the memory capacity of a 16-bit computer like an IBMPC/XT or its compatible to something like 8 mega-bytes. However, these are not yet very popularlyused Furthermore, most of these integrated softwares are not designed to handle relational data bases, afeature which is required in developing the management information system proposed in this trainingprogram. As a result, two separate software packages have been used in this training program, with eachperforming one of the two functions mentioned above.
5.3 A large number of data base and spreadsheet packages are available. The choice of one set ofpackages does not imply that the others available in the market are not suitable. The followingpackages are chosen for reasons given below:
DBASE HI (version 1.1 or 2) has been chosen for data base management. There are other database packages which are as powerful as DBASE III, like RBASE 5000 and KNOWLEDGE 2.DBASE III is chosen mainly because it is more user-friendly with its assistant facilities. Otherequally if not more powerful softwares like REVELATION and INFORMIX could be adopted inthe training program. But it appears DBASE III is more popularly used in IBM PCs or thecompatibles. In any case, the adoption of DBASE III in this training program does not precludethe participants from adapting the methodology and approach used in the training program toother data base management software, including newcomers like PARADOX (version 1.1); and
viii
LOTUS 123 (version 2) has been chosen as the spreadsheet software package largely because ofits popularity and its extremely user-friendly approach. Other softwares like VP- PLANNERwhich is claimed to have almost the same capabilitief As Lotus 123, to other software likeMULTIPLAN (version 2) which has the additional facility of liking different spreadsheets, couldwell be adopted, following the approach and methods used in the training program.
5.4 Summing up from the above, the structure of this training program could be visualized asfollows:
!fistula.
I
Contents.
Basic concepts and computer applications
Unit 1: Issues & problems in educationalplanning,management and research
Unit 2: Microcomputer applications
Unit 3: Data requirements identification andassessment
II Development of the Education ManagementInformation System
Unit 1: Data base construction
Unit 2: Informajon retrieval
III The Use of the Education Management InformationSystem for Management Control
Unit 1: Routine administration of schools andProjects
Unit 2: Monitoring performance of educationsystem
IV The Use of the Education Management InformationSystem for Planning
Unit 1: Diagnostic analysis of pupil flow
Unit 2: Forecasting enrollment in school
Unit 3: Forecasting teacher and other resourcerequirements
Software
WORDSTAR
DBASE MQUICKCODE III
DBASE IIIQUICKREPORT
LOTUS 123
It may be noted above that the use of WORDSTAR (version 3.3 a 2000) will be demonstratedModule 1 is presented to the participants so that they may after the training program be able to ,..
wordprocessing software for report writing.
ix

Table of Contents
Module II
L Introduction 1
1. Overall Module Objectives 1
2. The Organization of the Module 1
II. Unit 1: Data Base Development 23. Performance Objectives 24. Instructional Activities 25. User Manual 11
6. Learning Activities 367. Post-Assessment 38 -
Unit 2: Information Retrieval 398. Performance Objectives 399. Instructional Activities 39
10. User Manual 4211. Learning Activities 5712. Post-Assessment 59
xi3

Module II
The Construction of the Education ManagementInformation System
I. Introduction
1. Overall Module Objectives
1.1 The purpose of this module is to present to the participantsthe basic considerations in:
(a) The design and the construction of an integrated andcomputerized Education Management Information System (makinguse of microcomputers), which could serve simultaneously theneeds of provincial planners/administrators, as well astheir counterparts in the central ministry of education. Theactivities involved include the design of the questionnaires,and the setting up of the data base system for inputting,processing, and storing information;
(b) The use of the Education Management Information System inpreparing reports for the central government, and othersummary reports required to be compiled from time to time foradministrative and planning functions.
1.2 Module Performance Objectives. On completion of this module,the participants are expected to be able to:
(a) Create the computerized information system, making use ofmicrocomputer software packages;
(b) Produce simple reports from the data base so one canconstruct and retrieve information from it.
2. The Organization of the Module
2.1 The module is organized into two units, namely:
(a) Data Base Construction, where the essential considerationsand related technical aspects involved in creating acomputerized data base will be examined;
(b) Information Retrieval and Reporting, where the use of thedata base so constructed for retrieving information andproducing simple reports will be demonstrated.

2.2 It is hoped to underline in this module the flexibility andversatility that one could have in constructing a computerized database, making use of software packages like DBASE III. Therefore,
the active involvement of trainees is emphasized. After goingthrough the course contents and the demonstration:
(a) The instructor would invite the trainees to comment on therelevance and practicability of the models and computersystems used in the course content. This would be a free andopen discussion;
(b) The trainees are expected to give alternative suggestions tothe model and computer system designs, based on their ownknowledge and practical experience in school management,educational administration and planning. It would be usefulif the trainees could bring along some of their data sheets,questionnaires, and reports used in their work to facilitatediscussion and the subsequent practical exercises;
(c) On the basis of the suggested alternative designs, thetrainees would be guided to construct different data filesand retrieve information from the data files constructed.Although the software package DBASE III chosen for the courserequires a fair amount of programming for more sophisticateddata base design and information retrieval, the traineeswould be shown that their tasks would be greatly simplifiedby using software packages like QUICKCODE III.
II. Unit 1: Data Base Development
3. Performance Objectives
3.1 The objective of this section is to spell out the step-by-step procedure that could be taken in the construction of acomputerized data base. On completion of this unit, theparticipants are expected to be able to:
(a) Understand the basic considerations in the design of acomputerized education management information system;
(b) Draw up the data base structures and the various programmesfor data input, storage, and retrieval;
(c) Create the data base files and input data into the data base.
4. Instructional Activities
4.1 Sources and Flow of Data
4.1.1 There are two main sources of information, namely:
2
3o

(a) Administrative records which could provide a lot ofstatistical information useful for planning andadministration;
(b) Questionnaire surveys of schools which represent themore common means of collecting statistics foreducational planning and other information required bythe central education authorities.
4.1.2 There are definite advantages in trying to make asmuch use of the administrative records as the source ofinformation, as they are usually more accurate and timely,especially if finances are involved. The problems are thatthe manner in which these data are classified and analyzed insuch a way that they are only useful to those agency/officeundertaking the data collection. Thus, they may not beuseful to other users, in particular the planners.Furthermore, there may be great difficulty in retrieving suchadministrative information.
4.1.3 For information derived from questionnaire surveys ofschools, it is usually more comprehensive and geared to therequirements of different users. However, there are problemsof relevance, especially if the classification, coverage andcounting rules are not consistent with the one adopted forfinance, budgeting, and other management functions. Moreover,the data may not be available on time, because of the largenumber of schools involved. As schools may not have anyincentive in completing the questionnaires, the datacollected may not be reliable due to poor response andinaccurate reporting.
4.1.4 For the purpose of the present discussion, it isassumed that the main, if not only, source of information isfrom the survey of schools. Efforts will be made, in thedesign of the management information system, to overcome theproblems discussed in paragraph 9.3 above, by trying to:
(a) streamline the procedure of data collection andprocessing through the use of microcomputers in settingup an integrated data base system;
(b) make the data base more useful to the provincialplanners and administrators, by incorporating some oftheir data needs into the system.
Notwithstanding the above, it is still hoped that in thecourse of presenting this module to the participants, usefulinformation items which could be obtained from administrativerecords could be identified and incorporated into the database.
0
3

4.2 The Structure of the Data Base
4.2.1 The data base is to be set up at the provincialeducation office, with each individual record being a school.The data base may be organized into five data files asfollows:
(a) the pupil stock file,(b) the pupil flow file,(c) the teacher file,(d) the school file, and(e) the school master file.
It is of course possible to put all information into a bigfile for the school as a whole, including information onpupil, teacher and school. This is the case with the presentquestionnaire format used by the provincial offices whichcombines the three types of information into onequestionnaire. The former approach is adopted in thismodule, because it is considered more efficient to handledata files with fewer number of fields, especially if thenumber of records is big. With the use of such softwarepackages as DBASE III, it is always possible to linkdifferent data files together for cross tabulations andanalyses. Furthermore, the limited number of fields (being128) permitted in a DBASE III data file almost dictates theadoption of the former approach.
4.3 The Creation of the Data Base Files
4.3.1 The essential steps involved in the creation of thethree data base files outlined above compromise thefollowing:
(a) The design of data collection forms (i.e., thequestionnaires) to be sent to schools);
(b) The design of the structure for different data basefiles, defining field names, types and lengths. The
software package DBASE III will be used in theexercise and the compilation of programs for dataentry, validation and editing for the setting up ofthe data base.
4.3.2 Questionnaire Design. It is highly desirable thatthe same form could be used for subsequent data preparations(i.e., the input of data collected into the computer system).In designing the form, the need for simplicity and ease ofcompletion on the part of the school staff is stressed. Four
different questionnaires are required to be prepared, which
are as follows:
4
36
(a) questionnaire on the stock of pupils,(b) questionnaire on pupil flow,(c) teacher questionnaire, and(d) school questionnaire.
To facilitate future linkages between different data files,suitable references for identification (e.g., school codes)have to be incorporated into the questionnaires. Suggestedspecimens for the above four questionnaires are given inFigures I-IV below. It may be noted that efforts have beenmade to follow the format of the questionnaire now being usedby the Ministry to collect statistics from schools. Becauseof the limited number of fields permitted in a DBASE III datafile, that part of the questionnaire covering the agedistribution of pupils by grade and by whether public ornonpublic (see Figure I) has been simplified.
4.3.3 In this unit, the questionnaires shown in Figures I-IV will only be used for illustrative purposes. For thepractical exercises, and alternative, simplified set ofquestionnaires will be used, as the statistics available fordesigning the training materials are not detailed enough forthe questionnaire design suggested in Figures I-IV.
5
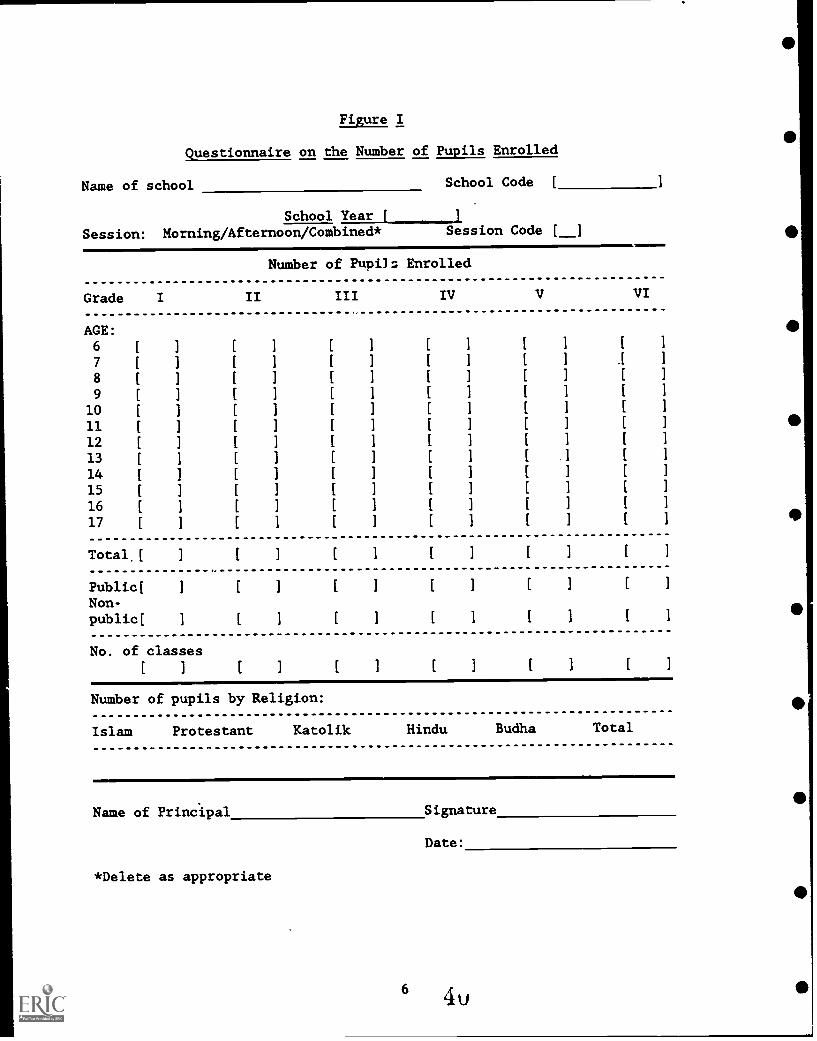
Figure I
Questionnaire on the Number of Pupils Enrolled
Name of school School Code [
School Year [ 1
Session: Morning/Afternoon/Combined* Session Code [
Number of Pupils Enrolled
Grade I II III IV V VI
AGE:6 [ ] 1 1 1 1 1 1 [ 1 [ 1
7 1 1 [ 1 1 1 1 1 1 1 .1 1
8 [] 1 1 1 1 1 1 1 1 1 1
9 1 1 1 1 1 1 1 1 1 1 1 1
10 [ ] 1 1 [ 1 1 1 1 1 1 I
11 [ ] 1 1 I 1 1 1 1 1 [ 1
12 [ ] 1 1 1 1 1 1 1 1 1 ]
13 [ ] 1 1 1 1 1 1 1 1 1 1
14 [ ] 1 1 1 1 1 1 1 1 1 I
15 1 1 1 1 1 1 [ 1 1 I 1 )
16 [ ] 1 1 1 1 1 1 1 1 1 1
17 [ ] 1 1 1 1 [ 1 1 1 1 1
Total.[ ] 1 1 1 1 1 1 1 1 1
Public( ] 1 1 1 1 1 1 1 1 1 1
Non-public( I 1 1 f 1 f I [ ] f 1
No. of classes
] ] ] ] ] ]
Number of pupils by Religion:
Islam Protestant Katolik Hindu Budha Total
Name of Principal Signature
*Delete as appropriate
6
Date:
4u
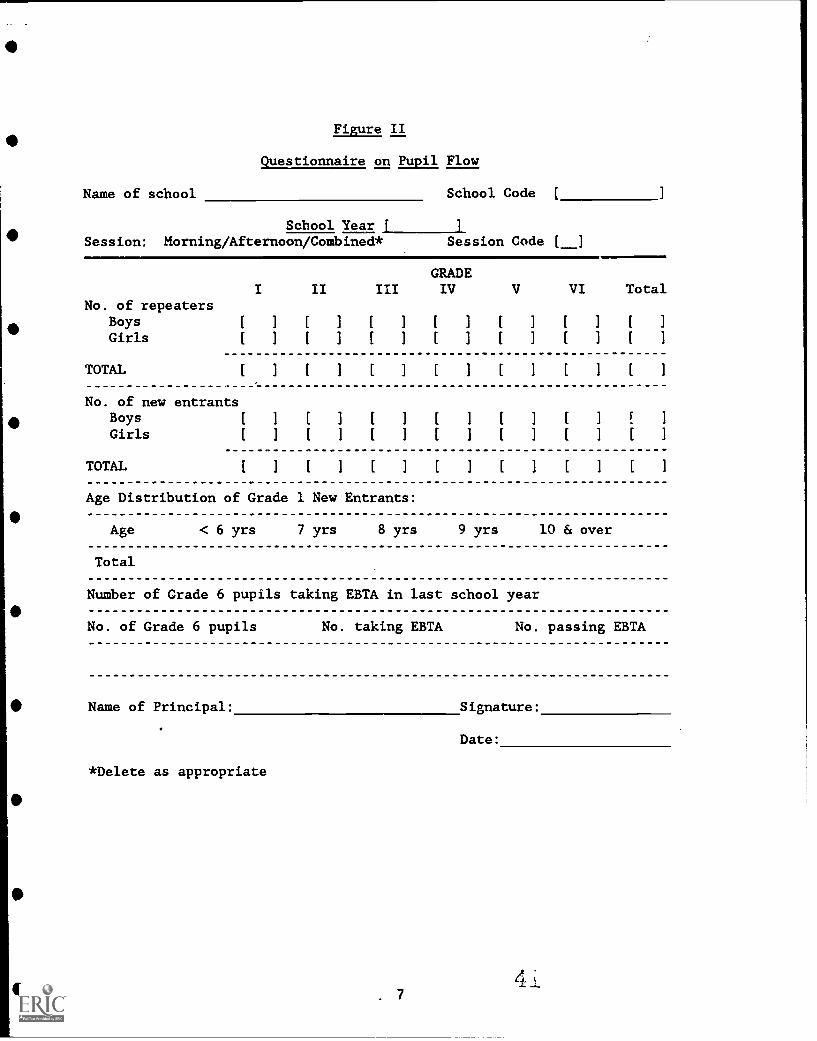
Name of school
Figure II
Questionnaire on Pupil Flow
School Code [
School Year [Session: Morning/Afternoon/Combined* Session Code [ ]
No. of repeatersBoysGirls
TOTAL
GRADEI II III IV V VI Total
[ l [ [ [ l [ [
[ l [ l [ l [ l [ l [ [
No. of new entrantsBoys [ ] ( ] [ ] [ ] [ ] E ]
Girls [ ] ( ] [ ( 1 [ ] [
TOTAL [ l [ [ [ l [ l [
Age Distribution of Grade 1 New Entrants:
Age < 6 yrs 7 yrs 8 yrs 9 yrs 10 & over
Total
Number of Grade 6 pupils taking EBTA in last school year
No. of Grade 6 pupils No. taking EBTA No. passing EBTA
Name of Principal: Signature:
Date:
*Delete as appropriate
7

Name of school
Figure III
Teacher Questionnaire
School Code [
School Year [
Session: Morning/Afternoon/Combined* Session Code [ ]
Number of Teachers
Q I II III IV V VI VII VIII
Public Teacher:Head [ I [ ] [ ] [ ] [ ] [ I [ ] [
Class [ ] [ ] [ ] [ [ ] [ ] [ ] [
Religion [ ] [ ] [ ] [ ] [ ] [ ] [ [
Sports [ [ ] [ [ ] [ [ ] [ [
Nonpublic Teacher:Head [ ] [ ] [ ] [ ] [ ] [ ] [ I [
Class [ ] [ ] [ ] [ ] [ ] [ ] [ I [
Religion [ ] [ ] [ ] [ ] [ ] [ [ ] [
Sports [ ] [ [ ] [ ] [ ] [ ] [ ] [
Total Ilt )(] I]Q: Qualifications:
I-SD dan Sederajat SPG, Cl, C2, PGA dan UGA
III -SMTP bukan Keguruan SPG, SGPLB, SGO, SMOA, KPG
V-SMTA bukan Keguruan VI -PGSLP
VII -PGSLA, B-1, Sarjana Muda VIII -B-II, Sarjana
Number of nonteaching staff
Administrative Labourer/Gardener Other Staff
P N P N P N
Name of Principal: Signature:
*Delete as appropriate
Date:
8 4,
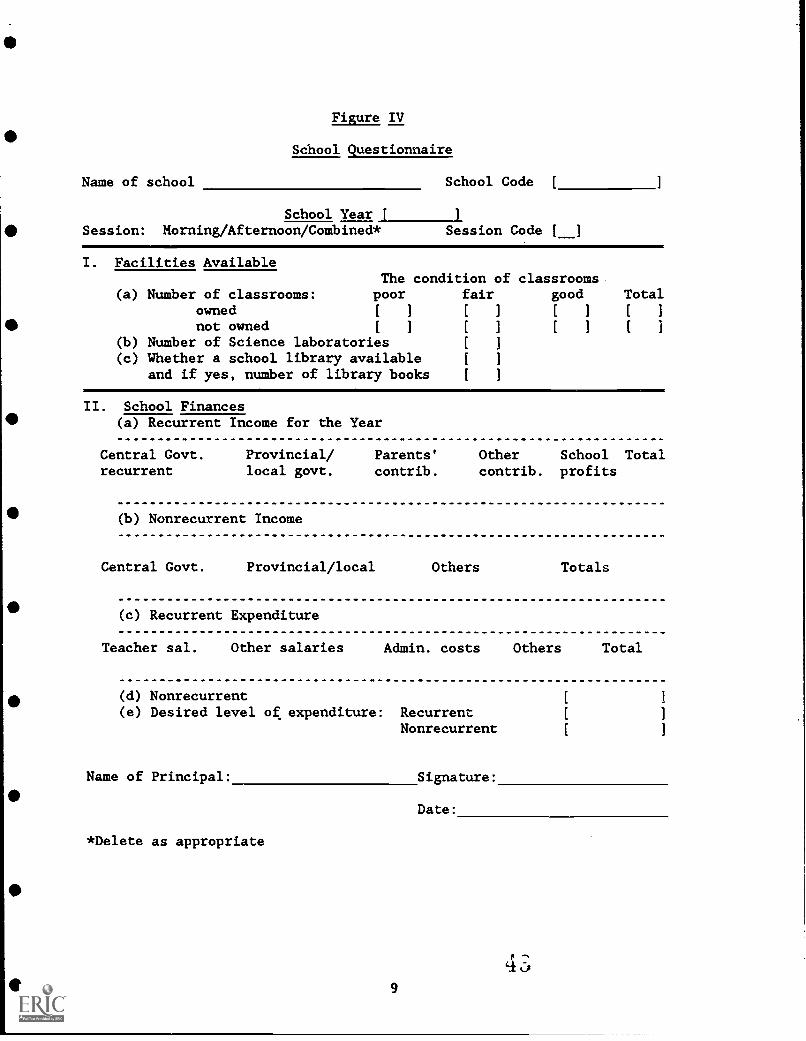
Name of school
Figure IV
School Questionnaire
School Code [
School YearSession: Morning/Afternoon/Combined* Session Code [ ]
I. Facilities AvailableThe condition of classrooms
(a) Number of classrooms: poor fair good Totalowned [ ] [ ] [ ] [ ]
not owned [ ] [ ] [ ] [ ]
(b) Number of Science laboratories [ ]
(c) Whether a school library available [ ]
and if yes, number of library books [ ]
II. School Finances(a) Recurrent Income for the Year
Central Govt. Provincial/ Parents' Other School Totalrecurrent local govt. contrib. contrib. profits
(b) Nonrecurrent Income
Central Govt. Provincial/local Others Totals
(c) Recurrent Expenditure
Teacher sal. Other salaries Admin. costs Others Total
(d) Nonrecurrent(e) Desired level of expenditure: Recurrent
Nonrecurrent
Name of Principal: Signature:
Date:
*Delete as appropriate
9

4.4 Program Development for Constructing Data Base
4.4.1 In designing the data base, it is always advisable todetermine in advance:
(a) The data items to be included in data file;
(b) The field names for each data item, and the key fieldwhich would serve as the link to other related datafiles. It is noted that the maximum number of fieldsallowed in one data file is 128;
(c) The characteristics of the different fields, i.e.,whether the field data type is numeric, character type,data type, logical, or memo type, and the length of thefield;
(d) Whether allowance should be made for the inclusion ofcomputed fields.
One need not be too worried about what the initial designis. With a flexible data base software like DBASE III, thereis always room for changing the data base structure afterthe data have been entered. However, caution is required toavoid any drastic changes, as it takes both time and demandscareful updating in changing the data base structure,especially when the data base contains a substantial numberof records.
4.4.2 To accept and organize the statistics collected fromthe questionnaires into the microcomputer requires thedevelopment of at least the following:
(a) The data base file specifying the structure of the database, i.e., the names of fields, field lengths, andcharacteristics;
(b) A program which could facilitate the entering of datainto the data base, the so-called ADD program;
(c) A program which could validate data entered, andcomputations on the data. This program could be linkedto the ADD program;
(d) A program to create the indtx file which couldfacilitate subsequent data retrieval, data editing andreporting.
4.4.3 Besides the writing of programs to facilitate theinput of data into the data files (see 7.4.1(b) above), onecan conveniently make use of the various commands and the
10 44
01

assistant in DBASE III for data entry and indexing. Thiswould be demonstrated in the practical session (see Section 8User Manual).
4.4.4 As discussed above, a school master file would becreated as well. This master would contain basic informationabout the schools in the province, such as name, address andpossible other physical facilities such as the number ofclassrooms. Information contained in this file should notchange very often, so that it is not necessary to includesuch information in the regular surveys of schools. The filecould be updated when new classroomsschool, or after the school has beenschools are built. For the purposesonly the following information itemsschool master file:
(a)
(b)
(c)
school code,name of school, andaddress of school.
are constructed in theclosed down, or when newof the present module,are included in the
Additional information can of course be added into this database.
5. User Manual
5.1 Getting Started
5.1.1 The user manual is designed for:
(a) The instructors in demonstrating the various stepsinvolved in constructing a data file and in subsequentinformation retrieval and reporting;
(b) The trainees in having "hands-on" use of the variousmicrocomputer software which has been designed for theunit, during the practical sessions.
5.1.2 The practical exercises are designed to be run onany IBM compatible microcomputer, operating on DOS 2.0 orabove, with at least 256 K bytes of memory, 2 double sidedfloppy disk drives or 1 double sided disk drive and a harddisk.
5.1.3 The standard software packages used in this unit areDBASE III (Plus or Version 1.1) and QUICKCODE III. Inbooting up the microcomputer, it is recommended to reserve 20file and 24 disk buffers (the default values are 8 and 2respectively) using the CONFIG.SYS file in the DOS diskette.
11

5.1.4 The various data files and programs designed for thisunit are stored in the diskette labeled "EPP Mod.v.l" and"EPP Mod.v.2." The files in the original diskette areprotected against modifications and deletion. It istherefore necessary to make a backup copy of the diskettesand use the backups for practical exercises. Any accidentaldeletion or deliberate amendments to the various data filesand programs during the practical sessions would not affectthe original data files and programs.
5.1.5 In starting up the system, the following procedureshould be adopted:
(a) After the microcomputer has been booted up, change thesystem prompt (i.e., >) to the B drive or the C drivefor the system with a hard disk;
(b) Start up the DBASE III program from the B drive (or theC drive);
(c) Put the Diskette "EPP Mod.v.2 (or 1)" in Drive A.
5.2 Creation of the School Master File
5.2.1 Using the simple school master file which containsonly three data items (namely school code, school name andaddress), the essential steps in the initial development ofa data base are demonstrated. In planning the data basedesign, the following have to be considered:
(a) Defining data characteristics, which is to assign to
each data item:
(1) the field name, which can be any name not morethan 10 characters long. If the data item appearsin more than one data base, the same field nameshould be used. It is essential not to duplicatethe field name in the same data file. Thefollowing field name is suggested for the schoolmaster file:
school code: SCH_CODEschool name: NAMEaddress: ADDRESS
The school code (SCH_CODE) is the common fieldwhich links the school master file with other datafiles.
(2) field type, which reflects the attribute of thedata for the data item (or field) concerned. Thetype selected determines the type of manipulation
12
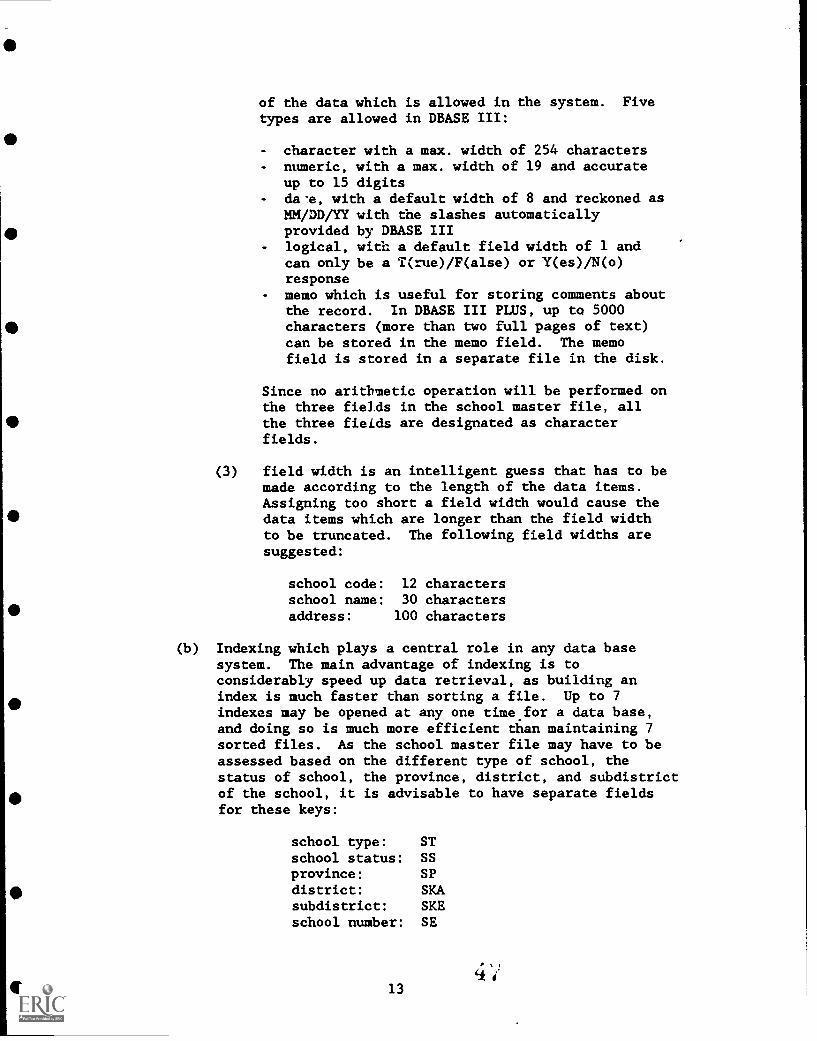
of the data which is allowed in the system. Fivetypes are allowed in DBASE III:
character with a max. width of 254 charactersnumeric, with a max. width of 19 and accurateup to 15 digitsda.e, with a default width of 8 and reckoned asMM/DD/YY with the slashes automaticallyprovided by DBASE IIIlogical, with a default field width of 1 andcan only be a T(rue)/F(alse) or Y(es)/N(o)responsememo which is useful for storing comments aboutthe record. In DBASE III PLUS, up to 5000characters (more than two full pages of text)can be stored in the memo field. The memofield is stored in a separate file in the disk.
Since no arithmetic operation will be performed onthe three fields in the school master file, allthe three fields are designated as characterfields.
(3) field width is an intelligent guess that has to bemade according to the length of the data items.Assigning too short a field width would cause thedata items which are longer than the field widthto be truncated. The following field widths aresuggested:
school code: 12 charactersschool name: 30 charactersaddress: 100 characters
(b) Indexing which plays a central role in any data basesystem. The main advantage of indexing is toconsiderably speed up data retrieval, as building anindex is much faster than sorting a file. Up to 7indexes may be opened at any one time for a data base,and doing so is much more efficient than maintaining 7sorted files. As the school master file may have to beassessed based on the different type of school, thestatus of school, the province, district, and subdistrictof the school, it is advisable to have separate fieldsfor these keys:
school type: STschool status: SSprovince: SP
district: SKAsubdistrict: SKEschool number: SE
13

The above 6 fields make up the field of schoolcode (SCH_CODE).
(c) computed field--as the 6 fields listed in (b) above are,taken together, the same as the field for school code(i.e., SCH_CODE). In order to avoid the need to inputthe same information twice during data entry, it isconvenient if the value of the field for school codecould be generated from the inputs to the 6 otherfields. This can be done by concatenating the characterstrings in the 6 fields listed in (b) above.
5.2.2 The actual process of creating the school master datafile is shown in paragraph 8.2.3 below, making use of theCREATE command in DBASE III. The CREATE command accomplishesthree tasks:
(a) Creating the data base file;(b) Defining the structure of the data file; and(c) Opening the file for data entry, if required.
In the procedures given in paragraph 8.2.3, all DBASE IIIcommands are written in UPPER CASE only and are preceded withan asterisk (*) for ease of reference. As the school masterfile (names SCHMAS) has already been constructed and storedin the diskette "EPP Mod.v.2," in creating another schoolmaster file during the practical sessions, a different filename (say SCHMAS1) should be assigned.
5.2.3 The following steps are suggested in actuallycreating the school master file:
(a) Start up DBASE III, and at dot command type *SET DEFAULTTO A to specify the drive to store the file;
(b) *CREATE SCHMAS1 and DBASE III will display a screen withhighlighted blocks for entry of field names, types offields, field widths and the numbers of decimal placesrequired;
(c) Enter the information requested as per paragraph 8.2.1above;
(d) After completing defining the data base, the system willprompt whether one would proceed to data input. One canproceed to data input immediately. Alternatively, one
can input data by:
(1) *USE SCHMAS1 to open the data file;(2) *APPEND to begin adding records;
14
flb
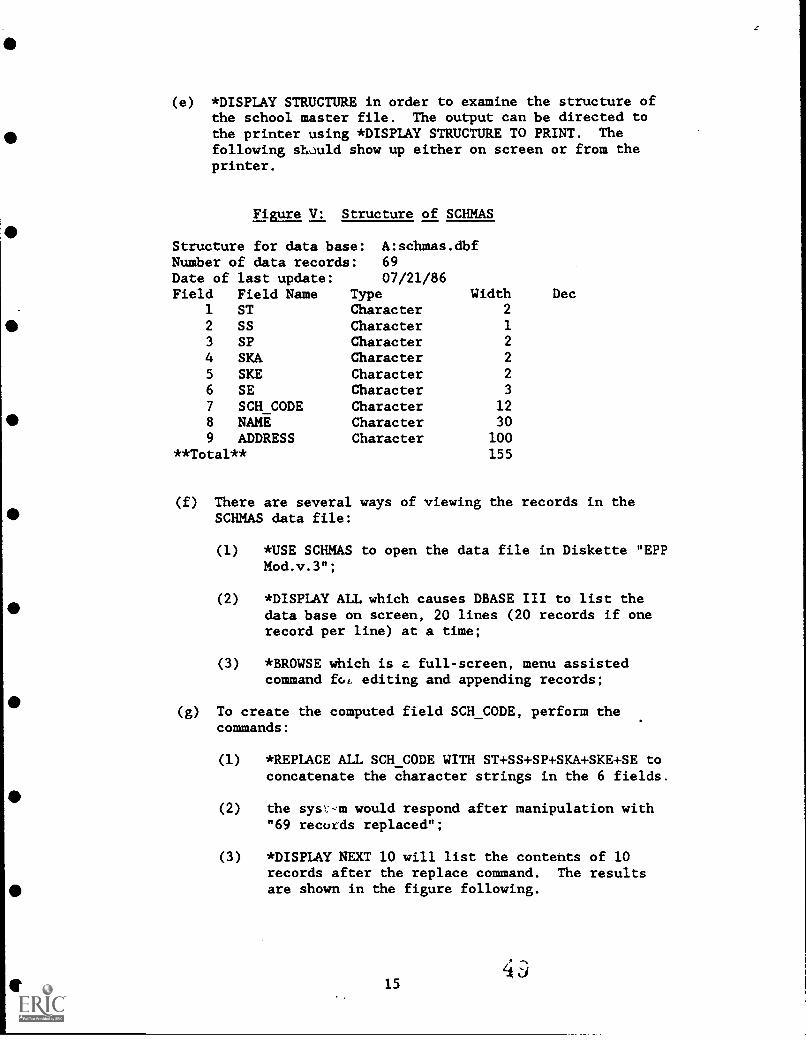
(e) *DISPLAY STRUCTURE in order to examine the structure ofthe school master file. The output can be directed tothe printer using *DISPLAY STRUCTURE TO PRINT. Thefollowing should show up either on screen or from theprinter.
Figure V: Structure of SCHMAS
Structure for data base: A:schmas.dbfNumber of data records: 69Date of last update: 07/21/86Field Field Name Type Width Dec
1 ST Character 2
2 SS Character 1
3 SP Character 2
4 SKA Character 2
5 SKE Character 2
6 SE Character 3
7 SCH_CODE Character 128 NAME Character 30
9 ADDRESS Character 100**Total** 155
(f) There are several ways of viewing the records in theSCHMAS data file:
(1) *USE SCHMAS to open the data file in Diskette "EPPMod.v.3";
(2) *DISPLAY ALL which causes DBASE III to list thedata base on screen, 20 lines (20 records if onerecord per line) at a time;
(3) *BROWSE which is a full-screen, menu assistedcommand foL editing and appending records;
(g) To create the computed field SCH_CODE, perform thecommands:
(1) *REPLACE ALL SCH_CODE WITH ST +SS +SP +SKA +SKE +SE to
concatenate the character strings in the 6 fields.
(2) the sysr-m would respond after manipulation with"69 records replaced";
(3) *DISPLAY NEXT 10 will list the contents of 10records after the replace command. The resultsare shown in the figure following.
15
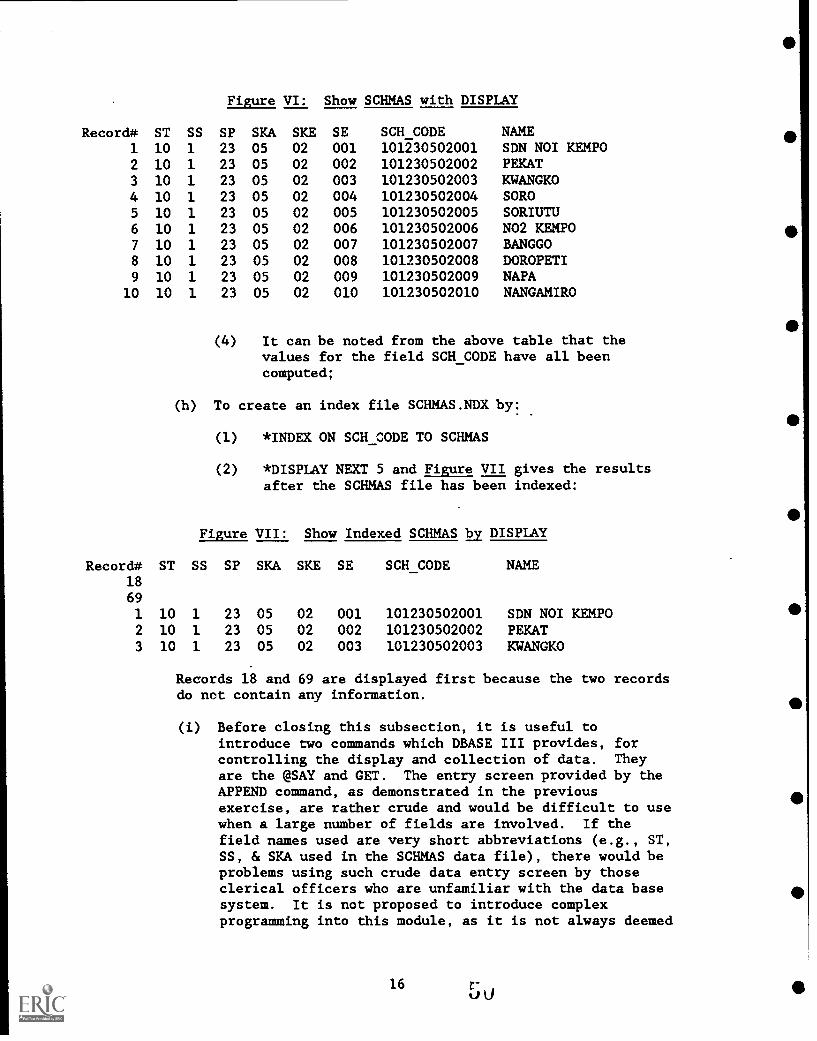
Figure VI: Show SCHMAS with DISPLAY
Record# ST SS SP SKA SKE SE SCH_CODE NAME1 10 1 23 05 02 001 101230502001 SDN NOI KEMPO2 10 1 23 05 02 002 101230502002 PEKAT3 10 1 23 05 02 003 101230502003 KWANGKO4 10 1 23 05 02 004 101230502004 SORO5 10 1 23 05 02 005 101230502005 SORIUTU6 10 1 23 05 02 006 101230502006 NO2 KEMPO7 10 1 23 05 02 007 101230502007 BANGGO8 10 1 23 05 02 008 101230502008 DOROPETI9 10 1 23 05 02 009 101230502009 NAPA
10 10 1 23 05 02 010 101230502010 NANGAMIRO
(4) It can be noted from the above table that thevalues for the field SCH_CODE have all beencomputed;
(h) To create an index file SCHMAS.NDX by:
(1)
(2)
*INDEX ON SCH_CODE TO SCHMAS
*DISPLAY NEXT 5 and Figure VII gives theafter the SCHMAS file has been indexed:
results
Figure VII: Show Indexed SCHMAS by DISPLAY
Record# ST SS SP SKA SKE SE SCH_CODE NAME18
69
1 10 1 23 05 02 001 101230502001 SDN NOI KEMPO2 10 1 23 05 02 002 101230502002 PEKAT3 10 1 23 05 02 003 101230502003 KWANGKO
RecordsRecords 18 and 69 are displayed first because the two recordsdo not contain any information.
(i) Before closing this subsection, it is useful tointroduce two commands which DBASE III provides, forcontrolling the display and collection of data. Theyare the @SAY and GET. The entry screen provided by theAPPEND command, as demonstrated in the previousexercise, are rather crude and would be difficult to usewhen a large number of fields are involved. If thefield names used are very short abbreviations (e.g., ST,SS, & SKA used in the SCHMAS data file), there would beproblems using such crude data entry screen by thoseclerical officers who are unfamiliar with the data basesystem. It is not proposed to introduce complexprogramming into this module, as it is not always deemed
16

necessary for most purposes. However, it would still beuseful to know this tool is available in DBASE III, andan understanding of the two commands would be helpful inlooking at the programming generated by QUICKCODE III inthe next subsection.
(1) It is necessary first to create a format filecalled SCHMAS.FMT, using the DBASE III editor:
*MODIFY COMMAND SCHMAS.FMT
(2) The suggested format file is as follows:
@ 3,25 SAY "CUSTOM SCREEN FOR SCHMAS FILE"@ 4,25 SAY "@ 6,2 SAY "SCHOOL STATUS & SESSION CODES" GET ST
PICTURE "99"@ 6,40 GET SS PICTURE "9"@ 8,2 SAY "SCHOOL DISTRICT CODES" GET SP PICTURE
"99"
@ 8,30 GET SKE PICTURE "99"@ 8,40 GET SKA PICTURE "99"@ 10,2 SAY "SCHOOL NAME:" GET NAME@ 12,2 SAY "ADDRESS:" GET ADDRESS
(3) *SET FORMAT TO SCHMAS*EDITThese would cause the SCHMAS data file to bedisplayed according to the format defined in theformat file. The display on the screen will looklike the following:
Figure VIII: Custom Screen for SCHMAS
CUSTOM SCREEN FOR SCHMAS FILE
SCHOOL STATUS & SESSION CODES 10 1
SCHOOL DISTRICT CODES 23 02 05
SCHOOL NAME: SDN NOI KEMPO
ADDRESS:
EDIT 1 <A:>ISCHMAS IRec: 1/69
17
I

(4) It is also noted that a format file does not needto include all fields in SCHMAS file. The fieldSCH_CODE has been omitted, as no information needsto be input into this field from the keyboard.
5 3 Creation of Pupil and Teacher Data Files
5.3.1 It may be seen from the demonstration in paragraph5.2 above on the creation of the school master file thatthere are limitations in the DBASE III APPEND command, aswell as in the use of the format file employing the SAY andGET commands. For example:
(a) It is not possible to cater for computer fields at thedata entry stage;
(b) No allowance can be made for the use of default valuesfor fields whose values remain the same for a largenumber of records. An example is the school year for apupil file;
(c) When a large number of fields are involved, writing aformat file becomes a rather cumbersome assignment.
5.3.2 In this subsection, an utility program calledQUICKCODE III is introduced. It is a program generator, thustaking off most of the boring work from the data basedesigners in writing and debugging programs. The maindrawback of the program is that it cannot handle more thanone data base at a time, and the processing time is ratherslow, when QUICKCODE III generated programs are used toinput data into a data base.
5.3.3 QUICKCODE III is quite user-friendly. The main stepsinvolved in building a group of utility programs are asfollows (all commands are given in UPPER CASE only and arepreceded by an asterisk (*)):
(a) Using the Quickscreen Mode to design the input screen toDBASE III:
(1) Starting QUICKCODE III by putting the program diskin Drive A and type *QC and the following screenwill appear:
18 rJ4.4
S
41
a

S
Figure IX: QUICKCODE III Opening Menu
QUICKCODE IIITo Design Your Screen: Q To Exit: E
SCREEN SELECTIONNEW Name For Your Screen:Get an OLD Screen From Disk: 0Get a TEXT File From Disk:
CUSTOMIZATIONCustomize Your Screen Design Commands:Customize Your Screen Settings (widths, lengths, etc.):Turn on the QUICKMENU Menu Generator:Change Your Output Options (see list below): X
GENERATE dBASE-III PROGRAMSGenerate ALL Programs: ESC Generate just one: G
ADD DBF ED FAU GETGO IC) OUT PRG
RPT SCR VAL
CURRENT SCREEN IS: NONAME (AUTO PILOT ON)ENTER COMMAND
(2) Naming the screen by choosing *N (for new name),and then *C:PUPIL1 to create a file PUPIL1 indrive C;
(3) Then select the Quickscreen Mode by typing *Q;
(4) When the blackboard appears, just type the name ofthe field (preceded by ";") at any positiondesired, and any other instructions and titles inthe same manner;
(5) In the following 3 figures, the Quickscreen Modefor the three data files, namely PUPIL_RC, FLOW RCand TEA_RC (which have been created and stored inDiskette "EPP Mod.v.2") are displayed todemonstrate how the blackboard in the QuickscreenMode can be drawn up:
19

LIN: 2
Figure X: Quickscreen Design for PUPIL RC
COL: 0 (AUTO PILOT) SCR: pupil_rc DBF: pupil_rc%MQ_MODE
Pupil Stock Questionnaire (Format RC)
Year ;yr# 'School Code I ;st I ;ss I ;sp I ;ska I ;ske
serial no. I ;se Session I ;sess
Grade I I
EnrollmentBoys ;eml#Girls ;efl#Classes ;c1#
II III IV V
;em2#;ef2#;c2#
;em3#;ef3#;c3#
;em4#;ef4#;c4#
;em5#;ef5#;c5#
VI
;em6#;ef6#;c6#
Age group 6 yrs or lower 7-12 years 13 yrs and above Total
Enrollment ;ea6# ;ea7# ;ea13# ;et#
Religion Moslem Protestant/Christian Khatolik Hindu Budha
;sch_code ;erm# ;erp# ;erk# ;erh# ;erb#
LIN: 2 COL: 1
Figure XI: Quickscreen for FLOW RC
(AUTO PILOT) SCR: flow_rc DBF: flow_rcIMQ_MODE
Pupil Flow Questionnaire (Format RC)
Year ;yr# 'School Code I ;st I ;ss I ;sp I ;ska I ;ske
serial no. I ;se SessionI ;sess
Final Examination No. of Grade VI pupils No. Registered No. Passedfor last year ;81# ] [ ;gt# ] ;gp#
New students for No. Registered No. planned to accept No. AcceptedGrade I [ ;elr# ] [ ;elp# ] [ ;ela# ]
By age group 6 yrs & below 7 yrs 8 yrs 9 yrs 10 yrs & over[ ;ey6# ] [;ey7#] [;ey8 #] key9#1 [ ;ey10# ]
Repeaters I II III IV V VI
by Grade [ ;rtl# ] [ ;rt2# ] [ ;rt3# ] [ ;rt4# ] [ ;rt5# ] ;rt6#
;sch_code ;rtt# ;eyt#
20

Figure XII: Quickscreen for TEA RC
LIN: 2 COL: 1 (AUTO PILOT) SCR: tea_rc DBF: tea_rcWQ_MODE
Teacher Stock Questionnaire (Format RC)
Year ;yr# !School Code 1 ;st 1 ;ss 1 ;sp 1 ;ska 1 ;ske
serial no. 1 ;se Session 1 ;sess
Nonteaching staff Administrative Watchman TotalPublic ;ap# ;1p# ;tp#Nonpublic ;an# ;1n# ;tn#
Teaching Staff Male ;tm# Female ;tf# Total ;tt#
No. by I II III IV V VI VII VIII TOTALCert. ;npl# ;np2# ;np3# ;np4# ;np5# ;np6# ;np7# ;np8# ;npt#
No. by grade Head Class Religion Sport/Art TotalPublic ;ph# ;pc# ;pr# ;ps# ;pt#
II Nonpublic ;nh# ;nc# ;nr# ;ns# ;nt#
6
;sch code ;nqt# ;nht# ;nct# ;nrt# ;nst# ;gtt#
(b) Using the Field Mode to define the characteristics ofthe fields given in the Quickscreen, the defaultvalues desired, the range check, the indexes to beused and the computed fields. The main proceduresinvolved are as follows (for detailed instructions, itis necessary to consult the User Manual):
(1) F,:om Quickscreen Mode, one can go to the FieldMode by pressing *CTRL B;
(2) Using the cursor movement arrows to move around inthe Field Mode. One can change the followinginformation given in the Field Mode:
Column 3 data type; noting that in Quickscreenone may have already defined an integer fieldtype by assigning an "#" after the field name,and a money field type (numerical field withtwo decimal points) by assigning an "$" afterthe field name;
Column 4 field length;
Column 5 file status for each field. This iswhere one would define the index field byassigning in descending order from 0 to 9;
21 t) J
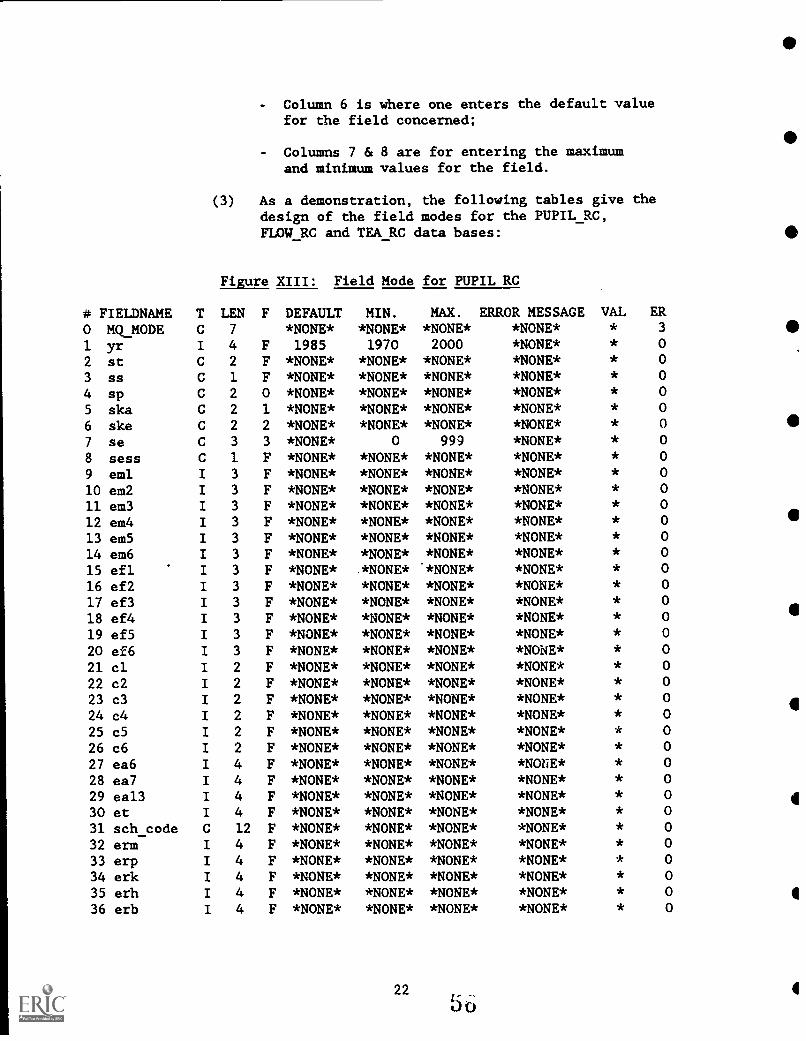
- Column 6 is where one enters the default valuefor the field concerned;
- Columns 7 & 8 are for entering the maximumand minimum values for the field.
(3) As a demonstration, the following tables give thedesign of the field modes for the PUPIL RC,FLOW RC and TEA RC data bases:
Figure XIII: Field Mode for PUPIL RC
# FIELDNAME T LEN F DEFAULT MIN. MAX. ERROR MESSAGE VAL ER
0 MQ_MODE C 7 *NONE* *NONE* *NONE* *NONE* * 3
1 yr I 4 F 1985 1970 2000 *NONE* * 0
2 st C 2 F *NONE* *NONE* *NONE* *NONE* * 0
3 ss C 1 F *NONE* *NONE* *NONE* *NONE* * 0
4 sp C 2 0 *NONE* *NONE* *NONE* *NONE* * 0
5 ska C 2 1 *NONE* *NONE* *NONE* *NONE* * 0
6 ske C 2 2 *NONE* *NONE* *NONE* *NONE* * 0
7 se C 3 3 *NONE* 0 999 *NONE* * 0
8 sess C 1 F *NONE* *NONE* *NONE* *NONE* * 0
9 eml I 3 F *NONE* *NONE* *NONE* *NONE* * 0
10 em2 I 3 F *NONE* *NONE* *NONE* *NONE* * 0
11 em3 I 3 F *NONE* *NONE* *NONE* *NONE* * 0
12 em4 I 3 F *NONE* *NONE* *NONE* *NONE* * 0
13 em5 I 3 F *NONE* *NONE* *NONE* *NONE* * 0
14 em6 I 3 F *NONE* *NONE* *NONE* *NONE* * 0
15 efl I 3 F *NONE* . *NONE* *NONE* *NONE* * 0
16 ef2 I 3 F *NONE* *NONE* *NONE* *NONE* * 0
17 ef318 ef4
I
I
3
3
FF
*NONE**NONE*
*NONE**NONE*
*NONE* *NONE**NONE* *NONE*
**
0
0 a19 ef5 I 3 F *NONE* *NONE* *NONE* *NONE* * 0
20 ef6 I 3 F *NONE* *NONE* *NONE* *NONE* * 0
21 cl I 2 F *NONE* *NONE* *NONE* *NONE* * 0
22 c2 I 2 F *NONE* *NONE* *NONE* *NONE* * 0
23 c324 c4
I
I
2
2
FF
*NONE**NONE*
*NONE**NONE*
*NONE* *NONE**NONE* *NONE*
**
0
0I
25 c5 I 2 F *NONE* *NONE* *NONE* *NONE* * 0
26 c6 I 2 F *NONE* *NONE* *NONE* *NONE* * 0
27 ea6 I 4 F *NONE* *NONE* *NONE* *NONE* * 0
28 ea7 I 4 F *NONE* *NONE* *NONE* *NONE* * 0
29 ea13 I 4 F *NONE* *NONE* *NONE* *NONE* * 0 I30 et I 4 F *NONE* *NONE* *NONE* *NONE* * 0
31 sch_code C 12 F *NONE* *NONE* *NONE* *NONE* * 0
32 erm I 4 F *NONE* *NONE* *NONE* *NONE* * 0
33 erp I 4 F *NONE* *NONE* *NONE* *NONE* * 0
34 erk I 4 F *NONE* *NONE* *NONE* *NONE* * 0
35 erh I 4 F *NONE* *NONE* *NONE* *NONE* * 0
36 erb I 4 F *NONE* *NONE* *NONE* *NONE* * 0
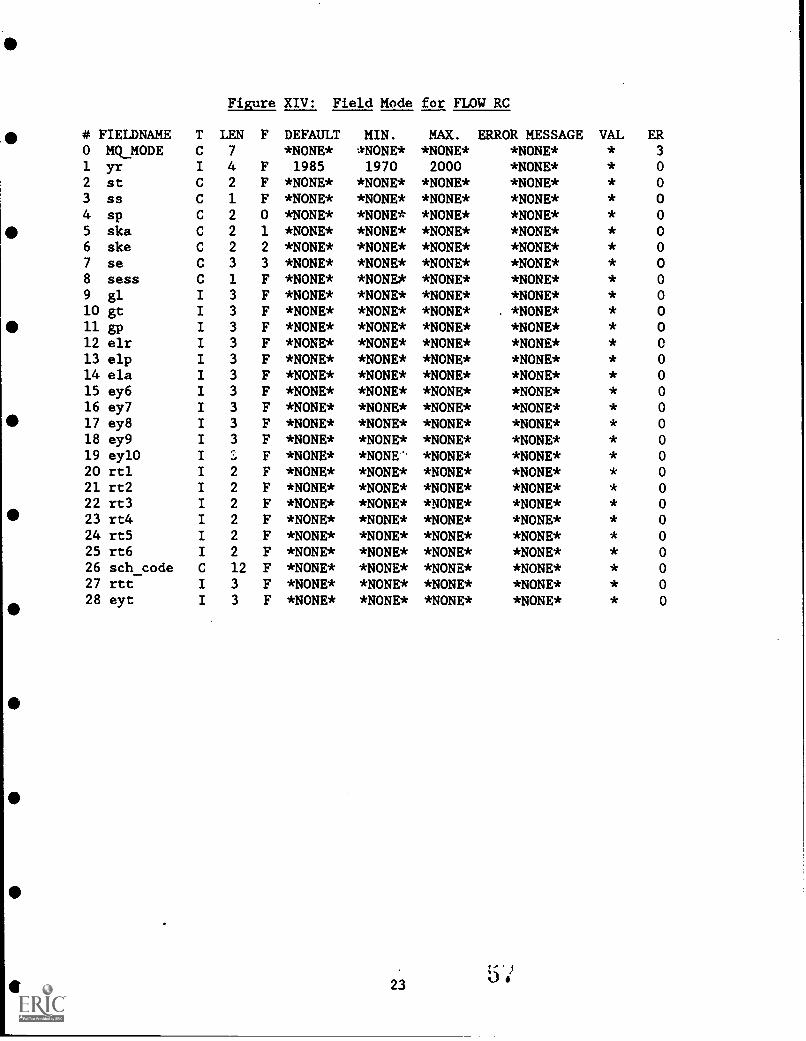
Figure XIV: Field Mode for FLOW RC
0 # FIELDNAME T LEN F DEFAULT MIN. MAX. ERROR MESSAGE VAL ER0 MQ_MODE C 7 *NONE* *NONE* *NONE* *NONE* * 3
1 yr I 4 F 1985 1970 2000 *NONE* * 0
2 st C 2 F *NONE* *NONE* *NONE* *NONE* * 0
3 ss C 1 F *NONE* *NONE* *NONE* *NONE* * 04 sp C 2 0 *NONE* *NONE* *NONE* *NONE* * 0
0 5 ska C 2 1 *NONE* *NONE* *NONE* *NONE* * 0
6 ske C 2 2 *NONE* *NONE* *NONE* *NONE* * 0
7 se C 3 3 *NONE* *NONE* *NONE* *NONE* * 0
8 sess C 1 F *NONE* *NONE* *NONE* *NONE* * 0
9 gl I 3 F *NONE* *NONE* *NONE* *NONE* * 010 gt I 3 F *NONE* *NONE* *NONE* *NONE* * 0
0 11 gp I 3 F *NONE* *NONE* *NONE* *NONE* * 0
12 elr I 3 F *NONE* *NONE* *NONE* *NONE* * 0
13 elp I 3 F *NONE* *NONE* *NONE* *NONE* * 014 ela I 3 F *NONE* *NONE* *NONE* *NONE* * 0
15 ey6 I 3 F *NONE* *NONE* *NONE* *NONE* * 0
16 ey7 I 3 F *NONE* *NONE* *NONE* *NONE* * 00 17 ey8 I 3 F *NONE* *NONE* *NONE* *NONE* * 0
18 ey9 I 3 F *NONE* *NONE* *NONE* *NONE* * 0
19 ey10 I : F *NONE* *NONE' *NONE* *NONE* * 0
20 rtl I 2 F *NONE* *NONE* *NONE* *NONE* * 0
21 rt2 I 2 F *NONE* *NONE* *NONE* *NONE* * 0
22 rt3 I 2 F *NONE* *NONE* *NONE* *NONE* * 0
23 rt4 I 2 F *NONE* *NONE* *NONE* *NONE* * 0
24 rt5 I 2 F *NONE* *NONE* *NONE* *NONE* * 0
25 rt6 I 2 F *NONE* *NONE* *NONE* *NONE* * 0
26 sch_code C 12 F *NONE* *NONE* *NONE* *NONE* * 0
27 rtt I 3 F *NONE* *NONE* *NONE* *NONE* * 0
II28 eyt I 3 F *NONE* *NONE* *NONE* *NONE* * 0
23Jt-

Figure XV: Field Mode for TEA RC
# FIELDNAME T LEN F DEFAULT MIN. MAX. ERROR MESSAGE VAL ER
0 MQ_MODE C 7 *NONE* *NONE* *NONE* *NONE* * 3
1 yr I 4 F 1985 1970 2000 *NONE* * 0
2 st C 2 F *NONE* *NONE* *NONE* *NONE* * 0
3 ss C 1 F *NONE* *NONE* *NONE* *NONE* * 0
4 sp C 2 0 *NONE* *NONE* *NONE* *NONE* * 0
5 ska C 2 1 *NONE* *NONE* *NONE* *NONE* * 0
6 ske C 2 2 *NONE* *NONE* *NONE* *NONE* * 0
7 se C 3 3 *NONE* *NONE* *NONE* *NONE* * 0
8 sess C 1 F *NONE* *NONE* *NONE* *NONE* * 0
9 ap I 2 F *NONE* *NONE* *NONE* *NONE* * 0
10 1p I 2 F *NONE* *NONE* *NONE* *NONE* * 0
11 tp I 3 F *NONE* *NONE* *NONE* *NONE* * 0
12 an I 2 F *NONE* *NONE* *NONE* *NONE* * 0
13 In I 2 F *NONE* *NONE* *NONE* *NONE* * 0
14 to I 3 F *NONE* *NONE* *NONE* *NONE* * 0
15 tm I 3 F *NONE* *NONE* *NONE* *NONE* * 0
16 tf I 3 F *NONE* *NONE* *NONE* *NONE* * 0
17 tt I 3 F *NONE* *NONE* *NONE* *NONE* * 0
18 npl I 2 F *NONE* *NONE* *NONE* *NONE* * 0
19 np2 I 2 F *NONE* *NONE* *NONE* *NONE* * 0
20 np3 I 2 F *NONE* *NONE* *NONE* *NONE* * 0
21 np4 I 2 F *NONE* *NONE* *NONE* *NONE* * 0
22 np5 I 2 F *NONE* *NONE* *NONE* *NONE* * 0
23 np6 I 2 F *NONE* *NONE* *NONE* *NONE* * 0
24 np7 I 2 F *NONE* *NONE* *NONE* -NONE* * 0
25 np8 I 2 F *NONE* *NONE* *NONE* *NONE* * 0
26 npt I 3 F *NONE* *NONE* *NONE* *NONE* * 0
27 ph I 2 F *NONE* *NONE* *NONE* *NONE* * 0
28 pc I 2 F *NONE* *NONE* *NONE* *NONE* * 0
29 pr I 2 F *NONE* *NONE* *NONE* *NONE* * 0
30 ps I 2 F *NONE* *NONE* *NONE* *NONE* * 0
31 pt I 3 F *NONE* *NONE* *NONE* *NONE* * 0
32 nh I 2 F *NONE* *NONE* *NONE* *NONE* * 0
33 nc I 2 F *NONE* *NONE* *NONE* *NONE* * 0
34 nr I 2 F *NONE* *NONE* *NONE* *NONE* * 0
35 ns I 2 F *NONE* *NONE* *NONE* *NONE* * 0
36 nt I 3 F *NONE* *NONE* *NONE* *NONE* * 0
37 sch_code C 12 F *NONE* *NONE* *NONE* *NONE* * 0
38 nqt I 3 F *NONE* *NONE* *NONE* *NONE* * 0
39 nht I 2 F *NONE* *NONE* *NONE* *NONE* * 0
40 nct I 2 F *NONE* *NONE* *NONE* *NONE* * 0
41 nrt I 2 F *NONE* *NONE* *NONE* *NONE* * 0
42 nst I 2 F *NONE* *NONE* *NONE* *NONE* * 0
43 gtt I 3 F *NONE* *NONE* *NONE* *NONE* * 0
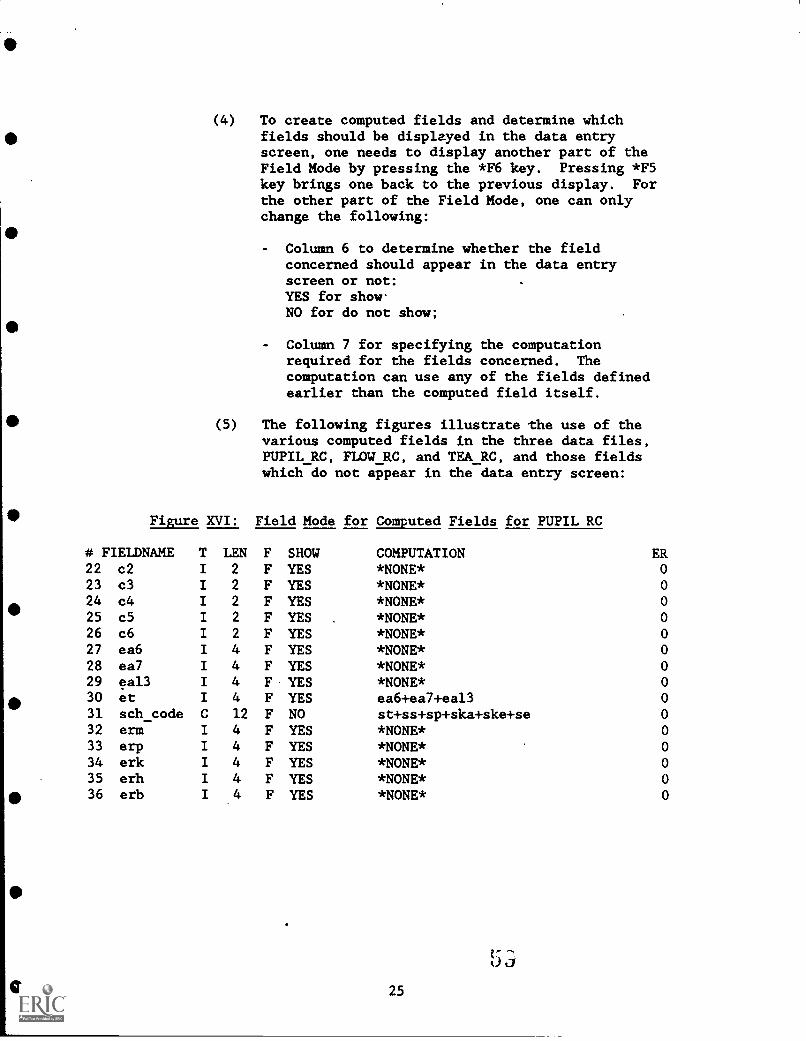
Figure
(4) To create computed fields and determine whichfields should be displayed in the data entryscreen, one needs to display another part of theField Mode by pressing the *F6 key. Pressing *F5key brings one back to the previous display. Forthe other part of the Field Mode, one can onlychange the following:
Column 6 to determine whether the fieldconcerned should appear in the data entryscreen or not:YES for show-NO for do not show;
- Column 7 for specifying the computationrequired for the fields concerned. Thecomputation can use any of the fields definedearlier than the computed field itself.
(5) The following figures illustrate the use of thevarious computed fields in the three data files,PUPIL RC, FLOW RC, and TEA RC, and those fieldswhich do not appear in the data entry screen:
XVI: Field Mode for Computed Fields for PUPIL RC
# FIELDNAME T LEN F SHOW COMPUTATION ER22 c2 I 2 F YES *NONE* 0
23 c3 I 2 F YES *NONE* 0
24 c4 I 2 F YES *NONE* 0
25 c5 I 2 F YES *NONE* 0
26 c6 I 2 F YES *NONE* 0
27 ea6 I 4 F YES *NONE* 0
28 ea7 I 4 F YES *NONE* 0
29 eal3 I 4 F YES *NONE* 0
30 et I 4 F YES ea6+ea7+eal3 0
31 sch_code C 12 F NO st+ss+sp+ska+ske+se 0
32 erm I 4 F YES *NONE* 0
33 erp I 4 F YES *NONE* 0
34 erk I 4 F YES *NONE* 0
35 erh I 4 F YES *NONE* 0
36 erb I 4 F YES *NONE* 0
0 25

Figure XVII: Field Mode for Computed Fields for FLOW RC
# FIELDNAME T LEN F SHOW COMPUTATION ER
22 rt3 I 2 F YES *NONE* 0
23 rt4 I 2 F YES *NONE* 0
24 rt5 I 2 F YES *NONE* 0
25 rt6 I 2 F YES *NONE* 0
26 sch_code C 12 F NO st+ss+sp+ska+ske+se 0
27 rtt I 3 F YES rtl+rt2+rt3+rt4+rt5+rt6 0
28 eyt I 3 F YES ey6+ey7+ey8+ey9+ey10 0

Figure XVIII: Field Mode for Computed Fields for TEA RC
# FIELDNAME T LEN F SHOW COMPUTATION ER0 MQ_MODE C 7 YES *NONE* 3
1 yr I 4 F YES *NO!IE* 0
2 st C 2 F YES *NONE* 0
3 ss C 1 F YES *NONE* 0
4 sp C 2 0 YES *NONE* 0
5 ska C 2 1 YES *NONE* 0
6 ske C 2 2 YES *NONE* 0
7 se C 3 3 YES *NONE* 0
8 sess C 1 F YES *NONE* 0
9 ap I 2 F YES *NONE* 0
10 1p I 2 F YES *NONE* 0
11 tp I 3 F YES ap+lp 012 an I 2 F YES *NONE* 013 In I 2 F YES *NONE* 0
14 to I 3 F YES an+ln 0
15 tm I 3 F YES *NONE* 0
16 ft I 3 F YES *NONE* 0
17 tt I 3 F YES tm+tf 0
18 npl I 2 F YES *NONE* 0
19 np2 I 2 F YES *NONE* 0
20 np3 I 2 F YES *NONE* 021 np4 I 2 F YES *NONE* 0
22 np5 I 2 F YES *NONE* 023 np6 I 2 F YES *NONE* 0
24 np7 I 2 F YES *NONE* 0
25 np8 I 2 F YES *NONE* 0
26 npt I 3 F YES npl+np2+np3+np4+np5+np6+np7+np8 0
27 ph I 2 F YES *NONE* 0
28 pc I 2 F YES *NONE* 0
29 pr T 2 F YES *NONE* 0
30 ps I 2 F YES *NONE* 0
31 pt I 3 F YES ph+pc+pr+ps 0
32 nh I 2 F YES *NONE* 0
33 nc I 2 F YES *NONE* 0
34 nr I 2 F YES *NONE* 0
35 ns I 2 F YES *NONE* 0
36 nt I 3 F YES nh+nc+nr+ns 0
37 sch_code C 12 F NO st+ss+sp+ska+ske+se 0
38 nqt I 3 F NO npl+np3+np5 0
39 nht I 2 F NO ph+nh 0
40 nct I 2 F NO pc+nc 041 nrt I 2 F NO pr+nr 0
42 nst I 2 F NO ps+ns 0
43 gtt I 3 F YES pt+nt 0
27 G
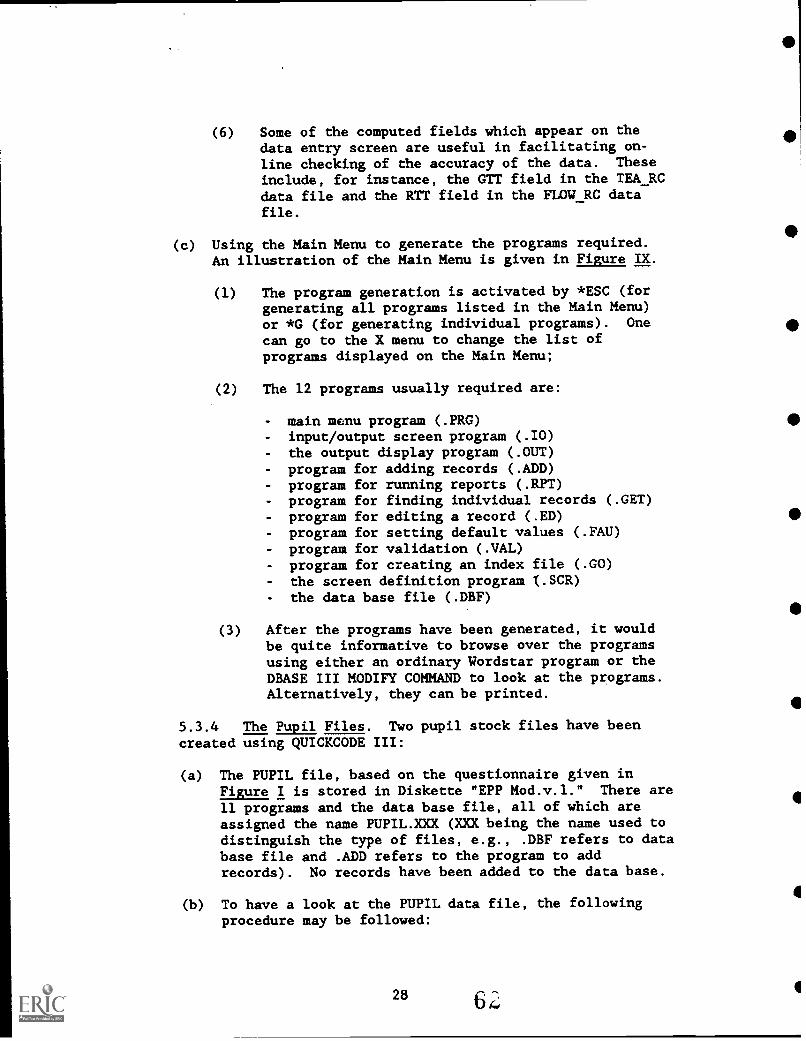
(6) Some of the computed fields which appear on thedata entry screen are useful in facilitating on-line checking of the accuracy of the data. Theseinclude, for instance, the GTT field in the TEA_RCdata file and the RTT field in the FLOW RC datafile.
(c) Using the Main Menu to generate the programs required.An illustration of the Main Menu is given in Figure IX.
(1) The program generation is activated by *ESC (forgenerating all programs listed in the Main Menu)or *G (for generating individual programs). One
can go to the X menu to change the list ofprograms displayed on the Main Menu;
(2) The 12 programs usually required are:
main menu program (.PRG)input/output screen program (.10)the output display program (.OUT)program for adding records (.ADD)program for running reports (.RPT)program for finding individual records (.GET)program for editing a record (.ED)program for setting default values (.FAU)program for validation (.VAL)program for creating an index file (.G0)the screen definition program (.SCR)the data base file (.DBF)
(3) After the programs have been generated, it wouldbe quite informative to browse over the programsusing either an ordinary Wordstar program or theDBASE III MODIFY COMMAND to look at the programs.Alternatively, they can be printed.
5.3.4 The Pupil Files. Two pupil stock files have beencreated using QUICKCODE III:
(a) The PUPIL file, based on the questionnaire given inFigure I is stored in Diskette "EPP Mod.v.l." There are11 programs and the data base file, all of which areassigned the name PUPIL.XXX (XXX being the name used todistinguish the type of files, e.g., .DBF refers to database file and .ADD refers to the program to addrecords). No records have been added to the data base.
(b) To have a look at the PUPIL data file, the followingprocedure may be followed:
28

(1) Start up DBASE III from Drive C or Drive B, andput the Diskette in Drive A;
(2) *SET DEFAULT TO A
(3) *DO PUPIL will tell DBASE III to run the programcalled PUPIL.PRG which will display a screen fromwhich different programs can be selected:
ADD program for adding records. It is usefulto examine the data input screen design;
GET/EDIT program for retrieving and editingindividual records;
- INDEX program is to create the Index filePUPIL.NDX according to the index keys createdin the GO program. The index keys are definedin the Field Mode;
RUN report program is to run reports usingreport format already defined or create reportsusing the DBASE III report generator.
(4) A specimen screen for the program menu generatedby the PUPIL_RC.PRG program is shown in Figure XIXbelow:
Figure XIX: Screen Design for PUPIL RC.PRG
41 MAIN MENU
SYSTEM: pupil_rc DBF: pupil_rc
A to ADD dataG to GET/EDIT dataR to RUN report
I to INDEX data base
Q to QUIT (exit to DOS)D to return to DBASE III
PLEASE ENTER YOUR CHOICE:
(c) The pupil file which will be used for demonstration inthis module is the PUPIL RC file. It is based on thequestionnaire "Format RC" used by Balitbang. The data
29UJ

file is contained in the Diskette "EPP Mod.v.2." Thefollowing procedure may be used in examining this datafile:
(1) Start up DBASE III from Drive C or Drive B and putthe Diskette in Drive A;
(2) *SET DEFAULT TO A;
(3) *USE PUPIL RC;
(4) *LIST STRUCTURE TO PRINT. This will give the database structure of PUPIL RC, as follows:
30
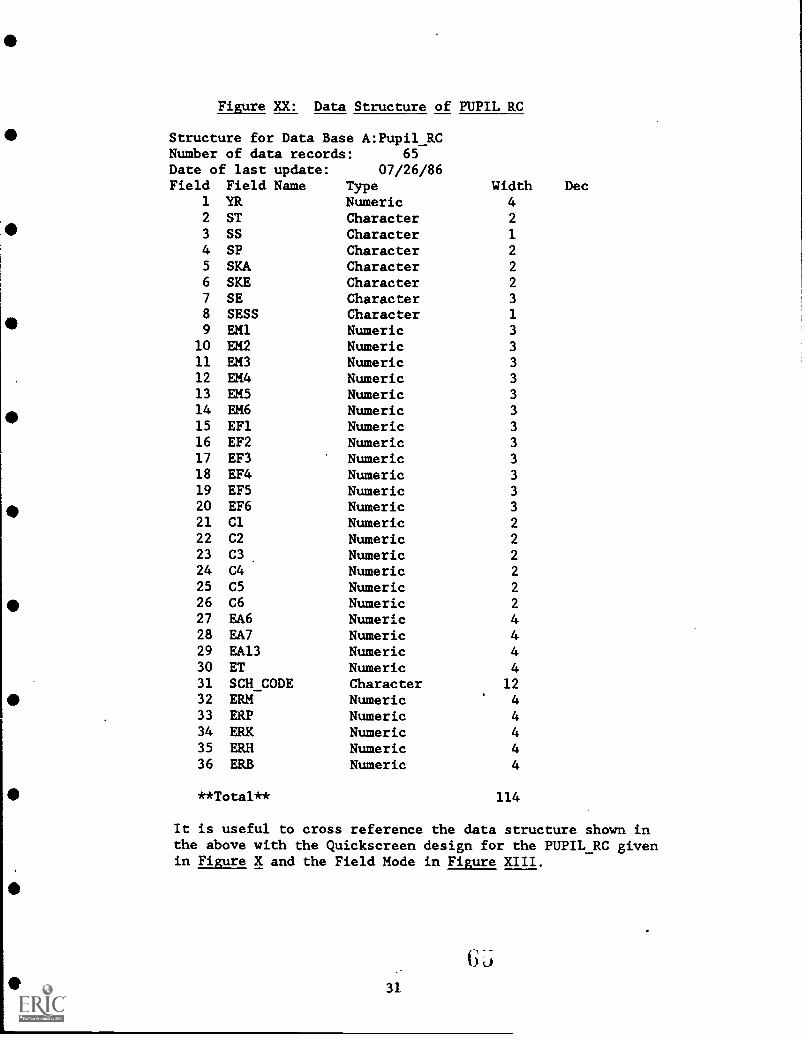
Figure XX: Data Structure of PUPIL RC
Structure for Data Base A:Pupil_RCNumber of data records: 65Date of last update: 07/26/86Field Field Name Type Width Dec
1 YR Numeric 42 ST Character 2
3 SS Character 1
4 SP Character 2
5 SKA Character 2
6 SKE Character 2
7 SE Character 3
8 SESS Character 1
9 EM1 Numeric 3
10 EM2 Numeric 3
11 EM3 Numeric 3
12 EM4 Numeric 3
13 EM5 Numeric 3
14 EM615 EF1
NumericNumeric
3
3
16 EF2 Numeric 3
17 EF3 Numeric 3
18 EF4 Numeric 3
19 EF5 Numeric 3
20 EF6 Numeric 3
21 Cl Numeric 2
22 C2 Numeric 2
23 C3 Numeric 2
24 C4 Numeric 2
25 C5 Numeric 2
26 C6 Numeric 2
27 EA6 Numeric 428 EA7 Numeric 429 EA13 Numeric 430 ET Numeric 431 SCH_CODE Character 1232 ERM Numeric
.
433 ERP Numeric 434 ERK Numeric 435 ERH Numeric 436 ERB Numeric 4
**Total** 114
It is useful to cross reference the data structure shown inthe above with the Quickscreen design for the PUPIL_RC givenin Figure X and the Field Mode in Figure XIII.
31

(5) To add records, browse or edit the existingrecords in the PUPIL_RC data base, one can use theDBASE III command such as APPEND, BROWSE or EDIT.However, it would be more convenient to use thevarious programs generated by QUICKCODE III, whichwill present the data in a better manner on thescreen:
- *DO PUPIL RC to run the menu program;
- From the menu, one can select a variety offunctions such as ldd, get, or edit.
5.3.5 Pupil Flow Files. Two data files have also beencreated for the pupil flow data:
(a) The FLOW data file which is modeled on the questionnairedesign given in Figure II. This data file is only usedfor demonstration purposes as no data have been addedinto the file.
(b) The FLOW_RC data file which is based on thequestionnaire "Format RC" used by the Balitbang.Sample records have been added into this data file.
(c) To view the design of FLOW, the following procedure maybe taken:
(1) Start up DBASE III from Drive C or Drive B, andput the Diskette "EPP Mod.v.1" in Drive A;
(2) *SET DEFAULT TO A;
(3) *DO FLOW to start up the Flow program menu fromwhich a variety of functions such as add, get andedit may be performed.
(d) To view the data in the FLOW_RC file, the followingprocedure may be taken:
(1) Start up DBASE III from Drive C or Drive B and putthe Diskette "EPP Mod.v.3" in Drive A;
(2) *SET DEFAULT TO A;
(3) *USE FLOWRC to open the data file;
(4) *LIST STRUCTURE TO PRINT to examine the datastructure of the file. The following shouldappear on the printer:
32

Figure XXI: Data Structure for FLOW RC
Structure for data base: A:flow_rc.dbfNumber of data records: 67
Date of last update: 07/27/86Field Field Name Type Width Dec
1 YR Numeric 42 ST Character 2
3 SS Character 1
4 SP Character 2
5 SKA Character 2
6 SKE Character 2
7 SE Character 3
8 SESS9 GL
CharacterNumeric
1
3
10 GT Numeric 3
11 GP Numeric 3
12 E1R Numeric 3
13 E1P Numeric 3
14 E1A Numeric 3
15 EY6 Numeric 3
16 EY7 Numeric 3
17 EY8 Numeric 3
18 EY9 Numeric 3
19 EY10 Numeric 3
20 RT1 Numeric 2
21 RT2 Numeric 2
22 RT3 Numeric 2
23 RT4 Numeric 2
24 RT5 Numeric 2
25 RT6 Numeric 2
26 SCH_CODE Character 1227 RTT Numeric 3
28 EYT Numeric 3
**Total** 81
It would be useful to cross-reference the above datastructure with the Quickscreen design for the data base,as shown in Figure XI and the corresponding Field Modedefinitions given in Figure XIV;
(5) The records in the FLOW_RC data base can be viewedor edited using the DBASE III commands such asEDIT, BROWSE, or DISPLAY as already discussed inthe previous subsections.
Alternatively, the menu program generated byQUICKCODE III can be used to add, retrieve orprint the records:
- *DO FLOW_RC;
33

- And select from the program menu a variety offunctions such as add, get, or edit.
5.3 6 Teacher Files. Two data files have also been created
for the Teacher File:
(a) One is the TEACHER file which is based on thequestionnaire design given in Figure III and is storedin the Diskette "EPP Mod.v.l." This file will be usedfor reference, and not for actual demonstration as norecords have been entered into the data base;
(b) The other is the TEA_RC file which is based on thequestionnaire Format RC and a number of records havebeen added into the data base. The data file, togetherwith other utility programs are stored in the Diskette"EPP Mod.v.2";
(c) To view the design of the data base TEACHER and theother programs generated, the following procedures maybe followed:
(1) Start up DBASE III from either Drive C or Drive Band put the Diskette "EPP Mod.v.l" in Drive A;
(2) *SET DEFAULT TO A, and *DO TEACHER; and selectfrom the program menu a variety of functions suchas add, get, and edit;
(d) To view the contents of the data base TEA_RC and runsome of the programs generated, the following proceduresmay be followed:
(1) Start up DBASE III from either Drive C or Drive Band put the diskette "EPP Mod.v.2" into Drive A;
(2) *SET. DEFAULT TO A, and *USE TEA_RC to open thedata base;
(3) *LIST STRUCTURE TO PRINT to print the data basestructure of TEA_RC, and the following should beprinted:
34
GE)
I
a

Figure XXII: Data Structure for TEA RC
Structure for data base: A:tea_rc.dbfNumber of data records: 67
Date of last update: 07/28/86Width Dec
42
1
2
2
2
3
1
2
2
3
2
2
3
3
3
3
2
2
2
2
2
2
2
2
3
2
2
2
2
3
2
2
2
2
3
12
3
2
2
2
2
3
**Total** 108
Field Field Name Type1 YR Numeric2 ST Character3 SS Character4 SP Character5 SKA Character6 SKE Character7 SE Character8 SESS Character9 AP Numeric
10 LP Numeric11 TP Numeric12 AN Numeric13 LN Numeric14 TN Numeric15 TM Numeric16 TF Numeric17 TT Numeric18 NP1 Numeric19 NP2 Numeric20 NP3 Numeric21 Ni'4 Numeric22 NP5 Numeric23 NP6 Numeric24 NP7 Numeric25 NP8 Numeric26 NPT Numeric27 PH Numeric28 PC Numeric29 PR Numeric30 PS Numeric31 PT Numeric32 NH Numeric33 NC .Numeric34 NR Numeric35 NS Numeric36 NT Numeric37 SCH_CODE Character38 NQT Numeric39 NHT Numeric40 NCT Numeric41 NRT Numeric42 NST Numeric43 GTT Numeric
Go35

It would be useful to cross-reference the abovedata structure with the Quickscreen design for thedata base, as shown in Figure XII, and thedefinitions used in the Field Mode as shown inFigure XV;
(4) *DO TEA RC to bring up the program menu, fromwhich a variety of functions such as add, get, andedit may be selected to run.
5.3.7 School File. Only one school file which is basedon the questionnaire design given in Figure IV, has beencreated using QUICKCODE III, namely SCHOOL. The data basefile and 11 utility programs generated are stored in theDiskette "EPP Mod.v.l." No record has been added into thisdata file. The following procedure may be followed toexamine the design of this data file:
(a) Start up DBASE III from either Drive C or Drive B, andput the Diskette "EPP Mod.v.l" into Drive A;
(b) *SET DEFAULT TO A, and *DO SCHOOL to bring up theprogram menu from which various othec programs may beselected to run.
6. Learning Activities
6.1 Microcomputer Tutorial Sessions
6.1.1 The purpose of the tutorial sessions is tofamiliarize the participants on the various techniques ondata base construction and usage which are discussed in theUser Manual section. In the User Manual Section, the varioussteps involved in constructing the four data files (namelythe school master "SCHMAS," pupil stock "PUPIL_RC," pupilflow "FLOW_RC," and teacher stock "TEAJC") have beenillustrated in detail. This is because it is considered offundamental importance to have the data base set up properlybefore any use can be made of the information stored in thedata base. The participants are required to go through bythemselves the various steps explained in the User ManualSection to:
(a) Construct 4 data files on pupil, pupil flow, teacher andschool master, following exactly the same design asproposed in the User Manual Section;
(b) Perform simple manipulations of the four data files by:
(1) Following the procedures suggested in the UserManual section;
36

(2) And exploring as well the use of other DBASE IIIfunctions and commands, which can be found in theapplication user manual. During this part of theexercise, the instructors will go through some ofthe commands that could be of use to theparticipants, which include, for instance:
GO TOP,DELETE, RECALL and PACK,COPY STRUCTURE,MODIFY STRUCTURE,CHANGE FIELDS.
6.1.2 It is stressed that the objective of the tutorialsessions is not to train the participants to becomeproficient programmers or users of the DBASE III language.It is important also to emphasize that the various commandsneed NOT be memorized, as there is on-line help and as thereis always the opportunity to consult the application usermanual. Furthermore, in view of the rapid development in thefield of computer hardware and software, any softwarepackage could easily become outdated very quickly.
6.2 Group Work Session
6.2.1 The OBJECTIVE of the group work session is tosensitize participants in the versatility and flexibility ofa computerized data.base, and the ease with which a data basecan be designed and modified.
6.2.2 The participants will be divided into groups. Basedon the results of the group discussion in Unit 2, theparticipants, working in groups, will be asked to:
(a) Identify data items which have been omitted from thedata bases (namely SCHMAS, PUPIL_RC, FLOW_RC and TEA_RC)which should be included;
(b) Comment on the design of the data base, in terms of:
(1) the format of the data input forms;(2) the relationship between fields for the computed
fields;
(3) additional computed fields that are considerednecessary;
(4) the choice of the index fields;
(c) Suggest any validation rules that could be built intothe data input system, which could be accommodated inthe QUICKCODE III system;
37

(d) And based on the results of the discussion in (a), (b)and (c) above, design and construct a differentinformation system comprising pupil, pupil flow,teacher, and school data bases. The techniques theyhave learned, as discussed in the User Manual section,may be employed to undertake this task.
6.2.3 The instructors would be available to help differentgroups of trainees in the group work sessions.
7. Post-assessment
7.1 The purpose of this post-assessment section is to help theinstructors evaluate to what extent the learners are able tounderstand the contents of the training materials and to performwhat is expected from them which is stated in the specificperformance objectives given for this Unit.
7.2 The participants are asked to undertake the followingexercise individually. However, if microcomputers are notavailable for each of the participants, they may have to work ingroups. The assignment is as follows:
(a) It is desired to develop a data base on pupils in aparticular province which could provide planners withthe following information:
(1) The total enrollment by sex in junior high schoolswhich have 3 grades from grade 1 to grade 3 in theprovince in question;
(2) The proportion of children in the junior highschool age group (i.e., 13-15 years) who areenrolled in the high schools;
(3) The proportion of overaged children in junior highschools;
(4) The estimated number of dropouts by grade fromjunior high schools.
(b) Other statistical information available is the number ofchildren in the 13-15 age range, by single years of age,for the province in question.
(c) The learners are expected to perform the followingtasks:
(1) Determine the dita items required to be collectedon pupils;
38 '4.1
r4

(2) Design the questionnaire for data collection;
(3) Create a pupil data base and design the data inputprogram for the pupil data file which will includeat least the following functions:
a screen format design for data input whichshould preferably be similar to the datacollection questionnaires;
adding data to the data base;
editing data and search for specific records inthe data base using the school code as index.
III. Unit 2: Information Retrieval
8. Performance Objectives
8.1 This is an introductory section on the topic of informationretrieval from the data bases constructed in the previous section.More in-depth discussion will be held in Module III on the Use ofthe Education Management Information System for Management Control.
8.2 Upon completion of this section, the participants areexpected to be able to:
(a) Do simple manipulation of the data stored in the data base,such as sum, average, and the creation of summary data files;
(b) Produce simple reports from the data bases.
9. Instructional Activities
9.1 Querying the Data Base
9.1.1 In the last section, a number of techniques have beendiscussed on retrieving information from the data base, usingcommand level language such as DISPLAY and BROWSE, as well asthe use of the GET and EDIT programs provided by QUICKCODEIII. The operation is essentially done at one data filelevel. Using the SET RELATION command, two data files maybe accessed at the same time. Furthermore, with the use ofprogramming and software like QUICKREPORT, more than two datafiles may be accessed at one time. Access to multiple databases will NOT be discussed in this Module, which will be thesubject for Module III.
39

9.1.2 One can specify the condition for the retrieval of
records from a data base, thus enhancing the usefulness of
the DISPLAY or BROWSE command. The ability of settingselection criteria in retrieving information is a verypowerful feature of many data base software packages like
DBASE III.
9.1.3 In addition, it may often be necessary to perform
simple calculations with a data base. For example, it may be
required to compile summary statistics such as the total
number of teachers, the average number of pupils per school
for the whole province, or for a selected district, or evenfor a given type of school within a selected district. These
summary statistics are required, for example, for stocktaking
purposes as discussed in paragraph 4.2.1(a). It is always
possible to compile such summary statistics from a database, making use of the arithmetic commands provided by
DBASE III. The next consideration would then be how to
capture the information. There could be several ways of
displaying and capturing the results:
(a) Displaying the results on-screen;
(b) Sending the results to a printer;
(c) When a lot of information is generated from thearithmetical operation, it would be wiser to try tostore the data so that the results could be retrieved at
a later stage, or used in another operation. To achieve
this, one can store the results in the memory variablesprovided by DBASE III;
(d) As the values stored in the memory variables woulddisappear once the machine is turned off, the resultscould also be stored to an external file on-disk.
9.2 Reporting
9.2.1 One of the commonest functions of data collection isfor the purposes of compiling various reports. Very often,because of the inflexibility .1.n the production of reportsprovided by an information system, piles of reports have tobe produced in advance in anticipation of possible demandfrom users. However, these reports in general are never
read or utilized by users. With a better designedcomputerized information system, reports that are notfrequently used need not be produced in advance, inanticipation of an unlikely requirement that might arise inthe course of time. These reports, required on an ad hocbasis, could easily be compiled from the data base, makinguse of a host of tabulation programmes available for both
mainframe computers and microcomputers.
40

9.2.2 Information stored in a computerized data base canalso be written onto a diskette or a removable hard disk ifthe data volume is very large. Such information can easilybe transported from the provincial offices to the centralministry. By doing so:
(a) Considerable amounts of clerical efforts required intranscribing the data can be saved;
(b) The data would be free froth manual errors of all sorts;
(c) The central ministry can then have access to the data inthe same level of details as the provincial offices,thus enabling:
- a better analysis of the statistics be made at thecentral ministry;
a more effective control and monitoring by thecentral ministry over the activities of theprovincial and district offices.
9.2.3 This subsection will examine the simple reportingfacilities that could be built into the computerizedinformation system. There are two main approaches:
(a) Information retrieval individually from the 5 data bases(pupil stock, pupil flow, teacher, school, and schoolmaster). This can be performed by:
(1) On-line inquiry using the Assistant facilitiesavailable in DBASE III to retrieve informationabout schools;
(2) The creation of a report form to generate reportsgiving information about a group of schools orsummary statistics about a given subdistrict,district, or province, or even about a given typeof school within the district specified;
(b) Information retrieval by linking several data bases.This enables information to be retrieved, for example,on pupils as well as teachers. One approach that can beadopted is to join two different data bases into one newfile. This is a more powerful feature of a relationaldata base like DBASE III. By doing so, a new filecontaining only information needed for the analysis canbe used to generate reports, bypassing the inconvenienceof having to create reports from multiple data files.This feature will be explored in detail in Module III.
7u;41

10. User Manual
10.1 Getting Started
10.1.1 The user manual is designed for both the instructoras well as the trainees. The purpose of this user manual isto put into DBASE III languages from the various functions
outlined in this unit, so that:
(a) The instructor can use it to demonstrate, during thepractical session, the various steps involved inretrieving information and producing reports from thedata bases;
(b) The trainees can follow the steps shown in doing theirpractical exercises.
10.1.2 The software package needed is DBASE III (Version 1.1
or Plus). The various programs and data files required forthe practical session are all contained in the Diskette "EPPMod.v.2." The files in the original diskette are protectedagainst modifications and deletions. It is thereforenecessary to create a backup of this diskette and to use the
backup in the practical sessions.
10.1.3 This user manual is divided into three parts asfollows:
(a) Part I introduces the techniques of querying the databases, displaying records selectively. This on-lineinquiry is useful in meeting, very quickly, the demandfor information about certain schools or types ofschools;
(b) Part II demonstrates the use of the arithmetic functionsof DBASE III in compiling summary statistics;
(c) Part III outlines the use of report generator to preparesimple reports on the data bases.
10.2 On-Line Inquiry
10.2.1 The techniques of querying the data bases using thecommands of DBASE III, such as BROWSE and DISPLAY, have beendemonstrated in the previous Unit. The facility allowed inDBASE III to select certain groups of records will bedemonstrated in this subsection. With this facility, anytypes of records can be selected for display either on thescreen, to the printer or to a file, provided there aresuitable keys in the data base to identify these groups ofrecords.

10.2.2 The following demonstrate one method of selectivelydisplaying a specified group of records:
(a) Start up DBASE III from either Drive C or Drive B, andput the Diskette "EPP Mod.v.2" in Drive A;
(b) *SET DEFAULT TO A;
(c) *USE PUPIL RC to open the data base PUPIL RC;
(d) *DISPLAY OFF SCH_CODE, ET FOR SKA"05" .AND. SKE"01",and the following would appear on the screen:sch_code et101230501001 284101230501002 201101230501003 341101230501004 249101230501005 147101230501006 182101230501007 220101230501008 327
101230501010 208101230501011 113
102230501032 196102230501033 269102230501034 287102230501035 148
102230501037 242102230501038 235
102230501039 275
102230501040 158102230501041 229102230501042 267
(e) The above procedure may be repeated for the FLOW_RC datafile by:*USE FLOW_RC
(f) *DISPLAY OFF SCH_CODE,GP,E1A,RTT FOR SKE"04" TO PRINT,and the following will be printed:sch_code gp ela rtt101230504001 21 43 15
101230504002 16 12 114101230504003101230504004
12
18
28
17
2
43101230504005 0 35 0
101230504006 9 0 1
101230504007 31 27 27
101230504008 13 14 26
101230504009 2 23 39
101230504010 21 20 18
101230504011 0 0 17
1143
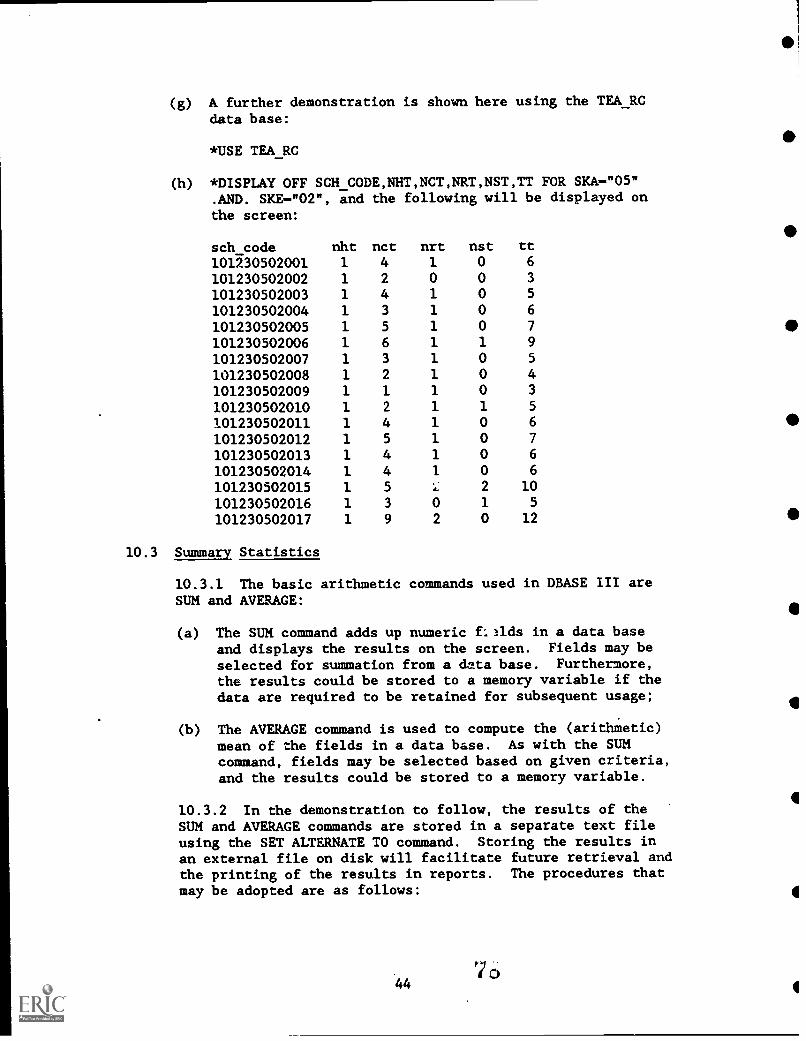
(g) A further demonstration is shown here using the TEA_RCdata base:
*USE TEA_RC
(h) *DISPLAY OFF SCH_CODE,NHT,NCT,NRT,NST,TT FOR SKA"05".AND. SKE"02", and the following will be displayed onthe screen:
sch code nht nct nrt nst tt
101230502001 1 4 1 0 6
101230502002 1 2 0 0 3
101230502003 1 4 1 0 5
101230502004 1 3 1 0 6
101230502005 1 5 1 0 7
101230502006 1 6 1 1 9
101230502007 1 3 1 0 5
101230502008 1 2 1 0 4
101230502009 1 1 1 0 3
101230502010 1 2 1 1 5
101230502011 1 4 1 0 6
101230502012 1 5 1 0 7
101230502013 1 4 1 0 6
101230502014 1 4 1 0 6
101230502015 1 5 2 10
101230502016 1 3 0 1 5
101230502017 1 9 2 0 12
10.3 Summary Statistics
10.3.1 The basic arithmetic commands used in DBASE III areSUM and AVERAGE:
(a) The SUM command adds up numeric f. Ids in a data baseand displays the results on the screen. Fields may beselected for summation from a data base. Furthermore,the results could be stored to a memory variable if thedata are required to be retained for subsequent usage;
(b) The AVERAGE command is used to compute the (arithmetic)mean of the fields in a data base. As with the SUMcommand, fields may be selected based on given criteria,and the results could be stored to a memory variable.
10.3.2 In the demonstration to follow, the results of theSUM and AVERAGE commands are stored in a separate text fileusing the SET ALTERNATE TO command. Storing the results inan external file on disk will facilitate future retrieval andthe printing of the results in reports. The procedures thatmay be adopted are as follows:
447 0

(a) Start up DBASE III in either Drive C or Drive B, and putthe Diskette "EPP Mod.v.3" in Drive A;
(b) *SET DEFAULT TO A;
(c) *USE PUPIL RC to open the data base PUPIL RC;
(d) *SET ALTERNATE TO PU, and the results will be stored inan external text file called PU.TXT in the Diskette "EPPMod.v.3";
(e) *SET ALTERNATE ON;
(f) *SUM ALL Cl,C2,C3,C4,C5,C6,ET gives the summarystatistics on the total number of classes by grade andthe total enrollment. The following will be written toPU.TXT as well as displayed on the screen:
65 records summedcl c2 c3 c4 c5 c6 et76 70 66 65 62 72 11785
(g) *SUM ALL Cl,C2,C3,C4,C5,C6,ET FOR SKE -"Ol", and thiswill cause the selection of those schools in thesubdistrict with the code of "01." This gives the totalnumber of class - ..s by grade and the total enrollment insubdistrict "01." The following will be written to thePU.TXT as well as displayed on the screen:
. sum all cl, c2, c3, c4, c5, c6, et forske-"01"
20 records summedcl c2 c3 c4 c5 c6 et28 27 24 22 22 19 4578
(h) *SUM ALL Cl,C2,C3,C4,C5,C6 FOR SKE-"04", causes theselection of only those schools in the subdistrict withthe code of "04." This gives the total number ofclasses and the total enrollment in subdistrict "04."The following will be written to the PU.TXT anddisplayed on the screen:
. sum all cl, c2, c3, c4, c5, c6 for ske-"04"11 records summed
cl c2 c3 c4 c5 c611 10 11 11 9 8
(i) *AVERAGE EMLEFLET gives the average male and femaleenrollment in Primary 1 and the average total enrollmentper school. The following will be written to PU.TXT anddisplayed on the screen:
45
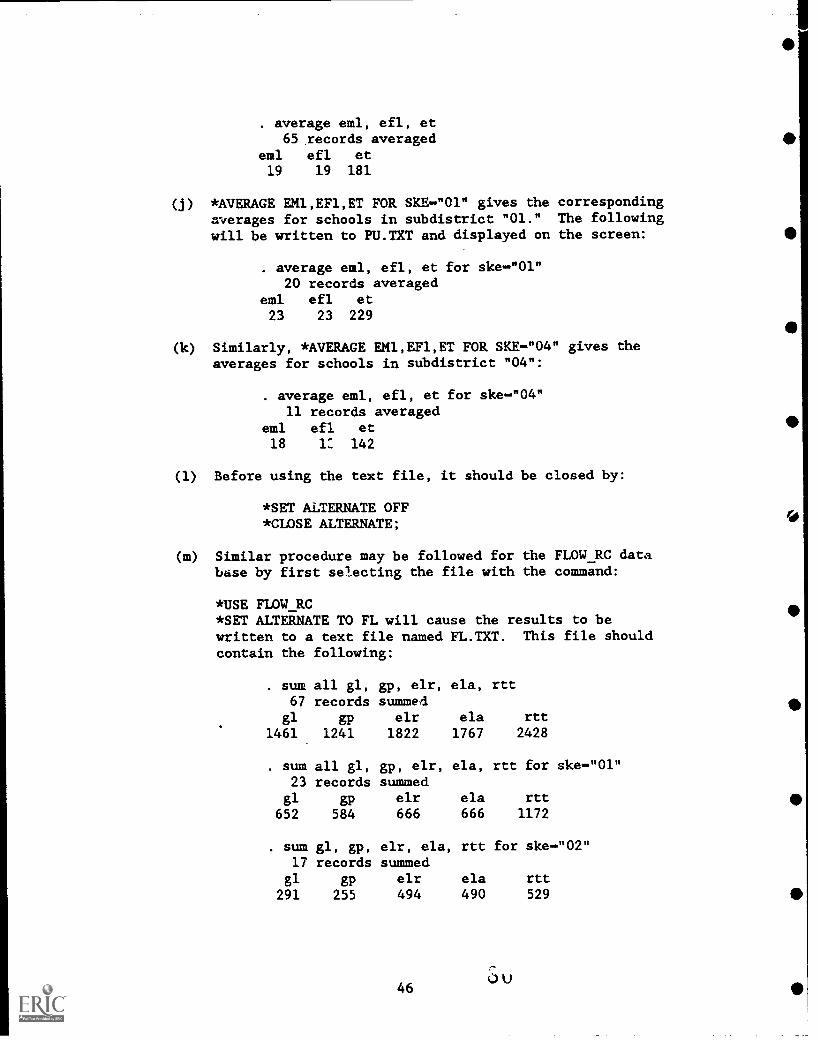
. average eml, efl, et65 ,records averaged
eml efl et19 19 181
*AVERAGE EM1,EF1,ET FOR SKE-"01" gives the correspondingaverages for schools in subdistrict "01." The followingwill be written to PU.TXT and displayed on the screen:
. average eml, efl, et for ske-"01"20 records averaged
eml efl et23 23 229
(k) Similarly, *AVERAGE EM1,EF1,ET FOR SKE-"04" gives theaverages for schools in subdistrict "04":
. average eml, efl, et for ske-"04"11 records averaged
eml efl et18 1: 142
(1) Before using the text file, it should be closed by:
*SET ALTERNATE OFF*CLOSE ALTERNATE;
(m) Similar procedure may be followed for the FLOW_RC database by first selecting the file with the command:
*USE FLOW_RC*SET ALTERNATE TO FL will cause the results to bewritten to a text file named FL.TXT. This file shouldcontain the following:
sum all gl, gp, elr, ela, rtt67 records summed
gl gp elr ela rtt
1461 1241 1822 1767 2428
. sum all gl, gp, elr, ela, rtt for ske-"01"23 records summed
gl gp elr ela rtt
652 584 666 666 1172
. sum gl, gp, elr, ela, rtt for ske-"02"17 records summed
gl gp elr ela rtt291 255 494 490 529
46

. sum gl, gp, elr, ela, rtt for ske"03"16 records summed
gl gp elr ela rtt325 259 443 392 425
. average gl, gp, elr, rtt67 records averaged
gl gp elr ela rtt22 19 27 26 36
. average gl, gp, elr, ela, rtt for ske"01"23 records averaged
gl gp elr ela rtt28 25 29 29 51
. average gl, gp, elr, ela, rtt for ske"02"17 records averaged
gl gp elr ela rtt17 15 29 29 31
. average gl, gp, elr, ela, rtt for ske"03"16 records averaged
gl gp elr ela rtt20 16 28 24 27
(n) For the TEA RC file, a similar text file has also beencreated (named TE.TXT) and stored in the Diskette "EPPMod.v.2." This file should contain the following:
. sum.all tm, tf, tt, nqt, nht, nct, nrt, nst, forske"01"
23 records summedtm tf tt nqt nht nct nrt nst
128 84 212 7 23 155 23 11
. sum all tm, tf, tt, nqt, nht, nct, nrt, nst, forske "02"
17 records summedtm tf tt nqt nht nct nrt nst85 20 105 0 17 66 17 5
. sum all tm, tf, tt, nqt, nht, nct, nrt, nst, forske"03"
16 records summedtm tf tt nqt nht nct nrt nst
111 24 135 0 16 96 18 6
. sum all tm, tf, tt, nqt, nht, nct, nrt, nst, forske"04"
11 records summedtm tf tt nqt nht nct nrt nst54 10 64 0 10 38 11 5
47

. sum all tm, tf, tt, nqt, nht, nct, nrt, nst, for67 records summed
tm tf tt nqt nht nct nrt nst
378 138 516 7 66 355 69 27
. average tm, tf, tt, nht, nct, nrt, nst67 records averaged
tm tf tt nht nct nrt nst6 2 8 1 5 1 0
. average tm, tf, tt, nht, nct, nrt, nst forske-001"
23 records averagedtm tf tt nht nct nrt nst
6 4 9 1 7 1 0
. average tm, tf, tt, nht, nct, nrt, nst forske-"02"
17 records averagedtm tf tt nht nct nrt nst
5 1 6 1 4 1 0
. average tm, tf, tt, nht, nct, nrt, nst forske-"03"
16 records averagedtm tf tt nht nct nrt nst
7 2 8 1 6 1 0
. average tm, tf, tt, nht, nct, nrt, nst forske - "04"
11 records averagedtm tf tt nht nct nrt nst
5 1 6 1 3 1 0
10.3.3 Another powerful command of DBASE III in providingsummary statistics is the TOTAL command. Like the SUMcommand, it adds up the values of the numeric fields in adata base. However, the totals can be added based on agrouping key. The results are summarized in a new data base.In other words, a summary data file is created by the TOTALcommand, with each subtotal being a record in the new database. The original data base must be indexed on the keyfield which determines where the subtotal breaks occur.Using the field option, one can select the fields to betotaled. The following procedures may be followed increating the summary files:
(a) Start up DBASE III in either Drive C or Drive B, and putthe Diskette "EPP Mod.v.3" in Drive A;
(b) *SET DEFAULT TO A;
48

e
0
0
0
S
(c) As the TOTAL will create numeric totals which may causethe data fields in the existing data file to overflow,it would be necessary to increase the field length toavoid overflow. Thus, a duplicate data base has to becreated in order to avoid disturbing the original datafile. In the following demonstration, the PUPIL_RC database will be used. A duplicate PUPIL1 has been createdusing:
*USE PUPIL_RC*COPY TO PUPIL;
(d) The duplicate PUPIL1 will be used for the demonstration:
*USE PUPILl, to open the PUPIL1 and close the PUPIL RC;
*MODIFY STRUCTURE to increase the field lengths;
*DISPLAY STRUCTURE will give the new structure forPUPIL1 as follows:

Structure for data base A:pupill.dbfNumber of data records: 65
Date of last update: 08/10/86
Field Field Name Type Width Dec
1 YR Character 4
2 ST3 SS
CharacterCharacter
2
1
4 SP Character 2
5 SKA Character 2
6 SKE Character 2
7. SE Character 3
8 SESS Character 1
9 EM1 Numeric 5
10 EM2 Numeric 5
11 EM3 Numeric 5
12 EM4 Numeric 5
13 EM5 Numeric 5
14 EM6 Numeric 5
15 EF1 Numeric 5
16 EF2 Numeric 5
17 EF3 Numeric 5
18 EF4 Numeric 5
19 EF5 Numeric 5
20 EF6 Numeric 5
21 Cl Numeric 4
22 C2 Numeric 4
23 C3 Numeric 4
24 C4 Numeric 4
25 C5 Numeric 4
26 C6 Numeric 4
27 EA6 Numeric 6
28 EA7 Numeric 6
29 EA13 Numeric 6
30 ET Numeric 6
31 SCH_CODE Character 12
32 ERM Numeric 6
33 ERP Numeric 6
34 ERK Numeric 6
35 ERH Numeric 6
36 ERB Numeric 6
**Total** 168
50

(e) Before using the TOTAL command, the new data file has tobe indexed on the key field which determines thebreaking subtotals. In this case, the subdistrict field"SKE" will be used as the index:
*INDEX ON SKE TO PU1SKE, which creates a new index filecalled PU1SKE.NDX;
(f) *TOTAL ON SKE TO PU1RP and the following will show up onthe screen:
65 Record(s) totaled4 Records generated
This means a new data base with only 4 records, eachrepresenting the totals for a subdistrict, has beencreated. The new data base has been named as PU1RP;
(g) *USE PU1RP to open this data base and then to view itscontent;
(h) *DISPLAY STRUCTURE will give the following:

Structure for data base A:pulrp.dbfNumber of data records: 4
Date of last update: 08/10/86Field Field Name Type Width Dec
1 YR Character 4
2 ST Character 2
3 SS Character 1
4 SP Character 2
5 SKA Character 2
6 SKE Character 2
7 SE Character 3
8 SESS Character 1
9 EM1 Numeric 5
10 EM2 Numeric 5
11 EM3 Numeric 5
12 EM4 Numeric 5
13 EM5 Numeric 5
14 EM6 Numeric 5
15 EF1 Numeric 5
16 EF2 Numeric 5
17 EF3 Numeric 5
18 EF4 Numeric 5
19 EF5 Numeric 5
20 EF6 Numeric 5
21 Cl Numeric 4
22 C2 Numeric 4
23 C3 Numeric 4
24 C425 C5
NumericNumeric
44
26 C6 Numee.c 4
27 EA6 Numeric 6
28 EA7 Numeric 6
29 EA13 Numeric 6
30 ET Numeric 6
31 SCH_CODE Character 12
32 ERM Numeric 6
33 ERP Numeric 6
34 ERK Numeric 6
35 ERH Numeric 6
36 ERB Numeric 6
**Total** 168
52 coo
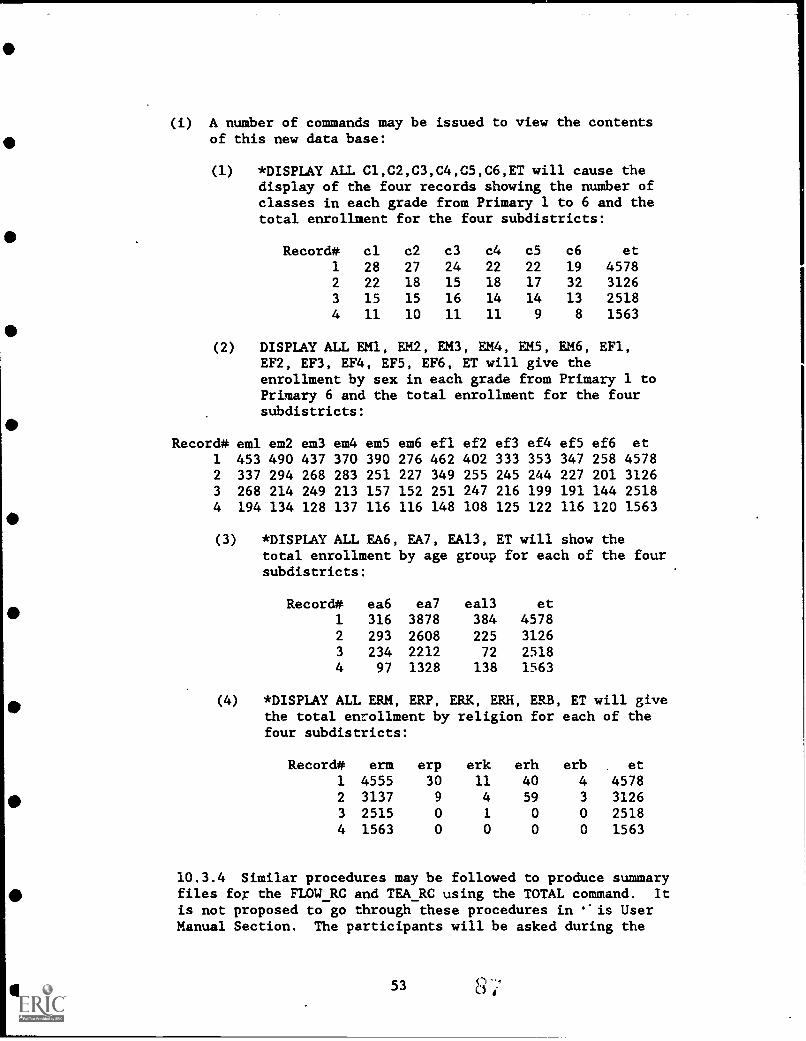
(i) A number of commands may be issued to view the contentsof this new data base:
(1) *DISPLAY ALL C1,C2,C3,C4,C5,C6,ET will cause thedisplay of the four records showing the number ofclasses in each grade from Primary 1 to 6 and thetotal enrollment for the four subdistricts:
Record* cl c2 c3 c4 c5 c6 et1 28 27 24 22 22 19 45782 22 18 15 18 17 32 31263 15 15 16 14 14 13 25184 11 10 11 11 9 8 1563
(2) DISPLAY ALL EM1, En, EM3, EM4, EMS, EM6, EF1,EF2, EF3, EF4, EFS, EF6, ET will give theenrollment by sex in each grade from Primary 1 toPrimary 6 and the total enrollment for the foursubdistricts:
Record# eml em2 em3 em4 em5 em6 efl ef2 ef3 ef4 ef5 ef6 et1 453 490 437 370 390 276 462 402 333 353 347 258 45782 337 294 268 283 251 227 349 255 245 244 227 201 31263 268 214 249 213 157 152 251 247 216 199 191 144 25184 194 134 128 137 116 116 148 108 125 122 116 120 1563
(3) *DISPLAY ALL EA6, EA7, EA13, ET will show thetotal enrollment by age group for each of the foursubdistricts:
Record# ea6 ea7 eal3 et1 316 3878 384 45782 293 2608 225 31263 234 2212 72 25184 97 1328 138 1563
(4) *DISPLAY ALL ERM, ERP, ERK, ERH, ERB, ET will givethe total enrollment by religion for each of thefour subdistricts:
Record# erm erp erk erh erb . et1 4555 30 11 40 4 45782 3137 9 4 59 3 3126
3 2515 0 1 0 0 25184 1563 0 0 0 0 1563
10.3.4 Similar procedures may be followed to produce summaryfiles fog the FLOW_RC and TEA_RC using the TOTAL command. It
is not proposed to go through these procedures in ''is UserManual Section. The participants will be asked during the
53

practical sessions to try to create summary files for theFLOW_RC and TEA_RC data bases (see Trainee Activitiessubsection below).
10.4 Compilation of Simple Reports
10.4.1 In the previous sections, the various commands likeDISPLAY have been discussed, which could be used to producelisting of records very quickly. In this subsection, theautomatic report generator provided in the DBASE III systemwill be discussed for creating simple reports from a singledata base. In Module III, more complicated reportcompilation using multiple data bases will be discussed.
10.4.2 The automatic report generator is very easy to use.It can provide totals as well as subtotals for the reportgenerated. Once the report format (whose file name has theextension ".frm") ha been defined, it can be usedrepeatedly, Needless to say, one has to plan the format ofthe report before activating the report generator. Thefollowing procedures may be followed in creating a reportusing the report generator:
(a) The TEA_RC data base will be used as an illustration.First of all, one has to start up DBASE III in eitherDrive C or Drive B, and put the Diskette "EPP MOD.v.3"in Drive A;
(b) *SET DEFAULT TO A,*USE TEA RC;
(c) If subtotals are required for certain fields like theprovince (SP), district (SKA) or subdistrict (SKE), onehas to index the data base first so that the data basecan be accessed in a sequence set down by the indexfields:
*INDEX ON SKE TO TESKE which will create an index fileTESKE.NDX;
(d) To create a report format type:
*CREATE REPORT TERP1 where TERP1 is the file nameassigned to the report format, and a full-screen modewill appear. By following the instructions given,resorting to on-line help where required by pressing*F1, one can create a report on, for exaaple, the numberof teachers by sex and the rimber of nonteaching staffby status, with subtotals given for each subdistrict.The following fields need to be included in the report:
54
I
I

(1) SCH_CODE for school code;(2) TM for the number of male teachers;(3) TF for the number of female teacher:.;(4) TT for the total number of teachers;(5) TP for the number of public nonteaching staff;(6) TN for the number of nonpublic nonteaching
staff;
(e) After the report headings and fields have been definedand selected, the screen will look like the following:
Options Groups Columns Locate Exit 08:06:18 pm
SCHCODETMTFTTTPTN
Report FormatSchool Total No. of Teachers by Sex Nonteaching StaffCode
Male Female Total Public Nonpublic
XXX'aXXMC ### ### 4*## ### ###
CREATE REPORT I<A:>ITERP1.FRM 'Opt: 1/6I I
Position selection bar - . Select - - +. Leave Menu - .
Step to any column immediately by selecting the column expression.
(f) To run the report, one may select the option of printingonly the summary totals for each subgroup defined (i.e.,subdistricts in this case) by issuing the followingcommand:
*REPORT FORM TERP1 SUMMARY and the report will be shownon the screen. Alternatively, the report can be printedor written to an external text file on disk:
*REPORT FORM TERP1 TO PRINT SUMMARY, or*REPORT FORM TERP1 TO FILE TE1 SUMMARY.
The following report should be shown:
55 8,3

Page No.08/11/86
1
Teacher Statistics by Subdistrict
School Total No. of Teachers by Sex
Code Male Female Total
**Subdistrict Code: 01**Subtotal**
Nonteaching StaffPublic Nonpublic
128 84 212 21 0
**Subdistrict Code: 02**Subtotal**
85 20 105 5 0
**Subdistrict Code: 03**Subtotal**
111 24 135 11 0
**Subdistrict Code: 04**Subtotal**
54 10 64 3 0
*** Total *** 378 138 516 40 0
(g) Selection criterion may be introduced so that only
schools for a certain subdistrict will be printed on the
report. For example:
*REPORT FORM TERP1 FOR SKA-"05" .AND. SKE-"01" and the
following report should be shown:
56
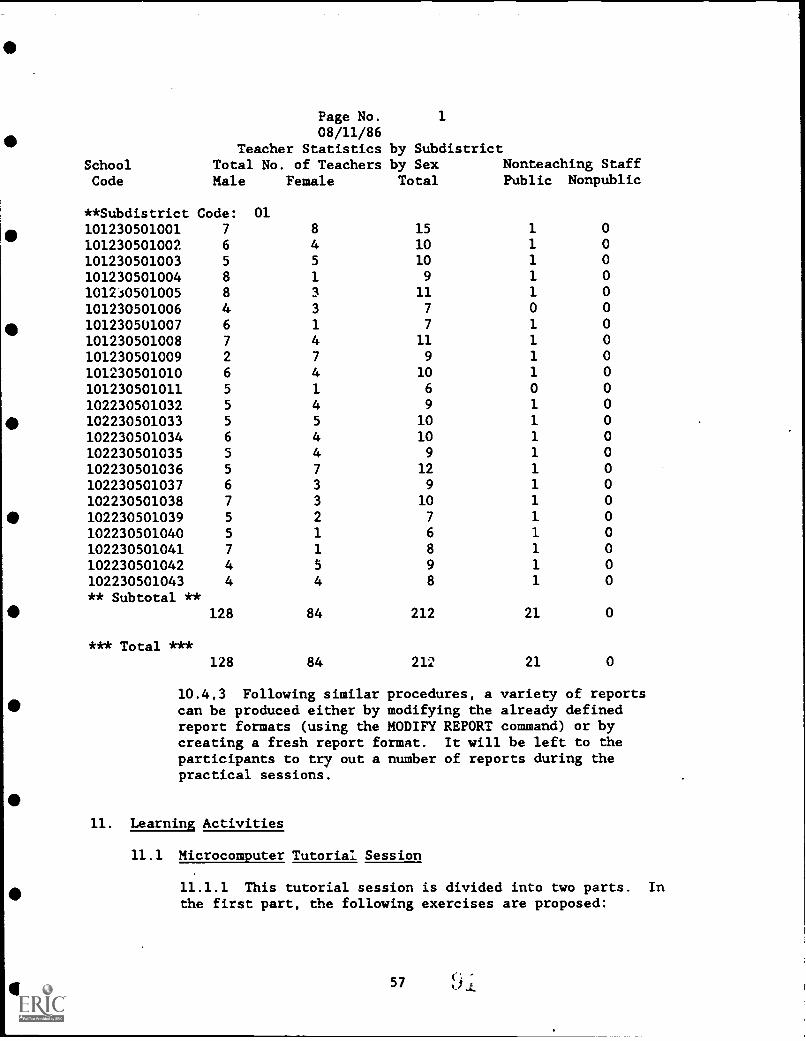
Page No. 1
08/11/86Teacher Statistics by Subdistrict
School Total No. of Teachers by SexCode Male Female Total
**Subdistrict Code: 01
Nonteaching StaffPublic Nonpublic
101230501001 7 8 15 1 0
101230501002 6 4 10 1 0
101230501003 5 5 10 1 0
101230501004 8 1 9 1 0
1012s0501005 8 3 11 1 0
101230501006 4 3 7 0 0
0 101230501007101230501008
6
7
1
47
11
1
1
00
101230501009 2 7 9 1 0
101230501010 6 4 10 1 0
101230501011 5 1 6 0 0
102230501032 5 4 9 1 0
0 102230501033 5 5 10 1 0
102230501034 6 4 10 1 0
102230501035 5 4 9 1 0
102230501036 5 7 12 1 0
102230501037 6 3 9 1 0
102230501038 7 3 10 1 0
102230501039 5 2 7 1 0
102230501040 5 1 6 1 0
102230501041 7 1 8 1 0
102230501042 4 5 9 1 0
102230501043 4 4 8 1 0
** Subtotal **0 128 84 212 21 0
*** Total ***128 84 212 21 0
10.4,3 Following similar procedures, a variety of reportscan be produced either by modifying the already definedreport formats (using the MODIFY REPORT command) or bycreating a fresh report format. It will be left to theparticipants to try out a number of reports during thepractical sessions.
11. Learning Activities
11.1 Microcomputer Tutorial Session
11.1.1 This tutorial session is divided into two parts. Inthe first part, the following exercises are proposed:
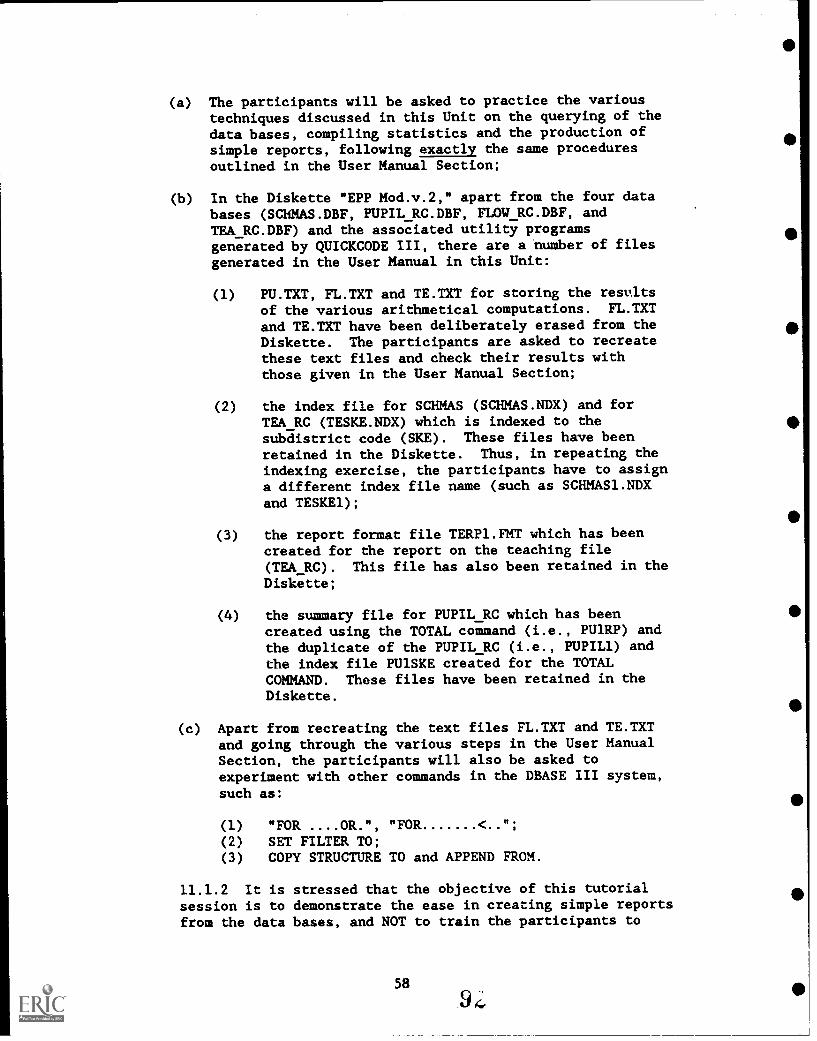
(a) The participants will be asked to practice the varioustechniques discussed in this Unit on the querying of thedata bases, compiling statistics and the production ofsimple reports, following exactly the same proceduresoutlined in the User Manual Section;
(b) In the Diskette "EPP Mod.v.2," apart from the four databases (SCHMAS.DBF, PUPIL RC.DBF, FLOW RC.DBF, andTEA RC.DBF) and the associated utility programsgenerated by QUICKCODE III, there are a number of filesgenerated in the User Manual in this Unit:
(1) PU.TXT, FL.TXT and TE.TXT for storing the resultsof the various arithmetical computations. FL.TXTand TE.TXT have been deliberately erased from theDiskette. The participants are asked to recreatethese text files and check their results withthose given in the User Manual Section;
(2) the index file for SCHMAS (SCHMAS.NDX) and forTEA RC (TESKE.NDX) which is indexed to thesubdistrict code (SKE). These files have beenretained in the Diskette. Thus, in repeating theindexing exercise, the participants have to assigna different index file name (such as SCHMAS1.NDXand TESKE1);
(3) the report format file TERP1.FMT which has beencreated for the report on the teaching file(TEA RC). This file has also been retained in theDiskette;
(4) the summary file for PUPIL_RC which has beencreated using the TOTAL command (i.e., PU1RP) andthe duplicate of the PUPIL_RC (i.e., PUPILI) andthe index file PU1SKE created for the TOTALCOMMAND. These files have been retained in theDiskette.
(c) Apart from recreating the text files FL.TXT and TE.TXTand going through the various steps in the User ManualSection, the participants will also be asked toexperiment with other commands in the DBASE III system,such as:
(1) "FOR ....OR.", "FOR < ";
(2) SET FILTER TO;(3) COPY STRUCTURE TO and APPEND FROM.
11.1.2 It is stressed that the objective of this tutorialsession is to demonstrate the ease in creating simple reportsfrom the data bases, and NOT to train the participants to
58

become proficient in using the DBASE III report generator.The participants do not need to memorize all the stepsinvolved in the creation of reports.
11.2 Group Work Session
11.2.1 The purpose of the group work session is to explorethe alternative use of the data bases for reporting and thecompilation of summary statistics. Similar to the group worksession in Unit 2, the ultimate objective is to sensitize theparticipants on the relative ease in information retrievalfrom a computerized data base.
11.2.2 As in Unit 2, the participants will be divided intogroups, preferably in the same manner as in Unit 2. Basedon the outcomes of the discussions and group work in Unit2, the participants will be asked to identify:
(a) the type of reports, and(b) the kind of summary statistics
which need to be produced by the revised data base design.The required report formats and summary statistics will thenbe produced by the participants, working in groups, usingmicrocomputers and the DBASE III software package.
11.2.3 The instructors should be available to help theparticipants during the group work session. In particular,the desired formats of the reports and the types ofarithmetical manipulation that need to be performed toproduce the required summary statistics have to be discussedamong the instructors and trainees. Additional functionsprovided by the DBASE III system may have to be employed forthis practical session.
12. Post-assessment
12.1 The purpose of the post-assessment is to enable theinstructors to evaluate the effectiveness of the instructional andlearning process in achieving the performance objectives statedabove. A number of simple exercises have berm suggested below totest the capability of the learners in using the software programsto retriele information from the data bases.
12.2 The participants will be asked to perform the following taskson their own:
(a) Produce summary files ot. the FLOW_RC and TEA_RC data basesusing the TOTAL command;

(b) After the summary files have been created, to display some of
the records in these new files;
(c) Prepare one report each on the FLOW RC and PUPIL RC data
bases, following either the format adopted in the User Manual
Section, or any other format considered appropriate;
(d) Modify the report format TERP1 by replacing the fields on the
number of nonteaching staff (TP and TN) by the fields on the
number of head and class teachers (which are the computed
fields named NHT and NCT) and print the report;
(e) Using the modified report format in (d) above, to print the
subtotals by type of schools rather than by subdistrict. In
other words, the data base has to be indexed on the field SS
instead of SKE.
60
Li
a
I
I
I

EDUCATIONAL POLICY AND
PLANNING PROJECT
Prisat Informatika
Balitoang Dikbud
DEPARTMENT PENDIDIKAN
DAN KEBUDAYAAN
A GOVERNMENT OF INDONESIA - USAID PROJECT
INDONESIAMicrocomputer Applicationsfor Education Planning andManagement: A ModularTraining Program
MODULE MUse of the Management
Information System for
Management Control
Center for Informatics
Office of Educational and Cultural Research and Development
MINISTRY OF EDUCATION
AND CULTURE
Jakarta, Indonesia

EDUCATIONAL POLICY AND
PLANNING PROJECTA GOVERNMEN'T OF INDONESIA - USAID PROJECT
Pusat Informatika
Balitbang Dikbud
DEPARTMEN PENDIDIKAN
DAN KEBUDAYAAN
INDONESIAMicrocomputer Applicationsfor Education Planning andManagement: A ModularTraining Program
MODULE HI
Use of the Management
Information System for
Management Control
-k
Center for Informatics
Office of Educational and Cultural Research and Development
MINISTRY OF EDUCATION
AND CULTURE
Jakarta, Indonesia
Hsu

PREFACE
The Educational Policy and Planning (EPP) Project is a seven yearproject conductedjointly by the Indonesia Ministry of Education (MOEC) and the United States Agencyfor International Development (USAID). The overall project objective is to improve thequality of education in Indonesia by assisting the MOEC, through the Office ofEducational and Cultural Research and Development (Balitbang Dikbud), to formulatebetter policies and long-term plans. The project aims to improve policy formulation andlong-term planning by improving the timeliness, relevance and accuracy of educationaldata collection, the subsequent analyses of such data, and theirultimate use forpolicy anddecisionmaking.
There are three major components of the EPP Project: (1) development of anintegrated management informations system (MIS) within the MOEC, (2) enhancementof MOEC policy research and analysis capacity, and (3) support for MOEC institutionaldevelopment at the national and provincial level through training and technical assis-tance. EPP technical advisory staff work closely with counterpart Indonesian staff as partof a collaborative process of developing institutional capacity.
Dr. BoedionoHead, Center for Informatics
Office of Educational and Cultural Research and DevelopmentDepartment of Education and Culture
Republic of Indonesia
The EPP Project in collaboration with the USAID Improving the Efficiency ofEducational Systems (TEES) Project, publishes EPP documents in order to disseminatethis knowledge and extend its usefulness. EPP has carried out a series of policy studiesdesigned to provide answers to key questions facing Indonesian educators. Theseinclude:
The Quality of Basic EducationThe Quality and Efficiency of Vocational/Technical EducationThe Strengthening of Local Education CapacityDeveloping Indicators of Educational EfficiencyTeacher Education IssuesCurriculum Reform and Textbook ProductionEducation, Economic, and Social Development
This series has been planned under the direction of Moegiadi, Balitbang Dikbud, andBoediono, Center for Informatics, Balitbang Dikbud and Simon Ju, EPP Chief of Party.
Editors for the series are Abas Gozali, Reta Hendrati Dewi, Center for Informatics,and Jerry Messec, LEES, Florida State University.

INTRODUCTION TO EPP TRAINING MODULES ON THEDEVELOPMENT & USE OF MIS ON MICROCOMPUTERS
1.0 sus=1.1 These training modules on the development and use of the education management information
system are primarily designed for planners and administrators at the provincial level, who are responsiblefor collecting, processing nd analyzing statistics for educational planning and management. The mainfeature of the modules is the use of microcomputers to enhance the speed, flexibility, and versatility inthe use of information.
12 The purposes of the modules are as follows:
To introduce to the participants the basic framework of an integrated education managementinformation system which could be used to serve the varied needs of different users;
To demonstrate how such a system could be set up, making use of microcomputers, and howdata could be retrieved for analytical purposes;
To show how an interactive models) for diagnostic, forecasting, planning and budgetingpurposes could be developed on microcomputers; and
To show, as well, how the computer system and the models could easily be modified to copewith unforeseen changes in requirements, with the help of user-friendly software packagesabundantly available old the market.
2.0 Tho Hierarchies of Inforrnatim
2.1 When viewed in terms of the point at which information is collated and used, there are threemain levels of information:
,
The school level, at which detailed information about individual pupils, teachers and staff(including their name, age, sex, grade, home address, zcademic performance, qualification,salaries, etc.), as well as information about the schools (e.g., area, number of rooms, equipment,etc.) have to be kept for the smooth running of the schools concerned;
The district level, where not all the data kept by schools are ,acquired. Only summary statisticssuch as the number of pupils by age, sex and grade, and the amount of recurrent expenditures arerequired for individual schools; and
The national level, where, depending on the extent of decentralization, detailed information onindividual schools may not be required. Only summary information is collected at thesubdistrict or district level.
2.2 Alternatively, depending on the usage, information could be distinguished between that for
planning,management control, andoperation.
2.3 Ideally, information at the school, district, and national level should be integrated and shared inone, or one network, of data base(s). For instance, information stored in schools could be computerized,and only the relevant data would be extracted and passed to the computer system kept at the district level;

and the similar procedure could apply to the flow of information between the district and national level.This could help avoid a lot of duplication of work, and solve the problems of quality of data and the timelag in producing the information. With the use of individualized data bases, more accurate informatioficould be made available about pupil and teacher flow, which is extremely useful in planning schoollooktion, and teacher demand and supply. The individualized data base could also reduce considerably thedata problems confronting educational researchers, especially those engaged in Lagitudinal studies.
2.4 Similarly, the same can be said of information for planning, management control andoperation. For instance, a simple ledger accounting system, if carefully designed and computerized,could provide a wealth of information useful in monitoring spending, analyzing cost structure andefficiency, as well as for forecasting and planning educational expenditures.
2.5 For the purpose of the present training modules, it is not proposed to cover the entirespectrum of the information system as discussed above, which would be clearly beyond the scope of thistraining program. Attention will mainly be focused on the following:
The flow of information from schools to the provincial and central offices via the usual channelof school surveys conducted by the Balitbang; and
The use of such information for planning and administrative purposes at the central as well asprovincial level.
Once the participants have mastered the basic principles and techniques discussed in this trainingprogram, they should have relatively little difficulties to applying them to different informationenvironments in their daily work.
3.0 OrganizatiamfAxidadults
3.1 There will be four modules in this training program, which are as follows:
Module I: Overview of basic concepts and computer applications in educational planning,management, and research;
Module II: The development of the Education Management Information System;
Module III: The use of the Education Management Information System for managementcontrol; r^:
Module W: The use of the Education Management Information System for planning.
4.0 The Structure of Instructional/Learning Process
4.1 Much of the emphasis placed in this training program is the use of microcomputers andsoften packages. Although data base and spreadsheet programs for data files creation and manipulationand modeling have already been designed for the participants, they inevitably have to understand andpractice the techniques in the use of microcomputers and software packages. With the availability ofmany user-friendly software packages and utility programs, computer programming could be kept to aminimum. It is also the aim of this training module to show to the participants that understanding thebasic principles and operating system of the various software packages would be sufficient to enablethem make full use of the information available to them for planning, management and research. Forthose participants who have a keen interest in computer programming and in mastering the softwarepackage, this training module will prepare them for further improving their computer skills bypracticing the techniques demonstrated in this program.
vi

4.2 It is recognized that the design of a management information system should be largely useroriented. It should start by looking at the potential uses of information rather than for the collection ofinformation per se. However, it would be deceptive to assume that all potential uses of informationcould be foreseen at the time a management information system is constructed. Furthermore, therequirements and practices in educational planning and management in Indonesia vary considerably fromprovince to province. Thus, it is almost impracticable to include the specific requirements of each andevery province in designing the training modules.
4.3 Naturally, participants to the training program would come from different divisions of theprovincial education offices. Some of them may mainly be concerned with say planning and budgeting,while others in the supervision of schools or other management functions. Some may be involved onlyin data collections. Consequently, not all parts of the training program would be of equal interest to theparticipants.
4.4 Taking into account the above considerations, the approach adopted in the design of thetraining materials is as follows:
APPLICABILITY is emphasized in the training program. Wherever possible, practical sessionson microcomputer applications are included in the modules so that the participants can have"hands-on" experience in the course. They will also be invited to try to include some of theirdaily planning, management and research tasks into the practical sessions, making use of someof the techniques and methods discussed in the training program;
FLEXIBILITY will be introduced in the design of the training materials so that alternate designsand applications of the management information system will be tested during the practicalsessions, making full use of the versatility and flexibility of a computerized data base and thecomputer software packages; and
a MODULAR approach will be adopted in the course so that each module is as self-cac.ained aspossible.
4.5 The structure of the instructional and learning activities for each of the four modules will thusbe arranged as follows:
Overall Objectives of each of the modules will first be stated so that instructors are aware of thewhile purpose of the module as well as the kDowled fie which is expected to be imparted duringthe instructional and learning processes;
Module Performance Objectives will also be stated io enable the instructors to assess the extentto which the bthavior of learners would be changed upon completion of the module. Morespecific performance objectives will also be given for different instructional units within amodule;
The actual instructional and learning processes are divided into four phases as follows:
Instiactional activities where the instructors will present to the learners the teachingmaterials for the module and unit concerned. The teaching materials will cover the basicconceptual issues related to the topic in question, and fundamentals of computer applicationsthat will be demonstrated, highlighting strengths and weaknesses of such applications;
User manual where the instructors will carry on with the presentation, but usingmicrocomputers to demonstrate the various applications in planning, management, andresearch. The detailed step-by-step procedures required to be followed in developing andusing the different computer applications will be described in this user manual section.Therefore, this sectimis designed for both the instructors and the learners;
vii
-L J

LaanlingAilthilio where the interaction between the instructors and learners will take place.The learners will be asked to:
practice the techniques in developing and using the data bases or models demonstratedby the instructors;
then the participants will be divided into groups to discuss the concepts, approaches andmethods used in the training materials. During the group discussion, they will beasked to suggest alternative approaches to the development and use of the managementinformation system;
based on the alternative designs suggested, the learners will, under the guidance of theinstructors, actually develop a new management information system and differentmodels of computer applications;
Post-assessment where the instructors will attempt to evaluate the extent to which thelearners have been able to have a firm grasp of the contents of the training materials. Anumber of questions and assessments have been proposed in the unit, and individual learnerswill be asked to do the assignments themselves.
5.0 Choice of Software Packages
5.1 With the rapid development in computer technology, it is difficult to choose softwarepackages which are both the most up- to-date and are familiar to both instructors and learners. Therefore,the fer3rs used in choosing a computer software are the power of the software, the ease of use and itsPopularity.
5.2 Two types of computing functions are required for these training modules:
data base management andspreadsheet applications.
A number of software packages have been very successful in integrating data base management withspreadsheet applications, and some statistical functions. However, these packages have limitationswhich dictate against using them in the training program. Nearly all of these packages are memory (orRAM) based, thus severely limiting the size of the data base that could be handled by the package. Theavailability of RAM banks or boards can increase the memory capacity of a 16-bit computer like an IBMPC/XT or its compatible to something like 8 mega-bytes. However, these are not yet very popularlyused Furthermore, most of these integrated softwares are not designed to handle relational data bases, afeature which is required in developing elle management information system proposed in this trainingprogram. As a result, two separate software packages have been used in this training program, with eachperforming one of the two functions mentioned above.
5.3 A large number of data base and spreadsheet packages are available. The choice of one set ofpackages does not imply that the others available in the market are not suitable. The followingpackages are chosen for reasons given below:
DBASE III (version 1.1 or 2) has been chosen for data base management. There are other database packages which are as powerful as DBASE III, like RBASE 5000 and KNOWLEDGE 2.DBASE III is chosen mainly because it is more user-friendly with its assistant facilities. Otherequally if not more powerful softwares like REVELATION and INFORMIX could be adopted inthe training program. But it appears DBASE III is more popularly used in IBM PCs or thecompatibles. In any case, the adoption of DBASE DI in this training program does not precludethe participants from adapting the methodology and approach used in the training program toother data base management software, including newcomers like PARADOX (version 1.1); and
viii
1 0

LOTUS 123 (version 2) has been chosen as the spreadsheet software package largely because ofits popularity and its extremely user-friendly approach. Other softwates like VP- PLANNERwhich is claimed to have almost the same capabilities as Lotus 123, to other software likeMULTIPLAN (version 2) which has the additional facility of liking different spreadsheets, couldwell be adopted, following the approach and methods used in the training program.
5.4 Summing up from the above, the structure of this training program could be visualized asfollows:
Modulo.
I
Contents
Basic concepts and computer applications
Unit 1: Issues & problems in educationalplanning,management and research
Unit 2: Microcomputer applications
Unit 3: Data rapirements identification andassessment
II Development of the Education ManagementInformation System
Unit 1: Data base construction
Software
WORDSTAR
Unit 2: Information retrievalDBASE III
QUICKCODE III
III Tha Use of the Education Management InformationSystem for Management Control
Unit 1: Routine administration of schools and1.1.0jeCtS
Unit 2: Monitoring performance of educationsystem
N The Use of the Education Management InformationSystem for Planning
Unit 1: Diagnostic analysis of pupil flow
Unit 2: Forecasting enrollment in school
Unit 3: Forecasting teacher and other resourcerequirements
DBASE IIIQUICICREPORT
LOTUS 123
It may be noted above that tha use of WORDSTAR (version 3.3 or 2000) will be demonstrated whenModule 1 is presented to the !7,articipants so that they may aim the training program be able to usewadprocessing software for report writing.

Table of Contents
Module III
L Introduction 11. Overall Module Objectives 1
2. The Organization of the Module 2
II. Unit 1: Routine Administration of Schools/Project 33. Performance Objectives 34. Instructional Activities 35. User Manual 146. Learning Activities 51
Ell Unit 2: Monitoring Performance of Education System 517. Performance Objectives 518. Instructional Activities 529. User Manual 56
10. Learning Activities 6011. Post-Assessment 60

Module III
The Use of the Education Management Informationfor Management Control
I. Introduction
1. Overall Module Objectives
1.1 This module is NOT a module on the principles of educationalmanagement. A number of good references on the practices andprinciples of educational management are available, whichparticipants in this module could consult. NOR is it one aimed atadvising educational planners and administrators what norms andcriteria should be set in managing their educational systems andthe educational institutions under their control. Nevertheless,this module is still a module on *HOW TO DO" techniques, but thetechniques are related to:
(a) The use of information, andCO The techniques employed to analyze the information for
the purposes of management control.
Based on the results of the analysis, individual administratorshave to make up their mind as to what standards should be set andhow schools should be managed and their performance regulated.
1.2 Thus, the purposes of this module is to present to theparticipants:
(a) The use of the education management information system set upin Module II to, at a micro-level, monitor the performance ofindividual schools and projects;
(b) And at a macro-level, to monitor the performance of theeducation sector for the country as a whole, or for aparticular province, district or subdistrict;
1.3 In this module, the participants will be shown how to takeadvantage of the computerized information system and other softwarepackages available to manipulate the data and perform a variety ofcomputations for analytical purposes. In other words, the "HOW TODO" techniques will be demonstrated with the use of microcomputersand software packages, which will help to:
(a) Overcome the problems associated with the need to studystatistics on a large number of schools;

(b) Simplify the tasks of the educational administrators inundertaking an excessive amount of calculations on the numberof teachers required for individual schools, which could be acumbersome process because of the large size of the schoolpopulation and the complicated methods of calculation;
(c) Speed up considerably the response time of both theeducational planners and administrators 1, detecting anymalfunctioning of the educational syste..., due to the fact thateducation indicators and other analysis could be performedquickly.
1.4 Module Performance Objectives. On completion of this module,
the participants should be able to:
(a) Make use of the data base software package DBASE III toproduce useful information from the education managementinformation system, required for the routine administrationof schools in a given district and development projects;
(b) Make use of the data base software package DBASE III tocompile educational indicators from the education managementinformation system, for the purposes of managing theeducation system;
1.5 It is stressed that although the package DBASE III has beenchosen for this module, this does not mean that other data basepackages are not suitable. Once the fundamentals of the packagehave been mastered, the participants should have little difficultyin adapting the techniques and methods demonstrated in this moduleto other data base packages or programs
2. The Organization of Cle Module
2.1 This module is organized into two units, as follows:
(a) Unit I on the use of the educational management informationsystem for the routine administration of schools andprojects,. This involves the use of the data collected in theinformation system at the level of individual schools anddevelopment projects;
(b) Unit 2 on the use of the educational management informationsystem for the management of the education system, for acountry as a whole or for a given province, district, orsubdistrict. This involves the identification andcompilation of various indicators on the performance of theeducation system. As far as the techniques in the use of thedata base package is concerned, this Unit is similar to Unit1, except that data analysis is done at the level ofprovince, district, or subdistrict.
2
106

2.2 It is stressed that an interactive approach could be adoptedthroughout this Module. This is especially important as therequirements for monitoring performance, the relevance ofeducational indicators constructed, and the diagnostic techniquesused in analyzing student flow could change rapidly over time.Furthermore, standards, procedures, and regulations are likely tobe different for different provinces and districts. Therefore, itis essential that the participants are able to adapt the systemsdeveloped in this Module to suit the specific requirements of theirprovinces or districts.
II. Unit 1
Routine Administration of Schools/Projects
3. Performance Objectives
3.1 On completion of this Unit, the participants should be ableto:
(a) Identify data items in the Educational Management InformationSystem which could be used to help them in the day-to-dayadministration of schools;
(b) Have a firm grasp of the techniques of retrieving such dataitems from the Information System and of analyzing the dataitems to provide useful management information;
(c) Understand the basic techniques in compiling informationrequired for project management;
(d) Be able to use computer data base packages like DBASE III toperform these tasks.
4. Instructional Activities
4.1 Administration of Schools
4.1.1 The tasks of administering schools are so diversethat it is definitely beyond the scope of this Module to dealwith. Moreover, the information required by the educationaladministrators for the effective management of schools ismore than what could be provided from the usual statisticalsurveys of schools. Therefore, what is to be discussed Inthis Unit is by no means exhaustive. Nevertheless, it is
3 1000

believed similar techniques could be employed in dealing withother sorts of management tasks not mentioned in this Unit.
4.1.2 At the risk of oversimplification, the tasks ofadministering schools performed by the central, provincial,or district educational administrators would fall broadlyinto two main groups:
(a) Supervis:,ry activities which involve the routine day-to-day administration of schools to ensure that they areoperated smoothly, according to a set of standardsgoverning the number of teachers to be employed, thequalifications of teachers, the amount of subsidy paidto the schools and pupils, the facilities and equipmentthat should be available, the maximum or minimum size ofthe class. The aim is to ensure that schools are givenat least the minimum resources in accordance withnational or provincial standards in order to functionproperly.
(b) Advisory activities which involve the provision ofprofessional guidance and advice, on a regular basis, onsuch matters as teaching methods, the curriculum to beadopted, and other teaching aids that could be employed.The objective is to help schools to provide the bestpossible education to the children, within the resourcesavailable to schools.
4.1.3 Supervisory Activities. The extent of supervisorypower that the central, provincial, or district educationaladministrators have over schools determines the number andnature of supervisory tasks performed by the educationaladministrators. This in turn determines the type of dataitems required by them for an effective management ofschools. For instance, in some countries, all schoolteachers are recruited centrally by the national, provincialor district education offices and allocated to schoolsaccording to a predetermined staffing standard. In the otherextreme, in some countries, for some types of public-sectorschools, the number of teachers and the recruitment ofteachers are entirely in the hands of the school principals.In both cases, the jobs of the educational administratorswould be very difficult, and the data items required wouldalso be different, at least in the level of details requiredon the teaching staff of schools.
4.1.4 What are discussed in the following paragraphsrepresent only a very tentative idea of certain data itemsthat could be used to help educational administrators incarrying out their supervisory duties. This is due to thelimitations imposed by the statistics available to create the
4
10

dAta files for demonstration. However, it is hoped that thisshortcoming could provide an opportunity for:
(a) the trainees to participate ACTIVELY in suggestingmodifications and additions to the training materials;and
(b) the instructorE to demonstrate how these additionalrequirements could be coped with in the computer systemdesign.
4.1.5 There are functions which invariably would fall intothe category of supervisory duties of the educationaladministrators. These are as follows:
(a) Whether schools
(b)
It is necessary
(1) The rightnumber ofconcernedThe usual
are properly staffed?
to ensure that schools have:
number of teachers, by relating theclasses or pupils in the schoolto the number of teachers available.data items required to monitor this are:
the number of teachers available, andthe number of teachers the school is entitledto according to the agreed teacher/class ratioor pupil/teacher ratio;
(2) Teachers of the right qualifications, by ensuringthat either all or a specified proportion ofteachers in the school concerned are qualified.The usual data items required to monitor this are:
the distribution of teachers by qualifications,or to be more concisethe proportion of qualified teachers
(3) Teachers of the right kind, by ensuring schoolsare staffed with teachers of the right subject-mix(which is more important at the secondary level)or of the right grade (in the case of primaryeducation in Indonesia, it is suggested toclassify teachers Into Head, Class, Religion andSport/Art teachers). For this, the data item issurely:
- the number of teachers by grade
Whether schools are properly equipped?
This would entail the following questions to be asked:
5

(1) Whether schools have the required number ofclassrooms and special rooms (such as library,laboratories, etc.)?
(2) Whether schools have the required amount of openspace and playground area for the children?
(3) Whether the conditions of classrooms, specialrooms and the school building in general aresatisfactory?
Since statistical infotmation is not available on theabove questions, it is therefore not proposed to go intodetail concerning the data items required to monitorwhether schools are properly equipped. The instructorsshould encourage the participants to bring their datasheets on the above subject matter to the trainingsessions, so that a data file on schools could beconstructed during the training session to show howstatistics could be compiled to provide the necessarymanagemeL". information to educational administrators inperforming the above tasks.
(c) Whether schools are properly financed?
This involves comparing the amount of subsidy orfinancial resources available to the school concernedwith the amount which the school is entitled toaccording to the national, provincial, or districtstandards. This amount would depend on the number ofpupils, the number of operating classes, etc., that theschool has. The data items requtred are:
(1) the amount of financial resources available to theschool, as compared to,
(2) the amount of financial resources the school isentitled to, having regards to the number ofclasses and pupils in the school concerned.
No information is available on the financial resourcesavailable to the schools. Therefore, in the practicaldemonstration, only a rough method of calculating schoolentitlement will be shown.
(d) Whether schools are properly enrolled?
The rationale for this supervisory function reflects theconcern of the educational administrators on theutilization of school resources. If schools are under-enrolled, it amounts to an underutilization of the
6

school building and the land, if not the teachers. Itcould be argued that a reduced enrollment would resultin a reduction in the class size, and hence could leadto an improvement in the quality of education.Regardless of whether this argument has theoretical andempirical foundation, it is clearly not the wish ofplanners and administrators to see that qualitativeimprovements are brought about in this haphazard manner.The data items which could be used to monitor this are:
(1) the class size of the school;
(2) the ratio of Primary 1 applicants to the number ofPrimary 1 place available;
(3) the number and the proportion of classrooms whichare vacant.
As no statistics are available on the number of vacantclassrooms for designing the practical demonstrationsfor (3) above, this data item will be included in thepractical session of this Unit.
4.1.6 Advisory Activities. What has been discussed aboveis related to the resource inputs and utilization of schools.The ultimate and primary concern of planners andadministrators is obviously not on these factors, but ratheron the quality of the teaching and learning processes in theclassrooms. This quality issue in turn is related to thequestions of:
(a) Whether activities in schools and classrooms areconducted in an effective manner conducive to learning;
(b) Whether the school environment promotes effectiveteaching and learning.
In some countries, the education ministry or the districtlevel education officers assume an active role in advisingschools In such matters as curriculum design, teachingmethods, etc. In others, these are either left to thediscretion of individual school heads or teachers, or largelyinfluenced by the examination system, or other authoritiesresponsible for selection to tertiary institutions. Ineither case, the central, provincial and district educationaladministrators would seldom want to relinquish their interestor influence, however marginal, over this qualitative aspectof school administration.
4.1.7 Most of the information required for this kind ofadvisory activity is qualitative in nature. For example,the educational administrators would need to have a list of
7

the textbooks used in the schools, the timetable adopted andpossibly the examination, testing and class promotionstandards enforced. In addition, some may require schools toinform them how they stream, set, or group students ofdifferent abilities and learning needs.
4.1.8 Quantitative information that is often collected isthe examination scores. Occasionally, the educationaladministrators may conduct the so-called standardized testsin schools, in order to monitor the performance of pupils,as well as schools, on a number of selected subjects. Thiskind of quantitative information however is not availablefrom the usual statistical surveys of schools. In any case,it is not available to the author in designing the practicalexercises.
4.1.9 As a result, the author has to rely on some indirectstatistical measures which could serve as a sort of indicatorfor the educational administrators in identifying schoolsthat might require attention. For example, if a particularschool has a less than average input of resources, thequality of teaching may suffer. If a school has a higherthan normal rate of repetition, then one might suspect thatsomething has gone wrong in the teaching-class process inthat school. Thus, the following so-called qualitativemeasures are proposed to be used to help administrators incarrying out their advisory activities:
(a) the rate of repetition;
(b) the proportion of Primary 6 leavers passing the finalexamination
both of which are indicators of the performance of thestudents, and
(c) the average class size;
(d) the pupil/teacher ratio; and
(e) the proportion of unqualified teachers.
which are indirect indicators on the quality of education forthe schools concerned.
4.2 Pro ect Management
4.2.1 Project management encompasses a whole range ofactivities from the formulation of a project or a programmeof projects, to the implementation and evaluation of theprojects(s). Projects are, put in the simplest terms, themeans to put into action an education policy. Thus, project
81*.'

management in fact immediately follows the formulation of aneducation plan. As distinction between the various phases ofthe planning, budgeting and implementation process is oftendifficult to draw, it is not the purpose of this module to gointo details about the various components which shouldconstitute project management.
4.2.2 What the author would want to highlight is that forany education plan, there are bound to be differentactivities that have to be carried out in a coordinatedmanner. Yet these activities could be quite different innature, and would most likely be implemented by differentministries, or different divisions within the educationministry, or by different regional or district educationoffices or other agencies. Take for example the policy toprovide universal junior secondary education for the countryat a certain date. In order to achieve this policy, it isnecessary to:
(a) Build sufficient number of junior secondary schools toprovide the required number of classrooms;
(b) Train sufficient number of teachers, or retrain some ofthe existing teachers to staff the new schools oradditional classes in existing schools;
(c) Design the curriculum for children coming from adifferent "ability group" or background, and to providefor the required textbooks, ETV programmes, etc.;
(d) To draw up a system of allocating pupils to differentschools or types of schools;
(e) To procure the necessary financial, physical, as well ashuman resources (other than teachers, e.g.,administrators and researchers) for the implementationof the above.
Each of the above could be conceived as a programme ofprojects, and would be the responsibility of a large numberof personnel in the education ministry, ministriesresponsible for finance and public works programmes, thelocal authorities, etc. In order to ensure the successfulimplementation of the policy 'on the provision of universaljunior secondary education, all of the above programmes haveto be carried out according to plan. Any slippage in theteacher training programme would severely affect theimplementation of this policy.
4.2.3 Thus, one of the main concerns of educationalplanners and administrators is to ensure that all theprogrammes or projects are implemented according to plan.
9

addition, there is also the concern of whether resources areutilized efficiently and effectively in the projects. Allthese amount to ensuring that the projects are effectivelymanaged. Normally, this should be the responsibility of theso-called "project manager" of the projects. The managementtasks involve:
(a) the monitoring of the timing of the project;
(b) the control over the financial spending;
(c) the supervision over the technical aspects of theprojects.
Taking the example of the school building programme, thetasks of managing any one rchool project in the buildingprogramme include overseeing the land acquisition processwhich may involve the clearance or legal or illegalinhabitants of the land, the site formation work, the designof the school building if there is no standard plan, theprogress of construction work, the drawing up of the list offurniture and equipment and the acquisition of these items,the setting up of the school management body, the appointmentof school heads and teachers, and finally, the enrollment ofpupils. Obviously, some of these tasks fall outside thejurisdiction if not as well beyond the competence ofeducational plaik-ters and administrators.
4.2.4 Therefore, for the purpose of this module, the wholerange of activities involved in project management would notbe discussed. These should be left to the "project manager"or the team of professionals and administrators fromdifferent disciplines, depending on the nature of theprojects. What is important and relevant to the educationalplanners and administrators is:
(a) The monitoring of the progress of the projects;
(b) The initiation of any remedial actions or modificationsto the original plan or design required to be taken toensure the smooth implementation of the projects.
To do this requires the availability of information on theprogress of the projects and on the problems encountered inthe implementation of the projects.
4.2.5 The information reqUired can be classified into twomain types:
(a) Financial data which would be the amount budgeted forthe project, the amount committed, and the amountactually spent. The data provide quickly a rough idea
10

41
about the progress of the project. Caution, however, isrequired in the use of such information. There may beconsiderable time lag in the claiming of bills by thecontractors;
(b) Data on physical targets completed which are moredifficult to define. For a simple project like a schoolbuilding project, the data could be the number ofclassrooms completed, or the stages of building workdone (say the school project could be broken down intoseveral stages like land acquisition, site formation,construction of classroom block, construction of otherparts of the school building, etc.). For a project oneradicating illiterates in rural areas, the results ofprogress would be much more difficult to assess. Thus,different kinds of projects would call for differenttypes of data.
In addition, the above data would be viewed in a "time"dimension. A very convenient yardstick is the comparison ofthe planned target date with the expected date of completingthe project.
4.2.6 Monitoring of School Pro ects. In view of thediversity in the nature of projects, it is proposed to usethe monitoring of school projects as an example orillustration of some of the techniques used in the use ofinformation for monitoring purposes. This involves:
(a) The design of a reporting procedure for the necessaryinformation to be fed back to the educationaladministrators and planners. Two points need to beconsidered here:
(1) The data items required, which may include thefollowing:
the project reference which relates the schoolproject to the budget reference number and theprogramme reference number;the project reference number which helps toidentify the project in question;the project number;the location of the project;the target date of commencing work for theproject;the target date of completion for the project;the number of classrooms available from theschool project;the amount of money budgeted for the project;the name of officer/agency responsible for theDroject;
11
i i 41.
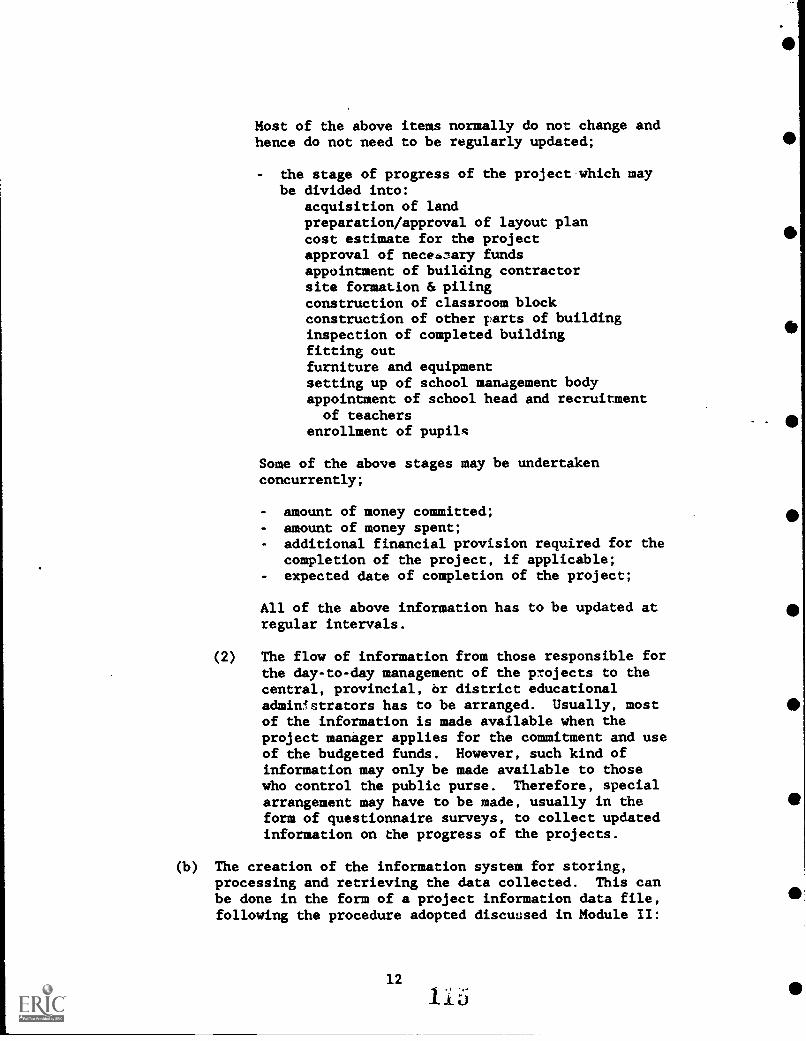
Most of the above items normally do not change andhence do not need to be regularly updated;
the stage of progress of the project which maybe divided into:
acquisition of landpreparation/approval of layout plancost estimate for the projectapproval of neceb:lary fundsappointment of building contractorsite formation & pilingconstruction of classroom blockconstruction of other parts of buildinginspection of completed buildingfitting outfurniture and equipmentsetting up of school management bodyappointment of school head and recruitmentof teachers
enrollment of pupils
Some of the above stages may be undertakenconcurrently;
amount of money committed;amount of money spent;additional financial provision required for thecompletion of the project, if applicable;expected date of completion of the project;
All of the above information has to be updated atregular intervals.
(2) The flow of information from those responsible forthe day-to-day management of the projects to thecentral, provincial, or district educationaladminstrators has to be arranged. Usually, mostof the information is made available when theproject manager applies for the commitment and useof the budgeted funds. However, such kind ofinformation may only be made available to thosewho control the public purse. Therefore, specialarrangement may have to be made, usually in theform of questionnaire surveys, to collect updatedinformation on the progress of the projects.
(b) The creation of the information system for storing,processing and retrieving the data collected. This canbe done in the form of a project information data file,following the procedure adopted discussed in Module II:
12
115

(1) The design of the data collection form as perFigure XX below;
(2) The collection of data from the project managersby asking them to submit on a regular basis,updated returns on the progress of the projectsunder their control. In order to simplify the jobof the project manager in completing thequestionnaires, it is not necessary for theproject manager to fill in data items which do notchange very often. Such information items couldautomatically be printed on the questionnaire byextracting the necessary data items from the database;
(3) The creation of the data base on the projects,based on information supplied by the projectmanagers.
(c) The compilation of the relevant statistical informationfrom the data base. Basically, the information requiredfor the monitoring of the projects include:
(1) The amount of funds spent as compared with theamount of funds budgeted. This gives the amountof funds left for the projects. If the amountleft is small compared with the stage of progressof the project, something has to be done to findout the reasons and to rectify the situation, ifrequired;
(2) &slated information is the additional financialprevision estimated to be required for thecompletion of the project. This is an indicationthat urgent remedial action is required by allconcerned;
(3) The expected date of completion .if the project ascompared with the target date of completion as avery convenient indicator of the progress of theproject.
Once the data base is set up, other information storedin the data file could easily be made available. Forexample, if a school project is found to have beendelayed, information on the stage of progress couldprovide indication as to where the slippage hasoccurred, so that the educational administrators couldapproach the appropriate officers/agencies for remedialaction.
4.2.7 Apart from helping the educational administrators inmonitoring the progress of school projecs, the data basecould also be used for other planning activities, forexamp:e:
(a) school mapping exercises for determining the location ofnew schools;
(b) the planning of teacher training and deployment, as thenumber of new schools to be completed in a particularlocality would affect the number of teachers required tobe trained and deployed to that locality;
(c) the planning of pupil selection and allocation, as thenumber of new schools to be opened in any school yearwould partly determine the number of children that canbe admitted in a particular district. If there is acentralized system of selecting and allocating pupils toschools, then this system has to take into account thechanging distribution of school places arising from newschools completed.
Some of the uses of the school project data base will bedemonstrated in Module IV on the Use of the EducationManagement Information System for Planning.
5. User Manual
5.1 Getting Started
5.1.1 The user manual is designed for:
(a) The instructors in demonstrating how to put intopractice the various points discussed in the section onInstructor Activities, making use of the educationmanagement information system on pupils, teachers, andschools;
(b) The trainees in practicing the procedures suggested inretrieving, processing, and summarizing data from theeducation management information system for the routineadministration of schools and projects.
While the programming steps and commands suggested wouldenable the participants to produce the kinds of managementinformation required, it is suggested that the instructorsand trainees should attempt to apply other techniques and tomodify some of the procedures suggested in this User Manualin order to exploit to the full the potentials of themanagement information system.

5.1.2 The practical exercises suggested in this section arebased on the data base software package DBASE III (version1.1 or 2) and the utility proglam QUICKUPORT. These twopackages can be run on any IBM PC or E7 ar its compatible,operating on PCDOS or MSDOS 2.0 or above, with at least 256 Kbytes of RAM, 2 double sided floppy disk drives or 1 doublesided disk drive and a hard disk.
5.1.3 It is recommended to boot up the microcomputer usingtha CONFIG.SYS file to reserve 20 file and 24 disk buffers(the default values are 8 and 2 respectively). The databases on pupil stock, pupil flow, teachers, and schools arebased on the ones constructed in Module II. They are storedin the Diskette "EPP Mod.v.3":
(a)
(b)
(c)
(d)
Pupil stock file:Pupil flow file:Teacher file:School master:
PUPIL_RC.DBFFLOW3C.Db.7TEAR.C.DBFSCHMAS.DBF
Their corresponding index files created in Module II have notbeen copied to this Diskette because it is planned to set upanother set of index files for these four data bases. Thereare other files contained in this Diskette which are createdwhen this User Manual Section is designed. All these fileshave been protected against accidental deletions andmodifications by being converted into read only files. It istherefore necessary to make a backup copy of the Diskette(using the DOS command COPY *.*) and use the backup for thepractical exercises.
5.1.4 In starting up the system, it is recommended to placethe Diskette "EPP Mod.v.3" in Drive A, and start up thesoftware (e.g., DBASE III) from Drive C or Drive B.
5.2 Administration of Schools
5.2.1 In this subsection, a number of programming steps aresuggested for compiling the required management statistics.These steps make use of DBASE III commands at command level.These steps are more complicated than the ones shown inModule II, and the manipulation of multiple data bases willbe demonstrated in this subsection. For ad hoc queries ofthe data base, these commands should be quite sufficient.However, working at dot prompt is not quite efficient if thedata base is large and the processing and manipulation of thedata are done repeatedly on the same data base. For example,the REPLACE command will cause the system to read through thedata base once. If more than one REPLACE commands areexecuted together with other commands like SUM, the systemhas to read through the data base many times. To overcomethis limitation requires the user to write his own programme.
15 1_t_c.i

It is not proposed, for the time being, to introduceprogramming in this Module. The purpose of the approachadopted here is to demonstrate how users can communicate withthe microcomputer. For provincial planners andadministrators who do not need to handle very large databases, this approach should not be inappropriate.
5.2.2 Supervisory Activities. A number of functions havebeen identified as part of the supervisory duties of thecentral, provincial, or district educational administrators.The following will go through some of these for which dataare available to permit the design of the practicalexercises, showing how the management statistics could becompiled from the information system on pupils, teachers, andschools:
(a) Staffing of Schools. One of the jobs of the educationaladministrators is to identify schools which haveproblems in staffing, in respect of:
(1) Whether the number of teachers available isadequate based on the approved staffing standards;
(2) Whether the teachers are qualified or not;
(3) Whether the mix of the teachers is right or not(as no information is available on the number ofteachers by subject, only the grade of teachers isexamined).
(b) The following gives the step-by-step procedures inretrieving the required management information for thequestion (a)(1) above:
(1) As the information required includes that on thenumber of classes and pupils in the schools whichare stored in the PUPIL RC data base, and that onthe number of teachers in the schools which isstored in the TEA RC data base, it is necessary toretrieve information simultaneously from the twodata bases. Accessing two data files calls forthe need to "link" the two files together, usingan index field common to the two files. Thisindex field is the SCH CODE which can uniquelyidentify the school and is included in both thePUPIL RC and TEA RC data bases.
(2) One of the approaches that can be adopted is touse the command SET RELATION TO. The procedurewhich can be followed is shown below. It shouldbe noted that all DBASE III commands are writtenin UPPER case beginning with an asterisk (*).

After starting up DBASE III, at dot prompt:
*SET DEFAULT TO A to tell the system to lookfor the files in Drive A;
*SELECT 1 to assign a working area 1 for onedata base. DBASE III system allows 10 workareas for data bases;
*USE PUPIL_RC to open the data base PUPIL_RC inwork area 1;
As not all the fields in PUPIL RC will berequired in this exercise, and to avoidchang4ng the data base which may be used forother purposes, it is recommended to create acopy of PUPIL_RC with only the required fields.This is done by:
*COPY TO PUPIL2 FIELDS SKA,SKE,SE,C1,C2,C3,C4,C5,C6,EA6,ET,SCH_CODE.
The field EA6 which stands for the enrollmentaged 6 or below, is only copied. This fieldwill be used to store the total number ofclasses, as it is not convenient to refer to(cl+c2+c3+c4+c5+c6) in subsequent datamanipulation;
*USE PUPIL2 ALIAS PU2*DISPLAY STRUCTURE, and the following shouldshow up on the screen:
Figure I: Structure for Data Base PUPIL2
Structure for data base: A:pupil2.dbfNumber of data records: 65
Date of last update: 08/17/86Field Field Name Type Width
1 SKA Character 2
2 SKE Character 2
3 SE Character 3
4 Cl Numeric 2
5 C2 Numeric 2
6 C3 Numeric 2
7 C4 Numeric 2
8 C5 Numeric 2
9 C6 Numeric 2
10 EA6 Numeric 411 ET Numeric 412 SCH_CODE Character 12
**Total** 40
17
Dec

- To compute the total number of classes andstore the value in EA6,*REPLACE ALL EA6 WITH Cl+C2+C3+C4+C5+C6;
To open the teacher file TEA_RC and assign itto work area 2,*SELECT 2*USE TEA RC;
*COPY TO TEA2 FIELDS SKA,SKE,SE,TT,SCH_CODE,NHT,NCT,NRT,NST,GTT so that a duplicate ofTEA_RC is also created with only the fieldsrequired;
*SELECT 2*USE TEA2 ALIAS TE2*DISPLAY STRUCTURE, and the following shouldappear on the screen:
Figure II: Structure of Data Base TEA2
Structure for data base: A:tea2.dbfNumber of data records: 67Date cf last update: 08/17/86Field Field Name Type Width Dec
1 SKA Character 2
2 SKE Character 2
3 SE Character 3
4 TT Numeric 3
5 SCH_CODE Character 126 NHT Numeric 2
7 NCT Numeric 2
8 NRT Numeric 2
9 NST Numeric 2
10 GTT Numeric 3
**Total** 34
In order to "link" the two data bases, it isnecessary to index the first on the commonindex field. Indexing the second is alwaysrecommended for file management of this sort:
*SELECT 1*INDEX ON SCH_CODE TO PU2*SELECT 2*INDEX ON SCHCODE TO TE2
- The two data ba.as can be linked by SETRELATION command. After the relation has been
18
121

set, one can display, print, transfer dataitems in the two data bases linked. SETRELATION is most useful when each record in onedata base matches one and only one record inanother data base.
*SET RELATION TO SCH_CODE INTO PU2*REPLACE ALL GTT WITH PU2- >ET /35
The above commands calculate the teacherrequirements for each school, which will bestored in the field GTT in the TE2 data base,using a hypothetical pupil/teacher ratio of 35.Based on this ratio, the number of teachersrequired is equal to total enrollment dividedby 35 (or ET in the data base PUPIL2 divided by35).
Once the number of teachers required iscalculated and is sorted in the field GTT inthe TEA2 data base, also named TE2 in the USEcommand, schools which are unders affe can beidentified by comparing the number requ red(GTT) with the number available (field TT inthe TEA2 data base):
*DISPLAY SCH_CODE,TT,GTT FOR TT<GTT will givethe following results:
Record# sch_code tt gtt18 101230502002 3 424 101230502008 4 5
28 101230502012 7 1032 101230502016 5 1035 101230504002 6 7
63 102230501039 7 8
Alternatively, the teacher requirement can becalculated using the teacher/class ratio of say1:2. Similar procedures may be adopted to findout schools which are understaffed:
*REPLACE ALL GTT WITH PU2->EA6*1.2*DISPLAY SCH_CODE,TT,GTT FOR TT<GTT
and the following should show up on the screenor if desired on the printer by directing theoutput to the line printer:
19
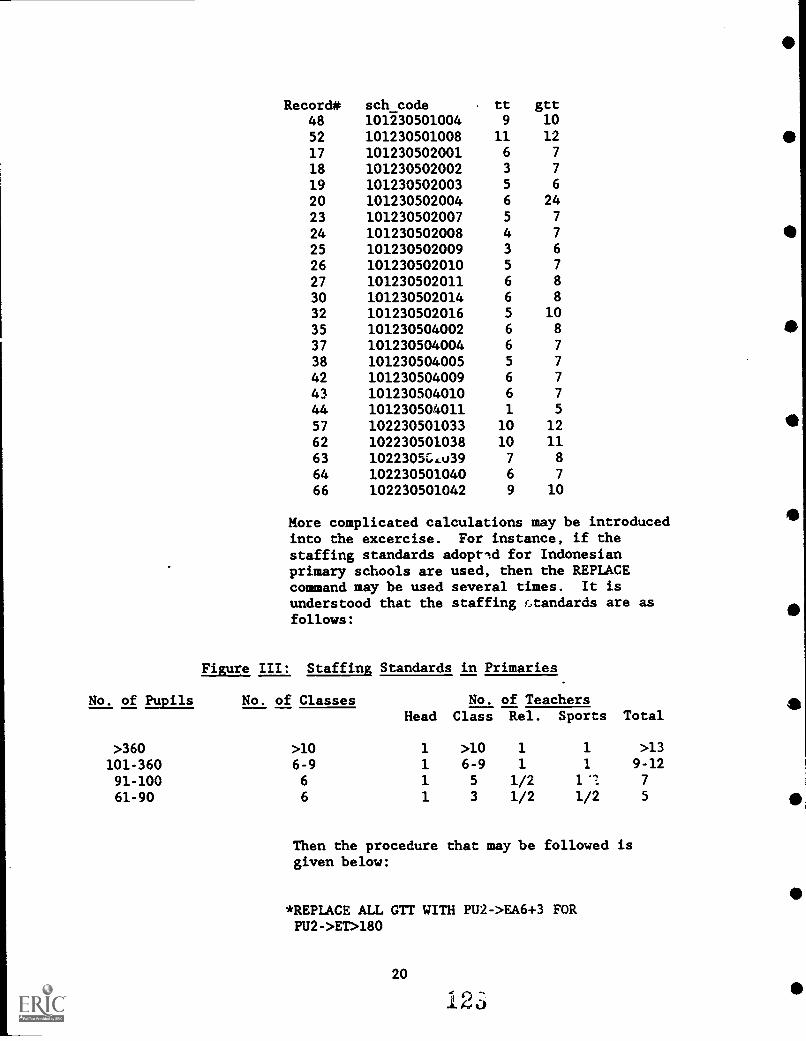
Record* sch_code tt gtt48 101230501004 9 10
52 101230501008 11 12
17 101230502001 6 7
18 101230502002 3 7
19 101230502003 5 6
20 101230502004 6 2423 101230502007 5 7
24 101230502008 4 7
25 101230502009 3 6
26 101230502010 5 7
27 101230502011 6 8
30 101230502014 6 8
32 101230502016 5 10
35 101230504002 6 8
37 101230504004 6 7
38 101230504005 5 7
42 101230504009 6 7
43 101230504010 6 7
44 101230504011 1 5
57 102230501033 10 12
62 102230501038 10 1163 1022305G.u39 7 8
64 102230501040 6 7
66 102230501042 9 10
More complicated calculations may be introducedinto the excercise. For instance, if thestaffing standards adopted for Indonesianprimary schools are used, then the REPLACEcommand may be used several times. It isunderstood that the staffing r,tandards are asfollows:
Figure III: Staffing Standards in Primaries
No. of Pupils No. of Classes No. of TeachersHead Class Rel. Sports Total
>360 >10 1 >10 1 1 >13
101-360 6-9 1 6-9 1 1 9-12
91-100 6 1 5 1/2 1'1 7
61-90 6 1 3 1/2 1/2 5
Then the procedure that may be followed isgiven below:
*REPLACE ALL GTT WITH PU2->EA6+3 FORPU2->ET>180
20

*REPLACE ALL GIL WITH 7 FORPU2->ET>90 .AND. PU2->ET<181
*REPLACE ALL GTT WITH 5 FORPU2->ET>60 .AND. PU2->ET<91
*REPLACE ALL GTT WITH 4 FOR PU2->ET<61
and this will give the teacher requirement forschools of different enrollment size, and toidentify schools which are understaffed*DISPLAY SCH_CODE,TT,GTT FOR TT<GTT will givethe following results:
Record* sch_code tt gtt47 101230501003 10 1148 101230501004 9 1150 101230501006 7 9
51 101230501007 7 9
52 101230501008 11 1355 101230501011 6 7
17 101230502001 6 7
18 101230502002 3 7
19 101230502003 5 7
20 101230502004 6 7
24 101230502008 4 7
25 101230502009 3 7
27 101230502011 6 1028 101230502012 7 9
29 101230502013 6 7
30 101230502014 6 7
32 101230502016 5 114 101230503005 7 9
5 101230503006 7 9
34 101230504001 7 8
35 101230504002 6 1037 101230504004 6 9
38 101230504005 5 7
42 101230504009 6 7
43 101230504010 6 7
44 101230504011 1 457 102230501033 10 1358 102230501034 10 1161 102230501037 9 1062 102230501038 10 12
63 102230501039 7 1064 102230501040 6 7
65 102230501041 8 1066 102230501042 9 11
(c) For the question (a)(2) above, one method is to examinethe distribution of teachers by differentqualifications. Since there are some 8 different
21
12-1
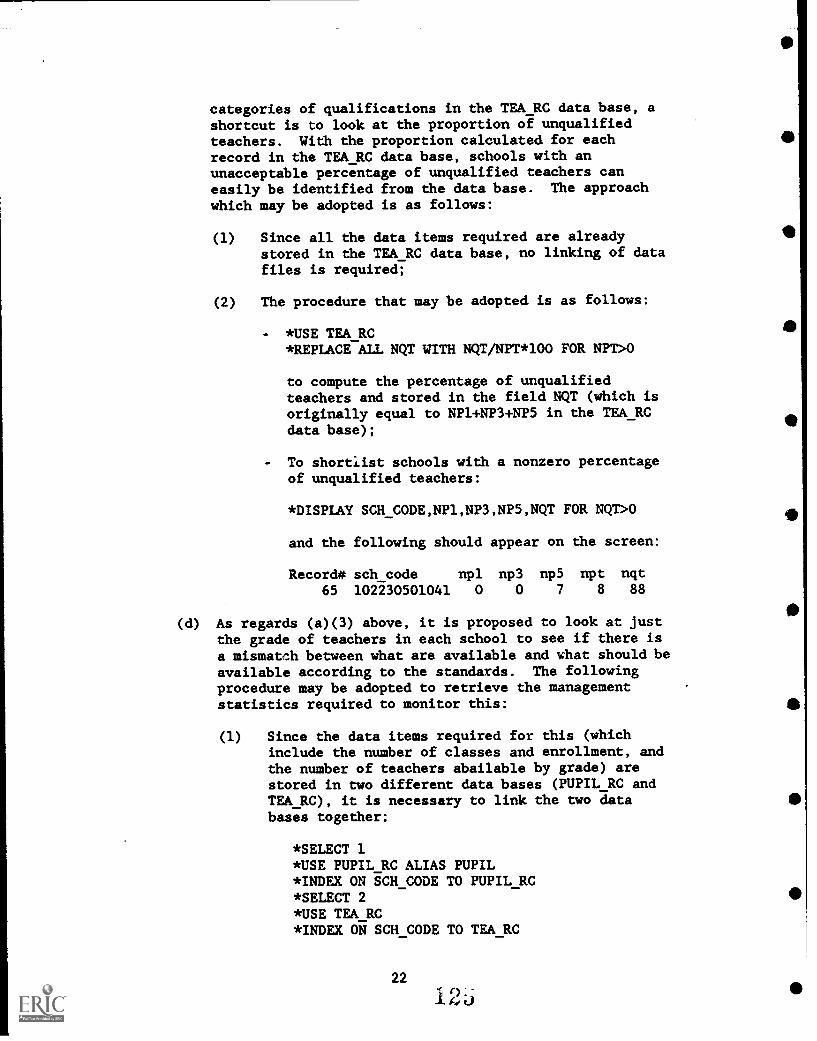
categories of qualifications in the TEA RC data base, ashortcut is to look at the proportion of unqualifiedteachers. With the proportion calculated for eachrecord in the TEA RC data base, schools with anunacceptable percentage of unqualified teachers caneasily be identified from the data base. The approachwhich may be adopted is as follows:
(1) Since all the data items required are alreadystored in the TEA RC data base, no linking of datafiles is required;
(2) The procedure that may be adopted is as follows:
*USE TEA_RC*REPLACE ALL NQT WITH NQT/NPT*100 FOR NPT>0
to compute the percentage of unqualifiedteachers and stored in the field NQT (which isoriginally equal to NP1+NP3+NP5 in the TEA RCdata base);
To shortiist schools with a nonzero percentageof unqualified teachers:
*DISPLAY SCH_CODE,NP1,NP3,NP5,NQT FOR NQT>0
and the following should appear on the screen:
Record# sch code npl np3 np5 npt nqt65 102230501041 0 0 7 8 88
(d) As regards (a)(3) above, it is proposed to look at justthe grade of teachers in each school to see if there isa mismatch between what are available and what should beavailable according to the standards. The followingprocedure may be adopted to retrieve the managementstatistics required to monitor this:
(1) Since the data items required for this (whichinclude the number of classes and enrollment, andthe number of teachers abailable by grade) arestored in two different data bases (PUPIL RC andTEA_RC), it is necessary to link the two databases together:
*SELECT 1*USE PUPIL_RC ALIAS PUPIL*INDEX ON SCH_CODE TO PUPIL_RC*SELECT 2*USE TEA_RC*INDEX ON SCH CODE TO TEA RC
22
.12a

*SET RELATION TO SCH CODE INTO PUPIL
(2) To identify schools with enrollment exceeding 180and which are not staffed with a religion teacher,one may issue the following commands:
*DISPLAY SCH_CODE,TT,NRT FOR NRT-O .AND.PUPIL->ET>180
and the following should show up on the screen:
Record* sch_code tt nrt32 101230502016 5 0
(3) To find out which schools with an enrollment of181 pupils or more, which are not staffed withsufficient numbers of religion and sportsteachers, the following commands may be used:
*DISPLAY SCH_CODE,TT,NRT,NST FORNRT+NST<2 .AND. PUPIL->ET>180
and the following would appear on the screen:
Record* sch_code tt nrt nst3 101230503004 10 1 0
4 101230503005 7 1 05 101230503006 7 1 0
8 102230503009 9 1 0
27 101230502011 6 1 0
28 101230502012 7 1 0
32 101230502016 5 0 1
47 101230501003 10 1 0
48 101230501004 9 1 0
50 101230501006 7 1 052 101230501008 11 1 0
54 101230501010 10 1 056 102230501032 9 1 061 102230501037 9 1 0
63 102230501039 7 1 066 102230501042 9 1 0
(4) In order to find out which schools have less thanthe required number of class teachers, it would berequired to relate staffing standards shown inFigure III above to the total number of classesand enrollment. The two variables areconveniently stored in the PUPIL2 data base.Hence, the TEA_RC and PUPIL2 data files have to belinked:
23

*SELECT 1*USE PUPIL2 ALIAS PU2*INDEX ON SCH_CODE TO PU2*SELECT 2*SET RELATION TO SCH_CODE INTO PU2
(5) To display schools with an enrollment of 181pupils or more, which are staffed withinsufficient numbers of class teachers, thefollowing procedure may be adopted:
*DISPLAY SCH_CODE,TT,NCT,PU2->EA6 FORNCT<PU2->EA6 .AND. PU2->ET>180
and the following records would appear on thescreen:
Record* sch_code tt nct pu2->ea6
40
4 101230503005 7 5 6
5 101230503006 7 5 6
27 101230502011 6 4 7
28 101230502012 7 5 6
31 101230502015 10 5 7
32 101230502016 5 3 8
34 101230504001 7 3 5
35 101230504002 6 3 7
37 101230504004 6 3 6
48 101230501004 9 7 8
50 101230501006 7 5 6
51 101230501007 7 4 6
52 101230501008 11 9 1057 102230501033 10 7 10
58 102230501034 10 7 8
62 102230501038 10 7 9
63 102230501039 7 5 7
65 102230501041 8 5 7
66 102230501042 9 7 8
(6) To find out whether the above schools are alsounderstaffed as far as the total number ofteachers is concerned, a further condition needsto be set to select only those schools which areunderstaffed. Apart from the FOR option, anothermethod is to use the SET FILTER TO option. Withthis option, the records in the data base arefiltered so that only those which meet thespecified conditions will be available fordisplay. This option can be turned off by issuingthe command SET FILTER TO but without anyconditions following the command.
24
12

*SET FILTER TO PU2->ET>180*DISPLAY SCH_CODE,TT,NCT,PU2->EA6,PU2->ET FORNCT<PU2->EA6 .AND. TT<PU2->EA6+3
and the following will show up on the screen:
Record* sch_code tt nct pu2->ea6 pu2->et4 101230503005 7 5 6 2355 101230503006 7 5 6 188
27 101230502011 6 4 7 18228 101230502012 7 5 6 34632 101230502016 5 3 8 35234 101230504001 7 3 5 20835 101230504002 6 3 7 22937 101230504004 6 3 6 20048 101230501004 9 7 8 24950 101230501006 7 5 6 18251 101230501007 7 4 6 22052 101230501008 11 9 10 32757 102230501033 10 7 10 26958 102230501034 10 7 8 28762 102230501038 10 7 9 23563 102230501039 7 5 7 27565 102230501041 8 5 7 22966 102230501042 9 7 8 267
(e) The Finance of Schools. As no information is availableon the amount of financial resources available to th,schools for designing the practical exercise, thissubsection only demonstrates a method of calculating theamount of subsidy that should be made available toschools of different size, based on the approvedstandards. The subsidy standards which are adopted inthe practical exercises are as follows:
Figure IV: Annual Recurrent Subsidy for Primaries
Nature of Subsidy Basis of Calculation Amount (Rp)
(1) Operation Costs per pupil 300per class 10000
(2) Administration per class 8000(3) Maintenance per school 25000(4) Employee Welfare per headmaster
(public school) 30000per teacher 30000
(5) School Garden per school(public school) 24000
(6) Sports & Arts per school(public school) 10000
25

(7) Supervision/ per schoolProgress Reports (public school) 5000
(8) Data Collection per school 5000
In the practical exrcises, information in the databases will be manipulated according to the abovestandards. It should be noted that following more orless the same procedures demonstrated in thissubsection, different standards of calculating recurrentsubsidy to schools can be used. It is suggested thatthe instructors should try to obtain information on anyother methods of calculating recurrent subsidy, and thendemonstrate how to arrive at a new set of figures basedon these other methods.
(f) It may be noted from Figure IV above, information has tobe retrieved from both the teacher (TEA RC) and thepupil (PUPIL RC) data bases. This means that the twodata bases have to be linked. In addition, it may havealready been discovered in the previous subsection onthe staffing of schools, that the information displayedon the screen is not quite adequate in that the names ofthe schools are not displayed. To display school nameswould link to a third data base, namely the schoolmaster file (SCHMAS,. The SET RELATION command does notpermit the setting of more than one relationship at atime. There could be a number of ways of overcomingthis restriction, for example:
(1) To design a program with a number of subroutineseach to accommodate a SET RELATION command;
(2) Or to use the JOIN command to join two data filestogether to form a new data file. This is one ofthe most powerful DBASE III commands for handlingmultiple data bases. The JOIN command may also beused to join two data bases to form a new one forreporting purposes, as the DBASE III reportgenerator does not support the use of more thanone data base. Using the JOIN command could bequite time-consuming, as the DBASE III system willsearch the two data bases sequentially, comparingone record in the first data base with all recordsin the second data base and merging those whichsatisfy the selection conditions with the recordin the first data base. Hence, if large databases are involved, the JOIN command should onlybe used when necessary.
(g) Metl,^d (f)(2) will be adopted in this subsection and the
26
12
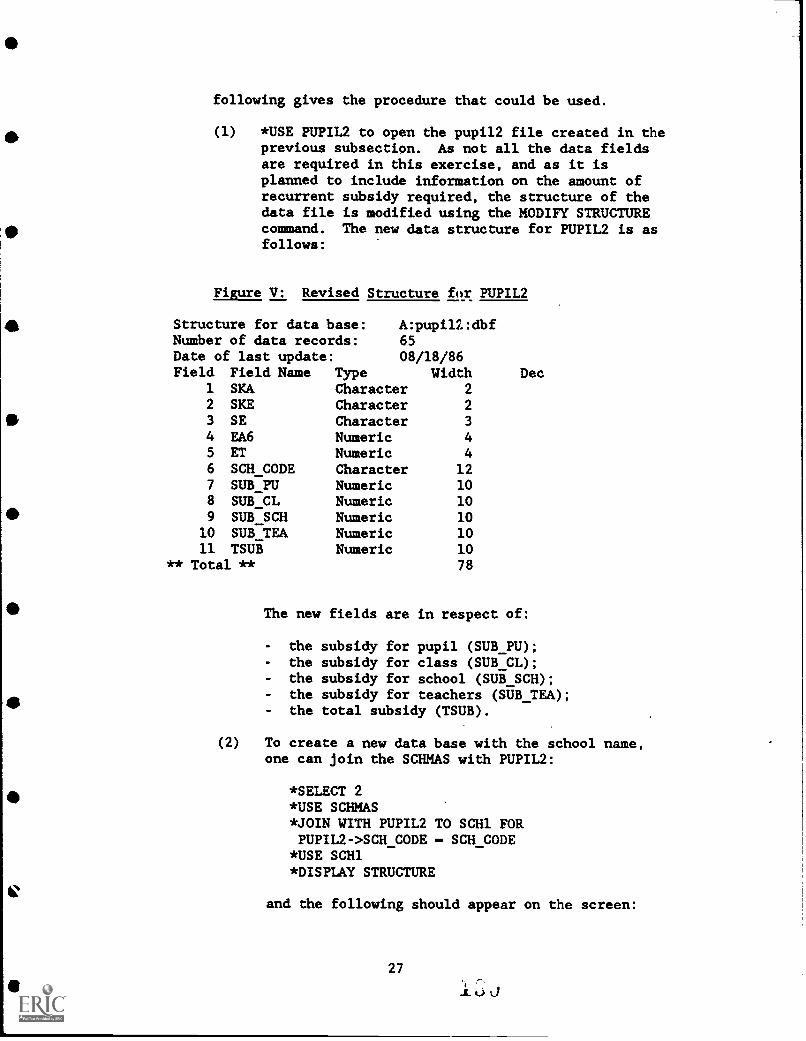
following gives the procedure that could be used.
(1) *USE PUPIL2 to open the pupil2 file created in theprevious subsection. As not all the data fieldsare required in this exercise, and as it isplanned to include information on the amount ofrecurrent subsidy required, the structure of thedata file is modified using the MODIFY STRUCTUREcommand. The new data structure for PUPIL2 is asfollows:
Figure V: Revised Structure for PUPIL2
Structure for data base: A:pupi12:dbfNumber of data records: 65Date of last update: 08/18/86Field Field Name Type Width Dec
1 SKA Character 2
2 SKE Character 2
3 SE Character 3
4 EA6 Numeric 45 ET Numeric 46 SCH_CODE Character 127 SUB_PU Numeric 108 SUB_CL Numeric 109 SUB_SCH Numeric 10
10 SUB_TEA Numeric 1011 TSUB Numeric 10
** Total ** 78
The new fields are in respect of:
the subsidy for pupil (SUB_PU);the subsidy for class (SUB_CL);the subsidy for school (SUB_SCH);the subsidy for teachers (SUB_TEA);the total subsidy (TSUB).
(2) To create a new data base with the school name,one can join the SCHMAS with PUPIL2:
*SELECT 2*USE SCHMAS*JOIN WITH PUPIL2 TO SCH1 FORPUPIL2->SCH CODE - SCH_CODE
*USE SCH1*DISPLAY STRUCTURE
and the following should appear on the screen:
27

Figure VI: Structure for SCH1
Structure for data base: A:schl:dbfNumber of data records: 45Date of last update: 08/18/86Field Field Name Type Width Dec
1 ST Character 2
2 SS Character 1
3 SP Character 2
4 SKA Character 2
5 SKE Character 2
6 SE Character 3
7 SCH_CODE Character 12
8 NAME Character 309 ADDRESS Character 100
10 EA6 Numeric 411 ET Numeric 412 SUB_PU Numeric 1013 SUB_CL Numeric 1014 SUB_SCH Numeric. 10
15 SUB_TEA Numeric 10
16 TSUB Numeric 10** Total ** 213
It may be noted that not all records in the twodata bases are matched. Apparently, there aresome errors in the codes which are probably due tomanual errors during the data input stage when thepupil (PUPIL RC) and school master (SCHMAS) filesare created.
(3) To calculate the amount of recurrent subsidy basedon the number of teachers, it is necessary to linkSCH1 with the TEA RC data base.
*SELECT 2*USE TEA_RC INDEX TEA_RC*SELECT 1*SET RELATION TO SCH_CODE INTO TEA_RC*REPLACE ALL SUB_TEA WITH TEA_RC->TT*30000
(4) To calculate other subsidies based on the numberof classes and pupils, the following procedure maybe adopted:
*REPLACE ALL SUB_SCH WITH25000+30000+24000+10000+5000+5000 FOR SS - "1"
*REPLACE ALL SUB_SCH WITH 5000+5000 FOR SS - "2"*REPLACE ALL SUB_CL WITH EA6*(10000+8000)*REPLACE ALL SUB_PU WITH ET*300
28
13

And to calculate the total amount of recurrentsubsidy:
*REPLACE ALL TSUB WITHSUB_PU+SUB_CL+SUB_SCH+SUB_TEA
(5) It will soon be discovered that the average costper pupil which is a very useful indicator has notbeen included in the data base. This additionalrequirement can be met by changing the structureof SCH1 by the MODIFY STRUCTURE command. Therevised structure is shown below:
Figure VII: Revised Structure for SCH1
Structure for data base: A:schl:dbfNumber of data records: 45Date of last update: 08/18/86Field Field Name Type Width Dec
1 ST Character 2
2 SS Character 1
3 SP Character 2
4 SKA Character 2
5 SKE Character 2
6 SE Character 3
7 SCH_CODE Character 128 NAME Character 309 ADDRESS Character 100
10 EA6 Numeric 411 ET Numeric 412 SUB_PU Numeric 1013 SUB_CL Numeric 1014 SUB_SCH Numeric 1015 SUB_TEA Numeric 1016 TSUB Numeric 1017 UCOST Numeric 5
** Total ** 218
And the average cost per pupil can be computed by:
*REPLACE ALL UCOST WITH TSUB/ET.
(6) One way of monitoring the financial resourcesavailable to schools is to identify schools whichhave below-average level of finances. Theprocedure that may be adopted is:
*AVERAGE UCOST and the screen will show theresults as follows:
29
0

45 records averageducost3186
To display those schools whose average subsidy perpupil is less than the average of 3186 Rp, thefollowing command may be issued:
*DISPLAY SCH_CODE,NAME,UCOST FOR UCOST<3186
and the information displayed on the screen shouldlook something like this:
Record* sch_code2 1012305020023 1012305020035 1012305020056 1012305020068 1012305020089 101230502009
10 10123050200912 10123050201113 101230502012'14 10123050201315 10123050201416 10123050201517 10123050201619 10123050300120 10123050300221 10123050300422 10123050300523 10123050300626 10223050300927 10223050301030 10223050301331 10223050301435 10123050400136 10123050400238 10123050400439 10123050400541 10123050400643 10123050400944 101230504010
name ucostPEKAT 2348KWANGKO 2990SORIUTU 2812NO2 KEMPO 2288DOROPETI 2344NAPA 2791NAPA 2484KONTE 2525KESI 1505PUPAU BAJO 2609TANJU 3132TA'A 2443KADINDI 1416SDN NO.1 RANGGE 2414SDN DANA 2474SDN SAWS 2785SDN JAMBU 2074SDN FANDA 2518SDN IMPRES SOKE 2183SDN IMPRES KUTA 2551SDN INPRES DESA HU'U 2346SDN INPRES JAIA 2594SDN KILO 2218SDN IABI 2069SDN KIWU 2235SDN TAROPO 2545SD INPRES MALAJU 2995SD INPRES DESA MALAJU 2617SD INPRES PALI 2863
Alternatively, one may wish to find out schoolswhich are poorly financed. For example:
*DISPLAY SCH CODE,NAME,UCOST FOR UCOST<2500
and the following schools will be listed:
30
113
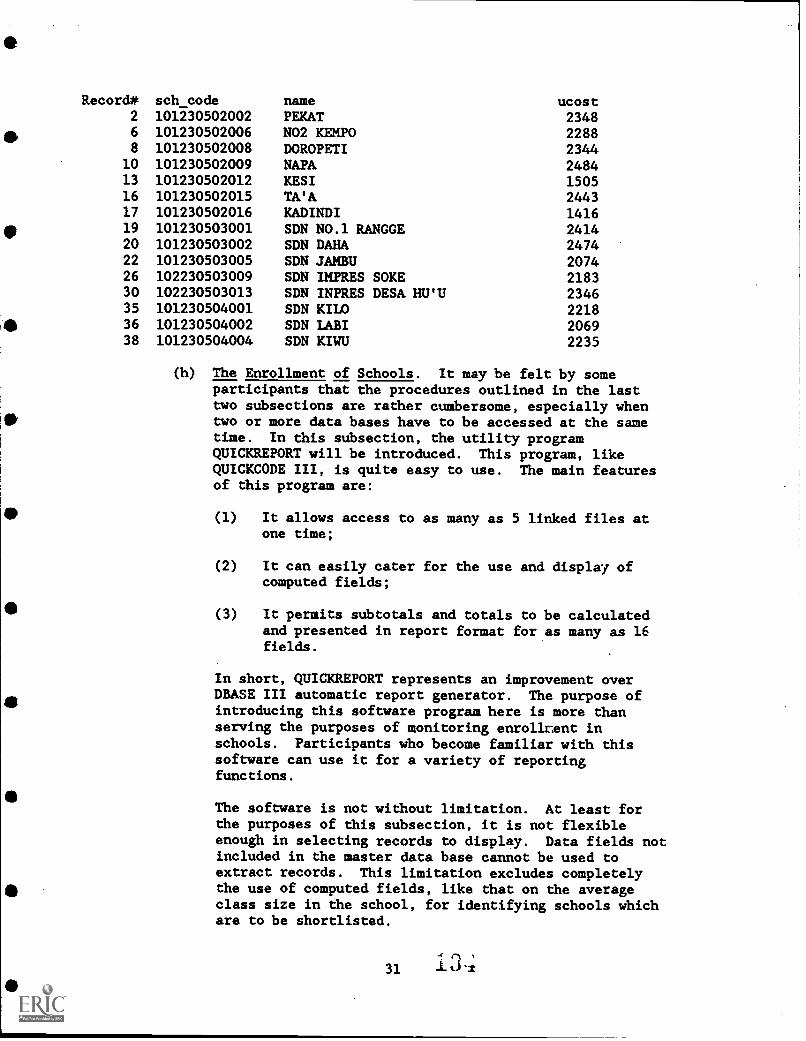
Record* sch_code name ucost2 101230502002 PEKAT 23486 101230502006 NO2 KEMPO 22888 101230502008 DOROPETI 2344
10 101230502009 NAPA 248413 101230502012 KESI 150516 101230502015 TA'A 244317 101230502016 KADINDI 141619 101230503001 SDN NO.1 RANGGE 241420 101230503002 SDN DANA 247422 101230503005 SDN JAMBU 207426 102230503009 SDN INPRES SOKE 218330 102230503013 SDN INPRES DESA HU'U 234635 101230504001 SDN KILO 221836 101230504002 SDN LABI 206938 101230504004 SDN KIWU 2235
(h) The Enrollment of Schools. It may be felt by someparticipants that the procedures outlined in the lasttwo subsections are rather cumbersome, especially whentwo or more data bases have to be accessed at the sametime. In this subsection, the utility programQUICKREPORT will be introduced. This program, likeQUICKCODE III, is quite easy to use. The main featuresof this program are:
(1) It allows access to as many as 5 linked files atone time;
(2) It can easily cater for the use and display ofcomputed fields;
(3) It permits subtotals and totals to be calculatedand presented in report format for as many as 16fields.
In short, QUICKREPORT represents an improvement overDBASE III automatic report generator. The purpose ofintroducing this software program here is more thanserving the purposes of monitoring enrollent inschools. Participants who become familiar with thissoftware can use it for a variety of reportingfunctions.
The software is not without limitation. At least forthe purposes of this subsection, it is not flexibleenough in selecting records to display. Data fields notincluded in the master data base cannot be used toextract records. This limitation excludes completelythe use of computed fields, like that on the averageclass size in the school, for identifying schools whichare to be shortlisted.
31 d-/
(i) What is presented below is an illustration of oneapplication of QUICKREPORT. The exercise is to producesummary statistics based on information available inthree data bases:
(1) SCHMAS - for providing information on the names ofthe schools;
(2) FLOW RC - for providing information on the numberof Primary 1 pupils admitted and the numberplanned to admit. This gives the percentage ofP.1 places filled which can be used as an earlyindicator of the future utilization rate of theschool concerned;
(3) PUPIL RC - which will be used as the master database in QUICKREPORT. The data base provides thebasic information on the number of operatingclasses by grade, total enrollment, the schoolcode, district, and subdistrict codes, and thecode for type of school. The average class sizecan be computed from the total number of operatingclasses (a field yet to be created) and the totalenrollment.
Using QUICKREPORT, a report file named ENR1.QR has beengenerated and stored in Diskette "EPP Mod.v.4." Byrunning QUICKREPORT from either Drive C or Drive B, andplacing the Diskette in Drive A, the report file can beexecuted to produce reports on the printer, the screenor to a disk file.
(j) The following attempt to depict the main proceduralsteps involved in creating the report file ENR1.QR.
4/1
(1) There are basically four steps involved increating a report: 41
selecting the master data file and its linkedfiles;
selecting the data fields to appear on thereport from the files selected, including thecreation of computed fields;
the design of the report format using the"blackboard" provided by QUICKREPORT;
the drawing up of the extraction criterion forselecting records to be extracted for display.
321 3 j
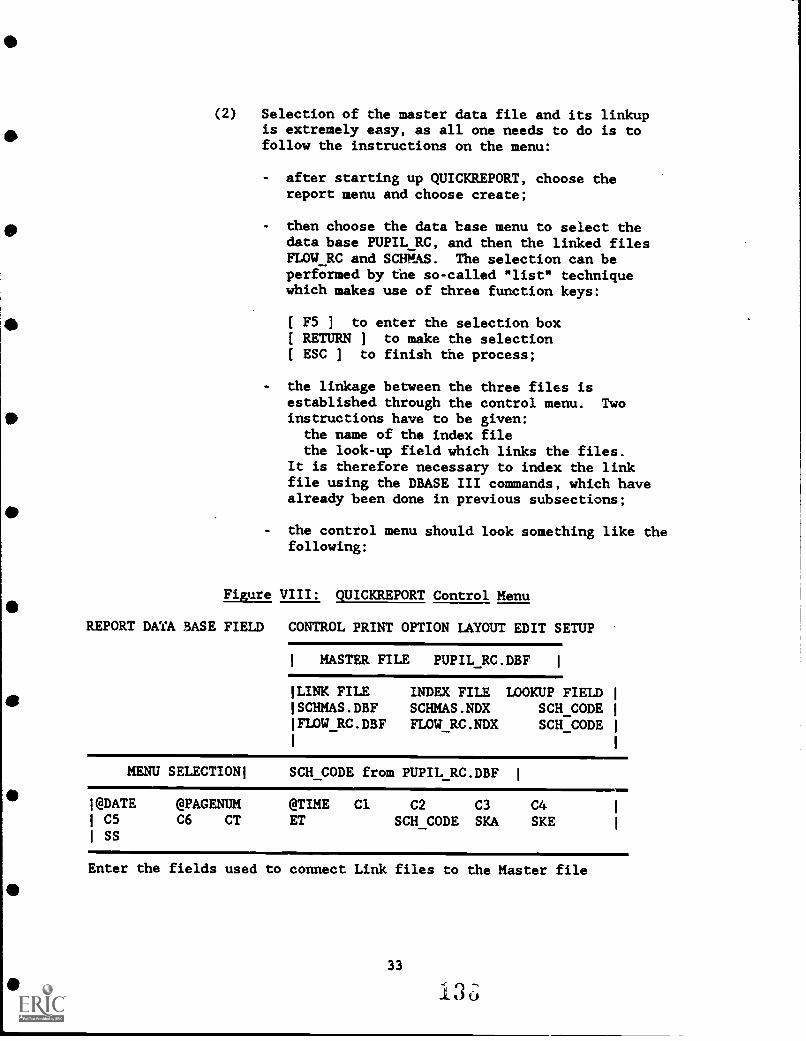
0
(2) Selection of the master data file and its linkupis extremely easy, as all one needs to do is tofollow the instructions on the menu:
after starting up QUICKREPORT, choose thereport menu and choose create;
then choose the data base menu to select thedata base PUPIL RC, and then the linked filesFLOW RC and SOMAS. The selection can beperformed by the so-called "list" techniquewhich makes use of three function keys:
[ F5 ] to enter the selection box[ RETURN ] to make the selection[ ESC ] to finish the process;
the linkage between the three files isestablished through the control menu. Twoinstructions have to be given:the name of the index filethe look-up field which links the files.
It is therefore necessary to index the linkfile using the DBASE III commands, which havealready been done in previous subsections;
the control menu should look something like thefollowing:
Figure VIII: QUICKREPORT Control Menu
REPORT DATA BASE FIELD CONTROL PRINT OPTION LAYOUT EDIT SETUP
1 MASTER FILE PUPIL RC.DBF 1
ILINK FILE1SCHMAS.DBF1FLOWRC.DBF
INDEX FILE LOOKUP FIELDSCHMAS.NDX SCH_CODEFLOW RC.NDX SCH_CODE
MENU SELECTION' SCH_CODE from PUPIL RC.DBF 1
I @DATE @PAGENUM @TIME Cl C2 C3 C41 C5 C6 CT ET SCH_CODE SKA SKE1 SS
VIM
Enter the fields used to connect Link files to the Master file
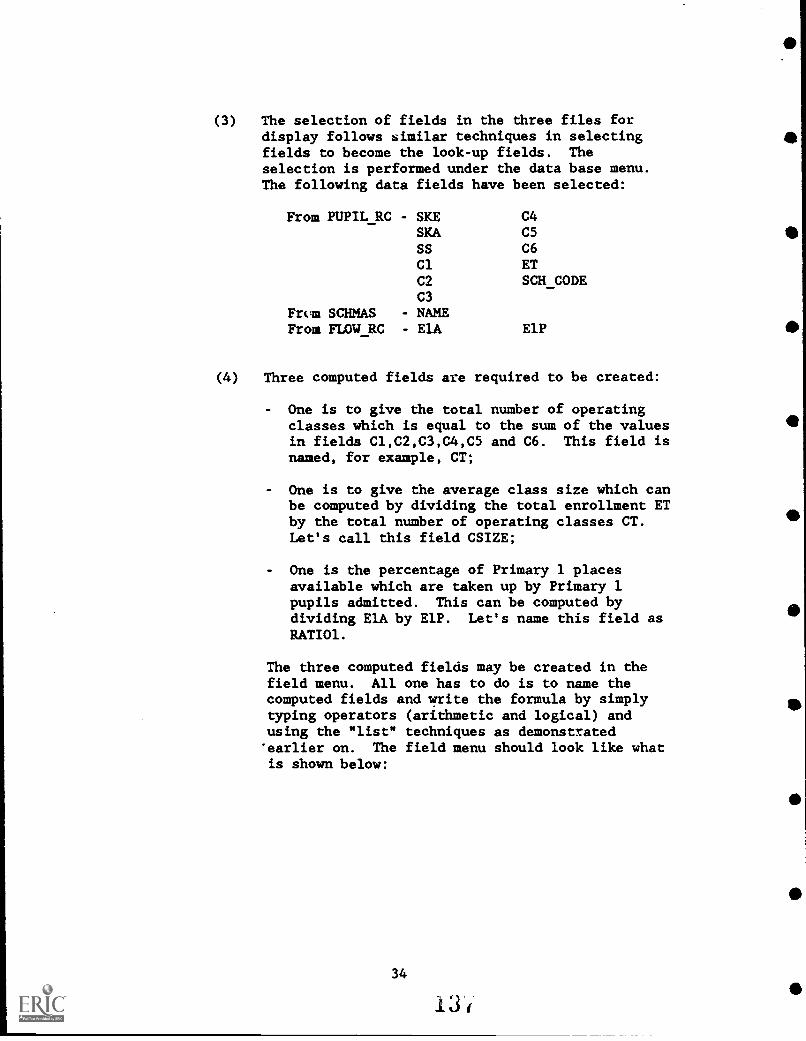
(3) The selection of fields in the three files fordisplay follows similar techniques in selectingfields to become the look-up fields. Theselection is performed under the data base menu.The following data fields have been selected:
From PUPIL RC SKE C4SKA C5 41SS C6Cl ETC2 SCH_CODEC3
From SCHMAS - NAMEFrom FLOW RC - E1A E1P
(4) Three computed fields are required to be created:
One is to give the total number of operatingclasses which is equal to the sum of the valuesin fields Cl,C2,C3,C4,C5 and C6. This field isnamed, for example, CT;
One is to give the average class size which canbe computed by dividing the total enrollment ETby the total number of operating classes CT.Let's call this field CSIZE;
One is the percentage of Primary 1 placesavailable which are taken up by Primary 1pupils admitted. This can be computed bydividing E1A by E1P. Let's name this field asRATI01.
The three computed fields may be created in thefield menu. All one has to do is to name thecomputed fields and write the formula by simplytyping operators (arithmetic and logical) andusing the "list" techniques as demonstrated'earlier on. The field menu should look like whatis shown below:
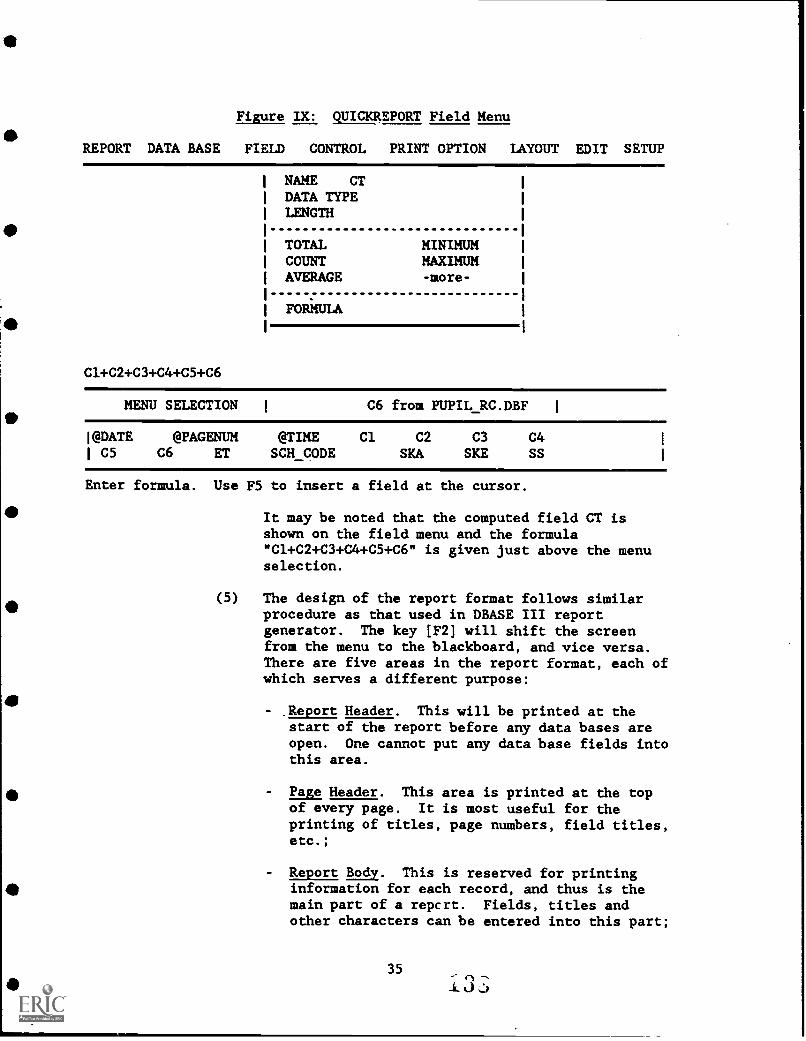
Figure IX: QUICKREPORT Field Menu
REPORT DATA BASE FIELD CONTROL PRINT OPTION LAYOUT EDIT SETUP
NAME CTDATA TYPELENGTH
TOTAL MINIMUMCOUNT MAXIMUMAVERAGE -more-
FORMULA
Cl+C2+C3+C4+C5+C6
MENU SELECTION C6 from PUPIL RC.DBF
1@DATE @PAGENUM @TIME Cl C21 C5 C6 ET SCH_CODE SKA
C3SKE
C4SS
Enter formula. Use F5 to insert a field at the cursor.
It may be noted that the computed field CT isshown on the field menu and the formula"Cl+C2+C3+C4+C5+C6" is given just above the menuselection.
(5) The design of the report format follows similarprocedure as that used in DBASE III reportgenerator. The key [F2] will shift the screenfrom the menu to the blackboard, and vice versa.There are five areas in the report format, each ofwhich serves a different purpose:
- _Report Header. This will be printed at thestart of the report before any data bases areopen. One cannot put any data base fields intothis area.
- Page Header. This area is printed at the topof every page. It is most useful for theprinting of titles, page numbers, field titles,etc.;
- Report Body. This is reserved for printinginformation for each record, and thus is themain part of a repert. Fields, titles andother characters can be entered into this part;
35

- Page Footer. This is printed at the end ofevery page. It can be used to print pagetotals, page numbers or any other summaryinformation;
Report Footer. This is printed at the end ofthe report, after all the data bases areclosed. It can be used to print the totals forthe entire report, and any other informationthat one would like to appear at the end of thereport.
The size of the five areas may be expanded orreduced by pressing respectively the "+" and "-"keys at the right of the numeric pad on thekeyboard.
The following show the report design for thereport file ENR1:
Figure X: Report Format Design for ENR1
Special Report on the Enrollment Position in Schools
School Code Name of School AverageClass Size
% of P.1 Placestaken up
SCH_CODE NAME CSIZE RATIO1
DRAW REPORT I PAGE FOOTER
@DATE @PAGENUM @TIME Cl C2 C3 C4C5 C6 CSIZE CT E1A EIP ETNAME RATIO1 SCHCODE SKA SKE SS
(6) The setting of the extraction criteria can easilybe done in the control menu. The criteria are setup by assigning selection conditions to the valuesof the fields in the master data file so that anyrecords satisfying these conditions would beextracted for display or printing. In thisexercise, the selection criterion chosen is forschools located in the subdistrict "01." Thiscondition may be changed every time the report is
36
135

displayed, so that in effect, one can selectschools from a number of districts, one at a time.The following give the control menu for settingextraction criteria:
Figure XI: Control Menu for Setting Extraction Criteria
REPORT DATA BASE FIELD CONTROL PRINT OPTION LAYOUT EDIT SETUP
MASTER FILE PUPIL RC.DBF
SORT ORDERBREAK GROUPSLINK FILESEXTRACT CRITERIA
MISSING LINK SKIP RECORDRESET PAGE NUMBERS
SKE"01"
MENU SELECTION RATIO1 from COMPUTATION
@DATEC5NAME
@PAGENUMC6RATIO1
@TIME ClCSIZE CT
SCH_CODE
C2
E1ASKA
C3E1PSKE
C4ETSS
Enter formula. Use F5 to insert a field at the cursor.
(7) The report design has to be saved before it can berun to print the report on the screen, the printeror to an external disk file. The following reportshould be produced if extraction condition is setto SKE "04 ";
Figure XII: Sample Report from ENR1 File
Special Report on the Enrollment SituationSchool Code Name of School Average
Class Size
in Schools% of P.1 Places
taken up101230502001 SDN NOI KEMPO 21 40101230502002 PEKAT 24 75
101230502003 KWANGKO 25 80101230502004 SORO 9 20101230502005 SORIUTU 28 121101230502006 NO2 KEMPO 40 100
37

101230502007 BANGGO 13 40
10123`502008101230:02009
DOROPETINAPA
2722
15
100 41b
101230502010 NANGAMIRO 14 40
101230502011 KONTE 26 32
101230502012 KESI 58 115
101230502013 PUPAU BAJO 38 100
101230502014 TANJU 20 62
101230502015 TA'A 35 925
101230502016 KADINDI 44 110
101230502017 CALABAI 31 60
101230502009 NAPA 23 100
Use F9 and F10 to scroll L'FT and RIGHT. Press RETURN for next screen.
5.2.3 Advisory Activities. In this subsection, we willexperiment combining some of the techniques demonstrated inthe previous subsections to perform the following functions:
(a) Simultaneously accessing data fields in three files(PUPIL RC, FLOW RC and TEA RC). This is to be achievedusing the JOIN command several times so that only onesingle file (which will be named SCH2) containing allthe required data fields will be used;
(b) To compute a number of indicators using the REPLACEcommand and store these indicators in the new file SCH2.Additional fields have to be created to accommodate theindicators, using the MODIFY STRUCTURE facility in DBASEIII;
(c) The records will be printed or displayed in a format tobe created using the DBASE III report generator. Twonew features will be added to the reports:
(d)
(1) One is the SET RELATION command, which if usedbefore the creation and printing of the reportformat, allows the report to access two data basesat the same time;
(2) One is to use the FOR clause to set downextraction criteria in selectively displaying therecords.
The procedure that may be adopted is shown below:
(1) In the first place, a new data base has to becreated, containing fields which will store valuesfor the following indicators:
- the repetition rate;
3814i

the proportion of P.6 leavers passing the finalexamination;the pupil-teacher ratio;the average class size;the proportion of unqualified teachers.
This new file is to be created using the PUPIL_RCdata to start up. Two new commands are used inthis exercise: COPY STRUCTURE and APPEND FROM.
*USE PUPIL RC*COPY STRUCTURE TO SCH2*MODIFY STRUCTURE to delete fields which are nolonger required, and to add the following newfields:
CSIZE - average class sizeRRATE - repetition ratePTRATIO - pupil/teacher ratioNQRATE % of unqualified teachersP6RATE - % of P.6 pupils passing examination
*DISPLAY STRUCTURE, and the following shouldshow up on the screen:
Figure XIII: Structure for SCH2
Structure for data base: A:sch2.dbfNumber of data records: 0
Date of last update: 08/18/86Field Field Name Type Width Dec
1 SS Character 1
2 SKE Character 2
3 Cl Numeric 2
4 C2 Numeric 2
5 C3 Numeric 2
6 C4 Numeric 2
7 C5
8 C6NumericNumeric
2
2
9 ET Numeric 410 SCH_CODE Character 1211 CT Numeric 3
12 CSIZE Numeric 3 1
13 RRATE Numeric 3 114 PTRATIO Numeric 2
15 NQRATE Numeric 3 1
16 P6PASS Numeric 3 1
1K 7otal ** 49
*APPEND FROM PUPIL_RC and this will copy thedata from PUPIL_RC. Data for fields notpresent in the SCH2 will not be appended.
39
I 'A

*INDEX ON SCH_CODE TO SCH2 to create an indexfile called SCH2.
*DISPLAY STATUS will give the following:
Currently Selected Data base:Select area: 1, Data base in Use: A:sch2.dbf Alias: SCH2
Master index file: A:sch2.ndx Key: sch_code
(2) The next step is to create a new file by JOININGwith the data base FLOW_RC and then TEA_RC.
*SELECT 2*USE FLOW_RC INDEX FLOW_RC*SELECT 1*JOIN WITH FLOW_RC TO SCH3 FORFLOW RC->SCH_CODESCH_CODE
A new file SCH3 is created. By modifying itsstructure to delflte fields that are not requiredone will get a data base SCH3 with the followingstructure:
Figure XIV: Structure for SCH3
Structure for data base: A:sch3.dbfNumber of data records: 65
Date of last update: 08/18/86Field Field Name Type Width Dec
1 Cl Numeric 2
2 C2 Numeric 2
3 C3 Numeric 2
4 C4 Numeric 2
5 C5 Numeric 2
6 C6 Numeric 2
7 ET Numeric 4
8 SCH CODE Character 12
9 CT Numeric 3
10 CSIZE Numeric 3 1
11 RRATE Numeric 3 1
12 PTRATIO Numeric 2
13 NQRATE Numeric 3 1
14 P6PASS Numeric 3 1
15 GL Numeric 3
16 GT Numeric 3
17 GP Numeric 3
18 RTT Numeric 3
** Total ** 58
*SELECT 2*USE TEA_RC INDEX TEA_RC
40
a
0)

*SELECT 1*JOIN WITH TEA_RC TO SCHSUM FORTEA RC->SCH_CODESCH_CODE*USE SCHSUM*DISPLAY STRUCTURE and the following will show upon the screen:
Figure XV: Structure for SCHSUM
Structure for data base: A:schsum.dbfNumber .of data records: 65
Date of last update: 08/18/86Field Field Name Type Width Dec
1 Cl Numeric 2
2 C2 Numeric 2
3 C3 Numeric 2
4 C4 Numeric 2
5 C5 Numeric 2
6 C6 Numeric 2
7 ET Numeric 4-8 SCH_CODE Character 129 CT Numeric 3
10 CSIZE Numeric 3 1
11 RRATE Numeric 3 1
12 PTRATIO Numeric 2
13 NQRATE Numeric 3 1
14 P6PASS Numeric 3 1
15 GL Numeric 3
16 GT Numeric 3
17 GP Numeric 3
18 RTT Numeric 3
19 YR Numeric 420 ST Character 2
21 SS Character 1
22 SP Character 2
23 SKA Character 2
24 SKE Character 2
25 SE Character 3
26 SESS Character 1
27 AP Numeric 2
28 LP Numeric 2
29 TP Numeric 3
30 AN Numeric 2
31 LN Numeric 2
32 TN Numeric 3
33 TM Numeric 3
34 TF Numeric 3
35 TT Numeric 3
36 NP1 Numeric 2
37 NP2 Numeric 2
38 NP3 Numeric 2
41

39 NP4 Numeric 2
40 NP5 Numeric 2
41 NP6 Numeric 2
42 NP7 Numeric 2
43 NP8 Numeric 2
44 NPT Numeric 3
45 PH Numeric 2
46 PC47 PR
NumericNumeric
2
2
48 PS Numeric 2
49 PT Numeric 3
50 NH Numeric 2
51 NC Numeric 2
52 NR Numeric 2
53 NS Numeric 2
54 NT Numeric 3
55 NQT Numeric 3
56 NHT Numeric 2
57 NCT Numeric 2
58 NRT Numeric 2
59 NST Numeric 2
60 GTT Numeric 3
** Total ** 153
(3) The third step is to compute the value for thefields CT, CSIZE, RRATE, PTRATIO, NQRATE andP6PASS.
*REPLACE ALL CT WITH C1 +C2+C3+C4+C5+C6 to givethe total number of operating classes;
*REPLACE ALL CSIZE WITH ET/CT to give theaverage class size in each school, by dividingthe total enrollment (ET) by the total numberof operating classes (CT);
*REPLACE ALL RRATE WITH RTT/ET*100 to give therepetition rate, by dividing the total numberof repeaters (RTT) by the total enrollment(ET);
*REPLACE ALL PTRATIO WITH ET/TT to give thepupil/teacher ratio, by dividing the totalenrollment :M.) by the total number of teachers(TT);
*REPLACE ALL NQRATE WITH NQT/TT to give theproportion of unqualified teachers, by dividingthe number of unqualified teachers (NQT) by thetotal number of teachers (TT);
4214

*REPLACE ALL P6PASS WITH GP/GL*100 FOR GL>0 togive the percentage of P.6 pupils passing thefinal examination, by dividing the number ofP.6 leavers passing the final examination (GP)by the total number of P.6 leavers (GL). Thecondition GL>0 is to safeguard against anyschools with no P.6 leavers to avoid numericoverflow.
(4) The fourth step is to create a report format fordisplaying indicators constructed above togetherwith the schools. The DBASE III report generatorwill be used. In this exercise, the file SCHMASwill also be used so that the report will show thenames of schools selected as well. Accessingsimultaneously two data bases requires the use ofthe SET RELATION command before the creation ofthe report file and the printing of the report.The following procedure may be adopted:
*SELECT 2*USE SCHMAS INDEX SCHMAS*SELECT 1*INDEX ON SCH_CODE TO SCHSUM*SET RELATION TO SCH_CODE INTO SCHMAS*CREATE REPORT ENR2
Then the DBASE III full screen report generatorwill appear on the screen. By following theinstructions given, one can create a report fileENR2. Very briefly, two steps need to be taken:
- In the option menu, one has to give the titleof the report, as well as other page formattinginstructions;
In the column options, one has to select thenames of the fields to be included in thereport, and the headings of the fields whichwill appear on the report. One field willoccupy one column, the width of which isdetermined the length of the column heading orthe width of the field selected.
The report layout which appears in the reportgenerator template will look something like thediagram below:
43
`7..t 0
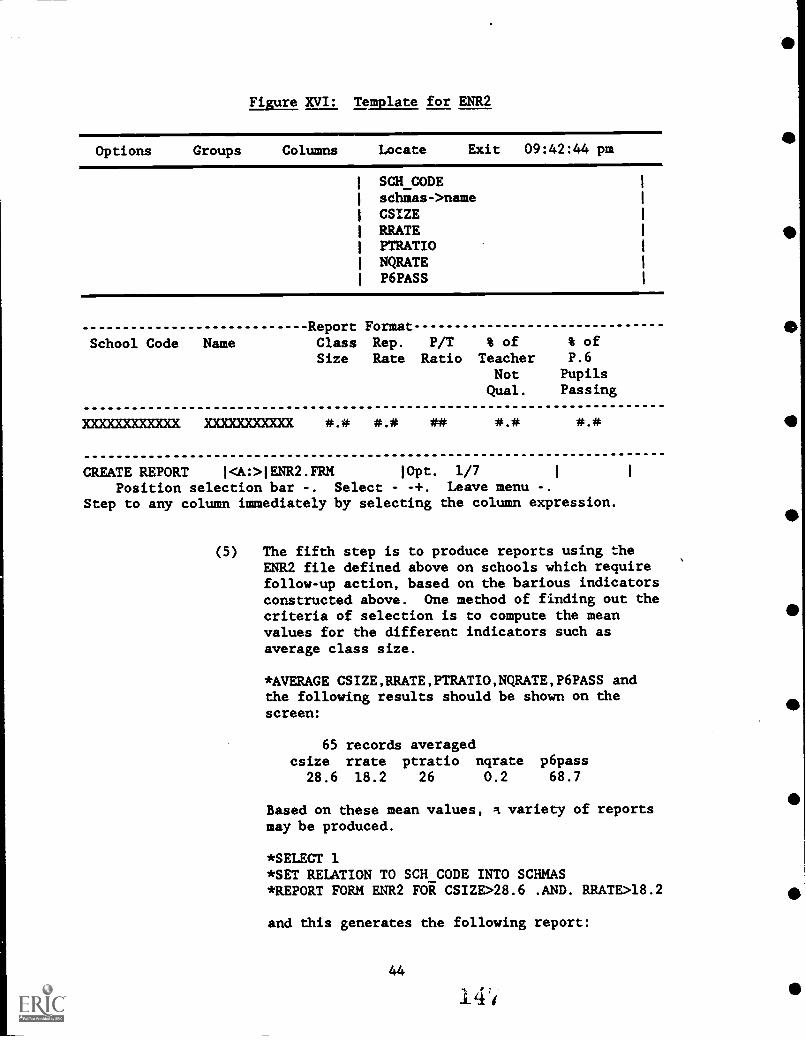
Figure XVI: Template for ENR2
Options Groups Columns Locate Exit 09:42:44 pm
SCH_CODEschmas->nameCSIZERRATEPTRATIONQRATEP6PASS
School Code NameReport FormatClass Rep. P/T % of % of
Size Rate Ratio Teacher P.6Not Pupils
Qual. Passing
MOODDOUCCUOM )00020000CM #.# #.# ## #.# #.#
CREATE REPORT I<A:>IENR2.FRM !Opt. 1/7I
Position selection bar -. Select - - +. Leave menu -.Step to any column immediately by selecting the column expression.
(5) The fifth step is to produce reports using theENR2 file defined above on schools which requirefollow-up action, based on the barious indicatorsconstructed above. One method of finding out thecriteria of selection is to compute the meanvalues for the different indicators such asaverage class size.
*AVERAGE CSIZE,RRATE,PTRATIO,NQRATE,P6PASS andthe following results should be shown on thescreen:
65 records averagedcsize crate ptratio nqrate p6pass
28.6 18.2 26 0.2 68.7
Based on these mean values, a variety of reportsmay be produced.
*SELECT 1*SET RELATION TO SCH_CODE INTO SCHMAS*REPORT FORM ENR2 FOR CSIZE>28.6 .AND. RRATE>18.2
and this generates the following report:
44
I

Page No.08/18/86
1
Figure XVII: Sample Report 1 for ENR2
School Code Name
Ad Hoc Report of Schools for theAdvisory Inspectorate
Class Rep. P/T % of % ofSize Rate Ratio. Teacher P.6
Not PupilsQual. Passing
101230501003 43.0 19.0 34 0.0 92.0101230501004 31.0 23.0 28 0.0 97.0101230501006 30.0 25.0 26 0.0 0.0101230501007 37.0 34.0 31 0.0 57.0101230501010 35.0 24.0 21 0.0 79.010123e02006 NO2 KEMPO 40.0 22.0 27 0.0 97.0101230502016 KADINDI 44.0 26.0 .70 0.0 89.0101230503004 SDN SAWS 34.0 22.0 20 0.0 100.0101230503005 SDN JAMBU 39.0 20.0 34 0.0 71.0101230503006 SDN FANDA 31.0 35.0 27 0.0 74.0101230503007 SDN NO.2 R 30.0 23.0 16 0.0 70.0101230504002 SDN LABI 33.0 50.0 38 0.0 89.0101230504004 SDN KIWU 33.0 22.0 33 0.0 86.0102230501032 33.0 23.0 22 0.0 92.0102230501034 36.0 42.0 29 0.0 100.0102230501037 35.0 34.0 27 0.0 87.0102230501039 39.0 28.0 39 0.0 73.0102230501041 . 33.0 40.0 29 11.0 78.0102230503013 SDN INPRES 29.0 35.0 22 0.0 67.0
** Total ** 665.0 547.0 573 11.0 1498.0
*REPORT FORM ENR2 FOR P6PASS<68.7 .AND. PTRATIO>26
and the following report will be produced:
45
141J
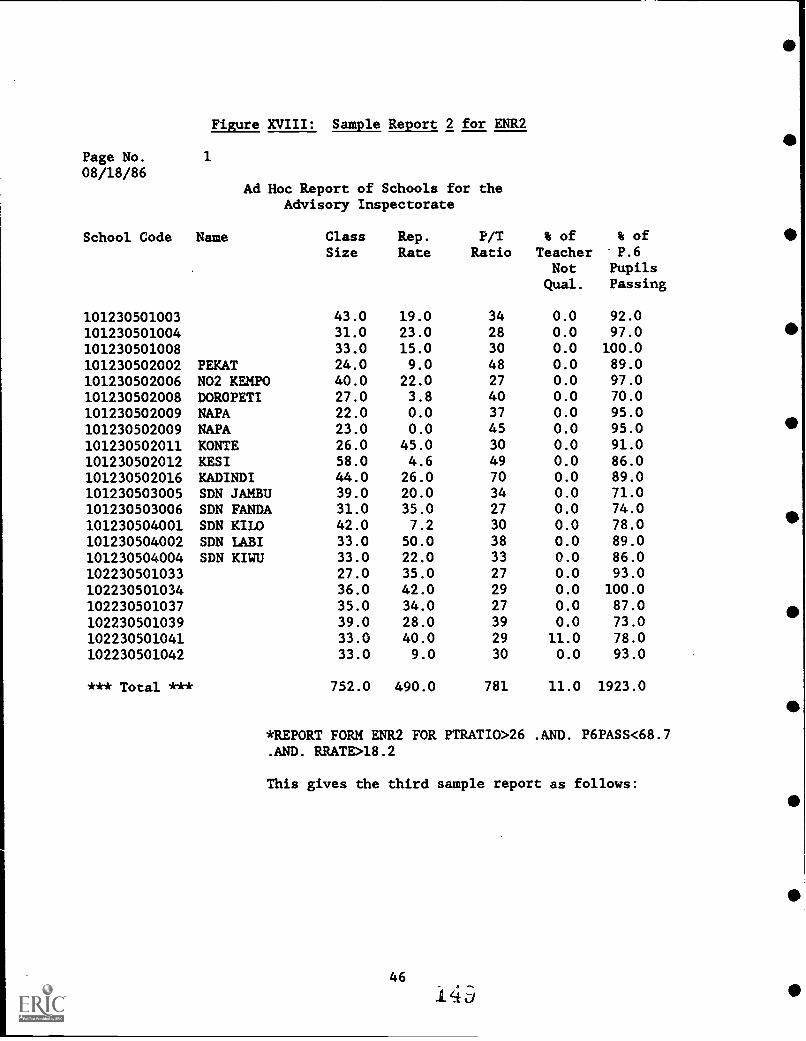
Page No.08/18/86
1
Figure XVIII: Sample Report 2 for ENR2
School Code Name
Ad Hoc Report of Schools for theAdvisory Inspectorate
Class Rep. P/T % of % ofSize Rate Ratio Teacher P.6
Not PupilsQual. Passing
101230501003 43.0 19.0 34 0.0 92.0
101230501004 31.0 23.0 28 0.0 97.0
101230501008 33.0 15.0 30 0.0 100.0
101230502002 PEKAT 24.0 9.0 48 0.0 89.0
101230502006 NO2 KEMPO 40.0 22.0 27 0.0 97.0
101230502008 DOROPETI 27.0 3.8 40 0.0 70.0
101230502009 NAPA 22.0 0.0 37 0.0 95.0
101230502009 NAPA 23.0 0.0 45 0.0 95.0
101230502011 KONTE 26.0 45.0 30 0.0 91.0
101230502012 KESI 58.0 4.6 49 0.0 86.0
101230502016 KADINDI 44.0 26.0 70 0.0 89.0
101230503005 SDN JAMBU 39.0 20.0 34 0.0 71.0
101230503006 SDN FANDA 31.0 35.0 27 0.0 74.0
101230504001 SDN KILO 42.0 7.2 30 0.0 78.0
101230504002 SDN LAM 33.0 50.0 38 0.0 89.0
101230504004 SDN KIWU 33.0 22.0 33 0.0 86.0
102230501033 27.0 35.0 27 0.0 93.0
102230501034 36.0 42.0 29 0.0 100.0102230501037 35.0 34.0 27 0.0 87.0
102230501039 39.0 28.0 39 0.0 73.0
102230501041 33.0 40.0 29 11.0 78.0
102230501042 33.0 9.0 30 0.0 93.0
*** Total *** 752.0 490.0 781 11.0 1923.0
*REPORT FORM ENR2 FOR PTRATIO>26 .AND. P6PASS<68.7.AND. RRATE>18.2
This gives the third sample report as follows:
46
I 4

Page No.08/18/86
1
School Code Name
Figure XIX: Sample Report 3 on ENR2
Ad Hoc Report of Schools for theAdvisory Inspectorate
Class Rep. P/T % of % ofSize Rate Ratio Teacher P.6
Not PupilsQual. Passing
101230501007 37.0 34.0 31 0.0 57.0101230502004 SORO 8.7 28.0 29 0.0 0.0101230504009 SD INPRES 28.0 23.0 28 0.0 7.4101230504011 SD KECIL E 13.0 33.0 52 0.0 0.0
*** Total *** 86.7 118.0 140 0.0 64.4
5.3 Monitoring of School Projects
5.3.1 The participants should have a firm grasp of thebasic techniques in using DBASE III to construct and query adata base, and produce a variety of reports and compilestatistical data from single or multiple data bases.Therefore, it is not proposed to repeat these demonstrationsin this subsection. Furthermore, there are no data availableto construct a data base of school projects. Nevertheless,in this subsection, the construction of a sample data base onschool projects is demonstrated using QUICKCODE III. Thepurpose is to demonstrate how a simple information system onthe progress of school projects could be set up, which willcontain the various data items discussed in paragraph 4.2.6above.
5.3.2 What is presented below is the procedure which may befollowed in constructing the data base. If there areparticipants who have not gone through Module II and hencemay not be familiar with the use of QUICKCODE III, theinstructors will have to refer to the teaching materials inModule II on the use of this utility program. Very briefly,users have to perform three main functions in creating thedata base file and other utility programmes:
(a) Designing the data input screen using the Quickscreenmode in QUICKCODE III, and at the same time drawing upthe list of fields to be included in the data base,assigning them names as well as the primary field types
47
I. R.) ti
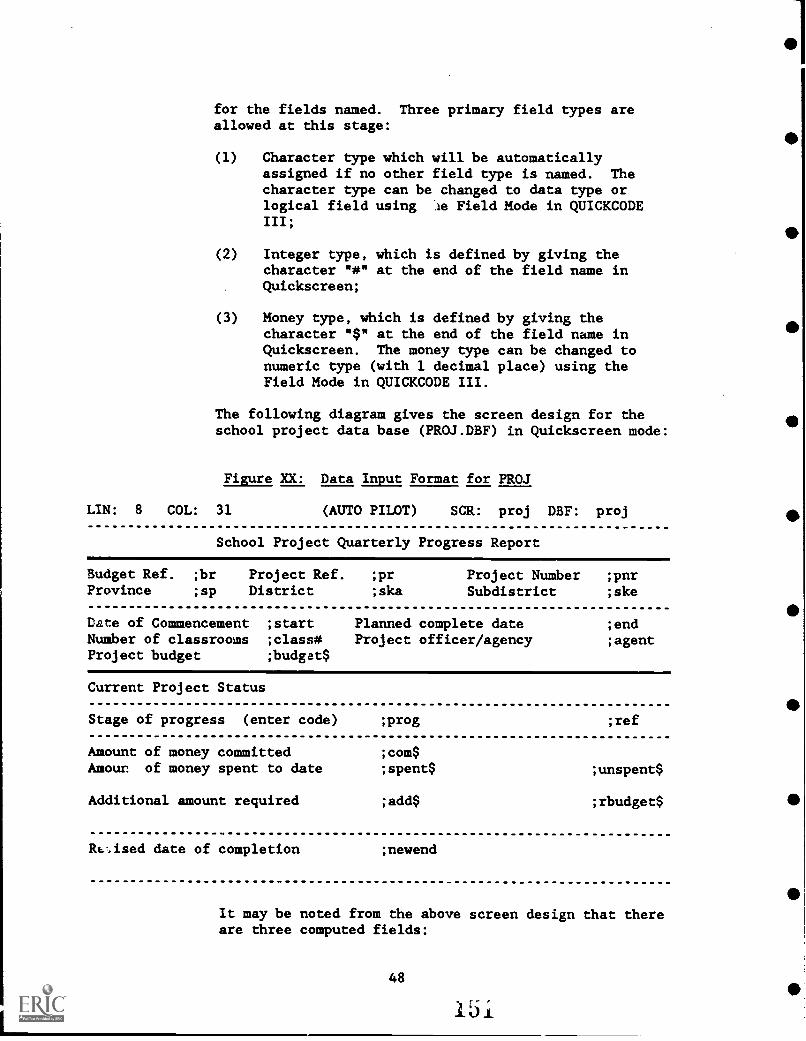
for the fields named. Three primary field types areallowed at this stage:
(1) Character type which will be automaticallyassigned if no other field type is named. Thecharacter type can be changed to data type orlogical field using le Field Mode in QUICKCODEIII;
(2) Integer type, which is defined by giving thecharacter "#" at the end of the field name inQuickscreen;
(3) Money type, which is defined by giving thecharacter "$" at the end of the field name inQuickscreen. The money type can be changed tonumeric type (with 1 decimal place) using theField Mode in QUICKCODE III.
The following diagram gives the screen design for theschool project data base (PROJ.DBF) in Quickscreen mode:
Figure XX: Data Input Format for PROJ
LIN: 8 COL: 31 (AUTO PILOT) SCR: proj DBF: proj
School Project Quarterly Progress Report
Budget Ref. ;br Project Ref. ;pr Project Number ;pnrProvince ;sp District ;ska Subdistrict ;ske
Date of Commencement ;start Planned complete date ;endNumber of classrooms ;class# Project officer/agency ;agentProject budget ;budgat$
Current Project Status
Stage of progress (enter code) ;prog ;ref
Amount of money committed ;com$Amour of money spent to date ;spent$ ;unspent$
Additional amount required ;add$ ;rbudget$
Rsed date of completion ;newend
It may be noted from the above screen design that thereare three computed fields:
48
51'

REF which will be used as the unique identifier for theproject concerned and is formed by concatenating thefields on budget reference BR, project reference PR,project number PNR, province SP, district SKA, andsubdistrict SKE;
UNSPENT which gives the amount of budget not yet spentand is derived from the difference between the amountbudgeted BUDGET and the amount already spent SPENT;
RBUDGET which is the revised budget for the project ifthere is any additional financial information required.This is derived from adding the amount budgeted BUDGETto the additional financial provision required ADD.
(b) The characteristics for the various fields defined abovein Quickscreen will have to be determined in the FieldMode. The computation required for the computed field
# FIELDNAME
will also have to be set in the Field Mode.are shown below:
Figure XXI: Field Mode for PROJ
The results
VAL ERT LEN F DEFAULT MIN. MAX. ERROR MESSAGE0 MQ_MODE C 7 *NONE* *NONE* *NONE* *NONE* * 3
1 br C 2 F *NONE* *NONE* *NONE* *NONE* * 0
2 pr C 2 F *NONE* *NONE* *NONE* *NONE* * 03 pnr C 3 F *NONE* *NONE* *NONE* *NONE* * 04 sp C 2 F *NONE* *NONE* *NONE* *NONE* * 05 ska C 2 F *NONE* *NONE* *NONE* *NONE* * 06 ske C 2 F *NONE* *NONE* *NONE* *NONE* * 07 start D 8 F *NONE* *NONE* *NONE* *NONE* * 08 end D 8 F *NONE* *NONE* *NONE* *NONE* * 09 class I 2 F *NONE* *NONE* *NONE* *NONE* * 010 agent C 11 F *NONE* *NONE* *NONE* *NONE* * 011 budget $ 10 F *NONE* *NOME* *NONE* *NONE* * 012 prog C 2 F *NONE* *NONE* *NONE* *NONE* * 013 ref C 13 F *NONE* *NONE* *NONE* *NONE* * 0
14 com $ 10 F *NONE* *NONE* *NONE* *NONE* * 015 spent $ 10 F *NONE* *NONE* *NONE* *NONE* * 016 unspent $ 10 F *NONE* *NONE* *NONE* *NONE* * 017 add $ 10 F *NONE* *NONE* *NONE* *NONE* * 018 rbudget $ 10 F *NONE* *NONE* *NONE* *NONE* * 019 newend D 8 F *NONE* *NONE* *NONE* *NONE* * 0
It may be noted that the field type for the fieldsSTART, END and NEWEND have been changed from characterto data type. The next step is then to define thecomputed fields and to tell the system.which fields will
49

be shown or not given in the data input screen. Theresults are given in the diagram below:
Figure XXII: Field Mode for Computed Fields
# FIELDNAME T LEN F SHOW COMPUTATION ER0 MQ_MODE C 7 YES *NONE* 3
1 br C 2 F YES *NONE* 0
2 pr C 2 F YES *NONE* 0
3 pnr C 3 F YES *NONE* 04 sp C 2 F YES *NONE* 0
5 ska C 2 F YES *NONE* 0
6 ske C 2 F YES *NONE* 07 start D 8 F YES *NONE* 08 end D 8 F YES *NONE* 0
9 class I 2 F YES *NONE* 010 agent C 11 F YES *NONE* 0
11 budget $ 10 F YES *NONE* 012 prog C 2 F YES *NONE* 013 ref C 13 F NO br+pr+pnr+sp+ska+ske 0
14 cola $ 10 F YES *NONE* 015 spent $ 1C F YES *NONE* 016 unspent $ 10 F NO budget-spe.,t 0
17 add $ 10 F YES *NONE* 018 rbudget $ 10 F NO budget+add 019 newend D 8 F YES *NONE* 0
(c) Finally, after all the data fields have been defined inthe FiAldMode, one can go back to the QUICKCODE IIImain menu by pressing CONTRL B to revert back to theQuickscreen and then (F1] to go back to the main menu.By pressing ESC, all the required programs may begenerated by the QUICKCODE III system. A total of 11programs have been generated and are stored in theDiskette "EPP Mod.v.4." To run these programs, one hasto start up DBASE III from either Drive B or Drive C,and put the Diskette in Drive A. After starting upDBASE III,
*SET DEFAULT TO A*DO PROJ
and an opening menu will appear, from which a number offunctions such as adding records to the data base,editing records, etc., may be selected.
50
6. Learning Activities
6.1 What has been covered in the User Manual Section are the maintechniques used in extracting and manipulation of data stored in asingle or multiple data base(s). It is essential therefore thatthe participants devote ample time to practicing these techniques,using other combinations of commands and conditions not yetdemonstrated in the User Manual Section. Most of these techniquesshould be adequate for users in performing ad hoc inquiries on thedata bases. For those who want to pursue further DBASE IIIprogramming techniques, and those who have the need for a moreefficient system of querying the data bases, they may attempt tocombine the sequence of commands used at the dot prompt level intosimple batch-type programmes. This will lead to a more efficientand automatic data processing system, so that more time-consumingprocedures could be run unattended, and the applications could behandled by less knowledgeable users.
6.2 The learners are advised to spend more time in going throughthe User Manual together with the instructors. The methods ofcalculations are bound to be different from what are currentlypractised by the learners: Therefore, there should be ampleopportunities for the learners to suggest alternative methodsfor calculating teacher entitlements in schools or for estimatingthe amount of subsidy required by schools. These alternativesshould be studied and the learners should, following the proceduresdemonstrated in the User Manual Section, attempt to design theDBASE III command procedure: to cater for the different methods ofcalculations.
III. Unit 2
Monitoring Performance of Education System
7. Performance Objectives
7.1 A variety of statistical information could be compiled fromthe education management information system outlined in Module IIfor the purposes of managing the education sector as a whole. Theyare quite similar to those discussed in Unit I above, except thatthe unit of analysis is the education system as a whole, ratherthan individual schools or other educational institutions, orindividual programmes. It is not proposed to cover the entirespectrum of management statistics, which could embrace informationon finances, information on teachers and other personnel,information on institutions including schools, research agencies,examination authorities, etc., and information on pupils. The .
51

focus of this unit is on the construction and use of educationalindicators for monitoring the performance of the education system.
7.2 On completion of this unit, the participants should be ableto:
(a) Design indicators to monitor the performance of the educationsystem;
(b) Make use of the education management information system andthe data base software package DBASE III in constructing theindicators for the country as a whole, or a given province ordistrict, or for a given type of school.
8. Instructional Activities
8.1 Uses and Limitations of Indicators
8.1.1 The main concern of planners and administrators are,at the risk of oversimplification, is to find out thefollowing:
(a) Whether educational programmes are implemented accordingto plan, with the expected effectiveness;
(b) The problems encountered;
(c) The causes of the problems;
(d) The alternatives available to solve the problems and themethods and criteria that can be adopted to assess theeffectiveness, costs and other implications of thesealternatives, and to choose from among the alternativesavailable the best one for implementation.
The purpose of management statistics is to provide thenecessary information which could throw light on the above.Indicators are one kind of management information which couldprovide planners, administrators and policymakers quicklywith up-to-date summary information on the above. Based onthe information, users can quickly appraise the situation,take correct measures accordingly or commission a moredetailed study or research on the matter. For indicatorswhich are compiled on a consistent basis over time, they canprovide extremely useful indication of any changes over time,which could be difficult to identify from the massive amountof statistics available. These statistics are usuallycollected and analyzed in a disaggregated and sometimesdecentralized manner. One example of the aggregated natureof indicators is public expenditure on education as apercentage of the gross national (or domestic) product which
52
1.5o

gives a summary indication of the resources devoted toeducation. There are studies which make use of indicatorsfor exploratory research on causal effect of education oneconomic development. A classic example is the Harbison andMyers study on the correlation between human resources andeconomic growth.
8.1.2 Indicators cannot possibly be used to summarize allmanagement statistics which are available. One would nothave a very thorough understanding of the phenomenon which agiven education indicator purports to highlight without goinginto details of the statistics available. An example is theilliteracy rate. The rata gives a summary information on thesize of the problem of illiteracy. But unless detailedstatistics are available on the geographical distribution ofilliterate populations, their age and sex distribution, etc.,it is difficult to design and mount any programme to combatilliteracy, nor to assess the effectiveness of a givennonformal education programme. Therefore, indicators cannotreplace the bulk of statistics that should be collated andpresented to users as well.
8.2 Criteria in Monitoring Performance
8.2.1 Before one can proceed to construct a set ofeducational indicators to monitor the performance of theeducation system, the question that would naturally rise ison what basis should performance be monitored. This is amore difficult question to answer than the problem ofconstructing a set valid and appropriate educationalindicator. Education has been conceived by many as the keyfactor contributing to economic growth, in maintainingnational unity, in preserving the culture of a society, inredressing social injustice, and even combating crime, etc.For different people like the students, the parents, thegovernment, and voluntary agencies like the religious bodies,they have different motives in providing education or forbecoming educated. It is thus extremely difficult to laydown a set of criteria agreeable to all for assessing theperformance of an education system.
8.2.2 It is not proposed to indulge in this sort ofargument in this Module, as it is clearly not the purpose.What appears to be less controversial norms for planningeducation and monitoring its performance are two rathersimple concepts:
(a) Equity;(b) Efficiency.
However simple these concepts are, there are nonetheless adozen different interpretations of what equity means in
53

practice. The argument on whether it is equity in terms oftreatment or in terms of achievement is still an unsettleddebate, although some have already conceded that equitycannot be achieved but approached. Efficiency could belooked at from the point of view of the internal efficiencyof the education system and from the point of view of itsexternal efficiency. The problems here are not so much withthe question of interpretation, but rather are related to thedifficulties in measuring efficiency.
8.2.3 Notwithstanding these conceptual problems, plannersand administrators have to rely on indicators of some sort tohelp them perform their duties. Most of the indicatorscommonly in use evolve around the concepts of equity andefficiency which seems to become the basic principles inplanning and implementing education policies:
(a) Indicators of equity include such estimates as theproportion of children not attending schools,disaggregated into different regions, ethnic groups orsocioeconomic classes;
(b) Indicators of internal efficiency include the repetitionand dropout rates, the number of pupil-years required toproduce a graduate, etc.;
(c) Indicators of external efficiency include the famousinternal rate of return t3 education, the proportion ofgraduates gainfully employed, etc.
8.3 Techniques in Constructing Indicators
8.3.1 There are three main approaches to the constructionof educational indicators:
(a) The first one is the use of simple indices which iscalculated by:
(1) taking the arithmetic mean or median for therelevant statistics or statistical distribution.One example is the mean pupil/teacher ratio or theaverage class size in all primary schools. If thedistribution is affected by the presence ofextreme values, the median would be used. Anexample is the median income of school leavers:
(2) taking the percentage of "population" possessin,the given characteristics. Examples of this typeof indicator includes percentage of population whoare illiterate, the percentage of school-agepopulation attending schools, etc.;
54
(3) taking the rate of change over time. Thisincludes, for instance, the rate of increase inenrollment.
(b) The second approach is the construction of the so-calledsynthetic indicators. This involves more complicatedprocedures in aggregating a number of subsidiaryindices, suitably weighted. The composite index ofhuman resources development constructed by Harbison andMyers is one example. Another method is to constructthe index based on a set of behavioral assumption. Anexample is the various indicators such as theinput/output ratio compiled from the reconstructedcohort method which would be discussed in Module IV.
(c) The third approach is the estimation of lifeexpectancies. The technique makes use of the life tableapproach to estimate the number of years children wouldspend in full-time education. Like the demographicmeasure of life expectancies, this sort of indicatorprovides useful summary information of the availabilityof education to children at a given point in time.
Not all the approaches discussed above will be covered inthis Module. Examples in respect of (a) above will be cited.For (b), an illustration of the use of the reconstructedcohort method will be given in Module IV.
8.3.2 Finally, users of educational indicators should notbe deceived by the sophistication and complication in thetechniques used to construct indicators. Not. all indicatorsare direct measures of the state of affair of which userswish to examine. Direct measures include most of thequantitative indicators indicators on the percentage ofschool-age population enrolled in schools. Many indicatorswhich purport to measure the quality of education are,however, simply proxy indicators which are only valid if theassumption regarding the high correlation between the proxyindicators and the subject matter is valid. A notableexample is the average class size which is supposedly ameasure of the quality of education. However, numerousstudies have confirmed that the quality of teaching is notnecessarily correlated with a smaller class size. Smallerclass size may permit the use of a more pupil orientedteaching method which is more conducive to the learningprocess. Thus reducing class size per se will notautomatically bring about an improvement in the quality ofeducation.
55

8.4 Types of Indicators
8.4.1 In the User Manual Section to follow, an attempt ismade to construct a number of educational indicators from theeducation management information system set up in Module II.It is stressed that this list is by no means exhaustive.Users should bear in mind the limitations and otherconsiderations which have been discussed in the earlier partof this Unit. From the list of indicators, one coulddistinguish between:
(a) an indicator which measures input into the educationsystem, and
(b) one which measures the output.
For some time, planners and statisticians have tried tomeasure, apart from input and output, the process of theeducation system. This means the construction of indicatorswhich can throw light on what is happening in the classroom.It appears nothing useful has come up so far. As a result,one has to rely on measures of either input or output, ormeasures which coi.pare input with output, to gauge which ishappening to the educational process.
9. User Manual
9.1 Getting Started
9.1.1 This user manual is designed for:
(a) The instructors in demonstrating how to compileeducational indicators from the education managementinformation system, using DBASE III, for a givenprovince, district, or subdistrict;
(b) The learners in practising the procedures suggested forthe construction of such indicators.
9.1.2 The participants should have by now gone through mostof the command level functions in DBASE III for informationprocess and retrieval. Most of the techniques applicable tothe retrieval of information classified at the school levelwill also apply to the retrieval of information at theprovince, district, or subdistrict level. The additionalfeature in DBASE III which will be discussed is the use ofthe MODIFY REPORT command and the SUMMARY command, thelatter of which has already been discussed in Module II.
56
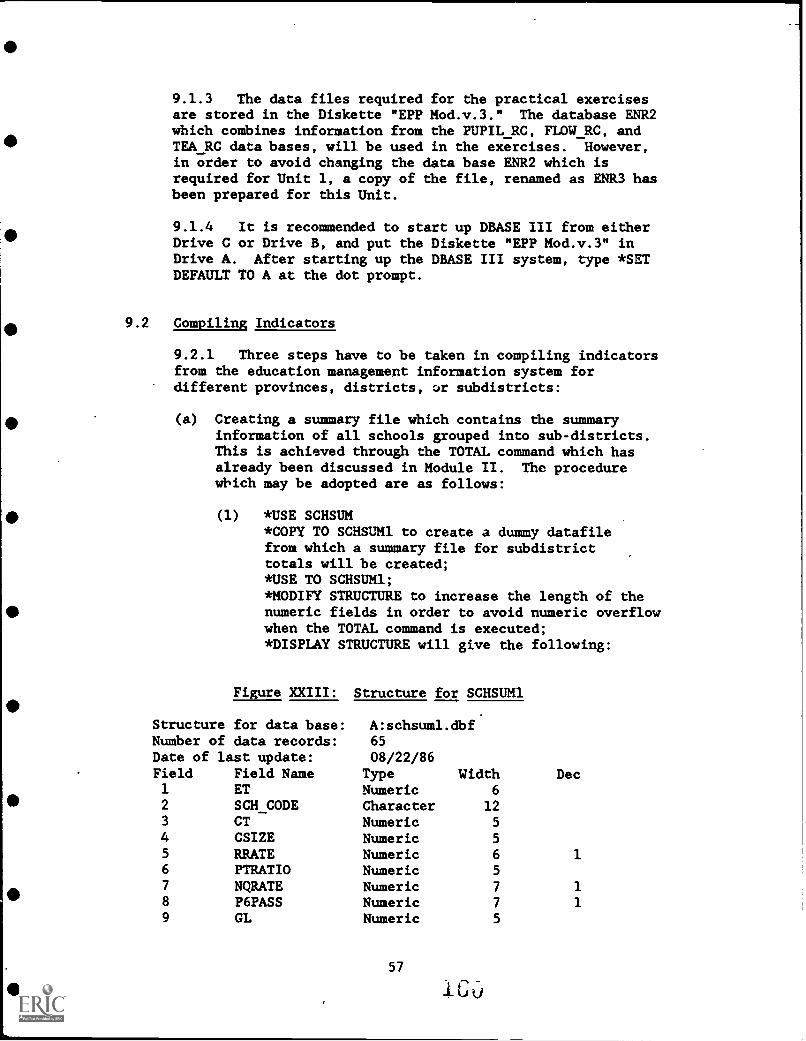
9.1.3 The data files required for the practical exercisesare stored in the Diskette "EPP Mod.v.3." The database ENR2which combines information from the PUPIL RC, FLOW RC, andTEA RC data bases, will be used in the exercises. However,in order to avoid changing the data base ENR2 which isrequired for Unit 1, a copy of the file, renamed as ENR3 hasbeen prepared for this Unit.
9.1.4 It is recommended to start up DBASE III from eitherDrive C or Drive B, and put the Diskette "EPP Mod.v.3" inDrive A. After starting up the DBASE III system, type *SETDEFAULT TO A at the dot prompt.
9.2 Compiling Indicators
9.2.1 Three steps have to be taken in compiling indicatorsfrom the education management information system fordifferent provinces, districts, 3r subdistricts:
(a) Creating a summary file which contains the summaryinformation of all schools grouped into sub-districts.This is achieved through the TOTAL command which hasalready been discussed in Module II. The procedurewhich may be adopted are as follows:
(1) *USE SCHSUM*COPY TO SCHSUM1 to create a dummy datafilefrom which a summary file for subdistricttotals will be created;*USE TO SCHSUM1;*MODIFY STRUCTURE to increase the length of thenumeric fields in order to avoid numeric overflowwhen the TOTAL command is executed;*DISPLAY STRUCTURE will give the following:
Structure
Figure XXIII: Structure for SCHSUM1
for data base: A:schsuml.dbfNumber of data records: 65Date of last update: 08/22/86Field Field Name Type Width Dec1 ET Numeric 6
2 SCH_CODE Character 123 CT Numeric 5
4 CSIZE Numeric 5
5 RRATE Numeric 6 1
6 PTRATIO Numeric 5
7 NQRATE Numeric 7 18 P6PASS Numeric 7 1
9 GL Numeric 5
57

10 GT Numeric 5
11 GP Numeric 5
12 RTT Numeric 5
13 YR Character 414 SS Character 1
15 SKE Character 2
16 SE Character 3
17 SESS Character 1
18 NQT Numeric 5
19 GTT Numeric 5
** Total ** 95
It may be noted that some of the redundant fields have beendeleted from the data base.
(2) The next is to create the summary file fromSCHSUM1.*INDEX ON SKE TO SSUMSKE to index the data fileSCHSUM to the field which will be used to groupschools with the same field value to form a singlerecord in the summary file.
*TOTAL ON SKE TO SSUM*USE SSUM*REPLACE ALL CSIZE WITH ET/CT to compute theaverage class size for each subdistrict;
*REPLACE ALL RRATE WITH RTT/ET*100 to calculatethe rate of repetition;
*REPLACE ALL PTRATIO WITH ET/GTT to give thepupil/teacher ratio;
*REPLACE ALL NQRATE WITH NQT/GTT*100 to give thepercentage of teachers not qualified;
*REPLACE ALL P6PASS WITH GP/GL*100 FOR GL>0 tocompute the percentage of P.6 leavers passing thefinal examination.
(3) Finally, one can retrieve information from thesummary file, using dot prompt commands likeBROWSE, DISPLAY. Alternatively, one can design areport format to present data. The followingshows the latter approach by modifying the reportfile ENR3 which has been created by copying fromthe file ENR2 created in the previous Unit.
*MODIFY REPORT ENR3, and after following theinstructions given on screen, one may arrive at amodified report format as per Figure XXIV below:
58

Options Groups
Figure XXIV: Screen Design for ENR3
Columns Locate Exit 09:50:40 am
ContentsHeadingWidthDecimal placeTotal this column
PTRATIOPupil/;Teacher;Ratio7
0
No
Report Format
Subdistrict TotalCode Enrol.
Ave. Repet.Class RateSize
Pupil/ % of TeachersTeacher notRatio qualified
% of P.6Ipupils I
passing I
XX ###### ###.# ####.# ##### #####.# #####.# I
MODIFY REPORT I<A:>ENR3.FRM !Column: 5Position selection bar -. Select - -+. Prev/Next column -
PgUp/PgDn.Enter a field or expression to display in the indicated report column.
To display the report using the report formatENR3, the following command may be used:
*REPORT FORM ENR3, and the following will show upon the screen:
Figure XXV: Report of SSUM aing ENR3 Format
Page No. 1
08/22/86
Sub- Totaldistrict Enrol.Code
Selected Educational Indicators
Average RepetitionClass RateSize
** School Status Code 1
Pupil/TeacherRatio
% ofTeachersNotQualified
% ofP.6pupilspassing
01 4578 32.0 23.4 25 48.1 88.802 3126 26.0 16.9 29 0.0 88.103 2518 29.0 16.9 19 0.0 79.704 1563 26.0 19.3 24 0.0 74.1
59

Following similar procedures, different reportsmay be generated, using DBASE III, from theeducation management information system.
10. Learning Activities
10.1 Microcomputer Tutorial Session. This Unit is rather shortbecause more of the DBASE III commands have already been introducedin Unit 1 or in Module II. The participants are only required topractice modifying the previously designed report format to compilethe various summary indicators for different districts. Thelearners would appreciate that to master the techniques ofretrieving information from the data base should not be toodifficult, although DBASE III language is not at all easy to learn.What is proposed for the practical session in this Unit is for thelearners to go through the various steps demonstrated in this Unit.
11. Post-assessment
11.1 The learners are required to experiment compiling thefollowing indicators from the original PUPIL RC, FLOW_RC andTEA RC, using the JOIN, REPLACE, TOTAL commands:
(a) The proportion of female teachers;
(b) The proportion of female pupils;
(c) Tht:.. proportion of pupils who are overaged (i.e., over vhe ageof 13 years);
(d) The teacher/class ratio;
(e) The average number of pupils per school.
60

EDUCATIONAL POLICY AND
PLANNING PROJECT
Pusat Informatika
l3alitbang Dikbud
DEPARTIviEN PENDIDIKAN
DAN ICEBUDAYAAN
A GOVERMENT OF INDONTSA- USAID PROJECT
INDONESIAMicrocomputer Applicationsfor Education Planning andManagement: A ModularTraining Program
MODULE IVUse of the Management
Information System for
Education Planning
Center for Informatics
Office of Educational and Cultural Research and Development
MINISTRY OF EDUCATION
AND CULTURE
Jakarta, Indonesia

Pusat Infonnatilca
Balitbang Dikbud
EDUCATIONAL POLICY AND
PLANNING PROJECT
DEPARTIEN PENDIDIKAN
DAN KEBUDAYAAN
A GOVERNMENT OF INDONESIA USAF PROJECT
INDONESIAMicrocomputer Applicationsfor Education Planning andManagement: A ModularTraining Program
MODULE IVUse of the Management
Information System for
Education Planning
Center for Informatics
Office of Educational and Cultural Researth and Development
MINISTRY OF EDUCATION
AND CULTURE
Jakarta, Indonesia
16j

PREFACE
The Educational Policy and Planning (EPP) Project is a seven year project conductedjointly by the Indonesia Ministry of Education (MOEC) and the United States Agencyfor International Development (USAID). The overall project objective is to improve thequality of education in Indonesia by assisting the MOEC, through the Office ofEducational and Cultural Research and Development (Balitbang Dikbud) to formulatebetter policies and long-term plans. The project aims to improve policy formulation andlong-term planning by improving the timeliness, relevance and accuracy of educationaldata collection, the subsequent analyses of such data, and theirultimate use forpolicy anddecisionmakh:g.
There are three major components of the EPP Project: (1) development of anintegrated management informations system (MIS) within the MOEC, (2) enhancementof MOEC policy research and analysis capacity, and (3) support for MOEC institutionaldevelopment at the national and provincial level through training and technical assis-tance. EPP technical advisory staff work closely with counterpart Indonesian staff as part
- of a collaborative process of developing institutional capacity.
Dr. BoedionoHead, Center for Informatics
Office of Educational and Cultural Research and DevelopmentDepartment of Education and Culture
Republic of Indonesia
The EPP Project in collaboration with the USAID Improving the Efficiency ofEducational Systems (TEES) Project, publishes EPP documents in order to disseminatethis knowledge and extend its usefulness. EPP has carried out a series of policy studiesdesigned to provide answers to key questions facing Indonesian educators. Theseinclude:
The Quality of Basic EducationThe Quality and Efficiency of Vocationalfrecimical EducationThe Strengthening of Local Education CapacityDeveloping Indicators of Educational EfficiencyTeacher Education IssuesCurriculum Reform and Textbook ProductionEducation, Economic, and Social Development
This series has been planned under the direction of Moegiadi, Balitbang Dikbud, andBoediono, Center for Informatics, Balitbang Dikbud and Simon Ju, EPP Chief of Party.
Editors for the series are Abas Gozali, Reta Hendrad Dewi, Center for Informatics,and Jerry Messec, TEES, Florida State University.
INTRODUCTION TO EPP TRAINING MODULES ON THEDEVELOPMENT & USE OF MIS ON MICROCOMPUTERS
1.0 Puwessa
1.1 These training modules on the development and use of the education management informationsystem are primarily designed for planners and administrators at the provincial level, who are responsiblefor collecting, processing and analyzing statistics for educational planning and management. The mainfeature of the modules is the use of microcomputers to enhance the speed, flexibility, and versatility inthe use of information.
12 The purposes of the modules are as follows:
To introduce to the participants the basic framework of an integrated education managementinformation system which could be used to serve the varied needs of different users;
To demonstrate how such a system could be set up, making use of microcomputers, and howdata could be retrieved for analytical purposes;
To show how an interactive models) for diagnostic, forecasting, planning and budgetingpluposes could be developed on microcomputers; and
To show, as well, how the computer system and the models could easily be modified to copewith unforeseen changes in requirements, with the help of user-friendly software packagesabundantly available on the market.
2.0 The Hierarchies of Information
2.1 When viewed in terms of the point at which information is collated and used, there are threemain levels of information:
The school level, at which detailed information about individual pupils, teachers and staff(mcluding their name, age, sex, grade, home address, academic performance, qualification,salaries, etc.), as well as information about the schools (e.g., area, number of rooms, equipment,etc.) have to be kept for the smooth running of the schools concerned;
The district level, where not all the data kept by schools are required. Only summary statisticssuch as the number of pupils by age, sex and grade, and the amount of recurrent expenditures arerequired for individual schools; and
The national level, where, depending on the extent of decentralization, detailed information onindividual schools may not be required. Only summary information is collected at thesubdistrict or district level.
2.2 Alternatively, depending on the usage, information could be distinguished between that for:
planning,management control, andoperation.
2.3 Ideally, information at the school, district, and national level should be integrated and shared inone, or one network, of data base(s). For instance, information stored in schools could be computerized,and only the relevant data would be extracted and passed to the computer system kept at the district level;
V

and the similar procedure could apply to the flow of information between the district and national level.This could help avoid a lot of duplication of work, and solve the problems of quality of data and the timelag in producing the information. With the use of individualized data bases, more accurate informationcould be made available about pupil and teacher flow, which is extremely useful in planning schoollocation, and teacher demand and supply. The individualized data base could also reduce considerably thedata problems confronting educational researchers, especially those engaged in longitudinal studies.
2.4 Similarly, the same can be said of information for planning, managemeet control andoperation. For instance, a simple ledger accounting system, if carefully designed and tomputerizul,could provide a wealth of information useful in monitoring spending, analyzing cost structure andefficiency, as well as for forecasting and planning educational expenditures.
2.5 For the purpose of the present training modules, it is not proposed to cover the entirespectrum of the information system as discussed above, which would be clearly beyond the scope of thistraining program. Attention will mainly be focused on the following:
The flow of information from schools to the provincial and central offices via the usual channelof school surveys conducted by the Balitbang; and
The use of such information for planning and administrative purposes at the central as well asprovincial level.
Once the participants have mastered the basic principles and techniques discussed in this trainingprogram, they should have relatively little difficulties to Applying them to different informationenvironments in their daily work.
3.0 Orsanizatictuithedaduka
3.1 There will be four modules in this training program, which are as follows:
Module I: Overview of basic concepts and computer applications in educational planning,management, and research;
Module II: The development of the Education Management Information System;
Module III: The. use of the Education Management Information System for managementcontrol; and
Module N: The use of the Education Management Information System for planning.
4.0 TballnwsumaLlastaxlianalgarnmihros-*
4.1 Much of the emphasis placed in this training program is the use of microcomputers andsoftware packages. Althougt data base and spreadsheet programs for data files creation and manipulationand modeling have already been designed for the participants, they inevitably have to understand andpractice the techniques in the use of microcomputers and software packages. With the availability ofmany user-friendly software packages and utility programs, computer programming could be kept to aminimum. It is also the aim of this training module to show to the participants that understanding thebasic principles and operating system of the various software packages would be sufficient to enablethem make full use of the information available to them for planning, management and research. Forthose participants who have a keen interest in computer programming and in mastering the softwarepackage, this training module will prepare them for further improving their computer skills bypracticing the techniques demonstrated in this program.
vi
i6o

4.2 It is recognized that the design of a management information system should be largely useroriented. It should tart by looking at the potential uses of information rather than for the collection ofinformation per se. However, it would be deceptive to assume that all potential uses of informationcould be foreseen at the time a management information system is constructed. Furthermore, therequitemags and practices in educational planning and management in Indonesia vary considerably fromprovince to province. Thus, it is almost impracticable to include the specific requirements of each andevery province in designing the training modules.
4.3 Naturally, participants to the training program would come from different divisions of theprovincial education offices. Some of them may mainly be concerned with say planning and budgeting,while others in the supervision of schools or other management functions. Some may be involved onlyin data collection. Consequently, not all pans of the training program would be of equal interest to theparticipants.
4.4 Taking into account the above considerations, the approach adopted in the design of thetraining materials is as follows:
APPLICABILITY is emphasized in the training program. Wherever possible, practical sessionson microcomputer applications are included in the modules an that the participants can have"hands-one experience in the course. They will also be invited to try to include some of theirdaily planning, management and research tasks into the practical sessions, making use of someof the techniques and methods discussed in the training program;
FLEXIBILITY will be introduced in the design of the training materials so that alternate designsand applications of the management information system will be tested during the practicalsessions, making full use of the versatility and flexibility of a computerized data base and thecomputer software packager; and
a MODULAR approach will be adopted in the course so that each module is as self-contained aspossible.
4.5 The structure of the instructional and learning activities for each of the four modules will thusbe anungedas follows:
Overall Objectives of each of the modules will first be stated so that instructors are aware of thewhile purpose of the module as well as the knowledge which is expected to be imparted duringthe instructional and learning processes;
Module Performance Objectives will also be stated to enable the instructors to assess the extentto which the behavior of learners would be changed upon completion of the module. Morespecific performance objectives will also be given for different instructional units within amodule:
The actual instructional and learning processes are divided into four phases as follows:
Instructional activities where the instructors will present to the learners the teachingmaterials for the module and unit concerned. The teaching materials will cover the basicconceptual issues related to the topic in question, and fundamentals of computer applicationsthat will be demonstrated, highlighting strengths and weaknesses of such applications;
User manual where the instructors will carry on with the presentation, but usingmicrocomputers to demonstrate the various applications in planning, management, andresearch. The detailed step-by-step procedures required to be followed in developing andusing the different computer applications will be described in this user manual section.Therefore, this section is designed for both the instructors and the learners;
vii

Lcataingmayiks where the interaction between the instructors and learners will take place.The learners will be asked to:
practice the techniques in developing and using the data bases or models demonstratedby the instructors;
then the participants will be divided into groups to discuss the concepts, approaches andmethods used in the training materials. During the group discussion, they will beasked to suggest alternative approaches to the development and use of the managementinformation system;
based on the alternative designs suggested, the learners will, under the guidance of theinstructors, actually develop a new management information system and differentmodels of computer applications;
Post- assessment where the instructors will attempt to evaluate the extent to which thelearners have been able to have a firm grasp of the contents of the training materials. Anumber of questions and assessments have been proposed in the unit, and individual learnerswill be asked to do the assignments themselves.
5.0 ChOiCeACQIDDIUALSQUiartradailrd
5.1 With the rapid development in computer technology, it is difficult to choose softwarepackages which are both the most up- to-date and are familiar to both instructors and 'tamers. Therefore,the factors used in choosing a computer software are the power of the software, the ease of use and itsPoPubuitY.
52 Two types of computing functions are required for these training modules:
data base management; andspreadsheet applications.
A number of software packages have been very successful in integrating data base manageMent withspreadsheet applications, and some statistical functions. However, these packages have limitationswhich dictate against using them in the training program. Nearly all of these packages are memory (orRAM) based, thus severely limiting the size of the data base that could be handled by the package. Theavailability of RAM banks or boards can increase the memory capacity of a 16-bit computer like an IBMPC/XT or its compatible to something like 8 mega-bytes. However, these are not yet very popularlyused. Furthermore, most of these integrated softwares are not designed to handle relational data bases, afeature which is required in developing the management information system proposed in this trainingprogram. As a result, two separate software packages have been used in this training program, with eachperforming one of the two functions mentioned above.
5.3 A large number of data base and spreadsheet packages are available. The choice of one SPA ofpackages does not imply that the others available in the market are not suitable. The followingpackages are chosen for reasons given below:
DBASE III (version 1.1 or 2) has been chosen for data base management. There are other database packages which are as powerful as DBASE III, like RBASE 5000 and KNOWLEDGE 2.DBASE III is chosen mainly because it is more user-friendly with its assistant facilities. Otherequally if not more powerful softwares like REVELATION and INFORMIX could be adopted inthe training program. But it appears DBASE III is more popularly used in IBM PCs or thecompatibles. In any case, the adoption of DBASE III in this training program does not precludethe participants from adapting the methodology and approach used in the training program toother data base management software, including newcomers like PARADOX (version 1.1); and
viii
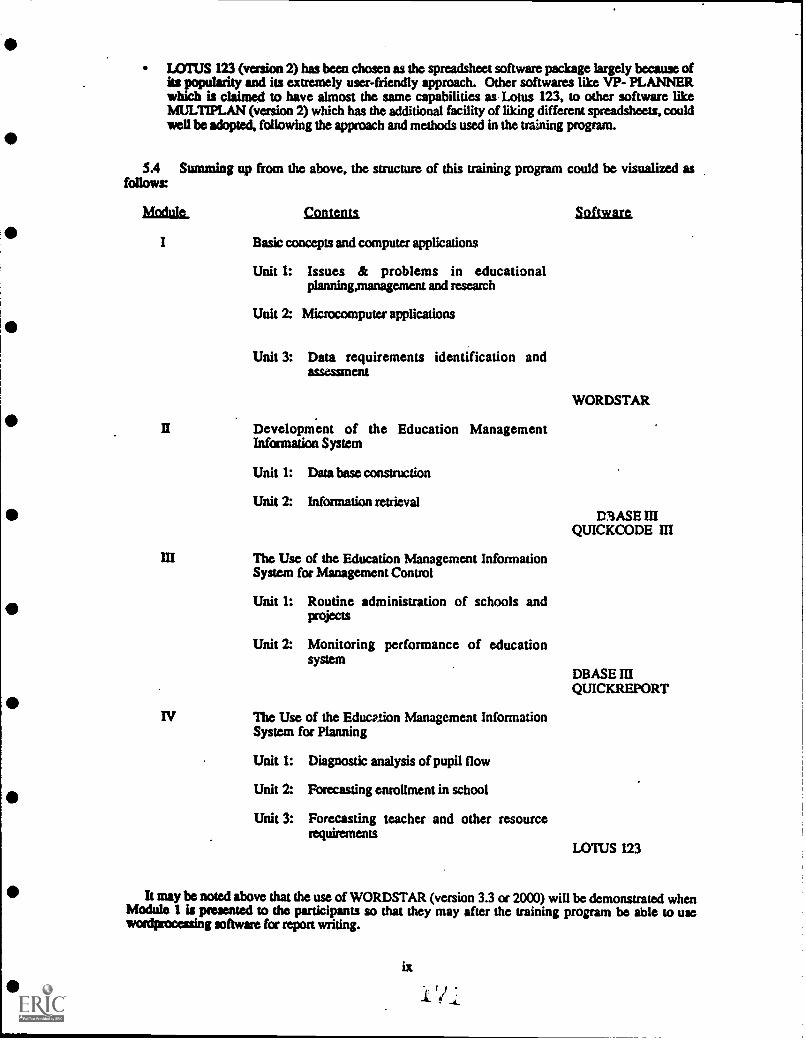
LOTUS 123 (version 2) has been chosen as the spreadsheet software package largely because ofits popularity and its extremely user-friendly approach. Other softwares like VP- PLANNERwhich is claimed to have almost the same capabilities as Lotus 123, to other software likeMULTIPLAN (version 2) which has the additional facility of liking different spreadsheets, couldwell be adopted, following the approach and methods used in the training program.
5.4 Summing up from the above, the structure of this training program could be visualized asfollows:
/fistula.
I
Contents
Basic concepts and computer applications
Unit 1: Issues & problems in educationalplanningmanagement and research
Unit 2: Microcomputer applications
Unit 3: Data requirements identification andassessment
II Development of the Education ManagementInformation System
Unit 1: Data base construction
Software
WORDSTAR
Unit 2: Information retrievalD3ASE III
QUICKCODE III
III The Use of the Education Management InformationSystem for Management Control
Unit 1: Routine administration of schools andProjects
Unit 2: Monitoring performance of educationsystem
IV The Use of the Education Management InformationSystem for Planning
Unit 1: Diagnostic analysis of pupil flow
Unit 2: Forecasting enrollment in school
Unit 3: Forecasting teacher and other resourcerequirements
DBASE 111QUICKREPORT
LOTUS 123
It may be noted above that the use of WORDSTAR (version 3.3 or 2000) will be demonstrated whenModule 1 is presented to the participants so that they may after the training program be able to usewordprocessing software for report writing.

Table of Contents
Module IV
L The Use of the Education Management Information System for Planning 11. Purposes 1
2. The Organization of the Module 2
IL Unit 1: Diagnostic Analysis of Student Flow 33. Performance Objectives 34. Instructional Activities 35. User Manual 126. Learning Activities 277. Post-Assessment 27
III. Unit 2: Projection of Enrollment 298. Performance Objectives 299. Insauctional Activities 29
10. User Manual 3811. Learning Activities 4712. Post-Assessment 48
IV. Unit 3: Projection of Teacher and Other Resources RequirementsAn Integrated Approach 48
13. Performance Objectives 4814. Instructional Activities 4915. User Manual 5016. Learning Activities 5617. Post-Assessment 56

Module IV
The Use of the Education Management Information System for Planning
1. Purposes
1.1 Module Performance Objectives. The purpose of this module isto present to the participants the use of a spreadsheet softwarepackage like Lotus in their diagnostic study of pupil flow andin formulating educational plans. On completion of this module, theparticipants should be able to:
(a) Have a firm grasp of the different pupil flow models foranalysing the internal efficiency of the school system, andto compile projections of future enrollment;
(b) Have an understanding of how to relate the student flow modelto other planning assignments such as the projection ofteacher and textbook requirement and demand for schoolfacilities;
(c) Use a microcomputer spreadsheet software program such asLotus 123 to perform the above tasks.
1.2 The emphasis placed in this Module is as follows:
(a) To highlight the potentials of a simple spreadsheet programlike Lotus 123 which planners could exploit to reduceconsiderably the response time needed in answering the so-called "what if" questions often posed by policymakers;
CO To stress the interrelationship between different educationprograms like the program to build more schools in order toincrease the proportion of school-age children enrolled inschools and the teacher training program. These interrelatedprograms could easily be incorporated into an integratedmodel of enrollment forecasts, teacher requirements andprovision of school facilities, using simple spreadsheettechniques.
1.: Although the spreadsheet program Lotus 123 is chosen for thisModule, other programs like VP-Planner and Multiplan can beemployed. Lotus 123 is chosen partly for its popularity and mainlyfor its extremely user-friendly approach adopted. After goingthrough the practical exercises given in this Module, theparticipants should have a working knowledge of the main featuresof this package, except for such facilities as macros which areuseful in data base management. The participants could experimentwith these facilities on their own.
1.

1.4 At the end of this Module, participants will soon realize thatthe life of planners will completely be changed with the use ofmicrocomputers. Instead of having to devote most of their timecalculating pupil flow and other quantitative implications ofdifferent policy options, they find they have to compete with thecomputers in dreaming up new planning alternatives. Otherwise theywill be sitting by their drawing boards with nothing to do, as themicrocomputers can very quickly produce the results with all thefinancial implications calculated for dozens of options devised byplanners. The educational planners can no longer say that becauseof the lack of time, only a few options have been tried out.
2. The Organization of the Module
2.1 This Module is organized into three units as follows:
(a) Unit 1 on the diagnostic study of pupil flow, which providesa means of analysing the internal efficiency of the schoolsystem and prepares the ground for the subsequent projectionof pupil enrollment;
(b) Unit 2 on the projection of school enrollment:
(c) Unit 3 on the related projection of teacher requirement andrequirement for school facilities. The integration of thedifferent projection models will also be demonstrated in thisUnit.
2.2 The Module has to be organized in such a manner which wouldpresent to the participants in a logical sequence the various stepsinvolved in planning. At the same time, it has to demonstrate tothe learners the use of the spreadsheet program Lotus 123, startingfrom the basic techniques to the more advanced ones. Specialarrangement has to be made to synchronize the two requirements inthe practical sessions in Unit 1. In this unit, the internalefficiency model will be presented to the learners. The.learnersare however not required to develop this model themselves untilthey have gone through Unit 3. What is expected from them issimply to understand how the model works.
2 17,-;

II. Unit 1: Diagnostic Analysis of Student Flow
3. Performance Objectives
3.1 On completion of this unit, the participants should have:
(a) An understanding of the different models which could be usedto analyse the movement of students in the school system;
(b) An appreciation of how internal efficiency indicators couldbe compiled from pupil flow models;
(c) A working knowledge of the use of Lotus 123 in buildingsimple spreadsheet depicting the flow of pupils through theschool system.
4. Instructional Activities
4.1 The Tasks of Educational Planners
4.1.1 The work of planners is essentially to designeducation programs to achieve the objectives of education.There are, however, many objectives of education. A methodhas yet to be devised to help planners and policymakers inranking and incorporatin3 all these objectives in educationalplanning and policymaking. It is not proposed to go intodetails the diverse tasks of the educational planners. Forthe purposes of this Module and at the risk of over-simplification, it would be sufficient to view the tasks ofeducational planners as ones evolving around two majorquestions:
(a) How much education for how many?(b) What kind of education and for whom?
4.1.2 To effectively answer these two questions, theplanners have to know, first of all:
(a) How many are being educated,(b) For how long, and(c) Who is promoted to what type of education?
Regular surveys of schools provide information on who arebeing educated and in what types of schools. .This kind ofstock data, however, cannot give the planners an idea of howlong a child ha, been or will be retained in the schoolsystem, and how children are promoted into different gradesor types of schools/educational institutions. The latterkind of information is the so-called flow data which have to
3

be derived from the stock data or obtained from othersources.
4.2 Data on Pupil Flow
4.2.1 The ideal method of collecting data on pupil flow isto actually trace the pupils throughout the years when theyare enrolled in schools. This kind of study, commonly knownas the tracer or longitudinal study, requires detailedrecords be kept and updated on individual pupils as long asthey remain in schools. This could be achieved by having anindividualized data base of all pupils in the school system,and the data base has to be regularly updated. To do this,however, requires the maintenance of a huge data base and anelaborate system of identifying movement of individual pupilsin the school system. The size of the data base could bereduced by including only a sample of pupils in the study. Anumber of sampling techniques can be employed to select arepresentative sample. Yet the task of avoiding dropoutsover time from the panel of pupils included in the sample isas difficult as the job of conducting a complete registrationof all pupils at regular time intervals. Not many countriesin the world succeeded in maintaining a data base covering allor a sample of pupils in the system.
4.2.2 Another approach is to make use of administrativeprocedures like the registration of pupils for publicexaminations, at different points in a pupil's educationcareer, to help build up and maintain a register of allpupils. This system should be able to cover almost allpupils in the school system. This would obviate the need formounting special surveys of pupils to update the register.However, since there are not many public examinations whichare held at different stages of the education ladder fromprimary to tertiary, and in view of the increasingunpopularity of having too many public examinations in manycountries, the prospects of using such an approach to createan updated register of all pupils Is not promising at all.
4.2.3 The most commonly adopted method is to compile flowdata from stock data collected over consecutive points intime. Depending on the availability of statistics, a numberof so-called cohort survival methods have been developed toprovide the flow information required by planners. Thesecohort survival methods will be discussed later on in thisunit.
4.3 Indicators of Internal Efficiency
4.3.1 In performing the planning tasks mentioned inparagraph 4.1 above, the planners need to have some kind ofguideline or criteria which would enable them to choose from
4
176

,
a number of alternatives. For example, what should be theproportion of children who should be provided school placesat thepost-compulsory level of education (i.e., uppersecondary level). Furthermore, planners need to know whatare the problems in the implementation of, for example,universal primary education. Giving every child 6 years ofprimary education is quite different from ensuring allchildren finish Primary 6, if the repetition is notinsignificant. Broadly speaking, there are two maincriteria:
(a) The question of equity;(b) The question of efficiency which could further be
classified into internal and external efficiency.
4.3.2 One of the topics covered in this unit is the questionof internal efficiency, which in short represents howefficient the school system is operating. Indicators ofinternal efficiency include such estimates as the repetitionand dropout rates, which can be derived from the flow data.In addition, there are other indicators like the "input/output ratio" which cannot be directly computed from the flowmodel. They have derived from the "Reconstructed CohortMethod" which will be discussed in this unit, using data onpupil flow.
4.4 Models of Pupil Flow
4.4.1 A model of pupil flow can be conceived by examininghow a pupil would progress in the school system, uponcompletion of a grade. A great variety of flow models havebeen developed, ranging from simple ones which only analysethe enrollment statistics by grade for a number of years, toa sophisticated one which takes into account repetition andnew entrants. The flow model can cover only one cycle ofeducation, say primary, or can be extended to encompass thewhole of the formal education system from primary touniversity education. Flow models for the nonformal sectoris more difficult, if not impossible, to construct. This isbecause for the nonformal education sector, the notion ofeducation ladder does not exist. Therefore, it is not easyto tell how pupils in the nonformal sector "progress" fromone level to another.
4.4.2 Very briefly, a flow model attempts to simulate themanner in which pupils progress through the education system,from the point they start enrolling in school to where they.graduate. From a pupil enrolled in any given grade, at theend of the school year, the pupil will either be promoted toa higher grade, or repeat the same grade or drop out of theschool system. The different routes are depicted below:
5

Figure I: Movement of Pupil Between Grades
Year 1 Year 2
Grade 1 I E(1) I ---> Repeat R(11)
I I
\ promote P(12)
VGrade 2 drop out I E(2)
D(12)
Different flow rates may be computed from the above diagram.For instance, if information is available on the enrollmentin grade 1 in year 1 and the enrollment in grade 2 in year 2,it is possible to estimate the combined effects of dropout,repetition and promotion. If additional information isavailable on repetition (i.e., R(1) above), then it ispossible to estimate both the number of dropouts and thenumber of pupils promoted to grade 2. What i discussedbelow are three different models of pupil flow which aredeveloped to analyse the movement of pupils between grades asdepicted in Figure I above.
4.4.3 Grade Retention Model. This model is developed forcountries which do not yet have a sophisticated system ofeducation statistics. What are available are simplestatistics on the number of pupils enrolled in each gradecollated usually from the routine censuses of schools whichare conducted in every academic year. In other words, onlyE(1) and E(2) in Figure I above are available. What plannershave to do is to estimate the approximate promotion rates orthe retention rates of pupils when they progress from onegrade to the next. If the rate of repetition does not changedrastically over time, this method could provide a roughanalysis of the retention power of the education system. Ifthe rate of repetition does not differ significantly fordifferent grades, the approximate promotion rate can be usedto assess the number of dropouts from the school system.Furthermore, the approximate promotion rates could be used asthe basis for forecasting future enrollment in the schoolsystem. The following diagram shows the working of thismethod:

Figure II. Pupil Flow Using the Grade Retention Model
Year Gr. I Gr. II Gr. III
1 1 1000 1
I
2
3
C.)
80.7%807
622
For any given cohort of pupils, the 1,000 pupils enteringgrade 1 in year 1, the approximate promotion of this group ofpupils is given by dividing the enrollment in grade 2 in year2 (i.e., 807) by the enrollment in grade 1 in year 1 (whichis 1000). The approximate promotion rate between grade 2 andgrade 3 for year 3 can similarly be calculated by dividingthe enrollment in grade 3 in year 3 (i.e., 622) by theenrollment in grade 2 in year 2 (i.e., 807). If statisticsare available on the enrollment by grade for any twoconsecutive years, the approximate promotion rates can becomputed for the various grades. To compute these ratesmanually would take quite some time, especially if the timeseries is long. In the user manual section, the participantswill be introduced to the techniques of Lotus 123 to performthese calculations virtually within seconds.
4.4.4 Grade Transition Model. This model is quite a popularmodel used in analyzing student flow. The model requiresinformation on the number of repeaters by grade. As shown inFigure I above, estimates of actual promotion rates anddropout rates can be computed from statistics on enrollmentand repetition. For enrollment at the compulsory level ofeducation, estimates of the number of dropr,uts are extremelyimportant in assessing the effectiveness of any program toprovide universal basic education for children. Themechanisms of the model are shown in the diagram below:
7

Figure III: Pupil Flow Rains Grade Transition Model
Year
1
2
3
Gr. 1 Gr. II Gr. III
48
1 1000 I
I \__146 \__
807 961 807 1
I \__89
622 32I 622 I
I
74
It may be seen from the above diagram that the number ofdropouts between grade 1 in year 1 and grade 2 in year 2is given by deducting from the enrollment in grade 1 in year 1(i.e., 1000) the number of pupils who repeat grade 1 in year2 (i.e., 146) and the number promoted to grade 2 in year 2(i.e., 807). The dropout rate between grade 1 and grade 2 isthus given by dividing the number of dropouts (i.e., 48) bythe total enrollment in grade 1 in year 1 (i.e., 1000).
4.4.5 It should be noted that the two models presented aboveare highly simplified. The purpose is just to show the basicmechanisms of the models. These models have not taken intoaccount admission to grade 1, graduation at the terminalgrade as well as new entrants. For the use of the models atthe provincial or district level, it would be necessary totake into account new entrants, especially if migrationbetween districts is significant to result to transfers ofpupils between schools in different districts. The detailedworkings of the two models will be demonstrated in the UserManual Section, using Lotus 123. Therefore, it is notproposed to repeat the description of the two models here.
4.5 Indicators of Internal Efficiency
4.5.1 Put in its simplest terms, a measure of the internalefficiency of a school syitem can be obtained by comparingthe inputs of resources into the school system against itsoutputs. While assessing inputs is relatively easy,measuring outputs from the education system encounters notonly the problems of measurement, but also the conceptualdifficulties in defining what are regarded as "outputs." The
8
1. u %.1

crudest measure of outputs is the number of pupilsgraduating. Admittedly, this is not a very satisfactorymeasure. For example, for those pupils who fail to graduate,the resources invested in them should hardly be considered astotally wasted. Hence, the crude measure mentioned aboveshould at least be improved to include estimates of thenumber of pupils dropping out of the school system at variouspoints of their school career. Alternatively, the internalefficiency of a school system can be assessed from itsability to retain pupils in the'school system, before theyreach the terminal grade. Regardless of whether internalefficiency is assessed on the basis of the input/outputcomparison or the ability of the school system to retainpupils, one inevitably has to study the progression of pupilsthrough the school system.
4.5.2 As pointed out above, the ideal approach to studyingstudent flow is the use of an update register of pupils, sothat the life history of pupils can be traced. A lessexpensive system has been proposed by some, using the "cohortcoding system." Under this system, pupils having the sameeducation experience will be given the same code number. Forexample, pupils repeating grade 2 and grade 4 will be given acode like "12234456 ", whereas pupils who do not repeat at allin their 6 years or primary education will be given a code ofnumber of "123456." Those who drop out from schools afterrepeating one year in grade 3 and after completing only grade4 will be assigned the code number of "12334." By analysingthe distribution of pupils with different code numbers, onecan estimate the number of pupils who eventually graduate,and the number of who drops out after spending 2, 3, or 4years in schools. While this system is relatively lessexpensive to maintain, it has to be monitored carefully coensure that pupils are given the correct code numbers.Furthermore, a separate data collection exercise, apart fromthe usual surveys of school enrollment, has to be conductedregularly to collate the necessary statistics. In short, itis not as simple as originally conceived by its creators.
4.5.3 Reconstructed Cohort Method. A simplified approach hasbeen developed to study the internal efficiency of the schoolsystem. This is the reconstructed cohort method which makesuse of the grade transition model presented above. Verybriefly, the method attempts to "reconstruct" the schoolcareer of a hypothetical cohort of pupils, based on givenrates of repetition, promotion and dropout. The followingassumptions have been built into this method:
(a) The rates of repetition, promotion and dropout areassumed to remain constant through the whole schoolcareer of the cohort of pupils;
9
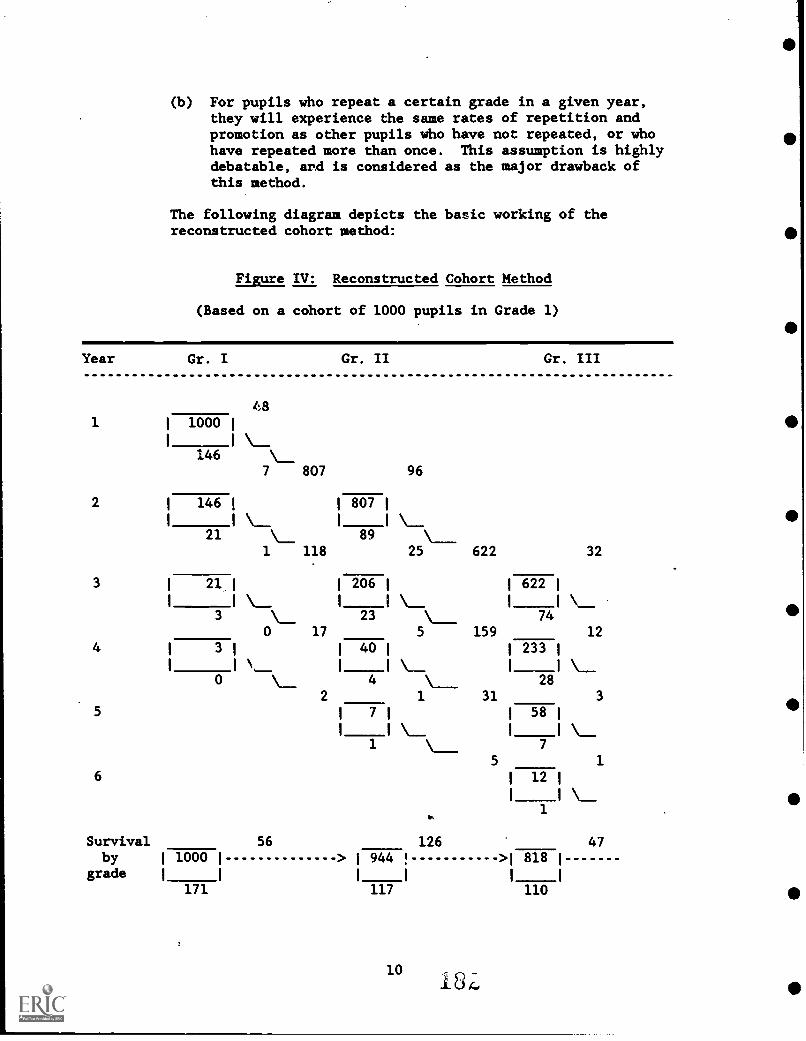
(b) For pupils who repeat a certain grade in a given year,they will experience the same rates of repetition andpromotion as other pupils who have not repeated, or whohave repeated more than once. This assumption is highlydebatable, and is considered as the major drawback ofthis method.
The following diagram depicts the basic working of thereconstructed cohort method:
Figure IV: Reconstructed Cohort Method
(Based on a cohort of 1000 pupils in Grade 1)
Year Gr. I
48
Gr. II Gr. III
1 1000
146 \__7 807 96
2 146 I 1 807
\ I I
21 \ 89 \___1 118 25 622 32
3 21, 1 2061
1 622
\__\
I \__ I I
3 23 \___ 740 17 5 159 12
4 3 1 40 1 1 233
0 \_ 4 \___ 28
2 1 31 3
5 7I 581\_ I
1 \___ 7
5 1
6 12
1
Survival 56 126 47by 1 1000 1 > 1 944 ! >1 818
grade 1I I I I
171 117 110
10

It may be seen from the above flow diagram that pupils areassumed to repeat for a maximum of three times in any onegrade. Thus, for the 146 pupils who repeat grade 1 in year2, some 21 of them will repeat grade 1 again in year 3, andanother 3 will repeat grade 1 again in year 4. All of themwill experience the same probability of repetition, promotionand dropout in grade 2 or higher.
4.5.4 The rates of repetition, dropout and promotionassumed in calculating the flow diagram above are shown inthe following table:
Figure V: Assumed Flow Rates in theReconstructed Cohort Model
Grade 1 2 3
Promotion rate 80.7% 77.0% 83.0%Repetition rate 14.6% 11.0% 11.8%Dropout rate 4.8% 11.9% 5.1%
The participants may wish to use the above rates to gothrough some of the calculations in Figure V above. In theUser Manual Section, the working of the model will bedemonstrated using Lotus 123. The assumed flow rates couldeasily be changed, the figures in the model being calculatedquickly by the program.
4.5.5 A number of useful indicators of internal efficiencycan be compiled from the reconstructed cohort model. Whatis given in the bottom of the diagram in Figure IV is theestimated number of pupils staying in the school system bygrade. For instance, out of the 1000 pupils who start grade1 in year 1, 944 manage to enroll up to grade 2. Of them,818 pupils enroll up to grade 3. For the dropouts, 36pupils drop out after attending only grade 1, another 126drop out after attending school up to grade 2, and a further47 drop out after attending grade 3. More indicators canstill be compiled from the model, including:
(a) The average number of years spent in school before apupil graduates. This is a useful indicator inestimating the average time taken to r..rodure a graduate;
(b) The average number of years spent in srhool before apupil drops out of school. This gives anotherindication of the retention power of the school systei.Given dropout may not represent a complete waste of
11
resources, this indicator at least gives a crude idea ofthe "amount" of education received by those pupils whoare not able to complete their schooling;
(c) A commonly sought for indicator is the so-calledinput/output ratio of the school system, being a proxyindicator of internal efficiency. Input represents theamount of resources, expressed in terms of the number ofpupil-years, invested in the school system, whereasoutput can be represented by the product of the numberof graduates and the number of years they are expectedto remain in schools before graduation. Thus, if aschool system is efficient, an input of 6000 pupil-yearswould be required to produce 1000 graduates given thatthe normal length of the school cycle is 6 years. Ifaverage unit costs of providing a place in the schoolsystem is taken into account, one can compile what isknown as the cycle cost from the model.
5. User Manual
5 1 Getting Started
5.1.1 Throughout the entire module, the spreadsheet programLotus 123 will be used to demonstrate the practical exercise.This program is almost completely menu-driven and isextremely easy to use. Therefore, it is not proposed torepeat what will be shown on the Lotus screen in thisSection. Therefore, the command steps given in this Sectionare relatively brief. Given that the spreadsheets used inthis model have already been developed, the participantsshould have little difficulty following the program.
5.1.2 Lotus 123 is an integrated spreadsheet, graphics anddata base software. It will not be possible to explore thedata base capabilities of Lotus 123. The techniques ofdata base management have been discussed extensively inModules II & III, using a relationship data base managementsystem DBASE III. The graphics capability of Lotus 123 willalso not be discussed in this module. The participants whohave mastered the techniques in building spreadsheet programsto help do their planning should have little difficultyturning their data into graphics.
5.1.3 Lotus 123 can be run on any IBM PC/XT or itscompatibles. The program requires a minimum of 192K ofmemory. All the spreadsheet programs are stored in theDiskette "EPP Mod.v.4." For systems with two floppy diskdrives, the Lotus system can be started up from either DriveA or Drive B, with the data diskette placed in other drive.For systems with a hard disk and a floppy disk, the Lotus
12

system has to be started from Drive C, with the data disketteplaced in Drive A.
5.1.4 It is recommended to make a copy of the Diskette anduse the duplicate in the practical session. All Lotus 123commands shown in this Module are written in this Module arewritten in UPPER CASE and enclosed by [ ].
5.2 The Grade Retention Model
5.2.1 In this subsection, the participants will beintroduced to a simple grade retention model. The model isconstructed using data on primary education. It will beshown how one can estimate flow rates from stock data. Asdiscussed above, the Grade Retention Model is used for aschool system where no information is available on the numberof repeaters by grade. The model is stored in the Lotus fileFLOWl.WK1.
5.2.2 In this subsection, the participants will beintroduced to the basic techniques in creating a simpleworksheet:
(a) moving around worksheet;(b) entering labels and numbers;(c) writing formulae;(d) automatic recalculations of the figures in the
worksheet;(e) saving and retrieving worksheets.
5.2.3 Moving Around Worksheet. To create any worksheet likeFLOW1, users have to be able to move around in the worksheet.Provided there is sufficient memory to hold the worksheet, itcan be as large as 256 columns wide and 2048 rows long.There are a number of ways of doing so:
(a) The use of the cursor control keys, the functions ofwhich are similar to those of many software packageslike Wordstar. The special cursor key [Home] will bringthe cursor back to the cell address [Al]. Pressing[PgDn] will bring the cursor down by 20 rows, whilepressing [PgUp] brings the cursor up by 20 rows;
(b) The use of the function key [F5] to go to a given celladdress;
(c) The use of the [TAB] key to move to the next screen tothe right. Pressing [TAB] key with the [SHIFT] key helddown will move to the next screen to the left.
13
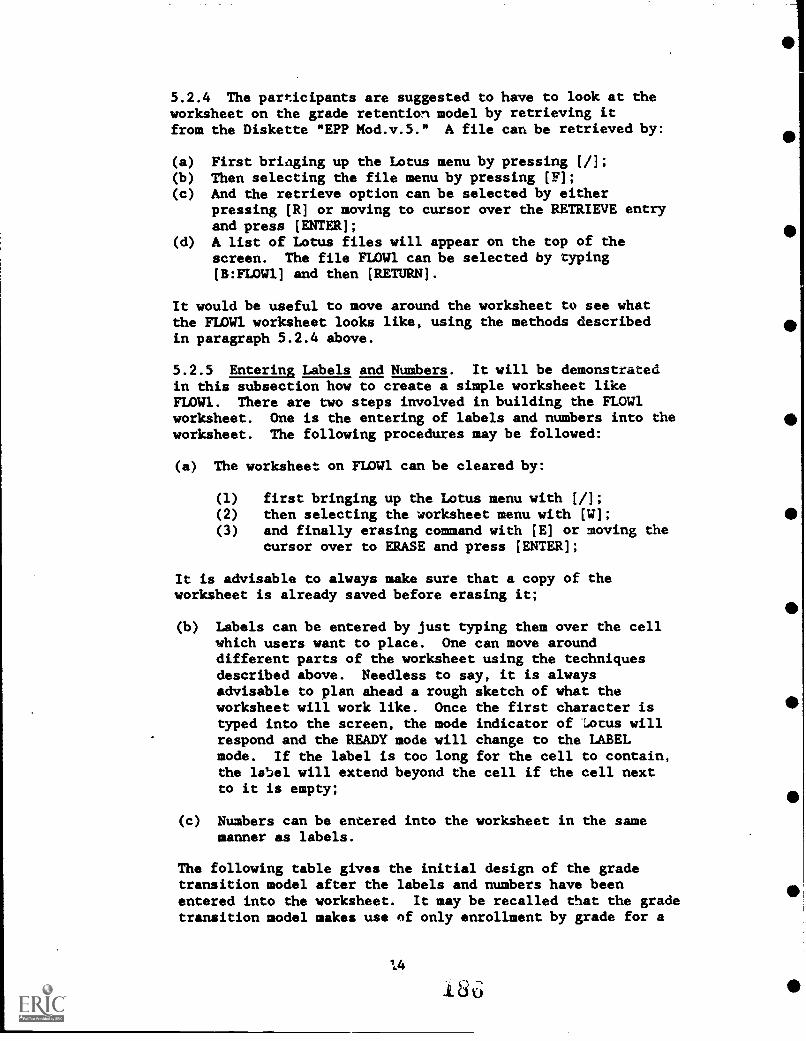
5.2.4 The participants are suggested to have to look at theworksheet on the grade retention model by retrieving itfrom the Diskette "EPP Mod.v.5." A file can be retrieved by:
(a) First bridging up the Lotus menu by pressing [/];(b) Then selecting the file menu by pressing [F];(c) And the retrieve option can be selected by either
pressing [R] or moving to cursor over the RETRIEVE entryand press [ENTER];
(d) A list of Lotus files will appear on the top of thescreen. The file FLOW1 can be selected by typing[B:FLOW1] and then [RETURN].
It would be useful to move around the worksheet to see whatthe FLOW1 worksheet looks like, using the methods describedin paragraph 5.2.4 above.
5.2.5 Entering Labels and Numbers. It will be demonstratedin this subsection how to create a simple worksheet likeFLOW].. There are two steps involved in building the FLOW1worksheet. One is the entering of labels and numbers into theworksheet. The following procedures may be followed:
(a) The worksheet on FLOW1 can be cleared by:
(1) first bringing up the Lotus menu with [/];(2) then selecting the worksheet menu with [W];(3) and finally erasing command with [E] or moving the
cursor over to ERASE and press [ENTER];
It is advisable to always make sure that a copy of theworksheet is already saved before erasing it;
(b) Labels can be entered by just typing them over the cellwhich users want to place. One can move arounddifferent parts of the worksheet using the techniquesdescribed above. Needless to say, it is alwaysadvisable to plan ahead a rough sketch of what theworksheet will work like. Once the first character istyped into the screen, the mode indicator of Locus willrespond and the READY mode will change to the LABELmode. If the label is too long for the cell to contain,the label will extend beyond the cell if the cell nextto it is empty;
(c) Numbers can be entered into the worksheet in the samemanner as labels.
The following table gives the initial design of the gradetransition model after the labels and numbers have beenentered into the worksheet. It may be recalled that the gradetransition model makes use of only enrollment by grade for a
14
186

number of years to estimate the approximate promotion rates.Therefore, the next step in building the FLOW1 worksheet is totell Lotus system how to calculate -he grade retention ratesfrom grade 1 to grade 6 for 1974-1978.
Figure VI: Worksheet A of Grade Transition Model
Simple Model of Student Flow
YearEnrollment 1974 1975 1976 1977 1978
Primary 1 3446835 3552671 4002377 4331285 4929754Primary 2 2829095 3067592 3253994 3747117 3955770Primary 3 2501138 2512291 2822812 3120022 3466353Primary 4 2003492 2099223 2217059 2538736 2770132Primary 5 1627590 1682093 1811199 1944685 2242429Primary 6 1299716 1366288 144268?, 1583446 1710381
5.2.6 Entering Formulae. The formula is used to calculatethe value of a cell, using other numeric values alreadyentered in other cells. To calculate -.:he approximate gradepromotion rate for Primary 1 to Primary 2 for 1974-75, onewould have to divide the enrollment in Primary 1 in 1974(i.e., 3446835) by the enrollment in Primary 2 in 1975 (i.e.3067592). Formulae may be entered by:
(a) either typing directly the cell addresses for the twovalues, i.e., [ +cell address for 3446835/cell addressfor 3067592];
(b) or using the pointer to the addresses of the cells inquestion:
(1) press [+];(2) then move the cursor to the cell for enrollment in
Primary 1 in 1974;(3) press [/];(4) and then move the cursor to the cell for
enrollment in Primary 2 in 1975;(5) press [ENTER] to complete the formula.
Immediately after the formula has been ente:ed, the approximatepromotion rate for P.1-P.2 in 1974-75 will automatically becalculated.
After formulae for all the retention rates have been assigned,one would have completed developing the grade retention ratesin Lotus worksheet. The following diagram shows the completegrade retention model:
154, I. Li
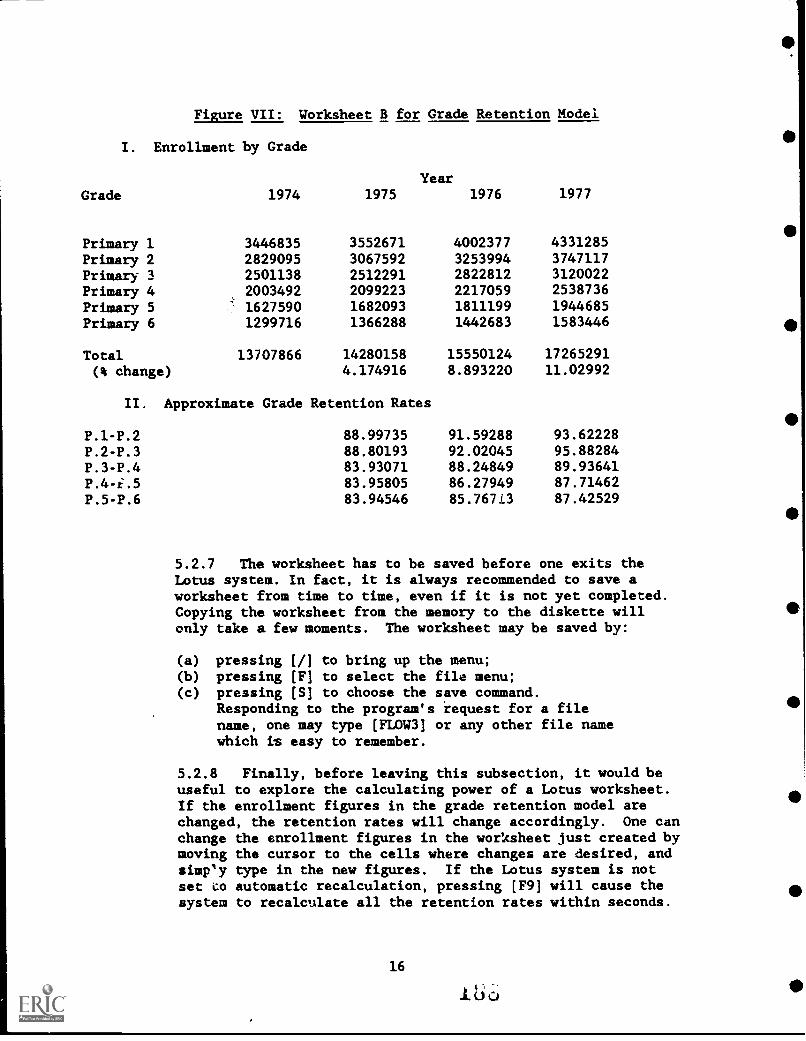
I. Enrollment
Grade
Figure VII: Worksheet B for Grade Retention Model.
by Grade
1974Year
1975 1976 1977
Primary 1 3446835 3552671 4002377 4331285
Primary 2 2829095 3067592 3253994 3747117Primary 3 2501138 2512291 2822812 3120022Primary 4 2003492 2099223 2217059 2538736
Primary 5 7. 1627590 1682093 1811199 1944685
Primary 6 1299716 1366288 1442683 1583446
Total 13707866 14280158 15550124 17265291
(% change) 4.174916 8.893220 11.02992
II. Approximate Grade Retention Rates
P.1-P.2 88.99735 91.59288 93.62228P.2-P.3 88.80193 92.02045 95.88284P.3-P.4 83.93071 88.24849 89.93641P.4-i.5 83.95805 86.27949 87.71462P.5-P.6 83.94546 85.767L3 87.42529
5.2.7 The worksheet has to be saved before one exits theLotus system. In fact, it is always recommended to save aworksheet from time to time, even if it is not yet completed.Copying the worksheet from the memory to the diskette willonly take a few moments. The worksheet may be saved by:
(a) pressing [I] to bring up the menu;(b) pressing [F] to select the file menu;(c) pressing [S] to choose the save command.
Responding to the program's request for a filename, one may type [FLOW3] or any other file namewhich is easy to remember.
5.2.8 Finally, before leaving this subsection, it would beuseful to explore the calculating power of a Lotus worksheet.If the enrollment figures in the grade retention model arechanged, the retention rates will change accordingly. One canchange the enrollment figures in the worksheet just created bymoving the cursor to the cells where changes are desired, andsimp'y type in the new figures. If the Lotus system is notset co automatic recalculation, pressing [F9] will cause thesystem to recalculate all the retention rates within seconds.
16
1. o

5.3 Grade Transition Model
5.3.1 As discussed above, the grade transition model is amore sophisticated version of the pupil flow model. Toconstruct the grade transition model requires statistics onenrollment by grade as well as the number of repeaters bygrades. The formulae required to calculate the number ofdropouts, dropout and promotion rates are also morecomplicated than the one used in the grade transition model.In this subsection, the powerful COPY command of Lotus willbe introduced to make the development of the grade transitionmodel easier.
5.3.2 A grade transition model has been constructed on Lotusworksheet and is stored in the file named FLOW2. This filecan be retrieved by the [ /FR] and then selecting the drive andthe file name FLOW2. The worksheet will look something likethe diagram below:
17
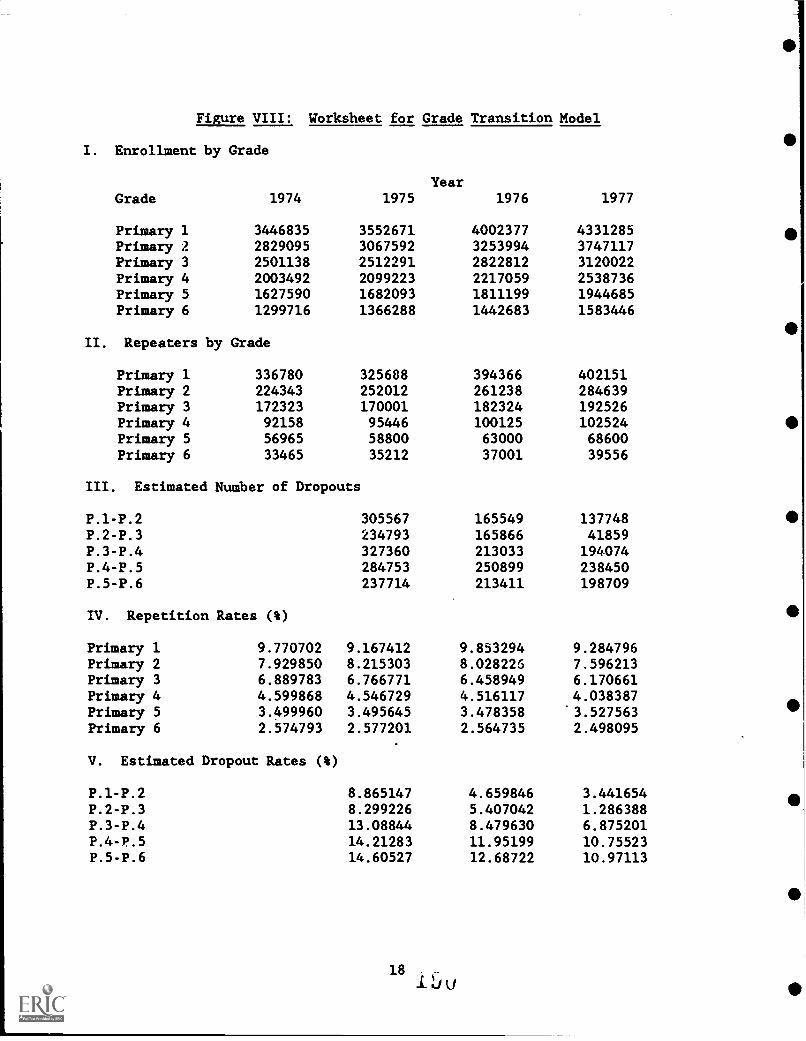
I. Enrollment
Figure VIII: Worksheet for Grade Transition Model
by Grade
YearGrade 1974 1975 1976 1977
Primary 1 3446835 3552671 4002377 4331285Primary 2 2829095 3067592 3253994 3747117Primary 3 2501138 2512291 2822812 3120022Primary 4 2003492 2099223 2217059 2538736Primary 5 1627590 1682093 1811199 1944685Primary 6 1299716 1366288 1442683 1583446
II. Repeaters by Grade
Primary 1 336780 325688 394366 402151Primary 2 224343 252012 261238 284639Primary 3 172323 170001 182324 192526Primary 4 92158 95446 100125 102524Primary 5 56965 58800 63000 68600Primary 6 33465 35212 37001 39556
III. Estimated Number of Dropouts
P.1-P.2 305567 165549 137748P.2-P.3 234793 165866 41859P.3-P.4 327360 213033 194074P.4-P.5 284753 250899 238450P.5-P.6 237714 213411 198709
IV. Repetition Rates ( %)
Primary 1 9.770702 9.167412 9.853294 9.284796Primary 2 7.929850 8.215303 8.028225 7.596213Primary 3 6.889783 6.766771 6.458949 6.170661Primary 4 4.599868 4.546729 4.516117 4.038387Primary 5 3.499960 3.495645 3.478358 '3.527563Primary 6 2.574793 2.577201 2.564735 2.498095
V. Estimated Dropout Rates ( %)
P.1-P.2 8.865147 4.659846 3.441654P.2-P.3 8.299226 5.407042 1.286388P.3-P.4 13.08844 8.479630 6.875201P.4-P.5 14.21283 11.95199 10.75523P.5-P.6 14.60527 12.68722 10.97113
181JU
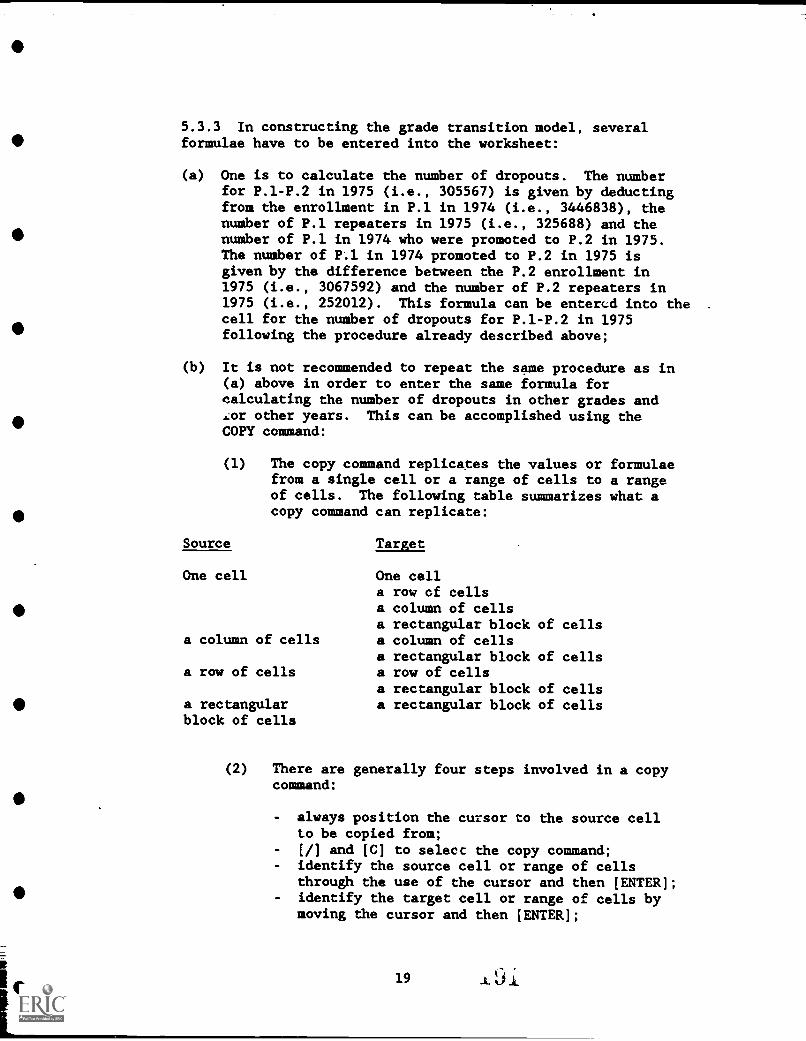
5.3.3 In constructing the grade transition model, severalformulae have to be entered into the worksheet:
(a) One is to calculate the number of dropouts. The numberfor P.1-P.2 in 1975 (i.e., 305567) is given by deductingfrom the enrollment in P.1 in 1974 (i.e., 3446838), thenumber of P.1 repeaters in 1975 (i.e., 325688) and thenumber of P.1 in 1974 who were promoted to P.2 in 1975.The number of P.1 in 1974 promoted to P.2 in 1975 isgiven by the difference between the P.2 enrollment in1975 (i.e., 3067592) and the number of P.2 repeaters in1975 (i.e., 252012). This formula can be entered into thecell for the number of dropouts for P.1-P.2 in 1975following the procedure already described above;
(b) It is not recommended to repeat the same procedure as in(a) above in order to enter the same formula forcalculating the number of dropouts in other grades andfor other years. This can be accomplished using theCOPY command:
(1) The copy command replicates the values orfrom a single cell or a range of cells toof cells. The following table summarizescopy command can replicate:
Source
One cell
a column of cells
a row of cells
a rectangularblock of cells
Target
One cella row of cellsa column of cellsa rectangular block of cellsa column of cellsa rectangular block of cellsa row of cellsa rectangular block of cellsa rectangular block of cells
formulaea rangewhat a
(2) There are generally four steps involved in a copycommand:
always position the cursor to the source cellto be copied from;[I] and [C] to select the copy command;identify the source cell or range of cellsthrough the use of the cursor and then [ENTER];identify the target cell or range of cells bymoving the cursor and then [ENTER];
19

(3) It should be noted that Lotus addressing works inrelative terms. The COPY command copies theformula by retaining the relative positions ofcells referenced in the formula. Thus, theformula is not copied exactly. For instance,copying the formula for calculating the number ofdropouts for P.1-P.2 in 1975 to the cell whichcontains the number of dropouts for P.1-P.2 in1976 will also change the contents of the formulafor the target cell so that the new formula willdeduct from the enrollment in P.1 in 1975 ratherthan in 1974, the number of pupils promoted to P.2in 1976 instead of 1975.
(c) Once the technique of copying is mastered, it will berelatively easy to enter another two sets of formulaeinto the worksheets:
(1) The formula to calculate the repetition rates.For instance, the repetition rate for P.1 in 1975is given by dividing the number of repeaters in1975 by the P.1 enrollment in 1974 and then times100 to convert the rate into percentage terms;
(2) The formula for calculating the dropout rates.The dropout rate for P.1-P.2 in 1975 is given bydividing the number of dropouts in 1975 for P.1-P.2 by the P.1 enrollment in 1974 and then times100 to convert the rate into percentage terms;
5.4 Internal Efficiency Model
5.4.1 An internal efficiency model has been developed onLotus worksheet and is stored in the file named EFFIC. It isnot proposed at this stage to go into detail about theconstruction of the model. The working of the model will bedemonstrated in this subsection. First of all the firstEFFIC can be retrieved by [/], [F], [R] and then select thedrive and file name. Since the worksheet is quite large, itis necessary to move the cursors around to see the entireworksheet.
5.4.2 Part of the internal efficiency model is shown in thediagram below:
20
1 !i
411
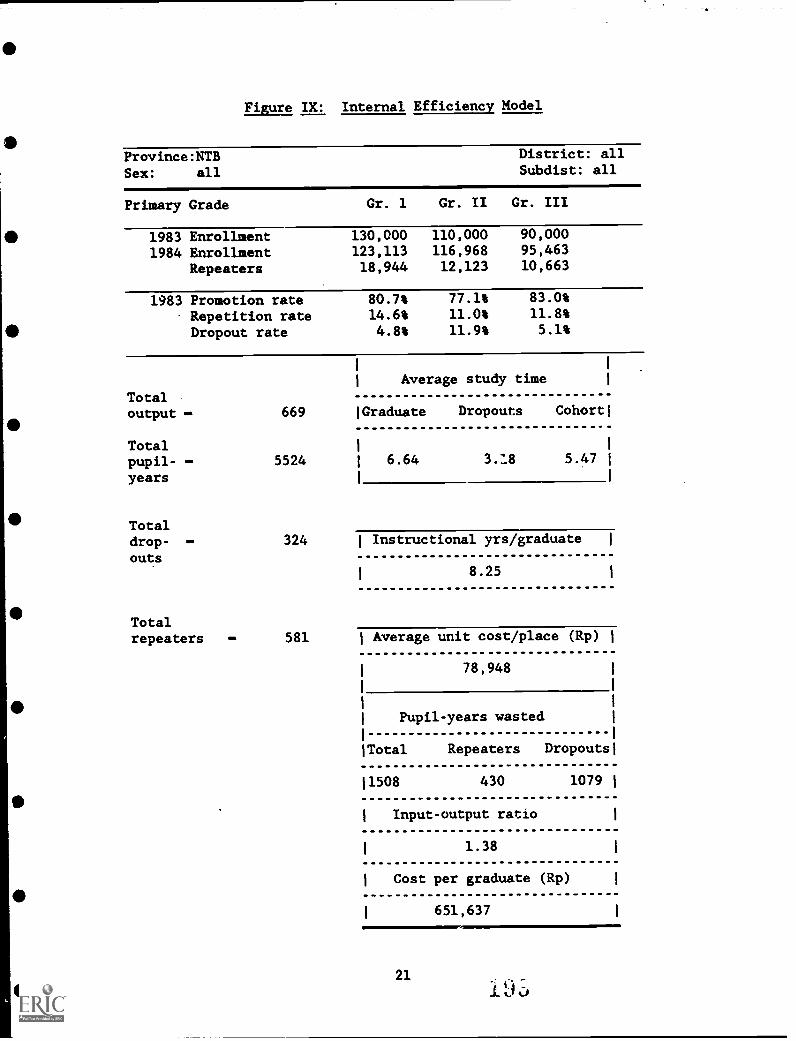
Figure IX: Internal Efficiency Model
Province:NTBSex: all
District: allSubdist: all
Primary Grade Gr. 1 Gr. II Gr. III
1983 Enrollment1984 Enrollment
Repeaters
130,000 110,000123,113 116,96818,944 12,123
90,00095,46310,663
1983 Promotion rateRepetition rateDropout rate
80.7%14.6%4.8%
83.0%11.8%5.1%
Totaloutput
Totalpupil- -years
Totaldrop- -outs
Totalrepeaters
Average study time
669 (Graduate Dropouts Cohort!
5524 6.64 3.18 5.47
324 Instructional yrs/graduate
8.25
581 Average unit cost/place (Rp)
78,948
Pupil-years wasted
Total Repeaters Dropouts
(1508 430 1079
I Input-output ratio
1.38
I Cost per graduate (Rp)
651,637
21

The main feature of the model is that it will calculate the
dropout, repetition and promotion rates, as well as a number
of indicators of internal efficiency from statistics onenrollment by grade for any two consecutive years and number
of repeaters by grade for the last year. The formulae for
calculating the three flow rates are based on the grade
transition model just described in section 5.3 above. The
promotion rates is equal to 1 minus the rates of repetition
and dropout. Based on the flow rates calculated, areconstructed cohort model can be developed, the method of
which is already demonstrated in the earlier part of this
Unit.
5.4.3 It would be useful to move around the worksheet and to
study the formula for each of the indicators listed above.
This can be done by simply placing the cursor in the cell in
the question and the formula will appear on the top of the
worksheet. for example:
(a) The average number of years spent by graduates iscalculating by first, aggregating the number ofgraduates who take 6 years to finish primary (i.e., 358)
multiplied by 6, the number of graduates who take 7years (i.e., 214) multiplied by 7, the number ofgraduates who take 8 years (i.e., 76) multiplied by 8,
and the number who take 9 years (i.e., 21), and thendividing the aggregated number by the total number of
graduates (i.e., 669). The relevant part of the
worksheet is shown below:
22
9

(b) The total number of pupil years spent by the cohort of1000 pupils (i.e., 5524) is also shown in the diagramabove. The number is obtained by summing the number ofsurvivors in each year;
(c) At the upper right hand corner of the boxes for thenumber of survivors by year is the estimated number ofdropouts at the end of the year concerned. Thus,
summing up the number of dropouts for each year givesthe total number of pupil-years spent by these dropouts.The average number of years these dropouts spend in theschool system can be estimated by dividing the totalnumber of pupil-years spent by dropouts by the totalnumber of dropouts.
5.4.4 A number of indicators may be constructed from thismodel, some of which are shown in Figure IX above:
(a) Indicators of Retention la Grade
(1) The number of survivors by grade, which is shownin Figure IV above. One may distinguish the flowrates such as promotion, repetition and dropoutrates computed from the flow models which referto the flow of pupils between any two consecutiveyears, from this indicator which shows what wouldeqentually happen to the cohort of pupils whenall those who repeat have finally dropped out orare promoted;
(2) The number of dropouts by grade, which is alsoshown in Figure IV above. This gives a usefulindication of the number of grades pupils willcomplete before leaving schools prematurely;
(3) Number of graduates from the final grade, whichrepresents an estimate of the output from theschool system for every 1000 cohort of pupils,based (a the assumed rates of repetition anddropouts. For setting targets which are relatedto the projected requirement for school leavers,this will be a very useful indicator,
(b) Indicators of Retention by Years Spent in School
(1) Number of survivors by years spent in school,which is shown in the diagram given in paragraph5.4.3(a) above;
(2) Average number of years spent in school bygraduates, as discussed in paragraph 5.4.3(a);
24
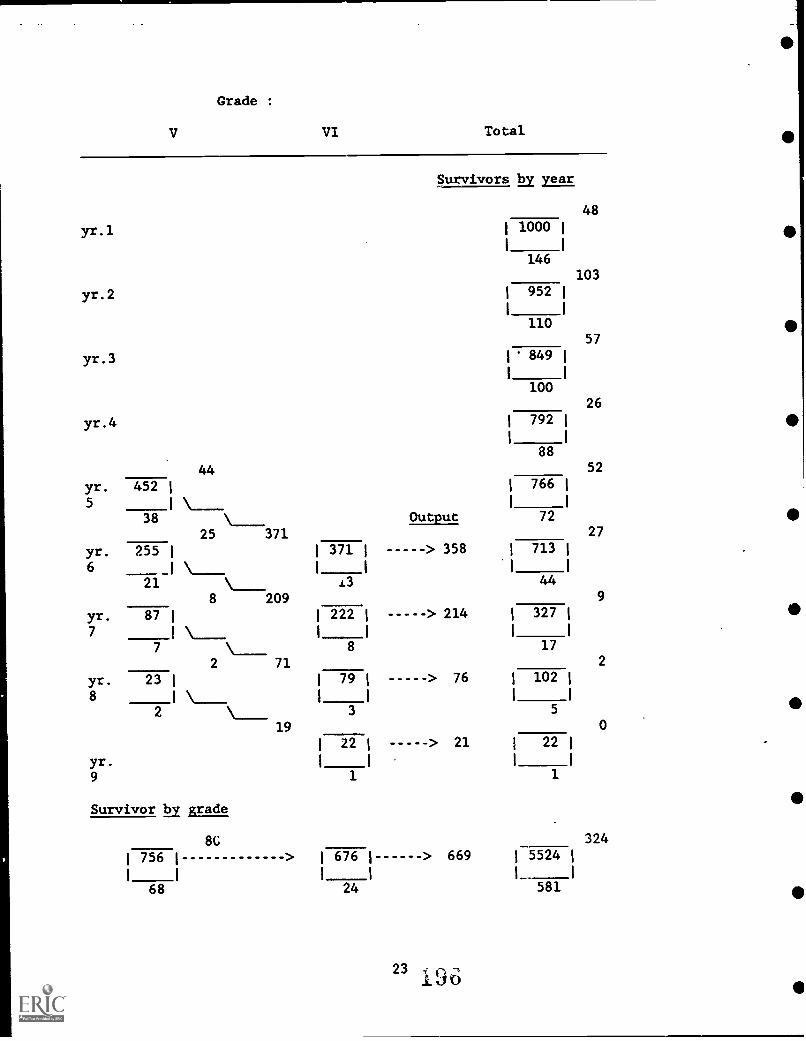
Grade :
V VI Total
Survivors 12y year
48
yr.1 1000
146103
yr.2 952
11057
yr.3 849
10026
yr.4 7921
88
44 52
yr. 452 766
5 I\.-38 \____ Output 72
25 371 27
yr. 255 I 1 371 I > 358 I 713
6I\____
21 \____ 13 44
8 209 9
yr. 87 I 1 222 > 214 I 327
7I \____
7 \____ 8 17
2 71 2
yr. 23 I 79 I > 76 I 102
8 \____2 \____ 3 5
19 0
yr.
22 > 21 I 22
9 1 1
Survivor by grade
8C 324
1 756 1> 1 676 1 > 669 1 5524 I
1 I 1 I_ I
68 24 581
239

(3) Average number of years spent in school by pupilswho will leave school prematurely, as discussed inparagraph 5.4.3(c);
(c) Indicators of Wastage and Efficiency
(1) Total number of pupil-years wasted by graduateson repeating. This can be obtained by aggregatingthe number of pupils who take 7 years (instead ofthe normal duration of 6 years) to completeprimary schooling (i.e., 214 in the diagram givenin paragraph 5.4.3(a)) multiplied by 1, the numberwho take 8 years multiplied by 2, and the numberwho take 9 years multiplied by 3;
(2) The input-output ratio as discussed in paragraph4.5.5(c) above. The ratio may be obtained bydividing the total number of pupil-years spent bythi cohort of 1000 pupils in school, by theproduct of the number Of graduates and 6 years.
5.4.5 It may be noted several new LOTUS techniques have beenused in developing the spreadsheet for analyzing internalefficiency:
(a) First of all, it may be noted the format of theworksheet is much better than the two worksheets on theflow models. This can be accomplished by:
(1) Formatting the width of the column to cope withdifferent labeling and numbering requirements.For some labels, the column width has to be set to
1. For others, the column width has to be greaterthan the default value of 9. The LOTUS commandsused to change column-width are:
[I] to bring up the menu;[W] to select the worksheet menu;[C] to select the column-width command;[S] to select the set width command;[ENTER] to issue the command and thenin respond the system request, enter theappropriate no. of characters for thecolumn-width;
It may be noted that the column width can be aslong as 240 characters. The default value of 9characters can be changed using the worksheetstatus [WS] commands;
25 l0,

(2) The alignment of labels. For columns which arewide, it is desirable to have the labels alignedso that the data which are numeric and are alwaysaligned to the right, could be shown immediatelybelow their respective titles. There are threespecial characters used by the LOTUS system in
aligning labels:
( ) which will align labels to the left;
( " ) which will align labels to the right;( " ) whIell will center labels.
The default is { ) giving left-justified labels;
(3) The formatting of numbers. The LOTUS system shows
numbers in the most efficient manner by using theminimum numbers of characters for numbers. By
formatting the rmmbers, one can determine thenumber of decimal places to be displayed onscreen, display percentages, display numbers with
commas "," to show thousands, millions, etc. It
may be noted that although a limited number ofdecimal places is shown on the screen, the LOTUSstill keeps up to 15 decimal positions in itsmemory. The relevant command procedure is as
follows:
[I] to bring up the menu;[RF] to bring up the range format menu whichallows users to specify the format for a range
of cells;Then one can cnoose from the options availablefrom the menu by simply moving the right cursorkey ( -> ) or the left cursor key ( <- );[ENTER] and then specify the range of cells tobe assigned the format just defined.
(b) It may also have been noted by moving around theworksheet that the backslash symbol (\) appears manytimes in the worksheet. This key allows users to repeat
any label that follows the backslash in the cell
concerned. Using this key will save a lot of typingtime required to repeat a label;
(c) Oneof the function keys available in LOTUS to performsummation, @SUM, has been used in developing the
spreadsheet. The function keys are built-in formulaewhich help users perform arithmetical, statistical aswell as logical functions. The function @SUM (CELL1..CELL2) sums up all numeric values in the range ofcells from cell 1 to cell 2. The functions may be used
in the same manner as entering formulae.
26

6. Learning Activities
6.1 Microcomputer Tutorial Sessions
6.1.1 The purpose of the tutorial sessions is to give yourparticipants an opportunity to practice the various LOTUScommands discussed in the User Manual Section, and to modifythe worksheets already developed in this unit.
6.1.2 In the first part of the tutorial sessions, theparticipants will be asked to go through the LOTUScommands used in the User Manual Section.
6.1.3 Then, in the second part, they will be asked to refinethe format worksheets FLOW1 and FLOW2 following the proceduredescribed in paragraph 5.4.4 above.
6.2 Group Work Session
6.2.1 The partiCiPants will be divided into groups. Duringthe group discussion, the participants will be asked tocomment on:
(a) Thsusefulness of the flow model in estimating thenuiiber of dropouts and analytinE internal efficiency;
(b) The shortcomings of the flow model when applied toanalyzing the pupil flow in a particular province ordistrict.
7. Post-assessment
7.1 The purpose of the post-assessment is to help the instructorsto evaluate whether the learners are able to perform the tasksdescribed in this unit. The learners are required to:
(a) Construct a simple flow model based on the information givenin paragraph 7.2 below;
(b) Develop an internal efficiency model for the junior highschool system, using the flow rates calculated from the flowmodel above.
7.2 Construction of Grade Transition Model. A simple flow modelis required to be constructed for a subdistrict by theparticipants, with the help of the instructors:
(a) The flow model is in respect of the junior high school systemin a subdistrict. The duration of study for the high schoolsis 3 years;
27

(b) It is assumed that data are available on the following:
(1) enrollment by grade for 3 consecutive years:
Grade I II III
year 1 300101 287664 254331
year 2 321098 276554 253444
year 3 364219 300567 256743
(2) number of repeaters by grade for 3 consecutive years:
Grade I II III
year 1 27864 26431 23217
year 2 30010 28777 24903
30211 24321year 3 21078
(3) number of leavers from grade 6 in primary schools someof whoa fail to be admitted into grade 1 in junior high
school for 3 consecutive years:
year 1 45646year 2 43408year 3 42127
(c) The learners are required to construct the grade transition
model based on the above statistics. The model should be
able to give the following indicators:
(1) The number of dropouts and dropouts by grade for the
junior high school system;
(2) The rate of repetition by grade;
(3) The promotion rates by grade for the junior high school
system;
(4) The number of grade 6 leavers from primary schools who
fail to be admitted into junior high school;
(5) The promotion rate between grade 6 in primary and grade
1 in junior high schools.
(d) The learners may construct a crude worksheet, similar to the
format of FLOW1 and FLOW2. But later they are required torefine the format of the worksheet, following the proceduresoutlined in paragraph 5.4.4.
7.3 Developing a Reconstructed Cohort Model. The learners will
then proceed to develop a reconstructed cohort model using the
transition rates computed from the flow model developed in
paragraph 7.2 above.
28
c-,
4-.4U o

III. Unit 2: Projection of Enrollment
8. Performance Objectives
8.1 On completion of this unit, the participants should be ableto:
(a) Apply the techniques of the pupil flow model to projectfuture enrollment in schools;
(b) Appreciate how the different flow indicators, some of whichmay have policy implications, would affect demand for school
places;
(c) Use the software package LOTUS 123 to develop worksheets forthe projection of enrollment in schools, which can take intoaccount different assumptions on the flow indicators.
9. Instructional Activities
9.1 Different Methods of Projecting Enrollment
9.1.1 Pupil Flow Model. A flow model is constructed byplanners to simulate the movement of pupils through theschool system based on time series data on enrollment andrepetition. Therefore, a natural extension of the use ofthe flow model is to apply it to forecasting future movementof pupils in the school system.' This gives the projectionof enrollment which is required in nearly all quantitativeplanning exercises, ranging from the planning of schoolbuilding, teacher training, curriculum development, and theproduction of textbooks. The merits of employing the flow
model are that:
(a) Planners can test the outcome of the enrollmentforecasts by using different assumptions on the ratesof repetition and promotion. In most circumstances,these rates can be affected by deliberate policymeasures. For example, a certain maximum repetitionrate can be imposed on schools as mandatory requirement.Standards set in the examination system for theselection of pupils for entry to junior high schoolslargely determines the progression rate from primary tojunior high schools. These so-called policy variablesoften become the centre of heated educational or evenpolitical debates;
(b) Planners can also test the sensitivity of the projectionmodels by changing the flow rates. This sensitive test
29
A

provides a means of assessing the probable range oferrors of any enrollment forecasts using the flow model.
9.1.2 Time Series Analysis of En...)11ment. A number ofmethods can be used to project future enrollment in school.
One method is the use of time series analysis of historical
enrollment data. Based on the past enrollment trend, thefuture enrollment size can be projected by a mereextrapolation of the past trends. A variety of statisticalmodels are available for the projection exercise. A serious
drawback of this method is that it fails to take into accountdemographic factors which determine the number of childrenavailable to become educated in the country or district
concerned. For places where the proportion of childrenattending schools is high, where the rate of attendance canbe or has to be determined as a policy variable, this method
is definitely inadequate for the purposes of making
enrollment projection.
9.1.3 Enrollment Ratio Method. This method overcomes thecriticism raised in (a) above, by taking into account
demographic factors. The additional statistical information
required is:
(a) Historical data on enrollment, preferably analysed byage;
(b) Demographic data on past and future projection ofpopulation in the school-age group by age.
Using this method, one could derive the net enrollment ratiosfor the school system using historical data. The net
enrollment ratio for primary education is defined as theproportion of the population in the primary school-age groupwho are enrolled in primary schools. Given a time series
data on the net enrollment ratios, one can project the future
enrollment by extrapolating from the past trend. Differentstatistical techniques may be used for such a projectionwhich could also take into account a target ratio for any
given year. By applying the forecasted net enrollment ratiosto the projected number of children in the corresponding age
group, one can derive the vstimated number of childrenenrolled in schools for the forecast period.
9.1.4 Other forms of enrollment ratios like the grossenrollment ratio can be used to project the number of pupils
in schools. The gross enrollment ratio for primary school isdefined as the ratio of the total enrollment in schools tothe number of children in the primary school-age group (7-
13 years). If no statistics are available on the enrollmentof pupils by age, the gross enrollment ratio has to be usedin the projection.
3020Z
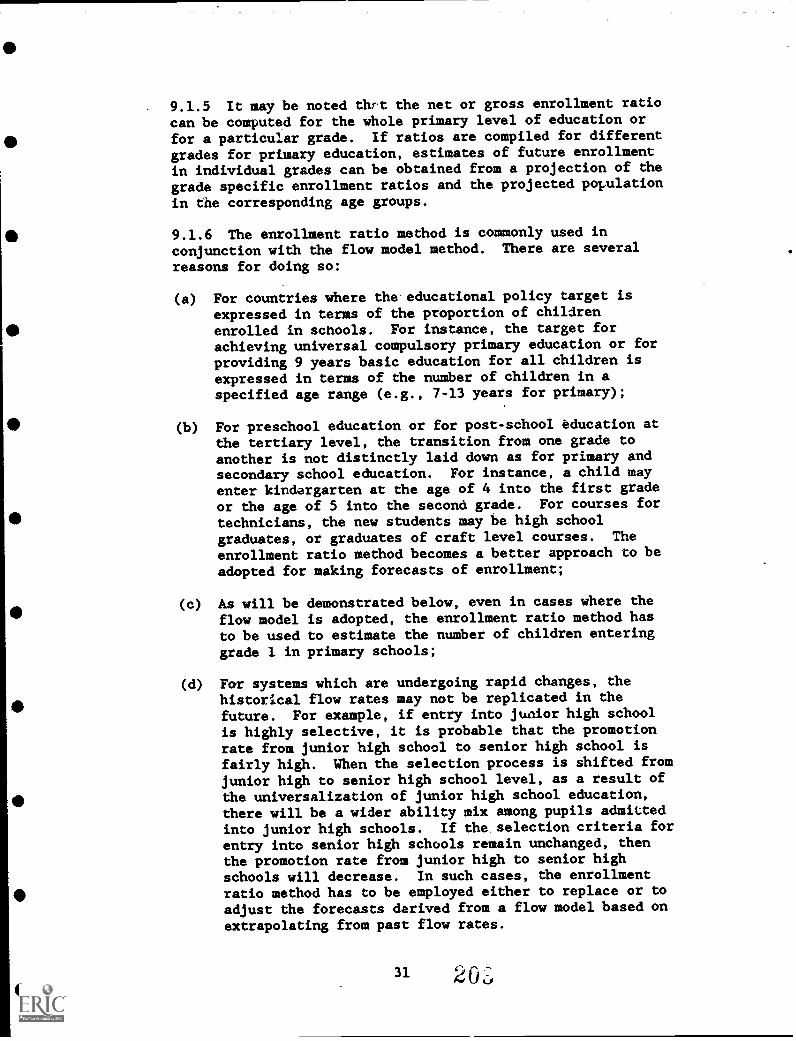
9.1.5 It may be noted tht the net or gross enrollment ratiocan be computed for the whole primary level of education or
for a particular grade. If ratios are compiled for differentgrades for primary education, estimates of future enrollmentin individual grades can be obtained from a projection of the
grade specific enrollment ratios and the projected population
in the corresponding age groups.
9.1.6 The enrollment ratio method is commonly used inconjunction with the flow model method. There are several
reasons for doing so:
(a) For countries where the educational policy target isexpressed in terms of the proportion of childrenenrolled in schools. For instance, the target forachieving universal compulsory primary education or forproviding 9 years basic education for all children isexpressed in terms of the number of children in aspecified age range (e.g., 7-13 years for primary);
(b) For preschool education or for post - school education atthe tertiary level, the transition from one grade toanother is not distinctly laid down as for primary andsecondary school education. For instance, a child mayenter kindergarten at the age of 4 into the first grade
or the age of 5 into the second grade. For courses fortechnicians, the new students may be high schoolgraduates, or graduates of craft level courses. Theenrollment ratio method becomes a better approach to beadopted for making forecasts of enrollment;
(c) As will be demonstrated below, even in cases where theflow model is adopted, the enrollment ratio method hasto be used to estimate the number of children enteringgrade 1 in primary schools;
(d) For systems which are undergoing rapid changes, thehistorical flow rates may not be replicated in thefuture. For example, if entry into junior high schoolis highly selective, it is probable that the promotionrate from junior high school to senior high school isfairly high. When the selection process is shifted fromjunior high to senior high school level, as a result ofthe universalization of junior high school education,there will be a wider ability mix among pupils admittedinto junior high schools. If the selection criteria forentry into senior high schools remain unchanged, thenthe promotion rate from junior high to senior highschools will decrease. In such cases, the enrollmentratio method has to be employed either to replace or toadjust the forecasts derived from a flow model based onextrapolating from past flow rates.
31 20,7,

9.2 Forecasting Using the Flow Model
9.2.1 Grade Retention Model. A number of parameters have tobe determined in making use of the grade retention model:
(a) The grade retention rates for the forecast period;
(b) The rates of admission into the first grade of the cycleof education under study over the forecast period,expressed as percentages of either the number ofchildren in the re_evant school-age group or the numberof children in the relevant school-age group or thenumber of school leavers from the terminal grade of thepreceding cycle of education.
These rates may be estimated by extrapolating from pasttrends, or based on prescribed policy objectives and/oreducational development programmes.
9.2.2 It follows from above that the data required for theprojection are as follows:
(a) Historical data on the number of enrollment by grade topermit an analysis of the changes in the gradetransition rates over time;
(b) Historical data on the number of children in the agegroup corresponding to the age of entry into the first
grade of the cycle of education under study and/or thenumber of school leavers from the terminal grade of thepreceding cycle of education;
(c) A projection of the number of children in the age groupcorresponding to the age of entry into the first gradeof the cycle of education under study and/or the numberof school leavers from the terminal grade of thepreceding cycle of education.
9.2.3 Grade Transition Model. The additional feature a gradetransition model has over the grade retention model is thedistinction made in the former model between repetition anddropouts. Thus in the grade transition model the retentionrate between any two grades is decomposed into promotion,dropout and repetition rates. As a result, the model ismore sophisticated than the grade retention model inanalysing as well as projecting pupil flow. The parametersrequired for the model are as follows:
(a) The rates of repetition and dropout by grade for theforecast period;
32
A
2 0 .;

(b) The rates of admission into the cirst grade of the cycleof education under study ov, the forecast period,expressed as percentages of either the number ofchildren in the relevant school-age group or the numberof school leavers from the terminal grade of the,receding cycle of education.
9.2.4 There are different ways of projecting the aboveparameters. The following only represent one of the possibleapproaches which can be adopted:
(a) The rates of repetition are usually prescribed bypolicymakers as educational targets. Sometimes, therepetition rates are even laid down as part of theregulations governing the modus operandi of schools.For some places, the abolition of repetition, to bereplaced by a more pupil oriented approach backed up bya host of remedial education services is regarded as the
medium, if not long-term objective in educationalplanning. Thus, determining the rates of repetition tobe used in the forecasting model should be fairlystraight-forward. Of course, due allowance must be madefor a gradual transition from the existing rates to thetarget rates;
(b) Dropout is always regarded as undesirable and has to beeliminated from a school system. However, the fact thatit is almost practically not possible to prevent pupilsfrom occasional truancy and eventually dropping out fromschools, necessitates a realistic assessment of dropoutand its inclusion into the projection model. In most
cases, the rates of dropouts have to be projected byextrapolating from past tre:,,ds, modified by expertjudgment on the working of the school system;
(c) Projecting new entrants into the school system is themost problematic part of any pro'lction exercise. For
entrants into the first level of education (i.e.,primary), the age of entry is usually laid down bypolicymakers. Therefore, it would be fairly straightforward to relate to the number of children in therespective age group to the official education policygoverning the proportion of children in the age groupwho should be admitted into schools. However, two
problems generally arise:
(1) Not all children enter primary school at the rightage, a phenomenon not uncommon in many developing
countries;
(2) Not all children who are required to be admittedin schools would attend schools. Even if they do
33
206

turn up at the beginning of the school year, some
of them may disappear from school even before
schools complete their registration procedure.
(.1) To tackle the problem raised in (c)(1) above. One can
obtain an estimate of the number of new entrants in
different age groups. This entails the projection ofthe "age-specific" admission rate into grade 1 for each
year group in the age range of the new pupils admitted.More detailed statistics on enrollment and new pupils
have to be collated:
(1) Historical data on enrollment in grade 1 by ageand repeaters in grade 1 by age. The number of
new pupils admitted into grade 1 by age can beestimated deducting from the number of grade 1
pupils in a given year group the number ofrepeaters in the corresponding year group; OR
(2) Historical data on the number of new pupilsadmitted into grade 1 by age.
The additional statistical information permits ananalysis be made of the age-specific admission rate for
grade 1. One may extrapolate these rates to forecastthe future age-specific admission rates, and multiplying
the projected rates by the estimated future population
in the respective age group gives the estimated number
of new pupils admitted into grade 1 by age. A simple
example is given below:
Figure XVI: Estimation of Grade I Entrants
Yr. Group Population Age-specific Estimated
Admission Rates Enrollment
7 100,000 0.78 78,000
8 110,000 0.11 12,100
9 113,000 0.06 6,780
10 115,000 0.02 2,300
Total 99,180
(e) In performing the above statistical analysis, it should
be noted that the age-specific admission rates for
different year groups are related to each other. This
may be illustrated by computing the so-called "diagonal
sum" for grade 1 admission, as shown below:
34 200
I
411
I
41

Figure XVII: Diagonal Sum .for Grade 1 Admission
(i) Cohort of children aged 7 in yr. 1 1000
(ii) Number of new pupils admitted into grade 1 by age:
(1) aged 7 in yr. 1 800
(2) aged 8 in yr. 2 100
(3) aged 9 in yr. 3 40
(4) aged 10 in yr. 4 20
Total number in the cohort admitted tograde 1 in yr. 1 - yr. 4 (Diagonal Sum) 960
The diagonal sum derived from the above computation shouldnot be larger than the total number of children in the cohort
in question (i.e., 1000). This maxima provides a means ofchecking the validity of the projected age-specific admissionrates.
(f) For places where underreporting of repetition in grade 1
is believed to not be serious, the "diagonal sum" methodcan be used to provide an indication of the extent ofunderreporting, the so-called "hidden" repetition ingrade 1. Underreporting will mostly occur when pupilstransfer from one school to another and repeat grade 1.If the parents of the pupils transferring schools reportthat the pupils are new entrants rather than repeaters.This phenomena is more widespread when entry to someprimary schools are highly selective. As a result, some
parents may try to prepare their children for entry into
these primary schools by first enrolling them in grade 1
in less selective schools. If the diagonal sum isgreater than 1, say 120%, then it may be deduced that
the "hidden" rate is 20% over the period concerned. If
there is "hidden" repetition, the maxima imposed on theage-specific admission rates to grade 1 will be greater
than unity. By forecasting the future movement of the"diagonal sum," one can allow for "hidden" repetition inthe projection of new entrants. Doing this is, however,
a precarious exercise for several reasons:
(1) The extent of underreporting may change over timeas a result of changing admission criteria adopted
by schools. It is extremely difficult to predictaccuracy future values of the "diagonal sum";
(2) To compute "diagonal sum" requires a fairly longtime series on statistics on ..'ew pupils admitted
into grade 1 by age. The staUstics are usuallynot available for many countries;
35

(3) The reporting of age by pupils may not be
reliable. Besides, accurate demographicstatistics on the number of children by single
year of age may also not be available, exceptperhaps for the census year. The computed"diagonal sum" will be subject to all these random
errors. As a result, it becomes almost impossible
to predict what will be the future values of the
"diagonal sum" based on an analysis of the past
trend.
Therefore extreme care needs to be exercised in the use of
the "diagonal sum" method in the projection model.
(g) For estimating entrants from one cycle to another, from
primary into the first cycle of the second level of
education (i.e., junior high school), the parameters are
the number of school leavers from primary schools and
the rate of admission. Estimates of the number of school
leavers are the output from the flow model for the
primary schools. The rate of admission into junior high
school is normally governed by education policy and the
availability of places in junior high schools. For
countries where the private sector is not insignificant,
the actual rates of admission into junior high schools
will be to some extent beyond the control of educational
planners and administrators. The number of primary
school leavers who choose to enter junior high schools
in the private sector will depend on such factors as the
quality of places available in the private sector, the
school fees charged, and the "return" they could expect
from attending junior high schools in the private
sector. In situations where both the public sectorprovision is expanding and people's aspirations for more
education is also rising, it would be quite difficult to
predict what the future admission rates would be.
9.3 The Choice of Methodology
9.3.1 Apparently, the flow model is the more sophisticated
model compared with a simple time series analysis of
enrollment or the enrollment ratio method. However, this
does not mean that the flow model is superior to the other
two methods in projecting enrollment. Wherever possible, one
has to construct a flow model in order to understand the
dynamics of pupil flow in the school system. Additionally,
one needs to look at tne enrollment ratio to appraise the
effectiveness of a program of providing education to the
children in reaching its target population. A simple time
series analysis of enrollment will provide one with an idea
of how enrollment is changing over time, with its
36
206
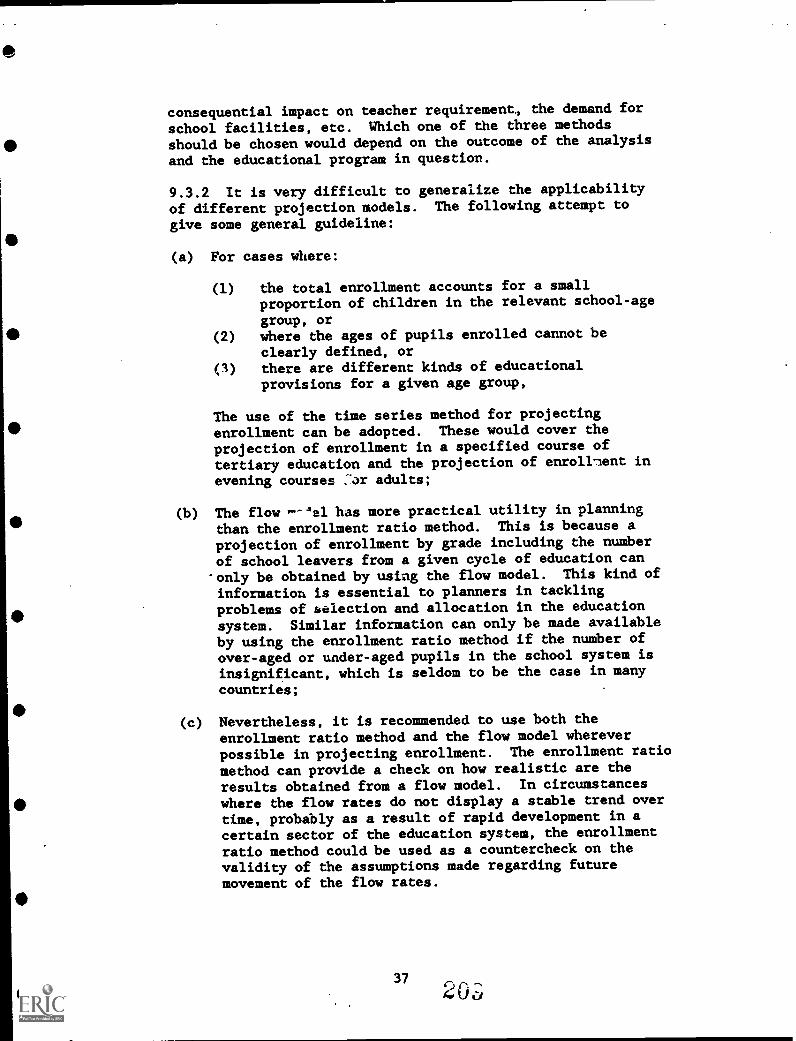
consequential impact on teacher requirement., the demand for
school facilities, etc. Which one of the three methodsshould be chosen would depend on the outcome of the analysis
and the educational program in question.
9.3.2 It is very difficult to generalize the applicabilityof different projection models. The following attempt to
give some general guideline:
(a) For cases where:
(1) the total enrollment accounts for a smallproportion of children in the relevant school-age
group, or(2) where the ages of pupils enrolled cannot be
clearly defined, or() there are different kinds of educational
provisions for a given age group,
The use of the time series method for projectingenrollment can be adopted. These would cover theprojection of enrollment in a specified course oftertiary education and the projection of enroll lent in
evening courses .-ar adults;
(b) The flow "al has more practical utility in planningthan the enrollment ratio method. This is because aprojection of enrollment by grade including the numberof school leavers from a given cycle of education canonly be obtained by using the flow model. This kind of
information is essential to planners in tacklingproblems of selection and allocation in the education
system. Similar information can only be made availableby using the enrollment ratio method if the number of
over-aged or under-aged pupils in the school system isinsignificant, which is seldom to be the case in many
countries;
(c) Nevertheless, it is recommended to use both theenrollment ratio method and the flow model whereverpossible in projecting enrollment. The enrollment ratiomethod can provide a check on how realistic are theresults obtained from a flow model. In circumstanceswhere the flow rates do not display a stable trend overtime, probably as a result of rapid development in acertain sector of the education system, the enrollmentratio method could be used as a countercheck on the
validity of the assumptions made regarding futuremovement of the flow rates.
37
20L

10. User 11:.nual
10.1 Getting Started
10.1.1 In this Unit, the participants will be introduced tothe techniques in constructing a more complicated worksheet,using the formatting commands as well as a few new commandsnot discussed in Unit 1. An enrollment projection worksheethas already been developed for this unit, and is stored inthe file named PUPROJ in the Diskette "EPP Mod.v.5." Most
parts of the worksheet are protected against modification.
Only the policy variables such as admission rates, repetitionrates, etc., are allowed to be modified.
10.2 The Grade Transition Model
10.2.1 It is considered sufficient to demonstrate thedevelopment and use of the grade transition model in a LOTUS
worksheet. Once the participants have mastered thetechniques in developing a grade transition model, thereshould be little difficulty for them to develop other lesscomplicated models such as the grade retention model or theenrollment ratio method in projecting enrollment.
10.2.2 Projecting Admission. The grade transition modelcontained in the worksheet named PUPROJ is a model forprojecting enrollment in primary schools. The first part of
the model is the projection of new pupils admitted intograde 1 in primary schools. The enrollment ratio method is
employed in the enrollment, by extrapolating the futuregrade specific gross enrollment rates, defined as the ratioof new pupils admitted to primary schools to the number ofchildren in the relevant school age group (i.e., 7 years).The following functions are provided in the projectionmodel:
(a) Users are allowed to prescribe a target gross enrollmentrate for the year 2000;
(b) Then the worksheets are programmed so teat the grossenrollment rate will gradually move towards the target,following a linear trend;
(c) The estimated numbers of children in the 7 year groupfor the forecast period from 1985 to 2000 are given inthe model as exogenous variables;
(d) The number of new pupils admitted into grade 1 inprimary schools can thus be computed from the product ofthe gross enrollment ratio and the population aged 7years.
38
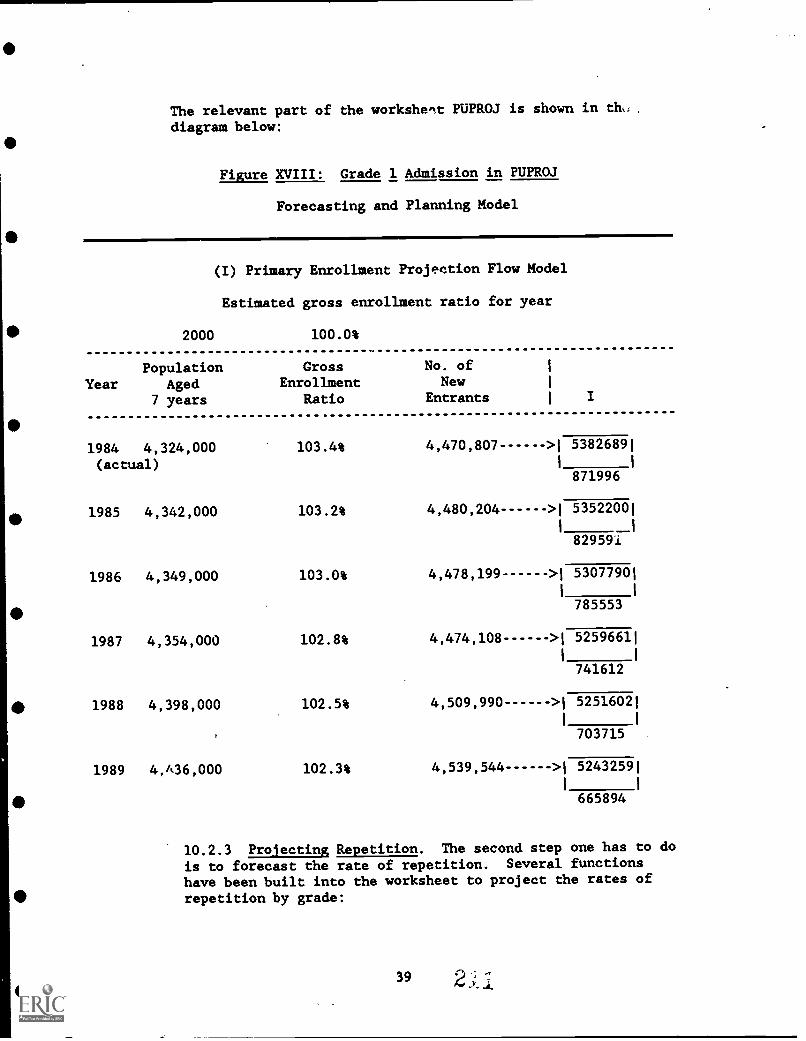
The relevant part of the worksheet PUPROJ is shown in th,,
diagram below:
Figure XVIII: Grade 1 Admission in PUPROJ
Forecasting and Planning Model
(I) Primary Enrollment Projection Flow Model
Estimated gross enrollment ratio for year
2000
PopulationYear Aged
7 years
1984 4,324,000(actual)
100.0%
GrossEnrollment
Ratio
103.4%
No. ofNew
Entrants
4,470,807
I
>1 53826891
I I
871996
1985 4,342,000 103.2% 4,480,204 >1 53522001
829591
1986 4,349,000 103.0% 4,478,199 >1 53077901
785553
1987 4,354,000 102.8% 4,474,108 >1 52596611
741612
1988 4,398,000 102.5% 4,509,990 >1 52516021
703715
1989 4,A36,000 102.3% 4,539,544 >1 52432591
665894
10.2.3 Projecting Repetition. The second step one has to do
is to forecast the rate of repetition. Several functionshave been built into the worksheet to project the rates of
repetition by grade:

(a) Users are allowed to assign the target rates ofrepetition for each of the six grades for the year 2000;
(b) From the actual rates of repetition in 1984 and the
targets in 2000, the system will extrapolate the rates
for 1985-2000 assuming a linear trend.
The results are shown in the diagram below:
Figure XIX: Repetition Rates in PUPROJ
Targetfor yr.
2000
Repetition rates
Yr.
5.0%
I
5.0%
II
4.0% 3.0%
GradeIII IV
3.0%
V
2.0%
VI
1984 16.2% 12.9% 10.5% 8.0% 9.7% 2.0%
1985 15.5% 12.4% 10.1% 7.7% 9.3% 2.0%
1986 14.8% 11.9% 9.7% 7.4% 8.9% 2.0%
1987 14.1% 11.4% 9.3% 7.1% 8.4% 2.0%
1988 13.4% 10.9% 8.9% 6.8% 8.0% 2.0%
1989 12.7% 10.4% 8.5% 6.4% 7.6% 2.0%
1990 12.0% 9.9% 8.1% 6.1% 7.2% 2.0%
1991 11.3% 9.4% 7.7% 5.8% 6.8% 2.0%
1992 10.6% 9.0% 7.3% 5.5% 6.4% 2.0%
1993 9.9% 8.5% 6.8% 5.2% 5.9% 2.0%
1994 9.2% 8.0% 6.4% 4.9% 5.5% 2.0%
1995 8.5% 7.5% 6.0% 4.6% 5.1% 2.0%
1996 7.8% 7.0% 5.6% 4.2% 4.7% 2.0%
1997 7.1% 6.5% 5.2% 3.9% 4.3% 2.0%
1998 6.4% 6.0% 4.8% 3.6% 3.8% 2.0%
1999 5.7% 5.5% 4.4% 3.3% 3.4% 2.0%
2000 5.0% 5.0% 4.0% 3.0% 3.0% 2.0%
10.2.4 Projecting Dropout Rates. Similar technique is
employed in projecting the dropout rates, by allowing users
to assign the target years for the year 2000. The results
are shown in the worksheet below:
40
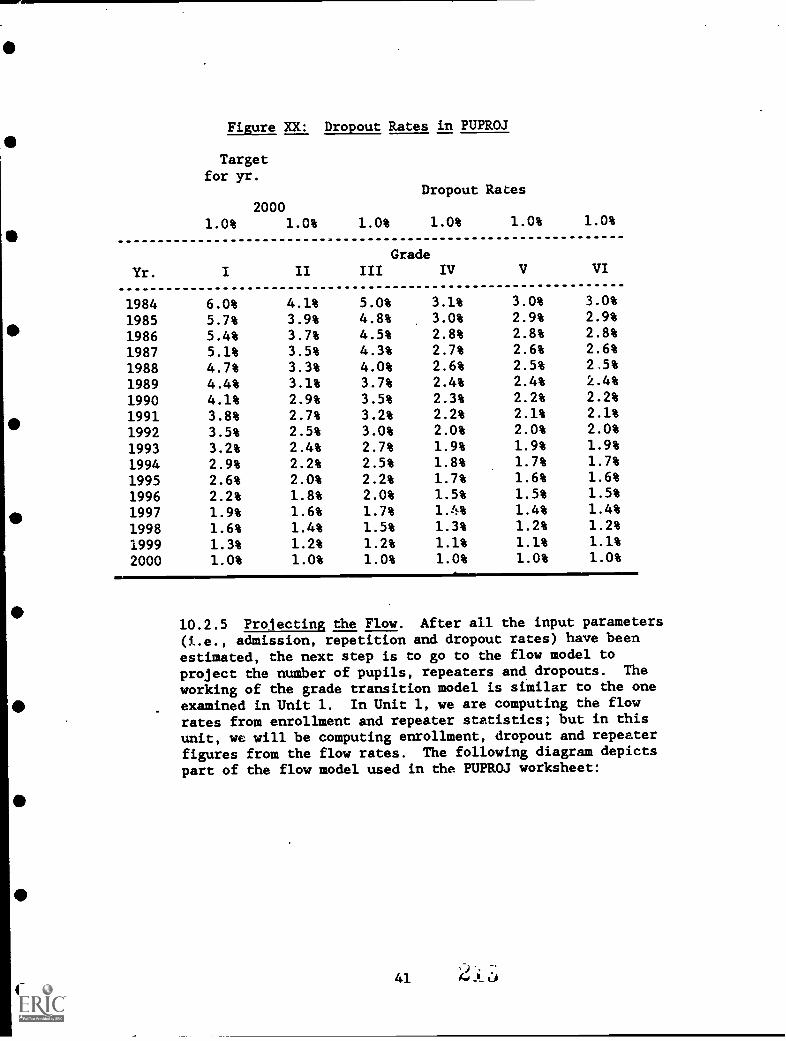
Figure XX: Dropout Rates in PUPROJ
Targetfor yr.
Dropout Rates
Yr.
20001.0%
I
1.0%
II
1.0%
GradeIII
1.0%
IV
1.0%
V
1.0%
VI
1984 6.0% 4.1% 5.0% 3.1% 3.0% 3.0%
1985 5.7% 3.9% 4.8% 3.0% 2.9% 2.9%
1986 5.4% 3.7% 4.5% 2.8% 2.8% 2.8%
1987 5.1% 3.5% 4.3% 2.7% 2.6% 2.6%
1988 4.7% 3.3% 4.0% 2.6% 2.5% 2.5%
1989 4.4% 3.1% 3.7% 2.4% 2.4% 2.4%
1990 4.1% 2.9% 3.5% 2.3% 2.2% 2.2%
19911992
3.8%3.5%
2.7%2.5%
3.2%3.0%
2.2%2.0%
2.1%2.0%
2.1%2.0%
1993 3.2% 2.4% 2.7% 1.9% 1.9% 1.9%
1994 2.9% 2.2% 2.5% 1.8% 1.7% 1.7%
1995 2.6% 2.0% 2.2% 1.7% 1.6% 1.6%
1996 2.2% 1.8% 2.0% 1.5% 1.5% 1.5%
1997 1.9% 1.6% 1.7% 1.4% 1.4% 1.4%
1998 1.6% 1.4% 1.5% 1.3% 1.2% 1.2%
1999 1.3% 1.2% 1.2% 1.1% 1.1% 1.1%
2000 1.0% 1.0% 1.0% 1.0% 1.0% 1.0%
10.2.5 Projecting the Flow. After all the input parameters(i.e., admission, repetition and dropout rates) have beenestimated, the next step is to go to the flow model toproject the number of pupils, repeaters and dropouts. The
working of the grade transition model is similar to the oneexamined in Unit 1. In Unit 1, we are computing the flowrates from enrollment and repeater statistics; but in this
unit, we will be computing enrollment, dropout and repeaterfigures from the flow rates. The following diagram depictspart of the flow model used in the PUPROJ worksheet:
41

Figure XXI: Flow Model in PUPROJ
Grade
YrI
322961
II
202549
84 5382689 4940215 I
\______ I \______871996 637288
304406 4187732 188477 4100378
85 5352200 4825020
l\_______829591 \____ 598604
285294 4218203 178824 4037938
86 5307790 4816807
l\_------
There area four sets of figures in the _above diagram:
(a) The figures shown inside the boxes above are the
estimated enrollment. Therefore the estimatedenrollment for grade 1 in 1986 is 5307790;
(b) The figures shown at the upper right hand corner of the
boxes are the estimated numbers of dropouts. Thus, the
number of dropouts between grade 1 and grade 2 for 1985-
1986 is 304406;
(c) The figures given at the bottom of the boxes are the
numbers of repeaters. For the number of repeaters in
grade 1 in 1984 is 871996;
(d) The figures given at the top left corners of the boxes
are the number of pupils promoted. It may be seen from
the above diagram that the number of pupils promoted
from grade 1 in 1985 to grade 2 in 1986 is 4218203.
10.3 Formulae for Computations
10.3.1 The interrelationship between the four sets of
figures and with the admission, dropout and repetition rates
estimated in other parts of the worksheet is defined in a
similar manner as that for the grade transition model
discussed in Unit 1 above:
(a) Grade 2 - 6 Enrollment. The number of enrollment in
grade 2 in 1986 (i.e., 4825020) is equal to SUM of the
number. of repeaters in grade 2 in.1986 which is 637288
42

and the number of pupils promoted from grade 1 to grade2 in 1986 (i.e., 4187732);
(b) Number of Pupils Promoted. The number of pupilspromoted from grade 1 to grade 2 in 1986 is in turngiven by the total number of pupils in grade 1 in 1985(i.e., 5382699) LESS the number of pupils who repeatedgrade 1 in 1986 (i.e., 871396) AND the nue)er of pupilswho dropped out from grade 1 in 1935-86 (i.e., 322961).
10.3.2 The number of repeaters, dropouts and enrollment ingrade 1 are estimated by linking other parts of the worksheeton repetition and dropout rates and the number of new pupils
admitted. The relationships between them are described below:
(a) Grade 1 Enrollment. This is given by adding the numberof new pupils admitted to grade 1 to the number ofrepeaters in grade 1 for the year concerned;
(b) Number of Repeaters. The number of repeaters for grade1 in 1987 is derived from multiplying the enrollment in1986 by the estimated repetition rate in grade 1 in1987;
(c) Number of Dropouts. The number of dropouts betweengrade 2 and grade 3 in 1986-87 is given by multiplyingthe enrollment in grade 2 in 1986 by the estimateddropout rate for grade 1 to grade 2 for 1986-87.
10.4 Constructing the LOTUS Worksheet
10.4.1 Entering Labels and Numbers. After having definedthe interrelationship between the various parameters, thenext step is to develop the worksheet. For a large worksheetlike the grade transition model, it would be a fairly time-consuming exercise to enter all the labels, including theflow diagram, and numbers into the worksheet. Theparticipants may make use of the COPY command learned in Unit1 to simplify their task. In order to design a format likethat of PUPROJ, the participants will have to resort to thevarious format commands which have been examined in Unit 1above.
10.4.2 Defining Formulae. Formulae have to be entered intothe worksheet for calculating the number of dropouts, thenumber of repeaters, etc. Different techniques have been
been used:
(a) Relative Addressing. This is the default setting forformulae in the worksheet. Thus, it is only necessaryto enter the formula for one year or one grade for
43

computing the number of repeaters. The formula for the
repeaters in grade 1 in 1985 can be created by:
(1) First move the cursor key to the cell which will
contain the number of repeaters in grade 1 in
1985;
(2) Type [ +] to tell the system that a formula is
being entered;
(3) Move the cursor key to the cell which contains the
value for the number of pupils in grade 1 in 1984;
(4) The address of the cell will appear on the controlpanel at the top of the worksheet;
(5) Then type [ 1k] which represents the multiplication
operator. The cursor will immediately jump backto the cell which will store the result of the
calculation (i.e., the number of repeaters ingrade 1 in 1985);
(6) Then move the cursor to the cell which containsthe repetition rate for grade 1 in 1985. Then
press [ENTER]:
(7) The cursor will return back to the cell which willstore the result of the formula (enrollment in
grade 1 in 1985 multiplied by the repetition ratein grade 1 in 1986). The formula expressed in
terms of the relevant cell addresses and the
multiplication operator will also appear on thecontrol panel at the top of the worksheet.
As cell addresses in the worksheet are relative, the
formula just created for calculating the number ofrepeaters in grade 1 in 1986 can be copied to calculate
the numbers of repeaters in grade 1 in 1987-2000, aswell as in grades 2-6 for the whole forecast period.This COPY technique has been demonstrated in Unit 1.
Using the same technique, the formulae for computing the
number of enroltztents by grade, the number of dropoutsand tae number of new pupils admitted can be enteredinto the worksheet easily.
(b) Mixed Cell Addressing. The technique of mixed celladdressing has been used to create formulae forestimating the admission, repetition and dropout rates.Cell addresses in formula can be relative, absolute and
mixed. When absolute addressing is used, the celladdress, say C10, will be written as $C$10. No matter
where this formula is. copied to, the cell address
44
2i 6
remains unchanged. Mixed cell addressing is eitherkeeping the column (represented by $C10) or the rowaddress (represented by C$10) constant. The "$" sign
may be entered into the formula by using the editing key
[F2]. Alternatively, before the formula has beencompleted, the cell reference can be transformed intoabsolute form using the function key [F4]. Pressing
[F4] once will change from relative to absoluteaddressing. Pressing [F4] again will give a mixed celladdressing with the row address becoming "absolute."Pressing [F4] once more will give a mixed celladdressing with the column becoming "absolute." "Mixedcell" addressing is required because the grade 1 grossenrollment ratios, the rates of repetition and dropoutsare based on the target rates set for a specified target
year. With "mixed cell" addressing, copying of formulaefor these rates would not change the cell addresses forthe target rates.
(c) @MAX Function. This function is used in projecting thegrade 1 gross enrollment ratio to ensure that the ratiowould not fall below unity. The function @MAX (list)returns the maximum value in the list.
10.4.3 It is suggested that the participants should explorethe worksheet and examine the formulae displayed on thecontrol panel at the top of the worksheet, in order to have abetter understanding of how the worksheet is built up.
10.4.4 The results of the projection are summarized the farright end of the worksheet. To summarize the resultsprovides a convenient means of making use of the results ofthe projection of further analys.J.s. The results are also
reproduced below:
45 ,4

Figure XXII: Results of the Enrollment Projection
Year
Projected Enrollment for Grade I-IV
I II III IV
1984 5,382,689 4,940,215 4,612,349 4,209,870
1985 5,352,200 4,825,020 4,584,675 4,234,225
1986 5,307,790 4,816,807 4,500,704 4,229,643
1987 5,259,661 4,810,745 4,500,186 4,354,000
1988 5,251,602 4,801,106 4,509,814 4,186,051
1989 5,243,259 4,822,957 4,517,194 4,211,734
1990 5,215,428 4,847,790 4,551,393 4,236,380
1991 5,181,219 4,856,189 4,590,593 4,284,617
1992 5,137,462 4,856,813 4,615,809 4,338,975
1993 5,168,245 4,847,764 4,632,926 4,381,332
1994 5,198,579 4,901,790 4,640,666 4,415,736
1995 5,155,372 4,961,156 4,704,227 4,441,173
1996 5,105,489 4,955,595 4,776,671 4,517,286
1997 5,055,690 4,938,040 4,790,668 4,604,434
1998 5,006,595 '4,918,828 4,789,923 4,638,118
1999 4,958,243 4,899,331 4,786,580 4,655,691
2000 4,910,620 4,879,703 4,782,597 4,670,05'2
46

11. Learning Activities
11.1 Microcomputer Tutorial Session
11.1.1 The purpose of this tutorial session is to provide anopportunity for the participants to see how the worksheet canbe used to answer the "what if" question in planning.Figures in the worksheet PUPROJ have been protected againstmodifications except for the following parameters:
(a) The projection population aged 7 years for the entire
forecast perioe;
(b) The target grade 1 gross enrollment ratio and the targetyear for the target ratio to be reached;
(c) The target rates of repetition by grade and the targetyear for these rates to be attained;
(d) The target rates of dropout by grade and the target yearfor which these rates cowl. be achieved;
(e) The actual enrollment, rates of repetition and dropoutsand the grade 1 gross enrollment rate for the year 1984;
11.1.2 The global protection and the unprotection forspecified range of cells can be set by the followingcommands:
(a) Setting global protection(1) [/] to bring up the LOTUS menu;(2) [W] to open the worksheet menu;(3) [G] to select the global menu;(4) [P] to select the protection facility and the
[E]nable command;
(b) Unprotect range of cells(1) The cell addresses for the parameters listed in
paragraph 11.1.1 above are unprotected by usingthe command [/] to bring up the LOTUS menu;
(2) [R] to select the range menu;
(3) [U] to activate the unprotect facility. Byspecifying the range of cells to be unprotected,followed by [RETURN], this allows values in thecells specified to be modified.
11.1.3 The participants could assign different values to theparameters listed in paragraph 11.1.1 above. By pressing[F9], a new tet of projection different from the one shown inFigure XXII above can be obtained from the worksheet. The
participants are encouraged to practice by assigningdifferent sets of values to these parameters.
47
12. Post-assessment
12.1 The participants are asked to develop, by their own, a
projection model using the grade retention model for primary
schools with the following statistical information:
(a) The estimated number of population aged 7 for the years 1984-
2000 which is given in the worksheet PUPROJ;
(b) The estimated number of population, aged 8 for the years 1984-
2000 which is assumed to be the same as the number of
children aged 7 years;
(c) The age-specific enrollment ratio for grade 1 in 1984 and the
target year of 2000:
AS! 7 Age 8
1984 (actual) 68% 20%
2000 (target) 90% 10%
It is assumed that pupils admitted into grade 1 are all within the
age range from 7 to 8 years;
(d) The target and actual retention rates by grades:
Gr. 1-2 2-3 3-4 4-5 5-6
1984 (actual) 88% 90% 95% 85% 70%
2000 (target) 100% 100% 100% 95% 90%
(e) The actual enrollment in 1984 is the same as that given in
the worksheet PUPROJ.
The participants will have to construct the worksheet based on the
above statistical information.
IV. Unit 3: Projection of Teacher and Other Resources Requirements
An Integrated Approach
13. Performance Objectives
13.1 The basic techniques used in constructing a fairly completed
projection have been discussed in Unit 2. In this unit, the
participants will be introduced to the techniques of linking
different projections in a single worksheet. On completion of this
unit, the participants should be able to:
48

(a) Appreciate the interrelationship between the enrollment .
projection and other resources requirements like the teacher
requirement projection and the projection of additional
schools required;
ib) Combine different LOTUS spreadsheets into an integratedprojection model, encompassing enrollment projection andother resources requirement projection models.
14. Instructional Activities
14.1 This is a fairly short unit, as the basic techniques in using
LOTUS 123 to develop projection models have already been discussed
in Unit 2 above. Furthermore, the nrojection of teacherrequirements and other resources laplications are relatively less
complicated than the enrollment projection models. In this unit,
the instructors should emphasize the need to link these differentprojections together in planning, so that an overall implication of
a given education policy can be thoroughly examined.
14.2 Teacher Projection
14.2.1 Teacher Projection is compared with other forecastsof manpower requirement, relatively easy to undertake. This
is because of the number of teachers required for a givenenrollment size is largely determined by educational planners
and policymakers. Furthermore, substitutability is not
easy as many countries enforce a certain standard on teacher
recruitment. Nevertheless, it is not uncommon to findcountries having to cope with the problems of shortages orsurpluses in the supply of teachers.
14.2.2 There are two main parameters in forecasting teacher
requirements:
(a) The teacher/class ratio or the pupil/teacher ratio;
(b) The teacher wastage rate.
If it is required to project the number of teacher requiredby qualifications, then additional information is required onthe qualification structure of the teacher force.
14.3. Projection of Other Resources Requirements
14.3.1 There is a host of other resources requirements thathave to be taken into account in preparing an education plan.These include, for instance, the following:
49 - ,
a 1

(a) The additional number of classrooms and the number of
schools required;
(b) The number of textbooks required and the number of
library books required;
(c) The TV sets required for educational television;
(d) The number of school social workers/counsellorsrequired.
Usually, these requirements can be related directly to the
enrollment size.
14.3.2 Finally, it goes without saying that it is necessaryto estimate as well the total costs required, which may be
broken down into teacher salary costs, and other recurrentcosts as well as nonrecurrent costs.
15. User Manual
15.1 Two worksheets on teacher requirement projection and
requirement for an additional number of classes have been developed
for this unit. They are stored in the file TEPROJ and CLPROJ
respectively. The techniques used in developing these twoworksheets have already been discussed in Units 1 and 2 above. A
third worksheet which combines the three worksheets PUPROJ, TEPROJ
and CLPROJ has also been created. This worksheet represents an
integrated approach to forecasting. The worksheet is stored in the
file named PLAN.
15.2 TEPROJ Worksheet for Teacher Requirements Projection
15.2.1 It is not proposed to go through the steps involved
in developing this worksheet. The participants should by now
be able to develop a worksheet like TEPROJ. Therefore, only
the main feature of the worksheet will be discussed here.
The worksheet can be divided into two parts:
(a) The first part is the use of the pupil/teacher ratio toestimate the total number of teachers, given a forecast
of enrollment. The relevant part of the worksheet is
shown below:
50t") ^40 rw
O

Figure XXIII: Estimating Total Number of Teachers Required
Teacher Requirement Projection Model II.Projected Teacher Requirement
YearTotalEnrollment
Pupil/teacherratio
Number ofTeachersRequired
1984 26,567,688 32.00 830,240
1985 26,612.007 31.94 833,253
1986 26,712,188 31.88 838,029
1987 26,847,231 31.81 843,921
1988 26,647,526 31.75 839,292
1989 26,681,691 31.69 842,026
1990 26,792,066 31.63 847,180
1991 26,925,462 31.56 853,084
1992 27,056,442 31.50 858,935
1993 27,259,670 31.44 867,107
1994 27,500,230 31.38 876,501
1995 27,701,963 31.31 884,693
1996 27,875,371 31.25 892,012
1997 28,028,508 31.19 898,710
1998 28,170,038 31.13 905,061
1999 28,256,614 31.06 909,670
2000 28,275,353 31.00 912,108
Thus the total number of teachers required is obtainedby sinply dividing the total enrollment by the pupil/teacher ratio.

(b) The second part of the worksheet is the estimation of
the number of new teachers required to cope with the
increase in the number of teachers and to replace
wastage. The relevant part of the worksheet is as
follows:
Figure XXIV: Prolecting Additional No. of Teachers
Additional Number of New Teachers Requiredfor Replacement for Increased Demand Total
1985 58,117 3,012 61,129
1986 58,328 4,777 63,104
1987 58,662 5,891 64,553
1988 59,074 (4,629) 54,446
1989 58,750 2,734 61,484
1990 58,942 5,154 64,096
1991 59,303 5,904 65,207
1992 59,716 5,851 65,567
1993 60,125 8,172 68,298
1994 60,697 9,395 70,092
1995 61,355 8,192 69,547
1996 61,929 7,318 69,247
1997 62,441 6,698 69,139
1998 62,910 6,352 69,261
1999 63,354 4,608 67,962
2000 63,677 2,439 66,115
The number of new teachers required to meet replacement
demand can be estimated by applying the assumed waste rate
to the number of teachers in the preceding year.
52

15.3 CLPROJ Worksheet for Estimated Number of Classes
15.3.1 The CLPROJ is developed to illustrate how the resultsof the enrollment projection can be used to estimate thenumber of additional classes required. The worksheet is
reproduced below:
Figure XXV: CLPROJ Worksheet
II. Projected Number of Operating Classes Required
Year I II III IV
Assumptions on class size:45.0 44.0 43.0 43.0
1984 119,615 112,278 107,264 97,904
1985 118,938 109,660 106,620 98,470
1986 117,951 109,473 104,668 98,364
1987 116,881 109,335 104,655 101,256
1988 116,702 109,116 104,879 97,350
1989 116,517 109,613 105,051 57,947
1990 115,898 110,177 105,846 98,520
1991 115,138 110,368 106,758 99,642
1992 114,166 110,382 107,344 100,906
1993 114,850 110,176 107,742 101,891
1994 115,524 111,404 107,922 102,692
1995 114,564 112,754 109,401 103,283
1996 113,455 112,627 111,085 105,053
1997 112,349 112,228 111,411 1C7,080
1998 111,258 111,792 111,394 107,863
1999 110,183 111,348 111,316 108,272
2000 109,125 110,902 111,223 108,606

It may be noted that the only parameters used in the previous
projection is the average class aize by grade.
15.4 Integrated Projection Model
15.4.1 An integrated projection model has been developed by
combining the PUPROJ, TEPROJ, and CLPROJ worksheets. Anadditional feature has also been included in the integrated
model. This is the estimation of the number of new schools
required, baseu on an assumption of the average number of
operating classes per new school. The relevant worksheet, is
shown below:
54

Figure XXVI: Projecting School Requirement in PLAN
(IV) Projected Number of Schools Required
Average No. of classes/new school - 12
Total Num.of
classes
Additionalno. ofclassesrequired
Additionalno. ofschoolsrequired
No. of Newschoolsrequiredeach year
609,679(cumulative) (cumulative)
610,802 1,123 94 94
613,182 3,503. 292 198
616,375 6,697 558 266
611,744 2,066 172 (386)
612,536 2,857 238 66
615,118 5,440 453 215
618,252 8,573 714 261
621,343 11,664 972 258
626,042 16,363 1,364 392
631,576 21,898 1,825 461
636,281 26,602 2,217 392
640,368 30,690 2,557 341
(43,990 34,312 2,859 302
647,343 37,664 3,139 279
649,416 39,738 3,311 173
649,912 40,233 3,353 41

a
16. Learning Activities
16.1 Microcomputer Tutorial Session
16.1.1 The participants are asked to change the following
policy variables and press [F9] to see how the projection
will be changed:
(a) The target grade 1 gross enrollment ratio;
(b) The target repetition rates;
(c) The target dropout rates;
(d) The target pupil/teacher ratio;
(e) The average class size;
(f) The average number of classes per new school.
17. Post-assessment
17.1 The participants will be asked to:
(a) Develop a worksheet for teacher projection, using the
teacher/class ratio instead of the pupil/teacher ratio for
projecting teacher requirement. All other variables will be
the same as the PLAN worksheet except that teacher/class
ratio for the forecast period is assumed to remain constant
at 1:4.
(b) Integrate this worksheet with the PUPROJ and CLPROJ
worksheets to produce an integrated forecasting model.
Related Documents


![DOCUMENT RESUME ED 357 204 CE 063 603 TITLE ...DOCUMENT RESUME ED 357 204 CE 063 603 TITLE VoCATS User Guide. [Draft.] INSTITUTION North Carolina State Dept. of Public Instruction,](https://static.cupdf.com/doc/110x72/5e2cfec776f9ab3b8a6d195b/document-resume-ed-357-204-ce-063-603-title-document-resume-ed-357-204-ce-063.jpg)


