DOCUMENT RESUME ED 142 321 PS 009 440 AUTHOR Hall, Arden; Weiner, Samuel TITLE The Supply of Day Care Services in Denver and Seattle. INSTITUTION Stanford Research Inst., Menlo Park, Calif. Center for the Study of Welfare Policy. SPONS AGENCY Department of Health, Education, and Welfare, 1, Washington, D.C. REPORT NO SRI-CSWP-RM-33 PUB DATE Jun 77 CONTRACT SRS-70-53; SRS-71-18 NOTE 177p. EDPS PRICE MF-$0.83 HC-$10.03 Plus Postage. DESCRIPTORS Costs; *Day Care Services; *Early Childhood Education; Educational Supply; *Family Day Care; Income; *Program Descriptions IDENTIFIERS *Colorado (Denver) ; *Washington (Seattle) ABSTRACT This study presents an analysis of the day care industry in Seattle, Washington and Denver, Colorado. The analysis includes a description of the day care structure as it existed in mid-1974, as well as an estimate and breakdown of cost functions in order to determine the custodial component of day care services. Four separate sectors of the day care industry are recognized: in-home providers, unlicensed family day care home operators, licensed family day care home providers, and child care centers. Chapter titles include: Characteristics of the Day Care Industry, of the Providers, and of the Day Care Services; Supply Constraints; Income and Costs. (Author/SB) *********************************************************************** Documents acquired by ERIC include many informal unpublished * materials not available from other sources. ERIC makes every effort * .* to obtain the.best copy available. Nevertheless, items of marginal * * reproducibility are often encountered and this affects the quality * * of the microfiche and hardcopy reproductions ERIC makes available * * via the ERIC Document Reproduction Service (EDRS). EDRS is not * responsible for the, quality of the original document. Reproductions * * supplied by EDRS are the best that can be made from the original. ***********************************************************************

Welcome message from author
This document is posted to help you gain knowledge. Please leave a comment to let me know what you think about it! Share it to your friends and learn new things together.
Transcript

DOCUMENT RESUME
ED 142 321 PS 009 440
AUTHOR Hall, Arden; Weiner, SamuelTITLE The Supply of Day Care Services in Denver and
Seattle.INSTITUTION Stanford Research Inst., Menlo Park, Calif. Center
for the Study of Welfare Policy.SPONS AGENCY Department of Health, Education, and Welfare,
1, Washington, D.C.REPORT NO SRI-CSWP-RM-33PUB DATE Jun 77CONTRACT SRS-70-53; SRS-71-18NOTE 177p.
EDPS PRICE MF-$0.83 HC-$10.03 Plus Postage.DESCRIPTORS Costs; *Day Care Services; *Early Childhood
Education; Educational Supply; *Family Day Care;Income; *Program Descriptions
IDENTIFIERS *Colorado (Denver) ; *Washington (Seattle)
ABSTRACTThis study presents an analysis of the day care
industry in Seattle, Washington and Denver, Colorado. The analysisincludes a description of the day care structure as it existed inmid-1974, as well as an estimate and breakdown of cost functions inorder to determine the custodial component of day care services. Fourseparate sectors of the day care industry are recognized: in-homeproviders, unlicensed family day care home operators, licensed familyday care home providers, and child care centers. Chapter titlesinclude: Characteristics of the Day Care Industry, of the Providers,and of the Day Care Services; Supply Constraints; Income and Costs.(Author/SB)
***********************************************************************Documents acquired by ERIC include many informal unpublished
* materials not available from other sources. ERIC makes every effort *.* to obtain the.best copy available. Nevertheless, items of marginal *
* reproducibility are often encountered and this affects the quality *
* of the microfiche and hardcopy reproductions ERIC makes available *
* via the ERIC Document Reproduction Service (EDRS). EDRS is not* responsible for the, quality of the original document. Reproductions ** supplied by EDRS are the best that can be made from the original.***********************************************************************

'Center for the Studyof Welfare Policy
(\IResearch Memorandum 33
U.S. DEPARTMENT OF HEALTH.EDUCATION WELFARENATIONAL INSTITUTE OF
EDUCATION
THIS DOCUMENT HAS BEEN REPRO-DUCED EXACTLY AS RECEIVED FROMTHE PERSON OR ORGANIZATION ORIGIN.ATONIC, IT POINTS OF VIEW OR OPINIONSSTATED DO NOT NECESSARILY REPRESENT OFFICIAL NATIONAL INSTITUTE DFEDUCATION POSITION OR POLICY
THE SUPPLY OF DAY CARE SERVICESIN DENVER AND SEATTLE
By:
ARDEN HALLSAMUEL WEINER
SRI Project URD-8750/1190
Project Leader: R. G. Spiegelman
The research reported herein was performed pursuant to contracts with the states etWashington and Colorado. prime contractors tor the Department of Health. Education, andWelfare under contract numbers SRS-70-53 and SRS-71-18 respectively. The opinionsexpressed in the paper are those of the authors and should not be construed as representingthe opinions or policies of the states of Washington or Colorado or any agency of the UnitedStates Government.
June 1977

ACKNOWLEDGMENTS
The aithors wish to express their gratitude to the following people
who contriLuted to this report: Gail Inderfurth, Lols Blanchard, Janey
Elliott, and Tony Muller of Mathematica Policy Research, who helped pre-
pare the interviews and collect data; Christine Decker and Barbara
Ferber, who monitored the surveY operation; and David Grembowski, and
Jarvis Rich, who provided invaluable computational assistance. Sonia
Conly and Lucy Conboy of DHEW ably reviewed an earlier draft, and
nobert G. Spiegelman's constant review at all stages was a valuable
input. Our appreciation is also offered to many state and local repre-
sentatives for their help in selecting day care providers for this
study, and also for their help in structuring the interview questionnaire.
iii

CONTENTS
ACKNOWLEDGMENTS iii
LIST OF TABLES vii
SUMMARY AND CONCLUSIONS SC-1
Summary SC-1Characteristics of the Day Care Industry SC-1Supply Constraints SC-4Revenues and Fees SC-7Costs SC-10Conclusions SC-13Implications for Public Policy SC-16Considerations Regarding Subsidies SC-19
I INTRODUCTION I-1
Components of the Day Care Industry 1-2Aspects of the Economics of Day Care. 1-5
II CHARACTERISTICS OF THE DAY CARE INDUSTRY, OF THEPROVIDERS, AND OF THE DAY CARE SERVICES II-1
Information from Other User Surveys II-1Licensing Considerations 11-4Provider Characteristics 11-6Considerations of Quality II-11
III SUPPLY CONSTRAINTS III-1
Barriers to Entry III-1Capacity Considerations 111-5Sick-Child Care 111-9Information III-11
IV INCOME IV-1
Subsidies IV-1Revenue and Fees IV-5Importance of Earnings in Family Income IV-15
V COSTS V-1
Descriptive Review of Costs V-1Cost Functions--An Attempt to Isolate the Costof Custodial Care V-I0

Specifications of VariaLles V-14
Cost Equations and the Estimatlon of Custodial Carefor In-Home and Family Day Care Home Providers . . . . V-14
Cost Equations and the Estimation of Custodial Care
for Centers V-19
APPENDICES
A DAY CARE SURVEY A-1
B CLASSIFICATION OF HOURS OF CARE B-1
C TESTS OF RANDOMNESS OF RETURNED STAFFQUESTIONNAIRES C-1
fl DAY CARE COSTS: FitEVIOUS STUDIES D-1
E CAPITAL COSTS..IN DAY CARE Hif:ES E-1
F SUPPLEMENTARY INFORMATION FOR THE DERIVATION OFFUNCTIONS USED IN THE ESTIMATION OF THE COSTOF CUSTODIAL CARF F-1
REFERENCES R-1
v i

TABLES
1 Percent of Day Care Provided Within the ThreeMain Sectors 11-3
2 Age and Race of Day Care Providers, and Race ofChildren 11-7
3 Selected Characteristics of Day Care Providers 11-8
4 Children Related to Child Care Provider by Race/Ethnic Class of Provider 11-12
5 Child/Staff Ratios 11-14
6 Education of Provider 11-16
7 Percent of Child Care.Time Devoted to Various Typesof Child Care 11-19
8 Health Care Services Provided to Children in DayCare Centers 11-21
9 Percent of Capacity Utilized 111-7
10 Age of Children Using Day Care and Number ofChildren Cared For III-10
11 Care Provided for Sick Child 111-12
12 Subsidization of Day Care Users IV-4
13 Percent of Children in Family Day Care Homes WhoseFees Are Fully or Partially Subsidized, by Race/Ethnic Group of Child IV-5
14 Day Care Center Subsidies IV-6
15 Cross Tabulation Between Revenue Per Child andPercent of Children Subsidized, Centers IV-7
16 Gross Monthly Earnings IV-9
17 Fees per Child Hour of Care IV-10
18 Parameter Estimates for Gross Quarterly Earnings inDenver (Unlicensed FDCH) IV-13
19 Parameter Estimates for Gross Quarterly Earnings inSeattle and Denver (Licensed .FDCH) IV-14
20 Predicted Gross Monthly Earninv IV-15
21 Percent of Providers' Income Represented by ChildCare Earnings 0 IV-16
vii

23
94
Mean Costs and Revenue for Licensed FDCH Providers
Relationships Between Valiable Cost, Children
Enrolled, and Total Revenue
V-3
V-5
95 Effect of Enforcement of the Minimum Wage on
Center Wage Bill Y-7
96 Current Market Value of Equipment and Vehicles V-9
97 Combined Regression Separated by City ond Provider
Type V-15
98 Values of Parameters for Custodial Care V-I6
29 Reduced City/Provider Type Regressions V-17
30 Cost per Child for Custodial Care V-18
31 Day Care Center Regeession V-20
32 Values of Parameters for Custodial Care V-92
33 Cost of Custodial Care in Day Care Centers V-93
D-1 Payment for Teachers with a Bachelor's Degree D-4
D-2 Child Care Costs for Centers D-6
E-1 Control Variables E-4
E-2 Regression Coefficients for Seattle E-5
E-3 Regression Coefficients for Denver E-6
E-4 Means of Independent Variables E-7
E-5 Predicted Differences E-7
E-6 Test Results, Seattle and Denver E-8'
F-1 Combined in-Home and Family Day Care HomeRegression Dependent Variable: CR F-8
viii

SUMMARY AND CONCLUSIONS
Summary
The purpose of this study is to present an analysis of the day care
industry in Seattle and in Denver. This analysis includes a description
of the day care structure as it existed in mid-1974, as well as an
estimate and breakdown of cost functions in order to determine the
custodial component of day care services.
Four separate sectors of the day care industry are recognized in
this study: in-home (I-H) providers, unlicensed family day care home
(FDCH) operators, licensed FDCH operators, and child care centers. For
some purposes, these four sectors are grouped into an informal and a
formai sector. The informal part consists of I-H and unlicensed FDCH
operators, while the formal segment consists of licensed FDCH and center
providers. Moreover, the center sector is furtiv.Ir broken down into three
different types: nonprofit private, nonprofit pub'ic, and for-profit
private centers.
Characteristics of the Day Care Industry
Day Care Providers
Day care providers in the informal sectors were somewhat younger
than those in the formal sectors. However, in each sector we found that
the majority of the providers, regardless of.age, had some previous full
time job other than child care; within the formal sector, almost all
providers had some previous full time work experience. There are indica-
tions that: some of the providers, expeciaily those in the informal sec-
tors, may be temporarily out of the regular labor force, primarily due
to the desire to stay home to care for their own children or to acquire
an education. Neyertheless, the majorj.Ly of day care ,Iro..riders are
probably part of the regular labor force.
SC-1

The implication of this finding is that labor supply would be
uniikely to constrain an expansion of day care service, unless providers
are required to come from some special group, such as housewives with
experience in elementary education. In that case, an expansion of the
supply of day care might be limited by a shortage of that type of labor.
However, the fairly low average level of educational achievement in most
sectors makes that assumption unlikely, at least as it concerns the
majority of providers.
We also found that the proportion of Black and Chicano provide:'s
in the informal sector in Denver was much greater than in the formal
sector. The same finding is true in Seattle, except for I-H providers,
where the proportion from minority groups is approximately the same as
in centers. Moreover, the racial/ethnic compobition of day care users
in both cities was apprOximately the same as that of providers. How-
ever, within the center sector we found that a large percent of the
public nonprofit staff and children were from minority groups, while
only a small proportion of users and staff in the private for-profit
centers were Black or_Chicanos. Therefore, except for the profit-
oriented centers, we found that there was no apparent restriction on
entry into the field of day care by minority group members.
Providers and users are more likely to be related in Denver than
in Seattle. We obtained information on the relationship between users
and providers of day care for all but the center sector. For the
licensed FDCHs, about one-fourth of the children using day care servi'...es
were related to providers of those services. However, in the informal
sectors, there was a much larger percentage of providers in Denver who
were related to the children for whom they provided care than in
Seattle: almost two-thirds of the unlicensed FDCH operators in Denver
were related to the children using their services, whereas in Seattle
the proportion was only one-third. Furthermore, we found that over
four-fifths of the Chicano unlicensed FDCH operators in Denver provided
services for related children. It appears that the more liberal sub-
sidy policy in Denver, whereby related unlicensed providers can more
SC:2

easily obtain payment for providing day care services, has resulted in
a far greater use of relatives for unlicensed day car.
Considerations of Quality in Day Care
From the point of view of users, perhaps the important con-
sideration concerning day care services is the 14,Iiity of that care.
While no universally accepted standard for determ.LI.ing quality exists,
when comparisons must be made, the ratio of chadren to child care staff
is generally used. The view is that wher ,?. there are fewer children per
availa7le staff, there is a higher quality of care being provided.
(Research being undertaken by the Office of Child Development may soon
shed light on this controversial issue.) We we-re able to obtain data to
estimate the child/staff ratios, and we also obtained data for an alter-
native measure of quality, the self-reported ratio of educational to
custodial activities.
As regards the child/staff ratio, we found that the informal sec-
tors in both cities have lower ratios--that is, higher presumed quality
of care--than was found in the formal sector. However, characteristics
of the caretaker are also of importance in judging how the available
staff affects quality. We found that the educational achievement, which
is presumed be positively related to the quality of care, of informal
sector providers i3 generally lower than was found for the formal sec-
tor staff. That is, although intrasector comparisons of quality on the
basis of the child/staff ratio are possible, inter-3ector comparisons
are not very meaningful. It is difficult to judge, therefore, on the
basis of the child/staff ratios, whether the quality of care was higher
or lower among the various sectors of the day care industry. Within
each sector, assuming that the child/staff ratio is an acceptable cri-
terion of quality, those providers with fewer children are offering
better care. In the center sector in particular, the public centers
were providing better care than the other center components in both
cities, although the difference in the child/staff ratios between the
public and private nonprofit centers in Denver was negligible.
SC-3

The other measure of quality for which we obtained data (self-
reported by the provider) was the percent of total day care time devoted
by prOviders to educational-developmental activities, relative to the
time spent, on purely custodia) rvices.* In Seattle, the informal
sector providers said the': !.-1;it 1C% of their time spent caring for
children for pay was dev-: t (Au!.ational-developmental care. The
licensed FDCH providers n Seattli-, along with all sectors other than
centers in Denver, saW that about 20% of their time was devoted to the
higher quality of care. In centers, about 30% of the time was spent on
educational-developmental care, with public center staff claiming that
up to 45% of their time was devoted to the higher quality of care.
Although we have presented our findings nn some variables thought
to influence the quality of care, we hesitate to draw firm conclusions
from the results. The definition and measurement of the quality of
day care have not been formulated objectively enough by educators to
allow economists to make judgments about the adequacy of existing day
care.
Supply Constraints
Our study of the supply Of day care focused on two major issues.
First, we asked whether there was excess supply or demand for day care
services, i.e., whether or not the day care market was in equilibrium;
and second, we asked what could be said with regard to the price elasticity
of supply--that is, could we determine the relationship existing between
changes in supply and changes in the price of day care services?
Although equilibrium conditions are difficult to determine from a
static view of the market at one point in time, a review of the capacity
*As a measure of quality of care this ratio is only a leasonable approx-
imation for at least two reasons: first, the questionnaire allowed
respondents considerable freedom in categorizing their activities,
which must have lead to some inconsisencies in the data; aecond, there
is some evidence that activities classed as educacionaldevelopmental
can be harmful to the child. (See, e.g., William J. Meyer [13].)
SC-4

utilization of providers and of waiting lists for users in the day care
market can provide some information about the state of the market at
the tiMe of the survey. Examination of that data leads us to believe
that the markets for day care in Seattle and Denver were aporoximately
in equilibrium at the time the interview was conducted. Ho'vever,
there appears to be substantial friction in the clearing of the market.
For example, within the center :.ector we found that almost 60% of all
centers in both cities had waiting lists, with almost three-fourths of
the public nonprofit centers stating that they had a waiting list; and
at the same time we found that the average level of capacity util:zation
for Seattle centers was 85%, with the public centers utilizing only 78%
of their capacity. In Denver the utilization rate was 95% for both the
total as well as for public centers.
That unused day care services and waiting lists exist simultaneously
may indicate some frictions in the day care market; which may have a
variety of causes. Day care service is not easily.standardized, so
demanders must search for a supplier who fits their needs. Differences
in the type of care, as well as in the hours of available care, contribute
to the time needed to find desired day care. Special needs may also make
a match between child and provider more difficult. We found that care was
more difficult to find for very young children and for children with
any but the most routine illness. It is a commonly heard complaint
that not enough day care caliacity is available for toddlers--children
under the age of two. However, we found that a substantial proportion
of the children cared for in licensed and unlicensed FDCHs in both
cities, as well as in public centers in Seattle, are toddlers. If day
care users are trying to get toddlers into the other segment of the day
care market, the complaint may have some validity, as only a small per-
centage of the children cared for in these other segments are less than
two years of age. Although a large percentage of the informal sector
providers will take care of children with a minor illness (e.g., a cold),
the percentage drops sharply for licensed FDCH providers; and the per-
centage of centers that offer such care is negligible. Yet another pos-
sible reason for friction in the day care market is that information
SC-5
'

about available suppliers was not widely used. Although both cities
have free referral services, we found that only 10% to 25% of all
children were enrolled through the use of these services. Most of the
other users learn of the available service through friends, neighbors,
or relatives. These, then, are some of the causes for the simultaneous
existence of underutilization of capacity and excess demand in the market
as a whole.
Information on the reaction of supply to changing prices was more
difficult to obtain than that about the current state of the market.
The available information related to possible constraints on supply
rather than to the actual change in aggregate supply that might result
from an increase in price. As has already been mentioned, the supply of
labor seems unlikely to be an absolute constraint on the supply of day
care. Other inputs, such as buildings or equipment, are also not likely
to constrain the expansion of day care.
However, there are barriers to entry, in the form of licensing and
zoning requirements, for providers in the formal sector of the day care
industry, which could potentially constrain the supply of day care. The
licensing procedure, although it takes some time, does not seem to be a
major barrier: the majority of providers waited less than two months to
obtain their licenses and few family day care homes spent more than $100
complying with licensing requirements. However, there is some indication
that the cost of compliance, especially as it concerns the new Title XX
child/staff standards, may present a significant financial burden for the
private for-profit centers,* if enforced. Zoning restrictions may also
present something of a barrier to entry for centers. Approximately one-
third of the centers in both cities and a smaller proportion of family
day care homes had to obtain zoning variances in order to provide day
care services. These licensing and zoning requirements did contribute
*See Samuel Weiner, "The Cost of Compliance to Federal Day Care Stand-
ards in Seattle and Denver," SRI Research Memo,andum, June 1977.
SC-6

noticeably to the cost of entry into the day care market. However,
these are costs under control of the local authorities. Regulations
could be simplified and procedures streamlined if the decision were made
to increase the availabi_Ity of day care. For example, in Denver there
are a number of different agencies involved in the licensing process,
including health, sanitation, zoning. building, and fire. These some-
what overlapping jurisdictions delay the licensing procedure and most
certainly impose an additional, if only psychic, ccst to the potential
entrant into the day care market.
Revenues and Fees
This deals with the financial environment of day care providers.
The issues dealt with in that area are primarily concerned with sub-
sidies, fees, and revenues.
Concerning subsidies, we found that in Seattle very few of the
informal sector children were fully subsidized, somewhat less than 10%;
in Denver, between one-fifth and one-third of the users of informal care
were fully subsidized. (We found that Denver was more liberal than
Seattle in allowing subsidy payments for I-H and unlicensed FDCH vendors.
In general there appeared to be less governmental interference or pres-
sure on the day care industry in Denver.) In the Seattle centers, about
one-fourth of the enrolled children were fully subsidized; howel;er, th
public component of the center sector showed a much higher percentage
of their children being subsidized, almost 75%. In thz. Denver centers,
a very small percentage--less than 5% overall--of the er,:slled children
were fully subsidized. Again, the public centers, with almost 45% of
their children fully subsidized, were an exception.
An important finding for centers was that the larger the percentage
of children being subsidized, the greater the gross revenue per child.
Because of the nature of the data collected, a similar comparison for
the other sectors was not undertaken. For centers, however, this finding
SC-7
indicates the possibility of differential pricing according to subsidy
status.* The data also suggest the possibility that revenue from sub-
sidized children is a steadier and more reliable source of income.
Moreover, the payment for subsidized children relative to nonsubsidized
users is more likely to be made even if the child is absent for a short
period. Thii, could also lead to higher average revenue from subsidized
children.
Concerning fees, we found that on the average the fees per child
range betweea about 45c and 60C/hr in all sectors, except for the private
nonprofit centers in Denver, where the average fee charged falls to
33C/hr. However, we also found a very large variance in the average
hourly fees paid. Although the variance was large for all sectors, it
was especially pronounced in some: in Seattle, for example, the maximum
fees were more than three times greater than the average for I-H pro-
viders and for every type of center provider, whereas FDCH operators
showed a much smaller difference between the average and the maximum
fees. In Denver, on the other hand, the variation was very large for
all sectors, with the exception of the public and prilre nonprofit
centers.
Revenue consists of the fees and subsidy payments received. Gross
monthly revenue per child is fairly low for the informal providers in
both cities, being about $20 to $30; it rises to $42/child in both cities
for the licensed FDCH operators; and it again doubius for centers, with
Denver showing a substantially higher average gross monthly earnings
than Seattle. In both cities the public centers had the highest average
gross monthly revenue. The variation between sectors was far less marked
with regard to the maximum gross monthly revenue per child. We f6und,
*One reviewer suggested that such a positive re1,7,tionship could be a
reflection of higher wage bills at public centers, which have a much
larger proportion of their users subsidized. This seems to he as
reasonable a hypothesis as the one suggested above.
SC-8
;-)

overall, that approximately 90% of all sector providers had gross monthly
revenue per child that was less than $100, with the exception of the
public centers. In that component of the center sector, less than one-
fourth of the providers grossed under $100/child/month.
We also wanted to determine whether earnings could be predicted
from data collected in the survey. Furthermore, we were interested in
the racial/ethnic earnings differences that might be found in those
predictions. In order to accomplish rnit-, re&res,ed gross earnings
per month per.provider against seventeen independent variables to obtain
an estimated regression equation for predicting earnings. This was done
for unlicensed FDCHs in Denver and licensed FDCHs in both Seattle and
Denver.* The predicted values using the mean values of the independent
variables in the estimated regressions are somewhat lower than earnings
obtained directly from the survey data; however, the predicted values
are all within one standard error of the survey data earnings. We also
found that the predicted earntngs for Blacks in Seattle are somewhat
higher than for Whites, but predicted earnings for Blacks in Denver are
lower than similar values for Whites or Chicanos for both licensed and
unlicensed FDCH operators. This result is difficult to explain but
is consistent with the effect of race in the estimated cost functions,
as reported in Part V of this study.
Finally,,we also have data supporting the view that day care earn-
ings for I-H as well as licensed and unlicensed FDCH operators are
generally a second source of family income. For those groups, in both
cities, the majority said their day care earnings were their only source
of personal incomes; however, only a very small proportion said that
those earnings contributed at least half of their total family income.
It appears that most of those day care providers are women who are
clasrified as secondary workers but are part of the regular labor force.
Others have preteenaged childrea, and in the absence of an earning
*The data for I-H and center providers in both cities, and unlicensedFDCH providers in Seattle, was not eitable for estimating a regressionmodel.
SC-9

potential within an environment where they can provide care for their
own children, they would be in the labor market on at best a part-time
basis, either !II hours per week or weeks worked per year.
Costs
Descripti,e
This 4', the last area for descriptive analysts that is covered by
data from our survey. Here we present a descriptive analysis of the
actual costs of the services provided by those interviewed. The same
data base is used to derive a cost relationship in which the custodial
component can be isolated. A summary of that analysis is presented below.
In 1968, the Children's Bureau of HEW presented costs for various
levels of day care.* If we adjust those costs for 1974 prices, and if
we assume that gross revenue equals costs, we can compare the Children's
Bureau standards with our survey data. The costs given by the Children's
Bureau for alternative levels of care,+ according to the quality of care
provided, were:
MinimumT level of care $136/child/month
Acceptable level of care $204/child/month
Desirable level of care $254/child/month
Our survey data shows that only public centers in either city met the
minimum standard.
*Although the Bureau was an advocacy agency their standards can be used
as a yardstick against which other costs can be measured.
tThese are costs estimated for centers; the equivaleat costs for family
day care homes are $156 (minimum), $222 (acceptable), and $260
(desirable).
hhis level of care approximates custodial care.
5Thi.s level of care would involve a high level of educational-
developmental care.
SC-10
1 '4

The costs that we estimated from our data were far lower than those
suggested above for a minimum level of care. The average monthly cost
for unlicensedTDCH operators, excluding imputed salaries, is about $35
in both Seattle and Denver. Comparable costs for licensed FDCH operators
are substantially higher in both cities, $83 in Denver and $112 in
Seattle.
We also derived costs for a level of care even lower than our sur-
vey data estimates. If our determination of an adequate level of cus-
todial care i6 comparable to the Children's Bureau's minimum level of
care, then costs for that type of.care in Seattle and Denver are far below
those suggested by the Bureau. On the other hand, the minimum level of
care proposed by HEW may include noncustodial elemen-E-g; or our measure
of adequate custodial care may be considered subminimal by the Children's
Bureau. If the Children's Bureau figures for minimum care are a true
reflection of adequate custodial care, we must conclude that the majority
of the Seattle and Denver day care operators do not provide it.
In the center sector, we were able to derive estimates for the
monthly variable cost* per child. In Seattle, it averaged $95 and in
Denver it averaged $107. Within the center seetor the ranges for monthly
variable cost per child were $61-157 in Seattle and $68-$160 in Denver.
In almost all cases,-the variable cost was between 85% and,100% of total
revenue.
The Cost of'Custodial Care
Before a rational decision can be made regarding government sub-
sidization of day care, cost and cost determinants must be known. Part
V provides this information for Seattle and Denver. Cost functions are
presented that provide estimates of the cost of custodial day care in
the two cities. While they provide the information required by the
*Including salaries and wages, insurance, rent, all utilities, janitorialservice, nondurable supplies, advertisement, food, and cost of leasedequipment.
SC-11
policy maker, they do not represent a complete description of cost
relationships in day care. The limitation on these results is that
variations in quality are not brought explicitly into the models.
Because of the diversity of opinion regarding the nature of quality
for day care services,* and also the necessity of taking some account of
differences in quality, we chose to estimate costs for one particular
level of care that we felt could be adequately defined: custodial care--
that is, day care that approximates the care provided by a familyt but
does not include services aimed specifically at child development.
Cost functions were estimated for in-home providers, family day
care homes, and day care centers in Seattle and Denver. We took advantage
of the similarities between cities and between some types of providers
to pool the data and obtain more accurate estimates. However, within
these pooled models, important variables were allowed to vary across
cities and provider types. Values of the explanatory variables were
chosen representing a custodial level of care, and these were substituted
into the estimated models to produce estimates of the cost of day care
for each city and provider type. For both cities it was found that care
bY in-home providers was least expensive and.that by family day care homes._
was most expensive. Estimated charges per child for a 40-hour week of
care ranged from $10.98 to $22.56 in Seattle and from $7.37 to $17.22
in Denver. For in-home providers, the charge was calculated per family
rather than per child. For a family of six children, the same number of
children per prcvider used for the estimates for the other types of day
*See discussion in Part II.
tWe do not wish to imply any value judgment on the quality of care pro-
vided by parents. However, such care could be described as care given by
persons not usually specially educated for the task. We borrow (with-
out necessarily endorsing) from educators the ideas that specific edu-
cation in child care is desirable in day care providers and that formal
developmental programs are beneficial additions to day care programs.
The reader should bear these assumptions in mind in assessing our
findings.
TSee Appendix F for a discus3ion of the variables used as indicators of
quality in the estimated cost functions.
SC-12
care, the minimum charge was $45.78 in Seattle and $29.58 in Denver (or
$7.63 per child in Seattle and $4.93 per child in Denver).
In producing these results, it was necessary to make some assump-
tions about the capital used in the production of day care services in
family day care homes. Any capital used by in-home providers presumably
belongs to the parents of the child.and so is not an element of cost;
on the other hand, for centers, capital could be brought explicitly into
the cost relationship. But FDCHs are homes as well as day care providers,
so pieces of their capital cannot be identified as specifically devoted
to day.care. We could not use capital in rhe cost relationship for
FDCHs, but an analysis was dcne to see if a part of the capital found
in these homes could be related to child care. Three measures of capital
for FDCHs were compared with the same measures for a control group of
similar families who did not provide day care,,drawn from the control
populations for the Seattle and Denver Income Maintenance Experiments.
The only difference discovered was in the number of rooms in the home.
FDCHs were found to have significantly more rooms'Aan similar homes
which did noc provide child care. The difference averaged about one-
and-three-quarter rooms in Seattle and one room in Denver. While too
little is known to assign a dollar value to this difference, it does
indicate that there are capital costs in the operation of family day
care homes.
Conclusions
One conclusion we can deduce from the data reviewed is that the
simple distinction between formal and informal day care, based on
whether the provider is licensed, is only partially supported by the
data. It i$ not fully supported in the sense that a comparison of the
averages for the different series examined does not show a clear simi-
larity between I-H and unlicensed FDCH providers on the one hand, and
licensed FDCH and center providers on the other, for most of the series
reviewed. In some cases we do find these similarities, in others not.
In fact, in some cases I-H and center data are similar, while licensed
SC-13

and unlicensed FDCH data follaw a consistent pattern, and the two sets
of data are very dissimilar.
We found that in the informal sector, there was generally a larger
proportion of older and younger providers than was found in the formal
sector. However, the proportions were similar in the for-profit centers
to those found in the unlicensed FDCH sector. There was also a fairly
consistent, if small, differenze .found in the mean years of schooling
completed between the formal and informal groups, with the latter having
a lower mean value. Furthermore, it appears that providers in the formal
sector-vizrWed in their sector a longer period of time.
Looking at the racial/ethnic composition of both the providers and
the children, we find little consistency in the formal/informal-care
dichotomy. In general, the percentage of minority group members who
are providers n the various sectors corresponds to the percentage of
children who were minority group members. However, there was no clear
distinction between licensed and unlicensed providers. It appears that
providers and children in unlicensed FDCH facilities were more likely to
be minority group members; except for the Seattle staff members, the
same held for public centers. We also found that more minority children
(Black and Chicano) use the public nonkofit centers. This is especially
true in Seattle, where over two-thirds of the currently enrolled chil-
dren are Black. Since the public centers tend to be in a model city or
other low-income areas, this is not at all surprising.
When we look at the proportions of children cared for who were under
two years of age, we find a similarity between and center providers,
as well as a similarity between the licensed and unlicensed FDCHs. This
relationship was not found in any of the other series.
In general, the percentage of hours worked devoted to educational-
developmental care followed the formal-informal distinction, with the
latter group generally spending substantially less of its time on die
higher quality of care. The same was true for the series showing the
proportion of facilities that allowed sick children to stay during their
normal period of care. And the data on gross monthly earnings per
SC-14

currently enrolled child showed a clear distinction between licensed
and unlicensed providers.
Overall, there appears to be a reasonable basis for the assertion
that day care can be broken into a formal and an informal group, based
on whether the facility is licensed. The other main conclusion is that
there appears to be a significant difference between the two cities in
many of the series discussed in this part of the study.. In other words,
the day care industry in Seattle is not the same as the day care industry
in Denver for much of the data reviewed.
Concerning providers, there appears to be a higher proportion of
older and younger providers in Seattle than in Denver, except for cen-
ters, where the opposite is true to a small extent. We also found that
in Denver providers were generally slightly less educated in terms of
years of schooling completed. Furthermore, in Denver a significantly
larger proportion of the providers, as well as of the children, were
either Black or Chicano.
On the other hand, gross monthly earnings per enrolled child, and
hourly fees per currently enrolled child, was quite similar in the
four individual sectors. However, there was a substantial difference
in gross monthly earnings for I-H providers in Seattle and Denver, and
for hourly fees for unlicensed FDCHs.
In the informal sector in Denver, there were substantially larger
numbers of related children provided day care by I-H and unlicensed
FDCH providers than in Seattle, and far more of the children were fully
subsidized. In the formal sector in Seattle, there was a large percent-
age of chiLdren whose care was fully, subsidized.
In sum, there appears to be a reasonable distinction between a
formal and an informal sector in the day care industry in Seattle and
in Denver. There also appears to be a real difference in the structure
of the day care industry between those cities. However, there were
enough exceptions found to justify the view that these conclusions should
not be considered too firm.
SC-15

Implications for Public Policy
Few systematic studies of day care providers have been done, while
both interest in the area and governmeht intervention have increased.
For these reasons it seems worthwhile to summarize the implications of
this study for day care policy. It must be kept in mind that the find-
ings discussed below and the conclusions drawn apply only to Seattle
and Denver, and should not be generalized uncritically beyond Close two
cities.
1. Is the day care market competitive?
We found the day care markets in Seattle to be generally com-
petitive. Prices did seem to be influenced, in the formal sector, by
the level of indirect subsidy, but that is a result of the fact that
subsidies to parents are earmarked for day care. If a provider cut her
prices, the subsidy would be reduced for the children under her care,
and she would not have improved her competitive position. This does not
necessarily imply that the day care market was not competitive. Pro-
viders were free to adjust the quality of care in response to changes in
the subsidy, and this mechanism, in the absence of some other constraint,
would assure competition in the market. No other constraint, such as
entry barriers, was found. We also found some evidence, discussed below,
that direct subsidies do not result in equivalent reductions in charges.
However, these subsidies may also have been spent to improve service,
so this is not conclusive evidence of market power. Because no con-
trary evidence was found, we conclude that the day care markets in the
two cities are generally competitive.
2. Are there barriers to entry in the day care markct?
We found some barriers to entry into the day care market, but
they were not substantial. Centers, and perhaps family day care homes,
require capital investment, but the amount required is probably less
than that required of most small businesses. There are also licensing
and zoning requirements for formalsector providers, but the require-
ments are not particularly onerous. Complying with the licensing
SC-16
requirements necessitates a moderate increase in capital investment.
Also, certification of compliance with the licensing and zoning require-
ments can delay the opening of a center or family day care home, but
almost all.the providers in our surveys had completed the process
in less than two months.
Our survey also found little evidence that entry into the market '
was more difficult for minorities. For the market as a whole, the
racial composition of providers matched that of the children. Within
some sectors of the market, we found more variation, but not enough to
provide clear evidence of any pattern of discrimination.
3. Is regulation successful?
Regulation of the day care centers in both cities seemed
moderaLely successful. Some family day care homes in both cities were
unlicensed and therefore unregulated. There wf,!re fewer unlicensed homes
in Seattle than in Denver, because a greater effort was made by the
licensing authorities in Seattle. But, in either city, it seemed pos-
sible'for someone to take a few children into her home for care with
little chance that they would be noticed by the authorities.
The regulations in force at the time of our interview were straight-
forward and relatively easy to enforce, and some of them were enforced
by other agencies, such as the fire departments. Greater efforu would
be required to enforce more comprehensive regulations, and some prob-
lems might be experlenced if that were undertaken.
4. Would additional regulations raise costs substantially? a
Using the data collected in Seattle and Denver, we made
estimates of the costs of compliance with the federal day care stan,4 -ds,
including the Title XX Ammendments that were partially implemented on
October 1, 1975 (see Weiner[26]).* We found that there were a significant
*Imposition of a more stringent child/staff standard for children underthree, which is part of the Title XX Amendments, has been postponedthrough at least September 30, 1977.
SC-17
number of licensed day care operators who were not in compliance with
existing and proposed federal standards. Especially heavy costs would
have to be incurred by the private for-profit centers not in compliance.
On the average, however, the increases in the number og family day care
homes or staffs of day care centers, upon which cost is heavily depend-
ent, are significant, but not overwhelming.
5. Are direct subsidies an efficient means of supporting day care?
The evidence from our survey is especially equivocal on this
point, because our information on direct subsidies is from 1973, while
our cost data are from 1974. However, if it can be assumed that subsidy
levels remained relatively fixed for the two years, then the survey
indicates that direct subsidies are not an efficient means of reducing
costs to users of day care, since in the sectors receiving direct sub-
sidies, little reduction was seen in the charges to users. While this
evidence argues against the use of direct subsidies to lowet user charges,
it is not necessarily evidence against the use of such subsidies. It
may be that the direct subsidies were spent to upgrade the quality of
the service, provided and did not benefit the provider at all. However,
the same result could be obtained by indirect subsidies to users, com-
bined with greater regulation. Such a policy would give more control
to parents, and so would seem to be preferable.
6. Can costs be estimated for a given level of care?
For a program of indirect subsidies to be efficient, the
agency administering the program must be able to set a subsidy level
that would just cover costs for the level of care desired. The meth-
odology used in Part V provides a way to estimate this cost. In order
to use this method, the level of care must be defined in quantitative
terms, and the level of care desired should already be provided by some
day care oN!rators. If these two requirements are met, a study modeled
on the one r,,ported in Part V should provide sufficient information
.for the administering agency to set a reasonable subsidy level.
SC-18

Considerations Regarding Subsidies
Aside from the six poirlts discussed above, there are several
issues concerned with the subsidy (revenue) side of public policy that
arose from our analysis of the survey data. One of the critical issues
is whether the subsidy should promote the services deemed to be desirable
by the subsidizing agertcy, or some other nonuser group, or whether the
subsidy should instead promote use of the service preferred by its user.
For example, if care by members of the extended family is prefetred,
subsidy policy can promote such care by allowing payment to relatives.
especially for in-home care. In Denver, where public ageucies were
more likely to allow str.:11 subsidy payments, we found a far larger per-.
centage using relatives as I-H providers. If subsidy payments were not
c;i:o.:A for relatives, the modal choice would probably be affected.
(See [11], pp. 47-50; althcugh the isSues raised concern the demand
sidu, they were included here because of their relevance to other issues
on the supply side.)
Another issue is the extent to which subsidy policy should promote
the provision of special needs, such as sick child care or care during
ode hours. The costs of these special services are generally higher
than those for the usual day care service, and the subsidy policy will,
in effect, determine the availability of these special services.
Finally, it appears that day care providers are partially subsidizing
users through the low average earnings they receive relative to their
education and previous work experience.* Enforcement of the minimum
wage, especially for noncenter providers, would have setious implica-
tions for the fees, and therefore for subsidy requirements.
*This is true mainly for I-H and FDCH providers.
SC-19
I INTRODUCTION'
The availability of child care services for working parents is a
critical issue for public policy. It is critical for labor force par-
ticipation decisions, especially for mothers; and it is of equal impor-
tance to federal, state, and local governments because of the costs
implied. In order to have a better understanding of this issue, a study
of the demand for day care was undertaken [11]. That study emphasized
the effects of child care programs on modal choice. As a complement to
that study, the present report was designed to examine the several modes
of day care services offered in Seattle and Denver.
In the study of demand, it was hypothesized that the day care
industry could be divided into a formal and an informal sector. This
division was based on whether the vendor was licensed; and the reason
underlying this distinction wa:.; that licensed vendors differed in their
basic economic structure and motivation from the unlicensed day care
operators.
Analyzing the day care industry in terms of a formal and an informal
sector is one possible approach. An alternative is to view day care as
composed of four major components: in-home (I-H) care, unlicensed family
day care homes (UFDCH), licensed family day care homes (LFDCH), and
centers (C),with the first two components constituting the informal and
the last two the formal sectors. The analysis in this study will be
based largely on the four separate components, although, where it is
relevant, the formal-informal dichotomy will be used. Moreover, a
break:down of the center sector according to proprietary type, will also
be used. Before proceeding with the analysis, a brief descriptive
statement concerning the four components of the day care industry will
be presented.
I-1
Components of the Day Care Industry
In-home child Care vendors provide regular child care for pay in
the user's home. This group comes closest to the popular image of the
baby sitter. They tend to be younger, work fewer hours per week taking
care of children for pay, and they tend to move in and out of the day
care field with greater frequency than do day care providers in other
sectors. In general, the in-home sector consists of a large number of
highly mobile, atomistic providers. Our description of this sector is
based on 25 I-H providers surveyed in Seattle and 20 in Denver.
Family day care 40me (FDCH) caretakers, whether unlicensed or
licensed, provide regular paid child care in the caretaker's own home.
Child care is usually for less than 24 hours during any one day; however,
a FDCH operator can sometimestake care of children during the entire
day. .We include in this sector all care given for payment in cash or
in kind, but do not include cooperative arrangements. Cooperative
FDCHs, unless they are communal types, are usually the weekend or stray
evening variety. This does not mean that coopera,ive child care arrange-
ments are not in some instances, or may not be more generally in the
future, a viable alternative. But as an element of the current day care
industry it appears to have little relevance. Our description of the
unlicensed and licensed FDCH sectors is based on interviews with 214
licensed FDCHs in Seattle and 167 in Denver, as well as on 27 unlicensed
FDCHs in Seattle and 104 in Denver.
From a very intensive investigation of FDCH facilities in Massachu-
setts, Professor Richard R. Rowe and his associates were able to con-
struct a typical day for an FDCH operator. He describes that day as
folluws:
"A typical morning starts at 7:30 when Billy and Todd,ages two and four years, are dropped off at Mrs. Rosewater's
house on Mother's way to work: one-half hour later, three-
year-cld Sally and five-year-old Mike and Amy arrive. Each
child enters to a breakfast of juice, hot cereal, and milk.
While Mrs. Rosewater does the dishes (assisted by the older
children), the others wander around the kitchen, winding up
in a small room Mrs. Rosewater has arranged for a children's
playroom. Sally busily builds with a Lego set; Billy and Toddhalf-heartedly begin to play fisherman.
1-2

"Throughout the day, Mrs. Rosewater watches over andplays with the children, soothing a bumped feeling, direct-ing a child into a game or activity, arbitrating a minordispute over the TV. While co-ing for the children, Mrs.Rosewater cleans house, receives a neighbor over to chat,talks on the phone with a variety of friends, weeds thegarden, and continually cleans, feeds and ministers to achanging assortment of active, messy, cheery, crying youngchildren. The work is strenuous, sometimes boring, ofteruneventful. Aside from talking to her neighbor and severalfriends, Mrs. Rosewater spends little time during the daywith other grownups. When in need, she calls her aunt, awoman who successfully raised two families.
'At 4:30 Billy's and Todd' dad stops by, talks brieflywith Mrs. Rosewater about the weather and the cay and takesthe boys home. An hour later Sally's and Amy's mothers pickup their children. And finally, at 6:00, Mike's mom, lateagain and apologetic, comes to get her son" {17}.
This synoptic (wervie is in many respects supported by the data
we collected in Seattle and Denver. Unfortunately, it leaves out too
much to be of Lmportance to us in describing the supply characteristics
of the FDCH sector of the day care industry.
From a purely legalistic point of view, there should be no unli-
censed fDCHs as a separate group. What this view would imply is that
there are only legal ;.nd illegal FDCP operations, and that aside from
the legality of the operation, there is no significant difference between
the two in terms of what is offered for sale. One of the important com-
parisons will be between licensed and unlicensed FDCHs, to determine the
differences, if any, between these sectcrs. Our a priori view is that
licensing .imposes a degree of uniformity and increases stability in
licensed facilities. Moreover, the structure of the licensing process
may promote a more businesslike attitude on the part of proprietors of
licensed facilities.
The last, component in our survey ,Yas day care centers. We attempted
to survey the entire population of day carP centers in Seattle and Denver.
Of the centers four.1 within the limits of these cities, we obtained in-
terview data from 67 out of 76 in Seattle and 47 out of 50 in Denver.*
*See Appendix A for more detail regarding the actual survey.
I3
e
This component of the day care industry is the most structured, in terms
of child care activities, and probably the most likely to be operated as
a business activity. Although it is the least important of the four
major components of the child care industry, in terms of the number of
child care demanders usiug the service, it is usually thought of, at
least by child care professionals, as the epitome of a child care insti-
tution. Formally, it is usually defined in terms of the number of
children for whom they are licensed to care. Usually, centers can care
for seven or more children, although there is a gray area where both
centers and FDCHs can have 7 to 11 children. For our purposes, a center
was simply defined as a child care facility licensed as a day care center.
Unlike the other sectors, centers can be broken down by type of
proprietorship: profit and nonprofit, private aud public. Of the 67
centers surveyed in Seattle, 21 were private profit-making operations,
35 were private nonprofit, and the other 11 were public nonprofit facil-
ities. In Denver, the 47 centers were broken down as follows: 17 private
for-profit, 13 private nonprofit, and 17 public nonprofit. A far greater
percentage of the centers in Seattle are private nonprofit than in Denver.
This is related to the fire standard changes for Denver mentioned below,
and their effect on private nonprofit centers. Our descriptive analysis
of the center sector will look at characteristics not only by city, but
also by proprietor type within each city.
Some of the center data came from staff members. A separate staff
supplement was given to each staff member with instruciions to fill in
the required answers and return the completed form to the center director.
Althoug;. ,everal follow-up procedures were initiated, the responr,e rate
for staff member supplements was disappointing.* Of 372 volunteer workers,
only 33 (8.9%) returued completed forms. Fortunately, the response rate
was much better for regularly paid staff. Of 1,128 regular staff in both
cities, 612 (54.3%) returned forms. We ran a series of chi square tests
on a cross tabulation of the frequencies of several variables against the
*In both cities, 29 centers (25.4% of the total) failed to return staff
questionnaires.
1-4

-
proportion of all regular staff members who returned their questionnaire.
In Seattle, none of the differences in the distributions were significant
at the 5% level or better, while in Denver we found one significant dif-
ference for the total number of children currently enrolled. What we
found in that instance was that centers with a. smaller number of children
enrolled were more likely to have over 25% of their total staff members
return completed forms. The frequencies and chi square tests for all
questions used are given in Appendix B.
On the basis of that appendix, it does not appear that there is
any bias introduced in the data by considering staff members who returned
their questionnaire to be representative of all regular staff members.
Aspects of the Economics of Day Care
Although we can, in many ways, view day care as an industry, it has
some very unique properties. These'peculiarities make it necessary to
qualify statements with regard to adjustments that might be expected, in
general, from some change in market conditions. One important considera-
tion is that providers, especially in-home and FDCH, but also center
staff, often care for their own children, or children of close relatives,
at the same t!me that tney provide paid care for nonrelated children.
This means that operators are providing a joint product, consisting of
paid care for nonrelatives and unpaid care for their own children. There
is clearly some value to be attributed to the care provided for their
own children. Since no money is exchanged, this value is often ignored.
However, the total revenue of such providers should be adjusted to take
account of the nonmonetized value of services provided to their children.
If that were done, we could easily imagine a long-run adjustment where
many providers were not covering (monetized) marginal costs.
The idea of joint products has another dimension--the fact that
child care services consist of both custodial and educational-developmental
components, provided at the same time. In any market adjustment process,
we would have to break down the relationship between costs and the quan-
tity of output provided into those two components of child care. Over

1the long run, adjustments to changes n price may be quite different for
providers whose cost functions are heavily weighted with an educational-
developmental component.
There is no unique formal theoretical model that we can offer for
understanding the economics of the day care industry. What we can do is
present a brief listing of the economic issues that motivated this study.
The most important issue was determining the short- and long-run
price elasticity of supply. This involves obtaining reliable estimates
of the cost functions for day care services. Without them there is much
less that we can say, analytically, about the supply side of the day
care industry. However, with such cost functions, we can determine how
supply will respond to price changes. Similarly, with well-defined cost
functions estimated, we could lpok into the issue of scale economies for
day care services.
In order to obtain these cost functions, we would have to determine
all costs of production. This includes not only the current labor or
equipment and supply costs, but also properly apportioned capital costs.
It also means that the imputed monetary value of donated time or supplies
and equipment would be required. This is especially relevant for FDCH
operators, who often.perform market and nonmarket activities at the same
time. That is, while they care for their own children, for which no
client money payment is made, they also provide paid child care for other
children in their home. This creates a serious problem regarding the
valuation of both market and nonmarket activities, where, as was pointed
out previously, there are joint products involved. Since labor is the
primary cost in all day care operations, the manner in which the market
wage imputation problem is handled will have an important effect on the
perceived economic viability of day care operations, especially noncenter
operations. It may be true that FDCH providers subsidize buyers of their
service; however, it might also be true that an incorrect valuation of
the services provided their own children means we have failed to add an
indirect benefit to the wages received.
I-6
Another aspect of imputed costs concerns the voluntary services
supplied, especially for centers, as well as the use of their own home
for FDCH operators. In general, the value of volunteer services is
simply the predicted earnings that could be obtained by that individual
if the time were spent in paid market activities. However, if the vol
unteer's child is enrolled in the center, as is often the case, an ad
justment to the market wage will be needed to subtract the value of free
child care time.
Along with estimating such costs, we must also face the issue of
what appropriate measure of output should be used. This is related tok
the activity mix provided the children. Whatever the specific activities,
what is needed is a dichotomy of all activities into two major components:
custodial and educationaldevelopmental. What we look for here is quality
of service being provided. We need to know the extent of variation in
quality within each sector of the day care industry. Furthermore, the
variation may refer not only to the custodial versus educational
developmental dichotomy, but also to lack of custodial care. The latter
appears mainly as a general risk element correlated positively with the
number of children being cared for per custodian.
Another set of problems that must be analyzed are entry barriers
and the utilization of capacity within each sector of the industry.
Capacity here usually refers to the licensed upper limit on the number
of children who can be cared for. However, it also depends on the number
of staff present and the required child/staff ratios. Furthermore, the
issue of what constitutes.gjpacity in a day care facility is tied into
the .question of determining what we mean by the quality of service. A
lower child/staff ratio may be a reflection of quality differences rather
than capacity utilization. The issue of entry barriers is related to
licensing requirements, zoning restrictions, and capital needs.
Pricing policy is yet another important issue in the economics of
the day care industry. It includes not only the fee charged per unit of
service offered, but also the quality of services provided. It would
also be useful to look into prices charged for special services, such as
odd hours or weekends. Related to the issue of prices is the question
1-7
of the subsidy paid. Furthermore, an adequate review of pricing prac-
tices would give us smile insight into the extent of price competition in
the day care industry.
These are not the only theoretical considerations in the economics
of day care that might be relevant, but they appear to be the most obvi-
ously important aspects. In this study we have addressed some of these
issues, and, using thP data collected in our survey, have been able to
suggest how relevant they were in Seattle and Denver (see Parts II
through V). However, much yet remains to be done.

II CHARACTERISTICS OF THE DAY CARE INDUSTRY, OF THE PROVIDERS,AND OF THE DAY CARE SERVICES
Information from Other User Surveys
Several national and regional surveys of day care users have been
undertaken within the past decade [1,12,17,18,21,24,27]. Most of these
have concentrated on the demand side of the day care industry. Perhaps4
the most widely quoted, insofar as day care user characteristics are
concerned, are the Low and Spindler [12] and the Ruderman [18] studies.
Ruderman takes a sample of workihg mothers and seeks to determine
the arrangements for child care. She finds that children of working
mothers are taken care of in the following seven ways: child takes
care of itself (7%), mother takes care of child while working (3%),
father takes care of the child (23%), an older sibling takes care of
child (12%), child is cared for in home of user by other than parent or
sibling (28%), child is cared for in the home of child care provider
(23%), child is cared for in center, nursery school, ot recreation
center (4%). The first five categories consist of various forms of
care provided within the child's home, whereas the last two are what is
usually termed family day care home and center care. What stands out
here is the preponderance of care for children of working mothers
providee by some relative or by the child itself. Similar results were
found in the Westinghouse-Westat survey [27]. In-both-surveys, almost
three-fourths of child care for working mothers was provided by
relatives or by self care.
In most discussions of day care as a business operation, the first
four types of care listed above are generally not taken into account.
Although these Corms of child care make up almost half of all care
provided to the children of working mothers, and can be substituted for
the remaining three forms of child care, researchers in the day care
field consider the first four types of care as within-family transfers.

Child care, especially when it is viewed as a business transaction, is
concerned with paid-for care (in money or in kind) provided in the home
of the user, in the home of the provider, or in a specially designated
structure devotecrto child care (although the structure may, at other
times, be used for non child care activities). These three sources of
care define what we know as in-home, family day care home, and center
child care.
In the surveys listed above, it is clear that the bulk of day care
users use informal care, whether in their own home or in that of
another. Every survey in which the distinction has been employed has
shown that licensed centers and family day care homes provide a small
proportion of all day care. However, it is most difficult to get a
reliable enumeration .of the informal sector.
Table 1 indicates the estimated importance of the informal sector.
Although the data from the different surveys used.in Table 1 are not
strictly comparable, they are close enough for rough comparisons.
Perhaps the most striking bit of information derived from Table 1 is
the small percentage of children who receive day care in formal centers.
The substantially higher percentage that we found in the Seattle survey
may be due to the attempts being made by state, local, and educational
groups to upgrade day care services in Seattle.
Ruderman found that Blacks were more likely to use out-of-home
child care arrangements than were Whites. We also found this to be
true in our Seattle and Denver da.,T care utilization data. Furthermore,
Ruderman found that the type of use was related to the family's socio-
economic status (SES). She found that lower SES children have a sub-
stantially larger percentage of nonrelatives.taking care of them. In
part this may be due to ability to pay; but it may also be attributable
to higher mobility rates of the high SES families, which usually means
fewer relatives availzdAe for use as child care providers.
The surveys discussed above also showed that about 75% of the
family day care homes provide care for only one or two children on a
full-day basis, and that about 20% of all FDCH children are less than
.11-2
1. t

Table 1
PERCENT OF DAY CARE PROVIDED WITHIN THE THREE MAIN SECTORS
Low-
Spindler
Westinghouse-
Ruderman Westatcd
Denver Seattlee
In-home 57.7% 51.9% 40.6% 25.0% 37.5%
Unlicensed family day care home 36.9e 42.6e 49.2e 61.9 35.6
H Licensed family day care home 5.0 9.8H
Center 5.4 5.5 10.2 8.1 17.1
aSee [12], p. 71,Tables 1-2 and 1-3.
b
See [18], p. 212, Table 49.
c
See [27], pp. 179-180, Tables 4.28 and 4.29.
d
Data collected from the Seattle-Denver Income Maintenance Experiment.
eThis ccnsists primarily of unlicensed family day care homes.

two years old. The Westinghouse-Westat study also found that most
center staff are neither well educated nor well paid. They found that
most directors and "teaching" personnel did not have college degrees;
and very few had any special formal off-the-job training in cnild care.
It was estimated that less that 2% of all FDCHs are licensed, whereas
about 90% of all centers appear to be licensed by some public agency.
Licensing Considerations*
Licensing of FDCHs is mandatory in 38 states, while center licens-
ing is required in all states except Mississippi, where it is volun-
tary. In-home care is rarely licensed, but some localities have
regulations fot I-H providers, especially where infants are involved.
In some states there are signlficant gaps in coverage where licensing
is not mandatory for all cities or counties and, when it is mandatory,
enforcement is relatively lax, especially as it concerns FDCHs.
In general, licensing requirements, such as for zoning, fire
safety, and building code and program requirements, are far less
stringent for FDCHs than they are for.centers. Child/staff ratios and
space per child requirements are, on the other hand, quite similar for
centers and FDCHs. In fact, since FDCHs are rarely licensed for more
than six children, .the average child/staff ratio is usually lower for
FDCHs than for centers.
-W-e-Tind that child/staff ratio requirements vary widely. For
FDCHs, the required ratio for children aged 0-14 years of age went
from 2:1 in Massachusetts to 7:1 in South Carolina.t However, for most
of the states, the requirement was one caretaker for every six children
(6:1) for that age group. It is also true that most states have some
type of restriction on the number of children under 2 years of age that
can be included in the total number of ohildren allowed per caretaker.
Much of the data for this section comes from [15].
tThese ratio requirements were in effect prior to the Title XX
Amendment to the Social Security Act, which increased staff requiremeats.
11-4
c_i

For centers, the child/staff ratio required by state regulating
agencies almost always varies according to the age of children cared
for. Furthermore, stratification by age may differ from state to state,
although there are also some similarities. For states in which children
who are less than 3 years of age are cared for, the lowest child/staff
ratio, 5:1, is found in Alaska, while the highest ratio, 10:1, is inArizona. For children aged 6-14, the child/staff requirements go from
15:1 in Florida and Nevada to 30:1 in Tennessee, with several states
having a requirement of a minimum of one caretaker for every 25
children aged 6-14.
During the past decade there have b.!en a number of attempts to
upgrade the '.wel of child care delivered to preschool children. These
efforts have focused on nursery schools and day care centers. However,
they have been hampered by the difficulty of assessing the type of care
that is desirable. "There are no adequate measures of the effects of
different kinds of child care, once abusive, unsafe care has been ruled
out" [17]. In lieu of an adequate instrument to assess the quality of
day care, staff size relative to the number of children cared for is
often equated with high quality child care. "The staff-child ratio,
although a very imperfect yardstick, is in our present state of
knowledge the principal indicator of both costs and quality as we know
them" [17 (italics in original); see also the section below concerned
with quality considerations]. Because of this view, which appears to be
held by many in the field of child development, the tendency has been to
apply pressure to regulatory agencies to have the child/staff ratios
lowered, at least for centers. What may be happening, therefore, is
that in those states where the advocates of high quality child care are
influential, there has been a reduction in the number of children who
can be enrolled in a center for each available caretaker. The range of
child/staff ratios may then reflect the relative power of child
development advocates.
It was also found'that fire safety, health, and building regula-
tions beome more stringent as population density increases, with the
4 ?

urban metropolitan areas having the mostStringent regulations. On a
national level, the following average delays were found in the licensing
procedure: fire inspection, 65 days; sanitation inspection, 35 days;
health inspection, 35 days; and zoning, 50 days. Since these can be
sequential, the total delay can range from an average of 65 to 185 days
(2 to 6 months).
Provider Characteristics
Child care is a labor-intensive process. About three-fourths of
the input costs for day care services consist of payment to providers.
With that level of importance, it will be useful_to review characteris-
tics of the day care labor inputs. Some characteristics of the
providers of day care services are more relevant to quality or cost
considerations, and these will be discussed in the next section, as well
as in Part V. However, there are some general characterisNgs of the
provider, and of the relationship between the provider and the child
being cared for, that are relevant to a discussion of the supply of day
care services. Most of our discussion with regard to providers is
derived fromdata in Tables 2 and 3 below.
In both cities, the I-H providers were generally younger.than
providers in other sectors. Licensed FDCH operators tended to be
somewhat older than providers in all other sectors, including centers,
whill.e in Seattle, the unlicensed FDCH operators and the center staff
were approximately the same average age. However, as we can see from
Table 2, the distribution of providers by age group does.uot follow the
same pattern seen in the averages. For example, although the average
age of unlicensed FDCH operators and the staff of for-profit private
centers is about equal, we find that the largest grouping in the center
is for 20- to 29-year-old staff, while for the nnlicensed FDCH
operators, the largest grouping is in the 19 and under and the 30- to
49-year-old group.
Although a larger proportion of the providers in both cities,
and of the unlicensed FDCH prw-iders in Seattle, were in the youngest
II-6

Table 2
AGE AND RACE OF DAY CARE PROVIDERS, AND RACE OF CHILDREN
(Percent of Total)
SEATE DENVER
Unlicensed Licensed Unlicensed Licensed
Family Family Centers Family Family Centers
In- Day Care Day Care Nonprofit For Profit In- Day Care Day Care Nonprofit For Profit
Home Homes Homes Total Private Public Private Home Homes Homes Total Private Public Private
Racial/ethnic group
(previriers)
?lack 20.0% 31.9%, '22.9% 18.5% 20.2% 26.8% 5.0% 25.0% 42.3% 16.8% 22.1% 14.8% 35.0% 4.9%
Chicano 4.0 0 0.5 2.2 1.5 5.4 1.7 30,0 26.9 12.0 16.3 9.1 26.1 4.9
White 72.0 44.4 ,3.8 74.2 73.2 66.1 85.0 45.0 25.8 70.0 58.3 76.1 33.1 87.7
Racial/ethnic group
(children)
Black 23.0% 47.72 20.7% 33.7% 35.8% 66.6% 17.0% 20.8% 37.7% 15.0% 23.2% 26.0% 29.2% 16.1%
Chicano 0 0 1.5 2.3 2.3 2.7 1.3 33.9 33.2 10.5 16,4 9.2 31.9 5.7
White 67.2 50.0 70.0 56.5 54.1 23.1 73.9 45.3 24.7 71.1 57.9 61. 36.1 75.4
Age
50 and older 8.0% 7,4% 28.4% 12.5% 12.6% /X 17.5% 15.0% 19.3% 22.8% 20.9% 21.6% 17.8% 26.3%
30-49 4.0 33,3 48.6 24.8 26,8 34.0 8.8 25,0 27.8 46.7 32,9 39.8 35.7 20.0
20-29 16.0 22.3 23.1 50.8 51.0 46.4 54.4 25.0 42.3 29.9 38.3 27.2 44.0 38.7
19 and under 72.0 37.0 11.9 9,6 12.5 19.3 35.0 10.6 0.6 8.0 11.4 2,5 15.0
Average age
(years) 23.6 30.2 41.8 31.8 32.2 31.3 30.8 31.3 33.3 0.8 36.7 38.0 36.3 36.2
, Source: The source of all tables in Chapters 2 to 5 1,, the survey undertaken by SRI in Seattle and Denver during May 1974, unless otherwise
specified.
4?.;

Worked at full time
job other than child
cate (% yes)
Gross rate of pay
per hour on last
full time job
(mean) b
Average number of
years providing
child care service
in given sector
(years)
Average number of
months provider has
cared for child cur-
rently being cared
for (months)
Percent of children
cared for, during
period when other
children are cared
for for pay, who are
sons or daughters of
provider (7)'
Table 3
SELECTED CHARACTERISTICS OF DAY CARE PROVIDERS
SEATTLEDENVER
Unlicensed
Family Family
In- Day Care Day Care
Home Homes Total
!I
.omes
52.0 66.7 87.4 NAa
S2.37 $2.02 $2.23 NA
3.9 2.0 5.4 2.2
14.7 6.3 11.4 NA
0 22.1 23.3 7.9
Licensed Unlicensed Licensed
Centers Family Family Centers
Nonprofit For Profit In- Day Care Day Care NonErofit For Profit
Private Public Private Home Homes Homes Total Private Public Private_
NA NA NA 55.0 66.3
NA NA NA $1.40 $1.83
2.4 1.6 2.1 3.4 4.3
NA NA NA 12.5 11.3
N\
9.0 7,1 5.0 9.4 30.6
88.0 NA NA NA NA
$2.08 NA NA NA NA
5.4 2.7 2.2 2.8 3.2
10.3 NA NA NA NA
22.8 12.0 11.4 12.7 11.2
aNA . not available,
bThe date of last job varies over a three-year period prior to the date of this survey.Therefore the absolute level of these rates of pay
are very approximate indicators of earnings. However, the relative values between sectors and cities is more useful for comparative purposes.
'For centers, the figures represent the percent of staffwhose own child was in attendance at the same center.
_
age groups, we still find that a majority of these providers had
previously held some full time paid job other than child care, as
shown in Table 3. However, in both cities we find that, whereas
somewhat over half the unlicensed providers had prior full time employ-
ment,_almost all the licensed FDCH operators had previously engaged in
full time work.
Moreover, there is no apparent systematic relationship between the
two cities or between licensed and unlicensed sectors, so far as the
average number of years that the day care operators had provided child
care. Except for the unlicensed FDCH sector, however, the average years
providing care was very close when Comparing the two cities for each of
the other sectors. We also found that in the three sectors for which
data were Lvailable, on the average about 6 to 15 months of care was
provided, with the I-H providers in both cities generally caring for
the same child the longest period of time.
Another relevant characteristic of providers, so far as the supply
of child care services is concerned, is their racial/ethnic composition.
It is relevant at least in view of the fact that the racial/ethnic
composition of children using day care services is highly correlated
to that of providers. In Seattle, the percentage of providers who
were from minority groups (Black or Chicano) was about the same for all
sector's other than unlicensed FDCHs, where the percent of minority
members involved was much greater. Howeve in Denver the distinction
is between formal and informal sectors, with the former having a
significantly lower percentage of providers who were from minority
groups. But within the center sector we find that the public centers
are comparable, insofar as minority member involvement is concerned,
to the informal sector, while the for-profit,private centers have the
lowest minority member participation. In Seattle, the proportion 'of
day care providers who are minority group members is roughly the same in
all sectors except for unlicensed FDCHs and the private for-profit
centers, with the percentage much lower in the former and much higher in
the Latter.
11-9

The racial/ethnic breakdown of the children who were being cared
for was fairly consistent with what we found for providers. The
percentage of children who were Black or Chicano was almost exactly
equal to the comparable provider percentages for all except the center
sector. In that sector in Seattle, we found that a large proportion of
the children were from minority groups relative to the providers; this
was especially true for the public centers. In Denver, the proportion
of children from minority groups was also somewhat larger than the
proportion of providers from those groups, but only for the private
nonprofit and for-profit centers.
When we look at the percentage of providers who cared for their
own children simultaneously with others, acme of whom could have been
related to the child care vendor, we find a different relationship
between sectors and cities. In Seattle, none of the I-H providers
cared for their own children during the time that other children were
being cared for, while about one-quarter of the unlicensed and licensed
FDCKs, and almost a tenth of all center staff, had their own child in
attendance. In Denver, the percentages were comparable for licensed
and unlicensed FDCHs, and for centers and I-H providers. So, for child
care operators providing care while their own children were in attend-
ance, the licensed and unlicensed FDCHs were comparable in and
between both cities, while the I-H providers and center elif were
reasonably comprrable, with the exception of the Seattle I-H providers.
In almost all instances, the percentage of providers and of
children being cared for who were minority group members was larger than
the proportion of the total population of Seattle and Denver who were in
thcse minority groups. In Seattle, slightly over 10% of the population
was Black or Chicano (according to the 1970 census tabulation), while
in Denver it was 26%. One important reason why our day care sample
ratios for minority members are so much greater. in general, than
similar ratios for the entire city population, is the selection process
used in obtaining our sample. Our method for selecting I-H unlicensed
FDCH respondents was ;7iased toward lower income areas in Seattle and
II-10

Denver, due to the fact that names of potential respondents were ob-
tained from the SIME/DIME sample, which is biased toward lower income
census tracts. That bias does not hold for the licensed sector, where
we obtained ogs.plete listings of providers. Consistent with that, we
found that the percentage of providers and of children who were
minority group members in centers and licensed FDCHs was almost the same
as the proportion of minority group members in the overall city popula-
tion, except for some sizeable discrepancies within the center sector.
In Seattle, this was especially true for public centers, and in Denver
there was a sizeable difference for the private ..or-profit centers.
We also found that a significant number of children being cared for
were related to the providers. Table 4 shows the percentage by racial/
ethnic groups. These relationships include the provider's own child
as well as other relationships. In Seattle, there is not a great deal
of variation, except for Black I-H and White unlaeensed FDCH providers.
In Denver, on the other hand, a far larger percentage of the unlicensed
sector providers cared for children who were related to them than was
found to hold for the licensed FDCH operators. Among Chicanos in
Deny,af, there appears to be a preference for the use of unlicensed
providers who are part of the extended family. This seems to be
especially true when compared with Whites. (This may simply be a
reflection of relative spaial living patterns among Chicanos versus
those found for Whites or Blacks.)
Considerations of Quality
A.; mentioned earlier, the quality of care provided by child care
vendors is very hard to assess. There are several alternatives having
the potential to help form this kind of judgment. One view of child
development says that in the early years a child needs a warm, nurturing
environment in which it can develop its latent abilities. In conjunc-
tion with this view, it is held that when an adult has "too many"
childr:m to care for, a warm and nurturing atalosphere is less likely.
Consequently tne chi) 1/scaff ratio is used as an indic:Itor of the
quality of care being provided, with the assumption being that the lower
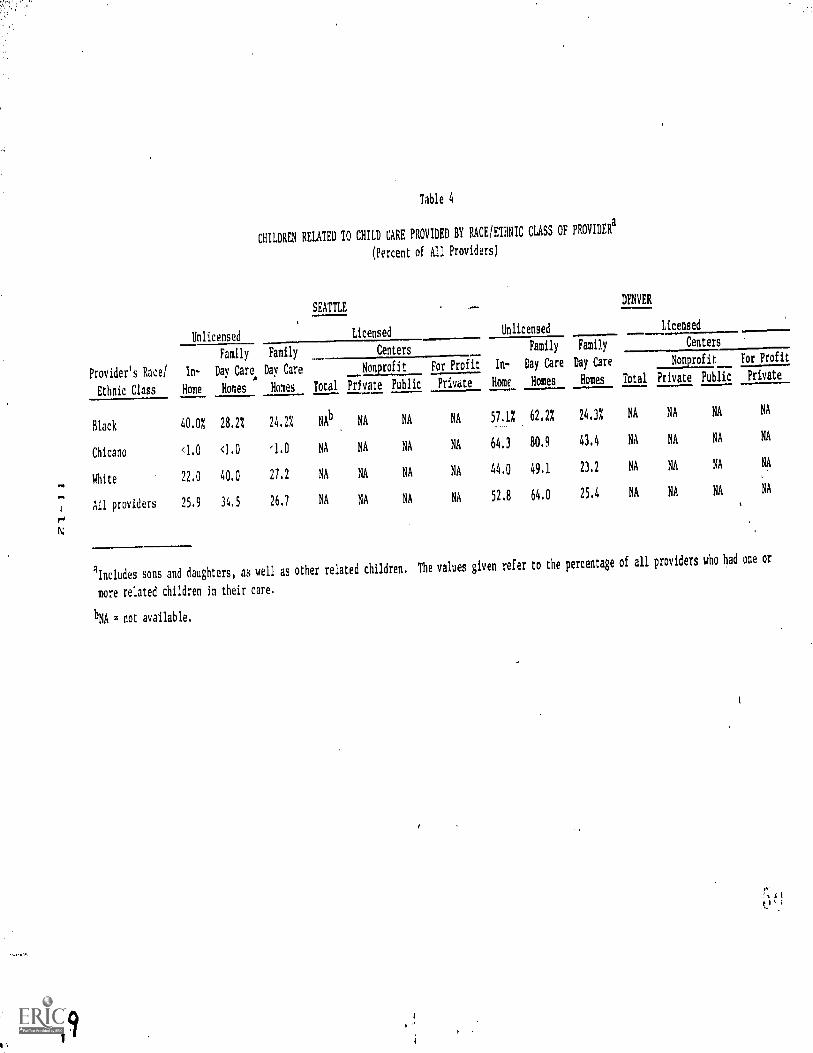
Provider's Race/
Ethnic Class
Table 4
CHILDREN RELATED TO CHILD CARE PROVIDED BY RACE/ETHNIC CLASS OF PROVIDERa
(Percent of All Providers)
Unlicensed
Family Family
In- Day Care. Day Care
Home Homes Homes
SEATTLE
Licensed
Centers
Nonprofit
Total Private Public
Unlicensed
Family
For Profit In- Day Care
Privdte Home Homes
DENVER
Licensed
Family Centers
Day Care Nonprofit For Profit
Homes Total Private Public Private
Black 40.0% 28.2% 24.2%NAb
NA NA NA 57.1Z 62.2% 24.3% NA NA NA NA
Chicano <1.0 <1.0 NA NA NA NA 64.7 80.9 43.4 NA NA NA NA
White 22,0 40.0 27.2 NA NA NA NA 44.0 49.1 23.2 NA NA NA NA
Ail providers 25.9 34.5 26.7 NA NA NA NA 52.8 64.0 25.4 NA NA NA NA
lIncludes sons and daughters, as well as other related children. The values given refer to the percentageof all providers who had one or
more related children In their care.
bNA . not available.

the ratio, the higher the quality of care. In judging the quality of
care, the child/staff ratio is often used as the main operationally
definable cr:t.terion.
Other measures that can be used to determine the quality of care
are the types of materials and equipment supplied to the children, as
well as measures of cognitive achievement or other developmental
attributes. Adequately specified measures of achievement* are very
costly to administer over any reasonable sample of children, and agree-
ment as to the effect of various types of equipment or materials on the
quality of care provided is difficult to find.
From.the data.collected in our Seattle and Denver surveys, we have
two principal ways of measuring the quality of care: child/staff
ratios and a self-reported measure of the percent of total care devoted
to educational-developmental activities. Both sets of data will be
used, along with_some inferential data for centers.
Child/Staff Ratios
As stated, the usual criterion used in discussing the quality of
day care being provided is the number of children cared for per staff
member. For all but centers, this ratio is simply the number of chil-
dren cared for divided by one.t Table 5 presents these child/staff
rr.tios for each stctor in both Seattle and De.nver.
What we find is that in both cities the .informal sector providers
care for a smaller number of children, i.e., they have a lower child/
*SRI is currently administering a set of such measures in an attempt toassess the quality of care in a s:ple of day care centers.
prasenting these raLios we have not made adjustments for part timecare, on the part of either the children or the providers. For ourpurposes a child is a child, and a provider a provider. In using theseratios to assess the quality of care, We are simply making comparisonsbetween sectors and cities, rather than attempting to determine theabsolute level of quality. For our purposes, therefore, assuming nosystematic difference in part time involvement between sectors, webelieve our approach to be adequate.
II-13

Table 5
CHILD/S1AFF RATIOSa
(Mean Values)b
SEATTLE
Unlicensed Licensed
Family Family Centers
In- Day Care Day Care Nonprofit For Profit
Home Homes Homes Total Private Public Private
1.9 3.2 5.2 4.6 4.6 3.3
aFor all sectors, other than cent
provider; for centers we use ill
all staff members in determining
excluded stgf liembers, such as
ever, only about 6% of all staff
bAli figures are given as a ratio
ratio include the provider's own
52,
DENVER
Unlicensed
Family Family
In- Day Care Day Care
Home Homes Homes Total
Licensed
Centers
Nonprofit
Private Public
5.5 1.8 3.7 4,6 5,4 4.8 4.6
For Profit
Private
6.9
er sectors, the ratio represents the number of children currently enrolled to a single
regularly paid staff members as the denominator.In assessing quality of care, use al
the child/staff ratio biases the resultstoward a lower ratio than would be true if we
cooks, who did not deal directly with thechildren in their child care activities. How-
in either city do not deal directly with children in their child care activities.
to 1, i.e., if 4.1 is given this implies a 4.1:1 ratio. Moreover, the children in the
children, who are cared'for at the same time that other children are cared for for pay.

staff ratio. On this basis, we might infer that the informal sector
providers deliver, on the average, a higher quality of care. However,
anotherGharacteristic of the providers that affects the quality of
care is their educational attainment.* Assuming that the highet the
educational attainment of the provider the greater the quality of care .
provided, all other things remaining the same, we see from data on
educational attainment that what we inferred from the child/staff
ratios might have to he ':.!alified. Table 6 shows that the informal
sector providers in both cities generally have a lower average level of
educational achievement. Moreover, almost none of them had two years or
more of college, whereas a significant number of the licensed FDCH pro-
viders did, and from about half to two-thirds of the regularly paid
.staff of all centers had at least two years of post-high school
education. t
We can also see from Table 5 that within the center sector, the
for-profit private centers have the highest cnild/staff ratio, while the
public nonprofit centers had the lowest ratios. Although this is true
in both cities, there are significant differences in the magnitudes
between sectors in Seattle versus Denver. In Seattle, the nonprofit
public centers have an average child/staff ratio that is considerably
lower than that for the other two components of the center sector. And
in those two. nonprofit private and for-profit private, thy child/staff
ratios are much closer, with the for-profit private centers having
the higher ratio. In Seattle, on the other hand, the ratios for both
nonprofit components were very similar, while the for-profit priVate
center ratio was considerably higher than either of the others.
There are also a host of personality correlates, for which we have nodata, that are relevant in assessing the quality of care provided.
TWe also found that the I-H providers were significantly younger thanthose in the cther sectors. Moreover, 48% of the I-H providers inSeattle and 25% in Denver were enrolled in school on a full timebasis, mainly high school, at !the same time that they were providingchild care.
11-15

Highest grade
completed
(mean years)
?ercent of
providers with:
10 years or less
of schooling
completed
14 years or more
of schooling
completed
Table 6
EQUATION OF PROVIDER
SEATTLEIl.
Unlicensed Licloed Unlicensed Licensed
Family Family Centers Family FaMily Centers
In- Day Care Day Care Noefit For Profit In- Day Care Day Care Nonprofit For Protit
Home Homes Homes Total PriA,ate Public Private Home Homes Homes Total Private Public Private
10.8 11.1 12.0 14.2 14.2 14,5 14.0 9.8 10.7 11.5 13.3 13.2 13.2 13.6
36,0% 33.3% 18.7% 4.1% 3.5% 5.6% 5.0% 60.0% 36,5% 28.7% 11,7% 12,5% 13,9% 6.3%
.
4.0 3.7 22.4 62.7 62.4 68.5 58.3 0 6.7 15.6 47..4 47.7 45.6 50.6

The reasons for varia.tions in the child/staf_ ratios are diffi-
cult to explain from the data collected. However, there are some clues
from the survey that we can use to suggest possible causes. In the
center sector, the extent of subsidization, especially for the public
centers, appears to be a determining factor in the existence of lower
child/staff ratios. Also, Lhe orientation toward making a profit would
tend tc promote the use of as few staff as possible, especially since
labor costs constitute about three-fourths of all varif,ble costs for
center operations. This would lead to higher child/staff ratios in
the for-profit private centers. In the other sectors, a possible
explanation of the fact that child/staff ratios increase, in both
cities, as we go fri..m I-H to the more formal child care arrangements,
is that for the latter there is more of a business-like orientation
toward the provision of child care. In that sense, the licensed FDCH
would be more likely to maximize use of their inputs (labor) in
generating their outputs (child care). Other explanations are possible,
such as personal inclinations with regard to the desire for taking care
of no more than a given number of children; but such speculations would
take us completely outside the realm of out survey results. We can,
however, continue to use our data in asSessing quality of care by
reviewing the percentage of time that day care vendors claim they
devote to educational-developmental care.
Type of Care Provided as Perceived by Vendors
In the survey, there were a series of questions from which we
attempted to apportion the time spent by day care vendors into:
(a) hours devoted to activities that could be classified as educational-
developmental, and (b) hours devoted to activities that could be
cla-ssified as purely custodial care. (See Appendix C for a discussion
of the method used in classifyaig hours of care.) However, there is no
clear distinction as to what constitutes custodial care (see discussion
of custodial care in Part V); moreover, we have no way of verifying
that the elements of custodial care as perceived by vendors in 'the
survey were comparable between respondents. In general, it appears
?
from discussions with day care proprietors that "gaod" custodial care
consists of a facility that conforms to required fire and other safety
features, provides meals and adequate napping accommodations, has no
systematic interactions with parents as far as their child's develop-
ment is concerned, lises a limited set of equipment, and indulges in a
very limited amount of planned activities, but does provide an overall
warm and accepting environment for the child.
Given the limitation of our data insofar as determining some
,)bjective measure of the quality of care, we can use the data in Table
as indicative of how respondents perceive and classify the type of
care they are providing. Using our method for calculating educational-
developmental care (see Appendix C), we found that the I-H and un-
licensed FDCH providers in Seattle said that approximately one-tenth
of their time was devoted to such care, while in the licensed FDCHs in
Seattle and for all sectors other than centers in Denver, about a fifth
of the time devoted to child care was perceived as being spent in
educational-developmental activities. The proportion of the week spent
on higher quality care was somewhat greater for centers--overall, one-
third in Seattle and slightly less in Denver. In the latter city,
there was very little difference in the percent of time devoted to such
care between different proprietary types. However, in Seattle, the
public centers reported spending almost half their time in educational-
developmental care, while the other centers show slightly under a
third of their time being used in that type of care.
Within the center sector, th:.re was also a substantial amount of
time devoted to "other" activities. A significant part of the "other"
activities were administrative tasks. There was a large difference
in the percentage of staff time devoted to administrative tasks among
the three proprietary types in the Seattle centers: public nonprofit
centers devoted an average of about 16% of their time to such tasks,
*Other tasks grouped under the "other" category included cooking,
household maintenance, etc., that could not be classed under the
other categories used.
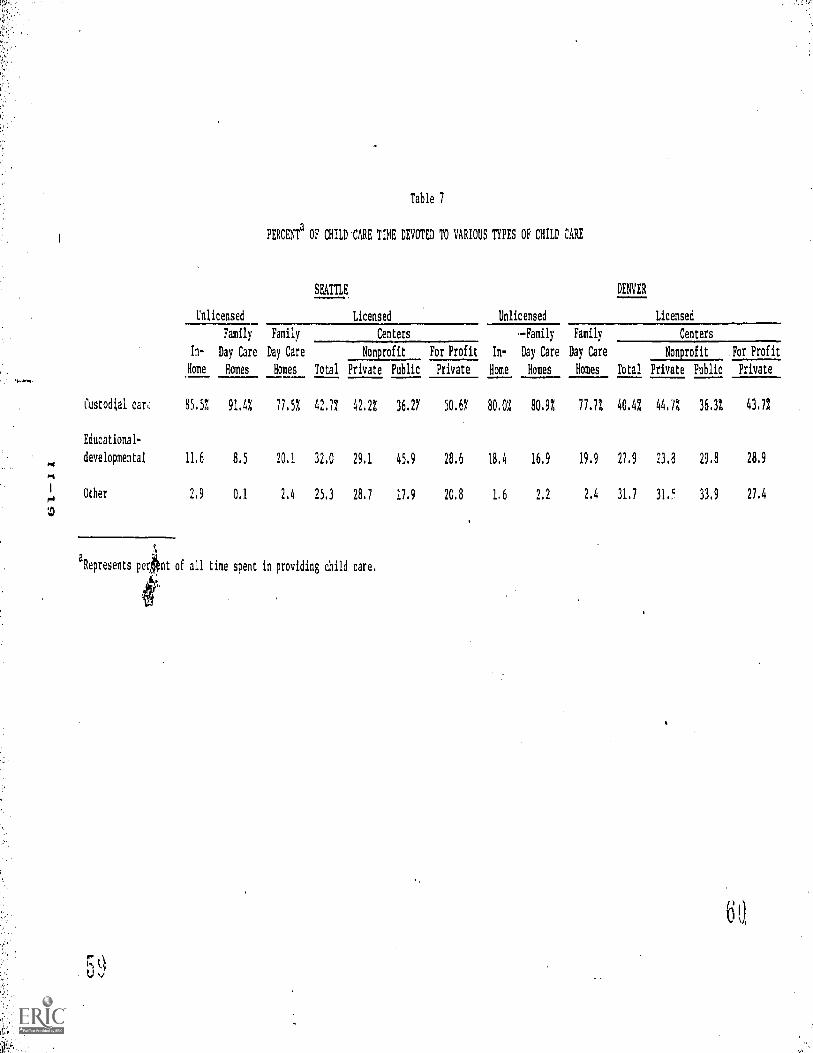
Table 7
PERCENTa
OF CHILD-CARE TIME DEVOTED TO VARIOUS TYPES OF CHILD CARE
SEATTLE DENVER
Unlicensed Licensed Unlicensed Licensed
Family Family Centers -Family Family Centers
In- Day Care Day Care Nonprofit For Profit In- Day Care Day Care Nonprofit ,For Profit
Home Homes Homes Total Private Public Private Home Homes Homes Total Private Public Private
Custodial care 85.57. 91,4% 77,5% 42.7% 42.2% 36.27 50.67 80.0% 80.9% 77.7% 40.4% 44.1% 36.3% 43.7%
Educational-
developmental 11,6 8.5 20.1 32.0 29.1 45,9 28.6 18.4 16.9 19.9 27.9 23.8 29.8 28.9
Other 2.9 0.1 2.4 25.3 28.7 17.9 20.8 1.6 2.2 2.4 31.7 31. 33.9 27.4
aRepresents perint of all time spent in providing child care.
60

while the profit-oriented centers spent about 5% of thir time on
administrative matters. In Denver, tbe distribution among proprietary
types with regard to the percent ot time spent in administrative
tasks was fairly uniform, ranging from about 13% for private for-
profit centers to a little over 16% for the public nonprofit centers.
Health Care Services
For centers, there is another possible indicator of the quality of
care provided--available health care services. Table 8 shows the
range and extent of involvement of centers in these services.' Public
centers seem much more likely to provide a wide range Df such health
services, although the other centers also provide a substantial
number. Except for dental checkups and psychological testing, the
Denver centers appear to provide very few health care services to the
children in their care, and when such care is provided, the Denver
centers are much less likely to pay for them than are the Seattle
centers.

Table 8
HEALTH CARE SERVICES PROVIDED TO CHILDREN IN DAY CARE CENTERS
Dental. checkups
Total
SEATTLEFor Profit
Total
DENVERFor Profit
Private
Nonprofit NonprofitPrivate Public Private Private Public
Percent proviciLig 17.9T 20.07 45.0% 0% 23.4% 23.1% 41.2% 5.9%
Percent paying forservice 41.7 28.6 60.0 0 9.1 33.3 0 0
Physical examinationPercent providing 16.4 14.3 45.5 4.8 8.5 7.7 11.8 5.9
Percent paying forservice 63.6 60.0 60.0 100.0 0 0 0 0
ImmunizationPercent providing 44.8 45.7 72.7 23.6 2.1 0 5.9 0
Porcent paying forservice 23.3 18.8 37.5 16.7 0 0 0 0
TB testsPercent providing 11.4 18.2 9.5 2.1 0 0 5.9
Percent paying forservice 62.5 50.0 100.0 50.0 0 0 0 0
Psychological testsPercent providing 11.9 8.6 9.1 19.1 27.7 30.8 41.2 11.8
Percent paying forservice 50.0 33.3 100.0 50.0 15.4 25.0 0 50.0

III SUPPLY CONSTRAINTS
In this chapter we will discuss barriers to !ntry, capacity
considerations, and some special needs of child care users. Data
regarding barriers to entry are concencd ni:Anly with the licensed
sectors of the day care industry, although the extent to which licens-
ing is enforced, especially with regard to IDCHs, will effectively
restrict entry into the unlicensed sector.
Barriers to Entry*
Day care licensing requirements are quite similar in Seattle and
Denver. The minimum requirements for licensing centers and FDCHs in
both cities are concerned with enforcement of fire and health code
standards, along with some restriction on staff/child ratios. The
latt,,,r condition is especially relevant for federally funded centers,
but again the regulations are similar in Seattle and Denver. In
practice, there are probably differences in the way that individual
fire or health inspectors view code enforcement, so that within-city
differences among inspectors may be as great as between-city differ-
ences. There may also be some variance with regard to case worker
concern and evaluation of the day care providers. However, both cities
have a fairly well-educated class of social workers, and our interviews
with some of them leads us to the view that there was no systematic
difference between the two cities concerning the way the case workers
judge the fitness of day care providers.
In both cities, the licensing regulations for centers and FDCHs
are in a state of flux. On the one hand there is pressure to simplify
*Much of the material on barriers to entry is concerned with licensingand zoning and is based on interviews conducted by Mae Stephen of SRI.

the regulations, while on the oLher there is pressure from the federal
level for more stringent regulations, especially with regard to staffing
of centers and child care training for FPCH providers Moreover, there
is a plethora of agencies (health, sanitation, zoning, building, and
fir e!. at state, county, and local levels that are involved in the
licensing process. Each brings a sometimes conflicting, and sometimes
costly, view of the minimum licensing standard requirements.
The actual enforcement of day care licensing regulations is a
relatively recent phenomenon in both Seattle and Denver. In conjuilction
with this, inspectors from health or fire departments tend to use
stanchrds developed and applied to other types of facilities or insti-
tutions when inspecting centers and FDCHs. For example, nursery schools
in Denver must be licensed, even though their -programs last only three
hours during the day.* Moreover, these nurseries must have commercial-
type dishwashers and cooking facilities if they serve any food.
The licensing staff in both Seattle and Denver feel that from the
point of view of the safety and development of the children cared for,
the licensing requirements are minimal at best. However, they also
feel that regulatory enforcement orthe day care industry is relatively
new, especially as,it pertains to facilities other than federally funded
,2e,Iters. They are also cognizant of the many violations of the rules,
end of the extent of unlicensed FDCHs in operation. The violations,
.;.,specially those concerning the number of children cared for at any one
time, occur in the licensed as well as unlicensed homes. n general,
the.licensing personnel also feel that they are grossly understaffed,
which means that they rarely make the required number of visits to each
facility to provide effective monitoring of licensed day care.
*This is not true for Seattle, where children must be in attendance for
at least four hours before licensing is required.
tLicensing is required for FDCHs in both cities, although the Seattlelicensing agency appears to be more diligent in getting the unlicensed
homes licensed.
III -2
Zoning restrictions are particularly burdenscime to centers. In
Denver, day care is treated as a light industry with regard to zoning.
Therefore, it is very difficult to obtain a permit to locate centers in
single family housing areas (R0 and R1). Seattle's zoning laws are far
more liberal and flexible, especially concerning FDCHs. Seattle
recently enacted legislation that allows up to twelve children to be
cared for in an FDCH,* whereas in Denver the maximum number of children
allowed in licensed FDCHs is four, with a zoning variance needed to
raise the number to six.t
Overall licensing standards for FDCHs are not considered too
excessive in either Seattle or Denver. Although it is not true thP.t
only a "fence and a phone" are needed to obtain a license, it is true
that most applicants have little trouble becoming licensed FDCH
operators. In Denver, less than 5% of all licensed FDCHs needed to
make any change in their facility (which, of course, was their own
home) that cost more than $100, in order to meet fire or safety
standards. In Seattle, almost 14% of the FDCH operators had to expend
that sum to mc.et the required standards.
On the average, the waiting time for acquiring an FDCH license is
not very long. Almost 75% of the operators in both cities waited only
i'wo months or less for their license to be approved, with almost 60%
waiting no more than one month. However, about 6% of all licensed
FDCH providers had to wait at least six months for their license.
Moreover, there appears to be a considerable amount of turnover among
liccmsed FDCH operators. In Seattle, only 13% of the FDCH vendors had
*If more than six children are cared for, an adult assistant must be.there. Therefore, the maximum child/staff ratio remains 6:1. Therehas also been an attempt to classify FDCHs licensed for seven to twelvechildren as minicenters, which would change their licensing requirements.
tIn general, it is not difficult to obtain a zoning variance that.allows up to six children in an FDCH.
'The new child/staff requirements proposed under the title XX Amendmentto the Social Security Act will make the standards for FDCHs reCeivingfederal funds a bit more stringent, or costly. See S. Weiner [26].
III-3

their current license for five years or more, while slightly over half
had it for less than one year. In Denver, about 16% had their license
for at least,five years, and almost 40% had it fot less than one year.
This is due only partly to turnovcr of existing operators, being attrib-
utable also to the emphasis on licensing of FDCHs during the past
several years, especially in Seattle.
In Denver, we also found that: over a third of the centers had been
licensed for at least five years, while less than one-fourth had been
licensed for that long in Seattle. As the proportion that have been
licensed for less than one year is far higher in Seattle than in Denver
(one-third versus one-fifth), it appears that the development of
centers in Seattle has been a relatively recent occurrence, although
there are some that have been in operation for a long period. More-
over, the growth has been most rapid for nonprofit centers in Seattle.
As we saw above, obtaining a zoning variance is more importqnt for
centers than for FDCHs. In Dent;-e-r-, almost a third of all centers had to
obtain a zoning variance, whereas only a fifth of the Seattle centers
needed to obtain such a permit. There was also quite a bit of variation
within the center sector,in Seattle. About a third of the private for-
profit centers in Seattle required a zoning variance, while less than a
tenth of th,' r.onprofit public centers did. In Denver, about a third of
each proprietary type needed a zoning variance.
In Denver, new fire standards were also put into effect on Janu-
ary 1, 1973. These standards implied some large expenditures, as they
required panic hardware on doors,*
one-hour fire proof doors, and a
requirement that every room have an outside exit. These new standards
forced some of the private nonprofit centers (mainly church-organized)
to close down their day care facilities because they couldn'e afford
the changes.
These are long handles that need only body pressure to open the door.
Theaters generally have them.

Capital requirement is of coarse another important barrier to
entry for centers.*
Our measure of capital cost includes only the
current market value of equipment, durables, vehicles, and average cost
of structural changes made prior to receiving a license.t Unfortunately,
Oie to a lack of reliable facility cost data, or other data with which
such costs could be estimated (such as square feet of space used), we
were not able to include the most important capital cost compr'nent:
structure cost. In the rrivate nonprofit sector, we did fine t',t many
centers were housed in caurches. So assignment of the appropriate
facility ccst to the child care operations would have been very tenuous,
evea if overall facility cost data were available. Even with the
obvious downward bias due to the exclusion of facility costs, we found
that the average capital cost, as defined above, was $11,254 in Seattle
aad $19,026 in Denver. Although these are not trivial figures, they do
not, by themselves, impose any serious barrier to entering the center
sector. The average current market value of equipment and vehicles per
currently enrolled child is also a reasonably low absolute amount:
$.27 for all centers in Seattle and $80 in Denver, with a high of $231
for public centers in Seattle and a high of $111 for private for-profit
centers in Denver. (See Chapter V for more detailed data on costs.)
Capacity Considerations
The capacity of centers is given by the number of children for
whom the center is licensed to provide care, a number based on meeting
certain requirements, such as having the required child/staff ratio.
We have constructed our own measure of capacity for I-H and FDCH pro-
viders (see footnote to Table 9).
We examined the capital cost for FDCHs as well.
Almost 56% of the 108 changes made in 44 centers in SePttle were tomeet fire or safety standards; in Denver, almost 48% of the 108changes in 35 centers were for these reasons.
111-5
,

CapacIty utilizatiun in Seattle and Denver is presented in Table 9.
In the discussion to follow, we will use center capacity as measured by
the ratio of full time equivalent enrolled children to licensed capac-'
ity, rather than using total current enrollment in the numerator.
Using that measure, we find in Table 9 that in Seattle, the unlicensed
FDCHs and the centers, as a whole, experienced the shme level of capac-
ity utili? -ion, while the I-H sector showed a somewhat higher degree
and th,.! licensed FDCHs a much lower. Within the center sector in
Seattle, we find the private for-profit centers showing the same level
of utilization as the I-H sector, while the public centers were much
closer to the rate found for licensed FDCHs.
In Denver, the relationship among sectors with regard to capacity
utilization was quite different from that found in Seattle. Licensed
and unlicensed FDCHs showed a fairly similar rate of utilization, while
the I-H sector rate was slightly higher. Centers in Denver showed a
much higher utilization rate, both overall and for each of the three
proprietary types.
In general, there is about a 15% to 20% underutilization of measured
capacity ih the day care industry in Seattle and Denver. Analogous to
what has been found in industrial activities, it may be that day care
providers reach an.optimum level of efficiency, in terms of their inter-
action with children cared for, at about 85% utilization Of their child
caring capacity.
Although the overall average level of capacity utilization is aboue
85%, there are significant numbers of day care providers in the differ-
ent sectors who ut1li.ze 100% (or more*
) of their capacity, according to
our measures. Ih L1r I-H sector, almost half of the Denver and three-
Iourths of the Seattle providers uZi1ize 100% of their capacity; in the
unlicensed FDCH sector, th 9. percentage with 100% utilization ±s far
less, about one-tuentieth in Seattle and oh-tenth in Denver; in the
licensed ETCH sector; about one-third utilize their ..apacity fully.
See :Ible 9, footnote b.
111-6

Table 9
PERCENT OF CAPACITY UT1LIZEDa
SEATTLE DENVER
Unlicensed Licensed Unlicensed Licensed
Family Family Centers Family Family Centers
In- Day Care Day Care Nonprofit For Profit In- Day Care Day Care Nonprofit For Profit
Home Homes Homes Total Private Public Private Home Homes Homes Total Private Public Private
93.07 84.0% 66.0% 85.17, 83.7% 74.7% 92.7% 85.0% 78.0% 76.0%
(98.6) (97.8) (83.2) (107.3)
96.6% 99.6% 102.3%° 90.9%
(109.9) (113.1) (118.6) (102.2)
a[or 1-7 ad ACP. .idors, the percent of capacity utilized was constructed as follows: (1) we obtained the maximum number
of ohildri.11 aken :are of for pay during any day of the week; (2) we multiplied that figure by the maximum nuMber of hours
that the providtq took care of children for pay during each day of the week, which is our measure of capacity; (3) the sum
of item (2) w;is then divided into the actual hours of paid care that the provider stated that she had worked during the
week, which is the percentage of capacity utilized. For centers, it represents the ratio of full time ecuivalent enrolled
children to licensed capacity, multiplied by 100; and in parentheses it represents the ratio of currently enrolled children
to licensed capacity, multiplied by 100.
bFor centers, capacity utilization is measured as the ratio of current enrollment (as of the survey dati) to the number of
--children for whom the center is licensed to provide care. Since current enrollment includes part as well as full time
children:the ratio sometimes exceeds 1.0.
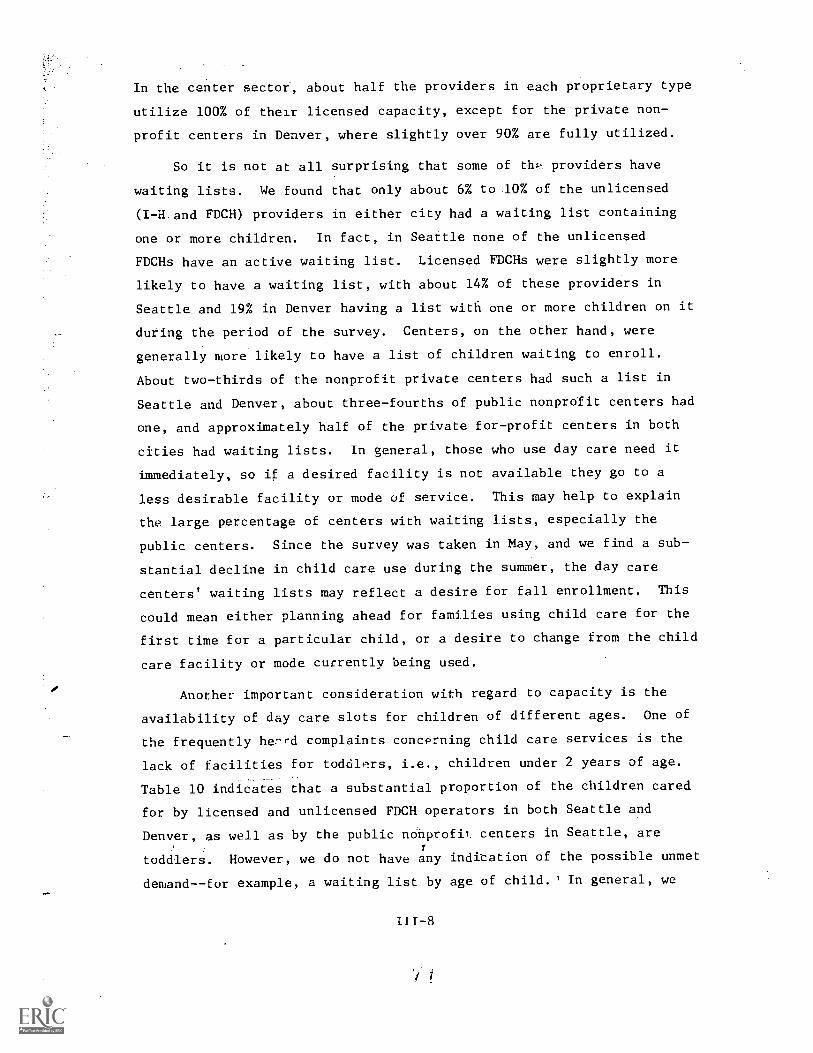
In the center sector, about half the providers in each proprietary type
utilize 100% of their licensed capacity, except for the private non-
profit centers in Denver, where slightly over 90% are fully utilized.
So it is not at all surprising that some of thL, providers have
waiting lists. We found that only about 6% to 10% of the unlicensed
(I-H and FDCH) providers in either city had a waiting list containing
one or more children. In fact, in Seattle none of the unlicensed
FDCHs have an active waiting list. Licensed FDCHs were slightly more
likely to have a waiting list, with about 14% of these providers in
Seattle and 19% in Denver having a list with one or more children on it
during the period of the survey. Centers, on the other hand, were
generally more likely to have a list of children waiting to enroll.
About two-thirds of the nonprofit private centers had such a list in
Seattle and Denver, about three-fourths of public nonprofit centers had
one, and approximately half of the private for-profit centers in both
cities had waiting lists. In general, those who use day care need it
immediately, so if a desired facility is not available they go to a
less desirable facility or mode of service. This may help to explain
the large percentage of centers with waiting lists, especially the
public centers. Since the survey was taken in May, and we find a sub-
stantial decline in child care use during the summer, the day care
centers' waiting lists may reflect a desire for fall enrollment. This
could mean either planning ahead for families using child care for the
first time for a particular child, or a desire to change from the child
care facility or mode currently being used.
Another important consideration with regard to capacity is the
availability of day care slots for children of different ages. One of
the frequently he7-rd complaints concerning child care services is the
lack of facilities for toddlrs, i.e., children under 2 years of age.-
Table 10 indicates that a substantial proportion of the children cared
for by licensed and unlicensed FDCH operators in both Seattle and
Denver, as well as by the public ncinprofit. centers in Seattle, are
toddlers. However, we do not have any inditation of the possible unmet
demand--for example, a waiting list by age of child. In general, we
111-8

found that centers were less likely to have children under 2 enrolled
than were the other sectors. 'In fact, 85% of all the Seattle centers
and almost 90% of those in Denver had no children under age 2 when
interviewed, while in both cities, almost none of the private for-
profit centers provided care for toddlers.
Aside from their age, it is of interest to note the average number
of children cared for by the various provider groups. With the excep-
tion of centers, providers in the different sectors in both cities care
for approximately the same number of childre;., on the average, as shown
in Table 10. That is, the I-H providers in Seattle are comparable with
the I-H providers in Denver with regard to the average number of children
cared for, etc. For centers, the average number of children cared for
in Denver is significantly higher than in Seattle. The variance is also
greater for centers in Denver, where the largest center cared for 230
children. We also see in Table 10 that the public centers in Denver
can be quite large, whereas the largest public center in Seattle had
less than one-third the maximum enrollment found in Denver.
Another relevant fat. Dr regarding capacity is the number of hours
of care provided. In the informal sectors, we find that providers in
Seattle spend far fewer hours taking care of children. I-H providers
in Seattle showed an average of 21 hours of care per week versus 38 in
Denver, and the unlicensed FDCHs in Seattle provided an average of 30
hours of care per week versus 39 in Denver. In the formal sectors, the
average hours of care per week in both cities was about 45.
Sick-Child Care
Another important aspect of child care service is whether it is
provided to users when the child is ill. We asked whether a child with
a minor illness, other than a simple cold, would, when ill, be taken
care of during Lhe hours that the child would normally have been cared
for. The I-H providers almost all reported that they would take care
of such children (see Table 11). The percentage dropped considerably
fGr unlicensed FDCHs in both cities, but there were still about
III-9

Table 10
ACE OF CHILDREN USING DAY CARE AND NUMBER OF CHILDREN CARED FOR
SEATTLEDENVER
Unlicensed Licensed Unlicensed Licensed
Family Family Centers Family Family Centers .
In- Day Care Bay Care Nonprofit For Profit In- Day Care Day Care Nonprofit For Profit
Home HoMes Homes Total Private Public Private Home Homes Homes Total Private Public Private
Age (percent of
total)
Less than 2 years 9.8%
2-5 yearsa 47,6
6 years and overb 42,6
Mean age° 5,3
Average number of
children currently
enrolled or cared
for 1.9
Maximum number
currently enrolled 3
a2-4 years for centers
b5 years and over for centers
cEstimates for centers
ci
29,1% 16.2% 4,1% 3.2% 16.6% 0.5% 7.5% 18.2%
48.8 52.9 69.5 71.6 54.0 71.8 47.2 50.6
22.1 30.9 26.5 25.2 29.4 27.7 45.3 31.2
3,6 4.6 4.0 3.9 3.8 4.1 5.7 4.7
3.2 5,2 41.9 46.1 29.6 41.1 1.8 3.7
7 14 135 135 66 120 2 12
21.1% 2.72 3.9% 4.8% 0%
57,7 68.4 65.9 70.8. 67.5
21.2 29.0 30.4 24,4 32.6
4.0 4.1 4.1 3,9 4.3
4.6 60,1 54.3 59.9 64.6
10 230 87 215 230

three-fifths in Seattle and over two-fifths in Denver who would provide
ill-child care. However, in the licensed FDCH settor, only about one-
fourth to one-third of the providers in either city provided such care,
while a very small percent of the centers in either city would accept
children with a minor illness. On the other hand, for the most preva-
lent of the minor childhood illnessr,.s (a simole cold), almost all pro-
viders in both cities said that they would accept such children for
regular care. For working mothers, being able to leave their children
with a day care provider when the child has a minor illness is an
important consideration in maintaining a steady work record.
Information
Most of the day care users found out about the child care services
through friends, neighbors, or relatives. This was true in both cities
and in all sectors. However, both Denver and Seattle provide a free
day care referral service for licensed facilities. In Seattle, the
service is provided by Depertment of Social and Health
Services, whereas in De.:v,c,' is provided by a nonprofit agency, the
Mile High Child Care man. The percentage of all children
enrolled in licenseL !s who were referred by these agencies is
relatively low, abou 3.0Z in both cities, with Seattle being in
the higher range. Ae percentages in both cities were
considerably higher 11, rA.ic nonprofit centers.

Provides care foi
sick child during
regular day of
child care
Takes care of child
with uld for regular
# day of care
Table 11
CARE PROVIDED FOR SICK CHILD
(Percent)
SEATTLE DENVER,
;'.Acensed Licensed Unlicensed Licensed I
Family Family Centers Family Family Centers,2.__In- Day Care Day Care Nonprofit For Profit In- Day Care Day Care N64L For Profit
dome Homes '',.., Total Private Public Private Home Homes Homes Total Private Public Private
..._ _
88,11 59,31 33,22 7.5% 11.4% 02 4.8% 85.0% 43,3% 26,4% 10.6% 15,4 5,9% 11,81
.1, 1 92,3 90,3 87.1 100,0 90,0 NA 96,6 95.1 76,2 73.7 75.0 80.0

IV INCOME
This chapter highligh- all the relevant data concerned with
revenues, whether they came from fees or subsidies. The discussion
will be grouped into three main subsections: subsidies, revenue and
fees, and a brief discussion of the relative importance of day care
vendor earnings in total family income.
Subsidies
In Denver, a private nonprofit group--the Mile High Child Care
Association (MBCCA)--provides about one-fourth of all 7icensed child
care. They operate under a contract with the City/County of Denver
that pays MHCCA about $7.50/child/day for children enrolled in their
centers, and about $4.00/child/day for children enrolled in their family
day care homes.*
The children are from low-income families, coming mainly from WIN
program participants, AFDC families, or eligible model city families.
Users of MHCCA facilities make very little direct payment, if any, for
child care services. A fee is charged if family income exceeds stipu-
lated amounts, given family size. However, MECCA never benefits from
any fee charged to the user, since user fees are subtracted from the
contract rate guaranteed by the county. The MHCCA also provides a
general child care referral service for licensed care that is available
to anyone in Denver.
Although MECCA provides about one-fourth of all licensed day care
in Denver, they provide a larger percentage of the licensed care for
*These rates are considerably higher than the Welfare Department's childsubsidy rates in Denver, which in 1974 ranged from $3.00/day for thefirst child in a family that used child care to $1.90/day for the thirdand subsequent children from the same family.

preschool children. Prior to late 1973, 'idCCA facilities were used
only for preschool children. Since that date, however, they have started
to get into programs that will provide day care for all children less
than 13 years of age.
For centers, subsidy payment:from the Department of Welfare in
Denver goes directly to the vendor. If the child is cared for by an
FDCH operator, licensed or unlicensed, the subsidy payment is made to
the vendor only upon the written request of the day care user. Subsidy
payment for I-H providers, including relatives, is allowed and is made
to the tu,er. An I-H provider who is related to the user must be over
16 and have foregone a paid position because of the child care duties,
in order for the child to be eligible for a subsidy.
The Seattle welfare department also allows subsidies to be paid
for child care by I-H providers who are related to the child. One dif-
ference is that in Seattle the provider must be at least 18 years of
age. Reimbursement for I-H care goes only to users of the service;
however, since August, 1973, subsidy payments for centers and FDCHs
(only licensed, since unlicensed FDCHs are illegal*) are made directly
to the vendor. Moreover, since early 1974, famil,es with two finan-
cially responsible adults present are also eligible for day care subsidy
under stipulated conditions, mainly where both are working and/or in
training, or one is disabled. In Seattle, vendors are also confined to
a maximum charge for subsidized children that is less than or equal to
the subsidy rate. That rate for centers and FDCHs, as of mid-1974, was
$5.31 per day for the first child in a family, $4.79 per day for the
second child, and $4.26 for the third child, with a. overall limit per
family of $265.00 per month. For I-H care, the E-Ibsidy rates cannot
exceed $0.75 per hour for the care of one to three children, and $1.00
per hour if four or more children are cared for.
*They are also illegal in Denver, although, as pointed out above, enforce-ment of the law in Denver was not as stringent in 1974 as it was inSeattle.
IV-2

Table 12 shows the percent of child care users who are subsidized.
There is very little intercity comparability in the percentages found,
except for the fact that in both cities the public centers had far and
away the largest percentage of users faho were subsidized. In Seattle,
we found that the percent subsidized was similar for the informal sec
tor providers, and also for the formal sector providers. These rela
tionships were especially valid for the fully subsidized users. How
ever, witl-in the center sector, as pointed out previously, the percent
of subsidized users was far greater for the public centers. In Denver,
the licensed and unlicensed FDCHs, along with all centers, had a roughly
comparable rate of user subsidization, whereas the IH providers showed
the highest percentage of users being subsidized, not including the
public centers.
In discussions with public and private agents concerned with child
care in Seattle and .Denver, we found that it is far easier for unlicensed
vendors to be approved as recipients of child care subsidies in Denver
than in :;eattle, i.e., that children cared for by unlicensed vendors
are more likely to be eligible for a subsidy in Denver. Moreover, the
Denver agencies appear to he more liberal with regard to the paymenE of
a subsidy for a child cared for by an IH provider who is also related
tu the child. These reasons largely explain the much higher percent of
fully subsidized children using unlicensed care in Denver.
Another way of looking at these phenomena is through the data pre
sented in Table 13. There we see that Black and Chicano children whose
fees are subsidized are more likely to use unlicensed care. From Table
13 we see that there is a sharp drop in the percent of users who are
subsidized, for each racial group, between the licensed and unlicensed
FDCH sector in Seattle, whereas in Denver that is not true for Chicanos
or Whites, and far less important for Blacks.
The center sector caters to a higher income clientele in Denver then
in Seattle, as shown in Table U. In the former city, only about one
fourth of the users are subsidized, whereas in Seattle over onethird
are subsidized. This is even more noticeable for the private forprofit
centers in Denver, where almost none of the users are subsidized, while
in Seattle over onefifth of similar users are subsidized.
1V-3
k
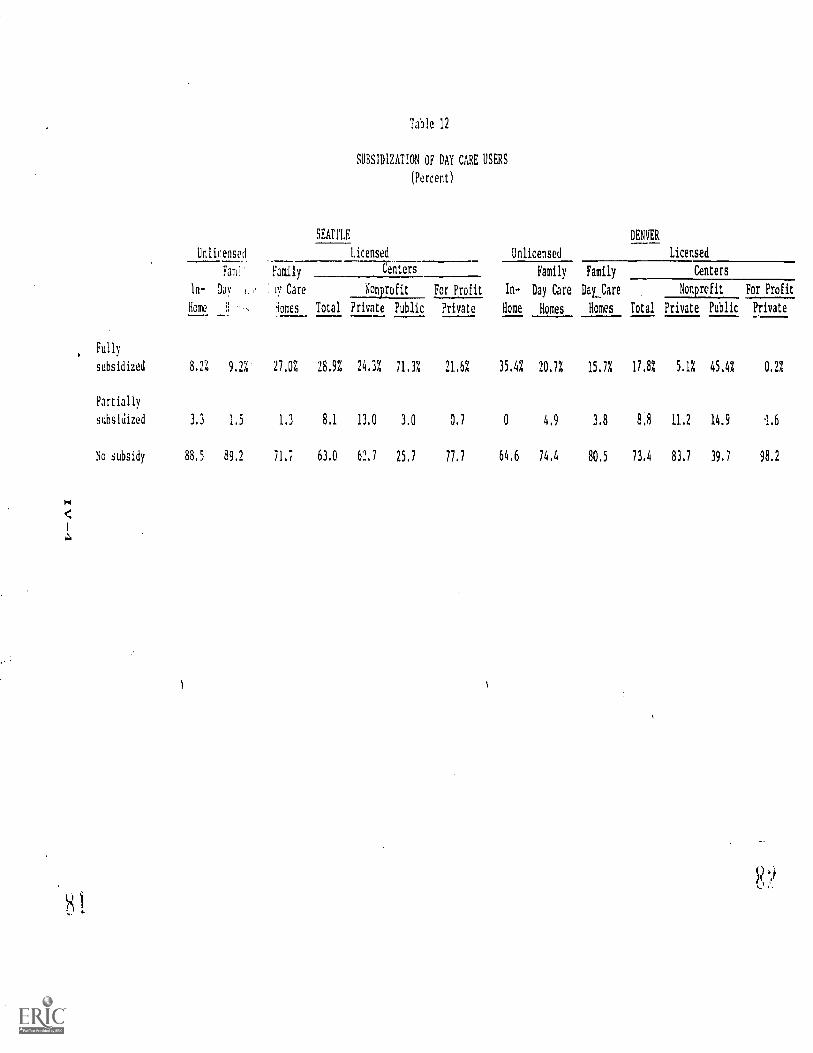
Table 12
SUBSIDIZATION OF DAY CARE USERS
(Percent)
SEATTLE DENVER
Unlicensed Licensed Unlicensed Licensed
Fam Family --Centers Family Family Centers
In- Day ,:o ! iy Care Nonprofit For Profit In- Day Care DaLCare Nonprofit For Profit
Home _ki - 'domes Total Private Public Private Home Homes Homes Total Private Public Private._..... _____ _
Fully
subsidized 8,2%. 9,2% 27,0% 28.9% 24.3% 71,3% 21.6% 35.4% 20.7% 15.7% 17.8% 5.1% 45,4% 0.2%
Partially
subsidized 3.3 1,5 1.3 8.1 13.0 3.0 0.7 0 4.9 3.8 8,8 11.2 14.9 1.6
No subsidy 88,5 89,2 71.7 63.0 62.7 25.7 77,7 64.6 74.4 80.5 73.4 83.7 39,7 98.2
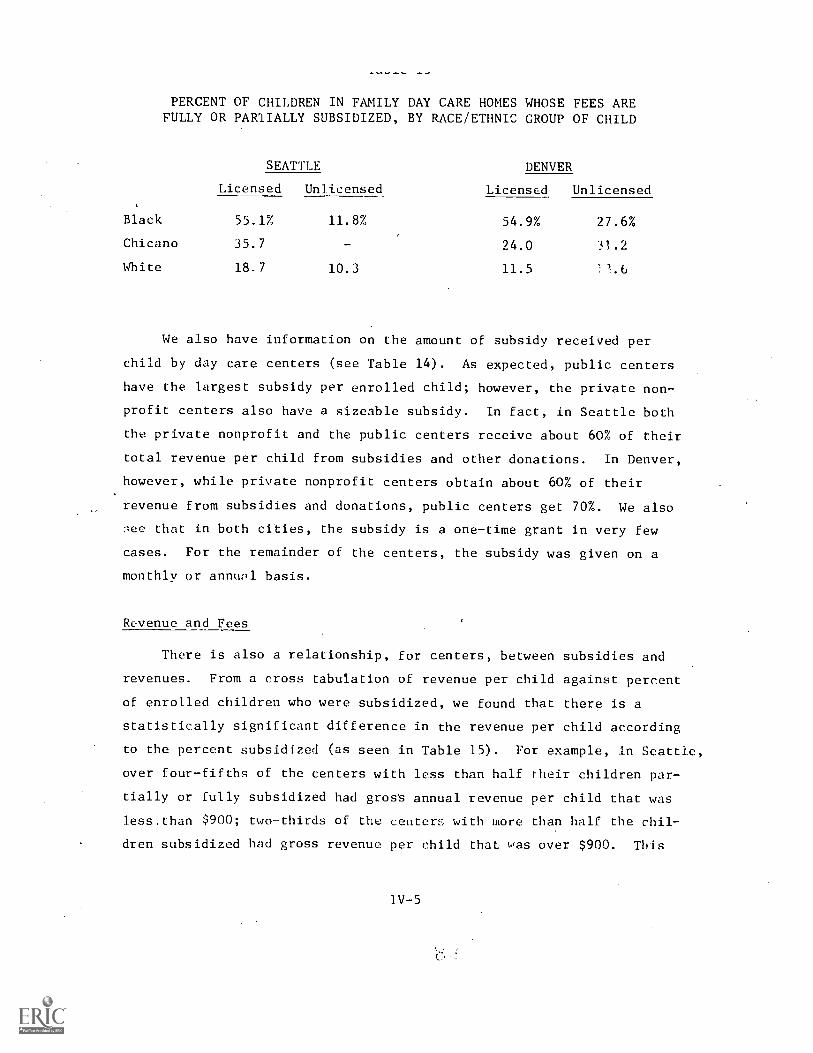
PERCENT OF CHILDREN IN FAMILY DAY CARE HOMES WHOSE FEES AREFULLY OR PARlIALLY SUBSIDIZED, BY RACE/ETHNIC GROUP OF CHILD
SEATTLE DENVER
Licensed Unlicensed Licensed Unlicensed
Black 55.1% 11.8% 54.9% 27.6%
Chicano 35.7 - 24.0 i1.2
White 18.7 10.3 11.5
We also have information on the amount of subsidy received per
child by day care centers (see Table 14). As expected, public centers
have the largest subsidy per enrolled child; however, the private non-
profit centers also have a sizeable subsidy. In fact, in Seattle both
the private nonprofit and the public centers receive about 60% of their
total revenue per child from subsidies and other donations. In Denver,
however, while private nonprofit centers obtain about 60% of their
revenue from subsidies and donations, public centers get 70%. We also
rzee that in both cities, the subsidy is a one-time grant in very few
cases. For the remainder of the centers, the subsidy was given on a
monthly or annual basis.
Revenue and Fees
There is also a relationship, for centers, between subsidies and
revenues. From a cross tabulation of revenue per child against percent
of enrolled children who were subsidized, we found that there is a
statistically significant difference in the revenue per child according
te the percent subsidized (as seen in Table 15). For example, in Seattle,
over four-fifths of the centers with less than half their children par-
tially or fully subsidized had gros's annual revenue per child that was
less.than $900; two-thirds of the centers with more than half the chil-
dren subsidized had gross revenue per child that was over $900. This
IV-5
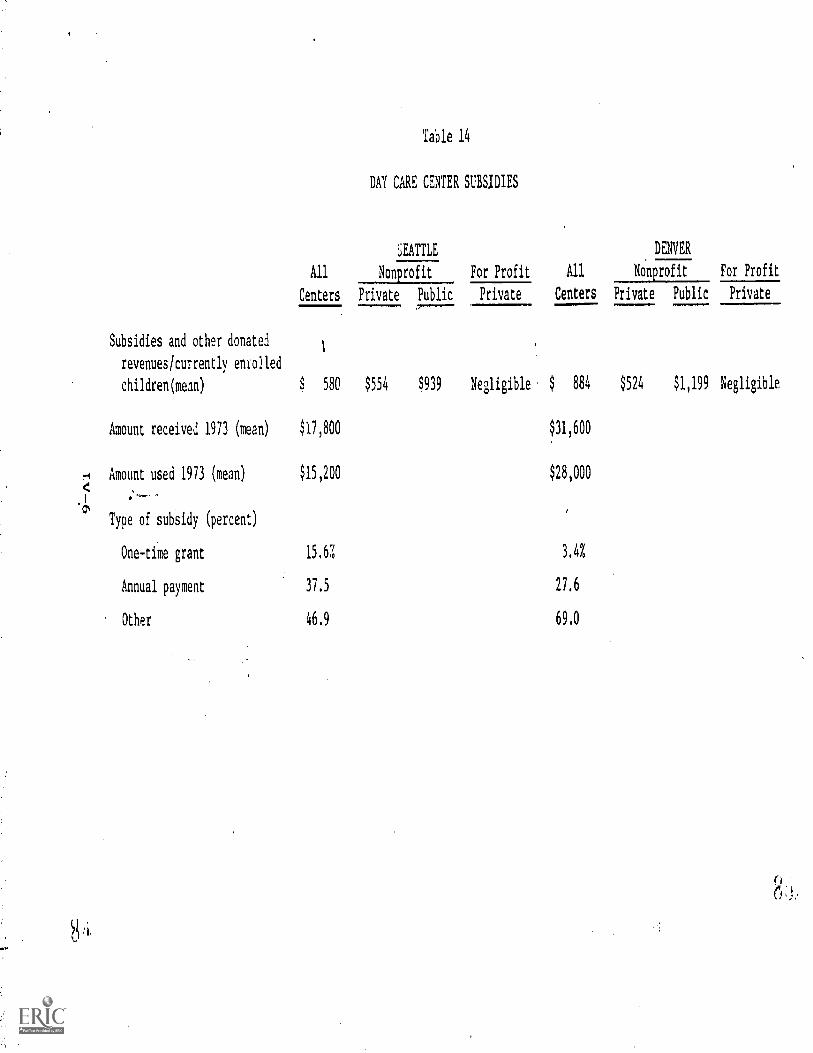
Table 14
DAY CARE CENTER SUBSIDIES
SEATTLE DENVER
All Nonprofit For Profit All Nonprofit For Profit
Centers Private Public Private Centers Private Public Private
Subsidies and other donated1
revenues/currently enrolled
children(mean) $ 580 $554 $939 Negligible $ 884 $524 $1,199 Negligible
Amount received 1973 (mean) $17,800 $31,600
H Amount used 1973 (mean) $15,200 $28,000
,1
Type of subsidy (percent)
One-time grant 15.6% 3.4%
Annual payment 37,5 27.6
Other 46.9 69.0

Table 15
CROSS TABULATION BETWEEN REVENUE PER CHILDAND PERCENT OF CHILDREN SUBSIDIZED, CENTERS
Gross Annual Revenue/Child(1973)
Percent of All ChildrenEnrolled Who Are Fullyor Partially Subsidized
Less than 50% or50.0% more
Seattle
Less than $900 81.6% 18.4%
$900 or more 33.3 66.7
N = 62
Chi square level of significance
= 0.0004
Denver
Less than $900 91.7 8.3
$900 or more 35.0 65.0
N = 44
Chi square level of significance
= 0.0003

implies that the conters' gross revenue increases with an increase in
.subsidized users. This result holds for both cities and is somewhat
more pronounced in Denver.
Gross earnings per month oer ,curreiltly enrolled child were cal-
culated for all sectors, as were the corresponding fees per hour. The
results of these calculations are presented in Tables 16 and 17. In the
unlicensed (informal) sector in both Seattle and Denver, the earnings
per child are very low, averaging about $20 to $30. Earnings per child
rise somewhat for the licensed FDCH operators, at $42 per month in both
cities. For the centers, there is a more substantial increase in the
average gross monthly earnings per child.* Both cities are roughly
comparable in their earnings per child, with the public nonprofit cen-
ters showing the highest earnings.figure, approximately $140 per month
per Child in bollh Seattle ,.nd Denver. Table 16 also shows that there
was a large variance in the gross earnings per child in all seCtOrs
for both cities, illthough almost all child care providers, except for
centers, had gross monthly earnings per child of less than $100. In
the center sector, about three-fourths of the public centers had
averaged more than $100 per month per cild of gross earnings, with
.about one-fourth of the Denver public centers receiving more than $200
per month per child.
It is of some interest to compare these earnings figures with
standards of care, according to cost, estimated by others. The
Cb'.1drents Bureau of DHEW established the following costs per child per
month for mid-1974T for three levels'of care in child care centers:
*For centers, we really refer to gross revenue, since subsidies and
donations are included, whereas 'or the other sectors there is very
little involved other than earnings.
IThe Children's Bureau figures were given as cost per child per year for
1968. We divided their figures by 12 to get a monthly average; then
we adjusted their costs to reflect price level changes to mid-1974.
IV-8

Gross monthly carlinv
per currently c;
childa (dollars
Maximum gross monthly
earnings for current;
enrolled child. (doDis'
1.1
< Percent with gross moW ly
I earnings per currently
enrolled child , $101.!
Percent with gross mond0
earnings per currently
enrolled child ) $200
CROSS MONTHLY EARNINGS
SEATTLEDENVER
---7Unlicensed _________
licensed Unlicensed Licensed
Family 1 v Centers Family Family Centers
In- Day Care Day Nonprofit For Profit In- Day Care Day Care Nonprofit For Profit
dome Homes Hoo, )tal Private Public Privatc Home Hones Homes Total Private Public Private
$ 18 $ 19 $ 42 77 $ 138 $ 64 $ 28 22 $ 42 $ 101 $ 76 $ 143 $ 71
i02 104 131 .U 18',' 190 107 6o 99 143 275 238 275 114
V).0% 96.3% 93,9 i.2i :5X 21,21 951U 100,0% 100.01 95.2% 61.4% 84.6% 23.5% 85.7%
0 0 0 0 0 0 0 0 0 0 11,5 7.7 23,6 0
aFor 1 and both FDCH sectlrs, this is gross earnings during April, 1974, divided hy the average number of children cared for during that reporting
period; for renters, it is '..otal revenue, including subt,idies, donations, etc., fo: 1973 per currently enrolledchild during May, 1974, with the
revenue adjusted for May, 1914, prim, and the sum diviled by 12,
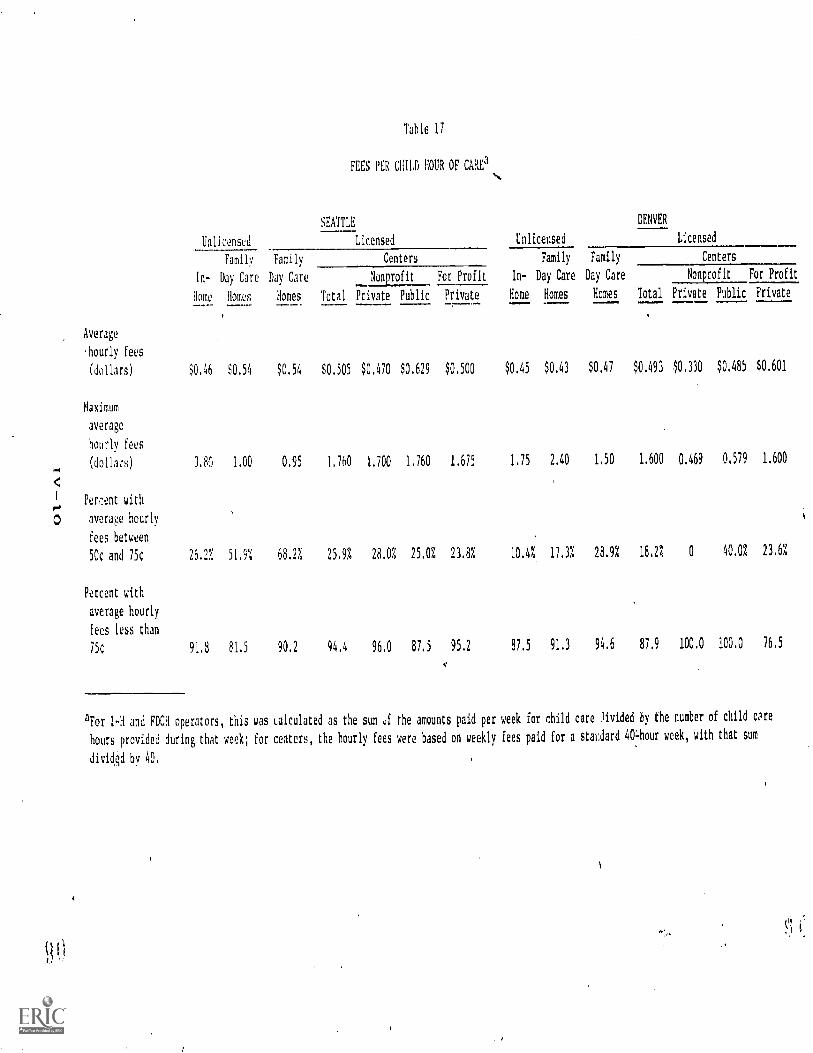
0.1
0
Average
.hourly fees
(dollars)
Maximum
average
hourly fees
(dollars)
Percent with
average hourly
fees between
50c and 75c
Percent with
average hourly
fees less than
75c
Table 17
FEES PER CHILD HOUR OF CAREaN,
SEATTLE DENVER
Unlicensed Licensed Unlicensed Licensed
Family Family Centers Family Family Centers
In- Day Care Day Care Nonprofit For Profit In- Day Care Day Care Nonprofit For Profit
Home Homes Homes Total Private Public Private Home Homes Homes Total Private Public Private
$0.46 $0.54 $0.54 $0.505 $0,470 $0.629 $0.500 $0.45 $0.43 $0.47 $0.493 $0.330 $0.485 $0.601
3.80 1.00 0.95 1.760 1.700 1.760 1.675 1.75 2.40 1.50 1.600 0.469 0,579 1.600
26.2i 51.9% 68.2% 25.9% 28.0% 25.0% 23.8% 10.47. 17.37. 28.9% 18.2% 0 40.0% 23.6%
91.8 81.5 90,2 94.4 96.0 87.5 95.2 87.5 91.3 94.6 87.9 100.0 100.0 76,5
aFor I-H and FDCH operators, this was Lalculated as the sum uf the amounts paid per week for child care Jivided by.the number of child care
hours provided during that week; for centers, the hourly fees were based on weekly fees paid for a stadard 404our week, with that sum
diviAd by 40.

Minimum $136/month/child
Acceptable $204/month/child
Desirable* $254/month/child
Our survey data for centers (Table 16) show that, on the average, only
the public centers in either city came up to the costs needed to meet
the minimum standards of care.± Even when we look at the maximum earn-
ings figure, we find that some public centers in Denver earn slightly
more than is needed to maintain a desirable level of cal, , while some
private nonprofit centers are.not too far below.that figure. In Seattle,
both nonprofit components are slightly below the acceptable level,
insofar as earnings needed to sustain required costs. Moreover, in both
cities the private for-profit cent(,rs have earnings that would prevent
them from spending enough to achieve the minimum level of care developed
by the Children's Bureau. (See also Chapter V for another estimate of
the cost of adequate custodial care.)
From Table 17, we find that in Seattle the average fees in all
sectors range from about 45c to 63c per hour, while in Denver the
average goes from 33c to 60c per hour. In most cases in both cities,
over nine-tenths of all children pay less than 75c per hour for care;
in all cases, over three-fourths of the children are charged fees less
than that amount. However, in Seattle there is a very large variance
between the average and the maximum fees charged by all providers,
except by the nonprofit components of the center sector; in Denver, the
variance is very large for all but the FDCH provider, where the range
between average and maximum is not as marked.
*A study of high-quality centers conducted by Abt Associates came upwith a cost per month per child, adjusted for 1974 prices, of $259.
tWe assume that gross earnings are the total amount that will be spent,and therefore, that they are equivalent to the actual costs incurred.This probably implies a downward bias due to volunteer help and donatedsupplies.
1ssuming they were to cover at least full cost. Moreover, volunteerhelp and donated supplies are far less important for the private for-profit component of the center sector.
IV-11

Finally, to see whether reasonable predictions for earnings could
be made from the data collected, and to see whether there were any racial/
ethnic differences in those predictions, gross quarterly earnings for
the first quarter of 1974 were regressed against seventeen independent
variables for unlicensed FDCH operators in Denver* and against sixteen
independent variables for licensed FDCH operators in Seattle and Denver.
The results of these regresSions can he seen in Tables 18 and 19. For
the unlicensed FDCHs in Denver, we find from Table 18 that the signifi-
cant coefficients are not unexpected. It is of some interest to note
that earnings tend to increase with an increase in the proportion of
the children cared for who are fully subsidized.t We also find that
earnings increase for the oldest group of providers.
Similarly, in the estimated regression for licensed FDCHs there
are no surprises in the signs of the significant coefficients, although
there certainly is no theoretical justification for earnings to increase
with the proportion of Black chil4en being cared for, as in Seattle.
Using the estimated regressions along with the mean values of the
independent variables, we can predict gross monthlyT earnings for the
FDCH operators. The predicted values are all shown in Table 20.. Divid-
ing these values by the average number of children taken care of during
the survey period,.we find that the predicted gross monthly earnings
per currently enrolled child are somewhat lower in each instance from
the values shown in Table 16. However, the predicted values are within
one standard error of the actual measured earnings....
*There were insufficient observations in Seattle to use in estimating
the specified regression equation f . at city.
iThis is consistent with.the results :cund fcr centers, using a cross
tabulation between revenue and perce:-. subsidized.
.-The predicted value of gross quarterly earnings ,as simply divided by
3 to obtain monthly value, for comparison with the data in Table 16.
.1V-12
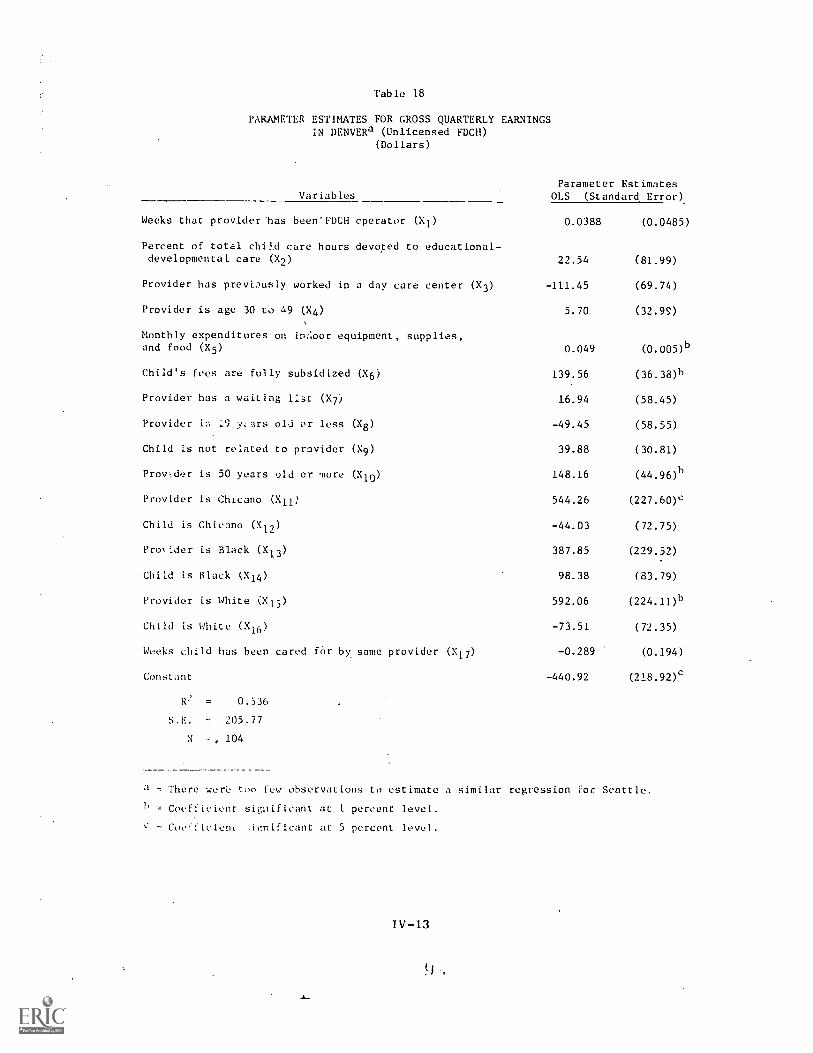
Table 18
PARAMETER ESTIMATES FOR GROSS QUARTERLY EARNINGSIN DENVERa (Unlicensed FDCH)
(Dollars)
VariablesParameter Estimates
OLS (Standard Error)
Weeks that provider-has been'FDCH cperator (XI) 0.0388 (0.0485)
Percent of total chil.d care hours devoted to educational-developmental. care (X9) 22.54 (81.99)
Provider has previously worked in a day care center (X3) -111.45 (69.74)
Provider is age 30 to 49 (X4) 5.70 (32.9)
Monthly expenditures on imloor equipment, supplies,and food (X5) 0.049 (0005)b
Child's fees are fully subsidized (X6) 139:56 (36.38)h
Provider has a waiting 113t (X7) 16.94 (58.45)
Provider I9 y,ars old or less (X8) -49.45 (58.55)
Child is not related to provider (X9) 39.88 (30.81)
ProvLder is 50 years old er more (X10) 148.16 (44.96)b
Provider Is Chicano (X11; 544.26 (227.60)c
Child is Chicano (X12) -44.03 (72.75)
Pro'Ider is Black (X13) 387.85 (229.52)
Child is Black (X14) 98.38 (83.79)
Provider is White (X15) 592.06 (224.1l)b
Child is White (X16) -73.51 (72.35)
Weeks child has been cared for by same provider (X17) -0.289 (0.194)
Constant -440.92 (218.92)c
= 0.536
S.E. = 205.77
N =, 104
a = There wtr oo fuw observations to estimate a similar regression ;'.or Seattle.
h = Coefficient significant at L percent level.
CoetlicienL ;inificant at 5 percent level.
IV-13
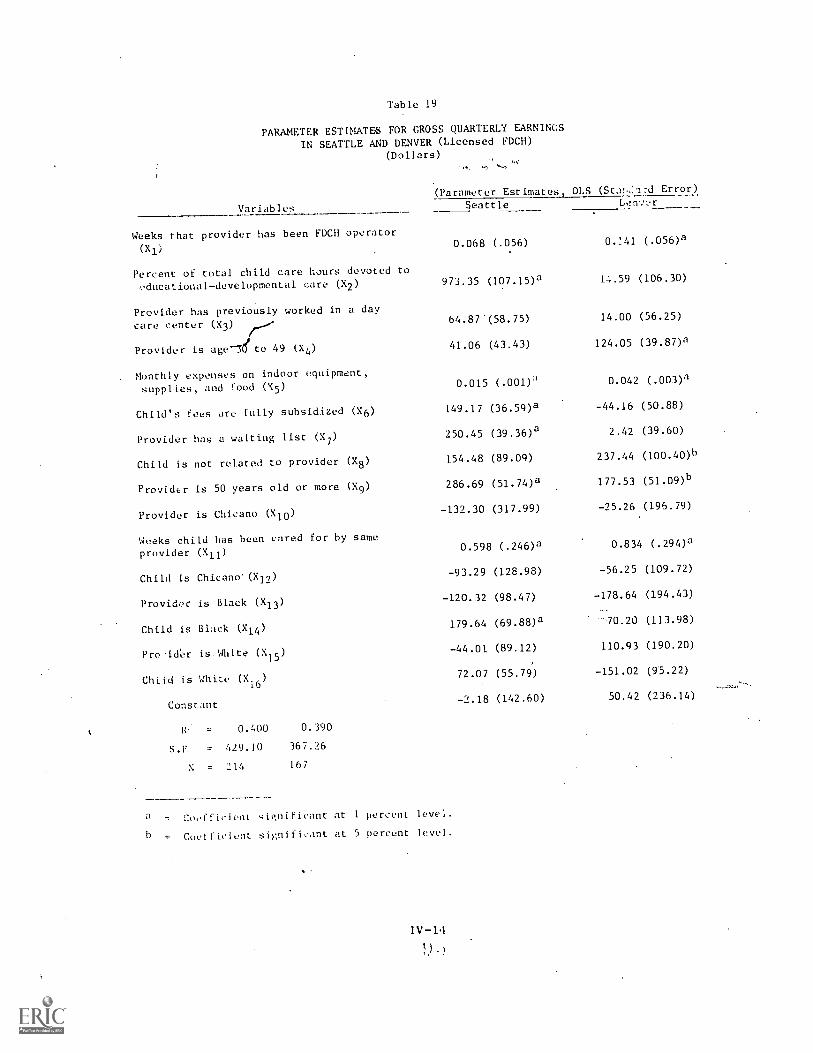
Table 19
PARAMETER ESTIMATE6 FOR. CROSS QUARTERLY EARNINGS
IN SEATTLE AND DENVER (Licensed FDCH)
(Dollars)
Variables
1,1
(Parameter Estimates, OLS (Stai-,21:d Error)
.9eattle
Weeks that provider has been FDC11 operator
(X1)
Percent of total child care hours devoted to,.-ducational-developmencal care (X2)
0.068 (.056)
973.35 (107.15)a
0.141 (.056)a
14.59 (106.30)
Provider has previously worked in a day
care center (X3) 64.87.(58.75) 14.00 (56.25)
Provider is age-teto 49 (X4) 41.06 (43.43) 124.05 (39.87)a
Monthly expenses on indoor equipment,supplies, and Food (X5) 0.015 (.001)1 0.042 (.003)a
Child's fees are futly subsidized (X6) 149.17 (36.59)a -44.16 (50.88)
Provider has a waiting list (X7) 250.45 (39.36)a 2.42 (39.60)
Child is not related to provider (X8) 154.48 (89.09) 237.44 (100.40)b
Provider is 50 years old or more (X0 286.69 (51.74)a 177.53 (51.09)b
Provider is Chicano (X10) -132.30 (317.99) -25.26 (196.79)
Weeks chi Id has been cared for by same
provider (X11)0.598 (.246)a 0.834 (.294)a
Child is Chicano'(X12)-93.29 (128.98) -56.25 (109.72)
Providr is Black (X13) -120.32 (98.47) -178.64 (194.43)
Child is Black (X14) 179.64 (69.88)a 70.20 (113.98)
Pro'id'er is. White (X15) -44.01 (89.12) 110.93 (190.20)
Chiid is White (X16) 72.07 (55.76 -151.02 (95.22)
Constant-2.18 (142.60) 50.42 (236.14)
0.400 0.390
S.F. = 429.10 367.26
= 214 167
a iloefficient significant at 1 percent level.
= Coeificient significant at 5 percent level.
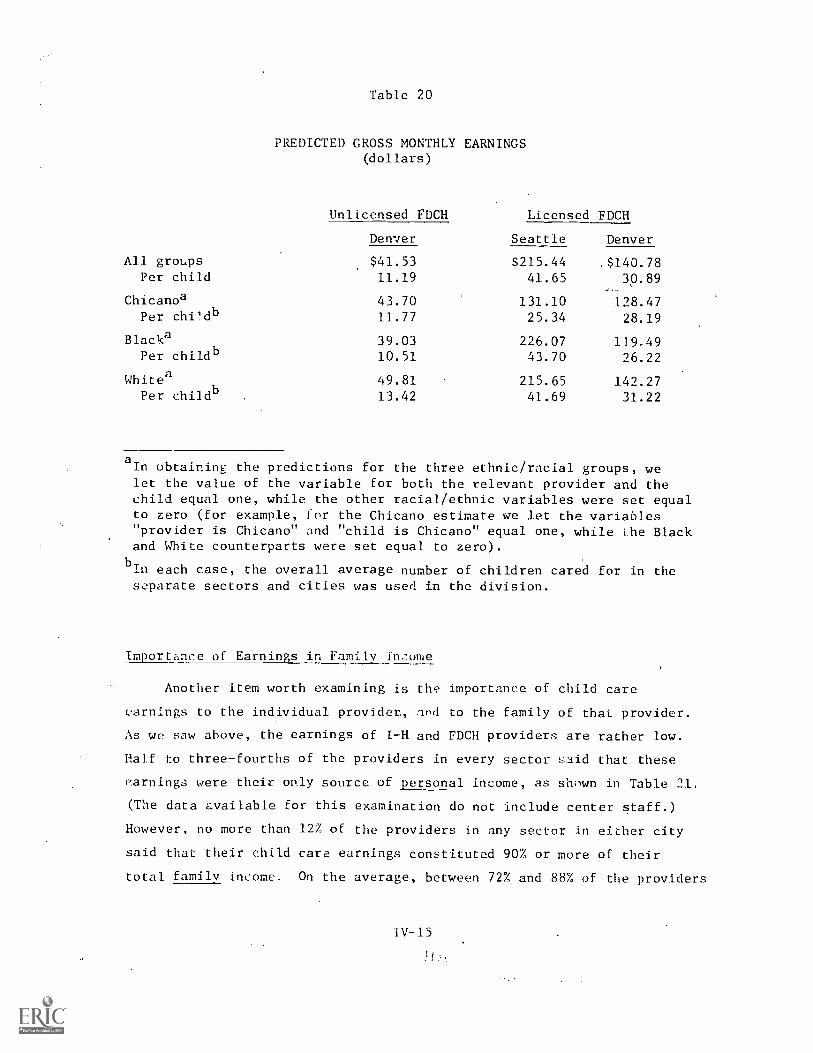
Table 20
PREDICTED GROSS MONTHLY EARNINGS(dollars)
Unlicensed FDCH
Denver
All groups $41.53Per child 11.19
Chicanoa 43.70Per chi'db 11.77
Blacie 39.03Per childb 10.51
Whited 49.81Per child b 13.42
a
Licensed FDCH
Seattle Denver
$215.44 .$140.7841.65 30.89
131.10 128.4725.34 28.19
226.07 119.4943.70 26.22
215.65 142.2741.69 31.22
In obtaining the predictions for the three ethnic/racial groups, welet the value of the variable for both the relevant provider and thechild equal one, while the other racial/ethnic variables were set equalto zero (for example, for the Chicano estimate we let the variables"provider is Chicano" and "child is Chicano" equal one, while Lhe Blackand White counterparts were set equal to zero).
bin each case, the overall average number of children cared for in theseparate sectors and cities was used in the division.
Importnee of Earnings in Family in.:'.ome
Another item worth examining is the importance of child care
earnings to the individual provider, and to the family of that provider.
As we saw above, the earnings of I-H and FDCH providers are rather low.
Half to three-fourths of the providers in every sector !aid that these
r.arnings were their only source of personal income, as shown in Table 21.
(The data available for this examination do not include center staff.)
However, no more than 12% of the providers in any sector in either city
said that their child care earnings constituted 90% or more of their
total family income. On the average, between 72% and 88% of the providers
1V-15
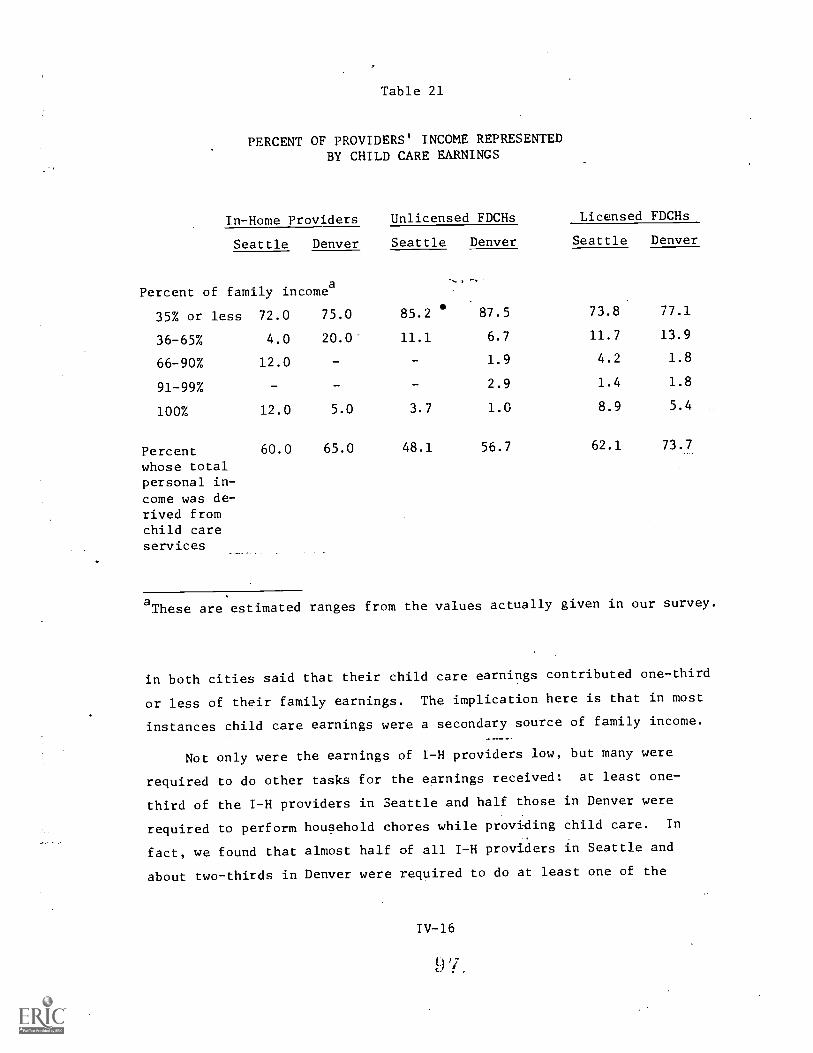
Table 21
PERCENT OF PROVIDERS' INCOME REPRESENTEDBY CHILD CARE EARNINGS
In-Home Providers Unlicensed FDCHs
Seattle Denver Seattle Denver
Licensed FDCHs
Seattle Denver
Percent of family incomea
35% or less 72.0 75.0 85.2 87.5 73.8 77.1
36-65% 4.0 20.0 11.1 6.7 11.7 13.9
66-90% 12.0 - 1.9 4.2 1.8
91-99% 2.9 1.4 1.8
100% 12.0 5.0 3.7 1.0 8.9 5.4
Percent 60.0 65.0 48.1 56.7 62.1 73.7
whose totalpersonal in-come was de-rived fromchild careservices
aThese are estimated ranges from the values actually given in our survey.
in both cities said that their child care earnings contributed one-third
or less of their family earnings. The implication here is that in most
instances child care earnings were a secondary source of family income.
Not only were the earnings of I-H providers low, but many were
required to do other tasks for the earnings received: at least one-
third of the I-H providers in Seattle and half those in Denver were
required to perform household chores while providing child care. In
fact, we found that almost half of all I-H providers in Seattle and
about two-thirds in Denver were required to do at least one of the
IV-16
9

following tasks: laundry or ironing for families, light housework,
cooking for family members other than the children cared for, and
heavy cleaning. Every provider required to perform these tasks said
that the fees charged included payment for these additional tasks. Con-
sequently, child care is only one component of the I-H provider earnings.
(However, see the estimate of the custodial component of child care pre-
sented in Chapter V.)
IV-17
V COSTS
Descriptive Review of Costs*
Because the cost data collected for FDCHs are not comparable with
the center cost data, we will not be able to make comparisons among sec-
tors in this section. However, we can compare costs between Seattle and
Denver for FDCHs and for centers separately.
Tables 22 and 23 show the costs for unlicensed and licensed FDCHs,
excluding any imputed cost of the providers labor and any prorated
share of the housing cost. Tn Table 22, we find'that the costs in
Seattle and Denver are quite similar for unlicensed FDCHs. In both
cities, costs per month are low, with the bulk accounted for by expend-
itures on food. The net revenue obtained by subtracting those costs
fa..om average revenue was very low in both.cities, and especially so for
Seattle, where only $23 were left after the costs listed had been sub-
tracted from the monthly revenue.
For the licensed FDCHs shown in Table 23, we find both costs and
net revenues to be much higher than for the unlicensed FDCHs. In the
former sector, there are some significant differences in the absolute
amount spent on various items in Seattle versus Denver. But the main
differences between the two cities in the relative weight of expendi-
tures in the different categories of Table 23 are the ,mount spent on
program supplies and the sum spent on advertising. In Seattle, almost
a fifth of all costs are for supplies and a tenth for advertising, while
in Denver not quite a tenth of the costs are for supplies and almost a
fourth for advertising. Otherwise, the relative expenditures arr? lbout
*See Appendix D for a discussion of day care costs obtained from otherstudies.
V-1

Table 22
MEAN COSTSa AND REVENUE FORUNLICENSED FDCH PROVIDERS
(Retent Month)
Expenditures
Seattle Denver
Indoor equipment $ 3.69 $ 1.96
Program suppliesc 5.72 5.46
Other supplies, excluding foodc 5.12 7.31
Advertising 0.59 0.04
Food for children 21.74 19.17
Total expenditures $36.86 $33.94
Revenue (for recent month)e 60.35 82.52
Revenue less expenditures $23.49 $48.58
a It has been assumed that there is no additional cost for maintenance
of Che home owing to its being used as a facility for the provisionof day care services.
bThe 1973 average divided by 12 and adjusted for inflation from June
1973 to May 1974.
cRecent week's cost multiplied by 4.3.
dIncludes food eaten by own children while in the home with children
taken care of for pay.
eRevenue of first quarter of 1974 divided by 3 and adjusted for infla-
tion from February 1974 to May 1974.
V-2

Table 23
MEAN COSTSaAND REVENUE FOR
LICENSED FDCH PROVIDERS(One Month During 1st Quarter, 1974)
Expenditures
Seattle Denver
Indoor equipmentb
$ 7.50 T---- $ 4.83
ProEram suppliesc
21.50 6.97
Oth,r sanplies, excluding foodc 21.50 12.94
Advertisin6 16.00 20.00
Food for childrend
51.00 38.00
Total expenditures $111.50 $ 82.74
Revenue (for recent month)e $219.78 $194.17
Revenue less expenditures $108.28 $111.43
aIt has been assumed that there is no additional cost for maintenanceof the home owing ro its being used as a facility for the provisionof day care services.
bThe 1973 average divided by 12 and adjusted for inflation from June1973 to May 1974.
cRecent week's cost multiplied by 4.3.
dIncludes food eaten by own children while in the home with childrentaken care of for pay.
eRevenue of first quarter of 1974 divided by 3 and adjusted for infla-tion from February 1974 to May 1974.
V-3
the same in the two cities. Moreover, we find that the net revenue for
the month* is approximately equal i.- Seattle and Denver.
Centers, unlike the otL2-, care sectors, often have a large
initial capital cost for buii,Ings and equipment. Lacking adequate
data, we have not been able to estimate the capital costs of buildings:I'
We have, however, been able to estimate the variable costs+ of day care
center operations. Table 24 shows these costs as an average per child,
as well as by ratio to total revenue.5
Monthly variable cost per child averaged $95 in Seattle and $107
in Denver. In Seattle, the range was from $61 for the private profit
making centers to $158 for the public centers, with the private non--
profit center falling about midway between these extremes. However, in
Denver the range was about the same, but the private nonprofit centers
had average monthly variable costs about equal to those of the private
forprofit centers. If we estimate variable cost.as a ratio to full
*The net revenue shown has not been adjusted to take account of payments
made by the licensed FDCH provider for paid help. In general, these
payments are very limited. Only 8% to 9% of the providers in Seattle
have either a paid bookkeeper or other paid assistant, or both, while
only about 4% of the providers in Denver paid for such help. Moreover,
these services tend to be purchased on a very limited basis, and it
appears unlikely that these payments would lower the average net re
turns by more than a few dollars per month. The issue is of even less
importance for the unlicensed FDCH sector.
l'For an empirical estimate of the cost of capital for family day care
homes, see Appendix E.
+Includes salaries and wages, insurance, rent, all utilities, janitorialservice, purchase of nondurable supplies, advertisement, food, and
amount spent on leasing equipment.
5In all cost and revenue estimates, price level adjustments have beenmade when a ratio is used and the numerator and denominator were not
for the same period.
V-4

Table 24
RELATIONSHIPS HTWEEN VARIABLE COST, CHILDREN ENROLLED, AND TOTAL REVENUE
(Means)
Monthly variable cost/
Seattle Denver
Total
Nonprofit For Profit
Private Total
Nonprofit For Profit
Private Public Private Public Private
currently enrolled children $94.84 $102.92 $157.57 $61.47 $107.11 $75.66 $160.46 $67.79
Variable cost/total revenue .94 .97 1.15 .83 1.00 .88 1.06 1.01
Rate of hourly pay for
center work $ 2.71 $ 2.70 $ 3.18 $ 2.33 $ 2.62 $ 2.45 $ 2.95 $ 2.12

time equivalent* enrollment, rather than to total currently enrolled,
the average value increases by 7% to 12%, but the relationship between
proprietary types does not change.
The ratio of variable cos '. to total revenue for public centers in
both cities; as well as for the private for-profit centers in Denver,
is surprising. For these centers, the ratio is greater than 1.0, which
means d'at variable costs take up over 100% of all revenues. Since
total revenue was supposed to Include all income received, it appears
that in Denver the profit-making centers were, on the average, taking
a lobs, and the public centers in both cities were incurring a fairly
sizeable debt.
In almost all cases, variable costs absorb most of the revenue.
brought into centers. This is due largely to the large percentage of
total revenue that is made up of salaries and wages. Overall, .70% of
the total revenue in Seattle and 66% in Denver is directed toward wages
and salaries.t However, these percentages varied considerably according
to Proprietary type. In both cities, the private for-profit centers
spent a relatively small percentage of their revenue on wages and sala-
ries (less than half in both Seattle and Denver); on the other hand, the
public centers in Seattle spent almost all their revenue on wages and
salaries, and in Denver it was four-fifths. Nonprofit private centers
had a somewhat lower percentage of revenue going to wages and salaries
than public centers, but the percent so spe-t was still far above (about
three-fourths in either city) those of the profit-making groups.
We can also estimate the effect on the center's wage bill if the
minimum wage in effect on May 1, 1974, were to be paid by all centers.
Table 25 summarizes the results of that calculation. On the average,
centers would find that imposition of the minimum wage Would raise their
*This is calculated by adding one-half the total of children enrolledpart time to the total of children enrolled full time.
tIf fringe benefits are included, this is higher by about 4% to 57g.
V-6

Table 25
EFFECT OF ENFORCEMENT OF THE MINIMUM WAGia ON CENTER WAGE BILL
SEATTLE DENVER
All Nonprofit Fcr Prout All Nonprofit For Profit
Centers Private Public ;rivar Centers Private Public Private
Number of defieitb
employees 30 20 4 7 50 9 11 30
Additional annual wage
needed for deficit workersc $14,975 $10,491 $1,877 $2,607 $26,509 $2,378 $3,712 $20,628
Total number of past
employees 283 175 52 56 302 82 150 70
Average hourly wage of all
paid employees $2.715 $2.702 $3.183 $2.326 $2.621 $2.451 $2.946 $2.425
e: Total annual wage bill fori
--.1 all paid employeesd $897,427 $552,289 $193,323 $152,139 $924,521 $234,747 $516,139 $173,740
Percent that added wage is
of totale 1.7% 1.9% 1.0% 1.7% 2.9% 1.0% 0.7% 11.9%
aThe minimum wage for newly covered workers (effective May 1, 1974) was used, which was $1.90 per hour.
hA deficit worker is a regularly paid employee.who earned less than $1.90 per hour during the survey week in May 1974. The
number of deficit workers actually fctind in the survey of regular paid employees was adjusted, by the inverse of the proportion
responding Lo the staff questionnaires, to estimate the total number of deficit employees among all regular paid workers. The
inverse of the proportion responding was 1.7857.
cThe additionbl annual wages needed for deficit workers was computed by adding the amounts that would be needed in order to
bring all deficit workers up to the minimum wage level, and then multiplying that total by the estimated average number of
hours worked per year (1,188). Ilie estimated aanual hours was derived by assuming that paid employees worked an average of 40
weeks per year. That qgure wa s. then multiplied by 29.2, which is the average hours that regular paid employees worktd during
the survey week.
dTh's is the product of line 3 mAtiplied by line 4 of the table, and the Sum multiplied by the estimated annual hours of work(1,168).
eline 2 divided by line 5, and the result multiplied by 100.

wage bill by from 2% to 3%,* except for the private for-profit centers
in Denver. In those cases, the wage bill would increase by almost 12%.
We were also able to estimate the.current market value of equip-
ment and vehicles in the Seattle and Denver day care centers. (See
Table 26.) In Denver, we find that the for-profit centers make a
substantially higher outlay on equipment and vehicles than do either
of the nonprofit types. However, this is due largely to the much
higher value of vehicles owned by the profit-oriented centers. Taking
only the ratio of the current market value of equipment to the number
of currently enrolled children in Denver, we find that the profit-making
centers make an expenditure on equipment per child about equal to the
publi centers. This is still quite different from what we see in
Seattle, where public centers have a far larger investment in equipment
plus vehicles per child, as well as in equipment alone, than do either
(he profit-making or the private nonprofit centers. We also found that
the current value per child of these items was greater in Seattle than
in Denver, although the for-profit centers in both cities had approxi-
mately equal values for equipment per child.
Another cost issue is the provision of transportation services to
users. Very few of the unlicensed FDCH vendors in either city provided
such service, about 7% in Seattle and 3% in Denver. Of those that did
in Seattle, most charged extra for that service; of the few who provided
transportation in Denver, almost all said that they did not alter their
fee for this additional service.
Of the licensed FDCHs in Seattle, about a tenth provided transpor-
tation to and/or from the home for the children under their care. In
about three-fourths of these cases, the fees paid did not include a
charge for this service, so that when transportation was provided, an
additional assessment was made. In Denver, almost none of the licensed
FDCHs offered a transportation service.
*The percent change in Table 25 is more meaningful than the absoluteamounts, since we did not receive the necessary data from about half
the regular paid staff in centers.
V-8
I

Table 26
CURFFNT MARKET VALUE OF EQUIPMENT AND VEHICLES
(Means)
Current Market Vall:e
SEATTLE DENVER
All
Centers
Nonprofit For Profit All
Centers
Nonprofit For Profit
Private Public Private Private Public Private
Equipment and vehicles $5,320 $4,742 $6,849 $5,577 $4,789 $2,460 $4,221 $7,157
Equipment and vehicles/
currently enrolled child 126.97 102.86 231.38 135.69 79.68 45.30 70.47 110.79
Equipment/currently
enrolled child 97.33 87.55 210.07 74.94 61.61 30.94 70.42 72.34

In Seattle, about a quarter of all centers provide transportation
to and from their facility, with about half of these adding an extra
charge for this service to their regular fee. The percentage providing
transportation in Seattle ranged from 33% of the for-profit and public
centers to about 17% of the private nonprofit centers, with none of the
public centers including the cost of transportation in the fees charged.
In Denver, less than 10% of all centers (none of the private nonprofit
centers) provided transportation, with about 6% of the public and 18%
of the for-profit centers doing so.
In another paper [26], we found that the annual cost per currently
enrolled child in public centers* was from 2-1/2 to 4 timeS higher than
for other center types in Seattle and from 2 to 3-1/3 times greater for
the other proprietary types in Denver. From the data.collected we have
determined that the cost discrepancy was due to three main factors:
(1) a lower average ratio of children to staff in public centers, (2) a
somewhat higher average number of hours worked per week by public cen-
ter employees, and (3) a much higher average hourly pay received by
public center employees. So we find that, for a given number of chil-
dren, public centers used more paid help, and they were paid a larger
amount for more hours worked. Moreover, it is well to remember that
these factors may also be indicative of a higher quality of care.
So far in this chapter on cost, we have been concerned with de-
scriptive analysis of the cost data from our survey. Now, we want to
investigate estimated cost functions, from which we attempt to isolate
the cost of custodial care.
Cost Functions--An Attempt to Isolatethe Cost of Custodial Care
Estimating a cost funTAion for day care is complicated by the
nature of the output. One of the simplifying assumptions usually made
*It was found to be $1,960 in Seattle and $1,644 in Denver.
V.-10

in the study of cost functions is that outputs are homogeneous between
firms. While this is never strictly true, the assumption is a reason-
able abstraction from reality in many situations. Unfortunately, day
care is not one bf these. Comparisons of the amount of service produced
by different day care providers fail to capture important differences in
quality of service. The costs of day care vary significantly in rela-
tion to quality as well as amount of care. Correctly accounting for
differences in quality is complicated by the fact that there is no
general agreement on what it is. Other studies . t carr_, costs [1], [27]
have avoided the difficulty by simply equating quality and cost. For
a given quantity of care, they have assumed that difierences ft costs
reflect equivalent differences in quality. ='
The cost functions estimated in this section reflect a different
approach. We have calculated a charge for each child for a standard
40-hour week of service. We assume that on a weekly basis, the rela-
tionship between the charge and the quantity of care is proportioaal,
e.g., that the charge for two weeks of care is double that for a single
week. To account for differ!ences in quality, we include variables in
the cost function that should affect that dimension of care. This
approach does not result in an explicit relationship between day care
quality and cost. However, the goal of this section is to produce a
cost function that will be a useful tool in evaluating the feasibility
of day care subsidization. Moreover, public policy may be confined,
in a comprehensive national day care subsidy program, to subsidizing
only the 'basic custodial component of day care. Oui- approach does
make it possible to estimate the cost of custodial care--that is, day
care approximating the care provided by the mother herself. The idea
of quality in day care, and the rationale for our choice of 'indicators
7f q%ality, are disuussed in Appendix F.
In explaining the variation in the weekly charge, the most impor-
tant indicator of quality is the amount of the provider's labor avail-
able to each child. Labor is, in value terms, by far the most impor-
tant input. It is the only provider input to in-home care. While
V-11

additignal inputs are used by other types of providers, even in child
care centers (which should use the greatest number of additional in-
puts), wages and benefits equal about 75% of gross income. Thus the
relationship of labor input to the charge per child is central to the
cost function for day care.
Since the model seeks to explain the variation in the charge per
child for a fixed period of care, the relevant amount of labor input
can be represented by the ratio of children to providers. Ihis ratio
decreases as the attention given to each child increases, and vice
versa. The exact relationship of this quantity to the charge per child
is not immediatel'Y obvious. _At_one_extreme, the charge per child may
be determined/Independent of the ratio of children per provider. All
variation in./the charge may be explained by the quality of the labor
input and the amounts of other inputs..
At the other extreme, an argument can be made that it is the total
charge for a provider's service rather than the charge per child that
is determined by the quality of the service and the quantity of other
inputs. If the number of children to be cared for is not large, the
addition of another child should not greatly increase the effort re-
quired of the provider. That implies that over some range of the num-
ber of children per provider, the total charge should be approximately
constant for a given provider's service. Such a relationship seems
most probable for in-home providers. Since the total charge is the
product of the charge per child and the ratio of children to providers,
this relationship implies chat the charge per child should be inyersely
proportional to the child/provider ratio. These two possible relation-
ships between the charge per child (C), the child/provider ratio (R),
and the variables representing quality of service and amounts of other
inputs (Qi) can be represented by the equations
C = a + E b.Q.i 1 1-
CR =d+EeQ.i i i
V-12

Equation (2) can also be expressed as
C = + EeR (3)
The true function is likely to be somewhere between the two extremes
and some experimentation has led to an intermediate model of the form
C=f4-+Eh 91-R i
(4)
The model in (4) requires the child/provider ratio as a variable,
but the nature of child care service makes it difficult to define a
single child/provider ratio. The number of children cared for in any
time period of reasonable length may vary for a number of reasons.
Parents' differing needs, or children's illness or school attendance,
may cause substantial variations in the number of children present in
a day care facility at any particular time. In addition, the number
of children enrolled may not be the number preferred by the provider.
Differences between the actual and the desired child/provider
ratio may effect the charge per child. Two providers, equipped to
handle the same number of children, may charge differently if their
average attendance is different. The provider with lower average
attendance would wish to charge a higher hourly rate for part time
children to maintain his hourly wage, and parents may be willing to
pay a higher rate because they purchase essentially a lower child/
provider ratio. Thus, we hypothesized that if differences in attend-
ance caused any variation in the charge, increases in the average
proportion of children in attendance to the number regularly enrolled
would decrease the charge. To capture this effect, the ratio of
average attendance to maximum attendance was included as an independent
variable.
V-13

Specifications of Variables
The variables needed for estimating Equation (4) are presented
systematically in Appendix F; here we briefly summarize them. The
_ dependent variable, charge per child (C), has been constructed so that
it reflects a normalized 40 hours of use per week. The child/provider
ratio (R) is simply the number of currently enrolled children per pro-
vider. The other variables represented other inputs used to produce
day care services, other services provided in conjunction with day care,
and differences in quality between providers.
Cost Equations and the Estimation of Custodial Carefor In-Home and Family Day Care Home Providers
Estimates of the model given in Equation (4) are presented in
Table 27. These represent the combined regressions* separated by city
and provider type.
Custodial care must be defined in terms of specific values of the
independent variables in the regressions reported above. The values
we have chosen to represent the custodial level of care for the vari-
ables used in those regressions are shown in Table 28. Summed, they
add $7.60 to the equivalent wage in Seattle and $4.96 in Denver. None
of the extra services were included in custodial care and only two
quality variables were given nonzero values. Using an appropriate data
base from another study [11], we found that the average education of
lower income working women was approximately 12 years in Seattle and
10 in Denver. We felt that custodial care should approximate the care
provided by the mother, at least in terms of quantifiable measures, and
this led us to choose 12 and 10 years of education as the amounts appro-
priate for custodial care. The PREWORK dummy was set to 1 because it
seemed likely that lack of previous work experience might indicate a
provider who is reluctant to work and insists upon a higher-than-normal
*See Appendix F, Table F-1, for the overall combined regression.
V-14
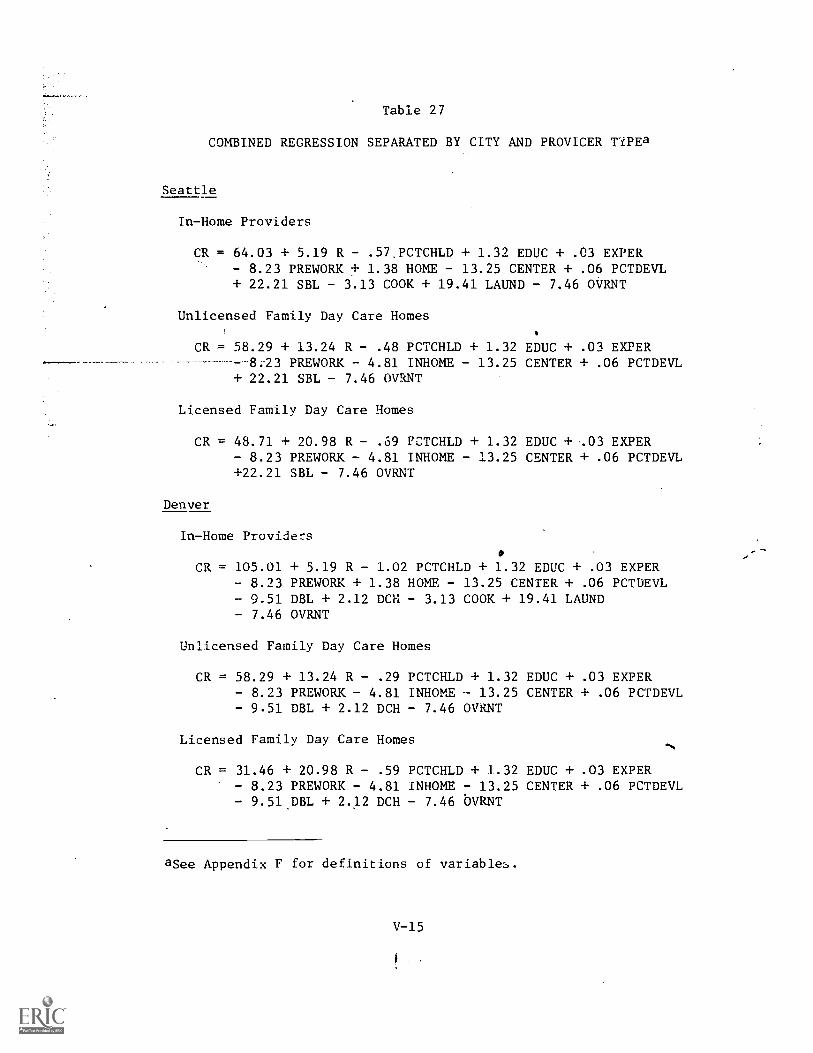
Table 27
COMBINED REGRESSION SEPARATED BY CITY AND PROVICER TIPEa
Seattle
In-Home Providers
CR = 64.03 + 5.19 R - .57.PCTCHLD + 1.32 EDUC + .03 EXPER8.23 PREWORK + 1.38 HOME - 13.25 CENTER + .06 PCTDEVL
+ 22.21 SBL - 3.13 COOK + 19.41 LAUND 7.46 OVRNT
Unlicensed Family Day Care Homes
CR = 58.29 + 13.24 R .48 PCTCHLD + 1.32 EDUC + .03 EXPER8.23 PREWORK 4.81 INHOME 13.25 CENTER + .06 PCTDEVL
+ 22.21 SBL 7.46 OVRNT
Licensed Family Day Care Homes
CR = 48.71 + 20.98 R .69 PCTCHLD + 1.32 EDUC + .03 EXPER- 8.23 PREWORK 4.81 INHOME 13.25 CENTER + .06 PCTDEVL+22.21 SBL 7.46 OVRNT
Denver
In-Home Providers
CR = 105.01 + 5.19 R - 1.02 PCTCHLD + 1.32 EDUC + .03 EXPER8.23 PREWORK + 1.38 HOME - 13.25 CENTER + .06 PCTDEVL9.51 DBL + 2.12 DCH 3.13 COOK + 19.41 LAUND7.46 OVRNT
Unlicensed Family Day Care Homes
CR = 58.29 + 13.24 R - .29 PCTCHLD + 1.32 EDUC + .03 EXPER8.23 PREWORK 4.81 INHOME 13.25 CENTER + .06 PCTDEVL9.51 DBL + 2.12 DCH 7.46 OVRNT
Licensed Family Day Care Homes
CR = 31.46 + 20.98 R .59 PCTCHLD + 1.32 EDUC + .03 EXPER- 8.23 PREWORK - 4.81 INHOME 13.25 CENTER + .06 PCTDEVL
9.51.DBL + 2.12 DCH 7.46 0VRNT
aSee Appendix F for definitions of variables.
V-15

wage. Although we used a value of zero for the experience variable,
the coefficient is so small that the_choice of.any_reasonable value for
the variable would cause very little change in the cost of custodial
care.
Table 28
VALUES OF PARAMETERS FOR CUSTODIAL CARE
1
Variablea Seattle Denver
OVRNT 0 0
COOK 0 0
LAUND 0 '0
EDUC 12 10
EXPER 0 0
INHOME 0 0
HOME 0 0
CENTER 0 0
PREWORK 1 1
PCTDEVL 0 0
aSee Appendix F for explanation ofvariables used.
Substituting the values in Table 28 into the cost equations yields
the equations in Table 29. It should be noted that the coefficients of
the child/provider ratio are constrained to be equal across cities for
each provider type and the race variables are constrained to be equal
across provider type for each city. Despite the constraint on the
'child/provider ratio, the two unconstrained variables--the constant and
the PCTCHLD, the variable measuring the ratio of average attendance to
the maximumhave the same relationship between provider types for each
V-16
$

city. Thus, for each city, in-home providers have theflargest constant
and licensed family day care homes the smallest. A similar relation-
ship holds for PCTCHLD. The consistency of these results for both
cities supports the validity of the constraint on the coefficients of
the child/provider ratio across cities.
Table 29
REDUCED CITY/PROVIDER TYPE REGRESSIONS
City and Provider Type Equation
Seattle
In-home CR = 71.62 + 5.19R - .57 PCTCHLD + 22.21 BL
Unlicensed FDCH CR = 65.88 + 13.24R .48 PCTCHLD + 22.21 BL
Licensed FDCH CR = 56.30 + 20.98R .69 PCTCHLD + 22.21 BL
Denver
In-home
Unlicensed FDCH
Licensed FDCH
CR = 109.96 + 5.19R - 1.02 PCTCHLD 9.51 BL+ 2.12 CH
CR = 37.96 + 13.24R .29 PCTCHLD 9.51 BL+ 2.12 CH
CR = 36.41 + 20.98R .59 PCTCHLD - 9.51 BL+ 2.12 CH
The coefficients of the child/provider ratio and PCTCHLD are signif-
icant against zero in most cases. Only for in-home providers is either
not significantly different from zero at the 5% level. Thus, for all
family day care homes, the hypothesis that the provider's wage does not
depend upon the number of children in his care can be rejected.
The calculation of the cost of custodial care for each city and
provider type requires the choice of values for PCTCHLD and the child/
provider ratio. For each city and type, providers were found whose
average attendance was equal to their maximum. Th_s, a value of 100%
V-17'
s

for PCTCHLD was chosen as appropriate for custodial care. The number
of children per provider was found to be as high as,12 in some family
day care homes. This ratio seems to be too high to ensure ,adequate
custodial care. Both cities have regulations imposing a maximum of
six children per adult in family day care homes, which seems to he an
effective limit. Less than 7% reported averaging more than six chil-
dren per provider. Because it was an effective limit for most firms
and because it seems a reasonable maximum to ensure adequate custodial
care, a child/provider ratio of six was used in calculating the charge
for custodial care for family day care 'm:)mes. Neither Seattle nor
Denver regulates in-home providers, so there is no established maximum
child/provider ratio for this type of day care. However, the six-to-
one ratio for family day care homes seems a reasonable maximum for
these providers also. We observed only one provider in either of the
two cities who had a higher child/provider ratio. Substituting thz-!se
values for PCTCHLD and the child/provider ratio yields the estimates
of the cost of custodial care shown in Table 30.
Table 30
COST PER CHILD FOR CUSTODIAL CARE(White Provider, R = 6, PCTCHLD = 100)
In-Home Unlicensed FDCH Licensed FDCH
Seattle 7.63 16.22 18.86(Black provider) (+3.70) (+3.70) (+3.70)
Denver 6.52 14.73 17.22(Black provider) (-1.59) (-1.59) (-1.59)
(+.35) (+.35)
The estimated charges for custodial care are consistent across
provider types for each city. For neither 'ty is the difference be-
tween licensed and unlicensed family day care homes large. There is
V-18
a sizable difference between the two types of family day care homes
and in-home providers, but this may be a consequence of the way the
results are presented rather than a true difference between the provider
types. In-home providers typically care for the children of only
one family, while family day care homes may have children from several
different families. Thus a three-child family Must accept a .child/
provider ratio of three if the parents hire an in-home provider but
can get a child/provider ratio of six in a family day care home. The
relevant costs for in-home care for a three-child family are $29.06 in
Seattle and $41.84 in Denver per Child. The costs for care in a family
day care home are shown in Table 30. The conclusion to be drawn4from
Table 3C is that in-home care is less expensive than other comparable
care but it is not a cheaper alternative for most users.
Differences in cost may also oe a result of differences in serv-
ices provided. We have not been able to account for capital services
in establishing the cost function. Capital costs seem unlikely to be a
major part of the charge, but they may explain some part of the differ-
ence between the two modes of care.
Cost Equations and the Estimation ofCustodial Care fur Centers
The estimated combined regression for both cities is presented
in Table 31. A discussion of the sample size problem as well as the
individual coefficients are given in Appendix F. Here we want to use
the estimated regression to determine the cost of custodial care for
centers.
Values for some of the independent variables in the regression
that are appropriate for custodial care are given in Table 32. The
values for the mean education level are taken, a; (7ir the in-home
providers and family day care homes, from data frum a sample of low
income families. The racial variables represent the racial composition
of providers with whom the average child came in contact. Note that,
as in the previous regression, the variable for Chicanos has been
V-19

Table 31
DAY CARE CENTER REGRESSION
Dependent variable: Charge per chtld
Independent variables
1/R
'SEATTLE
AGE
EDUC
EXPER
PCTDEVL
PROFIT
PUBLIC
BLACK
CHICANO
CAPITAL
SUBSIDY
Constant
Number of observations: 87
Standard error: 31.75c
Coefficient in $(standard error)
-3.25(3.16)
.25(1.20)
.22
(.13)
1.77b
(.65)
-.65(.42)
.04
(.05)
286b(1.25)
2.10(2.50)
11.08(9.97)
.0004
(.003)
-.11(.09)
-15.24(12.07)
aCharge per child for centers was calculated from a charge sched-ule rather than from actual charges, as was done for other pro-viders. The calculation is described in Appendix F. The valuesof the dependent variable are strongly affected by the way inwhich the calculations were done.
bSignificantly different from zero at the 5% level.
cThe regression was weighted by the square rooi of the number ofchildren in the center. Thus the standard error applies to theproduct of the charge and the square root of the number of chil-dren. Since the mean value of the square root is 6.63, thisstandard error is equivalent to a standard error of approximately$4.79 on the charge itself.
V-20

DEFINITIONS OF REGRESSION VARIABLES FROM TABLE 31
Variable Definition
C Charge for a 40-hour weak of care
Child/provider ratio
SBAiiLL Dummy indicating a center in Seattle
AGE* Mean age of providers in center who responded to survey
EDUC* Mean numberl of years of education of providers whoresponded tO survey
EXPER* Mean number of years of experience of providers whoresponded to survey
PCTDEVL*
Average perce,A of i:ime spent in developmental activitiesproviders who resp6nded to survey
PROFIT Dummy itldicating for-profit center
PUBLIC Dummy indicating center run by public agency
BLACK Proportion of Black providers among survey responders
CHICANO Proportion of Chicano providers among survey responders
CAPITAL Market value of all c.apital equipment used by centerexcept buildings and grounds per child
SUBSIDY qalue of direct subsidies to center for previous yearner week per child
*The data from which the variables AGE, EDUC, EXPER, and PCTDEVL werecalculated came from a questionnaire distributed to individual pro-viders in the center. Not all questionnaires were returned, so thesevariables were averages based on sometimes partial information.
V-21
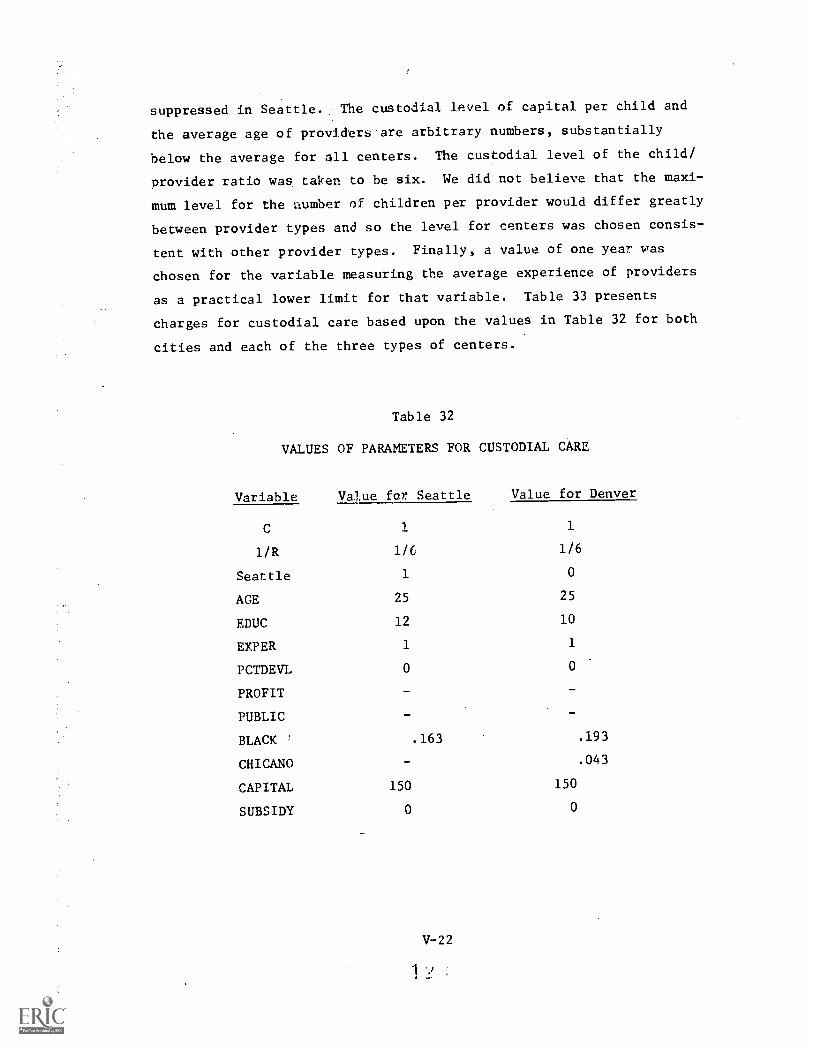
suppressed in Seattle.. The custodial level of capital per child and
the average age of providers are arbitrary numbers, substantially
below the average for all centers. The custodial level of the child/
provider ratio was taken to be six. We did not believe that the maxi-
mum level for the number of children per provider would differ greatly
between provider types and so the level for centers was chosen consis-
tent with other provider types. Finally, a value of one year was
chosen for the variable measuring the average experience of providers
as a practical lower limit for that variable. Table 33 presents
charges for custodial care based upon the values in Table 32 for both
cities and each of the three types of centers.
Table 32
VALUES OF PARAMETERS FOR CUSTODIAL CARE
Variable Value far Seattle Value for Denver
C 1 1
1/R 1/6 1/6
Seattle 1 o
AGE 25 25
EDUC 12 10
EXPER 1 1
PCTDEVL o o
PROFIT - -
PUBLIC
BLACK .163 .193
CHICANO - .043
CAPITAL 150 150
SUBSIDY o o
^
V-22
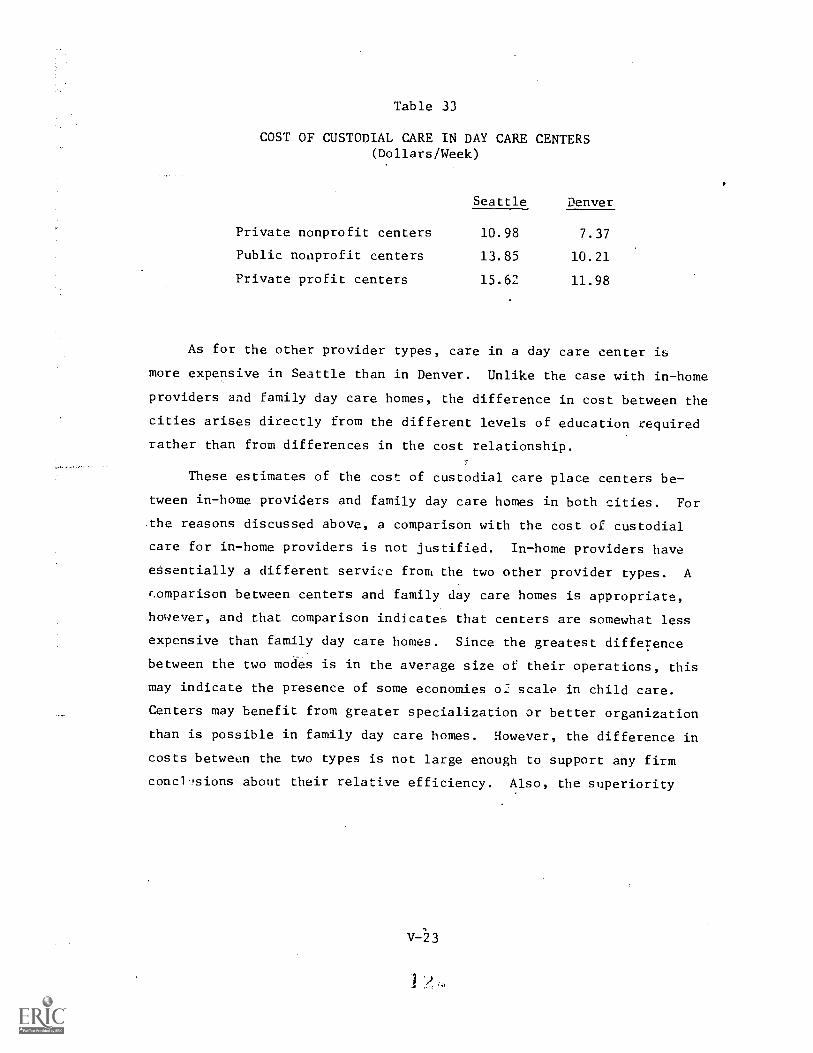
Table 33
COST OF CUSTODIAL CARE IN DAY CARE CENTERS(Dollars/Week)
Seattle Denver
Private nonprofit centers 10.98 7.37
Public noaprofit centers 13.85 10.21
Private profit centers 15.62 11.98
As for the other provider types, care in a day care center is
more expensive in Seattle than in Denver. Unlike the case with in-home
providers and family day care homes, the difference in cost between the
cities arises directly from the different levels of education required
rather than from differences in the cost relationship.
These estimates of the cost of custodial care place centers be-
tween in-home providers and family day care homes in both cities. For
the reasons discussed above, a comparison with the cost of custodial
care for in-home providers is not justified. In-home providers have
essentially a different servi,:e from the two other provider types. A
r.omparison between centers and family day care homes is appropriate,
however, and that comparison indicates that centers are somewhat less
expensive than family day care homes. Since the greatest difference
between the two modes is in the average size of their operations, this
may indicate the presence of some economies o: scale in child care.
Centers may benefit from greater specialization or better organization
than is possible in family day care homes. However, the difference in
costs between the two types is not large enough to support any firm
concl ,sions about their relative efficiency. Also, the superiority

of private nonprofit centers to the other types is even more striking
when a comparison is made with famay day care"homes. Both of these
results raise interesting questions for fur.her research.*
An attempt to compare these costs with an independent assessment of
total cost per child was made, but differences in the data base for
the two estimates made that comparison unreliable. Essentially, the
cost function was estimated from data on charges (revenue data), while
the other cost estimate was based on actual costs (debit data). More-
over, the actual cost data used is deficient in several respects,
especially with regard to capital costs.
V-24

Appendix A
DAY CARE SURVEY
IntroducLion
In a survey operation we rarely have the resotrices to undertake
bOth an extensive and an intensive invesLigation. The Abt study [1]
was an in-depth, intensive looK into a handful of high-quality center
operations, whereas the Westinghouse-Westat study [27] provided a
broad, extensive review of a large number of day care operations. In
the former, we can get at details, such as the provision of "in-kind"
services or the relationship between day care operations and tax write-
offs. Such detailed data can rarely be obtained in the survey attempt-
ing to obtain a broader coverage. In tnat case, researchers are
confined to a broader set of generalization's, many of which cannot be
answered with a small set of detailed data. When budgets are restricted,
what is chosen depends on the research design and the questions that
that design elicits [19].
We attempted to gain greater depth than the Westinghouse-Westat
survey, yet also provide a much broader coverage than the Abt survey.
However, our survey was not as extensive as the former, nor nearly as
intensive as the latter. Our compromise did, however, prqvide us with
detailed data on a large enough sample that we can obtain reliable
estimates of some :mportant supply relationships in the Seattle and
Denver day care industry.
Our preliminary review of the day care industry indicated that it
was compoSed of three main sectors: centers, family day care homes
(licensed and unlicensed), and in-home providers. Three basic survey
instruments were developed to obtain the needed data from those three
day care sectors. The instruments were designed so that we would get
needed details, yet be short enough to allow us, within the budget
A-1

constraint, to obtain enough coverage of the industry. Before pro-
ceeding with a review of the content and purpose of the instruments
used, we will-discuss the sample selected for the day care survey.
Sample Selection
Our sample selection was based on estimates of the population in
the different sectors of the industry, along with the budget limitation
for the survey. Estimates of the population of centers and licensed
family day care homes (FOCH) in both Seattle and Denver are very
reliable, although there is a significant turnover in the latter
sector. However, the size of the informal sector, unlicensed FDCHs
and in-home providers, is difficult to estimate with any reasonable
degree of reliability. Our estimates of the informal sector rould
easily be double or only half the true population size.
There were 74 eligible centers within the city limits of Seattle
and 50 in Denver. All centers wete to be included in the survey:
There were seven complete refusals (about 10%) in Seattle and three
refusals (about 6%) in Denver. Consequently, we were able to obtain
65 completed center interviews in Seattle (along with two partial inter-
views) and 47 completions in Denver.
Our SIME/DIME state liaison people gave us current lists of
(almost) all licensed FDCHs in Seattle and Denver. From that list we
selected a 25% random sample of the population to be surveyed. The
refusal rate in this sector was almost 10% in Seattle'and 1% in Denver.
The total of licensed FDCH questionnaires completed was 214 in Seattle
and 167 in Denver. Of the latter- number, 17 had been classed as un-
licensed FDCHs in a presurvey listing. During the interviews, and
through a later check, it was found that these homes were actually
licensed. They were consequently placed in the licensed FDCH sample.
For the informal sector, our goal was a sample of 200 unlicensed
FDCHs and 75 in-home providers in Denver, and 225 unlicensed FDCHs and
125 in-home respondents in Seattle. Our very crude estimate of the
informal sector suggested that, overall, the sample size chosen would
A-2
represent between 5% and 10% of the total population. However, due to
the difficulties in contacting and interviewing respondents in the in-:
formal sector, we were able to obtain only 27 completed unlicensed FDCH
and 25 in-home interviews in Seattle, and 104 unlicensed FDCHs with
20 in-home completions in Denver. In Seattle there may simply be a
smaller population of.unlicensed FDCHs because of the more rigidly
enflarced licensing requirement. On the other hand, it is equally likely
that, due to the stringent legal considerations, the (illegally) un-
licensed FDCHs are more hesitant about revealing that condition.
Although there is also a legal requirement that FDCHs be licensed in
Denver, the law is not enforced as rigorously there as it is in Seattle.
For the in-home providers, we estimate that our sample of completions
represents (roughly) perhaps 1% of the total population.
The informal sector sample was selected through several sources.
First, we sent a letter to all SIME/DIME families asking them to return
an enclosed form with the name of any child care provider they used or
knew. All licensed providers (centers and FDCHs) were eliminated from
the names returned.* The remainder were contacted for inclusion in the
survey. We also obtained the names of some informal sector providers
through the welfare department in Seattle and Denver.
Content of Instruments Used
The instruments were designed to obtain the data needed to answer
research questions arising from our a priori models of the day care
industry. These questions involved such issues as costs, product
differentiation, and entry barriers, brought out in Part I of the report.
In order to address the research objectives of this study, seven
principal areas for data needs were developed. These seven areas
The sample generated from the SIME/DIME population, which is a randomselection from che lower income families in the overall population ofSeattle and Denver, is somewhat biased. However, our concprn isprimarily with the supply of day care for lower income families, sothe bias is not an important problem for our analysis.
Cr
A-3
concerned output, revenue, capacity and waiting lists, enti', barriers,
information, costs, and social and demographic characteristics of
.prov-lders and children using day care services.
As a measure of output, ideally e would prefer to isolate cus-
todial care from the educational-developmental components of day care
service. In an attempt to do that, the instrument was structured so
that data on specific activities undertaken by providers would be
collected. On the basis of discussion with day care specialists, c,e
then determined which of those activities were relevant to the provision
of purely custodial service, which to the provision of educational-
developmental services, and which to other administrative or nonchild
care services. Data were also collected for use in an alternative
method of determining the custodial component of day care. That data
involved information on prices and on physical services such as meals
served, health checkups, whether the illness of a child precludes day
care utilization, and whether parental guidance is offered. Further-
more, the relationship between the price charged per child and the
number of children per provider, or staff member, in the three main
sectors, might provide us with an alternative measure of custodial
care (see Part V).
Revenue estimates were generated from data collected on fees,
subsidies, and donations received. There are also data available on
gross earnings and the total numbar of children cared for. The fees
are given for each child 4.!or in-home and FDCH providers, whereas a fee
schedule is provided for centers. Data are also available on non-
child care duties, such as light housekeeping performed by in-home
providers in the day care user's home, for which a fee adjustment must
be made.
Capacity data are available in terms of the hours and days the
t -facility is open, the number of full- and part-time children in
attendance, and whether there is a waiting list for available slots.
For entry barriers, we have data on problems associated with
licensing and zoning, where variances are required. In addition, we
A-4
4

know the delays encountered in receiving the license or in obtaining
the zoning variance. Data were also collected on the changes required
to obtain the license; furthermore, some data are available, or can be
estimated, on the capital needed to start up a day care opration.
Information data are chiefly concerned with how the user finds out
about the service available, as well as how the provider communicates
that information.
Cost data are most important for our analysis of the day care
industry. Because of its importance, and the difficulty of getting
reliable and comprehensive cost data, a significant proportion of the
interview was devoted to collecting information regarding costs. Our
concern was not only to obtain actual cost data on all relevant inputs,
but also to :et information that would allow us to impute costs for
volunteer services, and fo, donated foods, materials, equipment, rent,
and so on. Not only did we obtain data on the actual or imputed costs
of many inputs, but we also received the information needed to translate
these-costs into current dollars.
Finally, we obtained data from the interview on many ot the social
and demographic characteristics of providers and children. Data on the
age, sex, race, and relationship to provider are available for providers
and children. Additional data on education and work experience are
also available for providers. For center staff, there are also data on
whether the staff member works, and whether the fees for their own
child are adjusted because of their working at the center.
The interview instruments were structured to get the data needed
to address the research issues presented above. However, as our brief
discussion of the seven content areas indicates, a lot of data were
needed. After extensive cutting following a pretest, the interview
turned out to be about an hour long, and some problems arose in carry-
ing it out. It is useful to look at some of these problems as they
affect the data collected.
A-5
1

Problems in Data Collection
Interviewing began on May 2, 1974, and ended, with the exception
of a fewthard-to-reach cases, by June 7, 1974. In almost all instances,
this meant that the 4mterviews were .conducted during the regular school
year. For both sites and in all sectors, the refusal rate was below
15%. If the rate had exceeded 15%, we planned to obtain a profile of
respondents who refused to be interviewed to see whether there was a
systematic difference between those who provided the information and
those who refused. Since the refusal rate was, in most cases, far below
our cutoff point, the refusal profile was not undertaken,
Another problem was that in Denver the list of licensed FDCHs was
not complete, in that anyone who did not want his name to be used in
any referral would not be placed on the list compiled for use by
referral agencies. Since that was the list we used to determine the
total population of licensed FDCHs in Denver, we did not haqe an
accurate tally. However, a relatively small number of all licensed
FDCHs refuse to be listed. But when we selected our sample of
unlicensed FDCHs, 17 were, during the course of the interview, found to
be licensed. This usually came to our attention when the unlicensed
FDCH :espondent would answer "yes" to question 501 ("are you licensed
by an agency of the city or state as a family day care home operator"?).
For those who were later confirmed to be licensed, we changed their ID
number to reflect their actual condition, thereby placing them in the
licensed FDCH sample. The same problem did not exist in Seattle since
all licensees are on the list supplied by the Department of Sociai and
Health Services.
There were a number of other general problems that arose during
the course of the interviews, as well as some important problems
relating to specific questions. One major problem was, as pointed out
previously, obtaining an adequate sample of in-home providers in each
city, and a large enough sample of unlicensed FDCHs in Seattle. In
our attempt to enlarge the sample of unlicensed FDCH operators, we
came across a large number of communal child care exchanges. Due to

the peculiarirAes of this class of child care providers, * they were not
included in our sample.
Several problems arose during the center interviews. One was out-
side our control--the fact that in Seattle some centers had participated
in three surveys during the two years preceding our survey, including
one that began a few weeks before ours. About twelve centers were involved
in the latter survey, with two refusing our attempts to interview them.
Another center problem concerned the interview length. Although we
tried to cut down the average on-site interview time to a maximum of
1-1/4 hours, we found that the time required was running from 15 to 60
minutes longer than our maximum. The interviewers reported that the
early respondents would become irritated when the interview went much
beyond an hour., and would hurry through the last section. Since much
of our needed cost data were being picked up at the end of the inter-__view, we felt that it was essential to cut down the time. To do that,
we eliminated ten questions that had to be answered by the respondent,
usually the director, for each staff member employed at the center.
These questions took a large amount of time since some centers had as
many as 30 staff members, and few had less than five. Moreover, the
ten questions removed concerned the position for which staff members
were originally hired, the number of people hired for that position in
the past year, and the time required recruiting for that position.
These questions were originally iacluded in order to obtain some infor-
mation on possible "rare" inputs that could, conceivably, be a signifi-
cant cost factor. Since the directors were having peat difficulty in
answering those questions for their staff, and since the time required
in trying to obtain that data was jeopardizing more important data, the
ten questions were removed, from the on-site interview instrument.
There was also a supplement left behind at the center interview,
to be distributed to each center employee. After completion of her
This appears to be more related to a type of living arrangement,rather than to the market supply of day care services.
A-7

individual supplement, the staff member was to seal the form in an
enclosed envelope and return it to the center director, who was to
forward all staff supplements to the Urban Opinion Survey office.
Although a large number of these staff questionnaires were returned,
there were a significant number that were not returned, or not returned
in time for inclusion in our files.
Concerning the staff questionnaire that was left behind by the
interviewers, perhaps the most serious problem was the grid specifying
the activities undertaken during a week. This same difficulty was
also found during the FDCH interviews. The key problem was, as we
anticipated, division of the working week into independent activities.
As one respondent put it, "Ihe various duties and periods cannot be
divided into hours and minutes and the harder my staff tried the more
frustrating it was for them. Periods, duties and activities overlap
and very often many things are taking place at the same time." This is
clearly true, but the overwhelming proportion of all respondents
able to fit their activities by time into major activities undertaken.
Where problems were found in the activity grid and elsewhere in the
returned staff supplement, we found it difficult to follow up with the
respondent. This resulted from the fact that most of the center inter-
views were done in late May and early June. By the time the supplements
were sent in, many of the staff members had left on vacation, especially
volunteers, and locating them was not possible. Moreover, many direc-
tors simply refused to have staff members called to the telephone for
foilow-up work.
Another problem area was in fees that were scaled to family income.
In some cases there were almost 50 income classes used! Where the
center could not constrain the feeo within a more manageable number of
income classes, we averaged the fee schedule into at most five income
classes for nonsubsidized child care users.
Still another probrem that arose concerned some confusion with
regard to out-of-pocket food expenditures. In one question we asI.ed,
"On the average, how much do you usually spend per month on food i'or
A-8

the children, other than your own?" In a set of related questions, we
asked whether food stamps had been used to purchase food for children
who were cared for for pay, as well as the amount actually paid for
those food stamps. We found that some interviewers were adding the sums
from the several questions while others were not. In order to obtain an
accurate measure of the actual out-of-pocket expenditures, we checked
back with all respondents whose answer to the set of food expenditure
questions indica',:ed a possibility that the data given might have been
included twice.
A major source of cost data for FDCHs (licensed and unlicensvd)
came from a set of questions concerning capital and equipment owned.
To compare the asset positions of FDCHs with similar homes in which
child care is not provided, as well as to compare the asset positions
of FDCHs with centers, a bifurcation of our FDCH sample was required.
One subsample of FDCHs (licensed and unlicensed) was administered the
same capital and equipment questions asked of all centers; the other
subsample of FDCHs was asked the Net Worth module as given in the 7th
SIME/DIME Periodic interview. A comparison of the FDCHs given the
Net Worth module with homes of comparable socioeconomic characteristics
that do not provide day care services'was then made. Using a regression
model, we determined whether additional capitil assets were needed by
FDCH operators, because of their child care activities.
A-9
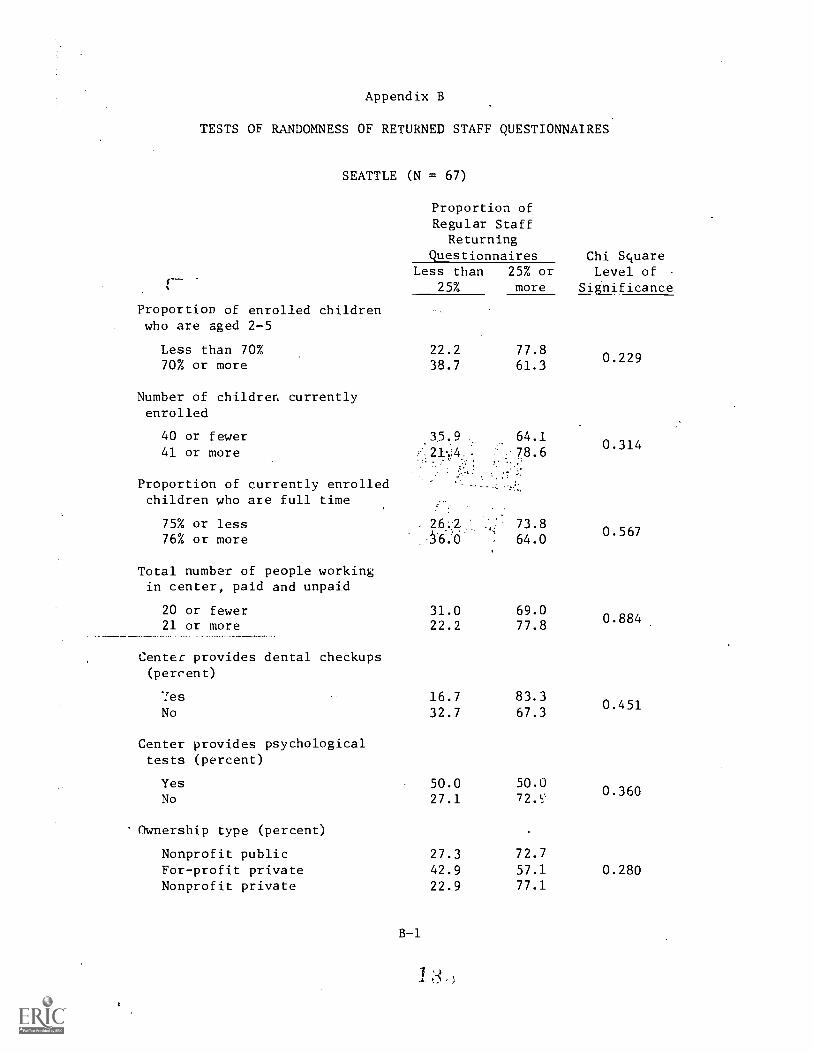
Appendix B
TESTS OF RANDOMNESS OF RETURNED STAFF QUESTIONNAIRES
SEATTLE (N = 67)
Proportion of enrolled childrenwho are aged 2-5
Less than 70%70% or more
Number of children currentlyenrolled
40 or fewer41 or more
Proportion of currently enrolledchildren who are full time
75% or less76% or more
Total number of people workingin center, paid and unpaid
20 or fewer21 or more
Center provides dental checkups(percent)
7esNo
Center provides psychologicaltests (percent)
YesNo
Ownership type (percent)
Nonprofit publicFor-profit privateNonprofit private
Proportion ofRegular Staff
ReturningQuestionnaires Chi Square
Level ofSignificance
Less than25%
25% ormore
22.238.7
.35.9
31.022.2
16.732.7
50.027.1
27.342.9
22.9
77.861.3
64.178.6
73.8
64.0
69.077.8
83.3
67.3
50.072.5
72.7
57.177.1
0.229
0.314
0.567
0.884
0.451
0.360
0.280
B-1
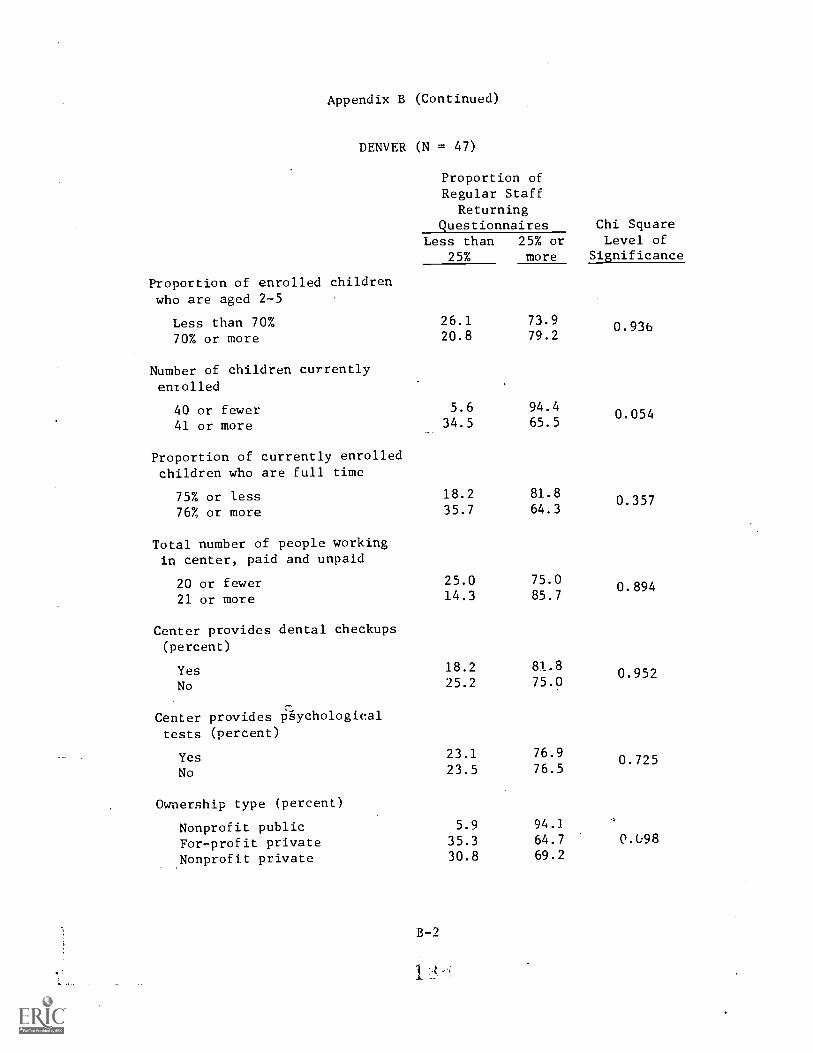
Appendix B (Continued)
DENVER (N = 47)
Proportion of enrolled childrenwho are aged 2-5
Less than 70%70% or more
Number of children currentlyentolled
40 or fewer41 or more
Proportion of currently enrolledchildren who are full time
75% or less76% or more
Total number of people workingin center, paid and unpaid
20 or fewer21 or more
Center provides dental checkups(percent)
YesNo
Center provides psychologicaltests (percent)
YesNo
Ownership type (percent)
Nonprofit publicFor-profit privateNonprofit private
Proportion ofRegular Staff
ReturningQuestionnaires Chi Square
Level ofSignificance
Less than25%
25% ormore
26.120.8
5.6
34.5
18.235.7
25.014.3
18.225.2
23.123.5
5.9
35.330.8
73.979.2
94.465.5
81.864.3
75.085.7
81.875.0
76.976.5
94.1
64.769.2
0.936
0.054
0.357
0.894
0.952
0.725
0.1;98
B-?

Appendix C
CLASSIFICATION OF HOURS OF CARE
For all providers, and for individual center staff members, we
asked that they allocate the total number of hours orked last week as
a day care vendor into twenty separate activities. These activities
were then grouped into custodial care hours, educational-developmental
care hours, administrative.hpurs, and other hours. Our fnterest was
in the first two types of activities. The method used in classifying
activities into custodial or educational-development groups was by a
consensus of those involved with the analysis of this study, along with
discussions with child care experts. The question asked waS, "Out of
the total time [worked last week], how much tile did you spend in each
of the following activities?" The following is-a breakdown of the
activities according to whether they were grouped into the custodial or
the educational-developmental set:
Custodial
1. Supervising or watching children while they were havingfree play time.
2. Supervising or watching children while they were having anap or rest time.
3. Taking the children back and forth to the toilet, andattending to their personal toilet, including dressiagand undressing them, washing them up, etc.
4. Supervising or watching the children while they werewatching TV.
5. Supervising or watching while they were having meals orsnacks.
Educational-Developmental
1. Teaching or working directly with the children while theywere watching TV.
C-1

2. Teaching or working directly with the children on science,language, or number skills. (This includes nature studies,reading, writing, learning numbers, counting, handlingdifferent quantities through the use of books, audio-visual aids, games, or other aids.) .
3. Preparing materials to teach or work wit%.the children onscience, language, or number skills.
4. Teaching or working directly with the children on arts,crafts, and music.
5. Preparing materials to teach or work directly with thechildren on arts, crafts, and music.
6. Teaening or working directly with the children on indoor-outdoor physical activities. (This includes rhythm games,running, jumping, climbing, diulng, puzzles, and tinkertoys.)
7. Taking the children on field trips, including museums,factories, and nature studies.
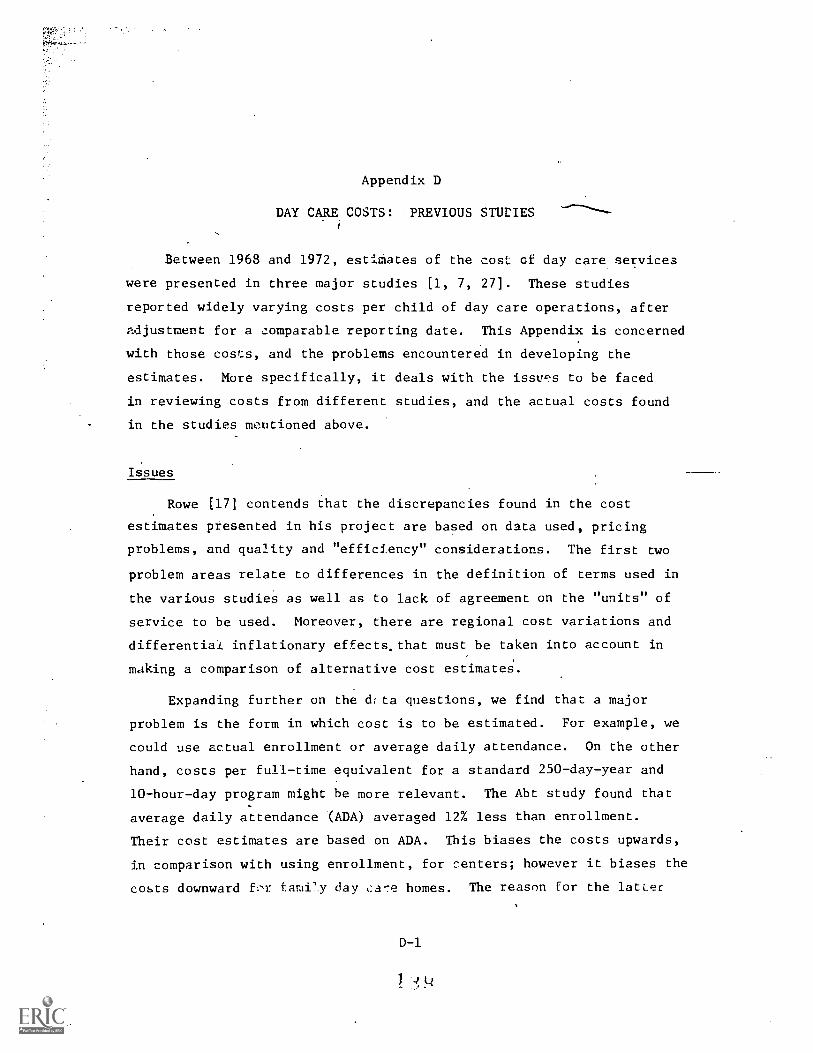
Appendix D
DAY CARE COSTS: PREVIOUS STUDIES
Between 1968 and 1972, estimates of the cost cf day care services
were presented in three major studies [1, 7, 27]. These studies
reported widely varying costs per child of day care operations, after
adjustment for a comparable reporting date. This Appendix is concerned
with those cost.:s, and the problems encountered in developing the
estimates. More specifically, it deals with the issu.ss to be faced
in reviewing costs from different studies, and the actual costs found
in the studies mentioned above.
Issues
Rowe [17] contends that the discrepancies found in the cost
estimates presented in his project are based on data used, pricing
problems, and quality and "efficiency" considerations. The first two
problem areas relate to differences in the definition of terms used in
the various studies as well as to lack of agreement on the "units" of
service to be used. Moreover, there are regional cost variations and
differential inflationary effects,that must be taken into account in
making a comparison of alternative cost estimate.
Expanding further on the d;ta questions, we find that a major
problem is the form in which cost is to be estimated. For example, we
could use actual enrollment or average daily attendance. On the other
hand, costs per full-time equivalent for a standard 250-day-year and
10-hour-day program might be more relevant. The Abt study found that
average daily attendance (ADA) averaged 12% less than enrollment.
Their cost estimates are based on ADA. This biases the costs upwards,
in comparison with using enrollment, for c.enters; however it biases the
costs downward fc,r fami'y day ca-e homes. The reason for the latter
D-1
result is that FDCH mothers take care of their own children, who are
not considered to be "enrolled" but are included in determining the
ADA. (See Rowe [16] p. 101.)
On the other hand, some estimates are based on the total number of
hours the facility is open, in conjunction with the average enrollment.
Using facility hours does have the advantage of stating costs per child
using the facilitY for the time that it is available to them. However,
- it is not an accurate reflection of actual use nor of the costs consis
tent with that level of use. It seems more appropriate to estimate the
costs per child bygdetermining the total costs per day, and then
dividing that sum by the number of full time equivalent (FTE) children
multiplied by the average hoUrs of day care provided per FTE child.
This would give us an estimate of the cost per child hour for the time
that the facility is actually being used.
Other data questions to be answered before useful comparisons can
be made between alternative cost estimates concern the elements of
cost used in the estimates presented. One major problem is that the
imputed costs of volunteer service and the value of donated materials,
supplies, and equipment are often not included in the cost totals.
Moreover, often only recurrent, operating costs are included, while
start-up costs as well as prorated shares of long-term investments are
not taken into account. In centers, the use of volunteer labor can be
a very significant factor in the actual use of resources in child care
operations. The Abt study (as reported in Rowe [17, Chap. 8, p. 16])
found that the use of vo3unteers, unpaid family members, unpaid over-
time, gifts, and other donated resources averaged 5% to 10% of total
resources used by proprietary centers, and 15% to 25% of resources used
by nonproprietary centers.
For FDCHs, an important and often neglected cost is a .elevant
market assessment of the operator's wage. What is frequently done is
to determine an ex post wage by dividing the difference between income
and total operating expenses, excluding wages, by the.hours spent
providing day c;3re services for pay. This procedure would lead to a
D-2

zero profit for FDCH operations, but it may not be an accurate'reflec-
tion of the real costs incurred. The market wage as calculated above
does not take into account the fact that most FDCH operators often take
care of their own children during the same time they are providing
paid care for other children. This unpaid element of day care should
be added into the income received before wages, as described above, are
calculated. That would help to make the costs comparable for FDCHs
in which the operators do and do not take care of their own children.
The issue of pricing problems and differing regional rates of
inflation is fairly'straightforward. If in one area the price of inputs
is systematically higher, comparison of the costs based on data
collected in the two areas is not valid. The same holds if two areas
for which cost data are being collected are experiencing differential
rates of inflation, which will lead to different relative prices for
similar inputs.
Table D-1 shows the total payment structure in Seattle and Denver
for individuals with a Bachelor's degree* and highlights some of the
problems faced in comparing costs where the price of an important input
differs between the areas used. Of course, if only the actual salaries
differed, and these were known, we could easily make an acceptable
deflation of the higher or an inflation of the lower salary by construct-
ing an index based on salaries in one or another of the cities used.
However, first of all we rarely have all the input prices for a similar
time period in the sites used for collecting the cost data; and second,
the table points out the need to take account of nonsalary items in
estimating the relative cost in the two cities. For e in Denver,
although salaries are higher, only one semester of partially paid
sabbatical is given, whereas in Seattle, a full year of partial pay is
given. This must be taken into account, and once it is known it can
*To the extent that centers use certified teachers, this structure mayactually be relevant to day care costs. The data were taken from"Salary &.Fringe Benefits for Tew.7hers, 1.972-'73," Rearch Report1973-R2, National Education Association, 1973.
D-3
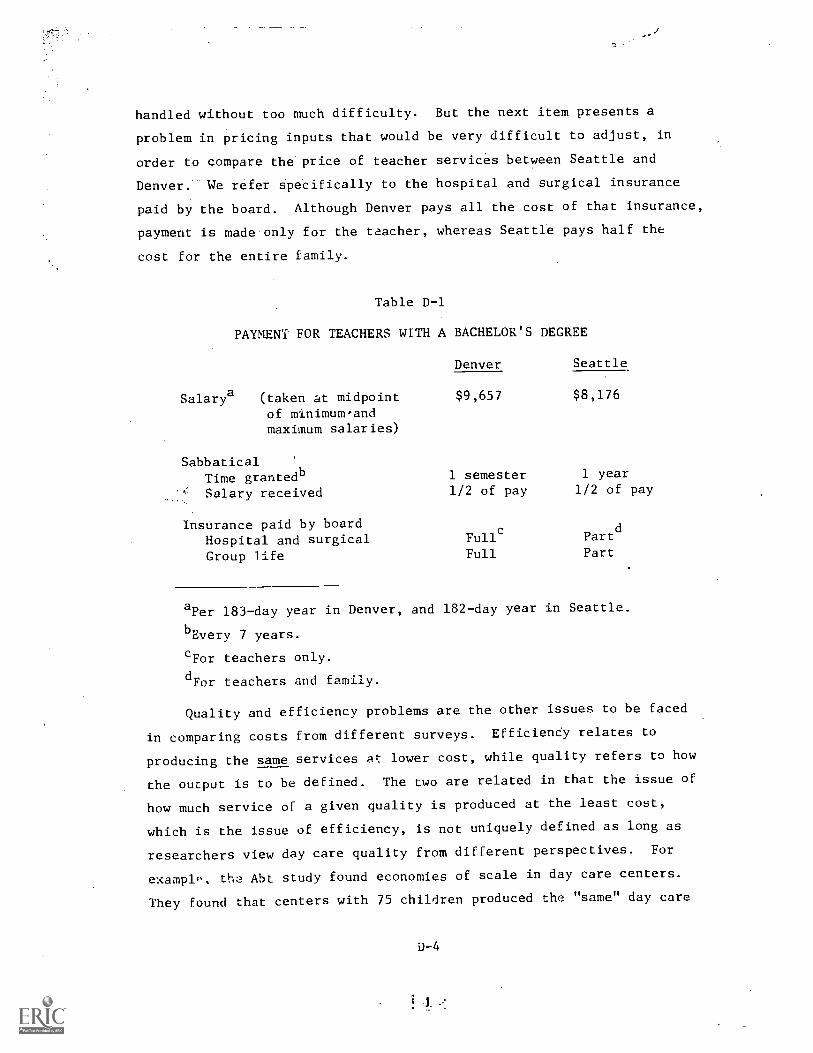
handled without too much difficulty. But the next item presents a
problem in pricing inputs that would be very difficult to adjust, in
order to compare the price of teacher services between Seattle and
Denver. We refer specifically to the hospital and surgical insurance
paid by the board. Although Denver pays all the cost of that insurance,
payment is made only for the teacher, whereas Seattle pays half the
cost for the entire family.
Table D-1
PAYMENT FOR TEACHERS WITH A BACHELOR'S DEGREE
Denver Seattle
$9,657 $8,176Salary a (taken at midpointof minimum.andmaximum salaries)
SabbaticalTime grantedbSalary received
1 semester1/2 of pay
1 year1/2 of pay
Insurance paid by boardc
Hospital and surgical Partd
Full
Group life Full Part
aPer 183-day year in Denver, and 182-day year in Seattle.
b-r.very 7 years.
cFor teachers only.
d For teachers and family.
Quality and efficiency problems are the other issues to be faced
in comparing costs from different surveys. Efficiendy relates to
producing the same services at lower cost, while quality refers to how
the output is to be defined. The two are related in that the issue of
how much service of a given quality is produced at the least cost,
which is the issue of efficiency, is not uniquely defined as long as
researchers view day care quality from different perspectives. For
examplo. tha Aht study found economies of scale in day care centers.
They found that centers with 75 children produced the "same" day care
D-4

services at ,about 10% less than centers with 25 children. This came
about mainly through the spreading of administrative costs. However,
the Abt investigators contend that large centers are less warm, so that
we may not actually be talking about the "same" service. Whether the
warmth of service is a relex.ant element of the quality of care is
difficult to say, but it is generally agreed that meeting the emotional
needs of the child should be an important factor in determining the
quality of child care.
Obtaining an objective measure for the quality of child care
services, one that is consistent and agreed upon between different
investigators, has been an almost impossible task. [See 4, 5, and 9,
Chap. 20; 17, Chap. 8, pp. 1, 10; and 28, p. 53.] As stated in Chapter
2, child/staff ratios are usually used as the most reliable ad hoc
measure of quality. However, it was found in a study of selected
centers in San Mateo County, California, that, past some point, in-
creased staff size can lead to a lowering of the care provided (Profes-
sor Henry Levin, Stanford University, private communication). In that
study, it was found that as staff size increases, more time is spent on
interstaff communication and interaction, and less on direct contact
with children.
The Westinghouse-Westat study attempted to present some objective
measures for viewing centers according to the level of child care
provided. First they clasaified centers according to the aims of the
programs. (They did not try to determine whether those aims were being
met, how well it was functioning, nor the effect of the programs on
children being served.) Their division was into type A (custodial),
Type B (educational), and Type C (educational-developmental). They
then presented a detailed table of characteristics for centers [27,
Table 2.11. Of the 119 characteristics used, very few appeared to show
any sizeable differences between Type A and C centers. In most cases,
the percentage of A and C centers for which the characteristics were
present or relevant was either both high or both low. It is hard to
see the relevance of many of the characteristics for a discussion cf
D-5
1 4
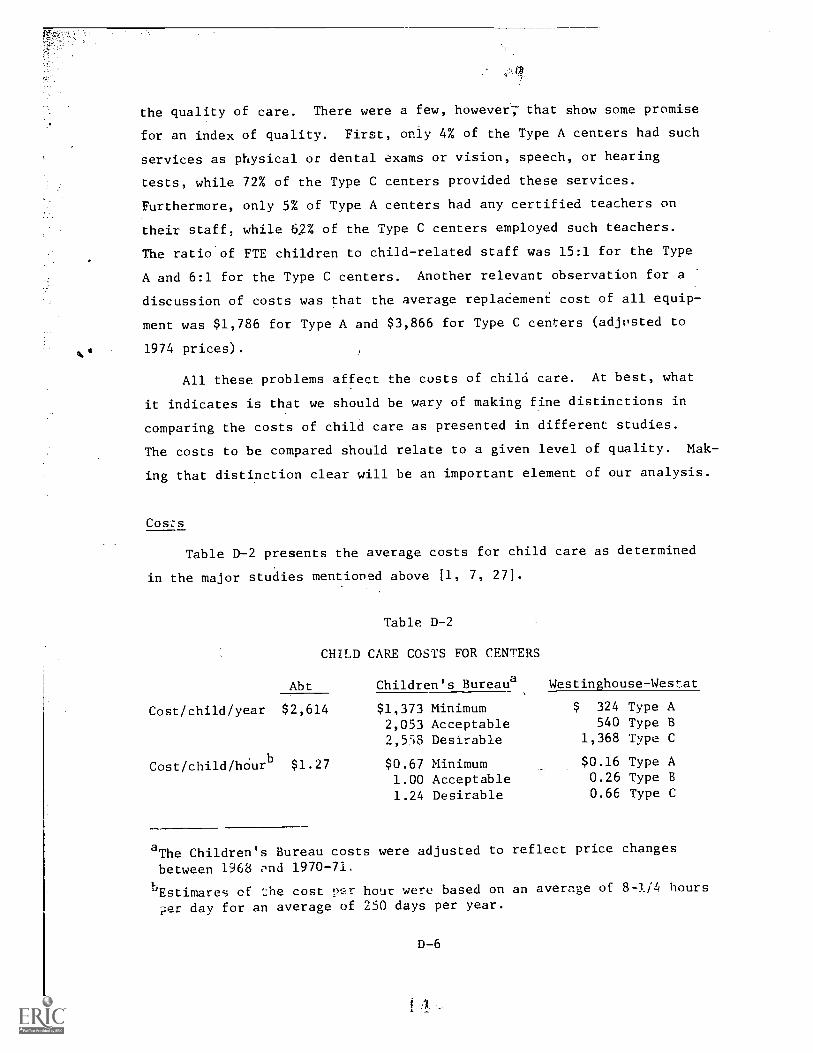
the quality of care. There were 'a few, however; that show some promise
for an index of quality. First, only 4% of the Type A centers had such
services as physical or dental
tests, while 72% of the Type C
Furthermore, only 5% of Type A
exams or vision, speech, or hearing
centers provided these services.
centers had any certified teachers on
their staff, while 62% of the Type C centers employed such teachers.
The ratio of FTE children to child-related staff was 15:1 for the Type
A and 6:1 for the Type C centers. Another relevant observation for a
discussion of costs was that the average rep1acement cost of all equip-
ment was $1,786 for Type A and $3,866 for Type C centers (adjvsted to
1974 prices).
All these problems affect the costs of child care. At best, what
it indicates is that we should be wary of making fine distinctions in
comparing the costs of child care as presented in different studies.
The costs to be compared should relate to a given level of quality. Mak-
ing that distinction clear will be an important element of our analysis.
Coszs
Table D-2 presents the average costs for child care as determined
in the major studies mentioned above [1, 7, 271.
Cost/child/year
Cost/child/hOurb
Table D-2
CHILD CARE COSTS FOR CENTERS
Abt
$2,614
$1.27
Children's Bureaua Westinghouse-Westat
$1,373 Minimum2,053 Acceptable2,558 Desirable
$0.67 Minimum1.00 Acceptable1.24 Desirable
$ 324 Type A540 Type B
1,368 Type C
$0.16 Type A0.26 Type B0.66 Type C
aThe Children's Bureau costs were adjusted to reflect price changes
between 1968 ond 1970-71,
bEstimares of '.:he cost !ler hour were based on an average of 8-1/4 hours
'i:er day for an average of 250 days per year.
D-6

The Abt cost data were collected for 13 exemplary centers so that,
presumably, their cost is for high quality day care service. The
Children's Bureau estimate for "desirable" care also represents an
attempt to estimate costs for high quality care. The two estimates
are very close. However, the Westinghouse-Westat estimate for Type C
centers, also supposed to offer high quality service, is only half of
what the other studies found for such service. In fact, the cost for
what the Children's Bureau considers to be custodial care (Minimum) is
slightly higher than the high quality service found in the Westinghouse-
Westat study. It is generally felt that the Westinghouse estimates
__were seriously underestimated, for several reasons. First, the
proprietary centers, which made up almost 60% of all centers surveyed,
'did not appear to include proprietors' income or the labor supplied by
unpaid family members into their costs. In general, as the report
warns, "No attempt was made to impute the value of donated goods and
services cr rent free space" [27, p. XIII]. These.costs can probably
best be used in comparfng the relative differences in costs between
Types A, B, and C centers. However, even for this the comparison might
not be too useful. Type C center costs are more than four times those
of Type A, while in the Children's Bureau study, Desirable care costs
are less than twice those for Minimum care. From the descriptions
given, it appears that Type A aqd Minimum care should be approximately
the same, as should Type C and Desirable care.
However these costs are defined, it appears in all cases that
costs are heavily dependent on the amount of labor used and the wage&
paid. The Abt study has three-fourths of the budget allotted to
personnel costs, while the Children's Bureau estimated that over 60% of
all costs were for personnel.
Using data collected from 20 exemplary centers offering educational
and developmental services, Abt prepared cost estimates for centers
with 25, 50, and 75 children in averas daily attendance. The costs
found were $2,349 per child per year fsr centers with 25 children,
$2,233 per child per year for centers with 50 ehildren, and $2,189 per
D-7

child per year for centers with 75 children. This indicates the
existence of fairly small economies of scale for high quality centers.
However, as the Abt report suggests, those economies may have been
more than offset by the loss of "warmth" in larger centers. They
also found that the higher cost of smaller centers was due mainly to
lower child/staff ratios, and not to higher salaries [see also 17].
D-8
!
AppeEdix E
CAPITAL COSTS IN DAY CARE HOMES
Capital Costs in Day Care Homes
Capital costs were left out of the cost equation for family day
care homes because of the difficulty in determining how much of the
services of hoy..q.eh.ald capital goods were used in child care. Another
reason for ignoring these costs was that the use of household capital
goods may not affect the cost of day care. If the capital goods were
things that would be owned whether or not the home was used for child
care, and if the children only use excess capacity that would not other-
wise be used by the provider's family, then competition could be expected
to drive the cost of these services toward zero. To test whether capital
services increase the cost of family day care home service, it is neces-
sary to measure these services. The only capital services that can
clearly be attributed to day care are those of goods owned by family day
care home providers and not by otherwise similar households. Thus, a
comparison of the househoJd capital of family day care homes with a group
of similar homes that do not provide child care offers the best test for
the presence )C capital as an element of cost in the provision of day
care.
The Seattle and Denver Income Maintenance Experiments are a source
of data on families suitable for this comparison. The control groups for
these experiments differ from the family day care home familles primarily
in the Zact that they do not provide child care. With tnis comparison
in mind, half thc: family day cara homes in each site were asked the same
questions about durable goods that are regularly asked the SIME and DIME
populations. Both SIME-DIME and FDCH families were also asked the number
of rooms in their homes. Although the data are responses to the same
questions, pey do not represent the same time pek-iod for each group.
While ehe D-ay.Care Survey was conducted in May of 1974, the latest S1ME
E-1

data available were froM February of 1973 and the latest DIME data from
November of 1973. This difference in dates could make data from the two
sources noncomparable. To determine whether this was the case, compari-
sons were made within the SIME and DIME samples over an equivalent length'
of time.*
These comparisons showed no systematic difference over time,
thus validating the use of the earlier SIME and DIME data for comparison
with FDCH data from the Day Care Survey.
Another difficulty that arises in making a comparison between SIME/
DIME and FDCH families is the definition of the variable or variables to
be compared. The comparison might be made on total net worth of the
family. However, that quantity included the values of many assets other
than buildings and equipment, and the presence of these other assets can
only blur any comparison between the two groups. At the other extreme,
comparisons might be made on individual items of equipment or aspects of
buildings. This approach too has difficulties. One problem is that some
items may be missing from many observations, complicating the comparison.
Also, this method multiplies the number of comparisons, making It diffi-
cult to reach a single conclusion unless the true difference is very pro-
nounced. The variables actually chosen for the comparison represent a
compromise between these two extremes. They are:
(1) .The present value of all durable equipment in the home,excluding vehicles
(2) The present value of all land motor vehicles
(3) The number of rooms in the house, excluding bathroomsand hallways.
These variables were computed in the same way from the raw interview
data for both groups.
*A paired comparison test was made for each variable. The value of thevariable for a particular month was compared with the value for :anearlier month for the same family. The number of months between theobservations was the same as the number between the SIME or DIME obser-vations and the FDCH observations.
E -2

The three variables listed above can reasonably be expected to be
influenced by many other factors besides the home's use 'as a child care
facility. In comparing family day care-hoffes-w4t-h-t-he-SIME-aft4-DIME
families, it is important to eliminate or at least minimize the effect
of these factors'before the comparison is made. A.straightforward way
to do this involves the use of linear regressions. Regression models
can be specified that explain the comparison (dependent) variables, in-
cluding child care utatus. When these models have been estimated, values
for the explanatory variables can be inserted to produce predictions. So
long as reasonable values of the explanatory variables are used to calcu-
late predictions, the differences between the predictions should reflect
the true diffcrence between family day'care homes and SIME or DIME fam-
ilies.
This procedure was used to compare family day care homes with SINE
and DIME 1.amilles,. Table E-1 lists the explanatory variables used in
the models for each of the three comparison variables'. Unfortunately,
the list does not include some variables that seem likely to affect the
comparlson variables. Economic status as measured by ;family income and
liquid assets should reasonably affect value of durables and value of
vehicles. The number of rooms is also probably influenced by the number
of children in the family. Data limitations prevented these and other
possibly helpful explanatory variables from being included in the model.
The absence of these variables may affect the comparison if there are
systematic differences in t.he absent varilbles between the two popula-
tions.
The fact that there are three variables to be explained points to
the,use of multivariate regression for estimating the coefficients of the
model. Multivariate regression is simply a generalization of the famil-
iar regression model to the case in which there are several dependent
variables. The technique produces the same estimates that would be pro-
duced by separate regressions on each dependent variable. However, in
hypothesis tests, the multivariate technique makes use of the covariances
between dependent variables that would implicitly be assumed to be zero
if rests were done using separate, single dependclt variable regressions.
E-3
t 4 9

1. Location
2. Education
3. Race
4
Table E-1-
CONTROL VARIABLES
-~
1
0 Outside SIME or DIME area1 Inside SlME or DIME area
Years of schooling
0 White1 1 Bik
Age Age of female head of family
1 Family with one parent present5. Parents Present
0 Family with two parents present
6. Homeownership0 Does not own home1 Owns home
Models were estimated, with the dependent and independent variables
described above, for faMily day care homes in each city, as well as for
SIME and DIME families in each city. Then, predicted values of the com-
parison variables were calculated for each population, using mean values
of the independent variables from the SIME population for rhe Seatide
compariscn and from the DIME population for the Denver comparison. Hy-
pothesis tests were done for each, comparing the predicted valus for
SIMF or DIME families against those for FDCH families. A simultaneous
test for all three'comparison variables was done first, and then a test
for each comparison variable separately. The estimated models, the means
of the explanatory variables, and results of the tests are presented in
Tables E-2, E-3, E-4, E-5, and E-6. Tables E-2 and E-3 present regres-
sion coefficients for each group for each city. The means of independent .
variables used to calculate predictee values and the mean differences be-
tween the'predicted values for the FDCH and SIME/DIME families are pre-
sented in Tables E-4 and E-5. The results of the tests of the differences
between the groups are given in Table E-6.
E-4
0!!
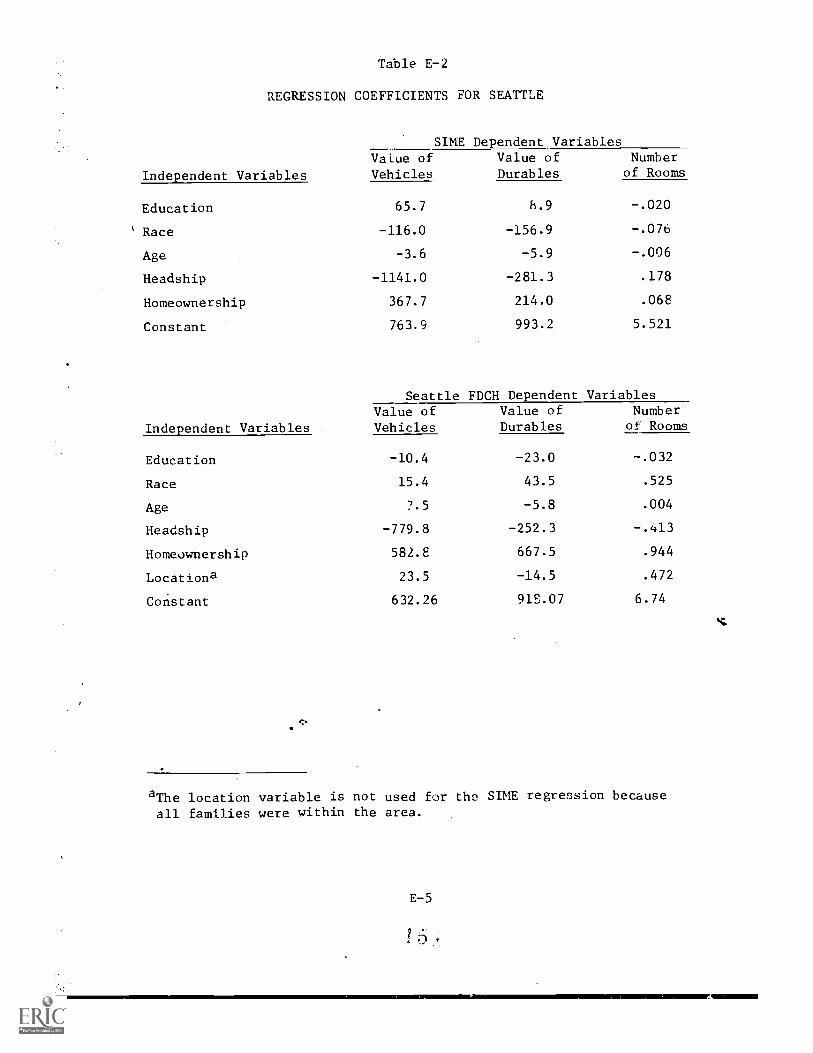
Table E -2
REGRESSION COEFFICIENTS FOR SEATTLE
SIME Dependent VariablesVaLue of Value of Number
Independent Variables Vehicles Durables of Rooms
Education 65.7 6.9 -.020
' Race -116.0 -156.9 -.076
Age -3.6 -5.9 -.006
Headship -1141.0 -281.3 .178
Homeownership 367.7 214.0 .068
Constant 763.9 993.2 5.521
Seattle FDCH Dependent Variables
Value of Value of Number
Independent Variables Vehicles Durables of Rooms
Education -10.4 -23.0 -.032
Race 15.4 43.5 .525
Age 7.5 -5.8 .004
Headship -779.8 -252.3 -.413
Homeownership 582.8 667.5 .944
Locationa 23.5 -14.5 .472
Constant 632.26 918.07 6.74
aThe location variable is not used for the SINE regression becauseall families were within the area.
E -5

Table E -3
REGRESSION COEFFICIENTS FOR DENVER
DIME Dependent VariablesValue of Value of Number
Independent Variables Vehicles Durables of Rom:3
Education 63.4 29.7 .086
Race 287.3 -14.8 .219
Age -20.2 -10.9 .011
Headship -466.2 -317.5 .160
Homeownership 281.6 622.8 .154
Constant 918.5 910.2 4.374
Denver FDCH Dependent VariableValue of Value of Number
Independent Variables Vehicles Durables of Rooms
Education 94.4 76.4 .022
Race -574.1 70.3 .293
Age -12.1 -10.1 -.002
Headship -761.7 -143.3 .487
Homeownership 1118.2 548.1 1.311
Locationa 129.9 70.7 -.441
Constant 423.8 85.32 5.81
aThe location variable is not used for the SINE revession because
all families were within the area.
E -6

Table E -4
MEANS OF INDEPENDENT VARIABLES
Seattle Denver
Education 12.1 11.6
Race .77 .74
Age 41.3 42.9
Headship .44 .40
Homeownership .17 .14
Location la laJ.
aComparison was made ,:rithin the SIME and DIME areas.
Table E -5
PREDICTED DIFFERENCES
FDCH/SIME FDCH/DIME
Value of vehicles -388.3 -514.9
Value of durables -216.5 -135.3
Number of rooms 1.775 1.110
E -7
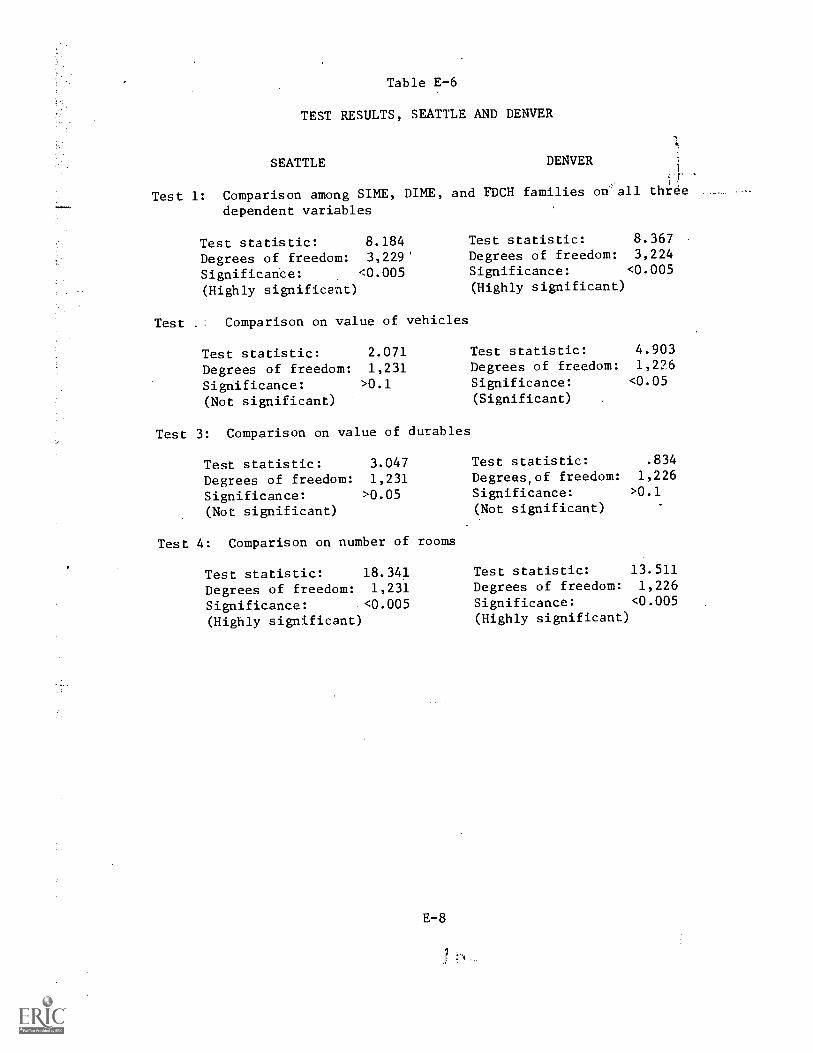
Table E -6
TEST RESULTS, SEATTLE AND DENVER
SEATTLE DENVERr
Test 1: Comparison among SIME, DIME, and FDCH families on all three
dependent variables
Test statistic: 8.184 Test statistic: 8.367
Degrees of freedom: 3,229' Degrees of freedom: 3,224
Significance: <0.005 Significance: <0.005
(Highly significant) (Highly significant)
Test Comparison on value of vehicles
Test statistic: 2.071 Test statistic: 4.903
Degrees of freedom: 1,231 Degrees of freedom: 1,226
Significance: >0.1 Significance: <0.05
(Not significant) (Significant)
Test 3: Comparison on value of durables
Test statistic: 3.047 Test statistic: .834
Degrees of freedom: 1,231 Degrees,of freedom: 1,226
Significance: >0.05 Significance: >0.1
(Not significant) (Not significant)
Test 4: Comparison on number of rooms
Test statistic: 18.341 Test statistic: 13.511
Degrees of freedom: 1,231 Degrees of freedom: 1,226
Significance: <0.005 Significance: <0.005
(Highly significant) (Highly significant)
E -8
n

The differences in the predicted values of the comparison variables
between SIME/DIME and FDCH families are consistent for Seattle and
Denver.- In both cities, the predicted value of vehicles and value of
durables are less for family day care homes while the predicted number
of rooms is greater. For both, the difference in the number of rooms
is the most significant difference between SIME/DIME and family day
care homes. The only real difference between the cities is that the
difference in value of vehicles is significant in Denver and not in
Seattle.
The results strongly support the conclusion that family day care
homes have more rooms on the average than similar homes that do not
provide child care. The direction of the difference is reversed for
the other two comparison variables, but this may reflect differences
in the data rather than differences between the two groups. While the
data were responses to identical questions, they represent the first
administration of the questionnaire to the FDCH families, while the
SIME and DIME families had been asked the same questions several times
before. This difference could be expected to lead to differences in
reporting accuracy, especially since information collected in previous
administrations of the questionnaires was used to prompt the SIME and
DIME families. This difference in procedure must bias the predicted
values for durables and vehicles upward for SIME and DIME families,
relative to that for the FDCH families. Such a bias seems the'best
explanation for the higher values of durables and vehicles exhibited
by SIME and DIME families. If there is some extra quantity of durables
or vehicles needed for the operation of a family day care home, it is
obscured by the bias caused by the different administration of the
tests.

Appendix F
SUPPLEMENTARY INFORMATION FOR THE DERIVATION OF FUNCTIONS USEDIN THE ESTIMATION OF THE COST OF CUSTODIAL CARE
Quality in Day Care
Quality of day care service is something researchers have had great
difficulty defining and measuring. There is no agreement on what would
constitute a measure or set of measures of day care quality. However,
there is a typology, with which most researchers would agree, that has
implications for the construction of a wodel for day care costs. This
typology divides day care quality into two groups of attributes. One
group has to do with the ifiteraction of child and provider, and the
environment or atmosphere of the place where the child receives care.
High quality care is equated with a "warm nurturing atmosphere" and a
provider who is attentive and takes an affirmative and encouraging atti-
tude toward the child. This group of attributes measures quality more
in terms of the determinants of the child's feelings about the exper-
ience than in terms of the effect of the experience upon his growth or
development. Of course, th: child's attitudes toward a place where he
must spend much of his time inevitably affect his development. The dis-
tinction is made to contrast this bundle of attributes from another bundle
that also affects child development and that involves the deliberate
manipulation of the child's experience to bring about some specific
change in his development. The only easily quantifiable indicator of
quality of the first type is the staff/child or child/provider ratio.
Mosc studjes that have addressed the issue of day care quality have con-
cluded that the staff/child ratio is crucial to the quality of cart-.
The relationship between the staff/child ratio and day care nost is
clear. Because labor is the most impOrtant element in child care services
higher staff/child ratios must significantly increase costs. Some quali-
fications would be needed to 1:1131y this statement if staff/child ratios
F-1

and costs were to be compared between sectors of the day care market.
However, it does hold within any one of the sectors. Moreover, this
statement is not in contradiction to the view expressed by one reviewer
that staff/child ratios, levels of professionalism, xosts, and child
behavior are inextricablY convected.
The beha-Acr of providers towards children is equally important
but much more difficult to evaluate. Fortunately, only observable dif-
ferences in provider behavior should have strong effects upon costs.
While education and experience are easily evaluated, judgments of the
provider's attitude must be so subjective and opinions of desirable
provider behavior so various that the market could not accurately dif-
ferentiate prices on the basis of this aspect of day care quality.
Variation in the staff/child ratio and observable provider characteristics
should summarize the effect of the first bundle of quality attributes
upon day care cost.
The second aspect of day care quality in this typology involves
the activities in the day care home or center that are designed to
directly affect child development. This aspect might be called the
quality of the day care program. Deliberate attempts at affecting
the child's development range from simply a careful choice of the toys
with which he may play through the establishment of detailed and
specific curriculum. This group of attributes is somewhat easier to
quantify, at least'approximately. The Westinghouse-Westat study [27],
foy example, classifies providers as giving either custodial, educational,
or developmental care. Although measures of this group of attributes
can he more explicit, there is less agreement above the level of quality
associated with different types of developmental care. The different
types of care are expressions of different theories of child development.
In terms of its own theory, eacn particular type of care is best, but
no generally accepted judgment of program quality exists.
Several indicators of the quality of day care vis-a-vis the child
development activities pursued by the provider can be identified. The
education and experience of the providers and the type of activities
provided are examples of such indicators. Taken together, they represent
F-2
only a general understanding of the nature of this aspect of quality in
day care service. The exact relationship between the indicators and
the quality of day care is unknown, and a cost function incorporating
indicators of the quality of the service will not directly relate cost
and the quality of care. It follows that a cost function including
;quality indicators cannot be used to estimate the cost of a given quality
of care unless that quality can be defined in terms of the indicator
variables.
in general, it is not easy to relate day care quality to particular
levels of the indicator variables. However, care that is almost purely
custodial in nature should be identifiable because it would correspond
to a minimum level of each of the variables identified as indicators
of quality. Thus, a cost function incorporating the indicators of
quality in day care service will permit the estimation of the cost of
custodial care. This cost is an appropriate variable for the determina-
tion o.1: day care policy, so infoimec: decisions can be made without a
complete understanding of quality variations in the provision of day
care services.
While .the cost of custodial care can be estimated from a function
incorporating indicators, little insight will be gained into the nature
of day care quality. Developmental care in general has a higher cost,
but some types of developmenta, care may be costless or even lead to
decreases in cost. Thus, the cost function will identify not the cost
of purely custodial quality care, but the quality of care with the lowest
cost. Since the estimates are to be used to determine the rate at which
day care should be subsidized, this is not a serious drawback. Deviations
from pure custodial care that were costless or resulted in cost savings
could be included in subsidized care.
Even for those elements of quality that increase costs, the cost
function is likely to provide little insight. The variables available
to account for quality are only indicators: while they are knwn to
be correlated with quality, their exact relationship to quality and their
interrelationships with each other are unknown. It is likely, however,
F-3
1

that variables used as indicators of quality are highly intercorrelated.
Variables indicating labor quality, age, experience, education, and race,
for example, will be interrelated in ways other than in their mutual
relationship to the cost of day care. Such interrelationships will cause
the coefficients of variables used as indicators of quality to be inac-
curately estimated. However, it is the relationship among nese
variables and not their joint effect upon day cz.re cost th;-.t is inac-
curately estimated. Again, our inability to accurately define quality
will not detract from our estimates of 'the cost uf cuszodial care. How-
ever, the intercorrelations of quality indicators wiil severely limit
the information about the quality of day care obtainable from cost func-
tion estimates.
Nonlabor Inputs to Day Care Services
While labor is the most important input to day care services, it
need not be the only one. For in-home providers, those who care for
childreu in the children's own home, the children or their parents
should normally provide whatever other inputs are used. The cost of
these inputs should therefore not figure in the charge for day care.
Another group of providers, the family day care home operators, bring
children into their own homes and presumably supply nearly all inputs
to the production of day care services. However, most of the inputs,
besides labor, used in the production of day care are the services of
various pieces of capital equipment, which the family of the provider
also consumes di.rectly.. The accepted view of these inputs is that they
represent the excess of capital services' not consumed by the provider's
family and as such do not represent a cost of day care. For this reason,
and because it would be very difficult to identify the part of these
capital services used in day care, we have ignored these inputs in the
estimation of the cost of day care for family day care homes. However,
an attempt was made to identify differences between the capital goods
held by family day care homes and similar homes that do not provide child
care- The results of this analysis are presented in Appendix E.
F-4

The contribution of other inputs to cust in day carc centers cannot
be ignored si.cce these inputs are used exclusively for the production of
day care services. Detailed information about the value and type of
capital used in day care centers was collected in the interview. For
analysis, it was necessary to aggregate the variables into a manageable
set. The aggregation was done in.value terms and the result was a
single variable that measures the value of all capital equipment used
in day care except buildings and grounds. Including a measure of the
contribution of buildings and grounds proved difficult because the
appropriate data were not often provided by the day care center. Two
measures were investigated: square feet of floorspace and building cost,
either rent or mortgage payment.
Other Services Provided With Day Care
Other services are often provided concurrently with day care and
their price included in the day care charge. Variables were added to
functions for ea4h mode of care to account for these services-.- Inhome
providers sometimes provided various housekeeping services while they
cared for children, and varLables were added to adcount for the cost of
these extra services. Both in-home and family day care home providers
occasionally kept children with them overnight. Presumably the hourly
charge for an overnight stay was much lower since it required little
lebo,- from the provider. Since our charge variable is standardized for
40 hours of any type of care, some adjustment for overnight stays was
necessary. The adjustment wa!---; made by adding a variable that counted
the number of overnight stays made by the child iu the week of observa-
tion.
Combining Provider Types
While it differs in detail, the day care service is basically very
similar for all providers. This implies that cost functions for different
provider types should be similar. The similarity should also extend across
F-5
!

cities. In the estimation of cost functions, this similarity can be used
to advantage. So long as the few differences between provider types and
cities are accounted for within the equation, the data can be combined
in estimating cost fOnctions. Combining the data for different provider
types will produce more precise estimates than could be obtained if
cost functions foi each provider type and city were estimated separately.
However, the way in which the data should be combined and the variation
r!.-ross providers that should allowed in a combined regression are not
obvious from prior knowiedge of the day care service. Fortunately there
,is a flexible statistical test, the Chow test, that faciliCates compari-
son between separate and combined models and between different forms of
the combined model. Because of our belief j.n the similarity of the cost
functions for different provider types, we imposed a 1% significance
level for rejecting tests of combined regressions in favor of separate
regressions.
Heteroskedasticity
The model, as described so far, cAn be expressed in the equation
X.a PCT
C = + b + c + Ed. + ER
The question of heteroskedasticity naturally arises here: there is no
particular reason to suppose that C, the cost per child, has a constant
variance for all providers. It seems just as reasonable that it is CR,
the equivalent wage, and not C that has a constant variance for all
providers. To find the correct form for the regressions presented below,
we ordered their residuals by increasing the value of R and then plotted
them. If the model estimated were heteroskedastic, the residuals would
vary in absolute value systematically with R. Ordering the residuals
by R assures that any systematic relationship will be readily apparent.
This procedure was followed for the regressions presented below and in
each case the model that showed no heteroskedastic relationship with R
was chosen.
F-6
,
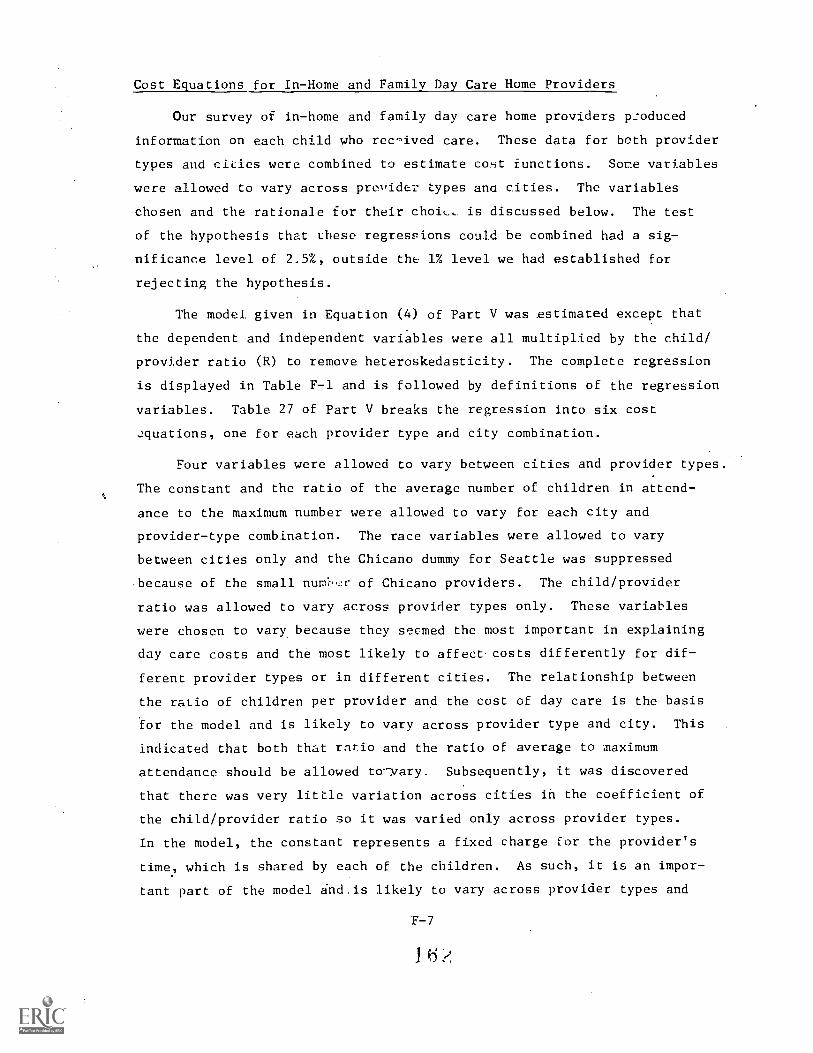
Cost Equations for In-Home and Family Day Care Hume Providers
Our survey of in-home and family day care home providers p2oduced
information on each child who rec,d.ved care. These data for bath provider
types and cities were combined to estimate cot functions. Some variables
were allowed to vary across provider types ana cities. The variables
chosen and the rationale for their choiL, is discussed below. The test
of the hypothesis that these regressions could be combined had a sig-
nificance level of 2.5%, outside the 1% level we had established for
rejecting the hypothesis.
The model given in Equation (4) of Part V was estimated except that
the dependent and independent variables were all multiplied by the child/
provider ratio (R) to remove heteroskedasticity. The complete regression
is displayed in Table F-1 and is followed by definitions of the regression
variables. Table 27 of Part V breaks the regression into six cost
Jquations, one for each provider type and city combination.
Four variables were allowed to vary between cities and provider types.
The constant and the ratio of the average number of children in attend-%
ance to the maximum number were allowed to vary for each city and
provider-type combination. The race variables were allowed to vary
between cities only and the Chicano dummy for Seattle was suppressed
because of the small nurr of Chicano providers. The child/provider
ratio was allowed to vary across provider types only. These variables
were chosen to vary because they seemed the most important in explaining
day care costs and the most likely to affect costs differently for dif-
ferent provider types or in different cities. The relationship between
the ratio of children per provider and the cost of day care is the basis
for the model and is likely to vary across provider type and city. This
indicated that both that ratio and the ratio of average to maximum
attendance should be allowed to-vary. Subsequently, it was discovered
that there was very little variation across cities ih the coefficient of
the child/provider ratio so it was varied only across provider types.
In the model, the constant represents a fixed charge for the provider's
time, which is shared by each of the children. As such, it is an impor-
tant part of the model and,is likely to vary across provider types and
F-7
16?

Table F-1
COMBINED IN-HOME AND FAMILY DAY CARE HOME REGRESSIONDEPENDENT VARIABLE: CR
Independent V :iablesCoefficient(dollars)
StandardError(dollars)
Constant $105.01 $31.43
SEAIH -40.98 A40.84
SEAHU -46.72 35.97
SEAH -56.30 31.46
DENHU -72.0e 34.19
DENHL -73.55a 31.69
RIH 5.19 5.04
RHU 13.24a 1.56
RHL 20.98a 0.68
SPCTCIP -0.57 0.34
SPCTCHU -0.48a 0.21
SPCTCHL -0.69a 0.07
DPCTCIH -1.02a 0.31
DPCTCHU -0.29a 0.14
DPCTCHL -0.59a 0.09
EDUC 1.32a 0.66
EXPER 0.03 0.28
PREWORK_
-8.23a 3.84
INHOME -4.81 3.22
HOME 1.38 12.75
CENTER -13.25a 4.92
PCTDEVL 0.06 0.09
SBL 22.21a 4.69
DBL -9.51 5.22
DCH 2.12 6.36
COOK -3.13 14.81
LAUND 19.41 13.63
OVRNT -7.46 3.25
Number of ,Uservations: 1750
R2: 0.56
Standard error: 56.25
Significantly different from zero at the 5% level.
F-8
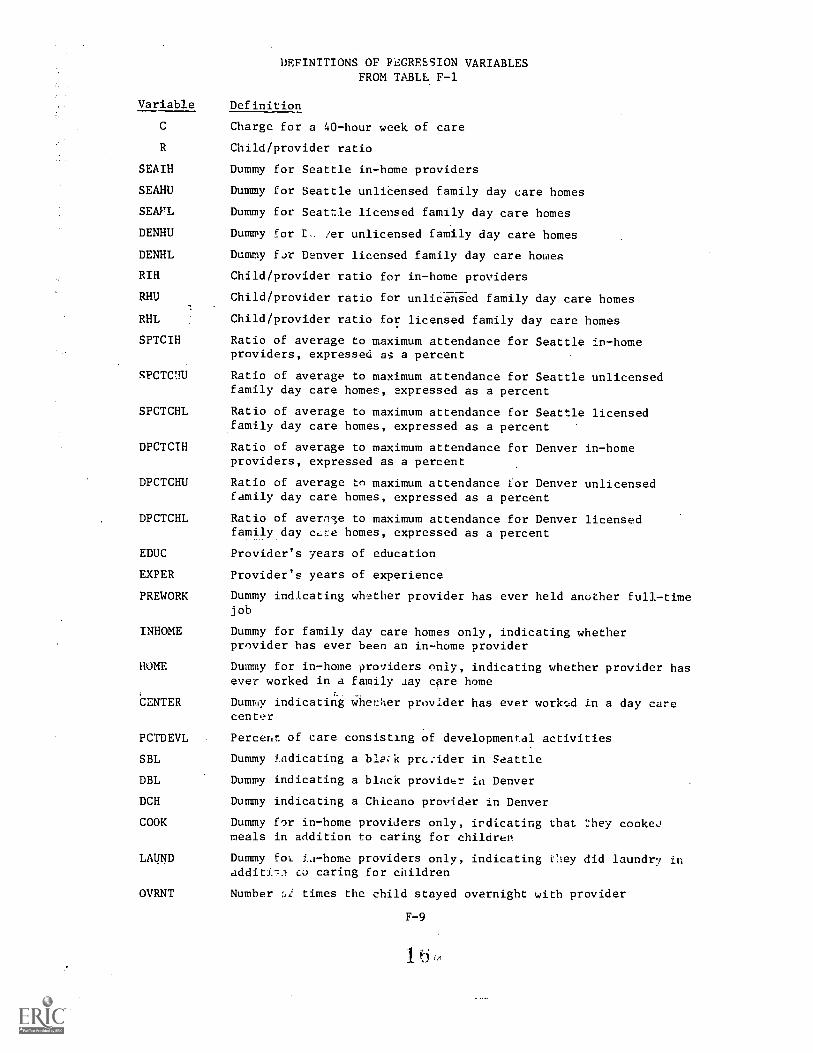
DEFINITIONS OF FEGRESSION VARIABLESFROM TABLE F-1
Variable Definition
Charge for a 40-hour week of care
Child/provider ratio
SEAIH Dummy for Seattle in-home providers
SEAHU Dummy for Seattle unliCensed family day care homes
SEAM, Dummy for Seattle licensed family day care homes
DENHU Dummy for t ier unlicensed family day care homes
DENHL Dummy fxr Denver licensed family day care homes
RIH Child/provider ratio for in-home providers
RHU Child/provider ratio for unlica-ged family day care homes
RHL Child/provider ratio for licensed family day care homes
SPTCIH Ratio of average to maximum attendance for Seattle in-homeproviders, expressed as a percent
SPCTOU Ratio of average to maximum attendance for Seattle unlicensedfamily day care homes, expressed as a percent
SPCTCHL Ratio of average to maximum attendance for Seattle licensedfamily day care homes, expressed as a percent
DPCTCIH Ratio of average to maximum attendance for Denver in-homeproviders, expressed as a percent
DPCTCHU Ratio of average to maximum attendance L'or Denver unlicensedfamily day care homes, expressed as a percent
DPCTCHL Ratio of avern3e to maximum attendance for Denver licensedfamily day c,..;:e homes, expressed as a percent
EDUC Provider's years of education
EXPER Provider's years of experience
PREWORK Dummy indicating whether provider has ever held another full-timejob
INHOME Dummy for family day care homes only, indicating whetherprovider has ever been an in-home provider
HOME Dummy for in-home providers only, indicating whether provider hasever worked in a family day care home
'CENTER Dummy indicating whe?:4er provIder has ever workc,d in a day carecenter
PCTDEVL Percent of care consisting of developmental activities
SBL Dummy indicating a ble:k prL:ider in Seattle
DBL Dummy indicating a black provicir in Denver
DCH Dummy indicating a Chicano provider in Denver
COOK Dummy for in-home providers only, irdicating that ::hey cookeJmeals in addition to caring for children
LAUND Dummy fol. La-home providers only, indicating Cley did laundry inadditi-::? co caring for cnildren
OVRNT Number ;,If times the child stayed overnight with provider
F-9
1

cities. If the race of the provider affected his charges, the effect
should differ only between cities. Any race effect should be similar
for all provider types in a city, so race dummies were allowed to vary
across cities only.
The parameters that varied across provider type or city are most
conveniently discussed before the functions are separated. Some of these
were included to account for charges other than regular child care.
A variable was included counting the number of times the child stayed
with the provider overnight for all types and cities. The sum of all
hours spent with the provider was used to calculate a standard 40-hour
charge and, if some of those hours represented overnight stays, the
charge would be a weighted average of the charge for regular care and
the charge for overnight care, with the weight depending upon the number
of overnight stays. We have 1....pothesized that overnight care was cheaper
per hour than regular care and this implies that the coefficient for
OVRNT, the variable representing the number of overnight stays, should
be negative. The regression confirms this hypothesis. The coefficient
for OVRNT is significantly negative and is of appropriate size Remem-
bering that the dependent variable is the product of the charge per
child and the child/provider ratio, we see that a provider with three
children will charge approximately $2.50 less for 40 hours of care for
each overnight stay included in that 40 hour period.
Dummy variables indicated whether in-home providers cooked or did
laundry while they provided child care. Neither variable was signifi-
cantly different from zero. While there must have been some additional
charge for these services, there were too few providers performing them
for the charge to be measured accurately.
Seven variables were incluled in the regression to capture the
effebt of quality differences upon the cost of day care. In general,
these variables exhibit the behavior hypothesized above. They are Co-
linear and as a. result have large standard errors and erratic values.
Four out of the seven are not significantly different from zero at the
5% level. The variables are constructed such that larger values should
F-10
have a positive effect upon costs, yet three of them have negatiw co-
efficients, two of which are significantly different from zero. For
one of thEse, the dummy indicating whether the provider has ever held a
full-time job, the negative coefficient may not be so Eurprising. If
the provider has never had a full time job, this may indicate he has a
high reservation wage relative to others with his skill and training.
He will wOrk only if he recev,es a higher wage than is normally paid to
persons with the same qualifications. That such persons exist and that
lack of previous work experience would indicate them seems reasonable,
but that anyone would make use of their services is somewhat surprising.
Other, equally qualified, persons offer their services at a lower price,
so competition should assure that only those asking lower wages would
be employed. The reason we see such persons employed may be that they
possess qualities especially attractive to their employer but not generally
available in the market for child care providers. For example, the
. provider may live nearby or be related to the children and thus offer
greater convenience or security to the parents. Such circumstances offer
a plausible explanation for the negative coefficient on the previous-
employment dummy.*
The negative coefficient on the dummy variable indicating whether
the provider had ever worked in a day care center was also significantly
less than zero. No explanation for this result is apparent. However,
the decrease caused by the variable in the charge per child for an average
number of children per provider is not large.
Three continuous variables were included to mezsure quality dif-
ferences. Years of schooling had a significant effeei upon the cost of
care, increasing the charge about 43c per week for each year of educa-
tion when a provider cares for three children. Surprisingly, neither the
provider's exp.r.rience nor the proportion of the children's time occupied
in rlevelopmental activities had a significant effect upon the cost of
*Alternately, as a reviewer points out, the variable may indicate personswho have specialized in child care, and whose services are thereforemore valuable as a day care provider.

care, so that these variables may not be good indicators of quality dif-
ferences. A variable measuring the provider's age was used in preliminary
regressions but it was found to be insignificant and highly colinear with
other variables, so it was dropped.
Racial variables were varied only across cities, and, because of the
sme.7.1 number of Chicanos in Seattle, the variable representing Seattle
Chicanos was dropped. Neither of the racial dummies for Denver was sig-
nificantly different from zero, indicating no strong support for the
hypothesis that racial discrimination was present. The dummy for Seattle
blacks strongly indicates racial discrimination, but in reverse. Black
providers received significantly more money for their services than did
Whites. The negative coefficient might have resulted from a spurious
correlation between the dummy for Black providers in Seattle and a
variable affecting cost that was excluded from the regression. For
example, race might be correlated with the location of the provider in
the city, and the areas in which Black providers tend to work might have
higher-than-average:charges. This possibility and several other plausible
correlations have been investigated without result. The coefficient for
Black providers in Seattle remains unexplained.
Day Care Centers
The survey used to collect data from day care centers differed fromtt used for the in-home providers and family day care homes in several
respects. Because of the size of the centers, data were not collected
on individual children. Although data were collected for individual
providers, that information was useful only in the aggregate because the
provider information could not be related to individual children. The
center survey provided essentially a single ot-;ervation for each center,
representing average values for the dependent and independent variables.
Although all centers in both cities were surveyed, only 87 center inter-
views provided enough data to estimate a cost function. Even some of
these were incomplete, but the missing variables were not vital and were
therefore replaced with means from the compJnte observations. The form
of the interview required us to calculate the charge for a 40-hour week
F-12
of care in a special way. The interview did not ask for charges for
individual children but rather for a charge schedule. The blank schedule
in the interview allowed the charge to vary by the number of children
per family and by the family income. We produced a single average charge
from this schedule in two steps. First, for each category of number of
children per family, we took a weighted average across income strata.
The weights were based upon the proportion of families in each strata
for each city, as reported in the 1970 Census. The next step was to
average across the number of children per family, and the weights used
were the proportions of families with that number of children in the
two Cities, also taken from the 1970 Census. The charge thus derived
was then adjusted to a charge per 40-hour week. This procedure was the
best way to produce a variable comparable to that used for other pro-
viders. However, it relies on several assumptions that could have been
violated for many centers. This problem, together with the relatively
small number of observations for centers, make the results presented
below somewhat less reliable than those for other providers.
The charge variable derived as described above is a mean charge for
all children in the center. We assume for the centers as well as for
the family day care home and in-home providers that the charge for each
child has an identical variance. The mean charge for a particular center
then has a variance inversely proportional to the number of children in
the center. Regressions using the charge as a dependent variable must
be corrected or the stochastic error will be heteroskedastic. The
appropriate correction is to multiply the charge and all independent
variables in the regression by the square root of the number of children
at the center. Heteroskedasticity might also have resulted if the wrong
forr were chosen to estimate the regression. The form used in the regres-
sion for in-home providers and family day care homes was found to be
inappropriate and the regression was run directly on the charge rather
than on the equivalent wage.
There were several differences between the independent variables used
in the center regression and those used in the,in-home and family day
care home regression. Dummies indicating whether providers had previously
F-13

held a full-time job or provioc-0 oti:er types of day care could not be
produced from the center interv-l_e!Js. Also, none of the extra services
sometimes provided by in-home providers or family day'care homes were
furnished by centers, so the variable counting the number of times the
child stayed overnight with the provider and the dummies-itidiedting
that the provider cooked or did laundry were dropped. An attempt was
made to construct a variable corresponding to PCTCHLD in the in-home
provider, family day care home regression. Because the center ques-
tionnaire had no information on individual children, the variable was
constructed using the number of full- and part-time children with an
imputed average attendance for part-time children. The variable had
no predictive power in the preliminary regression and it was dropped.
Other variables specific to centers were added to the regression.
The variable CAPITAL measured the market value of all capital equip-
ment per child except building and grounds. Two proxies for facilities
rental were tried, but neither contributed greatly to the regression.
Poor quality of data may explain this result. Another variable was
added to capture the effect upon cost of any eirect subsidy to the center.
The specific variable used was the amount of direct subsidy per child
per week.- Dummies were also added to account for cost differences by
center type. There are both public and private day care centers and
among private centers there are both profit-making and nonprofit centers.
The fact that centers usually have several providers led us to use
means for variables measuring their qualities. A mean age variable was
tried for the colters. Although it was not useful in the in-home
provider, family day care home regression, mean age proved to have some
influence over cost for centers and it was retained in the final
regression.
\ Attempts were made to combine the data for Seattle and Denver in
the final center regression. Little difference was found between the
regressions for che two cities. Therefore the data were combined and
only the constant term was allowed to vary between the two cities. The
F test of the constraints implied by that particular combined regression
was barely significant at the 2.5% level, outside the 1% critical level
we have previously set.F-14

Cost Equations for DaY Care Centers
The combined regression for Seattle and Denver was shown in Table
31 of Part V, along with a list of definitions. The most noticeable
thing about that regression is the scarcity of variables significantly
different from zero. Only EDUC and PROFIT were significantly different
from zero at the 5% level. The general low significance level is probably
explained by the combination of a relatively small sample size and
limited variation in the levels of variables that determine day care
cost. While the final sample size was 87, the standard error of the
unweighted dependent variable--the charge per child--was only 4.69 across
centers. The small variation in the dependent variable suggested that
the independent variables might be relatively constant, and further
examination confirmed that few of the independent variables exhibit
great variations across centers.
The small sample size and limited variability of independent variables
in the regression have led to high standard errors of the coefficient
but the problem had not been so severe as to produce wild coefficient
values. All the coefficients except those for average provider experience
and the child provider ratio have the expected signs. The. variable EXPER
measures the average experience of all providers in the center. Exper-
ience is a desirable quality and should have a positive effect upon cost.
However, the regression predicts that each year of provider experience
decreases the charge per child by 8.65. Similarly, the coefficient of
R, the child/provider ratio, measures the fixed cost per provider, which
must be divided among the children, and such a fixed charge is presumably
positive. Neith.er coefficient is significantly different from zero at
even the 10% level, and we conclude that the incorrect signs are a result
of the variability of the parameter estimates caused by the small sample
size and limited variation of the independent'variables.
No other coefficients have signs different from what is to be expected
and most have values in a range that seems reasonable. Two exceptions
are the variables measuring capital per child and subsidy per child.
The coefficient of the capital variable measures the charge per week
F-15
7

per dollar of capital. When compounded, the coefficient implies a
yearly return on capital of 2.3%. The coefficient is unreasonably low
but its large standard error indicates that it is very inacGurately
\measured. A two-standard-error interval around the estimated coeffiCient
more than covers all reasonable values of the coefficient. The coeffi-
cient of the subsidylvariable measures the decrease in the weekly charge
caused by a one.dollar increase in the direct suh9idy ner child. As
mentioned above, the subsidy variable was based upon the previous year's
subsidy, so conclusions about the effect of direct subsidies should be
made cautiously. However, the interesting hypothesis for this coefficient
is-that the coefficient is one, implying a one-for-one traie-off between
subsidy and charge, and this hypothesis can clearly be rejet:led. The
estimated coefficient is more than ten standard errors away from one,
so the hypothesis can be rejected despite the mismatching of the subsidy
data. Direct subsidies do not seem to result in equivalent reductions
in the charge per child.
The coefficients allow us to tost other interesting hypotheses
about the determinants of cost in cent7,rs. The coefficient of
the dummy indicating a public cer,r nearly significant and the
coefficient of the dummy indicl:ing c(ers operated for profit is
significant at the 5% level. :47/: three types of centers: private
profit-making centers, privatc nonvof. centers, and public. The PROFIT
and PUBLIC dummies represent t,c;.: 'ill:ence in these three types of centers
and the significance of the coc7 .-nts indicates some differences between
the charges of different types u. centers. The sigl:ficance or near sig-
nificance of the test::: PROFIT and PUBLIC against zcr!, i,aply that private
profit-making centers public nonprofit centers ;:re differeni
cost from private nonprofit centers. The third hyp3C:;cs,is, that privdte
profit-making center, were oqual in cost to pu.,iic nonprofit centers, was
arSo tested and no significant difference in cost was fouf,u. Also, the
coefficient of the variable indicating that a center was in Seattle Was
insignificant. This supports the hypothesis tLizt there is little dif-
ference !71etween the cost relationships for the two cities.
F-16

SELECTE0 :EFERENCES
1. Abt Associates, Inc., "Cos.; and Quality Issues for Operators," fromA Study in Child Care 1970-'11, Vol. III (Boston, Mass., 1972).
2. Bain, J. S., Industrial Oinization (J. Wiley & Sons, Inc., NewYork, New York, 1959).
3. Bourne, P. G., "What Day C,?re Ought to 3," The New Republic(Jan. 12, 1972).
4. Breiter, C., "An Acath,p'' Proposal f. r Disadvantaged Children:Conclusions from Evaluation paper presented at JohnsHopkins University, Feb. 1971).
5. Campbell, D., and A. Erlbacke.c, Pw Regression Artifacts In Quasi-Experimental Evaluation Can MikeAly Make Compensating EducationLook Harmful," Disadvantaged Grild, Vol. III, J. Helimuth, ed.(Brunner & Mazel, New York, Nc:1,. York, 1970).
6. Chambers, J., "An Analyis of School Size Under a Voucher System,"Occasional Papers In the 717.,onmics & Politics of Education, No.72-11, School of Stanford University (Nov. 1972).
7. Child Care Bulletin ;:]=J. 9, "Alternative Federal Day Care Strategiesfor the 1970's," 1:)..f Care and Child Development Council of America,Inc. (March, 1972).
8. Children's Bureau of the US DHEW, "Standard & Costs for Day Care,"Day C..ze & Chilk: Development Council of America (1968).
9. Fein, G. G., a Clarke-Stewart, Day Care in Context (J. Wiley &Sons, New York, New York, 1973).
10. Jenck, C., et al., rnequality: A ReasSessment of the Effect ofFamily and Schoolin in America (Basic Books, Inc., New York, NewYork, 1972).
11. Kurz, M., P. Mains, and R. G. Spiegelman, "A Study of the Demandfor Child Care by Working Mothers," Research Memorandum 27, Centerfor the Study of Welfare Policy, Stanford Research Institute, MenloPark, Calif. (August 1975).
12. Low, S., and P. G. Spindler, "Child Care Arrangements of WorkingMothers in the U.S.," Children's Bureau Publication 461, 1968, US DHEW(1968). .
R-1

13. Meyer, W. J., "Staffing Characteristics & Child Outcomes," paperprepared for DHEW, OS/ASPE/SSHD, Contract No. HEW-100-76-0145Oant:nry 1977).
14. Mocr:c, T G., "The Purpose of Licensing," The Journal of Law &Econ,:aj(!L: Vol. 4, pp. 93-117 (Oct. 1961).
15. Office of Child Development, "Day Care Licensing Study, SummaryReport on Phase I: State and Local Day Care Licensing Requirements,"US DHEW, Bureau of Child Development Services, Publication No. (OCO)73-1066 (1973).
16. Rowe, M. P., and R. D. Husby, "Economics of Child Care: Costs,Need & Issues," in Child Care Who Cares? Pamela Roby, ed., Chap. 8(Basic Books, New York, New York, 1973).
17. Rowe, R. R., et al., "Child Care in Massachusetts: The PublicResponsibility," Massachusetts Early Education Project (Feb. 1972).
18. Ruderman, F. A., Child Care & Working Mother: A Study of Arrange-ments Made For Daytime Care of Children, Child Welfare League ofAmerica (1968).
19, Samuelson, P. A., "Parable and Realism in Capital Theory: The
Surrogate Production Function," The Review of Economic Studies,Vol. XXIX(3), No. 80, pp. 193-206, June 1962.
20. Schultze, C. L., E. R. Fried, A. M. Rivlin, and N. H. Teeters,"Child Care," in Setting National Priorities: the 1973 Budget,Chap. 8, (Brookings Institution, Washington, D.C., 1972).
21. Stanford Research Institute, "A Survey of Day Care In Seattle andDenver," conducted during May, 1974, SRI., Menlo Park, Calif.
22. Stigler, G. J., "The Theory of Lconomic Regulation," The Bell Journalof Economics & Management Science, Vol. 2, No. 1, pp. 3-21 (1971).
23. Strober, M. H., "Some Thoughts on the Economics of Child Care Cen-ters," Paper read at 140th meeting of the American Association forthe Advancement of Science, February 28, 1974, San Francisco, Calif.
24. Unco, Inc., "A Profile of Federally Supported Day Care in Region X,"Vol. 3 (Final Report), prepared for the US Dept. of HEW (Mar. 31,1973).
25. Walters, A. A., "Proluction & Cost Functions: conometric Survey,"Econometrica, Vol. 31, No. 1-2, pp. 1-66 (July-': 1, 1963).
R-2

26. Weiner, S., "The Cost of Compliance with Federal Day Care Standardsin Seattle and Denver," Research Memorandum 40, Center for theStudy of Welfare Policy, Stanford Research Institute, Menlo Park,Calif. (June 1977).
27. Westinghouse Learning Corp. and Westat Res., Inc., Day Care Survey--1970: Summary Report And Basic Analysis (April 1971).
28. Young, D. R., and R. R. Nelson, ed . Public Policy for Day Careof Young Children: Organization, Finance, & Planning (Lexington
Books, Lexington, Mass., 1973).
R-3
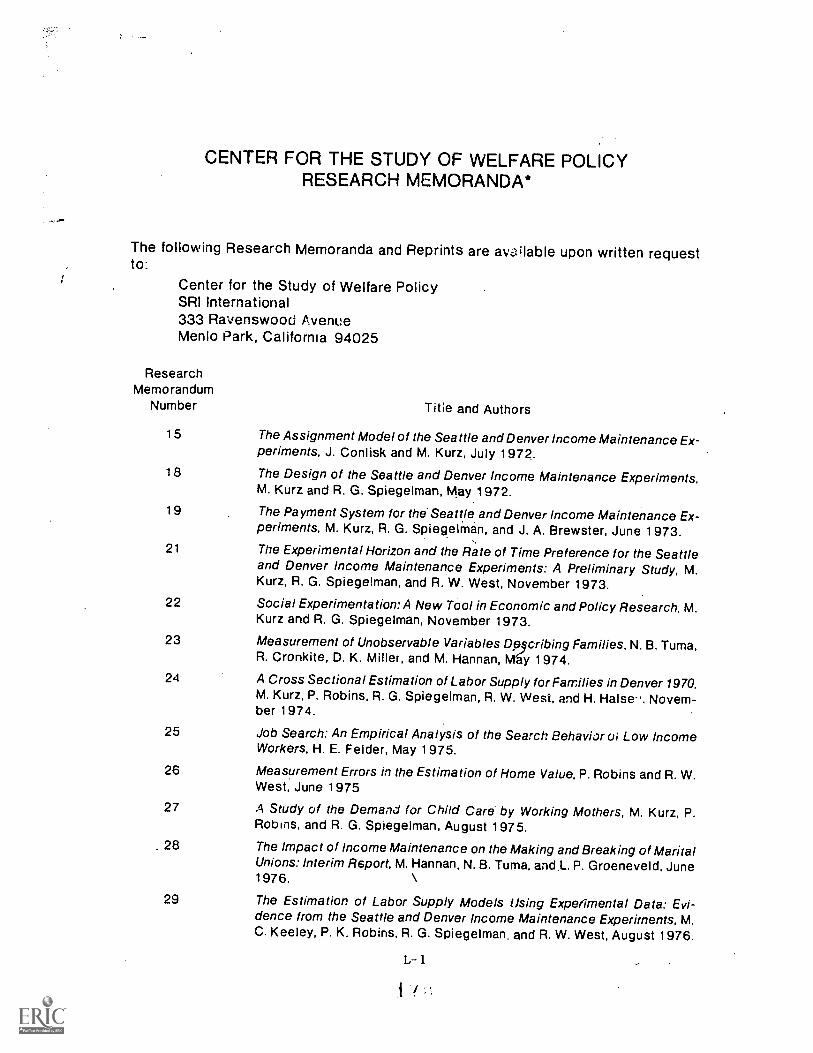
CENTER FOR THE STUDY OF WELFARE POLICYRESEARCH MEMORANDA*
The following Research Memoranda and Reprints are available upon written requestto:
Center for the Study of Welfare PolicySRI International333 Ravenswood AvenueMenlo Park, California 94025
ResearchMemorandum
Number Title and Authors
15 The Assignment Model of the Seattle and Denver Income Maintenance Ex-periments, J. Conlisk and M. Kurz, July 1972.
18 The Design of the Seattle and Denver Income Maintenance Experiments.M. Kurz and R. G. Spiegelman, May 1972.
19 The Payment System for the Seattle and Denver Income Maintenance Ex-periments, M. Kurz, R. G. SpiegelMan, and J. A. Brewster, June 1973.
21 The Experimental Horizon and the Rate of Time Preference for the Seattleand Denver Income Maintenance Experiments: A Preliminary Study, M.Kurz, R. G. Spiegelman, and R. W. West, November 1973.
22 Social Experimentation: A New Tool in Economic and Policy Research, M.Kurz and R. G. Spiegelman, November 1973.
23 Measurement of Unobservable Variables Dpydribing Families, N. B. Tuma,R. Cronkite, D. K. Miller, and M. Hannan, May 1974.
24 A Cross Sectional Estimation of Labor Supply for Families in Denver 1970,M. Kurz, P. Robins, R. G. Spiegelman, R. W. West, and H. Heise-, Novem-ber 1974.
25 Job Search: An Empirical Analysis of the Search Behavior ui Low IncomeWorkers, H. E. Felder, May 1975.
26 Measurement Errors in the Estimation of Home Value, P. Robins and R. W.West, June 1975
27 A Study of the Demand for Child Care by Working Mothers, M. Kurz, P.Robins, and R. G. Spiegelman, August 1975.
. 28 The Impact of Income Maintenance on the Making and Breaking of MaritalUnions: Interim fisport, M. Hannan, N. B. Tuma, and L. P. Groeneveld, June1976.
29 The Estimation of Labor Supply Models llsing Experlmental Data: Evi-dence from the Seattle and Denver Income Maintenance Experiments, M.C. Keeley, P. K. Robins, R. G. Spiegelman, and R. W. West, August 1976.
L-1

30 Determinants and Changes in Normative Preferences of Spouses, R. C.Cronkite, May 1977.
31 Homogamy. Normative Consensus, and Marital Adjustment. R. C.Cronkite, May 1977.
32 The Determinants of Participation of Single-Headed Families in the AFDCProgram, Arden Hall, May 1977.
33 The Supply of Day Care Services in Denver and Seattle, Arden Hall andSam Weiner, June 1977.
35 First Dissolutions and Marriages: Impacts in 24 Months of the Seattle andDenver Income Maintenance Experiments, N.B. Tuma, L.P. Groeneveld,and M.T. Hannan, August 1976.
36 The Estimation of Nonlinear Labor Supply Functions with Taxes from aTruncated Sample, Michael Hurd, November 1976.
37 The Welfare Implications of the Unemployment Rale, Michael Hurd,November 1976.
38 The Labor Supply Effects and Costs of Alternative Negative Income TaxPrograms: Evidence from the Seattle and Denver Income Maintenance Ex-perimt ts, Part I: The Labor Supply Response Function,M. C. Keeley. P. K.Robins, R. G. Spiegelman, and R. W. West, May 1977.
39 The Labor _Supply Effecis and Costs of Alternative Negative Income TaxPrograms: Evidence from the Seattle and Denver Income Maintenance Ex-periments, Part II: National Predictions Using the Labor Supply ResponseFunction, M. C. Keeley, P. K. Robins, R. G. Spiegelman, and R. W. West,May 1977.
40 Cost of Compliance with Federal Day Care Standards in Seattle andDenver, Sam Weiner, May 1977.
41 An Interim Report on the Work Effort Eifects and Costs of a Negative In-come Tax Using Results of the Seattle and Denver Income MaintenanceExperiment-:: A Summary, M.C. Keeley, P.K. Robins, R.G. Spiegelman, andR.W. West, June 1977.
'Research Memoranda 1 through 14, 16. 17. and 20 are obsolete and are not available for distribution. ResearchMemorandum 34 is in preparation.
L-2

.41
CENTER FOR THE STUDY OF WELFARE POLICYREPRINT SERIES
M. Kurz and R. G. Spiegelman, "The Seattle Experiment: The Combined Effect of Income Main-tenance and Manpower Investments," American Economic Review (May 1971).
Michael C. Keeley, "A Comment on an Interpretation of the Economic Theory of Fertility," Jour-nal of Economic Litarature (June 1975).
Takeshi Amemiya, "The Modified Second-Round Estimator in the General QualitativeResponse Model," Technical Report No. 189, The Economics Series, Institute for Mathemati-cal Studies in the Social Sciences, Stanford University, Stanford, Ca., December 1975.
R. G. Spiegelman and R. W. West, "Feasibility of a Social Experiment and Issues in Its Design:Experiences from the Seattle and Denver Income Maintenance Experiments," in 1976 Businessand Economic Statistics Section Proceedings of the American Statistical Association.
Takeshi Amemiya, "The Specification and Estimation of a Multivariate Log it Model," TechnicalReport No. 211, The Economics Series, Institute for Mathematical Studies in the SocialSciences, Stanford University, Stanford, Ca., June 1976.
Michael C. Keeley, "The Economics of Family Formation: An Investigation of the Age of FirstMarriage," Economic Inquiry (April 1977).
Philip K. Robins and Richard W. West, "Measurement Errors in the Estimation of Home Value,"Journal of the American Statistical Association (June 1977)
L-3
Related Documents