ED 129 136 DOCUMENT RESUME 5 HE 008 197 AUTHOR Atelsek, Frank.).; Oomberg, Irene L. TITLE Young Doctorate Faculty in Selected Science and Engineering Departments, 1975-1980. Higher Education Panel Reports, No. 30. INSTITUTION American Cannon on Education., Washington D.C. Higher Education Panel. SPONS AGENCY National Institutes of Health (DHEW), Bethesda, Md.; National Science Foundation, Washington D.C.; Office of Education (DH W) Washington, D.C. PUB DATE Aug 76 NOTE 38p. AVAILABLE FROM Higher Education Panel, American Council on ."Education, One Dupont Circle, Washington, D.C. 20036 ED?S PRICi DESCRIPTORS MF-$0.83 HC-$2.06 Plus Postage. *Academic Rank (Professional); *Age; *College Faculty; *Doctoral Degrees; *Engineering; Faculty Recruitment; *Higher Education; Intellectual Disciplines; National Surveys; Questionnaires; *Science Department-- Statistical Surveys ABSTRACT Focus in_this survey, conducted at the request of. the National Science Foundation,_is on young doctorate faculty (i.e., those receiving their Ph.D. in the last five years) employed full-time in science and engineering departments at Ph.D.-granting institutions. Questionnaire.responses were obtained from 1,148 departments at 137 institutions. They indicate that the proportions of young faculty members have been_declining over the past seven years and, in most fields, are estimated to continue to decline.,The situation appears most critical in the_fields of physics, biology, geology, mathematics, and mining and mineral engineering, physiology, and zoology. In all these fields, the proportions of young doctorates--either in 1975 or as estimated for 1980 or bothfall below what is regarded by most department heads as the most desirable proportion. Those department heads who expressed concern about the age imbalance within their faculties suggested a variety of means for increasing the proportion of young doctorates. Generally, however, they are not optimistic- that theSe means will be adopted in the neat future. (LBH) Documents acquired by ERIC incl de many informal unpublished * materials not available from other sources. ERIC makes every effort * * to obtain the best copy available. Nevertheless, items of marginal * * reproducibility are often encountered and_this affects the quality * * of the microfiche and hardcopy reproductions. ERIC makes available * * via the ERIC Document Reproduction Service (EDRS). EDRS is not * responsible for the quality of the original document. Reproductions *. * supplied by EDRS are the best that can be .made from the original. * ***********************************************************************

Welcome message from author
This document is posted to help you gain knowledge. Please leave a comment to let me know what you think about it! Share it to your friends and learn new things together.
Transcript

ED 129 136
DOCUMENT RESUME
5 HE 008 197
AUTHOR Atelsek, Frank.).; Oomberg, Irene L.TITLE Young Doctorate Faculty in Selected Science and
Engineering Departments, 1975-1980. Higher EducationPanel Reports, No. 30.
INSTITUTION American Cannon on Education., Washington D.C.
Higher Education Panel.SPONS AGENCY National Institutes of Health (DHEW), Bethesda, Md.;
National Science Foundation, Washington D.C.; Officeof Education (DH W) Washington, D.C.
PUB DATE Aug 76NOTE 38p.AVAILABLE FROM Higher Education Panel, American Council on
."Education, One Dupont Circle, Washington, D.C.20036
ED?S PRICiDESCRIPTORS
MF-$0.83 HC-$2.06 Plus Postage.*Academic Rank (Professional); *Age; *CollegeFaculty; *Doctoral Degrees; *Engineering; FacultyRecruitment; *Higher Education; IntellectualDisciplines; National Surveys; Questionnaires;*Science Department-- Statistical Surveys
ABSTRACTFocus in_this survey, conducted at the request of. the
National Science Foundation,_is on young doctorate faculty (i.e.,those receiving their Ph.D. in the last five years) employedfull-time in science and engineering departments at Ph.D.-grantinginstitutions. Questionnaire.responses were obtained from 1,148departments at 137 institutions. They indicate that the proportionsof young faculty members have been_declining over the past sevenyears and, in most fields, are estimated to continue to decline.,Thesituation appears most critical in the_fields of physics, biology,geology, mathematics, and mining and mineral engineering, physiology,and zoology. In all these fields, the proportions of youngdoctorates--either in 1975 or as estimated for 1980 or bothfallbelow what is regarded by most department heads as the most desirableproportion. Those department heads who expressed concern about the
age imbalance within their faculties suggested a variety of means forincreasing the proportion of young doctorates. Generally, however,they are not optimistic- that theSe means will be adopted in the neat
future. (LBH)
Documents acquired by ERIC incl de many informal unpublished* materials not available from other sources. ERIC makes every effort *
* to obtain the best copy available. Nevertheless, items of marginal *
* reproducibility are often encountered and_this affects the quality *
* of the microfiche and hardcopy reproductions. ERIC makes available *
* via the ERIC Document Reproduction Service (EDRS). EDRS is not* responsible for the quality of the original document. Reproductions *.
* supplied by EDRS are the best that can be .made from the original. *
***********************************************************************
Young Doctorate Faculty inSelected Science and Engineering
Departments, 1975 to 1980Frank J. Atelsek and Irene L. Gorriberg
0 2
0 ° X 0z 0 W &7
7 a 0zp0
HIGHER EDUCATION PANEL REPORTS, NUMBER 30AMERICAN COUNCIL ON EDUCATION
AUGUST1976
A Survey Funded by the National Science Foundation, the U. S. Office of Education:and the National Institutes of Health.
2

AMER4CAN COUNCIL ON EDUCATION
IFIdigor W. Heyns, President
The American ,ouncil on Education. founded in 1915, is a councii of educational organiza-
tions and institutions. Its purpose is to advance education and educational methods through
cornprehensiye votuntaN and cooperative action on the part of American educational associa-
tions, organizations, and institutions.
The Higher Education Panel i% a survey research program established by the Council for
the purpose of securing poricy-rellated information quickly from representative samples of
colleges and universities. Higher Education Panel Reports are designed to expedite communica-
tion of thie Panel's survey findings. to policy-makers in government, in the associations, and in
educational institutions ecroSs the nation.
The Highei. Education Panel's surveys on behall of the Federal Government are conducted
grant support provided )ointlly by the National Science Foundation, the National Institutes
o/l Health, and the U. S. Office ot Education (NSF Grant SFIS-7517251).
STAFF OF THE HIGHER ED C TION PANEL
Frank J. Ateisek, Panel Jircrar
frerio L Gotnberg, Senior Research Analyst
Nabit Issa, Prhg rammer
Elaine ChamberlMn, Project Secre y
HEP ADVISORY COMMITTEE
Lyle H. Lanier, Director, Offiet oV Administrative Affa rs, and EduGanonal Statistics.,
ACE. Chairman
John A Creager, Direcfor, Division of Educational Statistics, ACE
W. Toad Furniss, Director, Office of Academic Affairs, ACE
John F. Hughes. Director, Policy Analysis Service. ACE
Charles V Kidd, Executive Secretary, Association of American Universities
J. Biayd Page, President. Councif of Graduate Schools in the United Statet,
FEDERAL ADVISORY BOARD
Charles E. Falk, National', Science Foundation, ChairmanWiBiam E. Rhode, National Institutes of Health
George E. Hall, Office of Management and BudgetRichard T. Sonnergren, LI. S. Ofticie of'EducationFellix H. Lindsay, National Scfence Foundation,. Secretary
TECHNICAL ADVISORY COMMITTEE TO THE FEDERAL ADVISORY BOARD
Martin Frankel, National Center fiat Education Statistics, Chairman
Nancy M. Conlon, National Science FoundationTavia Gordon, National Institutes of Health
Additional copies 01 this feport ar available from the Highe Education Panel, Aeierican Councti on Educa-
tion One Dupont Circle, Washington, a C. 20030.

YOUNG DOCTORATE FACULTY IN SZIECTIED
SCIE CE AND ENGINEERING DEPARTNENTS& 1975 TO 1EO
Frank J. Ate1sekIrene L. Gomberg
iher Education Ptnel ReportsNurrOoer 30 T.ugust 1976
Ameri an Council on EducationWtshin5ten, D. C.

Acknowled
Blghlights
Contents
-a s mi.". 66 1. 4 ... .. *- ..Page
1
Methods Summary......... . ..............,......... . ....... 2
Result
Tables.
400 . 60,4 4
.. ... .... .. 12
Appendixes
A. Survey Instrument... 21
B. Response to Survey #30.... .. . . .. .,.,.......... 28
C. List of SUrvey In .. 0
iii

Acknowledgments
This survey grew from two earlier studie of young doctorate
faculty conduct d by the Division of Science Resources Studies at
the National Science Foundation. Comparisons with the earlier
studies, together with development of the current survey, were
facilitated by Charles H. Dickens and Felix R.I. Lindsay of the
Science Education Studies Group of that Division.
The Federal Advisory Board for HEP and its Technical Advisory
Committee provided their usual helpful guidance. Data processing
was performed by Nabil Issa, and Elaine Chamberlain organized the
survey followup and typed the final report.
In particular, we wish to thank the department heads who
r zponded to the survey and our Panel representatives who administered
6
Highlichts
In the 1975-76 academic year, the average proportion al yoUng doctorates on the fall-time faculty in sixteen science and engineering fields at Ph.0.-granting institutionswas 28 percent. The social sciences -- sociology, psychology, economics -- had thehighest proportions, and the fields of physics, mining and mineral engineering,chemistry, chemical engineering, and biochemistry bad the lowest proportions.
The proportions of young doctorate faculty were expected to decrease over the fiveyears to 1980, to an overall average of 25 percent. Moat fields estimated a decline,though mining and mineral engineering, chemical engineering, and biochemistry anti-cipated increases from 3 to 6 percentage points.
Generally, the ten highest ranked of the departments rated good or adequate in thefourteen science and engineering fields covered in the Roose-Andersen study hadhigher proportions of young doctorate faculty in 1975 than did either the 236 depart-ments-rated distinguished or strong or the Top Ten departMents; the only exceptionswere physics and economics, where the Top Ten had more young doctorates. Moreover,
estimates for 1980 indicated that these differentials would continue in virtually all
fields.
In most of those departments for which longitudinal data were available, the propOretions of young doctorates had declined since 1968. Between 1968 and 1974, the pro-
portions had dropped by at least half in electrical engineering, physics-, and chemicalengineering, though the last of these fields anticipated an increase by 1980.There were no clear-cut and consistent differences between the Top Ten distinguishedand strong departments in each field and the first ten good or adequate departMentswith respect to relative changes in the proportions of young doctorate faculty.
About two in five department heads said that they considered the 1975 proportionsof young doctorate faculty to be too low. Nearly half said they regarded the
estimated 1980 proportions as too low. Concern over age imbalance was directlyrelated to having (or expecting to have) a lower-than-average proportion of youngdoctorates on the full-time faculty.
The most desirable proportion of young faculty, according to department heads, was
30 percent. For most fields, the "ideal" proportion was slightly higher than theactual (1975) proportion, the exceptions being the three social science fields.
The most common measures initiated by either departments or institutions to increasethe proportions of young doctorates were lengthening the probationary period beforea tenure decision has to be made,and encouraging optional early retirement.
About one in four department heads believed that financial constraints were solelyresponsible for limiting the hiring of young faculty. Other frequently mentionedfactors were the lack of new positions, the law mobility of senior faculty, and theneed to hire senior rather than junior faculty.
Those department heads who felt that their proportions of young doctorates were toolow most often recommended encouraging early retirement or partial retireMsnt,increasing funding and research support, and hiring only or mostly young faculty asways to overcome the age imbalance. Relatively few, however, felt that their re-
commendations would be put into ope ion.

-2-
YOUNG DOCTORATE FACULTY IN SELECTED SCIENCE
AND ENGINEERING DEPARTMENTS, 1975 TO 1980
This survey, conducted at the request of the National Science Foundation, focuses
young doctorate faculty employed full-time in science and engineering departments at Ph.D.-
granting institutions . In surveys conducted previously by the Foundation,1 it was found,
among other things, that the overall proportion of young doctorate faculty in Ph.D.-granting
institutions dropped from 39 percent to 28 percent between 1968 and 1974.
Economic constraints and changing enrollment patterns in higher education may further
reduce the capacity of academic institutions to add new doctorate-recipients to their faculties,
with a resultant loss of vigor in botb teaching and scientific research. To monitor this
trend and to gain more insight into the s tuation, the present survey asked department heads
in selected science and engineering fields to report what proportions of their faculties, as
of December 1975, were young doctorate faculty (defined as those who had received the docto-
rate within the previous, seven years); to estimate what that proportion would be "five years
from now" (i.e., in 1980); to indic te whether they regarded those proportions 4s too 101.7;
to specify what steps the department or institut on had taken (or planned to take in the
next academic year) to change tenure or appointment policies and practices; and to give their
opinions about what should be done to alleviate any age iMbalance. (See Appendix A for a
copy of the survey instrument, along with other material mailed to the institution or depart-
ment in connection with the survey.)
The data for this
Methods_ Summary_
e collected as part f tie continuing research program of the
Higher Education Panel of the Americ Council on Education. Created in 1971 to conduct
quick-turnaround surveys on topics of general policy interest to the higher education community
See National Science Foundation, Youn. and Senior ScjerlC8 and Engineering Facult 974:
It/pis)rtr.ci_ation, and Tenure, NSF 75-302 Washington: U.S. Government
Printing Office, 1975), andAcademic
Staff, 1968, NSF 68-31 (Washington: U.S. Government Printing Office, 1968).
8

-3-
and to government agencies, the Panel is based upon a network of campus representatives at
643 academic institutions broadly representative of all colleges and universities in the
nation. For any given survey, the entire Panel or a subset of institutions may be used.
For this survey, the subset comprised institutions that (1) had awarded the dontorate
in at least one science or engin ering field in the 1970-71 academic year and (2) had
received at least $1 million in federal support for research and development in fiscal
1974.2
Of the 219 Ph.D.-granting institutions in the Higher Education Panel, 145 met both
criteria. These institutions accounted for 85 percent of th- nearly 18,500 sciQoce and
engineering doctorates awarded in 1970-71. (See Appendix C for a list of the institutions
surveyed.)
L ke the recent HEP su y on faculty research activity (Higher Education Panel Report
No. 29, January 1976), this inquiry was directed at individual science and engineering
de?artments within the institution rather than at the institution itself. The respondents
were department heads in the following sixteen- fieldS:
Biochemistry Chemistry Mathematics Physiology
Biology, Economics Microbiology Psychology
Botany Electrical Engr Mining & Mineral Engr. Sociology
Chemical Engr. Geology Physics Zoology
Our expetience with the earlier departmental survey, together with updated information
received during the course of this survey, enabled us to arrive at a reliable
eligible Ph.D.-level departments within each institution. Thapotential respondents
ultimately comprised nearly 1,400 departments at 145 colleges and vniver ities.
By the deadline for questionnaire returns, usable responses had been receive
1,148 departments3at 137 institutions. Thus, the departmental response rate was 82 percent,
2Based on reports to the National Science Foundation derived from the government-wide datasystem originally established under the auspices of the Committee on Academic Science andEngineering (CASE). These institutions were selected because of their subStantial researchactivity.
3Not all the responding departments provided usable da on each item in the _survey question-
naire; therefore, totals vary from item to item.

-4-
and the institUtiOnal resPonse rate was 94 percent. (For a M
inst
the b sic data, separately by field, fot all departments responding wi
for a given item. In addition, for purposes of comparison, some data
on three el,lh,-groups of depa_ tments: 1) those departments rated "di_
(Roose and Andersen, 1970)4; the Top Ten responding departments
"strong" categories; and (3 ) the ten highest ranked responding departA%
"or "adequate.-
5
and depar mental response to the survey, see Appendix
Results
In December 1975, more than one-fourth (28 percent ) of ell fu 1-t
in the 1,113 dep tnents responding to the first item
ported aq young, havina rceive th5 degree in th
the survey queskv
years since 196 (la
The Roose-Andersee ratings represent a summary of the asseSerrients pro
faculty MeMber5 in 37 diciraines at 131 major institutione Who rated a
major institutions offering doctoral study in their disciplines as the
to judge. SpecificallYr respondents were asked to select from a gl,Verl
the one they felt best described the quality of graduate facility apd th
Of the doctoral program, and to indicate the degree of change they perc
relative position of departments. Average scores were calculated for
at each institution, and the departments within each discipline Were th
In the summary ratings of graduate faculty, the highest-scoring depa
categorized as "distinguished," The next level was "strong," followe
"marginal," and "net sufficient for doctoral training." The toP two
combined for separate tabulation. See Kenneth D. Rowse and Charles J.
of_Gradae (Washington: American Council on Education, 1970
g4ion of
_rt presents
formati n
luded
0 or "stron "
.inguished"
d "good"
A). The
4,009of thecompetenttArms.eivenese
the
portmentked-ordered.
5Not all institut ona tanked by the Roose-Andersen study were members of
Education Panel; converSelYf not all HEP membere were ranked by the PO
Consequently, the departments categorized as "Top Ten" of the distingta
and "first ten" of the good and adequate were selected on the basis of
ranked respondents in their respective categories for which datA were a.\)
both sources.
\
ty
"adequate,'
0 were
A2141.122
441her%sen study.
wrol strongre higheste from
1 0

-5°
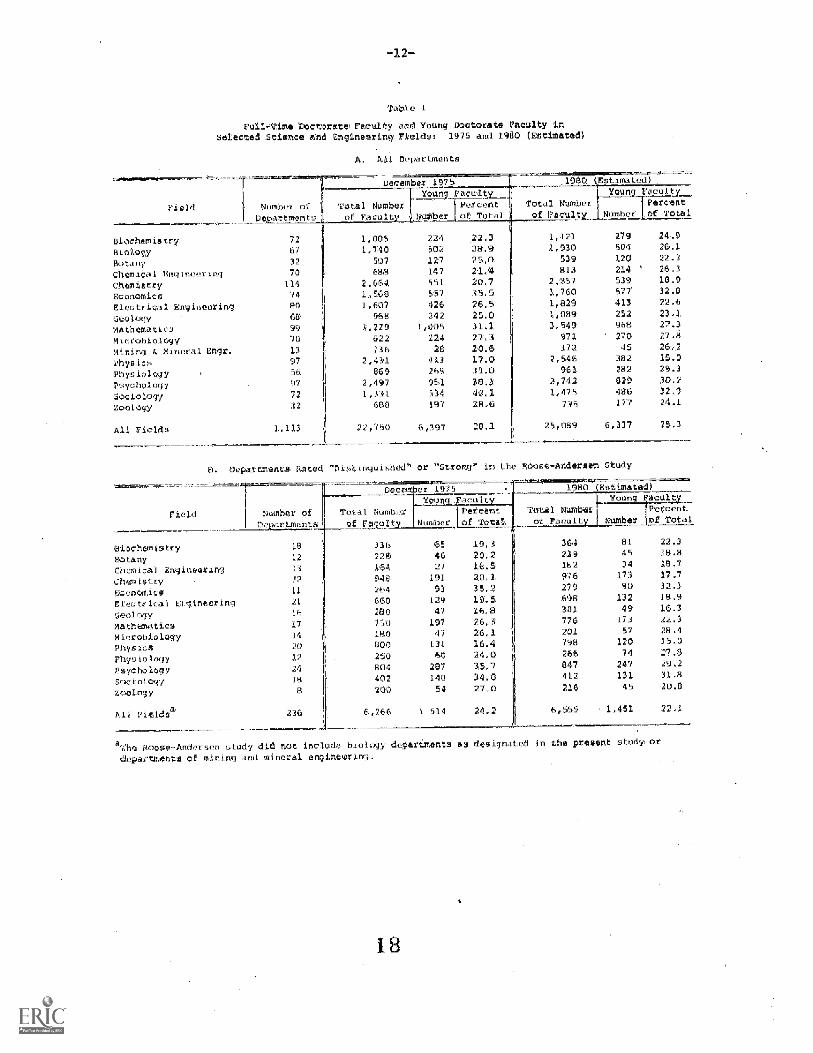
pro -rtions varied widely among the sixteen fields. The highest concentrations of young
doctorates vere found in the three s cial sciences included in the survey (sociology, 40
percent; psychology, 38 percent; and econoMics, 36 percent), and the lowest in physics (17
percent), followed by mining and mineral engineering, -hemistry, chemical engineering each
with 21 pe-cent), and biochemistry (22 p 7eent).
Overall, tbe respondi g department heads estimated that the proportion of young docto-
rates would decline to 25 percent bY 1980. All but four fields anticipated a decline, the
exceptions being microbiology, biochemistry, chemical engineering, and mining and mineral
engineering. Theirestimated proportions of young faculty were closer to the average pro-
portion for all departments than the other fields. The tw- fields with the very lowest
proportions, physics and chemistry, predicted further decreases in the proportions of young
dacto ates on their full-time faculties by 1980.
The 236 departments rated "distinguihed" or "strong" in the fourteen science and
engineering fields covered by the RooSe-Andersen study6had somewhat smaller proportions of
young doctorates on their full-,time faculties in December 1975 (24percent) that figure
was expected to drop to 22 percent by 1980 (Table 18). Variations by field among these
distinguished and strong dePartments followed the same general pattern as that for all
departments: The social scion _s had the highest nroportions of young doctorates, whereas
physics, chemical engineering, biochemistry, geology and electrical engineering had the
lawes , with fewer than one in five young doctorates on their full-time faculties. Two of
these five fields -- chemical engineering and biochemistry -- expected the propo_
increase by 1980 and the three others anticipated slight declines. In addition, the three
social sciences expected decreases frOn 3 to 7 percentage points, as did mathematics and
zoologY.
The patterns were similar for the Top Ten departmen for which data were available in
6The Roose-Andersen study did not include biology departments as designated in the presentstudy or departments of mining and mineral engineering.

the fourteen science and engineering fields rated "distinguished"TV rong" in the Roose-
Andersen study (Table 1C). In 1975, about one in three full-time faculty members in the
three social sciences was a young doctorate, and this proportion was expected to drop
slightly over the next five years. Fields having lower-than-average proportions of young
doctorates in 1975 were geology, chemical engineering, botany, biochemistry, physics, and
electrical engineering; all six of these fields anticipated decreases or only slightincreases
(of no mo e than 3 percentage points) by 1980. The only fields expecting substantial pro-
onate increases were microbiology (from 24 percent in 1975 to 30 percent in 1980) and
physiology (from 23 percent in 1975 to 28 perceflt in 1980). The eight reporting zoology
departments ant cipated a decline of 6 percentage points m 27 percent in 1975 to 21
percent in 1980) , which represents a 17 pe cent decrease in the absolute numbers of young
doctorate faculty in this field. Department heads in other science and engineering depart-
ments expected only minor changes over the next five years.
or the ten highest ranked of departments rated good or adequate in the fourteen science
and engin_ --ing fields rated in the Roose-Andersen study, the overall proportion of young
doctorates was higher (28 percent) than that for the Top Ten distinguished or strong depart-
ments (24 p cent), but there was considerable variation by field (Table ID). The heads of
sociology and psychology departments reported that about two in five of their full-time
doctorate faculties were young, whereas the heads of physics departments reported that only
three in twenty of their full-time faculties had received the doctorate in the last seven
years. Departments in two fields expected substantial increases in the proportions of young
doctorate faculty over the next five years: chemical engineering, from 17 percent in 1975
39 percent in 1980; and biochemistry, from 25 percent in 1975 to 35 percent in 1980.
Departments in the three social sc ences estimated that their proport n_ 0f young faculty
would decline by 1980, but to a level that would remain well above the overall estimated
average of 27 percent for all fields.

-7-
Com arisons with Ear1ir Surveup
To get a clearer picture of trends in the hiring of young doctorates, the resPonses of
departments to the present survey were matched with earlier responses by these same depart-
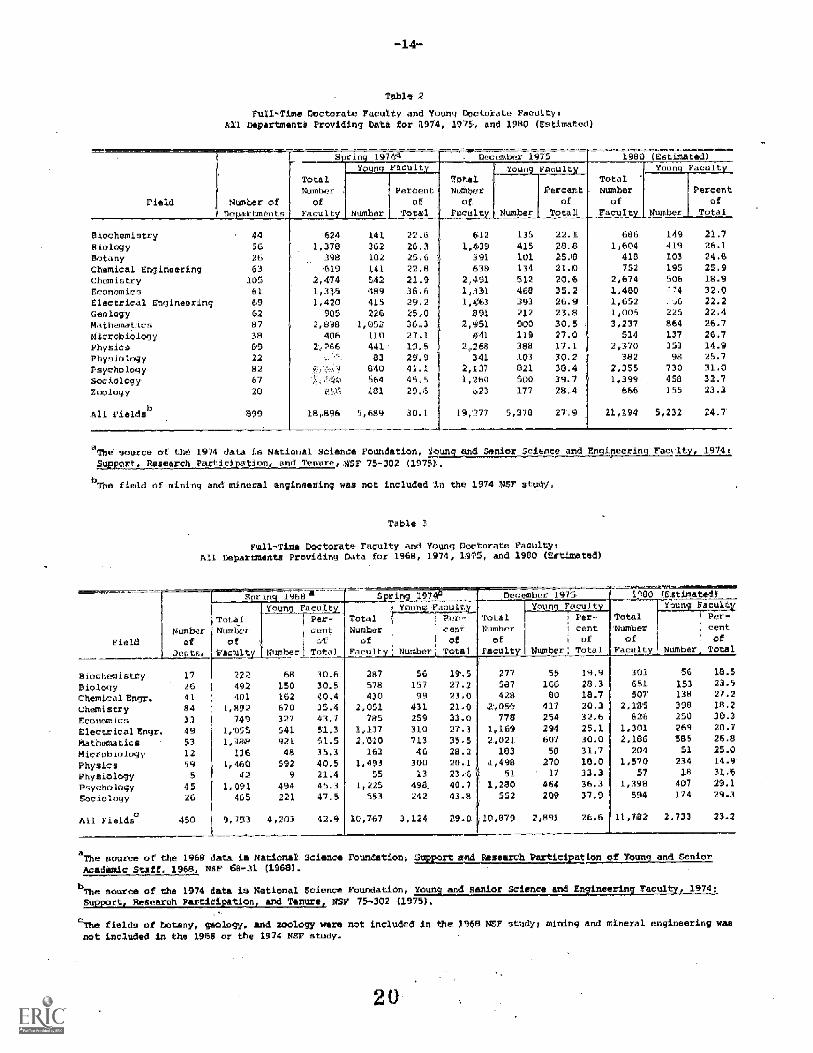
ments to previous surveys -- ducted by the National SCience Foundation. Table 2 presents
trends based on 899 departments for wh ch data are available for three years -- 1974, 1975
and 1980. Longerterm tr nds based on 450 departments for which data are available for
years -- 1968, 1974, 1975 and 1980 -- are shown in Table 3.
Between spring 1974 and December 1975, there was Slight but consial ecline in thetent d
proportion of young docto ates among full-time faculty in most of the fifteen fields covered
by both surveys,7 the sharpest drops occurring in mathematics and sociology (6 percentage
points each) (Table 2). The 56 matched biology departments registered an overall increase
of 3 percentage points during the period, and the fields of botany and ohysiology registered
smaller increa
The data from the 1968 survey indicate that the deeli in the proportions of young
doct _ates evident bet een 1974 and 1975 -as actually th; continuation of a longer
trend (Table 3). In 1968, of the 9,800 full-time doctorate facultY at the 450 departments in
twelve fields8 for which matched data from all thr e surveys were available, more than two
in five (43 percent) were young doctorates; by 1974, the overall proportion was only three
in ten; by 1975, it was slightly over one in four; and for 1980 it was estimated to be less
than one in four. The decrease in the absolute numbers of young doctorates ws 31 percent
over the period from spring 1968 to December 1975. In some fields, the decline was modest;
biology, from 31 percent in 1968 to 28 percent in 1975; microbiology, from 35 percent in 1968
to 32 percent in 1975. In others, it was precipitous- In three fields, the proportion of
young doctorate faculty was virtually aut in half: eleztr cal engineering, _ om 51 per ent
7The field of mining and mineral engineering was hot included in the 1974 NSF study.
8The fields of botany, geology, and zoology were hot included in the 1968 NSF study;
mining and mineral engineering was included in neither the 1968 nor the 1974 study.

-8-
25 percent; physics, from 41 percent to 18 percent; and chemical engineering from 40
percent to 19 percent. Mathematics also suffered a decrease of over 20 percentage points.
rn only one field was there an increase: The proportion of young doctorate faculty in
physiology rose from 21 percent in 1968 to 33 percent in 1975,
Another item on the 1975 survey instrument asked department heads to indicate whether
they regarded the current projected proportions of young doctorates on their faculties as
too law. Overallt_two in five department heads said they considered the 1975 proport -ns
to be too low, and almost half expressed the same opinion about the anticipated 1980 pro-
portions (Table 4). Most frequent concern over age imbalance was indicated by department
heads in physics (66 percent in 1975; 80 percent in 1980), biochemistry (53 percent in 1975;
54 percent in 1980), and chemistry (49 percent in 19751 63 percent in 1980) -- fields which
also had low average proportions of young doctorate faculty. On the other hand, those in
fields with above-average p °portions (e , economics, sociology, and psychology) were
less likely to express such concern.
Table 5 shows the proportion5 pf young docto a faculty only in ose departments
whose heads judged that proport on to be "too low," and thus highlights the causes of con-
cern over age imbalance. Overall, the departments judged to be "t -" averaged only
sevente n young doctorates per hundred full-time doctorate faculty members in 1975 and
anticipated having only eighteen per hUndred by 1980.
Both figures were substantially lower than those reported by all departments surveyed
(28 percent in 1975, and 25 percent anticipated for 1980). The same relations obtained in
each field considered eparately: That is, departments expressing concern over having too
few young doctorates were also those departments.where the proportions of young doctorates
were below average for the field. For instance, in physics -- the field with the lowest
proportion of young doctorate faculty in 1975 (17 perc -- those departments whose heads
judged the proportion as "too low" averaged only 12 percent.

Department heads were also asked to indicate what they regarded as the most desirable
proportion of young doctorate faculty in their departments. The, oVerall average cited was
30 percent, ranging from a low of 26 percent in chemistry to a, high of 37 percent in
sociology (Table 6).. For most fields, the proportion thought desirable was greater than
the actual proportion of young doctorate faculty shown in Table 1. Not supris ngly, the
discrepanCy between the ideal and the actual was greatest in physics, mining and mineral
engineering, and biochemistry -- fields with very low proportions of young doctorate faculty.
In econ psychology, and sociology, however, the proportion regarded as desirable was
slightly lower than the actual 1975 proportions. Department heads who believed that they
had too low a proportion of young doctorates did not differ drast'cally from other department
heads in their views of what constitutes a desirable. proportion. Tabulations for the 229
responding departments rated distinguished or strong are shown in Table 6B; the patterns
were essentially' the same as those for ail rNsponding institutiOns.
Increase_the_Proportibn of :young faculty
The present survey inquired about the kinds of tenure or appointment policies and p o-
tices (designed te increase the proportion of young doctorates and initiated either by the
department or by the institut on) that were in effect du ing the current academic year or that
were planned to go into effect in the next academic year (Tables 7A and 8). Policies in
effect during the 1975-76 academic year, as reported by the 1,148 responding departments,
were (in order of frequency):
Lengthening the probationary period bofgre a tenure decision has to be made
(r ported by 18 percent of the responding departments)
Encouraging optional early retirement .(18 percent)
Repla ing senior faculty with young faculty by hiring only at the as s
professor/inst- ictor levels (8 percent)
Reducingthe mandatory reti- ent age (7 percent)
Announcing quotas on the number or percentage of tenured facult- 5 _cent)
1 5

Other efforts to increase the proportion of young faculty, mentioned hy fewer than 5
percent of the responding departments, were making limited/temporary appointments and
tighten ng standards for promotion.
In 73 instances, depa tments heads indicated that similar policies and prac ices w
planned for implementation in the next academic year (1976-77). Most such plans involved
lengthening the probationary period before granting tenure (mentioned by 27 department heads)
or providing a mechanism for optional eprly ret ent ( entioned by 23 depOrtment heads).
Respondents were asked to give their opinions as to what other factors, apart from
financial constraints, had the effect of limiting the pr portion of young doctorate faculty
(Table 0). More than one in fou_ department heads believed that ne faCtera other than
financial constraints were involved. The lack of new positions- the low mobility of se ior
faculty, and the need to hire senic)r rather than junior faculty were each Mentioned by about
one in five department heads. TeLute policies and practices were considered a limiting
factor by abovc ne in ten; a few respondents (4 percent) mentiohed -lack of space or of
equipi-nent, and fewer still (3 percent) said that a shortage of high-quality young appli-
cants wac a limiting factor. Commentsindicated that the main limitation ultimately was
financial.
Those department heads who, earlie_ in the survey questionnaire, indicated that they
believed the proportions of young doctorate faculty in their departments were too low,
also provided their opinions on what 'hould be done to alleviate the situation. They
ered a wide variety of proposals as to specific kind- of actions that should be under-
taken by the depa
we
or Institution (Table 9). The mast frequently suggested remedies
To encourage early retirements, including partial retirement wi-orwithout
financial incentives (164 mentiens)
To increase funding, research support, postdoc ate research associate positions,
sabbaticals, etc. (163 mentions)
To make ch nges in the tenure system (126men ns)
To hire only or mostly young faculty (90 mentions)
1 6
The department heads were not, however, optimistic that their propo 1 mild be imple-
mented with n their own departments or institutions. Almost half of the approximately 600
department heads responding item did nut expect any action to be taken to alleviate
the age imbalance. Among the actions that were regarded as most likely werO hiring only or
mostly young faculty (anticipated by 65 respond s), en ouraging early retirement (antici-
pated by 40 :espondents) and raising tenure standards (anticipated\by 36 respondents). Forty-
one respondents said they did not know what acti n would be taken, and an additional 47 did
not accept the premise that any action neces ary, some bell ving that the age imbalance
would eventually take care of itself,. Manv respondents expressed the belief that tho encour-
agement oi! early retirement without financial assiStance would not be very ucc-esfu1.
Conclusion
It is generally held that the vitality of the science enterprise in thiS country
depends on the infusion of new blood, new ideas, and new vigor in teaching and resea
represented by young faculty members. Th6 result is study indleate th t the prospects
for continued vitality in the science and engineering departments of tho n'tion's doctorate-
granting institutioras may not be bright.
The proportions of young faculty members have been declining over the past seven years
or so and, in most fields, are estimated to continue to decline. The situation appears most
critical in the fields of physics, chemistry, botany, and electrical engineering; and sca cely
less so in biocbaistry, biology, geology, mathematics, mining and mineral engineering,
physiology, and zoology. In all these fields, the proportions of young doctorates -- either
in 1975 or as estimated for 1980 or both - fall below what is regarded by most department
heads as the siost desirable proportion.
Those department heads who expressed concern about the age imbalance wthin their
faculties sugg sted a varity of means for increa ing the proportion of young doctorates.
Generally, however, they are riot optimistic that ese eans will be adopted in the near futu
-12--
Table 1
Faculty atad Young 0octert FacultY inSelected Sctr&ce oind gineeriney Ehelds: 1975 and 1980 (Estimated/
Field
BiochemistryBiotogyBotanyChemical EngineeringChemistryEconomicsElectrical r-r-
GeologyMathematicsMicrobiolo4yMining E. Mineral n--
PhysicsPhysiolnqyPsychologySociologyZoology
411 Fields
ng
A. All Departments
Total Numberof f cul
mber 1975YOUn
W.-Ober
72 1,005 224
67 1,740 502
32 507 127
70 689 147
114 I 2,664 551
74 1,568 557
80 1,607 426
66 968 242
-5.229 1,005
822 224
136 28
97 2,411 43,3
56 864 269
97 2,497 951
72 1,311 534
32 668 197
1,113,22,7506-397
FnotatTotal 14.1
of F 0Percentof Total.; Number
PercentOf Tatal
22.3 1,121 279 24,9
28,9 1,930 504 26.1
25.5 539 120 22.3
2 A 813 214 ' 26.3
20.7 2,857 539 18.9,
35.5 1,760 577 32.8
26.5 1,829 413 22.6
25.0. 1,089 252 23.1
31,1 3,549 965 27.3
27.3 971 270 27.8
20.6 172 45 26,2
17,0 2,546 382 15.0
31.0 961 792 79.3
38,3 2,742 829 30.2
40.1 1,475 486 32,9
28.6 715 177' 24.1
26,1 25,089 6,337 25,3
D. paitl000to Rated 'Distinguished" or 'Strong° in the Roose-Andersen Study
Field Nuthber of Total Namb=aof _aquit! Num0er.'
/BiochemistryBotanyChemical EnrorinqChom(stryEConomicsElectrical Eilineering=20I00y
MathematicsMicrobiolegYPhysicsphysioleg7PsychologySociologyZoology
'ieldsa
975
Yuong Fa_
ed)
- ult
of Total
11
21
16
17
14
20
12
18
of Tota
Nialber
Facult
336 65 19,3 353 81 22.3
228 46 20.2 239 45 18.8
164 27 18.5 1b2 34 18.7
948 191 20,1 918 173 17.7
264 93 35.2 279 90 32,1
660 129 19.5 698 132 18.9
280 43 16.8 301 49 16.3
710 197 26,3 776 173 22.3
160 47 26.1 281 57 28.4
800 131 16.4 798 120 15.0
250 60 24.0 266 74 n7.8
804 287 35,7 847 247 29,2
402 140 34.e 412 131 31.8
200 54 27.0 216 45 20.8
236 6,266 1 514 24,2
anc= Roose-Ande en study did not inciade biology dopiOtoptacrita of Ironing and Mineral engineorring.
6,555 1 451 22.1
study ordesignated in the OreSent

Table 1 Cc
Top Ten of the Responding Departments Rated "Distinguished" or .%t g"
in the Roose-Andersen Study
Field
BiochemistryBotanyChemical En9eznrChemistryEconomicSElectrical EngineeringGeologyMathematicsMicrobiologyPhysicsPhysiologyPsychologySOC -W logy
Zoologyo
All Fialdsb
Number ofD -rtments
TO
Total Numbercuity
10
10
TO
10
10
108
118
100 34 18.9
181 34 18.8
126 22 47.5329 73 22.2
249 88 35.3
388 79 20.4189 30 15-9
454 109 24.0117 28 23.9416 82 19,7
219 50 22,8
394 130 33.0
222 74 33.3200 54 27.0
3,6454 887 24.2
Pe
Number_ of Total
193 43 22,3
188 34 18.1
139 27 19.4
341 72 21,1
266 89 33.5
408 75 38.4
204 33 16.2
469 94 20.0
129 39 30,2
417 75 18.0234 66 28.2
407 133 32.7
227 68 30,0
216 45 20.8
3,838 893 23.3
aaf all zoology departmentsily the "Top Eight" for zoology.
nquished or strong only 8 responded. Thus the "Top Ten" is
The Roose-Andersen study did not include biology departa
departments of mining and mineral engineering.
_ as designated in the present study or
Ten Highest Ranked of the Re pondimg Departments Rated "Go d" or "Adequate"
in the Roose-Andersen Study
fliochemTstryBotany 4Chemical 6iflnoLoqChemistryEconomicsElectrical EngineeringGeologymathematicsMicrobiologyPhysicsPhysiologyPsychologySociologYZoology,
All Pi-olds
Number ofDepartments_
1975Ypung Facu4N YoungFacuIi
TOtal Number Percent Total Number Percent
of f'ecult mbar -f Total of Faculty Nembur of Total
10 169 42 24.9 182 64 35.2
9 159 46 28.9 166 38 22.9,
10 116 20 17.2 136 53 39.0
10 257 55 21.4 266 63 23.8
10 284 92 32.4 304 93 30.6
IQ 240 58 24.2 270 49 18.1
10 169 37 21.9 181 37 20.4
10 355 99 27.91 379 94 24.8
IQ 124 32 4.8 147 39 26.5
IQ 287 42 14,6 297 47 15.6
10 184 67 36.4 195 69 35.4
10 325 130 40.0 375 116 30.9
10 189 71 40.7 203 67 33.0
10 242 65 36-9 238 61 25.6
139 I3,100 862 27.8 32359 895 26.6
aOf all botany depar"highest rease.
'ated good or adeq7,iate, only 9 respended. Thu* there are only 9, net 10,
-The "Ncose-Andersen study did not include biology departments as desIgn Ad in the present udy or
departments of mining and mineral engineering.
1 9
-14-
Table 2
FU 1-.Time Doctorate Faculty and Young Doctorate FaciaAll Departmente Providing Data for 1974, 19754 and 1980 (E
in A December 197 0......
E d,
Faculty x-ur. Foult Young_ Facul V---YoungTotal Total Total
Number Percent Number Percent Number Percent
Field Nuaber of of of of of of of
Departments Faculty Number Total FaccaL Number Total Facult Number Tote
Biochemistry 44 624 141 22.6 612 135 22.1 686 149 21,7
Biology 56 1,378 362 26.3 1409 415 28.8 1,604 419 26.1
Botany 26 398 102 25,6 391 101 25.61 418 103 24.6
Chemical Sngincering 63 619 141 22-8 638 134 21.0 752 195 25.9
Chemistry 105 2,474 542 21.9 2,491 51-2 20.6 2,674 506 18.9
Economics 61 1,315 489 36.6 1,331 468 35.2 1,480 .:74 32.0
Electrical Engineering 69 1,420 415 29.2 104063 393 26.91 1,652 6 22.2
Geology 62 905 226 25,0 891 212 23.8 1,005 225 22.4
Mathematics 87 2,898 1,052 36.3 2,951 900 30.5 3,237 864 26.7
Microbiology 38 406 110 27.1 441 119 37.0 514 137 26.7
Physic-a 09 2,266 441 10.5 2,268 388 17.1 20370 353 14.9
Physiology 22 83 29.9 341 103 30,2 382 98 25.7
Psychology 82 840 41.1 2,437 821 38.4 2,355 730 31.0
Soci.ology 67 i,1C 564 45,5 1,260 500 39.7 1,399 458 32.7
Zoology 28 29.5 623 177 28,4 666 155 23.3
Allb
Fields 899 18,896 5,689 30.1 19,277 5,378 27.9, 21,194 5,232 24.7
cc of the 1974 data is National SCionce Foundation, Toun 4nd Senior Scicnce and Engineering FacwIty, 1974:rch Fartici.ation, and' Tenure,NSF 75-302 (1975)..
Id of mining and' mineral engineering was not included An the, 1974 NSF study.
aThe
Table 3
Full-Time Doctorate Faculty and Young DoctorateAll DepartmLlente Providing Data for 1968, 1974, lan, and
culty80 (Eci ma
FieldNumber
of-ts,
1968' 4December
Tet41Number
ofFacult
1978 1'80
TotalNumber
ofFaculty
EtijeatediT2Un9 Facii1W
Total-Number
ofPaciult
____----5P.L.0.9-
19KL9...215TotalNumbe
ofFacult
Young_ Faculty
Per-centof
Number Total
tIST1,51r4c41q:Per,.
centI of
Number Total
Per-! cent
i ofNumber ' Total
I Per-
! centof
Number Total
Biochemistry 17 222 68 10.6 287 56 19-5 277 55 19.9 303 56 18.5
Biology 26 492 150 30.5 578 157 27.2 587 166 28.3 651 153 23.5
ChemicalEngr. 41 401 162 40,4 430 99 23,0 428 80 18.7 507 138 27.2
Chemistry 84 1,892 670 35.4 2,051 431 21.0 417 20.3 2,185 398 18.2
Economics 33 749 327 43.7 785 259 33.0 778 254 32.6, 826 250 30.3
ElectricalEngr. 49 1,055 541 51.3 1,137 310 27.3 1,169 294 25.1 1,301 269 20.7
Mathematics 53 1,350 921 51.5 2,010 713 35.5 2,021 607 30.0 2,186 585 26.8
Microbiology 12 136 48 35.3 163 46 28.2 183 se 31.7 204 51 25.0
Physics 59 1,460 592 40.5 1,493 300 20.1 1,498 270 18.0 1,570 234 14.9
Physiology 5 42 9 21.4 55 13 23.6 51 17 33.3 57 18 31.6
Psychology 45 1,091 494 45.3 1,225 498, 40.7 1,280 464 36.3 1,398 407 29.1
Sociology 76 465 221 47,5 553 242 43-8 552 209 37.9 594 174 29.3
all Fieldsc 450 9,7913 4,203 42.9 10,767 3,124 290 10,879 2,891 266 11,782 2,733 23.2
source of the 1968 data ia National science Found4tionAcademic Stiff, 1968, NSF 68-31 (1968).
and Research Partici -atlon of Youg and Senior
bThe source of the 1974 data iS National Science Foundation, Young and_ sepipr_ pOeeee and Engineering Facu1tyt_1974:Su -rt Research Partici'atfon and Tenure NSF 75-302 (1975).
c_-The fields of botany, geology, and zoology were not included in the 1968 NSF study, aindng and mineral
not included in the 19158 or 010 1974 NSF study,
2 0
was
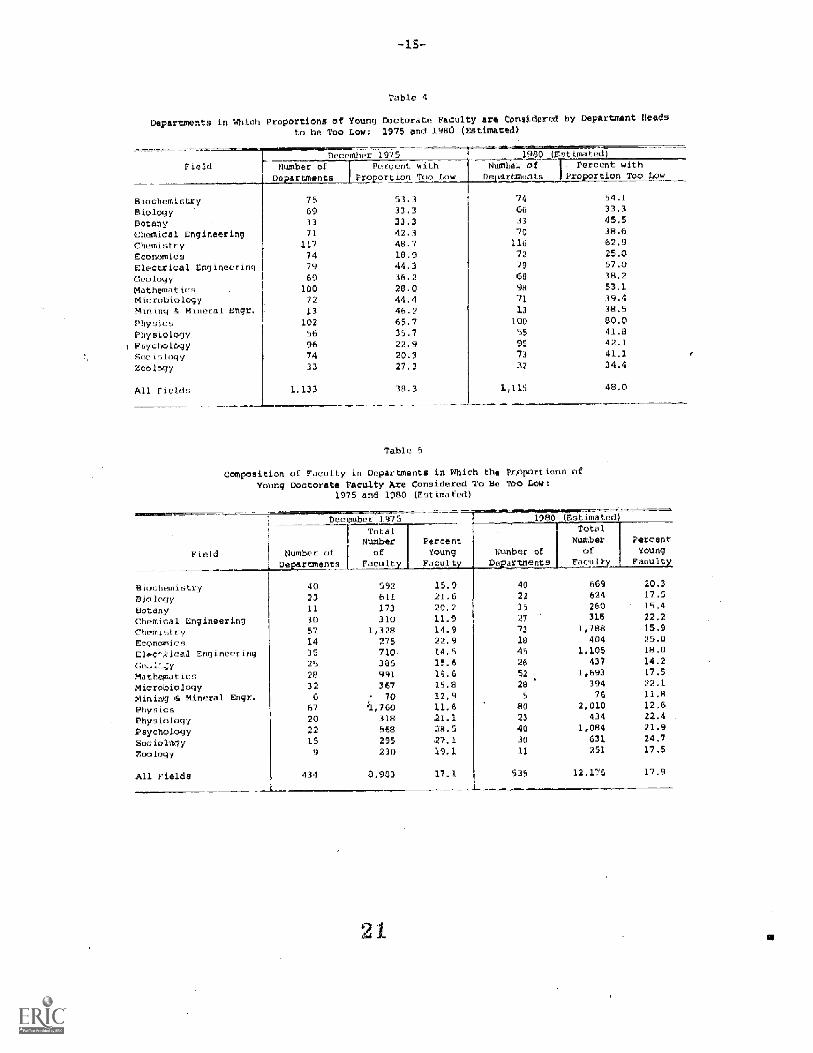
Table 4
Departments in Which Proportions of Young Doctorate Faculty are Conside ed by Department Heads
to be Too Low; 1975 and 1980 (Estimated)
Field
BiochemistryBiologyBotanyChemical EngineeringChemistryEconomicsElectrical EngineeriGeologyMathematicsMicrobiologyMining t mineral Etgr.
PhysicsPhysiology
1 PsychologyBociologyZoology
All Fields
unber _ of Pe cent withn Too
75 53.3
33.333.3
71 42.3117 48.7
74 18.9
79 44.3
69 36.2
100 28.0
72 44.4
13 46.2102 65.7
56 35.7
96 22.974 20.3
33 27.3
1,133 38.3
0 imated)
Nmnbe of Percent withn To
33
011672
79
68
13
10055
54.133.3
45.538.662.925.057,038.253.1
39.438.5
80.041.842.1
41,1
34.4
1,115 48.0
Tab
Composition of Faculty in Ocparbtientm ig Which the Proportions aYoung DOctorate Faculty Are Considered To Be Too Low:
1975 and 1980 (Estimated)
Number orDepartments
T _Number
ofFacu
Percent
Voting
A.mated)
TotalNuMber
NuMher ofD- artcient
BiochemistryBiologyBotanyChemical EngineeringChemistrEconomicsElec,gical Engineering
MathematicsMicrobiologyMining t mineral EngnPhysicsPhysiologyPsychologySociolOgyZoology
All Fields
4023
57
14
28
326
67
20
22
15
9
434
592611173
3101,328
275710385991
367
15.921.620.2
11.914.922.914.515.619.6
15.8
: 70 1291.,760 11.6
318 21.1568 716.5
295 27.1230 19.1
8,983 17.1
acuily
PercentYoungFaculty
40 669 20.3
22 624 17.5
15 260 15.4
27 316 22.2
73 1,788 15.9
18 404 25.0
45 1,105 18.0
26 437 14.2
52 1,693 17.5
28 394 22.1
5 76 11.8
80 2,010 12.6
23 434 22.4
40 1,084 21.9
30 24.7
11 251 17.5
535 12,176 17.9
2 1

=16-
Table 6
Average of Most Des _ ble PercentAmong the Total Doctorate Faculty, in th_ Opinion of Department Head$
09 Doctorates
All Departments
Field
BiochemistryBiology
4
BotanyChemical EngineeringChemistryEconomicsElectrical EnqineorinGoaloqyMathematicsMicrobiologyMining Mineral Engr.
Physic's
Physiolo4yPsychologySociologyZoology
All Fields
All DepartmenAverage DesiratPercentage of
FacUlt
rtmntS Reporting Propo_T0 Low in 1975 or 198
7469
3271
113
71
78
67
96
71
13
99
55
94
71
30
1,104
3130
27
27
2633
29
28
31
30
32
27
34
34
30
Field
. 52
34
16
23
56
34
56
44
7
82
29
45
34
13
005
Average DesirablePercentage ofYoun Facu
31
31
27
2827
36
3026
3032
31
27
35
35
4032
644 30
Departments Rated "Distinguished" or "Strong"in the Poose-Andersen Study
Al
_ ing Proportions1975 or 1980
Average Desirable Average Desirable
Percentage of Percentage of
Number n FactAt_y2411tyBiochemistry 18 28 12 26
Botany 12 24 26
Chemical Engineering 13 27 10 30
Chemistry 25 21 26
Economics 32 4 29
Electrical Engineering 21 29 18 29
Geology 16 25 25
Mathematic 17 32 11 30
Microbiology 14 28 27
Physics 22 25 17 25
Physiology 11 35 7
Psychology 21 34 13
SociOlogy 17 35 40
Zoology 7 28 3 31
All Fieldsa 229 29 150 29
aThe Roose-Andersen study did not include biology departments as designated i
departments of mining and mineral engineering.
22
nt study

-17-
Table 7
Percentage of Departments Reporting Changes in Tenure or Appointment Po1icie or 9ractices t
A. In Effect This Academic Year 75-7
Percent.. _ of Oe artment Re ort3n
Total Quotas Roducd Ii ring
Number on Lengthened Encouraged Mandatory Faculty Increased Temporary
Field of Tenured Probationary Early Retirement at Lower Promotion Appoint-
tmen .- ycult period metirement A Leve s S andards rnents Othe
Biochemistry 76 3.9 13.2 21.1 3.9 10.5 1,3 3.9 1.3
Biology 69 7.2 14.5 15.9 7.2 2.9 2.9 2.9 1.4
Botany 33 3.0 21.2 24.2 6.1 6.1 0 0 0
Chemical Engr. 72 5.6 20.8 20.8 6.9 4.2 1.4 1.4 0
Chemistry 117 5.1 24.8 23..1 6.8 6.0 4.3 6.0 1.7
Economics -75 4.0 17.3 12.0 6.7 12.0 4.0 1.3 1.3
Electrical Engr. 81 6.2 22.2 18.5 11.1 8.6 2.5 1.2 1.2
Geology 70 10.0 18.6 21.4 7.1 10.0 4.3 1.4 1.4
Mathematics 100 3.0 15.0 11.0 9.0 8.0 2.0 6.0 2.0
Microbiology 72 4.2 9.7 13.9 4.2 4.2 0 6.9 2.8
Mining & MineralEngn 13 15.4 7.7 23.1 7.7 15.4 0 0 0
Physics 105 7.6 21.8 15.2 9.5 6.7 1.9 9.5 3.8
Physiology 57 3.5 8.8 14.0 1.8 5.3 3.5 7.0 5.3
Psychology 99 4.0 22.2 16.2 5.1 11.1 6.1 4.0 2.0
Sociology 75 5.3 17.3 20.0 10.7 16.0 6.7 2.7 0
Zoology 34 2,9 20.6 8.8 2.9 8.8 2.9 2.9 0
All FIlds 1,148 5.3 18.3 17.2 7.0 8.2 3.0 4.2 1,7
Pla-n d for Next Aced-- c Year (1976-.77)
Field
TotalNumberof
e artuwnes-,_
Percentage of Dc rtment n .
Quotason
TenuredF- ul
LengthehedProbationary
Period
EncouragedEarly
Petrezflcnt
ReducedMandatoryRetireMent
A a
HiringFacultyat Lowerwe
IncreasedPromotionStandrd s
TemmOraryAppoint-
n Other
Biochemistry 76 0 1.3 0 0 0 0 0 0
Biology 69 1,4 1.4 2.9 1,4 0 1.4 0 1.4
Botany 33 0 3.0 3.0 0 0 0 0 0
CheMical Engr. 72 1,4 1.4 1.4 0 0 0 0 1.4
Chemistry 117 0 0 1,7 .9 .9 .9 .9 0
Economics 75 1.3 5.3 4.0 0 0 0 0 0
Electrical Engr. 01 1.2 4.9 2.5 0 0 0 0 0
Geology 70 0 1.4 0 0 0 0 1.4 0
Mathematics 100 0 4.0 3.0 0 0 0 0 0
Microbiology 72 0 2.8 1.4 0 1.4 1.4 0 1.4
Mining & Mineral Engn 13 0 0 15.4 0 0 0 0 0
Physics 105 0 1.0 1.0 0 0 0 0 0
Physiology 57 0 1.8 0 0 0 0 0 0
Psychology 99 2.0 3.0 4.0 1.0 0 0 2.0 0
5ociology 75 0 1.3 1.3 0 0 1.3 0 0
Zoology 34 2.9 5.9 0 0 0 0 0 0
All Fielde 1,148 .6 2.4 2.0 .2
2 3
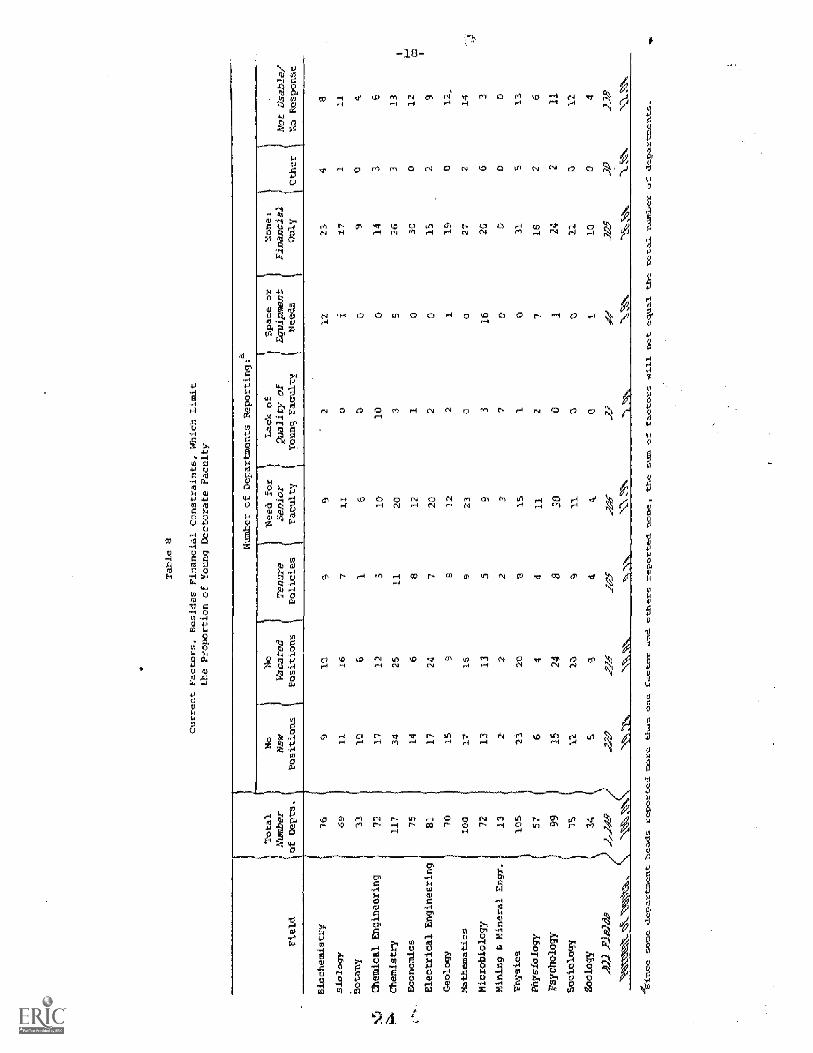
Table 8
Current Factors, Besides Financial Constraints, Which Limit
the. Proportion of Young Dcctorate Faculty
Field
Total
No
Number
New
mt Depts.
Positions.
Biochemistry
76
9
Biology
69
11
Sotany
31
10
Chemical. Engineering
72
17
P6
Chemistry
117
34
Economics
75
14
Electrical Engineerin
81.
17
Geology'
70
15
Mathematics.
100
17
Microbiology
72'
13
mlning e Mineral. Engr...
13
2.
P hysics
105
2.3
P hysiology'
57
6
T'sychology
99H
15Sociology
15
11
Zoology
34
I5
AI"
)2J
1J.2
.24'
G'Ince. some. department. heads.reported more than
Number of Departments Reporting.:a
No.
Vacated
Positiom
Tenure.
Policies
Neea for
Senior.
Faculty
Lack of
Puelity of
Young Faculty
Space or
Equipment
Needs
None :
Financial
Oth
erNot Usable/
No Response
10
99
12
2.3
48
16
711
0i
17
11/
61
60.
0
12
510
1.0
014
36
25
11
20
3.
5.
26
313
68
12
10
30
012
co
24
720
20
15
2.
9
98
12
21
15.
0
16
923.
00
27'
214
T';1
13
59
316
20
63:
22
3.
7O.
00
0
201
SIS
10
31.
511
44
11
27'
18
26
248.
.30
02
24
2ii
20
g11.
00
22
011
9:
4.
4.
31.
10
04
.276
'_r
igs'
n.r
27
44,
3e25
'E:tiN,
..Ye2
_2249
one
factor
and
others reported
themum of
facto=s
will.
MOOt
ftoual
the
total numlme=
of departments--
none,

4squamltivdap to
iqmu io alp renbe qou THA. sTuscdoId ;o wns amt. 'auou pasodold statpo puu u.0310P auo uVuA atom pasodotd speaut luaupliedap amps, aouTsv
9.9
EV
IC .LE
9.10I!
69
1r8SS
16'17
i
ZE
1Z-609
ii
10'5Z
E9I
'ET
1
0,
'
1
6? J
%°I'
Zi.
11
ViD,'L
1
9V
6°Z61
8 '
-81
I'SEE
1
1Z,'IZ
1
1
I
'
11
V9I
1
1000
Z59
'sqdc0 ;,0 -4m,o10..aad
uP/old IIV
I11
SEZ90EVIt,ZEEI1V
0E1EII
011
1
V0,
,iZ
1
;
Z,
V
,
E10Z
ISLE80lE
S5IIZLsTZ8
VZ09Ic9V
'
SV01zTzZ
0,IS
'
IL0zZZI0tc0IE
10ZsSI
0,
9
'
t.ZS0Vt1t.8
,
z'
t,
1
9LLT
ELT
OZ
ZI
01
L15
II
t,9
,91
1'
8:
I
S,
OI
!1
'
EI
LL
1
Zi
6v6,
L
,ZsV
,
'
1VI.
,
110550IV1IZ:'
1
00I0Z0,10050Z001i
ZsLI501ZZE
,0LIz
'
L
,S
ToZ0t0ZZ
I
ZcI000,
0Z
,
I1
o00i
Z0T
1
0z'
5'
0-6IT117
01LZ800E.cI0ZIzIZ
1o0'
iI
,
E0z.
I
5
'
c50E
,I1
,
Ii,
1
IiI
'1I
9L51
17OZToT
ET
IT
PT
IEZ
Ea51
LT
VI
SE
St
6?
1
V8
LVP
85
SE
95
EZ58
Et
97
tE
ZS
ilL01 coz,
45,oTaToo
Z6oTogoAsd
411,010TE:4d
5xTE,,Aqd
.../..,U7
1[12...TLIT;,7 [UT btriUTW
iipurairciolTN,
sal4tu,DLovi.;
ZfiaTozity
LuT.7aouT5z /,,-,74.--..,c.c[3.
..;,Lliaol,19,a,1
Lalb1111044-,
buTa3cu7Flv:::
!uun1=14:.
Sir c...I OT 8
L:'4.11...T2'4,00la
;10/
0 ,..., ,01
sco
.?8
/k,
',4""
0
eZ.
/4
,
LIUTS;Cal
oiva1,J10.611-74,1rda0
3.up atig=iN
moq 00,i aq. al AlInael aw,m10,00 6unaA ;(), suoTliodasa paloaEcia ao
luattno, alp tapIsuop pqm S94 luaapaudau Aq pasodold suoillocv IvIpamaA
6 a1afel,
PI '0'7..1

Total
Number Oeor
tnents
Lower
tlandatory Retirtment
Age Make
Temporary
'
Appointments
Eliminate
Tenure
Announce
Quotas on
Tenure
Ocher
Tenure Changes
litre
on y or
Mostly
Young
Faculty Improve
Funding
Increase
Gov't Support
o Actien 1;ecesnary
Wit Know

-21-
A -ndix A: Surv- Instrnienl
AMERICAN COUNCIL ON EDUCATIONONE DUPONT CIRCLE
WASHINGTON. D. C. 20036
H!GrER EGUGATIGN PANgt.
Dear Higher Education Panel Representative:
November 24, 1975
Enclosed is the thirtieth survey of the Higher Educe ion Panel. Requested by
the National Science Foundation, this survey concerns the status of "young"
doctorate faculty in selected science and engineering departments.
You will note that, instead of a single institutional response, replies are
requested from heads of doctorate-level departments in selected science and
. engineering fields. A list of the selected fields and an explanation of the
survey procedures and enclosed materials are provided on the following page.
The Director of the National Science Foundation has written a letter to
department heads explaining the purpose of the survey. His letter appears as
the cover page of the questionnaire.
We realize that for some institutions there will be a number of individualdepartments to contact and that, in some instances, the department head may
not be available during the survey period. In such cases the acting department
head or the department's director of graduate studies should be asked to
complete the questionnaire.
Please understand that responses from your institution will be held in
strictest confidence. As with all our surveys,thedata you provide will be
reported in summary fashion only and will not be identified with your
institution.
We would appreciate having the completed questionnaires returned to us _la
December 15th 1975. A self-addressed, stamped envelopehas been enclosed for
your convenience. We ask that you not delay the return of completed question-
naires past the due date even if some of the departmental replies are missing .
f you or the department heads have any questions or problems with the survey
procedures, please do not hesitate to telephone us (collect) at (202) 833-4757.
Thank you for your continued coope ation.
Encls. 2 7
Sincerely,
Frank Atelsek, Director
-22-
American Council on EducationHigher Education Panel,Survey Number 30
Status of "Young" Doctorate Faculty in Selected Science and Engineering Departments,1975 to 1980
GENERAL INSTRUCT ONS
Enclosed in this package are the follow ng materials:
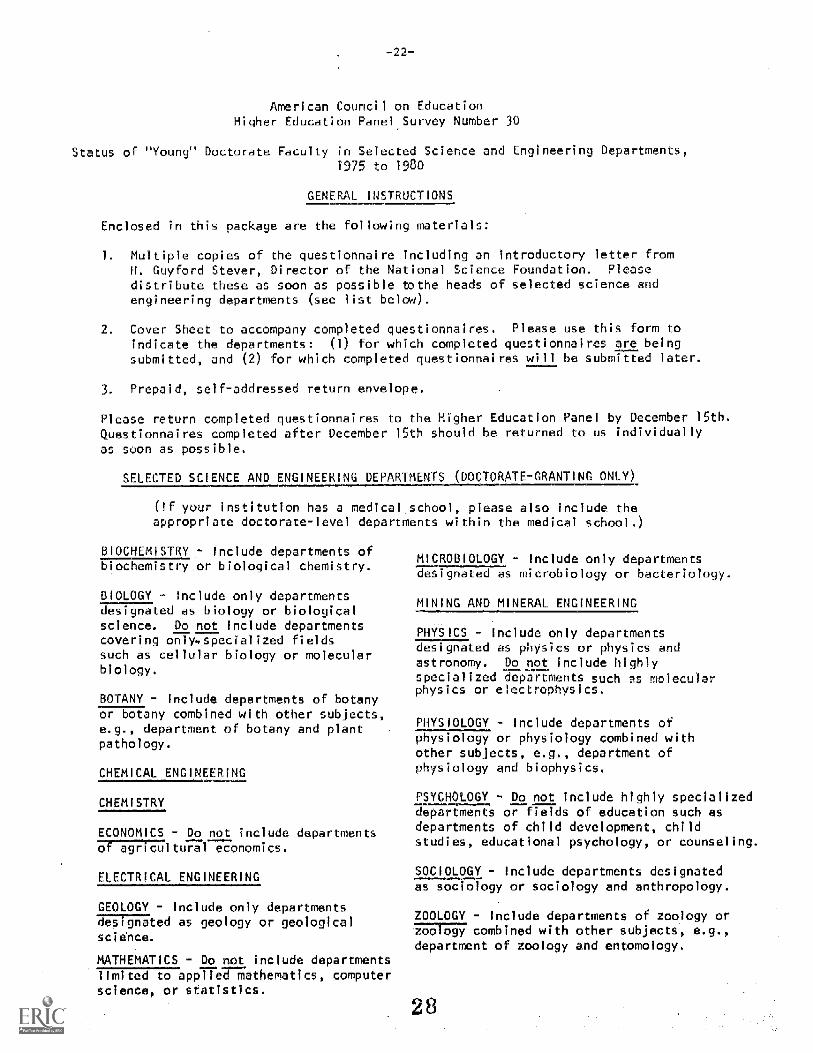
1. Multiple copies of the questionnaire including an introductory letter fromH. Guyford Stever, Director of the National Science Foundation. Please
distribute these as soon as possible Wthe heads of selected science andengineering departments (see list below).
2. Cover Sheet to accompany completed questionnaires. Please use this form toindicate the departments: (1) for which completed questionnaires are_ beingsubmitted, and (2) for which completed questionnaires will be submitted later.
3. Prepa d, self-addressed return envelope.
Please retu_n completed questionnaires to the. Higher Education Panel by December 15th.Questionnaires completed after December 15th should be returned to us individuallyas suon as possible.
SELECTED SCIENCE AND ENGINEERING DEPARTMENTS (DOCTORATE-GRANTING ONLY)_
(If your institution has a medical.school, please also include theappropriate doctorate-level departments within the medical school.)
B_I_OCHEMISTRY - Include departments ofbiochemistryor biological chemistry.
BIOLOGY Include only departmentsdesignated as biology or biologicalscience. Do not include departmentscovering only.specialized fieldssuch as cellular biology or molecularbiology.
BOTANY - Include departments of botanyor botany combined with other subjects,e.g., department of botany and plantpathology.
CHEMICAL_ ENGINEERING
CNEMISTRY
ECONOMI_CS Do _not include depar ments775671171tural economics.
ELECTRICAL ENGINEERING
GEOLOGY - Include only departmentsdepignated as geology or geologicalscience.
MATHEMATICS - Do not_ include departmentslimited to applied mathematics, computerscience, or statistics.
MICROBIOLOGY Include only departmentsdesignated as microbiology or bacteriology.
MINING AND MINERAL ENGINEERING
PHYSICS - Include only departmen sdesignated as physics or physics andastronomy. Do not include highlyspecialized departments such as molecularphysics or electrophysics.
PHYSIOLOGY - Include departments ofphysiology or physiology combined withother subjects, e.g., department ofphysiology and biophysics.
PSYCHOLOGY - Do not include highly specialized_
departments or fields of education such asdepartments of child development, childstudies, educational psychology, or counseling.
SOCIOLOGY - Include departments designatedas sociology or sociology and anthropology.
npum - Include departments of zoology or-zoology combined with other subjects, e.g.,department of zoology and entomology.

American Council on EducationHigher Education P,,inel Survey Number 30
Status o "Young" Doctorate Faculty in Selected Science and Engineering Departments,
1975 to 1980
Reports
COVER SHEET
(to accompany completed questionnaires)
are requested only for departments granting the
egree. ease make appropriate note
or to be submitted,
ions for repor
doctorateubmitted
Eligible DeparmenqYour Instit.ition-(underlined in red)
CompletedSurveyEnclosed (V)
Survey to beSubmitted
by: (Indicate da
Biochemistry........ ...
Biology
Botany ..... .
Chemical Engineering......
Chemistry
Economics... .
Electrical Engineering
Geology-- .. . .
Mathematics .
Microbiology........ ... .........
Mining and Mineral Engineering
Physics
Physiology
Psychology
Sociology
Zoology.
....... "6666440 .. 6
According to the postcard you completed for the previous HEP survey.Please note above any corrections.
Name q,f Institution
Person to be called regarding departm ntal
forms to be submitted at a later date
Phone Number
-24-
NATIONAL SCIENCE FOUNDATIONOFFICE OF THE DIRECTOR
WASH1NOTON, D.C. 20550
November 24, 1975
Dear Colleague:
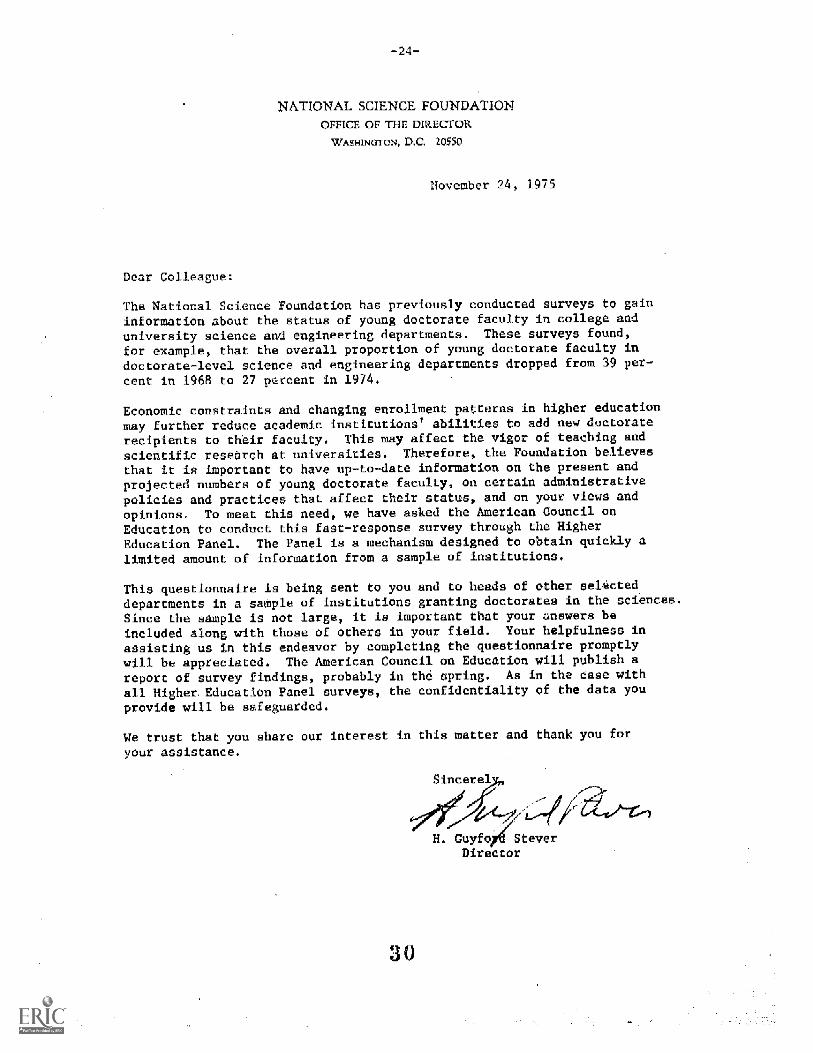
The National Science Foundation has previously conducted surveys to gaininformation about the status of young doctorate faculty in college anduniversity science and engineering departments. These surveys found,for example, that the overall proportion of young doctorate faculty indoctorate-level science and engineering departments dropped from 39 per-
cent in 1968 to 27 petcent in 1974.
Economic constraints and changing enrollment patterns in higher education
may further reduce academic institutions' abilities to add new doctorate
recipients to their faculty. This may affect the vigor of teaching and
scientific research at universities. Therefore, the Foundation believes
that it is important to have up-to-date information on the present andprojected numbers of young doctorate faculty, on certain administrativepolicies and practices that affect their status, and on your views and
opinions. To meet this need, we have asked the American Council onEducation to conduct this fast-response survey through the HigherEducation Panel. The Panel is a mechanism designed to obtain quickly alimited amount of information from a sample of institutions.
This questionnaire is being sent to you and to heads of other selecteddepartments in a sample of institutions granting doctorates in the sciences.
Since the sample is not large, it is important that your answers beincluded along with those of others in your field. Your helpfulness in
assisting us in this endeavor by completing the questionnaire promptlywill be appreciated. The American Council on Education will publish a
report of survey findings, probably in the spring. As in the case withall Higher. Education Panel surveys, the confidentiality of the data you
provide will be safeguarded.
We trust that you share our interest in this matter and thank you
your assistance.
3 0
H. Guyfo SteverDirec or
INSTRUCTIONS AND DEFINITIONS
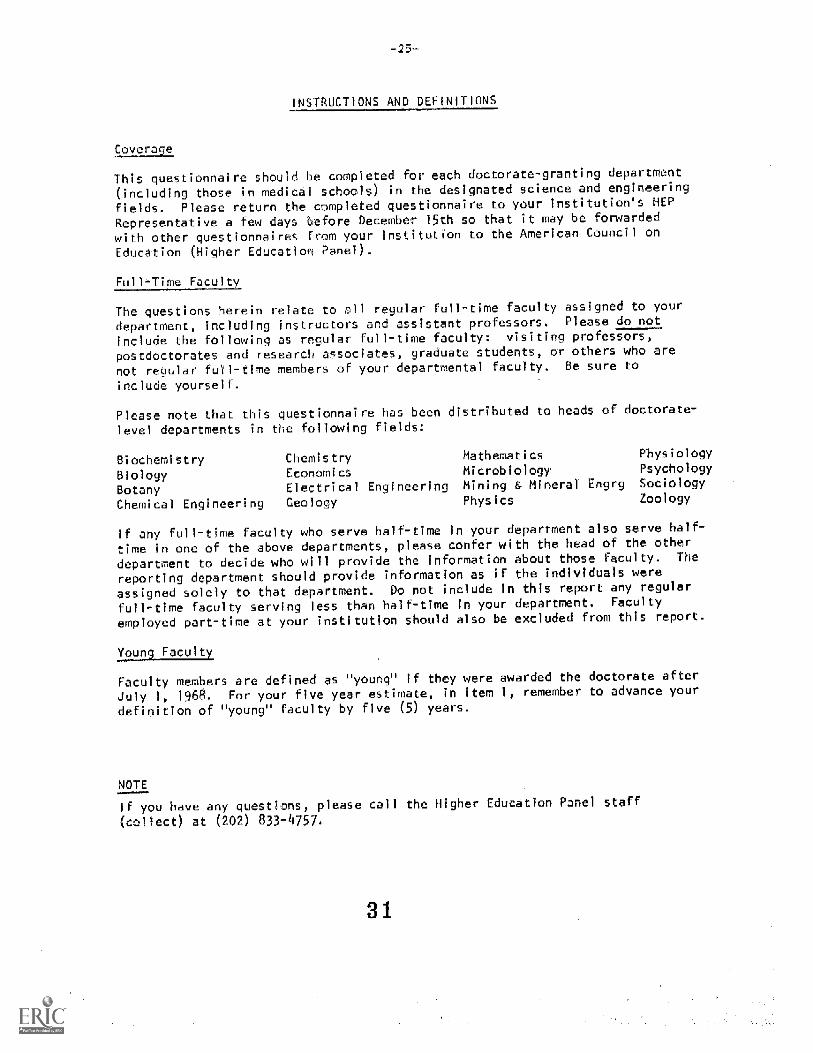
Coverage
This questionnaire should be completed for each doctorate-granting department
(including those in medical schools) in the designated science and engineering
fields. Please return the opmpleted questionnaire to your institution's HEP
Representative a faw days before December 15th so that it may be forwarded
with other questionnaires from your institution to the American Council on
Education (Higher Education Panel).
Full-Time Faculty
The questions herein relate to li regular full-time faculty assigned to your
department, including instructors and assistant professors. Please do not
include the following as rocular full-time faculty: visiting professors,
postdoctorates and research associates, graduate students, or others who are
not regular full-time members of your departmental faculty. Be sure to
include yourself.
Please note that this questionnaire has been distributed to heads of doctorate-
level departments in the following fields:
Biochemistry Chemistry Mathematics Physiology
Biology Economics Microbiology Psychology
Botany Electrical Engineering Mining & Minera l °Emgrg Sociology
Chemical Engineering GeoloeY Physics Zoology
If any full-t;me faculty who serve half-time in your department also serve half-
time in one of the above departments, please confer with the head of the other
department to decide who will provide the information about those faculty. The
reporting department should provide information as if the individuals were
assigned solely to that department. Do not include in this report any regular
full-time faculty serving less than half-time in your department. Faculty
employed part-time at your institution should also be excluded from this report.
Young_faculty
Faculty members are defined as "young" if they were awarded the doctorate after
July 1, 1968. For your five year estimate, in item 1, remember to advance your
:definition of "young" faculty by five (5) Years.
NOTE
if you have any ques-liect) at (202) 8
ns, please call the Higher Education Panel staff
4757.

-26-
American Council on EducationOne Dupont Circle, N.W.Washington, D.C. 20036
Higher Education Panel Survey Number 30
Status of Young Doctorate Facultyin _Selected Science and EngineeTing pepartmeryts, 1975 tol98
Nave of Department
OMD No. 99-0265Expires 6/76
1. Please provide the numbers of regular full-time doctorate faculty in your
department for the years specified. What numbers are young doctorates?
(In making your estimate for five years from now, please assume nosignificant changes in the availability of federal research funds.)
December 1975 Five years from now
actual) e timate)
Number of full-time doc or faculty
Number of young doctorate faculty(i.e., 7 years or less
since doctorate)
2 . Do you consider that the present or projected proportions of young to the
total doctorate faculty, as reported above, are too low? (Please check one
response for each period of time.)
December 1975 Five years from now
actual) estimate)_ -
Yes rj 177No
For your department, what do you consider to be the most desirable percentage
of young doctorates of the total doctorate faculty?
SiTice 1970 has your department or insti_u '-n implemented any of the following
changes in tenure or appointment policies or practices? (Check all that apply.)
a. Announce quotas on number or percentage
of tenured faculty.
b. Lengthen the probationary period beforea tenure deciSion has to be made.
C. Encourage optional early retirement.
d. Reduce mandatory retirement age from
age to age
e. Other actions designed to increase Ole
number of young faculty, or havingthat effect. Please specify:
None
Pi:L-nned for
In Effect this ImplementationAcademic Year Next Academic Year
Over

-27-
4. Besides financial constraints, what ether factors currently have the effect
of limiting the proportion of young doctorate faculty? (For example, the
need to hire recognized senior faculty tc maintain prey ous levels of
extr-imural research support.)
IF YOU RESPONDED "YES" TO ANY PART OF ITEM 2a (indiatinq that theprOortion of young doctorate faculty in your department is now toolow or is expected to be tco low five years from now), PLEASE ANSWER
THE FOLLOWING:
, in your op n on, should be done to alleviate the situ *on?
What ac ions do you belleve your department inst ution be
at,le to take in this matter?
Thank you for your cooperation.
Please retain a copy of this survey for your records.
Person completing this for :
Offite:
Telephone Number.
-28-
ageaaglE:
Response _ to Survey 30 Young Docto ate Faculty
,k
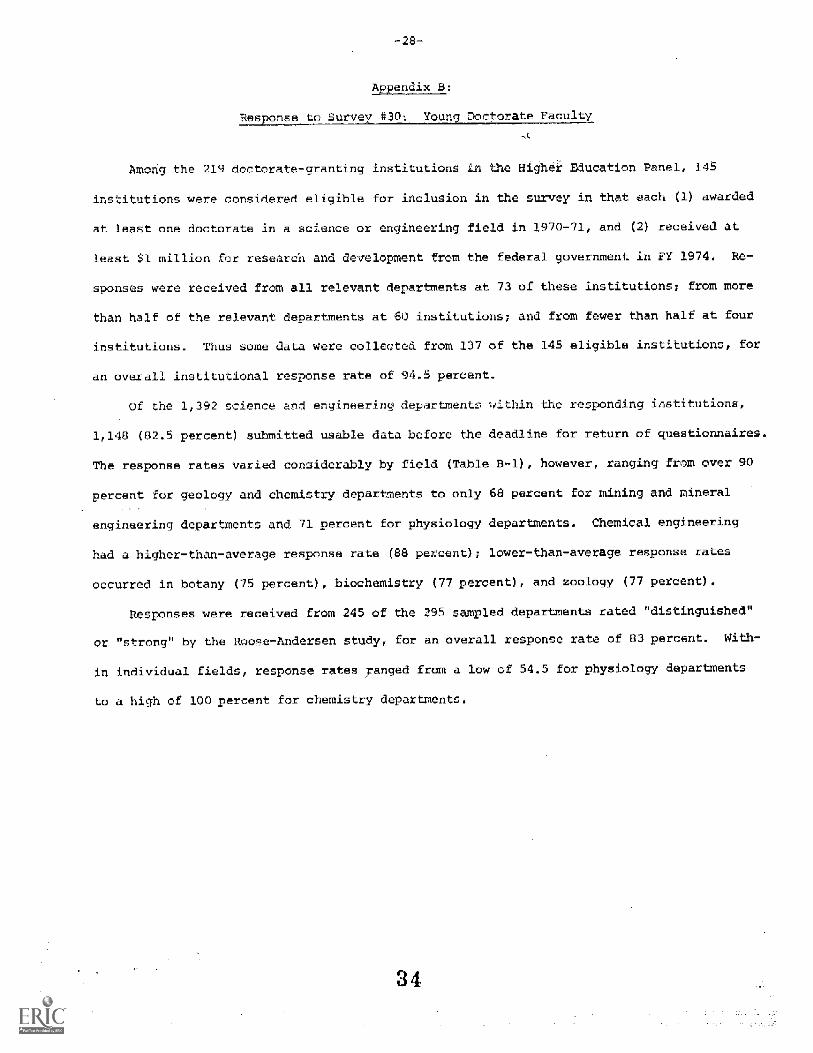
Among the 219 doctorate-granting institut* ns in the Higher Education Panel, 145
institutions were --considered eligible for inclusion in the suivay in that each (1) awarded
at least one doctorate in a sclenoe or engineering field in 1970-71, and (2) received at
-ast $1 million far research and development from the federal gover_ ent in PY 1974. Re-
sponses were received from all relevant departments at 73 of these institutions; from more
than half of the relevant departments at 60 institutions; and from fewer than half at four
institutions. Thus som- data were collected from 137 of the 145 eligible institutions, for
an overall institutional response rate of 94.5 percent.
Of the 1,392 science and engineering dectments within the responding iflstitutions,
1,148 (82.5 percent) submitted usable data before the deadline for return of questionnaires.
The response rates varied considerably by field (Table B-1), however, ranging from over 90
percent for geology and chemistry departments to only 68 percent for mining and mineral
engineering depar-ments and 71 percent for physiology departments. Chemical engineering
had a higher-th -average response rate (88 percent); lower-than-average response rates
occurred in botany (75 percent), biochemistry (77 percent), and zoology (77 percent).
Responses were received from 245 of the 295 sarnled departments rated "distinguished"
or "strong" by the Rooce-Andersen study, for an overall response rate of 83 percent. With-
in individual fields, response rates Fanged from a low of 54.5 for physiology departments
to a high of 100 percent for chemistry departmen s.
3 4
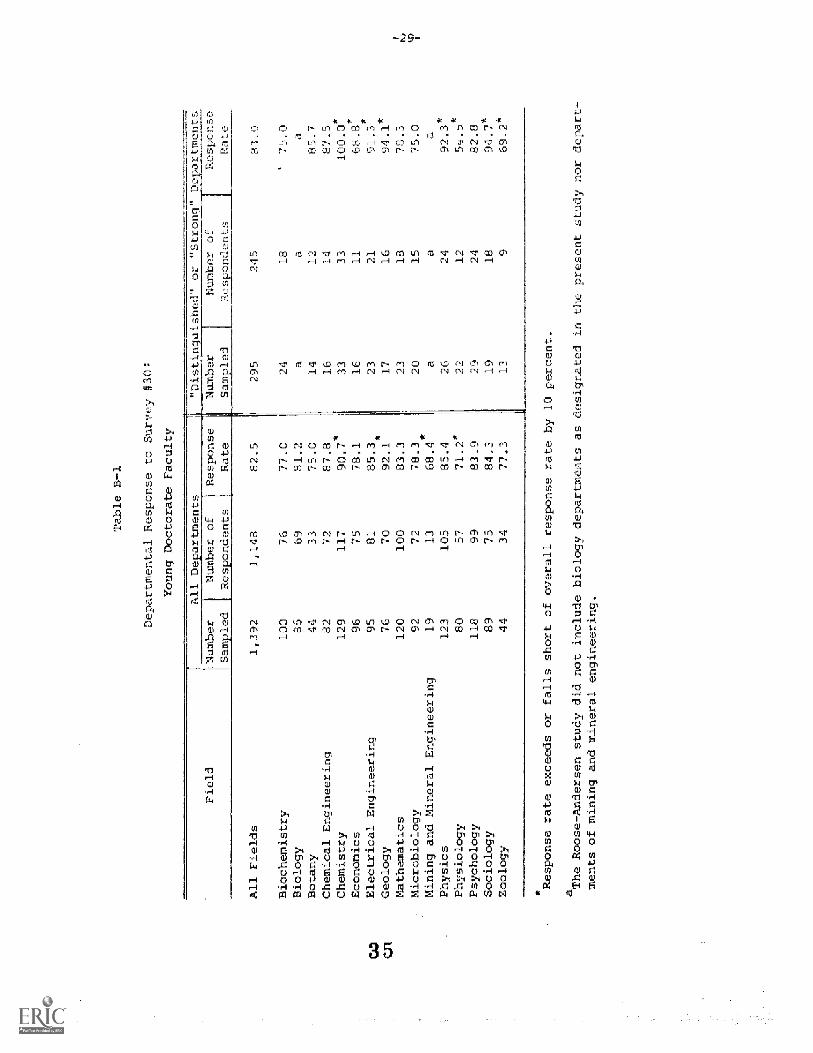
Table B-1
Departmental Response to Survey #30:
Young Doctorate Faculty
Field
All Departments
"Distinguished" or "Strong" De)artments
.Number
Number of
Sampled
Respondents.
Response.
Rate
Number
Sampled
Number of
Respondents,
Response
Rate
All Fields
1,392
1,148
82.5
Ij
295
245
a3
Biochemistry
100
76
77.0
24
18
'75.0
Biology
85
69.
31.2
aa
a.
Botany
44:
'33
75.0
14
12
85.7
Chemical Enginee ing
82
72
87.8
16
14
87.5
Chemistry
129:
117
go 7*
33
33
100.0
Economics
96
75
78.1
16:
11
68.e
Electrical. Engineering
95
81
85.3*
23
21
91.3'
Geology
76
70
92.1
17
16
94.1*
Mathematics
120
100
83.3
23
18
78.3
t
Microbiology.
92
72
78.3
H
*20
15.
75.0
I
Mining and Mineral Engineering
19 ,
13
68.4
aa.
a
Physics
123
105:
85.4:
26
24
92.3* *
Physiology
80
57
71.2*
I
22
12
.
Psychology
118
99
83.9
29
24
82.8
Sociology
89
75
84.3
ig:
18.
94.7*
Zoology.
44.
34
77.3
13
9.
69.2*
ResponSe rate exceeds or falls short of overall response rate by 10 percent.
a.
The Roose-Andersen study did not include biology departments as designated in the present study nor depart.-
ments of mining and mineral engineering.

University of Alabama-Univers:LIUniversity of Alaska-FairbanksAmerican UniversityArizona State UniversityUniversity of ArizonaUniversity of Arkansas-Main CampusAdburn University-Main Campus
Boston CollegeBoston UniversityBrandeis UniversityBrown University
University of California-Berkeley
UniversityCaliforniaUniversityUniversityUniversityUniversity
of California-DavisInstitute of Technologyof California-Irvineof California-LAof California-Riversideof California Med ctr-sF
University of California-Santa BarbaraUniversity of California-Santa CruzCarnegie-Mellon UniversityCase Western Reserve UniversityCatholic UniverSity of AmericaUniversity of Cincinnati-Maih CampusCleMson UniversityUniversity of Colorado-Main CampusColorado School of MinesColorado State University ,Columbia University-Main DivisionColuMbia University Teachers CollegeCornell U. Endowed Colleges
Dartmouth CollegeUniversity of DaytonUniversity of DelawareUniversity of DenverDrexel UniversityDuke University
Enory Univer ity
Florida State UniversityUniversity of Florida
Georgia Institute of Tech-Main Campus--George Peabody College for TeachersGeorge Washington UniversityGeorgetown UniversityUniversity of Georgia
HahnemaAn Med Col and Hospital
Harvard UniversityUniversity of Hawaii at ManoaUniversity of Houston-Main Campus
Howard University
-30-
ot Surve-ed Institutions_
University of IdahoUniversity of Illinois-Chicago CircleUniversity of Illinois-Urbana CampusIllinois Institute of TechnologyIndiana University at BloomingtonIowa State U Sciences and Technology
Johns Hopkins University
Kansas State U Agr. & Applied SciencesUniversi y of Kentucky-Main Campus
Louisiana State University-Baton RougeLehigh UniversityLoma Linda UniversityUniversity of LouisvllleLoyola University
University of Maine at OronoUniversity of Massachusetts-AmherstUniversity of Maryland-College ParkCollege of Medicine and Dentistry-NewarkMedical College of GeorgiaMedical University of South CarolinaMedical College of PennsylvaniaUniversity of MiamiUniversity of Michigan-Ann ArborUniversity of Minn-Mnpls St PaulUniversity of Mississippi-Main CampusMississippi State UniversityUniversity of Missouri-ColumbiaUniversity of Missouri-RollaMontana State UniversityUniversity of Montana
University of North Carolina-Chapel HillNorth Carolina State University-RaleighN Dakota State University-Main CampusUniversity of Nevada-RenoUniversity of New HampshireNew York Medical CollegeNew York UniversityUniversity of New Mexico-Main CampusNew Mexico State University-Main CampusNortheastern UniversityNorthwestern UniversityUniversity of Notre Dame
Ohio State University-Main CampusOklahoma State University-Main CampusUniversity of Oklahoma-Norman CampusUniversity of Oregon-Main CampusOregon State University
Pennslyvania State University-Main CampUs
UniVersity of Pennsylvania
ur:L2ifiUnstit ions _ontinued)
University of Pittsbur Main CampusPolytechnic Institute of New York
Princeton UniversityPurdue University-Main Campus
Rensselaer Polytechnic InStituteUniversity of Rhode IslandRice UniversityUniversity of RochesterRutgers University-New Bruns ick
St. Louis Univers ty-Main CampusUniversity of South Carolina-Main CampusSouth Dakota State UniversityUniversity of South FloridaUniversity of Southern CaliforniaStanford UniversityStevens Institute of TechnologySUNY Downstate Medical CenterSUNY State University Buffalo-Main CampusSUN? State University Stony Brook MainSUNY State U at AlbanySUNY Upstate Medical Cente:,:Syracuse University Main Campus
Temple University-Main CampusUniversity of Tennessee KnoxvilleUniversity of Texas at Austin-Main CampusTexas A&M UniverSity-Main CampusTexas Tech UniversityTufts UniversityTulane University of Louisiana
Utah State UniversityUniversity of Utah
Virginia Polytechnic Institute and St. U
Vanderbilt UniversityVirginia Commonwealth UniversityUniversity of Virginia-Main CampusUniversity of Vermont & St Agri College
Wash_ngton State UniversityWashington UniversityUniversity of WashingtonWayne State UniversityWest Virginia UniversityUniversity of WisCOnsin-MadisonUniversity Of Wisconsin-MilwaukeeUniversity of Wyoming
Yale UniversityYeshiva University
3 7
Other Reports of the Higher Education PanelAmerican Council on Education
Blandford. . and Dutton. D. Sum, of First-Year Graduate arid Postdoctoral Enrollment in Science and Engineering. Higher
Education Panel Report. No. I. Aueust. 1971.
Blandford. B. and Dutton. D. Research Support for Science Faculty. Higher Education Panel Report. No. 2, November, 1971.
Astin. A.. Blandford. B.. and Mahn. T. Freshman Class Vacancies in Fall 1971 and Recent Trends in Enrollment of MinorityFreshmen. Higher Education Panel Report. No. 3. February, 1972.
Changes in Graduate Programs in Science and Engineering 1970-72 and 1972-74.Science ResOUrces Studies H ighlights. Washing-
ton: National Science Foundation. July. 1972.
Blandford. B. and Sell, C. Enrollment of Junior-Year Students 19 0 and 1971 Higher Education Panel Report No. 5. April,
1972,
Trexler. J. and Blandford, B. What College Presidents Are Reading. Higher Education Panel Report. No. 6. March. 1972.
Tresler. J. and Kent. L. Commercial Theme-Writing Services. Higher Education Panel Report. No. 7. June. 1972.
Furnis, W. T. Faculty Tenure and Contract Systems: Current Practice. ACE Special Report. July, 1972.
Bayer. A. E. and AstinA, W. War Protest on U.S. Campuses During April 1972. Higher Education Panel Report, No. 9.
May.1972.
Bla Hord, B. A. and -I-resler. J. C. Expected First-Year Graduate Enrollment in Science and Engineering, Fall 1972. HigheEducation Panel Report. No. 10, August. 1972.
Blandlord. B. A. Student Participation on Institutional Governing Boards. Higher Education Panel Report, No. I I, October.
1972,
Dutton. J F. and Blandfrd. B. A. Enrollment of junior-Year Students (1971 and 1972). Higher Education Panel Report, No. 12.
April. 1973.
Dutton. J. E. Courses and Enrollment in Ethnic/Racial Studies. Higher Education Panel Report. No. 14. August. 1973.
Dutton. J. E. and Jenkins. NI. D. The Urban Involvement of Colleges and Universities. Higher Education Panel Report. No. 1.5.
August, 1973_
Dutton. J. E. and El-Khawas. E. H. Production of Doctorates m Selected Fields, 1972-1975. Higher Education and Panel Report.
No. 16. April. 1974.
Dutton..1, E. First-Year Enrollment for Masters or Higher Degrees. Fall 1973. Higher Education Panel Report. No. 17. April.
1974.
El-Khawas. E. H. and Kinzer. J. l,. The impac Bice of Education Student Assistance Programs, Fall 1973. Higher Education
Panel Report. No. S8, April. 1974.
El-Khawas. E. H. and Kinzer. J. L. Enrollnientof Minority Graduate Students at Ph.D. Granting Institutions. Higher Education
Panel Report. No. 19. August. 1974.
El-Khawas, E., H. College and University Facilities: Expectations of Space and Maintenance Needs for Fall 1974. Higher Educa-
tion Panel Report. No. 20. September. 1974.
Kinzer. J. E. and El-Khawas. F.. H. Compensation Practices for Graduate Research A i- n A Survey of Selec ed Doctoral
Institutions, Higher Education Panel Report, No. 21, October. 1974.
El-Khawas, E H. and Eurniss. W_ T. Faculty Tenure and Contract Systems: 1972 and 1974. Higher Education Panel Report.
No_ 22. December. 1974.
El-Khawas. F,. H. and Kinzer. J. 1.. A Survey of Continuing Education Opportunities Available to Nonacaderhle Scientists,Engineers and Mathematicians. Higher Education Panel Report, No. 23, April. 1975.
Atelsek. Frank 1_ and Ciomberg. Irene E. Nonfederal Funding of Biomedical Research and Development: A Survey of Doctoral
Institutions. Higher Education Panel Report. No. 25,July 1975.
G mherg, Ilene F. and Atelsek. Frank J. Major Field Enrollment of Junior-Year Stud nts, 1973 and 1974. Higher Education
Panel Report. No. 26. April. 1976.
At Isek, Erank J. and Gomberg, Irene I,. Student A.s.si.stance Participants and Programs, 1974-75. Higher Education Panel
Report, No. 27, July 1975.
Atelsek. Frank J. and Gomberg, Irene L. Health Research Facilities: A Survey of Doctorate-Granting Institutions. HigherEducation Panel Report, No. 28, February. 1976.
Atelsek, Frank J. and Gomberg. Irene L. Faculty Research: Level of Activity and Choice ot Area. Higher Education PanelReport No. 29, January. 1976.
Single copies of the above reports may bc obtained from the Higher FAueation Panel, American Council on Education, One Dupont
Washington. D.C. 20036.
38
Related Documents