DOCUMENT RES= ED 273 239 HE 019 655 AUTHOR Johnston, Lloyd D.; And Others TITLE Drug Use among American High School Students, College Students, and Othr Young Adults. Rational ?reads Through 1985. INSTITUTION Michigan Univ., Ann Arbor. inst. for Social Research. SPONS AGENCY National Inst. on Drug Abuse (DHHS/PHS), Rockville, Md. REPORT NO DHHS-ADM-86-1450 PUB DATE 86 GRANT 3-R01-DA-01411 NOTE 247p.; Some tables contain small print. AVAILABLE FROM Superintendent of Documents, U.S. Goveremeat Printing Office, Washington, DC, 20402. PUB TYPE Reports - Research/Technical (143) EDRS PRICE DESCRIPTORS MF01/PC10 Plus Postage. Alcoholic Beverages; *Attitudes; College Stmleits; Drug Abuse; *Drug Use; Higher Education; High Schools; *High School Seniors; *Illegal Drug Use; Lysergic Acid Diethylamide; Marijuana; Narcotics; National Surveys; Sedatives; Smoking; Stimulants; Trend Analysis; *Young Adults ABSTRACT Drug use and related attitudes of U.S. high school seniors from the graduating classes of 1975-1985 aad young adults is their late teens and early- to mid-twenties were studied, as part of an ongoing research project. Eleven classes of drugs were assessed: marijuana (including hashish), inhalants, hallucinogens, cocaise, heroin, other natural and synthetic opiates, stimmlants (amphetamines), sedatives, tranquilizers, alcohol, and cigarettes. Several subclasses of drugs were also covered: PCP and lysergic acid diethylamide (LSD), amyl and butyl nitrites, and barbiturates and methaqualone. Attention was focused on drug use at the higher frequency levels rather than whether respoadents had ever used various drugs. Of concern were: age of first use; the seniors' own attitudes and beliefs; and the attitudes, beliefs, and behaviors of others in the seniors' social environment, including perceived drug availability. The use of non-prescription stimulants, including diet pills, stay-awake pills, and pseudo-amphetamines were also reported, along with cocaine use among young people. Findings include sex differences in drug use, differences related to college plass, regional differences, and differences related to population deasity. The implications of findings for prevention efforts were addressed. (SW) ************** Reproduct ************** * * * * * * * * * * * * * * * * * * * * * * * * * * * * *** * * ** * ** * **** * *** * * ** * * * * ions supplied by EDRS are the best that can be made from the original document. *********************************************************

Welcome message from author
This document is posted to help you gain knowledge. Please leave a comment to let me know what you think about it! Share it to your friends and learn new things together.
Transcript

DOCUMENT RES=
ED 273 239 HE 019 655
AUTHOR Johnston, Lloyd D.; And OthersTITLE Drug Use among American High School Students, College
Students, and Othr Young Adults. Rational ?readsThrough 1985.
INSTITUTION Michigan Univ., Ann Arbor. inst. for SocialResearch.
SPONS AGENCY National Inst. on Drug Abuse (DHHS/PHS), Rockville,Md.
REPORT NO DHHS-ADM-86-1450PUB DATE 86GRANT 3-R01-DA-01411NOTE 247p.; Some tables contain small print.AVAILABLE FROM Superintendent of Documents, U.S. Goveremeat Printing
Office, Washington, DC, 20402.PUB TYPE Reports - Research/Technical (143)
EDRS PRICEDESCRIPTORS
MF01/PC10 Plus Postage.Alcoholic Beverages; *Attitudes; College Stmleits;Drug Abuse; *Drug Use; Higher Education; HighSchools; *High School Seniors; *Illegal Drug Use;Lysergic Acid Diethylamide; Marijuana; Narcotics;National Surveys; Sedatives; Smoking; Stimulants;Trend Analysis; *Young Adults
ABSTRACTDrug use and related attitudes of U.S. high school
seniors from the graduating classes of 1975-1985 aad young adults istheir late teens and early- to mid-twenties were studied, as part ofan ongoing research project. Eleven classes of drugs were assessed:marijuana (including hashish), inhalants, hallucinogens, cocaise,heroin, other natural and synthetic opiates, stimmlants(amphetamines), sedatives, tranquilizers, alcohol, and cigarettes.Several subclasses of drugs were also covered: PCP and lysergic aciddiethylamide (LSD), amyl and butyl nitrites, and barbiturates andmethaqualone. Attention was focused on drug use at the higherfrequency levels rather than whether respoadents had ever usedvarious drugs. Of concern were: age of first use; the seniors' ownattitudes and beliefs; and the attitudes, beliefs, and behaviors ofothers in the seniors' social environment, including perceived drugavailability. The use of non-prescription stimulants, including dietpills, stay-awake pills, and pseudo-amphetamines were also reported,along with cocaine use among young people. Findings include sexdifferences in drug use, differences related to college plass,regional differences, and differences related to population deasity.The implications of findings for prevention efforts were addressed.(SW)
**************
Reproduct
**************
* * * * * * * * * * * * * * * * * * * * * * * * * * * * *** * * ** * ** * **** * *** * * ** * * * *
ions supplied by EDRS are the best that can be madefrom the original document.
*********************************************************

National Institutu on Drug Abuse
DRUG USE AMONG AMERICANHIGH SCHOOL STUDENTS,
COLLEGE STUDENTS,AND OTHER YOUNG ADULTS
National Trends through 1985
U.S. DEPARTMENT OF EDUCATIONOffice of Educational Ruesrch and Improvement
ED CATIONAL RESOURCES INFORMATIONCENTER (ERIC)
This document heti been reproduced asreceived from the person Of ozganizahonoriginating it
O Minor changes have been made to improvereproduction quality
Points ol view or opinions stated in this docu.ment do not necessarily represent officialOERI position or policy
LC.)
\`)U.S. DEPARTMENT OF HEALTH AND HUMAN SERVICES
Public Health Service
*C3
Alcohol, Drug Abuse, and Mental Health Administration

DRUG USE AMONG AMERICAN
HIGH SCHOOL STUDENTS,
COLLEGE STUDENTS,
AND OTHER YOUNG ADULTS
National Trends through 1985
byLloyd D. Johnston, Ph.D.
Patrick M. O'Malley, Ph.D.Jerald G. Bachman, Ph.D.
The University of Michiganlnsfitute for Social Research
Natkmal Institute on Drug Abuse5600 Fishers Lane
Rockville, Maryland 20857
U.S. DEPARTMENT OF HEALTH AND HUMAN SERVICESPublic Health Service
Alcohol, Drug Abuse, and Mental Health Administration
1986

This publication was written by theprincipal investigators and staff of TheMonitoring the Future project, at theInstitute for Social Research, TheUniversity of Michigan, under ResearchGrant No. 3 RO1 DA 01411 from theNational Institute on Drug Abuse.
Public Domain Notice
All material appearing in this volume isin the public domain and may bereproduced or copied withoutpermission from the Institute or theauthors. Citation of the source isappreciated.
DHHS Publication No. (ADM) 86-1430Printed 1986
For sale by the Superintendent of Documents, U.S. Government Printing OfficeWashington, DC 20402
4
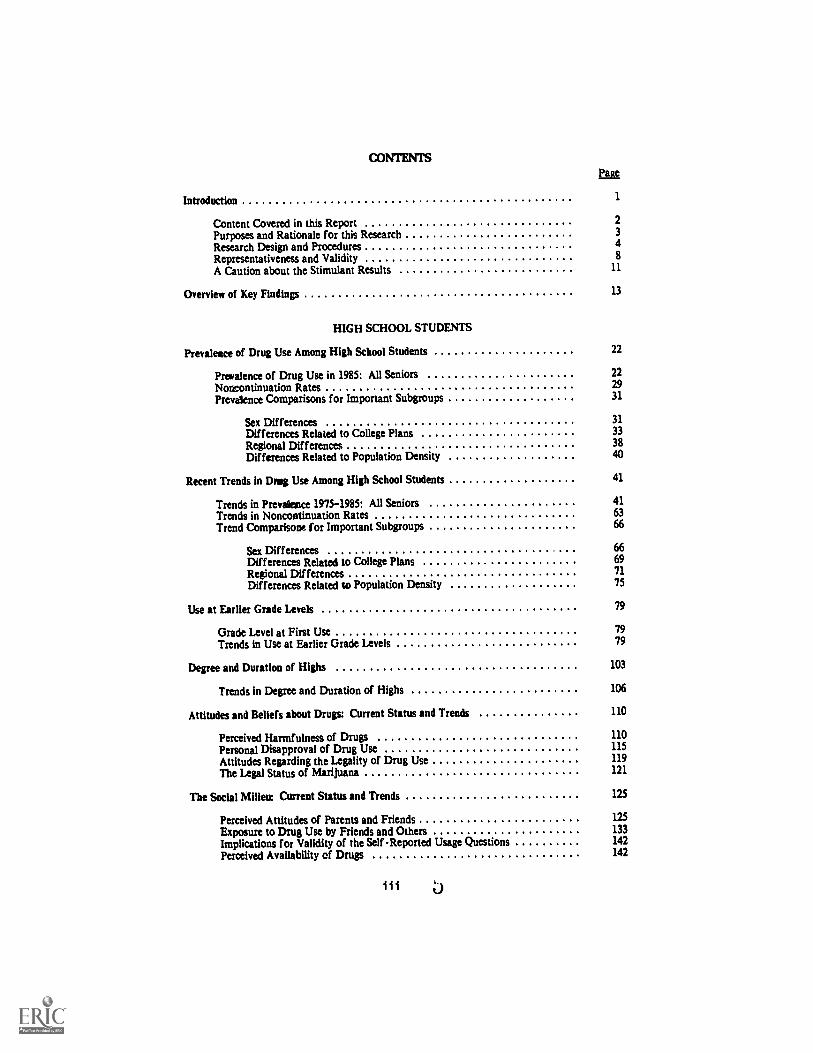
CONTENTSL'age
Introduction 1
Content Covered in this Report 2
Purposes and Rationale for this Research 3
Research Design and Procedures 4
Representativeness and Validity 8
A Caution about the Stimulant Results 11
Overview of Key Findings 13
HIGH SCHOOL STUDENTS
Prevalence of Drug Use Among High School Students 22
Prevalence of Drug Use in 1985: All Seniors 22
Norcontinuation Rates 29
Prevdence Comparisons for Important Subgroups 31
Sex Differences 31
Differences Related to College Plans 33
Regional Differences 38
Differences Related to Population Density 40
Recent Trends in Din Use Among High School Students 41
Trends in Preemies= 1975-1985: All Seniors 41
Trends in Noncontinuation Rates 63
Trend Comparisone f or Important Subgroups 66
Sex Differences 66
Differences Related to College Plans 69
Regional Dif ferences 71
Differences Related to Population Density 75
Use at Earlier Grade Levels 79
Grade Level at First Use 79
Trends in Use at Earlier Grade Levels 79
Degree and Duration of Highs 103
Trends in Degree and Duration of Highs 106
Attitudes and Beliefs about Drugs: Current Status and Trends 110
Perceived Harmfulness of Drugs 110
Personal Disapproval of Drug Use 115
Attitudes Regarding the Legality of Drug Use 119
The Legal Status of Marijuana 121
The Social Milieu: Current Status and Trends 125
Perceived Attitudes of Parents and Friends 125
Exposure to Drug Use by Friends and Others 133
Implications for Validity of the Self -Reported Usage Questions 142
Perceived Availability of Drugs 142
i i i 0

YOUNG ADULTS POST HIGH SCHOOL
Prevalence of Drug Use Among Young Adults 148
Prevalence of Drug Use in 1985: Young Adults 148Sex Differences in Prevalence 151
Recent Trends in Drug Use Among Young Adults 170
Trends in Prevalence Through 1985: Young Adults 170Sex Differences in Trends 176
COLLEGE STUDENTS
Prevalence of Drug Use Among College Students 178
Prevalence of Drug Use in 1985: College Students 179Sex Differences in Prevalence 180
Recent Trends in Drug Use Among College Students 204
Trends in Prevalence 1980-1985: College Students 204Sex Differences in Trends 207
OTHER FINDINGS FROM THE STUDY
The Use of Non-Prescription Stimulants 210
The Use of Marijuana on a Daily Basis 215
A Further Look at Cocaine Use 220
Self-Reported Reasons for Using Drugs 221
Some Implications for Prevention 225
Other Data on Correlates and Trends 229
APPENDIX
Estimates Adjusted for Absentees and Dropouts
The Effects of Missing Absentees 230The Effects of Missing Dropouts 231Summary and Conclusions 235Examples of Revised Estimates for Two Drugs 237
ti
v

LIST OF TABLES
page
HIGH SCHOOL STUDENTS
1. Prevalence (Percent Ever Used) of Sixteen Types of Drugs:Observed Estimates and 95% Confidence Limits, Class of 1985 23
2. Prevalence (Percent Ever Used) and Recency of Useof Sixteen Types of Drugs. Class of 1983 25
3. Lifetime Prevalence of Use of Sixteen Types of Drugs by Subgroups,Class of 1985 32
4. Annual Prevalence of Use of Sixteen Types of Drugs by Subgroups.Class of 1985 34
5. Thirty-Day Prevalence of Use of Sixteen Types of Drugs by Subgroups.Class of 1985 36
6. Thirty-Day Prevalence of Daily Use of Marijuana, Alcohol, and Cigarettesby Subgroups. Class of 1985 37
7. Trends in Lifetime Prevalence of Sixteen Types of Drugs 42
8. Trends in Annual Prevalence of Sixteen Types of Drugs 43
9. Trends in Thirty-Day Prevalence of Sixteen Types of Drugs 44
10. Trends in Thirty-Day Prevalence of Daily Useof S:Nteen Types of Drugs 45
11. Trends in Lifetime, Annual, and Thirty-Day Prevalencein an Index of Illicit Drug Use 47
12. Trends in Noncontinuation Rates Among SeniorsWho Used Drug in Lifetime 64
13. Trends in Noncontinuation Rates Among SeniorsWho Used Drug Ten or More Times in Lifetime 65
14. Grade of First Use for Sixteen Types of Drugs. Class of 1985 80
15. Trends in Perceived Harmfulness of Drugs 112
16. Trends in Proportions Disapproving of Drug Use 118
17. Trends in Attitudes Regarding Legality of Drug Use 120
18 Trends in Attitudes Regarding Marijuana Laws 122
19. Trends in Proportion of Friends Disapproving of Drug Use 126
20. Trends in Proportion of Friends Using Drugs 136
v

21. Trends in Exposure to Drug Use 138
22. Trcnds in Reported Availability of Drugs 143
YOUNG ADULTS
23. Prevalence of Use of Twelve Types of Drugs. 1985Among Follow-Up Respondents 1-8 Years Beyond High School by Sex 152
24. Trends in Annual Prevalence of Twelve Types of DrugsAmong Follow-Up Respondents 1-8 Years Beyond High School 172
25. Trends in Thirty-Day Prevalence of Twelve Types of DrugsAmong Follow-Up Respondents 1-8 Years Beyond High School 173
26. Trends in ThirtyDay Prevalence of Daily Use of Twelve Types of DrugsAmong Follow-Up Respondcnts 1-8 Years Beyond High School 174
27. Trends in Annual and Thirty-Day Prevalence of An illicit Drug Use IndexAmong Follow-Up Respondents 1-8 Years Beyond High School by Sex 175
COLLEGE STUDENTS
28. Trends in Annual Preval c of Twelve Types of DrugsAmong College Stuu,nts 1-4 Years Beyond High School 182
29. Trends in Thirty-Day Prevalence of Twelve Types of DrugsAmong College Students 1-4 Years Beyond High School 183
30. Trends in ThirtyDay Prevalence of Daily Use of Twelve Types of DrugsAmong College Students 1-4 Years Beyond High School 184
31. Trends in Annual and ThirtyDay Prevalence of an illicit Drug Use IndexAmong College Students 1-4 Years Beyond High School by Sex 185
OTHER FINDINGS
32. Various Stimulants: Trends in Lifetime. Annual, and Thirty-Day Prevalenceby Sex 211
33. Responses to Selected Questions on Daily Marijuana Use by Subgroups 217
34. Trends in Daily Use of Marijuana in Lifetime by Subgroups 219
vi

LIST OF FIGURES
lAts
1. Location of Schools Surveyed in 1985 5
HIGH SCHOOL STUDENTS
2. Prevalence and Recency of UseEleven Types of Drugs, Class of 1985 26
3. Thirty-Day Prevalence of Daily UseEleven Types of Drugs, Class of 1985 28
4. Noncontinuation Rates: Percent of SeniorsWho Used Drug Once or More in Lifetimebut Did Not Use in Past Year 30
5. States Included in the Four Regions of the Country 39
6. Trends in Lifetime Prevalenceof an Illicit Drug Use Index All Seniors 49
7. Trends in Annual Prevalenceof an Illicit Drug Use Index All Seniors 51
8. Trends in Thirty-Day Prevalenceof an Illicit Drug Use Index All Seniors 53
9. Trends in Lifetime, Annual, and Thirty-Day Prevalenceof Sixteen Drugs
a. Marijuana and Stimulants 54b. Tranquilizers, Inhalants, and Nitrites 55c. Sedatives, Barbiturates, and Methaqualone 56d. Hallucinogens, LSD, and PCP 57e. Cocaine, Other Opiates, and Heroin 58f. Alcohol and Cigarettes 59
10. Trends in Thirty-Day Prevalence of Daily Useof Marijuana. Alcohol, and Cigarettes by Sex 60
11. Trends in Two-Week Prevalenceof Heavy Drinking by Sex 61
12. Trends in Annual Prevalence of an Illicit Drug Use Indexby Sex 67
13. Trends in Annual Prevalence of an Illicit Drug Use Indexby College Plans 70
14. Trends in Annual Prevalence of an Illicit Drug Use Indexby Region of the Country 72
v11

15. Trends in Lifetime Prevalence oi Cocaine Useby Region of the Country
74
16. Trends in Annual Prevalence of an Illicit Drug Use Indexby Population Density
76
17. Trends in Lifetime Prevalence for Earlier Grade Levels
a. Use of Any Illicit Drug85b. Use of Any Illicit Drug Other Than Marijuana86c. Use of Any Illicit Drug Other Than Marijuanaor Amphetamines 87d. Marijuana88e. Cocaine89f. Stimulants90g. Hallucinogens91h. PCP92i. Inhalants93j. Nitrites94k. Sedatives95I. Barbiturates96m. Methaqualone97n. Tranquilizers98o. Heroin99p. Other Opiates
100q. Cigarette Smoking on a Daily Basis101r. Alcohol102
18. Degree of High Attained by Recent Users104
19. Duration of High Attained by Recent Users105
20. Trends in Perceived Harmfulness: Marijuana and Cigarettes 114
21. Trends in Perceived Harmfulness: Other Drugs116
22a. Trends in Disapproval of Illicit Drug UseSeniors, Parents, and Peers
130
22b. Trends in Disapproval of Illicit Drug UseSeniors, Parents, and Peers
131
23. Trends in Disapproval of Licit Drug UseSeniors, Parents, and Peers
132
24. Proportion of Friends Using Each Drugas Estimated by Seniors, in 1985
134
25. Trends in Perceived Availability of Drugs141
1 oviii

YOUNG ADULTS
26-38. Trends in Annual Prevalence Among Young Adults by Age Group
26. Any Illicit Drug 153
27. Any Illicit Drug Other than Marijuana 154
28. Any Illicit Drug Other than Marijuana or Stimulants 155
29. Marijuana (Including Thirty-Day and Daily Prevalence) 156
30. LSD 158
31. Cocaine 159
32. Other Opiates 160
33. Stimulants 161
34. Barbiturates 162
35. Methaqualone 163
36. Tranquilizers 16437. Alcohol (Including Thirty-Day, Daily, and Heavy Drinking Prevalence) 165
38. Cigarettes (Including Thirty-Day, Daily, and Half -Pack Prevalence) . . 168
COLLEGE STUDENTS
39-51. Trends in Annual Prevalence Among 1 %lege Students1-4 Years Beyond High School
39. Any Illicit Drug 186
40. Any Illicit Drug Other than Marijuana 187
41. Any Illicit Drug Other than Marijuana or Stimulants 18842. Marijuana (Including Daily Prevalence) 189
43. LSD 191
44. Cocaine 192
45. Other Opiates 193
46. Stimulants 194
47. Barbiturates 195
48. Methaqualone 196
49. Tranquilizers 19750. Alcohol (Including Thirty-Day, Daily, and Heavy Drinking Prevalence ) 19851. Cigarettes (Including Thirty-Day, Daily, and Half-Pack Prevalence) . . 201
OTHER FINDINGS
52. Prevalence and Recency of Use, by SexAmphetamines and Non-Prescription Stimulants, Class of 1985 214
53. Reasons Given for Abstaining From and Quitting Marijuana Use:Possible Physical and Psychological Harm 226
54. Reasons Given for Abstaining From and Quitting Marijuana Use:Cost and Availability 227
APPENDIX
A-1. High School Completion by Persons 20-24 Years Old, 1972-1985 232
A-2. Estimates of Prevalence and Trends for the Entire Age/Class Cohort,Adjusting for Absentees and Dropouts 236
ix

INTRODUCTION
This report is the ninth in an annual series reporting the drug use andrelated attitudes of America's high school seniors. The findings, whichcover the high school dosses of 1975 through 1985, come from anongoing national research and reporting program entitled Monitoring theFuture: A Continuing Study of the Lifestyles and Values of Youth. Theprogram is conducted by the University of Michigan's Institute forSocial Research, and is funded primarily by the National Institute onDrug Abuse. The study is sometimes referred to as the High SchoolSenior Survey, since each year a representative sample of all seniors inpublic and private high schools in the coterminous United States issurveyed. However, the study also includes representative samples ofyoung adults from previous graduating dosses who are administeredfollow-up surveys by mail.
Published on a less frequent interval is a series of larger volumes, fromwhich this series presents only a summary of findings. The most recentwas published by the National Institute on Drug Abuse in 1984 under thetitle Drugs and American High School Students: 1975-1983. In additionto presenting a full chapter of detailed findings for each of the variousdosses of drugs, each larger volume contains chapters on attitudes andbeliefs about drugs and various relevant aspects of the social milieu, aswell as several appendices dealing with validity, sampling errorestimation, and survey instrumentation.*
Two of the major topics which continue to included in this presentseries are the current prevalence of drug use among American highschool seniors, and trends in use by seniors since the study began in1975. Also reported are data on grade of first use, trends in use atearlier grade levels, Intensity of drug use, attitudes and beliefs amongseniors concerning various types of drug use, and their perceptions ofcertain relevant aspects of the social environment.
The Inclusion of College Students and YounR Adults Generally
For the first time this year, data on the prevalence and trends in druguse among young adults who have completed high school are beingincorporated into this report. The period of young adulthood (late teensand early- to mid-twenties) is particularly important because this tendsto be a time of peak levels of use for many drugs. The current epidemicof cocaine use among young adults also makes this an age group ofparticular policy importance.
12

The Monitoring the Future study design includes ten-year follow-uppanel studies of a subsample of the participants in each participatingsenior class, beginning with the class of 1976. Thus, data were gatheredin 1983 on represontative samples of the graduating classes of 1976through 1984, corresponding to modal ages of 19 to 27.
Separate data are provided on college students specifically. Thissegment of the young adult population has not been well represented innational surveys to date, because many college students live on campus,in dormitories, fraternities, and sororities, and these group dwellingsare not included in the national household survey population.
Other publications from the study already have reported on variousaspects of these panel data; now, beginning with the current report, thisseries will routinely provide data on the prevalence and trends in druguse among young adults.
Content Areas Covered in this Report
Eleven separate classes of drugs are aistinguished in this report:marijuana (including hashish), inhalants, hallucinogens, cocaine, heroin,natural and synthetic opiates other than heroin, stimulants (morespecifically, amphetamines), sedatives, tranquilizers, alcohol, andcigarettes. (This particular organization of drug use classes was chosento heighten comparability with a parallel series of publications based onnational household surveys on drug abuse.) Separate statistics are alsopresented here for several sub-classes of drugs: PCP and LSD (bothhallucinogens), barbiturates and methaq..idlone (both sedatives), and theamyl and butyl nitrites (both inhalants). PCP and the nitrites wereadded to our measurements for the first time in 1979 because ofincreasing concern over their rising popularity and possibly deleteriouseffects; trend data are thus only available for them since 1979. (Forsimilar reasons, smokeless tobacco is being added to the 1986 surveyand will be included in the next report in this series.) Barbiturates andmethaqualone, which constitute the two components of the "sedatives"class as used here, have been separately measured from the outset.They have been presented separately because their trend lines aresubstantially different.
Except for the findings on alcohol, cigarettes, and non-prescriptionstimulants, practically all of the information reported here deals withIllicit drug use. Respondents are asked to exclude any occasions onwhich they used any of the psychotherapeutic drugs under medicalsupervision. (Some des on the medically supervised use of such drugsare contained in the full 1977, 1978, 1981, and 1983 volumes.)
Throughout this report we have chosen to focus considerable attentionon drug use at the higher frequency levels rather than simply reportingproportions who have ever used various drugs. This is done to helpdifferentiate levels of seriousness, or extent, of drug involvement.While there still is no public consensus of what levels or patterns of useconstitute "abuse," there is surely a consensus that higher levels of use
13,

Throughout this report we have chosen to focus considerable attentionon drug use at the higher frequency levels rather than simply reportingproportions who have ever used various drugs. This is done to helpdifferentiate levels of seriousness, or extent, of drug involvement.While there still is no public consensus of what levels or patterns of useconstitute "abuse," there is surely a consensus that higher levels of useare more likely to have detrimental effects for the user and societythan are lower levels. We have also introduced indirect measures ofdosage per occasion, by asking respondents the duration and intensityof the highs they usually experience with each type of drug. Onesection of this report deals with those results.
For both licit and illicit drugs, separate sections of this report aredevoted to age of first use; the seniors' own attitudes and beliefs; andthe attitudes, beliefs, and behaviors of others in the seniors' socialenvironment (including perceived drug availability).
In 1982 we added a special section, under "Other Findings from theStudy," dealing with the use of non-prescription stimulants, includingdiet pills, stay-awake pills, and the "look-alike" pseudo-amphetamines.Questions on these substances were placed in the survey beginning in1982 because the use of such substances appeared to be on the rise, andalso because their inappropriate inclusion by some respondents in theiranswers about amphetamine use were affecting the observed trcnds.The "Other Findings from the Study" section continues to present trendresults on those non-prescription substances.
That section also presents trend results from a set of suestions on theuse of marijuana at a daily or near-daily level. These questions wereadded to enable us to develop a more complete indivAual history ofdaily use over a period of years, and they reveal some very interestingfacts about the frequent users of this drug.
In addition, the "Other Findings" section includes synopses of twomonograph chapters published over the past year: one reportsextensively on cocaine use among young Americans, and the seconddiscusses the implications for prevention efforts of various findingsfrom the study, including further evidence for the causal linkagebetween recent declines In marijuana use and growing concerns aboutthe health consequences of such use. The "Other Findings" section alsopresents a synopsis of results from the study reportee in a recentjournal article on the reasons young people give for their use of thevarious drugs.
Purposes and Rationale for this Research
Perhaps no area is more clearly appropriate for the application ofsystematic research and reporting than the drug field, given its rapidrate of change, its importance for the well-being of the nation, and theamount of legislative and administrative intervention addressed to it.Young people are often at the leading edge of social change; and thishas been particularly true in the case of drug use. The massive upsurgein illicit drug use during the last twenty-five years has proven to beprimarily a youth phenomenon, with onset of use most likely to occur
3
One of the major purposes of the Monitoring the Future series is todevelop an accurate picture of the current drug use situation andtrends. Having a reasonably accurate assessment of the basic size andcontours of the problem of illicit drug use among young Americans is aprerequisite for rational public debate and policy making. In theabsence of reliable prevalence data, substantial misconceptions candevelop and resources can be misallocated. In the absence of reliabledata on trends, early detection and localization of emerging problemsare more difficult, and assessments of the Impact of major historicaland policy-induced events are much more conjectural.
The Monitoring the Future study has a number of purposes in addition toprevalence and trend estimationpurposes which are not addressed inany detail in this volume. Among them are: gaining a betterunderstanding of the lifestyles and value orientations associated withvarious patterns of drug use, and monitoring how those orientations areshifting over time; determining the immediate and more general aspectsof the social environment which are associated with drug use and abuse;determining how drug use Is affected by major transitions in socialenvironment (such as entry into military service, civilian employment,college, unemployment) or in social roles (marriage, parenthood);distinguishing age effects from cohort and period effects in determiningdrug use; determining the effects of social legislation on all types ofsubstance use; and determining the changing connotations of drug useand changing patterns of multiple drug use among youth. Readersinterested in publications dealing with any of these other areas shvuldwrite the authors at the Institute for Social Research, Room 2030, TheUniversity of Michigan, Ann Arbor, Michigan, 48106-1248.
Research Design and Procedures for the Surveys of Seniors
The data from high school seniors are collected during the spring ofeach year, beginning with the class of 1975. Each data collection takesplace in approximately 125 to 140 public and private high schoolsselected to provide an accurate cross-section of high school seniorsthroughout the coterminous United States. (See Figure 1.)
There are several reasons for choosing the senior year of high school asan optimal point for monitoring the drug use and related attitudes ofyouth. First, the completion of high school represents the end of animportant developmental stage in this society, since it demarcates boththe end of universal public education and, for many, the end of living inthe parental home. Therefore, it is a logical point at which to takestock of the cumulated influences of these two environments onAmerican youth. Further, the completion of high school represents thejumping-off point from which young people diverge into widely differingsocial environments and experiences. Finally, there are some importantpractical advantages to building a system of data collections aroundsamples of high school seniors. The need for systematically repeated,large-scale samples from which to make reliable estimates of changerequires that considetable stress be laid on efficiency as well asfeasibility. The last year of high school constitutes the final point atwhich a reasonably good national sample of an age-specific cohort canbe drawn and studied economically.

FIGURE
Location of Schoo la Surveyed in 1985
1 t's

One limitation in the design Is that it does not include in the targetpopulation those young men and women who drop out of high schoolbefore graduationbetween 13 and 20 percent of each age cohort. Theomission of high school dropouts does introduce biases In the estimationof certain characteristics of the entire age group; however, for mostpurposes, the small proportion of dropouts sets outer limits on the bias.Further, since the bias from missing dropouts should remain just aboutconstant from year to year, their omission should introduce little or nobias into the various types of change being estimated for the majorityof the population.* Indeed, we believe the changes observed over timefor those who finish high school are likely to parallel the changes fordropouts in most instances.
Sampling Procedures. A multi-stage procedure Is used for securing thenationwide sample of high school seniors each year. Stage 1 is theselection of particular geographic areas, Stage 2 the selection of one ormore high schools In each area, and Stage 3 the selection of seniorswithin each high school.
This three-stage sampling procedure yielded the following numbers ofparticipating schools and students:
Classof
CI's.of
Classof
Classof
Classof
Classof
Classof
Classof
Classo!
Classof
Classof1975 1976 1977 1978 1979 1980 1981 1982 1983 1984 1985
Number public schools III 108 108 111 III 107 109 116 112 117 115Number private schools 14 15 16 20 20 20 19 21 22 17 17
Total number schools 125 123 124 131 131 127 128 137 134 134 132
Total number students V 91 16,678 18,436 18,924 16,662 16,524 18,267 11,348 16,947 16,499 16,502Student response rate 78% 77% 79% 83% 82% 82% 81% 83% 84% 83% 8495
Questionnaire Administration. About ten days before theadministration students are given flyers explaining the study. Theactual questionnaire administrations are conducted by the localInstitute for Social Research representatives and their assistants,following standardized procedures detailed in a project instructionmanual. The questionnaires are administered in classrooms during anormal class period whenever possible; however, circumstances in someschools require the use of larger group administrations.
Questionnaire Format. Because many questions are needed to cover allof the topic areas in the study, much of the questionnaire content isdivided into five different questionnaire forms (which are distributed to
*See the Appendix for a detailed discussion of the likely effects ofthe exclusion of dropouts on estimates of prevalence of drug use andtrends in drug use among the entire age cohort.

participants in an ordered sequence that ensures five virtually identicalsubsamples). About one-third of each questionnaire form consists ofkey or 'tore" variables which are common to all forms. Alldemographic variables, and nearly all of the drug use variables includedin this report, are included in this 'tore" set of measures. Many of thequestions dealing with attitudes, beliefs, and perceptions of relevantfeatures of the social milieu are contained in only a single form,however, and are thus based on one-fifth as many cases (i.e.,approximately 3,500 respondents).
Research Design for the Follow-Up Surveys After High School
Beginning with the graduating class of 1976, each class is being followedup annually for a period of ten years after high school. From theapproximately 17,000 seniors originally participating in a given class, arepresentative sample of 2,400 individuals is chosen for follow-up. Inorder to ensure sufficient numbers of drug users in the follow-upsurveys, those fitting certain criteria of current drug use (that is, thosereporting current daily marijuana use in senior year or use of any of theother illicit drugs In the previous 30 days) are selected with higherprobability (by a factor of 3.0) than the remaining seniors. Differentialweighting is used in all follow-up analyses to compensate for thedifferential sampling probabilities.
The 2,400 selected respondents from each class are randomly assignedto one of two matching groups of 1,200 each; one group is surveyed oneven-numbered calendar years, while the other group is surveyed onodd-numbered years. This biannual procedure is intended to reducerespondent burden.
Follow-Up Procedures
Using information provided by respondents at the time of the seniorsurvey (name, address, phone number, and the name and address ofsomeone who would always know how to reach them), we contact thestudents selected for the panels by mail. Newsletters are sent eachyear and name and address corrections are requested. Questionnairesare sent by certified mail in the spring of each year. A check for $5.00,made out to the respondent, is attached to the front. Reminder lettersand post cards go out at fixed intervals thereafter and finally, those notresponding receive a prompting phone call from the Survey ResearchCenter's phone interviewing facility in Ann Arbor. If requested, asecond copy of the questionnaire is sent.
Panel Retention Rates
To date the panel retention rates have remained quite high. In the firstfollow-up after high school, about 85% of the original panel returnedquestionnaires. Naturally, the retention rate reduces ordinally withtime; however, the 1985 panel retention from the Class of 1976theoldest of the panels, now aged 27remains at 71%.
7 j d

Since attrition is to a modest degree associated with drug use, we haveintroduced corrections into the prevalence estimates presented here forthe follow-up panels. These raise the prevalence estimates from whatthey would be uncorrected, but only slightly. We believe the resultingestimates to be the most accurate obtainable, but still low for the agegroup as a whole due to the omission of dropouts and absentees from thepopulation covered by the original panels.
Representativeness and Validity
School Participation. Schools are invited to participate In the study fora two-year period, and with only very few exceptions, each school in theoriginal sample, after participating for one year of the study, hasagreed to participate for a second year. Thus far, from 66 percent to80 percent of the schools Invited to participate initially have agreed todo so each year; for each school refusal, a similar school (in terms ofsize, geographic area, urbanicity, etc.) Is recruited as a replacement.The selection of replacement schools almost entirely removes problemsof bias in region, urbanicity, and the like, that might result from certainschools refusing to participate. Other potential biases are more subtle,however. lf, for example, It turned out that most schools with "drugproblems" refused to participate, that would seriously bias the sample.And if any other single factor were dominant in most refutals, that alsomight suggest a source of serious bias. In fact, however, the reasons fora school refusing to participate are varied and are often a function ofhappenstance events; only a small proportion specifically object to thedrug content of the survey. Thus we feel quite confident that schoolrefusals have not seriously biased the surveys.
Schools are selected in such a way that half of each year's sample Iscomprised of schools which participated the previous year, and half Iscomprised of schools which will participate the following year. Thisstaggered half-sample design Is used to check on possible biases in theyear-to-year trend estimates derived from the full samples. Spe-cifically, separate sets of one-year trends are computed using first thathalf-sample of schools which participated In both 1973 and 1976, thenthe half-sample which participated in both 1976 and 197 and so on.Thus, each one-year trend estimate derived in this way Is based on a setof about 65 schools. When the resulting trend data (examinedseparately for each class of drugs) are compared with trends based onthe total sample of schools, the results are highly similar, indicatingthat the trend estimates are little affected by turnover or shiftingrefusal rates in the school samples. 1The absolute prevalence estimatesfor a ;Oven year are not as accurate using just the half-sample, ofcourse.)
Student Participation. Completed questionnaires are obtained from77% to 8496 of all sampled students in participating nchools each year.The single most important reason that students are missed is absencefrom class at the time of data collection; in mcst cases it is notworkable to schedule a special follow-up data collection for absentstudents. Students with fairly high rates of absenteeism also report
19 8
above-average rates of drug use; therefore, there is some degree of biasintroduced into the prevalence estimates by our missing the absentees.Much of that bias could be corrected through the use of specialweighting; however, we decided not to do so because the bias In overalldrug use estimates was determined to be quite small, and because thenecessary weighting procedures would have introduced undesirablecomplications. (Appendix A of the full reports provides a discussion ofthis point and the Appendix to this report shows trend and prevalenceestimates which would result with corrections for absentees included.)
Of course, some students are not absent from class, but simply refusewhen asked to complete a questionnaire. However, the proportion ofexplicit refusals amounts to less than 1 percent of the target sample.
Sampling Accuracy of the Estimates. For purposes of this introduction,it is sufficient to note that drug use estimates based on the total sampleof seniors each year have confidence intervals that average about +I%(as shown in Table 1, confidence intervals vary from +2.2% to smallerthan +0.3%, depending on the drug). This means that had we been ableto invite all schools and all seniors in the 48 coterminous states toparticipate, the results from such a massive survey should be withinabout one percentage point of our present findings for most drugs atleast 95 times out of 100. We consider this to be a high level ofaccuracy, and one that permits the detection of fairly small changesfrom one year to the next.
Validity of the Measures of Self-Reported Drug Use
A question which always arises in the study of sensitive behaviors likedrug use is whether honest reporting can be secured. Like most studiesdealing with sensitive behaviors, we have no direct, objective validationof the present measures; however, the considerable amount of inferen-tial evidence that exists strongly suggests that the self-report questionsproduce largely valid data. A more complete discussion of thecontributing evidence which leads to this conclusion may be found inother publications; here we will only briefly summarize the evidence.*
First, using a three wave panel design, we established that the variousmeasures of self-reported drug use have a high degree of reliabilitya
*Johnston, L.D. & O'Malley, P.M. "Issues of validity and populationcoverage in student surveys of drug use." In B.A. Rouse, N.J. Kozel, &L.G. Richards (Eds.), Self-report methods of estimating drug use:Meeting current challenges to validity. (National Institute on DrugAbuse Research Monograph 57). Washington, D.C.: U.S. GovernmentPrinting Office (ADM) 85-1402, 1985; Johnston, L.D., O'Malley, P.M., &Bachman, J.G. Drugs and American high school students: 1975-1983.(National Institute on Drug Abuse). Washington, D.C.: U.S. Govern-ment Printing Office (ADM) 80-976, 1984.
29 u

necessary condition for validity.* In essence, this means thatrespondents were highly consistent in their self-reported behaviors overa three- to four-year time Interval. Second, we found a high degree ofconsistency among logically related measures of use within the samequestionnaire administration. Third, the proportion of seniors reportingsome illicit drug use by senior year has reached two-thirds of allrespondents in peak years and nearly as high as 80% in some follow-upyears, which constitutes prima facie evidence that the degree ofunderreporting must be very limited. Fourth, the seniors' reports of useby their friends has been highly consistent with self-reported use interms of both prevalence and trends in prevalence, as will be discussedlater in this report. Fifth, we have found self-reported drug use torelate in consistent and expected ways to a number of other attitudes,behaviors, beliefs, and social situationsin other words, there is strongevidence of "construct validity." Sixth, the missing data rates for theself-reported use questions are only very slightly higher than for thepreceding non-sensitive questions, in spite of the instruction torespondents to leave blank those drug use questions they felt they couldnot answer honestly. And seventh, the great majority of respondents,when asked, say they would answer such questions honestly if they wereusers.
This is not to argue that self-reported measures of drug use are valid inall cases. In the present study we have gone to great lengths to createa situation and set of procedures in which students feel that theirconfidentiality will be protected. We have also tried to present aconvincing case as to why such research is needed. We think theevidence suggests that a high level of validity has been obtained.Nevertheless, insofar as there exists any remaining reporting bias, webelieve it to be in the direction of underreporting. Thus, we believe ourestimates to be lower than their true values, even for the obtainedsamples, but not substantially so.
Consistency and the Measurement of Trends. One further point is worthnoting in a discussion of the validity of the findings. The Monitoring theFuture project is designed to be sensitive to changes from one time toanother. Accordingly, the measures and procedures have been stan-dardized and applied consistently across each data collection. To theextent that any biases remain because of limits in school and/or studentparticipation, and to the extent that there are distortions (lack ofvalidity) in the responses of some students, It seems very likely thatsuch problems will exist in much the same way from one year to thenext. In other words, biases in the survey estimates will tend to beconsistent from one year to another, which means that our measure-ment of trends should be affected very little by any such biases. Thesmooth and consistent nature of most trend curves reported for thevarious drugs provides rather compelling empirical support for thisassertion.
*O'Malley, P.M., Bachman, J.G., & Johnston, L.D. "Reliability andconsistency in self-reports of drug use." International Journal of theAddictions, 1983, j, 803424.
21 10

A Caution about the Stimulant Results for 1979-1982
In reporting their psychotherapeutic drug use, respondents areinstructed to exclude not only medically-supervised use, but also anyuse of over-the-counter (i.e., non-prescription) drugs. However,beginning in about 1979 we believe that some of those reportingstimulant (amphetamine) use were erroneously including the use ofover-the-counter stay-awake and diet pills, as well as other pillsintentionally manufactured to look like amphetamines, and sold undernames which sound like them, but which contain no controlledsubstances. The advertising and sale of over-the-counter diet pills(most of which contain the mild stimulant phenylpropanolamine)burgeoned at about that time, as was also true for the "sound-alike,look-alike" pills (most of which contain caffeine). We believe that theinappropriate Inclusion of these non-controlled stimulants in theresponses to our surveys accounted for much of the observed sharp riseIn reported "amphetamine" use in 1980 and 1981. Therefore, the readeris advised to view the unadjusted amphetamine-use statistics for thoseyears with some caution.
In the 1982 survey, some new questions were Introduced on the use ofboth controlled and non-controlled stimulants. (We also kept the oldversion of the question in two questionnaire forms In the high schoolsurveys so that it would be possible to "splice" the trend lines resultingfrom the old and new questions.) Since 1982 we have included statisticson "amphetamines, adjusted'swhich are based on these new questionscontained in three questionnaires in 1982 and 1983 and then in all fivequestionnaires in 1984 and thereafter. We believe these questions havebeen successful at getting respondents to exclude over-the-counterstimulants and those "look-alike" stimulants which the user knows arelook-alikes. However, as is true with several other drug classes, theuser may at times be ingesting a substance other than the one he or shethinks it to be. Thus, some erroneous self-reports of "amphetamine" usemay remain.
An upward bias from the inclusion of over-the-counter and look-alikestimulants would have affected not only the stimulant (amphetamine)trend statistics in the years in question, but also trend statistics for thecomposite indexes entitled "use of any illicit drug" and "use of anyillicit drug other than marijuana." Since these indexes had been usedconsistently in this monograph series to compare important subgroups(such as those defined by sex, region, college plans, etc.) we decided tokeep them, but to include an adjusted value based on calculations inwhich amphetamines have been excluded. In other words, this adjustedstatistic reflects "use of any illicit drugs other than marijuana oramphetamines," and is included to show what happens when amphet-amine useand any upward biases in trends it might containisexcluded entirely from the trend statistics since 1975.
A second adjusted statistic has also been included since 1982, when therevised amphetamine questions were introduced. It gives our bestestimate of overall illicit drug use, including the use of real amphet-amines as measured by the revised amphetamine questions. A <Isymbol is used to denote this estimate in any figures presenting data on
11 2."

these two illicit drug use indexes, whereas a 41 symbol Is used todenote estimates In which amphetamines are excluded entirely. (SeeFigure 6 for an example.)
It is worth noting that the two classes of drug use which are notactually amphetamine use, but which are sometimes Inadvertentlyreported as amphetamine use, reflect two quite different types ofbehavior. Presumably most users of over-the-counter diet and stay-awake pills are using them for functional reasons and not forrecreational purposes. On the other hand, it seems likely that mostusers of the look-alike pseudo-amphetamines are using them forrecreational purposes. (In fact, in many cases the user who purchasedthem on the street may think he or she has the real thing.) Thus, theinclusion of the look-alikes may have Introduced a bias in the estimatesof true amphetamine use, but not In the estimates of a class ofbehaviornamely, trying to use controlled stimulants for recreationalpurposes. Some would argue that the latter is the more importantfactor to be monitoring in any case.
2 312

OVERVIEW OF KEY FINDINGS
This monograph reports findings from the ongoing research andreporting project entitled Monitoring the Future: A Continuing Study ofthe Lifestyles and Values of Youth. Each year since 1975, In-schoolsurveys of nationally representative samples of high school seniors havebeen conducted. In addition, in each year since 1976, representativesubsamples of the participants from each previously graduating classhave been surveyed by mall.
Findings on the prevalence and trends in drug use and related factorsare reported for high school seniors and also for young adult high schoolgraduates 19-27 years old. Trend data are presented for varying timeintervals, ranging from ten years 11975-1985) for the youngest age band(18 year olds) to one year for the oldest age band (25-26 year olds).Results are given separately for college students, a particularlyImportant subset of this young adult population for which therecurrently exist no other nationally representative data.
A number of important findings emerge from these three nationalsubpopulationshigh school seniors, young adults through age 27, andcollege students. Some of them are cause for concern.
Probably the most Important finding in 1985 is that therather steady decline of the past four years In overallillicit drug use among high school seniors appears tohave halted. The proportions of seniors using anillicit druR in their lifetime, the past year, and thepast month remained virtually unchanged in 1985,compared to 1984, as did the proportions of seniorsus3 any Illicit drug other than marijuana. This haltIn a longer term dedine was also replicated in trenddata derived from the nation's college students andyoung adults gene-ally.
Concurrent with this halt in the decline in overallinvolvement with illicit drugs came the equallydisturbing finding that cocaine use increased amongseniors in 1985. (An increase in 1984 in the 30-dayprevalence figure gave an early indication of thisshift.) Current use (i.e., use in the prior 30 days) rosefrom 4.9% in 1983 to 5.8% in 1984 to 6.7% in 1985.Some 17% of all seniors in 1985 have tried it. Giventhe growing publicity about the very real hazards ofthis drug, a natural downward correction in use wouldhave been reasonable to expect. It appears, however,that beliefs about the harmfulness of experimentingwith the drug have moved very little, and even in 1985only 34% of all seniors believe there is great riskinvolved in trying cocaine once or twice (reflectingpractically no change since 1978).
132 i

Not only do a fair proportion of seniors try cocaine,but both lifetime prevalence and active use risedramatically with age as people pass into their mid-twenties. Among 27 year olds in the follow-up study,roughly 40%four in every ten of these youngadultshave tried cocaine. (Only 10% of them hadused cocaine when they were seniors in 1976.)
During the post-high school years, cocaine is the onlyone of the illicit drugs at present to show a substantialincrease in active use with age. Active cocaine usehas risen with age among recent cohorts until aboutage 22 when annual prevalence plateaus at around 22%and 30-day prevalence plateaus at around 10% to 12%.As we have reported elsewhere, relative to otherillicitly used drugs, a fairly high proportion of thosewho try cocaine go on to use it frequently, puttingthemselves at substantial risk for addiction.
Two other classes of drugs which showed relativelysmall increases in use among seniors in 1985 are PCPand opiates other than heroin. The annual prevalenceof PCP use rose from 2.3% to 2.9% (nonsignificant)between 1984 and 1985, though it should be noted thatthese levels are far below the peak level of 7.0% in1979. (The use of PCP is not reported for follow-uprespondents because it is asked on a singlequestionnaire form and, therefore, yields too few casesfor sufficiently reliable trend estimation.)
Among seniors the use of opiates other than heroin hasbeen relatively stable, though annual prevalence rosefrom 5.2% in 1984 to 5.9% in 1985 (a statisticallysignificant increase). Among young adults in generalthere was also a slight (nonsignificant) increase in usein 1985.
The steady decline since 1979 in marijuana use amongseniors halted in 1985. Lifetime, annual, monthly, anddaily use prevalences now stand at 54%, 41%, 26%, and4.9% respectively. This halt is also observed amongcollege students and the full young adult sample.
Over the prior six years, daily marijuana use had shown. dramatic decline among seniors, falling from 10.7%in 1978 to 5.0% in 1984. (It is 4.9% in 19853 While wedo not have trend data on college samples prior to1980, there was an equally dramatic drop amongcollege students between 1980 and 1984, from 7.2% to3.6%; and in this case the drop did continue in 1985 (to3.1%). Looking across all the age groups encompassed,we have seen quite parallel cross-time trends in dailyuse and very little difference in daily usage rates as afunction of age.
23 14

Tranquilizers had been showing a decline among highschool seniors over a longer time period, from 1977(when annual use was at 11%) to 1984 (annual use at6.1%), but this decline also halted in 1985 (annual useremained at 6.1%). The long term steady decline inthe use of this drug among college students also haltedin 1985, while the full young adult sample showed avery slight further decline.
Like tranquilizer use, the use of barbiturates Is atappreciably lower levels among all groups in 1985 thanwhen this class of drugs began to decline at least adecade ago. Annual prevalence for nonmedicallysupervised barbiturate use today is only 4.6% amongseniors, 1.3% among college students, and 2.7% in theyoung adult sample 19 to 27 years old. There was acontinuing slight (nonsignificant) decline in 1985 in allthree populations studied.
Two classes of drugs did show a continuing (andsta. Istically significant) decline in 1985stimulantsand methaqualone. Of the Illicitly used drugs, stim-ulants (more specifically, amphetamines) constitutethe second most widely used class after marijuana.Since 1982, when the use of this class of drugs beganto drop among seniors, annual prevalence has fallenfrom 20.3% to 15.8% In 1985 (2% of that drop occurredin 1985). Annual prevalence among college students,and you.ig adults generally, has dropped even moresteeply over the same interval (from 21.1% to 1.1.94among college students, for example).
Methawalonelike barbiturates, the other class ofsedatives In the studyhas shown a very large declinein use (in this case since 1981) among high schoolseniors, college students, and the larger group of youngadults surveyed. In the most recent years, shrinkingavailability very likely played a role in this drop, aslegal manufacture and distribution within the UnitedStates ceased. In 1985 the annual prevalence rates areonly 2.8% among seniors (vs. a peak of 7.6% in 1981),1.8% among all the young adults one to nine years posthigh school, and 1.4% among colleise studentsspecifically (from a peak of 7.2% in 1980).
While LSD use did not appear to decline further thisyear among seniors (annual prevalence has fallen from6.6% in 1979 to 4.4% in 1985), it did continue todecline significantly among the young adults andcollege students. Among college students annualprevalence is down from t.3% in 1982 to 2.2% in1985nearly a two-thirds decline. Among all youngadults one to nine years post high school, annualprevalence now stands at 3.1%, following anappreciable decline since 1982.
15

Inhalant use among high school seniors remalned fairlysteady In 1985 and, in fact, has changed rather littleslnce 1980. Adjusted annual prevalence In the senloryear of high school Is 7.2%. The amyl and butyl nitritecomponent of that general class of drugs also remalnedstable with annual prevalence of 4.0% (which is belowpeak levels in earner years).
As a result of these various changes, the three classesof Illicit drugs which now impact on appreciableproportions of young Americans in thelr late teens andtwenties are mat:Nana, cocalne, and stimulants.Among high scnool seni7r7hey show annualprevalence rates in 1985 of 41%, 13%, and 16%respectively. Among college students the comparableannual prevalence rates in 1985 for marljuana,cocalne, and stimulants are 42%, 17%, and 12%; andfor all high school graduates one to nine years posthigh school (the "young adult" sample) the respectiveannual prevalence rates are 41%, 20%, and 14%.
A number of additional interesting findings emergefrom the new sections in thls report dealing with age-related changes in use. One is that the already highproportion of young people who by senlor year have atleast trled any Illicit drug (61% in 1985) growssubstantially larger up through the mid-twenties(where It reaches 75% to 80% in 1985). There is aslmllar rise in the proportion using any Illicit drugother than marlivana (40% among seniors in 1985 vs.50% to 55% among those in their mid-twenties).Lifetime prevalence for marl uana reaches about 70%to 75% by the mid-twenties vs. 54% among 1985seniors) and for cocaine nearly 40% (vs. 17% among1985 seniors).
On the other hand, active Illicit drug use among theolder age groups has-ie.-a-id to approximate the levelsobserved among seniors.. This has been true for theannual prevalence of any Illicit ctg.1 , marijuana,methacklaione, and tranquilizers. It has also been truefor daily marijuana use. In fact, the young adultsample actually shows lower rates of annual preva-lence than high school senlors on three drugsLSD,barbiturates and opiates other than heroin. Coca1n7,737 course, Is the exceptlon in that active use rises untilabout age 22, where it reaches a plateau.
American college students (one to four years past highschool), when compared to all high school graduatestheir age, show annual usage rates for a number ofdrugs which are about average, including any Illicit
any illicit drug other than marijuana, marl uanaspecifically (although their rate of daily mariluana useis below average for their age group), cocaine, andmethaoualone. For several drugs, however, they have
16
2 '/

rates of use which are below average for their agegroup, including LSD and all of the psychotherapeuticdrugs (stimulants barbiturates, tranquilizers, andopiates other than heroin
Since college-bound seniors in high school had tendedto have lower rates of use on all of these illicit drugs,their eventually attaining parity on some of themreflects a "catching up" to some degree. As someresults from the study published elsewhere have shown,the "catching up" may be explainable more in terms ofdifferential rates of leaving the parental home and ofgetting married than In terms of any direct effects ofcollege per se. (College students are more likely toleave the parental home and less likely to get marriedthan their age peers.)
In general, the trends since 1980 in illicit substanceuse among American college students are found toparallel those for their age group as a whole. Thatmeans that for most drugs there has been a decline inuse over the five-year interval. Further, all youngadult high school graduates through age 27, as well ascollege students taken separately, show trends whichare highly parallel for the most part to the trendsamong high school seniors, although declines in theactive use of many of the drugs over the past halfdecade have been proportionately larger in these twoolder populations than among high school seniors(particularly the declines in LSD and stimulant use).
Regarding sex differences, In all three populationsmales are more likely to use most illicit drugs, and thedifferences tend to be largest at the higher frequencylevels. Daily marijuana use among high school seniorsin 1985, for example, Is reported by 6.9% of males vs.2.8% of females; among all young adults by 7.4% ofmales vs. 3.4% of females; and among collegestudents, specifically, by 4.9% of males vs. 1.6% offemales. The only exceptions to the rule that malesare more frequently users of illicit drugs than femalesoccur for stimulant use in high school and tranquilizeruse among young adults post high school: in both casesfemales are slightly higher.
Insofar as there have been differential trends for thetwo sexes among any of these populations, they havebeen In the direction of a diminution of differencesbetween the sexes. For college students, previousdifferences In the usage rates for methaqualone,barbiturates, and LSD are disappearing as the annualprevalence rates for both sexes converge toward zero(which means that use by males has fallen more). Thesame is happening for methaqualone use among youngadults generally as well as high school seniors. There
. 172
Is also some convergence between the sexes Instimulant use among college students and young adults,though not yet among high school students. Theconvergence Is again due to a faster drop in use amongmales.
Regarding alcohol use In these age groups, severalfindings are noteworthy. First, during the period ofrecent decline in the use of marijuana and other drugsthere appears not to have been any "displacementeffect" in terms of any increase In alcohol use amongseniors. In fact, the opposite seems to be true. Since1980, the monthly prevalence of alcohol use amongseniors has gradually declined, from 72% In 1980 to66% in 1985. Daily use declined from a peak of 6.9%In 1979 to 4.8% In 1984 (with no further decline in1985); and the prevalence of drinking five or moredrinks in a row during the prior two-week Interval has
fallen from 41% in 1983. to 37% in 1985 (the 4% dropwas statistically significant).
There remains a quite substantial sex differenceamong high school seniors In the prevalence ofoccasions of heavy drinking (28% for females vs. 45%for males In 1985), but this difference has beendiminishing very gradually since the study began adecade ago.
The data from college students, however, show asomewhat different pattern in relation to alcohol use.They show very little drop off in monthly prevalencesince 1980 (about 1.5%), about the same drop in dailyuse as among seniors (from 6.5% in 1980 to 5.0% in1985) and roughly a 1% to 2% increase In theprevalence of occasions of heavy drinking, which Is at45% in 1985appreciably higher than the 37% amonghigh school seniors.
(The 45% figure is also higher than the rate observedamong their age group as a whole (41%), which meansthat college students are above average on thisdimension. Since the college-bound seniors in highschool are consistently less likely to report occasionsof heavy drinking than the noncollege-bound, thisreflects a reversal &king the years post high school.)
A more detailed analysis shows that the divergenttrends between high school students and collegestudents in occasions of heavy drinkbx is due to anincrease (since 1982) among male college studentsspecifically. (The proportion of them reporting fiveor more drinks In a row rose from 52% In 1982 to 57%in 1985.) Female college students, if anything, showedsome decline in such behavior over the same time
2 a'18

Interval (from 37% In 1982 to 34% in 1985). Thus analready large sex difference at the college levelbecame even larger.
College students overall have a daily_ drinking rate(5.0%) which is below average for their age group as awhole (6.0%), suggesting that they are somewhat morelikely to confine their drinking to weekends, on whichoccasions they tend to drink a lot.
In sum, heavy party drinking among males in college Iscommon and Is becoming more common. Among highschool students, however, there Is a decline takingplace in such behavior. Sex differences in occasions ofheavy drinking appear to be diminishing somewhat atthe high school level at the same time that they areenlarging at the college level.
The expansion of the study population to includecollege students has also uncovered some Importantnew results concerning cigarette smoking. Since thestudy began in 1975, cigarettes have comprised theclass of substance most frequently used on a dailybasis among high school seniors (although daily use diddrop considerably between 1977 and 1981). Use hasremained fairly stable overall since 1981, despite theappreciable downturn in most other forms of drug use.(In 1985, daily use actually rose 0.8%, not statisticallysignificant, to 19.5% for seniors.)
Among young adult high school graduates aged 19 to26, the daily rate in 1985 dropped 0.5% (also notstatistically significant) to 25.9%. Among collegestudents it also dropped 0.5% (nonsignificant) to14.3%.
Obviously there Is a very large difference in smokingrates between college students and others their age,just as there is a very large difference in high schoolbetween the college-bound and those not college-bound. A less expected finding, however, is that withinthe college population, there is a substantial sexdifference In smoking rates. Daily smoking, forexample, is 17.596 among females In college vs. 10.0%among males in college. This sex difference is muchlarger than that observed among high school seniors(21% for females vs. 18% for males) or among youngadults generally (27% for females vs. 25% for males).
To summarize, over the last five years there has beenan appreciable decline in the use of a number of theillicit drugs among seniors, and even larger declines intheir use among American college students and youngadults more generally. However, in 1985 thereoccurred a halt in these favorable trends in all three
93 0

populations, as well as an increase in active cocaineuse. There also appears to be some Increase in the useof opiates other than heroin (among seniors only).
While the overall picture has improved considerably inthe past five years, the amount of illicit as well aslicit drug use among America's younger age groups isstill striking when one takes into account the followingfacts:
By their mid-twenties, some 75% to 80% oftoday's young adults have tried an illicit drug,including about 50% to 55% who have triedsome Illicit drug other than (usually In additionto) marijuana. Even for high school seniorsthese proportions still stand at 61% and 40%,respectively.
By age 27, nearly 40% have tried cocaine. Asearly as the senior year of high school, some17% have done so.
One in twenty high school seniors In 1985smokes marijuana daily, and roughly the sameproportion of young adults aged 19 to 27 do, aswell.
About one In twenty seniors drinks alcoholdaily, and some 37% have had five or moredrinks in a row at least once in the prior twoweeks. Even more young adults one to fouryears past high school report such occasionalheavy drinking, and the prevalence among malecollege students reaches 57%.
Some 30% of seniors have smoked cigarettes Inthe month prior to the survey and 20% are dailysmokers. In addition, many of the light smokerswill convert to heavy smoking after high school.For example, 26% of those ages 19 to 27 aredaily smokers, and 21% smoke a half-pack-a-day or more.
Clearly this nation's high school students and otheryoung adults still show a level of involvement withillicit drugs which is greater than can be found In anyother Industrialized nation in the world. Even byhistorical standards in this country, these rates stillremain extremely high.
3120

HIGH SCHOOL STUDENTS
3421

PREVALENCE OF DRUG USEAMONG HIGH SCHOOL STUDENTS
This section summarizes the levels of drug use reported by the highschool class of 1985. Data are included for lifetime use, use during thepast year, use during the past month, and daily use. There is also acomparison of key subgroups in the population (based on sex, collegeplans, region of the country, and population density or urbanicity).
Because we think that the revised questions on stimulant (amphetamine)use, introduced in 1982, give a more accurate picture of the actual useof that controlled substance, all references to stimulant prevalencerates in this section will be based on that revised version (includingreferences to proportions using "anx illicit drug" or "any illicit drugother than marijuana").
It should be noted that all of the prevalence statistics given in thissection are based on participating seniors only. Selected prevalencerate estimates reflecting adjustments for absentees and dropouts maybe found in the Appendix to this report.
Prevalence of Drug Use in 1985: All Seniors
Lifetime, Monthly, and Annual Prevalence
Nearly two-thirds of all seniors (61%) report illicitdrug use (using the revised definition of amphetaa-caat some time in their lives. However, a substantialproportion of them have used only marl:Jana (21% ofthe sample or 34% of all illicit users ).
Four in every ten seniors (40%) report using an illicitdrug other than mariluana at some time.*
Figure 2 gives a ranking of the various drug classes onthe basis of their lifetime prevalence figures. Inaddition, Table 1 provides the 95% confidence intervalaround the lifetime prevalence estimate for each drug.
Mari uana is by far the most widely used illicit drugwith 54% reporting some use in their lifetime, 41%reporting some use in the past year, and 26% reportingsome use in the past month.
*Use of "other illicit d.ugs" includes any use of hallucinogens,cocaine, or heroin or any use of other opiates, stimulants, sedatives, ortrarluilizers which is not under a doctor's orders.
22
33

TABLE 1
Prevalence (Percent Ever Used) of Sixteen Types of Drugs:Observed Estimates and 95% Confidence Limits
Class of 1985(Approx. N = 16000)
Lowerlimit
Observedestimate
Upperlimit
Marijuana/Hashish 52.0 54.2 58.4
Inhalants° 14.3 15.4 16.5Inhalants Arjlustsdb 16.6 17.9 19.3
Amyl & Butyl Nitrites° 8.8 7.9 9.4
Hallucinogens 9.3 10.3 11.3Hallucinogens Adjustedd 112 122 13.3
LSD 8.7 7.5 8.4PCP° SA 4.9 8.1
Cocaine 18.1 17.3 18.8
Heroin 0.9 1.2 1.5
Other opiates° 9.4 10.2 11.1
Stimulants Adjusted°I 24.8 262 27.7
Sedatives° 10.8 11.8 12.9
Barbiturates° 8.3 9.2 10.2Methaqualone° 5.9 8.7 7.8
Tranquilizers° 10.9 11.9 13.0
Alcohol 90.7 92.2 93.5
Cigarettes 87.3 88.8 70.3
°Data based on four questionnaire forms. N is four-fifths of N indicated.bAdjusted fbr underreporting of amyl and butyl nitrites. See text fordetails.
°Data based on a single questionnaire form. N is one-flfth of Nindicated.
dAdjusted for underreporting of PCP. See text for details.°Only drug use which was not under a doctor's orders is included here.f Adjusted for the inappropriate reporting of non-prescription
stimulants.
23
154-831 0 - 86 - 2

The most widely used class of other illicit drugs isstimulants (26% lifetime prevalence, adjusted).* Nextcome inhalants (adjusted) at 18% and cocaine at 17%.These are followed closely by hallucinWnnadjusted)at 12%, sedatives at 12%, and tranquilizers at 12%.**
The inhalant estimates have been adjusted upwardbecause we observed that not all users of one sub-classof inhalantsamyl and butyl nitriten (describedbelow)report themselves as Inhalant WM. Becausewe Included questions specifically about nitrite use forthe first time in one 1979 questionnaire for m, we wereable to discover this problem and make estimates ofthe degree to which inhalant use was being under-reported in the overall estimates. As a result, allprevalence estimates for Inhalants have beenincreased, with the proportional increase beinggreater for the more recent time intervals (I.e., lastmonth, last year) because use of the other commoninhalants, such as glue and aerosols, is more likely tohave been discontinued prior to senior year, makingnitrite use proportionally more important In lateryears.
The specific classes of inhalants known as amyl andbutyl nitrites, which are sold legally and go by thestreet names of "poppers" or "snappers" and such brandnames as Locker Room and Rush, have been tried byone in every twelve seniors (8%).
We also discovered in 1979, by adding questionsspecifically about PCP use, that some users of PCP donot report themselves as users of hallucinogenseventhough PCP is explicitly included as an example In thequestions about hallucinogens. Thus, since 1979 thehallucinogen prevalence and trend estimates also havebeen adjusted upward to correct for this knownunderreporting.***
Lifetime prevalence for the specific hallucinogenicdrug PCP now stands at 5%, somewhat lower than thatof the other most widely used hallucinogen, LSD(lifeane prevalence, 8%).
*See caution at the end of the introductory section concerning theinterpretation of stimulant statistics.
**Only use which was not medically supervised is included In thefigures cited in this volume.
***Because the data to adjust inhalant and hallucinogen use areavailable from only a single questionnaire form In a given year, theoriginal uncorrected variables will be used in most relational analyses.We believe relational analyses will be least affected by theseunderestimates, and that the most serious impact is on prevalenceestimates, which are adjusted appropriately.
24

TABLE 2
Prevalence (Percent Ever Used) and Recency of Use ofSixteen Types of Drugs (1985)
(Approx. N = 16000)
Everused
Pastmonth
Pastyear,notpast
month
NotpastLear
Neverused
Marijuans/Hashish 54.2 25.7 14.9 13.8 45.8
Inhalants° 15.4 2.2 3.5 9.7 84.8Inhalants Ac4justed6 17.9 2.9 4.9 10.7 82.1
Amyl & Butyl Nitritese 7.9 1.8 2.4 3.9 92.1
Hallucinogens 10.3 2.5 3.8 4.0 89.7Hallucinogens Aelliutreld 12.2 4.2 3.5 4.5 87.8
LSD 7.5 1.8 2.8 3.1 92.5PCPC 4.9 1.8 1.3 2.0 95.1
Cocaine 17.3 8.7 8.4 4.2 82.7
Heroin 1.2 0.3 0.3 0.8 98.8
Other opiates° 10.2 2.3 3.8 4.3 89.8
Stimulants Adlustede/ 26.2 6.8 9.0 10.4 73.8
Sedatives° 11.8 2.4 3.4 8.0 88.2
Barbiturates° 9.2 2.0 2.8 4.8 90.8Methaqualone° 8.7 1.0 1.8 3.9 93.3
Tranquilizers° 11.9 2.1 4.0 5.8 88.1
Alcohol 92.2 85.9 19.7 CO 7.8
Cigarettes 88.8 30.1 (38.7)g 31.2
°Data based on fOur questionnaire forms. N is four-fifths of N indicated.bAdiusted for underreporting of amyl and butyl nitrites. See text for details.eData based on a single questionnaire form. N I. one-fifth of N indicated.dAdjusted for underreporting of PCP. See text for details.°Only drug use which was not under a doctor's orders is included here.f Adjusted for the inappropriate reporting of non-prescription stimulants.gThe combined total for the two columns I. shown because the question askeddid not discriminate between the two answer categories.
25

100
90
80
70
60
50
40
30
20
10
0
FIGURE 2
Prevalence and Recency of UseEleven Types of Drugs, Class of 1985
KEY
Used Drug, but Not
60 0Ott
w cin Past Year
Used in Past YearNot in Past Month
Used in Past Month(30 Day Prevalence)
JO% 12%) 12%t 4.1(X21
Mit4.2% E Li
2' 0.411b Vgts0 (..)a s: ztu ° Z.St. grrw
-V0
26°/
8°4171% )x4,4
54%i
69%
92%1
NOTES: The bracket near the top of a bar indicates the lower and upper limits ofthe 95% confidence interval.
26
3

Opiates other than heroin have been used by about onein ten seniors (10%).
Only 1.2% of the sample admitted to ever using anyheroin, the most infrequently used drug. But given thehighly illicit nature of this drug, we deem It the mostlikely to be underreported.
Within the general class "sedatives," the specific drugmethaqualone has been used by nearly as many seniors(7% lifetime prevalence) as the other, much broadersubclass of sedatives, barbiturates (9%).
The illicit drug classes rem in roughly the sameorder whether ranked by lifetime, annual, or monthlyprevalence, as the data in Figure 2 illustrate. The onlyImportant change in ranking occurs for Inhalants,because use of certain of them, like glues and aerosols,tends to be discontinued at a relatively early age.
Use of either of the two major licit drugs, alcohol andcigarettes, remains more widespread than use of anyof the Illicit drugs. Nearly all students have triedalcohol (92%) and the great majority (66%) have used
ir7Tist the past month.
Some 69% report having tried cigarettes at some time,and 30% smoked at least some in the past month.
Daily Prevalence
Frequent use of these drugs is of greatest concernfrom a health and safety standpoint. Tables 6 (page37) and 10 (page 45) and Figure 3 show the prevalenceof daily or near-daily use of the various classes ofdrugs. For all drugs except cigarettes, respondents areconsidered daily users if they indicate that they hadused the drug on twenty or more occasions In thepreceding 30 days. In the case of cigarettes,respondents explicitly state the use of one or morecigarettes per day.
The displays show that cigarettes are used daily by
more of the respondents1M(7Tr-lan any of the otherdrug classes. In fact, 12.5% say they smoke half-a-pack or more per day.
Another Important fact is that marijuana is still usedon a daily or near-daily basis by a substantial fractionof the age group (4.9%), or zbout one In every twentyseniors. At present virtual.y the same proportion(5.0%) drink alcohol that often.
Less than 1% of the respondents report daily use ofany one of the illicit drugs other than marijuana. Still,0.4% report unsupervised daily use of .st_cle
27
3

PE
RC
EN
TA
GE
US
ING
DA
ILY
(A8
-a.
too
0(A
co 0
P o P o P o o co g P 4. P 4A to P o
inhalants (adjusted) and amphetamines (revised versionWiraccludes the non-prescription stimulants). Thenext highest daily-use figure is for hallucinogens(adjusted), PCP specifically, and nitritesall at 0.3%.While veryrow, these figures are7aTiconsequential,given that 1% of each high school class represents over30,000 individuals.
Sedatives and opiates other than heroin are used dailyWc7iryWbout .1%.
While daily alcohol use stands at 5.0% for this agegroup, a substantially greater proportion reportoccasional heavy drinking. In fact, 37% state that onat least one occasion during the prior two-weekinterval they had five or more drinks in a row.
Noncontinuation Rates
An indication of the extent to which people who try a drug donot continue to use it can be derived from calculating thepercent, based on those who ever used a drug (once or more),who did not use it the 12 months preceding the survey.* These"noncontinuation rates" are provided for all drug classes inFigure 4 for the Class of 1985. We use the word"noncontinuation" rather than "discontinuation," since thelatter might imply discontinuing an established pattern of use,and our current operational definition includes experimentalusers as well as established users.
It may be seen in Figure 4 that noncontinuation ratesvary widely among the different drugs.
The highest noncontinuation rate by senior year (63%)is found for inhalants most of which tend to be used atyounger ages. l'he nitrites specifically, however, areused somewhat later as the 49% noncontinuation rateillustrates.
Cocaine on the other hand, partly because of itsrelatively late age of onset, has the lowestnoncontinuation rate in senior year of any of the illicitdrugs (24%).
Mari'uana also has a low noncontinuation rate (25%);but this occurs not because onset comes later than for
Frequent use of these drugs is of greatest concernfrom a health and safety standpoint. Tables 6 and 10
*This operationalization of noncontinuation has an inherentproblem in that users of a given drug who initiate use in senior year bydefinition cannot be noncontinuers. Thus, the definition tends tounderstate the noncontinuation rate, particularly for drugs that tenu tobe initiated late in high school rather than in earlier years.
29

FIGURE 4
Noncontinuation Rats Portent of Belem Who Ueed DrugOnce or More In Lifetime but Did Not Use In Past Year
10-
60
W 5000
40
.
'Percent of regular smokers (ever) who did not smoke at all in the past 30 days.
41

most drugs (the opposite is true), but simply because arelatively high proportion of users continue to use atsome level over an extended period.
Methaqualone currently shows a relatively highnoncontinuation rate (58%), which accounts in part forthe recent dramatic decline in overall use.
The remaining illicit drugs have noncontinuation ratesranging from 39% to 51%.
Noncontinuation rates for the two licit drugs areextremely low. Alcohol which has been tried bynearly all seniors 93% , is used in senior year bynearly all of those who have ever tried it (93% of the93%).
For cigarettes the definition of continuation is a littledifferent; it is the percent of those who say they eversmoked "regularly" who also reported smoking at leastone cigarette during the past month. Hardly any ofthese regular smokers (only 16% of them) have ceasedactive use. (A comparable definition of noncontinua-tion to that used for other drugs is not possible, sincecigarette use in the past year is not asked ofrespondents.)
Prevalence Comparisons for Important Subgroups
Sex Differences
In general, higher proportions of males than femalesare involved in Illicit drug use, especially heavy druguse; however, this picture is a compiicated une (seeTables 3 through 6).
Overall the proportion using marijuana is only slightlyhigher among males, but daily use of marijuana is morethan twice as frequent among males (6.9% vs. 2.8%for females).
Males also have considerably higher prevalence rateson most other illicit drugs. The annual prevalence(Table 4) for inhalants (unadjusted and adjusted),hallucinogens (unadjusted and adjusted), heroin, metha-qualone, and the specific drugs EcE, la), and thenitrites tend to be one and one-half to two and one-half times as high among males as among females.Males also report somewhat higher annual rates of usethan females for cocaine, opiates other than heroin,tranquilizers, and barbiturates. Further, malesaccoLnt for an even greater share of the frequent orheavy users of these various classes of drugs.
31

TABLE 3
Lifetime Prevalence of Use of Sixteen Types of Drugsby Subgroups, Class of 1985
(Entries are pertatepoi
4
1/*41
414
31
4 Itd*
MI &Mors 54.1 15,4 7.9 10,5 7.5 4.9 17.3 1,2 10,2 28,2 11.6 9.1 6.7 11,9 92,2 88,88ex;
Mole 581 18.5 11.1 12,4 9.4 81 ILI 1.4 11.8 241 12.8 9.9 7,1 117 92.6 67.4Fork 6145 11,4 4,9 8,0 5,8 3.1 14,8 0.8 9.1 Ai 11.0 8,3 8,0 11,7 91,9 89.7
Con* Plans;
Nom or ander 4 yrs 59.1 18,5 VI 12,5 9,7 8,8 201 1,1 11,5 31,9 15,2 1149 8,7 13.4 93,0 15.9Complete 4 ps 501 14,5 1,9 8.0 U 8.4 14,8 OS 9.1 22.8 9.6 7.4 5,3 10.8 91,9 63.1
Notion;
Northeast 12.2 ILI 10.0 15.7 9,4 7.3 25.9 1.1 12.0 27.6 13,4 10.5 7.9 14,0 95.0 71.4North Central 53,8 14,8 1,5 10,2 8.5 LI 11.5 12 10,4 27,7 12,0 9,6 U 11.5 93.5 71,6South 44,6 18.0 1.0 5.8 4.6 3.4 ILI 12 7,3 22,1 11,1 6.0 6,7 11.1 89,7 65,1West 90.4 17.0 9,1 10.9 8.2 7.1 25,4 0,8 12.7 ILl 10.9 9.1 4,9 11,2 901 87,4
Population Deity;
Lsrp 8M8A 59,2 14,9 8,8 13.9 8.1 81 24,1 1,4 9.8 2548 12,1 91 7.0 11,9 93.5 70,2Other 8148A 54.8 15.6 8.7 9.6 8.0 4,3 18.2 1,2 11.0 26,2 12,0 8.9 1,1 117 91.4 67.8NARA 48,3 15.6 LI 8.2 8.4 41 ILI 1.0 9.5 26.8 11.1 1.3 51 12,1 91,0 88,9
°Unstated for known enderreporthl lite* drugs. flee Oat for details,bAdlatoifor the inappropriato ',pork of non.practiption obviate,

Cray in the case of stimulants do the annualprevalence rates (as well as frequent usage patterns)for females exceed those for malesand then only bysmall amounts. Annual prevalence for stimulants(adjusted) is 16.4% for females vs. 14.9% for males.This reversal in sex differences is due to the fact thatsubstantially more females than males use stimulantsfor purposes of weight lossan instrumental, asopposed to social recreational, use of the drug.
Despite the fact that all but one of the individualclasses of illicit drugs are used more by males than byfemales, the proportions of both sexes who reportusing some illicit drug other than marijuana during thelast year are not substantially different (28% for malesvs. 26% for females; see Figure 12). Even ifamphetamine use Is excluded from the comparisonsaltogether, fairly comparable proportions of both sexes(23% for males vs. 19% for females) report using someillicit drug other than marijuana during the year. Ifone thinks of going beyond marijuana as an importantthreshold point in the sequence of illicit drug use, thennearly equal proportions of both sexes were willing tocross that threshold at least once during the year.However, on the average the female "users" takefewer types of drugs and use them with less frequencythan their male counterparts.
Frequent use of alcohol tends to be disproportionatelyconcentrated among males. Daily use, for example, isreported by 7.0% of the males vs. only 3.0% of thefemales. Also, males are more likely than females todrink large quantities of alcohol in a single sitting (1.e.,45% of males report taking five or more drinks in arow in the prior two weeks, vs. 28% of females).
Finally, for cigarettes, there is not at present anappreciable sex difference. For example, at the levelof smoking a half-a-pack or more daily: 12.0% of thefemales smoke this heavily versus 12.3% of the males.There is a larger difference in proportions reportingarii use during the past month; 31% of the femalesversus 28% of the males.
Differences Related to College Plans
Overall, seniors who are expecting to complete fouryears of college (referred to here as the "college-bound") have lower rates of illicit drug use than thosenot expecting to do so (see Tables 3 through 6 andFigure 13).
33

TABLE 4
Annual Prevalence ofUse of Sixteen Tyva of Drugs
by Subgroups, Class of 1985
(Cabin art pronto)
(tot /4' itf.fs 4
1 4i
All tioniors
let
401 5,7 4.0 13 4,4 31 131 0.6 5,9 151 5,8 41 3.8 11 851 -
Male 431 81 18 8.1 5,9 4,1 14,8 0.8 11 14,9 8,5 5,1 3.5 14 111 -Mak 87,8 4.5 2.1 4.4 2.5 1.7 111 0.3 5,1 114 4.8 81 1,1 5.7 510 -Coll* Pim
None or untie 4 yro 440 5.8 41 7,7 5.1 8,7 14,7 0.7 U 19,7 7.5 13 3,8 81 811 -Complete 4 yrs VS 5,7 34 10 8,4 12 11.4 0,5 5,4 113 4.7 8.5 2,1 51 85,5 -Retbn:
Northeast 41.1 30 5.5 9.9 5.4 5.0 20,1 01 7.1 111 U 5,1 1,5 7.1 90.8 -North Control 40,8 5.8 4.3 U 13 1,7 81 0.8 8,1 17.8 U 41 18 5.0 817Booth 31.0 41 3.5 343 21 1,4 7,5 01 1.1 11.1 5.5 4.1 31 5,1 81.3 -Wog 481 5,4 4,2 11 4.5 41 111,7 0,1 7,1 17,3 51 4,1 1.9 5.8 84.5 -PopintIon Mar
Law 8M8A 44.4 6,1 38 5.1 4.1 4.0 15,8 0,7 10 15.0 15 4,4 11 51 17.0 -°this 131% 40.1 5.9 8,8 6,1 4.5 3.5 13,4 02 8.4 15.7 17 4.2 11 10 111 -Non4M11A 111 5,4 4.1 5.0 4.1 21 93 0.4 51 116 11 5.4 2.1 15 511 -tnotljostod for known sierropwthl of sirloin drag So tat tot &talk,bAdjostsd tor thi inappropriate mothgof noninualption ellmolanto.
eAnntle psalms Is not milohlo.
4J

Annual marl uana use is reported by 38% of thecollege-bound vs. 44% of the noncollege-bound.
There Is a substantial difference in the proportion ofthese two groups using any illicit drui(s) other thanmarl uana (adjusted). In 1985, 24% of the college-bound reported any such behavior In the prior year vs.32% of the noncollege-bound. (If amphetamine use isexcluded from these "other illicit drugs," the figuresare 19% vs. 24%, respectively.)
For most of the specific illicit drugs other thanmarijuana, annual prevalence is highersometimessubstantially hIgheramong the noncollege-bound, asTable 4 illustrates. In fact, current (30-day)prevalence is roughly one and one-half to two times ashigh among the noncollege-bound as among thecollege-bound for jci r_logem (LSD in particular),stimulants (revised), sedatives (especiallymethaqualone), and cocaine.
Frequent use of many of these illicit drugs shows evenlarger contrasts related to college plans (see Table 6).Daily miluana use, for example, is more than twiceas high among those not planning four years of college(6.7%) as among the college-bound (3.3%).
Frequent alcohol use is also more prevalent among thenoncollege-bound. For example, drinking on a dailybasis Is reported by 6.4% of the noncollege-bound vs.only 4.0% of the college-bound. Instances of heavydrinking are also related to college plans: 33% of thecollege-bound report having five or more drinks In arow at least once during the preceding two weeks, vs.42% of the noncollege-bound; drinking that heavily onsix or more occasions in the last two weeks Is reportedby 3.9% of the college-bound vs. 7.1% of thenoncollege-bound. On the other hand, there arepractically no differences between these groups inlifetime, annual, or monthly prevalence of alcohol use.
By far the largest difference in substance use betweenthe college and noncollege-bound Involves cigarettesmoking. There is a dramatic difference here, withonly 6.5% of the college-bound smoking a half-a-packor more daily compared with 20.7% of the noncollege-bound.
35

TABLE 5
Thirty.Day Prevalence of Use of Sixteen Types of Dropby Subgroup', Clio of 1985
(gnt* ire wankel)
All Seniors 15,7 LI LI U LB IA 53 0,8 31 0,8 1,4 2,0 1.0 LI 851 30,1
8w,Mak 11.1 2.8 11 5.4 1,4 3,4 7,7 0.3 3,8 8.5 3.0 2,4 LI 1.2 82.8 28,2Female 23.4 1,7 OA 1,4 0.8 0,7 51 0,1 3,0 7.1 1,8 LB 0.7 11 RI $1.4
CONII Nor,None or undu 4 yri 22.0 2.8 13 3.0 2.0 1.7 71 01 2,4 0.1 LI 23 1,4 2.8 871 40,5Completo 4 In 23,7 341 11 1,0 Li 1,4 5.5 01 3.8 5,3 1.9 LO 0,1 L8 841 222
Rigten
32.0 LI 2,2 4.3 LI 2.1 12,0 0.1 2.1 7.1 2.0 IA 21 72.3 $4.2North eintral 311 3.3 1,7 2.8 2,3 02 8.9 0.8 1,8 7.7 2,8 2.2 1.1 2.1 88,8 34.1eolith 110 LI LI U 01 0,1 2.1 0.3 1,0 2.4 II LI 01 LI 80.0 251Vol 22.7 1,1 1,5 11 11 2.5 93 0.1 2.0 7.1 1.7 13 0.4 LI 081Poprlition Dotilly:
Largo NSA 215 Le LI 2.8 1.5 2,1 10.3 0.8 2,2 8,5 Le 2.1 13 2,0 87.4 ILIOther 8118A 251 1.8 1,3 2.3 L7 1.4 8.1 0,2 31 8,8 LI 1.8 0.8 1.9 85.1 215Non1118A 11.0 2.5 1,7 LI 1,7 13 43 01 3,1 7.1 3.4 2.2 02 2.3 851 30.8
IlUnadjuted for horn enderropertini of Win drip. Is. text for detaile.
Adjuted for the komplett roportieg of nonfoription etimelente.
4H(
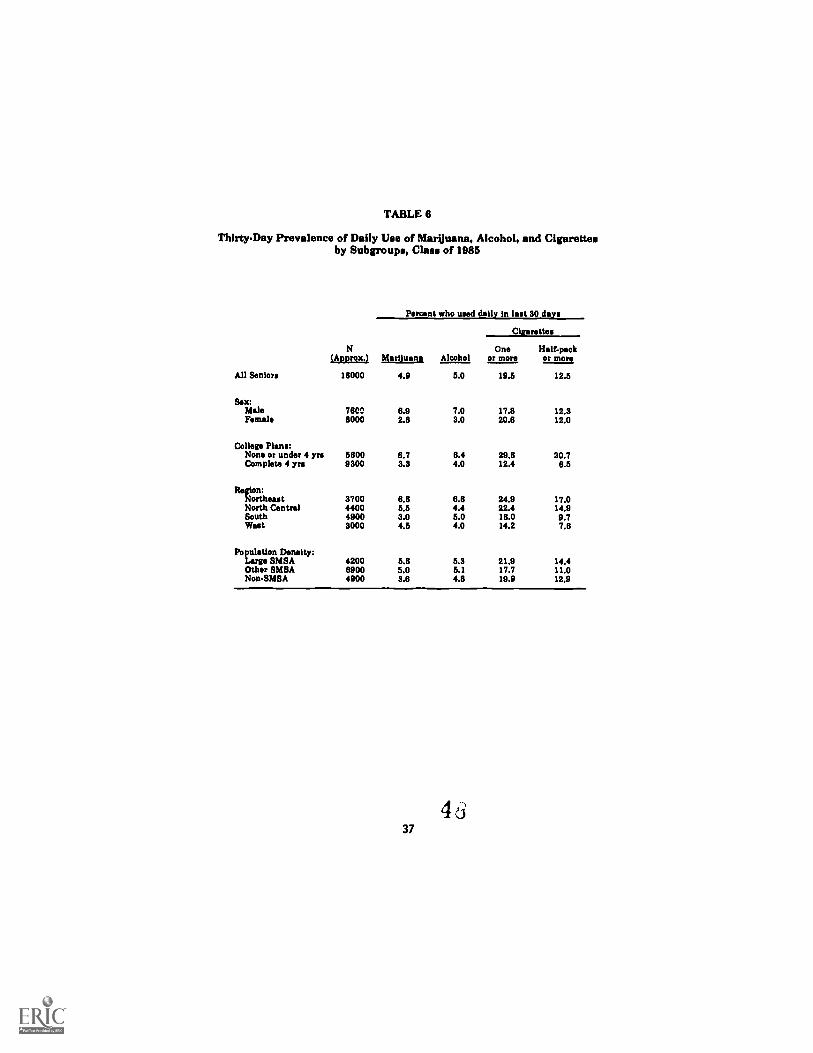
TABLE
Thirty.Day Prevalence of Daily Use of Marijuana, Alcohol, and Cigarettesby Subgroups, Class of 1985
aps.r.22. 1cMa
Percent who used daily in last 30 days
uana Alcohol
Cigarettes
Oneor more
Halt-packor more
All Seniors 18000 4.9 5.0 19.5 12.5
Sex:Male 7805 8.9 7.0 17.8 12.3Female 8000 2.8 3.0 20.8 12.0
College Plans:None or under 4 yrs 5800 8.7 8.4 29.8 20.7Complete 4 yrs 9300 3.3 4.0 12.4 6.5
Region:Northeast 3700 8.8 8.8 24.9 17.0North Central 4400 5.5 4.4 22.4 14.9South 4900 3.0 5.0 18.0 9.7West 3000 4.5 4.0 14.2 7.8
Population Density:Large SMSA 4200 5.8 5.3 21.9 14.4Other SMSA 8900 5.0 5.1 17.7 11.0Non-SMSA 4900 3.8 4.8 19.9 12.9
437

Regional Differences
There are now some fair-sized regional differences inrates of illicit drug use among high school seniors.(See Figure 5 for a regional division map of the statesincluded in the four regions of the country.) Thehighest (adjusted) rates are in the Northeast and West,where 53% say they have used a drug illicitly in thepast year, followed by the North Central with 46%,and the South with only 37% having used any illicitdrug (see Figure 15).
There are comparable regional variations in terms ofthe percent using some illicit drug other thanmari uana (adjusted) In the past year: 33% in theNortheast and West, 26% in the North Central, and21% in the South.
The Northeast and West rank relatively high in the useof some illicit drug other than ma-iivana, due in partto their high level of cocaine use. In fact, the regionaldifferences in cocaine have been the largest observed.For example, annual prevalence is nearly three timesas high in the Northeast (20.8%) and West (19.7%) as inthe South (7.5%). The North Central also has arelatively low prevalence rate (8.2%).
Other specific illicit substances vary in the extent towhich they show regional variation, as Table 4illustrates for the annual prevalence measure.
Several drugs are highest in the Northeast and lowestin the South with the West and North Central inbetween: these include inhalants (unadjusted andadjusted), the nitrites sj:17.71a y, hallucino ens(unadjusted and artrsi;DI , PCP specifically, and otheropiates. Interestingly, despite its quite high rate ofuse of some drugs, it is the West that shows the lowestlevels of use for barbiturates, rnethaqualone,tranquilizers, and heroiri-(all c;i,t rai nervous systemdepressants). For Z.-athese the Northeast shows thehighest rate of use. Stimulants show still a thirdpattern, with the highest use in t e North Central andWest and lowest in the South.
Alcohol usein particular, the rate of occasionalEaTidrinkingtends to be somewhat lower in theSouth and West than it is in the Northeast and NorthCentral.
A similar though larger regional difference occurs forregular cigarette smoking. Smoking half-a-pack ormore a day occurs most often in the Northeast (17% ofseniors) and the North Central (15%) with the South(10%) somewhat lower, and the West (8%) lower still.
38
4

FIGURE 5
States Included in the Four Regions of the Country
eeeeeeee
4/e
ti.".
--- CENTRAL t ) ..... -EAST
NORTHj...v./k/
(. WEST I\ ......
ISOUTH4 I "
.8
k.\
These are the four major regions of the country as defined bythe U.S. Bureau of the Census.

Differences Related to Population Density
Three levels of population density (or urbanicity) havebeen distinguished for analytical purposes: (1) LargeSMSA's, which are the twelve largest Standard Metro-politan Statistical Areas in the 1980 Census; (2) OtherSMSA's, which are the remaining Standard Metropoli-tan Statistical Areas; and (3) Non-SMSA's, which aresampling areas not designated as metropolitan.
Overall illicit Jrug use is highest in the largestmetropolitan areas (50% annual prevalence, adjusted),slightly lower in the other metropolitan areas (47%),and lowest in the nonmetropolitan areas (43%) (seeFigure 16).
The same ranking occurs for the use of illicit drugsother than mariluana: 30% annual prevalence(adjusted) in the largest cities, 27% in the other cities,and 26% in the nonmetropolitan areas. (With amphet-amine use excluded, these numbers dropto 25%,21%, and 18%, respectivelybut still retain the samerank order.)
For specific drugs, one of the largest absolutedifferences associated with urbanicity occurs formarlluant, which has an annual prevalence of 44% inthe large cities but only 37% in the nonmetropolitanareas (Table 4).
However, by far the greatest proportional difference,as well as the greatest absolute difference, occurs forcocaine, where there is more than twice as much usein the large metropolitan areas (19%) as in thenonmetropolitan areas (3%).
There has been some tendency for a few other drugs tobe associated positively with urbanicity; however, therelationships have not been strong nor alwaysconsistent from one year to another.
40
RECENT TRENDS IN DRUG USEAMONG HIGH SCHOOL STUDENTS
This section summarizes trends in drug use, comparing the elevengraduating classes of 1975 through 1985. As in the previous section, theoutcomes discussed include measures of lifetime use, use during thepast year, use during the past month, and daily use. Also, trends arecompared among the key subgroups.
Trends in Prevalence 1975-1985: All Seniors
The years 1978 and 1979 marked the crest of a longand dramatic rise in marijuana use among Americanhigh school students. As Tables 7 through 10 illus-trate, annual and 30-day prevalence of marijuana uselevelled between 1978 and 1979, following a steadyrise in the preceding years. In 1980 both statisticsdropped for the first time and continued to declinethrough 1984. However, in 1985 there was a slightincrease in annual and 30-day prevalence, althoughthey are still 10% to 11% below their all time highs.Lifetime prevalence, which had remained unchanged in1980, finally began to drop in 1981, though moregradually. Even today it is only 6% below its all timehigh. As we discuss later, there have been somesignificant changes in the attitudes and beliefs thatyoung people hold in relation to marijuana.
Of greater importance is the even sharper downwardtrend which has been continuing to occur for dailymarruana use. Between 1975 and 1978 there was analmost two-fold increase in daily use. The proportionreporting daily use in the class of 1975 (6.0%) came asa surprise to many; and then that proportion roserapidly, so that by 1978 one in every nine high schoolseniors (10.7%) indicated that he or she used the drugon a daily or nearly daily basis (defined as use on 20 ormore occasions in the last 30 days). In 1979 wereported that this rapid and troublesome increase hadcome to a halt, with a 0.4% drop occurring that year.By 1985 the daily usage rate has dropped to 4.9%about one in every twenty seniorsactually below the6% level we first observed in 1975. As later sectionsof this report document, much of this reversal appearsto be due to a continuing increase in concerns aboutpossible adverse effects from regular use, and agrowing perception that peers would disapprove ofregular marijuana use. It is worth noting, however,that the decline stopped in 1985, with a drop of only0.1% from the 1984 figure of 5.0%.
41
54

TABLE 7Trends in Lifetime Prevalence of Sixteen Types of Drugs
Percent ever used
Class
of
1976
Class Cleo Clueof of of
1976 1977 1978
Class Clan Class Clotof of of of
1979 1980 1981 1982
Clan Clefs Class
of of of '84-151983 1984 1985 ohmApprox. N 'I (9400) (15400) (17100) (17800) (15500) (15900) (17500) (17700) (15300) (15000) (10000)MerQuinilliashieh 47.3 52.8 58,4 591 60.4 00.3 59,5 58,7 57.0 542 54,2 -0,7Inhalants° NA 10.3 11.1 12,0 12,7 11.9 12.3 122 13.6 14.4 15,4 +1,0
b
Inhalants Adjusted NA NA NA NA 18,7 17,6 17.4 18,0 18,8 19,0 17.9 -1.1Amyl & Butyl Nitrittsc NA NA NA NA 11,1 11,1 10.1 9,8 8.4 8.1 7.9 -0,2Hallucinogens16.3 15.1 132 14.3 14,1 132 13.3 12.5 11.9 10,7 10.3 -0,4
Hallucinogens Adjusted' NA NA NA NA 182 15.7 15,7 15,0 14.7 13,3 12.2 -1,1LSD,11,3 11.0 9.8 9.7 9,5 9.3 9.8 9.6 8,9 8.0 7.5 -0,5
PCP' NA NA NA NA 12.8 9,8 7,8 8,0 5.8 5,0 4.9 -0.1Cocsine9,0 9,7 10.8 12,9 15.4 15.7 16,5 16.0 16.2 16.1 17,3 +1.2Heroin22 1,8 1,8 1,6 LI 1,1 1,1 1.2 1.2 1,3 1,2 -0,1Other opiates°9.0 92 10,3 9,9 10,1 9.8 10,1 9.6 9,4 9.7 10,2 +0.5Stimulate° t 22,3 22.6 23.0 22,9 24.2 26.4 32,2 352 35,4 NA NA NA
Stimulants Adjuster NA NA NA NA NA NA NA 27.9 26.9 27.9 28,2 -1,7Sedatives° 18.2 17,7 17,4 18.0 14.6 14,9 18,0 15.2 14.4 13.3 11.8 -1,51Barbiturates° 16.9 16.2 152 13.7 11.8 11.0 11,3 10,3 9,9 9.9 9.2 -0,7Methaqualone° 8,1 7.8 8,5 7.9 8.3 9.5 10.6 10.7 10.1 8,3 6.7 - 1.6istrinquilisers° 17,0 16.8 18.0 17.0 16.3 15,2 14,7 14.0 13.3 12.4 11,9 -0,5Alcohol
OM 91.9 92,5 93.1 932 93.2 9246 92,8 922 92.8 92.2 -0,4Cigarettes73,8 75.4 75.7 75.3 74.0 71,0 71.0 70.1 70,6 89.7 68,8 -0,9
tOTES., Level of *Macaws of difference between the two most recent times: s .051 le '.01 su ti.001. NA indicates data not available.Data bated
on four questionnsire birms. N 1, four.filliu of N indicated,bAdiusted for underreporting of amyl and butyl nitrites, See text for detalls,!pate hated on a single questionneire form.
N is one4fth of N indicated.Adjuated fOr undeneporting of 1)CP. See text for detells.
;Only drug use which was not under a doctor's orders is included here.Adjulted for the inappropriate reporting ofnon.prekription stimulate.

TABLE 8
Trends In Annual Provolone of Sixteen Types of Drugs
Percent who mid in lut twelve month.
Clue Clare Clue Clue Clue Clue Claes Clue Claes Claus Class
of of of of of of of of of of of '84-'851975 1078 1877 1978 1870 1980 1981 1882 1983 1984 1085 clime
Approx. N a (9400) (15400) (17100) (17800) (15500) (15900) (17500) (17700) (18300) (15900) (18000)
Marijuanduhleh 401 44.5 471 50,2 50,8 488 4641 44.3 42.3 40.0 40,6 +046
Inhalente° 1, NA 3,0 3.7 4.1 5,4 41 441 4,5 4,3 5,1 5.7 +0,6inhalinte Adjusted" NA NA NA NA 8,2 71 8,0 6.8 6,7 7.0 7,2 -0.7
Amyl i Butyl Nitritetc NA NA NA NA 6.5 5.7 3,7 3,8 3.6 4.0 4.0 0.0
Hallucinogen A 11,2 9.4 8,8 9,6 9,9 9.3 9.0 841 7.3 6.5 6,3 -0,2Hallucinogens Adjulted NA NA NA NA 12,8 10,6 10.1 9,3 9,3 7.9 7,1 -0,2
LSD 7,2 8,4 5,5 8,3 8.6 61 6.5 6.1 5.4 4.7 4,4 -0.3PCP° NA NA NA NA 7.0 4.4 3,2 12 2,6 2.3 2,8 +0.6
Cocaine 51 6,0 7.2 9.0 12.0 12.3 12.4 11,5 11,4 11,6 13.1 +1,5e
Aw Heroin 1,0 0.8 0.8 0,8 0.5 0.5 0.5 0.6 0.6 01 0.6 +0.1
Other opiate? 5.7 5.7 8.4 8.0 8.2 6.3 5.9 5.3 5.1 5,2 5,9 +0.7s
Stimulants° f 18.2 15,8 16,3 17,1 18.3 20,8 26,0 26,1 24.6 NA NA NA
Stimulant; AOlter NA NA NA NA NA NA NA 20,3 17,9 17.7 15,8 -11u
Sedatives° 11.7 10.7 10.8 9.9 9.9 10.3 10.5 9,1 7,9 6.6 5,8 -0.8
BarbIturatee 10.7 91 9,3 8,1 7,5 6,8 81 5,5 5,2 41 4.6 -0.3Methaqualone' 5.1 4.7 5,2 4,9 5.9 7,2 7.6 6.8 5.4 3.8 2,0 -1,0es
tenquIllserie 10.6 10.3 10.8 9.9 9.8 8.7 8.0 7.0 6.9 6.1 6.1 0.0
Muhl 84.8 85.7 87,0 87.7 88.1 87.9 87.0 86,8 87,8 86.0 85.6 -0.4
Clgsrettes NA NA NA NA NA NA NA NA NA NA NA NA
liOTES: Level of eignIticance of difference between the two most recent clause.; s 11,051 ie :1,01, in 0,001. NA indicates dete not available,
bData hued on four quutionnaire forms. N Is four.fifthr of N Indicated.
Adjusted for underreporting el amyl and butyl nitrites. See text for details.
°pita bleed on a eingle queltionnaire fern N I. onallith of N Indicated.
"Adjusted for underreporting of PCP. Sie text ter details,;Only
drug use which wu not under a doctor'r order, II included here.
Adjuted for the inappropriate reporting of nompreufiption stimulants,
5 Li

TABLE 9
Trends In Thirty.Day Prevalence of Sixteen Types of Drup
Pircenvho tired in lilt thirty day,
Om
Clioof
1975
Clio,
of
1976
Clioof
1977
Clioof
1978
Cleo,
of
1979
Cluiof
1080
elmof
1981
Clan
of
1082
Clio,
of
1083
Class
of
1084
Cla Is
of '84-'851985
Appro., N (9400) (15400) (17100) (17100) (15500) (15900) (17500) (17700) (16300) (15900) (16000)Marljuandluhish 27,1 32.2 35.4 37,1 30.5 33,7 31,6 28,5 17,0 25,2 25,7 4 0.5Inhalant,' k NA 0.9 1.3 1.5 1,7 1.4 1,5 1,5 1,7 1.0 2,2 40,3Inhilant, Adjusted" NA NA NA NA 4.1 2,7 2,3 2.5 2,7 2,7 2,9 + 0,2
Amyl ft Butyl Nittiteic NA NA NA NA 2.4 1.8 1.4 LI 1,4 1.4 140 0,2Helluclnogens 4.7 3.4 4.1 3,9 4,0 3,7 3,7 3.4 2,8 2,6 2.5 1.1Hallucinogens Adjustor NA NA NA NA 5.5 4,4 4,4 4.3 3.8 3.8 4,2 40
1,BD, 2.3 1.9 2.1 2.1 2.4 2.3 2.5 2,4 1,9 1,5 1,6 +0,1PCP" NA NA NA NA 2,4 1.4 1,4 1.0 1,3 1.0 L8 +OhCocalne 1,9 2,0 2,0 3.9 5,7 5,2 5,8 5.0 4,9 5,8 0,7 +0,9,Heroin 0,4 0,2 0.3 0.3 0,2 0,2 0,2 0.2 0,1 0,3 0,3 10Other opiate,' 2,1 2,0 2,8 2.1 2,4 1.4 2.1 1.8 1,11 1.8 2,3 40,5,Stimulentel f 8.5 7.7 8,8 8.7 9,9 12.1 15,8 13.7 12.4 NA NAStimulant. Adjustmr NA NA NA NA NA NA NA 10.7 8,9 8,3 0.6 -1.58,Sedetivee 5,4 4,5 5,1 4.2 4,4 4.6 4.6 3,4 3.0 2,3 2.4 +0,1
Barbiturates' 4,7 3.9 4.3 3.2 3,2 2.9 2.6 2,0 11 1,7 2,0 +0,3Methequalone' 2.1 1,8 2.3 1.9 2,3 3,3 3.1 2,4 1,8 1,1 1.0 -0.1Tranquillarel 4,1 4.0 4,5 9.4 3.7 3,1 2.7 2,4 2.5 2,1 2.1 0.0Alcohol 88.2 66.3 71,2 72.1 71,8 72,0 70.7 69.7 69,4 67,2 05.0 -1.3Cigarette, 36,7 38.8 38,4 36.7 34.4 30.5 29.4 30.0 30.3 29.3 30.1 +0,8
110TE8 s, loll of significanca of difference between the two most recent clung I 11,05, us 'Al, III 2,001. NA indicate, data not available.bOala based on hut quutionnairt forms. N I. fourAfthi of N indicated.Adjusted for undenoporting of amyl and butyl MOM, See text for detells,
tpata based on a single questionnaire form. N ir onaillth of N indicated,
mAdjuited for underreporting of PCP. See text for details,
'only drug use which not under a doctor's mden is Included here.fAdjustod for the inappropriate nporling of non.prescription stimulants.
5 s)
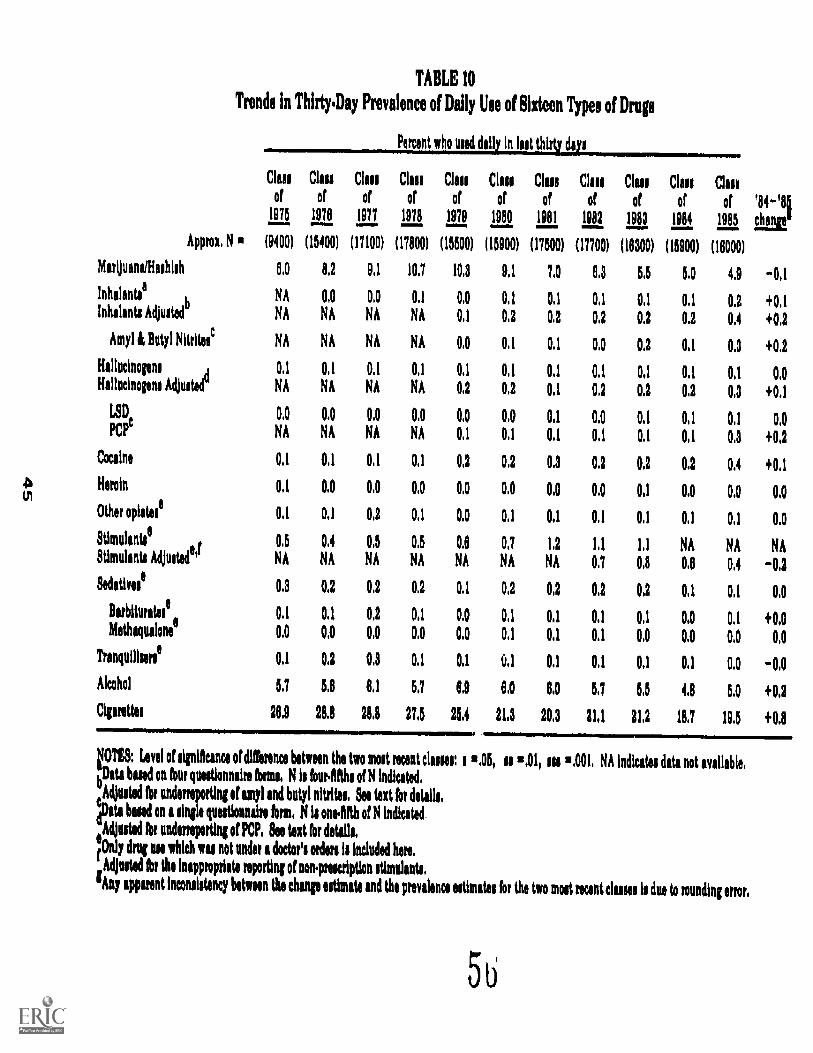
th
TABLE 10
Trials in Thirty.Day Prevalence of Daily Use of Sixteen Types of Drugs
Percent mut thir days
'84-'81
Clue
of
Class
of
Class
of
Class
of
Clau
of
Class
of
Claes
of
Clue
of
Class
of
Class
of
Class
of1075 1978 1977 1978 1979 1980 1981 1982 1983 1984 1985 kit
Approx. N (9400) (15400) (17100) (17800) (15500) (15900) (17500) (17700) (18300) (15900) (18000)
MerljuanelliashIsh 8.0 8,2 9.1 10.7 10.3 9,1 7.0 8.3 5.5 5.0 4.9 -0,1
Inhelantei NA 0,0 0.0 0.1 0.0 0.1 0,1 0,1 0.1 0.1 0,2 +0,1Inhalants Adjusted" NA NA NA NA 0.1 0,2 0.2 0,2 0.2 0.2 0.4 +0.2
Amyl Butyl N1tritesc NA NA NA NA 0.0 0.1 0.1 0.0 0.2 0,1 0.3 +0,2
Hellutinopos A 0.1 0.1 0.1 0.1 0,1 0.1 0,1 0.1 041 0.1 0,1 0.0Hallucinogens Adjusted' NA NA NA NA 0.2 0,2 0.1 0.2 01 0,2 0.3 +0.1
LSD 0.0 0.0 0.0 0.0 0.0 0.0 0.1 0.0 0,1 0.1 0.1 0.0PCP° NA NA NA NA 0.1 0,1 0.1 0.1 0.1 0.1 0.3 +0,2
Cocaine 0.1 0,1 0.1 03 0.2 0.2 0.3 0.2 0,2 0.2 0.4 +041
Heroin 0.1 0.0 0.0 0.0 0.0 0.0 0,0 0.0 0,1 0.0 0.0 0,0
Other opiates° 0.1 0,1 0,2 0.1 0.0 0.1 0.1 0.1 0.1 0.1 0.1 0.0
Stimulants° t 0.5 0.4 0.5 0.5 0.6 0.7 1.2 1.1 1.1 NA NA NAStimulants Adjusted" NA NA NA NA NA NA NA 0.7 0.8 0.6 0.4 -01Sedetivue 0.3 0.2 0,2 0.2 0.1 0.2 0.2 01 0.2 0,1 0.1 0.0
Barbiturates° 0,1 0.1 0.2 0.1 0.0 0.1 0.1 0,1 0.1 0.0 0.1 +0.0Methaqualone" 0.0 0.0 0.0 0.0 0.0 0.1 0,1 0,1 0.0 0,0 0.0 0.0
Tranquilliers° 9.1 0.2 0.3 0.1 0.1 0,1 0.1 0.1 0.1 0.1 0.0
Alcohol 5.7 5.6 6,1 5,7 61 6.0 6.0 5.7 5.5 4.8 5.0 +0.2
Cigaretki 26,9 28.8 28,8 27,5 25.4 21.3 20.3 21.1 21.2 18.7 19.5 +0.8
OT18'. Level of significance of difference between the two most recent client, I s,05, ao 2,011 III 2.001. NA indicates data not available.bDati hued on four qustionnaire terms. N le fourifths of N indicated,
Adjusted fel undurepotting of unyl end butyl nitrites. See tut for details.°pets baud on a single questionnaire form. N a onesfilth of N indiceted .
eAtusted fer underreporting of PCP. See tut for details.
(Onlydrug UN which wu not under a doctor's orders is included here.
.Adjusted for the inappropriate reporting of noninuription stimulanta.
°Any apparent incomistency between the change estimate and the prevalence estimates for the two most recent classes is due le rounding error.

Until 1978, the proportion of seniors Involved In any.Illicit drug use had Increased steadily, primarilybecause of the Increase in marijuana use. About 5496of the classes of 1978 and 1979 reported having triedat least one Illicit drug during the last year, up from4596 In the class of 1975. Between 1979 and 1984,however, the proportion reporting using any Illicit drugduring the prior year dropped by 1 or 2% annually untilthis year, when no further decline was observed: Infact, there has been a slight Increase In the proportionreporting use of any Illicit drug In the previous yca,from 45.8% In 1984 to 46.3% (revised version). Theearlier decline in the proportion of students having anyinvolvement with Illicit drugs appeared to be dueprimarily to the change In marijuana use; and thepresent halt In that decline Is also attributable to themarijuana use trend.
As Figure 6 and Table 11 Illustrate, between 1976 and1982 there had been a very gradual, steady Increase inthe proportion who have ever used some Illicit drugother than marijuana. The proportion going beyondmarijuana in their lifetime had risen from 35% to 45%between 1976 and 1982; In 1983 It dropped back to 44%and in 1984 the revised statistic remained stable andthen decreased slightly in 1985. The annual prevalenceof such behaviors (Figure 7), which had risen from 25%to 34% in 1981, leveled in 1982, and then dropped backslightly in each subsequent year to 27% In 1985. Butthe current (or 30-day) prevalence figures actuallybegan to drop a year earlierin 1982and have shownthe largest proportional drop (as may be seen In Figure8 and in Table 11).
Most of the earlier rise in other illicit drug useappeared to be due to the increasing popularity ofcocaine with this age group between 1976 and 1979,and then due to the increasing use of stimulantsbetween 1979 and 1982. However, as stated earlier,we believe that this upward shift had been exaggeratedbecause some respondents Included instances of usingover-the-counter stimulants in their reports ofamphetamine use. (See discussion at the end of theintroductory section.) A rather different picture ofwhat trends have been occurring in the proportionsusing illicit drugs other than marijuana emerges whenself-reported amphetamine use is excluded from thecalculations altogether. (This obviously understatesthe percent using illicits other than marijuana in anygiven year, but it might yield a more accurate pictureof trends in proportions up through 1982, when newquestions were introduced to deal with the problemdirectly.) Figures 6-8 (and other figures to follow) havebeen annotated with small markings ( ) next to eachyear's bar, showing where the shaded area would stop
46

TABLE 1 1
Trends in Lifetime, Annual, and Thirty.Day Prevalence in an Index of Illicit Drug Use
(Eased on Original and Revlied Amphetamine Quertiona11
Approx. N
Clem
of
1075
Class
of
1978
Clan
of
1977
Claes
of
1978
(17800)
Clan Clue
of of
1979 1980
(15500) (15900)
Percent re din use in
Clue
of
1081
Clan
of
1082
Clinof
1983
(16300)
Chas
of
1984
Class
of
1985
'84-'85
clam
(9400) (15400) (17100) (17500) (17700)
lifetime
(15900) (18000)
Marijuana Only 19,0 22,9 25,8 27.13 27.7 28,7 22.8 20.8 19.7 - -Revised Version _ - - - 213 22.5 21.3 20.9 -0.4
Any Illkit Drug Other
Than Marijuana' 38.2 35.4 35.8 38,5 37,4 38.7 42,8 45.0 44,4 - -Revised Version - - - - - - 41.1 40.4 40.3 39.7 -0.6
Total: Any Illicit
Drug Ure 55,2 58.3 81.8 84,1 65,1 85,4 06.6 135.8 84.1 .m,
Revised Venion - - - - 84,4 62.9 61,6 60,6 -1.0
.............11_2.jantre Ain um in lint twelve monthe
MaNuana Only 18,8 22.7 25.1 26.7 26.0 22.7 18.1 17.0 16.6
o.4
Revised Version
Any Illicit Drug Other
_ _ 19,3 19.0 17.8 18,9 +1,1
Then Marijuana° 28.2 25.4 28.0 27.1 28.2 30.4 34.0 33.8 32.5 - MI
Revised Version - - - - 30.1 28.4 28.0 27.4 -0.8
Total: Any Illicit
Drug Um 45.0 48.1 51.1 53.8 54.2 53.1 52.1 50,8 49.1 -Revised Version - _ _ - - - 49.4 47,4 45,8 48.3 +0.5
Percent reporting ilk in last 30 days
Marijuana Only 15.3 20,3 22,4 23.8 22,2 18,8 15,2 14.3 14.0 - w
&wind Version _ _ _ - - - 15.5 15,1 14,1 14.8 +0,7
Any Illicit Drug Other
Than Wm° 15.4 13.9 16.2 15.1 18.8 18,4 21,7 19,2 18.4 - In
Revised Version - - 17,0 15.4 15.1 14,9 -0.2
Total: Any Illicit
Drug Um 30.7 34.2 37.6 38,9 38,9 37.2 36,9 315 32.4 - -Revised Version - - - - - 32.5 30.5 29.2 29.7 +0.5
NOTES: Level of significance of difference between the two most recent clams: s m,05, as m.01, us m,001.
!Revised questions about stimulant use were intmduced in 1982 to exclude mom completely the inappropriate reporting of nompreecription stimulante.
°Use of 'other illicit drugs" includes any use of hallucinogens, cocaine, and heroin, or any use of other opiates, stimulants, sedatives, or tranquilizers
not under a doctor's orden.

if amphetamine (stimulant) use were excluded entirely.The cross-time trend in these markings shows that theproportion going beyond marijuana to illicits otherthan amphetamines during the prior year was almostconstant between 1975 and 1981. However, this figurebegan to drop gradually from 24% in 1981 to 21% in1985.
Thus, with stimulants excluded from the calculationsentirely, we are seeing a gradual drop in the proportionof seniors using illicit drugs other than marijuana,following a considerable period of virtually level use.With stimulants (including the incorrectly reportedones) included in the definition, we also see a downturnin recent years, but following a period of considerableincrease. Finally, using the corrected stimulantstatistics for 1982 and thereafter (marked with thesymbol (4) in Figures 6-8), we still see the downturn inrecent years, but It follows a period of what we deduceto have been a modest increase in use from the mid-seventies to 1982.
Although the overall proportion using illicit drugsother than marijuana has changed fairly graduallyduring recent years, more varied and turbulent changeshave been occurring for specific drugs within the class.(See Tables 7, 8, and 9 for trends in lifetime, annual,and monthly prevalence figures for each class ofdrugs.)
From 1976 to 1979 cocaine exhibited a dramatic andaccelerating increase in popularity, with annual preva-lence going from 6% in the class of 1976 to 12% in theclass of 1979a two-fold increase In just three years.Between 1979 and 1984, we judge there to have beenlittle or no change in any of the prevalence statisticsfor the nation as a whole. (Some possible regionalchanges will be discussed below.) In 1985, however,there were significant increases In annual and monthlyUSe.
Like cocaine use, inhalant use had been rising steadilyin the mid 1970's, though more slowly and from a loweroverall level. Annual prevalence (in the unadjustedversion) rose from 3.0% In 1976 and reached a peak of5.4% in 1979. Then, between 1979 and 1983, there wasan overall declinein part due to a substantial drop inthe use of the amyl and butyl nitrites, for which annualprevalence declined from 6.5% In 1979 to 3.6% in1983. Both measures increased slightly between 1983and 1985, with annual use for inhalants (adjusted foruse of nitrites) increasing from 6.7% In 1983 to 7.2% in1985, and the nitrites increasing from 3.6% to 4.0%.
48
59

70
60
50
(9 404Ui
trfj 30
20
10
01975 1976 1977 1978 1979 1980 1981 1982 1983 1984 1985
USE IN LIFETIME
FIGURE 6
Trends in Lifetime Prevalence of an Illicit Drug Use IndexAll Seniors
wUsed Marijuana OnlyUsed Some Other Illicit Drugs
5855
6265 65 66 6664 64
6158
40
31
NOTES: Use of "some other illicit drugs" includes any use of hallucinogens,cocaine, and heroin, or any use which is not under a doctor's orders ofother opiates, stimulants, sedatives, or tranquilizers.
indicates the percentage which results if all stimulants are excludedfrom the definition of "illicit drugs." 4 shows the percentage whichresults if only non-prescription stimulants are excluded.
The dashed vertical line indicates that after 1989 the shaded and openbars are defmed by using the revised amphetamine questions.
49

Stimulant (amphetamine) use, which had remainedrelatively unchanged between 1975 and 1978, began toshow evidence of a gradual increase in use in 1979,
, with even greater increases to occur in 1980 and 1981.Between 1976 and 1981, reported annual prevalencerose by a full 10.2% (from 15.8% in 1976 to 26.0% in1981); and daily use tripled, from 0.4% in 1976 to 1.2%in 1981. As stated earlier, we think these increaseswere exaggerated--perhaps sharply exaggeratedbyrespondents in the 1980 and 1981 surveys in particularincluding non-amphetamine, over-the-counter diet pills(as well as "look-alike" and "sound-alike" pills) in theiranswers. In 1982, we added new versions of thequestions on amphetamine use, which were moreexplicit in instructing respondents not to include suchnon-prescription pills. (These were added to only threeof the five forms of the questionnaire being used; theamphetamine questions were left unchanged in theother two forms until 1984.) As a result, Tables 7through 11 give two estimates for amphetamines: oneis based on the unchanged questions, which providescomparable data across time for longer-term trendestimates; the second (adjusted) estimate, based on therevised questions, provides our best assessments ofcurrent prevalence and recent trends in trueamphetamine use.*
As can be seen in 1982 and 1983, the two years forwhich both adjusted and unadjusted statistics areavailable, the unadjusted showed a considerableamount of overreporting. Both types of statistics,however, suggest that a downturn in the current use ofstimulants began to occur in 1982 and has continuedsince. Still, in the class of 1985 more than a quarterof all seniors (26.2%) have tried amphetamines(adjusted).
For sedatives the sustained, gradual decline between1975 and 1979 halted in 1980 and 1981. For example,annual prevalence, which dropped steadily from 11.7%in 1975 to 9.9% in 1979, increased slightly to 10.5% by1981. In 1982, though, the longer-term declineresumed again and annual prevalence has now fallen to5.8%. In sum, annual sedative use has dropped by fullyone-half since the study began in 1975. But, theoverall trend lines for sedatives mask differentialtrends occurring for the two components of the
*We think the unadjusted estimates for the earliest years of thesurvey were probably little affected by the improper inclusion of non-prescription stimulants, since sales of the latter did not burgeon untilafter the 1979 data collection.
50
61

FIGURE 7
Trends in Annual Prevalence of an Illicit Drug Use IndexAll Seniors
Used Marijuana Only60 Used Some Other Illicit Drugs
50
4 0
30
20
10
01975 1976 1977 1978 197919801981 198219831984 1985
USE IN PAST 12 MONTHS
NOTES: Use of "some other illicit drugs" includes any use of hallucinogens,cocaine, and heroin, or any use which is not under a doctor's orders ofother opiates, stimulants, sedatives, or tranquilizers.
indicates the percentage which results if all stimulants are excludedfrom the definition of "illicit drugs." 41 shows the percentage whichresults if only non-prescription stimulants are excluded.
The dashed vertical line indicates that after 1983 the shaded and openbars are defined by using the revised amphetamine questions.
51
64

measure (see Figure 9c). Barbiturate use has declinedrather steadily since 19737E7d7irci stands at belowhalf its 1975 level in terms of annual prevalence (i.e.,at 4.6% vs. 10.7% in 1975). Methaqualone use, on theother hand, rose sharply from 1976 until 1981. (Infact, it was the only drug other than stimulants thatwas still rising in 1981.) But in 1982, the use ofmethaqualone also began to decline, which accountedfor the overall sedative category resuming its decline.Annual use now stands at less than half of its peaklevel observed by 1981 (2.8% in 1985 vs. 7.6% in 1981).
The usage statistics for tranquilizers peaked In 1977,and have declined since then. Lifetime prevalence hasdropped from 18% in 1977 to 12% in 1985, annualprevalence from 11% to 6%, and 30-day prevalencefrom 4.6% to 2.1%. (Annual and 30-day rates in 1985are unchanged from 1984, but lifetime prevalencecontinued to decline.)
Between 1975 and 1979 the prevalence of heroin usehad been dropping rather steadily. Lifetime prev-alence dropped from 2.2% in 1975 to 1.1% in 1979 andannual prevalence had also dropped by half, from 1.0%in 1975 to 0.5% in 1979. This decline halted in 1980and the statistics have remained almost constant sincethen.
From 1975 to 1981 the use of opiates other than heroinremained fairly stable, with annual prevalence at ornear 6%. Annual prevalence then declined to 5.1% in1983, but has since risen slightly to 5.9% in 1985.
Hallucino en use (unadjusted for underreporting ofPCP ) declined some in the middle of the decade (from11.2% in 1975 to 9.6% in 1978 on annual prevalence).It then leveled for several years before beginninganother sustained decline. Between 1979, when thefirst adjusted figures were available, and 1985, therewas a steady decline, with adjusted annual prevalencedropping from 12.8% in 1979 to 7.7% in 1985.
1.12, one of the major drugs comprising thehallucinogen class, showed a decline from 1975 to1977, followed by considerable stability through 1981.Since 1981, however, there has been a second period ofdecline, with annual prevalence falling from 6.5% in1981 to 4.4% in 1985.
The lifetime prevalence statistic for the specifichallucinogen PCP showed a continuation of the steadyand very substantial decrease which began in 1979when we first measured the use of this drug (life timeprevalence has dropped from 12.8% in the class of1979 to 4.9% in the class of 1984). The annual and 30-
6 3 52

50
40
40
0
FIGURE 8
Trends in Thirty-Day Prevalence of an Illicit Drug Use IndexAll Seniors
31
4
15
gUsed Marijuana OnlyUsed Some Other Illicit Drugs
34
14
a:
4
19 394 4 37
4 r-
1547
15
48
4
22
k
434
19
32
4 I 29 304 41
4 4 28
48
:$::}
.4k 3::44 re
5
14,ta.4
:
15
1975 1976 1977 1978 1979 1980 4931 1982 1983 4984 1985USE IN PAST 30 DAYS
NOTES: Use of "some other illicit drugs" includes any use of hallucinogens,cocaine, and heroin, or any use which is not under a doctor's orders ofother opiates, stimulants, sedatives, or tranquilizers.
-a indicates the percentage which resulti if all stimulants are excludedfrom the definition of "illicit drugs." a shows the percentag) whichresults if only non-prescription stimulants are excluded.
The dashed vertical line indicates that after 1983 the shaded and openbars are defined by using the revised amphetamine questions.
53

FIGURE 9a
Trends in Lifetime, Annual, and Thirty-Day Prevalence of Sixteen Drugs
100
90
80
70
La, 60
tz 50
w 40o_
30
20
10
0
o LIFETIME PREVALENCE
O ANNUAL PREVALENCEa THIRTY-DAY PREVALENCE
1111111111A 1_1_11_11111111975
'7677 '79 '81
78 '80 '82MARIJUANA
'83 '8584
75 '77 '79 '81 '83 '8576 78 80 '82 84
STIMULANTS
NOTE: The dotted lines connect percentages which result if non-prescriptionstimulants are excluded.
54

FIGURE 9b
Trends in Lifetime, Annual, and Thirty.Day Prevalence of Sixteen Drugs
20
15
o LIFETIME PREVALENCE\vit.% 0 ANNUAL PREVALENCE
THIRTY-DAY PREVALENCE
5
0 1 1 1 1 1 1 1 1 1 1
4975 '77 '79 '81 '83 '85'76 '78 '80 '82 '84
TRANQUILIZERS
I TI 11111111'75 '77 '79 '84 '83 '85
'76 '78 '80 '82 '84INHALANTS
11111111111'75 '77 '79 '84 '83 '85
'76 '78 '80 '82 '84AMYL B BUTYL NITRITES
NOTE: The dotted lines connect percentages which are adjusted for underreportingof amyl and butyl nitrites.
55
154-831 0 - 86 - 3

FIGURE 9c
Trends in Lifetime, Annual, and Thirty-T Prevalence of Sixteen Drug.
20
15
o LIFETIME PREVALENCE
o ANNUAL PREVALENCE
THIRTY-DAY PREVALENCE
5
0 1 1 1 1 1 1 1 1 1 I 1
1975 '77 '79 '81 '83 '851 1 1 1 1 1 1 1 1 1 1
'75 '77 '79 '81 '83 '85'76 '78 '80 '82 '84 '76 '78 'SO '82 '84
SEDATIVES BARBITURATES
56
'75 '77 '79 '81 '83 '85'76 '78 '80 '82 '84
METHADUALONE

FIGURE 9d
Trends in Lifetime, Annual, and Thirty-Day Prevalence of Sixteen Drugs
20
15
o LIFETIME PREVALENCE
OANNUAL PREVALENCE
ATHIRTY-DAY PREVALENCE
5
0h1I 11111111111 IlIlIlIlICIi975 '77 '7? '81 '83_ '85 '75 '77 '79 '81 '83 '85 '75 '77 '79 '81_ '8576 78 80 '82 84 '76 78 '80 82 '84 76 78 '80 82 -84
LSO PCPHALLUCINOGENS
NOTE: The dotted lines connect percentages which are adjusted for underreportingof PCP.
57 6;3

FIGURE 9s
Trends in Lifetime, Annual, and Thirty-Day Prevalence of Sixteen Drugs
20
15
o LIFETIME PREVALENCE
a ANNUAL PREVALENCE
A THIRTY- DAY PREVALENCE
cecesCr°.0'4,c,.0.0A
D.e.tr°43Cks.oze
6-14\c"r4.6-u-&-te°0-1-1-1-1_1-11.1.1...1-1 111111111111975'77 '79 '81 83 '85 '75 '77 '79 '81 '83 185
'76 '78 '80 '92 '84 '76 '78 '80 '82 '84COCAINE OTHER OPIATES
58
'75 '77 '79 '81 '83 '85'76 '78 '80 '82 '84
HEROIN

FIGURE 9f
Trends in Lifetime, Annual, and Thirty-Day Prevalence of Sixteen Drugs
100
90
80
70
60
50teli
40
30
20
cp_cp-0-043-C1-0-4:4-0.-cLo
10 -0 llll
1975 '77 '7? '81 '8? '85'76 '78 80 '82 84
ALCOHOL
59
PREVALENCE OF USE
LIFETIME
ANNUAL
THIRTY-DAY
DAILY
TWO-WEEK PREVALENCEOF HEAVY DRINKING
DAILY USE OF A HALF-PACKOR MORE OF CIGARETTES
I lllll'75 '77 '79 81 '83 '85
'76 '78 '80 82 '84C IGARE T T ES

30
25
20
15
10
FIGURE 10
Trends in Thirty-Pay Prevalence of Daily Use ofMarijuana, .. Johol, and Cigarettes
by Sex
o MALEFEMALE
0975 '77 '79 '81 '83 '85
76 '78 SO 82 84MARI JUANA
DAILY
*-4."*"'.--I 1 1 1 1 1 1 1 1 1
*75 '77 '79 '81 '83 '85'76 '78 '80 '82 '84
Any Doily Use
1/2 Pock or More
1 1 1 1 1 imp'75 '77 '79 '81 '83 '85
'76 '78 '80 '82 '84ALCOHOL CIGARETTES
DAILY DAILY
NOTE: Daily use for alcohol and marijuana is defined as use on 20 or moreoccasions in the past thirty days. Daily use of cigarettes is defined assmoking one or more cigarettes per day in the past thirty days.
60

FIGURE 11
Trends in Two-Week Prevalence of Heavy Drinkingby Sex
60
50
40
gve 3°W
10
0......0........0....0_43....
-
.____----°"--.._
-o MALE
FEMALE
ot 1 i IIIIIIII1975 1976 1977 1978 1979 19801981 1982 1983 19841985
FIVE OR MORE DRINKS IN A ROW INLAST TWO WEEKS
61
day statistics for PCP show slight rises in 1985(neither is statistically significant), which offset asimilarly slight drop the previous year.
As can be seen from these varied patterns for theseveral classes of illicit drugs, while the overallproportion of seniors using au illicit drugs in theirlifetime other than marijuana or amphetamines haschanged rather little, the mix of drugs they are usinghas changed quite substantially.
Turning to the licit drugs, between 1975 and 1978 or1979 there was a small upward shift in the prevalenceof alcohol use among seniors. To illustrate, between1975 and 1979 the annual prevalence rate rose steadilyfrom 85% to 88%, the monthly prevalence rose from68% to 72%, and the daily prevalence rose from 5.7%to 6.9%. Since 1979, there has been virtually no dropin lifetime prevalence, but some drop for the morerecent prevalence intervals: between 1979 and 1984,annual prevalence fell from 88% to 86%, monthlyprevalence from 72% to 66%, and daily prevalencefrom 6.9% to 4.8%. Clearly the change in daily use isthe most important of these shifts.
There also had been some increase in the frequency ofoccasional heavy drinking in the last half of the 1970's.When asked whether they had taken five or moredrinks in a row during the prior two weeks, 37% of theseniors in 1975 said they had. This proportion rosegradually to 41% by 1979, where it remained through1983. In both 1984 and 1985, we observed drops of 2%in this troublesome statistic, which is again at 37%,exactly where it was in 1975. Thus, to answer afrequently asked question, there is no evidence thatthe currently observed drop in marijuana use is leadingto a concomitant increase in alcohol use. If anything,there has been some parallel decline in daily alcoholuse as well as in occasional heavy drinking.
As for cigarette use, 1976 and 1977 appear to havebeen the peak years of smoking in this age group, asmeasured by lifetime, thirty-day, and daily prevalence.(Annual prevalence is not asked.) Over the foursubsequent graduating classes, thirty-day prevalencedropped substantially from 38% in the class of 1977 to29% in the class of 1981. More importantly, dailycigarette use dropped over that same interval from29% to 20%, and daily use of half-pack-a-day or morefrom 19.4% to 13.5% between 1977 and 1981 (nearly aone-third decrease). In 1981 we reported that thedecline appeared to be decelerating; in 1982 and 1983it clearly had halted. There was a brief resumption ofthe earlier decline in 1984, with daily use falling from21% to 19%, and daily use of half-pack-a-day dropping
62
7 3

from 13.8% to 12.3%. However, in the Class of 1985these measures rose slightlydaily use to 20% andhalf-pack-a-day to 12.5%. What seems most note-worthy is the lack of appreciable decline in thesmoking rates since 1981, despite (a) the generaldecline which has occurred for most other drugs(including alcohol), (b) some rise in the perceivedharmfulness and personal disapproval associated withsmoking, and (c) a considerable amount of restrictivelegislation which has been debated and enacted atstate and local levels in the past several years.
Trends in Noncontinuation Rates
Table 12 shows how the user continuation rates observed for the variousclasses of drugs have changed over time. Recall that thenoncontinuation rate, as used here, is defined as the percent of thosewho ever used the drug who did not use in the year prior to the survey.
For most drugs there has been relatively little changein noncontinuation rates among those who have triedthe drug at least once. There are some noticeableexceptions, however.
Malluana has shown some increase in the noncontinua-tion rates between 1979 (when it was 16%) and 1985(when it was 25%). This corresponds to the greaterdrop in annual use than in lifetime use describedearlier.
The noncontinuation rate for cocaine decreased from1976 (when it was 38%) to 1979-1Then it was 22%),corresponding to the period of increase in the overallprevalence of use.
There was considerably more noncontinuation ofstimulant use in 1985 (40%) than in 1982 (when it was279T)TIsed on the revised question. Earlier data(based on the unrevised question), suggest that thechange began after 1981.
Much of the recent decline in sedative use is alsoaccounted for by a changing rate of noncontinuation.For example, in the case of barbiturates the noncon-tinuation rate has risen since 1980, when it was around38%, to 1985 when it was around 50%.
Similarly, In 1980 24% of the seniors who ever usedmethaqualone did not use in the prior year, whereasthe comparable statistic by 1985 was more than twiceas high, at 58%.
Tranquilizer users showed a steady, gradual increase innoncontinuation between 1975 and 1982, as the rate
63

TABLE 11
Trends in Noneontinuation RatesAmong Seniors Viho Used Drug in Lifetime
Percent who did not use in put year
Class
ofClass
ofClaus
ofClaus
ofClue
ofClass
ofCliii
ofClass
ofClass
ofClass
ofClass
of1075 1976 1977 1978 1979 1980 1981 1982 1983 1084 1985
Marijuana/Hashish 15,4 15.7 15,6 15.2 15$ 19.1 221 24,5 25,8 27,1 25.1Inhalants NA 70,9 86,7 85.8 571 61.3 66,7 64.8 68.4 ea 03,0Acljustad NA NA NA NA 50.8 55.7 65.5 03,3 64.4 58.4 59,8Nitrites NA NA NA NA 414 481 63.4 631 57.1 501 49,4
Hallucinogens 31.3 37.7 30.1 31,9 29,8 30.1 32,3 35,2 38.7 39.3 38.8Acl)ustatl NA NA NA NA 31,2 32,5 35,7 38,0 38,7 40.6 381LSD 30.3 41,8 43,9 35,1 30.5 30.1 33.7 36.5 39.3 413 41,3PCP NA NA NA NA 45.3 54.2 59,0 03,3 53,8 54.0 40.8
Cocaine 37.8 38,1 33,3 30.2 22.1 217 24,8 28.1 29,6 28,0 24,3Heroln 54,5 55.6 55.6 50,0 54,5 54.5 54,5 50.0 50,0 61.5 501Other Opiates 36.7 00.6 37$ 39.4 38.6 35,7 418 44,8 45,7 46.4 42.2Stimulants 27.4 30,1 20,1 25,3 24.4 21.2 19.3 28,7 30,5 NA NARevised NA NA NA NA NA NA NA 27.2 33.5 36.6 30.7Sedatives 35,7 39,5 37,9 38.1 32.2 30.9 34,4 40,1 45,1 50,4 50.8
Barbiturates 36,7 40,7 40.4 40.9 36.4 38.2 41,6 48.6 47.5 50.5 50.0Methaqualone 3 0 39.7 38.8 38.0 28.9 24.2 28,3 38.4 484 541 58.2
Tranquilizers 37.8 38.7 40.0 41.8 41,1 42.8 45.8 50,0 48,1 50,8 48,7Alcohol 6.2 8,7 5.9 5,8 5,3 5.7 6,0 6.5 5.7 7.1 7,2Cigarettes° 16.0 16,7 16.2 17,9 19,6 21.4 20,8 19.1 18.6 18.5 15.9
°Percent of roguler smokers (ever) tato did not smoke at all in the.put 30 da s.
iJ

TABLE 13
Trends in Noneontinustion Bates Among Seniors Who
Used Drug Ten or More Times in Lifetime
Percent who did not use in pest year
Class
of
Class
of
Close
of
Class
of
Class
of
Class
of
Class
of
Clans
of
Class
of
Class
or
Class
of
1975 1076 1977 1978 1979 1980 1981 1982 1083 1084 1985
Marijuana/Hashish 4,0 4.0 4.1 3.7 4.0 5.4 1.2 7,6 8,3 8,8 7.8
Inhalants NA 48.9 42,6 34,6 23.8 25,2 23.8 27.2 23.1 23.4 25.8
Nitrites'
Hellucinogens 10.8 18.1 15,2 10.8 8.1 8,4 7,1 7.5 13.0 14.1 12,2
LSD 15,2 17,3 18,0 12.2 7.4 6.4 7.1 7.5 15.3 12,1 12,6
PCP'
alui Cocaine 7.7 8.2 6.2 3.8 3.1 3,1 3.1 2.9 6,2 3.1 V.
Heroin'
Other Opletes 9.0 11.0 9.7 9.9 8.7 10,8 10.1 13.6 18.4 15.4 12.2
Stimulants 8.0 9,8 7.6 7.4 8.1 4.1 4.4 0.4 7.5 NA NA
Revised NA NA NA NA NA NA NA 8.4 10,7 12.7 17,5
Sedatives 13,6 16.2 12.4 12.8 8.6 10.5 7.6 8.6 16.4 20,8 23,6
Barbiturates 13.4 10,5 12.9 13.5 11,2 11.7 8.9 12.6 17.7 22.8 20,6
Methaqualone 13.5 15.9 11,9 13.1 6.1 8.0 4.9 8.0 10.3 23,3 20.7
Tranq uilizers 12,0 13,0 11.1 14.4 14.1 14,3 16,3 16.0 14.8 18.8 19.2
Alcohul 0.8 0.8 0,8 0.9 0.7 0,8 1.0 0,9 0.9 1.1 1,2
'The cell entries in these rows were omitted because they were based on fewer than 100 senior' who used ten or more times. All
other cells contain more than 100 cases,
7u

rose from 37% to 50%. Since 1982 there has not beenany further systematic change, however.
Table 13 provides noncontinuation rates for seniorswho were more established usersthat Ls, tlr thosewho report having used the drug ten or more tirris intheir life. It shows that noncontinuation Is far lesslikely among such heavier users than among all usersof a given drug. Further, while the trends Innoncontinuation mentioned above for mariluania,stimulants barbiturates, methaqualone, and ganqui-lizers, are all similar to trends observed In thenoncontinuatIon rates for heavier users of those samedrugs, the percentage fluctuations tend to beconsiderably smaller among the heavier users.
Trend Comparisons for Important Subgroups
Sex Differences in Trends
Most of the sex differences mentioned earlier forindividual classes of drugs have remained relativelyunchanged over the past ten yearsthat is, any trendsin overall use have occurred about equally amongmales and females. There are, however, a fewexceptions (data not shown).
Since 1977, the small sex difference Involving tranqui-lizer use (males this age had used them less frequentlythan females) has disappeared for lifetime prevalenceand actually reversed for annual and 30-dayprevalence, due to a faster decline among females.
The ratio of male-female prevalence rates In cocaineuse, which was rather large in the mid:1970T,diminished somewhat in the early 1980's. Although thedifferences have lessened, males still use morefrequently than females.
Regarding stimulant use, a sex difference emerged in1981 and 1982 using the original version of thequestion; but the revised question Introduced in 1982showed no sex difference, suggesting that over-the-counter diet pills accounted for females showinghigher use in those two years. In 1985, with therevised version of the question, females show slightlyhigher rates of use of stimulants due to their morefrequent use of amphetamines for the purpose ofweight loss.
An examination of the trends in the proportion of eachsex using any illicit drug in the prior year (see Figure12) shows that use among males rose between 1975 and
66
7'1

100
90
80
70
FIGURE 12
Trends in Antal Priv& lance din Illicit Drug Ulm Index
by Sex
Used Marijuana Cey
Used Some Other RIO Iri.ins
50
40
30
20
10
o675 76 '77 178 '79 '80 81 '82 '83 '84 '85 1975 76 '77 78 79 '80 11 '82 '83 84 85
MALES FEMALES
NOTE: See Figure 8 for relevant fotnotes.
ei

1978, and then declined steadily until 1985 (from 5996in 1978 to 48% in 1985). Use among females increasedfrom 1975 (41%) until 1981 (51%) and then droppeduntil 1985 (44%). However, if amphetamine use isdeleted from the statistics (see notations in Figure12), female use peaked earlier (in 1979) and thendeclined as well. (Note that the declines for bothmales and females were attributable to the decliningmarijuana use rates.) This year, the declines haltedfor both sexes, based on the annual use statistics.
Regarding the apparent parity between the sexes inthe levels and trends in the use of illicit drugs otherthan marijuana, It can be seen in Figure 12 that, whenamphetamine use is excluded from the calculations,somewhat differential levels emerge for males vs.females but the trends tend to remain fairly parallel.
The sex differences in alcohol use have narrowedslightly since 1975. For example, the thirty-clayprevalence rates for males and females differed by12.8% in 1975 (75.0% vs. 62.2% respectively), but thatdifference was down to 7.7% by 1985 (69.8% vs.62.1%). And, although there still remain substantialsex differences in daily use and occasions of heavydrinking, there has '3een some narrowing of thedifferences there, as well (Figure W. For example,between 1975 and 1985 the proportion of malesadmitting to having five drinks in a row during theprior two weeks showed a net decrease of 3.7% (from49.0% to 45.3%), whereas a net increase of 1.8%occurred for females (from 26.4% to 28.2%).* It shouldbe noted that both sexes showed slight decreases thisyear in this important statistic.
Although males are far more likely than females tohave five or more drinks in a row during the prior twoweeks (48% vs. 28%), there is practically no differencein the proportion of them who had at least one drinkduring that same interval (44% vs. 42%). Thus, it isthe propensity to drink a lot per occasion that differsbetween male and female high school seniors, not thepropensity to drink at all.
On one of the five questionnaire forms used in thestudy, respondents are asked separately about their use
*It is worth noting that the same number of drinks producessubstantially greater impact on the blood alcohol level of the averagefemale than the average male, because of sex differences in bodyweight. Thus, sex differences in frequency of actually getting drunkmay not be as great as the binge drinking statistics would indicate,since they are based on a fixed number of drinks.
68
7J

of beer, wine, and hard liquor. The answers to thesequestions reveal that It is primarily a differential rateof beer consumption that accounts for the large sexdifferences in occasions of heavy drinking; 43% of190 senior males report having flve or more beers ln arow during the prlor two weeks vs. 22% of the female/In contrast, males are only slightly more likely thanfemales to report having or more drinks of hardliquor (21% vs. 18% for females) and they are justabout equivalent with respect to heavy use of wine(12.9% vs. 12.5% for females). This patterna largesex difference in heavy uso of beer, a much" smallerdifference in heavy use of nerd liquor, and very littledifference in heavy use of winehas been presentthroughout the study, with little systematic trending.
Regarding cigarette smoking, we observed in 1977 thatfemales for the first time caught up to males at thehalf-a-pack per day smoking level (Flgure 10). Then,between 1977 and 1981, both sexes showed a decline inthe prevalence of such smoking; but use among malesdropped more, resulting in a reversal of the sexdifferences. As of 1985, the proportions of males andfemales smoking at least a half-pack-a-day differrather little (12.3% for males, 12.0% for females); andat the pack-a-day or more level, there are slightlymore males (7.0%) than females (6.2%). However, atless frequent levels of smoking, there is a somewhatlarger sex difference, since there are more occasionalsmokers among females than among males. Forexample, in 1985, 31% of the females report smokingat least once in the prlor 30 days, vs. only 28% of themales. This year's Increase in smoking among allseniors, which was not statistically significant,occurred entirely among males.
Trend Differences Related to College Plans
Both college-bound and noncollege-bound studentshave been showing fairly parallel trends in overallillicit drug use over the last several years (seeFigure 13).*
Changes in use of the specific drug classes have alsobeen generally qulte parallel for the two groups since1976, with only minor exceptions.
*Because of excessive mlssing data in 1975 on the variablemeasuring college plans, group comparisons are not -tsented for thatyear.
69

100
90
80
70
a
a
30
20
10
0
a
FIGURE 13
Trends In Annual Pfflvalenee ofan 1111elt Drug Use Index
by College Plans
Used Moriluono Only
Used Some Other Drop
1976 '77 '78 '79 '80 '81 '82 '83 '84 185
PLANNING NO
COLLEGE, OR
LESS THAN 4 YEARS
44
1976 '77 '78 '79 '80 '81 '82 '83 t4 '85
PLANNING TO
COMPLETE 4 YEARS
Or COLLEGE
NOTE: See Figure 8 for relevant footnotes.
I

One such exception Is that the 198f Increase in currentuse of opiates other than heroin occurred primarilyamong the college-bound.
On the other hand, nearly all of the 1985 increase insrr_ici_g<in rates occurred among the noncollege-bound.
Regional Differences In Trends
In terms of the proportion of seniors using any illicitdrug during the year, all four regions of the countryreached their peaks In 1978 or 1979 (Figure 14), andgenerally have been falling since then. In 1985, boththe South and the Northeast showed patterns ofcontinuing decline. However, the No 7th Central andWest showed slight reversals; in the North Central therlse is due In part to statistically significant increasesin marijuana, cocaine, and other opiates; in the West itis due to a rise In use of other opiates.
As noted earlier, a major factor in the rise of illi 'tdrug use other than marlluana had been an Increase inreported amphetamine use. Such a rise appeared in allfour regions; however, the rise from 1978 to 1981 wasonly 6% in the South, whereas in the other regions thepercentages all had risen between 9% and 12%. Inessence, the South has been least affected by both therise and the fall in reported amphetamine use.
When amphetamine use is excluded, as shown by thearrow ( ) in Figure 14, a rather different pictureappears for regional trends during the late seventiesand early eighties than the picture given by the shadedbars (which include all reported amphetamine use).Use of illicits other than marijuana and amphetaminesactually started to decline in the South and NorthCentral in 1981both regions having had fairly levelrates of use prior to that. Rates in the West and theNortheast did not begin their decline until 1982, aftera period of some increase in student involvement withsuch drugs (but not as great an increase as the"uncorrected" figures would suggest). In 1985, therewas little further change in the Northeast and West;but due to significant changes in opiates other thanheroin and cocaine use, the North Central showed anincrease in this statistic, and the South silowed afurther decline due to significant changes in hallu-cinogen (adjusted', sedative, and methaqualone use.
Over the lon term cocaine use has shown quitedifferent tren ;1'1 the four regkwis of the country (seeFigure 15 for lifferences in lifetime prevalencetrends). In th.. mid seventies, there was relativelylittle regional variation in cocaine use. Then, large
71

FIGURE 14
Trani, In Annual Provolone. of an 1111olt Dmig UN Index
by Itellon of the Country
100 0
10
illkod Ihrljuono Only
Usti 8we Othor Illicit Drugs
80
10
4o
30
20
10
o197511 li Is 19 'soli 12 'I3 '84 15 1975 78 11 `ii li to 11 12 '83 14 '85
Northeast North Control
NOTE: See Figure 8 for rand footaota
1 i .1 6 j

100
90
80
70
60
50
40
30
20
10
0
-
-
-
-
-
FIGURE 14 (cont.)
Trends In Annual Prue Iona of en 1111elt Drug Use Index
by Region of the Country
Used Marijuana Only
Used Some Other Illicit Drugs
37
21
48
5356 56 56
50 50 flflflJ-Q2 53
6
1
1975'70 '77 '70 '79 130 '81 12 '83 14 15 1975'76 '77 '78 '79 '80 '81 '82 '83 14 '85
South West
NOTE; See Figure 8 for relevant footnotes.
8 4
33

40
30
20
10
0
FIGURE 15
Trends in Lifetime Prevalence of Cocaine Useby Region of the Country
West
'75 '76 '77 '78 '79 '80 '81 '82 '83 '84 '85
74

regional differences emerged so that by 1981 annualuse had roughly tripled In the West and Northeast,nearly doubled in the North Central, and increased"only" by about 30% In the South. Since 1981, therehas been some further increase in the Northeast(occurring specifically in 1984 and 1985). The Westshowed a drop in 1982 but some gradual increase since,while the North Central showed a gradual decreaseafter 1980 until thls year, uken there was a significantincrease. There has been little change In the Southsince 1979. The net effect has been that there haveremained very substantial regional differences incocaine use since around 1980, with the West andNortheast now showing annual prevalence rates near20% vs. around 8% for the South and North Central.
Between 1975 and 1981 sizeable regional differences Inhallucinogen use emerged, as use in the South droppedappreciably. In 1981, both the North Central and theWest had annual rates that were about two and one-half times higher than the South (10.3%, 10.4%, and4.1%, respectively), and the Northeast was three timesas high (12.9%). After 1981, hallucinogen use droppedappreciably In all three non-Southern regions (by 3-4%), narrowing these differences In absolute terms,though the North Central and West now have annualrates twice that of the South with the Northeast stillthree times as high. Unlike the other hallucinogens,which decreased in all regions between 1981 and 1985,recent use of PCP showed a different pattern,increasing in both the Northeast and West, whiledeclining In both the North Central and South.
The remaining drugs (I.e., alcohol, cigarettes,marijuana, heroin, other opiates, 1:,arbIturatesmethaqualone, tranqulls, and inhalants) showrather little regional variation in trends.
Trend Differences Related to Population DensitY
There appears to have been a peaking in 1979 in theproportions using any illicit drug in all three levels ofcommunity slze (Figure 16). Although the smallermetropolitan areas and the non-metropolitan areasnever caught up completely with their larger counter-parts, they did narrow the gap some between .975 and1979. Most of that narrowing was due to changinglevels of marijuana use, and most of lc occurred priorto 1978.
Since 1979, there had been a fairly steady decrease inall three groupings on community sizeuntil 1985,when the metropolitan areas remained level and :henon-metropolitan areas showed a slight rise.
75 8 b

100
90
so -
70
so
50
40
30
20
10 -
FIGURE 16
Trends in Annual Prevalence ofan Illicit Drug Use Index
by Population Density
Used Some Other Illicit Drugs
Used Morijoono Only
53
50
7
43
26
1970617 1191oli 12113144 1T5 161718 I9 Wei t21313415 1975 '7617179 Wei 8218318035LARGE
OTHER NON-METROPOLITAN METROPOLITAN METROPOLITAN
(SMSA) 1SM8A) (Non.SMSA)
NOTE: See Figure 8 for relevant footnote'
0 6(
The overall proportion Involved in illicit drugs otherthan marl uana also has peaked in communities of allsizes, but not until 1981 or 19. Up to 1981, theproportions reporting the use of some illicit drug otherthan marijuana In the last 12 months had beenincreasing continuously (ove. a four-year perlod In thevery large cities, and over a three-year period In thesmaller metropolitan and non-metropolitan areas). Ascan be seen by the special notations In Figure 16,almost all of thls Increase Is attributable to the rlse inreported amphetamlne use (which likely Is artifactualIn part). The 1983 figures showed decreases of one totwo percent In all three levels of community size Inillicit drug use other than marljuana (revised version).The decllne contlnued in 1984 and 1985 In themetropolitan areas, but the non-metropolitan areaswere stable.
There were statistically significant decreases in annualand monthly amphetamine use between 1984 and 1985among seniors In the large cities. All three areas haveshown declines In recent use slnce the amphetamlnemeasures were revised In 1982. (Data not shown.)
The Increase In cocaine use, although dramatic at alllevels of urbanIcity between 1976 and 1979, wasclearly greatest in the large cities. Between 1980 and1984, use was fairly stable In all groupings, and In 1985they all showed a rise In use. (Data not shown.)
There is evidence of a decline in current alcohol use inthe large cities In recent years. For example, thirty-day prevalence in the large cities Is down by 11%,from 78% In 1980 to 67% In 1985; during the sameinterval, the smaller metropolitan areas decreased 6%(from 71% to 65%), and the non-metropolitan areasdropped 3% (from 69% to 66%). Similarly, daily usedecreased between 1980 and 1985 by 1.8% In the largecities (7.1% to 5.3%), while the smaller citiesdecreased by 0.3% (5.4% to 5.1%) and non-metro-politan areas decreased by 1.3% (6.1% to 4.8%). Andoccasional heavy drinking decreased by 7% (from 45%to 38%) In the large clties, compared to a 3.5%decrease In other cities (38.9% to 35.4%) and a 3.8%drop in non-metropolitan areas (41.4% to 37.6%).These differential shlfts result in less variation amongthe three levels of urbaniclty In 1984 and 1985 thanthere had been several years earlier.
Differences related to community size have alsonarrowed In the cases of LSD (since 1981) due to agreater amount of decrease In the large cities andother cities than In the non-metropolltan areas (whichstarted out considerably lower). A similar thingappeared to be happening for as well, until this
77

year when reported use In the largest cities rose whileuse in the other types of communities remainedunchanged.
Opiates other than heroin were used by significantlymore seniors in the smaller metropolitan areas, in 1985compared to 1984; for example, annual use went from5.196 to 6.4%.
The remaining drugs show little variation in trendsrelated t 3 population density.

USE AT EARLIER GRA DE LEVELS
In two of the five questionnaire forms used in the study, respondents areasked to Indicate the grade in which they wrre enrolled when they firsttried each class of drugs. Graphic presentations on a drug-by-drug basisof the trends for earlier grade levels and of the changing age-at-onsetcurves for the various graduating classes are contained in the large1978, 1981, and 1983 reports from the study (ciied earlier). In thepresent report, only some of these figures are Included. Table 14 givesthe percent of the 1985 seniors who first tried each drug at each of theearlier grade levels.
Incidence of Use by Grade Level
For mari uana, alcohol, and cigarettes, most of theInitial experiences took place before high school. Forexample, regular daily cigarette smoking was begun by13% prior to tenth grade vs. only an additional 9% inhigh school (I.e., in grades ten through twelve). Thefigures for initial use of alcohol are 56% prior to and37% during high school; and for marijuana, 28% priorto and 26% during high school (see Table 14). Also,for the use of inhalants (unadjusted) more than half(8.3%) was Initiated before tenth grade (vs. 7.0%after).
For most of the illicit drugs, between 40 and 50% ofthe eventual users initiated use prior to 10th grade;methaqualone, barbiturates, heroin, Fs!, ampheta-mines, and tranquilizers fall in this category.
Among eventual users of hallucinogens, LSD (spe-cifically), nitrites, and opiates other than heroin, stilla substantial minorityabout one-thirdinitiate useprior to tenth grade.
Cocaine presents a contrasting picture to nearly allother drugs in that initiation rates are highest in thelast two years of high school; less than 20% ofeventual users initiated use prior to tenth grade.Furthermore, our follow-ups of earlier graduatingclasses show that initiation rates remain very high inthe years after high school.
Trends in Use at Earlier Grade Levels
Using the retrospective data provided by members ofeach senior class concerning their grade at first use, itis possible to reconstruct lifetime prevalence curves at
79 itj

Ote4 In *Atel 114111M
wit
TAIL/ 14
Grob of Pint Uos for /Woo Typos of Drop, Ciao of 1115
Ileitis ate pseenisis)
tki/Ikon
0 jig14
#.0 ne
/I/Ilh 11 LI 0.1 0.1 03 01 0,3 0.1 0,4 01 01 U OA 9.7 3,1
7.1th ILO 11 01 0.3 OA 0.8 0.1 1.0 U LI 11 1,1 IA ILO 61
1th IU 1.1 IA 1.1 1.1 LI 01 LI 7.1 IA 11 IA LI 12.8 4,9
10th ILI U IS LI LO 04 14 1.7 U IA LI IA 18.5 4.2
1Ith 0,7 tO U LI 11 10 24 0,1 tO 4,7 11 IA IA IA 11,8 28
110 6,4 1,7 IA IA LI 0,0 41 111 LO 2,3 0,1 0.7 01 111 1,4 1,7
Novel
eNd 41,1 144 ILI 1211 NI 111 111 111 11,1 111 111 124 111 811 74 77,9vimoverismovirrir
omormiimmonolawimorrmw
NOM No lob us Ad 1,1e of do Imo IN s opploolostoly 17N), ht Milos%Petal tin ittliouldi Mt la oely oes IN opprookootoly 1104
itholioloi Is Wm udeopnlei of Wok drop. IN tut lot itells,bAdjoilW
Is do looppoplate Rotting dueller* othooloolo.
9

lower grade levels during the years when each classwas at those various grade levels. Obviously, datafrom eventual dropouts from school are not included inany of the curves. Figures 17a through 17r show thereconstructed lifetime prevalence curves for earliergrade levels for a number of drugs.
Figure 17a provides the trends at each grade level forlifetime use of any illicit drug. It shows that for allgrade levels there was a continuous increase In Illicitdrug involvement through the seventies. The increaseis fortunately quite small for use prior to sixth grade;only 1.1% of the class of 1975 reported having used anillicit drug before 6th grade (which was in 1969 forthat class), but the figure has increased modestly, andfor the class of 1985 is at 4.3% (which was in 1979 forthat class). The lines for the other grade levels allshow much steeper upward slopes, indicating that themore recent graduating classes had initiated illicitdrug use earlier than the less recent classes. Forexample, about 45% of the class of 1985 had used someillicit drug by the end of grade 10, compared to 37% ofthe class of 1975.
Beginning in 1980, though, there was a leveling off atthe high school level (grades 10, 11, and 12) in theproportion becoming involved in illicit drugs. Theleveling in the lower grades came about a year earlier.
Most of the increase in any illicit drug use was due toincreasing proportions using marijuana. We know thisfrom the results in Figure l7b showing trends for eachgrade level in the proportion having used any illicitdrug other than marijuana in their lifetime. Comparedto Figure 17d for marijuana use, these trend lines arerelatively flat throughout the seventies and, ifanything, began to taper off among ninth and tenthgraders between 1975 and 1977. The biggest cause ofthe increases in these curves from 1978 to 1981 wasthe rise in reports of amphetamine use. As notedearlier, we suspect that at least some of this rise isartifactual. If amphetamine use is removed from thecalculations, even greater stability is shown in theproportion using illicits other than marijuana oramphetamines. (See Figure 17c.)
As can be seen in Figure 17d, for the years coVeredacross the decade of the 70's, marijuana use had beenrising steadily at all grade levels down through theseventh-eighth grades. Beginning in 1980, marijuanainvolvement began to decline for grades 9 through 12.Junior high school use reached an asymptote by theend of the seventies, as well.
81A.,

There was also some small increase in marijuana useduring the 1970's at the elementary level (that is, priorto seventh grade). Use by sixth grade or lower rosegradually from 0.6% for the class of 1973 (who weresixth graders in 1968-69) to a peak of 4.3% in the classof 1984 (who were sixth graders in 1977-78). (Itappears to start dropping thereafter.) The three mostrecent national household surveys by NIDA suggestthat this relatively low level of use among this agegroup continues to hold true: the proportion of 12 to13 year olds reporting any experience with marijuanawas 6% in 1971, and was constant at 8% in 1977, 1979,and 1982. Presumably sixth graders would have evenlower absolute rates, since the average age of sixthgraders Is less than twelve.*
Cocaine use at earlier grade levels Is given in Figure17e. One clear contrast to the marijuana pattern Isthat most initiation into cocaine use takes place in thelast two years of high school (rather than earlier, as isthe case for marijuana). Further, most of the increasein cocaine experience between 1976 and 1980 occurredin the 1 ith and 12th grades, not below. After 1980,experience with cocaine generally remained level until1984 (for juniors) and 1983 (for seniors), when anupturn can be observed.
The lifetime prevalence statistics for stimulantspeaked briefly for grade levels 9 through 12 during themid 70's. (See Figure 17f.) However, it showed asharp rise in the late 70's at virtually all grade levels.As has been stated repeatedly, we believe thatsomeperhaps mostof this recent upturn is artifac-t:al in the sense that non-prescription stimulantsaccount for much of It. However, regardless of whataccounts for it, there was a clear upward seculartrendthat Is, one derived across all cohorts andgrade levelsbeginning in 1979. The unadjusted datafrom the class of 1983 give the first indication of areversal of this trend. The adjusted data from theclasses of 1982 through 1983 suggest that the use ofstimulants leveled around 1982. (In fact, as notedearlier, current use among twelfth graders has actuallyfallen appreciably since 1982.)
Lifetime prevalence of hallucinogen use (unadjustedfor underreporting of PCP) began declining amongstudents at most grade levels in the mid-1970's (Figure17g), and this gradual decline continued in the uppergrades. However, it appears that a leveling occurred
*See National Survey on Drug Abuse: Main Findings 1982 by 3.D.Miller et al. Rockville, MD: National Institute on Drug Abuse, 1983.
82
9

after 1979 in the lower grades, due almost entirely tothe trends in LSD use. (The trend curves for LSD (notshown) are extremely similar in shape, though lower Inlevel, of course.)
While there is less trend data for Egl, since questionsabout grade of first use of PCP were not included until1979, some interesting results emerge. It appears thata sharp downturn began around 1979 (see Figure 17h),and the trend in lifetime experience continues down,though much more gradually in recent years. If thehallucinogen figure (17g) were adjusted for under-reporting of PCP use, it would be showing even moredownturn in recent years.
Questions about age at first use for inhalants(unadjusted for the nitrites) have been asked only since1978. The retrospective trend curves (Figure 170suggest that during the mid 1970's, experience withInhalants decreased slightly for most grade levels andthen began to rlse again. For the upper grade levelsthere has been a continued gradual rise since 1980 inlifetime prevalence, whereas the curves have beenmore uneven in the lower grades.
Since grade-at-first-use data have been gathered forthe nitrites beginning in 1979, only limited retrospec-tive data exist (Figure 17P. These do not show therecent Increase observed for the overall inhalantcategory. In fact, they show a gradual decline Incyperience with the nitrites, beginning around 1980.
Egure 17k shows that the lifetime prevalence ofser4tive use, like stimulant use, began declining for allsr3cle levels In the mid-70's, then showed somer...versal in the late 70's. (Recall that annualprevalence observed for seniors had been decliningst,!adily from 1975 to 1979.) As the graphs for the twosubclasses of sedativesbarbiturates and methaqua-1nne--show, the trend lines have been quite differentfor them at eat ler grade levels as well as in twelfthgrade (see Figui.:s 171 and 17m). Since about 1974 or1975, lifetime prevalence of barbiturate use had fallenoff sharply at all grade levels for all classes until thelate 70's; since then there has been little change(although current use continued to decline amongseniors until 1984, at least).
During the mid-70's methactualone use started to falloff at about the same time as barbiturate use in nearlyall grade levels, but dropped rather little and thenflattened. Between 1978 and 1981 there was a fairresurgence in use in nearly all grade levels; but since1982 there has been a sharp decline.
83
9,4

Lifetime prevalence of tranquilizer use (Figure 17n)also began to decline at all grade levels In the mid-70's. Overall, it would appear that the tranquilizertrend lines have been following a similar course to thatof barbiturates. So far, the curves are different onlyin that tranquilizer use continued a stcady declineamong eleventh and twelfth graders, while barbiturateuse did not.
Though a little difficult to see, the heroin lifetimeprevalence figures for grades 9 throug7Trall begandeclining in the mid-1970's, then leveled, and show noevidence of reversal as yet (Figure 17o).
The lifetime prevalence of use of opiates other thanheroin luo remained quite flat at all grade levels sincethe mid-70's (Figure 17p).
Figure 17q presents the lifetime prevalence curves forcigarette smoking on a daily basis. It shows dramat-ically that Initiation to daily smoking was beginning topeak at the lower grade levels in the early to mid-1970's. This peaking did not become apparent amonghigh school seniors until a fey years later. In essence,these changes reflect in large part cohort effects--changes which show up consistently across the ageband for certain class cohorts. Because of the highlyaddictive nature of nicotine, this is a type of drug-using behavior in which one would expect to observeenduring differences between cohorts if any areobserved at a formative age. The classes of 1982 and1983 showed some leveling of the previous decline, butthe classes of 1984 and 1985 showed an encouragingresumption of the decline while they were in earliergrade levels.
The curves for lifetime prevalence of alcohol at highergrade (11-12) levels (Figure 170 ale very flat,reflecting little change over a decade. At the 7-10thgrade levels, the curves show slight upward slopes inthe early 1970's, indicating that compared to the oldercohorts (prior to the class of 1c)78), more recentclasses initiated use at earlier ages. For example, 30%of the class of 1975 first used alcohol in ninth grade orearlier, compared to 55 or 56% for all classes since1978. These changes are relatively small, however.(Females account for most of the change; 42% offemales in the class of 1975 first used alcohol prior totenth grade, compared to 51 to 52% for all classessince 1981.)
84
9

FIGURE 17a
Use of Any Illicit Drugs Trends in LifetimePrevalence for Earlier Grade Levels
Based on Rerospective Reports from Seniors
Data Derived From theGraduating Close all
100o 4975o 1976
90 A 4977a 04978
0 497980O 1980a 4981g TO At 1182
4983g 60 01984 12 th grade
e 498511th gradea) 50
(r) 40 10th grade70; 30
W 20ce
8 th gradeO . 10
9 th grade
6th rade
.-..e 42th"4911th
-19 40 th
t9 9th
"9 8th
6tho
196970 '71 '72 '73 '74 '75 '7677 '78 '79 '80 '81 '82 '83 '84 '85
NOTE: The dotted lines connect percentages which result if non-prescriptionstimulants are excluded.
9 b85

100
90m
00 1997576uii- A 49774 80o o 1978a o 1979z 70 0 1980Lai 0 19811 60 A 1982
0 1983)- 0 1984m 50 e 1985co4ig 40 121h gradei
3011 th grade;
FIGURE 17b
Use of Any Illicit Drug Other ThanMarijuana: Trends in Lifetime Prevalence
for Earlier Grade LevelsBased on Retrospective Reports from Seniors
Dote Dor Ived From theGraduating Class of:
410-0-4)...49 12th
11 th
10 th grade -°""e 10 th1 20 9th.0 th.... 9grat...0...a.
10 cm.
6ttr" .0:)"6"."*""00-...13..-601"...4313th0 6
4969 70 '71 '72 '73 '74 '75 '76 '77 '78 '79 '00 '81 '82 '83 '84 '85
NOTE: The dotted lines connect percentages which result if non-prescriptionstimulants are excluded.
9 'i 86

FIGURE I7c
Use of Any Illicit Drug Other Than Marijuana or Amphetamines:Trends in Lifetime Prevalence for Earlier Grade Levels
Based on Retrospective Reports from Seniors
100 4-
90
90
Doti Derived From theGraduating Class oh
0 19750 1976A 49770 49780 4979
70 0 1980CI 4981
60 A 19824983
0 198450 e 4985
4012th Grads
30 41th
20 iotho
10 9th 40.-43,3_02.4..0--'e'.0
Sthet 1111111969 '70 '71 172 73 '74 '76 '77 '78 '79 '80 '81 '82 '83 '84 '85
9887
154-831 0 - 86 - 4

FIGURE 17d
Marijuana: Trends in Lifetime Prevalence for Earlier Grade LevelsBased on Retrospective Reports from Seniors
100 Data Derived From theGraduating Class ofs
90
70
60
50
40
30
20
8 th grade
O 1975o 1976A 4977o 4978o 4979O 1980G 4981
19824983
0 498511 th grade
0 1984 12 th grade
10 th grade
9 th grade
Ett,ggc,12c=stt2=_L.._L_L_1969'70 '71 172 '73 174 175176 '77 '78 '79 '80 '81 '82 '83 '84 '85
9
88

FIGURE 17e
Cocaine: Treads in Lifetime Prevalence for Earlier Grade LevelsBased on Retrospective Reports from Seniors
40
0wict90 30z
g01#., 20MItami3
w 100Ccwa.
0
Data Derived From theGraduating Close off
'713 7
o 19750 1976A 49770 49780 49790 19800 49819 19829 49830 4984A 4985
12th grade11th grade
10111 grade9th grade
eth grade6th grade
1968 0 II '72 '73 14 '78 ' 8 '78 '80 '81 '82 '83 '84 '85
89 l t) 0

FIGURE 17f
Stbnu lents: Trends in Lifetime Prevalence for Earlier Grade LevelsBased on Retrospective Reports from Seniors
40
30
20
10
Oata Derived From theGraduating Class oft
O 19750 1976A 4 977
4978O 1979O 1980G 1981A 1982O 19830 1984 12th grade
4985
11th grade
10 th grade
91h grade
St h
8th grade.906th grade
....0..02..0....0=11=61=tazoith--1-616thi -1 I 1
1969'70 '71 '72 '73 '74 '75 '76 '77 '78 '79 '80 '81 '82 '83 '84 '85
'"o9 42th
14th
40th
NOTE: The dotted lines connect percentages which result if nonprescriptionstimulants are excluded.
1 0 190

FIGURE 17g
Hallucinogens: Trends in Lifetime Prevalence for Earlier Grade LevelsBased on Retrospective Reports from Seniors
40Data Derived From the
Graduating Class oh
O 19750 1976A 49770 4978O 4979O 198019 4 981
19824983
O 19840 4985
CIlaI-4U5 30zlaCa4CC0>-CDO 20lacan0xIuiz 10c.)crlaa. 9th grad
8th grade6thgao....odes2z2=8=8:1°niftier° 'T1 '72 '73 '74 '75 '76 'TT '78 '79 '80 '81 '82 '83 '84 '85
92 1 .).2

FIGURE 17h
PCP: Trends in Lifetime Prevalence for Earlier Grade LevelsBased on Retrospective Reports from Seniors
40 Data Derived From theGraduating Class oft
O 19790 1980G 1981
19825 30 0 1983
0 49840 1985
>-co 20
0 12th grade
1 10 11 th grade
6 10 th gradece
9th gradea.eth grade 0--'4116-4.."-0--e
6!11 griadtm.
196970 '71 '72 '73 '74 '75 '76 '77 '76 '79 '80 '81 '82 '83 '84 '85
1
92

FIGURE 171
Inhalants: Trends in Lifetime Prevalence for Earlier Grade LeveeBased on Retrospective Reports from Seniors
40 Dote Derived From theGraduating Class oft
o 19780w 0 1979
0 1980a o 198125 30 0 1982z 0 1983
0 19840 1985
18 20
iox 12 th grade3 II th grad
10 10th grade9th graft
cew
0
6 th grade
1989'70 '71 '72 '73 '74 '75 '76 77 '78 '79 '80 '81 '82 '83 '84 '85
93 FA.
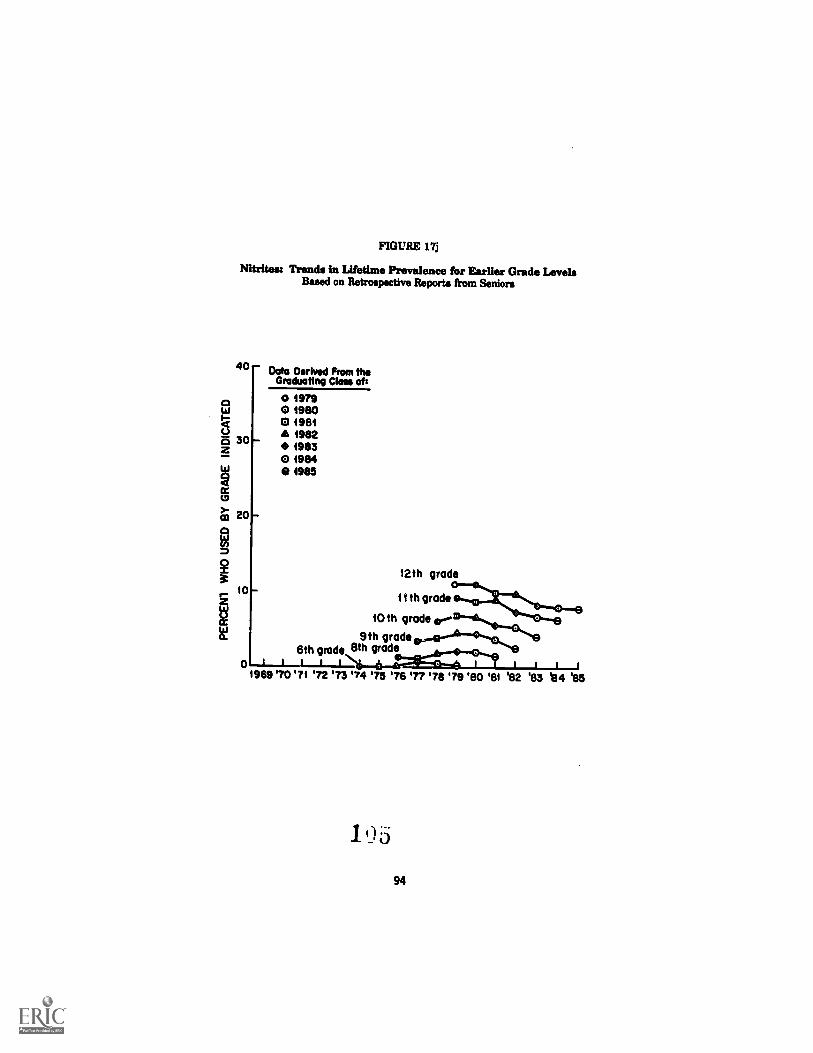
FIGURE 17j
Nitrites: Trends in Lifetime Prevalence for Earlier Grade LevelsBased on Retrospective Reports from Seniors
40 Data Derived From thsGraduating Class of:
0 19790 1980O 4981
19824983
0 4984Et 4985
121h grade
10 th grade
11 th grade
9th grade 40,410"421"-.'"<"4%e61h grudeltil:_priac
1969 '70 '71 '72 '73 '74 175 '76 '77 '78 '79 '80 '81 '82 '83 '84 '85
105
94

FIGURE 17k
Sedativei: Trends in Lifetime Prevalence for Earlier Grade LevelsBased on Retrospective Reports from Seniors
Oda Derived From theGraduating Class ot:
40
30
20
o 19750 1976A 4977o 4978o 19790 1980O 4981A 1982
49830 4984e 4985
12 th grade
11th
10 10th
01969'70 '71 72 '73 174 '75 76 '77 '78 '79 '80 '81 '82 '83 '84 '85
6th et9th
95 1

FIGURE 171
Barbiturates: Trends in Lifetime Prevalence for Earlier Grade LevelsBased on Retrospective Reports from Seniors
40Data thrived From tits
Graduating Class oft
0 49750w 0 1976t-4 A 49770 0 4978o 302 0 4979
0 1980ta0 0 49814 A 1982mO 0 4983>- 0 4984alt 20 e 4985
§ 12th grade
11th gradeo
10th grade
m
§re
a.w 91h grade
Elth grade61h grade
0--1969 '70 '71 '72 73 '74 '75 '76 '77 '78 79 '80 '81 '82 '83 '84 '85
FY/96

FIGURE 17m
Methagualone: Trends in Lifetime Prevalence for Earlier Grade LevelsBased on Retrospective Reports from Seniors
40
30
20
Dote Derived From theGraduating Class of:
o 1975o 1976A 4977co 4978O 4979o 198013 1981A 1982
1983o 19840 4985
1011th
10th gradegrade .12th grade
9th grade8th gra
6th grade0
1969 '70 '71 '72 173 '74 75 '76 '77 '78 19 '80 '81 '82 '85 '84 '85

noun on
Waage Wawa Treads in LAS** Prevalence ter Earlier Ore& lamasBend is Eareepertive Reports preen Seniors
DIA Serial Pew Steeneall011 Clan NI40
NMWM41071'
407040711
0111041101
1100111113
41104411415
1 "
42th grade
I Oh
94h0.42/w -N24-41%.,te
MN '70 '71 '72 '73 '74 '75 '75 '77 '78 '78 'SO '81 '82 '83 '84 '55
19998

FIGURE 170
Hereim Trends in Lifetime Prevalence for Earlier Grads LevelsBased on Retrospective Reports from Seniors
40
30
20
810
01969 '70 '71
Date Derived from theGraduating Clem oft
o 1975197649774978
o 19791980
O 498119824983
0 49844985
12th grade11th grads
10th grade9th grad
8 th grade6th grads
'72 '73 '74 '75 '76
99
'77 '78 '79 '80
11 0
'81 '82 '83 '84 '85

FIGURE 17p
Other Opiate.: Trend. in Lifetime Prevalence for Earlier Grade Level.Based on Retrospective Reports from Seniors
40 Data Derived From theGraduating Class oft
O 49750 1976A 4977
4978O 4979O 1980O 4984A 1982O 49830 4984
4985
10 121hII lh grods
10Ih grade9Ih grade ../:1-t"-c'%0..-0-0--er--4°--1
8Ih
06Ih grade
1969'70 '71 '72 '73 '74 '75 '76 17 '78 '79 '80 '81 '82 183 184 '85
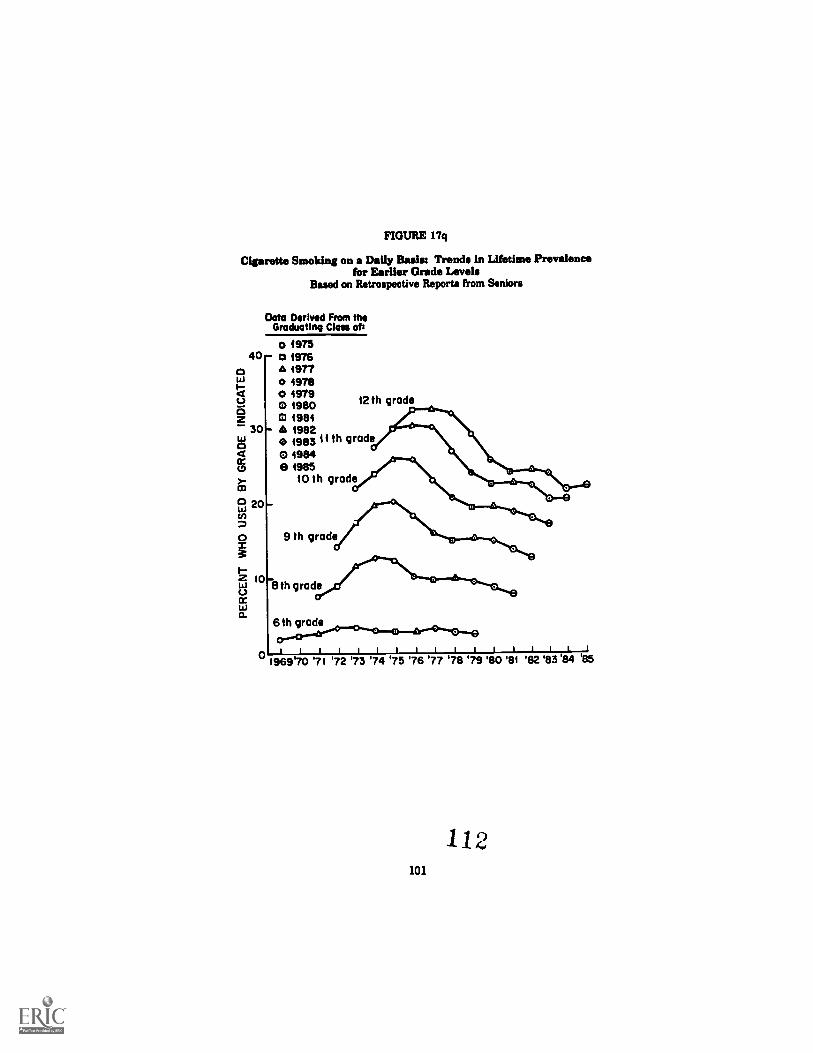
FIGURE 17q
Cigarette Smoking on Daily Basim Trends in Lifetime Prevalencefor Earlier Grade Levels
Based on Retrospective Reports from Seniors
Data Derived From theGraduating Class ots
O 197540 CI igyg
0LaI-CIU0Z
30La04cr0>-co
0 20wcr,m0X31Z 10wUreLaO.
A 4977O 4978O 4979O 1980 12th grade
0 1981
O 4983 11th grade0 498443 4985
10 th grade
A 1982
9 th grade
8th grade
ot 1
1969'70 '71III i I II I a 11111_4
'72 '73 '74 '75 '76 '77 '78 '79 '80 '81 '82 '83 84 '85
101
112

FIGURE 17r
Alcohol: Trends in Lifetime Prevalence for Earlier Grade LevelsBased on Retrospective Reports from Seniors
100
90
70
8g 60CD
m 50
40c::
3 30
w 20c.)ccLs!
10
1-
1_
12th grade
11th grade
10th grad
9 th grad
_8 th
6 th grade
1969'70 '71 '72 73 '74 '75 '76 '77 '78 '79
113
102
Data Oerived From theGraduating Clan do
0 4975o 1976A 49770 49780 19790 19800 4981
19820 49830 1984e 4985
I 1 1 1 I 1
'80 '81 '82 '83 '84 '85

DEGREE AND DURATION OF HIGHS
On one of the five questionnaire forms, seniors who report use of a drugduring the prior twelve months are asked how long they usually stayhigh on that drug and how high they usually get. These measures weredeveloped both to help characterize the drug-using event and to provideindirect measures of dose or quantity of drugs consumed.
Figure 18 shows the proportion of 1985 seniors who saythat they usually get "not at all" high, "a little" high,"moderately" high, or "very" high when they use agiven type of drug. The percentages are based on allrespondents who report use of the given drug class inthe previous twelve months, and therefore each barcumulates to 100%. The ordering from left to right isbased on the percentage of users of each drug whoreport that they usually get "very" high. (The width ofeach bar is proportional to the percentage of allseniors having used the drug class in the previous year;this should serve as a reminder that even though alarge percentage of users of a drug may get very high,they may represent only a small proportion of allseniors.)
The drugs which usually result in intense highs are thehallucinogens (LSD and other hallucinogens), heroin,and methaqualone (Quaaludes). (Actually, thisquestion was omitted for heroin beginning in 1982, dueto small numbers of cases available each year; but anaveraging across earlier years indicated that it wouldrank very close to LSD.)
Following closely are cocaine and mariluana withroughly two-thirds of the users of each saying theyusually get moderately high or very high when usingthe drug.
The four major psychotherapeutic drug classesbarbiturates, opiates other than heroin, tranaullizers,and stimulantsare less often used to get high; butsubstantial proportions of users (from 23% for tranqui-lizers to 44% for barbiturates) still say they usuallyget moderately or very high after taking these drugs.
Relatively few of the many seniors using alcohol saythat they usually get !try high when drinking, althoughnearly half usually get at least moderately high.However, for a given individual we would expect morevariability from occasion to occasion in the degree ofintoxication achieved with alcohol than with most of
103 11 4

6
100
90
80
70
60
50
40
30
20
10
0
FIGURE 18
Degree of High Attained by Recent User.
44,
Aft?93r0.c
iNot at all High
A Little HighModerately High
Very High
NOTE: The width of each bar is proportionate te the number of seniors reportingany use of each drug in the prior 12 months. Heroin is not included inthis figure because these particular questions are not asked of the smallnumber of heroin users.
115104

10090
80
70 -
GO
50
40
30
20
10
0
-h-
FIGURE 19
Duration of High Attained by Recent Users
i
1 i
iUsually Don't Get High
One toTwo Hours
Three toSix Hours
Seven Hours or More
of fie4., eq.
NOTE: The width of each bar is proportionate to the number of seniors reportingany use of each drug in the prior 12 months. Heroin is not included inthis figure because these particular questions are not asked of the smallnumber of heroin users.
116105

the other drugs. Therefore, many drinkers surely getvery high at leant sometimes, even if that is not"usually" the case.
Figure 19 presents the data on the duration of thehighs usually obtained by users of each class of drugs.The drugs are arranged in the same order as forintensity of highs to permit an examination of theamount of correspondence between the degree andduration of highs.
As can be seen in Figure 19, those drugs which resultin the most intense highs generally tend to result inthe longest highs. For example, other hallucin-
and methaaualone rank one through threerespectively on both dimensions, with substantialproportions (from 18% to 60%) of the users of thesedrugs saying they usually stay high for seven hours ormore.
However, there is not a perfect correspondencebetween degree and duration of highs. The highsachieved with mariluana, although intense for manyusers, tend to be relatively short-lived in comparisonwith most other drugs. The majority of users usuallystay high two hours or less, and the modal time is oneto two hours (32%), but over one-third (34%) reportusual highs lasting 3-6 hours.
For cocaine users the modal high is one to two hours,though almost as many stay high three or more hours.
The modal and median duration of highs for barbit-urates and methaaualone are three to six hours. Usersof opiates other than heroin, stimt_a_t,slan and ping-llzers report highs of slightly shorter duration.
In sum, the drugs vary considerably in both theduration and degree of the highs usually obtained withthem, though most have a median duration of one totwo hours. (These data obviously do not address thequalitative differences in the experiences of being"high.") Sizeable proportions of the users of all ofthese drugs report that they usually get high for atleast three hours per occasion, and for a number ofdrugsparticularly the hallucinogens--appreciableproportions usually stay high for seven hours or more.
Trends in Degree and Duration of Highs
There have been several Important shifts over the lastseveral years in the degree or duration of highs usuallyexperienced by users of the various drugs.
1 1 7 106

For cocaine1 the proportion who say they usually gethigh for only two hours or less increased from 36% in1977 to 54% in 1981, where it has remained since,reflecting a substantial shortening and then leveling inthe average duration of highs. There was also somemodest decline in the average degree of high attainedbetween 1977 and 1981, again with little change since.
For opiates other than heroin, there has been a fairlysteady decline since 1975 in both the intensity of thehighs usually experienced and in the duration of thosehighs. In 1975, 39% said Fery usually got "very high"vs. 10% in 1985. The proportion usually staying highfor seven or more hours dropped from 28% in 1975 to14% in 1985. This substantial shift has occurred Inpart because an increasing proportion of the users saythey do not take these drugs "to get high" (4% in 1975vs. 21% in 1985).
Stimulants showed a substantial decrease betweenTY/57,Tnd 981 in the proportion of recent users usuallygetting very high or moderately high (down from 60%in 1975 to 37% In 1981). Consistent with this, theproportion of users saying they simply "don't take themto get high" increased from 9% in 1975 to 20% by1981. In addition, the average reported duration ofstimulant highs was declining; 41% of the 1975 userssaid they usually stayed high seven or more hours vs.only 17% of the 1981 users.* In 1982 the revisedversion of the question about stimulant use wasintroduced into the form containing subsequentquestions on the degree and duration of highs. Basedon this revised form, there has been some continueddrop in the duration of highs obtained, and (to a lesserextent) in the degree of highs obtained.
These substantial decreases In both the degree and theduration of highs strongly suggest that there has beensome shift in the purposes for which stimulants arebeing used. An examination of data on self-reportedreasons for use tends to confirm this conclusion. Inessence, between 1979 and 1984 there had been arelative decline in the social/recreational reasons foruse and since 1976 there has been an increase in the
*The questionnaire form containing the questions on degree andduration of highs Is one on which the amphetamine questions wereclarified in 1982, t o eliminate the inappropriate inclusion of non-prescription stimulants. One might have expected this change to haveIncreased the degree and duration of highs reported, given that realamphetamines would be expected to have greater psychological impacton the average; but the trends still continued downward that year.
107 118

frequency with which recent users mention "to loseweight" (from 26% in 1976 to 41% in 1984), "to getmore energy" (from 56% to 69%), "to stay awake"(from 52% to 62%), and "to get through the day" (from22% to 30%). "To feel good or get high," which in 1976was the first ranked reason at 62% of recent ampheta-mine users, dropped fairly steadily to 45% in 1984,making It the fourth ranked reason. Similarly, "tohave a. good time with my friends," which reached ahigh of 38% in 1979, dropped to 31% in 1980 and to30% in 1984.
The 1985 results suggest that, although intensity andduration of highs continued their decline, there was nofurther decline in social/recreational reasons for use(to get high and to have a good time with friendsincreased by 4% each), and no further increase in thefrequency of use for instrumental purposes (to loseweight, to get more energy, to stay awake, to getthrough the day all decremsed, by 2-7%). Thus theshift seen between 1976 and 1984 toward moreinstrumental, and less recreational, use of stimulantsmay have ended.
In addition to the relative decline seen earlier inrecreational reasons for use of stimulants, It alsoappears that there was at least some Increase in theabsolute level of recreational use, though clearly notas steep an increase as the trends through 1981 inoverall use might have suggested. The data onexposure to people using amphetamines "to get high orfor kicks," which will bediscussed further in a sectionbelow, show a definite Inz: ease between 1976 and 1981(there was a rise of 8% just between 1979 and 1981).There was no further increase in exposure to peopleusing for those purposes in 1982, however, suggestingthat recreational use, as well as overall use, hadleveled off, and since 1982 there has been a decreasein such exposure.
In the last few years the degree and duration of highsusually achieved by the shrinking number of barbit-urate users and methaqualone users also has beendecreasing. The highs achieved by tranquilizer usersalso seem to be decreasing slightly since about 1080.
For marijuana there has been some general downwardtrending since 1978 in the degree of the highs usuallyobtained. In 1978, 73% of users said they usually got"moderately high" or "very high"--a figure whichdropped to 64% by 1983, and stands at 66% in 1985.There have also been some interesting changes takingplace in the duration figures. Recall that most
1 1 108

marijuana users say they usually stay high either oneto two hours or three to six hours. Between 1973 and1983 there was a steady shift in the proportions sayingthey stayed high three or more hours (from 32% in1975 to 35% in 1983); the proportion stands at 38% in1981 Until 1979 this shift could have been due almostentirely to the fact that progressively more seniorswere using marijuana; and the users in more recentclasses, who would not have been users in earlierclasses, probably tended to be relatively light users.(We &educe thls from the fact that the percentage ofall seniors reporting three to six hour highs remainedrelatively unchanged from 1975 to 1979, while thepercentage of all seniors reporting only one to twohour highs increased steadily (from 16% in 1973 to 2396in 1979).
However, the overall prevalence rate did not increaseover the past six years (annual prevalence actuallydropped by 10%), but the shift toward shorter averagehighs continued. Thus we must attribute this recentshift to another factor, and the one which seems mostlikely Is a ger,eral shift (even among the mostmarijuana-prone segment) toward a less frequent (orless intense) use of the drug. The drop in dailyprevalence since 1979, which certainly is dispropor-tionate to the drop in overall prevalence, is consistentwith thls interpretation. Also consistent Is the factthat the average number of "joints" smoked per day(among those who reported any use in the prior month)has been dropping. In 1976, 49% of the recent users ofmarijuana indicated that they averaged less than one"joint" per day in the prior 30 days, but by 1983 thisproportion had risen to 61%. In sum, not only arefewer high school students now using marijuana, butthose who are using seem to be using less frequentlyand to be taking smaller doses per occasion.
There are no clearly discernible patterns in theintensity or duration of the highs being experiencedwith LSD or hallucinogens other than LSD. (Data havenot been collected for highs experienced in the use ofinhalants the nitrites specifically, or PCP specifically;and the number of admitted heroin users on a singlequestionnaire form is inadequate to estimate trendsreliably.)
The intensity and duration of highs associated withalcohol use have been very stable throughout the studyperiod.
109 120

ATTITUDES AND BELIEFS ABOUT DRUGS
This section presents the cross-time results for three sets of attitudeand belief questions. One set concerns seniors' views about how harmfulvarious kinds of drug use would be for the user, the second asks howmuch they personally disapprove of various kinds of drug use, and thethird deals with attitudes on the legality of using various drugs underdifferent conditions. (The next section covers the closely related topicsof parents' and friends' attitudes about drugs, as the seniors perceivethe m.)
As the data below. show, overall percentages disapproving various drugs,and the percentages believing their use to involve serious risk, both tendto parallel the percentages of actual users. Thus, for example, of theIllicit drugs marijuana is the most frequently used and the least likely tobe seen as risky to use. This and many other such parallels suggest thatthe individuals who use a drug are less likely to disapprove use of it orto view its use as Involving risk. A series of individual-level analysesof these data confirms this conclusion: strong correlations existbetween individual use of drugs and the various attitudes and beliefsabout those drugs. Those seniors who use a given drug also are morelikely to approve its use, see it as less dangerous, and report their ownparents and friends as being at least somewhat more accepting of itsuse.
The attitudes and beliefs about drug use reported below have beenchanging during recent rars, along with actual behavior. In particular,views about marijuana lite, and legal sanctions against use, have shownimportant trends.
Beginning in 1979, scientists, policy makers, and in particular theelectronic and printed media, have given considerable attention to theincreasing levels of regular marijuana use among young people, and tothe potential hazards associated with such use. As will be seen below,attitudes and beliefs about regular use of marijuana have shifteddramatically since 1979 in a more conservative directiona shift whichcoincides with a reversal in the previous rapid rise of daily use, andwhich very likely reflects the impact of this increased public attention.
Perceived Harmfulness of Drugs
Beliefs in 1983 about Harmfulness
A substantial majority of high school seniors perceiveregular use of any of the illicit drugs as entailing"great risk" of harm for the user (see Table 13). Some86% of the sample feel this way about herointhe
121 110

highest proportion for any of these drugswhile 83%associate great risk with using LSD. The proportionsattributing great risk to cocaine barblturates, andamphetamines are 79%, 68 , and 67% respect veiy.
Regular use of cigarettes (i.e., one or more packs aday) is judged by two-thirds of all seniors (67%) asentailing a great risk of harm for the user.
Regular use of mariluana is judged to involve greatrisk by 70% of the sample, slightly more than judgecigarette smoking to involve great risk, perhaps in partbecause marijuana can have dramatic short-termimpacts on mood, behavior, self-control, etc., inaddition to any long-term physiological impacts.
Regular use of alcohol was more explicitly defined inseveral questions. Very few (24%) associate much riskof harm with having one or two drinks almost daily.Only four in every ten (43%) think there is great riskinvolved in having five or more drinks once or twiceeach weekend. Fully two-thirds (70%) think the usertakes a great risk in consuming four or five drinksnearly every day, but this means that about a third ofthe students do not view this pattern of regular heavydrinking as entailing great risk.
Compared with the above perceptions about the risksof regular use of each drug, many fewer respondentsfeel that a person runs a "great risk" of harm by simplytrying the drug once or twice.
Very few think there is much risk in using marijuanaexperimentally (1590 or even occasionally (23%).
Experimental use of the other illicit drugs, however, isstill viewed as risky by a substantial proportion. Thepercentage associating great risk with experimentaluse ranges from about 25% for amphetamines andbarbiturates to 47% for heroin. Despite the amountof negative publicity cocaine use has receivedrecently, only about a ti--77r1 34%) see great riskinvolved in experimenting with it. This suggests onereason why so many young people have eventuallygotten into trouble with this extremely dependence-producing drug.
Practically no one (5%) believes there is much riskinvolved in trying an alcoholic beverage once or twice.
Trends in Perceived Harmfulness
Several very important trends have been taking placein recent years in these beliefs about the dangers
111
1 22

Q. Kew assh de ps 121.2 pushINS Uni Ing Wombs*rylryliealry se la eauways), If airy.
Try siseysems ease se WINSmile emelIseu sesuiseellySmile leseeseme Nolo*Ta LSD Mu el twinTele UM NOW,fer unite emu el twinTele Nubs neelselyTry hems sou se swissTele Well amelseidlyfele Sesele lepleely
4062.2suuless use et WIN01001eubes Papistry
Ter liesblUesise eese se SeiseTels Iselaseseis ispleelyTry see se ewe Mike Use
&seas bump (best,NW% NUNN
Tabs see se ewe Make weftmy dey
'Ns Ma se Su &We see*eury des
Neu eve se uses MIAs ewese WIN sea ereebeW
Saslie eft et Nom pule etelpeelles per dey
emu. N
TABLE 15
Treads la Perceived Elsredidnees of Drugs
Potent miss "met risk"
Clueet
MIClue
ofNM
Clueof
MIClue
of1121
Clemoflin
Clueof
lthClue
of1111
Clueofall
Clueof
AllClue
of1111
Clueof
1111'54-15dust
12.1 11.4 9.5 S. 1 9.4 10.0 12.0 11.5 12.7 14.7 14.11 +0.1111.1 15.0 18.4 12.4 12.5 14.7 19.1 152 20.1 22.5 24.5 + La42.8 U.S $11.4 24.9 42.0 50.4 57.11 50.4 112.11 SSA 70.4 +11.5.41.4 07 41.2 42.7 41.5 43.9 46.5 44.0 44.7 43.4 42.5 -1.9S IA 90.0 79.1 $1.1 $2.4 Se .0 08.5 U.11 $2.11 $11.0 22.11 -0.942S $9.1 $11.11 U.2 $1.5 111.11 $2.1 112.0 22.0 $5.7 24.0 -1.772.1 722 1111.2 11L2 0.5 112.2 71.2 72.0 74.2 79$ 79.0 +0.200.1 1111.9 541.11 31.9 50.4 112.1 529 51.1 50.0 49.11 47.2 -21171.11 75.0 71.9 71.4 70.9 70.9 722 99.3 71.0 70.7 09.$ -0.957.2 ILI $0.1 KS 27.5 $5.2 27.5 115.0 $1SA $7.2 $10.0 -1.2$6.4 1111.4 $0.5 29.9 211.7 29.7 WA K2 24.7 115.4 25.2 -0.2KO 57.2 1111.9 $7.1 0.9 0.1 811.1 14.7 U.S 17.1 87.2 +0.124.11 112.5 $1.2 $1.3 $0.7 $0.9 04 27.5 27.0 27.4 211.1 -1.255.1 87.7 OSA 55.4 71.0 722 119.9 117.11 $7.7 25.5 58.11 -0.9
5.2 4.3 4.1 24 4.1 11.0 4.5 11.5 4.2 4.5 5.0 +0.4
21.0 21.2 12.5 19.0 92.11 10.2 21.5 21.5 21.6 23.0 24.4 +1.4
112.11 111.0 ILO 112.1 ILI 05.7 114.5 56.5 111.II 115.4 WS +1.4
PA $7.0 54.7 $4.5 $4.9 211.9 $11.11 $0.0 U.5 41.7 42.0 +1.2
512 511.4 511.4 59.0 SLO 03.7 58.8 50.5 01.2 1111.11 116.5 +2.7(2004) (U26) ($570) (2770) (2250) ($224) (11004) (11557) ($205) (112112) (2250)
v011e Level et elpilleree dIllensee Nelms the two mod resist alums s .05, .01, us .001.duvet eftseedess VIM (1) N. el* (2) IN& deli Ileimele del. (4) &est shiM, sad (5) Can't say, dreg eneuelear.
123

associated with using various drugs (see Table 13 andFigures 20 and 21).
One of the most important trends involves mariluana(Figure 20). From 1973 through 1978 there had been adecline in the harmfulness perceived to be associatedwith all levels of marijuana use; but in 1979, for thefirst time, there was an increase in theseproportionsan increase which preceded any appre-ciable downturn in use and which has continued fairlysteadily since then. By far the most impressiveincrease has occurred for regular marijuana use, wherethe proportion perceiving it as involving a great riskhas doubled in seven yearsfrom 33% in 1978 to 70%in 1983. This dramatic changewhich continuedvigorously in 1985 with a significant 4% increase from1984has been occurring during a period in which asubstantial amount of scientific and media attentionhas been devoted to the potential dangers of heavymarijuana use. While there have been some upwardshifts in concerns about the harmfulness of occasional,and even experimental, use, they have been nowherenearly as large, though both did continue in 1983.
There also had been an important increase over alonger period in the number who think pack-a-dayc arette smoking involves great risk to the user (from3 % in 1975 to 64% in 1980). This shift correspondedwith, and to some degree preceded, the downturn inregular smoking found in this age group (compareFigures 9f and 20). But in 1981 this statistic showedno further increase (presaging the end of the decline inuse), and the figures for 1982 and 1983 actually showedsome reversal of that trend. However, in 1984 therewas once again a resumption of the trend, with anearly 3% jump in the proportion seeing great riskbeing associated with regular smoking, followed byanother 3% increase in 1985. Nevertheless, what maybe most important is that about a third (32.0%) ofthese young people do not believe there is a great risk,despite an that is known today about the healthconsequences of cigarette smoking.
For most of the other lllicit drugs, the period from1975 to 1979 marked a modest but consistent trend inthe direction of fewer students associating much riskwith experimental or occasional use of them (Table 13and Figure 21). Only for amphetamines and barbitu-rates has this trend continued beyond 1979, until aboutMT In both cases. Over the last several years therehas been little change, although perceived risk of harmin experimental or occasional use of the illicit drugsother than marijuana all dropped slightly in 1983.
113 124

FIGURE 20
Trends in Perceived Harmfulness: Marijuana and Cigarettes
Smoke marijuana70 regularly.0.,...° Smoke one or more
pocks of cigarettesSO per day
11 40
Ii 30
i 201r
40Try marijuana onceor Nice
Smoke marijuanaoccasionally
0 t ill t I1975 4976 1977 1978 1979 4980 1981 1982 1983 1964 1985
125 114
The percentage who perceived great risk in ti_IlAncocaine once or twice dropped from 43% in 1975 to31% in 1980, which generally corresponds to a periodof rapidly increasing use. But perceived risk thenbegan to inch upward over the next four years, to 36%in 1984; a slight decrease in 1983 leaves the currentfigure at 34%. 'Me proportion seeing great rlsk Inrekular cocaine use also dropped somewhat from 1973to 1977 and remained fairly level until 1980; but thenrose 3% over the next three years before jumping afull 4.3% In 1984 alone. In 1983 this proportionremained stable at 79%.
In sum, between 1973 and 1979 there was a distinctdecline in perceived harmfulness associated with useof all the Illicit drugs. Since 1979, there has been adramatic Increase In concerns about regular marijuanause, and a more modest Increase In concerns about useof that drug at less frequent levels. In general,concerns about use of other Illicit drugs have changedrather little over the last several years, althoughperceived risk In regular use of cocaine has Increased,and risks associated with amphetamine and barbiturateuse have dropped slightly.
Beliefs concerning the risk associated with alcohol useat various levels have remained largely unchanged overthe past eight years. The one exception occurred withoccasional heam drinklmb where the proportionperceiving great risk rose from a low of 33% In 1979 to43% in 1983. Some 3% of this 8% change occurred in1984 alone, the first year In which the reportedprevalence of this type of drinking actually declined.Thus the gradual change In beliefs about the riskinessof this behavior preceded a change In use by severalyearsonce again suggesting the Importance of thesebeliefs in determining behavior.
Personal Disapproval of Drug Use
A different set of questions was developed to try to measure anygeneral moral sentiment attached to various types of drug use. Thephrasing, "Do you disapprove cf people (who are 18 or older) doing eachof the following" was adopted.
Extent of DisaPProval in 1985
The vast majority of these students do not condoneregular use of any of the Illicit drugs (see Table 16).Even regular marijuana use is disapproved by 86%, andregular use of each of the other illicits receivesdisapproval from between 93% and 98% of today's highschool seniors.
115
126

FIGURE 21
Trends in Perceived Harmfulness: Other Drugs
Try heroinonce or twiceTry LSDonce or twice
Try cocaineonce or twice
Try omphetominesonce or twice
4975 4976 4977 4978 4979 1980 1981 4982 4983 4984 1985
127116

Smoking a pack (or more) of cigarettes per day re-ceives the disapproval of 72% of the age group.
Drinkinit at the rate of one or two drinks daily receivesdisapproval from 71% of the seniors. A curious findingis that weekend Singe drinking (five or more drinksonce or twice each weekend) is acceptable to moreseniors than is moderate daily drinking; only 60%disapprove of having five or more drinks once or twicea weekend. This is In spite of the fact .that moreseniors associate great risk with weekend bingedrinking (43%) than with the daily drinking (24%). Onelikely explanation for these seemingly inconsistentfindings may be the fact that a greater proportion ofthis age group are themselves weekend binge drinkersrather than regular daily drinkers. They thus expressattitudes accepting of their own behavior, even thoughsuch attitudes may be somewhat inconsistent withtheir beliefs about possible consequences.
For each of the drugs included In the question, fewerpeople indicate disapproval of experimental or occa-sional use than of regular use, as would be expected.The differences are not great, however, for the illicitdrugs other than marijuana. For example, 79%disapprove experimenting with cocaine vs. 94% whodisapprove its regular use.
For marijuana, however, the rate of disapproval variessubstantially for different usage habits. Although thegreat majority (86%) disapprove regular use, onlyabout half (31%) disapprove trying it.
Trends in Disapproval
Between 1973 and 1977 there occurred a substantialdecrease in disapproval of marijuana use at any levelof frequency (see Table 16 and Figure 22). About 14%fewer seniors in the class of 1977 (compared with theclass of 1973) disapproved of experimenting, 11%fewer disapproved of occasional use, and 6% fewerdisapproved of regular use. Since 1977, however, therehas been a substantial reversal of that trend, withdisapproval of experimental use having risen by 18%,disapproval of occasional use by 22%, and disapprovalof regular use by 20%.
Until 1980 the proportion of seniors who disapprovedtrying am hetamines had remained extremely stable(at 73% ). This proportion dropped slightly in 1981 (to71%), but increased thereafter and again reached 73%in 1983.

I-.
TABLE 16Trends in Proportions Disapproving of Drug Use
Percent "disapprovinei
Q. Do you disapprove of4mople Class Class(who are 18 or older) ing of ofeach of the following? ign pa
Try marijuana once or twice 47.0 33.4Smoke marijuana occasionally 54.8 47.8Smoke marijuana regularly 71.9 69.5Try LSD once or twice 42.8 84.6Take LSD regularly 94.1 95.3
Try cocaine once or twice 81.3 82.4Take cocaine regularly 93.3 98.9
Try heroin once or twice 91.5 92.6Take hotoin occasionally 94.3 98.0Take heroin regularly 96.7 97.5
I-. TrY amphetamines onoe or twice 74.8 75.1Co Take amphetamines regularly 92.1 92.8
Try barbiturates once or twice 77.7 81.3Take barbiturates regularly 93.3 93.6
Try one or two drinks of analcoholic beverage (beer,wine, liquor)
Take one or two drinks nearlyevery day
Take !bur or five drinks nearlyevery day
Have five or more drinks onceor twice each weekend
Smoke one or more packs of
21.8 18.2
67.6 68.9
88.7 90.7
60.8 58.6
cigarettes per day 67.5 65.9
Approx. N = (2877) (3234)
Class Class Classof of of
art_ 1978 1979
33.4 33.4 34.244.3 43.5 45.385.5 67.5 69.2
83.9 85.4 88.695.8 98.4 98.9
79.1 77.0 74.792.1 91.9 90.8
92.5 92.0 92.496.0 98.4 98.897.2 97.8 97.9
74.2 74.8 75.192.5 93.5 94.4
81.1 82.4 84.093.0 94.3 95.2
15.6 15.6 15.8
66.8 67.7 68.3
88.4 90.2 91.7
57.4 58.2 58.7
66.4 67.0 70.8
(3582) (8688) (3221)
Class Class Classof of of
ing ion gm89.0 40.0 45.549.7 52.6 59.174.6 77.4 80.6
87.3 86.4 88.898.7 98.8 96.7
76.3 74.6 76.691.1 90.7 91.5
93.5 93.5 94.698.7 97.2 96.997.6 97.8 97.5
75.4 71.1 72.693.0 91.7 92.0
83.9 82.4 84.495.4 94.2 94.4
16.0 17.2 18.2
89.0 69.1 69.9
90.8 91.8 90.9
55.6 55.5 58.8
70.8 69.9 69.4
(3281) (3610) (3851)
Classofint
Clueof
1984
Classofjig '84 - '85
cl_Lstal
46.3 49.3 51.4 +2.160.7 83.5 65.5 +2.382.5 84.7 8$.5 +0.889.1 83.9 89.5 +0.697.0 96.8 97.0 +0.277.0 79.7 79.8 -0.493.2 94.5 93.8 -0.794.3 94.0 94.0 0.096.9 97.1 96.8 -0.397.7 98.0 97.6 -0.472.3 72.8 74.9 +2.192.8 93.6 93.3 -0.383.1 84.1 84.9 +0.895.1 95.1 95.5 +0.4
18.4 17.4 20.3 +2.91
68.9 72.9 70.9 -2.0
90.0 91.0 92.0 + 1.0
58.6 59.6 60.4 +0.8
70.8 73.0 72.3 -0.7(8341) (3264) (3265)
VOTE: Level of significance of difference between the two most recent clause: s = .05, u = .01, us = .001.Answer alternatives were: (1) Don't disapprove, (2) Disapprove, and (3) Strongly disapprove. Percentages are
',shown for categories (2) and (3) comblnad."The 1975 question asked about people who are no or older."
129

During the late 1970's personal disapproval ofexperimenting with barbiturates had been increasing(from 78% in 1973 to 84% in 1979). Since then It hasremained relatively stable.
In earlier years disapproval of regular cigarettesmoking had been Increasing modestly (from 66% in1976 to 71% in 1980). It then remained fairly stablethrough 1983 before resuming its increase in 1984(when actual use resumed its decline). Disapproval isdown very slightly in 1983 (and actual use is up veryslightly).
Concurrent with the years of increase in actualcocaine use, disapproval of experimental use ofcocaine had declined somewhat, from a high of 82% in1976 down to 73% in 1979. It then leveled for fouryears, showed a statistically significant increase in1984, and remained essentially unchanged in 1983.
There has been relatively little change in attitudesregarding alcohol use, with one exception. There wasa slight softening of attitudes regarding weekend bingedrinking, with disapproval dropping from 60% in 1975to 36% in 1978; since then disapproval has beenincreasin3, and in 1983 is again at 60%.
Attitudes Regarding the Legality of Drug Use
Since the legal restraints on drug use appeared likely to be in a state offlux for some time, we decided at the beginning of the study to measureattitudes about legal sanctions. Table 17 presents a statement of oneset of general questions on this subject along with the answers providedby each senior class. The set lists a sampling of Illicit and licit drugsand asks whether their use should be prohibited by law. A distinction isconsistently made between use in public and use in privateadistinction which proved quite important in the results.
Attitudes in 1983
Most seniors (78%) favor legally prohibiting marl'uanause in public places, despite the fact that the majorityhave used marijuana themselves; but considerablyfewer (45%) feel that way about marijuana use inprivate.
In addition the great majority believe that the use inpublic of Other illicit drugs than marijuana should beprohibited by law (e.g., 78% in the case of ampheta-mines and barbiturates, 86% for heroin).
Fully 43% believe that cigarette smoking In publicplaces should be prohibited by law. More think gettldrunk in such places should be prohibited (33%).
154-831 0 - 86 - 5
119
130

TABLE 17
Trends in Attitudes Regarding Legality of Drug Use
Q. Do you think that people (whoare 18 or older) should beprohibited by law from doing
Percent saying "yes"'
'84 - '85
Classof
Classof
Classof
Classof
Classof
Classof
Classof
Classof
Classof
Classof
Classofeach of the Ibllowing?" 1975 1978 1977 1978 MI 1980 1981 1982 1083 1984 Am Ate,Smoke marijuana in private 32.8 27.5 28.8 25.4 28.0 28.9 35.4 38.8 37.8 41.0 44.7 +3.1sSmoke marijuana in public place. 83.1 59.1 58.7 59.5 81.8 80.1 87.4 72.8 73.8 75.2 78.2 +3.0sTake LSD in private 87.2 85.1 03.3 82.7 82.4 65.8 CA 87.1 88.7 87.9 70.8 +2.7Take LOD in public places 85.8 81.9 79.8 80.7 81.5 82.8 80.7 82.1 82.8 82.4 84.8 +2.46,...iv0 Take heroin in private
Take heroin in public places78.390.1
72.484.8
89.281.0
88.582.6
88.584.0
70.333.3
85.882.4
89.382.5
89.788.7
89.883.4
73.385.8
+3.5s+2.41
Take amphetamines orbarbiturates in private 57.2 53.5 52.8 52.2 53.4 54.1 52.0 53.5 52.8 54.4 58.3 +1.9Take amphetamines orbarbiturates in public places 7941 78.1 73.7 75,8 77.8 78.1 74.2 75.5 78.7 78.8 78.3 +1.5Ost drunk in private 14.1 15.8 18.8 17.4 18.3 10.7 19.8 19.4 19.9 19.7 19.8 +0.1Get drunk in public places 55.7 50.7 49.0 50.3 50.4 48.3 49.1 50.7 52.2 51.1 53.1 +2.0
Smoke cigarettes in certainspecified public places NA NA 42.0 42.2 43.1 42.8 48.0 42.0 40.5 39.2 42.5 +3.8a
Approx. N as (2820) (3285) (3829) (3783) (3288) (3224) (3811) (3827) (3315) (3238) (3254)NOTE: Level of significance of difference between the two most recent classes: a 0. .05, as .01, us .001. NA indicates data not available.'Answer alternatives were: (1) No, (2) Not sure, and (3) Yes.um. 1975 question asked about people who are "20 or older."
131

For all dru s fewer students believe that use inprivate settings should be Illegal, though in the casesof LSD and heroin, the differences are not verysubstantial.
Trends in These Attitudes
From 1973 through 1977 there was a modest decline(from 4% to 9%, depending on the substance) in theproportion of seniors who favored legal prohibition ofprivate use of any of the Illicit drugs. By 1983,however, these proportions have all increased.
Over the past six years (from 1979 to 1983) there hasbeen a sharp jump in the proportion favoring legalprohibition of marlivana use, either in private (up from28% to 45%) or in public (up from 62% to 78%).
After several years of relative stability, in 1983 therehas also been a statistically significant increase in theproportions favoring prohibition of public and privateheroin use.
For other Illicit drugs, the changes are more modest,but between 1984 and 1985 all showed increasedproportions favoring prohibition.
Getting drunk and smoking cigarettes in public alsoshowed increases in the proportions favoringprohibition.
The Legal Status of Marijuana
Another set of questions goes into more detail about what legalsanctions, if any, students think should be attached to the use and saleof marijuana. Respondents also are asked to guess how they would belikely to react to legalized use and sale of the drug. While the answersto such a question must be interpreted cautiously, a special study of theeffects of marijuana decriminalization at the state level, conducted aspart of the Monitoring the Future series, suggests that in the aggregatetheir predictions about how they would react proved relativelyaccurate.*
*See Johnston, L.D., O'Malley, P.M., and Bachman, 3.G. Marlivanadecriminalization: The Impact on youth, 1975-1980 (Monitoring theFuture Occasional Paper no. 13). Ann Arbor: Institute for SocialResearch, 1981, 83 pp.
121 132

TABLE 18
Trends in Attitudes Regarding Marijuana Laws(Entries are percentages)
Q. Then has been a great deal ofpublic debate about whethermarijuana use should be legal
Classof
Classof
Classof
Classof
Classof
Classof
Classof
Classof
Classof
Classof
ClassofWhich of the Mowing policies
would you favor?1975 1976 1977 1978 JEL1 1980 1981 1982 1983 .1184 1985
Using maripana should beentirely late 27.3 32.8 331 32.9 32.1 28.3 23.1 20.0 18.9 18.6 16.6
It should be a minor violationlike a parking ticket but not
crime 25.3 29.0 31.4 30.2 30.1 30.9 29.3 28.2 26.3 23,6 25.7It should be crime 80.5 25.4 21.7 22.2 24.0 26.4 32.1 34.7 36.7 40.6 40.8Don't know 16.8 13.0 13.4 14.6 13.8 18.4 15.4 17.1 18.1 17.2 16.9N (2617) (3264) (3022) (3721) (3278) (3211) (3593) (3615) (3301) (3230) (3238)Q. If it were legal tbr people toUSE marijuana, should it alsobe legal to SELL marijuana?
No 27.8 23.0 22.5 21.8 22.9 25.0 27.7 29.3 27.4 30.9 32.6Yea, but only to adults 37.1 49.8 52.1 53.6 53.2 51.8 48.6 46.2 47.6 45.8 43.2Yes, to anyone 16.2 13.3 12.7 12.0 11.3 9.8 10.5 10.7 10.5 10.6 11.2Don't know 18.9 13.9 12.7 13.6 12.6 13.6 13.2 13.8 14.6 12.8 13.1
N (2818) (3279) (3828) (3719) (3280) (3210) (3599) (3619) (3300) (3222) (3237)Q. If marijuana were legal to useand legally available, whichof the &Wowing would yoube most likely to do?
Not um it, even if it werelegal and available 53.2 50.4 50.6 46.4 50.2 53.3 55.2 80.0 80.1 82.0 83.0
Try it 8.2 8.1 7.0 7.1 6.1 6,8 6.0 0.3 7.2 6.8 7.5lime it about u often as I do now 22.7 24.7 28.8 30.9 29.1 27.3 24.8 21.7 19.8 19.1 17.7Use it more often than I donow 8.0 7.1 7.4 8.3 6.0 4.2 4.7 3.8 4.9 4.7 3.7Use it less than I do now 1.8 1.5 1.5 2.7 2.5 2.6 2.5 2.2 1.5 1.6 1.6Don't know 8.5 8.1 0.6 8.7 6.1 5.9 6.9 8.0 8.4 8.0 8.5N .= (2602) (8272) (8625) (3711) (3277) (8210) (3598) (8818) (3298) (3224) (3232)
133

Attitudes and Predicted Response to Legalization; 1983
As shown in Table 18, less than one-fifth of all seniorsbelieve marljuana use should be entirely legal (17%).About one out of four (26%) feel it should be treatedas a minor violationlike a parking ticketbut not asa crime. Another 17% indicate no opinion, leavingabout two-fifths (41%) who feel It still should betreated as a crime.
Asked whether they thought it should be legal to sellmarijuana If It were legal to use lt, a majority (54%)sald "yes." However, nearly all of these respondentswould permit sale only to adults, thus suggesting moreconservatism on this subject than might generally be
supposed.
High school seniors predict that they would be littleaffected by the legalization of either the sale or theuse of marljuana. Fully 63% of the respondents saythat they would not use the drug even if it were legalto buy and use, and another 19% indicate they woulduse It about as often as they do now, or less. °illy 4%say they would use It more often than at present andonly another 8% think they would try It. Some 7% saythey do not know how they would react. The specialstudy of the effects of decriminalization at the statelevel (which falls short of the hypothetical situationposited in this question) revealed no evidence of anyimpact on the use of marijuana, nor even on attitudesand beliefs concerning Its use.
Trends In Attitudes and Predicted Responses
Between 1976 and 1979 seniors' preferences fordecriminalization or legalization remained fairlyconstant; but in the past six years there has been asharp drop in the proportion favoring outright legaliza-tion (down from 32% in 1979 to 17% in 1985), whilethere was a corresponding Increase In the proportionsaying marijuana use should be a crime (from 24% to41%).
Also reflecting the recent Increased conservatismabout matijuana, somewhat fewer now would supportlegalized sale even If la were to be made legal (downfrom 65% in 1979 to 54% in 1985).
The predictions about personal marijuana use, if saleand use were legalized, have been qulte similar for allhigh school classes. The slight shifts being observedare mostly attributable to the changing proportions ofseniors who actually use marljuana.
123 134

In sum, in recent years American young people havebecome more supportive of legal prohibitions on theuse of Illegal drugs, whether used in private or inpublic. The fairly tolerant attitudes of students in thelate 70's toward marijuana use have erodedconsiderably as substantially more think it should betreated as a criminal offense and correspondinglyfewer think it should be entirely legal to use.
135
124

THE SOCIAL MILIEU
The preceding section dealt with seniors' own attitudes about variousforms of drug use. Attitudes about drugs, as well as drug-relatedbehaviors, obviously do not occur in a social vacuum. Drugs arediscussed in the medial they are a topic of considerable interest andconversation among young people; they are also a matter of muchconcern to parents, concern which often is strongly communicated totheir children. Young people are known to be affected by the actualdrug-taking behaviors of their friends and acquaintances, as well as bythe availability of the various drugs. This section presents data onseveral of these relevant aspects of the social milieu.
We begin with two sets of questions about parental and peer attitudes,questions which closely parallel the questions about respondents' ownattitudes about drug use, discussed in the preceding section. Since
parental attitudes are now included in the survey only intermittently,those discussed here are based on the 1979 results.
Perceived Attitudes of Parents and Friends
Perceptions of Parental Attitudes
A large majority of seniors In 1979 felt that theirparents would disapprove or strongly disapprove oftheir exhibiting any of the drug use behaviors shown inTable 19. (The data for the perceived parentalattitudes are not given in tabular form, but aredisplayed in Figures 22 and 23.)
Drug use appears to constitute one area in which theposition of parents approaches complete unanimity.Over 97% of seniors said that their parents woulddisapprove or strongly disapprove of their smokingmarl uana regularly, even trying LSD or ampheta-mines, or having four or five drinks every day.(Although the questions did not include more frequentuse of LSD or amphetamines, or any use of heroin, it isobvious that if such behaviors had been included in thelist virtually all seniors would have indicated parentaldisapproval.)
Even experimental use of marl uana was seen as a
parentally disapproved activity by the great majorityof the seniors (85%). Assuming that the students weregenerally correct about their parents' attitudes, these
results clearly show a substantial generationaldifference of opinion about this drug.
125136

TABLE II
Trends in Proportion of Friends Disapproving of Drug Use
Pefosol MIN Monde dlesetweveQ. Kew de you UM your AGA& Class Close Claes Class Class Class Class Class Claes Claw Classelm Mends Isel (et meat of of of of of of of of of of '84-86week( ken abut yea.. ralg
blut b I
1119- L nil 1141 LI LI slamTeas, atestioano Noe in Nato 0.6) 44.3 NA 41.8 NA 40.9 411.5 45.4 50.1
.11U
81.0 54.1 54.7 + 0.6Ise lift maims@ eesesiesally (+0.8) 04.11 NA 46.0 NA NA GOA 51.9 67.4 66.9 99.9 94.1 +1.1awaking wealsone splarly (+4,11) 75.0 NA St 1 NA 70.11 71.0 78.0 74.7 776 79.1 81.0 +13L110 esse ii Wise (4 9.0) 85.5 NA NA NA 87.9 87.4 NIA 87.5 87.8 87.6 55.6 +1,0Triad an eaybotandse esseet WM ( +2.2) 71.8 NA 80.3 NA 81.0 75.9 74.4 76.7 75.8 77.0 77.0 0.0Tab* ate es two Maks nattywavy day (+7.10 57.1 NA 71.0 NA 71.0 70.5 79.5 71.0 71.7 71.6 75.4 +1.8'Mu bet es Sneakenvy day
Nadia) Ive drabs(+OA) 88.11 NA 1111.1 NA NIA 87.9 $6.4 NA 88.0 85.1 31.2 +1.1(+4.7) $6.0 NA 511.4 NA 111.5 50.0 60.1 51.2 50.6 81.3 51.9 +4.61e
at awe easew twit* every weekend
Ileseldad
(+8.8) ILI NA 118.1 NA 78.4 74.4 711.8 70.1 71.11 78.9 71.7 -0.2
ate et mete peeks etadman ye, day
Appian. N (1466) (NA) (2911) (NA) (1715) (11765) (1120) (IOU) (17211) (1711) (1688)NOMI Wel et sysilsome efiliftwesee between the two meet toast aliases) s .06, ea .01, see .001. NA indicates data not available.°Anew altemetivee wide (I) Des% dim/peva (1) titeapprea, tad (1) lassely disapyeeve. Pereestagee iii Nown for categories (2) and (11)asebbied.
bnese Soma have bum NUNN by the fasten reported is the Aset deltas because of leek of esayarabllity of questioacontoat smugadatinistrelisen Use tut be dissuselea)
137

Also likely to be perceived as rating high parentaldisapproval (around 92% disapproval) were occasionalmariluaea use, taking one or two drinks nearly everyday, and pack-a-day cigarette smoking.
Slightly lower proportions of seniors (85%) felt theirparents would disapprove of their having five or moreAtha once or twice every weekend. This happened tobe exactly the same percentage as said that theirparents would disapprove of simply experimenting withmarijuana.
There is no reason to think that parental attitudeshave softened in the period since 1979. If anything theopposite seems more likely to be the case, given therising public concern about mar;.;uana and cocaine andthe burgeorang parents' movement against drugs.
Current Perceptions of Friends' Attitudes
A parallel set of questions asked respondents toestimate their friends attitudes about drug use (Table19). These questions ask "How do you think your closefriends feel (or would feel) about you ...." The highestlevels of disapproval for experimenting with a drug areassociated with trying IA2 (89%) and trying anamphetamine (77%). Presumably, if heroin were onthe list It would receive the highest peer disapproval;and, judging from respondents' own attitudes, experi-menting with cocaine would be slightly moredisapproved than experimenting with amphetamines,while experimenting with barbiturates would be stillless popular.
Even experimenting with marl uana is now "out" withmost seniors' friends 155% ; and a substantial majoritythink their friends would disapprove if they smokedmarijuana regularly (81%).
About three-quarters of all seniors think they wouldface peer disapproval if they smoked a pack or more ofcigarettes daily (74%).
While heavy drinking on weekends is judged by overhalf (56%) to be disapproved by their friends, substan-tially more (75%) think consumption of one or twodrink; daily would be disapproved. The great majority48%) would face the disapproval of their friends ifthey engaged in heavy daily drinking.
In sum, peer norms differ cc siderably for the variousdrugs and for varying degrees of involvement withthose drugs, but overall they tend to be quite conser-vative. The great majority of seniors have friendship
127 138

circles which do not condone use of the Illicit drugsother than marijuana, and over four-fifths feel thattheir friends would disapprove of regular marijuanause. In fact, over half of them now believe theirfriends would disapprove of their even tryingmarijuana.
A Comparison of the Attitudes of Parents, Peers,and Respondents Themselves
A comparison of the perceptions of friends' disapprovalwith perceptions of parents' disapproval shows severalinteresting findings.
First there Is rather little variability among differentstudents in their perceptions of their parents'attitudes: on any of the drug behaviors listed nearlyall say their parents would disapprove. Nor is theremuch variability among the different drugs inperceived parental attitudes. Peer norms vary muchmore from drug to drug. The net effect of these factsIs likely to be that peer norms have a much greaterchance of explaining variability in the respondent'sown Individual attitudes or use than parental norms,simply because the peer norms vary more.
Despite there being less variability in parentalattitudes, the ordering of drug use behaviors is muchthe same for them as for peers (e.g., among the illicitdrugs asked about, the highest frequencies ofperceived disapproval are for trying LSD, while thelowest frequencies are for trying marijuana).
A comparison with the seniors' own attitudes regardingdrug use (see Figures 22 and 23) reveals that on theaverage they are much more in accord with their peersthan with their parents. The differences betweenseniors' own disapproval ratings and those attributed totheir parents tend to be large, with parents seen asmore conservative overall in relation to every drug,licit or illicit. The largest difference occurs in thecase of marl uana experimentation, where only 51% ofseniors in 1985 say they disapprove vs. 85% (of 1979seniors) who said their parents would disapprove.
Trends in Perceptions of Parents' and Friends' Views
Several important changes in the perceived attitudesof others have been taking place recentlyand partic-ularly among peers. These shifts are presentedgraphically in Figures 22 and 23. As can be seen inthose figures, adjusted (dotted) trend lines have been
128
139

Introduced before 1980. This was done because wediscovered that the deletion in 1980 of the questionsabout parents' attitudeswhich up until then had beenlocated immediately ahead of the questions aboutfriends' attitudesrernoved an artifactual depressionof the ratings of friends' attitudes, a phenomenonknown as a question-context effect. This effect wasparticularly evident in the trend lines dealing withalcohol use, where otherwise smooth lines showedabrupt upward shifts in 1980. It appears that whenquestions about parents' attitudes were present,respondents tended to understate peer disapproval inorder to emphasize the difference in attitudes betweentheir parents and their peers. In the adjusted lines, wehave attempted to correct for that artifactual depres-sion in the 1975, 1977, and 1979 scores.* We think theadjusted trend lines give a more accurate picture ofthe change taking place. For some reason, thequestion-context effect seems to have more Influenceon the questions dealing with cigarettes and alcoholthan on those dealing with illicit drugs.
For each level of marijuana usetrying once or twice,occasional use, regular usethere had been a drop inperceived disapproval for both parents and friends upuntil 1977 or 1978. We know from our other findingsthat these perceptions correctly reflected actual shiftsin the attitudes of their peer groupsthat is, thatacceptance of marijuana was in fact increasing amongseniors (see Figure 22). There is little reason tosuppose such perceptions are less accurate inreflecting shifts in parents' attitudes. Therefore, weconclude that the social norms regarding marijuana useamong adolescents had been relaxing before 1979.However, consistent with the seniors' reports abouttheir own attitudes, there has been a sharp reversal inpeer norms regarding all levels of marijuana use and itcontinued in 1985.
*The correction evolved as follows: We assumed that a moreaccurate estimate of the true change between 1979 and 1980 could beobtained by taking an average of the changes observed in the year priorand the year subsequent, rather than by taking the observed change(which we knew to contain the effect of a change in question context).We thus calculated an adjusted 1979-1980 change score by taking anaverage of one half the 1977-1979 change score (our best estimate ofthe 1978-79 change) plus the 1980-1981 change score. This estimatedchange score was then subtracted from the observed change score for1979-1980, the difference being our estimate of the amount by whichpeer disapproval of the behavior in question was being understatedbecause of the context in which the questions occurred prior to 1980.The 1975, 1977, and 1979 observations were then adjusted upward by theamount of that correction factor. (Table 19 shows the correctionfactors in the first column.)
129
1 4*

400
90
90IDZ TO
1 OD
a 50
g4°E 3
20
40
FIGURE 22a
Trends in Disapproval of Illicit Drug UseSeniors, Parente, and Peers
430.01, av-o.0.44
04975 17 '79 '84 113 '85
'78 '78 '80 '82 '84Tryingmarijuanaonce or twice
0 I I4
'75 77 '79 '84 '83 '95'76 Is 'so 'az '84
Smokingmarijuanaoccasionally
A Seniorsco Parentsw Friends
1 1 1 1 i 1 1 1 1 1 1
'75 '77 '79 ts V '85'76 '76 'so '82 'ea
Smokingmarijuanaregularly
NOTE: Points connected by dotted lineshave been adlusted because of lack of comparability ofquestioncontext among administrations. (See text for discussion.)
141

400 0-o-o-o.0
90 -
BO
70
80
41. 50
40
30
20
40
FIG URE 22b
Trends in Disapproval of Illicit Drug UseSeniors, Parents, and Peers
.0......0 grAaskvekereear06.6
-
-I I I 1 1 1 1 1 1 1 1
975'77 '79 'el In 'e5'78 '78 'so 132 134Trying onamphetamineonce or twice
I I
'75 '77 '79 '84 '83 '85'78 '78 '80 '82 '84
Tryingcocolneonce or twice
c-cra-co-0
..,6-A-&4,,A-6-A-4clxv.-11:eqr6"6
75 '77 '79 '81 '63 '85'76 '78 '60 '82 '64
Trying obarbiturateonce or twice
A Seniorso Parentso Friends
Iittittliti'75 '77 79 '81 '63 '85
'76 '76 '80 '82 '84Trying LSOonce or twice
NOTE: Points connected by dotted lines have been adjusted because of lack of comparability ofquestion-oontext among administrations. (See text for discussion.)
142

FIGURE 23
Trends in Disapproval of Licit Drug UeeSeniors, Parents, and Peers
400
90 -0..cro-ce o-oAe114%1o-04\7,0
80
odea04z To
60-p
5034% 40
r.)
Ar,
ho SPoenreiorntss
a Friends2
40
1111111111111111111111It,IIIIIIIII975/7 7, '81 '83 '88'75 '7? 17, 'el '03 'ern '77 '79 131 '85/5 17 79 '81 133 '85'76 78 80 182 '84 16 78 80 82 184 '76 '78 '80 '82 '84 '76 78 '80 '82 '84Smoking one or Having five or Taking one ormore packs of mom drinks two drinks nearlycigarettes per day once or twice every dayeach weekend
NOTE: Points connected by dotted lines have been adjusted booms of lack of comparability ofquestion-context among administrations. (See text for discussion.)
Taking four orfive drinks nearlyevery day
143

Until 1979 there had been relatively little change ineither self-reported or perceived peer attitudes towardamphetamine use, but in 1981 both measures showedsignificant and parallel dips In disapproval (as use rosesharply). Since 1981 disapproval has been easing backup toward the earlier levels (as use has declined),though perceived disapproval among friends did notrise any further in 1985 despite a continuing increasein self-reported disapproval.
Peer disapproval of LSD use has been inching upwardsince 1975.
One of the larger changes In perceived peer norms hasoccurred in relation to regular cigarette smoking. Theproportion of seniors saying that their friends woulddisapprove of them smoking a pack-a-day or more rosefrom 64% (adjusted version) in 1975 to 74% in 1980. Inthe several years following, peer disapproval easedback a percent or two, only to begin rising again in1984. Overall, since 1980 peer disapproval hasfluctuated within a fairly narrow range.
For alcohol, perceived peer norms have moved prettymuch in parallel with seniors' statements about theirpersonal disapproval. Heavy daily drinking is seen asremaining disapproved of by the great majority (SS% in1985), with little systematic change over the decade.Weekend binge drinking showed some modest decline indisapproval up through 1980. It then remained levelfor about four years (while personal disapproval wasincreasing) until this year, when there was a signifi-cant 5% increase in disapproval for peers. (Recall thatthis form of episodic heavy drinking began to declinefor the first time in 1984 and continued to decline in1985.) While experimenting with alcohol is stillaccepted by the great majority (80%), there was asignificant decline of 3% in this figure in 1985.
Exposure to Drug Use br Friends and Others
It is generally agreed that much of youthful drug use is initiated througha peer social-learning process; and research has shown a high correla-tion between an individual's illicit drug use and that of his or her
friends. Such a correlation can, and probably does, refiett severaldifferent causal patterns: (a) a person with friends who use a drug willbe more likely to try the drug; (b) conversely, the individual who isalready using a drug will be likely to introduce friends to theexperience; and (c) one who is already a user is more likely to establishfriendships with others who also are users.
133
144

PE
RC
EN
TA
GE
-C
LAS
S O
F 1
985
0.0
o'8
00b
u, 0$
-,10
80
00, 0
oa
o44
),ile
fto
Ii
I
g--4
.;11
/007 fa
MI
ft3)
/4f/
14P
CP0
1=
641y
rsE
EO
Psy
c,07
°0 P
I1
&op
L,cs
Li
1111
°Nre
sII
15
N14
004
SO
P4
15
4fer
y14
/44t
sP4
It04
:004
40av
e
44ip
z,47
b/P4
reSB
I)- 4)
.440
4ts
Irm
a15
Co
1ic
.. k..s
Mau
iG
Ria
ti4N
gyp'
Do
4 m
ospa
mes
dI
it'4
gp°,
!Vir
a)00
4..
ceir
;rr
erre
sa)
A. m
rt44
,069
04E
MI
ID it

Given the potential Importance of exposure to drug use by others, wefelt It would be useful to monitor seniors' association with others takingdrugs, as well as seniors' perceptions about the extent to which theirfriends use drugs. Two sets of questions, each covering all or nearly allof the categories of drug use treated in this report, asked seniors toindicate (a) how often during the past twelve months they were aroundpeople taking each of the drugs to get high or for 'Sticks," and (b) whatproportion of their own friends use each of the drugs. (The questionsdealing with friends' use are shown In Table 20. The data dealing withdirect exposure to use may be found in Table 21.). Obviously, responsesto these two questions are highly correlated with the respondents' owndrug use; thus, for example, seniors who have recently used marijuanaare much more likely to report that they have been around othersgetting high on marijuana, and that most of their friends use It.
Exposure to Drug Use In 1985
A comparison of responses about friends' use, andabout being around people in the last twelve monthswho were using various drugs to get high, :.eveeas ahigh degree of correspondence between these twoIndicators of exposure. For each drug, the proportionof respondents saying "none" of their friends use It Isfairly close to the proportion who say that during theLast twelve months they have not been around anyonewho was using that drug to get high. Similarly, theproportion saying they are "often" around peoplegetting high on a given drug Is roughly the same as theproportion reporting that "most" or "all" of theirfriends use that drug.
Reports of exposure and friends' use closely parallelthe figures on seniors' own use (compare Figures 2 and24). It thus comes as no surprise that the highestlevels of exposure Involve alcohol; a majority (60%)say they are "often" around people using It to get high.What may come as a surprise is that fully 30% of allseniors say that most or all of their friends go so far asto get drunk at least once a week. (Thls Is consistent,however, with the fact that 37% said they personallyhad taken flve or more drinks In a row at least onceduring the prior two weeks.)
The drug to which students are next most frequentlyexposed Is marijuana. Only about one In four (27%)reports no exposure during the year. Some 24% are"often" around people using It to get high, and another27% are exposed "occasionally." But only one In five(20%) now say that most or all of their friends smokemarijuana.
Ampetamines, the most widely used class of illicitdrugs other than marijuana, Is also the one to whichseniors are next most often exposed. Some 41% of all
135
146

TABLE 20
Trends in Proportion of Friends Using Drugs(Entries are percentages)
Q. How many of your Class Claes Class Class Class Class Class Class Class Class Classblends would of of of of of of of of of of of '84-'85you estimate... 1975 nit 1977 au isli 1980 1981 1982 1983 1984 1985 change
Smoke marijuanaII saying none 17.0 17.1 14.1 13.9 12.4 13.6 17.0 15.6 19.7 22.3 20.5 -1.8II saying most or all 30.3 30.6 32.3 35.3 35.5 31.3 27.7 23.8 21.7 18.3 19.8 +1.5
Use inhalantsII saying none 75.7 81.4 81.1 80.0 80.9 82.2 83.5 81.8 83.9 80.7 78.8 -1.9II saying most or all 1.1 1.1 1.0 1.1 1.1 1.2 0.9 1.3 1.1 1.1 1.5 +0.4
Use nitritas...cri
II saying noneII saying most or all
Take LOD
NANA
NANA
NANA
NANA
78.41.9
81.01.3
82.81.2
82.50.9
85.50.7
85.01.2
84.41.0
-0.13-0.2
II saying none 83.5 69.4 68.1 70.1 71.1 71.9 71.5 72.2 78.0 76.1 75.13 -0.5II saying most or all 2.7 2.8 3.0 2.0 1.9 1.8 2.2 2.4 1.4 2.0 1.5 -0.5
Take other psychedelicsII saying none 58.8 89.7 88.6 70.8 71.8 71.8 73.7 74.4 77.9 78.7 78.0 -0.7II saying most or all 4.7 3.0 2.8 2.0 2.2 2.2 2.1 1.9 1.13 1.9 1.4 -0.5
Take PCPII saying none NA NA NA NA 72.2 77.8 82.8 82.7 85.8 85.8 84.1 -1.7% Ming most or all NA NA NA NA 1.7 1.13 0.9 0.9 1.1 1.1 1.2 +0.1
Take cocaineII saying none 88.4 71.2 139.9 88.8 81.1 58.4 59.9 59.8 82.4 81.1 58.2 -4.9ssII saying most or all 3.4 3.2 3.8 4.0 8.0 8.1 8.3 4.9 5.1 5.1 5.8 +0.7
Take heroin% Wing none 84.8 813.4 87.1 85.7 87.1 87.0 87.5 813.8 88.0 87.0 85.5 -1.5II saying most or all 0.7 0.8 0.7 0.9 0.5 1.0 0.5 0.7 0.8 0.8 0.9 +0.1
Take other narcoticsII saying none 71.2 75.9 78.3 713.8 713.9 77.13 713.9 78.1 79.2 78.13 77.2 -1.4II saying most or all 2.1 2.2 1.7 1.4 1.5 1.7 1.5 1.4 1.4 1.13 1.4 -0.2
(Table continued on next page)
147

TABLE 20 (cont.)
Trends in Proportion of Friends Using Drugs(Entries ars percentages)
Q. How many of your Class Class Class Class Class ClassMends would of of of of of ofyou estimate... 1975 let Let EH LEI plim
Take amphetamlnes% saying none 49.0% saying most or all 5.9
Take barbiturates% saying non 55.0% saying most or all 4.3
Take quuludes% saying none 68.3% saying most or all 3.0
I-. Take tranquilisers(..) % saying non 54.4s.I 11 saying most or all 3.5
Drink alcoholic beveragn% saying none 3.3% saying most or all 68.4
Get drunk at least onceweek
% saying none 17.6% saying most or all 30.1
Smolt. cigarettes% saying none 4.8% saying most or all 41.5
Approx. N (2640)
57.8 58.7 59.3 59.3 58.15.6 4.1 4.7 4.3 4.8
63.7 65.3 67.5 69.3 69.53.5 3.0 2.3 2.1 2.6
73.0 71.7 73.0 72.3 67.51.6 2.9 2.2 2.8 3.6
63.7 62.2 65.2 68.0 70.33.1 2.7 1.8 2.0 1.9
4.9 5.6 5.1 4.6 3.964.7 66.2 68.9 68.5 68.9
19.3 19.0 18.0 16.7 16.926.6 27.6 30.2 32.0 30.1
6.3 6.3 6.9 7.9 9.436.7 33.9 32.2 28.6 23.3
(2929) (3134) (3247) (2933) (2937)
Classof
Classof
Classof
Classof
Classof '84-'85ilia 1982 1983 tem 1985 Atm
51.2 49.4 53.9 54.9 56.7 +1.86.4 5.4 5.1 4.5 3.4 -1.1
68.9 68.7 71.7 73.4 72.9 -0.52.1 1.8 1.7 1.7 1.6 -0.1
65.0 64.5 70.3 73.9 74.0 +0.13.6 2.6 2.6 1.7 1.3 -0.4
70.5 70.1 73.3 73.4 74.2 +0.81.4 1.1 1.2 1.5 1.2 -0.3
5.3 4.3 4.5 5.4 5.4 0.067.7 69.7 69.0 60.6 66.0 -0.6
18.2 16.9 16.1 18.5 17.5 -1.029.4 29.9 31.0 29.6 29.9 +0.3
11.5 11.7 13.0 14.0 13.0 -1.022.4 24.1 22.4 19.2 22.8 +3.6ss
(3307) (3303) (3095) (2945) (2971)
NOTE: Laval of significance of &throne between the two most recent clones: s .05, as .01, en .001. NA indicates data not available.
148

TABLE 21Trends In Exposure to Drug Use
(Entries are percentages)
Q. During the LAST 12 MONTHS how often have Class Class Class Clam Class Class Class Classyou been around people who were taking each of of of of of of of ofof the fdlowing to get high or fbr 'kicks"? Elf ICI LEM 1979 19111 1981
Marijuana% saying not at all NA 20.5 19.0 17.3 17.0 18.0 19.8 22.1% saying often NA 32.5 37.0 39.0 38.9 33.8 33.1 28.0
LSD% saying not at all NA 78.8 80.0 81.9 81.9 82.8 82.0 83.9% saying often NA 2.2 2.0 Le 2.0 1.4 2.0 1.9
Other psychedelics% saying not at all NA 78.5 78.7 78.7 77.8 79.8 82.4 83.2% saying often NA 3.1 3.2 2.9 2.2 2.2 2.0 2.8
Cocaine% saying not at all NA 77.0 73.4 09.8 84.0 82.3 83.7 05.1% saying often NA 3.0 3.7 4.8 0.8 5.9 8.8 8.0
Heroin% saying not at all NA 91.4 90.3 91.8 92.4 92.0 93.4 92.9% saying often NA 0.8 1.1 0.9 0.7 0.4 0.0 1.0
Other narcotics% saying not at all NA 81.9 81.3 81.8 82.0 80.4 82.5 81.5% saying often NA 1.8 2.4 2.0 1.7 1.7 1.7 2.4
Amphetamines% saying not at all NA 59.0 80.3 110.1/ 58.1 59.2 50.5 49.8% saying often NA 8.8 7.9 8.7 7.4 8.3 12.1 12.3
Barbituratm'5 saying not at all NA 89.0 70.0 73.5 73.8 74.8 74.1 74.3% saying often NA 4.5 5.0 3.4 3.3 3.4 4.0 4.3
Tranquilizers% saying not at all NA 87.7 88.0 87.5 87.5 70.9 71.0 78.4% saying often NA 5.5 8.3 4.9 4.8 3.2 4.2 3.5
Alcoholic beverages% saying not at all NA 8.0 5.0 5.5 5.2 5.3 8.0 8.0% saying often NA 57.1 80.8 80.8 81.2 80.2 81.0 59.3
Approx. N (NA) (3249) (3579) (3882) (3253) (3259) (3808) (3845)
Classof
km
23.820.1
88.21.4
88.91.1
08.75.2
94.90.7
82.72.2
53.910.1
77.53.0
78.52.9
8.080.2
(3334)
Classof
1984
Classof
1211'84 - '85
25.0 28.5 +0.924.8 24.2 -0.8
87.5 88.8 -0.71.5 1.3 -0.2
87.3 87.5 +0.21.7 1.4 -0.3
84.4 01.7 -2.70.7 7.1 +0.4
94.0 94.5 +0.51.1 0.5 -0.0$
82.0 81.8 -0.42.0 1.8 -0.2
55.0 59.0 +4.0ss9.0 8.5 -2.5ss
78.8 81.1 +2.32.7 1.7 -1.0e
78.9 78.8 -0.32.9 2.2 -0.7
8.0 0.0 0.058.7 59.5 +0.8
(3288) (3252)
NOTES: Level of significance of diffbrence between the two most recent classes: .05, as so .01, us .001. NA indicates data not avallable.
143

seniors have been around someone using them to gethigh over the past year, and 7% say they are "often"around people doing this.
Nearly as many (38%) now report being exposed tococaine use during the prior year.
For the remaining illicit drugs there are far lowerrates, with any exposure to use in the past yearranging from-23% for tranquilizers, down to 6% forhero:n.
More than two of every five seniors (41%) report noexposure to illicit drugs other than marijuana.
Regarding cigarette smoking, it is interesting to notethat only about one in every four seniors (23%) reportsthat most or all of his or her friends smoke.
Recent Trends in Exposure to Drug Use
During the two-year interval from 1976 to 1978,seniors' reports of exposure to marljtja use increasedin just about the same propoarg as percentages ofactual monthly use. In 1979 both exposure to use andactual use stabilized; and since 1979 both have beendropping, though rather little in 1985 consistent withthe leveling in use. The proportion saying they areoften around people using marijuana decreased from39% in 1979 to 24% in 1985a drop of more than one-third in the past six years.
Cocaine had a consistent increase from 1976 to 1979 inthe proportions exposed to users. From 1979 to 1983there was a slight drop in exposure to use coincidingwith the slight drop in self-reported use; but in 1984and again In 1985 there were further increases inexposure to use.
From 1979 to 1983 there had been statisticallysignificant decreases in exposure to others (includingclose friends) using tranquilizers, and psychedelicsother than LSD (Including Me) which coincide withcontinued declines in the self-reported use of theseclasses of drugs. There has been little or no furtherchange since 1983, however, In exposure to the use ofthese substances.
There also had been a gradual decrease in exposure tobarbiturates and LSD from 1975 through 1980. How-ever, exposure to the use of both of these drugs thenplateaued for two years, as did the usage figures- Bothdrugs have shown further decline in use since 1981, andboth resumed their decline in exposure to use.
139 150

Trend data are only available since 1979 on friends' useof Efilt or the altrltes. For both drugs, exposure tofrieW use had dropped significantly between 1979and 1983. Only half as many seniors In 1983 (14%) saidany of their friends used PCP than said so In 1979(28%). The comparable drop for nitrites was from 22%to 13%. In 1984 there was no further drop in exposureto either drug, however, and in 1983 exposure to PCPincreased slightly as did self-reported use.
The proportion having some friends who usedamplatwines rose from 41% to 31% between 1979and 1982--parallellng the sharp Increase In reporteduse over that period. The proportion saying they werearound people wing amphetamines "to get high or forkicks" also Jumped substantially between 1980 and1982 (by 9%).* It then fell back 9% in the last threeyears (as actual use has declined).*
Between 1978 and 1981 mithigigkot use rose, as didthe proportion of seniors saying some of their friendsused. A decline in both use and exposure started in1982 and by 1985 there were 9% fewer seniors sayingthey had any friends who use quaaludes (from 33% to26% between 1981 and 1983).
The proportion saying that "most or all" of theirfriends smoke claerettes dropped steadily and substan-tially between 1976 and 1951, from 37% to 22%.(During this period actual use dropped markedly, andmore seniors perceived their friends as disapprovingregular smoking.) Between 1981 and 1983, friends' use(as well as self-reported use) remained stable, in 1984the declines in both measures resumed, but In 1983both measures showed a reversal. In 1977, the peakyear, 34% said most or all of their friends smoked; in1983, 23% made the same statement.
The proportion saying most or all of their friends gelds4;th at least once a week had been increasingstily, between 1976 and 1979, from 27% to 32%during a period in which the prevalence of occasionalheavy drinking was rising by about the same amount.After that, there was little change in either measureuntil 1954. when both declined for the first time. In
*This finding was important, since it indicated that a substantialt of the increase observed in self-reported amphetamine use was duethings other than simply an Increase in the use of over-the-counterpills or stay-awake pills, which presumably are not used to get high.lously more young people were using stimulants for recreationalposes. There still remained the question, of course, of whether theme ingredients in those stimulants really were amphetamines.
1 5 11"

6400
p 90
FIGURE 26
Trends in Perceived Availability of Drugs
(°)--13"----o-- Marijuana-
ig 50
-0 I I I I I I I I I I I
1975 4976 4977 4978 1979 1980 4981 4982 4983 4984 4985
1141
52
arnplutornines
TranquilizersBarbituratesCocaine
Other NarcoticsHallucinogens
Heroin
1985 reported friends' use did not decline, though self-reported use did. But without question, what remainsthe most impressive fact here Is that nearly a third ofall high school seniors (30% in 1985) say that most orail of their friends get drunk at least once a week!
Implications for Validity of Self-Reported Usage Questions
We have noted a high degree of correspondence in theaggregate level data presented in this report amongseniors' self-reports of their own drug use, theirreports concerning friends' use, and their own exposureto use. Drug-to-drug comparisons in any given yearacross these three types of measures tend to be highlyparallel, as do the changes from year to year.* Wetake this consistency as additional evidence for thevalidity of the self-report data, and of trends in theself-report data, since there should be less reason todistort answers on friends' use, or general exposure touse, than to distort the reporting of one's own use.
Perceived Availability of Drugs
One set of questions asks for estimates of how difficult It would be toobtain each of a number of different drugs. The answers range acrossfive categories from "probably impossible" to "very easy." While nosystematic effort has been undertaken to assess directly the validity ofthese measures, It must be said that they do have a rather high level offace validityparticularly if It is the subjective reality of "perceivedavailability" which is purported to be measured. It also seems quitereasonable to us to assume that perceived availability tracks actualavailability to some extent.
Perceived Availability in 1985
There are substantial differences in the reportedavailability of the various drugs. In general, the morewidely used drugs are reported to be available by thehighest proportion of the age group, as would beexpected (see Table 22 and Figure 25).
Mari uana appears to be almost universally available tohigh school seniors; some 86% report that they think Itwould be "very easy" or "fairly easy" for them to
*Those minor instances of non-correspondence may well resultfrom the larger sampling errors in our estimates of these environmentalvariables, which are measured on a sample size one-fifth the size of theself-reported usage measures.
1 5 3 142

TABLE 92
Trends In Reported Availability of Drugs
Q. How difficult do you thinkit would be fbr you toget each of the &Bowing
Percent saying drug would be "Fairlyeasy" or "Very easy" fbr them to ger
'84-'85Clau
ofClose
ofClass
ofClass
ofClass
ofClue
ofClass
ofClass
ofClass
ofClass
ofClass
ofWas of drugs, if youwanted soma?
gati me 1977 1E71 1979 An 1981 1982 1983 1984 1985 change
Marijuana 87.8 87.4 87.9 87.8 90.1 89.0 89.2 88.5 88.2 84.8 85.5 +0.9LSD 48.2 37.4 34.5 32.2 34.2 35.3 35.0 34.2 30.9 30.8 30.5 -0.1Some other psychedelic 47.8 35.7 33.8 33.8 34.8 35.0 32.7 30.8 28.8 28.8 28.1 -0.5Cocaina 37.0 34.0 33.0 37.8 45.5 47.9 47.5 47.4 43.1 45.0 48.9 +3.9s
I-.a. Heroin 24.2 18.4 17.9 18.4 18.9 21.2 19.2 20.8 19.3 19.9 21.0 +1.14.)Some other narcotic
(including methadone) 34.5 28.9 27.8 28.1 28.7 29.4 29.8 30.4 30.0 32.1 33.1 +1.0Amphetamines 87.8 81.8 58.1 58.5 59.9 81.3 89.5 70.8 88.5 88.2 88.4 -1.8Barbiturates 80.0 54.4 52.4 50.8 49.8 49.1 54.9 55.2 52.5 51.9 51.3 -0.8Tranquilizers 71.8 85.5 84.9 84.3 81.4 59.1 80.8 58.9 55.3 54.5 54.7 +0.2
Approx. N = (2827) (3183) (3582) (3598) (3172) (3240) (3578) (3802) (33135) (3289) (3274)
NOTE: Level of significance of difference between the two most recentcluses: e = .05, es = .01, ass = .001.'Answer alternativee were: (1) Probably impoulble, (2) Very difficult, (3) Fairly difficult, (4) Fairly easy, and (5) Very easy.
154

get-31% more than the number who report everhaving used it.
After marijuana, the students indicate that thepsychotherapeutic drugs are the most available tothem: amphetamines are seen as available by 66%,tranquilizers by 55%, and barbiturates by 51%.
About half of the seniors (49%) see cocaine as readilyavailable to them.
j.jI2, other psychedelics, and opiates other than heroinare reported as available by only about one of everythree or four seniors (31%, 26%, and 33%,respectively).
Heroin is seen by the fewest seniors (21%) as beingeasy to get.
The majority of "recent users" of nearly all drugsthose who have illicitly used the drug in the pastyearfeel that it would be easy for them to get thatsame type of drug. (Data not shown here.)
There Is some further variation by drug class, however.Most (from 79% to 97%) of the recent users ofmarl uana, cocaine, amphetamines, barbiturates, andtranquilizers feel they could get those same drugseasily. Smaller majorities of those who used LSD(70%), other opiates (66%), or heroin (53%) feel itwould be easy for them to get those drugs again.
Trends in Perceived Availability
Marijuana, for the first time since the study was begunin 1975, showed a small but statistically significantdecline in perceived availability (down 3.9%) between1982 and 1984, undoubtedly due to the reducedproportion of seniors who have friends who use. Therehas been little further change since then and 86% ofthe class of 1985 think marijuana would be easy to get.
Ar_nplamines showed a full 11% jump in availabilitybetween 1979 and 1982; but availability has droppedback by 4% in the three years since.
The perceived availability of barbiturates also jumpedabout 6% between 1980 and 1982, but also droppedback by 4% in the subsequent three years.
Between 1977 and 1980 there was a substantial (15%)increase in the perceived availability of cocaine (seeFigure 25 and Table 22). Among recent cocaine users
155 144

there also was a substantial increase observed overthat three year interval (data not shown). Availabilitythen levelled, dropped some in 1983 and 1984, beforerising significantly (by 4%) in 1983.
The availability of tranquilizers declined steadilybetween 1978 and 1980, held steady for two years, andthen declined another 4% between 1982 and 1985.
The perceived availability of LSD and otherpsychedelics dropped sharply betweeiTh73 and porLSD availability has decreased since 1978 by less than2% (from 32.2% to 30.3%), but the easy availability ofother psychedelics showed a further decline of anadditional 8% by 1983 (from 34% to 26%) a periodduring which the use of PCP dropped substantially.
There is no evidence of any systematic change in theperceived availability of heroin since 1976; and otherooiates, also showed stability through 1983. A modestrise in availability then began in 1984, prefacing a risein use in 1985.
All these trends are similar among recent users.
156145

YOUNG ADULTS
POST HIGH SCHOOL
147 157

PREVALENCE OF DRUG USEAMONG YOUNG ADULTS
As Is described in the introduction to this report, the Monitoring theFuture study has followed representative samples from each graduatingclass beginning with the Class of 1976. Two matched panels, of roughly1200 seniors each, are selected from each graduating classone panelbeing surveyed on every even-numbered year thereafter, the other beingsurveyed on every odd-numbered year. Thus, in a given year, the studyencompasses one of the panels from each previously participating seniorclass. In 1985, this meant that representative samples of the Classes of1976 through 1984 were surveyed by mall. In this section we presentthe results of that survey: results which should accurately characterizethe approximately 85% of young adults in the class cohorts one to nineyears beyond high school who are high school graduates. The highschool dropout segment missing from the senior year surveys is, ofcourse, missing from the follow-up segments, as well.
Figures 26 through 33 provide prevalence data for all age groupscovered, up through those who are nine years beyond high school (modalage of 27). These figures also show the trend data for seniors and forgraduates who are up to eight years past high school (modal age of 26).Age groups have been paired into two-year Intervals to Increase thenumber of cases, and thus the reliability, of each point estimate. Forobvious reasons, trends on the youngest age bands can be calculated forthe longest period of time. As the years pass and the earlier classcohorts get older, new age groups can be added to the figures.
A number of interesting findings emerge from these data. *
Prevalence of Drug Use in 1985: Young Adults
For virtually all drugs, and for illicit drug use taken asa whole, older age groups exhibit higher levels oflifetime experience (data not shown), but some agegroups show levels of active or current use which areno higher than they were in high school. For example,
*In this section on post-high school drug use, we note somedifferences that seem to be consistently associated with age. Werecognize that the separation of age effects from period or cohorteffects is a difficult methodological task, and have dealt extensivelywith that Issue elsewhere (O'Malley, P.M., Bachman, J.G., & Johnston,L.D. "Period, age, and cohort effects on substance use among Americanyouth: 1976-1932," American Journal of Public Health, 1984, ab 682-688). In this monograph we take a more descriptive approach,presenting the trend data along with those interpretations that we thinkare most reasonable.
15$48

among 25 and 26 year olds, lifetime experience withany illicit drust approaches 80%, vs. 61% for highschool seniors. However, the different age groups allhave about the same annual and monthly prevalencerates on this index of overall illicit drug involvement.
A similar pattern exists for marl uana (including dailyuse) and for tranquilizers. That is, active rates of usefor young adults past high school are about what theyare for seniors in high school. (For marijuana, thelifetime prevalence reached by respondents in theirmid-twenties (in 1985) 13 between 70% and 75%.)
it is perhaps particularly significant that dailymarlivana use is not any lower among the older agegroups than among high school seniors. This meansthat up through age 27, at least, there is no evidenceof a fall-off in active daily use as a function of age.
The statistics on the use of any illicit drux other thanmarl uana behave in a somewhat different fashion,however. Like marijuana and the any-illicit-drug-useindex, lifetime rates on this index also show anappreciable rise with age, with peak levels seeming tobe reached about five or six years past high school.For example, in 1985 roughly 55% of thos five or sixyears past high school had tried some illicit drug otherthan marijuana during their lifetime, and about thesame statistics hold for those seven, eight, and nineyears out. This compares with between 36% and 43%across all seniors surveyed in the past decade.
However, the annual usage statistics are also slightlyhigher in the post high school age groups than amongseniors. As the next several paragraphs illustrate,most of the drugs which comprise this category show adecline with age in annual prevalence. Thus, the onewhich shows an appreciable increase with agenamely, cocainemust account for nearly all of theincrease in the general category.
Several classes of drugs show lower rates of currentuse among the older age groups than among seniors.LSD in recent years has shown lower 30-day prev-alence rates for the older ages than for seniors.(Annual prevalence rates also tend to be lower atpresent, though this has not always been truereflecting a sharper decrease in use among the olderage groups than among seniors.) We should add,however, that all of these prevalence rates are verylow, and thus the differences are quite small.
For stimulants, lifetime prevalence is much higheramong the older age groupsagain reflecting the
149
159

addition of new initiates in the early twenties (datanot shown). However, active use as reflected in theannual prevalence figure is somewhat lower among theolder age groups at present, again as a result of asharper decline in use in the older ages than hasoccurred among seniors.
For methaqualone, lifetime prevalence risesappreciably with age, but there Is little age-relateddifference in annual prevalence at present, thoughthere may have been in earlier years.
Barbiturates are similar to stimulants andiTagrrluarone in that lifetime prevalence again risesappreciably with age, but slightly different In thatactive non-medical use after high school has alwaysbeen appreciably lower than during high school.
Opiates other than heroin behave very similarly tobarbituratessome increase in lifetime prevalencewith age, with active nonmedical use being lower Inthe years after high school than during high school.
Cocaine presents a somewhat unique case in thatlah.71e, annual, and current use all rise substantially
with age. In 1985, lifetime prevalence by age 27 wasroughly 40%, vs. 17% among today's high school seniors(and 10% among the 27-year-old cohort when theywere seniors in 1976). Annual prevalence for 27-year-olds today is about 20% and 30-day prevalence around10%egain, appreciably higher than for the 1985seniors. Clearly this is a drug which is used muchmore frequently among people in their twenties thanamong those in their late teens; and this factdistinguishes it from all of the other illicit drugs.
In the case of alcohol lifetime prevalence variesrather little by age obviously due to a "ceiling effect")but current use (in the past 30 days) does varysomewhat more by age, with a higher proportion of theolder age groups drinking actively. Current OakdrinkirK is also slightly higher in the older age groups.
Occasions of heavy drinkinst in the two weeks prior tothe survey shows a more complex pattern, with those 1to 4 years beyond high school showing a higherprevalence of such behaviors than seniors, but withthose 5 or more years beyond high school droppingback to rates actually lower than those observed insenior year. We have Interpreter' 'Is as a curvilinearage effect, since it seems to replicate across years andgraduating classes (see footnote earlier in this sectionfor reference).
160150

Cigarette smoking shows an unusual pattern in relationto age, in that current smoking (30-day prevalence)increases moderately with age, but heavy dailysmoking increases appreclably more in proportionalterms. This means that relatively few new people arerecruited to smoking past high school, but many whopreviously were moderate smokers move Into a patternof heavier consumption during early adulthood.
Sex Differences in Prevalence Among Young Adults
Statistics on usage rates for young adults one to eightyears beyond high school, combined, are given for thetotal sample and separately for males and females InTable 23.
In general, It can be seen that most of the sexdifferences In drug use which pertalned In high schoolmay be found in this young adult sample as well. Forexample, somewhat more males than females reportusing any illicit drug during a glven time Interval, butthe differences are not large. Males have higherannual prevalence rates in most of the illicit drugswith the highest ratlos pertalning for Ls% methaqua-M__I ,e heroin, and opiates other than heroin.
Other large sex differences are to be found In dauxmarijuana use (3.4% for females vs. 7.4% for Males 111190 , daily alcohol use (3.6% vs. 10.4%), and occaslonsof drinking five or more drinks In a row in the priortwo weeks (27% vs. 5296). The sex difference Inoccasions of heavy drinking is greater than In highschool.
The use of stimulants which was slightly higher amongfemales in high school, is slightly higher among malesin this post high school perlod.
One other small reversal from hlgh school patterns isthat tranquilizer use is slightly higher among femalesafter high school, whereas It was slightly higher amongmales during high school.
For cigarettes, smoking at the rate of half-a-pack perday is almost identical for males and females (20% vs.21%, respectively), while smoking at all during theprlor month is a little more different (31% vs. 34%),just as is true in high school.
151
154-831 0 - 86 - 6161

TABLE 23
Prevalence of Use of Twelve Types of Drugs, 1985AO:14g Follow-Up Respondents 1-8 Years Beyond High School
by Sex
Aaprea Wtd. 10.
Mrkluana
?Ma
(2400)
Females 'kW(5400)(3000)
^nous! 45.3 30.9 40.030..Day 29.0 21.1 24.9Daily 7.4 3.4 5.2
LSDAnnual 4.7 1.8 3330.Da3' 1.1 0.4 0.7
Cool losAbaual 23.0 10.8 19.930..bay 10.0 7.2 8.7
WroteAanual 0.4 0.1 0.230.Day 0.0 0.1 0.1
Othot Opiates°Annual 4.4 3.0 3.030.Day 1.1 1.0 1.0
Stimi dents, Adjusted°Animal 14.0 12.7 13.530.Day 5.3 5.0 5.1
Sedatives°MMus) 4.3 3.3 3.830.Day 1.1 0.9 1.0
Barbiturates°Annual 3.1 2.4 2.7Mal ly 0.9 0.7 0.8
Meringue loneAnnual 2.2 1.5 1.830-Dsy 0.3 0.4 0.3
Trent Ionizers°Ainual 5.3 5.7 5.53,lkbay 1.8 1.8 1.8
AlcoholMewl] 91.2 88.9 89.931bay 82.5 71.5 70.4Daily 10.4 3.6 0.76,4 drinks in a row
in past two weeks 51.9 213.i 38.1CiOmettes
$0.bay 31.2 33.5 32.0D.,,,lly (Any)ma pack or more per day
24.920.0
20.021.0
25.920.0----------
°Only dtug use which was not under a doctor's orders I. included here.
162152

FIGURE 26
Any Illicit Drug: Trends in Use Among Young Adultsby Age Group
30- .---e----*40 -
30 -
20 -
10-
0
ANNUAL
Years Beyond High School0 YEARS OKOAL AGE Is/
a i - 2 YEARS ( 19-20)O 3-4 YEARS ( N 21-22)
O 5-8 YEARS ( 23-24)O 7-11 YEARS ( 25-26)
9 YEARS ( 271
V
ell' ell' elt; ell IP' it>. ogg 41 obb; olgYEAR OF ADMINISTRATION
NOTE. The dotted lines between 1981 and 1982 denote the change in theamphetamine question.
153
163

FIGURE 27
Any Melt Drug Other than Marijuana: Trends in Use Among Ytung Adultsby Age Group
100
90-
80-
70-
GO-
30-
40 -
30-
20
10
0
ANNUAL
Yeats Beyond High School
0 YEARS (MODAL AGE 16)
O 1-2 YEARS ( 19-201
O 3-4 YEARS ( N 21-22)
O 5-6 YEARS ( 23-24)O 7-8 YEARS ( 25-26)
9 YEARS ( 27)
.......ifitialii......
elv ell' elv etv obv .0 oggoes obit: orls
YEAR OF ADMINISTRATION
NOTE. The dotted lines between 1981 and 1982 denote the change in theamphetamine question.
164 154

I
FIGURIC 28
Any Molt Drug Other than Marijuana orStimulant's Trends In Um Among Young Adults
by Age Group
ANNUAL
Yearly= =railD 0 AK IOa 1-2 KAMI I 110-530 3-4 KAM ( 21-11)0 5-8 KAMI I 23-2410 7-8 MUM I 25-2110 I/ KAM I 27/
............... 0010===82111."43.1111910pza".........
dab 41 eit 49 otp
YEAR OF ADMINISTRATION
155 165

10000-
110-
70
00-
50-
40-
30-
20
10-
FIGURE 29a
Marijuana: Trends In Use Among Young Adultsby Age Group
ANNUAL
Ysersy=ond =Schoolt) AGE
A 1-2 YEARS ( 12-21:10 3-4 YEARS ( 21-2210 5-2 MAN ( 23-2410 7-2 YEARS ( 25-20V 9 YEARS ( 27)
elt; elt; elq 401 $61; $611
YEAR OF ADMINISTRATION
166
156

gt
9
FIGURE 29b
MarUusnas Trends in Use Among Young Adultsby Age Group
THIRTY-DAY
100 -
90 -
60 -
70 -
60 -
50 -
40 -
30 -
20 -
10-
da111"100%,...!
Yearn Beyond HO School0 YEARS (KCAL
A i -2 YEARS (0 3-4 YEARS (0 5-6 YEARS (0 7-8 YEARS (v 9 YEARS (
.4.4".ritle.2
AGE 11419-20)21-22)23-24)25-261
27)
0,00 .Ail .46 .00 4,6 4$.41:43
DAILY
0 43 AA' Aq' .474 AO AS 41" .42)42 AP: AP
YEAR OF ADMINISTRATION
157
167
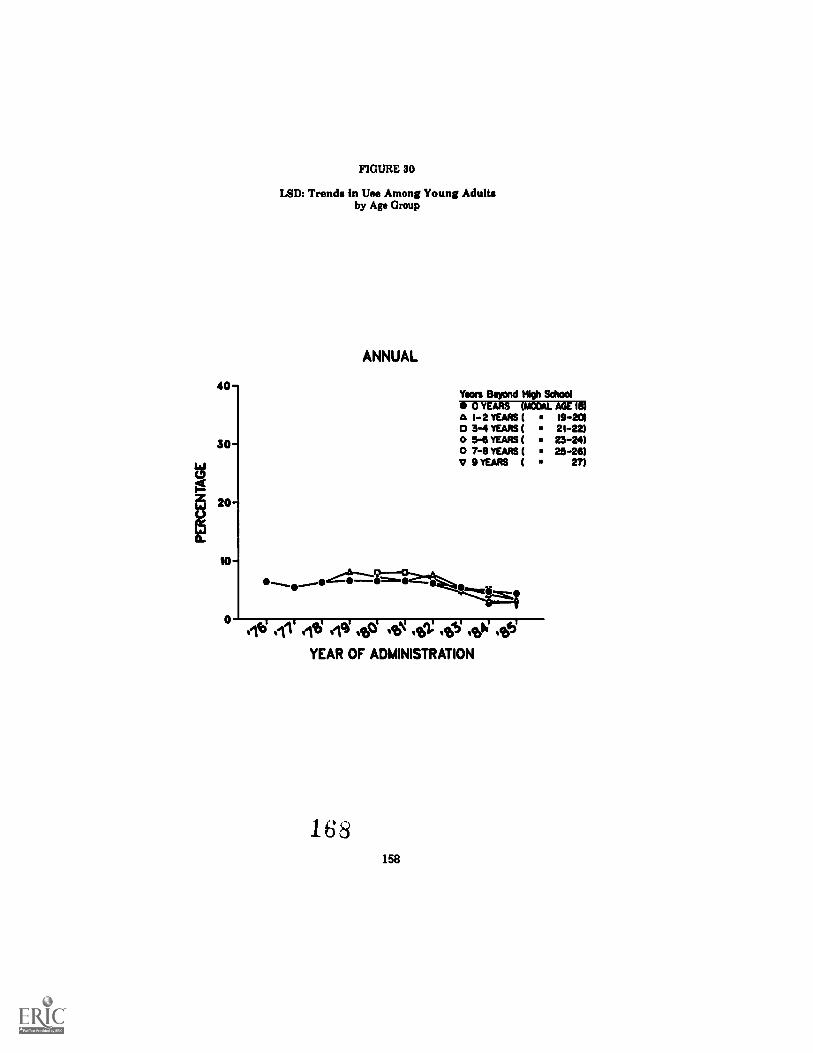
40
30-
5 20-t.)
10-
FIGURE 30
LSD: Trends In Use Among Young Adultsby Age Group
ANNUAL
Yoors Beyond High School0 YEARS (MODAL AGE la1-2 YEARS ( 19-201
0 3-4 YEARS ( 21-22)0 5-6 YEARS ( 23-24)0 7-0 YEARS ( 25-26)v 9 YEARS ( 27)
° err eve eics itg ogi: 01,1; isqYEAR OF ADMINISTRATION
168158

40-
30-
20-
10-
FIGURE 31
Cocaine: Trends in Use Among Young Adultsby Age Group
ANNUAL Years Beyond High School0 YEARS (MOGAL AGE 111)
A 1-2 YEARS ( 19-20)0 3-4 YEARS ( 21-22)0 5-8 YEARS ( 23-24)0 7-9 YEARS ( 25-28)v 9 YEARS ( 27)
° ell' eft; eve .v obi; ,t;is obq
YEAR OF ADMINISTRATION
159
169
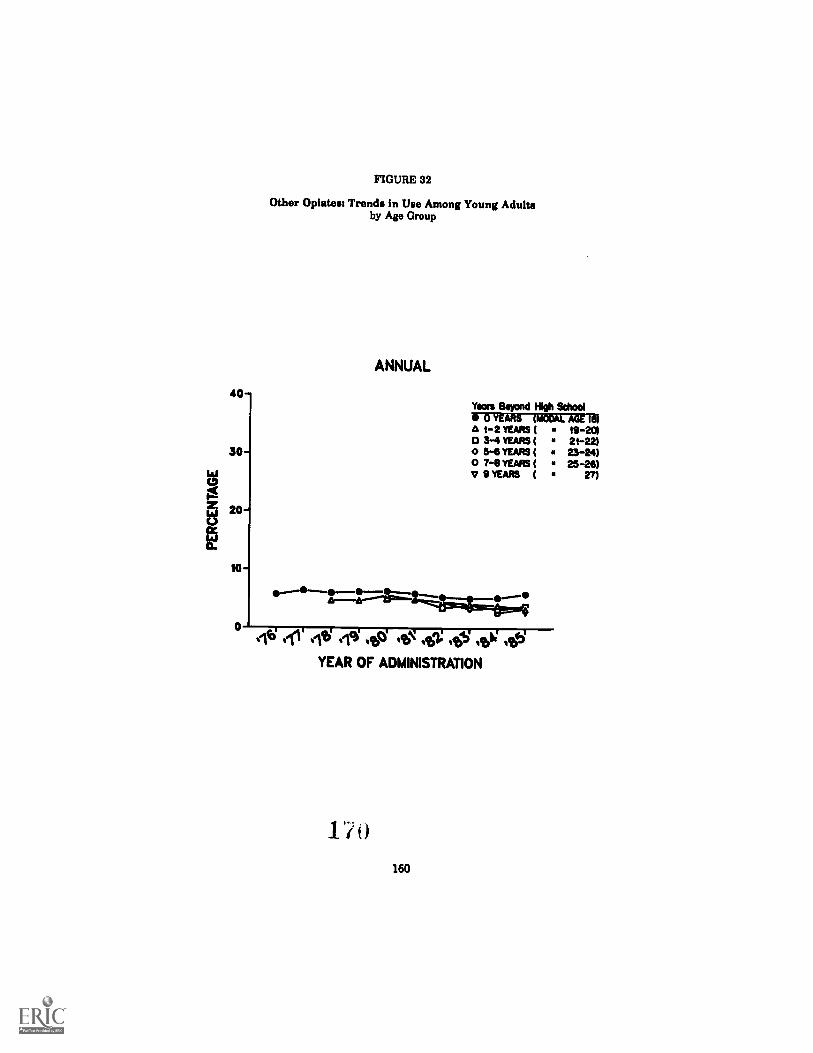
40
30-
5 20-
Q.
10-
FIGURE 32
Other Opiates: Trends In Use Among Young Adultsby Age Group
ANNUAL
.
Years Bsgend High School0 YEARS (MOOAL AGE IN1-2 YEARS ( a 19-20)
o 3-4 YEARS ( 21-22)0 5-8 YEARS ( 23-24)0 7-8 YEARS ( 25-26)V 9 YEARS ( 27)
0%lb elt 1q ob0 '0 41- 00 obi orP
YEAR OF ADMINISTRATION
17160

40-
30-
5 20-
10-
FIGURE 33
Stimulants: Trends in Use Among Young Adultsby Age Group
ANNUAL
Years Beyond High School0 YEARS (MCOAL AGE GO
A 1-2 YEARS ( 19-2010 3-4 YEARS ( * 21-22)0 5-8 YEARS ( 23-24)0 7-8 YEARS ( 25-26)V 9 YEARS ( 27)
° eii4 ei1' eit; eici otpl tot; 4: 00 obi' obq
YEAR OF ADMINISTRATION
NOTE. The dotted lines between 1981 and 1982 denote the change in theamphetamine question.
161
171

FIGURE 34
Barbiturates: Trends in Use Among Young Adultsby Age Group
ANNUAL
40Years Beyond WO School
o YEARS (iteanairTeA 1-2 YEARS ( 19-2130 3-4 YEARS ( 21-22)
30- 0 5-6 YEARS ( 23-24)0 7-8 YEARS ( 25-26)
laJ V 9 YEARS ( 27)
20-C.)
10- ,..4
elb sit 144
YEAR OF ADMINISTRATION
162

FIGURE 36
Methaqualonei Trends in Use Among Young Adultsby Age Group
ANNUAL
40
30-
Yaws Beyond High School0 YEARS (MODAL AGE IC
A 1-2 YEARS ( 19-2010 3-4 YEARS ( 21-22)0 5-8 YEARS ( 23-24)0 7-8 YEARS ( 25-26)v 9 YEARS ( 27)
a/ct,10-
_...ea.---'' N.--- t.--,--.04
0 tIV 411 elt; ell .40 otS ogg OgS Obb; ogi
YEAR OF ADMINISTRATION
173163

FIG URE
Tranquilizers: Trends in Use Among Young Adultaby Age Group
ANNUAL
40-Years &wad Klgb SddETIVAIN-71555XEM1115A 1-2 Yr.4113 ( 19-201CI 3-4 was 1 21-22)
30- 0 5-6 YEARS (0 7-8 YEARS
23-24)25-28)
v 9 YEARS ( 27)
20-
10-
43 41 ele) (14 ob° 45.1e 451:
YEAR OF ADMINISTRATION
174164

100
Oa-
110-
70-
SO-
SO-
40-
30-
20-
to-
0
FIGURE 37a
Aleohoh.Trends In Use Among Young Adultsby Age Group
ANNUAL
Ulf{ Belvad NO School0-YEARS (MODAL AGE 1(5i-2 YEARS ( 19-201
0 3-4 YEARS ( 21-22)0 54 YEARS ( 23-24)0 7-8 YEARS ( 25-219v !YEARS ( 27)
eig eici 40 obis V; ottiYEAR OF ADMINISTRATION
165 175

100-
90 -
80
-GO -
50 -
40 -
30 -
20 -
10 -
30
20-
10-
FIGURE 87b
Alcohol: Trends in Use Among Young Adultsby Age Group
THIRTYDAY
Years Beyond High School0 YEARS (MAL AGE le)
a l-2 YEARS ( 19-2(0 3-4 YEARS ( 21-22)0 5-6 YEARS ( 23-24)0 7-8 YEARS ( 25-26)v 9 YEARS ( V)
AA' .43Aci 1q &'-` 1q A14- V( oil
DAILY
0---.0/A1"."4e 0-0
,411 ett ,d \CO 40 ,41bN ,944) qt 4463
YEAR OF ADMINIST'ATION
176166

60
50-
w 40-CD
1
20
10
0
FIGURE 37c
Mcohob Trends In Use Among Young Adultaby Age Group
FIVE OR MORE DRINKS IN A ROWIN PAST TWO WEEKS
__
*ars Beyond High School0 YEARS (140A1. AGE lel
A 1-2 YEARS ( 19-20113 3-4 YEARS ( 21-22)0 54 YEARS ( 22-24)0 7-8 YEARS ( 25-28)V 9 YEARS ( 27)
lb ell elt: elcSI obq obl% ebbi obtO
YEAR OF ADMINISTRATION
167 1 77

40
FIGURE 38a
Clgarettren Tvends In Use Among Young Adultsby Age Group
THIRTYDAY
Ygors Beyond High School0 YEARS (MODAL AGE 111)
A 1-2 YEARS ( 19-2010 3-4 YEARS ( 21-22)0 5-6 YEARS ( 23-24)0 7-1) YEARS ( 25-26)v 9 YEARS ( 2?)
0 .44 .1AI .4 ef) 00 .q; Alft.' 442; Ai 44
40-1
30-
2 -
10-
DAILY
Ato AA efb AA op ,46`. obi" cp oblo op
YEAR OF ADMINISTRATION
178 168

30
20
10
nom asb
Cigarette., Trends In Um Among Young Adult.by Ago Group
HALFPACK OR MOREPER DAY 'tteraynr1 IlosoI
o IIMILI-1 WARS ( 040
0 3-4 ( 11-1011-6 YEARS ( 20-64)
O 7-6 WAN ( 25-26)rum ( En
"""6,....
0(14, Al. ell) el' 4121 4 44; 4t
YEAR OF ADMINISTRATION
1 7 9169

RECENT TRENDS IN DRUG USEAMONG YOUNG ADULTS
Trends in the use of the various licit and illicit drugs are presented inFigures 26 through 38 for all high school graduates from one up to eightyears beyond high school. Each data point L-1 these figures, whichrepresents two adjacent class cohorts, Is based on approximately 1200weighted data cases. (Actual N's are somewhat larger.)
Trends in PrevalenCe Through 1983: Young Adults
Por most drugs, the trends in use among the older agegroups have paralleled the changes among seniorsdiscussed earlier in this monograph. This means thatmany of the changes observed have been seculartrendsthat is, they are observable across the welousage groups. This has generally been true for trends Inthe lifetime, annual, and 30-day prevalence measuresfor the use of any Illicit drug, mariluana, 1A1,3methaqualone, stimulants, barbiturates, tranquilizers,and opiates other than heroin.
Several of these drug classes have actually exhibited afaster decline in use during recent years among theolder age group than among the high school seniors.These include 1.4% stimulants. and methaqualone.
The alcohol statistics for the older age group alsogenerally have tracked those reported for seniors(meaning a very gradual Increase In the late 70's andthen a fairly level period through 1983), with oneimportant exception. The slight decline observedamong seniors since 1983particularly in 30-dayprevalence and In occasions of heavy drinking duringthe prior two weeksis not observable among those intheir early to mid-twenties. Whether these differ-ential trends may be due to the effects of changes Inthe drinking age laws in many states, which would tendto impact only specific age groups, remains to bedetermined.
The prevalence statistics for cigarette smoking do nottend to show parallel trends across age groups. Whilethe curves are of the same general shape for each agegroup, each curve tends to be displaced to the right ofthe one for the immediately preceding age group(which was two years younger). This pattern is verysimilar to the one described earlier for lifetimesmoking rates for various grade levels below senioryear. this Is the clank pattern exhibited when thereis a cohort effect present, meaning that a class cohorttends to be different from other cohorts In
"Is U°

consistent way across the age span. This is how weInterpret the cigarette data (O'Malley et al., 1984,referenced earlier), and we believe that the cohortdifferences tend to remain throughout the lifespan dueto the highly dependence-producing nature of nicotine.None of the other drugs studied here shows such aclear pattern of enduring cohort differences, despitewide variations in their use by different cohorts at agiven age.
Looking specifically at the trends from 1984 to 1985, ayear in which the high school data suggest a halt in thedecline of most types of drug use, we find that thedata from these young adults tend to produce a similarfinding. Tables 24 through 27 present the trends inprevalence for 1984-1985 for all respondents one-to-eight years beyond high school combined. They showthat in 1985 there was no decline in the proportion ofyoung adults reporting the use in the past year of inxIllicit drug, any Illicit drug other than mariluana, orany illicit drug other than mariluana or stimulants. Infact, all of the statistics show a smalifnot statisticallysignificant) increase (Table 27). The same was true forthe annual prevalence of marl uana. specifically (Table24).
The data from young adults also showed no furthersignificant decline in 1985 in the annual prevalence oftranquilizers or barbiturates, as was true amongseniors. Annual prevalence for heroin also remainedstable for both groups.
Also parallel to the high school results are the findingsthat stimulants and metha ualone both did showfurther sThrgrlificant) declines in 198c
Cocaine, which showed a statistically significant 1.5%increase in annual prevalence among seniors, alsoshowed an increase of 0.9% in annual prevalenceamong young adults, though that did not reach statis-tical significance.
Another class of drugs showing a small but statisticallysignificant (0.7%) increase in annual prevalence amongseniors In 1985opiates other than heroinshowed asmaller (0.3%) not statistically significant increaseamong the young adult samples.
Most statistics for alcohol use remained relativelyunchanged in both groups In 1985. However, as ismentioned above, occasions of heavy drinking, whichfell significantly among seniors, did not decline amongthe young adults. (It increased by 0.4%, which is notstatistically significant.)
171181_

IABLE 24
Trends in Annual Prevalence of Twelve Types of DrugsAmong Follow-Up Respondents 1-8 Years Beyond High School
Percent who used in past 12 months'84'85
1984 1985 change
Approx. Wtd. N w (5500) (5400)
Marijuana 40.2 40.6 +0,4
LSD 3.8 3.1 0.7sCocaine 19.0 19.9 +0.9
Heroin 0.2 0.2 0.0
Other opiates° 3.3 3.6 +0.3
Stimulants, Adjusted° 15.5 13.5 2.0ss
Sedatives° 4.9 3.8 1.1ssBarbiturates°. 3.0 2.7 0.3Methaqualon e 3.3 1.8 1.5sss
Tranquilizers° 5.8 5.5 0.3Alcohol 89.2 89.9 +0.7
Cigarettes NA NA NA
NOTES: Level of significance of difference between the two most recent years:w.05, ss w.01, sea w.001.
NA indicates data not available.°Only drug use which was not under a doctor's orders is included he. e.
18
172

TABLE 25
Trends in Thlrty-Day Prevalence of Twelve Types of DrugsAmong Follow-Up Respondents 1-8 Years Beyond High School
Percent who used in past 30 days
'84-'851984 1985 change
Approx. Wtd. N .. (5500) (5400)
Marijuana 25.3 24.9 -0.4LSD 0.8 0.7 -0.1Cocaine 8.7 LT 0.0Heroin 0.1 0.1 0.0Other Opiates' 1.1 1.0 -0.1Stimulants, Adjusted' 6.3 5.1 -1.2s5Sedatives' 1.3 1.0 -0.3
Barbiturates'. 1.0 0.8 -0.2Methaqualone 0.6 0.3 -0.3s
Tranquilizers" 1.9 1.8 -0.1Alcohol 76.1 76.4 +0.3Cigarettes 32.7 32.6 -0.1
NOTES: Level of significance of difference between the two most recentyears: ..05, as ..01, ssa
'Only drug use which was not under a doctor's orders I. included here.
1 83173

TABLE 26
Trends in Thirty.Day Prevalence of DailyUse of Twelve Types of Drugs
Among Follow-Up Respondents 1-8 Years Beyond High School
Percent using dailyin last 80 da s
'84 - '85chtlumi1984 MI
Approx. Wtd. N 4. (5500) (6400)
Marijuana 5.4 5.2 -0.2LSD 0.0 0.0 0.0
Cocaine 0.2 0.2 0.0Heroin 0.0 0.0 0.0
Other Opiates° 0.1 0.0 0.0
Stimulants, Adjusted° 0.4 0.2 -0.2aSedatives° 0.1 0.0 -0.1
Barbiturates°. 0.1 0.0 -0.1Methaqualone 0.0 0.0 0.0
Tranquilisms° 0.0 0.0 0.0
Alcohol 8.9 8.7 -0.2Five or more drinks in a row
in last two weeks 97.7 98.1 +0.4
Cigarettes 28.4 25.9 -0.5Halt pack or more per day in past 30 days 21.2 20.8 -0.8
NOTES: Level of significantm of difference between the two most recent years:-.05, se .4.01, sse
°Only drug use which was not under doctor's orders is included here.
184
174

TABLE 27
Trends in Annual and Thirty-Day Prevalence of An Illicit Drug Use IndexAmong Follow-Up Respondents 1-8 Years Beyond High School
by Sex
1984 198584 -'85change
Percent reporting usein last twelve months
Any Illicit Drug 45.3 48.2 +0.9
Males 48.8 49.8 +1.2Females 42.5 43.4 +0.9
Any Illicit Drug Other than Marltuana 29.5 29.9 +0.4
Males 82.9 33.1 +0.2Females 28.8 27.8 +0.7
Any DIEN Drug Other thanMarijuana or Stimulants 24.4 25.2 +0.8
Males 28.5 28.7 +0.2Females 20.7 22.4 +1.7
Percent reporting usein last 30 day.
Any Illicit Drug 29.3 28.8 -0.7Maks 33.2 32.7 -0.5Females 25.9 25.4 -0.5
Anj Illicit Drug Other than Marltuana 15.2 14.9 -0.3Males 17.7 17.1 -0.8Females 18.0 18.1 +0.1
Any Illicit Drug Other thanMarijuana or Stimulants 11.8 11.8 0.0
Males 14.2 14.0 -0.2Females 9.5 10.0 +0.5
Approximate Weighted Ws
All Respondents (5500) (5400)
Males (2500) (2400)Females (2900) (3000)
NOTES: Level of significance otdifference between the two most recant years:s w .05, u .01, us w .001.
175 185

The only othor slight divergence In 1983 between highschool seniors and the older age group (modal agesfrom 19 to 26) ots,ctered for cigarette smoking. Whileseniors showed a slight (nonsignificant) increase Insmoking In 1943, the older age soup showed a slight4ionsignificant) decrease. However, because of thestrength of known cahort effects In cigarette smoking,we do not nece;sarily expect parallel changes In thetwo age soups In any given year.
in SIMI these various samples of high school seniorsand young adults show longer-term trends in substanceuse, as well as near-term trends, which tend to behighly parallel. While divergent trends would notnecessrrily demonstrate a lack of validity in either setof data (because such a divergence would not beunreasonable to expect in reality), we believe that thehigh degree of conver enrt provides an important newsource of validation of the trends which have beenreported among the seniors. In fact, each of these setsof data helps to validate the "trend story" reported bythe other.
Sex Differences in Trends
Table 23 shows the prevalence rates in 1983 for 19 to26-year-old males and females, separately. in general,the recent trends in use have been very similar for thetwo sexes (data not shown). There are two notableexceptions.
Use of amohetamines has declined recently moreamong males than among females, so that what wasabout a 4% difference in annual use in 1982 is, as of1983, only a 2% difference.
Similarly, methaaualone WM has declined much moreamong males (who started from a distinctly higherlevel), and both sexes now show similar (very low):ates of use. As mentioned earner, thls may be due Inpart to the tact that thls substance 13 no longermanufactured or distributed legally in the tinnedStates.
186176

COLLEGE STUDENTS
187177
PREVALENCE OF DRUG USEAMONG COLLEGE STUDENTS
The follow-up design of the Monitoring the Future project is cape .generating an excellent national sample of college studentsbetter inmany ways than a design which first samples colleges and then samplesstudents within them, because in the present sample the students arenot clustered in a limited number of colleges. Given the much greaterdiversity in post secondary institutions than in high schools, the use of aclustered sample would place far itreater limitations on sampleaccuracy at the college level than at the high school level. Further, theabsence of dropouts in the high echool senior sample should havepractically no effect on the college sample, since very few of thedropouts would go on to college.
Perhaps the major limitation of the present design Is that It mustdelimit the college sample to a certain ege level. For trend estimationpurposes, we have decided to limit the age band to the most typicalonefor college attendance, 1.e., one to four years past high school, whichcorresponds to the modal ages of 19 to 22 years old. According tostatistics from the United States Bureau of the Census,* this age shouldencompass about 3396 of all students enrolled in college full-time in1930. While extending the age band to be covered by an additional twoyears would cover 92% of all enrolled college students, It would alsoreduce by two years the interval over which we could report trend data.The cilfferences which would result in the 1935 prevalence estimatesunder the two definitions are extremely small, however. The annualprevalence of all drugs except cocaine would shift only about one-ortwo-tenths of a percent. Cocaine, which has the greatest amount ofchange with age, would have an annual prevalence rate only 0.3% higherif the six year age span were covered rather than the four year agespan. Thus, for purposes of estimating all prevalence rates exceptlifetime prevalence, the four year and six year Intervals are nearlyinterchangeable.
On the positive side, controlling the age band (either one to four or oneto six years after high school) may be desirable for trend estimationpurposes, in the event that the age composition of college studentsshould change much with time. Otherwise college students charac-terized in one year would represent a non-comparable segment of thepopulation when compared to college students surveyed in another year.
College students are here defined as those follow-up respondents one tofour years past high school who say they were registered as full-timestudents at the beginning of March in the year in question and who say
*US. Bureau of the Census. Current Population Reports:Population Characteristics. Series P-20. ao. 400. Washington, DC: U.S.Government Printing Office, 1982.
178
188

they are enrolled in a two or four year college. Thus, the definitionencompasses only those who are one to four years past high school andare active full-time undergraduate college students in the year inquestion. It excludes those who may prevlously have been collegestudents or may have already completed college.
Prevalence rates for college students are provided in Tables 28 to 31.They are also included in the figures providing trends In annualprevalence (see Figures 39 through 51) along with the prevalence ratesfor all r apondents one to four years past hlgh school, including thecollege students. Having both statistics makes it possible to seewhether college students are above or below average for all hlgh schoolgraduates in their age group taken as a whole.
Any observed difference between college students and the total group isan underestimate of the total difference bctween the college enrolledand those not enrolled, of course, since the college enrolled arethemselves included in the total. (They comprise roughly 40% of thetotal in a given year.) Further, any such difference would likely beenlarged if data from the missing high school dropout segment wereavailable. Therefore, any differences observed here are only anindication of the directlon and relative size of differences between thecollege and non-college-enrolled populations, not an absolute estimateof them.
The findings are presented below.
Prevalence of Drug Use in 1985: College Students
There Is practically no dlfference between thoseenrolled in college versus all respondents of the sameage (i.e., 1 to 4 years past high school) in their annualprevalence of any 111IcIt drug_ use, use of any Illicitdrug other than marijuana, or use of nyl lIclt drugother than marlJuana or stimulants (Figures 39-41).
College students are also average for their age groupin their annual prevalence of marijuana use. However,their rate of current daily. mariluana use is on:y 3.1%versus 4.6% for thelr age group taken as a whole.Recall that a similar large difference in daily use wasobservable in hlgh school between the college-boundand those not bound for collage.
College students also have about average rates fortheir age group of cocaine use and methaoualone use In1985, though in the past they have tended to havebelowaverage rates of use on both drugs whencompared to their age group.
College students are below average, in thelr annualusage rates for kg stimulants, barbiturate tranoul-km, and In 1985 (for the first time ) in opiates otherthan heroin. For the most part, howtver, their rates
179 189

of use are not much below average. LSD shows thelargest proportional difference, with an annual prev-alence of 2.2% vs. 3.3% for all respondents one to fouryears past high school. The comparable figures forstimulants are 12% vs. 14%, for barbiturates 1.3% vs.2.2%, for rantkullizers 3.3% vs. 4.3%, and for oplatesother than neroin 2.4% vs. 3.6%.
Regarding alcohol use, today's college students haveabove average annual prevalence compared to all highschool graduates in their age cohort (92% vs. 89%), aslightly above average monthly prevalence (80% vs.7396), and a slightly below average daily prevalence(5.0% vs. 6.0%). The most Important difference,however, lies In the prevalence of occasions of heavydrinking (five or more drinks in a row in the past twoweeks) which Is 43% among college students, versus41% for the total group of respondents including thecollege students.
By far the largest difference between college studentsand others their age occurs for cigarette smoking. Forexample, their prevalence of daily smoking is only 14%vs. 24% for all high school graduates that age,Including the college students. Smoking at the rate ofhalf-a-pack-a-day stands at 9.4% vs. 18.3%, respec-tively. Recall that the high school senior data showthe college-bound to have much lower smoking rates inhigh school than the noncollege-bound: thus most orall of the differences observed at college age actuallypreceded college attendance.
Sex Differences In Prevalence Among College Students
V/Nle tabular data are not provided for male and female collegestudents separately (except for Table 31, giving differences on theillicit drug use indexes), sex differences are plotted In Figure 39 through51 for the varlous drugs.
It may be seen that most of the sex differences amongcullege students replicate those discussed earner forall young adults (one to eight years past high school),which in turn replicated sex differences In high schoolfor the most part. That means that among collegestudents, males have higher annual prevalence ratesfor most drugs, including marijuana (47% vs. 3790,LSD (2.8% vs. 1.8%), cocaine (20% vs. 15%), Stim-ulants (13% vs. 11%), and opiates other than heroin(3.31-6 vs. 1.4%).
Males also have hlgher prevalence rates on severalother drugs, but both sexes are so close to zero thatthe absolute differences are now negligible. Theseinclude methagualone (1.5% vs. 1.2%), barbiturates(1.6% vs. 1.1%) and heroin (0.2% vs. 0.1%).
180
190

As is true for the entire young adult sample,substantial sex differences are to be found in cjakmarlluana we (4.9% for males vs. 1.6% for females),dally alcohol use (7.4% vs. 3.1%), and occasions ofdrinking five or more drinks In a row In the prior twoweeks (37% vs--T-96 ). The three to one male-femaleratio In dally marljuana usd is noteworthy and isgreater than is observed in the sample of all youngadults. In essence, It means that the great majorlty ofdaily marijuana use in college is to be found among themales.
Other than the finding on dally marljuana use, the onlyother drug-using behavlor which shows a sex differenceappreciably different than those observed In thesample of all young adults involves sytarette smokinst.While the male and female rates were very closeamong all young adults, among college students thereIs an appreciable sex difference In smoking rates. Thehalf-a-pack-per day rate is considerably higher forcollege women than men (11% vs. 7%, respectively) asis the dally figure (18% vs. 10%) and the monthlyprevalence figure (26% vs. 19%). For whatever reason,college women are quite a bit more likely to besmokers than thelr male counterparts.
181 1 91

TABLE 28
Trends In Annual Prevalence of Twelve Types of DrugsAmong College Students 1-4 Years Beyond High School
Percent who used in past 12 months
84-851980 1981 1982 1983 1984 1985 clian't
Approx. Wtd. N (1040) (1)30) (1150) (1170) (1110) (1080)
Marijuana 51.2 51.3 44.7 45.2 40.7 41.7 +1.0LSD 8.1 4.8 8.3 4.2 3.7 2.2 -1.5sCocaine 18.9 15.9 17.2 17.2 18.4 17.3 +0.9Heroin 0.4 0.2 0.1 0.0 0.1 0.2 +0.1Other Opiates& 5.1 4.4 3.8 3.8 3.8 2.4 -1.4Stimulants& is 22.4 22.2 NA NA NA NA NAStimulants, Adjusted.'" NA NA 21.1 17.3 15.8 11.9 -3.9ssSedatives° 8.3 7.9 8.0 4.5 3.4 2.5 -0.9
Barbiturates& 2.9 2.8 3.2 2.2 1.9 1.3 -0.8Methaqualone" 7.2 8.5 8.8 3.1 2.5 1.4 -1.1
Tranquilizers& 8.9 4.8 4.7 4.8 3.5 3.5 0.0Alcohol 90.5 92.5 92.2 91.8 90.0 92.0 +2.0Cigarettes NA NA NA NA NA NA NA
NOTES: Level of significance of difference between the two most recent years:a e.05, ss ..01, sss -.001.
NA indicates data not available.&Only drug use which was not under doctor's orders Is included here.bAdjusted for the inappropriate reporting of non-preacription stimulants.
A. 9 2182

TABLE 29
Trends b Thirty-Day Prevalence of Twelve Types of DrugaAmong College Students 1-4 Years Beyond High School
Approx. Wtd. N ..
Percent who used in lut 30 days'84-'85stiza1980 1981 1932
(1150)
1983 1984 1985
(1040) (1130) (1170) (1110) (1080)
Marijuana 34.0 33.2 26.8 26.2 23.0 23.6 +0.6LSD 1.3 1.4 1.7 0.9 0.8 0.7 -0.1Cocaine 6.9 7.3 7.9 6.4 7.6 6.9 -0.7Heroin 0.3 0.0 0.0 0.0 0.0 0.0 0.0Other Opiates° 1.8 1.1 1.0 1.1 1.4 0.7 -0.7Stimulants° 13.4 12.3 NA NA NA NA NAStimulants, Adjusteda'b NA NA 9.9 7.0 5.5 4.2 -1.3Sedativeo° 3.7 3.4 2.5 1.1 1.0 0.7 -0.3
Barbiturates°. 0.9 0.8 0.9 0.5 0.7 0.4 -0.3Methaqualone 3.1 3.0 1.9 0.7 0.5 0.2 -0.3
Tranquilizers° 2.0 1.4 1.4 1.1 1.2 1.4 +0.2Alcohol 81.8 81.9 82.8 80.3 79.1 80.3 +1.2Cigarettes 25.8 25.9 24.4 24.7 21.5 22.4 +0.9
NOTES: Level of significance of difference between the two most recent years:a 0.05, as -.01, sss
NA indicates data not available.°Only drug use which was not under a doctor's orders is included here.bAdjusted for the inappropriate reporting of non-prescription stimulants.
183154-831 0 - 86 - 7
193

TABLE 30
Trends in Thirty-Day Prevalence of Daily Use of Twelve Types of DrugsAmong College Students 1-4 Years Beyond High School
Percent who used daily in last 30 days'84-'85
1980 1981 1982 1983 1984 1985 claim%
Approx. Wtd. N (1040) (1130) (1150) (1170) (1110) (1080)
Marijuana 7.2 5.6 4.2 3.8 3.6 3.1 -0.5LSD 0.0 0.0 0.0 0.0 0.0 0.0 0.0
Cocaine 0.2 0.0 0.3 0.1 0.4 0.1 -0.3Heroin 0.0 0.0 0.0 0.0 0.0 0.0 0.0
Other Opiates° 0.0 0.1 0.0 0.1 0.1 0.0 -0.1Stimulants° 0.5 0.4 NA NA NA NA NAStimulants, Adjusteda'b NA NA 0.3 0.2 0.2 0.0 -0.2Sedatives° 0.0 0.0 0.1 0.0 0.1 0.0 -0.1
Barbiturates° 0.0 0.0 0.1 0.0 0.1 0.0 -0.1Methaqualone 0.0 0.0 0.0 0.0 0.0 0.0 0.0
Tranquilizers° 0.0 0.0 0.1 0.0 0.1 0.0 -0.1Alcohol 6.5 5.4 6.1 6.1 6.6 5.0 -1.6
Five or more drinks in a rowin last two weeks 43.9 43.6 44.0 43.1 45.5 44.6 -0.9
Cigarettes 18.3 17.1 16.2 15.3 14.8 14.3 -0.5Half pack or more per day
in put 30 days 12.7 11.9 10.5 9.6 10.2 9.4 -0.8
NOTES: Level of significance of differ nce between the two most recent years:.05, as -.01, us .001.
NA indicated data not available.°Only drug use which was not under a doctor's orders is included here.bAdjusted fbr the inappropriate reporting of non-prescription stimulants.
194
184

TABLE 31
Trends in Annual and 30-Day Prevalence of An Illicit Drug Use IndexAmong College Students 1-4 Years Beyond High School
by Sex
19808 19818 1982 1983 1984 198584-85change
Percent reporting usein last twelve months
Any Illicit Drug 56.2 55.0 49.5 49.9 45.1 48.3 +1.2Males 58.9 56.2 54.8 53.4 48.4 50.9 r2.5Females 53.3 54.0 44.9 48.7 41.9 42.7 +0.8
Any Illicit Drug Other than Marijuana 32.3 31.8 30.0 29.9 27.2 28.7 -0.5Males 33.7 32.8 33.4 33.5 29.2 29.7 +0.5Females 31.1 30.9 28.9 28.7 25.2 24.4 -0.8
Any Illicit Drug Other thanMarijuana or Stimulants 25.2 22.8 22.3 23.8 21.1 21.4 +0.3
Males 28.4 25.7 25.7 28.8 25.3 24.4 -0.9Females 22.1 19.8 19.3 21.1 17.0 19.0 +2.0
Percent reportinguse in last 30 days
Any Illicit Drug 38.4 37.6 31.3 29.4 27.0 28.1 -0.9Males 42.9 40.6 37.7 33.8 30.4 29.9 -0.5Females 34.0 34.8 25.8 25.5 23.7 23.2 -0.5
Any Illicit Drug Other than Marijuana 20.7 18.6 17.1 13.9 13.8 11.8 -2.0Males 22.9 18.6 20.2 18.0 18.1 12.7 -3.4Females 18.6 18.5 14.2 12.2 11.8 11.2 -0.4
Any Illicit Drug Other thanMarijuana or Stimulants 12.6 11.0 11.2 9.8 10.7 9.1 -1.6
Males 15.2 13.3 13.1 12.1 13.5 10.6 -2.9Females 10.1 9.9 9.5 7.8 8.0 8.0 0.0
Approximate Weighted N.
All Respondents w (1040) (1130) (1150) (1170) (1110) (I 80)Males (520) (530) (550) (550) (540) 490)Females (520) (6OO) (610) (620) (570) (I:00)
NOTES: Level of significance of difference between the two most recent years:s 311 -.01. nil w.001.
8Revised questions about stimulant use were introduced in 1982 to exclude more completely theinappropriate reporting of nomprescription stimulants. The data in italics are therefore not strictlycomparable to the other data.
185 .195

FIGURE 39
Any Illicit Drug: Trends in Annual Prevalence Among College Students1-4 Years Beyond High Sohool
100-
SO-
80-
70-
SO-
50-
40-
30-
20-
10-
0
COLLEGE STUDENTS VS TOTAL
A TOTAL SAMPLE 1-4 YRS. PAST Kt
FULL-TIME COLLEGE STUDENTS
I.-1.-Jr...11
100-
SO-
80-
70-
SO-
50-
40-
30-
20-
10-
0
810 Ii1 82 83 84 85
MALE VS FEMALE COLLEGE STUDENTS
O MALES
FEMALES
6.0=9..o.o. . 111".,
80 111 82 82 84 85YEAR OF ADMINISTRATION
NOTE. The dotted lines between 1981 and 1982 denote the change in theamphetamine question.
190"

100-
00-
110-
70-
110-
50-
40-
30-
20.
10.w
0
FIGURE 40
Any Illicit Drug Other than Marijuana: Trends inAnnual Prevalence Among College Students
1-4 Years Beyond High School
COLLEGE STUDENTS VS TOTAL
A TOTAL SAMPLE 1-4 YRS. PAST H.S.
FULL-TIME COLLEGE STUDENTS
100-
00-
110-
70-
110-
50-
40-
30-
20-
10-
110 112 113 1 114 15
MALE VS FEMALE COLLEGE STUDENTS
o MALESFEMALES
.. OOOO°410Iw......111
110 al 112 11-3 114 11S
YEAR OF ADMINISTRATION
NOTE. The dotted lines between 1981 and 1982 denote the change in theamphetamine question.
187
1

FIGURE 41
Any Illicit Drug Other than Marijuana or Stimulants: Trendsin Annual Prevalence Among College Students
1-4 Years Beyond High School
100-
90-
80-
70-
SO-
SO-
40-
30-
20-
10-
0
COLLEGE STUDENTS VS TOTAL
TOTAL SAMPLE 1-4 YRS. PAST H.S.
FULL-TIME COLLEGE STUDENTS
1001
90-
80-
70-
80-
50-
40-
30-
20-
10-
0
110 it 112 113 014 115
MALE VS FEMALE COLLEGE STUDENTS
O MALES
FEMALES
141);------13----C"-----4:6)------°-----43*--110 1; ' I 11 8 112 3 14 115
YEAR OF ADMINISTRATION
198188

FIGURE 42a
Marijuana: Trends in Annual Prevalence Among College Students1-4 Years Beyond High School
100
90
80-
70-
110-
50-
40
30
20
10
0
COLLEGE STUDENTS VS TOTAL
TOTAL SAMPLE I- YR& PAST H.&
FULL-TIME COULGE STUDENTS
100-
90-
BO-
70-
110-
30-
40-
30-
20-
10-
1 80 111 82 12 12 82
MALE VS FEMALE COLLEGE STUDENTS
O MALES
FEMALES
9'0 111 92 112 92 92YEAR OF ADMINISTRATION
189 19 9
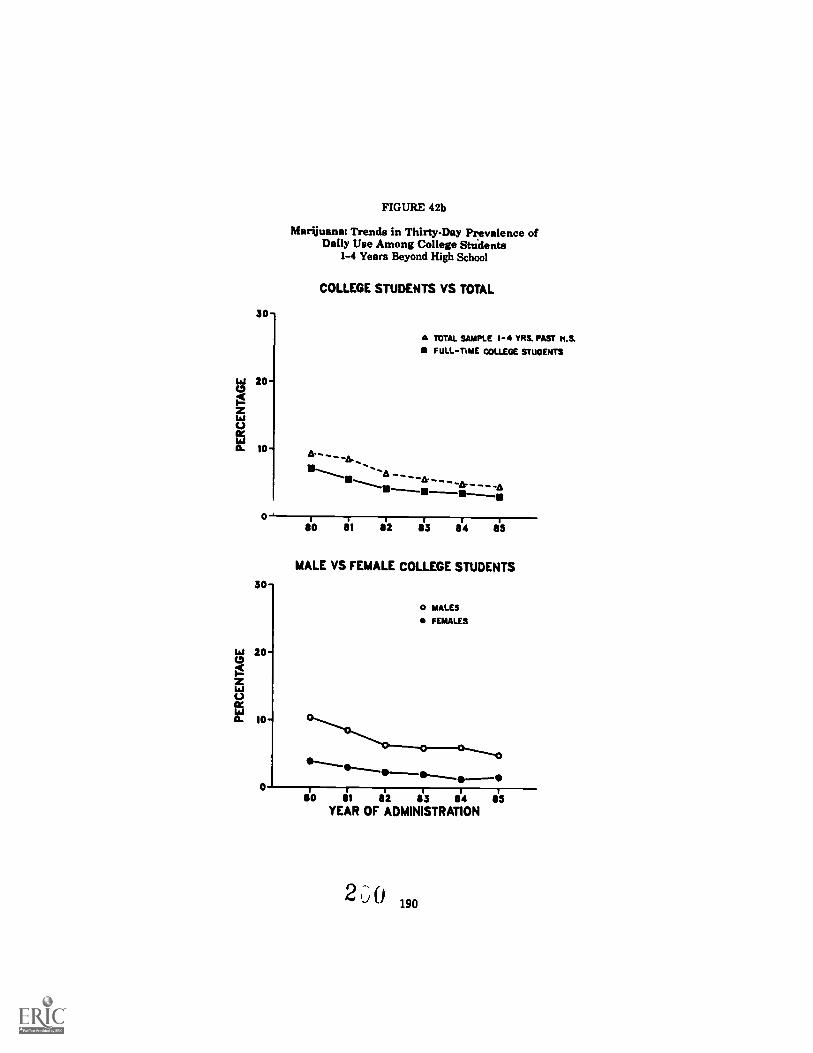
30-
20-
10-
0
FIGURE 42b
Marijuana: Trends in Thirty-Day Prevalence ofDaily Use Among College Stidents
1-4 Years Beyond High School
COLLEGE STUDENTS VS TOTAL
-Lt
a ToTAL SAMPLE 1-4 YRS. PAST H.S.
FULL-TIME COLLEGE STUDENTS
a
30-
10-
10-
0
so 81 112 113 84 113
MALE VS FEMALE COLLEGE STUDENTS
o MALES
FEMALES
SO 111 112 113 114
YEAR OF ADMINISTRATION
2190

FIGURE 43
LSD: Trends in Annual Prevalence Among College Students1-4 Years Beyond High School
3 0
2 0 -
1 0
3 0
2 0
10
COLLEGE STUDENTS VS TOTAL
A TOTAL SAMPLE 1-4 YRS. PAST /LS.
FULL-TIME COLLEGE STUDENTS
8 0 81 8 2 8 3 84 84
MALE VS FEMALE COLLEGE STUDENTS
O MALES
FEMALES
1 1 10 1 82 83 848 84YEAR OF ADMINISTRATION
191 2 tu.

FIGURE 44
Cocaine: Trends in Annual Prevalence Among College Students1-4 Years Beyond High School
30
20-
10
0
30
20
10
0
COLLEGE STUDENTS VS TOTAL
4 TOTAL SAMPLE 1-4 YRS. PAST H.S.
FULL-TIME COLLEGE STUDENTS
- ...-tb ---1,-----2=11-=-7-z.1-...-----
do et e2 113 84A
MALE VS FEMALE COLLEGE STUDENTS
o MALES
FEMALES
4:1"------.0./....45--------0-----0-----°
---"L"-----..----".
110 111 812 113 814 115
YEAR OF ADMINISTRATION
212192

FIGURE 45
Other Opiates: Trends in Annual Prevalence Among College Students1-4 Years Beyond High School
30-
20-
10-
30
20
10
COLLEGE STUDENTS VS TOTAL
A TOTAL. SAMPLE 1-4 YRS. PAST H.S.
Full-TIME COLLEGE STUDENTS
810 at 82 53 84 85
MALE VS FEMALE COLLEGE STUDENTS
o MALES
FEMALES
80 el 82 83 8'4 55YEAR OF ADMINISTRATION
193 2 3

FIGURE 46
Stimulants: Trends in Annual Prevalence Among College Students1-4 Years Beyond High School
COLLEGE STUDENTS VS TOTAL
40
30-
20-
10
..041. ...---
TOTAL SAMPLE 1-4 YRS. PAST H.S.
FULL-TINE COLLEGE STUDENTS
**AS.."...
Ol "..:,..".A...
'ANI
.....
o110 di d2 113 114 113
40-
30-
20-
10-
0
MALE VS FEL:ALE COLLEGE STUDENTS
O MALES
FEMALES
1 00 d1 112 113 114 113
YEAR OF ADMINISTRATION
NOTE. The dotted lines between 1981 and 1982 denote the change in theamphetamine question.
2 ,..) 4 194

FIGURE 47
BarbIturatem Trends In Annual Prevalence Among College Students1-4 Years Beyond High School
COLLEOE STUDENTS VS TOTAL
30-
TOTAL SAMPLE 1-4 TN& PAST N.&
Full-11141 COLLIS( STUDENTS
20-
10-
AV
0Sit $13 Si4
30
tg 20 -
MALE VS FEMALE COLLEGE STUDENTS
o MALES
MALES
0ito 1 i Ia $3 $4 is
YEAR OF ADMINISTRATION
195
205

FIGURE 48
Methaqualone: Trends in Annual Prevalence Among College Students1-4 Years Beyond High School
30
V 20-
8
0
COLLEGE STUDENTS VS TOTAL
TOTAL SAMPLE 1-4 YRS. PAST H.S.
FULL-TIME COLLEGE STUDENTS
A''
30-
20-
10-
0
I i 1 1 12 13 14 1$o 5
MALE VS FEMALE COLLEGE STUDENTS
MALES
FEMALES
BO 11 1 1 11 112 13 14 113
YEAR OF ADMINISTRATION
236 196

FIGURE 49
Tranquilizers: Trends in Annual Prevalence Among College Students1-4 Years Beyond High School
30 -
20
1 0
0
30-
20 -
10 -
0
COLLEGE STUDENTS VS TOTAL
& TOTAL SAMPLE 1-4 YRS. PAST Kt
FULL-TIME COLLEGE STUDENTS
"'A ....
--'...."-- 1
do82il83 84 85
MALE VS FEMALE COLLEGE STUDENTS
o MALES
FEMALES
SO i 1 112 113 84 815
YEAR OF ADMINISTRATION
197 2 7 -

FIGURE 50a
Alcohol: Trends in Annual Prevalence Among College Students1-4 Years Beyond High School
100
80-
80-
70-
SO-
50-
40-
30-
20-
10-
100
110-
80-
70-
SO-
50-
40-
30-
20-
10-
COLLEGE STUDENTS VS TOTAL
rro-6-4
TOTAL SAMPLE 1-4 YR& PAST KtFULL-TIME COLLEGE STUDENTS
I ao e I 112 313 84 8I5
MALE VS FEMALE COLLEGE STUDENTS
O MALES
FEMALES
1110 1 84 84 11115
YEAR OF ADMINISTRATION

30-
20
10:
0
FIGURE 50b
Alcohols Trends in Thirty.Day Prevalence ofDaily Use Among College Students
1-4 Years Beyond High School
COLLEGE STUDENTS VS TOTAL
TOTAL SAMPLE 1-4 YDS. PAST
FULL-TIME COLLEGE STUDENTS
30-
20
10
0
so 1 I13 4 11120 5 1 5
MALE VS FEMALE COLLEGE STUDENTS
CI MALES
FEMALES
111..,0
110 II 112 53 111 4 esYEAR OF ADMINISTRATION
199 2 9 9

FIGURE 50c
Alcohol: Trends in Two Week Prevalence of 5 or MoreDrinks in a Row Among College Students
1-4 Years Beyond High School
30 -
20 -
10 -
0
0
COLLEGE STUDENTS VS TOTAL
!---II
21- .-'7".r.1-----1--s.
a TOTAL SAMPLE 1-4 YRS. PAST H.S.
FuLL-TINE COLLEGE STUDENTS
SO -
w 40 -0ot1--
W 20
10
0
eci 11 11 02 113 114 is
MALE VS FEMALE COLLEGE STUDENTS
0_---0---__0,-.0--
.............,............
o MALESFEMALES
1 80 111 1112 113 114 1115
YEAR OF ADMINISTRATION
210200

FIGURE 51a
Cigarettes: Trends in Thirty-Day Prevalence Among College Students1-4 Years Beyond High School
40
30
20-
10 -
0
COLLEGE STUDENTS VS TOTAL
-
A TOTAL SAMPLE ! .4 YRS. PAST KS.
FULL-TIME COLLEwE STUDENTS
40-
30-
20-
10 -
0
' 1 10 1 12 5 1138 4
MALE VS FEMALE COLLEGE STUDENTS
O MALES
FEMALES
'0 d 811S 1 2 113 4 115
YEAR OF ADMINISTRATION
201 211

40
30-
20-
10-
0
40
FIGURE 51b
Cigarettes: Trends in Thirty-Day Prevalence ofDaily Use Among College Students
1-4 Years Beyond High School
COLLEGE STUDENTS VS TOTAL
A TOTAL SAMPLE 1-4 YRS. PAST KS.
FULL-TIME COLLEGE STUDENTS
A.-.
30-
20-
10-
o
110 111 112 83 84 115
MALE VS FEMALE COLLEGE STUDENTS
111-.........
o MALES
FEMALES
. .G"----.0.-----0.---.....0
80 111 82 113 84 esYEAR OF ADMINISTRATION
212202

FIGURE 5 k
Cigarettes: Trends in Thirty-Day Use of Half-Pack aDay or More Among College Students
1-4 Years Beyond High School
40
30-
20-
10-
0
COLLEGE STUDENTS VS TOTAL
a TOTAL SAMPLE 1-4 YRS. PAST H.S.
FULL-TIME COLLEGE STUDENTS
^hp
40-
30-
20-
10-
0
80 81 82 83 84 85
MALE VS FEMALE COLLEGE STUDENTS
o MALESFEMALES
80 DI 112 83 84 85YEAR OF ADMINISTRATION
203 21

RECENT TRENDS IN DRUG USEAMONG COLLEGE STUDENTS
Since the drug-using behaviors of American college students in the late1960's and early 1970's represented the leading edge of what was tobecome an epidemic of certain types of drug use In the generalpopulationespecially with regard to the use of marijuana and LSDitis interesting and important to note what has happened to thosebehaviors among college students In recent years.
In this section we continue to use the definition of college students ashigh school graduates one to four years past high school who areenrolled full time in a two year or four year college at the beginning ofMarch in the year In question. For comparison purposes we also providetrend data on the entlre respondent group one to four years past highschool, including the college students. (See Figures 39 through 51.)Because the rate of college enrollment declines steadily with number ofyears beyond high school, the comparison group is slightly older on theaverage than the college-enrolled component of that group. However,this should influence the comparisons of the college-enrolled with thetotal group rather little, since few of the drugs show an age effect intheir usage rates.
It should also be remembered that the difference between the enrolledand total group shows the degree to which college students are above orbelow average among all high school graduates in this age band. Werewe able to Include the high school dropout segment in the "total"calculation, any differences with the college-enrolled would probably beaccentuated.
For each year there are approximately 1100 respondents comprising thecollege student sample (see Table 31 for N's per year) and roughly 2800respondents comprising the total age group one to four years past highschool. Comparisons of the trends in these two groups are given below.
Trends in Prevalence 1980-1985: College Students
Trends between 1980 and 1985 in the use of any illicitdrug other than marijuana or amphetamines are veryparallel for those enrolled in college and for allrespondents of the same age (i.e., 1 to 4 years pasthigh school), with both groups showing slight declines.The same is true for use of any illicit drink and use ofany illicit drug other than marijuana, but part of the1980 to 1982 decline in these two measures is due tothe artifactual over-reporting of amphetamine use in1980 and 1981, which was subsequently removed by achange in question wording in 1982. Since 1982 therehave been parallel slight declines for both the college-enrolled and those not enrolled, on all three measures
214 204

of illicit drug use. For example, annual use of myillicit druK among college students declined from 50%in 1982 to 46% in 1985, and monthly use dropped from31% to 26%.
Also, for most individual classes of drugs, the trendssince 1980 among those enrolled in college tend toparallel those for that age group as a whole, as well asthe trends observed among seniors. That means thatfor most drugs there has been a decline In use overthat time interval.
For example, there was a decline in the annualprevalence of marijuana among college studentsbetween 1980 and 1984 from 51% to 41% but thedecline halted In 1985. These changes are highlyparallel to the changes observed for the age group as awhole and proportional to the degree of changeoccurring among seniors.
Daily marl uana use among college students fellsignificantly between 1980 and 1985, from 7.2% to3.1%, as It die for the age group as a whole and as itdid among high school seniors.
In proportional terms, one of the largest declinesobserved among college students is for LEI, withannual prevalence falling from 6.3% in 1982 to 2.2% in1985. This is a proportionately larger drop than wasobserved among seniors, but parallels pretty closelythe age group as a whole.
An appreciable decline also occurred for stimulant use,for which annual prevalence dropped from 21% in 1982to 12% in 1985. Proportionately this also Is aconsiderably larger drop than among seniors, but isfairly parallel to the overall change among those ofcollege age.
Methaqualone showed a dramatic drop among collegestudents, going from an annual prevalence of 7.2% in1980 to 1.4% in 1985. Again, this drop has beengreater than among high school students, though onlyslightly greater, and parallels the changes in this agegroup as a whole.
Barbiturate use was already quite low among collegestudents in 1980 (at 2.9% annual prevalence) but it fellmore than half to 1.3% by 1985. This proportionaldecline was, once again, more sharp than among highschool students, but this time a little less sharp thanamong the young adult sample taken as a whole.
The annual prevalence of tranquilizer use dropped byhalf in the perIod 1980-1984, from 6.9% to 3.5%. No
205
21 5

further decline was observed in 1985. Again, this is alarger proportional drop than among high schoolseniors, but about average for the entire age group.
Unlike what happened among high school seniors, theuse of oplates-other-than-heroin did not rise In 1985among college students; rather, It fell to an annualprevalence of 2.4%, from 3.8% in 1984. This rate isconsiderably below the 1980 figure for college studentsof 5.1%, and the overall decline closely parallels whathas been happening among young adults generally.High school seniors, by comparison, have shown nodecline since 1980 in the use of this class of drugs.
Like the high school seniors, college students showed arelatively stable pattern of cocaine use between 1980and 1984 and a small increase in annual prevalence in1985 (from 16% to 17% among college students, whichis not statistically significant). For the whole agegroup cocaine use remained quite stable throughoutthe interval 1980-1985, with the result that collegestudents caught up to their age peers with their slightincrease in use.
It is in regard to alcohol use that college studentsappear to be showing shifts in use which are differentfrom those observed either among their total agegroup or among high school seniors. Both of the lattergroups have shown some drop in the frequency ofhaving five or more drinks in a row during the two-week interval preceding the survey, but collegestudents have not shown this decline. Indeed, theyreport their highest rates in 1984 and 1985. Thus it isclear that more college students report occasions ofheavy drinking than other young adults, and thatpattern of drinking may be on the increase amongcollege students at the same time it is showing somefalloff among their age mates and among high schoolstudents.
College students also have a thirty-day prevalence ofalcohol consumption which is higher than their peers.The difference has changed rather little since 1980,although some divergence does appear in 1985.
On the other hand, college students generally have hadslightly lower rates of daily drinking than their agegroup taken as a whole, and this fact has changedrather little in the past five years, insofar as both haveshown some decline in daily use. In 1985 daily drinkingamong college students stands at 5.0%, compared with6.0% for their age group and 5.0% for high schoolseniors.
216206

Cigarette smoking among American college studentshas declined modestly in the period 1980-1985. Thirty-day prevalence fell from 25.8% to 21.5% between 1980and 1984, then rose slightly (to 22.4%) in 1985 ashappened among seniors. The daily smoking rate fellfrom 18.3% in 1980 to 14.3% in 1985, though the rateof decline decelerated after 1983. While the rates ofsmoking are dramatically higher than average for theentire age group (including those not In college) thetrends are highly parallel.
Among seniors, however, the trend line for daily useduring the 1980-1985 interval has been fairly flat.This divergence of trends between high school andcollege age graduates Is due to the strong cohorteffects, discussed earlier, which are observed incigarette smoking. The recent levelling among highschool seniors leads to the prediction that there will bea levelling in the college years (barring the overlay ofany important historical events), as seems to bedeveloping already.
In sum, the trends in substance use among Americancollege students appear to parallel closely thoseoccurring among their age group as a whole, thoughthere are some important differences in absolutelevels. The major exception occurs for occasions ofheavy drinking, which appears to be falling amongthose not enrolled full-time in college (as well asamong high school seniors) but, If anything, Is risingamong college students.
The trends among college students are highly parallelfor the most part to the trends among high schoolseniors, although declines in many drugs over the lasthalf-decade (1980-1985) have been proportionatelylarger among college students (and for that matteramong all young adults of college age).
Sex Differences in Trends Among College Students
One trend which is not obvious from the figures included here is thefact that the proportion of college students who are female has beenrising slowly. Females comprised 50% of our 1980 sample of collegestudents, but 55% of our 1985 sample. Given that there existsubstantial sex differences in the use of some drugs, we are concernedthat over a longer time apparent trends in the levels of drug use amongcollege students might actually be attributable to changes in the sexcomposition of that population. For that reason, in particular, wepresent separate trend lines for the male and female components of thecollege student population. Differences in the trends observed for thesetwo groups are illustrated in Figures 39 through 51, and are discussedbelow:
207 21 7
154-831 0 - 86 - 8

Trends between 1980 and 1985 In the use of any Illicitdrug other than marijuana or amphetamines are veryparallel for male and female college students, withboth groups showing slight declines. Female collegestudents show a sharper decline between 1981 and 1982In use of any illicit drug and use of any illicit drugother than marijuana, but part of the decline is due tothe artifactual over-reporting of amphetamine useprior to 1982. Since 1982 (when the revised amphet-amine questions were introduced) there have beenparallel slight declines In both groups for all threemeasures of illicit drug use. For example, annual useof any Illicit drug among male college studentsdeclined from SS% in 1982 to 51% in 1985, and thecorresponding figures for female students are 45% and43%.
For several specific drugs, trends In the annualprevalence of use for male and female college studentshave also been highly parallel. These include marl-ivana, cocaine, tranquilizers, heroin, and alcohol.
For another group of three drugsLAD., methaqualona,and barbituratesthere has been evidence of a con-vergence In usage rates between the sexes. In allthree cases, both sexes are moving toward conver-gence near 0%.
14.12, for example, shows an almost complete elimina-tion of a sizeable sex difference In 1980 (with maleshigher), primarily due to a large drop in use by males.
A substantial sex difference in methaqualone use(males higher) also was erased over the interval, as useby both sexes declined, but with males decliningsubstantially more.
A 1980 sex difference in barbiturate use (males higher)was virtually eliminated by 1982: both sexes havedeclined in parallel since.
Stimulant use also shows some convergence of usebetween 1982 (when the revised questions were firstintroduced) and 1985. While use by both sexes isdropping, males (who have consistently been higher)have dropped more.
Among the illicit drugs, only in the case of opiatesother than heroin is there evidence that there has beenany divergence between the sexes. Between 1983 and1985 use by females declined steadily while use bymales first rose and then fell some.
Regarding alcohol use, annual prevalence has remainedvirtually identical for the two sexes throughout the
208
218

period. However, there has been some evidence of adivergence in 30-day prevalence since 1982, withfemales dropping and males rising overall. Roughlythe same has been true for kik prevalence (althoughboth sexes dropped in 1983).-13erhaps most important,however, has been the divergence in sx_casioni otbnyxkjthka. We can see in Figure 30c that collegemales account for the overall difference In trendsbetween college students and their larger age group.Between 1982 and 1983 the prevalence of such heavydrinking has risen from 32% to 37% among collegemales, whereas among college females it has droppedfrom 37% to 34%.
The case is less clear for claarettes. Since 1980cigarette smoking has consistently been higher amongfemales than males in college. While the sexdifferences appeared to narrow during the middle ofthat five year interval, they are about as large in the1983 survey as they were in 1980.
21 9209

OTHER FINDINGSFROM THE STUDY
Each year this section presents additional recent findings from theMonitoring the Future study. Some of these have been publishedelsewhere; however, the first two analyses included hereon the use ofnon-prescription stimulants and daily marijuana useare not reportedelsewhere.
The Use of Non-Prescription Stimulants
As is discussed in other chapters of this report, between 1979 and 1981we observed a substantial increase In reported stimulant use by highschool students. We had reason to believe that a fair part of thatincrease was attributable to non-prescription stimulants of two generaltypes"look-alike" drugs (pseudo-amphetamines, usually sold by mallorder, which look like, and have names which sound like, realamphetamines) and over-the-counter stimulants (primarily diet pills andstay-awake pills). These drugs usually contain caffeine, ephedrine,and/or phenylpropanolamine as their active ingredients.
Beginning with the 1982 survey we Introduced new questions on somequestionnaire forms in order to more accurately assess the use ofamphetamines as well as to assess the use of the "look-allkes," dietpills, and stay-awake pills of the non-prescription variety. For example,on one of the five questionnaire forms respondents were asked toindicate on how many occasions (If any) they had taken non-prescriptiondiet pills such as Dietac, Dexatrlm, and Prolamine (a) In their lifetime,(b) in the prior twelve months, and (c) in the prior thirty days. (Thesecorrespond to the standard usage questions asked for all drugs.) Similarquestions were asked about non-prescription stay-awake pills (such asNo-Doz, Vivarin, Wake, and Caffedrine) and the "look-alike" stimulants.(The latter were described at some length in the actual question.)
On three of the five questionnaire forms in 1982 and 1983 (and in allquestionnaire forms thereafter) respondents were also asked about theiruse of prescription amphetamines, with very explicit instructions toexclude the use of over-the-counter and "look-alike" drugs. Thesequestions yielded the data described in this volume as "stimulants,adjusted." Here we will refer to them as "amphetamines, adjusted," todistinguish them more clearly from the non-amphetamine stimulants.
Prevalence of Use in 1985
Table 32 gives the prevalence levels for these variousclasses of stimulants. As can be seen, a substantialproportion of students (29%) have used over-the-counter diet pills and 7% have used them in just thepast month. Some 0.9% are using them daily.
210
220

TABLE 32
Various Stimulants: Trends in Lifetime, Annual, and Thirty-Day Prevalence by Sex(Entries are percentages)
Classof
Classof
Diet Pills
Class'84 - '85 of
atly,Awake Pills
Clue'84 - '85 of
Look-Mikes
'84 - '85Class
ofClass
ofClass
ofClass
ofClass
ofClass
ofClass
ofClass
of1982 1983 1984 an change, 1982 1983 1084 1985 change 1982 1983 1984 1985 change,
Lifetime Prevalence
Total 29.8 31.4 29.7 28.7 -1.0 19.1 20.4 22.7 28.3 +3.8ss 15.1 14.8 15.3 14.2 -1.1
Males 18.5 17.4 14.8 14.8 0.0 20.2 22.3 23.2 28.0 +4.8s 13.8 14.2 14.1 14.1 0.0Females 42.2 44.8 43.1 41.5 -1.8 18.9 18.2 21.7 24.9 +3.2 15.1 14.4 15.2 13.8 -1.4
Annual Prevalence
Total 20.5 20.5 18.8 18.9 -1.9 11.8 12.3 13.9 18.2 +4.3sss 10.8 9.4 9.7 8.2 -1.5
Males 10.7 10.8 9.2 9.0 -0.2 12.8 13.8 15.4 19.7 +4.3s 9.5 9.2 9.7 8.3 -1.4Females 29.5 30.0 27.5 24.4 -3.1 10.0 10.5 12.5 17.0 +4.5ss 10.7 8.8 8.5 7.8 -0.7
30-Day Prevalence
Total 9.8 9.5 9.9 7.3 -2.8ss 5.5 5.3 5.8 7.2 +1.4 5.8 5.2 4.4 3.8 -0.8
Males 5.0 4.0 4.8 3.7 -1.1 8.0 5.5 8.2 7.7 + 1.5 4.0 4.5 4.5 3.8 -0.7Females 14.0 13.7 14.2 10.7 -3.5s 4.7 4.5 5.5 8.7 +1.2 5.2 5.4 3.8 3.1 -0.7
NOTE: Level of significance of difference between the two most recent classes: s = .05, as = .01, ess = .001.
221

Very similar proportions are using actual ampheta-mines (adjusted): 26% lifetime, 7% monthly, and 0.4%daily prevalence.
Only about half as many students are knowingly usingthe "look-allkes" as are using diet pills or ampheta-mlnelTidjt7FO: 14% lifetime, 4% monthly, and 0.4%daily prevalence. Of course, It is probable that someproportion of those who think they are getting realamphetamines have actually been sold "look-alikes,"which are far cheaper for drug dealers to purchase.
Stay-awake_pills have also been used by a fair numberof students: 26% lifetime, 7% monthly, and 0.4% dailyprevalence.
The revised questions on amphetamine use yieldedprevalence estimates in 1983 which were about one-quarter to one-third lower than the original version ofthe question, indicating that the distortion in therecent unadjusted estimates was due to the inclusionof some non-prescription stimulant use.
Subgroup Differences
Figure 52 shows the prevalence figures for these drugclasses for males and females separately. It can beseen that the use of diet pills is dramatically higheramong females than among males. In fact, theabsolute prevalence levels for females are impres-sively high, with some 42% reporting some experiencewith them and 11%or one in every nine femalesreporting use In just the last month. For all otherstimulants the prevalence rates for both sexes arefairly close.
A similar comparison for those planning four years ofcollege (referred to here as the "college-bound"), andthose who are not, shows some differences as well(data not shown). As is true for the controlledsubstances, use of the "look-alikes" and diet pills islower among the college-bound. For example, theannual prevalence figures for the college-bound vs. thenoncollege-bound respectively are 7% vs. 10% for the"look-alikes," and 15% vs. 21% for the diet pills.
Use of stay-awake pills is actually higher for thecollege-bound: annual prevalence is 20% vs. 16% forthe noncollege-bound.
There are no dramatic regional differences in the useof diet pills or "look-alikes." The West, however, isdistinctly higher in the use of stay-awake pills. Annualprevalence is at 26% in that region, compared to 18%
212
222

In the Northeast and North Central, and 13% In theSouth.
There are no systematic differences In use of non-prescription stimulants associated with populationdensity.
The use of all of the non-prescription stimulants (i.e.,diet _pills, stay-awake Pill% and "look-allkes") issubstantially higher among those who have hadexperience with the use of illicit drugs than amongthose who have not, and highest among those who havebecome most involved with illicit drugs (data notshown). For example, 1% of those who have abstainedfrom any Illicit drug use report ever using a "alike" stimulant, compared to 5.4% of those who haveused only marijuana, and 35.0% of those who have usedsome illicit drug other than marijuana.
Trends In Use
Because these questions were new In 1982, trends canbe directly assessed only since then.
However, It is worth noting that the 1982 figures foramphetamines (adjusted) are higher than theunadjusted figures for all years prior to 1980. (SeeTables 7 through 10.) This suggests that there wasindeed an increase In amphetamine use between 1979and 1982or at least an increase In what, to the bestof the respondent's knowledge, were amphetamines.
In recent years, there have been increased legislativeand law enforcement efforts to curb the manufactureand distribution of "look-alike" pills. Perhaps as aresult, the use of these pills decreased slightly from1982 to 1985; for example, annual prevalence wentfrom 10.8% to 8.2%.
Use of diet pills decreased slightly between 1982 and1985.
Use of stay-awake pills has increased significantly inrecent years, particularly in 1985, with a lifetimeprevalence of 26% in 1985, up from 19% in 1982.Annual prevalence increased significantly from 12% in1982 to 18% in 1985. Monthly prevalence showed onlya small increase, from 5.5% to 7.2%.
Subgroup differences in trends for the most partreflect the overall trends, although the West showed aparticularly large increase in the use of stay-awakeOh in 1985.
213 ?23

100
90
80
70
40
30
20
10
0
FIGURE 52
Prevalence and Recenev of Use, by SexAmphetamines and Non-Prescription Stimulants, Class of 1985
KEY
I Used Drug, But Notf in Past Year} Used in Past Year
Not in Past MonthIUsed in Past Month,Less Than DailyUsed Daily in Past Month(Daily Prevalence)
28
42
2824 25
1614 5
11
15
8 e 84 4.5 A A A 3 IA 3 .5
Males Females Males Females Moles Females Males Females
"Look-alikes" Stay Awake Diet Pills AmphetaminesPills (adjusted)
224214

The Use of Marijuana on a Daily Basis
In past reports In this series, we summarized a number of findingsregarding daily marijuana users, including what kind of people they are,how use changes after high school for different subgroups, and whatdaily user. see to be the negative consequences of their use.* In 1982 aspecial question segment was introduced Into the study In one of thefive questionnaire forms In order to secure more detailed measurementof Individual patterns of daily use. More specifically, respondents wereasked (a) whether if at any time during their lives they had ever usedmarijuana on a daily or near-dally basis for at least a month and, if so,(b) how recently they had done that, (c) when they first had done it, and(d) how many total months they had smoked marijuana daily, cumulatingover their whole lifetime. The results of our analyses of these questionsfollow.
Lifetime Prevalence of Daily Use
Current daily use, defined as use on twenty or moreoccasions In the past thirty days, has been fluctuatingwidely over the past eight years, as we know from thetrend data presented earlier In this report. It rosefrom 6.0% among seniors In 1975 to 10.7% In 1978,then down to 4.9% In 1985.
For the Classes of 1982 - 1984, we have found thelifetime prevalence of daily use for a month or moreto be far higher than current daily usee.g., at 15.6%or one In every six seniors In 1985. In other words, theproportion who describe themselves as having beendaily or near-daily users at some time In their lives isthree times as high as the number who describethemselves as current daily users. However, webelieve it very likely that this ratio has changeddramatically over the life of the study as a result ofthe large secular trends In daily use. Therefore, Itwould be inaccurate to extrapolate to the Class of1978, for example, ..nd deduce that their lifetimeprevalence of daily use was three times their 10.7%current use figure. (An Investigation of data from afollow-up panel of the Class of 1978 confirms thisassertion.)
*For the original reports see the following, which are availablefrom the author: L.D. Johnston, "Frequent marijuana use: Correlates,possible effects, and reasons for using and quitting," In R. De Silva, etal., (Eds.), Treating the marijuana dependent person. New York: TheAmerican Council on Marijuana, 1981. Also see L. D. Johnston, "Areview and analysis of recent changes In marijuana use by Americanyoung people," in Marijuana: The national impact on education, NewYork: The American Council on Marijuana, 1982.
215 225

Utilizing data collected in 1985 from follow-up panelsfrom the earlier graduating classes of 1976 through1984, we find that the lifetime prevalence of dailymarijuana use for these recent graduates (ranging Inage from about 19 to 27) is 23%.
Grade of First Daily Use
Of those seniors who were daily users at some time,over half (57%, or 9% of all seniors) began thatpattern of use before tenth grade. However, thesecular trends in daily use must be recalled. Activedaily use reached its peak among seniors in 1978, whenthis 1985 graduating class was in fifth grade. Thus weare confident that different graduating classes showdifferent age-associated patterns.
Nearly all who were to become daily users by the endof high school had done so by the end of grade ten(79% of the eventual daily users). The percentages ofall seniors who started daily marijuana use In eachgrade level is presented in Table 33.
Recency of Daily Use
Two-thirds (68%) of those who report ever having beendaily marijuana users (for at least a one monthInterval) hrve smoked that frequently in the past yearto year-and-a-half, while one-third (33%) of them saythey last used that frequently "about two years ago" orlonger. On the other hand, only 26% of all such users(or 4.1% of the entire sample) say they have used dailyor almost daily in the past month (the period for whichwe define current daily users). The fact that only4.1% of the entire sample report themselves to becurrent daily users, versus the 4.9% estimate givenearlier in this report, suggests that some students havea more stringent definition of "daily or near-dally use"than the operational one used in this report (i.e., useon twenty or more occasions during the past month).
Duration of Daily Use
It seems likely that the most serious long-term healthconsequences associated with marijuana use will bedirectly related to the duration of heavy use. Thus aquestion was introduced which asks the cumulativenumber of months the student has smoked marijuanadaily or nearly daily. While hardly an adequatemeasure of the many different possible cross-timepatterns of usea number of which may eventuallyprove to be Importantit does provide a grossmeasure of the total length of exposure to heavy use.
216
226
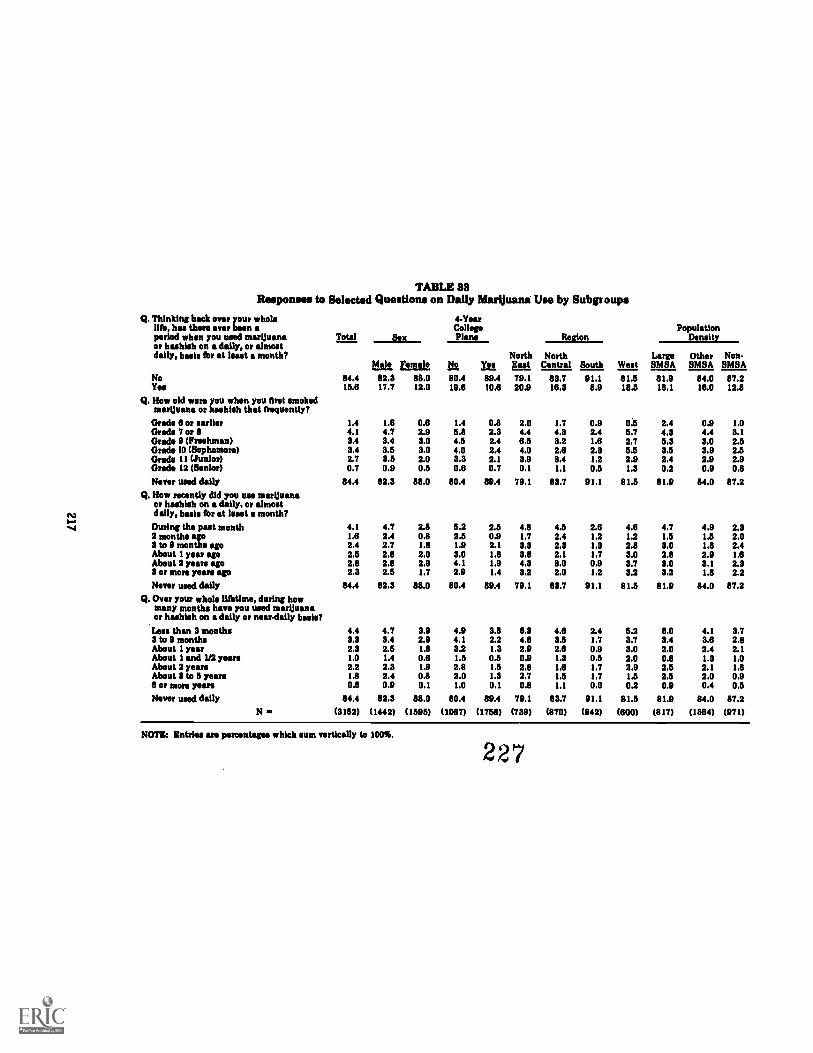
TABLE 33Responses to Selected Questions on Daily Marijuana Use by Subgroups
Q. Thinking back over your wholelife, hu there ever been aperiod when you used marijuanaor hashish on a daily, or almostdaily, basis for at least a month?
Dial S a x
4-YearCollegePlan
NorthEut
RmdcA1
West
PopulationDenslt
Male Female No YesNorth
Central SouthLargeSMSA
OtherSMSA
Non.SMSA
No 84.4 82.3 88.0 80.4 89.4 79.1 83.7 91.1 81.5 81.9 84.0 87.2Yu 15.8 17.7 12.0 19.8 10.8 20.9 18.3 8.9 18.5 18.1 18.0 12.8
Q. How old were you when you first smokedmarijuana or huhish that frequently?
Grade 8 or earlier 1.4 1.8 0.8 1.4 0.8 2.0 1.7 0.9 OA 2.4 0.9 1.0()rade 7 or 8 4.1 4.7 2.9 5.8 2.3 4.4 4.3 2.4 5.7 4.3 4.4 3.1Grade 9 (Freshman) 3.4 3.4 3.0 4.5 2.4 8.5 3.2 1.8 2.7 5.3 3.0 2.5Deeds 10 (Sophomore) 3.4 3.5 3.0 4.0 2.4 4.0 2.8 2.3 5.5 3.5 3.9 2.5Grade 11 (Junior) 2.7 3.5 2.0 3.3 2.1 3.9 3.4 1.2 2.9 2.4 2.9 2.9Grade 12 (Senior) 0.7 0.9 0.5 0.8 0.7 0.1 1.1 0.5 1.3 0.2 0.9 0.8
Never used daily 84.4 82.3 88.0 80.4 89.4 79.1 83.7 91.1 81.5 81.9 84.0 87.2
I%)..
Q. How recently did you use marijuanaor huhish on a daily, or almostdaily, buis fin at least a month?
V During the put month 4.1 4.7 2.8 5.2 2.5 4.8 4.5 2.8 4.8 4.7 4.9 2.32 months ago 1.8 2.4 0.8 2.5 0.9 1.7 2.4 1.2 1.2 1.5 1.5 2.03 to 9 months ago 2.4 2.7 1.8 1.9 2.1 3.3 2.3 1.3 2.8 3.0 1.8 2.4About 1 year ago 2.5 2.8 2.0 3.0 1.8 3.8 2.1 1.7 3.0 2.8 2.9 1.8About 2 years ago 2.8 2.8 2.9 4.1 1.9 4.3 3.0 0.9 3.7 3.0 3.1 2.33 or more years ago 2.3 2.5 1.7 2.9 1.4 3.2 2.0 1.2 3.2 3.2 1.8 2.2Never used daily 84.4 82.3 88.0 80.4 89.4 79.1 83.7 01.1 81.5 81.9 84.0 87.2
Q. Over your whole lihtlme, during howmany months have you used markluanaor huhiah on a daily or near-dally buis?
Less than 3 months 4.4 4.7 3.9 4.9 3.8 8.3 4.8 2.4 5.2 8.0 4.1 3.73 to 9 months 3.3 3.4 2.9 4.1 2.2 4.8 3.5 1.7 3.7 3.4 3.8 2.8About 1 year 2.3 2.5 1.8 3.2 1.3 2.9 2.8 0.9 3.0 2.0 2.4 2.1About 1 and 1/2 years 1.0 1.4 0.8 1.5 0.5 0.9 1.3 0.5 2.0 0.8 1.3 1.0About 2 years 2.2 2.3 1.9 2.8 1.5 2.8 1.8 1.7 2.9 2.5 2.1 1.8About 3 to 5 years 1.8 2.4 0.8 2.0 1.3 2.7 1.5 1.7 1.5 2.5 2.0 0.98 or more years 0.8 0.9 0.1 1.0 0.1 0.8 1.1 0.0 0.2 0.9 0.4 0.5Never used daily 84.4 82.3 88.0 80.4 89.4 79.1 83.7 91.1 81.5 81.9 84.0 87.2
N w (3152) (1442) (1585) (1087) (1758) (739) (870) (942) (800) (817) (1384) (971)
NOTE: Entries are percentages which sum vertically to 100%.
227

Table 33 gives the distribution of answers to thisquestion. It shows that almost two-thirds (64%) ofthose with daily use experience have used "about oneyear" or less cumulativelyat least by the end oftwelfth grade. In fact, more than a quarter (28%) haveused less than three months cumulatively.
On the other hand, over one-fourth (29%, or 5% of allseniors) have used "about two years" or more cum-ulatively on a daily or near-dally basis.
Subgroup Differences
There is some sex difference in the proportion havingever been a daily user-189 for males and 12% forfemales. Furthermore, the cumulative duration ofdaily use is distinctly longer far the males. These twosex differences combine to account for the large male-female difference in current daily use. There is alsosome difference in their age at onset, with the malestending to start earlier on the average.
Whether or not the student has college plans isstrongly related to lifetime prevalence of daily use, aswell as to current prevalence. Of those planning fouryears of college, 11% had used daily compared with20% of those without such plans. And the college-bound users show a distinctly shorter cumulativeduration of use, with a lower proportion of them stillusing daily. Nevertheless, among those in each groupwho did use daily, the age-at-onset pattern Is fairlysimilar.
There are some large regional differences In lifetimeprevalence of daily use, all consistent with those foundfor current daily use. The Northeast is highest, with21% having used daily at some time, the West andNorth Central are in the middle at 19% and 16%respectively, and the South Is the lowest at 9%.
The subgroup differences associated with urbanicityare likewise similar to those found for current dailyuse. Lifetime prevalence of daily marijuana use is18% in the large cities, 16% in the smaller cities, and13% in the non-urban areas.
Trends in the Use of Marijuana on a Daily Basis
Compared to the class of 1982, significantly fewerseniors in the class of 1984 had described themselvesas having been daily or nearly daily users of marijuanaat some time in their lives (21% vs. 16%); in 1985 theproportion was essentially unchanged (16%).
218
22 8

TABLE 34
Trends in Daily Use of Marijuana in Lifetimeby Subgroups
All seniors
Sex:MaleFemale
Percent ever used
'84-85ea=- 0.7
+0.5- 0.9
Chumof
MI20.5
20.118.0
Classof
LW16.8
18.113.5
Classof
UM18.3
17.212.9
Clipsof
MI15.8
17.712.0
iv....ua College Plans:
None or under 4 yrs 22.5 20.3 18.9 19.6 +0.7Complete 4 yrs 13.8 10.5 10.7 10.6 -0.1
Region:Northeast 25.1 20.4 24.1 20.9 -3.2North Central 21.1 15.9 12.8 18.3 +3.5South 15.7 12.7 14.0 8.9 -5.1ssWest 20.8 21.4 17.8 18.5 +0.9
Population Density:Large SAWA 23.8 20.0 19.4 18.1 -1.3Other MU 20.3 18.2 16.6 18.0 -0.6Non-SMSA 17.9 12.6 13.2 12.8 -0.4
Percent reporting first useprior to tenth grade
Classofina13.1
14.28.2
17.313.39.3
12.6
15.812.511.7
NOVA: Level of signIficance of difference between the two most recent classes: s w .05, es w .01,
229
Classof
DmClass
ofjaiChios
ofnig '84-15
onugt,
11.1 10.9 8.8 -2.1.
12.1 11.8 9.8 -2.08.3 8.0 6.5 -1.5
13.5 12.3 11.8 -0.56.5 6.6 5.5 -1.1
11.9 17.2 12.9 -4.312.4 8.4 9.1 +0.78.3 8.5 5.0 -3.5s
13.9 12.1 8.9 -3.2
13.7 12.4 12.0 -0.412.0 11.5 8.3 -3.2a8.2 8.5 6.6 -1.9
en w .001.

Between 1982 and 1985, the decline was strongeramong females (from 18% in 1982 to 12% in 1985) thanamong males (20% to 18%).
Both the college-bound and noncollege-bound groupsdeclined between 1982 and 1985 by about 3% each.
Lifetime prevalence is down in all four regionsbetween 1982 and 1985, with the South showing thelargest decline (from 16% in 1982 to 9% in 1985). Theother regions are down by 2-5%.
All three population density levels showed 1982 to1985 declines of 4-6%.
The trends In daily use of marijuana at earlier gradelevels parallel very closely the trends in lifetimeprevalence (see Table 34).
A Further Look at Cocaine Uses
In the cited chapter on cocaine, and in a subsequent NIDA-sponsoredpress science briefing, we provided some information about the levels ofand recent trends in cocaine use among America's adolescents andyoung adults, as well as some of their attitudes and beliefs about thedrug, and their reasons for using it. We also examined cross-timepattowns of use through 1984, certain predictors of use, and some of thecondit'ons of the social and physical environments which are associatedwith use. Most of the results have been presented earlier in the presentreport; here we will very briefly summarize the findings.
Overall, we found levels of cocaine use among seniorsto be relatively stable for the years between 1980 and1984, after a period of rapid increase between 1976and 1979. The Increase was particularly strong in tworegions of the country, the Northeast and West, asshown in Figure 15. (Figure 15 contains data updatedthrough 1985.) Exposure to use and use by friendsmoved in parallel to self-reported use, as would beexpected, assuming valid measures. Perceived avail-ability also moved in tandem with these othermeasures.
The great majority of the 1984 seniors believed regularuse to be dangerous, and 80% disapproved of evenexperimenting with cocaine. Use was found most
*O'Malley, P.M., Johnston, L.D., & Bachman, 3.G. "Cocaine useamong American adolescents and young adults." In N.3. Kozel & E.H.Adams (Eds.), Cocaine Use in America: Epidemioloftic and ClinicalPerspectives (NIDA Research Monograph 61) (ADM) 85-1414.Washington, D.C.: National Institute on Drug Abuse, 1985.
230 220

frequently In the West and Northeast regions of thecountry, In more urban areas, among males, and amongthose who are not college-bound. Neithersocioeconomic status nor personal Income was verystrongly associated with use; but a history of truancy,going out frequently In the evenings, and havingrelatively low religious Involvement were. Cocaineusers tended to use other illicit drugs (particularlymarijuana) and to be smokers and heavy drinkers muchmore frequently than nonusers. Thus there was littleevidence that cocaine involves a separate drug-usingsyndrome. In fact, it is not uncommon for cocaineusers to concurrently use marijuana or alcohol or both.
When taking cocaine, high school students most oftensnorted it, though some (24% of recent users) smokedit while only 4% of the users Injected. It was almostalways used with other people present, often at a partybut more often with just one or two people present.Most use occurred in the evening, with very few youngpeople using at school and a minority ever using athome or in a car.
Among the reasons most often cited for using cocaineare: "to see what it's like," "to get high," and "to havea good time with my friends." Only about 1% ofrecent users say they use it be- 'Ise they are "hooked,"and only about 4% say they tu tried to quit and beenunable to do so. In fact, most of those who used inhigh school do not show a cross-time progression toheavier use in the three to four years followinggraduation, which suggests that dependence eitherdevelops rather slowly or develops with relatively lowfrequency among moderate and light users.
Self-Reported Reasons for Using Drugs
The reasons that high school seniors use drugs and alcohol was thesubject of an extended article appearing in the 3ournal of Drug Issues.*On one of the study's five questionnaire forms, respondents were askedto indicate which of a list of thirteen or more reasons were the mostimportant reasons for their use of each of a number of licit awl Illicitsubstances they had used in the previous twelve month period, Theresponses of those who had used only once or twice in their lifet.rnes,and had used In the past year, were examined separately from those :+fthe more frequent users, to provide some perspective on the differencesin motivation associated with initial use versus continued use.
*L.D. Johnston and P.M. O'Malley. "Why do the nation's studentsuse drugs and alcohol: Self-reported reasons from nine nationalsurveys." Journal of Drug Issues, 1986, 16, 29-66.
221 231

In answer to one of several research questionsaddressed in the analyses, we found that, among theset of reasons offered to respondents, there was atendency for clusters of reasons (or factors) to emergethat are similar across the different drugs. Thereseemed to be a social or recreational factor consistingof the reasons "to get high" and "to have a good timewith friends." Several self-reported reasons having todo with using drugs to cope with negative affect alsotended to cluster, including "to get away from myproblems," "to deal with anger and frustration," "to getthrough the day," and "to relax or relieve tension."Using a drug "to increase the effects of other drugs"tends to be correlated with using "to decrease theeffects of other drugs," probably due to the fact thatboth are indicators of the respondent's degree ofmultiple drug involvement.
Across the full set of substances, the reason mostoften given for using any of them is "to have a goodtime with my friendsr (mentioned for at least onedrug by 65% of those reporting using any of them). Asubstantial but smaller proportion mention thecorrelated reason "to feel good or get high" (49%) as areason for using one or more of the drugs. Clearly,these social-recreational reasons comprise a majorreason for adolescent substance use, particularly forcontinued use as opposed to initial use. "To relax orrelieve tension" was also mentioned by slightly lessthan half (41%). Alcohol and marijuana are the twodrugs used by the most seniors for both of thesereasons.
The cluster of reasons related to coping with negativeaffect tend to be mentioned by a relatively largeproportion of the users of the various central nervoussystem depressant drugs, and particularly by the morefrequent users of alcohol, barbiturates, andtranquilizers. In fact, both the proportion and absolutenumber of day alcohol users who mention suchreasons for their use has been risingperhaps the mostdisturbing finding to emerge from these analyses.
For each drug, the more frequent users Indicate agreater number of reasons for their use than lessfrequent users. The social-recreational reasons inparticular are mentioned considerably more frequentlyby frequent users, as well as by those having to do withcoping with negative affect. For the central nervoussystem stimulants, amphetamines and cocaine, there isa considerable increase as a function of level of use inthe mentions of "to get more energy," "to stay awake,"and "to get through the day."
232 222

We think It likely that this multiplication of purposesat increased levels of use reflects both a self-selectionof the more psychologically 'heady" (or otherwisemotivated into heavier use), as well as the result ofheavier users learning from their experiences aboutthe ends that can be achieved with a given drug. Oneconclusion seems clear, howevers many of the morefrequent users (and particularly the daily marijuanaand alcohol users) nre using these substances forpsychological copingthat Is, to deal with negativeaffect, boredom, and (for the stimulants) to gain moreenergy.
A comparison of males and females shows far moresimilarities in their reasons for using the varioussuostances than differences. The few differences thatexist generally show females somewhat less inclined tobe using drugs for social-recreational reasons and, athigher frequency levels of use, somewhat more likelyto mention reasons having to do with coping withnegative affect, or with self-medication or otherfunctional reasons. This finding may help to explaintoe finding reported earlier in this monograph, thatnearly equal proportions of males and females havehad some experience with illicitly-used substancesdespite the fact that, on Individual substances,prevalence and frequency levels tend to be distinctlylower among females than among males.
As for there being any changes across time in thepatterns of reasons given by students for their use ofthese various substances, we find only a limitedamount of change. The major exception has been foramphetamines, where there has been some shift awayfrom soclal-recreational reasons for use and a shifttoward more instrumental reasons ("to lose weight,""to stay awake") and coping reasons ("to get throughthe day," "to get more energy"). The fact that theunderlying prevalence of use for most of thesesubstances has been shifting during the historicalperiod in question, means that a shift in the proportionof recent users giving a particular reason may tell adifferent story than trends in the proportion of theentire population giving that reason. Therefore, bothtypes of data were examined.
We conclude from these various findings that the typeof information gathered by self-report from respon-dents on the reasons for their using various substancescan be very useful in helping to develop an under-standing of the behavior in a given population or sub-population and for adding some qualitative under-standing of some of the cross-time trends in use. In
general, the findings tend to be highly replicableacross independent samples, to show a high order of
223 233

construct validity, and to show orderly patterns ofchange. It should be noted, however, that largesamples are required to attain these outcomes insurveys of the normal population, given the relativelylow frequency with which many of the illicitsubstances are used.
One use of such data, which we view as holdingpromise, is to characterize subgroups of users of aparticular substance based on their pattern of reasonsfor use. One would expect that somewhat differentpredictors, outcomes, and natural histories might bedistinguished for such differentiated subgroups. Forexample, people who are primarily social-recreationalusers of a drug might have quite different charac-teristics than those who are primarily using It for self-medication or other instrumental purposes. No doubt"pure types" will be in the minority, but we never-theless believe that such an approach to differen-tiating subgroups of users holds considerable promise.
Another clear Implication from the data is that thefrequently observed tendency to conceptualize anddiscuss illicit "drug use" In unldimensional or mono-lithic terms can be misguided. The differentsubstances tend to have qualitatively quite differentprofiles of reasons for which they are used. Whilethere does exist a fairly high degree of covariationamong the usage measures for the various substancesundoubtedly due in considerable part to such generalunderlying factors as propensity for risk taking,willingness to violate social norms, inclination to usechemicals to alter mood and consciousness, andinvolvement in soclal-recreational drug use inparticularthere is still an appreciable amount ofvariance in the use of each substance that is notexplainable by use of the other substances. A betterunderstanding of the more specific and unique reasonsfor using particular classes of substances may enhanceour ability to predict, explain, and understandsubstance use in all of Its forms.
23 4224

Implications for Prevention
In a recent chapter for a NIDA research monograph we discussed someof the implications the results of the current study may have forprevention strategy.* One is that the data on grade at first use suggestthat at present prevention programs need to begin at quite a young ageIf they are to reach youngsters before some "critical mass" of themhave already begun to use drugs, and to proselytize to potential newusers. The point Is made that the appropriate age for intervention mayvary over time and by drug. Since cocaine initiation continues into themid-twenties, continued prevention efforts with late adolescents andyoung adults are called for In the case of that drug, at least.
The dramatic rise In perceived harmfulness of regular marijuana use,which occurred during the same historical period in which daily usedropped by half, strongly suggests that there may be more of a rationaldecision-making component to drug using behaviors than has beenpreviously supposed. Of course, a concurrent change In attitudes andrelated behaviors does not necessarily mean that the change in attitudecaused the change In behavior. Therefore In the chapter we pursuefurther evidence that there Is such a linkage by looking at trends In thereasons seniors have given for either abstaining from marijuana usealtogether, or for quitting use. ("Quitters" were defined as those whohave used at least once In the past, but not at all In the month prior tothe survey, and who said that they probably or definitely would not beusing in the future. "Abstainers" were defined as those who had nevertried marijuana.)
Figure 33 in this report gives the chapter original figures showing trendsin the frequency with which these two groups of seniors have beenchecking "concern about psychological damage" and "concern aboutphysical damage" as reasons for their non-use. They show aconsiderable increase over time in the frequency of mentions for thesetwo reasons in both groupsthough particularly among quitters.
Since changes In price or availability might also account for a change Inuse, we provide in Figure 34 trends on the frequency with which thesereasons are mentioned. Clearly they have little or no power to explainthe_ change in daily use between 1978 and 1983, while the questionsabout perceived dangers do. Taken along with the other data from thestudy suggesting little or no change among all seniors in perceivedavailability for the past ten years, we take this as strong evidence that"supply side" factors did not account for the downturn, which in turnsuggests that "demand side" factors could, and indeed did. We believethe increase in the mentions of health concerns as reasons forabstaining and quitting provides evidence, In addition to that alreadyprovided by the overall change In perceived risk, that these attitudes
*See 3ohnston, L.D. The etiology and prevention of substance use:What can we learn from recent historical changes? In C.1.. 3ones andR.3. Battjes (Eds.), Etiology of Drug Abuse: Implications for Prevention(NIDA Research Monograph 36) (ADM) 83-1333. Rockville, MD:National Institute on Drug Abuse, 1983.
225 235

SO-
70.
SO-
50-
40-
FIGURE 63
Reasons Given for Abstaining Prom and Quitting Marijuana Use:Possible Physical and Psychological Harm
3076 77 78 79 80 81 82 83
Concern about Psychological Damage
0 Abstainers
0 Quitters
76 77 78 79 80 81 82 83Concern about Physical Damage
NOTE: Weighted N's for abstainers range from 1,198 to 1,808 yearly; weighted N's for thosewho quit using marijuana range from 730 to 1,067.
2. b

20
GO-
30-
40-
Z 30-
20-
10-
FIGURE 64
Reasons Given for Abstaining From and Quitting Marijuana Use:Cost and Availability
o Abstainers
o Quitters
0=g=9.0.0.0.1376 77 78 78 80 81 82 83 7 6 7 l7 7 8 78 8081 82 8.3
Too Expensive Not Available
NOTE: Weighted N's for abstainers range from 1,198 to 1,808 yearly; weighted N's for thosewho quit using marijuana range from 787 to 1,087.
237
account for much of the decline in daily use. (In an article currentlyunder review we will add still further evidence to support thatassertion.)
It Is unfortunate that data on perceived risk have not routinely beengathered for PCP, as well, since we think it likely that Increasedknowledge about the very real dangers of that drug also played a role inits substantial decline in use between 1979 and 1982. However, suchdata are not available to examine the hypothesis. Data on trends in theperceived rlsk of LSD in the early 1970's may also have told a verycomparable story to that observed for marijuana in the late 1970's andearly 1980's.
If our contention Is correct that the dangers perceived to be associatedwith a drug influence the likelihood that young people will use lt, thereare substantial prevention implications which derive from that fact.One is that it is important for prevention purposes to establishscientifically the facts about consequences. Another is that it isimportant to communicate them in a credible way to young people. Inthe chapter we argue that "the system" squandered whatever littlecredibility it had with young people in the early 1970's by presentinginaccurate and exaggerated claims in public service announcementsabout the effects of many drugs. We argue that the Importance ofretaining credibility cannot be overemphasized. In recent years itappears that the "system" has gained credibility on this issuein partbecause the cautions have come from scientific research communicatedby the press. While we believe that a more active use of the electronicmedia for prevention purposes is desirable at this juncture, we alsowould caution that the mistakes of the early 1970's not be repeated.
Some ways in which surveys such as the present one might be used moredirectly in the prevention process are also listed in the chapter.
1) It appears that young people often have an exaggeratedview of the proportion of their age group who usedrugse type of "collective Ignorance." Surveys, there-fore, might be used to affect normative behavioralexpectations, by showir,g that 'hot everybody is doing it,"whatever "IV may be, either among people of the sameage as the target audience, or among somewhat oldergroups who may serve as role models.
2) Survey results may be used in a similar way to influenceperceived normative values, by showing, for example, thatmost young people disapprove of even trying all illicitdrugs except marijuana.
3) The images of Perceived social connotations of usingvarious drugs.may be influenced by feeding back results onthe images most young people have of being users ofvarious drugs The Monitoring the Future study, forexample, released findings on the ways in which smokingtended to change the manner in which a senior isperceived by his or her peerschanges which were nearlyall unfavorable,
228
238

4) The problems reported by users to have resulted fromtheir use of various drugs may be emphasized. Forexample, we have reported elsewhere that of the dailymarijuana users in a recent survey, fully 42% thought thedrug caused them to have less energy, one-third thought Itmade them less interested in other activities, one-thirdthought It hurt their school and/or Job performance, etc.
We conclude the chapter by noting that those trying to prevent drugInvolvement on the part of young people are finally moving with thecurrent, instead of against it, and that the potential for achievingappreciable results may be better now than at any time In the pasttwenty years.
Other Data on Correlates and Trends
Hundreds of correlates of drug use, without accompanying interpreta-tion, may be found in the series of annual volumes from the studyentitled Monitoring the Future: Questionnaire Responses from theNation's High School Students.* For each year since 1975, a separatehardbound volume presents unlvarlate and selected blvariate distribu-tions on all questions contained in the study. Many variables dealingexplicitly with drugsvarlables not discussed hereare contained inthat series; and bivarlate tables are provided for all questions each yeardistributed against an index of lifetime illicit drug Involvement. Aspecial cross-time reference Index Is contained in each volume tofacilitate locating the same question across different years. One canthus derive trend data on some 1500 to 2000 variables for the entiresample, or for Important sub-groups (based on sex, race, region, collegeplans, or drug involvement).
*This series Is available from the Publications Division, Institutefor Social Research, The University of Michigan, Ann Arbcr, Michigan48109.
2 3 9229

Appendx
ESTIMATES ADJUSTEDFOR ABSENTEES AND DROPOUTS
One question which has arisen over the years in regard to this study hasconcerned the degree to which the prevalence and trend estimatesderived from high school seniors are an accurate reflection of thereality which pertains for all young people who would be in the sameclass or age cohort, including those who have dropped out of school bysenior year. In 1985 we published an extensive chapter on this topic in avolume in the NIDA Research Monograph series.* We will attempt inthis Appendix to summarize the maIn points relevant to this Issue ofsample coverage.
First, it should be noted that two segments of the entire class/agecohort are missing from the data collected each year from seniors:those who are still enrolled in school but who are absent that day (the"absentees"), and those who have formally left school (the dropouts).The "absentees" constitute virtually all of the non-respondents shown inthe response rate table given in the Introduction to this volume (sincerefusal rates are negligible) or about 18% of all seniors (or 15% of theclass/age cohort). Based on our review of available Census data thedropouts account for approximately 15% of the class/age cohort.
The methods we used to estimate the prevalence rates for these twomissing segments are summarized briefly here. Then, the effects ofadding in these two segments to the calculation of the overallprevalence rates for two drug classes are presented along with theImpact on the trend estimates. Two illicit drugs have been chosen forIllustrative purposes: marijuana, the most prevalent of the illicit drugs;and cocaine, one of the more dangerous and less prevalent drugs.Estimates for high school seniors are presented for both lifetime and30-day prevalence for each drug.
The Effects of Missing Absentees
To be able to assess the effects on the estimates of drug use of missingthe absentees, we Included a question in the study which asks studentshow many days of school they had missed in the previous four weeks.Using this variable, we can place individuals Into different strata as afunction of how often they tend to be absent. For example, all studentswho had been absent 50% of the time could form one stratum.Assuming that absence on the day of the administration is a fairly
*Johnston, L.D. & O'Malley, P.M. Issues of validity and populationcoverage in student surveys of drug use. In BA. Rouse, N.3. Kozel, &L.G. Richards (Eds.), Self-report methods of estimating drug use:Meeting current challenges to validity. (National Institute on DrugAbuse Research Monograph 57). Washington, D.C.: U.S. GovernmentPrinting Office (ADM) 85-1402, 1985.
230
24 0

random event, we can use the respondents in this stratum to representall students in the stratum, including the ones who happen to be absentthat particular day. By giving them a double weight, they can be usedto represent both themselves and the other 50% of their stratum whowere absent that day. Those wErsay they were in school only one-thirdof the time would get a weight of three to represent the two-thirds intheir stratum who were not there, and so forth.
Using this method, we found that absentees as a soup have appreciablyhigher than average usage levels for all licit and Illicit drugs. However,looking at 1983 data, we found that their omission did not depress anyof the prevalence estimates In any of the drugs by more than 2.7%, dueto the fact that they represent such a small proportion of the totaltarget sample. (The correction across all 13 drugs in lifetimeprevalence averaged only 1.4%.) Considering that a substantialproportion of those who are absent likely are absent for reasonsunrelated to drug usesuch as Illness and participation inextracurricular activitiesit may be surprising to see even thesedifferences. In any case, from the point of view of instructing policy orpublic perceptions, the small "corrections" would appear to be of littleor no significance. (The correction across all 13 drugs in lifetimeprevalence averaged only 1.4%.) Further, such corrections should havevirtually no effect on cross-time trend estimates unless the rate ofabsenteeism were changing appreciably; and we find no evidence in ourdata that It is. Put another way, the presence of a fairly slightunderestimate which is constant across time should not Influence trendresults. Should absentee rates start changing, then It could be arguedmore convincingly that such corrections should be presented routinely.
The Effects of Missing Dropouts
Unfortunately, we cannot derive corrections from data gathered fromseniors to Impute directly the prevalence rates for dropouts, as we didfor absentees, since we have no completley appropriate stratum fromwhich we have "sampled." We do know from our own previous research,as well as the work of others, that dropouts have prevalence rates forall classes of drugs substantially higher than the in-school students. Infact, the dropouts may not be too dissimilar from the absentees.
We have consistently estimated the proportion who fall to completehigh school to be approximately 15%; Figure n-1 displays thecompletion rate for the years 1972 through 1985 based on Census data.As the figure indicates, completion rates (and the complement, dropoutrates) have been quite constant over this Interval for persons 20-24years old.* (Younger age brackets are more difficult to use becausethey include some who are still enrolled in high school.) Monitoring theFuture probably covers some small proportion of the 15%, in fact, sincethe survey of seniors takes place a few months before graduation, and
*US. Bureau of the Census. Current Population Reports Series P-20 various numbers. Washington, DC: US. Government PrintingOffice, various years.
241

FIGURE A-1
High School Completion by Persons 20-24 Years Old, 1972-1985
10090 -80 -
W TOCD
441 60
Lej 50
40
30
20
10
0 I 1 I I I I
'73 '75 '77 '79 '81 '83 '85YEAR
Source: U.S. Bureau of the Census, Current Populations Surveys, published andunpublished data; and 1980 Census.
242232

not everyone will graduate. On the other hand, perhaps I% to 2% of theage group which Census shows as having a diploma get it through aGeneral Equivalency Degree and thus would not be covered inMonitoring the Future. (Elliot and Voss report this result for less than2% of their sample in their follow-up study of 2617 ninth graders inCalifornia who were followed through their high school years.)* Sothese two factors probably cancel each other out. Thus, we use 15% asour estimate of the proportion of a class cohort not covered.
Extrapolating to Dropouts From Absentees. To estimate the drug usageprevalence rates for this group we used two quite different methods.The first was based on extrapolations from seniors participating in thisstudy. Using this methods we developed estimates under three differentassumptions: that the difference between dropouts and the seniors whoparticipated In the study was equivalent to (a) the difference betweenabsentees and participating seniors, (b) one and one-half times thatdifference, and (c) twice that difference. The last we would consider arather extreme assumption. (The method for calculating prevalencerates for the absentees is the one described above.)
The second general method involved using the best recent national dataon drug use among dropoutsnamely the National Household Surveys onDrug Abuse.** While these surveys have rather small samples ofdropouts in the relevant age range in any given year, they should atleast provide unbiased estimates for dropouts still in the householdpopulation.
Using the first method of estimation, we found that, under theassumption that dropouts are just like absentees, no prevalence rate waschanged by more than 5% over the estimate based on 1983 seniors only,even with the simultaneous correction for both absentees and dropouts.The largest correction in 1983 involverinarijuana, with lifetimeprevalence rising from just under 60% to 64%. Even under the mostextreme assumptionwhich results in exceptionally high prevalencerates for dropouts on all drugs, for example 90% lifetime prevalence formarijuanathe overall correction in any of the prevalence figures forany drug remains less than 7.5%. Again, marijuana shows the biggestcorrection (7.5% in annual prevalence, raising It from 46% uncorrectedto 54% corrected for both absentees and dropouts). As we would haveexpected, the biggest proportional change occurs for heroin, since itrepresents the most deviant end of the drug-using spectrum and thuswould be most associated with truancy and dropping out.
*Elliott, D. and Voss, H.L. Delinquency and dropout. Lexington,MA: DC Heath-Lexington Books, 1974.
*Fishburne, P.M., Abelson, H.I., and Cisin, I. National Survey onDrug Abuse: Main Findings 1979 (National Institute on Drug Abuse).Washington, DC: U.S. Government Printing Office (ADM) 80-976, 1980.Also see Miller, 3.D., et al. National Survey on Drug Abuse: MainFindings 1982 (National Institute on Drug Abuse). Washington, DC:U.S. Government Printing Office (ADM) 83-1263, 1983.
233 243

Extrapolating From the Household Surveys. The second method ofestimating drug use among dropouts was by comparing the householdsurvey data on dropouts with the data from those remaining In school.We conducted secondary analyses of the archived data from the 1977and 1979 National Household Surveys. Analyses were restricted to theage range 17 to 19 years old, since about 9396 of the Monitoring theFuture respondents fall in this range. Of course, the numbers of casesare small. In the 1977 survey there were only 46 dropouts and 173enrolled seniors In this age group. In the 1979 survey 92 dropouts and266 seniors were Included.
For marijuana, the estimated differences from the household surveydata came out at a level which was at or below the least extremeassumption made In the previous method (where dropouts are assumedto have the same drug use levels as absentees). While this may havebeen comforting to the authors of the present report, we must admitthat we believe the household sample tmderrepresents the more drug-prone dropouts to some degree. Those without permanent residenceand those In the prison population, to- take two examples, would beexcluded from the sample coverage in a household survey. Thus weconcluded that estimates closer to those made under the secondassumption in the previous method may be closer to realitythat Is,that dropouts are likely to deviate from participating seniors by one andone-half times the amount that absentees deviate from them.
Again, we emphasize that there are a number of reasons for droppingout, many of which bear no relationship to drug use, including economichardship In the family and certain learning disabilities and healthproblems. At the national level, the extreme groups such as those Injail or without a permanent place of residence are undoubtedly verysmall as a proportion of the total age group and probably even as aproportion of all dropouts. Thus, regardless of their prevalence rates,they would be unable to move the prevalence estimates by a very largeproportion except In the case of the most rare eventsIn particular,heroin use. We do believe that, In the case of heroin useparticularlyregular usewe are very likely unable to get a very accurate estimateeven with the corrections used In this paper. For the remaining drugs,we conclude that our estimates based on participating seniors, thoughsomewhat low, are not bad approximations for the age group as a whole.
Effccts of Omitting Dropouts On Trend Estimates. Whether theomission of dropouts affects the estimates of trends in prevalence ratesIs a separate question, however. The relevZirrssues parallel thosediscussed earlier regarding the possible effects on trends of omittingthe absentees. Most Important Is the question of whether the rate ofdropping out has been changing In the country, since a substantialchange would mean that seniors studied in different years wouldrepresent noncomparable segments of the whole class/age cohort.Fortunately for the purposes of this study, at least, the data In FigureA-1 indicate a very stable rate of droppingout from 1972 to 1983.
244234

Given that there appears to be no sound evidence of a change in thedropout rate, the only reason that trend data from seniors would deviatefrom trends for the entire class cohort (Including dropouts) would be ifthe constant proportion who have been dropouts for some reason showedtrends contrary to those observed among seniors; and even then,because of their small numbers, they would have to show dramaticallydifferent trends to be able to change the trend "story" very much forthe age group as a whole. There has been no hypothesis offered for sucha differential shift among dropouts which these authors, at least, findvery convincing.
The one hypothesis which is occasionally heard is that more youngstersare being expelled from school, or voluntarily leaving school, because oftheir drug use; and that this explains the recent downturn in the use ofmany drugs being reported by the study. However, It is hard toreconcile this hypothesis with the virtually flat dropout rates over thefourteen year period displayed in Figure Ai, unless one posits aperfectly offsetting tendency for more completion among those who areless drug pronehardly a very parsimonious set of explanations.Further, the reported prevalence of some drugs has remainedremarkably stable throughout the life of the study (e.g., alcohol, opiatesother than heroin) and the prevalence of some has risen (cocaine anduntil recently, amphetamines). These facts are not very consistent withthe hypothesis that there has been a recent Increased rate of departureby the most drug prone. Certainly more youngsters leaving school inthe 80's have drug problems than was true in the 60's. (So do more ofthose who stay in.) However, they still seem likely to be very much thesame segment of the population, given the degree of association thatexists between drug use and deviance and problem behaviors of varioussorts.
Summary and Conclusions
In sum, while we believe there is some underestimation of theprevalence of drug use in the cohort at large as a result of the dropoutsbeing omitted from the universe of the study, we think the degree ofunderestimation Is rather limited for all drugs (with the possibleexception of heroin) and, more importantly, that trend estimates havebeen rather little affected. Short of having good trend data gathereddirectly from dropouts, we cannot close the case definitively.Nevertheless, we think the available evidence argues strongly againstalternative hypothesesa conclusion which was also reached by themembers of the NIDA technical review on this subject held in 1982.*
...the analyses provided in this report show that failure toinclude these two groups (absentees and dropouts) does notsubstantially affect the estimates of the incidence andprevalence of drug use.
*Clayton, R.R. and Voss, H.L. Technical Review on Drug Abuseand Dropouts. Rockville, MD: National Institute on Drug Abuse, 1982.
235 245

FIGURE A-2
Estimates of Prevalence and Trends for the Entire Age/Class Cohort,Adjusting for Absentees and Dropouta
100]90
eo -
70 -
20 -
10 -
0
Populationa-Jonloro Present and AboontoSonloro Prowl Only
....... 0 ... . ...... .. - .. MIZANA
.. 46
'se.. ..... .....
Ii44.11A/MIA
....... COCAPR-
'76 '77 '78 '79 '80 '81 '82 '83 '84 '85Year of Administration
24 6
236

Examples of Revised Estimates for Two Drugs
Figure A-2 provides the prevalence and trend estimates of marijuanaand cocaine, for both the lifetime and thirty-day prevalence periods,showing (a) the original estimates based on participating seniors only;(b) the empirically derived, revised estimates based on all seniors,including the absentees; and (c) estimates for the entire class/agecohort. The last estimate was developed using the assumption judged tobe most reasonable abovenamely that the dropouts differ fromparticipating seniors by one and one-half tlmes the amount that theabsentees do. Estimates were calculated separately for each year, thustaking into account any differences from year-to-year in theparticipation or absentee rate. The dropout rate was taken as aconstant 13% of the age group across all years.
As Figure A-2 illustrates, any difference in the slopes of the trend linesbetween the original and revised estlmates are extremely, almostinfinitesimally, small. The prevalence estimates are higher, of course,but not dramatically so, and certainly not enough so to have any seriouspolicy-implication effects In the interpretation of the data.
237
U-8. GOVEINUIPARgar
247
CE : 19860 - 154-831
Related Documents