NATIONAL SCIENCE FOUNDATION DECEMBER 2018 National Center for Science and Engineering Statistics Directorate for Social, Behavioral and Economic Sciences 2017 Doctorate Recipients from U.S. Universities

Welcome message from author
This document is posted to help you gain knowledge. Please leave a comment to let me know what you think about it! Share it to your friends and learn new things together.
Transcript
NATIONAL SCIENCE FOUNDATIONDECEMBER 2018
National Center for Science and Engineering Statistics Directorate for Social, Behavioral and Economic Sciences
2017Doctorate Recipients from U.S. Universities
ABOUT THIS REPORT
The Survey of Earned Doctorates, the data source for this report, is an annual census of individuals who receive research doctoral degrees from accredited U.S. academic institutions. The survey is sponsored by six federal agencies: National Science Foundation (NSF), National Institutes of Health, Department of
Education, National Endowment for the Humanities, Department of Agriculture, and National Aeronautics and Space Administration. These data are reported in several publications from NSF’s National Center for Science and Engineering Statistics. The most comprehensive and widely cited publication is this report, Doctorate Recipients from U.S. Universities.
This report calls attention to major trends in doctoral education, organized into themes highlighting important questions about doctorate recipients. Online, the reader is invited to explore trends in greater depth through detailed data tables and interactive graphics (https://www.nsf.gov/statistics/sed/). Technical notes and related resources are provided to aid in interpreting the data, and report content is available for downloading. An interactive data tool is also available at https://ncsesdata.nsf.gov/ids/sed.

National Center for Science and Engineering Statistics Directorate for Social, Behavioral and Economic Sciences
NATIONAL SCIENCE FOUNDATION DECEMBER 2018 NSF 19-301
2017Doctorate Recipients from U.S. Universities
ii Doctorate Recipients from U.S. Universities: 2017
WHY IS THIS IMPORTANT?
The American system of doctoral education is widely considered to be among the world’s best, as evidenced by the large and growing number of international students over time—many of them among the top students in their countries—who choose to pursue the doctoral degree at U.S. universities. But the continued
preeminence of U.S. doctoral education is not assured. Other nations, recognizing the contributions doctorate recipients make to economies and cultures, are investing heavily in doctoral education. The world’s brightest students, including U.S. citizens, may go elsewhere for the doctoral degree, and they may begin careers elsewhere as well. Monitoring the number of degrees awarded in science and engineering fields is an important part of the mission of the National Center for Science and Engineering Statistics within the National Science Foundation. The Survey of Earned Doctorates and this report contribute toward that goal.
Annual counts of doctorate recipients from U.S. universities are measures of the incremental investment in human resources devoted to science, engineering, research, and scholarship, and they can serve as leading indicators of the capacity for knowledge creation and innovation in various domains. The changing characteristics of this population over time—including the increased representation of women, minorities, and foreign nationals; emergence of new fields of study; time it takes to complete doctoral study; expansion of the postdoctoral pool; academic employment opportunities after graduation; and patterns of postgraduate interstate mobility—reflect political, economic, social, technological, and demographic trends and events. Understanding the connections between these larger forces and the number and characteristics of doctorate recipients is necessary to make informed improvements in this country’s doctoral education system.
Doctorate recipients begin careers in large and small organizations, teach in universities, and start new businesses. Doctoral education develops human resources that are critical to a nation’s progress—scientists, engineers, researchers, and scholars who create and share new knowledge and new ways of thinking that lead, directly and indirectly, to innovative products, services, and works of art. In doing so, they contribute to a nation’s economic growth, cultural development, and rising standard of living.
1https://www.nsf.gov/statistics/sed/
TABLE OF CONTENTSWho earns a U.S. doctorate? . . . . . . . . . . . . . . . . . . . . . . . . . . . . . . . . . . . . . . . . . . . . . . . . . . . . . . . . . 2
Overall trends
Citizenship
Sex
Race and ethnicity
Which fields attract students? . . . . . . . . . . . . . . . . . . . . . . . . . . . . . . . . . . . . . . . . . . . . . . . . . . . . . . . 4Field of study trends
Temporary visa holders
Minority U.S. citizens and permanent residents
Women
What influences the path to the doctorate? . . . . . . . . . . . . . . . . . . . . . . . . . . . . . . . . . . . . . . . . . . . . 6Parental education
Sources of financial support
Education-related debt
Time to degree
What are the postgraduation trends? . . . . . . . . . . . . . . . . . . . . . . . . . . . . . . . . . . . . . . . . . . . . . . . . . 8Job market
First postgraduate position
Median salaries
Temporary visa holders and postgraduation
Patterns of interstate mobility: What are the demographic and field of study trends? . . . . . . . 10Overall trends
Sex and marital status
Age of dependents
Age
Race and ethnicity
Field of study
Patterns of interstate mobility: What are the employment and geographic trends? . . . . . . . . . 12Employment sector
Primary work activity
Doctorate recipients staying in state
Net inflows and outflows by state
Glossary . . . . . . . . . . . . . . . . . . . . . . . . . . . . . . . . . . . . . . . . . . . . . . . . . . . . . . . . . . . . . . . . . . . . . . . . . 14
Data source . . . . . . . . . . . . . . . . . . . . . . . . . . . . . . . . . . . . . . . . . . . . . . . . . . . . . . . . . . . . . . . . . . . . . . 16
Further reading . . . . . . . . . . . . . . . . . . . . . . . . . . . . . . . . . . . . . . . . . . . . . . . . . . . . . . . . . . . . . . . . . . . 17
Online resources . . . . . . . . . . . . . . . . . . . . . . . . . . . . . . . . . . . . . . . . . . . . . . . . . . . . . . . . . . . . . . . . . . 18
Acknowledgments, citation, and contact . . . . . . . . . . . . . . . . . . . . . . . . . . . . . . . . . . . . . . . . . . . . . 19

2 Doctorate Recipients from U.S. Universities: 2017
WHO EARNS A U.S. DOCTORATE?Each new cohort of doctorate recipients augments the supply of prospective scientists, engineers, researchers, and scholars. Data on the demographic composition of these cohorts reveal changes in the presence of underrepresented groups.
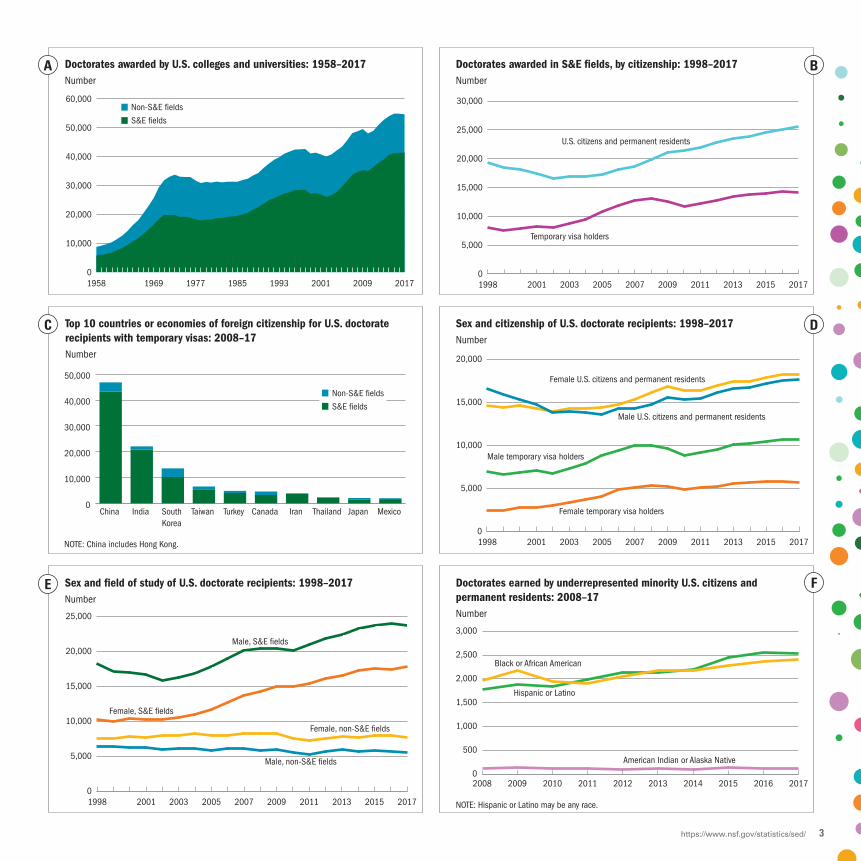
Overall trendsThe number of research doctorate degrees awarded by U.S. institutions in 2017 declined slightly to 54,664, according to the Survey of Earned Doctorates (SED). Over time, the number of doctorates awarded shows a strong upward trend—average annual growth of 3.3%—punctuated by periods of slow growth and even decline.
Since the SED began collecting data in 1957, the number of research doctorates awarded in science and engineering (S&E) fields has exceeded the number of non-S&E doctorates, and the gap has widened. From 1977 to 2017, the number of S&E doctorate recipients has more than doubled, while the number of non-S&E doctorates awarded in 2017 was slightly lower than the 1977 count. As a result, the proportion of S&E doctorates climbed from 58% in 1977 to 76% in 2017 (figure A).
CitizenshipOverviewIn 2017, the number of S&E doctorates awarded to temporary visa holders was 14,166, a decline of 159 from 2016. Overall growth was still up 77% since 1998 and 9% since 2008. The proportion of S&E doctorates awarded to temporary visa holders peaked at 41% in 2007 but has held steady at around 36% since 2011 (figure B).
In comparison, the number of S&E doctorates awarded to U.S. citizens and permanent residents grew 2% from 2016 to 2017 but experienced a slower growth overall (32% since 1998 and 29% since 2008), although from a larger base.
Countries or economies of foreign citizenshipThe number of doctorate recipients on temporary visas is highly concentrated in a few countries of origin. In the past decade, 10 countries accounted for 71% of the doctorates awarded to temporary visa holders, and the top three countries—China, India, and South Korea—accounted for over half (54%) (figure C).
SexCitizenshipSince 2002, women have earned a slim majority of all doctorates awarded to U.S. citizens and permanent residents and more than 31% of those awarded to temporary visa holders. From 1998 to 2007, the share of female doctorate recipients grew from 47% to 51% among U.S. citizens and permanent residents and from 26% to 35% among temporary visa holders. Since 2007, the shares of female doctorates in both citizenship categories have changed little. Overall, 46% of all doctorates in 2017 were awarded to women (figure D).
Field of studyMost of the growth in the number of doctorates earned by both men and women has been in S&E fields. From 1998 to 2017, the number of female doctorate recipients in S&E fields increased by 73%, far more than the 30% growth in the number of male S&E doctorates. Women’s share of S&E doctorates awarded increased from 36% in 1998 to 42% in 2009, and it has remained stable since then.
In non-S&E fields, 58% of doctorates were awarded to women in 2017, a share that has changed little since 2007. The number of female non-S&E doctorate recipients has slightly increased over the past 20 years, whereas the number of male doctorates in those fields has declined (figure E).
Race and ethnicityParticipation in doctoral education by underrepresented minorities who are U.S. citizens or permanent residents is increasing, though from a small base. From 2008 to 2017, the number of doctorates awarded to blacks or African Americans increased by 23%, and the number of Hispanic or Latino doctorate recipients increased by 43%. As a result, the proportion of doctorates earned by each group during this period grew from 6% to 7%. The proportion of American Indian or Alaska Native doctorate recipients has remained under 1% (figure F).
3https://www.nsf.gov/statistics/sed/
E F
C D
A B
Doctorates earned by underrepresented minority U.S. citizens and permanent residents: 2008–17 Number
NOTE: Hispanic or Latino may be any race.
0
500
1,000
1,500
2,000
2,500
3,000
Hispanic or Latino
Black or African American
American Indian or Alaska Native
2017201620152014201320122011201020092008
Sex and �eld of study of U.S. doctorate recipients: 1998–2017 Number
0
5,000
10,000
15,000
20,000
25,000
Female, non-S&E �elds
Female, S&E �elds
Male, non-S&E �elds
Male, S&E �elds
2017201520132011200920072005200320011998
Sex and citizenship of U.S. doctorate recipients: 1998–2017Number
0
5,000
10,000
15,000
20,000
Female temporary visa holders
Female U.S. citizens and permanent residents
Male temporary visa holders
Male U.S. citizens and permanent residents
2017201520132011200920072005200320011998
Top 10 countries or economies of foreign citizenship for U.S. doctorate recipients with temporary visas: 2008–17Number
NOTE: China includes Hong Kong.
0
10,000
20,000
30,000
40,000
50,000
Non-S&E �elds
S&E �elds
Mexico Japan Thailand Iran Canada Turkey Taiwan South Korea
India China
Doctorates awarded in S&E �elds, by citizenship: 1998–2017 Number
0
5,000
10,000
15,000
20,000
25,000
30,000
Temporary visa holders
U.S. citizens and permanent residents
2017201520132011200920072005200320011998
Doctorates awarded by U.S. colleges and universities: 1958–2017Number
0
10,000
20,000
30,000
40,000
50,000
60,000Non-S&E �elds
S&E �elds
20172009200119931985197719691958
4 Doctorate Recipients from U.S. Universities: 2017
WHICH FIELDS ATTRACT STUDENTS?As researchers expand their understanding of the world, new fields of study emerge and existing fields change. Observing which fields of study are attracting growing proportions of students can provide early insight into where future research breakthroughs may occur.
Field of study trendsS&EDoctorates in science and engineering (S&E) fields are a growing share of all doctorates awarded. Overall, S&E doctorates accounted for 76% of all doctorates awarded in 2017, a substantially larger share than 10 years and 20 years earlier (71% and 67%, respectively). Every broad S&E field except for psychology and social sciences increased both its number and share of doctorates over the past 2 decades. Psychology and social sciences increased in the number of doctorate recipients, but its share of all doctorates declined. Engineering had the largest growth of S&E fields in the past 20 years (figure A).
Non-S&E Within non-S&E fields, the number of doctorates awarded in education has declined over the past 2 decades, leading to a large, steady drop in the relative share of doctorates in that field. The number of humanities and arts doctorates remained fairly stable during this period, but the field’s relative share of doctorates fell almost 3 percentage points. The number of doctorates in other non-S&E fields, such as business management and communication, increased but their share remained fairly level (figure B).
Temporary visa holdersThe share of doctorates awarded to temporary visa holders increased in every broad field of study over the past 20 years. In 2017, temporary visa holders earned the majority of doctorates awarded in engineering and in mathematics and computer sciences (figure C).
Minority U.S. citizens and permanent residentsAmong minority U.S. citizens and permanent residents, doctorate recipients of different racial or ethnic backgrounds are more heavily represented in some fields of study than in others. In 2017,
Asians earned more doctorates than other racial and ethnic minority groups in life sciences, physical sciences and earth sciences, mathematics and computer sciences, and engineering. Blacks or African Americans were the largest U.S. minority population in education. Hispanics or Latinos earned a larger share of doctorates in psychology and social sciences and in humanities and arts than did any other minority group (figure D).
WomenField of studyWomen’s share of doctorates awarded has grown over the past 2 decades in all broad fields of study. In 2017, women earned the majority of doctorates awarded in life sciences, psychology and social sciences, education, and humanities and arts.
Though women earned about a fourth of the 2017 doctorates awarded in engineering and in mathematics and computer sciences and a third of the doctorates in physical sciences and earth sciences, their relative shares of doctorates awarded in those fields has been growing. From 1998 to 2017, women’s share has nearly doubled in engineering (from 13% to 25%) and grown considerably in life sciences (from 46% to 55%) and in physical sciences and earth sciences (from 25% to 33%). Growth in mathematics and computer sciences and in psychology and social sciences has been more modest (from 22% to 25% and from 55% to 59%, respectively) (figure E).
Growing subfieldsThe subfields of doctoral study showing the largest relative growth in numbers of female doctorate recipients over the past decade have been materials science engineering and other engineering; geosciences, atmospheric sciences, and ocean sciences; and agricultural sciences and natural resources. Over the same period, the number of women doctorate recipients declined in education research (figure F).

5https://www.nsf.gov/statistics/sed/
E F
C D
A B
Fastest changing �elds of study for female U.S. doctorate recipients, by broad �eld of study: 2008–17
Percent change 2008–17
-20 0 20 40 60 80 100 120 140 160 180
Non-S&E �elds not elsewhere classi�edCommunication
HistoryOther humanities and arts
Education researchTeaching �elds
Materials science engineeringOther engineering
PsychologyOther social sciences
Computer and information sciencesMathematics and statistics
ChemistryGeosciences, atmospheric, and ocean sciences
Health sciencesAgricultural sciences and natural resourcesLife sciences
Physical sciencesand earth sciences
Mathematics andcomputer sciences
Psychology andsocial sciences
Education
Engineering
Humanities and arts
Other non-S&E �elds Non-S&E �elds not elsewhere classi�ed
Communication
HistoryOther humanities and arts
Education researchTeaching �elds
Materials science engineeringOther engineering
PsychologyOther social sciences
Computer and information sciencesMathematics and statistics
ChemistryGeosciences, atmospheric, and ocean sciences
Health sciencesAgricultural sciences and natural resources
Share of doctorates awarded to women, by broad �eld of study: 1998–2017Percent
0
10
20
30
40
50
60
70
80
90
100
Other non-S&E �elds
Humanities and artsEducation
Engineering
Psychology and social sciencesMathematics and computer sciencesPhysical sciences and earth sciences
Life sciences
2017201520132011200920072005200320011998
Other non-S&E �elds
Humanities and artsEducation
Engineering
Psychology and social sciencesMathematics and computer sciencesPhysical sciences and earth sciences
Life sciences
Doctorates awarded to minority U.S. citizens and permanent residents, by race, ethnicity, and broad �eld of study: 2017Percent
NOTE: Hispanic or Latino may be any race.
02468
101214161820
More than one race
Black or African American
AsianAmerican Indian or Alaska Native
Hispanic or Latino
Other non-S&E �elds
Humanitiesand arts
EducationEngineeringPsychologyand
socialsciences
Mathematicsand
computersciences
Physicalsciencesand earthsciences
Life sciences
More than one race
Black or African American
AsianAmerican Indian or Alaska Native
Hispanic or Latino
Doctorates awarded, by citizenship and broad �eld of study: 1998 and 2017Percent
Life sciences Psychologyand
socialsciences
Engineering Education Humanitiesand arts
Physicalsciencesand earthsciences
Other non-S&E �elds
Mathematicsand
computersciences
0102030405060708090
100Temporary visa holdersU.S. citizens and permanent residents
20171998|20171998|20171998|20171998|20171998|20171998|20171998|20171998|
Doctorates awarded in non-S&E broad �elds of study: 1998–2017 Percent
0
5
10
15
20
25
Other non-S&E �elds
Humanities and arts
Education
2017201520132011200920072005200320011998
Doctorates awarded in S&E broad �elds of study: 1998–2017Percent
0
5
10
15
20
25
Engineering
Psychology and social sciences
Mathematics and computer sciences
Physical sciences and earth sciences
Life sciences
2017201520132011200920072005200320011998
6 Doctorate Recipients from U.S. Universities: 2017
WHAT INFLUENCES THE PATH TO THE DOCTORATE?Some paths to the doctoral degree are less traveled and some are more difficult to navigate, owing to a variety of influences that shape doctoral study. These paths may lead to different postgraduate destinations.
Parental educationOverviewThe parents of recent doctorate recipients are better educated than the parents of earlier cohorts of doctorate recipients. The share of doctorate recipients from families in which neither parent has earned more than a high school diploma declined in the past 20 years. Meanwhile, the share from families in which at least one parent has earned a bachelor’s degree or at least one parent has an advanced degree continued to climb (figure A).
Race and ethnicityThe pattern of rising parental educational attainment is visible among all races and ethnicities for doctorate recipients who are U.S. citizens and permanent residents. Nonetheless, doctorate recipients from underrepresented minority groups are less likely to have at least one parent with a bachelor’s degree than are Asian or white doctorate recipients.
In 2017, more than 70% of doctorate recipients who were Asian or white came from families having at least one parent who had a bachelor’s degree or higher, compared to just over half of doctorate recipients who were black or African American, American Indian or Alaska Native, or Hispanic or Latino (figure B).
Sources of financial supportOverviewResearch assistantships are the most frequent primary source of financial support for all doctorate recipients, followed by fellowships or grants and teaching assistantships. Sixteen percent of doctoral students rely primarily on their own resources—loans, personal savings, personal earnings, and the earnings or savings of their spouse, partner, or family—to finance their graduate studies, and 5% relied on such other sources as employer reimbursement and foreign support (figure C).
Field of studyThe primary sources of financial support used by doctorate recipients vary by field of study. In 2017, research assistantships were the most common primary source of financial support for
doctorate recipients in engineering, physical sciences and earth sciences, life sciences, and mathematics and computer sciences. In mathematics and computer sciences, teaching assistantships were almost as frequent as research assistantships. Both fellowships or grants and teaching assistantships were the most common sources for doctoral students in humanities and arts. Nearly half of the doctorate recipients in education relied on their own resources as their primary source of support. In psychology and social sciences, similar proportions of doctorate recipients reported fellowships or grants, teaching assistantships, and their own resources as their primary source of financial support (figure D).
Education-related debtThe amount of education-related debt incurred by doctorate recipients during graduate school is an indicator of the availability of financial support. In 2017, large majorities (71% and above) of those in physical sciences and earth sciences, mathematics and computer sciences, engineering, and life sciences reported holding no debt related to their graduate education when they were awarded the doctorate. In psychology and social sciences, humanities and arts, and other non-science and engineering (non-S&E) fields, that proportion dropped to around half.
Within each broad field of study, 6% to 9% of doctorate recipients had incurred low levels ($10,000 or less) of education-related debt by the time they graduated. The shares of doctoral graduates with education-related debt burdens over $30,000 were greatest in education (37%), psychology and social sciences (30%), other non-S&E fields (30%), and humanities and arts (26%) (figure E).
Time to degreeOver the past 20 years, the time between entering graduate school and earning the doctorate has fallen in all fields of study, particularly in education. On average, it takes years longer to earn a doctorate in non-S&E fields than it does to complete doctoral training in S&E fields (figure F).

7https://www.nsf.gov/statistics/sed/
E F
C D
A B
Median time to degree of U.S. doctorate recipients, by broad �eld of study: 1998–2017Years from graduate school entry to doctorate
0
2
4
6
8
10
12
14
16
Other non-S&E �eldsHumanities and artsEducation
EngineeringPsychology and social sciences
Mathematics and computer sciences
Physical sciences and earth sciences
Life sciences
2017201520132011200920072005200320011998
Other non-S&E �eldsHumanities and artsEducation
EngineeringPsychology and social sciences
Mathematics and computer sciences
Physical sciences and earth sciences
Life sciences
Graduate education-related debt of U.S. doctorate recipients, by broad �eld of study: 2017Percent
0
10
20
30
40
50
60
70
80
90
100
$30,001or greater
$10,001–$30,000
$10,000 or less
No debt
Other non-S&E �elds
Humanitiesand arts
EducationEngineeringPsychologyand
socialsciences
Mathematicsand
computersciences
Physicalsciencesand earthsciences
Lifesciences
Primary source of �nancial support for U.S. doctorate recipients: 2017Percent
0
5
10
15
20
25
30
35
Other sourcesOwnresources
Fellowshipor grant
Researchassistantship
Teachingassistantship
Primary source of �nancial support for U.S. doctorate recipients, by broad �eld of study: 2017Percent
0
10
20
30
40
50
60
70
80
90
100
OthersourcesOwnresources
Fellowshipor grant
Researchassistantship
Teachingassistantship
Other non-S&E �elds
Humanitiesand arts
EducationEngineeringPsychologyand
socialsciences
Mathematicsand
computersciences
Physicalsciencesand earthsciences
Lifesciences
Parental educational attainment of U.S. citizen and permanent resident doctorate recipients, by race and ethnicity: 1998–2017 Percent having at least one parent with a bachelor’s degree or higher
NOTE: Hispanic or Latino may be any race.
0
10
20
30
40
50
60
70
80
90
100
White
Black or African American
Asian
American Indian or Alaska Native
Hispanic or Latino
2017201520132011200920072005200320011998
Doctorates awarded, by highest parental educational attainment: 1998–2017Percent
0
5
10
15
20
25
30
35
40
45
50
At least one parent with advanced degree
At least one parent with bachelor’s degree
At least one parent with some college
Neither parent with more than high school diploma
2017201520132011200920072005200320011998
8 Doctorate Recipients from U.S. Universities: 2017
WHAT ARE THE POSTGRADUATION TRENDS?A graduate’s first position after earning the doctoral degree may reflect broad economic conditions and can shape later career opportunities, earnings, and choices. Over the longer term, the early career patterns of doctorate recipients may influence the decisions of future generations of students considering careers as scientists, engineers, scholars, and researchers.
Job marketS&EAt any given time, the job market for new doctorate recipients will be better in some fields of study than in others. Though all fields tend to follow a similar cyclical pattern that generally reflects overall trends in economic conditions, definite commitments for employment are likely to be influenced by many factors.
The proportion of doctorate recipients in science and engineering (S&E) fields reporting definite commitments for employment, including postdoctoral (postdoc) study, has been in decline since 2001. Proportions hit low points from 2014 to 2016, depending on the field, but in 2017 increased in all S&E broad fields (figure A).
Non-S&EIn non-S&E fields, the proportion of doctorate recipients with definite commitments for employment, including postdoc study, has declined in the past 2 decades despite a slight improvement in the past year (figure B).
First postgraduate positionAcademic employmentIn 2017, 46% of all doctorate recipients with definite employment commitments (excluding postdoc positions) in the United States reported that their principal job would be in academe.
The highest rates of academic employment commitments were reported by doctorate recipients in humanities and arts (77%) and in other non-S&E fields (80%); the lowest rates were in engineering (14%) and in physical sciences and earth sciences (24%). In the past 10 years, the overall rate of academic employment commitments by doctorate recipients in S&E fields has declined, while that of doctorates in non-S&E fields has risen due to the increase in academic commitments in education (figure C).
Postdoc positionsHistorically, postdoc study positions have been a customary part of the early career paths of doctorate recipients in life sciences and in physical sciences and earth sciences, making up over half of definite commitments. They also have become increasingly prevalent
in mathematics and computer sciences, psychology and social sciences, engineering, and non-S&E fields, though at lower rates.
The overall proportion of S&E doctorate recipients taking postdoc positions in the United States immediately after graduation was similar in 2008 and 2017 (47%). However, the proportions of doctorate recipients taking postdoc positions in life sciences, physical and earth sciences, and mathematics and computer sciences declined, while the proportions in engineering and in psychology and social sciences increased (figure D).
Median salariesIn 2017, doctorate recipients who had definite commitments for a postdoc or other employed position in the United States in the coming year reported basic annual salaries that varied by their field of study and the type of position to which they committed.
In every field, median salaries for doctorate recipients committing to jobs in industry were higher than those in postdocs and academe. The median salaries for postdocs in all broad fields were relatively similar, ranging from $46,000 to $50,000, except for postdocs in mathematics and computer sciences, who had a median salary of $60,000. In every broad field, reported postdoc salaries were lower than salaries reported by doctorate recipients entering non-postdoc employment in industry or academe. Doctorate recipients in engineering and those in other non-S&E fields, such as business, reported the highest median academic salaries. Those in mathematics and computer sciences and those in other non-S&E fields reported the highest median salaries in industry positions (figure E).
Temporary visa holders and postgraduationIn 2017, 80% of temporary visa holder doctorate recipients in S&E fields with definite commitments reported that the location of their postdoc or other employment position was in the United States, up from 71% in 1998. Shares were highest in fields where temporary visa holders are more heavily represented: life sciences, physical sciences and earth sciences, mathematics and computer sciences, and engineering (figure F).

9https://www.nsf.gov/statistics/sed/
E F
C D
A B
Temporary visa holder U.S. doctorate recipients with de�nite commitments for employment in the United States, by broad �eld of study: Selected years, 1998–2017 Percent
NOTE: Percentages are based on the number of doctorate recipients who reported de�nite commitments for employment, including postdoc study, in the coming year and plans to stay in the United States.
0102030405060708090
201720081998
Non-S&E �eldsEngineeringPsychologyand socialsciences
Mathematicsand computer
sciences
Physicalsciences andearth sciences
Life sciencesS&E �elds
Median basic annual salary of U.S. doctorate recipients with de�nite commitments for employment in the United States, by position type and broad �eld of study: 2017Dollars
NOTES: Employment includes postdoc study. Other non-S&E �elds includes business management and administration.
0
20,000
40,000
60,000
80,000
100,000
120,000
140,000
Employed position in industry or businessEmployed position in academePostdoc position
Other non-S&E �elds
Humanitiesand arts
EducationEngineering Psychologyand
socialsciences
Mathematicsand
computersciences
Physicalsciencesand earthsciences
Lifesciences
De�nite commitments for academic employment in the United States, by broad �eld of study: 1998–2017 Percent
NOTE: Percentages are based on the number of doctorate recipients who reported de�nite commitments for employment, excluding postdoc study, in the coming year (including those missing employer type) and plans to stay in the United States.
0102030405060708090
100
Other non-S&E �elds
EducationHumanities and arts
EngineeringPsychology and social sciences
Mathematics and computer sciencesPhysical sciences and earth sciences
Life sciences
2017201520132011200920072005200320011998
U.S. postdoctorate rate for U.S. doctorate recipients, by broad �eld of study: Selected years, 1998–2017 Percent
NOTE: Percentages are based on the number of doctorate recipients who reported de�nite commitments in the coming year, who reported whether their commitment was for postdoc study or other employment, and who plan to live in the United States.
0
10
20
30
40
50
60
70201720081998
Non-S&E �eldsEngineeringPsychologyand socialsciences
Mathematicsand computer
sciences
Physicalsciences andearth sciences
Life sciencesS&E �elds
De�nite commitments for employment at doctorate award among U.S. doctorate recipients, by non-S&E broad �eld of study: 1998–2017Percent
NOTES: Shaded areas re�ect recessions that occurred between March 2001 and November 2001 and between December 2007 and June 2009. Employment includes postdoc study.
50
55
60
65
70
75
80
85
90
95
100
Other non-S&E �elds
Humanities and arts
Education
2017201520132011200920072005200320011998
De�nite commitments for employment at doctorate award among U.S. doctorate recipients, by S&E broad �eld of study: 1998–2017Percent
NOTES: Shaded areas re�ect recessions that occurred between March 2001 and November 2001 and between December 2007 and June 2009. Employment includes postdoc study.
50
55
60
65
70
75
80
85
90
95
100
EngineeringPsychology and social sciencesMathematics and computer sciences
Physical sciences and earth sciences
Life sciences
2017201520132011200920072005200320011998
EngineeringPsychology and social sciencesMathematics and computer sciences
Physical sciences and earth sciences
Life sciences

10 Doctorate Recipients from U.S. Universities: 2017
PATTERNS OF INTERSTATE MOBILITY: WHAT ARE THE DEMOGRAPHIC AND FIELD OF STUDY TRENDS?Interstate mobility is a key measure of the population and the workforce. The flows of newly minted doctorate recipients from one state to another for their first job after graduation are an indicator of economic growth and workforce development within the United States.
Overall trends The trends presented here were estimated using data from doctorate recipients with definite employment commitments in the United States. Of the 517,336 doctorates who earned their degrees from 2008 to 2017, 59% reported postgraduation plans to work in the United States. They were considered mobile if their first definite employment commitment was in a state different from the state of their doctoral institution.
Among U.S. citizens and permanent residents, the number of mobile doctorate recipients has been on the rise for 12 years following an almost 40-year period of gradual decline. In the late 1960s, two-thirds of U.S. citizen and permanent resident doctorates had definite employment commitments outside the state of their awarding institution. This interstate mobility proportion declined to just over half (51%) by 2005 but increased to 56% in 2017 (figure A).
Doctorate recipients who were on temporary visas had greater interstate mobility than U.S. citizens and permanent residents. The rest of this section focuses on interstate mobility by demographic characteristics of U.S. citizens and permanent residents.
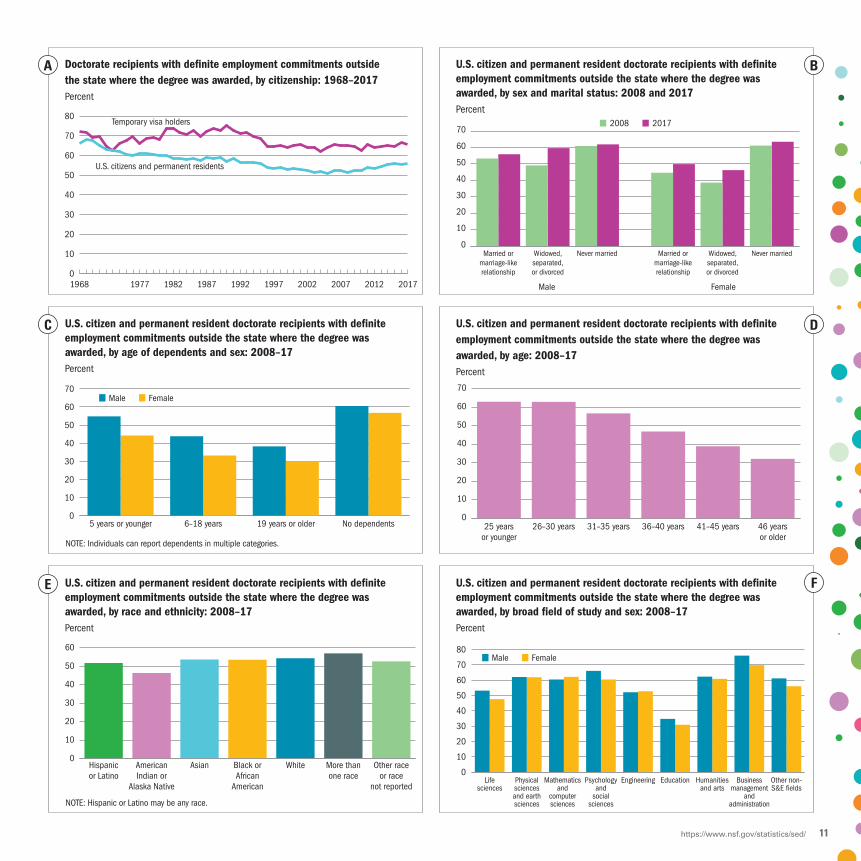
Sex and marital status In 2017, women who had never married were slightly more mobile than men with the same marital status. Men who were or had been married or in marriage-like relationships were more mobile than their female counterparts.
From 2008 to 2017, interstate mobility increased the most for men and women who were widowed, separated, or divorced and for women who were married or in marriage-like relationships. Doctorate recipients who had never married were more mobile than those who reported any other marital status (figure B).
Age of dependentsDoctorate recipients with no dependents were more mobile than those with dependents. Overall, women with dependents had lower interstate mobility rates than men with dependents,
with the largest differences among doctorate recipients who had dependents younger than age 18. Among these doctorate recipients, mobility declined for both men and women as the age of the children increased (figure C).
AgeInterstate mobility rates decline with age. In the youngest cohorts of doctorate recipients (age 30 and younger), nearly two-thirds accepted employment in a state different from where they earned their degree. Among doctorate recipients who were age 45 or older, only close to a third accepted employment in a different state (figure D).
Race and ethnicityIn the past 10 years, slightly more than half of new doctorates committed to employment in another state, and mobility was similar across most racial and ethnic groups. The interstate mobility rate of American Indians or Alaska Natives was the lowest (46%) among racial or ethnic groups, while that of doctorate recipients of more than one race (57%) was the highest (figure E).
Field of studyIn the past decade, doctorate recipients in business management and administration had the highest interstate mobility rates and education doctorates the lowest. More than three-quarters (76%) of men and over two-thirds (70%) of women earning a doctorate award in business management and administration accepted a job in a state different from the state of their doctoral institution. In contrast, interstate mobility of doctorate recipients in education during this period was 35% for men and 31% for women (figure F).
In science and engineering fields, interstate mobility was highest in psychology and social sciences, physical sciences and earth sciences, and mathematics and computer sciences. In mathematics and computer sciences, engineering, and physical sciences and earth sciences—which were broad fields with low participation of women—women were as mobile or slightly more mobile than men.
11https://www.nsf.gov/statistics/sed/
E F
C D
A B
U.S. citizen and permanent resident doctorate recipients with de�nite employment commitments outside the state where the degree was awarded, by broad �eld of study and sex: 2008–17Percent
0
10
20
30
40
50
60
70
80FemaleMale
Other non-S&E �elds
Businessmanagement
andadministration
Humanitiesand arts
EducationEngineeringPsychologyand
socialsciences
Mathematicsand
computersciences
Physicalsciencesand earthsciences
Lifesciences
U.S. citizen and permanent resident doctorate recipients with de�nite employment commitments outside the state where the degree was awarded, by race and ethnicity: 2008–17Percent
NOTE: Hispanic or Latino may be any race.
0
10
20
30
40
50
60
Other raceor race
not reported
More thanone race
WhiteBlack orAfrican
American
AsianAmericanIndian or
Alaska Native
Hispanicor Latino
U.S. citizen and permanent resident doctorate recipients with de�nite employment commitments outside the state where the degree was awarded, by age of dependents and sex: 2008–17Percent
NOTE: Individuals can report dependents in multiple categories.
0
10
20
30
40
50
60
70FemaleMale
No dependents19 years or older6–18 years5 years or younger
U.S. citizen and permanent resident doctorate recipients with de�nite employment commitments outside the state where the degree was awarded, by age: 2008–17Percent
0
10
20
30
40
50
60
70
46 yearsor older
41–45 years36–40 years31–35 years26–30 years25 yearsor younger
U.S. citizen and permanent resident doctorate recipients with de�nite employment commitments outside the state where the degree was awarded, by sex and marital status: 2008 and 2017Percent
0
10
20
30
40
50
60
7020172008
Never marriedWidowed,separated,or divorced
Married ormarriage-likerelationship
Never marriedWidowed,separated,or divorced
Married ormarriage-likerelationship
Male Female
Doctorate recipients with de�nite employment commitments outside the state where the degree was awarded, by citizenship: 1968–2017Percent
0
10
20
30
40
50
60
70
80Temporary visa holders
U.S. citizens and permanent residents
2017201220072002199719921987198219771968

12 Doctorate Recipients from U.S. Universities: 2017
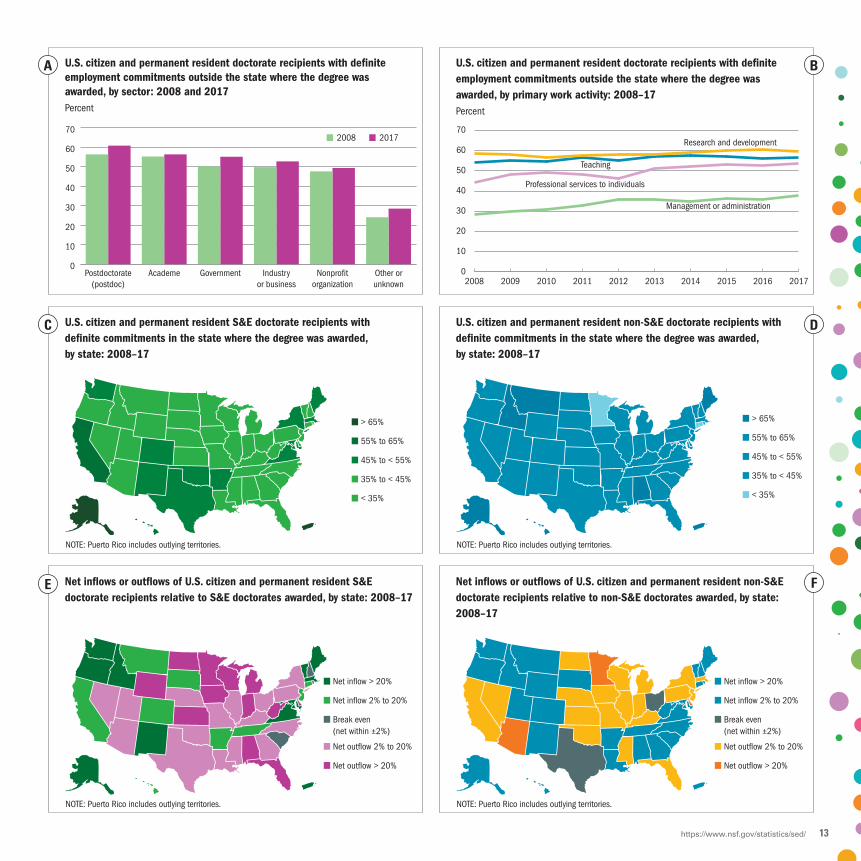
Employment opportunities available for highly skilled individuals vary considerably by state based on employment sector and primary work activity. Some doctorate recipients may take a job in a different state in search of opportunities to conduct research and development (R&D). Others may stay because they are more settled or have job opportunities in the area.
PATTERNS OF INTERSTATE MOBILITY: WHAT ARE THE EMPLOYMENT AND GEOGRAPHIC TRENDS?
Employment sectorIn 2017, doctorate recipients with definite employment commitments for a postdoc were more mobile than those committed to jobs in other sectors. About half or more of doctorate recipients committed to work in academe, government, business, and the nonprofit sectors moved out of state for a job after graduating. Doctorate recipients in the “other or unknown” category, which includes mostly those in K–12 teaching, had the lowest interstate mobility rate of all sectors (figure A).
In the past 10 years, interstate mobility increased in all sectors. Doctorate recipients with commitments in academe had the smallest increase in mobility and those with jobs in government, the largest.
Primary work activityDoctorate recipients who would be primarily working in R&D were the most mobile, followed closely by those who would be mainly teaching. In comparison, interstate mobility was lower for those who would be primarily managers or administrators and those providing professional services to individuals—but their mobility rates have seen larger increases in the past 10 years, peaking in 2017. Doctorate recipients who would be primarily offering professional services to individuals were now nearly as mobile as those who would be teaching (figure B).
Doctorate recipients staying in stateS&EAmong doctorate recipients in science and engineering (S&E) fields, the rates of those staying to work in the state where they earned their degree (stay rates) were highest in Puerto Rico (69%), Alaska (66%), California (60%), and Hawaii (57%). Four Midwest states (Michigan, Indiana, Iowa, and Minnesota) had stay rates below 35% and Southeastern states had stay rates between 35% and 45% (figure C).
Non-S&EIn nearly every state, stay rates were higher among doctorate recipients in non-S&E than in S&E fields. The vast majority of non-S&E doctorate recipients from Puerto Rico and Alaska stayed
there for their first job after graduation (94% and 87% respectively). Other states with high stay rates (between 65% and 80%) included Maine, Hawaii, Idaho, Montana, Alabama, and Texas (figure D).
Net inflows and outflows by stateHighest S&E flowsOver the past 10 years, several states registered a net inflow of new S&E doctorate recipients—an increase in the number of new doctorate recipients working in the state, relative to the number of doctorates awarded by universities in the state over the same period (see “Glossary”). Net inflows of S&E doctorate recipients were particularly strong in Northeastern and Mid-Atlantic states (Maine, Vermont, Maryland, and the District of Columbia) and in the Northwest (Oregon, Washington, and Idaho). New Mexico had the greatest net inflow of doctorate recipients—indicating a large number of research-intensive S&E jobs relative to S&E doctorates awarded (figure E).
Some states in the East North Central region (Indiana, Michigan, and Wisconsin) and the West North Central region (Iowa, North Dakota, Kansas, and Minnesota) together with Delaware, West Virginia, Florida, Alabama, and Wyoming registered the largest net outflows, training more S&E doctorate recipients than they employed.
Highest non-S&E flowsFrom 2008 to 2017, Alaska, Vermont, Maine, and New Hampshire registered the highest net inflows of non-S&E doctorate recipients, while Delaware, the District of Columbia, Minnesota, and Arizona had the highest net outflows (figure F).
Other notable geographic trendsOver the past decade, some states in the East North Central region (Illinois, Indiana, Michigan, and Wisconsin) and West North Central region (Nebraska, Minnesota, North Dakota, Iowa, and Kansas) registered net outflows of both non-S&E and S&E doctorate recipients. The states of Wyoming, Utah, Georgia, North Carolina, Alabama, and Louisiana, registered net inflows in non-S&E but net outflows in S&E fields.
13https://www.nsf.gov/statistics/sed/
E F
C D
A B
Net in�ows or out�ows of U.S. citizen and permanent resident non-S&Edoctorate recipients relative to non-S&E doctorates awarded, by state: 2008–17
NOTE: Puerto Rico includes outlying territories.
Net in�ow > 20%
Net in�ow 2% to 20%
Break even (net within ±2%)
Net out�ow 2% to 20%
Net out�ow > 20%
Net in�ows or out�ows of U.S. citizen and permanent resident S&E doctorate recipients relative to S&E doctorates awarded, by state: 2008–17
Net in�ow > 20%
Net in�ow 2% to 20%
Break even (net within ±2%)
Net out�ow 2% to 20%
Net out�ow > 20%
NOTE: Puerto Rico includes outlying territories.
U.S. citizen and permanent resident S&E doctorate recipients with de�nite commitments in the state where the degree was awarded, by state: 2008–17
> 65%
55% to 65%
45% to < 55%
35% to < 45%
< 35%
NOTE: Puerto Rico includes outlying territories.
U.S. citizen and permanent resident non-S&E doctorate recipients with de�nite commitments in the state where the degree was awarded, by state: 2008–17
> 65%
55% to 65%
45% to < 55%
35% to < 45%
< 35%
NOTE: Puerto Rico includes outlying territories.
U.S. citizen and permanent resident doctorate recipients with de�nite employment commitments outside the state where the degree was awarded, by primary work activity: 2008–17Percent
0
10
20
30
40
50
60
70
Management or administration
Professional services to individuals
Teaching
Research and development
2017201620152014201320122011201020092008
U.S. citizen and permanent resident doctorate recipients with de�nite employment commitments outside the state where the degree was awarded, by sector: 2008 and 2017Percent
0
10
20
30
40
50
60
7020172008
Other orunknown
Nonpro�torganization
Industryor business
GovernmentAcademePostdoctorate(postdoc)

14 Doctorate Recipients from U.S. Universities: 2017
GLOSSARYBasic annual salary. Annual salary to be earned from the doctorate recipient’s principal job in the next year, not including bonuses or additional compensation for summertime teaching or research.
Carnegie Classification. The Carnegie Classification of academic institutions is a commonly used classification of postsecondary institutions based on level of degree awarded, fields in which degrees are conferred, and, in some cases, enrollment, federal research support, and selectivity of admissions criteria. The categories used here are from the 2015 version of the classification and include highest research universities, higher research universities, moderate research universities, and other universities.
Definite commitment. A commitment, through a contract or other method, by doctorate recipients to accept employment, including a postdoc study, in the coming year or to return to predoctoral employment.
Definite employment commitment. A definite commitment by doctorate recipients for employment in a non-postdoc position in the coming year.
Field of study. The Survey of Earned Doctorates (SED) collects data on 331 fields of doctoral study. For reporting purposes, these fields are grouped into 35 major fields and are further aggregated into eight broad fields: life sciences; physical sciences and earth sciences; mathematics and computer sciences; psychology and social sciences; engineering; education; humanities and arts; and other non-science and engineering fields. See technical table A-6 in the online resources of this report for a listing of the major fields within each broad field category. See the survey questionnaire for a full listing of the fine fields of study in 2017 (https://www.nsf.gov/statistics/sed/).
Graduate education-related debt. The amount of debt owed by a doctorate recipient at the time the doctorate is awarded that is directly related to graduate education.
Interstate mobility. Characteristic of doctorate recipients who at graduation have a definite employment commitment in a different state from the state of the institution that awarded the doctoral degree. This report focuses on interstate mobility of U.S. citizens and permanent residents with definite employment commitments in the United States.
Net inflows or outflows of doctorate recipients. An index measuring the increase or decrease in the number of U.S. doctorate recipients working in a state over a period of time, relative to the size of the doctorate recipient cohort in that state during that time. The measure is calculated as follows: Over the past 10 years [(total number of doctorates awarded in that state minus recipients who accepted a job in a different state plus those whose job commitments brought them into the state) divided by total number of doctorates awarded in that state] multiplied by 100. In this measure, interstate mobility could include taking a job in a different state but continuing to live in the state of their doctoral institution.
Non-S&E. Non-science and engineering: A grouping of broad fields of study that includes education, humanities and arts, and other non-S&E fields, such as business.
Parental educational attainment. The highest level of education attained by either parent of a doctorate recipient.

15https://www.nsf.gov/statistics/sed/
Postdoc position. As defined on the questionnaire form, a temporary position primarily for gaining additional education and training in research, usually awarded in academe, industry, government, or a nonprofit organization.
Postdoc rate. The proportion of doctorate recipients who have definite commitments for a postdoc position among all doctorate recipients with definite commitments in the coming year, who reported whether their commitment was for postdoc study or other employment, and who plan to live in the United States.
Race and ethnicity. Doctorate recipients who report Hispanic or Latino heritage, regardless of racial designation, are counted as Hispanic or Latino, and as of 2013, those who do not answer the Hispanic or Latino ethnicity question are counted as “ethnicity not reported.” Respondents who indicate that they are not Hispanic or Latino and indicate a single race are reported in their respective racial groups, except for those indicating Native Hawaiian or Other Pacific Islander, who are included in “other race or race not reported.” Beginning in 2001, respondents who are not Hispanic or Latino and who indicate more than one race are reported in the category “more than one race.” Data for this category were not collected before 2001. Before 2001, respondents who are not Hispanic or Latino and who indicate more than one race were categorized as “other or unknown.” For 2001 and later data, the “other or unknown” category includes doctorate recipients who indicated that they were not Hispanic or Latino and either did not respond to the race item or reported their race as Native Hawaiian and Other Pacific Islander. For 2000 and earlier data, Native Hawaiians and Other Pacific Islanders are counted in the Asian group.
Research doctorate. A doctoral degree that is oriented toward preparing students to make original intellectual contributions in a field of study and that is not primarily intended for the practice of a profession.
Research doctorates require the completion of a dissertation or equivalent project. In this report, the terms “doctorate” and “doctoral degree” are used to represent any of the research doctoral degrees covered by the survey. Professional doctorates, such as the MD, DDS, JD, and PsyD, are not covered by the Survey of Earned Doctorates.
S&E. Science and engineering: A grouping of broad fields of study that includes science (life sciences, physical sciences and earth sciences, mathematics and computer sciences, psychology and social sciences) and engineering fields.
Sources of financial support. Sources of financial support are grouped into the following five categories: fellowships (includes scholarships and grants); teaching assistantships; research assistantships (includes traineeships, internships, clinical residencies, and other assistantships); own resources (includes loans, personal savings, personal earnings, and earnings or savings of spouse, partner, or family); and other (includes employer reimbursements and support from non-U.S. sources).
State stay rates. The rate of doctorate recipients whose definite commitment for employment immediately after graduation is in the same state as the institution that awarded the degree.
Time to degree. The median time elapsed from the start of any graduate school program to completion of the doctoral degree. In addition to this measure, two other measures of time to degree are also reported in the data tables: median time elapsed from completion of the bachelor’s degree to completion of the doctorate, and median time elapsed from the start of the doctoral program.
Underrepresented minority. The following groups are underrepresented in science and engineering, relative to their numbers in the U.S. population: American Indian or Alaska Native, black or African American, and Hispanic or Latino.

16 Doctorate Recipients from U.S. Universities: 2017
DATA SOURCE
The Survey of Earned Doctorates (SED) is the sole data source for Doctorate Recipients from U.S. Universities: 2017. The principal elements
of the 2017 SED data collection are described in the sections that follow. More detailed information and related technical tables are available at https://www.nsf.gov/statistics/sed/.
Survey eligibility. The SED collects information on research doctorate recipients only. Research doctorates require the completion of a dissertation or equivalent project, are oriented toward preparing students to make original intellectual contributions in a field of study and are not primarily intended for the practice of a profession. The 2017 SED recognized 18 distinct types of research doctorates. In 2017, 98% of research doctorate recipients earned the PhD.
Survey universe. The population eligible for the 2017 survey consisted of all individuals who received a research doctorate from an accredited U.S. academic institution in the 12-month period from 1 July 2016 to 30 June 2017. The total universe consisted of 54,664 persons in 428 institutions that conferred research doctorates in academic year 2017.
Data collection. Institutional coordinators at each doctorate awarding institution distributed the SED Web survey link (or paper survey form) to individuals receiving a research doctorate. Nonresponding graduates were contacted by e-mail, mail, or phone to request response to the survey. RTI International served as the 2017 SED data collection contractor on behalf of the National Center for Science and Engineering Statistics within the National Science Foundation.
Survey response rates. In 2017, 91.4% of research doctorate recipients completed the survey. Limited records (field of study, doctoral institution, and sex) are constructed for nonrespondents from administrative records of the university—commencement programs, graduation lists, and other public records—and are included in the reported total of doctorate recipients. Response rates for 2008–17 are provided in the technical tables.
Time series data changes. After a multiyear review of Doctor of Education (EdD) degree programs participating in the SED, 143 programs were reclassified from research doctorate to professional doctorate over the 2010–11 period. No additional reclassifications of EdD degree programs are planned. SED data are no longer being collected from graduates earning degrees from the reclassified EdD programs, and this has affected the reporting of the number of doctorates awarded by sex, citizenship, race, and ethnicity. Several figures in this report show a decline in number of degrees awarded from 2009 to 2011 (in particular, see figures D and F in the “Who earns a U.S. doctorate?” section and figure B in the “Which fields attract students?” section). Readers should note that the declines from 2009 to 2010 and from 2010 to 2011 are at least partly attributable to the EdD reclassification.
Data license. Microdata from the SED may be obtained through a restricted-use data license (see https://nsf.gov/statistics/license/index.cfm).
17https://www.nsf.gov/statistics/sed/
FURTHER READING
For an overarching view of long-term trends in U.S. doctoral education, as reflected in the data from the Survey of Earned Doctorates (SED),
please see U.S. Doctorates in the 20th Century (NSF 06-319, October 2006, https://www.nsf.gov/statistics/nsf06319/). Additional context is provided in summary reports for previous years (Doctorate Recipients from U.S. Universities ), available at https://www.nsf.gov/statistics/doctorates/.
Other publications from the National Center for Science and Engineering Statistics use SED data to report on focused topics. Publications that relate to the topics covered in Doctorate Recipients from U.S. Universities: 2017 are listed below, by relevant section.
“Who earns a U.S. doctorate?” and “Which fields attract students?”Women, Minorities, and Persons with Disabilities in Science and Engineering: 2017 (NSF 17-310, January 2017, https://www.nsf.gov/statistics/2017/nsf17310/).
Numbers of Doctorates Awarded in the United States Declined in 2010 (NSF 12-303, November 2011, https://www.nsf.gov/statistics/infbrief/nsf12303/).
Numbers of Doctorates Awarded Continue to Grow in 2009 ; Indicators of Employment Outcomes Mixed (NSF 11-305, November 2010, https://www.nsf.gov/statistics/infbrief/nsf11305/).
Interdisciplinary Dissertation Research (NSF 10-316, March 2010, https://www.nsf.gov/statistics/infbrief/nsf10316/).
Numbers of U.S. Doctorates Awarded Rise for Sixth Year, but Growth Slower (NSF 10-308, November 2009, https://www.nsf.gov/statistics/infbrief/nsf10308/).
“What influences the path to the doctorate?”Baccalaureate Origins of U.S.-trained S&E Doctorate Recipients (NSF 13-323, April 2013, https://www.nsf.gov/statistics/infbrief/nsf13323/).
Role of HBCUs as Baccalaureate-Origin Institutions of Black S&E Doctorate Recipients (NSF 08-319, August 2008, https://www.nsf.gov/statistics/infbrief/nsf08319/).
Baccalaureate Origins of S&E Doctorate Recipients (NSF 08-311, July 2008, https://www.nsf.gov/statistics/infbrief/nsf08311/).
Time to Degree of U.S. Research Doctorate Recipients (NSF 06-312, March 2006, https://www.nsf.gov/statistics/infbrief/nsf06312/).
“What are the postgraduation trends?”Unemployment among Doctoral Scientists and Engineers Remained Below the National Average in 2013 (NSF 14-317, September 2014, https://www.nsf.gov/statistics/infbrief/nsf14317/).
Unemployment among Doctoral Scientists and Engineers Increased but Remained below the National Average (NSF 14-310, April 2014, https://www.nsf.gov/statistics/infbrief/nsf14310/).
International Mobility and Employment Characteristics among Recent Recipients of U.S. Doctorates (NSF 13-300, October 2012, https://www.nsf.gov/statistics/infbrief/nsf13300/).
Emigration of U.S.-Born S&E Doctorate Recipients (NSF 04-327, June 2004, https://www.nsf.gov/statistics/infbrief/nsf04327/).
Plans for Postdoctoral Research Appointments among Recent U.S. Doctorate Recipients (NSF 04-308, March 2004, https://www.nsf.gov/statistics/infbrief/nsf04308/).
Interstate Migration Patterns of Recent Science and Engineering Doctorate Recipients (NSF 02-311, February 2002, https://www.nsf.gov/statistics/nsf02311/).
18 Doctorate Recipients from U.S. Universities: 2017
ONLINE RESOURCES
An interactive version of the printed report and its related resources, described below, are available at https://www.nsf.gov/statistics/
sed/. Data from the Survey of Earned Doctorates (SED) also can be further explored in the National Center for Science and Engineering Statistics interactive data tool at https://ncsesdata.nsf.gov/ids/sed.
Data tables. Data on the full range of survey items collected by the 2017 SED are presented in 72 detailed statistical tables. These tables present detailed data on the demographic characteristics, educational history, sources of financial support, and postgraduation plans of doctorate recipients. The full set of tables is available for download as PDF and Excel files.
Figures. The figures illustrating each theme are presented as interactive graphics and available for download as image files, accompanied by the supporting source data in Excel format.
Survey questionnaire. A link to the questionnaire for the 2017 SED appears in the “How Do I…” section of the online report.
Technical notes and tables. The technical notes provide more detail on how the SED collects data about recipients of research doctorates. The technical tables provide such information as the types of research doctoral degrees included in the SED, survey response rates over time, and details on field aggregations.

19https://www.nsf.gov/statistics/sed/
ACKNOWLEDGMENTS, CITATION, AND CONTACTAcknowledgmentsThe conduct of the Survey of Earned Doctorates (SED), the maintenance of the SED, and resulting publications are supported by the National Center for Science and Engineering Statistics (NCSES) within the National Science Foundation (NSF) and by the National Institutes of Health (NIH), Department of Education (ED), National Endowment for the Humanities (NEH), Department of Agriculture (USDA), and National Aeronautics and Space Administration (NASA). These federal agencies gratefully acknowledge the support and assistance of graduate deans and their staff, registrars, dissertation officers, and other administrators who participate in the SED effort and contribute to its success. Appreciation is also extended to the new research doctorate recipients who completed the 2017 survey.
Jaquelina Falkenheim (NCSES) oversaw the preparation of this report. Emilda Rivers, John Finamore, Samson Adeshiyan, and Kelly Kang at NCSES reviewed and commented on multiple drafts of the report and data tables. Amy Burke, Karen Hamrick, Derek Hill, Francisco Moris, and Darius Singpurwalla at NCSES provided helpful comments and suggestions. Staff at RTI International who played a valuable role in the 2017 SED and report effort are Jamie Friedman, August Gering, Patricia Green, Jane Griffin, Miranda Guardiola, Kaleen Healey, Ruth Heuer, Herschel Sanders, Joe Simpson, and Robert Steele.
The published report was produced by Catherine Corlies, Tanya Gore, and Christine Hamel (NCSES). Drew Mitchell and staff at OmniStudio, Inc., designed the cover and layout. Development of the Web version was guided by Rajinder Raut (NCSES), with technical assistance from staff of Penobscot Bay Media.
Suggested citationNational Science Foundation, National Center for Science and Engineering Statistics. 2018. Doctorate Recipients from U.S. Universities: 2017. Special Report NSF 19-301. Alexandria, VA. Available at https://ncses.nsf.gov/pubs/nsf19301/.
Contact report authorJaquelina Falkenheim 703-292-7798 [email protected]

NSF 19-301
Related Documents