STUDIES ON SOME NOVEL ANTICORROSION CONDUCTING POLYMERIC MATERIALS THESIS SUBMITTED FOR THE AWARD OF THE DEGREE OF Doctor of Philosophy In Applied Chemistry BY RUMAN ALAM UNDER THE SUPERVISION OF PROF. MOHAMMAD MOBIN DEPARTMENT OF APPLIED CHEMISTRY ALIGARH MUSLIM UNIVERSITY ALIGARH (INDIA) 2016

Welcome message from author
This document is posted to help you gain knowledge. Please leave a comment to let me know what you think about it! Share it to your friends and learn new things together.
Transcript

STUDIES ON SOME NOVEL ANTICORROSION
CONDUCTING POLYMERIC MATERIALS
THESIS
SUBMITTED FOR THE AWARD OF THE DEGREE OF
Doctor of Philosophy
In
Applied Chemistry
BY
RUMAN ALAM
UNDER THE SUPERVISION OF
PROF. MOHAMMAD MOBIN
DEPARTMENT OF APPLIED CHEMISTRY
ALIGARH MUSLIM UNIVERSITY
ALIGARH (INDIA)
2016

CANDIDATE’S DECLARATION
I, Ruman Alam, Department of Applied Chemistry certify that the work
embodied in this Ph.D thesis is my own bonafide work carried out by me under the
supervision of Prof. Mohammad Mobin at Aligarh Muslim University, Aligarh. The
matter embodied in this Ph.D. thesis has not been submitted for the award of any
other degree.
I declare that I have faithfully acknowledged, given credit to and referred to
the research workers wherever their works have been cited in the text and the body of
the thesis. I further certify that I have not willfully lifted up some other’s work, para,
text, data, result, etc. reported in the journals, books, magazines, reports, dissertations,
thesis, etc., or available at web-sites and included them in this Ph.D. thesis and cited
as my own work.
Date: (Signature of the candidate)
RUMAN ALAM
(Name of the candidate)
Certificate from the Supervisor
This is to certify that the above statement made by the candidate is correct to the best
of our knowledge.
Signature of the Supervisor
Name & Designation: Dr. Mohammad Mobin, Professor
Department: APPLIED CHEMISTRY
(Signature of the Chairman of the Department with seal)

COURSE/ COMPREHENSIVE EXAMINATION/ PRE-
SUBMISSION SEMINAR COMPLETION CERTIFICATE
This is to certify that Mr. Ruman Alam, Department of Applied Chemistry
has satisfactorily completed the course work/comprehensive examination and
pre-submission seminar requirement which is part of his Ph.D. programme.
Date: ……………. (Signature of the Chairman of the Department)
COPYRIGHT TRANSFER CERTIFICATE
Title of the Thesis: STUDIES ON SOME NOVEL ANTICORROSION
CONDUCTING POLYMERIC MATERIALS
Candidate’s Name: RUMAN ALAM
Copyright Transfer
The undersigned hereby assigns to the Aligarh Muslim University, Aligarh,
copyright that may exist in and for the above thesis submitted for the award of
Ph.D. degree.
(Signature of the Candidate)
Note: However, the author may reproduce or authorize others to reproduce material
extracted verbatim from the thesis or derivative of the thesis for author’s
personal use provided that the source and the university’s copyright notice are
indicated

Dedicated To
My Family

CONTENTS
CHAPTER-1 : General Introduction 1-36
CHAPTER-2 : Materials and Methods 37-51
CHAPTER-3 : Anticorrosion behavior of poly(aniline-co-o-anisidine)/ZnO nanocomposite coating on mild steel -anisidine)/ZnO nanocomposite coating on mild stee
52-71
CHAPTER-4 : Anticorrosion behavior of poly(aniline-co-N-ethylaniline)/ZnO nanocomposite coating on mild steel nanocomposite coating on mild
72-96
CHAPTER-5 : Anticorrosion behavior of poly(aniline-co-2, 3-xylidine)/ZnO nanocomposite coating on mild steel
97-115
CHAPTER-6 : Anticorrosion behavior of poly(aniline-co-2-pyridylamine-co-2, 3-xylidine)/ZnO nanocomposite coating on mild steel
116-131
CHAPTER-7 : Anticorrosion behavior of polypyrrole/graphene nanosheets/rare earth ions/dodecyl benzene sulfonic acid nanocomposite coating on mild steel
132-147
CHAPTER-8 : Conclusion and Future work plan 148-150
- References 151-162
- List of Publications -

Chapter 1

General Introduction

CHAPTER 1
1
1.1 Introduction
The term corrosion is derived from a Latin word “rodere” means “gnawing”
and “corrodere” means “gnaw into pieces” or “eating up”. It is an undesirable
phenomenon and exists as a part of our everyday life. It destroys the luster and beauty
of the metallic objects and shortens their life. Ever since the discovery of the metal,
corrosion has not only impacted the daily-life of the people but also hindered their
technical progress. It involves issues pertaining to public safety, huge economic and
environmental impact and conservation of materials. Corrosion is commonly equated
to rusting and refers to the destruction of a metal resulting from exposure and
interaction with the environment. International Standard Organization (ISO) in
collaboration with International Union of Pure and Applied Chemistry (IUPAC)
defined corrosion as the “Physicochemical interaction between a metal and its
environment which results in changes in the properties of the metal and which may
often lead to impairment of the function of the metal, the environment or the technical
system of which these forms a part” [1, 2]. However, corrosion involves not only the
degradation of iron or a metallic material but also refers to the degradation of non-
metallic materials like polymers, ceramics, semiconductors etc. and probably
encompasses all types of natural and man-made materials including biomaterials and
nanomaterials. In view of the above a broader and widely accepted alternative
definition of corrosion was suggested, which defines corrosion as “an irreversible
interfacial reaction of a material (metal, ceramic, polymer) with its environment
which results in consumption of the material or in dissolution into the material of a
component of the environment” [3].NACE (National Association of Corrosion
Engineers) International defined corrosion as “The deterioration of a material, usually
a metal, that results from a reaction with its environment” [4].
Corrosion is a natural occurring process based on the universal laws of nature.
Like all natural processes, which tend to return toward the lowest possible energy
states, the driving force for corrosion is the lowering of a system’s Gibbs free energy.
Most of the metals are present in nature in the form of oxides as their ore and are
chemically stable. When the refined metal comes in contact with the environment
consisting of oxidizing agent it reverts back to its natural low energy oxide state with
holes, pits and cracks. The return of the metals to the native oxide state is termed as
corrosion. Corrosion, which is now been considered as an essential component of
CHAPTER 1
2
design has undergone an irreversible transformation from a state of isolation and
obscurity to a recognized discipline of engineering. The learned societies like
European Federation of Corrosion, Japan Society of Corrosion Engineers, NACE
International and others are playing leading role in the development of corrosion
engineering education.
1.2 Importance of Corrosion
Corrosion has many serious economic, health, safety, technological, and
cultural consequences to our society. The economic consequences is the prime motive
for much of the current researches in the field of corrosion. Corrosion has a major
impact on the economy of a nation. In every country each year industries are paying
huge price for corrosion and that cost is rising. Many papers and documents have
been published about the cost of corrosion. The first significant report on cost of
corrosion was presented by Uhlig in 1949. The annual cost of corrosion in United
States was estimated to be 5.5 billion dollars, which was 2.1 percentage of total Gross
National Product GNP of 1949 [5]. However, the importance of corrosion was
recognized in the sixties when it was realized that damage was being caused to the
economics of the industrialized nations, resources are being wasted by anti-
metallurgical processes and useful life of manufactured goods were being reduced [6].
In the late seventies, a comprehensive landmark study on economic effects of
corrosion was published in USA [7]. The results of the study showed that the total
loss due to corrosion in the year 1975 was $70 billion, which was approximately 5%
of Gross National Product (GNP) of that year. The study directed the cost of corrosion
into avoidable costs and unavoidable costs. The avoidable cost (which could have
been reduced by application of available corrosion control practices) in the study was
staggering $ 10 billion, which was about 15% of the total cost of corrosion. Later on,
the U.S. Federal Highway Administration (FHWA) released a breakthrough study in
2002, which made an estimation of the direct cost associated with metallic corrosion
in U.S. industrial sector. The study was initiated by NACE International, and has the
mandate of U.S. Congress as part of Transportation Equity Act for the 21st century
(TEA-21). The study provided the current cost estimates and identified national
strategies to minimize the impact of corrosion [8]. The results of the study showed
that total annual direct cost of corrosion was staggering $ 276 billion which was

CHAPTER 1
3
approximately 3.1% of the nation’s Gross Domestic Product (GDP). The corrosion
costs studies have since then been undertaken by several countries including the
United Kingdom, Japan, Australia, Kuwait, Germany, Finland, Sweden, India, and
China. A common finding of these studies has been that the annual corrosion costs
range from approximately 1 to 5 percent of the GNP of each nation. In a quite recent
publication the global economic losses due to corrosion, as estimated by NACE
International in 2016, has been reported to be $ 2.5 trillion [9].Although the value of
such numbers is always debatable, corrosion issues are clearly of great importance in
modern societies. In India the direct cost due to corrosion during the year 1984-85
was estimated and found to be Rs.4076 Crores out of which Rs.1804 Crores was
considered avoidable [10]. Another report on the cost of corrosion in India estimated
the annual losses due to corrosion to be Rs. 25,000 crores per year, which worked out
to be 4% of GNP [11]. As per the latest global study by NACE International the cost
to India's economy on the account of corrosion is estimated to be 4.2% of GDP.
In addition to the economic costs, several other aspects make corrosion control
an urgent consideration. Recent years have seen an increasing use of metal prosthetic
devices in the body, such as pins, plates, hip joints, pacemakers, and other implants.
New alloys and better techniques of implantation have been developed, but corrosion
continues to create problems. Corrosion can lead to structural failures that have
dramatic consequences for humans and the surrounding environment. Reports on the
corrosion failures of bridges, buildings, aircrafts, automobiles, and gas pipelines are
not unusual. The problem of corrosion of structures can result in severe injuries or
even loss of life. Various accidents related to corrosion failures are reported in the
history of mankind which shook the world. The environmental concerns include
consideration of corrosion caused pollution, and depletion of resources such as those
needed for replacement of corroded structure. The safety and environmental concerns
tend to be very hard to define in terms of cost. The development of new technologies
is held back by corrosion problems because materials are required to withstand higher
temperatures, higher pressures, and more highly corrosive environments. In many
industrial sectors corrosion is a limiting factor preventing the development of
economically or even technologically workable systems. International concern was
aroused by disclosure of serious deterioration of artistically and culturally significant
gilded bronze statues in Venice, Italy. Corrosion will accelerate deterioration of
CHAPTER 1
4
precious artifacts by highly polluted environments that are prevalent in most countries
of the world. Inside world's museums the conservators and restorers are laboring to
protect cultural treasures against the ravages of corrosion or to remove its traces from
artistically or culturally important artifacts.
At least a third portion of corrosion cost can be saved by using available
practices and technologies in our routine working environments. Further costs can be
reduced by incorporating corrosion prevention technologies and practices in the
design stage of the asset. Better broadcasting of the existing information through
education and training, technical advisory and consulting services, and research and
development activities should be encouraged to minimize the cost as well as hazards
of corrosion. The corrosion problem must be addressed for safety, environment and
economic reasons. Countless number of research papers are being published each year
on the subject of corrosion and corrosion protection of the metals. Among the metals
investigated maximum attention has been paid on the iron and its alloys as they form
the building block of modern industry. Even with the availability of number of non-
metallic materials, iron and its alloys are still the most dominant construction material
in the modern industry.
1.3 Units of Corrosion
Corrosion rate may be expressed in number of ways, e.g., as an increase in
corrosion depth per unit of time (penetration rate, for example, mils per year, mpy) or
weight loss per unit area per unit time, usually mdd (milligrams per square decimetre
per day) or the corrosion current (mAcm-2). The preferred SI unit of corrosion rate
expression is millimeter per year (mmpy) or inch per year (ipy). The expression mils
per year (mpy) (a mil being a thousand of inches) is the most widely used and
desirable corrosion rate expression in USA because other units do not explain
corrosion resistance in terms of penetration which is an important aspect to predict the
life of metal. Corrosion rate in mpy can be calculated from weight loss of metal
specimen by using the following equation:
t A
W
ρ
534(mpy)rateCorrosion (1)

CHAPTER 1
5
where, W is weight loss in mg; ρ is the density of specimen in g/cm3; A is the
area of specimen in sq. in. and t is exposure time in hrs. The interconversion of most
common units used to express corrosion rate are shown in Table 1.1.
Table 1.1: Interconversion of corrosion units
mA cm-2 mmpy mpy g m-2 day-1
mA cm-2 1 3.28 M/nd 129 M/nd 8.95 M/n
mmpy 0.306 nd/M 1 3.94 2.74 d
mpy 0.0077 nd/M 0.0254 1 0.0694 d
g m-2 day-1 0.112 n/M 0.365 /d 14.4 /d 1
Where, d is the density; M is atomic mass and n is the number of electrons
freed by the corrosion reaction.
1.4 Laboratory Corrosion Measurements Techniques
The widely used corrosion measurements techniques employed in the
laboratory can broadly be classified into non-electrochemical measurements and
electrochemical measurements. The important non-electrochemical measurements
include: weight loss method, Gasometric, solution analysis of metal ions and
electrical resistance (ER) probe technique. The electrochemical techniques include:
linear polarization resistance (LPR), potentiodynamic polarization (PDP),
electrochemical impedance spectroscopy (EIS) and electrochemical noise (EN).
1.4.1 Non-electrochemical measurements
1.4.1.1 Weight loss method
The weight loss method, considered as the “gold standard,” of corrosion
testing, i s the simplest and most widely used corrosion monitoring technique. Pre-
weighed coupon of the material is exposed to the corrosive solution or process
environment for a reasonable time interval. The coupon is then taken out, cleaned to
remove corrosion products and is reweighed. The corrosion rate is expressed by
measuring the weight loss taking place over the period of exposure. However, there
are important issues to be considered for weight loss measurements. First, since mass
can be measured easily only to about 0.1mg, the sensitivity of weight loss

CHAPTER 1
6
measurements is limited. Other issues include end-grain attack leading to different
corrosion rates on different exposed faces, crevice corrosion associated with hanging
or supporting the sample and waterline attack if the sample extends beyond the
surface. Finally, weight loss measurements are usually performed after long exposure
times so they provide an average rate over time as well as over the exposed surface.
1.4.1.2 Gasometric techniques
When a metal corrodes in acidic environment hydrogen gas is evolved as a by-
product of the corrosion reaction. The progress of the corrosion reaction can be
monitored by careful measurement of the volume of the evolved hydrogen gas at
fixed time intervals. The corrosion rate may be determined from the volume of
hydrogen evolved as the corrosion reaction proceeds.
1.4.1.3 Solution Analysis of Metal Ions
The corrosion rate of a metal immersed in an electrolytic solution of a fixed
volume can also be measured from determination of total metal ions entered into the
electrolytic solution in the course of corrosion during immersion. The chemical
analysis of withdrawn aliquots of the solution as a function of time allows
determination of the corrosion rate. The chemical analysis of metal ions in the
electrolytic solution can be performed using UV-visible and atomic absorption
spectrophotometry. However, this technique also has sensitivity limitations similar to
weight loss method.
1.4.1.4 Electrical resistance (ER) probe technique
Electrical resistance technique involves a change in electrical resistance of a
probe sample. The reduction of the cross-sectional area of a probe by corrosion is
accompanied by a proportionate increase in the electrical resistance, which can be
tracked easily [12, 13].The electrical resistance monitoring typically requires a
relatively long exposure period for a detectible difference in probe resistance and
electrically conductive deposits can affect the measurements. However, a major
advantage of this technique is its applicability to a wide range of corrosive conditions
including environments having poor conductivity or non-continuous electrolytes such
as vapors and gases.

CHAPTER 1
7
1.4.2 Electrochemical techniques
The electrochemical techniques are based on the electrode kinetics taking
place as a result of the corrosion processes and are used to study both the corrosion
rates and qualitative behavior of corrosion mechanisms. The techniques require the
use of working electrode (specimen being studied), the counter electrode (provide
current path into solution) and reference electrode (reference connection for
potential measurement). The advantage of the electrochemical technique include
instantaneous corrosion rate measurement whereas disadvantage include the
requirement of relatively clean aqueous electrolytic environments as it will not work
in gases or water/oil emulsions where fouling of the electrodes will prevent
measurements being made. A number of excellent reviews have appeared describing
the electrochemical techniques in detail and providing instructions on their proper use
[14-18].
1.4.2.1 Linear polarization resistance (LPR)
In this technique the corrosion rate is determined from the polarization
resistance (RP) using the Stern-Geary equation provided that the RP is similar to the
charge transfer resistance and if the Tafel slopes are known. The most common way
to determine RP is by the LPR method. In this method potential is scanned about ±5–
10 mV relative to the corrosion potential. The LPR method has been put to
considerable use in corrosion monitoring as it involves relatively little potential
perturbation. However, accurate assessment of corrosion rate requires knowledge of
the Tafel slopes, which must be determined separately or assumed.
1.4.2.2 Potentiodynamic polarization (PDP)
The potentiodynamic polarization (PDP) over a potential range about ±200 –
250 mV from the open circuit potential (OCP) results in a polarization curve that can
be analyzed for corrosion rate, provided that the rates of other anodic reactions such
as those associated with redox reactions are small in comparison. Typically presented
in a semi-logarithmic plot, polarization curves provide corrosion rate by extrapolation
of the linear cathodic and/or anodic regions to the corrosion potential. PDP over a
wide range of potential generates more information about the system than just the
corrosion rate. For instance, in formation can be obtained about the proximity of the
OCP to regions of passivity or localized corrosion susceptibility. PDP is a tool for
CHAPTER 1
8
laboratory investigations, not corrosion rate monitoring, as it involves perturbation of
the potential relatively far from the steady-state corrosion potential.
1.4.2.3 Electrochemical impedance spectroscopy (EIS)
The EIS is another powerful electrochemical technique widely used in
corrosion research. T h e technique involves the application of a time-varying voltage
and measurement of the current response. The ratio of two gives the frequency-
dependent impedance. A number of research papers and book chapters have been
published on EIS and its application to corrosion [19-25].The low frequency limit of
the impedance magnitude can be related to Rp and thus the corrosion rate using the
Stern-Geary equation. Again, the Tafel slopes are required to do so. Constant phase
elements CPEs are used widely in the analysis of EIS corrosion data. EIS is a
particularly useful technique for low conductivity electrolytes as the ohm resistance is
determined explicitly. It also provides a good description of the response of paint-
coated samples and is sensitive to early stages of coating failure. One main difficulty
with the technique is the proper selection of an equivalent circuit. An equivalent
circuit should always be based on a physical model of the corroding system; addition
of circuit elements simply to improve the fit is unacceptable. However, a number of
complex circuits could be rationalized as the detailed nature of the physical system
often is not known.
1.4.2.4 Electrochemical noise (EN)
The electrochemical noise (EN) has been reviewed by several investigators
[25-33]. The technique involves the measurement of electrochemical events i.e.,
current or potential transients or both simultaneously produced by the corrosion
process. The most common approach is to measure current noise utilizing a zero
resistance ammeter of two identical electrodes shorted together and the potential noise
between the pair and a reference electrode (RE) or a third identical electrode. The
ratio of the root mean squared deviation of the potential and current fluctuations is
one measure of the noise resistance. Alternatively, the data can be transformed into
the frequency domain to generate a power density spectrum or evaluated using
wavelet analysis. One problem with EN is the proper approach for accounting for the
exposed area of the sample. EN is particularly appealing for in situ monitoring as no
applied perturbation is required. Even though the absolute corrosion rate cannot be

CHAPTER 1
9
obtained, the EN character is quite different for passive conditions low noise,
metastable pitting random events of short duration, and stable pitting individualized
events of longer duration so it can be useful for assessing the onset of localized
corrosion or stress corrosion cracking for a stressed sample. Changes in conditions
can be detected, triggering closer inspection or sampling of passive probes immersed
in the environment.
1.5 Types of Corrosion
Corrosion can be classified on three different basis, namely nature of
corrodents (wet or dry corrosion), mechanism of corrosion (electrochemical or direct
chemical attack) and appearance of corroded metal surface (uniform or general
corrosion and localized corrosion). The localized corrosion is more dangerous as the
failure is abrupt and difficult to predict. Fontana [34] has classified different types of
corrosion into eight forms, which are as follows:
Uniform, or general corrosion
Crevice corrosion
Pitting corrosion
Stress corrosion cracking
Galvanic, or two metal corrosion
Intergranular corrosion
Selective leaching or dealloying
Erosion corrosion
1.5.1 Uniform corrosion
Uniform or general corrosion is the most common form of corrosion. In this
type of corrosion the rate of attack over the entire exposed metal surface is same.
With time metal become thinner and finally fails. Steel sample dipped in dilute
hydrochloric acid will normally dissolves at a uniform rate over its entire surface.
This form of corrosion represents the loss of metal on tonnage basis. Uniform
corrosion is more prone to steel, low alloy iron and magnesium alloys. From technical
point of view uniform corrosion is not of great concern because the life of equipment
can be easily estimated by carrying out simple tests. It can be prevented or reduced to

CHAPTER 1
10
greater extend by using inhibitors, coatings, proper selection of materials, or by
cathodic protection.
1.5.2 Crevice corrosion
The crevice corrosion, which also refers to corrosion in occluded areas, is one
of the most damaging forms of localized material degradation [35].The corrosion is
produced at the region of contact of metals with metals or metals with nonmetals.
This type of corrosion is generally associated with small volumes of stagnant solution
trapped in holes, gasket surfaces, lap joints, surface deposits, and crevices under bolt
and rivet heads. It is also known as gasket or deposit corrosion. Sand, dirt, corrosion
product and other solids are some of the deposits that cause crevice corrosion. The
crevice gap width and depth, and the surface ratios of materials can all affect the
extent of crevice corrosion. Humidity, temperature, environmental constituent and its
concentration is largely responsible for extent of crevice corrosion.
1.5.3 Pitting corrosion
Pitting corrosion is one of the most destructive forms of corrosion and is often
responsible for failures of components in process plants, where it accounts for at least
90% of the metal damage by corrosion [36, 37]. The engineering alloys such as
stainless steel and aluminium alloys, which form protective passive films on the
surface are often susceptible to localized breakdown resulting in accelerated
dissolution of the underlying metal. A pit may be described as a cavity on metal
surface with the diameter equal to or less than depth. The pits formed on the metallic
surfaces are sometimes isolated or so close together that they look like a rough
surface. Pits are difficult to detect and causes equipment to fail with only a small
percentage weight loss of entire structure. Pitting is very difficult to predict under
laboratory test conditions because some pits takes longer time to show up and it is
also very difficult to measure quantitatively and compare the extent of pitting as
number of pits and their depth varies under similar condition.
1.5.4 Stress corrosion cracking (SCC)
Stress corrosion cracking (SCC) involves formation of cracks caused due to
simultaneous action of tensile strength and corrosive environment. The metal may be
virtually unattacked over most of the surface, but fine cracks progress through the

CHAPTER 1
11
metal. Stress corrosion cracks give the appearance of a brittle mechanical fracture.
Many investigators have specified all cracking failures occurring in corrosive
mediums as stress corrosion cracking, including failures due to hydrogen
embrittlement. The two classic cases of stress corrosion cracking are “season
cracking” of brass, and the “caustic embrittlement” of steel. Season cracking refers to
the stress-corrosion cracking failure of brass cartridge cases. The standard austenitic
stainless steels such as AISI 304 and 316 are prone to stress corrosion cracking in
chloride containing environments [38, 39]. Metal composition, metal structure,
temperature, stress and corrosive environment are the deciding factors for the extent
of stress corrosion.
1.5.5 Galvanic or two metal corrosion
When two dissimilar metals were immersed in a conductive solution
connecting with a circuit, the potential difference produces electron flow between
them. Corrosion of less resistant metal increases and attack on more resistant metal
decreases. The less resistant metal becomes anode and other become cathode. The
cathodic metal undergoes less or no corrosion. The difference in potential, common
electrolyte and common circuit leads to formation of galvanic cell and because of
dissimilar metals and electric current this form of corrosion is known as galvanic
corrosion. The galvanic current flow is due to potential developed between two
dissimilar metals. The seriousness of galvanic corrosion depends upon the potential
difference between the metals, geometry of metals, and type of electrolyte in contact
and polarization behavior of metals.
1.5.6 Intergranular corrosion
Localized attack at, and adjacent to grain boundaries with relatively little
corrosion of grains is known as intergranular corrosion or inter crystalline corrosion.
The segregation of impurities at the grain boundaries or enrichment/depletion of one
of the alloying elements in the grain boundary areas leads to intergranular corrosion.
It is a process occurring preferentially at grain boundaries, usually with slight or
negligible attack on the adjacent grains. The chromium is added to stainless steel to
improve corrosion resistance but its depletion along the grain boundaries leads to
intergranular corrosion. Due to such type of corrosion alloy loses its strength and
disintegrates.

CHAPTER 1
12
1.5.7 Selective leaching
It is a type of corrosion in which one of the element of alloy is removed
leaving behind the elements that are more resistant to the particular environment.
Removal of zinc from alpha brasses is one of the perfect example of selective
leaching. Overall dimensions of the metal alloys do not change unusually. Depending
upon the element leached from the surface this type of corrosion is also known as
dezincification, or decobaltification, or decarburization, or dealuminumification.
Corrosion inhibitors have been used in the inhibition of dezincification of brasses.
Dezincification can also be minimized by reducing the aggressiveness of the
environment or by cathodic protection or by adding small amount of arsenic,
antimony, phosphorus, or tin.
1.5.8 Erosion corrosion
Erosion corrosion is the acceleration or increase in rate of deterioration or
attack on metals surface because of relative movement between a corrosive fluid and
the metal surface. The rapid movement or flow of the medium results in mechanical
wear. The metal is removed from the surface in the form of dissolved ions or in the
form of solid corrosion products, which are mechanically swept from a surface.
Erosion corrosion of a metal appears in the form of grooves, gullies, rounded holes,
valleys and usually exhibits a directional pattern. Erosion corrosion depends upon
nature of the surface films formed on the metal surface, velocity of the moving fluid,
amount of turbulence in the liquid, impingement, the galvanic effect, chemical
composition, hardness and corrosion resistance.
1.6 Corrosion Prevention and Control
The corrosion prevention and control are both issues used to describe the
procedures necessary to provide effective corrosion maintenance. The corrosion
control involves the application of engineering principles and procedures to minimize
corrosion to an acceptable level by the most economical method. Willis Rodney
Whitney developed the electrochemical nature of corrosion, which led to the modern
methods of corrosion control. Various methods to protect metals or to reduce rate of
corrosion are listed below [34]:
Proper material selection

CHAPTER 1
13
Proper design
Environmental control
Use of inhibitors
Cathodic protection
Anodic protection
Protective coatings and linings
1.6.1 Proper material selection
The selection of proper materials is critical to preventing many types of
corrosion failures. The method involves selection and use of high corrosion resistance
materials related to particular environment to enhance the lifespan of a structure. The
choice of a corrosion resistant material is quite complicated and is accomplished in
several stages. However, cost and many other considerations does not always permit
the use of corrosion resistant materials.
1.6.2 Proper design
Corrosion can be controlled up to significant extent by appropriate system
design. The mistakes in plant design are the most frequently cited cause (58%) of
corrosion failure in chemical process industries. Design includes the consideration of
many factors, such as material selection, process and construction parameters,
geometry for drainage, electrical separation of dissimilar metals, sealing of crevices,
and corrosion allowance.
1.6.3 Environmental control
Alteration in environmental conditions can somehow lower the corrosion rate.
However, this method of corrosion control is limited to closed systems. Lowering the
temperature of the system may cause a pronounced decrease in corrosion rate,
however, in some cases increase in temperature leads to better protection. Decreasing
the velocity of corrosive media lowers the corrosion although there are some
exceptions. Very high velocities should always be avoided. Removing the oxidizing
agents or oxygen from the surroundings protect the under lying metals.

CHAPTER 1
14
1.6.4 Use of corrosion inhibitors
The application of corrosion inhibitors is another prevalent method employed
for corrosion control in closed systems. The method is quite effective, practical and
economical. An inhibitor is a chemical substance which when added in small
concentration to a system, effectively decreases the corrosion rate [40].Inhibitors
protect the metal either by changing the characteristics of the environment, resulting
in reduced aggressiveness [41] or by adsorption of a thin film onto the surface of a
corroding material or by inducing the formation of a thick corrosion product. They
may be anodic or cathodic or mixed type depending upon their ability to interfere with
cathodic, anodic or both cathodic and anodic reaction. They may be classified
according to their composition or mechanism of action. Inhibitors are often easy to
apply and offer the advantage of in-situ application without causing any significant
disruption to the process.
1.6.5 Cathodic protection
The method of cathodic protection is an electrochemical technique used to
protect a wide variety of immersed and buried facilities and infrastructure, as well as
reinforced concrete structures. However, the method is in practice much before the
science of electrochemistry was developed and Sir Humphrey Davy for the first time
suggested cathodic protection in 1824 [42]. A cathodically protected metal can be
maintained in a corrosive environment without deterioration for an indefinite time.
There are two methods to protect the metal from corrosion cathodically, either by
galvanic coupling or by external power supply. In galvanic coupling more anodic
metal is coupled with metal to be protected. The anodic metal sacrifices itself to
protect the metal connected with; therefore it is also known as sacrificial anode
method. Cathodic protection with sacrificial anode is used to protect underground
pipelines. The impressed current method or protection by external power supply is
widely used technique to protect the marine ships and buried pipelines. In this method
an external dc supply is connected to metal to be protected. The negative terminal of
power supply is connected to the metal and positive terminal to an inert auxiliary
anode. The circuit connecting metal to anode and anode itself are to be insulated to
prevent leakage.
CHAPTER 1
15
1.6.6 Anodic protection
Anodic protection method is relatively new as compared to cathodic one and
was first suggested in 1954 by Edeleanu [43]. Anodic protection is an electrochemical
method of controlling corrosion but is based on the phenomenon of passivity.
Passivity is a condition in which a piece of metal, because of an impervious covering
of oxide or other compound, has a potential much more positive than that of the metal
in the active state. In this process a layer of protective film is formed on the metal
substrate by use of external anodic current. Though anodic current tend to increase the
dissolution rate of metals and decrease hydrogen evolution but if carefully controlled
anodic current is applied they are passivated and rate of dissolution of metal
decreases. However, the method is applicable to metals having active passive
transitions like nickel, titanium, iron, chromium and their alloys. The primary
advantages of anodic protection is its applicability in extremely corrosive
environments and its low current requirements. This provides slight advantage over
cathodic protection. In this method a potentiostat is required, which maintains metal at
a constant potential with respect to reference electrode.
1.6.7 Protective coatings and linings
To reduce the corrosion rate and protect the underlying material, coating of
metal surface is one of the most widely used technique nowadays. The protective
coatings give long terms protection under a broad range of corrosive conditions,
extending from atmospheric exposure to full immersion in strongly corrosive solution.
The coatings when applied over metal surface act as a physical barrier and cut off the
contact between corrosive environment and the base metal. The coatings are often
applied in conjunction with cathodic protection systems to take care of any damage
caused to the coating material. Galvanization is one of the most common known
example of protective coating. The methods of coatings application include: electro
deposition, flame spraying, cladding, hot deposition, vapor deposition, diffusion and
chemical conversion. A protective coatings provide little or no strength to the metal
surface, however, it maintains integrity and strength of underlying metal by protecting
it against corrosion.
CHAPTER 1
16
1.7 Conducting Polymers
1.7.1 Introduction
The organic polymers that conduct electricity are called conducting polymers.
The basic property which differentiates metals with conventional polymers is the
electrical conductivity. In case of metals the electrical conductivity is in order of 104-
106 S cm-1 for metals, whereas for polymers the value does not exceed 10-14 S cm-1.
The conventional polymers are viewed as insulators (good insulators such as teflon
and polystyrene have conductivity value close to 10-18
S cm-1) whereas metals are
conductors (good conductors such as Cu and Ag have conductivities close to 106
S cm-
1). The idea of producing polymers showing electrical conductivity identical to that of
metals, has always fascinated and engaged the researchers worldwide. The same was
fulfilled in 1977 when it was discovered that a polymer, polyacetylene, can be made
conductive almost like a metal. In the study it was observed that oxidation with
chlorine, bromine or iodine vapour made polyacetylene films 109 times more
conductive than they were originally [44]. Treatment with halogen was called
“doping” by analogy with the doping of semiconductors. The “doped” form of
polyacetylene had a conductivity of 105 S m-1, which was higher than that of any
previously known polymer. Polyacetylene was already known as a black powder
when it was prepared in 1974 as a silvery film from acetylene, using a Ziegler-Natta
catalyst. But despite its metallic appearance it was not a conductor. The discovery of
metallic conductivity in polyacetylene in the 1970s by Shirakawa, Hegeer and
MacDiarmid lead to their 2000 noble prize in chemistry. However, one of the
drawbacks of conducting polyacetylene was its instability in air. This became a
limiting factor in its applications and led to efforts to discover other polymers,
exhibiting identical properties.
A key property of a conductive polymer is the presence of conjugated double
bonds along the backbone of the polymer. In conjugation, the bonds between the
carbon atoms are alternately single and double. Every bond contains a localized
“sigma” (σ) bond which forms a strong chemical bond. In addition, every double bond
also contains a less strongly localized “pi” (π) bond which is weaker. However,
conjugation is not enough to make the polymer material conductive. In addition,
charge carriers in the form of extra electrons or “holes” have to be injected into the

CHAPTER 1
17
material. A hole is a position where an electron is missing. When such a hole is filled
by an electron jumping in from a neighboring position, a new hole is created and so
on, allowing charge to migrate a long distance. The conductivity of polymers depends
upon the method of synthesis, purification and isolation techniques and physical
treatment of the polymers [45, 46]. Presence of oxygen and moisture also affects the
conductivity of polymer [47]. With increase in crystallinity of the polymer its
electrical conductivity increases. Dopant also affects the conductivity of polymers as
their concentration plays a vital role. The nature of dopant plays an important role in
the stability of conducting polymer.
Though the instability of polyacetylene in air was a limiting factor in its
applications but this spawned efforts to discover other polymers that exhibit similar
properties. During the last four decades, the researchers, through the simple
modifications of ordinary organic conjugated polymers, have succeeded in
synthesizing polymers with high electrical conductivity. These polymer system,
which combined the electrical properties of metals with advantages of polymers such
as lighter weight, easy workability, resistance to chemical attack, and lower cost have
found wide application as anticorrosion materials. With their wide range of
applications extending from most common consumer goods to highly specialized
applications these polymers are being called as the materials of 21st century. Today
many polymers are known having good conductivity and easy processibilty.
Polyaniline, polypyrrole, polythiophene, poly (p-phenylene sulphide), polyfuran and
their derivatives are the most common known examples of conducting polymers
shown in Figure. 1.1.
1.7.2 Synthesis and Doping of Conducting Polymers
The following methods are used to synthesize conducting polymers.
1. Chemical synthesis of the polymer and its subsequent doping (a) with
oxidizing/ reducing agents and (b) by an electrochemical method.
2. Electrochemical polymerization followed by doping with desired dopant in a
single operation.
The method of polymerization depends upon the nature of monomer. Though
doping of polymers by chemical method is a popular option and has often been used,
electrochemical doping is emerging as the preferred method in many applications as it

CHAPTER 1
18
provides a potentially highly controllable and reproducible method for investigation
of the doping process. The conducting heterocyclic polymers such as polypyrrole,
polythiophene, polyfuran and their derivatives can be obtained in a single step from
their monomers by electrochemical polymerization and simultaneous doping with the
dopant. The obtained polymers are more pure and homogeneous.
1.7.3 Applications of Conducting Polymers
Conducting polymers, because of their unique combination of physical and
chemical properties, possibility of both chemical and electrochemical synthesis,
distinct electronic properties, diversity, processing advantages of conventional
polymers and potentially low cost, have drawn the attention of scientists and
engineers for various application possibilities like batteries, capacitors, transistors,
photovoltaic cells, light-emitting diodes, aircraft fuselage, and biochemical analysis,
film forming corrosion inhibitors and as anticorrosion coatings to protect the metallic
substrates [48, 49]. Some of the important applications of conducting polymers are as
follows:
Storage batteries
Sensors (Biosensors, pH-sensors, Gas sensors)
Electrochromic displays
Actuators
Non-linear optics
Drug delivery
Adhesives
Corrosion protection
1.7.4 Application of conducting polymers in protection against corrosion
The most cost effective measure that can be taken for corrosion control is to
protect the structure with a protective coating. The traditional protective coatings,
which have been applied to secure steel from corrosion in aggressive environments
are organic coatings consisting of paints, plastics or organic resins. The main
strategies for corrosion control by organic coating are to act as barrier and protect
metal from oxidation and dissolution, prevent electrolyte from reaching the metal
surface or keep the concentration at low level, limit water and oxygen transport to

CHAPTER 1
19
metal, interfere with the corrosion reaction and if corrosion does begin, prevent or
reduce its spread. The use of the barrier coatings, though a popular method, has
limitations of mechanical and thermal damages, which require continuous monitoring
resulting in billing high maintenance cost. The scratches or exposed edges can allow
the access of corrodents to the base metal initiating and accelerating corrosion through
mechanism such as cathodic disbondment. Further, most of the effective corrosion
resistant paint formulations that are popular are based on toxic chromic compounds,
which need to be replaced with alternative environmentally compatible materials. In
view of the above limitations associated with traditional barrier coatings the
development and design of alternative organic coating formulations with self-healing
ability (for example, conducting polymers) have been considered in protection of
metal. Conducting polymers, which have been used either as protective coatings or
film forming inhibitors have attracted more and more attention due to their excellent
anticorrosion property and environmental compatibility [50-62]. The conducting
polymers are capable of preventing metallic corrosion even in defect areas where bare
metal surface is exposed to the corrosive environments. Among the conducting
polymers, polyaniline (PANi) [63-80], polypyrrole (PPy) [81-103] and their
derivatives are the most promising and are mainly considered for corrosion protection
owing to their good physio-chemical properties, stability and synthesis advantages.
The synthesis of conducting polymers could be realized either by chemical or
electrochemical route. The chemical deposition is more practical from application
point of view, whereas electrochemical deposition is burdensome and virtually
impossible on large structures such as pipelines, bridges, ships etc. [104]. Further, the
film forming electropolymerization at oxidizable metals has been hindered by several
thermodynamic as well as kinetic problems. The metals oxidation thermodynamic
potentials are significantly lower than those of conducting monomers. As a
consequence, the metallic electrode subjected to electropolymerization generally
undergoes strong anodic dissolution before the oxidation potential of the monomer
can be reached, thus preventing the occurrence of electropolymerization reaction.
Conducting polymers exist in reduction non-conductive state or in oxidation
conductive state and can easily be transformed into one another depending upon the
conditions. Conducting polymers undergo redox reaction and provides counter ions
due to potential triggered by local electrochemical reactions, which act as a corrosion
inhibitor and reduces corrosion rate [105, 106]. A number of corrosion protection

CHAPTER 1
20
mechanism like barrier, inhibitor, anodic protection and mediation of oxygen
reduction offered by conducting polymers have been proposed in the literature [64-66,
107-115]. In corrosion protection by barrier mechanism a dense, adherent, low
porosity film is formed on the metal surface, which maintain a basic environment on
the metal surface and restrict the access of oxidants and preventing oxidation of the
metal surface. The less porous the conducting polymer layer the better is the barrier
effect and lower is the transport rate of O2 and H2O in to the polymer. The most
curious aspect regarding the corrosion protection offered by conducting polymers
reported in the literature are studies confirming protection when deliberate defects
were introduced into the coatings to expose the bare metal. These studies confirmed
the operation of anodic protection mechanism in addition to barrier mechanism. In
presence of conducting polymers the polymer/metal interface is reported to be
modified to produce passivating oxide layers and occurrence of charge transfer
reaction between the polymer and the metal. The studies support the anodic protection
mechanism and reports of significant ennoblism in presence of conducting polymer
coatings. The passivation of steel is possible when the surface potential and pH of the
aqueous medium are sufficiently high. A conducting polymer coating due to its redox
nature could create such a passivation at the coating/steel interface. The coating
potential shifts the steel surface potential towards the noble direction. However, there
have been considerable variation in the reported shift in the corrosion potential, which
highlight the composition of coating and method of application, nature of electrolyte
and substrate preparation on corrosion protection offered by conducting polymers. For
example, it has been shown that emeraldine base (EB) form of PANi is more superior
in corrosion protection as compared to emeraldine salt (ES) form [67, 68].The reason
for the difference in performance was not clear until Spink et al [74] carried out a
comparative study on the anticorrosive performance of PANi coatings in the form of
both ES and EB with epoxy coatings on carbon steel in a saline solution. Epoxy
coating show less dissolution rate as compared to that of EB and ES. Both ES and EB
coatings show small periods of reduced corrosion rates. EB generates a highly
alkaline environment favoring the formation of passive layer whereas ES creates a
mildly acidic environment in which the formation of passive oxide is less favorable.
In sodium chloride solution it is non-conducting EB form of PANi that provides the
best protection [65, 68], whereas in HCl it appears that it is conducting ES form
which provide the better protection [70], with the undoped non-conducting form

CHAPTER 1
21
having poor adhesion [71]. The anodic protection of steel by conducting PANi-based
paint coating has been shown in Figure.1.2 [80].
The controlled inhibitor release (CIR) model suggests that the oxidized and doped
form of certain conducting polymers such as PANi when applied to base metal
substrate, release the anion dopant upon reduction resulting from coupling to the base
metal through defects in the coating. Hence, defects in the coatings drive release of
inhibitor and constitutes the smart corrosion inhibiting coatings. The CIR mechanism
for a metal M coated by conducting polymer (CP) layer such as PANi doped with an
anion, A- which act as corrosion inhibitor has been shown in Figure. 1.3 [57].
In spite of successful application of conducting polymers in protection against
corrosion there have been a number of challenges associated with their development
on the metallic surfaces. One of the challenges in developing conducting polymer
coatings in general, has been to overcome the difficulty in processing these materials.
The general lack of solubility and fusibility of these materials make the formation of
coating on active metals difficult and prohibit them as replacement for traditional
coating systems. The charge stored in the polymer layer (used to oxidize the base
metal and produce the passive layer) can be irreversibly consumed during the
system’s redox reactions and hence the protective properties of the polymer coating
may be lost with time. Further, the hydrophilic and porous nature of conducting
polymer film may lead to serious drawbacks for anticorrosive applications under
severe conditions. Also, the extent to which the conducting polymers can be used is
limited due to the exclusivity of monomers that are essential for their synthesis. To
overcome these limitations, different synthesis approaches have been attempted.
These include the synthesis of conducting polymers as, bi-layers [116-128],
copolymers/terpolymers [50, 129-133], composites and nanocomposites [134-145].
1.7.5 Applications of conducting copolymers/terpolymers in protection against
corrosion
The synthesis of copolymers/terpolymers between different monomers has
been utilized to improve the physical-chemical properties of the conducting polymer
films. The addition of monomers with hydrophobic groups could lower the water up
CHAPTER 1
22
taking rate or another group may enhance the stability and adherence and thus help to
prepare new polymers with inbuilt tailor-made properties.
Copolymer film of aniline and o-anisidine was synthesized on Cu electrode by
electrochemical method in sodium oxalate solution [146]. 3.5% NaCl solution was
employed as corrosive medium to evaluate the corrosion protection behavior of
copolymer film using EIS, free corrosion potential measurements and anodic
polarization curves. The results showed strong adhesion, uniformity and homogeneity
of synthesized copolymer film with excellent corrosion protection for longer exposure
time. Bereket et al [147] synthesized conductive coating films of homopolymer PANi,
poly(2-iodoaniline) and poly(aniline-co-2-iodoaniline) via electropolymerization
synthesis route on 304 stainless steel and studied their corrosion protection behavior
in 0.5 M HCl solution. The characterization studies (FTIR and UV-visible
spectroscopy) reveal the difference in morphology of homopolymers and copolymer.
The results show that after 48 h of immersion the coatings offered protection behavior
greater than 75%, in which copolymer coating show maximum protection from
corrosion. Hur et al [148] investigated the anticorrosive behavior of homopolymers,
PANi, poly(2-chloroaniline) and copolymer poly(aniline-co-2-chloroaniline) on 304 L
stainless steel in 0.5 M HCl solution. The copolymer coating of poly(aniline-co-2-
chloroaniline) and homopolymer PANi show both barrier and anodic protection,
whereas poly(2-chloroaniline) only show barrier protection. Copolymer coatings
provide superior protection (more than 80%) after 48 h of immersion. Copolymer of
aniline and 2-toludine, poly(aniline-co-2-toludine) and respective homopolymers were
synthesized electrochemically on stainless steel [149]. The anticorrosive behavior of
synthesized homopolymers and copolymer was evaluated in 0.5 M HCl solution. The
coating of copolymer was found to provide better protection as compared to
homopolymers coating. The superior protection of copolymer was attributed to better
compactness of resulting copolymer film. Tueken et al [150] successfully countered
the water uptake problem of PPy by synthesizing copolymer of pyrrole and N-methyl
pyrrole on mild steel. It was observed that copolymer coatings provide better
protection against corrosion as compared to either of the PPy or poly(N-methyl
pyrrole). Srikant et al [151] separately synthesized homopolymer PANi, poly N-
methylaniline and their copolymer poly (aniline-co-N-methylaniline) on mild steel
and studied corrosion behavior in 0.1 M HCl. Copolymer coatings were observed to
show superior protection capability than their respective homopolymers coatings.

CHAPTER 1
23
Yalcinkaya et al [152] copolymerized pyrrole with substituted aniline. The copolymer
of aniline and o-toludine was synthesized in different monomer ratios by
electropolymerization technique on mild steel. The anticorrosive studies in 3.5% NaCl
solution show best protection efficiency for copolymer poly(pyrrole-o-toluidine) with
feed ratio 8:2. In continuation to their work, they synthesized terpolymer of pyrrole,
o-anisidine, and o-toluidine on carbon steel [153]. Characterization studies reveals
completely different morphology and other structural properties of terpolymer when
compared to PPy or copolymer films. The anticorrosive studies suggested excellent
protection offered by terpolymer coating against corrosion due to improved resistance
to water permeation and stability in severe corrosive conditions.
In a series of papers, Mobin et al [128, 154-157] have reported the synthesis,
characterizations and anticorrosion properties of conducting homopolymers,
copolymers and terpolymer coatings on low-carbon steel surfaces in different
corrosive environments. The copolymers/terpolymer were synthesized by chemical
oxidative polymerization and deposited on mild steel surface using solution
evaporation method. The copolymers/terpolymer were observed to exhibit lower
corrosion rates and more nobler shift in corrosion potential than the individual
homopolymer coatings. In a quite recent paper, Govindraju et al [158]
electrodeposited copolymer film of poly(aniline-co-pyrrole) on low nickel stainless
steel by means of cyclic voltammetry technique. The obtained copolymer was
modified with zinc particles over it by potentiodynamic cathodic sweeps. The
corrosion resistant nature of coatings in 1 M HCl solution was determined by
potentiodynamic polarization and EIS measurements. Modified poly(aniline-co-
pyrrole) film showed superior corrosion protection and exhibited low permeability to
corrodents to reach metal substrate. The improved barrier and passivation behavior is
due to the formation of pore free and adherent zinc modified poly(aniline-co-pyrrole)
film. Sambyal et al [159] synthesized poly(aniline-co-o-toluidine)/fly ash composite
by chemical oxidative polymerization. The copolymer composite coatings were
developed by loading them in epoxy resin on mild steel specimens by using an
electrostatic spray gun held at 67.4 kV potential with respect to the substrate.
Anticorrosive properties of copolymer composite coatings were demonstrated by AC
impedance, potentiodynamic polarization and open circuit potential measurements in
3.5% NaCl as corrosive medium. The results of OCP vs time measurements show
noble potential for epoxy with copolymer composite coated steel specimens as
CHAPTER 1
24
compared to epoxy coated steel. The Tafel parameters indicate low corrosion current
for coatings with 2.0 and 3.0 wt% loading of copolymer composite in 3.5 wt% NaCl
solution. The salt spray test (carried out with 5% NaCl) reveals significantly less
extended corrosion along the scribe mark for epoxy coatings with 2.0 and 3.0 wt%
loading of copolymer composite.
1.7.6 Applications of conducting polymer nanocomposites in protection against
corrosion
Another interesting alternative to improve the performance of conducting
polymers is to consider conducting polymer nanocomposite systems. The nano-
composites based on conducting polymer matrix have been extensively studied for
application in optoelectronic devices, batteries, sensors and electronic display devices.
The focus is now shifting from synthesis to manufacture of useful structures and
coatings having greater wear and corrosion resistant. Nanoparticle additives are
attractive materials for corrosion protection because of their high surface areas allow
them to function as carriers for molecular corrosion inhibitors and their small particle
sizes often generate novel chemisteries not observed in bulk materials that permit the
design of triggered release mechanism[160-165]. The nanoparticles incorporated
within the conducting polymers modifies the morphology and improves the physio-
chemical properties like improved adhesion to metal surface, less porosity, stability,
better mechanical strength and easy processibilty. A number of nanoparticles such as
metal oxide nanoparticles, carbon nanotubes and graphene can be encapsulated into
conducting polymer matrix to yield conducting polymer based nanocomposite
materials [166]. The conducting polymer nanocomposites perform better when
compared with those of pure conducting polymer and show better mechanical,
physical and chemical properties, due to the combination of the qualities of
conducting polymers and inorganic particles [126, 167].
Olad and Rasouli [168] studied the effect of zinc nanoparticles on the
anticorrosive property of PANi coating on iron samples. The PANi/Zn nanocomposite
was synthesized by in situ polymerization of aniline in the presence of Zn
nanoparticles. The nanocomposite was characterized using FTIR, conductivity
measurement, cyclic voltammetry and AFM techniques. PANi/Zn nanocomposite
coating exhibited improved corrosion protection effect when compared with pure
PANi coating. The zinc present in the coating system protects the underlying iron

CHAPTER 1
25
metal by sacrificial protection. The corroded particles of zinc fills the pores and
improves the barrier protection. Polyaniline/zinc composites and nanocomposites
were prepared using solution mixing method and films and coatings of PANi/Zn
composites and nanocomposites were prepared by the solution casting method on Iron
[169]. The electrical conductivity and anticorrosion performances of both PANi/Zn
composites and nanocomposites were found to increase with the increasing zinc
loading. Also, the PANi/Zn nanocomposite films and coatings have better electrical
conductivity and corrosion protection effect on iron coupons compared to that of
PANi/Zn composite. The better protection is due to change in morphology by
nanoparticles, which improves barrier properties. Hosseini et al [170] investigated the
anticorrosive behavior of PPy and its nanocomposites with ZnO (PPy-ZnO)
electrodeposited on mild steel using open circuit potential (OCP), Tafel polarization
and EIS techniques. Pure PPy film was not found to protect the mild steel perfectly
but the coating with nano-sized ZnO (PPy-ZnO) has dramatically increased the
corrosion resistance of mild steel. EIS measurements indicated that the coating
resistance (Rcoat) and corrosion resistance (Rcorr) values for the PPy-ZnO
nanocomposite coating was much higher than that of pure PPy coated electrode. The
improved anticorrosive behavior of nanocomposite was due to the morphology of
ZnO as it was present in the form of nanorods in PPy matrix. These results concludes
that the morphology of contributing nanoparticle also affects the corrosion protection
performance of nanocomposite coatings.
Mahmoudian et al [171] successfully electrodeposited poly(N-methyl pyrrole)
(PMPy) coating on steel in mixed electrolytes of dodecyl benzene sulphonic acid with
oxalic acid in the absence and the presence ofTiO2 nanoparticles. The incorporation of
TiO2 nanoparticles affects the morphology of the polymer film significantly and
makes the TiO2 nanoparticles to be loosely piled up with PMPy, which can increase
the surface area of PMPy. The increased ability of the PMPy/TiO2 NPs to interact
with the ions liberated during corrosion reaction of steel in NaCl solution is due to the
increase of the area of the synthesized PMPy with the presence of the nanoparticles.
The interaction of TiO2 nanoparticles with PMPy decreases the water uptake of
nanocomposite coating and increases the barrier effect. In continuation to this work,
Mahmoudian et al [172] chemically polymerized pyrrole in the presence of Sn-doped
TiO2 nanoparticles on steel. The EIS results confirmed better performance for
CHAPTER 1
26
corrosion protection for the PPy/Sn-doped TiO2 NCs in comparison with PPy/TiO2.
The authors attributed two reasons for the better performance of PPy/Sn-doped TiO2
NCs: (i) the increase of area of synthesized PPy in the presence of Sn-doped TiO2
NPs can increase its ability to interact with the ions liberated during the corrosion
reaction of steel in the presence of NaCl and (ii) the increase of the band gap for the
Sn-doped TiO2 and the action of the conduction band of SnO2 as a sink for electrons
can decrease the charge transfer through the coating and decrease the probability of
reduction reaction of O2 and H2O.Ionita et al [173] presented a computational method
based on molecular mechanics and dynamics to predict mechanical properties of
polypyrrole (PPy)/polyaminobenzene sulfonic acid-functionalized single-walled
carbon nanotubes (CNT-PABS) and PPy/carboxylic acid-functionalized single-walled
carbon nanotubes (CNT-CA) composites. Experiments like potentiodynamic
polarization measurements, SEM and TEM were carried out to assess the
anticorrosive properties of the PPy film and CNT-PABS and CNT-CA PPy reinforced
composite coatings electrodeposited on carbon steel in 3.5% NaCl solution. The
mechanical properties of PPy, PPy/CNT-PABS and PPy/CNT-CA films were
investigated using computational tools. The results of investigation clearly confirmed
that the CNT-PABS and CNT-CA are properly dispersed in the composite coatings
and have beneficial effect on mechanical integrity. Further, the anticorrosive
properties of the composite coatings was observed to be significantly higher than the
pure PPy coating. The synthesis and corrosion protection effect of emeraldine base
PANi/clay nanocomposite as a barrier pigment in zinc rich ethyl silicate primer was
reported by Akbarinezhad et al [174]. The anti-corrosion performance of modified
and unmodified primers chemically deposited on carbon steel was evaluated using
OCP and EIS in 3.5% sodium chloride solution for a period of 120 days. The
modified primer was found to show higher barrier properties than unmodified primer.
OCP of modified primer was also higher than the original primer due to the
passivation and barrier effects of PANi/clay nanocomposite. The results of the studies
revealed that the performance of primer improved strongly in presence of PANi/clay
nanocomposite. Mostafaei et al [175] synthesized nanocomposite of PANi containing
ZnO nanorods in presence of camphosulfonic acid (CSA) by chemical oxidative
polymerization using ammonium peroxydisulfate as oxidant. Authors visualized that
the synthesized nanocomposite may find application in marine paints as an
anticorrosive and antifouling additives. They stated that in this regard further research

CHAPTER 1
27
is in progress in their laboratory. In continuation of the above work Mostafaei et al
[176] synthesized series of conducting polyaniline PANi-ZnO nanocomposites
materials has been successfully synthesized by via chemical oxidative polymerization
method of aniline monomers in the presence of ZnO nanorods with camphor-sulfonic
acid (CSA) and ammonium peroxydisulfate (APS) as surfactant and oxidant,
respectively. Tetraethylenpentamine (TEPA) was used as a solvent to dissolve the
resultant nanocomposites. Epoxy was also added to the mixture and nanocomposite
coatings on carbon steel plate was obtained by solvent evaporation method.
Electrochemical impedance spectroscopy (EIS) and chronopotentiometry at open
circuit potential (OCP) were used to study the anticorrosive behavior of the epoxy
binder blended with PANi-ZnO nanocomposites in 3.5% NaCl solution at a
temperature of 25◦C. It was observed that the epoxy coating containing conducting
PANi-ZnO nanocomposites exhibits excellent corrosion resistance and provide better
barrier properties in the paint film in comparison with pure epoxy and epoxy/PANi
coatings. In the case of conducting coatings, the OCP was shifted to the noble region
due to presence of PANi pigments. Surface morphological studies shows crack free,
uniform and compact nanocomposite coating system. Presence of ZnO nanorods
significantly improves the barrier and corrosion protection performance of the epoxy
coating due to the flaky shaped structure of the PANi-ZnO nanocomposites.
Polyaniline/f-CNT nanocomposite coatings were electrochemically synthesized by
cyclic voltammetry method with different CNTs feed ratio (1, 3 and 5 mg/L) [177].
ATR-IR and Raman analysis confirmed the presence of f-CNTs in PANi matrix.
Electrochemical studies (potentiodynamic polarization and EIS analysis) carried out
in 3.5% NaCl showed a remarkable improvement in corrosion resistance behavior on
mild steel. Water contact angle analysis shows that an increase in concentration of f-
CNTs in polymer matrix increases the hydrophobic nature of composite coating
resulting in more resistance against corrosion in aqueous environments. In a recent
publication Layeghi et al [178] first synthesized polyaniline-zinc oxide (PANi-ZnO)
nanocomposite by chemical oxidative polymerization of aniline in the presence of
ZnO nanoparticles and then, 5%, 10% and 15% solutions of PANi–ZnO
nanocomposites were mixed with a solution of polystyrene (PS) in tetrahydrofuran
(THF) to obtain PANi-PS-ZnO nanocomposites. The anticorrosive behavior of
nanocomposite coatings obtained on iron coupon by solvent casting method was
analyzed by open circuit potential (OCP) and Tafel techniques in 3.5% NaCl solution.

CHAPTER 1
28
The obtained results implies the superior anticorrosive nature of PS-[PANi-ZnO 10%]
nanocomposite coating as compared to that of pure PANi, PANi–ZnO nanocomposite,
PANi-PS composite and two other PANi-PS-ZnO nanocomposite coatings. Pagotto et
al [179] successfully synthesized polyaniline (PANi) and PANi/nanotubes-TiO2 by
chemical oxidative polymerization method using ammonium persulfate as an
oxidizing agent. NMP was used as a solvent to obtain coatings on carbon steel by
solvent casting method. The potentiodynamic polarization and free corrosion potential
measurements were carried out in a 3% NaCl medium whereas salt spray tests were
performed with a 5% NaCl solution at 35°C to determine the corrosion resistance
behavior of composite coatings. Results exhibit best protection of PANi when a layer
of 2 μm was applied on steel samples, which gradually decreases with increase in
thickness of coating layer due to development of mechanical tension resulting in
increase in porosity. However, the addition of TiO2 nanotubes to PANi coating matrix
demonstrates an interesting ability to obstruct this undesirable mechanical effect,
showing a good anticorrosive behavior and lower porosity when thickness layer is
increased.
Graphene has attracted the interest of numerous researchers due to its useful
properties and wide area of applications [180-182]. Graphene, a two-dimensional
monolayer of sp2 bonded carbon, has outstanding properties such as excellent
electrical conductivity, useful mechanical properties, excellent chemical inertness,
high thermal conductivity, high surface area, high aspect ratio and high transmittance.
Graphene has been reported to provide an impermeable barrier as its surface forms a
natural diffusion barrier physically isolating metals from the reactants [183, 184]. Due
to the above attributes graphene has potential as an ultrathin protective coating
especially in protection of metals from degradation in marine or saline environment.
Sreevatsa et al. [185] provided a qualitative description of graphene as an ionic barrier
for steel, but the electrochemical tests did not show considerable improvement in
corrosion resistance. Kirkland et al. [186] discussed the possibility of graphene as a
corrosion barrier based on commercially available graphene-coated Cu that probably
did not have the desired surface coverage. The graphene coating was observed to
suppress the cathodic reaction rate in an aerated chloride solution. However, the
change in the anodic reaction rate, which represents the principal reaction for
electrochemical dissolution of Cu, was insignificant. Prasai et al. [187] have reported
CHAPTER 1
29
that graphene coating improves the corrosion resistance of Cu by seven times.
However, the electrochemical experiments were performed in a less aggressive
electrolyte. Raman et al. [188] demonstrated that tailored graphene coatings on Cu
can dramatically decrease anodic and cathodic current densities to protect it from
electrochemical degradation in an aggressive electrolyte. The authors showed an
increase in the resistance of the metal to electrochemical degradation by one and half
orders of magnitude. The elaborate electrochemical characterization in aggressive
chloride environment showed impedance of Cu increasing dramatically and the
anodic and cathodic current densities of the coated Cu becoming nearly 1-2 orders of
magnitude smaller when coated with graphene. These observations are
counterintuitive as graphite in contact with metals increases metallic corrosion. The
results of the studies brought paradigm changes in the development of anti-corrosion
coatings using conformal, ultrathin graphene films.
In recent years, research into graphene-based materials, which includes
graphene, graphene oxide (GO), reduced graphene oxide (rGO), and graphene-
embedded polymers, has demonstrated potential for applications in anti-corrosive
coatings [183, 189-191] graphene oxide nano paints, [189, 192]. Moreover, both GO
and rGO exhibit an excellent antibacterial activity [193-195]. GO sheets are a material
of particular interest due to their unique properties, including gram-scale production at
very low cost, biocompatibility, fluorescence, and the potential for controlling the
properties through the oxidation level, which make them a candidate for a wide range
of applications [196-199]. GO coatings have been reported for corrosion inhibition of
aluminum current collectors in Li-ion batteries [190]. In a recent study
Krishnamoorthy et al. [195] have developed a multifunctional GO-based nano paint
by incorporating GO sheets in an alkyd resin with suitable non-toxic additives for
corrosion resistance and antibacterial applications. The prepared GO nano paint
exhibited good corrosion-resistant behavior in both acidic and high-salt-content
solutions as examined by the immersion and electrochemical corrosion tests.
CHAPTER 1
30
1.8 Scope and Objectives of the Work Presented in the
Thesis
The exposure of metals to environmental and service conditions often results in
failure due to oxidation and corrosion. Various types of coatings based on ceramics,
metals, and polymers have extensively been used for protecting metals against
corrosion. The discovery of conducting polymers has shown the way to develop
anticorrosive coatings, which are non-toxic, eco-friendly, environmentally stable and
binds strongly on the metal surface. The conducting polymers based coatings are
excellent replacement of toxic chromate based anticorrosion coatings. In spite of
successful application of conducting polymers in protection against corrosion there
have been a number challenges associated with their development on the metallic
surfaces. The challenges include: lack of solubility and fusibility, exclusivity of
monomers, deterioration in the protective properties with time and hydrophilic and
porous nature of conducting polymer films. To overcome these limitations, different
synthesis approaches have been attempted, which include the synthesis of conducting
polymers as, bi-layers, co- and ter-polymers, composites and nanocomposites. The
development of conducting polymer nanocomposites on metal substrates has received
considerable attention in the recent past. The incorporation of nanoparticles within the
conducting polymers modifies the morphology and improves the physio-chemical
properties like improved adhesion to metal surface, less porosity, stability, better
mechanical strength and easy processibilty. Further, the conducting polymer
nanocomposites coatings developed on the metal substrate either chemically or
electrochemically increases the passivation property of the metal substrate by shifting
the corrosion potential towards the direction of more noble metal and thus enhancing
their anticorrosive nature to a greater extent.
Considering the above mentioned critical review on conducting polymer based
anticorrosion coatings the proposed research work aims to focus on the following
objectives:
1. To develop some anticorrosive conducting homo, co- and ter-polymer based
nanocomposites coatings on commercially obtained mild steel.
2. To obtain data regarding the corrosion behavior of conducting polymer
nanocomposites coated mild steel in major corrosive environments.
CHAPTER 1
31
3. To study the protective behavior of coatings by conducting electrochemical
tests.
4. To study the performance of coated steel during atmospheric exposure.
5. To carry out mechanical testing on the coated steel samples under controlled
laboratory conditions.
STATEMENT OF THE WORK PRESENTED IN THE THESIS
The work presented in this thesis deals with the corrosion protection of mild
steel using some nanocomposites of conducting polymers as coating material
synthesized under research laboratory conditions. A number of nanocomposites of
conducting polymers, which include homopolymer nanocomposites, copolymers and
their nanocomposites and a terpolymer along with its nanocomposite were
synthesized by chemical oxidative polymerization and were deposited over mild steel
surface via solution casting method. Fourier Transform Infrared (FTIR) spectroscopy,
X-ray diffraction (XRD), scanning electron microscopy (SEM) and transmission
electron microscopy (TEM) were used to characterize the synthesized polymers and
their nanocomposites. The anticorrosive properties of the coatings has been
investigated by conducting various corrosion tests which includes: electrochemical
impedance spectroscopy (EIS), potentiodynamic polarization measurements, free
corrosion potential (open circuit potential) measurements and immersion test. SEM
analysis was used to evaluate the surface morphology of the coatings prior to and after
immersion in corrosive solutions. The breakup of the work contained in various
chapters is as follows:
Chapter I
This chapter is devoted to general introduction, which deals with the
fundamentals of corrosion. It includes the concept of corrosion, its definition,
importance of corrosion, laboratory corrosion measurement techniques, types of
corrosion and methods of corrosion control. Some basics of conducting polymer along
with literature survey on the applications of conducting polymers as anticorrosive
coatings has been included in the later part of the introduction.
The thesis includes literature survey from the selected research papers,
reviews and reports published on the subject during the last three decades. Special

CHAPTER 1
32
emphasis has been laid to the work which has direct or indirect bearing on the studies
presented in this thesis. It might be possible that some results of important studies
have been left unquoted quite inadvertently yet there was absolutely no intension to
undermine those works.
Chapter II
This chapter deals with the experimental details, which includes materials and
methods used during the experimental work. The chapter also contains the details
synthesis procedure along with the characterization and deposition of conducting
polymers on mild steel. The conducting polymers synthesized and deposited on steel
include: homopolymers nanocomposites [PANi/ZnO, poly(2, 3-xylidine)/ZnO,
poly(2-pyridylamine)/ZnO]; copolymers [poly(aniline-co-o-anisidine), poly(aniline-
co-N-ethylaniline), poly(aniline-co-2, 3-xylidine)] and their nanocomposites [poly
(aniline-co-o-anisidine)/ZnO, poly (aniline-co-N-ethylaniline)/ZnO, poly(aniline-co-2,
3-xylidine)/ZnO]; terpolymer [poly(aniline-co-2-pyridylamine-co-2, 3-xylidine)] and
its nanocomposite [poly(aniline-co-2-pyridylamine-co-2, 3-xylidine)/ZnO] and
nanocomposite involving pyrrole (Py), graphene nano sheets (GNS), rare earth
elements (RE3+= La3+, Sm3+, Nd3+) and dodecyl benzene sulfonic acid (DBSA)
[(PPy/GNS/DBSA), (PPy/GNS/RE3+/DBSA)] along with PPy/DBSA composite.
Chapter III
This chapter describes the results of the investigations concerning with the
corrosion protection performance of chemically synthesized copolymer
nanocomposite poly(aniline-co-o-anisidine)/ZnO and pure copolymer poly(aniline-co-
o-anisidine) coatings on mild steel. The resultant copolymer and its nanocomposite
were characterized by FTIR, XRD, SEM, EDX and TEM. The corrosion protection
performance of copolymer and its nanocomposite coating was investigated in
corrosive solutions of 0.1M HCl, 5% NaCl and distilled water using immersion test,
free corrosion potential measurements, potentiodynamic polarization measurements
and atmospheric exposure tests. The surface morphology of copolymer and its
nanocomposite coatings was also evaluated using SEM, prior to and after 30 days
immersion in 0.1 M HCl.

CHAPTER 1
33
Chapter IV
This chapter deals with the studies of the corrosion behavior of chemically
synthesized copolymer, poly (aniline-co-N-ethylaniline) and its nanocomposite with
ZnO, poly (aniline-co-N-ethylaniline)/ZnO coatings on mild steel. The synthesized
polymers were characterized by FTIR, XRD, SEM and TEM techniques. The
anticorrosive properties of both copolymer and its nanocomposite coatings were
investigated in major corrosive environments by conducting various corrosion tests
which include: immersion test, free corrosion potential measurements,
potentiodynamic polarization measurements and AC impedance analysis. The surface
morphology of the coated samples immersed in 0.1 M HCl as corrosive medium,
before and after 30 days immersion has also been examined by SEM.
Chapter V
The chapter deals with the anticorrosive properties of chemically deposited
copolymer, poly (aniline-co-2, 3-xylidine) its nanocomposite with ZnO poly (aniline-
co-2, 3-xylidine)/ZnO and homopolymers PANi and poly (2, 3-xylidine) coatings on
mild steel. The synthesized polymers were characterized by FTIR, XRD, SEM and
TEM techniques. The anticorrosive properties of copolymer, copolymer
nanocomposite and homopolymers coatings were investigated in major corrosive
environments by conducting various corrosion tests which include: immersion test,
free corrosion potential measurements, potentiodynamic polarization measurements
and EIS. The surface morphology of the coated samples immersed in 0.1 M HCl as
corrosive medium, before and after 30 days immersion has also been examined by
SEM. The anticorrosion properties of nanocomposite coating was compared with
parent copolymer and individual homopolymers.
Chapter VI
The work presented in this chapter deals with the investigation concerning
with the anticorrosion performance of chemically synthesized terpolymer
[poly(aniline-co-2-pyridylamine-co-2, 3-xylidine)] and its nanocomposite with ZnO
[poly(aniline-co-2-pyridylamine-co-2, 3-xylidine)/ZnO] coatings on mild steel. FTIR,
XRD, SEM and TEM techniques were used to characterize the resultant terpolymer
and its nanocomposite. The anticorrosive behavior of terpolymer and its
nanocomposite was studied by conducting immersion test, free corrosion potential
CHAPTER 1
34
measurements, potentiodynamic polarization measurements and AC impedance
analysis in 0.1 M HCl as corrosive medium. The surface morphology of terpolymer
and its nanocomposite coating was also evaluated using SEM, before and after 30
days immersion in corrosive solution. The anticorrosive property of terpolymer and its
nanocomposite coating was also compared separately with homopolymers
nanocomposite PANi/ZnO, poly(2, 3-xylidine)/ZnO and poly(2-pyridylamine)/ZnO.
Chapter VII
This chapter deals with the synthesis of organic-inorganic nanocomposites
(PPy/GNS/RE3+/DBSA) involving pyrrole (Py), graphene nano sheets (GNS), rare
earth elements (RE3+= La3+, Sm3+, Nd3+) and dodecyl benzene sulfonic acid (DBSA).
The resultant nanocomposites were characterized by FTIR, XRD, SEM and TEM.
The synthesized nanocomposites were chemically deposited on mild steel by solution
casting method. The anticorrosive nature of polymer coatings were studied in 0.1M
HCl solution by subjecting them to various corrosion tests, which includes: AC
impedance analysis, potentiodynamic polarization measurements, free corrosion
potential measurement and immersion test. The surface morphology of coated
samples before and after immersion in corrosive solution was evaluated using SEM.
Chapter VIII
This chapter is dedicated to overall conclusions from the thesis and future plan
of work.

CHAPTER 1
35
Polyaniline, Emeraldine (PANi)
Polyaniline, Pernigraniline (PNG)
Polypyrrole (PPy)
Polythiophene (PT)
n Polyphenylene Sulphide (PPS)
n Polyfuran (PFU)
Fig. 1.1: Structure of different conducting polymers.
O
S
S
S
S
S
N
H
N
H
N
H
N
H
N
N
N
N
N
N
N
H
N

CHAPTER 1
36
Fig. 1.2: Schematic diagram of mechanism of iron passivation by PANI pigmented
paint coating on steel.
Cl-
Fig. 1.3: Controlled inhibitor release mechanism for a metal, M coated by a CP layer
such as PANI doped with an ion, A-, which acts as a corrosion inhibitor
O 2 Metal-dopant (MA n ) Complex
A –
PANI
Metal oxide
M n +
ES EM
ne
EM ES PANI
Metal oxide
M n +
M n +

Chapter 2

Materials and Methods
CHAPTER 2
37
2.1 Chemicals Used
The chemicals used throughout the experimental work were all A.R. grade
products. The make and the purity of the chemicals used throughout the experiments
are given in Table 2.1.
2.2 Preparation of Metal Specimens for the Application of
Synthesized Conducting Polymers Coatings
The specimens used for application of different synthesized conducting
polymers were press-cut from commercially obtained mild steel sheets. For
immersion tests and free corrosion potential measurements rectangular specimens of
dimension 4.0×1.5×0.13 cm were used. A hole of 1 mm diameter was made near the
edge of the specimens for hooking. For electrochemical experiments (AC impedance
and potentiodynamic polarization measurements) circular specimens with diameter 1
cm were used. The mild steel specimens were machined and abraded sequentially
with 180, 220, 320, 400, 600 and 1200 grit SiC papers. The polished specimens were
washed with double distilled water, degreased with absolute ethanol and finally dried
in warm air. Prior to the application of coatings of synthesized polymers, the mild
steel specimens were subjected to above treatment and freshly used with no further
storage. The chemical composition of mild steel (in weight %), as analyzed by optical
emission spectrophotometer, is listed in Table 2.2.
2.3 Synthesis of Nanoparticles, Conducting Polymers and
Conducting Polymers Nanocomposites
2.3.1 Synthesis of ZnO nanoparticles
ZnO nanoparticles were synthesized in accordance with the previously
described method [200]. In the typical synthesis, 0.2 M of aqueous zinc acetate
dehydrate was dissolved in 50 mL of distilled water under continuous stirring at room
temperature. 0.2 M of aqueous NaOH was added drop wise to attain pH of 12. The
solution was vigorously stirred for 2 h. The white precipitate obtained was filtered and
washed with distilled water followed by ethanol to remove the impurities. The
conversion of Zn(OH)2 into ZnO nanoparticles was carried out through complete
drying of precipitate in hot air oven at 60º C for overnight.

CHAPTER 2
38
2.3.2 Synthesis of graphene nano sheets
Graphene oxide was synthesized by modified hummer’s method following an
earlier reported procedure [201]. 1 g of graphite powder and 25 mL of concentrated
H2SO4 was added into a 250 mL conical flask under stirring conditions in an ice bath.
3 g of KMnO4 was added slowly into the above reaction mixture. The reaction
mixture was removed from ice bath to obtain the dark green solution, which was kept
stirring at 35◦C for 1 h. Later, 50 mL of water was added slowly to the reaction
mixture, the reaction mixture was kept at this temperature for another 30 min. After
that, 10 mL of 30% H2O2 and 150 mL of distilled water were added to stop the
reaction. The precipitate was centrifuged and washed by 5% HCl and ethanol for
several times and vacuum dried at 60◦C. The obtained graphene oxide was
transformed into graphene (reduced graphene oxide) by treating with hydrazine,
indicated by color change from brown to black, which was subsequently ultra-
sonicated for 4 h in ortho-dichlorobenzene to attain graphene nano sheets by liquid-
phase exfoliation method [202]. The resulting product was washed with water and
ethanol followed by vacuum drying at 50o C for 24 h.
2.3.3 Synthesis of poly(aniline-co-N-ethylaniline) copolymer and its
nanocomposite poly(aniline-co-N-ethylaniline)/ZnO
Copolymer of aniline and N-ethylaniline, poly (aniline-co-N-ethylaniline) with
monomer ratio of 50:50 was synthesized by chemical oxidative polymerization
following an earlier reported method [203]. The mixture of aniline (0.1 M) and N-
ethylaniline (0.1 M) was dissolved in 150 mL of 1 M HCl taken in a 250-mL two-
necked glass flask and placed on ice bath, maintaining the temperature 0-5ºC. 11.4 g
of APS dissolved in 1 M HCl was added drop wise to the above mixture by
continuously stirring the reaction mixture and maintaining the temperature 0-5ºC.
After complete addition of oxidant solution the resultant mixture was allowed to stir
24 h at room temperature, followed by filtration and continuous washing of
precipitate by 1 M HCl and distilled water until the filtrate become colorless. The
precipitate obtained was then neutralized in 0.1 M ammonium hydroxide solution for
24 h to obtain copolymer base. The dark blue colored copolymer base was filtered and
washed with excess of distilled water and dried in ambient air for 24 h.
CHAPTER 2
39
Poly (aniline-co-N-ethylaniline)/ZnO nanocomposite was synthesized by
dispersing ZnO nanoparticles (10% w/w based on the co-monomer content) to the
mixture of aniline (0.1 M) and N-ethylaniline (0.1 M) dissolved in 150 mL of 1 M
HCl taken in a 250-mL two-necked glass flask. The synthesis of the nanocomposite
was further continued following the identical synthesis route as described for the
synthesis of the copolymer.
2.3.4 Synthesis of poly(aniline-co-o-anisidine) copolymer and its nanocomposite
poly(aniline-co-o-anisidine)/ZnO
The synthesis of copolymer of aniline and o-anisidine, poly(aniline-co-o-
anisidine) (50:50 monomer ratio) was carried out by chemical oxidative
copolymerization following an identical procedure reported elsewhere [204]. A
mixture of 6.6 mL of aniline (0.1 M) and 8.3 mL of o-anisidine (0.1 M) were
dissolved in 150 mL of 1 M HCl taken in a 250-mL two-necked glass flask. This
solution was maintained at 0-5ºC and continuously stirred for about 1 h. Another
solution prepared by dissolving 15 g of ammonium persulfate in 50 mL of 1 M HCl
was added drop by drop to this solution. The reaction was continued for 24 h at room
temperature, after which a green precipitate was formed, which was filtered and first
washed with 1 M HC1 and then distilled water until the disappearance of the color of
the filtrate. The copolymer hydrochloride salt was subsequently neutralized in 0.1 M
ammonium hydroxide for 24 h to obtain the copolymer base. The copolymer base was
filtered and washed with excess water and left to dry in ambient air for 30 h.
Poly(aniline-co-o-anisidine)/ZnO nanocomposite was synthesized by
dispersing ZnO nanoparticles (10 % w/w based on the co-monomer content) to the
mixture of aniline (6.6 mL, 0.1 M) and o-anisidine (8.3 mL, 0.1 M) dissolved in 150
mL of 1 M HCl taken in a 250 mL two-necked glass flask. The synthesis of the
nanocomposite was further proceeded following the identical synthesis procedure
given for the synthesis of the copolymer poly(aniline-co-o-anisidine).
2.3.5 Synthesis of poly(aniline-co-2, 3-xylidine) copolymer and its
nanocomposite poly(aniline-co-2, 3-xylidine)/ZnO
Copolymer of aniline and 2, 3-xylidine, poly(aniline-co-2, 3-xylidine)was
synthesized via in situ chemical oxidative polymerization in an acidic medium by a
CHAPTER 2
40
method available in the literature [205]. In a typical procedure for the synthesis of the
copolymer with 50:50 monomer ration is as follow: A mixture of aniline (0.1 M) and
2, 3-xylidine (0.1 M) were dissolved in 40 mL of 1 M HCl solution taken in a 250 mL
two-necked glass flask. This solution was maintained in an ice-sodium chloride (2:1
wt %) bath at 0-5°C and constantly stirred for about 1 h. Another oxidant solution was
prepared separately by dissolving 11.4 g (0.1 M) of APS in 35 mL of 1 M HCl. The
monomer solution was then treated with the oxidant solution, which was added drop
wise. After the addition of first few drops of oxidant, the reaction solution turned
blue-violet. The reaction mixture was vigorously stirred for 48 h, after which the
precipitate (hydrochloride salt) was formed, which was filtered and washed with
excess distilled water until the disappearance of the color of the filtrate. The
copolymer hydrochloride salt was subsequently neutralized in 0.2 M ammonium
hydroxide for 24 h to obtain the copolymer base. The copolymer base was again
washed with excess distilled water. The blackish violet solid powder was obtained,
which was left to dry in ambient air for one day.
For the synthesis of poly(aniline-co-2, 3-xylidine)ZnO nanocomposite, ZnO
nanoparticles (10% w/w based on the co-monomer content) was dispersed in the
mixture of aniline (0.1 M) and 2, 3-xylidine (0.1 M) dissolved in 40 mL of 1 M HCl
taken in a 250 mL two-necked glass flask. The synthesis of the nanocomposite was
further continued following the identical procedure as prescribed for the synthesis of
the copolymer.
2.3.6 Synthesis of poly(aniline-co-2-pyridylamine-co-2, 3-xylidine) terpolymer
and its nanocomposite poly(aniline-co-2-pyridylamine-co-2, 3-
xylidine)/ZnO
Terpolymer poly (aniline-co-2-pyridylamine-co-2, 3-xylidine) was synthesized
by chemical oxidative polymerization of aniline,2-pyridylamine and 2, 3-xylidine
following previously described method [206]. A typical procedure of the synthesis of
terpolymer with a 10:80:10 monomer ratio is as follows: 0.475 g of 2-pyridylamine,
3.66 mL of aniline, and 0.6 mL of 2, 3-xylidine were dissolved in 40 mL of 1 M HCl
taken in a 200 mL round bottom flask. The oxidant solution was prepared separately
by dissolving 11.4 g of APS in 35 mL of 1 M HCl. The mixture of monomer solution
was then treated with the oxidant solution, which was added drop wise at 19ºC for

CHAPTER 2
41
about 2 h under continuous stirring. The terpolymer hydrochloride salt was isolated
from the reaction mixture by filtration and washed with an excess of distilled water to
remove the oxidant and oligomers. The hydrochloride salt was subsequently
neutralized in 0.1 M ammonium hydroxide for 24 h to obtain the base form of the
terpolymer. The terpolymer base was washed with excess water. A bluish-black solid
powder was left to dry in ambient air for 72 h.
The nanocomposite of terpolymer poly(aniline-co-2-pyridylamine-co-2, 3-
xylidine)/ZnO was also synthesized following the identical synthesis route given for
the synthesis of terpolymer. Initially to the monomer solution of 2-pyridylamine,
aniline and 2, 3-xylidine, ZnO nanoparticles (10% w/w based on the co-monomer
content) were added and then the resultant solution was treated with oxidant solution
to obtain nanocomposite following the procedure stated above.
2.3.7 Synthesis of PANi and PANi/ZnO nanocomposite
PANi was synthesized by typical chemical oxidative polymerization method
by using aniline as monomer. 10 mL of aniline was dispersed in 1 M HCl solution by
ultra-sonication for ½ h. 12.5 g of APS was dissolved in a 150 mL of 1 M HCl and
was added dropwise to the aniline monomer, with stirring, in an ice bath maintaining
the temperature 0-5ºC. Polymerization proceeded for 24 h at room temperature. The
PANi, which was obtained as green precipitate was then neutralized in 0.1 M
ammonium hydroxide solution for 24 h. The precipitate was filtered, washed with
distilled water and ethanol several times to remove all the impurities and then dried in
ambient air for 48 h.
PANi/ZnO nanocomposite was synthesized by dispersing ZnO nanoparticles
(10 % w/w based on the co-monomer content) to the 10 mL aniline in 1 M HCl taken
in a 250 mL two-necked glass flask. The synthesis of the nanocomposite was further
proceeded following the identical synthesis procedure given for the synthesis of the
PANi.
2.3.8 Synthesis of poly(2-pyridylamine)/ZnO nanocomposite
In a typical synthesis 0.5 g of 2-pyridylamine along with ZnO nanoparticles
(10% w/w based on the co-monomer content) was dissolved in 25 mL of 1 M HCl.
The solution obtained was stirred for ½ h on ice bath maintaining temperature 0-5ºC.
27 g of APS was dissolved in 100 mL of 1 M HCl and added drop wise to the above

CHAPTER 2
42
mixture under continuous stirring. The color of the solution turned dark. The reaction
mixture was allowed to stand overnight for complete precipitation. The precipitate
was filtered and washed with distilled water, methanol, acetone, and finally with ethyl
acetate to remove impurities. The resultant precipitate was then neutralized in 0.1 M
ammonium hydroxide solution for 24 h and was dried in an oven maintained at 40ºC.
2.3.9 Synthesis of poly(2, 3-xylidine) and poly(2, 3-xylidine)/ZnO
nanocomposite
The homopolymer of 2, 3- xylidine was synthesized via in situ chemical
oxidative polymerization in an acidic medium. 2, 3-xylidine (10 mL) was dissolved in
1 M HCl solution (40 mL) taken in a 250 mL two-necked glass flask. Resultant
mixture was stirred for ½ h by maintaining the temperature at 0-5°C. Oxidant solution
was prepared separately by dissolving 11.4 g of APS in 35 mL of 1 M HCl. The
oxidant solution was then added drop wise to the monomer solution. After the
addition of first few drops of oxidant, the resultant reaction solution turned blue-
violet. Reaction mixture was vigorously stirred for 48 h, after which the precipitated
hydrochloride salt was filtered and washed with excess of distilled water until the
disappearance of the color. The hydrochloride salt was subsequently neutralized in 0.2
M ammonium hydroxide for 24 h and again washed with excess distilled water.
Blackish violet solid powder was obtained, which was left to dry in ambient air for 48
h.
For the synthesis of poly(2, 3-xylidine)/ZnO nanocomposite, ZnO
nanoparticles (10% w/w based on the co-monomer content) was dispersed in solution
of 2, 3-xylidine (0.1 M) dissolved in 40 mL of 1 M HCl taken in a 250 mL two-
necked glass flask. The synthesis of the nanocomposite was further continued
following the identical procedure as prescribed for the synthesis of the homopolymer.
2.3.10 Synthesis of PPy/GNS/RE3+/DBSA and PPy/GNS/DBSA nanocomposite
Organic-inorganic nanocomposites (PPy/GNS/RE3+/DBSA) involving pyrrole
(Py), graphene nano sheets (GNS), rare earth elements (RE3+= La3+, Sm3+, Nd3+) and
dodecyl benzene sulfonic acid (DBSA) were synthesized by chemical oxidative
polymerization method using FeCl3 as an oxidant and p-toluene sulfonic acid as
dopant as illustrated in scheme 2.1.
CHAPTER 2
43
In the typical synthesis of nanocomposite [207], 2 mL pyrrole, rare earth ions
and GNS (both 5% by weight of the amount of pyrrole) along with 0.5 mL of PEG-
600 were taken in round bottom flask. 15 mL of ethanol and 1 g of DBSA was added
to it and the resultant mixture was ultra-sonicated for 3 h. After sonication the mixture
was allowed to cool to 0-5oC under constant stirring. After 20 min, 0.5 g of p-toluene
sulfonic acid was added to the mixture and left for stirring for 30 min. Finally, 4 gm
of FeCl3 was dissolved in 50 mL of water and added drop wise to the above mixture
under constant stirring maintaining the temperature 0-5ºC. After 2 h of stirring the
resultant mixture was left at room temperature for 48 h for further polymerization.
The obtained precipitate was filtered and washed with double distilled water and
ethanol to remove residual pyrrole, DBSA and oxidant. The precipitate was dried in
vacuum for 12 h.
PPy/GNS/DBSA nanocomposite was also synthesized following the identical
synthesis route.
2.3.11 Synthesis of composite of PPy/DBSA
The synthesis of PPy/DBSA composite was carried out by chemical oxidative
polymerization. A solution of pyrrole and DBSA in HCl was prepared by dissolving
2.7 mL of pyrrole and 1 g of DBSA in 100 mL of 1 M HCl and ultra-sonicated for ½
h. A solution of APS in HCl was prepared by dissolving 9 g of APS in 80 mL of 1 M
HCl and added drop wise in the solution of pyrrole and DBSA with continuous
stirring maintaining the temperature at 0-5ºC. The resultant mixture was stirred for 12
h at room temperature to complete polymerization process. The obtained precipitate
was filtered and then washed with double distilled water and ethanol to remove
residual pyrrole, DBSA and oxidant. The precipitate was dried in vacuum for 12 h to
obtain the composite of PPy/DBSA.
2.4 Characterization Techniques
The synthesized copolymers, terpolymer and their nanocomposites along with
homopolymers nanocomposite were characterized by FTIR, XRD, SEM-EDX and
TEM. The FTIR spectra were taken with KBr pellets using PerkinElmer FTIR
Spectrometer in the range of 4000–500 cm−1. X-ray diffraction (XRD) studies were
done in the 2 range of 20–80◦using Shimadzu 6100X analytical X-ray

CHAPTER 2
44
diffractometer. The morphological and compositional analyses of polymer coatings
and their nanocomposites were carried out using SEM (Model: JEOL JSM-6510LV)
with an EDX (Model: INCA, Oxford) attachment and TEM (Model: JEOL JEM-
2100).
2.5 Preparation of Synthesized Conducting Polymer Coatings on
Mild Steel Specimens
The synthesized compounds were deposited on mild steel coupons by solvent
evaporation method. The coatings of polymers were obtained on freshly polished mild
steel specimens using NMP (N-methyl-2-pyrrolidone) as a solvent. 10% epoxy resin
by weight was used to increase the adhesive property of the polymers. Saturated
solution of polymers were separately prepared in NMP, filtered and spread on the
steel surface with the help of dropper. This was followed by evaporation of solvent at
temperature 85–90◦C. The pouring of polymer solution on the steel specimens was
continued till a thick and near uniform coating was obtained. The thickness of the
coatings was controlled by monitoring the weight of the deposited polymer per unit
area. The coatings were applied on one side of the specimens only. The back and
edges were covered with clear nail polish. Following identical procedure more coated
samples were obtained. The coating thickness was measured using Elcometer (Model:
456). The color and the thickness of the various polymers coatings is listed in Table
2.3.
2.6 Evaluation of Anticorrosive Behaviour of Polymer Coatings
In order to evaluate the anticorrosive performance of the conducting polymer
coatings in different corrosive environments uncoated and coated mild steel
specimens were subjected to various corrosion tests which include: immersion test,
free corrosion potential measurement, AC impedance, potentiodynamic polarization
measurements and scanning electron microscopy (SEM). All the tests were done at
room temperature under static condition. The details of the different tests are as
follows:
2.6.1 Immersion test
After recording the initial weight and dimensions, the uncoated and coated
mild steel specimens were suspended in corrosive solutions with the help of a nylon
CHAPTER 2
45
thread. The immersion tests were carried out under unstirred condition for a period
extending 30 days at room temperature. After completion of immersion the coated
and uncoated steel samples were taken out, washed gently with distilled water and
dried in warm air. The integrity of the coating was visually examined. The dried steel
specimens were weighed again to record the weight loss. The tests were carried out in
triplicate and the uncertainty in the results was reported at the bottom of weight loss
measurement table in chapter 3-7. The corrosion rate was calculated using the
following equation:
AT
534W = (mpy) (CR) rateCorrosion
(1)
where, W is weight loss (mg), is density of specimen (g /cm3), A = area of
specimen (sq. inch.) and T is exposure time (h). To calculate the protection efficiency
of the polymeric coatings the following equation was used.
100CR
CRCR = PE) (%
0
i0
(2)
where, 0CR is the corrosion rate of mild steel in absence of coating and iCR is
the corrosion rate of mild steel in presence of coating.
2.6.2 Free corrosion potential measurements
To measure the free corrosion potential, the uncoated and coated steel
specimens were electrically connected with a wire having an alligator clip on both the
ends. One end of the alligator clip was connected to a multimeter, whereas the other
end was connected to the steel specimen, which was immersed into the test solution.
Saturated calomel electrode (SCE) was used as reference electrode and change in
voltage was plotted against time. The measurement of potential was continued till a
steady state was obtained.
2.6.3 Electrochemical measurements
The electrochemical measurements (potentiodynamic polarization and AC
impedance) were carried out using an AUTOLAB potentiostat/galvanostat, model:
128Nwith inbuilt impedance analyzer FRA 2. The experiments were performed in 1L
corrosion cell provided by AUTOLAB with Ag/AgCl electrode (saturated KCl) as
CHAPTER 2
46
reference electrode, coated and uncoated steel samples with exposed surface area of 1
cm2 as working electrode and Pt wire as counter electrode. To minimize IR drop a
Luggin–Haber capillary was also used and the tip of the capillary was kept very close
to the surface of the working electrode. Prior to the commencement of each
measurements, the specimens were left in test solution to stabilize and attain a steady
state open circuit potential (OCP). The potentiodynamic polarization measurements
were carried out by sweeping the potential between -250 and 250 mV with respect to
the steady-state potential at a scan rate of 0.001 V/s. All the experiments were carried
out at room temperature (30±1ºC) under static condition. The linear segments of the
anodic and cathodic curves were extrapolated to obtain the corrosion current densities
(Icorr) and corrosion potential (Ecorr). The % protection efficiency (PE) was calculated
from the measured icorr values using the following equation:
100i
ii(%PE)
0
corr
corr
0
corr
(3)
where, i0corr is the corrosion current density of uncoated sample and icorr is the
corrosion current density of coated sample.
A sinusoidal AC perturbation of 10 mV amplitude coupled with the open
circuit potential was applied to the metal/coating system within the frequency range
from 10-2 to 105 Hz in the electrochemical impedance spectroscopy (EIS)
measurements. The values of charge transfer resistance (Rct) was used to calculate the
protection efficiency:
100(%PE)
o
Rct
RctRct
(5)
where, Rct and Rcto are the charge transfer resistance of coated and uncoated
samples.
The porosity in the coating is also an important parameter as it decides its
suitability to protect the underneath metal against corrosion. The porosity of the
polymers coatings on mild steel was determined from potentiodynamic polarization
measurements by following the relationship [204]:
ba
ΔE
(coated) p
(uncoated) pcorr
10R
R = P (4)

CHAPTER 2
47
where, P is the total porosity, Rp (uncoated) and Rp (coated) are the polarization resistance of
uncoated and coated mild steel, Ecorr is the difference between the corrosion
potential and ba is the anodic Tafel slope for uncoated mild steel.
2.6.4 Atmospheric exposure test
The atmospheric exposure test was performed as per ASTM designation G-7-
05 (standard practice for atmosphere testing of non-metallic materials). The polymer
coated steel samples along with coated scribed and uncoated steel samples were
weighed and subsequently fixed on a panel, which stood on a heavy metallic base and
placed at the roof of the department for a period of 60 days. The temperature and
humidity were monitored during the entire period of atmospheric exposure. The
samples were taken off from the panel after the completion of the exposure test and
physically examined for any coating deterioration. To examine the effect of the
atmosphere on the corrosion performance of the polymer coatings, the samples
obtained after completion of atmospheric exposure were immediately immersed in
distilled water and were subjected to potentiodynamic polarization measurements.
2.6.5 Surface morphological studies
The surface morphology of the polymer coatings on mild steel before and after
immersion in corrosive solution (0.1 M HCl) was evaluated using SEM. After
completion of immersion the specimens were taken out, thoroughly washed with
double distilled water, dried in warm air and then subjected to SEM studies.

CHAPTER 2
48
Table 2.1: List of Chemicals, their suppliers and purity
Names Providers % Purity
Aniline 99.50
N-ethylaniline 98.00
Zinc acetate dihydrate 99.50
Sodium hydroxide 99.00
Hydrochloric acid 35.50
Sodium chloride 99.99
N-methyl-2-Pyrrolidone (NMP) 99.50
o-anisidine 98.00
2, 3-xylidine Merck 97.00
2-pyridylamine 98.00
Ammonium persulfate (APS) 98.00
Polyethylene glycol 600 N.A
Ethanol 99.99
Sulfuric acid 90.00
p-toluene sulfonic acid 98.00
ortho-dichlorobenzene 98.00
Ferric chloride 99.00
Dodecyl benzene sulfonic acid 95.00
Ammonium hydroxide 25.00
Pyrrole Sigma Aldrich 98.00
Graphite powder 99.99
Potassium permanganate 99.00
Lanthanum(III) nitrate hexahydrate 99.90
Neodymium(III) nitrate hexahydrate Alfa Aesar 99.90
Samarium(III) nitrate hexahydrate 99.90
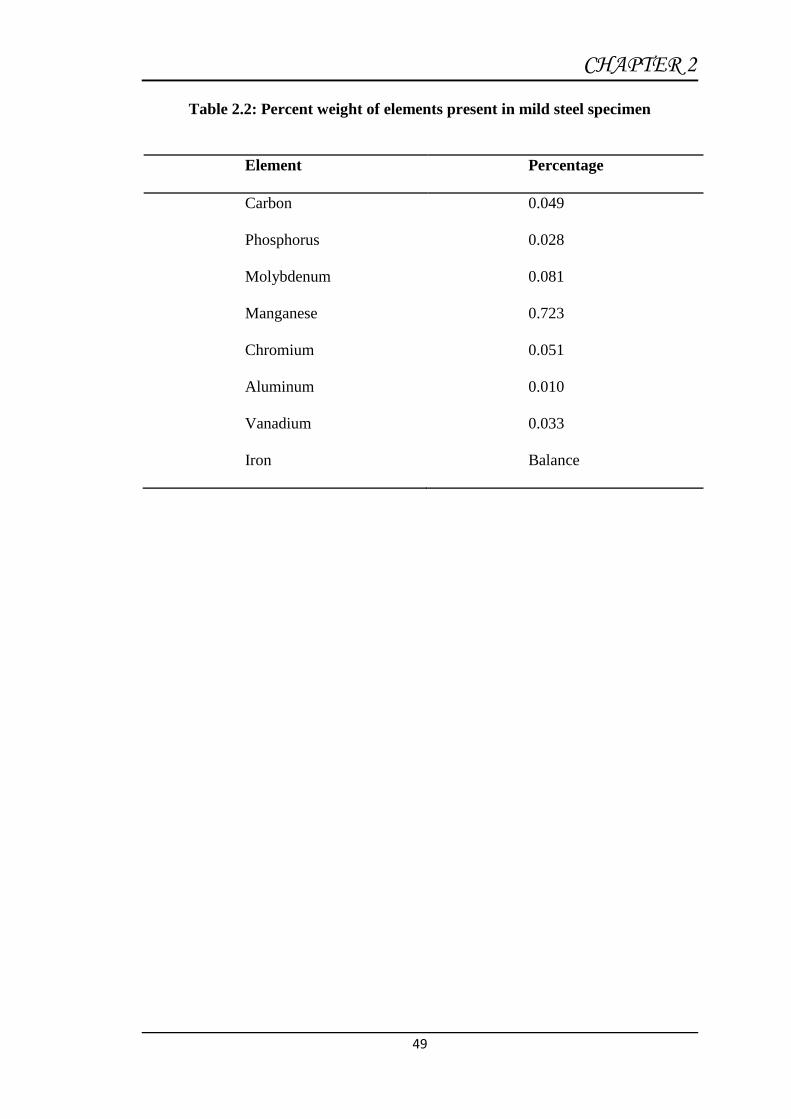
CHAPTER 2
49
Table 2.2: Percent weight of elements present in mild steel specimen
Element Percentage
Carbon 0.049
Phosphorus 0.028
Molybdenum 0.081
Manganese 0.723
Chromium 0.051
Aluminum 0.010
Vanadium 0.033
Iron Balance

CHAPTER 2
50
Table 2.3: Color and thickness of the coatings obtained on mild steel specimens
Polymer Color Thickness(μm)
(average)
Poly(aniline-co-N-ethylaniline) Dark blue 12.85
Poly(aniline-co-N-ethylaniline)/ZnO Blue-black 11.57
Poly (aniline-co-o-anisidine) Dark blue 12.24
Poly (aniline-co-o-anisidine)/ZnO Dark black 10.81
PANi Dark blue 45.92
PANi/ZnO Blue-green 12.34
Poly(2-pyridylamine)/ZnO Dark blue 12.92
Poly(2, 3-xylidine) Purple-violet 46.23
Poly(2, 3-xylidine)/ZnO Violet-black 12.68
Poly(aniline-co-2, 3-xylidine) Purple-violet 48.12
Poly(aniline-co-2, 3-xylidine)/ZnO Dark black 50.47
Poly(aniline-co-2-pyridylamine-co-2,3-xylidine) Blue-black 12.76
Poly(aniline-co-2-pyridylamine-co-2, 3-xylidine)/
ZnO
Black 11.59
PPy/DBSA Black 15.71
PPy/GNS/DBSA Jade black 16. 04
PPy/GNS/Sm3+/DBSA Black 16.57
PPy/GNS/Nd3+/DBSA Blue-black 16.32
PPy/GNS/La3+/DBSA Black 16.45

CHAPTER 2
51
Scheme 2.1: Synthesis of PPy/GNS/RE3+/DBSA

Chapter 3
Anticorrosion behavior of poly(aniline-co-o-
anisidine)/ZnO nanocomposite coating on
mild steel
Journal of Materials Engineering and Performance, 25 (2016) 3017
CHAPTER 3
52
3.1 Results
3.1.1 Characterization of copolymer poly(aniline-co-o-anisidine) [poly(AN-co-
OA)] and poly(aniline-co-o-anisidine)/ZnO [poly(AN-co-OA)/ZnO]
nanocomposite
FTIR spectra
Figure 3.1 (a and b) shows the FTIR spectra of the pure copolymer and its
nanocomposite with 10% ZnO nanoparticles. The copolymer and nanocomposite
showed almost identical spectra. Considering the FTIR spectrum of copolymer (Fig.
3.1a), the broad band centered at 3230 cm-1 is attributed to the characteristic free N-H
stretching vibration of a secondary amine (-NH-) group [209]. The bands at 1575 and
1493 cm-1 are assigned to C-N and C=C stretching vibrations of quinoid and
benzenoid rings, respectively [210]. The peak at 1284 cm-1 has been attributed to the
C-N stretching vibration in the quinoid imine units. The band at 1172 cm-1 is
considered as a measure of the degree of the delocalization of electrons [211]. The
band corresponding to out of plane bending vibration of C-H bond of p-disubstituted
rings appeared at 825 cm-1. The appearance of these IR bands verified the formation
of copolymer. In the spectrum of nanocomposite (Fig. 3.1b), the respective vibrational
bands of the both copolymer and ZnO (the Zn-O band appearing at 458 cm-1) were
observed. However, the corresponding bands of the pure copolymer have been shifted
to 1585, 1509, 1286, 1174, and 830 cm-1, respectively, in the nanocomposite. In
addition, the intensity ratio of the quinonoid band has changed. These results
indicated the existence of hydrogen bonding interaction between the copolymer and
ZnO.
XRD pattern
The XRD patterns of the pure copolymer and nanocomposite are shown in
Figure 3.2 (a and b). In the XRD patterns of copolymer/nanocomposite, the peaks
centered at 2 = 20-30º may be ascribed to periodicity parallel to the copolymer chain
[212]. XRD patterns of copolymer have a broad peak at about 2 = 25.2º, which is the
characteristic peak of copolymer, poly(AN-co-OA) [213]. In the XRD patterns of
nanocomposite, poly(AN-co-OA)/ZnO (Fig. 3.2b), the interaction of poly(AN-co-
OA) with ZnO nanoparticles leads to the highly ordered structure, which can be
CHAPTER 3
53
clearly seen by the pattern in the high-angle region [214]. The sharp peaks observed at
2 = 43.9º, 64.2º, and 77.4º, which correspond to the crystal planes (102), (103), and
(202) imply the presence of ZnO nanoparticles in Poly(AN-co-OA)/ZnO
nanocomposite and ordered structure which results in crystallinity [215-217].The
addition of ZnO nanoparticles caused an increase in the intensity of copolymer peaks.
This confirmed the formation of a conducting organic inorganic nanocomposite.
SEM, EDX and TEM studies
SEM images of the poly(AN-co-OA) copolymer and Poly(AN-co-OA)/ZnO
nanocomposite are shown in Figure 3.3 (a and b).The ZnO nanoparticles have a
strong effect on the morphology of the copolymer. SEM micrograph of the pure
copolymer (Fig. 3.3 a) shows significant difference in its morphology compared to the
morphology of its nanocomposite (Fig. 3.3 b).The copolymer showed a typical
amorphous morphology (which is also confirmed by XRD, Fig. 3.2a), whereas the
nanocomposite showed growth of a chain pattern of the copolymer with the ZnO
nanoparticles presents between the junctions of the copolymer chain network. In
nanocomposite, the ZnO nanoparticles are fairly dispersed in the copolymer matrix.
The nanoparticles are almost uniform, global, and slightly agglomerated.
EDX profile of copolymer poly(AN-co-OA) and copolymer nanocomposite
poly(AN-co-OA)/ZnO are shown in Figure 3.4 (a and b). EDX analysis of copolymer
shows the presence of characteristic peaks of the elements constituting the copolymer,
whereas in copolymer nanocomposite, additional peaks of Zn are observed. EDX
mapping of the nanocomposite indicated that the ZnO nanoparticles were well
dispersed in the copolymer (Fig. 3.5).
The TEM image of poly(AN-co-OA)/ZnO nanocomposite is depicted in
Figure 3.6. TEM micrograph clearly reveals that the ZnO nanoparticles in the range of
25-30 nm are homogeneously dispersed and embedded in the copolymer matrix. This
suggests that the ZnO interacts with copolymer by the formation of H-bonding
between the proton on N-H and the oxygen atom on ZnO surface.
3.1.2 Immersion test
The results of immersion tests for coated mild steel specimens along with
uncoated mild steel in different corrosive solutions are shown in Table 3.1. The test

CHAPTER 3
54
was carried out under unstirred (static) condition at room temperature for the
immersion period of 30 days in different corrosive solutions, e.g., 0.1 M HCl, 5%
NaCl solution, and distilled water. The corrosion rate of control sample in three
corrosive media, 0.1 M HCl, 5% NaCl solution, and distilled water is found to be
23.67, 6.00 and 5.07 mpy, respectively. The corrosiveness of NaCl solution and
distilled water is almost same and comparable. The corrosion performance of
poly(AN-co-OA)/ZnO nanocomposite coatings was found much better (protection
efficiency being highest) than poly(AN-co-OA) coatings in all corrosive media. The
protection efficiency of nanocomposite coating in 0.1 M HCl, 5% NaCl solution and
distilled water being 82.04, 72.33, and 93.24%, respectively, whereas that of
copolymer coating in the respective medium being 73.97, 64.50, and 87.08%,
respectively. In presence of scribed marks in the coated samples the protection
efficiency of both copolymer and copolymer nanocomposite coatings were only
slightly lowered. The protection efficiency of scribed copolymer coating in 0.1 M
HCl, 5% NaCl solution and distilled water was observed to be 69.20, 60.17 and
85.48%, respectively, whereas that of scribed copolymer nanocomposite coating in
the respective medium being 77.44, 66.50 and 91.85%, respectively.
3.1.3 Free corrosion potential measurements
The OCP values (Ecorr) of uncoated, poly(AN-co-OA) copolymer and
poly(AN-co-OA)/ZnO nanocomposite (both coated and scribed) steel samples vs.
SCE were measured against time in three different media, namely, 0.1 M HCl, 5%
NaCl solution, and distilled water and the results are produced in Figure 3.7 - 3.9.
0.1 M HCl
The Ecorr vs time plot for uncoated, coated and coated scribed steel specimens
in 0.1 M HCl is shown in Figure 3.7. The initial potential of uncoated steel is -455
mV, which remained approximately constant for a couple of h, this was followed by
an increase in negative potential till a near steady state potential was reached at a
potential of -585 mV. The initial Eocp value for poly(AN-co-OA)/ZnO
nanocomposite coated steel was measured to be -190 mV, that is very anodic potential
with respect to uncoated steel under the same condition. A steady potential of -290
mV was obtained after an exposure period of 125 h, which remained constant till the
end of immersion period of 200 h. In case of poly(AN-co-OA)/ZnO nanocomposite

CHAPTER 3
55
coated scribed sample the initial potential was measured to be -385 mV. In
comparison to unscribed copolymer coated steel the initial OCP was quite high due to
the break in the coating. However the potential of the scribed sample is still nobler
than the uncoated steel sample at the end of immersion period of 200 h.
Considering the OCP values of poly(AN-co-OA) copolymer coated mild steel
the coating also caused a significant noble shift in the Ecorr value, with respect to
uncoated steel. The initial potential of poly(AN-co-OA) copolymer coated steel (-340
mV) was very much closer to the poly(AN-co-OA)/ZnO nanocomposite coated
scribed sample under the same condition and remains so till 200 h of immersion. The
starting potential of poly(AN-co-OA) copolymer coated scribed steel was measured to
be -489 mV, which is less nobler than the Ecorr of nanocomposite as well as
copolymer coated steel but still nobler than the uncoated steel under the same
condition. The final potential was still nobler than the potential of uncoated steel.
5% NaCl
The steady potential of uncoated steel in 5% NaCl solution is -687 mV (Fig.
3.8). The initial Eocp for poly(AN-co-OA)/ZnO nanocomposite sample is -374 mV
which is quite nobler with respect to uncoated steel. It attained a potential of -438 mV
after 80 h of exposure and finally reached a steady potential of -417 mV over the
remaining period of immersion. The Ecorr values of poly(AN-co-OA)/ZnO
nanocomposite coated scribed steel was also much nobler than bare steel sample,
followed the same trend as that of unscribed poly(AN-co-OA)/ZnO but remained less
nobler throughout the immersion period. Considering the case of poly(AN-co-OA)
copolymer coated steels, the initial Eocp of poly(AN-co-OA) copolymer coated steel
is much nobler than that of uncoated steel, but remained less nobler than
nanocomposite coated steel. The Eocp of scribed sample of copolymer coating also
remained nobler than the uncoated steel and attained a steady state potential after 100
h of immersion.
Distilled water
Figure 3.9 shows the Ecorr vs time plot for uncoated, copolymer and
copolymer nanocomposite coated steel in distilled water. The initial potential of
uncoated steel was -494 mV, this was followed by an increase in negative potential
till a steady state potential at -555 mV was reached. The initial potential of poly(AN-

CHAPTER 3
56
co-OA)/ZnO nanocomposite coated steel was -163 mV, this was followed by a
gradual increase in the negative potential followed by positive shift after 40 h. A
steady potential of about -196 mV was obtained after a time period of 60 h, which
remained constant throughout immersion. The poly(AN-co-OA)/ZnO nanocomposite
coated scribed steel sample show stability in potential (-320 mV) after 95 h of
immersion, which remained constant and nobler than bare steel. The initial potential
of both poly(AN-co-OA) copolymer coated and coated scribed steel was measured to
be -235 mV and -312 mV, respectively, which became constant after 92 h of
immersion.
3.1.4 Potentiodynamic polarization measurements
The potentiodynamic polarization curves for uncoated, Poly(AN-co-OA) and
Poly(AN-co-OA)/ZnO (both scribed and unscribed) coated steel recorded in 0.1 M
HCl, 5% NaCl solution and distilled water, respectively, are shown in Figure 3.10,
3.11 and 3.12, respectively. The corrosion kinetics parameters derived from these
curves, e.g., corrosion potential (Ecorr), corrosion current density (Icorr), cathodic
Tafel slope (bc), anodic Tafel slope (ba), and polarization resistance Rp are listed in
Table 3.2.
0.1 M HCl
Considering the Tafel curves in 0.1 M HCl, poly(AN-co-OA)/ZnO
nanocomposite coated steel sample shows the highest positive shift in the corrosion
potential in comparison to bare steel (from -483.94 mV to -218.05 mV vs Ag/AgCl
electrode). With respect to bare steel, the lowering of corrosion current density (from
158.55 A/cm2 to 0.15 A/cm2) and increase in polarization resistance (from
1.27x10²/cm2 to 1.11x10⁶ /cm2) was highest compared to other coated steel
samples. Also the porosity (P) was lowest compared to other coatings. Considering
the Tafel curves for copolymer poly(AN-co-OA) coated steel, the shift in corrosion
potential with respect to bare steel (from -483.94 mV to -373.39 mV) is also nobler
but the value is less pronounced than copolymer nanocomposite coating. Scribed
samples of both poly(AN-co-OA)/ZnO nanocomposite and poly(AN-co-OA) coated
steel samples show relatively less nobler corrosion potential and higher values of
CHAPTER 3
57
corrosion current density than the corresponding unscribed samples due to break in
the coatings.
5% NaCl
The Tafel extrapolation results shows similar trends as observed from those
obtained in 0.1 M HCl. Nobler shift in corrosion potential with respect to bare steel
(from -618.45 mV to -418.32 mV), lowering of corrosion current density (from 16.12
A/cm2 to 0.45 A/cm2) and increase in polarization resistance (from 1.23x10³
/cm2 to 2.45x10⁵/cm2) along with lowest porosity shows more effectiveness of
nanocomposite coatings on mild steel samples in comparison with copolymer coating.
Distilled water
The results of potentiodynamic polarization curves in distilled water show a
significant positive shift in the corrosion potential (from -498.21 mV to -208.55 mV),
increase in polarization resistance (from 2.08x10⁴ /cm2 to 1.37x10⁶ /cm2) and
reduction in corrosion current (from 2.83 A/cm2 to 0.14 A/cm2) for nanocomposite
coated steel samples relative to uncoated steel. The copolymer coated steel also show
significant increase in polarization resistance (3.30x10⁵ /cm2) and lowering of
corrosion current (0.17 A/cm2) than the nanocomposite coatings.
3.1.5 Atmospheric exposure test
After the completion of the atmospheric test, the samples were physically
examined for color change and any coating deterioration. In the test, both copolymer
and nanocomposite coatings did not show any color change. But the coatings were
found to be detached from the substrate at some places. However, the performance of
nanocomposite coating was better than copolymer coating as it showed insignificant
detachment from the substrate. The potentiodynamic polarization curves for uncoated,
coated, and coated scribed steel samples recorded in distilled water after 60 days
exposure to open atmosphere are shown in Figure 3.13. The values of corrosion
kinetic parameters were obtained from these curves and are listed in Table 3.3. The
Tafel plots show a positive shift in corrosion potential (from -467.82 mV to -206.25
mV) and lowering in corrosion current density (from 6.96 A/cm2 to 1.31 A/cm2)
for the nanocomposite coated steel with respect to bare steel for the same condition.

CHAPTER 3
58
The copolymer coated steel also show similar trends of decrease in corrosion current
density (from 6.96 A/cm2 to 0.48 A/cm2) and positive shift in corrosion potential
(from -467.82 mV to -303.65 mV) but the values are less pronounced than
nanocomposite coated steel.
3.1.6 Surface morphological studies
Figure 14 (a to d) shows the surface morphology of the copolymer and
nanocomposite coatings on mild steel before and after one-month immersion in 0.1 M
HCl. Before immersion in 0.1 M HCl, the pure copolymer and polymer
nanocomposite coatings did not show any cracks or defect (Fig. 14a, c). The
nanocomposite coating appeared more dense and uniform than copolymer coating,
hence providing higher corrosion protection performance. However, after one-month
immersion in HCl solution, the copolymer coating was affected and some fine cracks
are visible (Fig. 14b). The one-month immersion in HCl solution did not cause any
significant damage to the copolymer nanocomposite coating and more or less a defect
free surface was obtained (Fig. 14d).
3.2 Discussion
The anticorrosive behavior of poly(AN-co-OA)/ZnO nanocomposite coating
was examined in major corrosive environments such as 0.1 M HCl, 5% NaCl solution,
distilled water and open atmosphere by subjecting it to different corrosion tests which
include: immersion test, free corrosion potential (OCP) and potentiodynamic
polarization measurements. The corrosion performance of nanocomposite was also
compared with the performance of poly(AN-co-OA) copolymer in the respective
medium.
The results of immersion test (Table 3.1) indicate that, in general, the
poly(AN-co-OA)/ZnO nanocomposite coating performed better than the copolymer
coatings. The nanocomposite coating on steel substrate effectively held up the attack
of corrosive environment and extended the diffusion path for electrolytes and other
corrosive species, thereby decreasing the corrosion rate. The better performance of
nanocomposite coating is because of its superior barrier property. The presence of
ZnO nanoparticles in the poly(AN-co-OA) copolymer film restricted the penetration
and diffusion path of electrolytes and other corrosive species and caused an
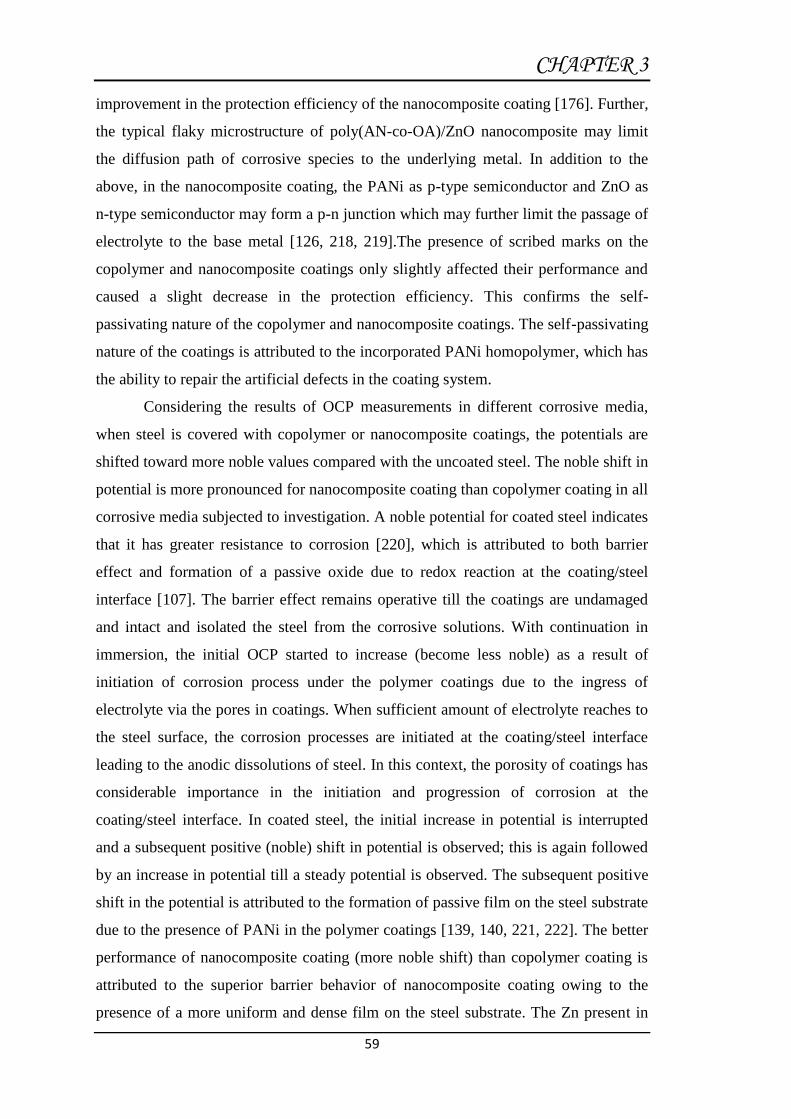
CHAPTER 3
59
improvement in the protection efficiency of the nanocomposite coating [176]. Further,
the typical flaky microstructure of poly(AN-co-OA)/ZnO nanocomposite may limit
the diffusion path of corrosive species to the underlying metal. In addition to the
above, in the nanocomposite coating, the PANi as p-type semiconductor and ZnO as
n-type semiconductor may form a p-n junction which may further limit the passage of
electrolyte to the base metal [126, 218, 219].The presence of scribed marks on the
copolymer and nanocomposite coatings only slightly affected their performance and
caused a slight decrease in the protection efficiency. This confirms the self-
passivating nature of the copolymer and nanocomposite coatings. The self-passivating
nature of the coatings is attributed to the incorporated PANi homopolymer, which has
the ability to repair the artificial defects in the coating system.
Considering the results of OCP measurements in different corrosive media,
when steel is covered with copolymer or nanocomposite coatings, the potentials are
shifted toward more noble values compared with the uncoated steel. The noble shift in
potential is more pronounced for nanocomposite coating than copolymer coating in all
corrosive media subjected to investigation. A noble potential for coated steel indicates
that it has greater resistance to corrosion [220], which is attributed to both barrier
effect and formation of a passive oxide due to redox reaction at the coating/steel
interface [107]. The barrier effect remains operative till the coatings are undamaged
and intact and isolated the steel from the corrosive solutions. With continuation in
immersion, the initial OCP started to increase (become less noble) as a result of
initiation of corrosion process under the polymer coatings due to the ingress of
electrolyte via the pores in coatings. When sufficient amount of electrolyte reaches to
the steel surface, the corrosion processes are initiated at the coating/steel interface
leading to the anodic dissolutions of steel. In this context, the porosity of coatings has
considerable importance in the initiation and progression of corrosion at the
coating/steel interface. In coated steel, the initial increase in potential is interrupted
and a subsequent positive (noble) shift in potential is observed; this is again followed
by an increase in potential till a steady potential is observed. The subsequent positive
shift in the potential is attributed to the formation of passive film on the steel substrate
due to the presence of PANi in the polymer coatings [139, 140, 221, 222]. The better
performance of nanocomposite coating (more noble shift) than copolymer coating is
attributed to the superior barrier behavior of nanocomposite coating owing to the
presence of a more uniform and dense film on the steel substrate. The Zn present in

CHAPTER 3
60
the nanocomposite coating may convert to Zn2+ ions, which may interact with the
nitrogen atom of the PANi and may change the morphology of the copolymer into
compact cluster and decrease the corrosion of underlying steel [140, 223, 224]. The
small percentage of Zn2+ ions may also inhibit the corrosion of steel substrate [126,
225]. The presence of ZnO nanoparticles can also improve the redox behavior of
PANi significantly. In the case of coated scribed samples, though the initial OCP was
higher (less noble) than the respective coated steel owing to the break in the coating,
the coating repassivated as a result of redox reaction and remained nobler than the
potential of uncoated steel.
The analysis of potentiodynamic polarization curves shows noble shift
(positive shift) in Ecorr, substantial reduction in Icorr, and an increase of Rp values of
the mild steel in the presence of both copolymer and copolymer/nanocomposite
coatings in all the three medium subjected to investigation. This confirms the
corrosion-resistant characteristics of the coatings in different corrosive media. In
general, the shift in Ecorr is higher for nanocomposite coatings as compared to the
copolymer coatings implying that the nanocomposite coating provides more effective
protection to the mild steel corrosion in all three medium by depressing the anodic
current of the corrosion reaction [220]. There is a change in the values of both the
Tafel slopes implying that corrosion of mild steel in the presence of copolymer
nanocomposite and pure copolymer coatings is under both anodic and cathodic
control. In case of coated scribed samples, the damage inflicted on the coatings has
some deteriorating effect on the protective properties of the coatings due to the
activation of corrosion process at the coating/metal interface. However, the values of
Icorr and corrosion rates are still lower than the bare steel indicating that protection
other than barrier is operating. Again the performance of scribed copolymer
nanocomposite coating is better than the scribed copolymer coating.
The porosity in the coating is also an important parameter as it decides its
suitability to protect the underneath metal against corrosion. The calculated values of
porosity for the coated samples is listed in Table 3.2. The porosity in the
nanocomposite coating was found to be significantly lower compared to the porosity
in copolymer coating in all the corrosive media under investigation. This again
suggests the improvement in the corrosion resistance of nanocomposite coating,
which greatly hindered the access of the electrolyte to the mild steel substrate.
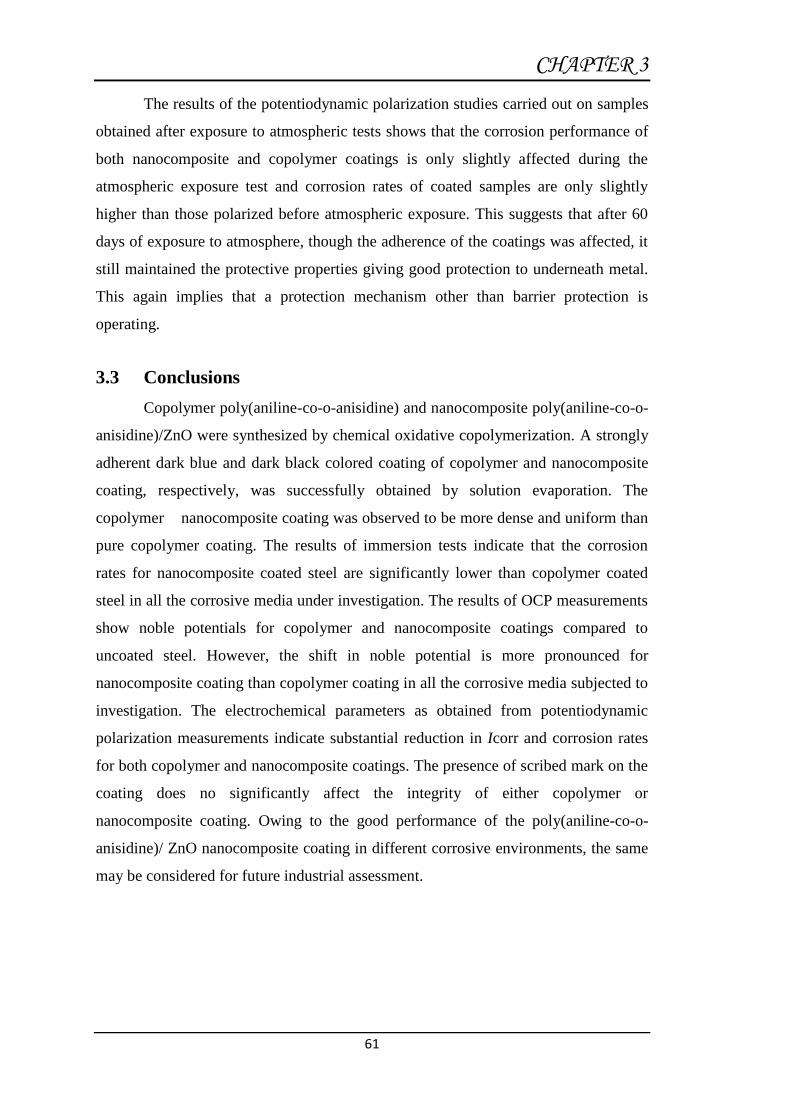
CHAPTER 3
61
The results of the potentiodynamic polarization studies carried out on samples
obtained after exposure to atmospheric tests shows that the corrosion performance of
both nanocomposite and copolymer coatings is only slightly affected during the
atmospheric exposure test and corrosion rates of coated samples are only slightly
higher than those polarized before atmospheric exposure. This suggests that after 60
days of exposure to atmosphere, though the adherence of the coatings was affected, it
still maintained the protective properties giving good protection to underneath metal.
This again implies that a protection mechanism other than barrier protection is
operating.
3.3 Conclusions
Copolymer poly(aniline-co-o-anisidine) and nanocomposite poly(aniline-co-o-
anisidine)/ZnO were synthesized by chemical oxidative copolymerization. A strongly
adherent dark blue and dark black colored coating of copolymer and nanocomposite
coating, respectively, was successfully obtained by solution evaporation. The
copolymer nanocomposite coating was observed to be more dense and uniform than
pure copolymer coating. The results of immersion tests indicate that the corrosion
rates for nanocomposite coated steel are significantly lower than copolymer coated
steel in all the corrosive media under investigation. The results of OCP measurements
show noble potentials for copolymer and nanocomposite coatings compared to
uncoated steel. However, the shift in noble potential is more pronounced for
nanocomposite coating than copolymer coating in all the corrosive media subjected to
investigation. The electrochemical parameters as obtained from potentiodynamic
polarization measurements indicate substantial reduction in Icorr and corrosion rates
for both copolymer and nanocomposite coatings. The presence of scribed mark on the
coating does no significantly affect the integrity of either copolymer or
nanocomposite coating. Owing to the good performance of the poly(aniline-co-o-
anisidine)/ ZnO nanocomposite coating in different corrosive environments, the same
may be considered for future industrial assessment.
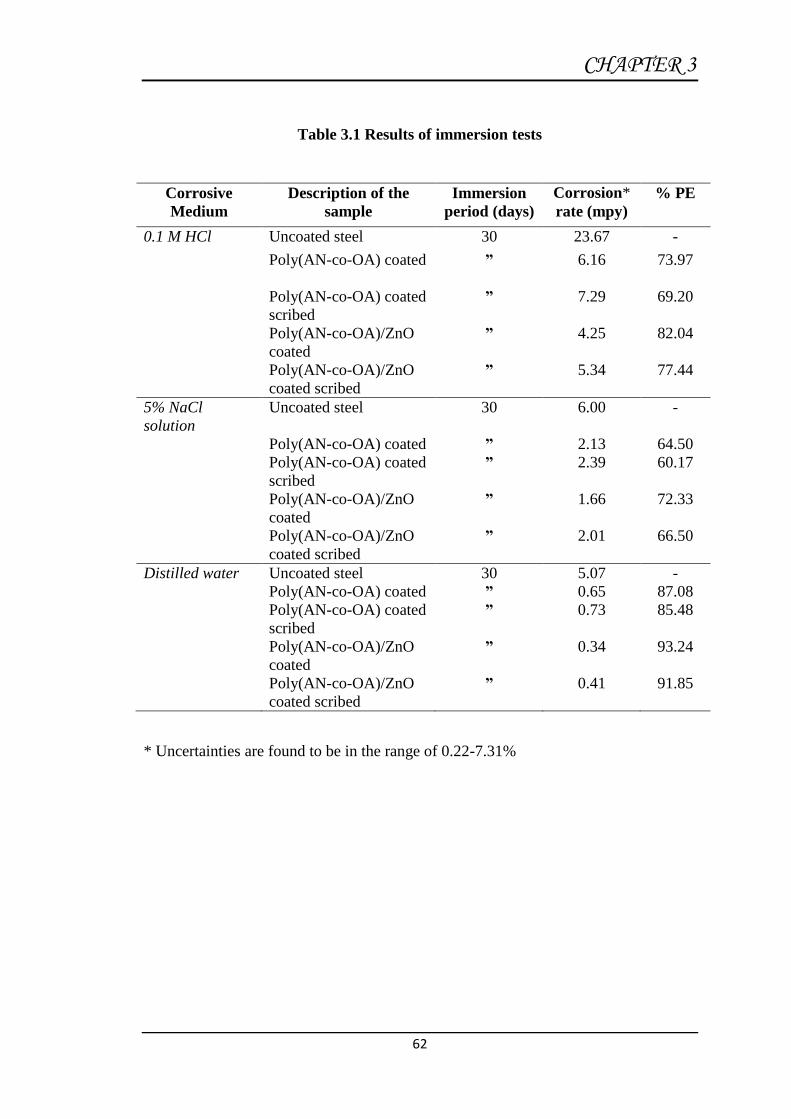
CHAPTER 3
62
Table 3.1 Results of immersion tests
Corrosive
Medium
Description of the
sample
Immersion
period (days)
Corrosion*
rate (mpy)
% PE
0.1 M HCl Uncoated steel 30 23.67 -
Poly(AN-co-OA) coated
” 6.16 73.97
Poly(AN-co-OA) coated
scribed ” 7.29 69.20
Poly(AN-co-OA)/ZnO
coated ” 4.25 82.04
Poly(AN-co-OA)/ZnO
coated scribed ” 5.34 77.44
5% NaCl
solution
Uncoated steel 30 6.00 -
Poly(AN-co-OA) coated ” 2.13 64.50
Poly(AN-co-OA) coated
scribed ” 2.39 60.17
Poly(AN-co-OA)/ZnO
coated ” 1.66 72.33
Poly(AN-co-OA)/ZnO
coated scribed ” 2.01 66.50
Distilled water Uncoated steel 30 5.07 -
Poly(AN-co-OA) coated ” 0.65 87.08
Poly(AN-co-OA) coated
scribed ” 0.73 85.48
Poly(AN-co-OA)/ZnO
coated ” 0.34 93.24
Poly(AN-co-OA)/ZnO
coated scribed ” 0.41 91.85
* Uncertainties are found to be in the range of 0.22-7.31%

CHAPTER 3
63
Table 3.2 Results of potentiodynamic polarization measurements
Corrosive
Medium
Description of the sample Ecorr
(mv)
Icorr
(A/cm2)
ba
(mV/dec)
bc
(mV/dec)
RP
(/cm2)
CR
(mpy)
Porosity
(P)
0.1 M HCl Uncoated steel -483.94 158.55 157.59 66.20 1.27x10² 72.49 -
Poly(AN-co-OA) coated -373.39 1.19 1342.00 1545.00 2.61x10⁵ 0.54 9.67x10⁻⁵
Poly(AN-co-OA) coated
scribed
-480.48 29.17 173.52 67.14 7.20x10² 13.35 16.79x10⁻²
Poly(AN-co-OA) /ZnO
coated
-218.05
0.15 616.08 1150.00 1.11x10⁶ 0.07 2.28x10⁻⁶
Poly(AN-co-OA) /ZnO
coated scribed
-456.71 7.59 1667.00 1296.00 4.70x10⁴ 3.46 3.99x10⁻³
5% NaCl
solution
Uncoated steel -618.45 16.12 144.36 67.06 1.23x10³ 7.36 -
Poly(AN-co-OA) coated -477.86 1.70 80.03 57.50 8.53x10³ 0.74 1.54x10⁻²
Poly(AN-co-OA) coated
scribed
-572.51 7.87 52.29 93.15 1.84x10³ 3.60 32.08x10⁻²
Poly(AN-co-OA) /ZnO
coated
-418.32 0.45 307.37 1521.00 2.45x10⁵ 0.19 2.06x10⁻⁴
Poly(AN-co-OA) /ZnO
coated scribed
-502.47 2.39 518.58 64.27 1.03x10⁴ 1.09 1.87x10⁻²

CHAPTER 3
64
Table 3.2 Results of potentiodynamic polarization measurements (Contd.)
Corrosive
Medium
Description of the sample Ecorr
(mv)
Icorr
(A/cm2)
ba
(mV/dec)
bc
(mV/dec)
RP
(/cm2)
CR
(mpy)
Porosity
(P)
Distilled
water
Uncoated steel -498.21 2.83 3185.10 142.30 2.08x10⁴ 1.26 -
Poly(AN-co-OA) coated -247.80 0.17 242.38 292.33 3.30x10⁵ 0.07 5.26x10⁻²
Poly(AN-co-OA) coated
scribed
-373.93
1.09 395.71 167.20 4.66x10⁴ 0.47 40.79x10⁻²
Poly(AN-co-OA) /ZnO
coated
-208.55 0.14 668.16 1367.00 1.37x10⁶ 0.06 1.23x10⁻²
Poly(AN-co-OA) /ZnO
coated scribed
-285.90 1.13 388.39 168.30 4.48x10⁴ 0.51 39.88x10⁻²
Table 3.3 Results of potentiodynamic polarization measurements after 60 days exposure to open atmosphere
Corrosive
Medium
Description of the sample Ecorr
(mv)
Icorr
(A/cm2)
ba
(mV/dec)
bc
(mV/dec)
RP
(/cm2)
CR
(mpy)
Porosity
(P)
Distilled
water
Uncoated steel
-467.82 6.96 534.15 607.80 1.77x10⁴ 3.15 -
Poly(AN-co-OA)
Coated
-303.65 1.31 338.84 364.15 5.78x10⁴ 0.59 15.09x10⁻²
Poly(AN-co-OA) coated
scribed
-319.87 4.50 609.87 831.25 3.39x10⁴ 2.04 27.62x10⁻²
Poly(AN-co-OA)/ZnO
Coated
-206.25 0.48 400.47 640.45 2.21x10⁵ 0.19 2.59x10⁻²
Poly(AN-co-OA)/ZnO
coated scribed
-272.71 3.21 245.14 362.03 1.97x10⁴ 1.45 38.72x10⁻²
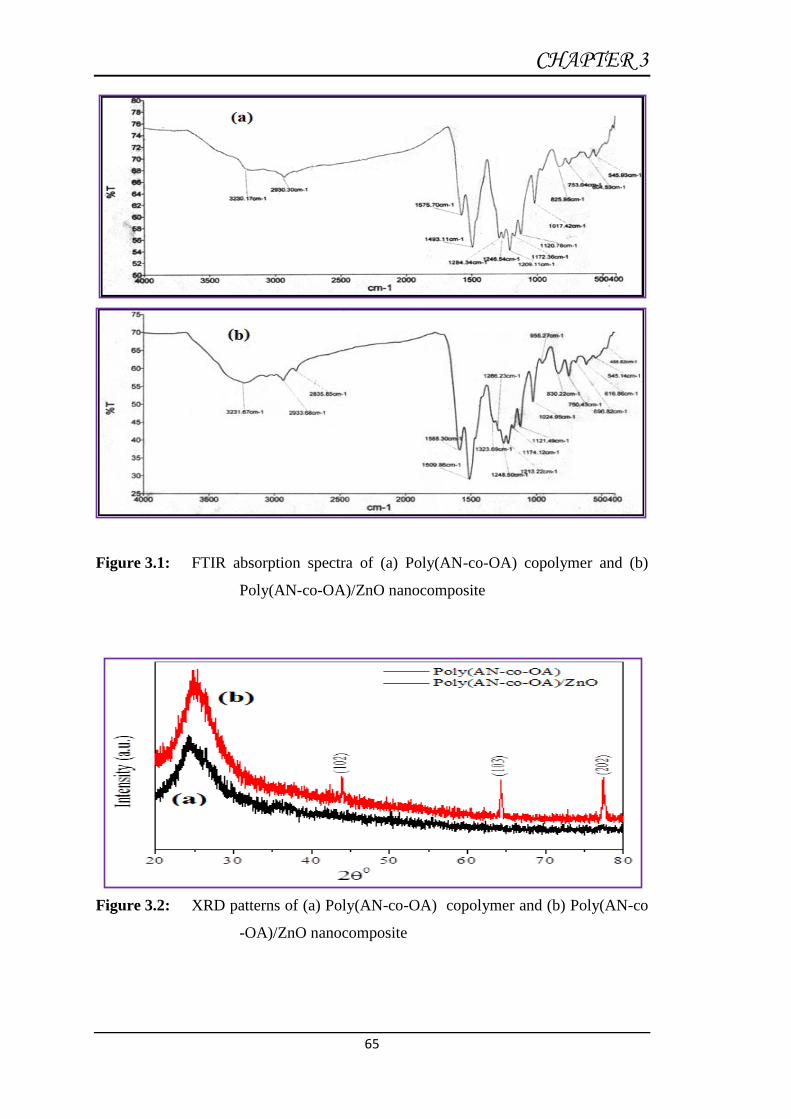
CHAPTER 3
65
Figure 3.1: FTIR absorption spectra of (a) Poly(AN-co-OA) copolymer and (b)
Poly(AN-co-OA)/ZnO nanocomposite
Figure 3.2: XRD patterns of (a) Poly(AN-co-OA) copolymer and (b) Poly(AN-co
-OA)/ZnO nanocomposite

CHAPTER 3
66
Figure 3.3: SEM images of (a) Poly(AN-co-OA) copolymer (b) Poly(AN-co-OA)/
ZnO nanocomposite
Figure 3.4: EDS profile of (a) Poly(AN-co-OA) copolymer (b) Poly(AN-co-OA)/
ZnO nanocomposite
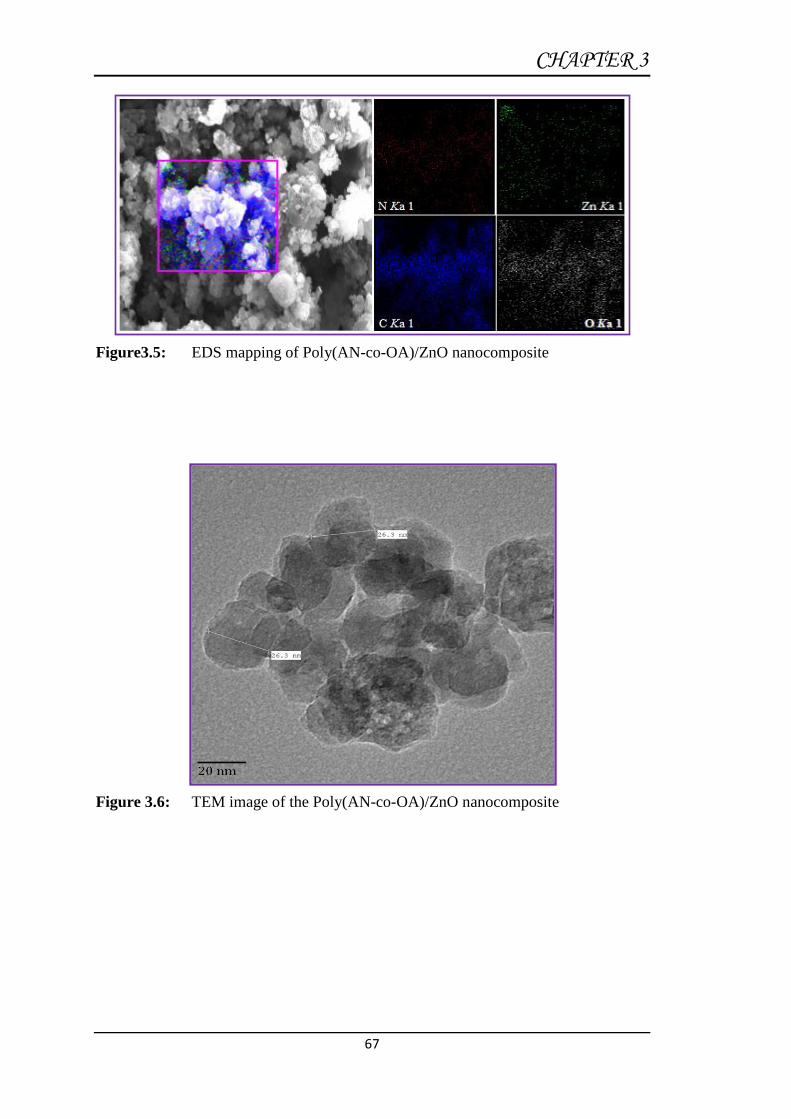
CHAPTER 3
67
Figure3.5: EDS mapping of Poly(AN-co-OA)/ZnO nanocomposite
Figure 3.6: TEM image of the Poly(AN-co-OA)/ZnO nanocomposite

CHAPTER 3
68
Figure 3.7: OCP variations of uncoated, coated and scribed steel during 200 h
immersion in 0.1 M HCl
Figure 3.8: OCP variations of uncoated, coated and scribed steel during 200 h
immersion in 5% NaCl solution
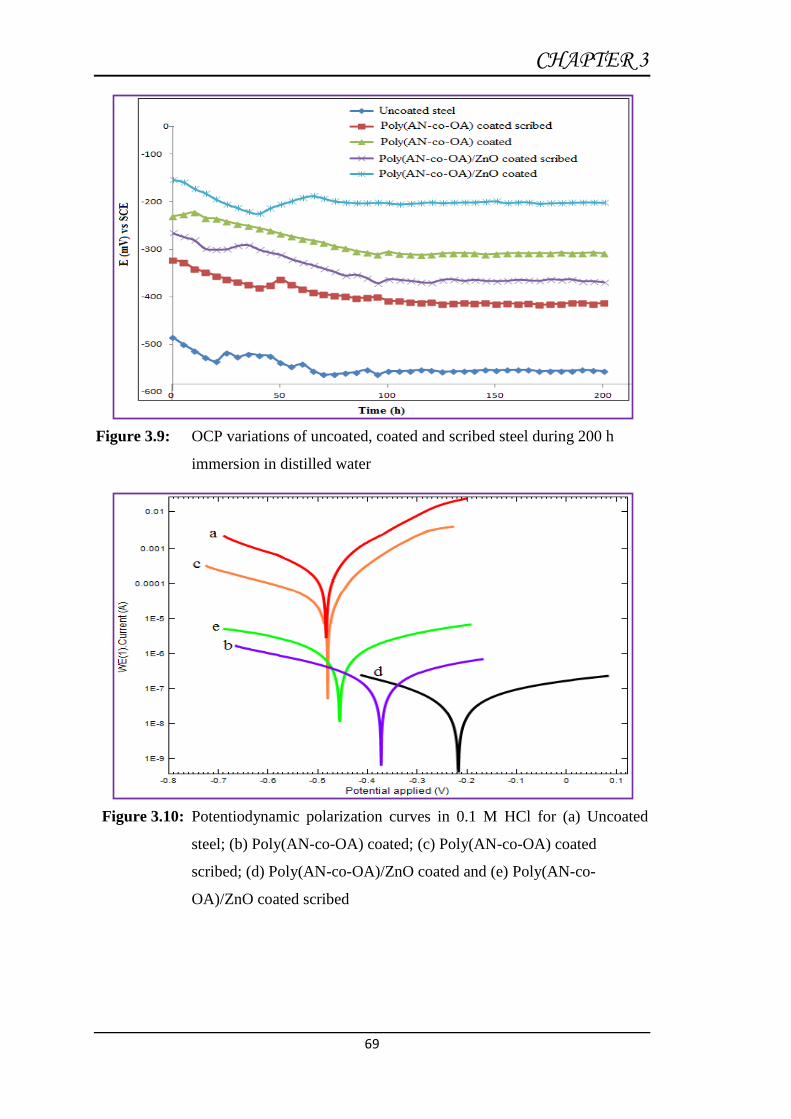
CHAPTER 3
69
Figure 3.9: OCP variations of uncoated, coated and scribed steel during 200 h
immersion in distilled water
Figure 3.10: Potentiodynamic polarization curves in 0.1 M HCl for (a) Uncoated
steel; (b) Poly(AN-co-OA) coated; (c) Poly(AN-co-OA) coated
scribed; (d) Poly(AN-co-OA)/ZnO coated and (e) Poly(AN-co-
OA)/ZnO coated scribed

CHAPTER 3
70
Figure 3.11: Potentiodynamic polarization curves in 5% NaCl for (a) Uncoated
steel; (b) Poly(AN-co-OA) coated; (c) Poly(AN-co-OA) coated
scribed; (d) Poly(AN-co-OA)/ZnO coated and (e) Poly(AN-co-
OA)/ZnO coated scribed
Figure 3.12: Potentiodynamic polarization curves in distilled water for (a) Uncoated
steel; (b) Poly(AN-co-OA) coated; (c) Poly(AN-co-OA) coated
scribed; (d) Poly(AN-co-OA)/ZnO coated and (e) Poly(AN-co-
OA)/ZnO coated scribed

CHAPTER 3
71
Figure 3.13: Potentiodynamic polarization curves in distilled water for (a) Uncoated
steel; (b) Poly(AN-co-OA); (c) Poly(AN-co-OA) coated scribed; (d)
Poly(AN-co-OA)/ZnO coated and (e) Poly(AN-co-OA)/ZnO coated
scribed steel after 60 days exposure to open atmosphere
Figure 3.14: SEM images of (a) and (b) Poly(AN-co-OA) copolymer coated steel
before and after 30 days immersion; (c) and (d) Poly(AN-co-OA)/ZnO
nanocomposite coated steel before and after 30 days immersion in 0.1
M HCl

Chapter 4

Anticorrosion behavior of poly(aniline-co-N-ethylaniline)/ZnO
nanocomposite coating on mild steel
Arabian Journal for Science and Engineering, 42 (2017) 209

CHAPTER 4
72
4.1 Results
4.1.1 Characterization of copolymer poly(aniline-co-N-ethylaniline) [poly(AN-
co-EA)] and poly(aniline-co-N-ethylaniline)/ZnO [poly(AN-co-EA)/ZnO]
nanocomposite
FTIR studies
FTIR spectra of the pure copolymer and its nanocomposite with 10% ZnO
nanoparticles are shown in Figure 4.1. The copolymer and nanocomposite showed
almost similar spectra. In the spectrum of copolymer (Fig.4.1a), a broadband centered
at 3197 cm−1 is attributed to the characteristic free N–H stretching vibration of
secondary amino groups (–NH–) in the copolymer [226]. The bands observed at 2871,
2929 and 2963 cm−1 show the symmetric and asymmetric aliphatic C–H stretching
that are attributed to the ethyl group on the ethylaniline units. The bands at 1590 and
1494 cm−1 are ascribed to C–N and C=C stretching vibrations of quinoid and
benzenoid ring, respectively. The C–N stretching vibration in an alternative quinoid–
benzenoid–quinoid unit observed at 1376 cm−1 and an additional peak at 1296 cm−1
can be attributed to C–N stretching in the benzenoid–benzenoid–benzenoid triad
sequence. The peak resonating at 1149 cm−1 represents an in-plane C–H bending
vibration in quinoid and benzenoid rings [227]. The C–H in-plane and C–H out of
plane bending vibration of the 1,4-phenylene ring on ethylaniline and aniline unit
have been observed at 1113 cm−1 and 815 cm−1, respectively. The presence of above
IR bands confirmed the formation of the copolymer. The FTIR spectrum of the
poly(AN-co-EA)/ZnO nanocomposite (Fig. 4.1b) shows respective vibrational bands
of the copolymer along with the additional absorption band of ZnO, the Zn–O band
appearing at 471 cm−1. However, the incorporation of ZnO led to the obvious shift in
several FTIR bands in the spectrum of nanocomposite when compared to the pure
copolymer. The corresponding bands of the pure copolymer have been shifted to
3211, 2875, 2930, 2965, 3047, 1596, 1499, 1258, 1160 and 818 cm−1, respectively, in
the nanocomposite. The shift may be described due to the formation of hydrogen
bonding on the surface of ZnO nanoparticles and –NH group of the copolymer.

CHAPTER 4
73
XRD analysis
The XRD patterns of the copolymer and its nanocomposite are shown in
Figure 4.2. In general, a polymer chain has both amorphous and crystalline domains
in the polymer matrix and the percentage of the respective domains vary, depending
upon the backbone [228]. In the XRD pattern of the copolymer (Fig. 4.2a), peak
centered between 2θ = 20◦ to 30◦ shows the partial crystalline behaviour of
copolymer. The interaction of poly(AN-co-EA) with ZnO nanoparticles leads to the
highly ordered structure, which can be clearly seen by the XRD pattern in the high
angle region [214] (Fig. 4.2b). The sharp peaks observed at 2θ = 43.95◦, 64.34◦ and
77.39◦,implies the presence of ZnO nanoparticle in poly(AN-co-EA)/ZnO
nanocomposite and ordered structure, which results in crystallinity [215-217]. The
addition of ZnO nanoparticles caused an increase in the intensity of copolymer peak.
This confirmed the formation of a conducting organic–inorganic nanocomposite.
SEM and TEM studies
Figure 4.3 shows the SEM images of the pure copolymer and its
nanocomposite. The ZnO nanoparticles have a strong effect on the morphology of the
copolymer. SEM micrograph of the pure copolymer (Fig. 4.3a) shows significance
difference in its morphology compared to the morphology of its nanocomposite (Fig.
4.3b). The copolymer without ZnO showed a typical morphology, whereas the
nanocomposite showed growth of a chain pattern of the copolymer with the ZnO
nanoparticles presents between the junctions of the copolymer chain network. In
nanocomposite, the ZnO nanoparticles are fairly dispersed in the copolymer matrix.
The nanoparticles are almost uniform, global and slightly agglomerated.
The TEM micrographs of poly(AN-co-EA)/ZnO nanocomposite
depicted in Figure 4.4 clearly indicates the homogeneous dispersion and embedment
of ZnO nanoparticles (particle size 25-30 nm) in the matrix of copolymer. This is
suggestive of binding of ZnO nanoparticles with the copolymer by forming hydrogen
bonding between the proton of N-H of copolymer and oxygen atom on ZnO surface.
4.1.2 Immersion test
The immersion test results for uncoated, coated and coated scribed mild steel
specimens in different corrosive solutions, e.g. 0.1 M HCl, 5% NaCl solution and

CHAPTER 4
74
distilled water, are shown in Table 4.1. The investigated copolymer and copolymer
nanocomposite coatings showed good protection efficiency (PE) in the all the three
media subjected to investigation. However, the performance of poly(AN-co-EA)/ZnO
nanocomposite coatings was found much better (PE being highest) than poly(AN-co-
EA) coatings in all corrosive media. The PE of nanocomposite coating in 0.1 M HCl,
5% NaCl solution and distilled water is 89.12, 79.73 and 96.00%, respectively,
whereas that of copolymer coating in the respective medium is 81.15, 72.64 and
90.00%, respectively. The presence of scribed mark in the coated steel samples
caused a slight lowering in the PE. The PE of scribed nanocomposite coating in 0.1 M
HCl, 5% NaCl solution and distilled water is observed to be 85.05, 75.00 and 92.40%,
respectively, whereas that of scribed copolymer coating in the respective medium is
76.12, 69.76 and 89.80% respectively.
4.1.3 Free corrosion potential measurements
The variations in OCP values of uncoated, coated and coated scribed mild
steel specimens in 0.1 M HCl, 5% NaCl solution and distilled water vs. SCE were
monitored with time and the results are shown in Figure 4.5, 4.6 and 4.7.
0.1 M HCl
The Ecorr vs time plot for uncoated, coated and coated scribed steel specimens
in 0.1 M HCl is shown in Figure 4.5. The steady state potential of uncoated steel is
measured to be -585 mV. The presence of coating of poly(AN-co-EA)/ZnO
nanocomposite on steel samples caused a noble shift in the potential and initial Eocp
value for poly(AN-co-EA)/ZnO nanocomposite coated steel was measured to be -173
mV. With increasing exposure period there was a continuous increase in the negative
potential. The measured potential after 50 h of exposure was found to be -223 mV,
which was still quite nobler with respect to the potential of bare steel under the same
condition. A steady potential of -284 mV was obtained after an exposure period of
145 h, which remained constant till the end of immersion period of 200 h.
Considering the OCP values for poly(AN-co-EA) coated mild steel, the coating also
caused a significant noble shift in the Ecorr value, with respect to uncoated steel. The
starting potential of poly(AN-co-EA) coated steel was measured to be -290 mV,
which is less noble than the Ecorr of nanocomposite coated steel but still nobler than
the potential of uncoated steel under the same condition. It reached a final potential of
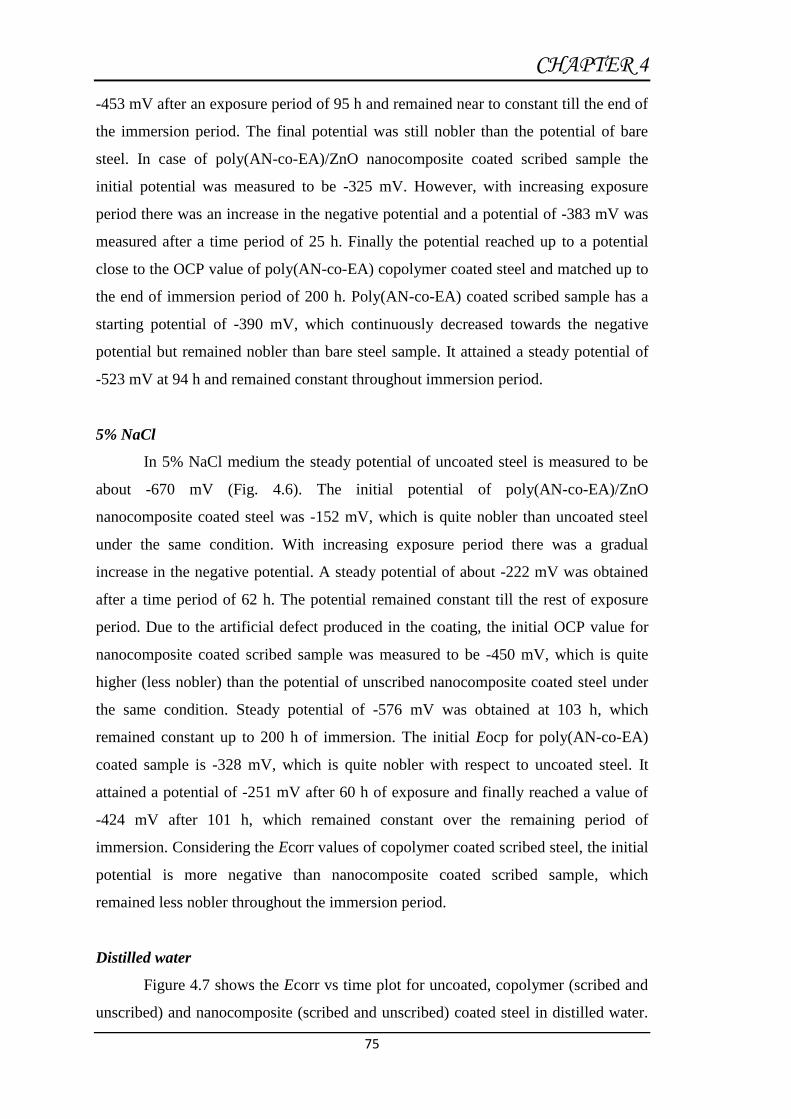
CHAPTER 4
75
-453 mV after an exposure period of 95 h and remained near to constant till the end of
the immersion period. The final potential was still nobler than the potential of bare
steel. In case of poly(AN-co-EA)/ZnO nanocomposite coated scribed sample the
initial potential was measured to be -325 mV. However, with increasing exposure
period there was an increase in the negative potential and a potential of -383 mV was
measured after a time period of 25 h. Finally the potential reached up to a potential
close to the OCP value of poly(AN-co-EA) copolymer coated steel and matched up to
the end of immersion period of 200 h. Poly(AN-co-EA) coated scribed sample has a
starting potential of -390 mV, which continuously decreased towards the negative
potential but remained nobler than bare steel sample. It attained a steady potential of
-523 mV at 94 h and remained constant throughout immersion period.
5% NaCl
In 5% NaCl medium the steady potential of uncoated steel is measured to be
about -670 mV (Fig. 4.6). The initial potential of poly(AN-co-EA)/ZnO
nanocomposite coated steel was -152 mV, which is quite nobler than uncoated steel
under the same condition. With increasing exposure period there was a gradual
increase in the negative potential. A steady potential of about -222 mV was obtained
after a time period of 62 h. The potential remained constant till the rest of exposure
period. Due to the artificial defect produced in the coating, the initial OCP value for
nanocomposite coated scribed sample was measured to be -450 mV, which is quite
higher (less nobler) than the potential of unscribed nanocomposite coated steel under
the same condition. Steady potential of -576 mV was obtained at 103 h, which
remained constant up to 200 h of immersion. The initial Eocp for poly(AN-co-EA)
coated sample is -328 mV, which is quite nobler with respect to uncoated steel. It
attained a potential of -251 mV after 60 h of exposure and finally reached a value of
-424 mV after 101 h, which remained constant over the remaining period of
immersion. Considering the Ecorr values of copolymer coated scribed steel, the initial
potential is more negative than nanocomposite coated scribed sample, which
remained less nobler throughout the immersion period.
Distilled water
Figure 4.7 shows the Ecorr vs time plot for uncoated, copolymer (scribed and
unscribed) and nanocomposite (scribed and unscribed) coated steel in distilled water.
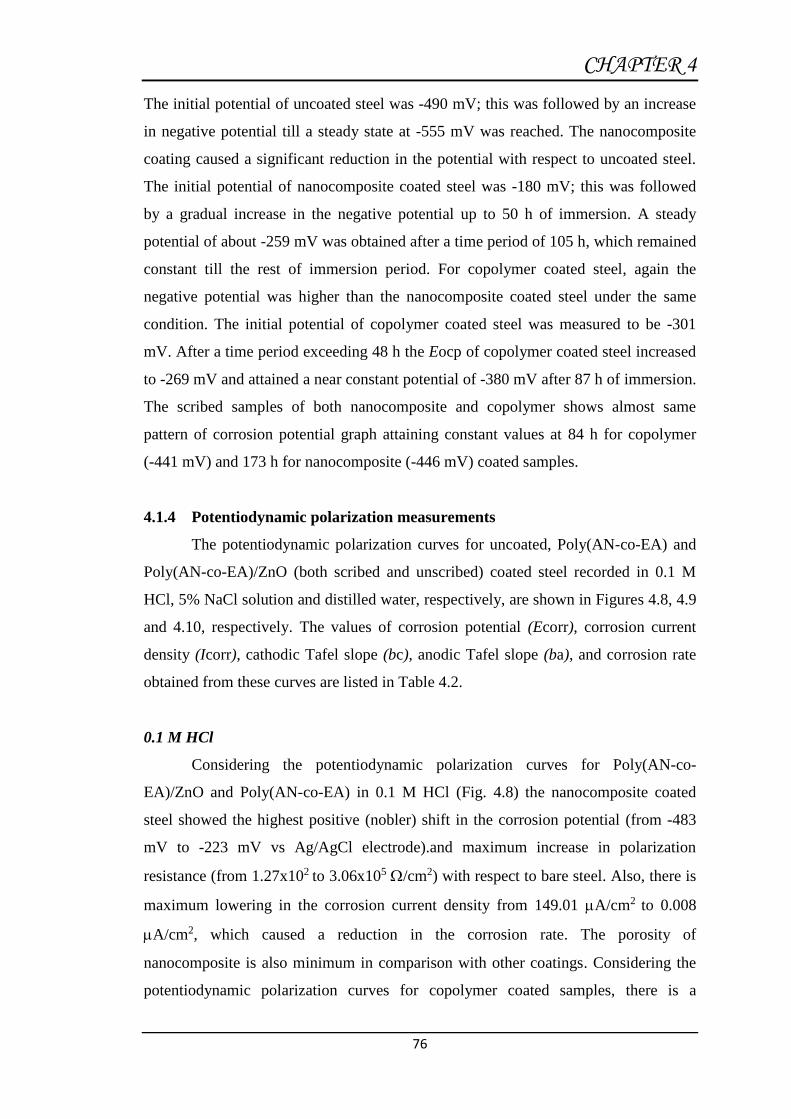
CHAPTER 4
76
The initial potential of uncoated steel was -490 mV; this was followed by an increase
in negative potential till a steady state at -555 mV was reached. The nanocomposite
coating caused a significant reduction in the potential with respect to uncoated steel.
The initial potential of nanocomposite coated steel was -180 mV; this was followed
by a gradual increase in the negative potential up to 50 h of immersion. A steady
potential of about -259 mV was obtained after a time period of 105 h, which remained
constant till the rest of immersion period. For copolymer coated steel, again the
negative potential was higher than the nanocomposite coated steel under the same
condition. The initial potential of copolymer coated steel was measured to be -301
mV. After a time period exceeding 48 h the Eocp of copolymer coated steel increased
to -269 mV and attained a near constant potential of -380 mV after 87 h of immersion.
The scribed samples of both nanocomposite and copolymer shows almost same
pattern of corrosion potential graph attaining constant values at 84 h for copolymer
(-441 mV) and 173 h for nanocomposite (-446 mV) coated samples.
4.1.4 Potentiodynamic polarization measurements
The potentiodynamic polarization curves for uncoated, Poly(AN-co-EA) and
Poly(AN-co-EA)/ZnO (both scribed and unscribed) coated steel recorded in 0.1 M
HCl, 5% NaCl solution and distilled water, respectively, are shown in Figures 4.8, 4.9
and 4.10, respectively. The values of corrosion potential (Ecorr), corrosion current
density (Icorr), cathodic Tafel slope (bc), anodic Tafel slope (ba), and corrosion rate
obtained from these curves are listed in Table 4.2.
0.1 M HCl
Considering the potentiodynamic polarization curves for Poly(AN-co-
EA)/ZnO and Poly(AN-co-EA) in 0.1 M HCl (Fig. 4.8) the nanocomposite coated
steel showed the highest positive (nobler) shift in the corrosion potential (from -483
mV to -223 mV vs Ag/AgCl electrode).and maximum increase in polarization
resistance (from 1.27x10² to 3.06x10⁵ /cm2) with respect to bare steel. Also, there is
maximum lowering in the corrosion current density from 149.01 A/cm2 to 0.008
A/cm2, which caused a reduction in the corrosion rate. The porosity of
nanocomposite is also minimum in comparison with other coatings. Considering the
potentiodynamic polarization curves for copolymer coated samples, there is a

CHAPTER 4
77
significant positive shift in Ecorr (from -483 mV to -382 mV) and lowering in the
Icorr (from 149.01 A/cm2 to 4.11A/cm2),which caused a significant reduction in
corrosion rate. However, the shift in Ecorr and lowering in Icorr for copolymer coated
sample is less pronounced than the nanocomposite coated sample. In case of scribed
samples there was some deterioration in the protective properties of the coatings.
However, the values of corrosion potential, corrosion current density and corrosion
rate measured were still nobler than uncoated steel for the same condition.
5% NaCl
The potentiodynamic polarization curves for uncoated, pure copolymer and
copolymer nanocomposite coated steel and in 5% NaCl solution are shown in Figure
4.9. The highest positive shift in Ecorr is noticed for nanocomposite coating (from -
619 mV to -176 mV), this is followed by copolymer (from -619 mV to -336 mV vs
Ag/AgCl electrode) with respect to uncoated steel. Again, there is a significant
reduction in Icorr for both nanocomposite (from 15.50 A/cm2 to 0.001 A/cm2) and
copolymer (0.006 A/cm2) coated samples relative to uncoated steel leading to a
substantial lowering in the corrosion rates. Scribed samples also shows nobler
corrosion potential and lower corrosion current compared to uncoated steel.
Distilled water
The Tafel extrapolation results for poly(AN-co-EA)/ZnO and poly(AN-co-
EA) in distilled water show similar trends (Fig. 4.10) as those obtained in 5% NaCl.
Nobler shift in corrosion potential (from -499 mV to -271 mV), lowering of corrosion
current (from 2.59 A/cm2 to 0.005 A/cm2), increase in polarization resistance (from
2.08x10⁴ /cm2 to 4.45x10⁵ /cm2) and decrease in porosity shows the effectiveness
of nanocomposite coatings on mild steel samples. Copolymer coated samples also
shows similar trends of increase in polarization resistance (from 2.08x10⁴ /cm2 to
3.23x10⁵ /cm2) and lowering of corrosion current (from 2.59 A/cm2 to 0.203
A/cm2). Scribed samples also shows nobler corrosion potential as compared to
uncoated steel.
4.1.5 Atmospheric exposure test
After the completion of the atmospheric test, the samples were physically
examined for color change and any coating deterioration. The coatings did not show
CHAPTER 4
78
any color change though they were found to be detached from the substrate at some
places. The potentiodynamic polarization curves for uncoated, coated and coated
scribed steel samples recorded in distilled water after 60 days exposure to open
atmosphere are shown in Figure 4.11. The values of Ecorr, Icorr, bc, ba and corrosion
rate obtained from these curves are listed in Table 4.3. The results of potentiodynamic
polarization measurements show some deterioration in the performance of the
coatings due to their detachment from the substrate but they still maintained the
protective properties giving good protection to the MS surface. The nanocomposite
coating was found least affected during the atmospheric exposure test, which was
confirmed by more positive shift in corrosion potential (from -467 mV to -280 mV)
and decrease in corrosion current density from 6.96 A/cm2 to 0.09 A/cm2.
4.1.6 Electrochemical impedance spectroscopy measurements
The corrosion protection behaviour of copolymer and its nanocomposites
coated mild steel in 0.1 M HCl and in 5% NaCl were also studied using EIS. This
method allows evaluating the kinetics of the electrochemical processes and mode of
protection at the mild steel/electrolyte interface modified by the presence of polymer
coatings. Figures 4.12 and 4.13 show the Nyquist impedance plots of copolymer and
nanocomposite coated mild steel specimens in 0.1 M HCl and 5% NaCl solution,
respectively. Various parameters (solution resistance, Rs, charge transfer resistance,
Rct and double layer capacitance, Cdl) obtained from Nyquist plots are listed in Table
4.4.
0.1 M HCl
The Nyquist plots for copolymer and its nanocomposites coated mild steel
(Fig. 4.12) show single capacitive loop, which is attributed to the charge transfer of
the corrosion process. The diameter of the capacitive loop increased in the presence of
polymer coatings. The capacitive loops are not exact semicircles but depressed to
some extent. This is attributed to the frequency dispersion effect due to roughness and
inhomogeneity of electrode surface. The increase in the diameter of the semicircle
was higher for nanocomposite coating indicating its superior protection ability over
copolymer coatings. There are an increase in Rct value (from 68 Ωcm2 to 1433 Ωcm2)
and a decrease in Cdl value (from 9.45x10⁻⁵ µFcm-2 to 2.47x10⁻⁵ µFcm-2) in the
CHAPTER 4
79
presence of copolymer coatings compared to uncoated mild steel. The copolymer
nanocomposite coating caused highest increase in Rct (2330 Ωcm2) and maximum
decrease in Cdl (1.14x10⁻⁷ µFcm-2) suggesting its superior protective behaviour
compared to copolymer coatings.
5% NaCl
The Nyquist plots for uncoated and polymer coated steel in 5% NaCl solution
(Fig. 4.13) show depressed semicircle probably due to surface heterogeneity or
corrosion product on mild steel substrate. The diameter of the semicircle increased in
presence of polymer coating. The highest increase in diameter of the semicircle was
observed for nanocomposite coating indicating its superior protection ability over
copolymer coatings. There is an increase in Rct value (from 442 Ωcm2 to 20514
Ωcm2) and decrease in Cdl value (from 3.5x10⁻⁴ µFcm-2to 6.74x10⁻⁸ µFcm-2) in
presence of nanocomposite coatings compared to uncoated mild steel. Copolymer
coated samples also show higher Rct value (15011 Ωcm2) and lower Cdl value
(1.07x10⁻⁶ µFcm-2) as compared to bare steel sample.
4.1.7 Surface morphological studies
The characteristic SEM micrographs of the copolymer and nanocomposite
coatings prior to and after 30 days immersion in 0.1 M HCl are shown in Figure 4.14.
The SEM micrograph of the copolymer coated mild steel surface prior to immersion
in 0.1 M HCl is shown in Figure 4.14(a). The coating was homogeneously covering
the substrate, without any crack or significant defect. However, after 30 days
immersion in HCl solution the integrity of the coating was affected and some fine
cracks are visible in the coating (Fig.4.14b). SEM micrograph of nanocomposite
coating prior to immersion is shown in Figure 4.14(c). The nanocomposite coating
provided crack free, homogenous and continuous closed packed structure on the mild
steel and brought higher corrosion protection to the metallic substrate. The coating
was more dense and uniform than copolymer coating. The immersion to the acid
solution did not cause any significant damage to the coating and more or less a defect-
free surface was obtained (Fig.4.14d).
CHAPTER 4
80
4.2 Discussion
The corrosion protection performance of poly(AN-co-EA)/ZnO
nanocomposite coating on mild steel was investigated in major corrosive
environments such as 0.1 M HCl, 5% NaCl solution and distilled water by subjecting
it to different corrosion tests, which include: immersion test, free corrosion potential
(OCP) measurements, potentiodynamic polarization measurements, open atmospheric
exposure tests and electrochemical impedance spectroscopy measurements. The
corrosion performance of nanocomposite was also compared with the performance of
poly(AN-co-EA) copolymer.
Considering the results of immersion tests, the high protection efficiency
shown by both copolymer and its nanocomposite coatings in three different corrosive
medium is attributed to both barrier effect and passivation behaviour [107].The
coatings act as a physical barrier layer and have high resistance towards the diffusion
of corrosive ions [229]. In addition, the coatings also protect the mild steel substrate
by forming a highly protective iron oxide layer that mainly consists of Fe2O3 and
Fe3O4 and have a tendency to replenish the oxide layer, if the coating is damaged
[230]. The better performance of nanocomposite coating is attributed to its superior
barrier effect due to lowering in the porosity. In nanocomposite coating the ZnO acts
as filler and improves the resistance of the coating towards chloride ion penetration
and reduces the corrosion process significantly. It has been reported that the presence
of nanoscale materials in organic coatings can increase the building block effect of the
coating and limit the diffusion path of the water molecules [176]; the morphology of
nanomaterial plays an important role in achievement of this objective. In the present
coating system, the ZnO nanoparticles in poly(AN-co-EA) film restricted the
penetration and diffusion path of the electrolytes and other corrosive species and
caused an improvement in the performance of nanocomposite coating. In addition to
the above, the copolymer/ZnO nanocomposite has flaky microstructure in which ZnO
nanoparticles are shielded by the copolymer. The flaky microstructure may decrease
the diffusion of corrodents in the nanocomposite coating. Further, the PANi in the
copolymer as p-type semiconductor and ZnO as n-type semiconductor may form a
p–n junction, which allows corrodents to transport in only one direction in the
nanocomposite coatings [126, 219, 231]. The presence of scribed marks on the
copolymer and nanocomposite coatings only slightly affected their performance and
CHAPTER 4
81
decreased the PE. This confirms the self-passivating nature of the copolymer and
nanocomposite coatings, which is attributed to the incorporated polyaniline
homopolymer. Polyaniline has the ability to repair artificial defects and restore the
passive state of the underlying mild steel.
Considering the results of OCP measurements, the noble shift in OCP values
for both copolymer and nanocomposite coated steel specimens indicate that inhibition
mechanism of conducting polymers is related to both passivation and blocking effect
[107]. The blocking effect is operative till the polymer coating remains adherent and
undamaged and prevents the contact of the steel substrates with the corrosive
environments. As the immersion is continued, the electrolyte develops pathways with
time through coating via pores in the coatings. The corrosive species diffuse through
these paths towards the steel surface along with the water. When the sufficient amount
of electrolyte reaches the steel surface, the corrosion processes are initiated at
coating/mild steel interface. The initial decline in the potential indicated the diffusion
of electrolyte and corrosive ions through the pinholes and defects existing in the
coatings. The subsequent positive shift in potential occurred due to the formation of
the passive film on the mild steel substrate because of the presence of PANi-
containing coatings [139, 140, 221, 222]. In case of poly(AN-co-EN)/ZnO coatings,
the presence of ZnO nanoparticles shifted the potential to more noble direction as it
improved both barrier properties and redox behavior of copolymer coating. The Zn
present in the nanocomposite coating may convert to Zn2+ ions, which may inhibit the
corrosion of the metallic substrate even when present in minimal quantities [126,
225]. The Zn2+ can change the morphology and structure of copolymer into the
compact cluster by interacting with the nitrogen atom of PANi thus reduce the
corrosion rate [140, 223, 224]. The redox behaviour of PANi can also be improved
significantly by the addition of metal oxide nanostructured materials. In case of
coated scribed specimens, the initial OCP was less noble than the OCP of coated
samples due to the break in the coating. However, the coating immediately
repassivated as a result of redox reaction and attended a potential close to the potential
of coated steel and matched up to the end of the immersion period. The finding of
OCP measurements suggests that protection mechanism other than barrier effect is
operating. A comparison of the results of OCP in 0.1 M HCl, 5 % NaCl and distilled
water suggest that the difference in the noble shift in steady OCP of copolymer and its

CHAPTER 4
82
nanocomposite coating is associated with the different inherent pH and redox
properties [232]. In 0.1 M HCl, the copolymer in salt form produces a mildly acidic
environment, which less favors the formation of passive oxide layer. This resulted in
less noble shift in OCP value. In NaCl solution, the polymer coatings in base form
provides a highly alkaline environment, which is favorable to passive oxide
formation. This resulted in highest noble shift in OCP for both copolymer and its
nanocomposite. In distilled water, the OCP of nanocomposite is comparable with that
of HCl. This may be accounted to local solution chemistry at coating/mild steel
interface, which might have been less favorable to oxide layer formation.
The results of potentiodynamic polarization measurements indicate better
protection of nanocomposite coatings. In case of nanocomposite coatings, the positive
shift in Ecorr, with respect to the Ecorr of uncoated mild steel, in all three media,
namely 0.1 M HCl, 5% NaCl solution and distilled water, is more pronounced than
copolymer coatings. The larger positive shift in Ecorr confirms the best protection of
the mild steel when its surface is covered by poly(AN-co-EA)/ZnO nanocomposite
coating. Also the lowering in the Icorr for nanocomposite coating, with respect to
uncoated mild steel, in all three medium, is more substantial than copolymer coating
indicating the formation of more protective film on the mild steel surface. The
presence of poly(AN-co-EA)/ZnO nanocomposite coating on mild steel substrate
reduces the anodic dissolution and provides the perfect coverage and best protection.
In case of coated scribed specimens though there is some deterioration in the
protective properties of the coatings, due to the damage inflicted on the coatings, but
still there is appreciable reduction in Ecorr and Icorr values and hence a reduction in
corrosion rate. Considering the results of potentiodynamic polarization measurements
performed on the coated samples obtained after exposure to open atmospheric test.
Some deterioration in the performance of the coatings due to their detachment from
the substrate was observed but they still maintained the protective properties giving
good protection to the mild steel surface. The nanocomposite coating was found least
affected during the atmospheric exposure test.
The Nyquist plots of coated specimens exhibit one time constant (capacitive
and resistive behavior) with significantly high impedance. A simplistic circuit (Fig.
4.1) consisting of a resistor in series to parallel connected capacitor and resistor is
applied to extract different parameters like, charge transfer resistance, Rct and double
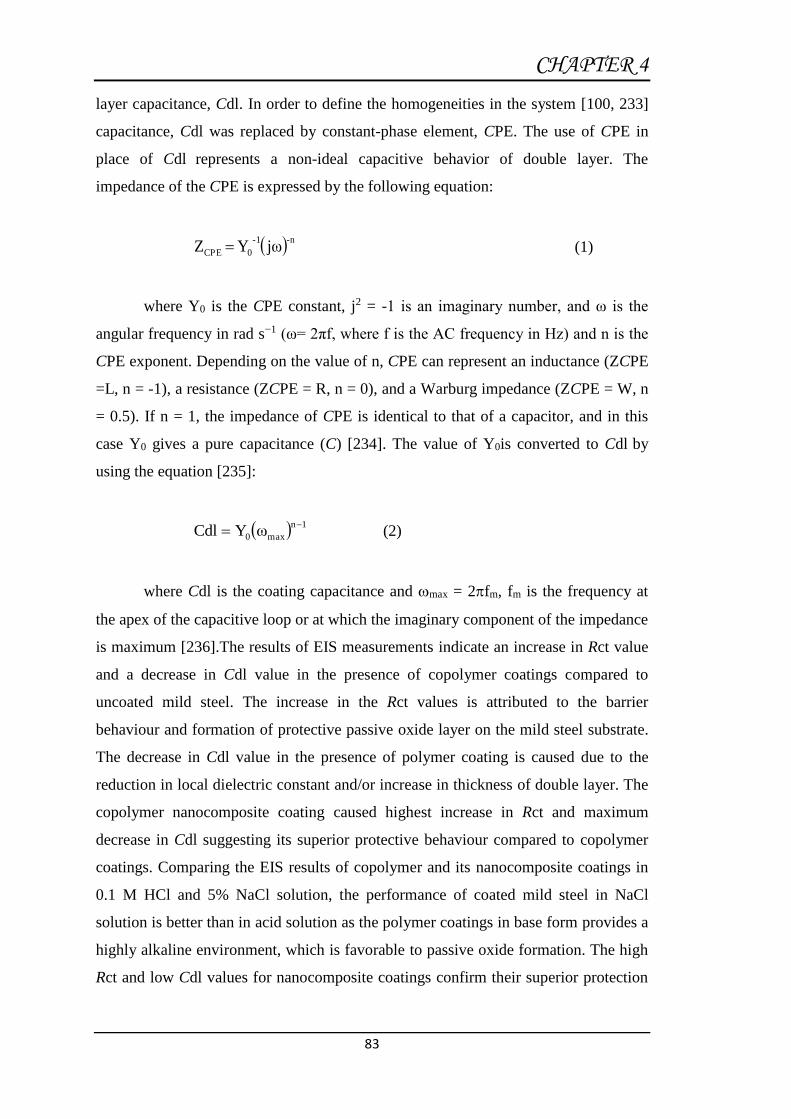
CHAPTER 4
83
layer capacitance, Cdl. In order to define the homogeneities in the system [100, 233]
capacitance, Cdl was replaced by constant-phase element, CPE. The use of CPE in
place of Cdl represents a non-ideal capacitive behavior of double layer. The
impedance of the CPE is expressed by the following equation:
jωY Z-n-1
0CPE (1)
where Y0 is the CPE constant, j2 = -1 is an imaginary number, and ω is the
angular frequency in rad s−1 (ω= 2πf, where f is the AC frequency in Hz) and n is the
CPE exponent. Depending on the value of n, CPE can represent an inductance (ZCPE
=L, n = -1), a resistance (ZCPE = R, n = 0), and a Warburg impedance (ZCPE = W, n
= 0.5). If n = 1, the impedance of CPE is identical to that of a capacitor, and in this
case Y0 gives a pure capacitance (C) [234]. The value of Y0is converted to Cdl by
using the equation [235]:
1n
max0 ωYCdl
(2)
where Cdl is the coating capacitance and max = 2fm, fm is the frequency at
the apex of the capacitive loop or at which the imaginary component of the impedance
is maximum [236].The results of EIS measurements indicate an increase in Rct value
and a decrease in Cdl value in the presence of copolymer coatings compared to
uncoated mild steel. The increase in the Rct values is attributed to the barrier
behaviour and formation of protective passive oxide layer on the mild steel substrate.
The decrease in Cdl value in the presence of polymer coating is caused due to the
reduction in local dielectric constant and/or increase in thickness of double layer. The
copolymer nanocomposite coating caused highest increase in Rct and maximum
decrease in Cdl suggesting its superior protective behaviour compared to copolymer
coatings. Comparing the EIS results of copolymer and its nanocomposite coatings in
0.1 M HCl and 5% NaCl solution, the performance of coated mild steel in NaCl
solution is better than in acid solution as the polymer coatings in base form provides a
highly alkaline environment, which is favorable to passive oxide formation. The high
Rct and low Cdl values for nanocomposite coatings confirm their superior protection
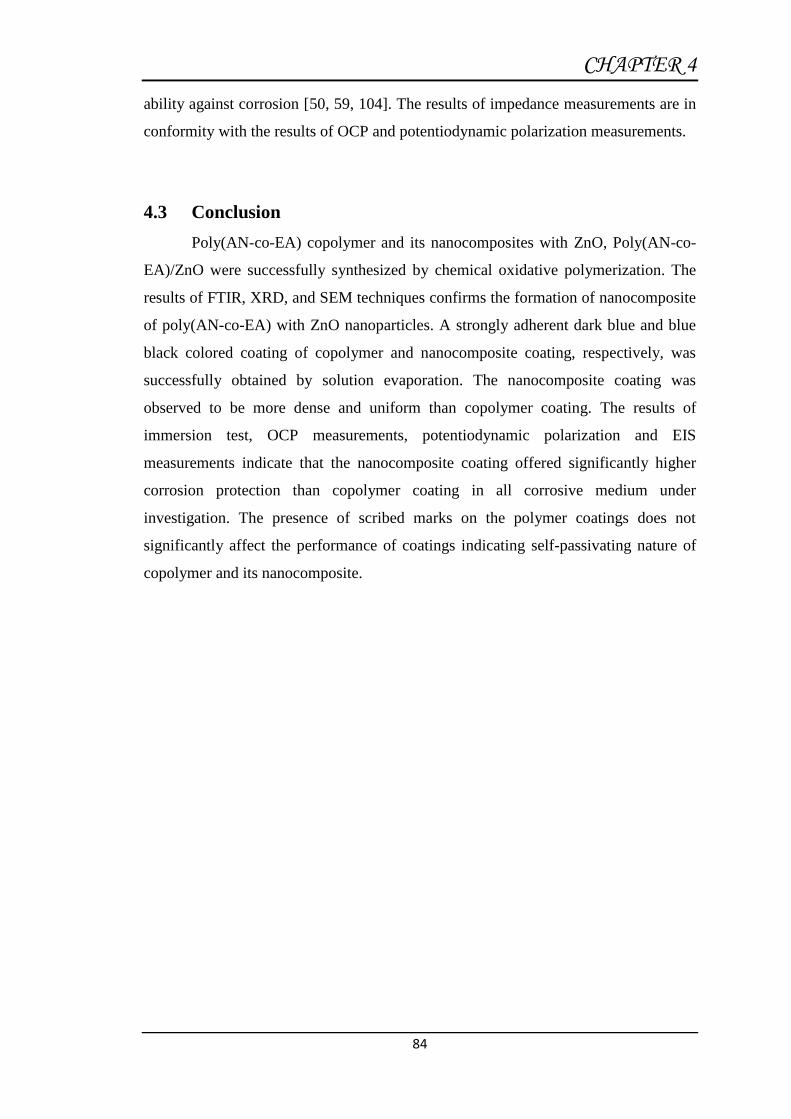
CHAPTER 4
84
ability against corrosion [50, 59, 104]. The results of impedance measurements are in
conformity with the results of OCP and potentiodynamic polarization measurements.
4.3 Conclusion
Poly(AN-co-EA) copolymer and its nanocomposites with ZnO, Poly(AN-co-
EA)/ZnO were successfully synthesized by chemical oxidative polymerization. The
results of FTIR, XRD, and SEM techniques confirms the formation of nanocomposite
of poly(AN-co-EA) with ZnO nanoparticles. A strongly adherent dark blue and blue
black colored coating of copolymer and nanocomposite coating, respectively, was
successfully obtained by solution evaporation. The nanocomposite coating was
observed to be more dense and uniform than copolymer coating. The results of
immersion test, OCP measurements, potentiodynamic polarization and EIS
measurements indicate that the nanocomposite coating offered significantly higher
corrosion protection than copolymer coating in all corrosive medium under
investigation. The presence of scribed marks on the polymer coatings does not
significantly affect the performance of coatings indicating self-passivating nature of
copolymer and its nanocomposite.

CHAPTER 4
85
Table 4.1 Results of immersion tests
Corrosive
Medium
Description of the
sample
Immersion
period (days)
Corrosion*
rate (mpy)
% PE
0.1 M HCl Uncoated steel 30 23.67 -
Poly(AN-co-EA)coated ” 4.46 81.15
Poly(AN-co-EA)coated
scribed ” 5.65 76.12
Poly(AN-co-EA)/ZnO
coated ” 2.57 89.12
Poly(AN-co-EA)/ZnO
coated scribed ” 3.53 85.05
5% NaCl
solution
Uncoated steel 30 6.00 -
Poly(AN-co-EA)coated ” 1.64
72.64
Poly(AN-co-EA)coated
scribed ” 1.81
69.76
Poly(AN-co-EA)/ZnO
coated ” 1.21
79.73
Poly(AN-co-EA)/ZnO
coated scribed ” 1.50
75.00
Distilled water Uncoated steel 30 5.07 -
Poly(AN-co-EA)coated ” 0.507 90.00
Poly(AN-co-EA)coated
scribed ” 0.517
89.80
Poly(AN-co-EA)/ZnO
coated ” 0.203
96.00
Poly(AN-co-EA)/ZnO
coated scribed ” 0.386
92.40
* Uncertainties are found to be in the range of 0.48-6.75%

CHAPTER 4
86
Table 4.2 Results of potentiodynamic polarization measurements
Corrosive
Medium
Description of the sample Ecorr
(mv)
Icorr
(A/cm2)
ba
(mV/dec)
bc
(mV/dec)
RP
(/cm2)
CR
(mpy)
Porosity
(P)
0.1 M HCl Uncoated steel -483.65 149.03 144.02 63.27 1.27x10² 68.414 -
Poly(AN-co-EA) coated -382.78 4.11 1481.9 136.82 5.32x10⁴ 1.888 4.70x10⁻⁴
Poly(AN-co-EA) coated scribed
-453.69 6.28 2380.7
458.60 2.65x10⁴ 2.884 2.96x10⁻³
Poly(AN-co-EA)/ZnO coated
-223.40 0.0089 116.26 137.02 3.06x10⁵ 0.040 6.22x10⁻⁶
Poly(AN-co-EA)/ZnO coated scribed
-405.56 1.49 960.26 157.84 3.96x10⁴ 0.683 9.20x10⁻⁴
5% NaCl
solution
Uncoated steel -619.24 15.5 134.78 65.47 1.23x10³ 7.118 -
Poly(AN-co-EA) coated -336.27 0.0069 624.25 180.86 8.53x10⁵ 0.031 1.10x10⁻⁵
Poly(AN-co-EA) coated scribed
-466.77 2.07 98.894
44.66
6.45x10³ 0.950 1.14x10⁻²
Poly(AN-co-EA)/ZnO coated
-176.60 0.0014 160.53 255.03 3.02x10⁶ 0.006 2.13x10⁻⁷
Poly(AN-co-EA)/ZnO coated scribed
-469.75 0.0887 101.89 37.783 1.34x10⁴ 0.407 7.00x10⁻³
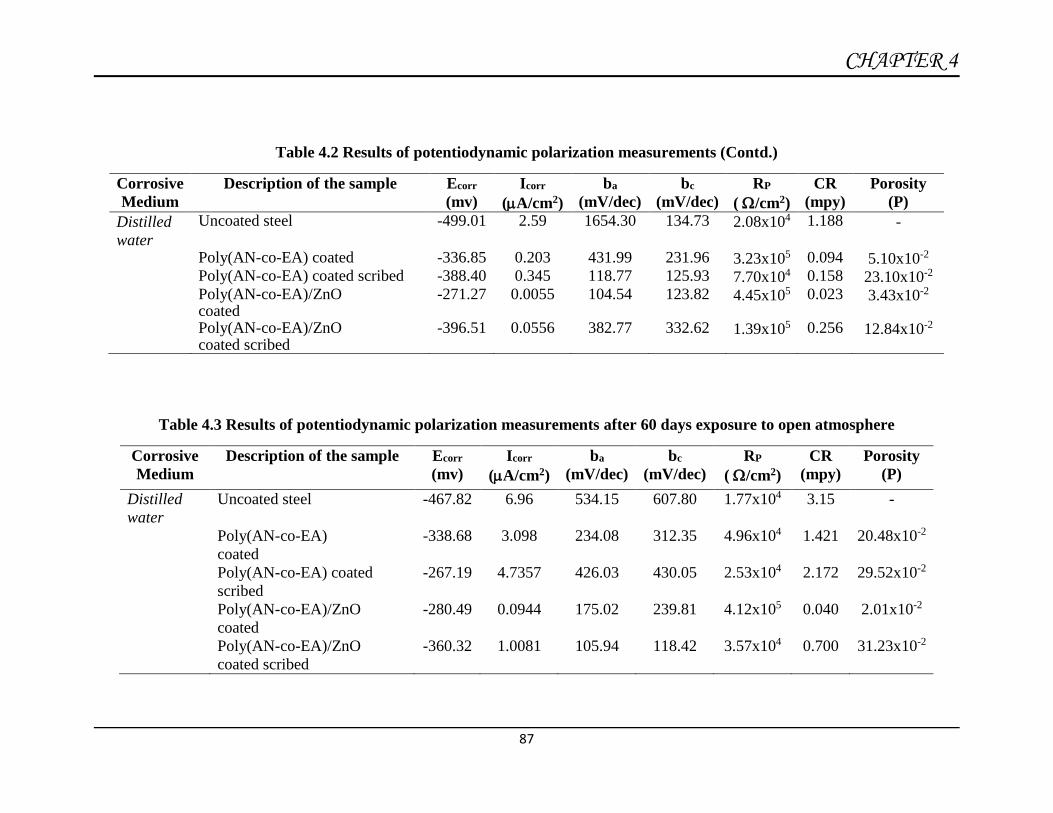
CHAPTER 4
87
Table 4.2 Results of potentiodynamic polarization measurements (Contd.)
Corrosive
Medium
Description of the sample Ecorr
(mv)
Icorr
(A/cm2)
ba
(mV/dec)
bc
(mV/dec)
RP
(/cm2)
CR
(mpy)
Porosity
(P)
Distilled
water
Uncoated steel -499.01 2.59 1654.30 134.73 2.08x10⁴ 1.188 -
Poly(AN-co-EA) coated -336.85 0.203 431.99 231.96 3.23x10⁵ 0.094 5.10x10⁻²
Poly(AN-co-EA) coated scribed -388.40 0.345 118.77 125.93 7.70x10⁴ 0.158 23.10x10⁻²
Poly(AN-co-EA)/ZnO coated
-271.27 0.0055 104.54 123.82 4.45x10⁵ 0.023 3.43x10⁻²
Poly(AN-co-EA)/ZnO coated scribed
-396.51 0.0556 382.77 332.62 1.39x10⁵ 0.256 12.84x10⁻²
Table 4.3 Results of potentiodynamic polarization measurements after 60 days exposure to open atmosphere
Corrosive
Medium
Description of the sample Ecorr
(mv)
Icorr
(A/cm2)
ba
(mV/dec)
bc
(mV/dec)
RP
(/cm2)
CR
(mpy)
Porosity
(P)
Distilled
water
Uncoated steel
-467.82 6.96 534.15 607.80 1.77x10⁴ 3.15 -
Poly(AN-co-EA)
coated
-338.68 3.098 234.08 312.35 4.96x10⁴ 1.421 20.48x10⁻²
Poly(AN-co-EA) coated
scribed
-267.19 4.7357 426.03 430.05 2.53x10⁴ 2.172 29.52x10⁻²
Poly(AN-co-EA)/ZnO
coated
-280.49 0.0944 175.02 239.81 4.12x10⁵ 0.040 2.01x10⁻²
Poly(AN-co-EA)/ZnO
coated scribed
-360.32 1.0081 105.94 118.42 3.57x10⁴ 0.700 31.23x10⁻²

CHAPTER 4
88
Table 4.4 Results of electrochemical impedance spectroscopy (EIS) measurements
Corrosive
Medium
Description of the
sample
Rs
(Ω cm2)
Rct
(Ω cm2)
Cdl
(µFcm-2)
(%) PE
0.1 M HCl Uncoated steel 22.74 68.96 9.45x10⁻⁵ -
Poly(AN- co-EA)
coated
118.25
1433.30
2.47x10⁻⁵ 95.18
Poly(AN- co-EA)
coated scribed
98.59
1038.90
2.82x10⁻⁵ 93.36
Poly(AN- co-EA)/ZnO
coated
70.22 2330.90 1.14x10⁻⁷ 97.04
Poly(AN- co-EA)/ZnO
coated scribed
280.62
1781.60
6.43x10⁻⁶ 96.12
5% NaCl solution
Uncoated steel 6.31 442.63 3.5x10⁻⁴ -
Poly(AN- co-EA)
coated
12.65 15011.00 1.07x10⁻⁶ 97.05
Poly(AN- co-EA)
coated scribed
635.03 3758.20 1.99x10⁻⁶ 88.22
Poly(AN- co-EA)/ZnO
coated
827.61 20514.00 6.74x10⁻⁸ 97.84
Poly(AN- co-EA)/ZnO
coated
262.51 17338.00 2.46x10⁻⁷ 97.44

CHAPTER 4
89
Figure 4.1: FTIR absorption spectra of (a) Poly(AN-co-EA) copolymer and (b)
Poly(AN-co-EA)/ZnO nanocomposite

CHAPTER 4
90
Figure 4.2: XRD patterns of (a) Poly(AN-co-EA) copolymer and (b) Poly(AN-co-
EA)/ZnO nanocomposite
(a)
(b)
Figure 4.3: SEM images of (a) Poly(AN-co-EA) copolymer and (b) Poly(AN-co-
EA)/ZnO nanocomposite

CHAPTER 4
91
Figure 4.4: TEM micrograph of Poly(AN-co- EA)/ZnO nanocomposite
Figure 4.5: OCP variations of uncoated, coated and scribed steel during 200 h
immersion in 0.1 M HCl

CHAPTER 4
92
Figure 4.6: OCP variations of uncoated, coated and scribed steel during 200 h
immersion in 5% NaCl
Figure4.7: OCP variations of uncoated, coated and scribed steel during 200 h
immersion in Distilled water

CHAPTER 4
93
Figure 4.8: Potentiodynamic polarization curves in 0.1 M HCl for (a) Uncoated steel;
(b) Poly(AN-co-EA) coated (Fresh sample); (c) Poly(AN-co-EA) coated
scribed (Fresh sample); (d) Poly(AN-co-EA)/ZnO coated (Fresh sample)
and (e) Poly(AN-co-EA)/ZnO coated scribed (Fresh sample)
Figure 4.9: Potentiodynamic polarization curves in 5% NaCl for (a) Uncoated steel;
(b) Poly(AN-co-EA) coated (Fresh sample); (c) Poly(AN-co-EA) coated
scribed (Fresh sample); (d) Poly(AN-co-EA)/ZnO coated (Fresh sample)
and (e) Poly(AN-co-EA)/ZnO coated scribed (Fresh sample)
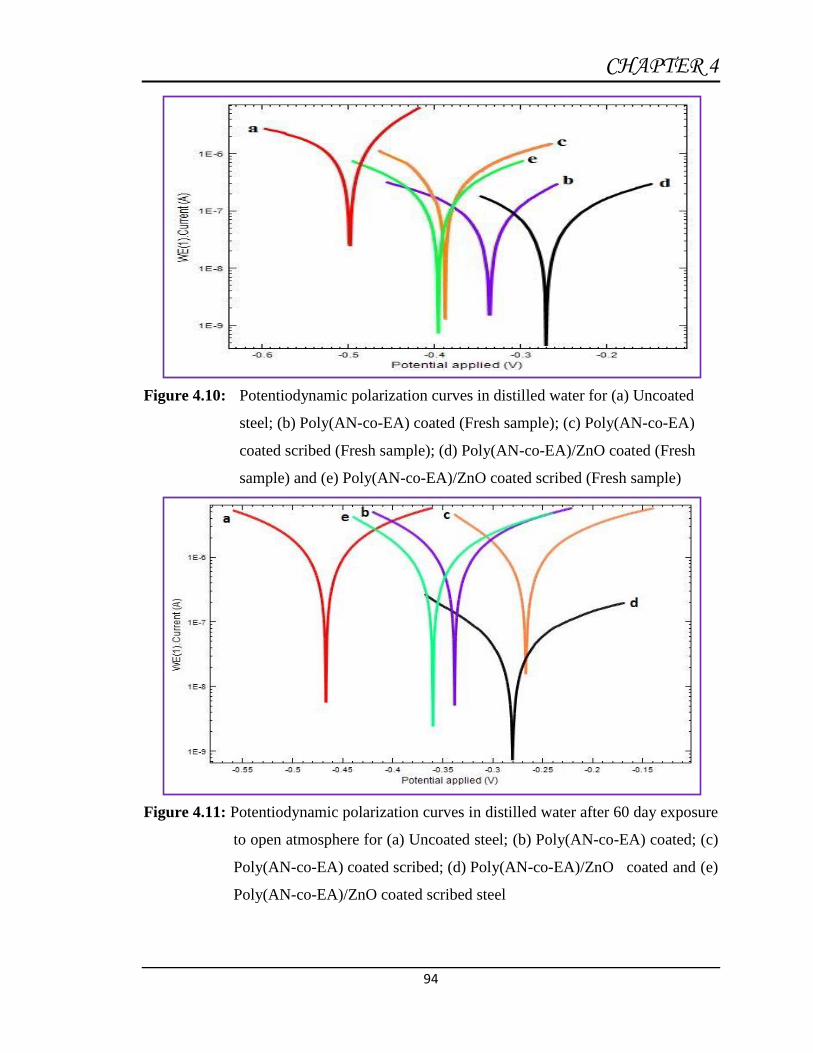
CHAPTER 4
94
Figure 4.10: Potentiodynamic polarization curves in distilled water for (a) Uncoated
steel; (b) Poly(AN-co-EA) coated (Fresh sample); (c) Poly(AN-co-EA)
coated scribed (Fresh sample); (d) Poly(AN-co-EA)/ZnO coated (Fresh
sample) and (e) Poly(AN-co-EA)/ZnO coated scribed (Fresh sample)
Figure 4.11: Potentiodynamic polarization curves in distilled water after 60 day exposure
to open atmosphere for (a) Uncoated steel; (b) Poly(AN-co-EA) coated; (c)
Poly(AN-co-EA) coated scribed; (d) Poly(AN-co-EA)/ZnO coated and (e)
Poly(AN-co-EA)/ZnO coated scribed steel

CHAPTER 4
95
Figure 4.12: Nyquist curves in 0.1 M HCl for (a) Uncoated steel (Inset); (b) Poly(AN-
co-EA) coated; (c) Poly(AN-co-EA) coated scribed; (d) Poly(AN-co-
EA)/ZnO coated and (e) Poly(AN-co-EA)/ZnO coated scribed
Figure 4.13: Nyquist curves in 5% NaCl for (a) Uncoated steel (Inset); (b) Poly(AN-co-
EA) coated; (c) Poly(AN-co-EA) coated scribed; (d) Poly(AN-co-
EA)/ZnO coated and (e) Poly(AN-co-EA)/ZnO coated scribed
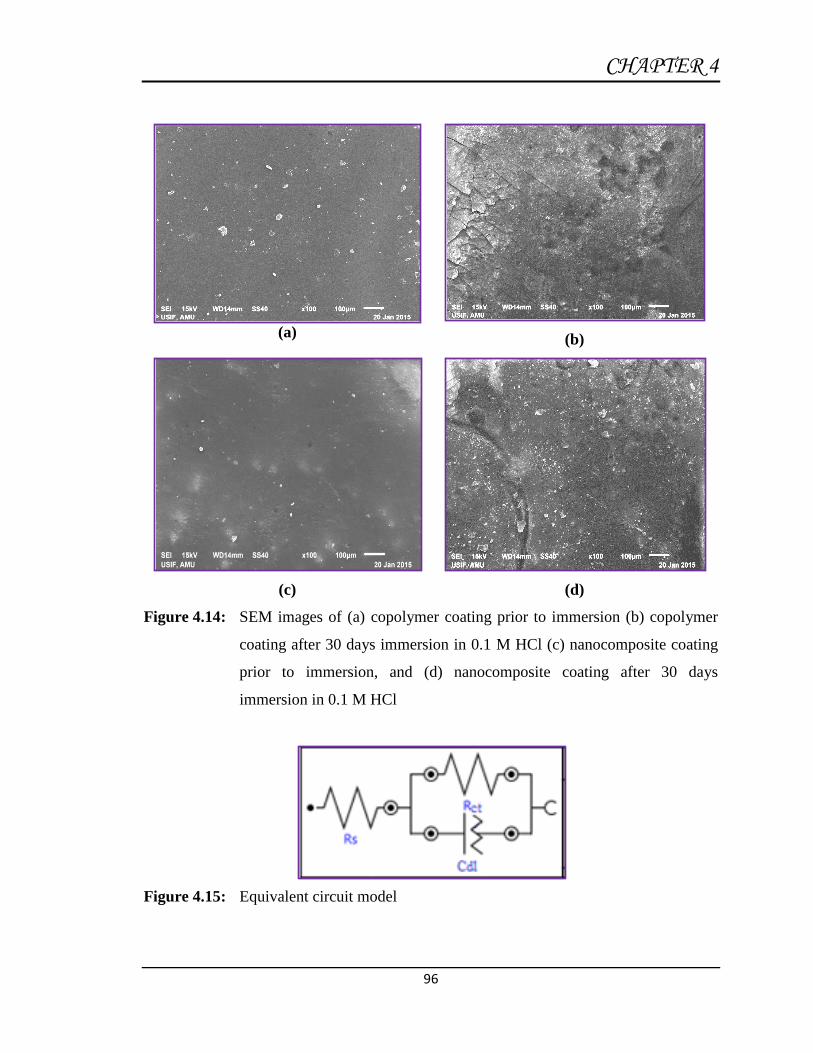
CHAPTER 4
96
(a)
(b)
(c)
(d)
Figure 4.14: SEM images of (a) copolymer coating prior to immersion (b) copolymer
coating after 30 days immersion in 0.1 M HCl (c) nanocomposite coating
prior to immersion, and (d) nanocomposite coating after 30 days
immersion in 0.1 M HCl
Figure 4.15: Equivalent circuit model

Chapter 5

Anticorrosion behavior of poly(aniline-co-2, 3-
xylidine)/ZnO nanocomposite coating on
mild steel
Journal of Adhesion Science and Technology, 31 (2017) 749

CHAPTER 5
97
5.1 Results
5.1.1 Characterization of poly(aniline-co-2, 3-xylidine) [poly(AN-co-XY)],
poly(aniline-co-2, 3-xylidine)/ZnO [poly(AN-co-XY)/ZnO] nanocomposite,
polyaniline [PANi] and poly(2, 3-xylidine)
FTIR studies
Figure 5.1 show the FTIR spectra of the pure copolymer poly(aniline-co-2, 3-
xylidine), its nanocomposite with 10% ZnO nanoparticles, poly(aniline-co-2, 3-
xylidine)/ZnO, polyaniline (PANi) and poly(2, 3-xylidine). FTIR spectrum of
poly(aniline-co-2, 3-xylidine) shows a broad band centered at 3357 cm−1, which is
attributed to the characteristic N-H stretching vibration of a secondary amine (-NH-)
group (Fig. 5.1a) [209]. The peaks at 2925 and 2857 cm−1 are attributed to the C-H
stretching vibrations in CH3 groups. Two peaks at 1588 and 1486 cm−1 are assigned to
quinoid and benzenoid rings, respectively [210]. A weak peak at 1376 cm−1 is
assigned to C-N stretching vibration in quinoid imine units and a strong peak at 1284
cm−1 is attributed to the C-N stretching vibration in alternating unit of the quinoid-
benzenoid-quinoid. The peak at 1150 cm−1 is considered as a measure of the degree of
the delocalization of electrons [211]. The peak at 819 cm−1 is attributed to C-H out of
plane bending vibration of p-disubstituted ring. These IR bands verified the formation
of copolymer poly(aniline-co-2, 3-xylidine). Figure 5.1 (b) shows the spectrum of
copolymer nanocomposite, poly(aniline-co-2, 3-xylidine)/ZnO, where respective
vibrational bands of the both copolymer and ZnO (the Zn-O band appearing at 448
cm−1) are observed. However, the corresponding bands of the pure copolymer have
been shifted to 3407, 2925, 2859, 1589, 1497, 1288, 1151, and 819 cm−1, respectively
in the nanocomposite. In addition, the intensity ratio of the quinonoid band has
changed. These results indicated the existence of hydrogen bonding interaction
between the copolymer and ZnO nanoparticle [176, 237, 238]. The spectra of the
PANi and poly(2, 3-xylidine) are consistent with the reported spectra of the polymers
[239]. The FTIR spectra of PANi is shown in Figure 5.1 (c). The characteristic
absorption bands of PANi are 3425 cm−1 (N-H secondary amine stretching), 2926 and
2857 cm−1 (C-H stretching vibrations in CH3), 1583 and 1495 cm−1 (C=C quinoid and
benzenoid stretching), 1377 cm−1 (C-N amine stretching vibration), 1140 cm−1 (C-H
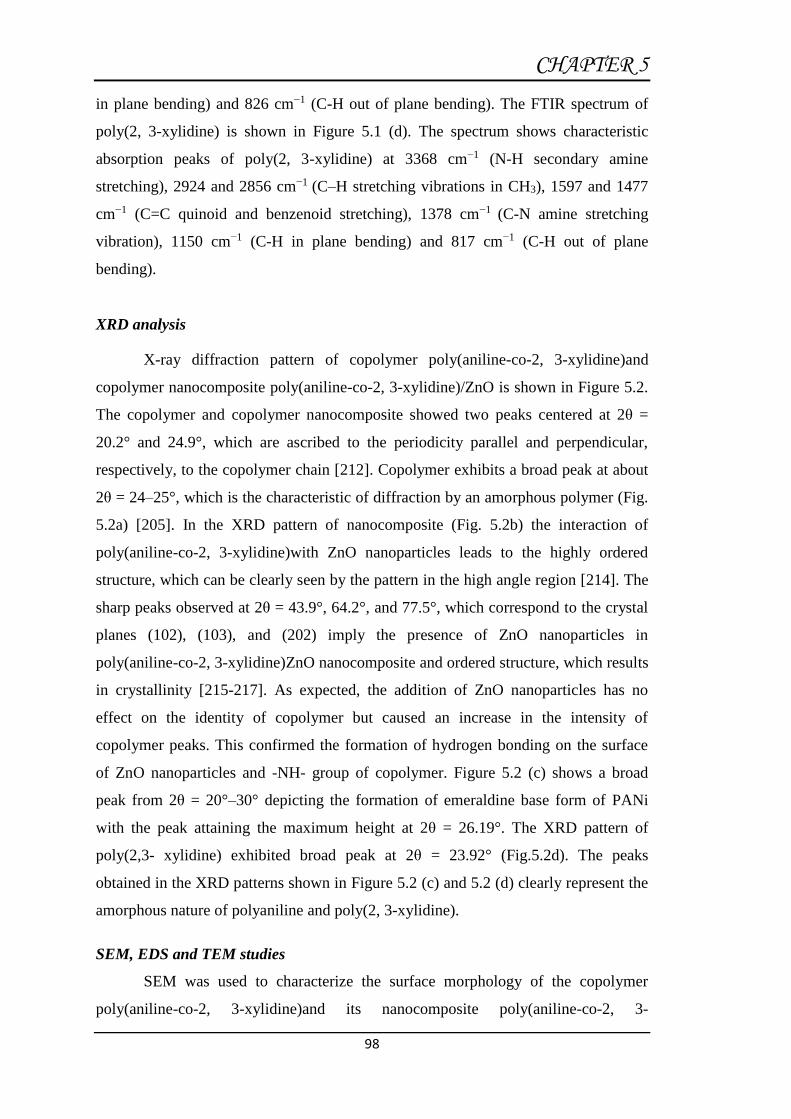
CHAPTER 5
98
in plane bending) and 826 cm−1 (C-H out of plane bending). The FTIR spectrum of
poly(2, 3-xylidine) is shown in Figure 5.1 (d). The spectrum shows characteristic
absorption peaks of poly(2, 3-xylidine) at 3368 cm−1 (N-H secondary amine
stretching), 2924 and 2856 cm−1 (C–H stretching vibrations in CH3), 1597 and 1477
cm−1 (C=C quinoid and benzenoid stretching), 1378 cm−1 (C-N amine stretching
vibration), 1150 cm−1 (C-H in plane bending) and 817 cm−1 (C-H out of plane
bending).
XRD analysis
X-ray diffraction pattern of copolymer poly(aniline-co-2, 3-xylidine)and
copolymer nanocomposite poly(aniline-co-2, 3-xylidine)/ZnO is shown in Figure 5.2.
The copolymer and copolymer nanocomposite showed two peaks centered at 2θ =
20.2° and 24.9°, which are ascribed to the periodicity parallel and perpendicular,
respectively, to the copolymer chain [212]. Copolymer exhibits a broad peak at about
2θ = 24–25°, which is the characteristic of diffraction by an amorphous polymer (Fig.
5.2a) [205]. In the XRD pattern of nanocomposite (Fig. 5.2b) the interaction of
poly(aniline-co-2, 3-xylidine)with ZnO nanoparticles leads to the highly ordered
structure, which can be clearly seen by the pattern in the high angle region [214]. The
sharp peaks observed at 2θ = 43.9°, 64.2°, and 77.5°, which correspond to the crystal
planes (102), (103), and (202) imply the presence of ZnO nanoparticles in
poly(aniline-co-2, 3-xylidine)ZnO nanocomposite and ordered structure, which results
in crystallinity [215-217]. As expected, the addition of ZnO nanoparticles has no
effect on the identity of copolymer but caused an increase in the intensity of
copolymer peaks. This confirmed the formation of hydrogen bonding on the surface
of ZnO nanoparticles and -NH- group of copolymer. Figure 5.2 (c) shows a broad
peak from 2θ = 20°–30° depicting the formation of emeraldine base form of PANi
with the peak attaining the maximum height at 2θ = 26.19°. The XRD pattern of
poly(2,3- xylidine) exhibited broad peak at 2θ = 23.92° (Fig.5.2d). The peaks
obtained in the XRD patterns shown in Figure 5.2 (c) and 5.2 (d) clearly represent the
amorphous nature of polyaniline and poly(2, 3-xylidine).
SEM, EDS and TEM studies
SEM was used to characterize the surface morphology of the copolymer
poly(aniline-co-2, 3-xylidine)and its nanocomposite poly(aniline-co-2, 3-

CHAPTER 5
99
xylidine)/ZnO, PANi and poly(2, 3-xylidine). The homopolymers and copolymer
show a typical amorphous morphology, which is further confirmed by XRD. There is
a significant difference in the morphology of homopolymers and copolymer. In the
SEM micrograph of copolymer nanocomposite the growth of a chain pattern of the
copolymer and presence of ZnO nanoparticles between the junctions of copolymer
chain network is evident. The ZnO nanoparticles, which are global and slightly
agglomerated, are fairly dispersed in the copolymer matrix. The SEM micrographs are
given in Figure 5.3 (a-d).
The typical EDS profile of copolymer and its nanocomposite is shown in
Figure 5.4 (a and b). In copolymer the characteristic peaks of elements constituting
the copolymer are evident, whereas in copolymer nanocomposite additional peaks of
Zn are observed.
Figure 5.5 shows the TEM micrograph of poly(aniline-co-2, 3-xylidine)/ZnO
nanocomposite, which clearly reveals the size range of ZnO nanoparticles i.e. 25-30
nm and their homogeneous dispersion and embedment in the copolymer matrix. This
is an indication that the ZnO interacts with copolymer by the forming H-bonding
between the proton on N–H and the oxygen atom on ZnO surface.
5.1.2 Immersion test
The results of immersion tests for coated mild steel specimens along with
uncoated mild steel in 3.5% NaCl as corrosive solution are shown in Table 5.1. The
test was carried out under static condition at room temperature for the immersion
period of 30 days. The protection efficiency (PE) of poly(AN-co-XY)/ZnO
nanocomposite coatings was observed to be highest (97.16%); this was followed by
poly(AN-co-XY) (93.83%), PANi (81.66%) and poly(2, 3-xylidine) (78.50%)
coatings.
5.1.3 Free corrosion potential measurements
The OCP measurements of uncoated steel, poly(AN-co-XY)/ZnO, poly(AN-
co-XY), PANi and poly(2, 3-xylidine) coated mild steel samples, were carried out in
3.5% NaCl solution at 30±2 °C for a period of 12000s. The change in voltage against
SCE used as reference electrode was plotted vs. time and the results are reported in
Figure 5.6. The OCP of uncoated steel is shifted toward negative values showing a
potential of -597 mV vs. SCE at the completion of immersion. The non-attainment of

CHAPTER 5
100
steady OCP indicated the general-type corrosion of uncoated steel in 3.5% NaCl
solution. Compared with the uncoated steel, the potentials of coated steels are shifted
toward more positive (noble) values. Though there is some initial increase (negative
shift) in the potential of coated steels due to deterioration in the protective properties
of coatings but they attained and maintained a steady-state OCP much nobler than the
potential of bare steel. The noble shift in OCP of coated steel compared to bare steel
is highest for nanocomposite poly(AN-co-XY)/ZnO coating (395 mV vs. SCE), this is
followed by copolymer Poly(AN-co-XY) (270 mV vs. SCE) and homopolymers;
PANi (126 mV vs. SCE) and poly(2, 3-xylidine) (105 mV vs. SCE).
5.1.4 Potentiodynamic polarization measurements
The potentiodynamic polarization curves for uncoated steel, copolymer
nanocomposite poly(AN-co-XY)/ZnO, copolymer poly(AN-co-XY), and
homopolymers PANi and poly(2, 3- xylidine) coated steel in 3.5% NaCl solution at
30±2 °C after 2 h of immersion are shown in Figure 5.7. The electrochemical
parameters: corrosion potential (Ecorr), corrosion current density (Icorr), and
protection efficiency (PE) are calculated and listed in Table 5.2. It can be seen from
Table 5.2 that compared to the uncoated steel, the coated steel specimens exhibited
more positive Ecorr and significantly lower Icorr values, suggesting the formation of
a stable passive film by the polymer coatings and protection of the underlying mild
steel. The highest positive shift in Ecorr (397 mV vs. Ag/AgCl) or greater lowering in
Icorr (3.61 × 10⁻³ A/cm2) for nanocomposite coatings as compared to the copolymer
(270 mV vs. Ag/AgCl and 8.58×10⁻² A/cm2) or homopolymers, PANi (110 mV vs.
Ag/AgCl and 10.9×10⁻² A/cm2) and poly(2, 3-xylidine) (113 mV vs. Ag/AgCl and
28.7×10⁻² A/cm2) coatings implied that the nanocomposite coating provides more
effective protection to the mild steel in 3.5% NaCl solution.
The anticorrosion performance of nanocomposite coating was also evaluated
at different immersion times for an extended period of 60 days and the results are
shown in Figure 5.8 and Table 5.3. With increasing immersion period the protective
property of coating was diminished and a lowering in Icorr was observed but the
coating still showed good protection efficiency of 77.46% for a period extending 30
days.
CHAPTER 5
101
5.1.5 Electrochemical impedance spectroscopy measurements
The impedance behavior of poly(AN-co-XY)/ZnO, poly(AN-co-XY), PANi
and poly (2, 3-xylidine) coatings were studied in 3.5% NaCl at OCP condition for 2 h
at 30 °C and the impedance spectra obtained as Nyquist and Bode plots are shown in
Figure 5.9. Nyquist plots (Fig. 5.9 a) show depressed semicircle for both coated and
bare steel specimen, probably due to the presence of corrosion product or surface
heterogeneity on steel substrate, and diameter of the semicircle increased in presence
of polymer coatings. Highest increase in diameter of the semicircle was observed for
copolymer nanocomposite coating; this was followed by pure copolymer and
homopolymers PANi and poly(2, 3-xylidine). This indicated highest protection ability
of copolymer nanocomposite coating over copolymer and homopolymer coatings.
Calculated EIS parameters are listed in Table 5.4. From the Table 5.4 it is apparent
that compared to the bare steel the values of Rct increases, whereas the value of Cdl
decreases in presence of polymer coatings. The increase in the Rct values or decrease
in Cdl values in presence of polymer coatings show better protection ability of
coatings. Again the copolymer nanocomposite coating caused highest increase in Rct
(5.22x10⁴ Ωcm2) and maximum decrease in Cdl (2.90x10⁻⁵ µFcm-2), suggesting its
superior anticorrosion behavior compared to pure copolymer (Rct 3.27x10³ Ωcm2 and
Cdl 5.64x10⁻⁵ µFcm-2) and homopolymers PANi (Rct 7.51x10² Ωcm2 and Cdl
2.40x10⁻³ µFcm-2) and Poly(2,3-xylidine) (Rct 3.43x10² Ωcm2 and Cdl 3.20x10⁻³
µFcm-2) coatings. The Bode impedance magnitude and phase angle plots recorded for
coated mild steel electrode immersed in 3.5% NaCl are given in Figure 5.9 (b) and 5.9
(c). In presence of copolymer nanocomposite coating highest increase in the value of
absolute impedance at low frequencies or more negative value of phase angle at
higher frequencies is observed. The EIS results of copolymer nanocomposite coating
evaluated for an extended period of 60 days are shown in Figure 5.10 and Table 5.5.
5.1.6 Surface morphological studies
Figure 5.11(a-d) shows the typical SEM images of the pure copolymer and
copolymer nanocomposite coatings on the mild steel substrate before and after 60
days of immersion in 3.5% NaCl solution. Prior to immersion in 3.5% NaCl solution,
the copolymer (Fig. 5.11a) and nanocomposite (Fig. 5.11c) coatings showed a surface
free from any cracks or defects. Figure 5.11(b and d) illustrates morphology of the
copolymer and nanocomposite coating after 60 days of immersion in corrosive
CHAPTER 5
102
environment. It is apparent from the SEM images that the nanocomposite coating
provided homogenous, crack-free surface with negligible defect, whereas the
copolymer coating had surface defects. This accounted for the higher corrosion
protection performance of the nanocomposite coating as compared to copolymer
coating.
5.2 Discussion
The corrosion protection performance of poly(AN-co-XY)/ZnO
nanocomposite coating on mild steel was investigated in 3.5% NaCl solution as
corrosive medium by subjecting it to different corrosion tests which include:
immersion test, free corrosion potential (OCP) measurements, potentiodynamic
polarization measurements, and electrochemical impedance spectroscopy
measurements. The corrosion performance of nanocomposite was also compared with
the performance of poly(AN-co-XY) copolymer, PANi and poly(2, 3-xylidine)
homopolymers.
The results of immersion test (Table 5.1) indicate that poly(AN-co-XY)/ZnO
nanocomposite coating performed better than the copolymer coatings. The better
performance of nanocomposite coating is because of its superior barrier property. The
presence of ZnO nanoparticles in the poly(AN-co-XY) copolymer film restricted the
penetration and diffusion path of corrosive species and caused an improvement in the
PE [176]. Further, the typical flaky microstructure of poly(AN-co-OA)/ZnO
nanocomposite also restricted the diffusion path of corrosive species to the underlying
metal. In addition to the above, in the nanocomposite coating, the PANi as p-type
semiconductor and ZnO as n-type semiconductor may form a p-n junction, which may
further limit the passage of electrolyte to the base metal [126, 218, 219]. The better
protection ability of PANi over poly(2, 3-xylidine) is attributed to increased
participation of PANi in oxide formation.
Considering the results of OCP measurements, a noble shift in potential
indicates greater resistance properties of surface film toward corrosion, [220] which
might be due to barrier effect and formation of a passive oxide by redox reaction at
the coating/steel interface [221]. Barrier effect operates till the coatings are
undamaged, adherent and isolate the steel from the 3.5% NaCl solution. As the period
of immersion is increased the corrosive solution penetrates through the pores in the
CHAPTER 5
103
coating and attack the underneath steel surface. When sufficient amount of corrosive
solution reaches the steel surface the process of corrosion is initiated at the
coating/steel interface. This leads to increase in OCP, i.e. shifting OCP to less noble
values. Increase in OCP is interrupted and a subsequent noble shift in OCP is
observed, which is again followed by an increase in OCP until a steady potential is
observed. The subsequent positive shift in the OCP is due to the formation of passive
film on the steel substrate because of the presence of PANi in the polymer coatings
[107, 126, 139, 140, 159]. Hence we can say that the porosity of coatings largely
affects the initiation and progression of corrosion at the coating/steel interface and the
fluctuation (increase/decrease) in potential is due to competitive diffusion of
electrolyte/re-passivating behavior of polymer coatings on steel surface. The
formation of passive oxide layer at the mild steel/polymer interface is explained as
follows:
PANim+ + m∕3 Fe → PANio + m∕3 Fe+3 (1)
PANio + mO2 + 2mH2O → PANim+ + 4mOH− (2)
2Fe+3 + 6OH− → Fe2O3 + 3H2O (3)
PANim+ oxidizes Fe/Fe2+ to Fe3+ and itself reduced to PANio. The PANio again
gets oxidized to PANim+ after the reaction with dissolved oxygen. Fe3+ reacts with the
OH− ion to form a hard insoluble Fe2O3 passive layer. The generation of the passive
Fe2O3 oxide layer is accelerated due to the redox catalytic effect of PANio. This
passive layer prevents the oxidation of inner metal surface and thus protects the
corrosion of the mild steel. This process occurs in cyclic order till the PANi layer
remains active. In case of pure copolymer, during the immersion in 3.5% NaCl
solution the aggressive chloride ions from the electrolyte transfer/penetrate through
the coating and induce the breakdown of the passive oxide and accelerate the anodic
dissolution of mild steel. In copolymer-nanocomposite coating the ZnO acts as filler
and improves the resistance of the coating toward chloride ion penetration and
reduces the corrosion process significantly. Zn may also convert to Zn2+ and inhibit
the corrosion of underlying metallic substrate by interacting with the imine nitrogen
atom of the copolymer and changing the morphology and structure of the copolymer
CHAPTER 5
104
into compact cluster [176]. Further, the PANi in the copolymer as p-type
semiconductor and ZnO as n-type semiconductor may form a p–n junction which
allows corrodents to transport in only one direction in the nanocomposite coating and
thus limiting the passage of electrolyte to the metal substrate [126, 218]. The redox
behavior of copolymer is significantly improved by the presence of ZnO
nanoparticles.
The analysis of potentiodynamic polarization curves show noble shift (positive
shift) in Ecorr, substantial reduction in Icorr, and an increase in PE values of the mild
steel in the presence of both copolymer and copolymer nanocomposite coatings. The
nanocomposite coating provides more effective protection to the mild steel in 3.5 %
NaCl solution by depressing the anodic current of the corrosion reaction [220].
Correspondingly the nanocomposite coating exhibited highest protection efficiency of
99.64% owing to its extraordinary compact microstructure, which led to better barrier
effect and hence superior anticorrosion property. There is a change in the values of
both the Tafel slopes implying that corrosion of mild steel in the presence of
nanocomposite and copolymer coatings is under both anodic and cathodic control.
Compared to the porosity in pure copolymer or homopolymer coatings the porosity in
the nanocomposite coating was found to be one order of magnitude lower in 3.5%
NaCl solution. This again suggested the superior protection behavior of copolymer
nanocomposite coating where access of the electrolyte to the mild steel substrate was
greatly lowered, hence improving its corrosion resistance.
Considering the results of EIS measurements, the increase in the Rct values or
decrease in Cdl values in presence of polymer coatings is attributed to the barrier
effect of coatings along with the development of protective passive oxide film on mild
steel substrate and the reduction in local dielectric constant and/or increase in
thickness of double layer, respectively. The performance of coated mild steel in 3.5%
NaCl solution is better as the polymer coatings in base form provides a highly alkaline
environment, which is favorable to passive oxide formation. The highest increase in
Rct and hence superior protection effect of copolymer nanocomposite coating is
attributed to homogeneously dispersed ZnO nanoparticle in the coating matrix, which
helped in the formation of a uniform passive film on the mild steel surface. The high
Rct and low Cdl values for nanocomposite coatings confirm their superior protection
ability against corrosion [50, 59, 104].Considering the results of Bode plots, in the

CHAPTER 5
105
presence of copolymer nanocomposite the highest increase in the value of absolute
impedance at low frequencies or more negative value of phase angle at higher
frequencies confirmed its superior protection behavior in comparison to copolymer
and homopolymer coatings. Considering the effect of immersion period, with
increasing immersion period the protective properties of coating were diminished and
a lowering in Rct or increase in Cdl values was observed but the coating still offered
good protection for a period extending 60 days. The results of impedance
measurements are in conformity with the results of immersion test, OCP and
potentiodynamic polarization measurements. The morphological studies strongly
supported the results of immersion and electrochemical tests.
5.3 Conclusions
Copolymer nanocomposite poly(aniline-co-2, 3-xylidine)/ZnO, pure
copolymer poly(aniline-co-2, 3-xylidine) and homopolymers, polyaniline and poly(2,
3-xylidine) were synthesized by chemical oxidative polymerization and successfully
developed on mild steel substrate by solution evaporation method. Results of OCP
measurements exhibited nobler potential for coated steel compared to bare mild steel.
The observed noble shift was highest for nanocomposite coating indicating its greater
resistance toward corrosion. Polarization studies revealed more positive shift in Ecorr
and significant lowering in Icorr for coated steel compared to bare steel. The observed
positive shift in Ecorr or lowering in Icorr for nanocomposite coating was highest
compared to copolymer or homopolymers implying that the nanocomposite coating
provides more effective protection to the mild steel in 3.5% NaCl solution. EIS results
indicate increase in Rct or decrease in Cdl values in the presence of polymer coatings
implying development of passive oxide film on steel substrate and reduction in local
dielectric constant and/or increase in thickness of double layer. SEM images show
nanocomposite coated steel with negligible surface defect even after 60 days of
immersion in NaCl solution. The results of studies confirmed sufficiently good
performance of nanocomposite coating even after a prolonged exposure in electrolytic
solution. The superior protection ability of copolymer nanocomposite coating is
attributed to homogeneously dispersed ZnO nanoparticle in the coating matrix, which
helped in the formation of a uniform passive film on the steel surface.
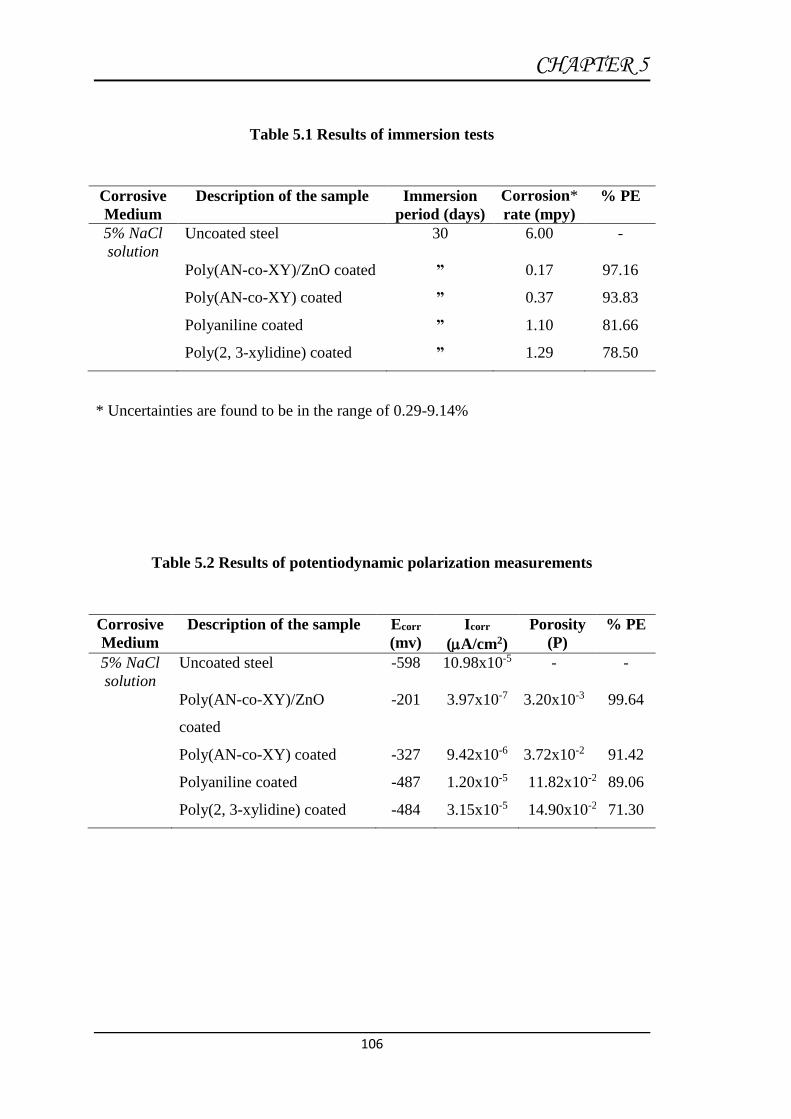
CHAPTER 5
106
Table 5.1 Results of immersion tests
Corrosive
Medium
Description of the sample Immersion
period (days)
Corrosion*
rate (mpy)
% PE
5% NaCl
solution
Uncoated steel 30 6.00 -
Poly(AN-co-XY)/ZnO coated ” 0.17 97.16
Poly(AN-co-XY) coated ” 0.37 93.83
Polyaniline coated ” 1.10 81.66
Poly(2, 3-xylidine) coated ” 1.29 78.50
* Uncertainties are found to be in the range of 0.29-9.14%
Table 5.2 Results of potentiodynamic polarization measurements
Corrosive
Medium
Description of the sample Ecorr
(mv)
Icorr
(A/cm2)
Porosity
(P)
% PE
5% NaCl
solution
Uncoated steel -598 10.98x10⁻⁵ - -
Poly(AN-co-XY)/ZnO
coated
-201 3.97x10⁻⁷ 3.20x10⁻³ 99.64
Poly(AN-co-XY) coated -327 9.42x10⁻⁶ 3.72x10⁻² 91.42
Polyaniline coated -487 1.20x10⁻⁵ 11.82x10⁻² 89.06
Poly(2, 3-xylidine) coated -484 3.15x10⁻⁵ 14.90x10⁻² 71.30
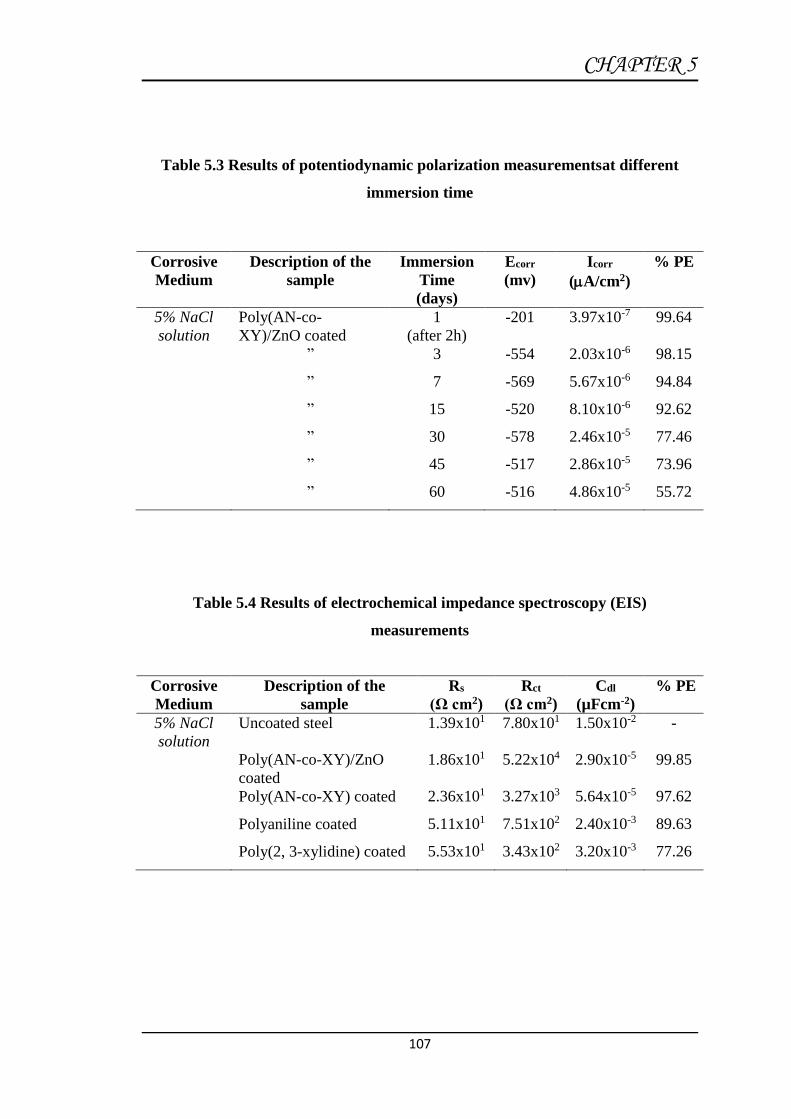
CHAPTER 5
107
Table 5.3 Results of potentiodynamic polarization measurementsat different
immersion time
Corrosive
Medium
Description of the
sample
Immersion
Time
(days)
Ecorr
(mv)
Icorr
(A/cm2)
% PE
5% NaCl
solution
Poly(AN-co-
XY)/ZnO coated
1
(after 2h)
-201 3.97x10⁻⁷ 99.64
” 3 -554 2.03x10⁻⁶ 98.15
” 7 -569 5.67x10⁻⁶ 94.84
” 15 -520 8.10x10⁻⁶ 92.62
” 30 -578 2.46x10⁻⁵ 77.46
” 45 -517 2.86x10⁻⁵ 73.96
” 60 -516 4.86x10⁻⁵ 55.72
Table 5.4 Results of electrochemical impedance spectroscopy (EIS)
measurements
Corrosive
Medium
Description of the
sample
Rs
(Ω cm2)
Rct
(Ω cm2)
Cdl
(µFcm-2)
% PE
5% NaCl
solution
Uncoated steel 1.39x101 7.80x101 1.50x10⁻² -
Poly(AN-co-XY)/ZnO
coated
1.86x101 5.22x10⁴ 2.90x10⁻⁵ 99.85
Poly(AN-co-XY) coated 2.36x101 3.27x10³ 5.64x10⁻⁵ 97.62
Polyaniline coated 5.11x101 7.51x10² 2.40x10⁻³ 89.63
Poly(2, 3-xylidine) coated 5.53x101 3.43x10² 3.20x10⁻³ 77.26

CHAPTER 5
108
Table 5.5 Results of electrochemical impedance spectroscopy (EIS)
measurementsat different immersion time
Corrosive
Medium
Description
of the sample
Immersion
Time
(days)
Rs
(Ω cm2)
Rct
(Ω cm2)
Cdl
(µFcm-2)
% PE
5% NaCl
solution
Poly(AN-co-
XY)/ZnO
coated
1
(after 2h)
1.86x101 5.22x10⁴ 2.90x10⁻⁵ 99.85
” 3 5.82x101 4.45x10⁴ 3.52x10⁻⁵ 99.80
” 7 8.95x101 6.59x10³ 2.16x10⁻⁴ 98.87
” 15 8.86x101 6.90x10³ 2.20x10⁻⁴ 98.80
” 30 1.53x101 1.33x10³ 1.63x10⁻³ 94.16
” 45 2.49x101 5.42x10² 6.11x10⁻³ 85.64
” 60 1.24x101 2.23x10² 1.07x10⁻² 65.04

CHAPTER 5
109
Figure 5.1: FTIR absorption spectra of (a) Poly(AN-co-XY) copolymer , (b)
Poly(AN-co-XY)/ZnO nanocomposite and homopolymers of (c)
Polyaniline, (d) Poly(2, 3-xylidine)
Figure 5.2: XRD patterns of (a) Poly(AN-co-XY) copolymer, (b) Poly(AN-co-
XY)/ZnO nanocomposite and homopolymers of (c) Polyaniline, (d)
Poly(2, 3-xylidine)
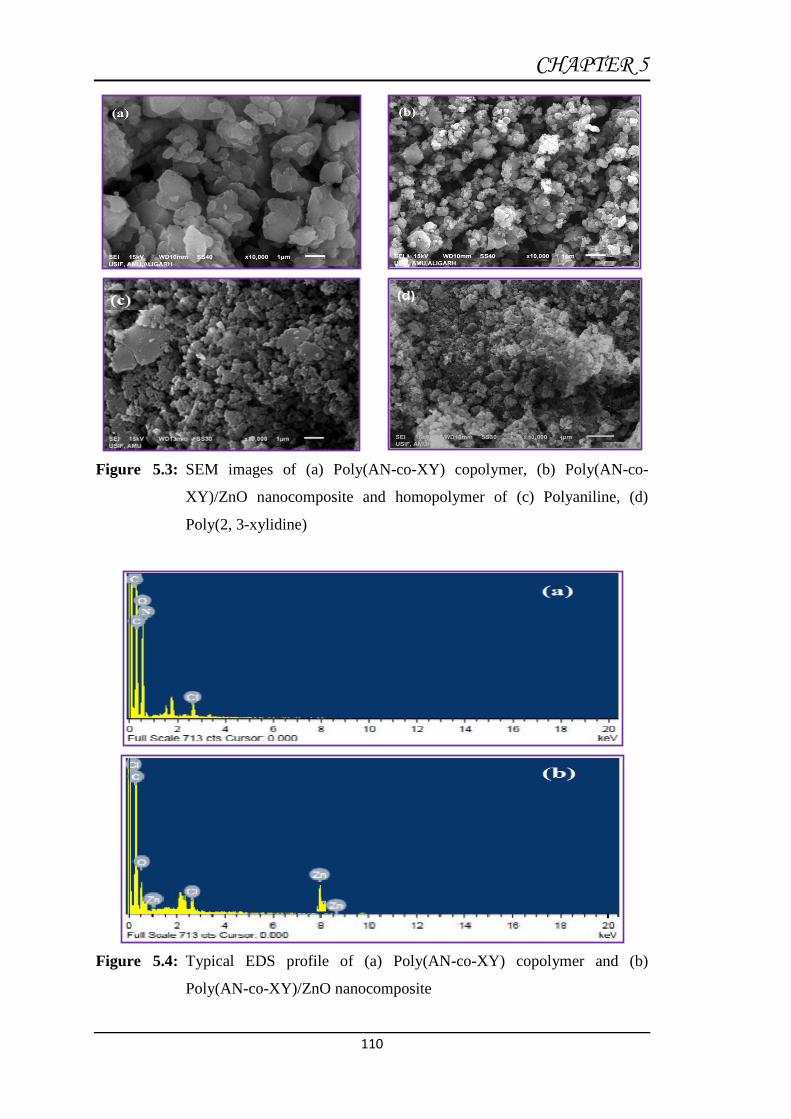
CHAPTER 5
110
Figure 5.3: SEM images of (a) Poly(AN-co-XY) copolymer, (b) Poly(AN-co-
XY)/ZnO nanocomposite and homopolymer of (c) Polyaniline, (d)
Poly(2, 3-xylidine)
Figure 5.4: Typical EDS profile of (a) Poly(AN-co-XY) copolymer and (b)
Poly(AN-co-XY)/ZnO nanocomposite
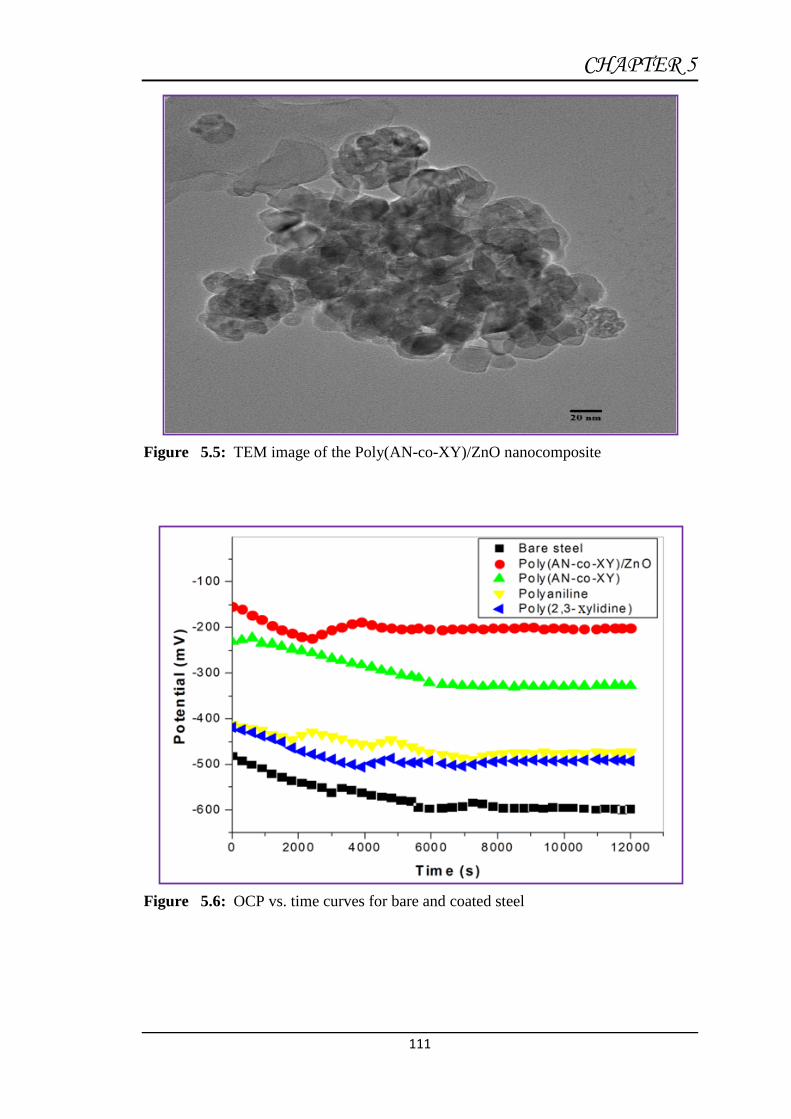
CHAPTER 5
111
Figure 5.5: TEM image of the Poly(AN-co-XY)/ZnO nanocomposite
Figure 5.6: OCP vs. time curves for bare and coated steel

CHAPTER 5
112
Figure 5.7: Tafel polarization curves for (a) bare steel, (b)Poly(AN-co-XY)/ZnO
nanocomposite, (c) Poly(AN-co-XY) copolymer and homopolymers of
(d) Polyaniline, (e) Poly(2, 3-xylidine) after 2h of immersion in 3.5%
NaCl solution
Figure 5.8: Tafel polarization curves of Poly(AN-co-XY)/ZnO nanocomposite
coated steel in 3.5% NaCl solution at different immersion time: (a) day
1, (b) day 3, (c) day 7, (d) day 15, (e) day 30, (f) day 45, (g) day 60

CHAPTER 5
113
Figure 5.9: Nyquist plots for (a) bare and coated steel and corresponding Bode plots
((b) and (c)) after 2h of immersion in 3.5% NaCl solution

CHAPTER 5
114
Figure 5.10: Nyquist plots (a) and corresponding Bode plots ((b) and (c)) for
Poly(AN-co-XY)/ZnO nanocomposite coated steel in 3.5% NaCl
solution at different immersion time: (a) day 1, (b) day 3, (c) day 7, (d)
day 15, (e) day 30, (f) day 45, (g) day 60

CHAPTER 5
115
Figure 5.11: Typical SEM images of Poly(AN-co-XY) coated steel (a) before and (b)
after 60 days immersion; Poly(AN-co-XY)/ZnO coated steel (c) before
and (d) after 60 days immersion

Chapter 6
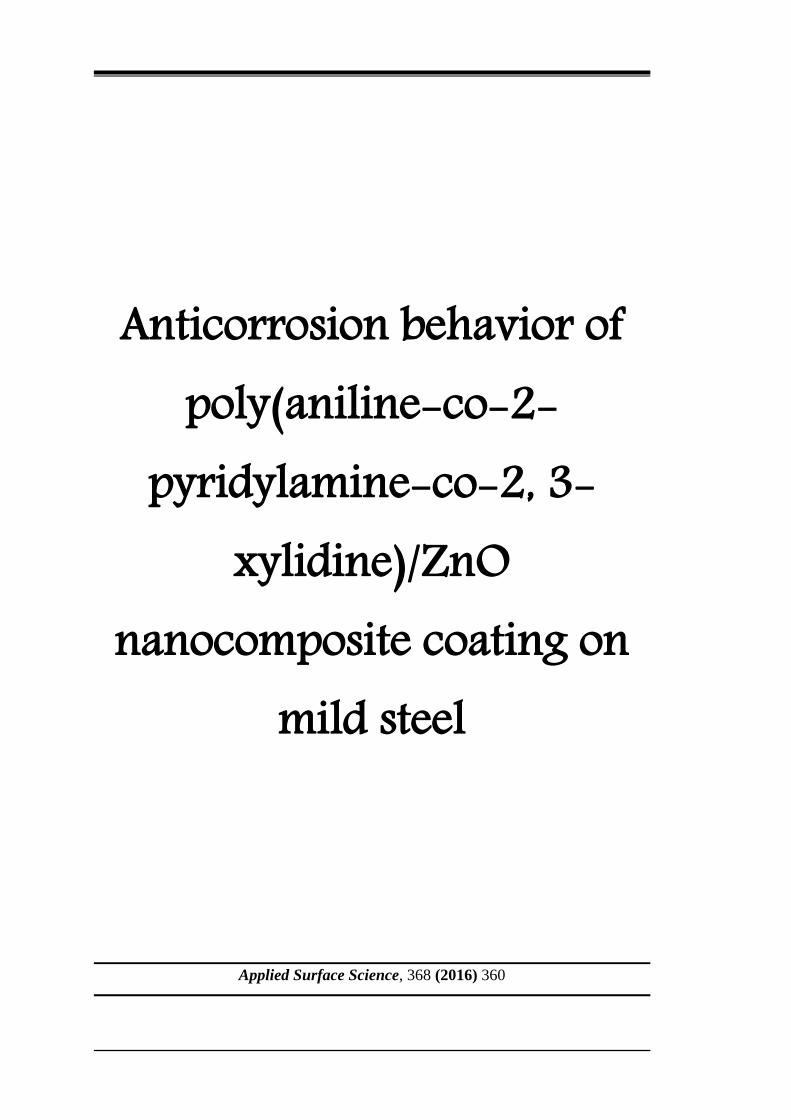
Anticorrosion behavior of poly(aniline-co-2-
pyridylamine-co-2, 3-xylidine)/ZnO
nanocomposite coating on mild steel
Applied Surface Science, 368 (2016) 360
CHAPTER 6
116
6.1 Results
6.1.1 Characterization of poly(aniline-co-2-pyridylamine-co-2, 3-xylidine)
[poly(AN-co-PA-co-XY)], poly(aniline-co-2-pyridylamine-co-2, 3-
xylidine)/ZnO [poly(AN-co-PA-co-XY)/ZnO], polyaniline/ZnO
[PANi/ZnO], poly(2-pyridylamine)/ZnO and poly(2, 3-xylidine)/ZnO
FTIR studies
The FTIR spectra of terpolymer poly(aniline-co-2-pyridylamine-co-2, 3-
xylidine) and its nanocomposite poly(aniline-co-2-pyridylamine-co-2, 3-
xylidine)/ZnO, and homopolymer nanocomposites are shown in Figure 6.1. The
spectrum of terpolymer (Fig.6.1a) is approximately identical to the reported spectrum
of the polymer [206]. A broad peak at 3431 cm−1 predicts the presence of secondary
amino group (-NH-). Peak at 2925 cm−1 represents C-H stretching in methyl group of
xylidine unit. Aromatic ring stretching shows absorption between 1518 and 1567
cm−1. A weak peak at 1357 cm−1 imputes stretching in quinoid imine ring. Peak at
1304 cm−1 represents alternative units of quinoid–benzenoid–quinoid. Peak at 1142
cm−1 shows C-H in plane and at 881 cm−1 represents out of plane bending vibration of
1,4-phenylene and 2,5-pyridylene rings. In the FTIR spectrum of terpolymer
nanocomposite the extra peak at 443 cm−1 (Fig. 6.1b) shows the presence of ZnO,
which was not present in the spectrum of terpolymer. In Figure 6.1 (c) a broad peak at
3435 cm−1 shows the N-H stretching of the PANi/ZnO nanocomposite. Quinonoid and
benzenoid structure of nanocomposite explains the peak observed at 1572 cm−1 and
1477 cm−1. Peaks at 1291 cm−1, 1236 cm−1, and 1111 cm−1 predicts the C-N stretching
and N-Q-N (Q is quinoid ring) stretching mode of the composite. Presence of ZnO
and C-H bonding mode of aromatic ring was indicated by peaks at 499 cm−1 and 794
cm−1, respectively [240]. Figure 6.1(d) represents the spectrum of poly(2, 3-
xylidine)/ZnO in which a broad peak at 3369 cm−1 indicates N-H stretching vibration
of primary and secondary amino group. Peak observed at 2924 cm−1 and 2856 cm−1
contributes to the stretching vibration of C-H in methyl group. Peak at 1595 cm−1 is
associated with quinoid ring and peak at 1476 cm−1 represents benzenoid ring. Sharp
peak at 411 cm−1 shows the presence of ZnO nanoparticle in the homopolymer.
Poly(2-pyridylamine)/ZnO is represented by Figure 6.1 (e), in which the characteristic
peak at 617–810 cm−1 represents the bending of C-H in pyridine and benzene ring. C-
CHAPTER 6
117
N stretching vibrations of secondary amines are represented by the 1240-1305 cm−1
absorption peak. Distinctive peak at 1560 cm−1 and 3404 cm−1 implies bending and
stretching of N-H in secondary amines. Peak at 419 cm−1 shows the presence of ZnO
nanoparticles.
XRD analysis
The XRD patterns of the terpolymer, poly(AN-co-PA-co-XY) and its
nanocomposite, poly(AN-co-PA-co-XY)/ZnO are shown in Figure 6.2. In the XRD
pattern of terpolymer (Fig. 6.2a) and its nanocomposite (Fig. 6.2b) the peak centered
at 2 = 20◦-30◦ may be attributed to periodicity parallel to the terpolymer chain
[212]. In the XRD pattern of nanocomposite the interaction of poly(AN-co-PA-co-
XY) with ZnO nanoparticles lead to the highly ordered structure, which can be clearly
seen by the pattern in the high angle region [214]. The sharp peaks observed at 2 =
43.9◦, 64.2◦, and 77.4◦ implies the presence of ZnO nanoparticles in poly(AN-co-
PA-co-XY)/ZnO nanocomposite and ordered structure which results in crystallinity
[215]. This confirmed the formation of a conducting organic-inorganic
nanocomposite. In the XRD pattern of PANi/ZnO (Fig. 6.2c) a broad peak from 2 =
20.60◦-31.26◦ implies the formation of emeraldine base form of polyaniline with the
peak attaining the maximum height at 2 = 26.12◦. The presence of ZnO
nanoparticles in the PANi/ZnO nanocomposite was justified by peaks at 2 = 44.1◦,
64.3◦, and 77.36◦. The XRD pattern of poly(2, 3-xylidine)/ZnO nanocomposite (Fig.
6.2d) show some degree of crystallinity. Peak at 2 = 23◦ is due to scattering at inter
planer spacing. Peaks at 2 = 43◦, 64◦, and 78◦ shows the presence of ZnO
nanoparticle in poly(2, 3-xylidine)/ZnO nanocomposite [241].Figure 6.2(e) shows
maximum peaks at 2 = 25.54◦, 43.42◦, 63.84◦, and 77.26◦, which implies that
poly(2-pyridylamine)ZnO contains ZnO nanoparticles along with scattering in the
polymer chains.
SEM and TEM studies
Figure 6.3 shows the SEM images of the terpolymer and its nanocomposite.
The ZnO nanoparticles have a strong effect on the morphology of the terpolymer.
SEM micrograph of the terpolymer (Fig. 6.3a) shows significance difference in its
morphology compared to the morphology of its nanocomposite (Fig. 6.3b). The
CHAPTER 6
118
terpolymer nanocomposite exhibited growth of a chain pattern of the terpolymer
having ZnO nanoparticles in between the junctions of the terpolymer chain network,
whereas the terpolymer exhibited a typical morphology. In nanocomposite, the ZnO
nanoparticles are fairly dispersed in the terpolymer matrix.
Figure 6.4 shows the TEM image of terpolymer nanocomposite, poly(AN-co-
PA-co-XY)/ZnO. The homogeneous dispersion of ZnO nanoparticle (particle size in
the range of 25-30 nm) embedded in the terpolymer matrix can be clearly identified.
The oxygen atom of ZnO nanoparticle is bonded with the proton of N-H of
terpolymer matrix by hydrogen bonding.
6.1.2 Immersion test
The immersion test was carried out under unstirred (static) condition at room
temperature for the immersion period of 30 days in 0.1 M HCl. The results of
immersion tests (corrosion rate and protection efficiency) for coated mild steel
specimens along with uncoated mild steel are shown in Table 6.1. The corrosion rate
of uncoated mild steel in 0.1 M HCl is found to be 23.67 mpy. The presence of
terpolymer nanocomposite poly(AN-co-PA-co-XY)/ZnO on mild steel caused the
maximum protection and the corrosion rate was lowered to 0.81 mpy exhibiting a PE
of 96.57%.The application of the terpolymer, and homopolymers nanocomposites
PANi/ZnO, poly(2, 3- xylidine)/ZnO and poly(2-pyridylamine)/ZnO coatings on the
mild steel also resulted in considerable lowering in corrosion rate exhibiting
protection efficiency of 93.07%, 91.04%, 87.15%, and 83.44%, respectively after 30
days of immersion.
6.1.3 Free corrosion potential measurements
Variations in the OCP values of uncoated and coated steel in 0.1 M HCl are
illustrated in Figure 6.5. The presence of coatings on steel specimen shift the potential
to more nobler direction (positive shift) as compared to the potential of uncoated steel.
The initial Eocp value for terpolymer nanocomposite coated steel was measured to be
-192 mV, that is very anodic potential with respect to uncoated steel (-455 mV) under
the same condition. A steady potential of -332 mV was obtained after an exposure
period of 110 h, which remained constant till the end of immersion period of 200 h.
The terpolymer nanocomposite shows a positive shift of 233 mV as compared to
uncoated steel, which was greater as compared to terpolymer corrosion potential shift
CHAPTER 6
119
(164 mV). The homopolymers nanocomposite show approximately equal noble shift
having values very close to each other i.e. 99 mV for PANi/ZnO, 76 mV for poly(2,
3-xylidine)/ZnO, 69 mV for poly(2-pyridylamine)/ZnO with respect to bare steel.
6.1.4 Potentiodynamic polarization measurements
The potentiodynamic polarization curves for coated and uncoated steel
samples recorded in 0.1 M HCl are illustrated in Figure 6.6. The corrosion kinetics
parameters derived from these curves, e.g., corrosion potential (Ecorr), corrosion
current density (Icorr) and polarization resistance Rp are listed in Table 6.2.
Considering the Tafel curves in 0.1 M HCl, there was a considerable positive shift in
Ecorr and lowering in Icorr in presence of coated steels in comparison with uncoated
steel. The nanocomposite poly(AN-co-PA-co-XY)/ZnO coated steel sample exhibited
the highest positive shift in Ecorr (from -483.65 mV to -316.82 mV vs Ag/AgCl
electrode) and maximum decrease in Icorr (from 149.03 to 0.89 A/cm2). The
positive shift in Ecorr and lowering in Icorr in presence of other coatings like
poly(AN-co-PA-co-XY) (-371.18 mv, 3.05 A/cm2), PANi (-450.92 mv, 5.98
A/cm2), Poly(2, 3-xylidine)/ZnO (-474.25 mv, 9.62 A/cm2), and Poly(2-
pyridylamine)/ZnO (-476.98 mv, 11.81 A/cm2) was quite significant. The presence
of polymer coatings on steel also caused a considerable increase in Rp value with
respect to Rp value of uncoated steel (1.28×10²/cm2). Again, the increase in Rp was
highest for poly(AN-co-PA-co-XY)/ZnO coated steel (1.09×10⁵/cm2) in
comparison with poly(AN-co-PA-co-XY) (4.06×10⁴/cm2), PANi/ZnO
(9.68×10³/cm2), Poly(2, 3-xylidine)/ZnO (6.28×10³/cm2), and Poly(2-
pyridylamine)/ZnO (5.14×10³/cm2). The calculated porosity in poly(AN-co-PA-co-
XY)/ZnO coated steel (6.95×10⁻⁵) was also lowest in comparison with pure
terpolymer (4.97×10⁻⁴)and homopolymers nanocomposites PANi/ZnO (7.70×10⁻³),
Poly(2, 3-xylidine)/ZnO (1.72×10⁻²) and Poly(2-pyridylamine)/ZnO (2.15×10⁻²).
6.1.5 Electrochemical impedance spectroscopy measurements
The corrosion protection behavior of homopolymer nanocomposites,
terpolymer, and terpolymer nanocomposite coated mild steel in 0.1 M HCl was also
studied using EIS. The impedance spectra in the presence and absence of polymer
coatings were obtained as Nyquist, Bode impedance and Bode phase angle plots and
CHAPTER 6
120
are presented in Figure 6.7 and 6.8. The Nyquist plot for coated and uncoated mild
steel specimen show depressed semicircle probably due to surface heterogeneity or
corrosion product on mild steel substrate. The diameter of the semicircle increased in
presence of polymer coating. The highest increase in diameter of the semicircle was
observed for terpolymer nanocomposite coating indicating its superior protection
ability over terpolymer and homopolymers nanocomposites coatings. The Nyquist
plots of coated specimens exhibit one time constant (capacitive and resistive
behavior) with significantly high impedance. A simplistic circuit (Fig. 6.7 inset)
consisting of a resistor in series to parallel connected capacitor and resistor is applied
to extract different parameters like, charge transfer resistance, Rct and double layer
capacitance, Cdl. The obtained EIS parameters are given in Table 6.3. The terpolymer
nanocomposite coating caused highest increase in Rct (2398 /cm2)and maximum
decrease in Cdl (3.28x10⁻⁶ Fcm−2) with respect to bare steel, suggesting its superior
anticorrosion behavior compared to terpolymer (Rct 1219.20 /cm2, Cdl 4.43x10⁻⁶
Fcm−2) and homopolymers nanocomposite, PANi/ZnO (Rct 1038.90 /cm2, Cdl
5.91x 10⁻⁶ Fcm−2), Poly(2, 3-xylidine)/ZnO (Rct 768.74 /cm2, Cdl 7.4x10⁻⁶
Fcm−2) and Poly(2-pyridylamine)/ZnO (Rct 592.32 /cm2, Cdl 1.05x10⁻⁵ Fcm−2)
coatings.
In Bode phase plot, the presence of polymer coatings resulted in more
negative values of phase angle at high frequencies. Further, the presence of
terpolymer nanocomposite coating on mild steel resulted in the highest increase in
impedance value.
6.1.6 Surface morphological studies
Figure 6.9 (a-d) shows the surface morphology of the terpolymer poly(AN-co-
PA-co-XY) and its nanocomposite poly(AN-co-PA-co-XY)/ZnO coatings on mild
steel before and after one month immersion in 0.1 M HCl. Before immersion in 0.1 M
HCl the terpolymer (Fig. 6.9 a) and nanocomposite (Fig. 6.9c) coatings did not show
any cracks or defects. The nanocomposite coating appeared more dense and uniform
than terpolymer coating, hence providing higher corrosion protection performance.
However, after one month immersion in HCl solution, the terpolymer coating was
affected and some fine cracks are visible (Fig. 6.9 b). The one month immersion in
0.1 M HCl solution did not cause any significant damage to the terpolymer
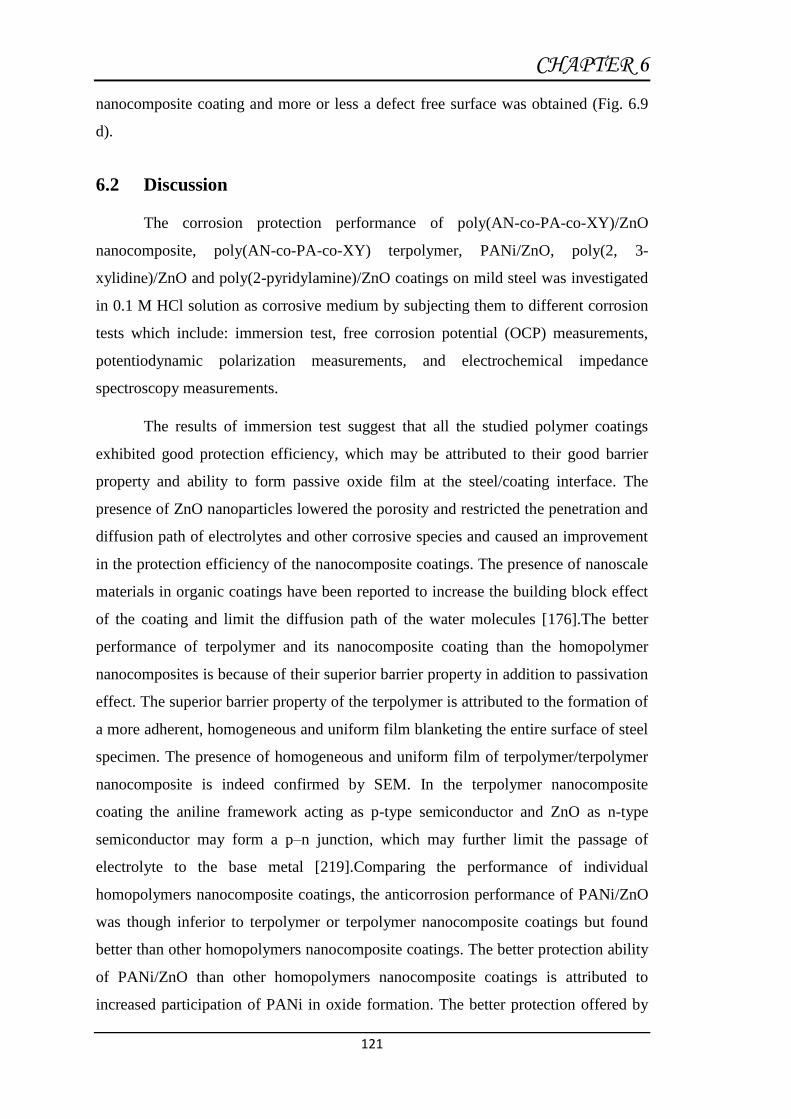
CHAPTER 6
121
nanocomposite coating and more or less a defect free surface was obtained (Fig. 6.9
d).
6.2 Discussion
The corrosion protection performance of poly(AN-co-PA-co-XY)/ZnO
nanocomposite, poly(AN-co-PA-co-XY) terpolymer, PANi/ZnO, poly(2, 3-
xylidine)/ZnO and poly(2-pyridylamine)/ZnO coatings on mild steel was investigated
in 0.1 M HCl solution as corrosive medium by subjecting them to different corrosion
tests which include: immersion test, free corrosion potential (OCP) measurements,
potentiodynamic polarization measurements, and electrochemical impedance
spectroscopy measurements.
The results of immersion test suggest that all the studied polymer coatings
exhibited good protection efficiency, which may be attributed to their good barrier
property and ability to form passive oxide film at the steel/coating interface. The
presence of ZnO nanoparticles lowered the porosity and restricted the penetration and
diffusion path of electrolytes and other corrosive species and caused an improvement
in the protection efficiency of the nanocomposite coatings. The presence of nanoscale
materials in organic coatings have been reported to increase the building block effect
of the coating and limit the diffusion path of the water molecules [176].The better
performance of terpolymer and its nanocomposite coating than the homopolymer
nanocomposites is because of their superior barrier property in addition to passivation
effect. The superior barrier property of the terpolymer is attributed to the formation of
a more adherent, homogeneous and uniform film blanketing the entire surface of steel
specimen. The presence of homogeneous and uniform film of terpolymer/terpolymer
nanocomposite is indeed confirmed by SEM. In the terpolymer nanocomposite
coating the aniline framework acting as p-type semiconductor and ZnO as n-type
semiconductor may form a p–n junction, which may further limit the passage of
electrolyte to the base metal [219].Comparing the performance of individual
homopolymers nanocomposite coatings, the anticorrosion performance of PANi/ZnO
was though inferior to terpolymer or terpolymer nanocomposite coatings but found
better than other homopolymers nanocomposite coatings. The better protection ability
of PANi/ZnO than other homopolymers nanocomposite coatings is attributed to
increased participation of PANi in oxide formation. The better protection offered by

CHAPTER 6
122
poly(2, 3-xylidine)/ZnO than poly(2-pyridylamine)/ZnO may be due to the
delocalization of electrons in xylidine facilitating its strong adsorption on the steel
surface. The protection efficiency of polymeric coatings are in the following order:
poly(AN-co-PA-co-XY)/ZnO > poly(AN-co-PA-co-XY) > PANi/ZnO > poly(2, 3-
xylidine)/ZnO > poly(2-pyridylamine)/ZnO.
Considering the OCP plots, the observed noble shift in OCP values for
homopolymer nanocomposites, terpolymer and its nanocomposite coated steel
specimens compared to the uncoated steel indicate that protection mechanism of steel
by the polymers coatings is related with both barrier and passivation effect, which
remains operative till the end of immersion [107]. The presence of ZnO nanoparticles
shifts the potential to more noble direction as it improved both barrier properties and
redox behavior of coatings. The Zn present in the nanocomposite coating may convert
to Zn2+ ions. The small percentage of these cations is able to inhibit the corrosion of
the metallic substrate [126]. The Zn2+ ions may also interact with N atoms of
polyaniline and change the morphology and structure of resultant polymer into the
compact cluster and thus reduce the corrosion rate [225]. The better protection offered
by terpolymer and its nanocomposite coating during the whole period of immersion is
due to better barrier effect as a result of formation of more uniform, adherent and
dense film on the substrate of steel. Initially there is lowering in the noble potential
for all the coatings due to ingress of the corrosive electrolyte in the coatings, which
reaches to the metal surface and lead to the anodic dissolution of metal. After some
time the potential achieves a steady state due to the formation of a passive film on the
steel substrate [139, 242].
Potentiodynamic polarization curves show noble shift (positive shift) in Ecorr,
substantial reduction in Icorr and increase of Rp values of the mild steel in the
presence of homopolymer nanocomposites, terpolymer and its nanocomposite
coatings. This proves the corrosion protection of metal substrate by the polymer
coatings under medium of investigation. The shift in Ecorr is highest for terpolymer
nanocomposite coatings as compared to the terpolymer and homopolymer
nanocomposites coatings implying that the terpolymer nanocomposite coating
provides more effective protection to the mild steel corrosion suppressing the anodic
current of the corrosion reaction. This may be attributed to the presence of a more

CHAPTER 6
123
dense and uniform coating on the steel substrate, which remained unaffected on
immersion in HCl solution. The presence of terpolymer nanocomposite coating on
mild steel substrate reduces the anodic dissolution and provides the perfect coverage
and best protection. The larger positive shift in Ecorr confirms the best protection of
the mild steel when its surface is covered by terpolymer nanocomposite coating. The
porosity in the coating is also an important parameter as it decides its suitability to
protect the underneath metal against corrosion. The porosity in the terpolymer
nanocomposite coating was found to be significantly lower compared to the porosity
in terpolymer and homopolymers nanocomposite coating in the corrosive media under
investigation. This again suggests the improvement in the corrosion resistance of
nanocomposite coating, which greatly hindered the access of the electrolyte to the
mild steel substrate. The reduction in Icorr or increase in Rp or decrease in porosity in
presence of different coatings is in the following order: poly(AN-co-PA-co-XY)/ZnO
> poly(AN-co-PA-co-XY) > PANi/ZnO > poly(2, 3-xylidine)/ZnO > poly(2-
pyridylamine)/ZnO.
Considering the EIS analysis results, in presence of polymer coatings the
increase in the Rct values is attributed to their barrier behavior and formation of
protective passive oxide layer on the mild steel substrate. The decrease in Cdl value in
presence of polymer coating is caused due to the reduction in local dielectric constant
and/or increase in thickness of double layer. The terpolymer nanocomposite coating
caused highest increase in Rct and maximum decrease in Cdl suggesting its superior
protective behavior compared to terpolymer and homopolymers nanocomposites
coatings. Considering the Bode plots, the value of absolute impedance at low
frequencies or phase angle at higher frequencies provide good idea about the
protective behavior of polymer coatings. In Bode phase plot, the presence of polymer
coatings resulted in more negative values of phase angle at high frequencies
suggesting protective behavior of polymer coatings. Again, the presence of
terpolymer nanocomposite coating on mild steel resulted in the highest increase in
impedance value or more negative value of phase angle. This again confirmed the
highest protective behavior of terpolymer nanocomposite coatings. The results of EIS
measurements are consistent with the results of potentiodynamic polarization
measurements and immersion test.
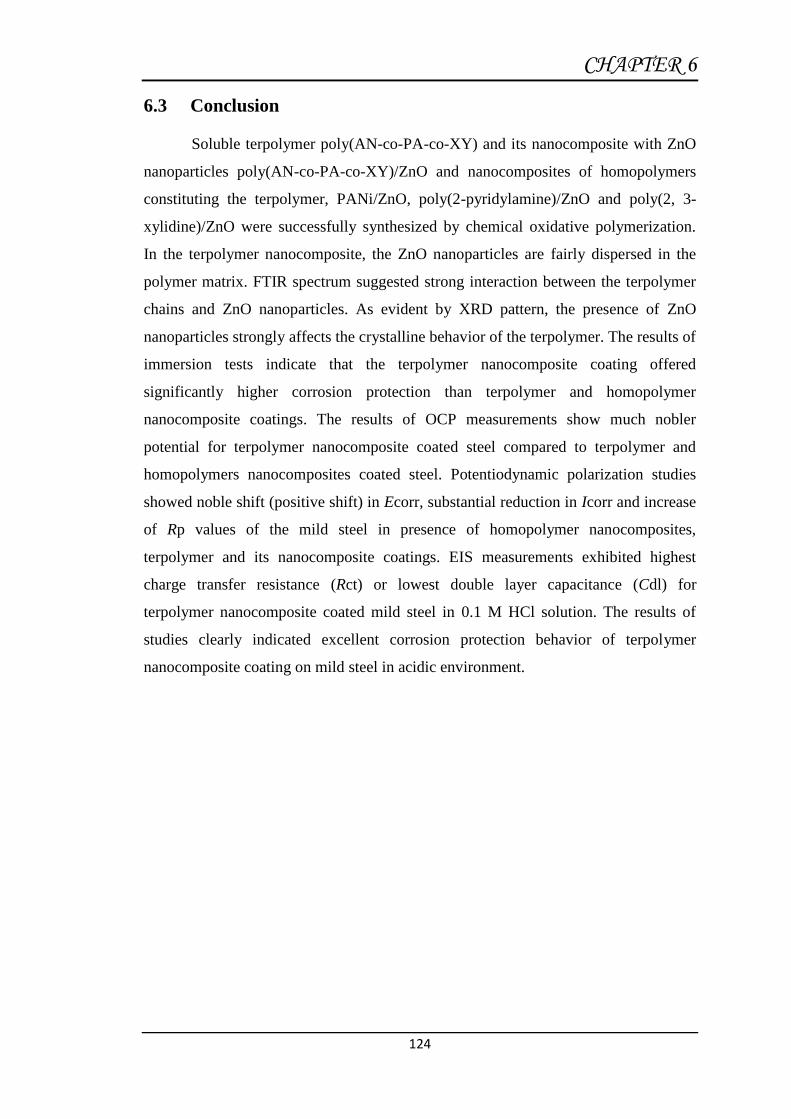
CHAPTER 6
124
6.3 Conclusion
Soluble terpolymer poly(AN-co-PA-co-XY) and its nanocomposite with ZnO
nanoparticles poly(AN-co-PA-co-XY)/ZnO and nanocomposites of homopolymers
constituting the terpolymer, PANi/ZnO, poly(2-pyridylamine)/ZnO and poly(2, 3-
xylidine)/ZnO were successfully synthesized by chemical oxidative polymerization.
In the terpolymer nanocomposite, the ZnO nanoparticles are fairly dispersed in the
polymer matrix. FTIR spectrum suggested strong interaction between the terpolymer
chains and ZnO nanoparticles. As evident by XRD pattern, the presence of ZnO
nanoparticles strongly affects the crystalline behavior of the terpolymer. The results of
immersion tests indicate that the terpolymer nanocomposite coating offered
significantly higher corrosion protection than terpolymer and homopolymer
nanocomposite coatings. The results of OCP measurements show much nobler
potential for terpolymer nanocomposite coated steel compared to terpolymer and
homopolymers nanocomposites coated steel. Potentiodynamic polarization studies
showed noble shift (positive shift) in Ecorr, substantial reduction in Icorr and increase
of Rp values of the mild steel in presence of homopolymer nanocomposites,
terpolymer and its nanocomposite coatings. EIS measurements exhibited highest
charge transfer resistance (Rct) or lowest double layer capacitance (Cdl) for
terpolymer nanocomposite coated mild steel in 0.1 M HCl solution. The results of
studies clearly indicated excellent corrosion protection behavior of terpolymer
nanocomposite coating on mild steel in acidic environment.

CHAPTER 6
125
Table 6.1 Results of immersion tests
Corrosive
Medium
Description of the sample Immersion
period (days)
Corrosion*
rate (mpy)
% PE
0.1 M HCl Uncoated steel 30 23.67 -
Poly(An-co-PA-co-
XY)/ZnO coated
30 0.81 96.57
Poly(AN-co-PA-co-XY)
coated
30 1.64 93.07
PANi/ZnO coated 30 2.11 91.04
Poly(2,3-xylidine)/ZnO
coated
30 3.04 87.15
Poly(2-pyridylamine)/ZnO
coated
30 3.92 83.44
* Uncertainties are found to be in the range of 0.15-7.85%
Table 6.2 Results of potentiodynamic polarization measurements
Corrosive
Medium
Description of
the sample
Ecorr
(mv)
Icorr
(A/cm2)
RP
(/cm2)
CR
(mpy)
Porosity
(P)
0.1 M HCl Uncoated steel -483.65 149.03 1.28 × 10² 68.41 -
Poly(AN-co-
PA-co-
XY)/ZnO
coated
-316.82 0.89 1.09 × 10⁵ 0.01 6.95 × 10⁻⁵
Poly(AN-co-
PA-co-XY)
coated
-371.18 3.05 4.06 × 10⁴ 0.03 4.97 ×10⁻⁴
PANi/ZnO
coated
-450.92 5.98 9.68 × 10³ 0.06 7.70 × 10⁻³
Poly(2,3-
xylidine)/ZnO
coated
-474.25 9.62 6.28 × 10³ 0.11 1.72 × 10⁻²
Poly(2-
pyridylamine)/
ZnO coated
-476.98 11.81 5.14 × 10³ 0.13 2.15 × 10⁻²

CHAPTER 6
126
Table 6.3 Results of electrochemical impedance spectroscopy (EIS)
measurements
Corrosive
Medium
Description of the
sample
Rs
(Ω cm2)
Rct
(Ω cm2)
Cdl
(µFcm-2)
% PE
0.1 M HCl Uncoated steel 23.63 65.36 1.00 × 10⁻⁴ -
Poly(An-co-PA-co-
XY)/ZnO coated
76.59 2398.50 3.28 × 10⁻⁶ 97.27
Poly(AN-co-PA-co-XY)
coated
86.26 1219.20 4.43 × 10⁻⁶ 94.63
PANi/ZnO coated 98.59 1038.90 5.91 × 10⁻⁶ 93.70
Poly(2,3-xylidine)/ZnO
coated
134.43 767.74 7.40 × 10⁻⁶ 91.48
Poly(2-
pyridylamine)/ZnO coated
100.07 592.32 1.05 × 10⁻⁵ 88.96

CHAPTER 6
127
Figure 6.1: FTIR spectra of (a) Poly(AN-co-PA-co-XY) Terpolymer; (b) Poly(AN-
co-PA-co-XY)/ZnO nanocomposite; (c) PANi/ZnO; (d) Poly(2, 3-
Xylidine)/ZnO; and (e) Poly(2-Pyridylamine)/ZnO
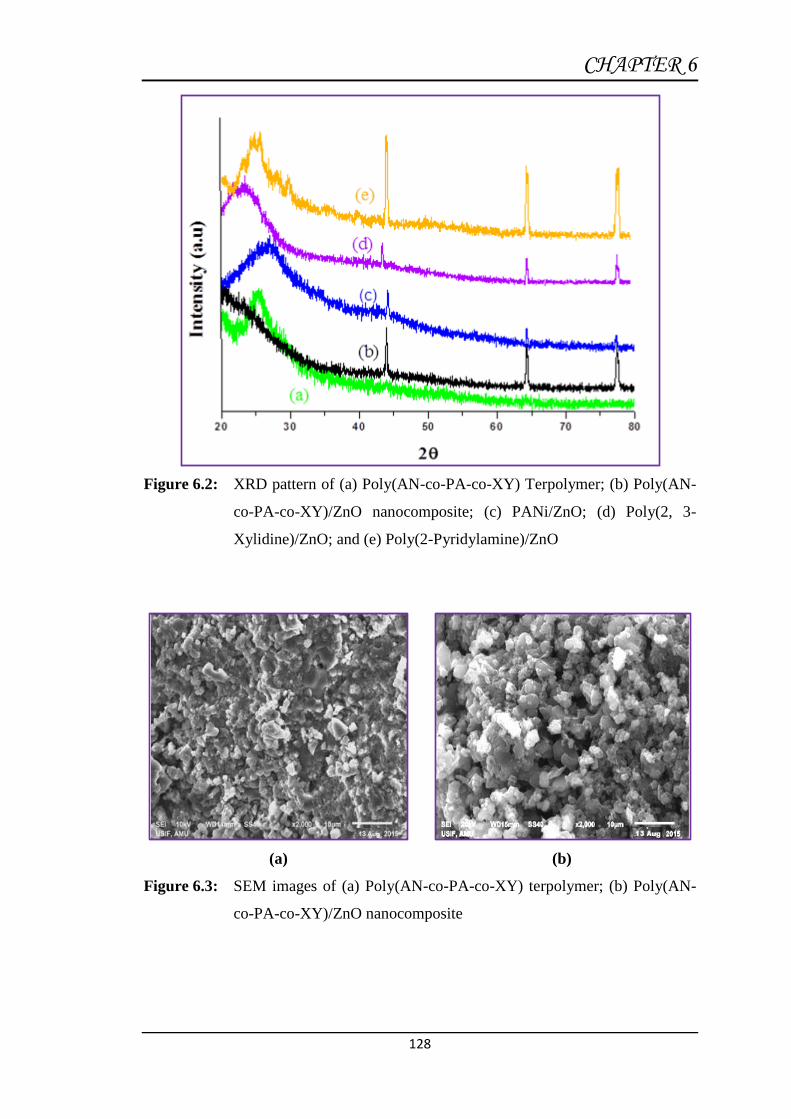
CHAPTER 6
128
Figure 6.2: XRD pattern of (a) Poly(AN-co-PA-co-XY) Terpolymer; (b) Poly(AN-
co-PA-co-XY)/ZnO nanocomposite; (c) PANi/ZnO; (d) Poly(2, 3-
Xylidine)/ZnO; and (e) Poly(2-Pyridylamine)/ZnO
(a)
(b)
Figure 6.3: SEM images of (a) Poly(AN-co-PA-co-XY) terpolymer; (b) Poly(AN-
co-PA-co-XY)/ZnO nanocomposite

CHAPTER 6
129
Figure 6.4: TEM micrograph of Poly(AN-co-PA-co-XY)/ZnO nanocomposite
Figure 6.5: Open circuit potential graph
-600
-500
-400
-300
-200
-100
0
0 50 100 150 200
Uncoated Poly(AN-co-PA-co-XY)
Poly(AN-co-PA-co-XY)/ZnO Poly(2-pyridylamine)/ZnO
Poly(2, 3-xylidine)/ZnO PANI/ZnO
Time (hrs)
Po
ten
tial (m
V v
s S
CE
)
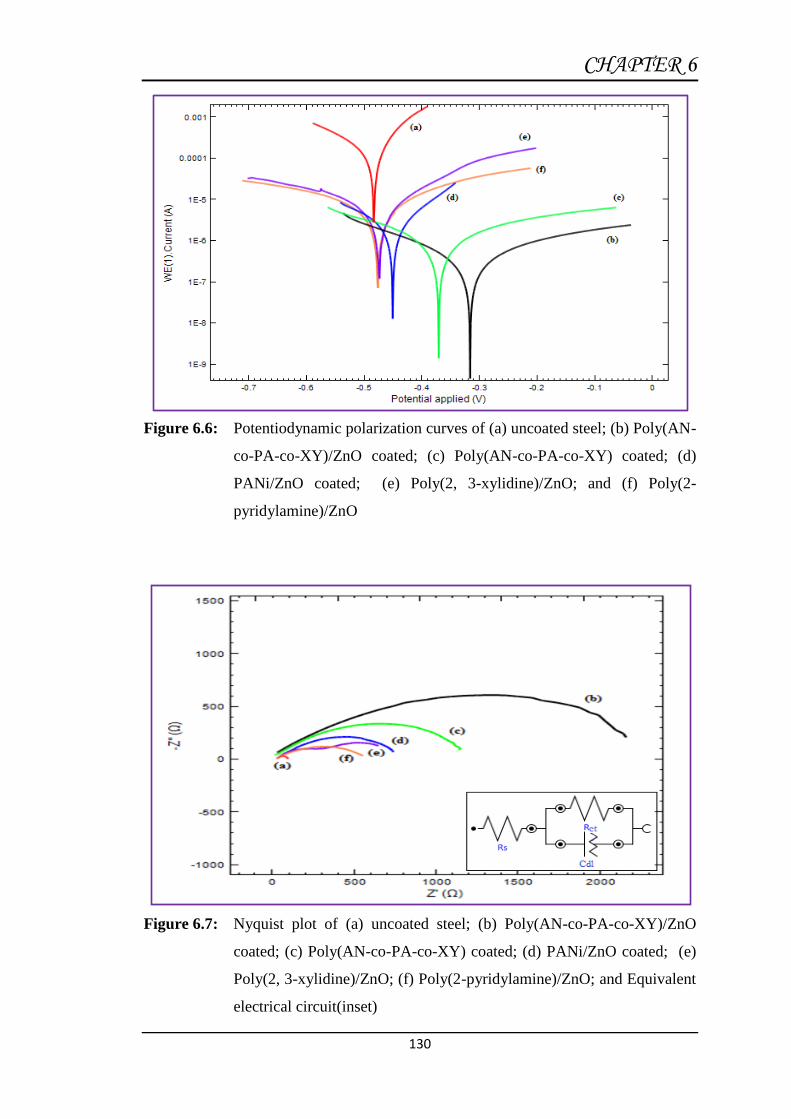
CHAPTER 6
130
Figure 6.6: Potentiodynamic polarization curves of (a) uncoated steel; (b) Poly(AN-
co-PA-co-XY)/ZnO coated; (c) Poly(AN-co-PA-co-XY) coated; (d)
PANi/ZnO coated; (e) Poly(2, 3-xylidine)/ZnO; and (f) Poly(2-
pyridylamine)/ZnO
Figure 6.7: Nyquist plot of (a) uncoated steel; (b) Poly(AN-co-PA-co-XY)/ZnO
coated; (c) Poly(AN-co-PA-co-XY) coated; (d) PANi/ZnO coated; (e)
Poly(2, 3-xylidine)/ZnO; (f) Poly(2-pyridylamine)/ZnO; and Equivalent
electrical circuit(inset)
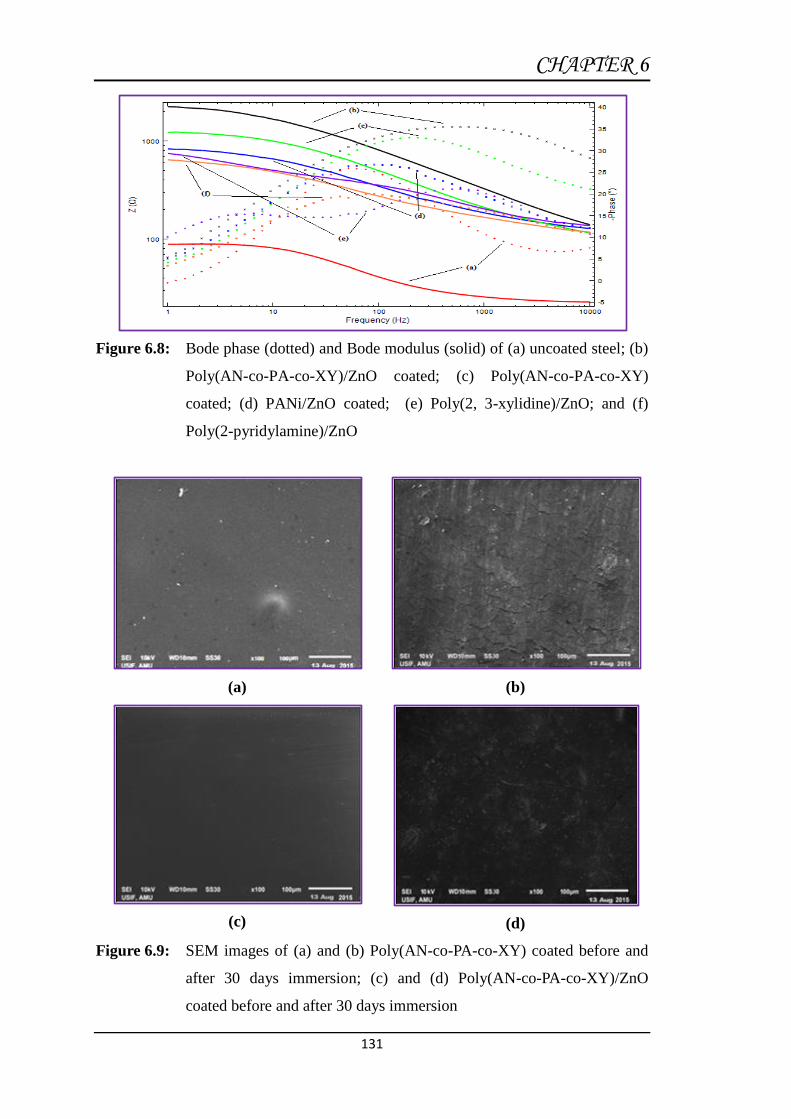
CHAPTER 6
131
Figure 6.8: Bode phase (dotted) and Bode modulus (solid) of (a) uncoated steel; (b)
Poly(AN-co-PA-co-XY)/ZnO coated; (c) Poly(AN-co-PA-co-XY)
coated; (d) PANi/ZnO coated; (e) Poly(2, 3-xylidine)/ZnO; and (f)
Poly(2-pyridylamine)/ZnO
(a)
(b)
(c)
(d)
Figure 6.9: SEM images of (a) and (b) Poly(AN-co-PA-co-XY) coated before and
after 30 days immersion; (c) and (d) Poly(AN-co-PA-co-XY)/ZnO
coated before and after 30 days immersion

Chapter 7

Anticorrosion behavior of Polypyrrole/graphene nanosheets/rare earth ions/dodecyl benzene
sulfonic acid nanocomposite coating on
mild steel
Surface & Coatings Technology, 307 (2016) 382

CHAPTER 7
132
7.1 Result
7.1.1 Characterization of PPy/GNS/RE3+/DBSA, PPy/GNS/DBSA and
PPy/DBSA
FTIR studies
The FTIR spectra of PPy/GNS/RE3+/DBSA, PPy/GNS/DBSA and PPy/DBSA
nanocomposites are shown in Figure 7.1 (a-e). In the PPy/DBSA spectrum peak
observed at 1453 and 1543 cm−1 show the stretching of C-N and C=C, whereas C-H
vibrations are represented by sharp peak at 1312 cm−1, respectively. The presence of
polypyrrole ring was shown by in-plane deformation of C-H bond and N-H bond
predicted by the peaks at 1053 cm−1. C-C stretching was attributed by peak at 1162
cm−1. The peak at 966 cm−1 predicts the out of phase C-C vibration. Comparing the
spectra of PPy/GNS/DBSA, PPy/GNS/La+3/DBSA, PPy/GNS/Nd+3/DBSA and
PPy/GNS/Sm+3/DBSA with PPy/DBSA spectrum, there exist approximately no
difference except minor shift in the peaks of PPy/DBSA attributed at 1162 cm−1 due
to introduction of GNS [243, 244]. The shift of peaks observed at 1196, 1169, 1168
and 1169 cm−1 in the GNS nanocomposites (Fig. 7.1 b–e) is due to π-π stacking
between GNS and PPy backbone [245]. The presence of rare earth elements in the
nanocomposites was shown by the peaks at 678 cm−1 (Sm3+), 681 cm−1 (Nd3+) and
676 cm−1 (La3+), respectively.
XRD analysis
The XRD patterns of the synthesized composites are shown in Figure 7.2 (a–
e). In Figure 7.2 (a) the broad peak observed at 2θ = 20°–30° implies the amorphous
nature of PPy/DBSA. Generally, PPy shows peak intensity approximately at 2θ = 25°
but due to the doping of DBSA in the PPy matrix peak shifts to 2θ = 23° and shows
interplanar spacing [246]. In Figure 7.2 (b–e) the diffraction peak at 2θ = 32° and 47°
implies the presence of graphene in the nanocomposites [247]. The intensity of
graphene peaks is very weak due to the wrapping of spherical PPy matrix on the
nanosheets.
SEM and TEM studies
Figure 7.3 shows the SEM microstructure of (a) PPy/DBSA, (b)
PPY/GNS/DBSA, (c) PPy/GNS/Sm3+/DBSA, (d) PPy/GNS/Nd3+/DBSA and (e)
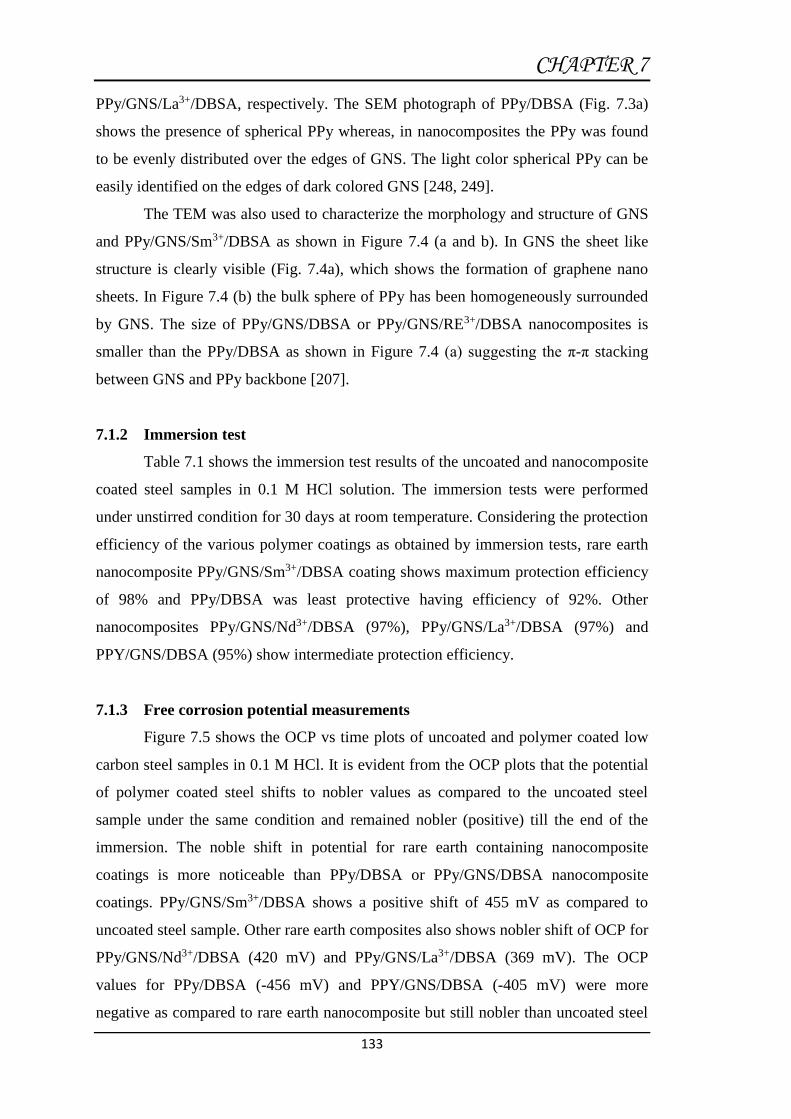
CHAPTER 7
133
PPy/GNS/La3+/DBSA, respectively. The SEM photograph of PPy/DBSA (Fig. 7.3a)
shows the presence of spherical PPy whereas, in nanocomposites the PPy was found
to be evenly distributed over the edges of GNS. The light color spherical PPy can be
easily identified on the edges of dark colored GNS [248, 249].
The TEM was also used to characterize the morphology and structure of GNS
and PPy/GNS/Sm3+/DBSA as shown in Figure 7.4 (a and b). In GNS the sheet like
structure is clearly visible (Fig. 7.4a), which shows the formation of graphene nano
sheets. In Figure 7.4 (b) the bulk sphere of PPy has been homogeneously surrounded
by GNS. The size of PPy/GNS/DBSA or PPy/GNS/RE3+/DBSA nanocomposites is
smaller than the PPy/DBSA as shown in Figure 7.4 (a) suggesting the π-π stacking
between GNS and PPy backbone [207].
7.1.2 Immersion test
Table 7.1 shows the immersion test results of the uncoated and nanocomposite
coated steel samples in 0.1 M HCl solution. The immersion tests were performed
under unstirred condition for 30 days at room temperature. Considering the protection
efficiency of the various polymer coatings as obtained by immersion tests, rare earth
nanocomposite PPy/GNS/Sm3+/DBSA coating shows maximum protection efficiency
of 98% and PPy/DBSA was least protective having efficiency of 92%. Other
nanocomposites PPy/GNS/Nd3+/DBSA (97%), PPy/GNS/La3+/DBSA (97%) and
PPY/GNS/DBSA (95%) show intermediate protection efficiency.
7.1.3 Free corrosion potential measurements
Figure 7.5 shows the OCP vs time plots of uncoated and polymer coated low
carbon steel samples in 0.1 M HCl. It is evident from the OCP plots that the potential
of polymer coated steel shifts to nobler values as compared to the uncoated steel
sample under the same condition and remained nobler (positive) till the end of the
immersion. The noble shift in potential for rare earth containing nanocomposite
coatings is more noticeable than PPy/DBSA or PPy/GNS/DBSA nanocomposite
coatings. PPy/GNS/Sm3+/DBSA shows a positive shift of 455 mV as compared to
uncoated steel sample. Other rare earth composites also shows nobler shift of OCP for
PPy/GNS/Nd3+/DBSA (420 mV) and PPy/GNS/La3+/DBSA (369 mV). The OCP
values for PPy/DBSA (-456 mV) and PPY/GNS/DBSA (-405 mV) were more
negative as compared to rare earth nanocomposite but still nobler than uncoated steel

CHAPTER 7
134
(-562 mV) throughout the immersion period. The noble shift in OCP is indicative of
redox reaction induced passivation of steel surface.
7.1.4 Potentiodynamic polarization measurements
The corrosion protection behavior of PPy/DBSA, PPY/GNS/DBSA,
PPy/GNS/RE3+/DBSA coated low carbon steel in 0.1 M HCl was studied using the
potentiodynamic polarization measurements. The Tafel plots of coated and uncoated
steel obtained from potentiodynamic polarization technique are illustrated in Figure
7.6. The corrosion kinetics parameters obtained from Tafel extrapolation, e.g.,
corrosion potential (Ecorr), and corrosion current density (Icorr) are listed in Table
7.2. There is positive (noble) shift in Ecorr, reduction of Icorr and increase in Rp
values of nanocomposite coatings as compared to the bare steel sample, which is
suggestive of better protection performance of nanocomposite coatings. The noble
shift of Ecorr is more in case of rare earth containing nanocomposites
{PPy/GNS/Sm3+/DBSA (-0.162 mV), PPy/GNS/Nd3+/DBSA (-0.196 mV),
PPy/GNS/La3+/DBSA (-229 mV)} as compared to PPy/DBSA (-442 mV) and
PPy/GNS/DBSA (-374 mV) indicating better protection performance of rare earth
nanocomposites. The decrease in Icorr and increase in Rp values of coatings is due to
the presence of dense coating on the steel surface. Lowering of corrosion current for
rare earth nanocomposites from 149.03 to 0.01 (Sm3+), 0.02 (Nd3+), 0.05 (La3+)
A/cm2 implies excellent protection efficiency of rare earth nanocomposites over
PPy/DBSA (3.26 A/cm2) and PPy/GNS/DBSA (0.32 A/cm2). Porosity is also an
important parameter, which gives an idea about the extent of diffusion of corrodents
to steel surface through polymeric coatings. The porosity of polymeric coatings are in
the following order: PPy/GNS/Sm3+/DBSA (1.19×10⁻⁸) < PPy/GNS/Nd3+/DBSA
(1.67×10⁻⁸) < PPy/GNS/La3+/DBSA (6.91×10⁻⁷) < PPy/GNS/DBSA (6.00×10⁻⁵) <
PPy/DBSA (3.01×10⁻³), suggesting the better protection behavior of rare earth
nanocomposites.
7.1.5 Electrochemical impedance spectroscopy measurements
The evaluation of corrosion protection ability of the resultant polymer coatings
i.e. PPy/DBSA, PPy/GNS/DBSA, PPy/GNS/Sm3+/DBSA, PPy/GNS/Nd3+/DBSA and
PPy/GNS/La3+/DBSA on mild steel was studied in 0.1 M HCl by using EIS
technique. This technique allows to understand the mode of protection of steel by the
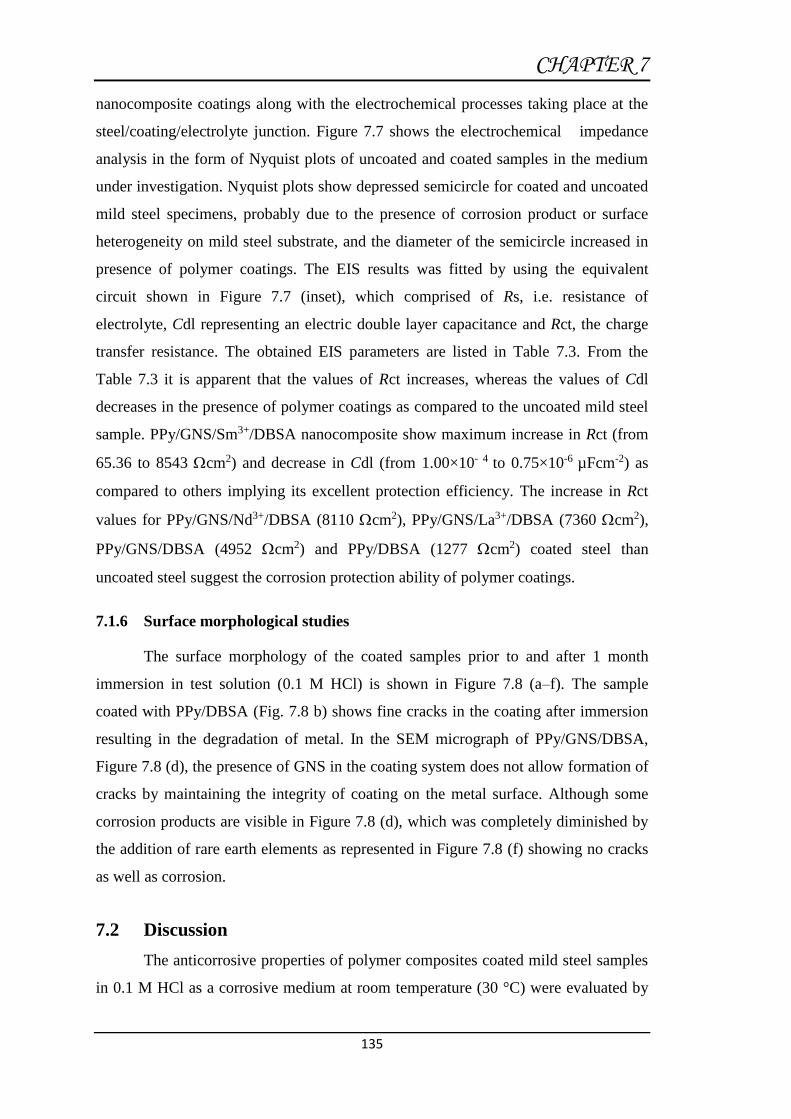
CHAPTER 7
135
nanocomposite coatings along with the electrochemical processes taking place at the
steel/coating/electrolyte junction. Figure 7.7 shows the electrochemical impedance
analysis in the form of Nyquist plots of uncoated and coated samples in the medium
under investigation. Nyquist plots show depressed semicircle for coated and uncoated
mild steel specimens, probably due to the presence of corrosion product or surface
heterogeneity on mild steel substrate, and the diameter of the semicircle increased in
presence of polymer coatings. The EIS results was fitted by using the equivalent
circuit shown in Figure 7.7 (inset), which comprised of Rs, i.e. resistance of
electrolyte, Cdl representing an electric double layer capacitance and Rct, the charge
transfer resistance. The obtained EIS parameters are listed in Table 7.3. From the
Table 7.3 it is apparent that the values of Rct increases, whereas the values of Cdl
decreases in the presence of polymer coatings as compared to the uncoated mild steel
sample. PPy/GNS/Sm3+/DBSA nanocomposite show maximum increase in Rct (from
65.36 to 8543 cm2) and decrease in Cdl (from 1.00×10- 4 to 0.75×10⁻⁶ µFcm-2) as
compared to others implying its excellent protection efficiency. The increase in Rct
values for PPy/GNS/Nd3+/DBSA (8110 cm2), PPy/GNS/La3+/DBSA (7360 cm2),
PPy/GNS/DBSA (4952 cm2) and PPy/DBSA (1277 cm2) coated steel than
uncoated steel suggest the corrosion protection ability of polymer coatings.
7.1.6 Surface morphological studies
The surface morphology of the coated samples prior to and after 1 month
immersion in test solution (0.1 M HCl) is shown in Figure 7.8 (a–f). The sample
coated with PPy/DBSA (Fig. 7.8 b) shows fine cracks in the coating after immersion
resulting in the degradation of metal. In the SEM micrograph of PPy/GNS/DBSA,
Figure 7.8 (d), the presence of GNS in the coating system does not allow formation of
cracks by maintaining the integrity of coating on the metal surface. Although some
corrosion products are visible in Figure 7.8 (d), which was completely diminished by
the addition of rare earth elements as represented in Figure 7.8 (f) showing no cracks
as well as corrosion.
7.2 Discussion
The anticorrosive properties of polymer composites coated mild steel samples
in 0.1 M HCl as a corrosive medium at room temperature (30 °C) were evaluated by
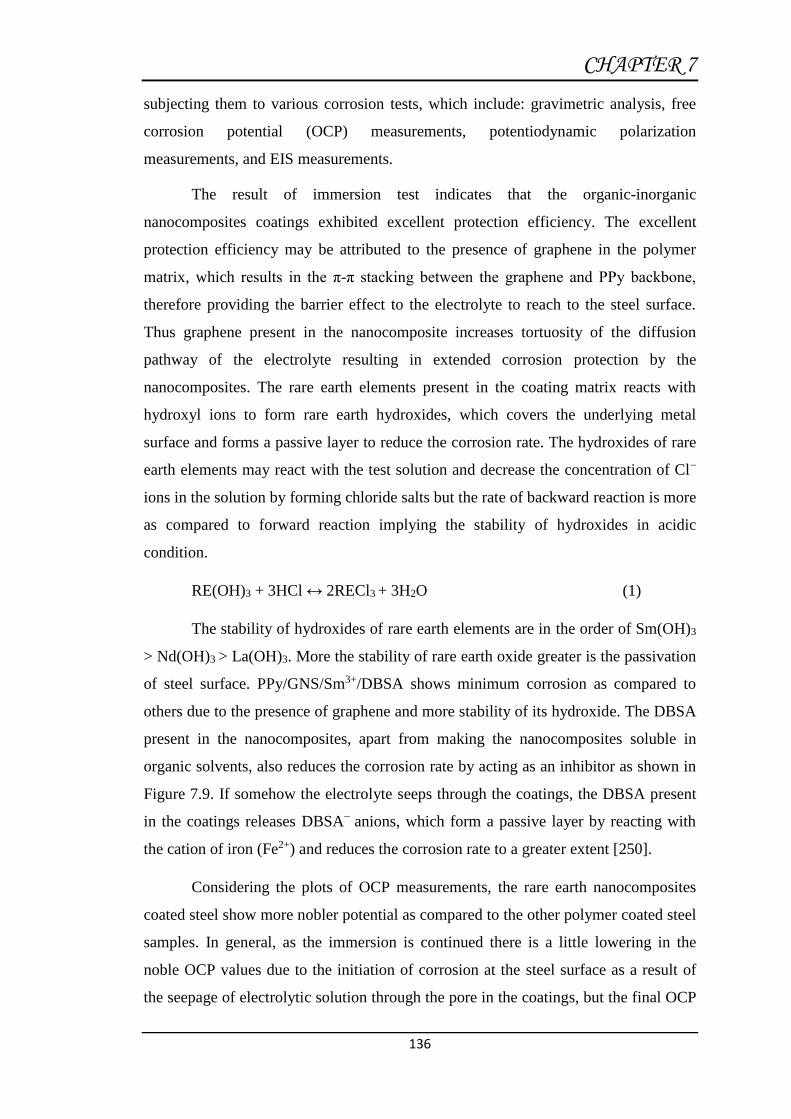
CHAPTER 7
136
subjecting them to various corrosion tests, which include: gravimetric analysis, free
corrosion potential (OCP) measurements, potentiodynamic polarization
measurements, and EIS measurements.
The result of immersion test indicates that the organic-inorganic
nanocomposites coatings exhibited excellent protection efficiency. The excellent
protection efficiency may be attributed to the presence of graphene in the polymer
matrix, which results in the π-π stacking between the graphene and PPy backbone,
therefore providing the barrier effect to the electrolyte to reach to the steel surface.
Thus graphene present in the nanocomposite increases tortuosity of the diffusion
pathway of the electrolyte resulting in extended corrosion protection by the
nanocomposites. The rare earth elements present in the coating matrix reacts with
hydroxyl ions to form rare earth hydroxides, which covers the underlying metal
surface and forms a passive layer to reduce the corrosion rate. The hydroxides of rare
earth elements may react with the test solution and decrease the concentration of Cl−
ions in the solution by forming chloride salts but the rate of backward reaction is more
as compared to forward reaction implying the stability of hydroxides in acidic
condition.
RE(OH)3 + 3HCl ↔ 2RECl3 + 3H2O (1)
The stability of hydroxides of rare earth elements are in the order of Sm(OH)3
> Nd(OH)3 > La(OH)3. More the stability of rare earth oxide greater is the passivation
of steel surface. PPy/GNS/Sm3+/DBSA shows minimum corrosion as compared to
others due to the presence of graphene and more stability of its hydroxide. The DBSA
present in the nanocomposites, apart from making the nanocomposites soluble in
organic solvents, also reduces the corrosion rate by acting as an inhibitor as shown in
Figure 7.9. If somehow the electrolyte seeps through the coatings, the DBSA present
in the coatings releases DBSA− anions, which form a passive layer by reacting with
the cation of iron (Fe2+) and reduces the corrosion rate to a greater extent [250].
Considering the plots of OCP measurements, the rare earth nanocomposites
coated steel show more nobler potential as compared to the other polymer coated steel
samples. In general, as the immersion is continued there is a little lowering in the
noble OCP values due to the initiation of corrosion at the steel surface as a result of
the seepage of electrolytic solution through the pore in the coatings, but the final OCP

CHAPTER 7
137
is still quite nobler than the OCP of bare steel under the same condition. However, the
reduction in OCP values for nanocomposites containing rare earth elements coatings
is very small compared to PPy/DBSA and PPy/GNS/DBSA coatings. The graphene
present in the nanocomposites provides barrier to the electrolyte and provide
passivating effect to the underlying steel surface. The π-π stacking of graphene and
PPy backbone made the coating denser to electrolyte to penetrate. In case of rare earth
containing nanocomposites the change in potential of Sm3+ containing nanocomposite
is found to be very minimal as compared to that of nanocomposites containing Nd3+
and La3+. The OCP of Sm3+ containing nanocomposite is almost constant throughout
the immersion period. The addition of rare earth elements might be causing formation
of rare earth hydroxides, which hinders both anodic and cathodic processes by
forming passive layer on the steel surface. Initially, after immersion the corrosion
process generates hydroxyl ions at cathodic site and the rare earth elements reacts
with these hydroxyl ions and forms partially insoluble rare earth hydroxides. More the
generation of hydroxyl ions more the formation of rare earth hydroxides.
RE3+ + 3OH̅ → RE(OH)3 (2)
Theses partially insoluble rare earth hydroxides deposited on the steel surface
and formed passive layer, which protect the underlying steel from further corrosion.
Some of the rare earth hydroxides undergo dehydration and result in the formation of
rare earth oxides, which also forms passive layer and protect the underlying metal.
2RE(OH)3 → RE2O3 + 3H2O (3)
The potentiodynamic polarization curves indicates the excellent protection
behavior of rare earth nanocomposites. Graphene and rare earth elements present in
the coating matrix increases the density of coating material, therefore retarding the
seepage of electrolyte. The addition of rare earth elements to nanocomposite causes a
displacement of the cathodic branch towards the negative values and a reduction in
the corrosion current density by blocking of cathodic sites. The presence of dense
coating on steel sample results in lowering of corrosion current and increase in
polarization resistance.
Considering the results of EIS analysis, the diameter of the Nyquist plots
increased in the order of Uncoated < PPy/DBSA < PPy/GNS/DBSA <
PPy/GNS/La3+/DBSA < PPy/GNS/Nd3+/DBSA < PPy/GNS/Sm3+/DBSA showing

CHAPTER 7
138
better corrosion protection performance of the nanocomposite coatings containing
rare earth elements. The increase in the Rct values or decrease in Cdl values in
presence of the graphene nano sheets in the polymer nanocomposite coatings is
attributed to the barrier effect of coatings along with the development of protective
passive oxide film on mild steel substrate and the reduction in local dielectric constant
and/or increase in thickness of double layer, respectively [100, 233]. The increase in
Rct and decrease in Cdl value is more in nanocomposite coatings containing rare earth
elements as compared to others. Within the rare earth elements presence of Sm3+
offers maximum corrosion protection as compared to Nd3+ and La3+. The superior
protection effect of PPy coating containing GNS or both GNS and RE elements is
attributed to homogeneously dispersed graphene nano particles in the coating matrix,
which helped in the formation of a uniform passive film on the carbon steel surface.
Considering the results of corresponding Bode plots (Fig. 7.10 a and b), in presence of
polymer nanocomposite coatings containing rare earths the highest increase in the
value of the absolute impedance at low frequencies or more negative value of phase
angle at higher frequencies confirmed their superior protection behavior in
comparison to PPy/DBSA or PPY/GNS/DBSA coatings.
7.3 Conclusion
The soluble organic-inorganic nanocomposites of pyrrole containing rare earth
ions and dodecyl benzene sulfonic acid embedded on the surface of graphene nano
sheets were successfully synthesized. The formation of PPy/GNS/DBSA and
PPy/GNS/RE3+/DBSA nanocomposites were confirmed using FTIR, XRD, SEM and
TEM. The EIS measurements exhibited highest charge transfer resistance (Rct) and
lowest double layer capacitance (Cdl) for PPy/GNS/RE3+/DBSA compared to
PPy/DBSA and PPy/GNS/DBSA coated steel. Potentiodynamic polarization studies
showed substantial reduction in Icorr, noble shift (positive shift) in Ecorr, decrease in
porosity (P) and increase of Rp values of the low carbon steel in presence of
nanocomposite coatings. The results of OCP measurements show much nobler and
stable potential for PPy/GNS/RE3+/DBSA than PPy/DBSA and PPy/GNS/DBSA
coated steel. The results of electrochemical tests find adequate support from
immersion tests. The morphology of the nanocomposite films deposited on steel

CHAPTER 7
139
specimen was examined by SEM to support the results obtained from electrochemical
studies. The nanocomposite coatings were observed to exhibit both barrier and
passivation behavior. Considering the excellent corrosion protection of
nanocomposite coatings the studied compounds can be used for future industrial
assessments.

CHAPTER 7
140
Table 7.1 Results of immersion tests
Corrosive
Medium
Description of the
sample
Immersion
period (days)
Corrosion*
rate (mpy)
% PE
0.1 M HCl Uncoated steel 30 23.67 -
PPy/GNS/Sm3+/DBSA 30 0.43 98.15
PPy/GNS/Nd3+ /DBSA 30 0.48 97.93
PPy/GNS/La3+/DBSA 30 0.62 97.37
PPy/GNS/DBSA 30 0.99 95.78
PPy/DBSA 30 1.78 92.47
* Uncertainties are found to be in the range of 0.27-4.21%
Table 7.2 Results of potentiodynamic polarization measurements
Corrosive
Medium
Description of
the sample
Ecorr
(mv)
Icorr
(A/cm2)
RP
(/cm2)
CR
(mpy)
Porosity
(P)
0.1 M HCl Uncoated steel -483.65 149.03 1.28 × 10² 68.41 -
PPy/GNS/Sm3+
/DBSA
-0.16 0.01 4.77 × 10⁶ 0.05 1.19 × 10⁻⁸
PPy/GNS/Nd3+
/DBSA
-0.19 0.02 3.41 × 10⁶ 0.01 1.67 × 10⁻⁸
PPy/GNS/La3+/
DBSA
-229.84 0.05 3.14 × 10⁶ 0.02 6.91 × 10⁻⁷
PPy/GNS/
DBSA
-374.87 0.32 3.70 × 10⁵ 0.14 6.00 × 10⁻⁵
PPy/DBSA -442.28 3.26 2.19 × 10⁴ 1.45 3.01 × 10⁻³

CHAPTER 7
141
Table 7.3 Results of electrochemical impedance spectroscopy (EIS)
measurements
Corrosive
Medium
Description of the
sample
Rs
(Ω cm2)
Rct
(Ω cm2)
Cdl
(µFcm-2)
% PE
0.1 M HCl Uncoated steel 23.63 65.36 1.00 × 10⁻⁴ -
PPy/GNS/Sm3+/DBSA 283.73 8543.30 0.75 × 10⁻⁶ 99.23
PPy/GNS/Nd3+ /DBSA 266.74 8110.20 1.10 × 10⁻⁶ 99.19
PPy/GNS/La3+/DBSA 252.40 7360.00 1.45 × 10⁻⁶ 99.11
PPy/GNS/DBSA 190.50 4952.00 2.87 × 10⁻⁶ 98.68
PPy/DBSA 42.82 1277.20 3.63 × 10⁻⁵ 94.88

CHAPTER 7
142
Figure 7.1: FTIR spectra of (a) PPy/DBSA (b) PPy/GNS/DBSA (c)
PPy/GNS/La3+/DBSA (d) PPy/GNS/Nd3+/DBSA and (e)
PPy/GNS/Sm3+/ DBSA
Figure 7.2: XRD pattern of (a) PPy/DBSA (b) PPy/GNS/DBSA (c)
PPy/GNS/La3+/DBSA (d)PPy/GNS/Nd3+/DBSA and (e)
PPy/GNS/Sm3+/DBSA

CHAPTER 7
143
(a)
(b)
(c)
(d)
(e)
Figure 7.3: SEM micrographs of (a) PPy/DBSA (b) PPy/GNS/DBSA (c)
PPy/GNS/La3/DBSA (d) PPy/GNS/Nd3+/DBSA and (e)
PPy/GNS/Sm3+/DBSA

CHAPTER 7
144
(a)
(b)
Figure 7.4: TEM images of (a) GNS and (b) PPy/GNS/Sm3+/DBSA
Figure 7.5: Open circuit potential (OCP) vs. time plots
-600
-500
-400
-300
-200
-100
0
0 50 100 150 200
Po
ten
tial
(m
V v
s SC
E)
Time (hrs)
Uncoated PPy/DBSA PPy/GNS/DBSA
PPy/GNS/La3+/DBSA PPy/GNS/Nd3+/DBSA PPy/GNS/Sm3+/DBSA
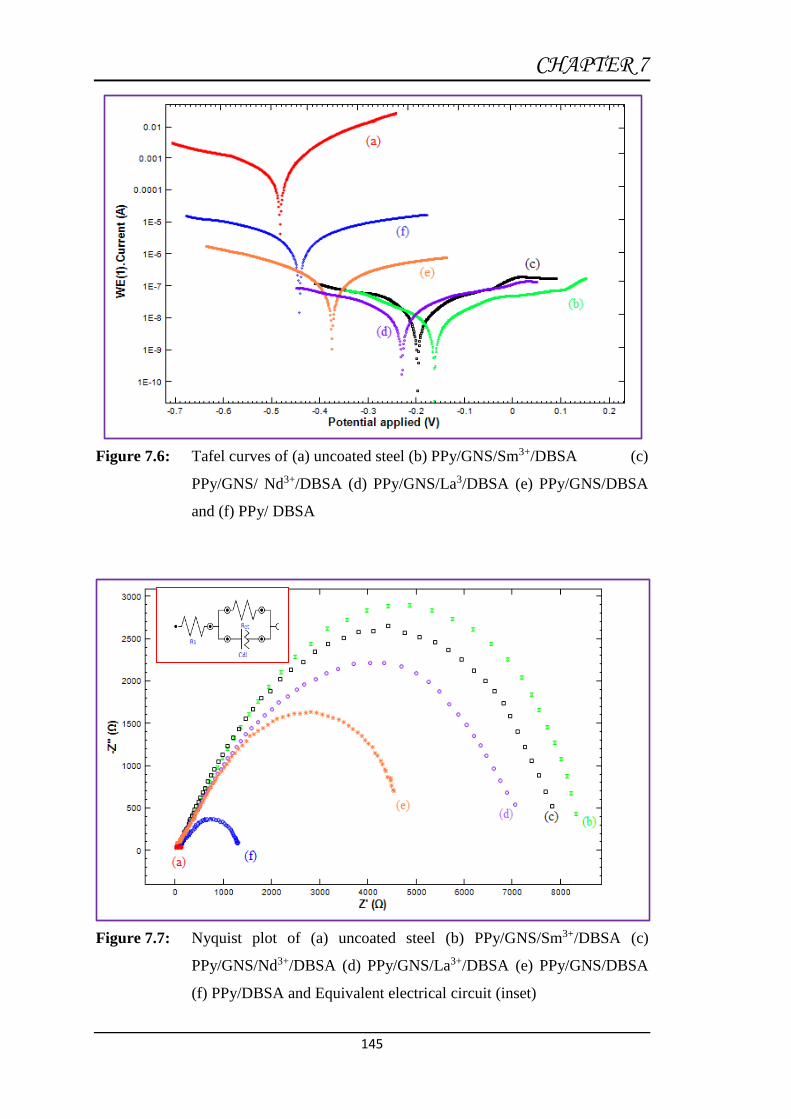
CHAPTER 7
145
Figure 7.6: Tafel curves of (a) uncoated steel (b) PPy/GNS/Sm3+/DBSA (c)
PPy/GNS/ Nd3+/DBSA (d) PPy/GNS/La3/DBSA (e) PPy/GNS/DBSA
and (f) PPy/ DBSA
Figure 7.7: Nyquist plot of (a) uncoated steel (b) PPy/GNS/Sm3+/DBSA (c)
PPy/GNS/Nd3+/DBSA (d) PPy/GNS/La3+/DBSA (e) PPy/GNS/DBSA
(f) PPy/DBSA and Equivalent electrical circuit (inset)
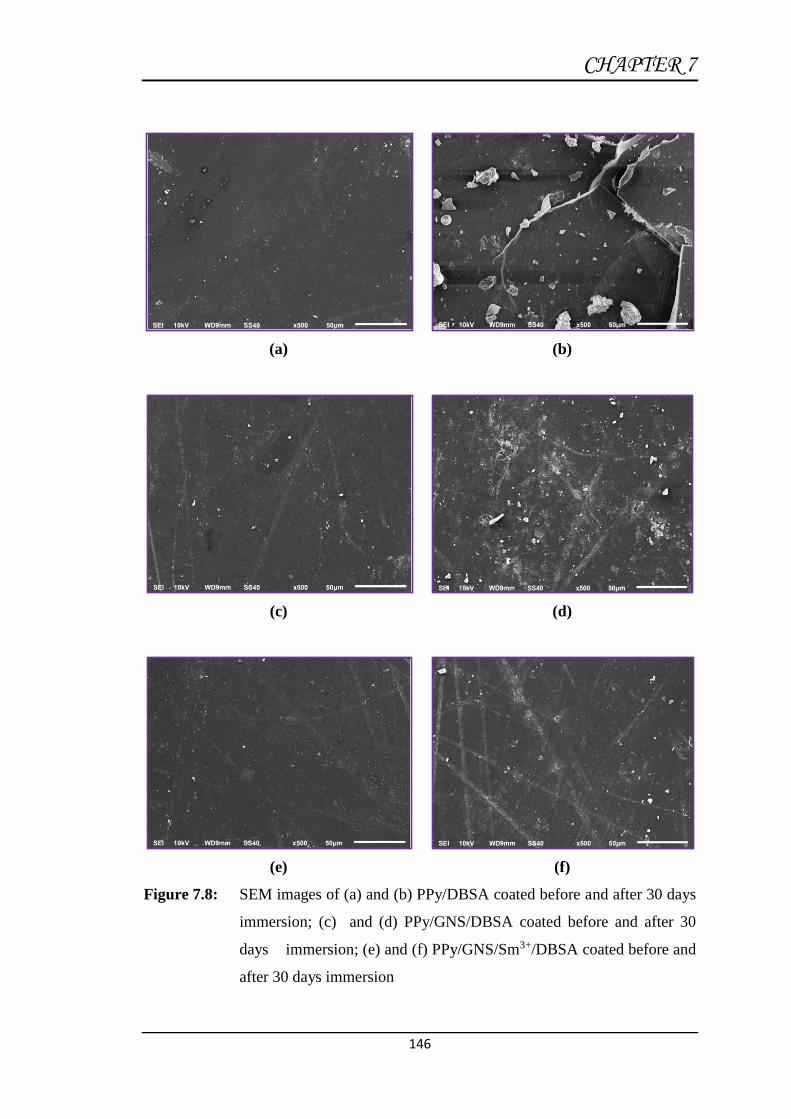
CHAPTER 7
146
(a)
(b)
(c)
(d)
(e)
(f)
Figure 7.8: SEM images of (a) and (b) PPy/DBSA coated before and after 30 days
immersion; (c) and (d) PPy/GNS/DBSA coated before and after 30
days immersion; (e) and (f) PPy/GNS/Sm3+/DBSA coated before and
after 30 days immersion

CHAPTER 7
147
Figure 7.9: Coating containing DBSA showing bio mimic effect
(a)
(b)
Figure 7.10: (a) Bode phase and (b) Bode modulus of (a) uncoated steel (b)
PPy/GNS/Sm3+/DBSA (c) PPy/GNS/Nd3+/DBSA (d) PPy/GNS/La3+/
DBSA (e) PPy/GNS/DBSA and (f) PPy/DBSA

Chapter 8

Overall Conclusion and Future Work
CHAPTER 8
148
8.1 Overall Conclusion from the Thesis
The thesis proposes an approach to corrosion prevention of mild steel using
conducting homopolymers, copolymers and terpolymers nanocomposites coatings.
The conducting homopolymers, copolymers, terpolymers and their respective
nanocomposites were synthesized by in situ chemical oxidative polymerization,
characterized by FT-IR, XRD, SEM/EDS and TEM, separately dissolved in N-
methyl-2-pyrrolidone (NMP), casted on mild steel substrate by solution evaporation
method and studied for their anticorrosion behavior in 3.5% and 5 wt% NaCl solution,
0.1 M HCl, distilled water and open atmosphere at a temperature of 30ºC using open
circuit potential (OCP), electrochemical impedance spectroscopy (EIS),
potentiodynamic polarization (PDP) and scanning electron microscopy (SEM). The
synthesized conducting polymers include: homopolymers and their nanocomposites
[PANi; PANi/ZnO; Poly(2,3-xylidine); Poly(2,3-xylidine/ZnO; Poly(o-
anisidine)/ZnO; Poly(o-toludine)/ZnO); polypyrrole (PPy)/DBSA], copolymers and
their nanocomposites [Poly(aniline-co-N-ethylaniline); Poly(aniline-co-N-
ethylaniline)/ZnO; Poly(aniline-co-o-anisidine); Poly(aniline-co-o-anisidine)/ZnO;
Poly(aniline-co-2,3-xylidine); Poly(aniline-co-2,3-xylidine)/ZnO] and terpolymers
and their nanocomposites [Poly(2-pyridylamine-co-aniline-co-2,3-xylidine); Poly(2-
pyridylamine-co-aniline-co-2,3-xylidine)/ZnO) Polypyrrole/graphene nanosheets/rare
earth ions/dodecyl benzene sulfonic acid (PPy/GNS/RE3+/DBSA);
Polypyrrole/graphene nanosheets/dodecyl benzene sulfonic acid(PPy/GNS/DBSA)].
The corrosion protection performances of the nanocomposites were compared with
pure homopolymers, copolymers and terpolymers under identical experimental
conditions. The following broad conclusions can be drawn from the above
investigations.
1. FT-IR spectrum of the synthesized nanocomposites suggested strong interaction
between the polymers chains and nanoparticles.
2. As evident by XRD pattern, the presence of nanoparticles strongly affects the
crystalline behavior of the polymer.
3. SEM micrograph of nanocomposites shows that the nanoparticles are fairly
dispersed in the polymer matrix. The nanoparticles are almost uniform, global
and slightly agglomerated. EDS mapping of the nanocomposite indicated that
the ZnO nanoparticle are well dispersed in the polymers.

CHAPTER 8
149
4. TEM micrograph clearly reveals that the nanoparticles in the range of 25-30 nm
are homogeneously dispersed and embedded in the polymer matrix.
5. The pure homopolymer, copolymer and terpolymer showed comparatively
inadequate adhesion to the mild steel substrate, where 5–15% of the coating was
removed. The coatings formed by nanocomposites displayed suitable adhesion
to the mild steel substrate, where less than 5% of the coating was removed
during the test.
6. The results of immersion test confirmed significantly higher corrosion
protection for nanocomposites of homopolymers, copolymers and terpolymers
than their respective homopolymers, copolymers and terpolymers in different
corrosive environments. The performance of terpolymers nanocomposites
coatings was better than copolymers and homopolymers nanocomposites
coatings owing to their superior barrier effect and improved passivation
behaviour.
7. The OCP results confirmed remarkable noble (positive) shift in OCP values for
terpolymer, copolymers, homopolymers and their respective nanocomposite
coated steel specimens. This indicate that inhibition mechanism of conducting
polymers is related with both passivation and barrier effect. The positive shift in
the OCP is more pronounced for terpolymer-nanocomposites coatings as
compared to pure terpolymers, copolymers, homopolymers and their respective
nanocomposites in all corrosive solutions.
8. As evidenced by the potentiodynamic polarization measurements, the presence
of polymer coatings on the steel substrate caused a remarkable positive shift in
the values of Ecorr and significant lowering in icorr. In case of terpolymer-
nanocomposites the shift in all electrochemical parameters is more pronounced
than the copolymers/homopolymers-nanocomposites.
9. EIS results indicated an increase in Rct value and decrease in Cdl value in
presence of polymer coatings compared to the bare steel. The increase in the Rct
values is attributed to the barrier behavior and formation of protective passive
oxide layer on the mild steel substrate whereas the decrease in Cdl value is
caused due to the reduction in local dielectric constant and/or increase in
thickness of double layer.

CHAPTER 8
150
10. The nanocomposites coatings were found least affected during the atmospheric
exposure test.
11. SEM micrograph of nanocomposites coatings provided crack free, homogenous
and continuous closed packed structure on the mild steel and brought higher
corrosion protection to the metallic substrate.
8.2 Scope for Future Work
The development of nanocomposites coatings based on conducting polymers
has resulted in the significant improvement in corrosion protection of mild steel. The
incorporation of nanoparticles within the conducting polymers matrix has resulted in
the modification of the morphology and improvement in the physio-chemical
properties like improved adhesion to metal surface, less porosity, stability, better
mechanical strength and easy processibilty. However, in order to exploit such
coatings commercially further improvement in their processibilty, biocompatibility,
adhesion to the base metals and long term corrosion protection performance under
extreme service conditions is needed. In order to meet the above requirements it is
proposed to:
1. Synthesize some self-healing nanocomposite coatings based on conducting
polymers (polyaniline, polypyrrole and their derivatives), biopolymers
(xanthan gum, guar gum, cellulose, chitosan, starch) and 2D materials
(graphene, carbon nanotube, MoS2 and 2D metal oxides) on commercially
available iron base alloys.
2. To evaluate the anticorrosive properties of the resultant coatings in major
corrosive environments by subjecting them to various tests which include:
immersion test, OCP measurements, potentiodynamic polarization and
electrochemical impedance measurements, scanning electron microscopy, salt
fog test and adhesion test.
3. The synthesis of conducting polymers/biopolymers/2D materials
nanocomposites will enable in the development of conducting polymer coating
systems with improved self-healing property, processibilty, biocompatibility,
adhesion to the substrate and long term corrosion protection performance
under extreme service conditions.

References

REFRENCES
(151)
References
[1] R. Parsons, Pure Appl. Chem., 37 (1979) 503.
[2] Corrosion of Metals and Alloys, Terms and Definitions, Draft International
Standard ISO/DIS 8044, TC, 156, (1985).
[3] K. E. Heusler, D. Landolt and S. Trasatti, Electrochemical Corrosion
Nomenclature (Recommendation 1998), Electrochim. Acta, 35 (1990) 295.
[4] L.S. Van Delinder, Corrosion Basics, An Introduction, ed. (Houston, TX:
NACE), (1984).
[5] H. H. Uhlig, The Cost of Corrosion in the United States. Chemical and
Engineering News, 27 (1949) 2764.
[6] L. Losana, 11th Int. Congr. On Metallic Corrosion, Florence, Itali, 1 (1990) 1.
[7] L.H. Bennet, J. Kruger, R. I. Parker, E. Passiglia, C. Reimann, A. W. Ruff, H.
Yakowitz and E. B. Berman, "Economic Effects of Metallic Corrosion in the
United States", National Bureau of Standards Special Publication 511,
Washington, DC, (1978).
[8] G. H. Koch, M. P. H. Brongers, N. G. Thompson, Y. P. Virmani and J. H. Payer,
“Corrosion Costs and Preventive Strategies in the United States”. Report by C.C
Technologies Laboratories, Inc. to Federal Highway Administration (FHWA),
Office of Infrastructure Research and Development, Publication no. FHWA-
RD-01-156, March, (2002).
[9] J. Haque, V. Srivastava, C. Verma and M. A. Quraishi, J. Mol. Liq.,
http://dx.doi.org/101016/j.molliq.2016.11.011 (2016).
[10] K. S. Rajagopalan, 10th Int. Congr. On Metallic Corrosion, Chennai, Oxford
& IBH, New Delhi, 2 (1987) 1765.
[11] A. S. Khanna, News Letter, NACE, India, 4 (1997) 3.
[12] C. F. Jaske, J. A. Beavers and N. G. Thompson, Corros. Prevention & Control,
49 (2002) 1.
[13] S. D. Cramer and B. S. Covino, Jr., Eds., “Corrosion, Fundamentals, Testing,
and Protection”, ASM Handbook, Vol. 13A, ASM International, Materials
Park, OH (2003).
[14] G. S Frankel and M. Rohwerder, "Experimental Techniques for Corrosion," in
Corrosion and Oxide Films, Encyclopedia of Electrochemistry, Vol. 4, M
Stratmann and G. S. Frankel, Eds., Wiley-VCH, Weinheim, Germany, (2003).
REFRENCES
(152)
[15] F. Mansfeld, "The Polarization Resistance Technique for Measuring Corrosion
Currents." in Advances in Corrosion Science and Technology, M. G. Fontana
and R. W. Staehle, Eds., Plenum, New York, (1976).
[16] J. R. Scully, "Electrochemical Methods for Laboratory Corrosion Testing," in
Corrosion Testing and Evaluation: Silver Anniversary Volume, R. Baboian and
S. W. Dean. Eds., ASTM International, West Conshohocken, PA, (1990).
[17] J. R. Scully, Corrosion, 56 (2000) 199.
[18] R. G. Kelly, J. R. Scully, D. W. Shoesmith and R. G. Buchheit, Electrochem.
Techniques in Corrosion Science and Engineering, Marcel Dekker, New York,
(2003).
[19] R. Baboian, Electrochemical Techniques, Ed., NACE, Houston, (1986).
[20] R. Baboian, Corrosion Tests and Standards, Ed., ASTM International, West
Conshohocken. PA, (1995).
[21] M. Kendig and F. Mansfeld, Corrosion, 39 (1983) 466.
[22] W. J. Lorenz and F. Mansfeld, Corros. Sci., 21 (1981) 647.
[23] J. R. Macdonald, Impedance Spectroscopy, Ed., John Wiley and Sons, New
York, (1987).
[24] W. S. Tait, An Introduction to Electrochemical Testing for Practicing Engineers
and Scientists, PairODocs Publications, Racine, WI, (1994).
[25] R. A. Cottis, S. Turgoose and R. C. Newman, Corrosion Testing Made Easy:
Impedance and Noise Analysis, B.C. Syrett, Ed., NACE, Houston, TX, (1999).
[26] U. Bertocci, C. Gabrielli, F. Huet and M. Keddam, J. Electrochem. Soc., 144
(1997) 31.
[27] U. Bertocci, C. Gabrielli. F. Huet, M. Keddam and P. Rousseau, J.
Electrochem. Soc., 144 (1997) 37.
[28] U. Bertocci and F. Huet, J. Electrochem. Soc., 144 (1997) 2786.
[29] U. Bertocci, J. Frydman, C. Gabrielli, F. Huet and M. Keddam, J. Electrochem.
Soc., 145 (1998) 2780.
[30] R. A. Cottis, Corrosion, 57 (2001) 265.
[31] F. Huet, "Listening to Corrosion", Interface (USA) 10 (2001) 40.
[32] F. Mansfeld and H. Xiao, J. Electrochem. Soc., 140 (1993) 2205.
[33] R. A. Cottis, J. Electrochem. Soc., 42 (2006) 557.
[34] M. G. Fontana, Corrosion Engineering, 3rd edition, McGraw-Hill Book Co.,
(1986).
REFRENCES
(153)
[35] M. Mobin and A. U. Malik, Mater. Perform. , 44 (2005) 28.
[36] A. U. Malik, M. Mobin, I. N. Andijani, S. Al-Fozan and A. Al-Hamed, J.
Failure Anal. Preven., 6 (2006)19.
[37] A. I. Asphahani and W. L. Silence, Metal Handbook, ASME, 13 (1987) 113.
[38] M. Mobin, A. U. Malik and F. Al-Muaili, J. Failure Analysis and Prevention,
9 (2009) 409.
[39] S. Shoji and N. Ohnaka, Corros. Eng., 42 (1993) 877.
[40] NACE Glossary of Corrosion Terms, Corrosion, 20 (1964) 267.
[41] N. Hackerman, Corrosion 93, Plenary and Keynote Lectures, R.D. Gundry (ed.),
NACE International, Houston, Texas, (1993).
[42] H. Hartley, Proceedings of the Royal Society of London. Series A,
Mathematical and Physical Sciences, 114 (1824) 151and 115 (1825) 328.
[43] C. Edeleanu, Metallurgia, 50 (1954) 113.
[44] H. Shirakawa, E. J. Louis, A. G. MacDiarmid, C. K. Chiang and A. J. Heeger,
J. Chem. Soc. Chem. Comm., 16 (1977) 578.
[45] D. J. Sandman, M. Rubne and L. Samuelson. J. Chem. Soc. Chem. Commun.,
731 (1982) 1133.
[46] K. Y. Jen, M. V. Lakshmikantan, M. Albeck, M. P. Cava, W. S. Huang and A.
G. MacDiarmid., J. Polym. Sci. Polym. Lett. Edn., 21 (1983) 441.
[47] G. Tourillon and F. Garnier, J. Phys. Chem., 87 (1983) 2289.
[48] T. A. Skotheim (Ed.), Handbook of Conducting Polymers, Vol. I–II, Marcel
Dekker Inc., New York, (1986).
[49] H. S. Nalwa, Handbook of Organic Conductive Molecules and Polymers, Vol.
1–4, Wiley, New York, (1997).
[50] P. Ocon, A. B. Cristobal, P. Herrasti and E. Fatas, Corros. Sci., 47 (2005) 649.
[51] D. P. Le, Y. H. Yoo, J. G. Kim, S. M. Cho and Y. K. Son, Corros. Sci., 51
(2009) 330.
[52] A. Kalendova, I. Sapurina, J. Stejskal and D. Vesely, Corros. Sci., 50 (2008)
3549.
[53] J. R. Santos, L. H. C. Mattoso and A. J. Motheo, Electrochim. Acta, 43 (1998)
309
[54] M. Kraljic, Z. Mandic and Lj. Duic, Corros. Sci., 45 (2003) 181.
[55] A. T. Ozyilmaz, M. Erbil and B. Yazici, Prog. Org. Coat., 51 (2004) 47.
[56] N. Ahmad and A.G. MacDiarmid, Synth. Met., 78 (1996) 103.

REFRENCES
(154)
[57] P. P. Deshpande, N. G. Jadhav, V. J. Gelling, D. Sazou, J. Coat. Technol. Res.,
11 (2014) 473.
[58] G. Spinks, A. Dominis, G. Wallace and D. Tallman, J. Solid State Electrochem,
6 (2002) 85.
[59] T. K. Rout, G. Jha, A. K. Singh, N. Bandyopadhyay and O. N. Mohanty, Surf.
Coat. Technol., 167 (2003) 16.
[60] M. Kraljic, K. Z. Mandic, L. J. Duic, Corros. Sci., 45 (2003) 181.
[61] Y. Bin, W. Gengchao, J. Ye and X. Li, Mater. Lett., 62 (2008) 1775.
[62] E. Armelin, A. Meneguzzi, C. A. Ferreira and C. Aleman, Surf. Coat. Technol.,
203 (2009) 3763.
[63] D. W. DeBerry, J. Electrochem. Soc., 132 (1985) 1022.
[64] B. Wessling, Adv. Mater., 6 (1994) 226.
[65] Y. Wei, J. Wang, X. Jia, J. M. Yeh and P. Spellance, Polymer, 36 (1995) 4535.
[66] B. C. Roy, M. D. Gupta and J. K. Ray, Macromolecules, 28 (1995) 1727.
[67] W. K. Lu, R. L. ElsenBaumer and B. Wessling, Synth. Met., 71 (1995) 2163.
[68] T. P. McAndrew, S. A. Miller, A. G. Gilicinski and L. M. Robeson, Polym. Mat.
Sci. Eng., 74 (1996) 204.
[69] D. Sazou and C. Georgolios, J. Electroanal. Chem., 429 (1997) 81.
[70] A. Talo, O. Forsen and S. Ylasaari, Synth. Met., 102 (1999) 1394.
[71] W. S. Araujo, I. C. P. Margarit, M. Ferreira, O. R. Mattos and P. L. Neto,
Electrochim. Acta, 46 (2001) 1307.
[72] E. W. Brooman, Met. Finish, 100 (2002) 104.
[73] D. Tallman, G. Spinks, A. Dominis and G. Wallace, J. Solid State Electrochem,
6 (2002) 73.
[74] M. Spinks, A. J. Dominis and G. G. Wallace, Corrosion, 59 (2003) 22.
[75] S. Biallozor and A. Kupniewska, Synth. Met., 155 (2005) 443.
[76] N. Ahmad, A. U. Malik and M. Mobin, J. Ind. Chem. Soc., 84 (2007) 1.
[77] P. Pawar, A. B. Gaikwad and P. P. Patil, Sci. Tech. Adv. Mat., 7 (2006) 732.
[78] Y. Chem, X. H. Wang, J. Li, J. Lu and F. S. Wang, Corros. Sci., 49 (2007) 3052.
[79] J. Fang, K. Xu, L. Zhu, Z. Zhou and H. Tang, Corros. Sci., 49 (2007) 4232.
[80] S. Sathiyanarayanan, S. Muthukrishnan, G. Venkatachari, D.C. Trivedi,
Prog. Org. Coat., 53 (2005) 297.
[81] F. Beck, Electrochim. Acta, 33 (1988) 839.
REFRENCES
(155)
[82] F. Beck, R. Michaelis, F. Schloten and B. Zinger, Electrochim. Acta, 39 (1994)
229.
[83] V. Haase and F. Beck, Electrochim. Acta, 39 (1994) 1195.
[84] C. A. Ferreira, S. Aeiyach, J. J. Aaron and P. C. Lacaze, Electrochim. Acta, 41
(1996) 1801.
[85] H. Korriyoussoufi, F. Garnier, P. Srivastava, P. Godillot and A. Yassar, J. Am.
Chem. Soc., 119 (1997) 7388.
[86] N. V. Krstajic, B. N. Grgur, S. M. Jovanovic and M. V. Vojnovic, Electrochim.
Acta, 42 (1997) 1685.
[87] B. N. Grgur, N. V. Krstajic, M. V. Vojnovic, C. Lacnjevac and L. Gajic-
Krstajic, Prog. Org. Coat., 33 (1998) 1.
[88] B. Zaid, S. Aeiyach, P. C. Lacaze and H. Takenouti, Electrochim. Acta, 43
(1998) 2331.
[89] J. Reut, A. Opik and K. Idla, Synth. Met., 102 (1999) 1392.
[90] J. Petitjean, S. Aeiyach, J. C. Lacroix and P. C. Lacaze, J. Electroanal. Chem.,
478 (1999) 92.
[91] M. Zhou and J. Heinze, Electrochim. Acta, 44 (1999) 1733.
[92] C .A. Ferreira, S. Aeiyach, A. Couloud and P. C. Lacaze, J. Appl. Electrochem,
29 (1999) 259.
[93] S. Wencheng and J. O. Iroh, Synth. Met., 114 (2000) 225.
[94] S. Wencheng and J. O. Iroh, Electrochim. Acta, 46 (2000) 1.
[95] J. O. Iroh and S. Wencheng, Electrochim. Acta, 46 (2000) 15.
[96] L. Wang, X. Li and Y. Yang, React. Funct. Polym., 47 (2001) 125.
[97] S. B. Saidman and J. B. Bessone, J. Electroanal. Chem., 521 (2002) 87.
[98] C.K. Tan and D.J. Blackwood, Corros. Sci., 45 (2003) 545.
[99] M. Bazzaoui, J. I. Martins, T. C. Reis, E. A. Bazzaoui, M. C. Nunes and L.
Martins, Thin Solid Films, 485 (2005) 155.
[100] B. N. Grgur, P. Zivkovic and M. M. Gvozdenovic, Prog. Org. Coat., 56 (2006)
240.
[101] E. Hur, G. Bereket and Y. Sahin, Mater. Chem. Phys., 100 (2006) 19.
[102] M. G. Hosseini, M. Sabouri and T. Shahrabi, Prog. Org. Coat., 60 (2007) 178.
[103] F. Jiang, X. W. Guo and Y. H. Wei, Synth. Met., 139 (2003) 335.
[104] P. Li, T. C. Tan and J. Y. Lee, Synth. Met., 88 (1997) 237.
[105] P. J. Kinlen, V. Menon and Y. Ding, J. Electrochem. Soc., 146 (1999) 3690.

REFRENCES
(156)
[106] P. J. Kinlen, Y. Ding and D. C. Silverman, Corrosion, 58 (2002) 490.
[107] T. Schauer, A. Joos, L. Dulog, and C. D. Eisenbach, Prog. Org. Coat., 33 (1998)
20.
[108] A. A. Pud, G. S. Shapoval, P. Kamarchik, N. A. Ogurtsov, V. F. Gromovaya, I.
E. Myronyuk and Y. V. Kontsur, Synth. Met., 107 (1999) 111.
[109] B. Wessling and J. Posdorfer, Synth. Met., 102 (1999) 1400.
[110] B. Wessling and J. Posdorfer, Electrochim. Acta, 44 (1999) 2139.
[111] P. J. Kinlen, D. C. Silverman and C. R. Jeffreys, Synth. Met., 85 (1997) 1327.
[112] J. L. Camalet. J. C. Lacroix, S. Aeiyach, K. I. Chane Ching and P. C. Lacaze,
Synth. Met., 93 (1998) 133.
[113] M. Bouayed, H. Rabaa, A. Srhiri, J. Y. Saillard, A. Ben Bachir and A. Le Beuze,
Corros. Sci., 41 (1999) 501.
[114] H. Luo, Y. C. Guan and K. N. Han, Corrosion, 54 (1998) 721.
[115] S. Sathiyanarayanan, S. K. Dhawan, D. C. Trivedi and K. Balakrishnan, Corros.
Sci., 33 (1992) 1831.
[116] M. H. Moayed and R. C. Newman, Corros. Sci., 40 (1998) 519.
[117] R. Hasanov and S. Bilgic, Prog. Org. Coat., 64 (2009) 435.
[118] J. O Iroh, Y. Zhu, K. Shah, K. Levine, R. Rajagopalan, T. Uyar, M. Donley, R.
Mantz, J. Johnson, N. N. Voevodin, V. N. Balbyshev and A. N. Khramov, Prog.
Org. Coat., 47 (2003) 365.
[119] R. Rajagopalan and J. O. Iroh, Electrochim. Acta, 46 (2001) 2443.
[120] J. L. Camalet. J. C. Lacroix, S. Aeiyach, K. I. Chane Ching and P. C. Lacaze,
Synth. Met., 102 (1999) 1386.
[121] Z. Gao, J. Bobacka and A. Ivaska, Synth. Met., 55 (1993) 1477.
[122] T. Tuken, G. Arslan, B. Yazici and M. Erbil, Corros. Sci., 46 (2004) 2743.
[123] B. Narayanasamy and S. Rajendran, Prog. Org. Coat., 67 (2010) 246.
[124] B. Zeybek, N. O. Pekmez and E. Kilic, Electrochim. Acta, 56 (2011) 9277.
[125] S. A. Kumar, K. Shree Meenakshi, T. S. N. Sankaranarayanan and S. Srikanth,
Prog. Org. Coat., 62 (2008) 285.
[126] R. C. Patil and S. Radhakrishnan, Prog. Org. Coat., 57 (2006) 332.
[127] H. Yang and W. J. Van Ooij, Prog. Org. Coat., 50 (2004) 149.
[128] M. Mobin and N. Tanveer, Portugaliae Electrochimica Acta, 29 (2011) 139.
[129] J. M. Yeh, C. P. Chin and S. Chang, J Appl. Poly. Sci., 88 (2003) 3264.
REFRENCES
(157)
[130] A. J. Motheo, M. F. Pantoja and E. C. Venancio, Solid State Ionics., 171 (2004)
91.
[131] D. D. Borole, U. R. Kapadi, P. P. Mahulikar and D. G. Hundiwale, Mater. Lett.,
60 (2006) 2447.
[132] A. Ashrafi, M. A. Gholzar and S. Mallakpour, Synth. Met., 156 (2006) 1280.
[133] K. Boukerma, J. Y. Piquemal, M. M. Chehimi, M. Mravcakova, M. Omastova
and P. Beaunier, Polymer, 47 (2006) 569.
[134] B. N. Popov, M. A. Alwohaibi and R. E. White, J. Electrochem. Soc., 140
(1993) 947.
[135] M. Omastova, M. Trchova, J. Kovarova and J. Stejskal, Synth. Met., 138 (2003)
447.
[136] S. Sathiyanarayanan, S. Muthkrishnan and G. Venkatachari, Electrochim. Acta,
51 (2006) 6313.
[137] S. Sathiyanarayanan, S. S. Azim and G. Venkatachari, Synth. Met., 157 (2007)
205.
[138] S. Sathiyanarayanan, S. S. Azim and G. Venkatachari, Electrochim. Acta, 52
(2007) 2068.
[139] S. Sathiyanarayanan, S. S. Azim and G. Venkatachari, Synth. Met., 157 (2007)
751.
[140] S. Sathianarayanan, S. S. Azim and G. Venkatachari, Electrochim. Acta, 53
(2008) 2087.
[141] C. Visy, G. Bencsik, Z. Nemeth and A. Vertes, Electrochim. Acta, 53 (2008)
3942.
[142] A. Olad and A. Rashidzadeh, Iran J. of Chem. Engg., 5 (2008) 45.
[143] A. A. Ahmed-Al-Dulaimi. S. Hashim and M. I. Khan, Pertanika J. Sci. &
Technol., 19 (2011) 329.
[144] L. H. E. Santos, J. S. C. Branco, I. S. Guimaraes and A. J. Motheo, Surf. Coat.
Techno., 275 (2015) 26.
[145] C. M. D. L. Almazan, M. Y. Chavez-Cinco, U. Paramo-Garcia, A. M.
Mendoza-Martinez, I. A. Estrada-Moreno and J. L. Rivera-Armenta, Polym.
Bull., 73 (2016) 1595.
[146] A. T. Ozyilmaz, N. Colak, M. K. Sangun, M. Erbil and B. Yazici, Prog. Org.
Coat., 54 (2005) 353.
[147] G. Bereket, E. Hur and Y. Sahin, Appl. Surf. Sci., 252 (2005) 1233.
REFRENCES
(158)
[148] E. Hur, G. Bereket and Y. Sahin, Prog. Org. Coat., 57 (2006) 149.
[149] E. Hur, G. Bereket and Y. Sahin, Current Appl. Phys., 7 (2007) 597.
[150] T. Tueken, G. Tansug, B. Yazici and M. Erbil, Surf. Coat. Technol., 202 (2007)
146.
[151] A. P. Srikanth, V. Raman, S. Tamilselvi, S. Nanjundan and N. Rajendran, J.
Anti Corros. Methods Mater., 55 (2008) 3.
[152] S. Yalcinkaya, T. Tuken, B. Yazici and M. Erbil, Prog. Org. Coat., 62 (2008)
236.
[153] S. Yalcinkaya, T. Tuken, B. Yazici and M. Erbil, Current Appl. Phys., 10
(2010) 783.
[154] M. Mobin and N. Tanveer, Journal of Minerals and Materials
Characterization and Engineering, 10 (2011) 735.
[155] N. Tanveer and M. Mobin, Prog. Org. Coat., 75 (2012) 231.
[156] M. Mobin and N. Tanveer, J. Coat. Techno and Res., 9 (2012) 27.
[157] M. Mobin and N. Tanveer, Prot. Met. Phys. Chem. Surf., 48 (2012) 243.
[158] K. M. Govindaraju and V. C. A. Prakash, Colloids Surf. A: Physicochem. Eng.
Aspects, 465 (2015) 11.
[159] P. Sambyal, G. Ruhi, H. Bhandari and S. K. Dhawan, Surf. Coat. Techno., 272
(2015) 129.
[160] S. Radhakrishnan, C. R. Siju, D. Mahanta, S. Patil and G. Madras, Electrochim.
Acta, 54 (2009) 1249.
[161] J. M. Yeh, S. J. Liou, C. Yulai and P. Chiwu, Chem. Mater., 13 (2001) 1131.
[162] A. Olad and B. Naseri, Prog. Org. Coat., 67 (2010) 233.
[163] N. Rajendran and P. Muthirulan, Mat. Sci. & Technol., (2010) 17.
[164] H. Bhandari, R. Srivastav, V. Choudhary and S. K. Dhawan, Thin Solid Films,
519 (2010) 1031.
[165] J. Alam, U. Riaz and S. Ahmed, Polym. Adv. Technol., 19 (2008) 882.
[166] G. Ciric-Marjanovic, Synth. Met., 170 (2013) 31.
[167] A. Olad and R. Nosrati, Prog. Org. Coat., 68 (2012) 319.
[168] A. Olad and H. Rasouli, J. Appl. Polym. Sci., 115 (2010) 2221.
[169] A. Olad, M. Barati and H. Shirmohammadi, Prog. Org. Coat., 72 (2011) 599.
[170] M. G. Hosseini, R. Bagheri and R. Najjar, J. Appl. Polym. Sci., 121 (2011)
3159.

REFRENCES
(159)
[171] M. R. Mahmoudian, W. J. Basirun and Y. Alias, Appl. Surf. Sci., 257 (2011)
3702.
[172] M. R. Mahmoudian, W. J. Basirun, Y. Alias and M. Ebadi, Appl. Surf. Sci., 257
(2011) 8317.
[173] M. Ionita and A. Pruna, Prog. Org. Coat., 72 (2011) 647.
[174] E. Akbarinezhad, M. Ebrahimi, F. Sharif, M. M. Attar and H. R. Faridi, Prog.
Org. Coat., 70 (2011) 39.
[175] A. Mostafaei and A. Zolriasatein, Prog. Nat. Sci., 22 (2012) 273.
[176] A. Mostafaei and F. Nasirpouri, Prog. Org. Coat., 77 (2014) 146.
[177] M. Kumar and Z. M. Gasem, Prog. Org. Coat., 78 (2015) 387.
[178] R. Layeghi, M. Farbodi and N. Ghalebsaz-Jeddi, Int. J. Nanosci. Nanotechnol.,
12 (2016) 167.
[179] J. F. Pagotto, F. J. Recio, A. J. Motheoa and P. Herrasti, Surf. Coat. Techno.,
289 (2016) 23.
[180] K. S. Novoselov, A. K. Geim, S. V. Morozov, D. Jiang, Y. Zhang, S. V.
Dubonos, I. V. Grigorieva and A. A. Firsov, Science, 306 (2004) 666.
[181] T. Kuila, S. Bose, A. K. Mishra, P. Khanra, N. H. Kim and J. H. Lee, Prog
Mater Sci, 57 (2012) 1061.
[182] H. Kim, A. A. Abdala and C. W. Macosko, Macromolecules, 43 (2010) 6515.
[183] S. S. Chen, L. Brown, M. Levendorf, W. W. Cai, S. Y. Ju, J. Edgeworth, X. S.
Li, C. W. Magnuson, A. Velamakanni, R. D. Piner, J. Y. Kang, J. Park and R.
S. Ruoff, ACS Nano, 5 (2011) 1321.
[184] J. Cho, L. Gao, J. F. Tian, H. L. Cao, W. Wu, Q. K. Yu, E. N. Yitamben, B.
Fisher, J. R. Guest, Y. P. Chen and N. P. Guisinger, ACS Nano, 5 (2011) 3607.
[185] S. Sreevatsa, A. Banerjee, G. Haim, ECS Meeting Abstracts, 901 (2009) 1319.
[186] N. T. Kirkland, T. Schiller, N. Medhekar and N. Birbilis, Corros Sci, 56 (2012)
1.
[187] D. Prasai, J. C. Tuberquia, R. R. Harl, G. K. Jennings, K. I. Bolotin, ACS Nano
6 (2012) 1102.
[188] R.K. Singh Raman, P. C. Banerjee, D. E. Lobo, H. Gullapalli, M. Sumandasa,
A. Kumar, L. Choudhary, R. Tkacz, P. M. Ajayan, M. Majumder, Carbon, 50
(2012) 4040.
[189] C. H. Chang, T. C. Huang, C. W. Peng, T. C. Yeh, H. I. Lu, W. I. Hung, C. J.
Weng, T.I. Yang and J. M. Yeh, Carbon, 50 (2012) 5044.

REFRENCES
(160)
[190] S. J. R. Prabakar, Y. H. Hwang, E. G. Bae, D. K. Lee, M. Pyo, Carbon, 52
(2012) 128.
[191] D. Kang, J. Y. Kwon, H. Cho, J. H. Sim, H. S. Hwang, C. S. Kim, Y. J. Kim,
R. S. Ruoff and H. S. Shin, ACS Nano,6 (2012) 7763.
[192] S. Stankovich, D. A. Dikin, G. H. B. Dommett, K. M. Kohlhaas, E. J. Zimney,
E. A. Stach, R. D. Piner, S. T. Nguyen and R. S. Ruoff, Nature, 442 (2006) 282.
[193] O. Akhavan, E. Ghaderi, ACS Nano, 4 (2010) 5731.
[194] I. N. Kholmanov, M. D. Stoller, J. Edgeworth, W. H. Lee, H. Li , J. Lee, et al.
ACS Nano, 6 (2012) 5157.
[195] K. Krishnamoorthy, M. Veerapandian, L. H. Zhang, K. S. Yun, S. J. Kim, J.
Phys Chem C, 116 (2012) 17280.
[196] K. P. Loh, Q. Bao, G. Eda, M. Chhowalla, Nat Chem., 2 (2010) 1015.
[197] D. A. Dikin, S. Stankovich, E. J. Zimney, R. D. Piner, G. H. B. Dommett, G.
Evmenenko, et al., Nature, 448 (2007) 457.
[198] K. Krishnamoorthy, M. Veerapandian, K. Yun, S. J. Kim, Carbon, 53 (2012)
38.
[199] D. R. Dreyer, H. P. Jia, C. W. Bielawski, Angew Chem Int Ed, 49 (2010) 6813.
[200] D. Gnanasangeetha and D. Sarala Thambavani, Res. J. Mater. Sci., 1 (2013) 1.
[201] Z. Gao, N. Liu, D. Wu, W. Tao, F. Xu and K. Jiang, Appl. Surf. Sci., 258 (2012)
2473.
[202] S. Stankovich, D. A. Dikin, R. D. Piner, K. A. Kohlhaas, A. Kleinhammes, Y.
Jia, Y. Wu, S.T. Nguyen and R. S. Ruoff, Carbon, 45 (2007) 1558.
[203] J. A. Conklin, S. C. Huang, S. M. Huang, T. Wen and R. B. Kaner,
Macromolecules, 28 (1995) 6522.
[204] S. S. Pandey, S. Annapoorni, and B. D. Malhotra, Macromolecules, 26 (1993)
3190.
[205] X .G. Li, M. R. Huang and Y. Yang, Polym. J., 4 (2000) 348.
[206] X. G. Li, M. R. Huang, P. Pan, Z. L. Zhu and Y. L. Yang, Polym. Degrad. Stab.,
71 (2001) 333.
[207] W. Sun and Z. Mo, Mater. Sci. Eng., B, 178 (2013) 527.
[208] S. Chaudhari, A. B. Mandale, K. R. Patil, S. R. Sainkar and P. P. Patil, Surf.
Coatings Technol., 200 (2006) 5557.
[209] X. G. Li, H. Y. Wang and M. R. Huang, Macromolecules, 40 (2007) 1489.
[210] H. Xia and Q. Wang, J. Appl. Polym. Sci., 87 (2003) 1811.

REFRENCES
(161)
[211] E. M. Scherr, A. G. MacDiarmid, S. K. Manohar, J. G. Masters, Y. Sun, X.
Tang, M. A. Druy, P. J. Glatkowski, V. B. Cajipe, J. E. Fischer, K. R. Cromack,
M. E. Jozefowicz, J. M. Ginder, R. P. McCall and A. J. Epstein, Synth. Met.,
41 (1991), 735.
[212] J. P. Pouget, C. H. Hsu, A. G. Mac Diarmid, and A. J. Epstein, Synth. Met., 69
(1995) 119.
[213] K. Sivakumar, V. S. Kumar and Y. Haldorai, Comp. Interface, 19 (2012) 397.
[214] D. Kumar and R. C. Sharma, Eur. Polym. J., 34 (1998) 1053.
[215] X. Li and X. Li., Mater. Lett., 61 (2007) 2011.
[216] V. V. Chabukswar and A. Athawale, J. Appl. Poly. Sci., 79 (2001) 1994.
[217] O. T. Ikkala, L. O. Pietila, L. Ahjopalo, H. Osterholm and P. Passiniemi, J.
Chem. Phys., 103 (1995) 9855.
[218] A. Olad and R. Nosrati, Prog. Org. Coat., 76 (2013) 113.
[219] A. Olad and R. Nosrati, Res. Chem. Intermed., 38 (2012) 323.
[220] R. Vera, R. Schrebler, P. Cury, R. R. Del and H. Romero, J. Appl.
Electrochem., 37 (2007) 519.
[221] S. Sathiyanarayanan, S. S. Azim and G. Venkatachari, Prog. Org. Coat., 59
(2007) 291.
[222] S. Radhakrishnan, N. Sonawane, and C. R. Siju, Prog. Org. Coat., 64 (2009)
383.
[223] S. Sathiyanarayanan, V. Karpakam, K. Kamaraj, S. Muthukrishnan and G.
Venkatachari, Surf. Coat. Technol., 204 (2010) 1426.
[224] S. Sathiyanarayanan, K. Maruthan, S. Muthukrishnan and G. Venkatachari,
Prog. Org. Coat., 66 (2009) 113.
[225] S. Sathiyanarayanan, C. Jeyaprabha and G. Venkatachari, Mater. Chem. Phys.,
107 (2008) 350.
[226] X. G. Li, W. Duan, M. R. Huang and Y. L. Yang, J. Polym. Sci. Part A Polym.
Chem., 39 (2001) 3989.
[227] M. C. Bernard and L. G. Hugot, J. Electrochem. Soc., 141 (1994) 2682.
[228] D. C. Trivedi and S. K. Dhavan, Synth. Met. 58 (1993) 309.
[229] M. R. Bagherzadeh, F. Mahdavi, M. Ghasemi, H. Shariatpanahi and H. R.
Faridi, Prog. Org. Coat., 68 (2010) 319.
[230] G. S. Goncalves, A. F. Baldissera, L. F. Rodrigues, E. M. A. Martini and C. A.
Ferreira, Synth. Met., 161 (2011) 313.

REFRENCES
(162)
[231] A. Olad and R. Nosrati, Prog. Org. Coat., 68 (2012) 319.
[232] A. Mirmohseni and A. Oladegaragoze, Synth. Met., 114 (2000) 105.
[233] P. Pawar, A. B. Gaikwad and P. P. Patil, Electrochim. Acta, 52 (2007) 5958.
[234] F. Mansfeld, Corros., 37 (1981) 301.
[235] C. H. Hsu and F. Mansfeld, Corrosion, 57 (2001) 747.
[236] I. Ahamad and M. A. Quraishi, Corros. Sci., 51 (2009) 2006.
[237] A. Mostafaei and F. Nasirpouri, J. Coat. Technol. Res., 10 (2013) 679.
[238] A. Mostafaei and F. Nasirpouri, Corros. Eng. Sci. Technol., 48 (2013) 513.
[239] W. S. Huang, B. D. Humphrey, A. G. MacDiarmid, J. Chem. Soc., Faraday
Trans. 1: Phys. Chem. Condens. Phases., 82 (1986) 2385.
[240] B. K. Sharma, A. K. Gupta, N. Khare, S. K. Dhawan and H. C. Gupta, Synth.
Met., 159 (2009) 391.
[241] L. Ma, F. Chen, Z. Li, M. Gan, J. Yan, S. Wei, Y. Bai and J. Zeng, Compos. B:
Eng., 58 (2014) 54.
[242] K. Saravanan, S. Sathiyanarayanan, S. Muralidharan, S. S. Azim and G.
Venkatachari, Prog. Org. Coat., 59 (2007) 160.
[243] J. Zhu, S. Wei, L. Zhang, Y. Mao, J. Ryu, P. Mavinakuli, A. B. Karki, D. P.
Young and Z. Guo, J. Phys. Chem. C, 114 (2010) 16335.
[244] J. Wu, X. Shen, L. Jiang, K. Wang and K. Chen, Appl. Surf. Sci., 256 (2010)
2826.
[245] D. Zhang, X. Zhang, Y. Chen, P. Yu, C. Wang and Y. Ma, J. Power Sources,
196 (2011) 5990.
[246] M. K. Song, Y. T. Kim, B. S. Kim, J. Kim, K. Char and H. W. Rhee, Synth.
Met., 141 (2004) 315.
[247] P. K. Kalambate, R. A. Dar, S. P. Karna and A. K. Srivastava, J. Power Sources,
276 (2015) 262.
[248] K. Zhang, L. L. Zhang, X. S. Zhao and J. Wu, Chem. Mater., 22 (2010) 1392.
[249] P. J. Hung, K. H. Chang, Y. F. Lee, C. C. Hu and K. M. Lin, Electrochim. Acta,
55 (2010) 6015.
[250] R. Arefinia, A. Shojaei, H. Shariatpanahi and J. Neshati, Prog. Org. Coat., 75
(2012) 502.

List of Publications
List of Publications
[1] R. Alam, M. Mobin and J. Aslam, “Investigation of anti-corrosive properties
of poly(aniline-co-2-pyridylamine-co-2, 3-xylidine) and its nanocomposite
poly(aniline-co-2-pyridylamine-co-2, 3-xylidine)/ZnO on mild steel in 0.1 M
HCl”, Applied Surface Science, 368 (2016) 360.
[2] M. Mobin, R. Alam, and J. Aslam, “Investigation of the Corrosion Behavior of
poly(Aniline-co-o-Anisidine)/ZnO Nanocomposite Coating on Low-Carbon
Steel”, Journal of Materials Engineering and Performance, 25 (2016) 3017.
[3] M. Mobin, J. Aslam and R. Alam, “Corrosion Protection of poly(aniline-co-N-
ethylaniline)/ZnO Nanocomposite Coating on Mild Steel”, Arabian Journal for
Science and Engineering, 42 (2017) 209.
[4] R. Alam, M. Mobin and J. Aslam, “Polypyrrole/graphene nanosheets/rare
earth ions/dodecyl benzene sulfonic acid nanocomposite as a highly effective
anticorrosive coating”, Surface & Coatings Technology, 307 (2016) 382.
[5] M. Mobin, J. Aslam and R. Alam, “Anti-corrosive properties of poly(aniline-
co-2, 3-xylidine)/ZnO nanocomposite coating on low-carbon steel”, Journal of
Adhesion Science and Technology, 31 (2017) 749.

ABSTRACT
1
Ever since the discovery of the metal, corrosion has not only impacted the
daily-life of the people but also hindered their technical progress. It involves issues
pertaining to public safety, huge economic and environmental impact and
conservation of materials. The effects of corrosion in our daily lives are both direct, in
that corrosion affects the useful service lives of our possessions, and indirect, in that
producers and suppliers of goods and services experiences corrosion costs, which they
pass on to consumers. Various techniques have been used to overcome the effect of
corrosion, among which coating of the active metal surface by conducting polymers is
most widely researched method in the recent past. However conducting polymers
have some limitations, e.g., solubility and fusibility leading to their processing
difficulty, stability at elevated temperatures, poor adhesion to metal surface, limited
availability of conjugated π-electrons containing monomers. One possible way to
overcome limited availability of conjugated π-electrons, is to synthesize one polymer
at the top of another polymer i.e. application of bilayered coatings as corrosion
protective coatings. The addition of monomers with hydrophobic groups could lower
the water up taking rate or another group may enhance the stability and adherence.
Synthesis of conducting co- or terpolymer changes the physical and chemical
properties of the resultant polymer. It increases the solubility of the polymer, adhesion
strength, durability, protection ability etc. Synthesis of various conducting
copolymers, terpolymers and their nanocomposites in which a combination of
monomers along with organic or inorganic constituents with specific properties have
been used to overcome the limitations stated above.
The present thesis entitled “Studies on some novel anticorrosion conducting
polymeric materials” has been categorized into seven chapters. The first chapter
includes general introduction and a critical review of literature on the subject. Second
chapter deals with material and methods to synthesize conducting polymers along
with their nanocomposites, their characterization and investigation of their
anticorrosive properties. Third, fourth and fifth chapter deals with the results and
discussion of anticorrosive properties of copolymers of aniline with o-anisidine
(chapter 3), N-ethylaniline (chapter 4) and 2, 3-xylidine (chapter 5) along with their
nanocomposites with ZnO nanoparticles. Sixth chapter comprises of the results and
discussion on terpolymer of aniline, 2-pyridylamine and 2, 3-xylidine along with the
corresponding terpolymer nanocomposite with ZnO nanoparticles. Homopolymer
nanocomposite of each monomers have also been studied. Seventh chapter includes

ABSTRACT
2
results and discussion about the anticorrosion properties of nanocomposites of
polypyrrole, graphene nanosheets, rare earth ions along with
dodecylbenzenesulphonic acid on mild steel.
Chapter 1: General Introduction
General introduction covers the fundamentals of corrosion and includes
the definition of corrosion, cost of corrosion, laboratory techniques to analyze
corrosion, types of corrosion and methods of corrosion control. It also consist of
basics of conducting polymers and detailed literature survey on their application as
corrosion protective coatings.
The thesis includes literature survey from the selected research papers,
reviews and reports published on the subject during the last three decades. Special
importance has been laid to the work which are directly or indirectly related to the
work presented in this thesis. It might be possible that some results of important
studies have been left unquoted quite unintentionally yet there was absolutely no
intension to underestimate those works.
Chapter 2: Materials and Methods
This chapter includes the experimental details related to the materials
and methods used during the experimental work. The chapter contains the details
about the procedure of synthesis of conducting polymers, their characterization
[FTIR, XRD, SEM and TEM] and deposition on mild steel substrate. The conducting
polymers synthesized and deposited on steel include: homopolymers PANi, poly(2, 3-
xylidine); homopolymers nanocomposites PANi/ZnO, poly(2, 3-xylidine)/ZnO,
poly(2-pyridylamine)/ZnO; copolymers [poly (aniline-co-o-anisidine), poly (aniline-
co-N-ethylaniline), poly(aniline-co-2, 3-xylidine)] and their nanocomposites [poly
(aniline-co-o-anisidine)/ZnO, poly (aniline-co-N-ethylaniline)/ZnO, poly(aniline-co-2,
3-xylidine)/ZnO]; terpolymer [poly(aniline-co-2-pyridylamine-co-2, 3-xylidine)] and
its nanocomposite [poly(aniline-co-2-pyridylamine-co-2, 3-xylidine)/ZnO] and
nanocomposites of pyrrole, graphene nano sheets dodecyl benzene sulfonic acid and
rare earth ions [(PPy/DBSA), (PPy/GNS/DBSA), (PPy/GNS/RE3+/DBSA)]. The
details of the corrosion tests [Immersion test, Free corrosion potential measurement,
Potentiodynamic polarization measurement and EIS analysis] in the corrosive
medium has also been explained in the later part of this chapter.

ABSTRACT
3
Chapter 3: Anticorrosion behavior of poly(aniline-co-o-anisidine)/ZnO
nanocomposite coating on mild steel
This chapter describes the results of the investigations concerning with
corrosion performance of chemically synthesized copolymer poly(aniline-co-o-
anisidine) and its nanocomposite poly(aniline-co-o-anisidine)/ZnO coating on mild
steel. The resultant copolymer and its nanocomposite were characterized by FTIR,
XRD, SEM and TEM. The results of immersion test shows the excellent corrosion
protection of copolymer nanocomposite as compared to copolymer in all corrosive
medium under investigation. Noble shift in corrosion potential shown by OCP
measurements indicates higher protection ability for copolymer nanocomposite than
pure copolymer. The corrosion kinetics parameters obtained from Tafel extrapolation
supports the result obtained from immersion tests and OCP analysis in all corrosive
medium under investigation. SEM images after 30 days immersion indicates the
superiority of copolymer nanocomposite over copolymer as anticorrosive coating on
mild steel substrate.
Journal of Materials Engineering and Performance, 25 (2016) 3017
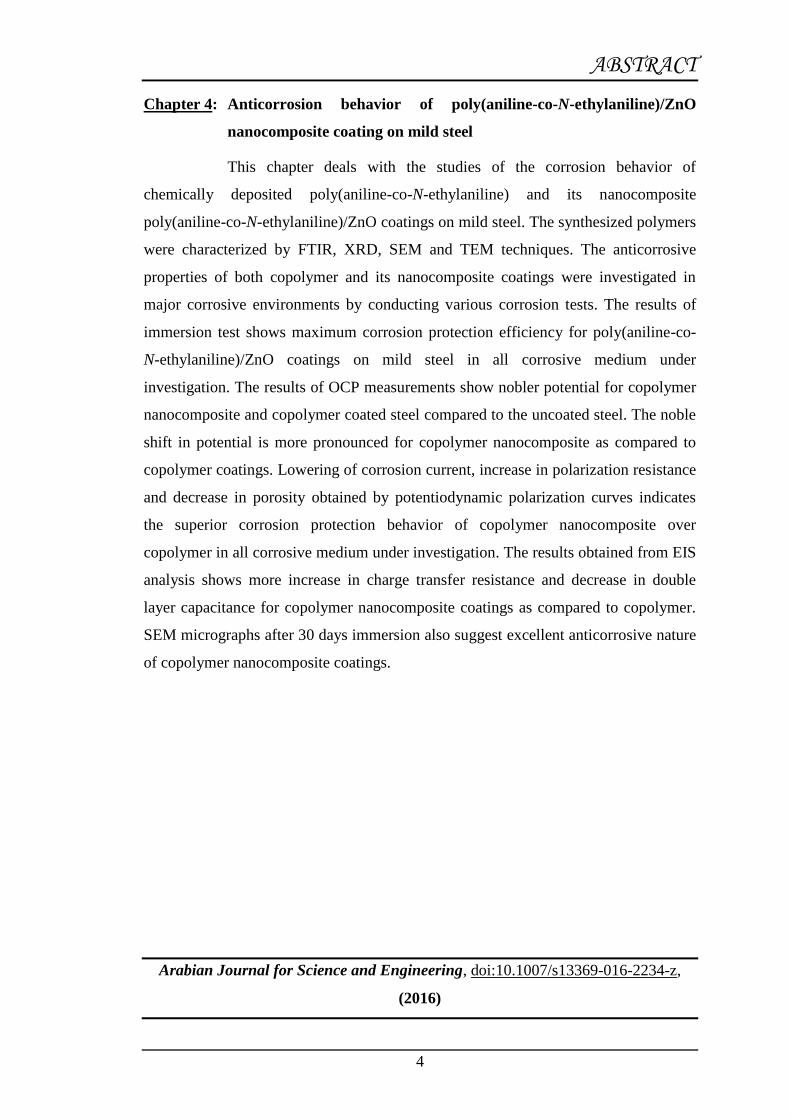
ABSTRACT
4
Chapter 4: Anticorrosion behavior of poly(aniline-co-N-ethylaniline)/ZnO
nanocomposite coating on mild steel
This chapter deals with the studies of the corrosion behavior of
chemically deposited poly(aniline-co-N-ethylaniline) and its nanocomposite
poly(aniline-co-N-ethylaniline)/ZnO coatings on mild steel. The synthesized polymers
were characterized by FTIR, XRD, SEM and TEM techniques. The anticorrosive
properties of both copolymer and its nanocomposite coatings were investigated in
major corrosive environments by conducting various corrosion tests. The results of
immersion test shows maximum corrosion protection efficiency for poly(aniline-co-
N-ethylaniline)/ZnO coatings on mild steel in all corrosive medium under
investigation. The results of OCP measurements show nobler potential for copolymer
nanocomposite and copolymer coated steel compared to the uncoated steel. The noble
shift in potential is more pronounced for copolymer nanocomposite as compared to
copolymer coatings. Lowering of corrosion current, increase in polarization resistance
and decrease in porosity obtained by potentiodynamic polarization curves indicates
the superior corrosion protection behavior of copolymer nanocomposite over
copolymer in all corrosive medium under investigation. The results obtained from EIS
analysis shows more increase in charge transfer resistance and decrease in double
layer capacitance for copolymer nanocomposite coatings as compared to copolymer.
SEM micrographs after 30 days immersion also suggest excellent anticorrosive nature
of copolymer nanocomposite coatings.
Arabian Journal for Science and Engineering, doi:10.1007/s13369-016-2234-z,
(2016)
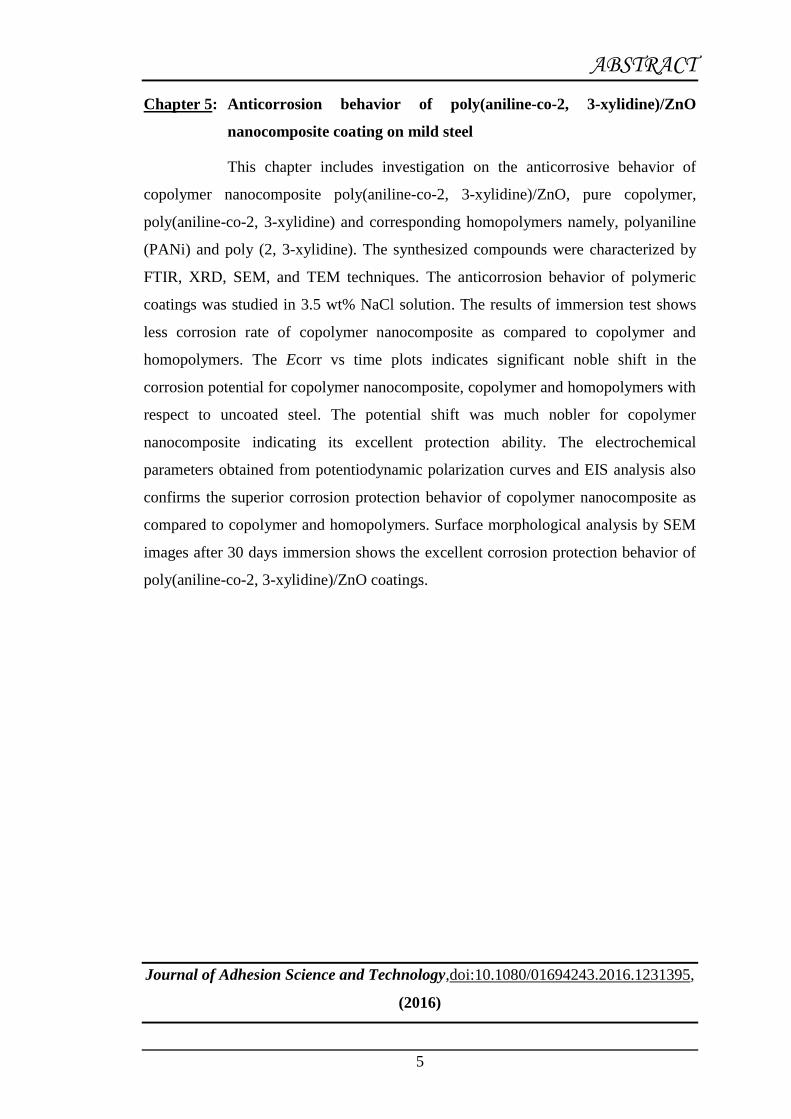
ABSTRACT
5
Chapter 5: Anticorrosion behavior of poly(aniline-co-2, 3-xylidine)/ZnO
nanocomposite coating on mild steel
This chapter includes investigation on the anticorrosive behavior of
copolymer nanocomposite poly(aniline-co-2, 3-xylidine)/ZnO, pure copolymer,
poly(aniline-co-2, 3-xylidine) and corresponding homopolymers namely, polyaniline
(PANi) and poly (2, 3-xylidine). The synthesized compounds were characterized by
FTIR, XRD, SEM, and TEM techniques. The anticorrosion behavior of polymeric
coatings was studied in 3.5 wt% NaCl solution. The results of immersion test shows
less corrosion rate of copolymer nanocomposite as compared to copolymer and
homopolymers. The Ecorr vs time plots indicates significant noble shift in the
corrosion potential for copolymer nanocomposite, copolymer and homopolymers with
respect to uncoated steel. The potential shift was much nobler for copolymer
nanocomposite indicating its excellent protection ability. The electrochemical
parameters obtained from potentiodynamic polarization curves and EIS analysis also
confirms the superior corrosion protection behavior of copolymer nanocomposite as
compared to copolymer and homopolymers. Surface morphological analysis by SEM
images after 30 days immersion shows the excellent corrosion protection behavior of
poly(aniline-co-2, 3-xylidine)/ZnO coatings.
Journal of Adhesion Science and Technology,doi:10.1080/01694243.2016.1231395,
(2016)
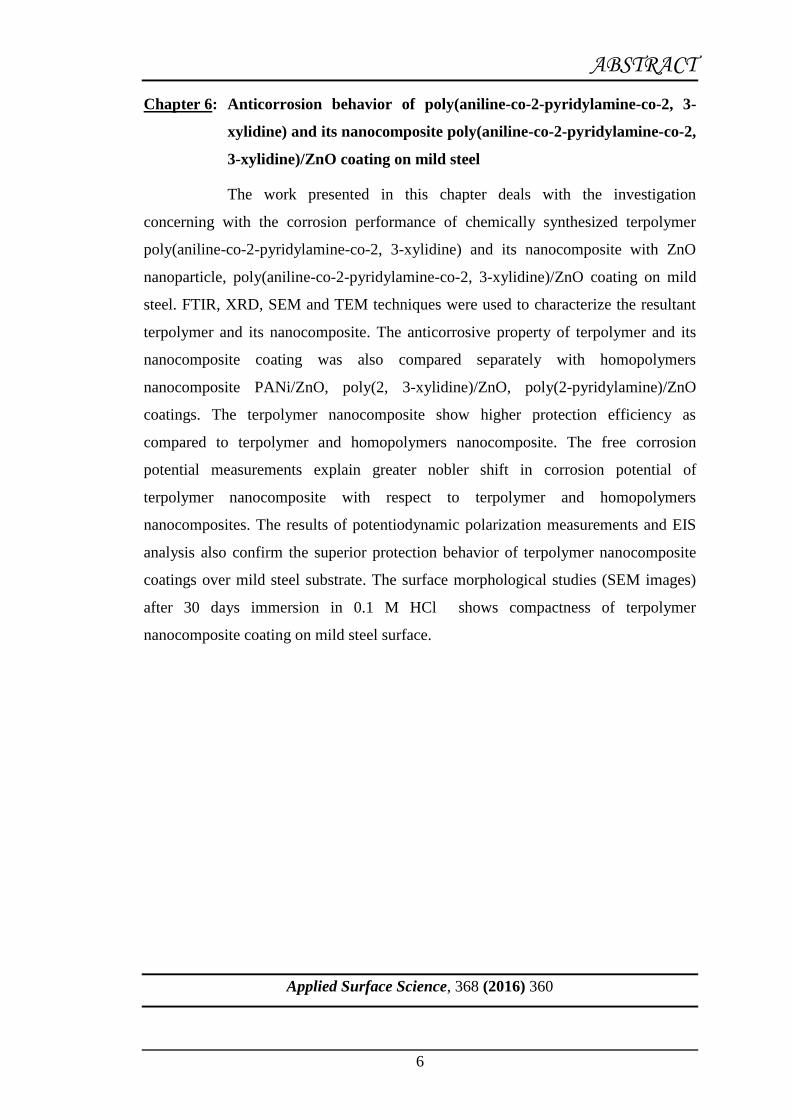
ABSTRACT
6
Chapter 6: Anticorrosion behavior of poly(aniline-co-2-pyridylamine-co-2, 3-
xylidine) and its nanocomposite poly(aniline-co-2-pyridylamine-co-2,
3-xylidine)/ZnO coating on mild steel
The work presented in this chapter deals with the investigation
concerning with the corrosion performance of chemically synthesized terpolymer
poly(aniline-co-2-pyridylamine-co-2, 3-xylidine) and its nanocomposite with ZnO
nanoparticle, poly(aniline-co-2-pyridylamine-co-2, 3-xylidine)/ZnO coating on mild
steel. FTIR, XRD, SEM and TEM techniques were used to characterize the resultant
terpolymer and its nanocomposite. The anticorrosive property of terpolymer and its
nanocomposite coating was also compared separately with homopolymers
nanocomposite PANi/ZnO, poly(2, 3-xylidine)/ZnO, poly(2-pyridylamine)/ZnO
coatings. The terpolymer nanocomposite show higher protection efficiency as
compared to terpolymer and homopolymers nanocomposite. The free corrosion
potential measurements explain greater nobler shift in corrosion potential of
terpolymer nanocomposite with respect to terpolymer and homopolymers
nanocomposites. The results of potentiodynamic polarization measurements and EIS
analysis also confirm the superior protection behavior of terpolymer nanocomposite
coatings over mild steel substrate. The surface morphological studies (SEM images)
after 30 days immersion in 0.1 M HCl shows compactness of terpolymer
nanocomposite coating on mild steel surface.
Applied Surface Science, 368 (2016) 360
ABSTRACT
7
Chapter 7: Anticorrosion behaviour of polypyrrole/graphene nanosheets/rare
earth ions/dodecyl benzene sulfonic acid nanocomposite coating on
mild steel
This chapter deals with the corrosion studies of synthesized organic-
inorganic nanocomposites (PPy/GNS/RE3+/DBSA) involving pyrrole (Py), graphene
nano sheets (GNS), rare earth elements (RE3+= La3+, Sm3+, Nd3+) and dodecyl
benzene sulfonic acid (DBSA). The resultant nanocomposites were characterized by
FTIR, XRD, SEM and TEM. The anticorrosive nature of polymer coatings were
studied in 0.1M HCl solution by subjecting them to various corrosion tests. The
results of immersion test shows superior anticorrosion behavior of rare earth
nanocomposites coatings as compared to PPy/GNS/DBSA and PPY/DBSA. The
Ecorr vs time plots show a significant noble shift in the corrosion potential of rare
earth nanocomposites, PPy/GNS/DBSA and PPy/DBSA with respect to uncoated
steel. The results of potentiodynamic polarization and EIS analysis explains the
superior corrosion protection behavior rare earth nanocomposites coatings on mild
steel. The SEM images obtained after 30 days immersion in 0.1 M HCl confirms that
the addition of rare earth ions diminishes the corrosion on the mild steel surface.
Surface & Coatings Technology, 307 (2016) 382
Related Documents