Welcome message from author
This document is posted to help you gain knowledge. Please leave a comment to let me know what you think about it! Share it to your friends and learn new things together.
Transcript
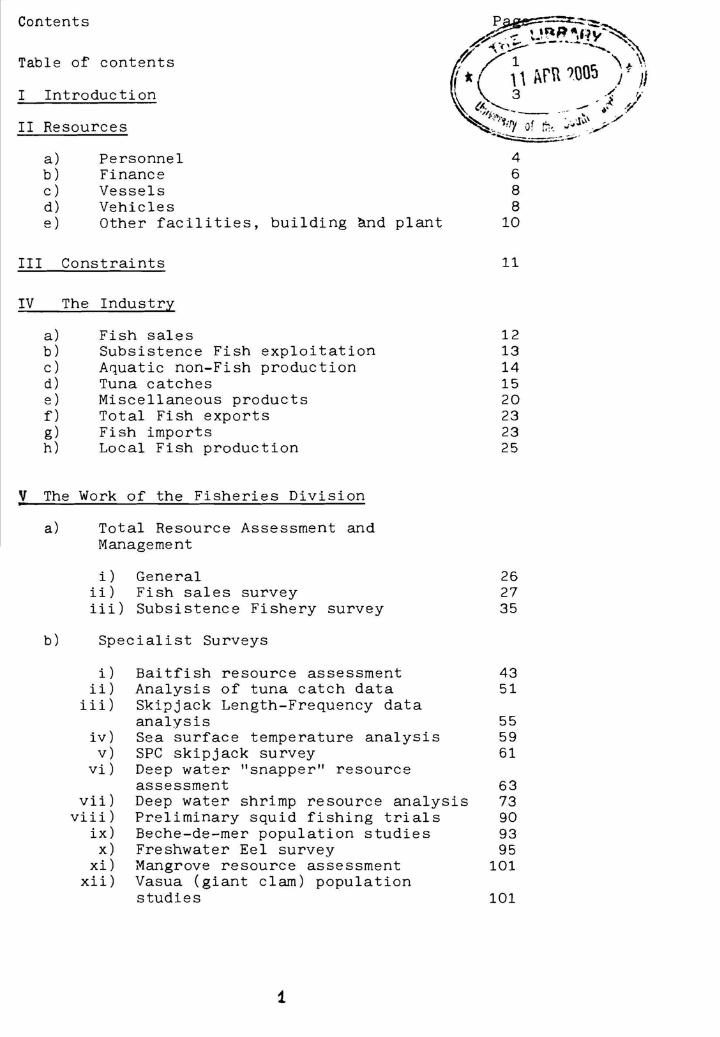
Contents
Table of contents
I Introduction
II Resources
a) Personnel 4 b) Finance 6 c) Vessels 8 d) Vehicles 8 e) Other facilities, building ~nd plant 10
III Constraints 11
IV
a) b) c) d) e) f) g) h)
The Industry
Fish sales Subsistence Fish exploitation Aquatic non-Fish production Tuna catches Miscellaneous products Total Fish exports Fish imports Local Fish production
V The Work of the Fisheries Division
a) Total Resource Assessment and Management
i) General ii) Fish sales survey iii) Subsistence Fishery survey
b) Specialist Surveys
i) ii)
iii)
iv) v)
vi)
vii) viii)
ix) x)
xi) xii)
Baitfish resource assessment Analysis of tuna catch data Skipjack Length-Frequency data analysis Sea surface temperature analysis SPC skipjack survey Deep water "snapper" resource assessment Deep water shrimp resource analysis Preliminary squid fishing trials Beche-de-mer population studies Freshwater Eel survey Mangrove resource assessment Vasua (giant clam) population studies
1
12 13 14 15 20 23 23 25
26 27 35
43 51
55 59 61
63 73 90 93 95
101
101

c) Aquaculture
i) ii)
iii) iv) v)
Naduruloulou Fish breeding station Raviravi Fish Farm Oyster/Mussel culture project Macrobrachium rosenbergii culture Aquaculture extension
d) Extension services
i) ii)
iii) iv) v)
vi) vii)
viii) ix)
Fish Processing unit Rural fishing operations Rural Fishing groups Commercial gear sales Boat building Refrigeration and ice production Loans Technical advice and training Library and information service
e) Regulatory activities
i) ii)
Licensing and law enforcement Law of the sea/Exclusive
Economic Zone
103 105 105 106 106
108 109 110 112 112 113 113 114 115
116
116

I. Introduction
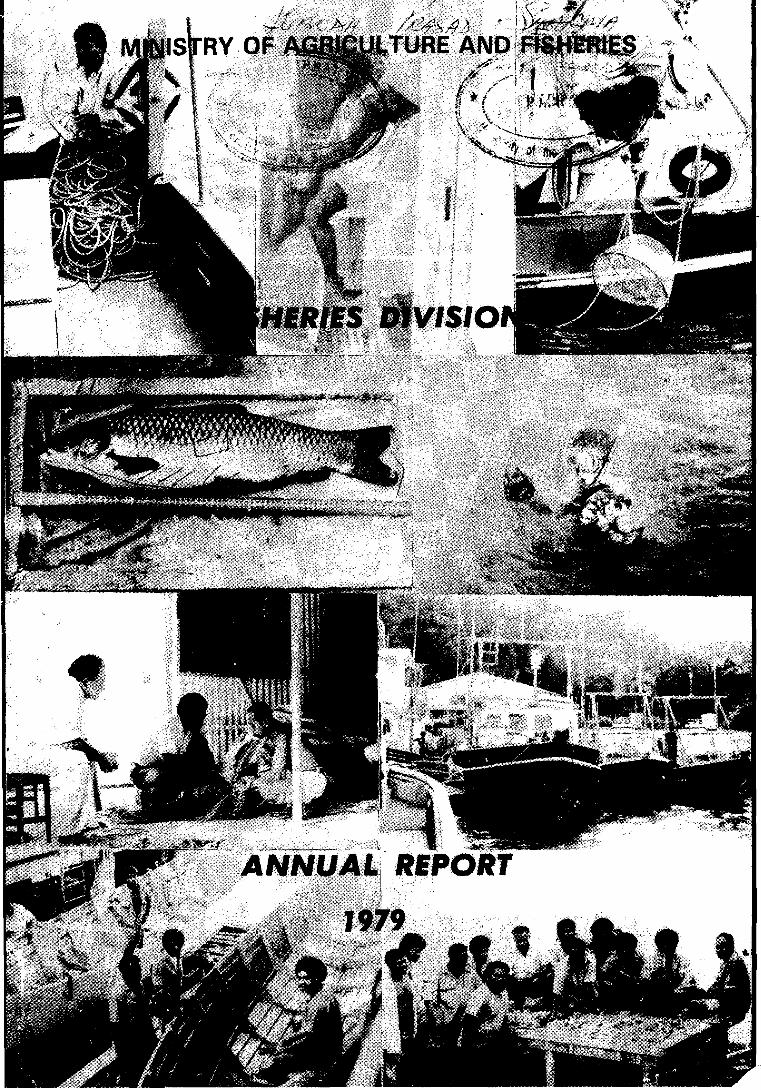
This report summarises the activities undertaken by the Fisheries Division of the Ministry of Agriculture and Fisheries during 1979. It is hoped that the facts provided will enable the reader to appreciate the current status of the Fisheries in Fiji. The projects undertaken by the Division have necessarily been wide in scope, in keeping with the diverse nature of the country's Fisheries, which range from the subsistence collection by hand of marine invertebrates, to the high technology capture of tuna on an industrial scale.
The Divisions work falls into two major categories, extension, and resource assessment and development. Extension activities involve the introduction of existing knowledge and technology into areas where it is needed or of use, and mainly results in improved performance by the rural sector. Resource assessment and development activities are not academic but applied in nature and involve the identification and location of new resources, new technologies and processes to exploit them,and improvement of currently used methods. Both areas of activity have contributed greatly to the Divisions major objective of increasing fish production in Fiji.
Additional work performed by the Division includes the continual collection and monitoring of information concerning fisheries, and the extensive support of its own, and other, facilities (vessels, plant, etc) which are of direct service to the fishing community. Law enforcement activities attempt to safeguard the future of fisheries susceptible to overexploitation. Subsidies to sales of vessels and gear encourage existing fishermen to extend their operations, and new ones to enter the industry. Higher production is allowed by the Divisions marketing services and liaison with commercial companies.
Fishing is now Fiji's third largest foreign exchange earner, and the industry is poised for considerable further expansion. In addition to excellent resources of tuna, rural and subsistence production can be greatly increased, resulting in greater supplies of fish for local consumption and for export. Of particular importance is the ease of access to fishery resources by rural communities, many of whom already depend for much of their incomeJand many more for their daily protein requirements, on fishing.
Fisheries development in Fiji is of direct benefit to a large majority of the population, and constitutes the work of the Fisheries Division.
11. RESOlJRCi:.:S
a) Personnel
i) Perm~nent established staff.
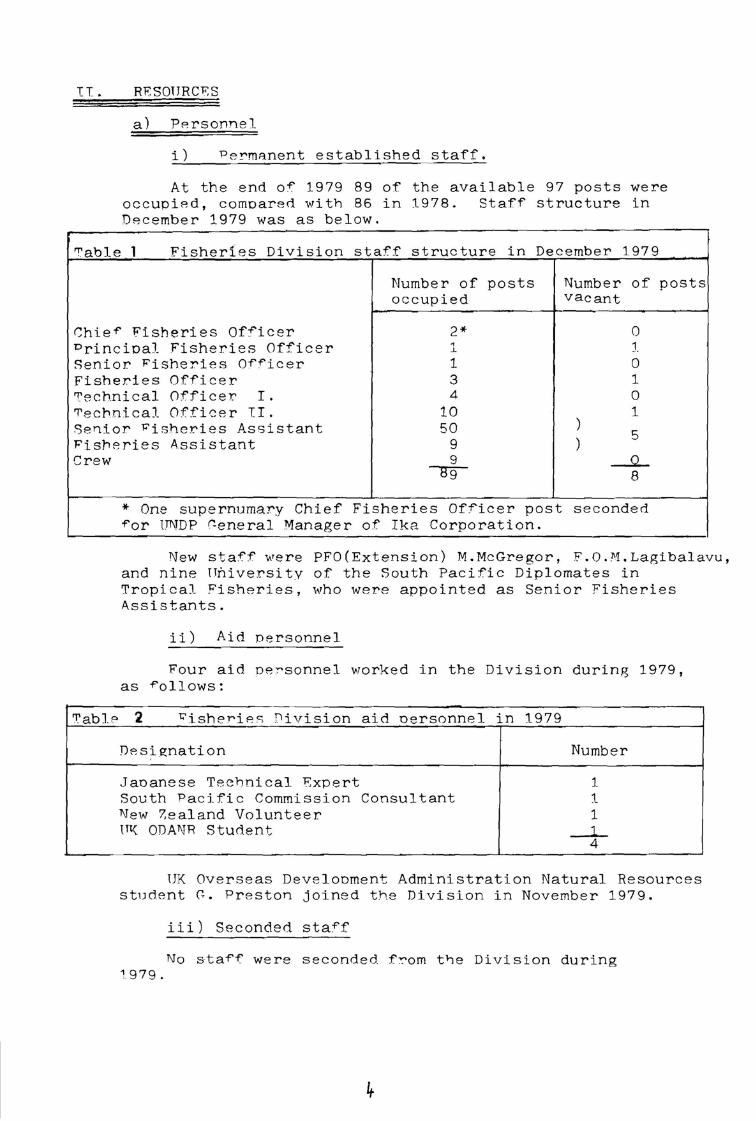
At the end o:f' 1979 89 of the available 97 posts were occupied, compared with 86 in 1978. Staff structure in December 1979 was as below.
,,.,a'ole 1 Fisheries Division staf:f structure in December 1979
Number of posts Number of posts occupied vacant
l'::hief' Fisheries Officer 2* 0 Principal Fisheries Officer " J. J.
Senior Fisheries O:ff'icer l 0 Fisheries Officer 3 1 'l'ech.nical Officer I. 4 0 "l'echnical Officer TI. 10 1
) Senior H"isheries Assistant 50 5 Fisheries Assistant 9 ) Crew
'l'abJ.e
9 ___Q_ --gg 8
* One supe rnuma:ry Chief Fisheries Off'icer post seconded f'or UNDP r-eneral Manager of Ika Corporation.
New sta:f':f were PFO(Extension) M.McGregor, F.0.111.Lagibalavu, and nine T~iversity of the South Pacific Diplomates in Tropical Fisheries, who were appointed as Senior Fisheries Assistants .
ii) Aid personnel
Four aid oe;--sonnel worked in the Division during 1979, as f'ollows:
2 t:'isheries f'livision aid oersonne1 in 1979
Designation Number
Jaoanese Technical Expert l South Pacific Commission Consultant 1 1\Tew 7.ealand Volunteer 1 ll"t( ODA11JR Student _L
4
UK Overseas Develooment Administration Natural Resources student G. Preston joined the Division in November 1979.
iii) Seconded staf'f
No staff were seconded f~om t~e Division during 1979.
'l"a))J_/1!: 3 List o~ P~rmanent Sta~~ and Airt Personnel at December 1.979
'lamP. o' () f"f"icer/ nf"A l crnatton:
, Jlr . o . ~. 4unt
0.,.1ncioal ~is"'""1;"'1es n,,.,.t~Pr
1 "' , l,1,.h11.to~1 ch
' · <: 'f'u t iaucaia
~ ~- 'f'u t cavu1111.t1
4. '1 . t.,aq:1 b ala· 1 11
"'Pchni ~al Qf<f'icer r
, • It. . " ua'll'a,:-a
2. c.~·,•nin2
'1 1111 . n.uosanibola
:i J . ~ . 'T'u 1tai
~- If , Vasu
4 • .J . Wortli(
~. $ . N'artd
6 . W. Cox
7. 'I . "larell 8 . S .M. Sinah
9. , , Mate
10 . "' . Vuakanisakea
Senior Fisheries .A.Hlatanta
1, t. su•u 2, J,Kavoa 3. L,Daivalu 4, S,Na1aua 5 . S , Chand e . K. llwu,y
Date "i.opc)in t ed
, ~ . 9 . 1977
,, • ? . 1977
1. 7 . 1974
26. 2. 1976
C, . 7 . 197,;
, . "l, ,960
, . 7 . ? 966
::10. 8 . 197 ~
25. \. 6B
21 .' . 1970
19.4 . 1972
,,.2. 191 1
22 . 2. 1971
~3 . P.1976
28 . 3.1978
1. 12. 1966
1.8 . 1970
1.9 .72
5.8.1968 2,1.1976 2 .1. 1976
2 . 1. !976 2.1. 1976 5.1.1976·
7. ti, Bill1n1s 21. 1, 1976 I, llr•• 8 . J(aumaitatoya 3 . 1.1977 t. 111H, T,Vereivalu 3,1.1977
Suva / Lam!
Lamt
Lami
Lahasa
Lami
Lam i
Lam\
Lau tok a
Lami
Lam1
Lam1
Lam1
Lami
Lami
Lami
Lami Lami
Naduru l oulou
Lautoka
Lami Savusavu Lautoka Lautoka Lautoka Lami
Savusavu Lami Naduruloulou
Duties Remarks
?oli c_v and administrative management
Operational management
Suoe r vision ot rf'! s earch act iviti e s . <transferred from ~aviravi fi s h farm on 1.2/1/7B)
O/inchar~e ~orthe rn Divisi on
•isheri e s O~fic e r (F .A)
Naduruloulou Breedin~ Station and Laucala Oyster culture projec t (on a 2 year course in ~ishery Sc i ~nc e in Indta under Co lombo olan)
~xtensi on s ~rvi c e 0 / inr. har~e ~e s~er~ Di visi on
Fll':"et F.ngi nee r
Captain
Captain
Captain
Bnaine ~r
F.n~ineer
Boat Builder (attended a 1 2 week UNDP boat building course in W. Samoa)
Refrigeration Mechanic Law En~orcement and Statistics
Fi s h Breeding Naduruloulou
captain o~ veesel
Exploratory ~ishin1 Food Processing Unit Market Survey Western
Food Proeeasina Units Extension services Laboratory , Bait~ieh and Man1rove project Tra1nin1 Information Measurement biolo1ical, physical, chefflical parameters and 1eneral station duties; attended 4 week•
10. Manasa Tumuri
11. Deo Chand 12, D.C.Harak 13. S.P . Sharma
14, Chain Singh i.5. R. Lakhan
16 . J . Lesavua 1 7 , J.Balawa.nilotu 1B . Karan Singh
3.1.1977
3.1.1977
3.1.1977 3.1. 1 977
3.1.1977 3.1.1977
3, 1. 1977 3 .1. 1977 3 . 1 . 1977
19, B. Tikomainiusiladi3 . ! . 1977
20. A. Sesewa
21. I.Vuki 22. 14.Tuiloa ,3. T. Namotu
, 4. H.K . Dayal 25 . s . Nai valu
26. T. Lakeba
~7. ,a. ?9. 30. 31. 3 2,
s. Kumar A.Turaganivalu r.. 11ath r. lfavuci J. Navakalomana 1'1.C .Nath
33. s . Waoainabete 34 . W. lltu .ic; . 'F. . Cox
36. L. Roko
37 . S. '1uku 38 . '4. t smai 1 39. 14. Vula,-4al u 40. J . " as uc a 41 . S. Li~al vl u 4 2 . J . r.olamatani-
s ! 11a 43 . K. Natubavivi 44 . T. Taumaipeau
45 . A. Hu s sein 46. L.Balenacagi 47. s. Vabaki 48. R. Tadulala 49, "I . I.Shah 50. J .Su1<1\u 51. M. Lal
9.1.19.?B
9. 1. 1. 978 9 .l. 19 78
9.1.1978
9 . 1. 1 978 9 . 1. ).978
9.1.1978
9.1.1978 16.2.79 16.2.1979 16. 2 .1979 16 .2. 79 16. 2. 79
16 , 2 . 79 16.2 . 79 1, 7. 79
1. 4 . 68
16.10.68 22.2.71 2<.2.71 15,3,71 1.7 . 71
1 . 7 , 71 1.7.71 !.9.72
1.9. 72 17,B,73 l. 2. 74 25.2.74 27,8 . 79 1.1.7~ 1.1.75
Fisheries Assistants
1. F, Viala 2. K. L.Natai 3. c;. Kava
A J. Baleiwai c E . Lesi ~- .T. Delai 7. A. Raratabu 8. A. Rawaaa 9, N. Nasibukui
~
~.. ~-. 7. ~-, .. 2.
~-
~. Ratini X. Toaisi
K. Rawalal
M. "'!auvoli ~- '-lakim • . flahiffl ~. D91no "' · Sivo
V,lfa&umoto (Jaoanese Aid) M.Gentle(SPC)
II . Tholfts(VSA)
15 . 3 . 1971 2.9 . 1973 20.12 . 1974
15.4.1976 15.4.1976 15.4.1976 15.4.1976 1.6,1976 8 . 6.1976
18 . 4 . l.975 24.4 . 1975
24.4.1975
7 .5. l.97!, 25.7.1977 25.7.1977 25.7.1977
1.4,1977 1.8.1978
course in water analyai. 4, at Koronivia Research
r;, Preaton 1"11" Aid)
8.11.1979
Station. ·
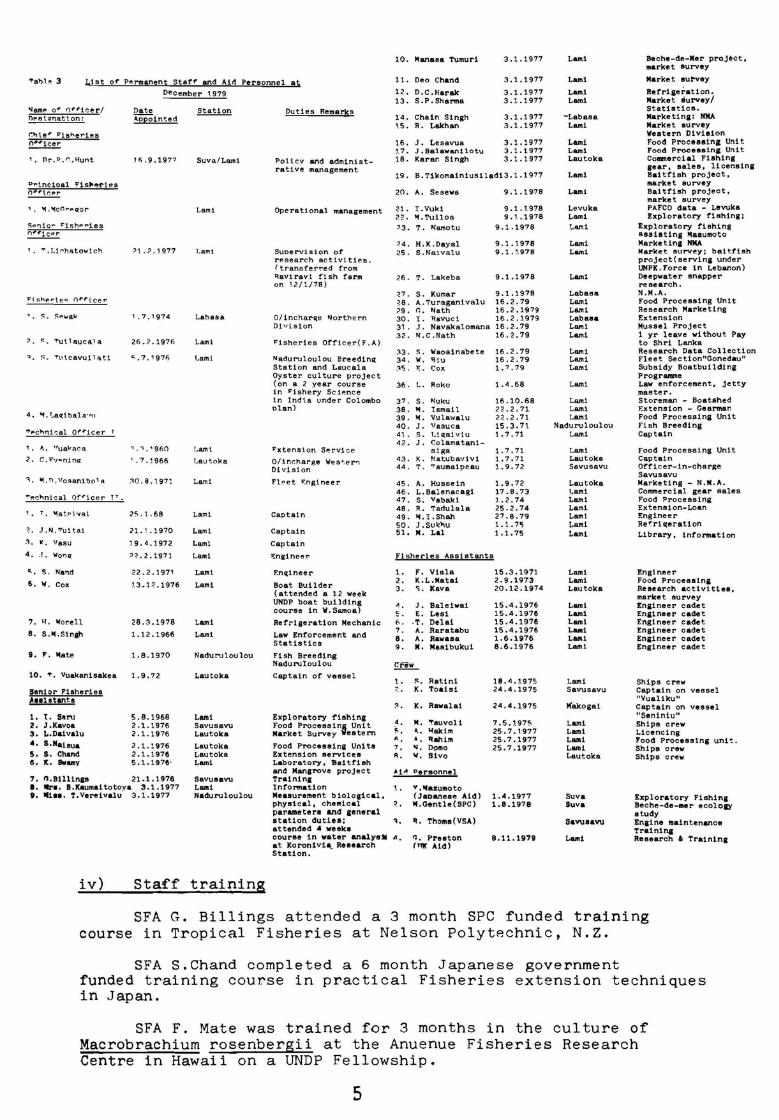
iv) Sta!'f training
Lami
Lami
Lami Lami
-Labasa Lami
Lami Lami Lautoka
Lami
Lami
Levuka Lami LMli
Lami Lami
Lami
Labal!I& Lami Lami Labaaa Lami Lami
Lami Lami Lami
Lami
Lam! Lami Lami
Naduruloulou Lami
Lami Lautoka Savusavu
Lautoka Lami Lami Lami Lami Lami !.ami
Lami Lami Lautoka
Lami Lami Lami LIUlli Lllllli Lami
Lami Savusavu
M'akogai
Lami Lami Lami Lami Lautoka
Suva Suva
Savusavu
Lu,1
Beche-de-Ner proJtct, market survey Market survey
Retriael'ation. Market survey/ Statistics. Narketin1: NNA Market survey Western Division Food P~ocesaina Unit Food Proc • eain& Uni t Co111nercial Fishina 1ear, ealee, licenein1 Bait~ish project, market survey Baitfi•h project, market survey PAFCO data - Levuka Exploratory ~i8hin1;
Exploratory fiehing assiatina Maeumoto MarkeUna NNA Market survey : baitfi s h proJect(eervin& under UNPK.Force in Lebanon) Deepwater snapper research. N. M.A. Food Processing Unit Research Marketing Extension Mu s sel Project 1 yr leave without Pay to Shri Lanka Research Data Collection Fleet Section"Gonedau " Subsidy Boatbuildi nl Programme Law en~orcement, Jetty master. Storeman - Boatshed F.xtension - Gearman Food Processina Unit Fl sh Breeding Captain
Food Processing Unit Captain o~~icer-in-charge Savusavu Marketing - N. N. A. Com,nercial gear l!lales f'ood Processing Extenl!lion-Lo&n Engineer Re~riqeration
Library, infonnation
Engineer Food Processina Research activities, market survey Enaineer cadet Enaineer cadet Engineer cadet Engineer cadet Enaineer cadet Enaineer cadet
Ships crew Captain on vessel 11Vualiku 11
Captain on vessel "Seniniu" Ships crew Licencing Food Processin1 uni t . Ships crew Ships crew
Exploratory Fi•h1n1 Beche-de-• er ecoloo study Enaine ~•intenance Trainina; Research & Trainin1
course SFA in
G. Billings attended Tropical Fisheries at
a 3 month SPC funded Nelson Polytechnic,
training N.Z.
SFA S.Chand completed a 6 month Japanese government funded training course in practical Fisheries extension techniques in Japan.
trained for SFA F. Mate was Macrobrachium rosenbergii at the
3 months in the Anuenue Fisheries
Centre in Hawaii on a UNDP Fellowship.
5
culture of Research
SFA J. Navakalomana was financially supported by SPC to perform research on tridacnids (vasua) for 3 weeks at the Cairns Fisheries Research Centre in Australia.
SFA. B. Tikomainiusiladi completed a 2 month Training period in skipjack resource assessment on the South Pacific Commissions skipjack tagging vessel, and assisted in the applied aspects of the program for that period.
SFA. K. Natubavivi obtained his qualification as Master, Fiji Is. FA's E. Lesi, M. Masibukui and A. Rawasa became qualified as 3rd class engineers.
Crew member K. Toaisi qualified as Mate, Fiji Is.
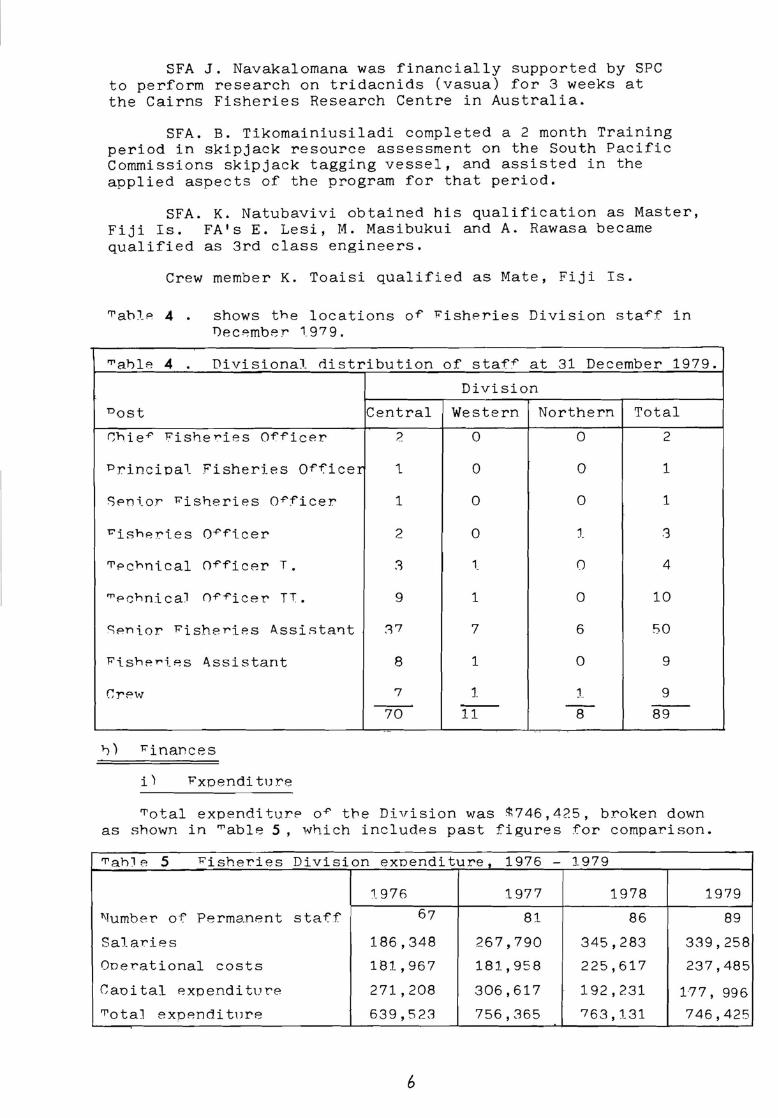
'T'ah).P 4 . shows the locations of' Fisheries Di vision staf'f in December 1-979.
.,.,ahle 4 . DivisionaJ. distribution of staff' at 31 December 1979.
Division
0 ost Central Western Northern Total
(;hi e-f' PisheT"ies Of'f'icer ~ 0 0 2
Principal. :Pisheri.es Of'-f:icer 1 0 0 1
Sf'n i. o:r H'isheries Qf'f'icer 1 0 0 1
l:'isheri.es 0-f'f'i.cer 2 0 l .'3
'T'pchni.cal Of'f'icer T • '.i 1 0 4
.,.,echni cal Of'-f'icer TT. 9 1 0 10
c:;pni.or Fisheries Assista'1t 17 7 6 so
Fi.sheT"i.es .\ssistant 8 1 0 9
CrPw 7 l l 9 -~ -- -- --70 11 8 89
. .
l-) ) H' in an c e s
i) Fxoendi tu re
'T'otal expenditure o-f' the Division was i746,425, broken down as shown in .,.,able 5, ,.,.,hich includes past figures for comparison.
'T'ahl e 5 l<isheries Division exoenditure. 1976 - 1979
1.976 1977 1978 1979
T\Tumber of' Perma.nent sta-ff 67 81 86 89
Sa1al'.'ies 186,348 267,790 345,283 339,258
Ooerational costs 181,967 181,958 225,617 237,485
Caoi tal expenditure 271,208 306,617 192,231 1-77, 996 'T'ota] expenditure 639,523 756,365 763,131 746,425
6
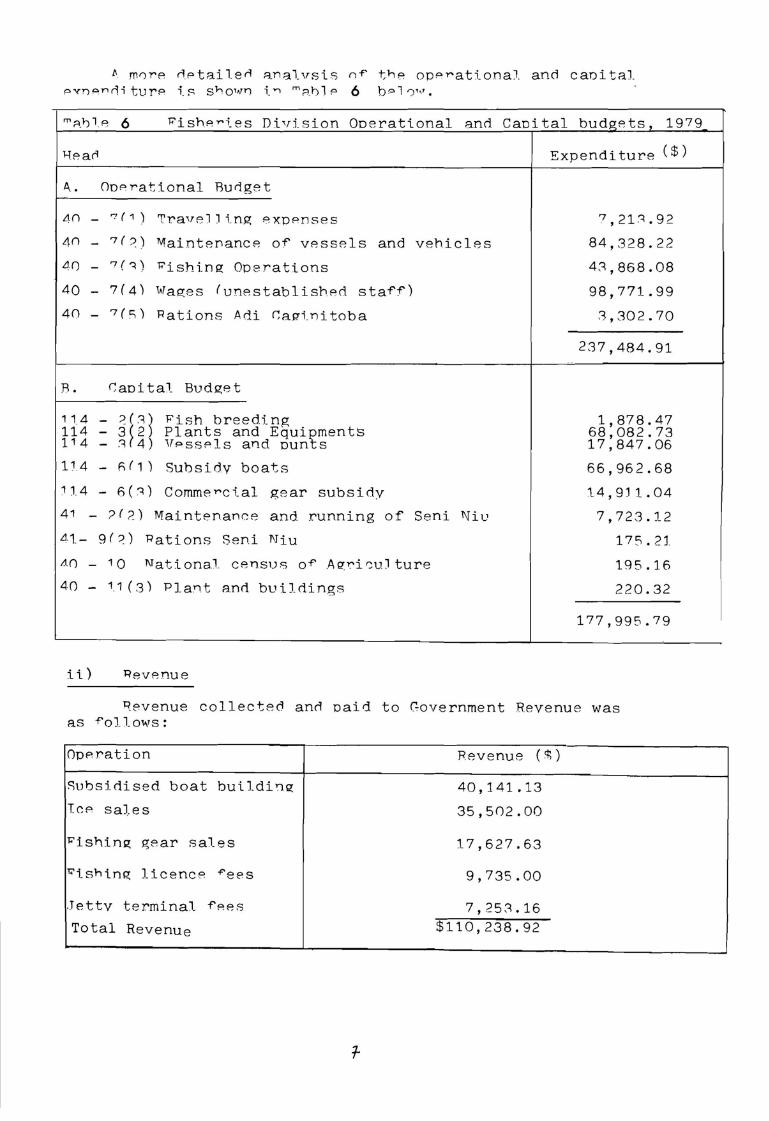
t-. rnr)rp nptai len A.ns3.lvsi.s nf' t;l-ip opPrattonal and cani taJ. PVDPY10i turP i.s S~OWY) ;_ ... m;:,_l')lP 6 bPl ')W.
"'ishP,,.i_es Divi.sion Ooerati.onal anrl Caoi tal budgets, 1979
A. OoPrational Burlget
4n -4n -Ll() -40 -40 -
'7 ( 1 )
'7 ( '.))
,., ( ~ )
7(4)
7(C:,)
'rravel 1 i_ng PXpPnses
¥aintenance or vessels and vehicles
"'ishing Operations
Wages (unestablished staf'r)
Rations Adi raginitoba
R. ~aoital Budget
114 - ?(~) Fish breedi_ng 114 - 3(2) Plants and Equipments 114 - .1 ( 4) VPssels and ounts
114 - 6f1) Subsidy boats
114 - 6(1) Comme,,.ci.al gear subsidy
41 - ?f2) Maintenance and running of Seni Niu
41- 9(?) Rations Seni Niu
A() - 10 National census of' Ag~i~uJture
40 - 11 (3) Plant and buildings
ii.) Revenue
Expenditure ( $)
7 ,21 -~.92
84,328.22
41,868.08
98,771.99
.1, 302. 70
237,484.91
1,878.47 68,082.73 17,847.06
66,962.68
14,9J1.04
7,723.12
175.2:l
195.16
220.32
177,995.79
~evenue collected anrl oaid to Government Revenue was as f'o1lows:
Operation Revenue ( ~ )
Subsidised boat bui.ldi'l.g 40,141.13
T.CP sales 35,502.00
l<'ish.in12: gPar sales 17,627.63
'!;'i_ sh i.ng licence -f'ees 9,735.00
.Jettv terminal_ f'Pes 7,251.16 Total Revenue $110,238.92
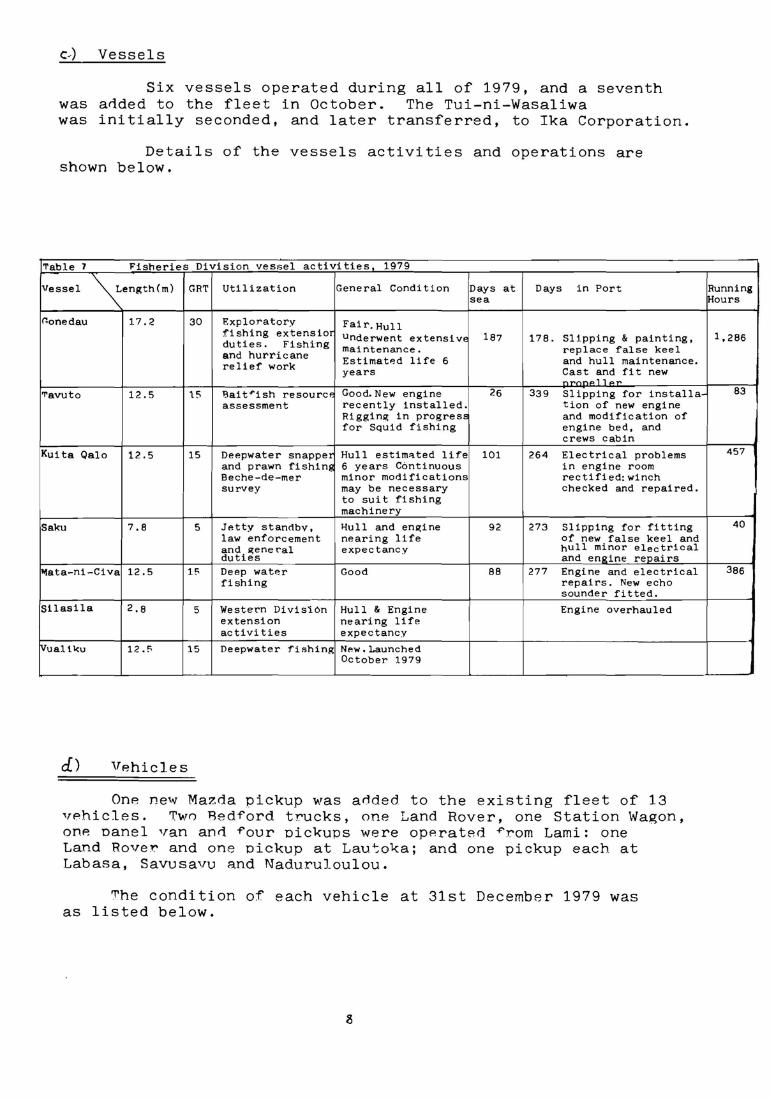
c-) Vessels
Six vessels operated during all of 1979, and a seventh was anded to the fleet in October. The Tui-ni-Wasaliwa was initially seconded, and later transferred, to Ika Corporation.
Details of the vessels activities and operations are shown below.
'!'able 7 Fisheries Division vessel activities 1979
Vessel ~ength(m) GR'l' Utilization General Condition Days at Days in Port sea
l'!onedau 17.2 30 Exploratory Fair.Hull fishing extensio1 underwent extensivE 187 178. Slipping & painting, duties. Fishing maintenance. replace false keel and hurricane relief work EstimatP.d life 6 and hull maintenance.
years Cast and fit new n'"n.no11Pr
Tavuto 12.5 15 Bait~ish resourcf Good. New engine 26 339 Slipping for installa-assessment recently installed. tion of new engine
Riggin11; in progress and modification of for Squid fishing engine bed, and
crews cabin
Kui ta Qalo 12.5 15 Deepwater snappex Hull estim::i.ted life 101 264 Electrical problems and prawn fishin~ 6 years Continuous in engine room Beche-de-mer minor modifications rectified:winch survey may be necessary checked and repaired.
to suit fishing machinery
Saku 7.8 5 Jetty standby, ~ull and en11;ine 92 273 Slipping for fitting law enforcement nearing life of new false keel and and 11;eneral expectancy hull minor electrical duties and engine repairs
1-!ata-ni-Civa 12.5 15 Deep watP.r Good 88 277 Engine and electrical fishing repairs. New echo
sounder fitted.
Silasila 2,8 5 Western Division Hull & Engine Engine overhauled extension nearing life activities expectancy
IVualll<u 12.5 15 Deepwater fishing Nt,w, Launched October 1979
cl) VP,hicles
One new Mazda pickup was added to the existing fleet of 13 vehicles. Twn Bed¥ord trucks, one Land Rover, one Station Wagon, one oanel van ann ¥our oickups were operated ~rom Lami: one Land Rove:i:- and one oickup at Lau-:ol<a; and one pickup each at Labasa, Savusavu and Naduruloulou.
~he condition of each vehicle at 31st December 1979 was as listed below.
Running Hours
1,286
83
457
40
386
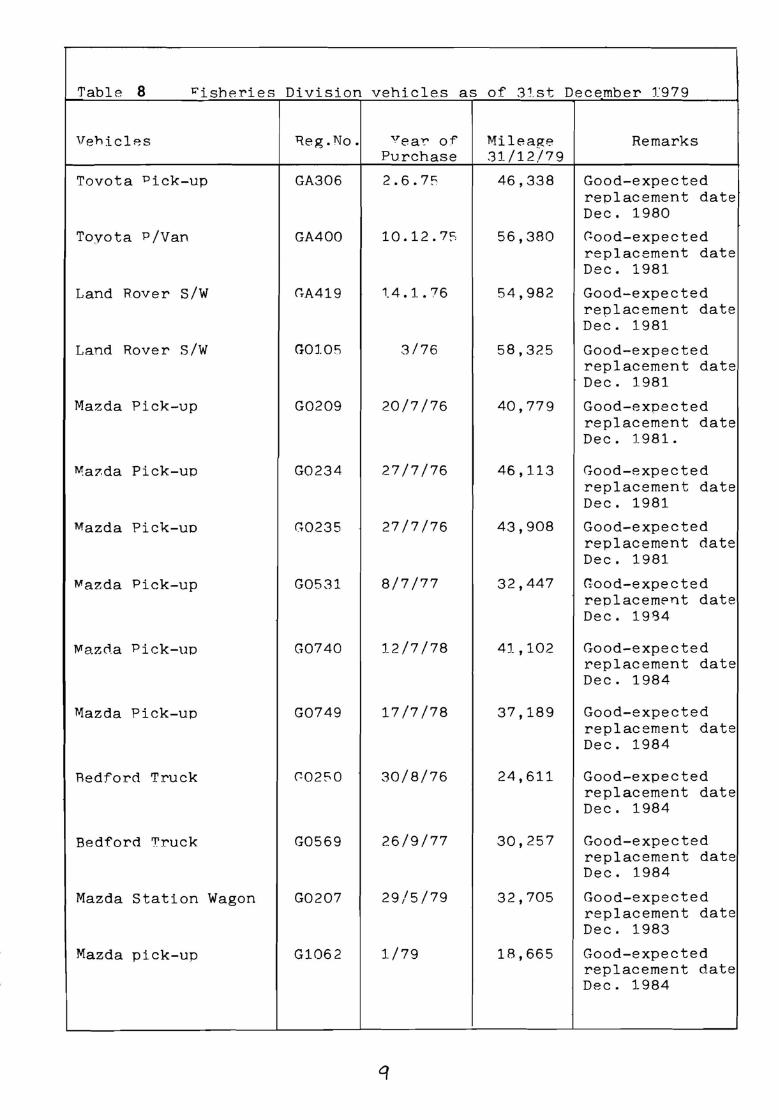
Table 8 l<'isheries Division vehicles as of 31.st December 1'979
Vehicl~s
Tovota Pick-up
Toyota P/Van
Land Rover S/W
Land Rover S/W
Mazda Pick-up
~a?.da Pick-up
Mazda Pick-up
Mazda Pick-up
Maz~a Pick-up
Mazda Pick-up
Redford Truck
Bedford Truck
Mazda Station Wagon
Mazda pick-up
Beg.No. vea~ of Purchase
GA306 2.6.7S
GA400 10.12.7S
GA419 1.4. l. 76
GO:J.05 .?, /76
G0209 20/7/76
G0234 27/7/76
G0235 27/7/76
G0531 8/7/77
G0740 12/7/78
G0749 17/7/78
Cc02SO 30/8/76
G0569 26/9/77
G0207 29/5/79
G1062 1/79
q
Milea~e Remarks 31/12/79
46,338 Good-expected replacement date Dec. 1980
56,380 Ccood-expected replacement date Dec. 1981
54,982 Good-expected replacement date Dec. 1981
58,325 Good-expected replacement date Dec. 1981
40,779 Good-expected replacement date Dec. 1981.
46,113 Good-expected replacement date Dec. 1981
43,908 Good-expected
32,447
41,102
37,189
24,611
30,257
32,705
18,665
replacement date Dec. 1981
Good-expected replacement date Dec. 1994
Good-expected replacement date Dec. 1984
Good-expected replacement date Dec. 1984
Good-expected replacement date Dec. 1984
Good-expected replacement date Dec. 1984
Good-expected replacement date Dec. 1983
Good-expected replacement date Dec. 1984
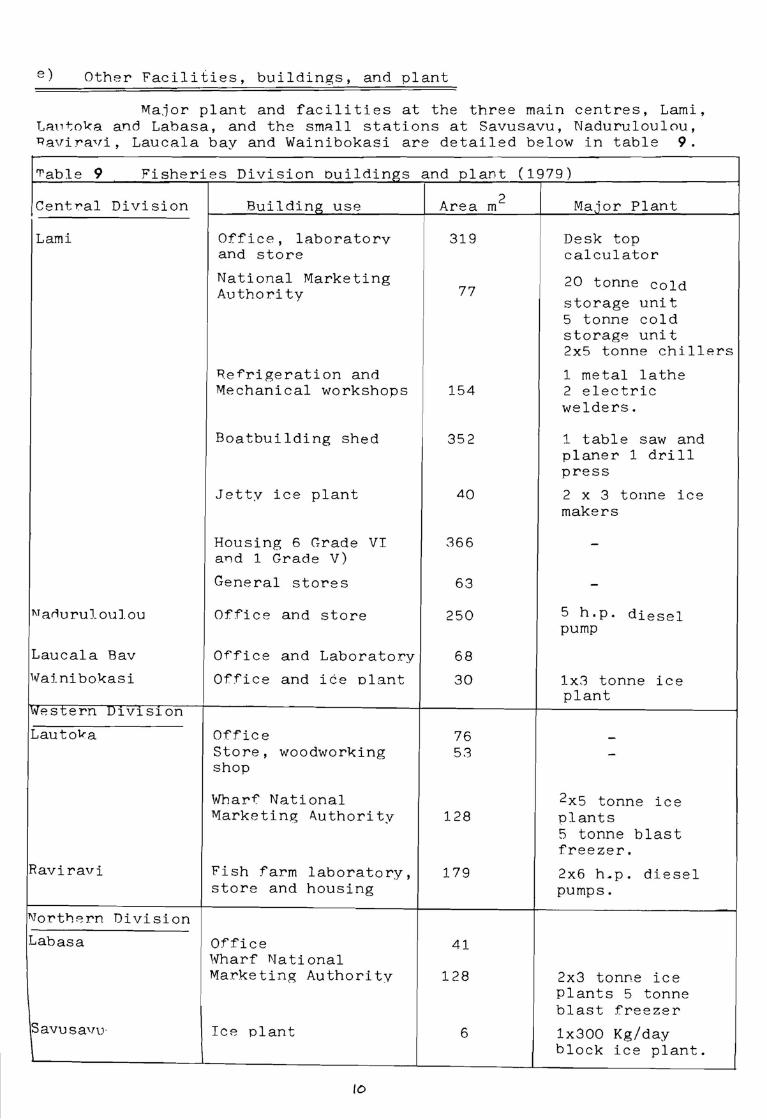
e) Other Facilities, buildings, and plant
Major plant and facilities at the three main centres, Lami, T...,a11t;ok:a and Labasa, and the small stations at Savusavu, Naduruloulou, 'Qavi:r-a,,i, Laucala bay and Wainibokasi are detailed below in table 9.
'l'able 9 Fisheries Division buildings and olant (1979)
Centl"al Division
Lami
1\Tan.u ru l ou 1 ou
Laucala Bav
Waj_nibokasi
1western D1v1s1on
Lautok:a
Raviravi
~orth.ern Divisj_on
Labasa
Building use
Office, laboratorv and store
National Marketing Authority
Re~rigeration and Mechanical workshops
Boatbuilding shed
Jett:v ice plant
Housing 6 Grade VI and 1 Grade V)
General stores
Office and store
Office and Laboratory
Office and ice olant
Office Store, woodworking shop
Wharf National Marketing Authority
Fish farm laboratory, store and housing
Office Wharf National Marketing Authority
Ice plant
10
Area m2
319
77
154
352
40
366
63
250
68
30
76 53
128
179
41
128
6
Major Plant
Desk top calculator
20 tonne cold storage unit 5 tonne cold storage unit 2x5 tonne chillers
1 metal lathe 2 electric welders.
1 table saw and planer 1 drill press
2 x 3 tonne ice makers
5 h.p. diesel pump
lx3 tonne ice plant
2x5 tonne ice plants 5 tonne blast freezer.
2x6 h.p. diesel pumps.
2x3 tonne ice Plants 5 tonne blast freezer
lx300 Kg/day block ice plant.

T1T. CONS~RAINTS
The orincipal objective of Fisheries Division is to increasA fish production in :Fiji. The constraints on this objecti've can be listed as follows:
a) The resource has not been defined, and its ability to withstand increased exoloitation is not clearly understood.
b) The lack of suitable boats and fishing gear at the village level
c) Inadequate servicing facilities for small motors, boats a~d fishing gear in rural areas.
d) Absence of suitable port facilities for fishing vessels
e) Absence of an effective distribution and marketing network
~) The shortage of experienced Extension Officers, and an absence of efficient; training P.rogrammes for commercial fishermen and Extension Officers
g) The lack of sufficient incentives and encouragement for more people to join the industry
h) The control of most inshore areas by mataqalis and the undisciplined allocation of perrniti discourages long term caoital investment by commercial fishermen.
i) The lack of knowledge of fish processing techniques and the available overseas markets for processed fish .
. i) The absence of training facilities for pole and line fishing, engineers and shore management staff for the Ika Corporation.
k) The capital restriction on rapid expansion of the Ika fleet to exploit known tuna resources.
11
IV. TBE INDUSTRY
Table
a. Fish sales
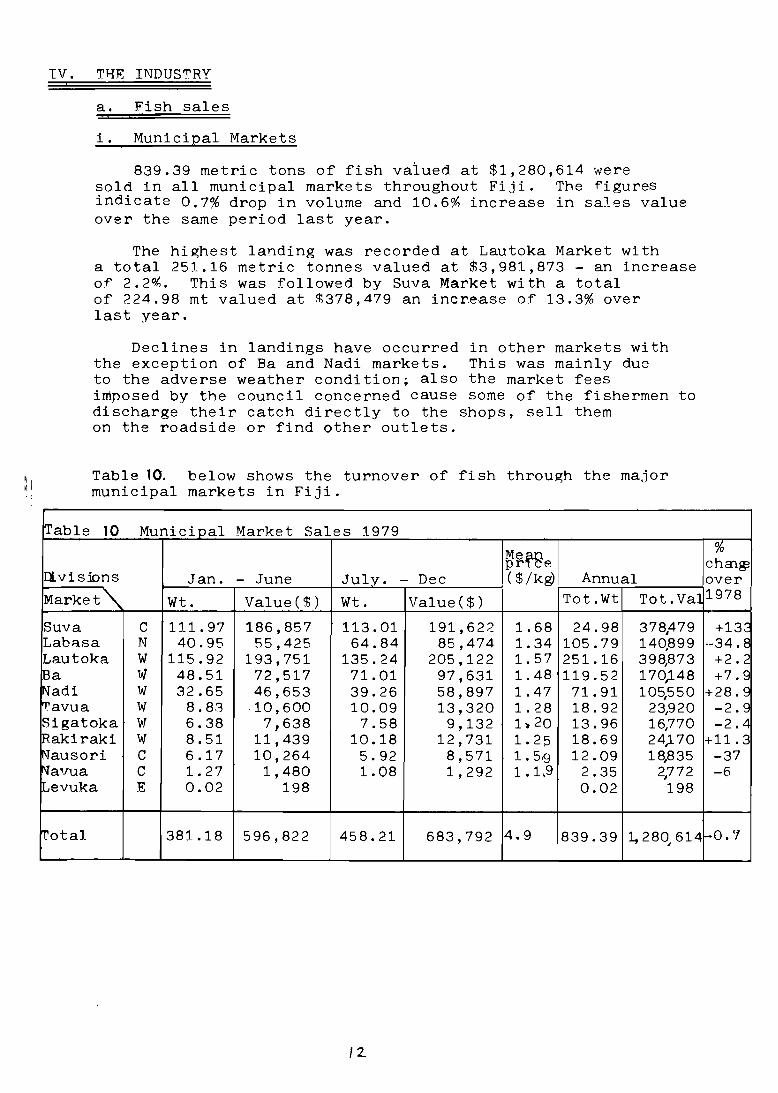
i. Municipal Markets
839.39 metric tons of fish valued at $1,280,614 were sold in all municipal markets throughout Fiji. The figures indicate 0.7% drop in volume and 10.6% increase in sa1es value over the same period last year.
The highest landing was recorded at Lautoka Market with a total 251.16 metric tonnes valued at $3,981,873 - an increase of 2.2~. This was followed by Suva Market with a total of 224.98 mt valued at i378,479 an increase of 13.3% over last year.
Declines in landings have occurred in other markets with the exception of Ba and Nadi markets. This was mainly due to the adverse weather condition; also the market fees imposed by the council concerned cause some of the fishermen to discharge their catch directly to the shops, sell them on the roadside or find other outlets.
Table 10. below shows the turnover of fish through the major municipal markets in Fiji.
10 Municipal Market Sales 1979
MefR pr e Il.vis:ions Jan. - June July. - Dec ($/kg) Annual
Market'\. Wt. Value($) Wt. Value($) Tot.Wt Tot. Val
Suva C 111. 97 186,857 113.01 191,622 1.68 24.98 378,479 Laba.Sa N 40.95 55,425 64.84 85,474 1.34 105.79 140,899 Lautoka w 115.92 193,751 135.24 205,122 1. 57 251.16 398,873 IBa vi 48.51 72,517 71.01 97,631 1. 48 119.52 170)48 IN'adi w 32.65 46,653 39.26 58,897 1.47 71.91 105,550 'i:'avua w 8.83 -10, 600 10.09 13,320 1. 28 18.92 23,920 Sigatoka w 6.38 7,638 7.58 9,132 1-a-20 13.96 16,770 R.akiraki w 8.51 11,439 10.18 12,731 1. 25 18.69 24,170 Nausori C 6.17 10,264 5.92 8,571 1. 5,g 12.09 18,835 Navua C 1. 27 1,480 1.08 1,292 1. L9 2.35 2,772 Levuka E 0.02 198 0.02 198
'rotal 38'.l..18 596,822 458.21 683,792 4.9 839.39 1,280 614 ,
/2
% cha1~ over 1978
+13~ --34. E
+2.2 +7.9
+28.9 -2.9 -2.Ll
+11.3 -37 -6
-0. '1
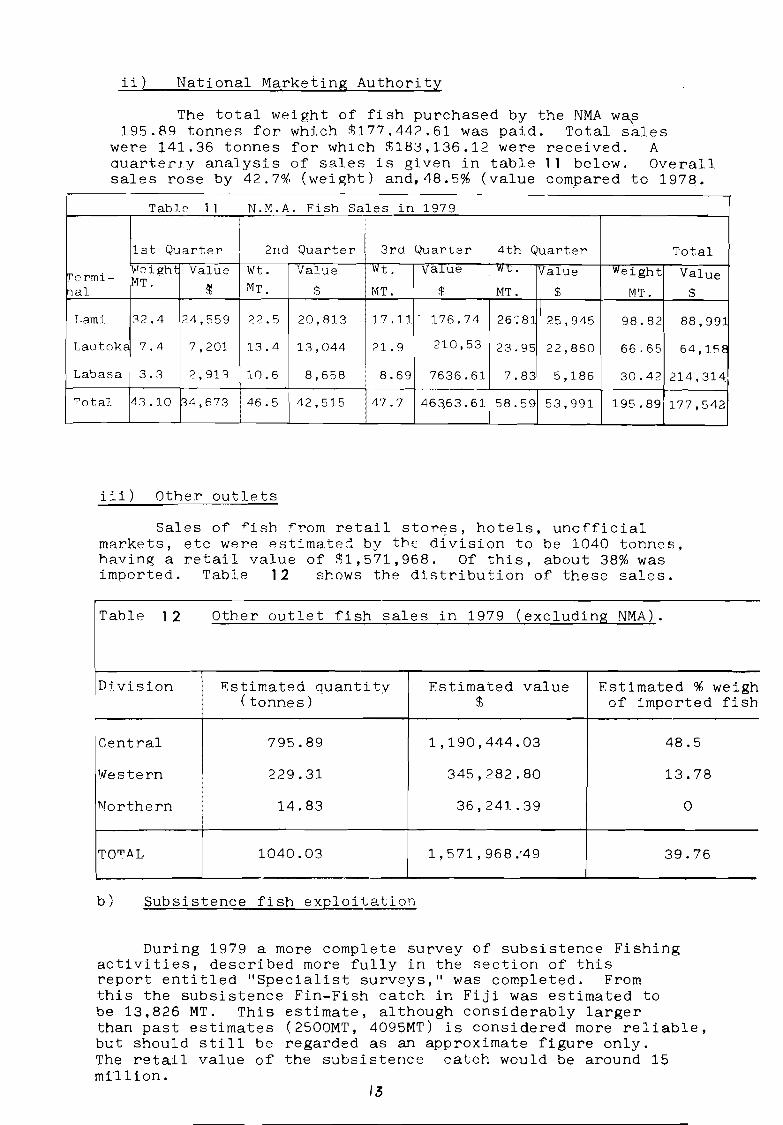
ii) National Marketing Authority
The total weight of fish purchased by the NMA w~s 195.8q tonnes for which 1177.442.61 was paid. Total sales
were 141.36 tonnes for which ~180,136.12 were received. A auarteriy analysis of sales is given in table 11 below. Overall sales rose by 42.7~ (weight) and,48.5% (value compared to 1978.
Table 1 1 N.M.A. Fish Sales in 1979
1st Quarter I 2nd Quarter 3rd Quarter 4th Quarter Total I W-C •
'l'ermi-l;Teight Value Wt. Value Wt, vaiue Value Weight Value MT.
1al ~ MT. i MT. $ MT. $ MT. s;
Lami 12.4 24,559 ??.5 20,813 17.11 - 176.74 26:Ri 05,94" 98.82 88,991
Lautoke 7.4 7,201 13 .4 13,044 21. 9 210,53 23.95 22,860 66.65 64,158
Labasa I 3.::J 2,911 10 .6 8,658 8.69 7636.61 7.83 5,186 30.42 214, 314_ I
'l'otaJ. i4-1, 10 34,673 46.5 I 142,515 47.7 463,63. 61 58.59 53,991 195.89 177,542
iii) Other outlets
Sales of ~ish ~rom retail stor~s, hotels, unofficial markets, etc were estimate~ by tbe division to be 1040 tonnes, havinJ?; a retail value of $1,571,968. Of this, about 38% was imported. Table 12 shows the distribution of these sales.
Table 1 2 Other outlet -fish sales in 1979 (excluding NMA).
Dlvision ~stimated quantity Estimated value Estimated % (tonnes) ~ of imported
Cent.ral 795.89 1,190,444.03 48.5
Western 229.31 345,282.80 13.78
T\Torthern 14.83 36,241.39 0
TO'rAL 1040.03 1,571,968:49 39.76
b) Subsistence fish exploitation
During 1979 a more complete survey of subsistence Fishing activities, described more fully in the section of this report entitled "Specialist surveys," was completed. From this the subsistence Fin-Fish catch in Fiji was estimated to be 13,826 MT. This estimate, although considerably larger than past estimates (2500MT, 4095MT) is considered more reliable, but should still be regarded as an approximate figure only. The retail value of the subsistence catch would be around 15 million.
weigh fish
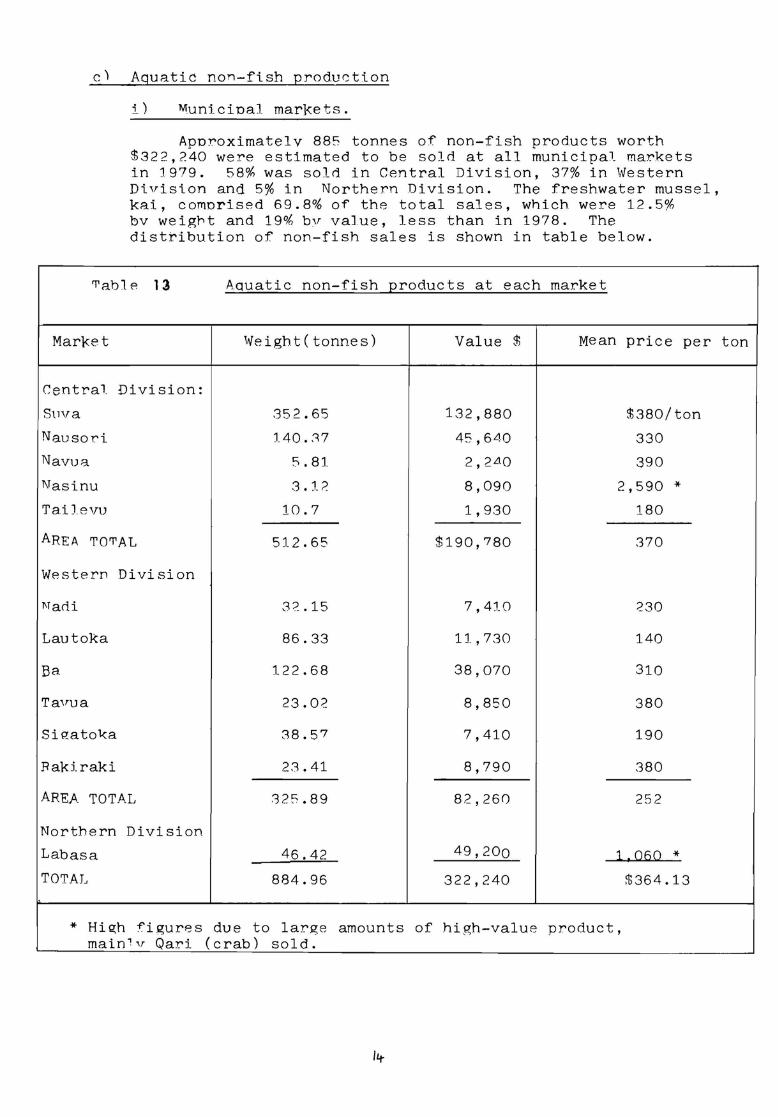
c) Aquatic non-fish production
i) Municioal markets.
Aooroximatelv 885 tonnes of non-fish products worth $322,2~0 were estimated to be sold at all municipal markets in 1979. 58% was sold in Central Division, 37% in Western Di.vision and 5% in Northern Division. The freshwater mussel, kai, comorised 69.8% or the total sales, which were 12.5% bv weig~t and 19% bv value, less than in 1978. The dist~ibution of non-fish sales is shown in table below.
'T'ab1 e 13 Aquatic non-fish 2roducts at each market
Marl<e t Weight(tonnes) Value $ Mean price per
Central Division:
S\nra 352.65 132,880 $380/ton
Nausor.i 140.37 45,640 330
Navua 5.81 2,2Ll0 390
l\Tasinu 3 . l ?. 8,090 2,590 * Ta.iJ.evu 10.7 1,930 180
AREA TO'T'AL 512.65 $190,780 370
Western Division
Narl.i 3'.2.15 7,410 230
Lautoka 86.33 11,730 140
Ba 122.68 38,070 310
Tavua 23.02 8,850 380
SiP.:ato'ka 38.57 7,410 190
.Rakiraki 23.41 8,790 380
AREA TOTAL 325.89 82,26() 252
Northern Division
Labasa 46.42 49,200 1,060 * TOTAL 884.96 322,240 $364.13
* High T'" 0 .. 1gur.J s due to large amounts of high-value product, main7,, Qari (crab) sold.
lit
ton
ii) National Marketing Authority
Due to the very small turnover of non-fish products via NMA, separate figures were not recorded.
Jii) Other outlets.
An estimated 26.69 tonnes of non-fish products worth ~45,71? were sold direct to hotels, butchers and supermarkets. 15.31 tonnes (57%) were imported prawns.
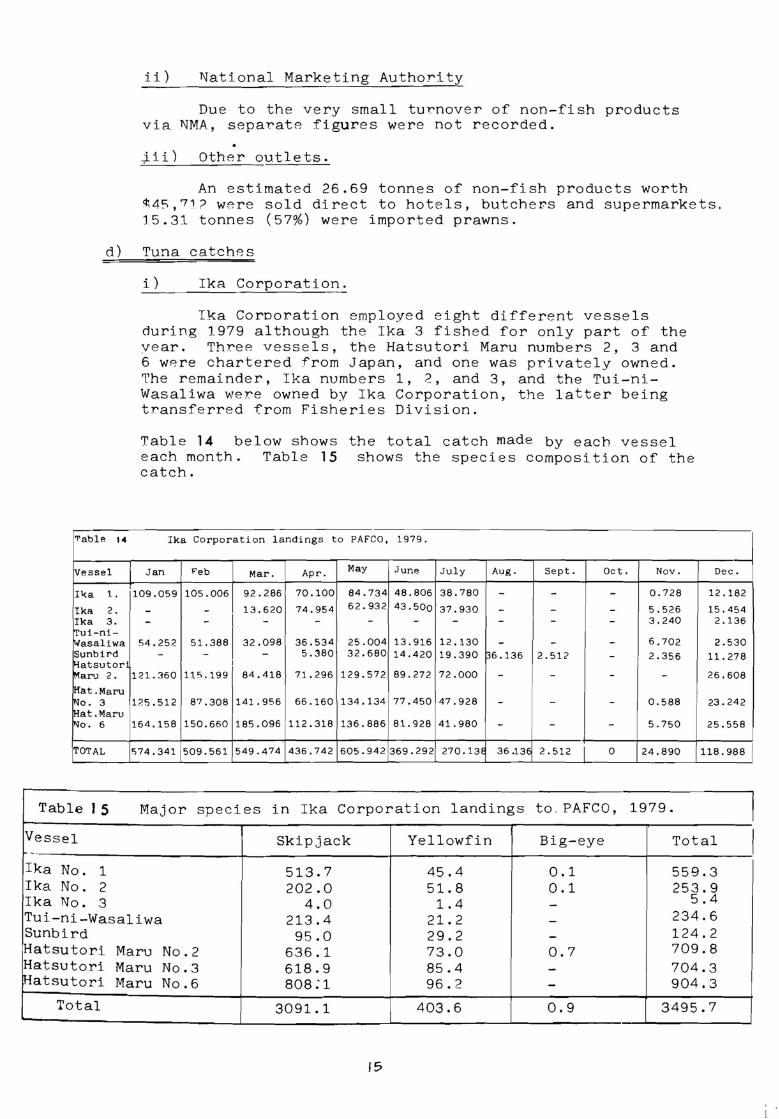
ct) Tuna catches
'!'able 14
Vessel
Il<a 1.
Ika 2. Ika 3. ITui-ni-"1asaliwa Sunhird f(atsutorl ~aru 2.
Hat .Maru N'o. 3 Hat. Maru N'o. 6
i) Ika Corporation.
Ika Corooration employed eight different vessels during 1979 although the Ika 3 fished for only part of the vear. Three vessels, the Hatsutori Maru numbers 2, 3 and 6 were chartered from Japan, and one was privately owned. The remainder, Ika numbers 1, 2, and 3, and the Tui-niWasaliwa were owned by Ika Corporation, the latter being transferred from Fisheries Division.
Table 14 below shows the total catch made by each vessel each month. Table 15 shows the species composition of the catch.
Ika Corporation landings to PAFCO, 1979.
Jan Feb Mar. Apr. May June July Aug. Sept. Oct. Nov.
1109 .059 105.006 92.286 70.100 84.734 48.806 38.780 - - - 0.728
- - 13.620 74.954 62.932 43.500 37.930 - - - 5.526 - - - - - - - - - - 3.240
54. 252 51.388 32.098 36.534 25.004 13.916 12,130 - - - 6.702 - - - 5.380 32.680 14.420 19.390 ~6.136 2.512 - 2.356
121.360 115.199 84.418 71.296 129.572 89.272 72. 000 - - - -
1;,5_512 87.308 141.956 66 .160 134. 134 77 .450 47.928 - - - 0.588
164.158 150.660 185.096 112.318 1.36. 886 81. 928 41.980 - - - 5.750
Dec.
12.182
15.454 2.136
2.530 11. 278
26.608
23. 242
25.558
TOTAL 574.341 509.561 549.474 436.742 605.942 369.292 270.13E 36 .13€ 2.512 I 0 24.890 110. 988 I
Table J 5 Major species in Ika Corporation landings to. PAFCO, 1979. I Vessel Skipjack Yellowfin Big-eye Total I -Ika No. 1 513.7 45.4 0.1 559.3 Ika No. 2 202.0 51. 8 0.1 253.9 Ika No. 3 4.0 1.4 - 5.4 Tui-ni-Wasaliwa 213.4 21. 2 - 234.6 Sunbird 95.0 29.2 - 124.2 Hatsutori Maru No.2 636.1 73.0 0.7 709.8 Hatsutori Maru No.3 618.9 85.4 - 704.3 Hatsutori Maru No.6 808:1 96.2 - 904.3
Total 3091.1 403.6 0.9 3495.7
15
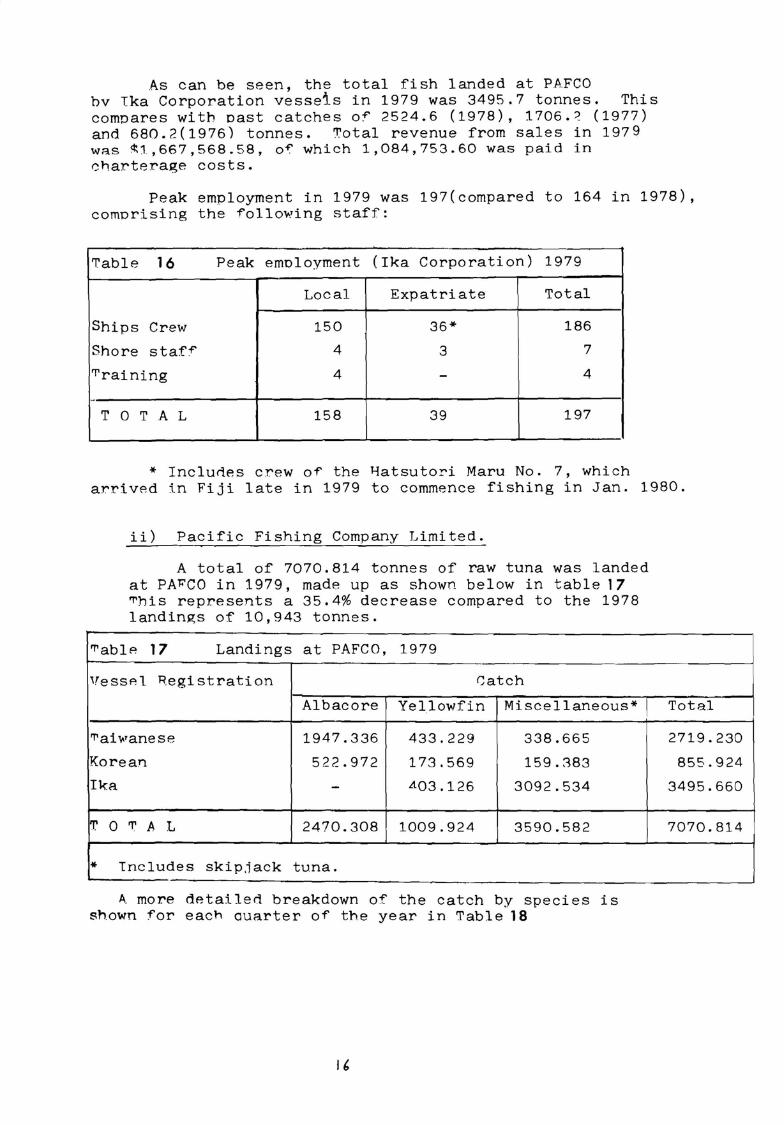
As can be seen, the total fish landed at PAFCO bv 1ka Corporation vessels in 1979 was 3495.7 tonnes. This compares with oast catches of 2524.6 (1978), 1706.~ (1977) and 680.2(1976) tonnes. ~otal revenue from sales in 1979 was ~1,667,568.58, o 9 which 1,084,753.60 was paid in ~hartera~e costs.
Peak employment in 1979 was 197(compared to 164 in 1978), comprising the -following staff:
'I'able 16 Peak emoloyment (Ika Corporation) 1979
Local Expatriate Total
Ships Crew 150 36* 186
Shore staff 4 3 7
'T'raining 4 - 4
.. T 0 T A L 158 39 197
* Includes crew of the 4atsutori Maru No. 7, which arrived :i.n Fiji late in 1979 to commence fishing in Jan. 1980.
ii) Paci£ic Fishing Company Limited.
A total of 7070.814 tonnes of raw tuna was landed at PA~co in 1979, made up as shown below in table 17 'T'his represents a 35,4% decrease compared to the 1978 landings of 10,943 tonnes.
rrable 17 Landings at PAFCO, 1979
Vessel R.egistration Gatch
Albacore Yellowfin Miscellaneous* I
rraiwanese 1947.336 433.229 338.665
Korean 522.972 173.569 159.'.i83
Ika - £103.126 3092.534
n:' 0 'l' A L 2470.308 1009.924 3590.582
* 1ncludes skip.iack tuna.
A more detailed breakdown of the catch by species is sh.own for each auarter of' the year in Table 18
Total
2719.230
855.924
3495.660
7070.814
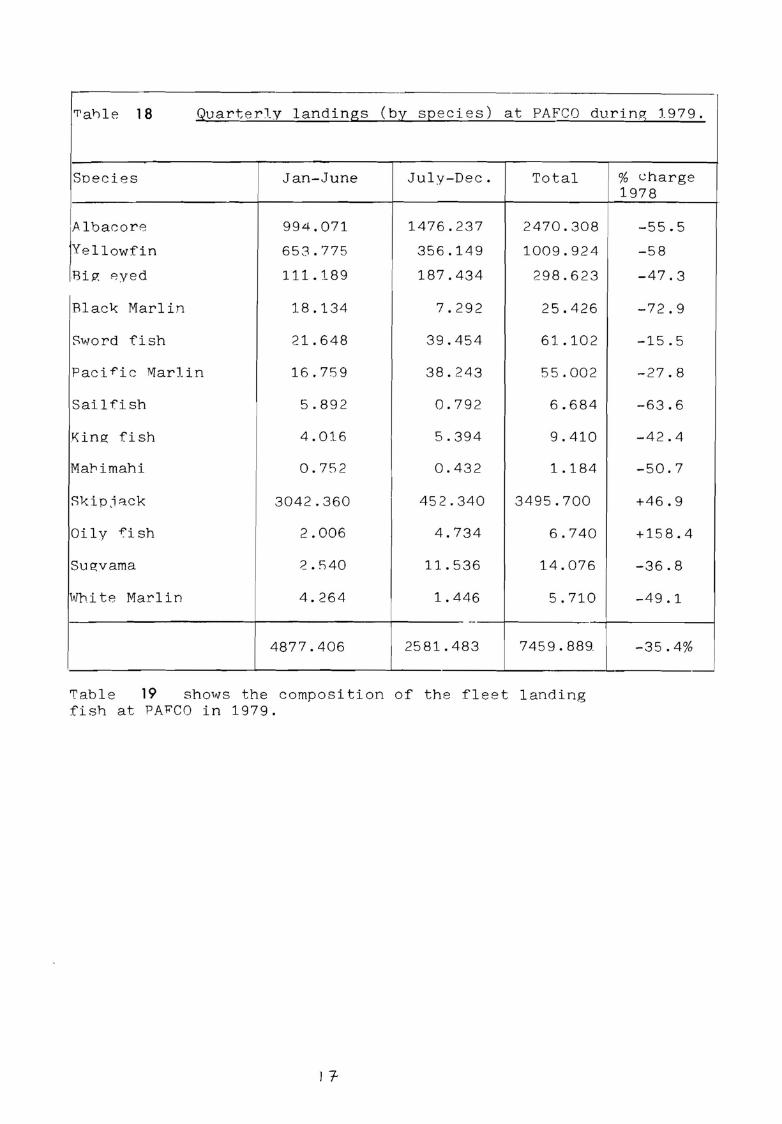
rral,le 18 Quarterly landings (by species) at PAFCO during 1979.
Soecies Jan-June July-Dec. Total % charge 1978
Albacore 994.071 1476.237 2470 .308 -55.5
Yellowfin 658.775 356.149 1009.924 -58
Big eyed 111.189 187.434 298.623 -47.3
Black Marlin 18.134 7.292 25 .426 -72.9
Sword fish 21.648 39 .454 61.102 -15.5
Pacif'ic Marlin 16.759 38.243 55.002 -27.8
Sailfish 5.892 0.792 6.684 -63.6
King fish 4.016 5.394 9.410 -4 2 .4
MaJ-,imahi 0.752 0.432 1.184 -50.7
Skipj8.ck 3042.360 452.340 3495.700 +46.9
Oily f'i sh 2.006 4.734 6.740 +158.4
Sugvama 2.540 11.536 14.076 -36.8
White Marlin 4. 264 1.446 5.710 -49.1
--
4877.406 2581.483 7459. 889. -35.4%
'1' ab 1 e 19 shows the composition of the fleet landing fish at PAFCO in 1979.
l 7-
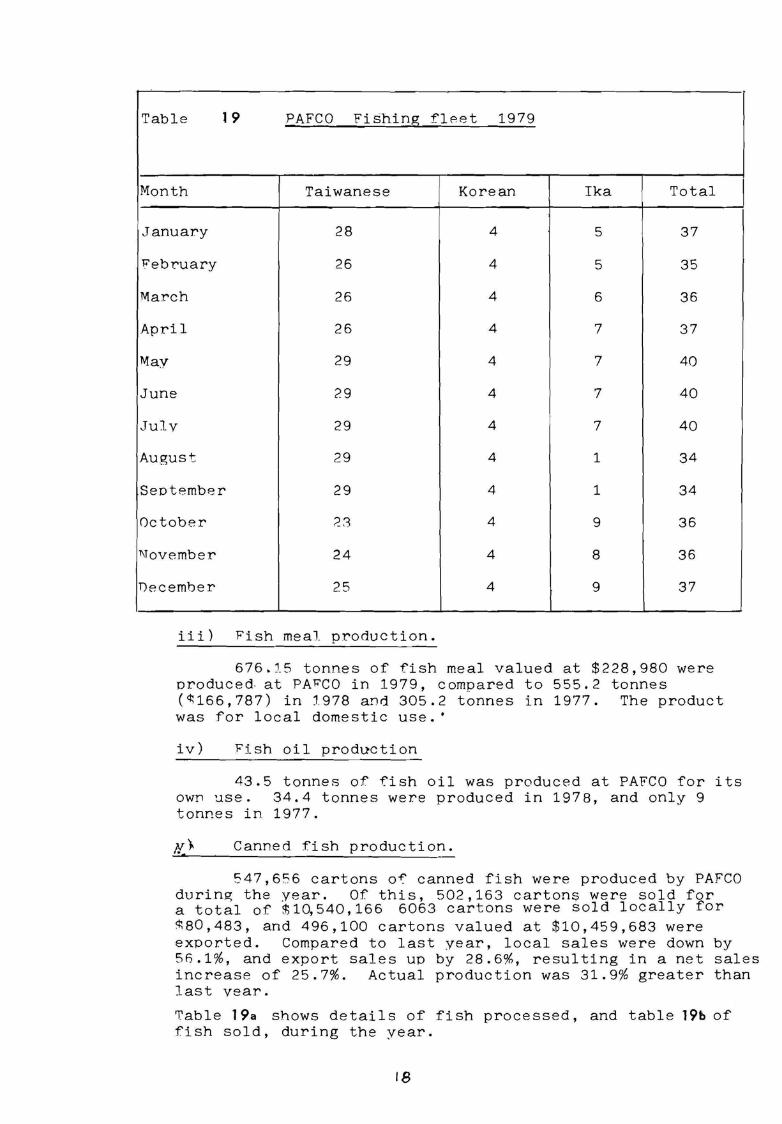
Table 1 9 PAFCO Fishing flPet 1979
Month Taiwanese Korean Ika Total
January 28 4 5 37
'l<'ebruary 26 4 5 35
March 26 4 6 36
April 26 4 7 37
May 29 4 7 40
June 29 4 7 40
Julv 29 4 7 40
August 29 4 1 34
September 29 4 1 34
October 28 4 9 36
November 24 4 8 36
December 25 4 9 37
iii) Fish meal production.
676.15 tonnes of fish meal valued at $228,980 were croduced. at PA'l<'CO in 1979, compared to 555.2 tonnes (~166,787) in 1978 and 305.2 t~nnes in 1977. The product was for local domestic use.'
iv) Fish oil production
43.5 tonnes of fish oil was produced at PAFCO for its own ~se. 34.4 tonnes were produced in 1978, and only 9 tonnes in 1977.
lf).. Canned :fish production.
547,656 cartons o~ canned fish were produced by PAFCO during the year. Of this, 502,163 cartons were sold for a total of $10,540, 166 6063 cartons were sold locally for ~80,483, and 496,100 cartons valued at $10,459,683 were exported. Compared to last year, local sales were down by 5n.1%, and export sales up by 28.6%, resulting in a net sales increase of 25.7%. Actual production was 31.9% greater than last vear.
'fable 19a shows detai 1 s of fish processed, and table 19b of fish sold, during the year.
18
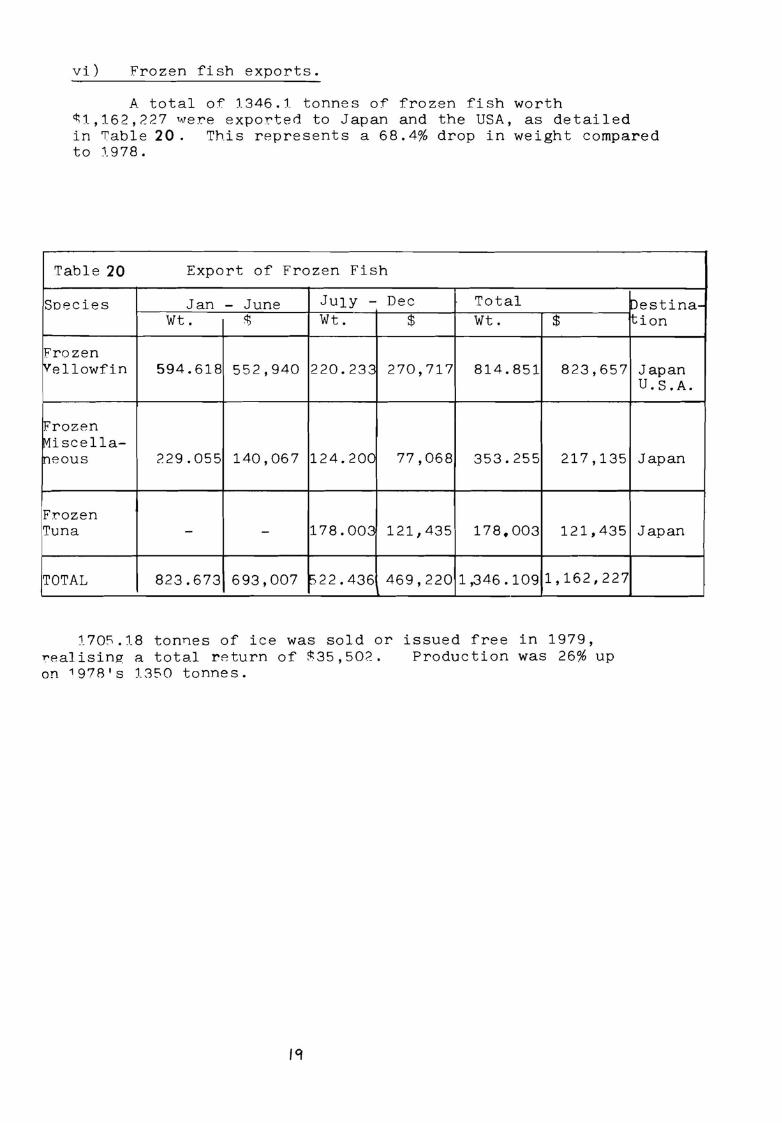
vi) Frozen fish exports.
A total of 1346.1 tonnes of frozen fish worth <l;l,162,227 were exported to Japan and the USA, as detailed in Table 20. This represents a 68.4% drop in weight compared to '.1.978.
Table 20 Export of Frozen Fish
Soecies Jan - June Ju1y - Dec Total Wt. <l; Wt. $ Wt. $
Frozen Vellowfin 594.618 552,940 220.233 270,717 814.851 823,657
Frozen Miscella-neous ?.29.055 140,067 124.200 77,068 353.255 217,135
Frozen Tuna - - 178.003 121,435 178.003 121,435
TOTAL 823.673 693,007 h.22.436 469,220 1,346.109 1,162,227
170S.18 tonnes of ice was sold or issued free in 1979, ~ealising a total return of ~35,502. Production was 26% up on 1970•s 1350 tonnes.
19
Destina-ltion
Japan U.S.A.
Japan
Japan
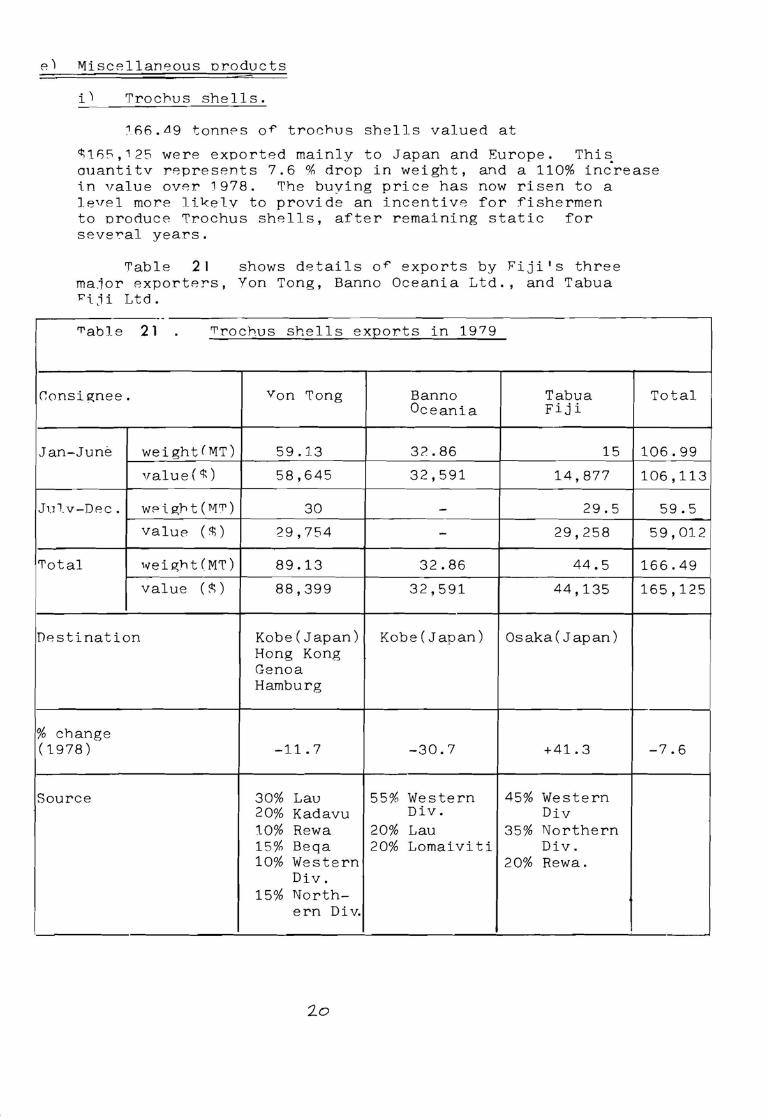
e) Miscellaneous oroducts
i) Trochus shells.
166.~9 tonnPs o~ trochus shells valued at
~1~~.125 were exported mainly to Japan and Europe. Thi~ auantitv represents 7.6 % drop in weight, and a 110% increase i.n value over 1978. The buying price has now risen to a level more lil<elv to provide an incentive for :fishermen to oroduce Trochus shells, after remaining static for sever-al years.
'T'able 21 shows details o~ exports by Fiji's three major exporters, Von Tong, Banno Oceania Ltd., and Tabua ~i.ji Ltd .
. .
'l'able 21 rrrochus shells exports in 1979
Consignee. Von Tong Banno Tabua Oceania Fiji
Jan-June weight(MT) 59.13 3?..86 15
value(i) 58,645 32,591 14,877
Julv-Dec. WP i. gh t ( 111'1') 30 - 29.5
value ( ~) 29,754 - 29,258
'T'otal weight(MT) 89.13 32.86 44.5
value ( ~ ) 88,399 32,591 44,135
Destination Kobe(Japan) Kobe (Japan) Osaka( Japan) Hong Kong Genoa Hamburg
% change (1978) -11.7 -30.7 +41.3
Source 30% Lau 55% Western 45% Western 20% Kadavu Div. Div 10% Rewa 20% Lau 35% Northern 15% Beqa 20% Lomaiviti Div. 10% Western 20% Rewa.
Div. 15% North-
ern Div.
2.o
Total
106.99
106,113
59.5
59,012
166.49
165,125
-7.6
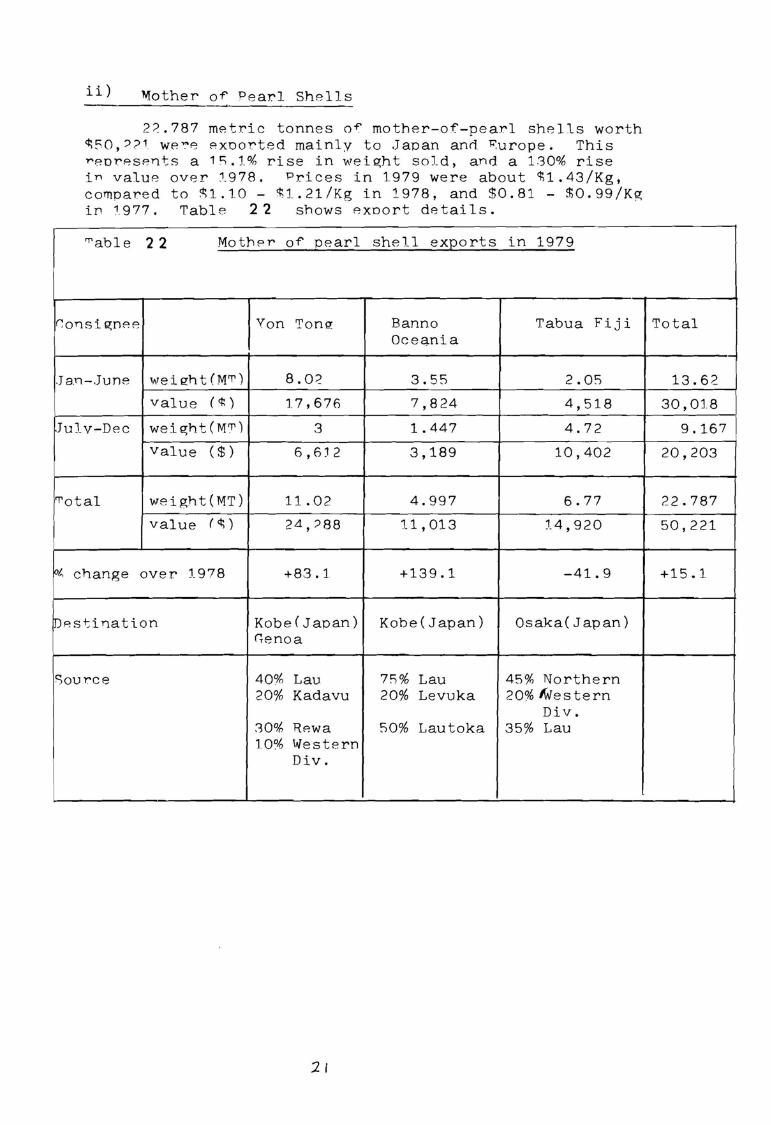
ii) Mother of' Pearl Shells
2~.787 metric tonnes o~ mother-of-pearl shells worth ~50,??1 we~8 exoorted mainly to Japan anrl ~urope. This ~eoresents a 1s.1% rise in weight sold, and a 130% rise in value over 1978, Prices in 1.979 were about tl.43/Kg, compared to ~1.10 - $1.21/Kg in 1978, and $0.81 - $0.99/Kg in 1.977. Table 2 '2 shows exoort details.
,,,able 22 Mother of' pearl shell ex2orts in 1979
l;onsignee Von Tong: Banno Tabua Fiji Oceania
.Jan-June wei 12:ht (M'T') 8.02 3.55 2.05
value ( ~ ) 17,676 7,824 4,518
JuJ_v-Dec weight(M'T') 3 1.447 4.72
value ($) 6,6J2 3,189 10,402
rrotal weight(MT) 11.02 4.997 6.77
value ( ~ ) 2Ll,?88 11,013 t4,920
ot, change over 1978 +83.l +139.1 -41.9
IDes+:ination Kobe( Japan) Kobe(Japan) Osaka( Japan) fienoa
C,ource 40% Lau 75% Lau 45% Northern 20% Kadavu 20% Levuka 20% Me stern
Div. 80% Rew a 50% Lautoka 35% Lau 10% Western
Div.
21
Total
13.62
30,018
9.167
20,203
22.787
50,221
+15.1
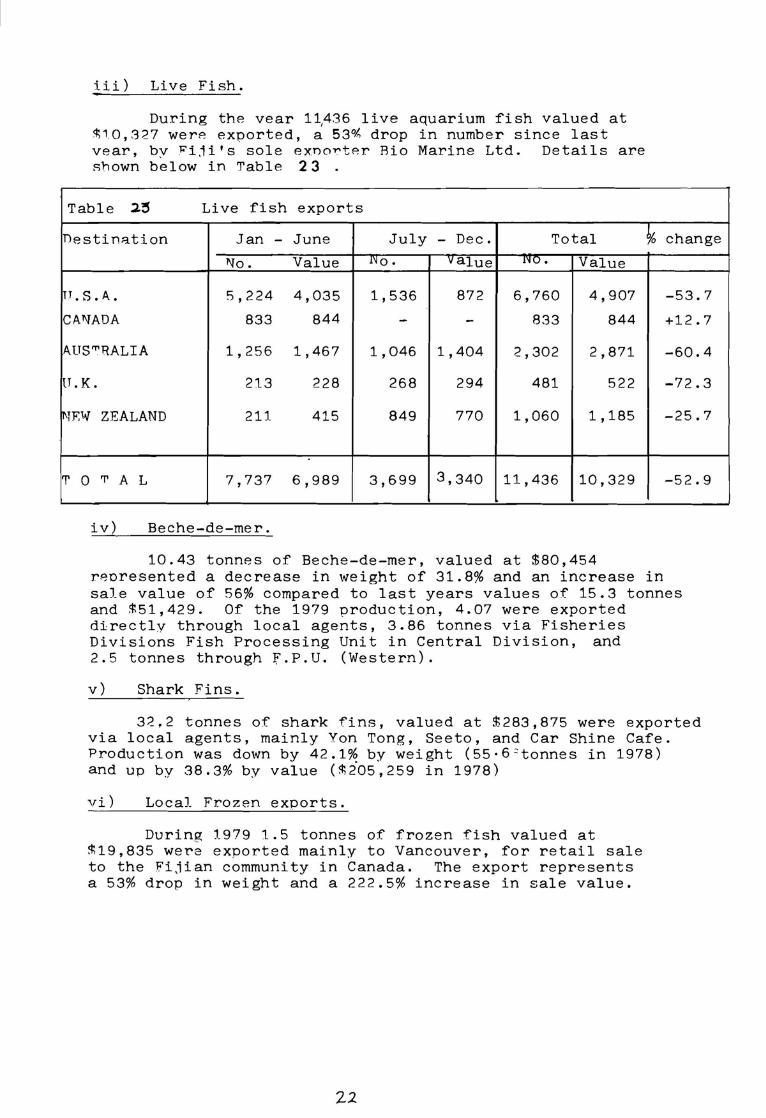
iii) Live Fish.
During the vear 1\436 live aquarium fish valued at q; 10,327 were exported, a 53°A drop in number since last vear, by ~iji's sole exno~ter Rio Marine Ltd. Details are shown below in Table 2 3 .
Table .2~ Live fish exports I
DestinR.tion Jan - June July - Dec. Total % change
T\To. Value no. va1ue l'lU • Value
TT . S.A. 5,224 4,035 1,536 872 6,760 4,907 -53.7
CA.T\TADA 833 844 - - 833 844 +12.7
AUS'T''RALIA 1,256 1,467 1,046 1,404 2,302 2,871 -60.4
tT . K . 213 228 268 294 481 522 -72.3
l'{R'IJ' ZEALAND 211. 415 849 770 1,060 1,185 -25.7
'T' 0 'T' A L 7,737 6,989 3,699 3,340 11,436 10,329 -52.9
iv) Beche-de-mer.
10.43 tonnes of Beche-de-mer, valued at $80,454 reoresented a decrease in weight of 31.8% and an increase in sale value of 56% compared to last years values of 15.3 tonnes and ~51,429. Of the 1979 production, 4.07 were exported directly through local agents, 3.86 tonnes via Fisheries Divisions Fish Processing Unit in Central Division, and 2.5 tonnes through f.P.U. (Western).
v) Shark Fins.
32,2 tonnes of shark fins, valued at $283,875 were exported via local agents, mainly Yon Tong, Seeto, and Car Shine Cafe. Production was down by 42.1~ by weight (55·6~tonnes in 1978) and up by 38.3% by value ($205,259 in 1978)
vi) Local Frozen exports.
During 1979 1.5 tonnes of frozen fish valued at ~19,835 were exported mainly to Vancouver, for retail sale to the Fijian community in Canada. The export represents a 53% drop in weight and a 222.5% increase in sale value.
22
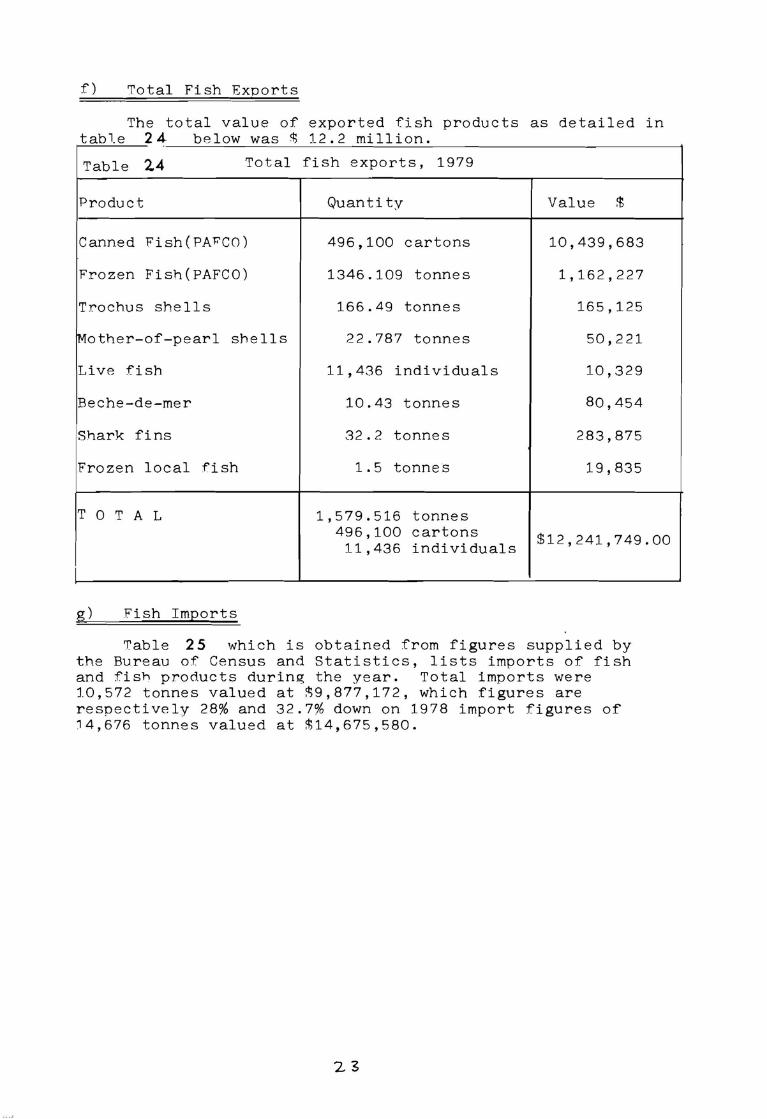
f) Total Fish Exports
The total value of exported fish products as detailed in table 24 below was <I; 12.2 million.
Table 24 Total fish exports, 1979
Product
Canned Fish(PA~CO)
Frozen Fish(PAFCO)
Trochus shells
Mother-of-pearl shells
Live fish
Beche-de-mer
Shark fins
Frozen local fish
T O T A L
g) Fish Imports
Quantity
496,100 cartons
1346.109 tonnes
166.49 tonnes
22.787 tonnes
11,436 individuals
10.43 tonnes
32.2 tonnes
1.5 tonnes
1,579.516 tonnes 496,100 cartons
11,436 individuals
Value ~
10,439,683
1,162,227
165,125
50,221
10,329
80,454
283,875
19,835
$12,241,749.00
Table 25 which is obtained from figures supplied by the Bureau of Census and Statistics, lists imports of fish and fish products during the year. Total imports were 10,572 tonnes valued at ~9,877,172, which figures are respectively 28% and 32.7% down on 1978 import figures of 14,676 tonnes valued at $14,675,580.
23
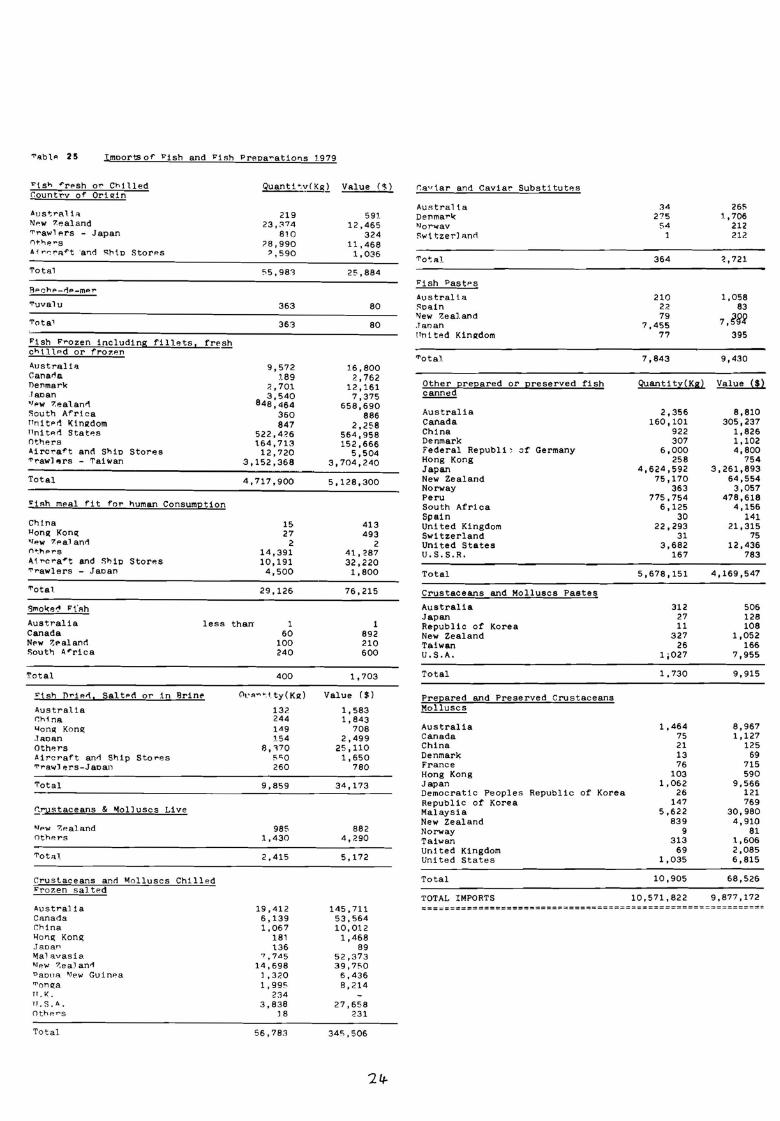
"'ablP. 25 lmoorts of' "ish and "ish Preoaratioris 1.979
"\sh ~resh or Chilled Countrv of' Orio;in
AtJs+;ral i::i NP.w ?'.ealand 'T'rawlers - Japan
Total
BPChP-r!P-mPT"
"T'uvalu
Totai
"ish Frozen including fillets, fresh chilled or fro~en
A.ustralia Ganar\a nenmark .laoan "'PW 7.ealanr\ South Af'rica TTni terl l(inl!dom llnitP.rl StatP.S 0t'1P.rs A.ircraf't and Shio Stores "'rawl~rs - Taiwan
Total
"i~h meal fit f'or human Consumption
China lion!! Kono; "'"w ?:paJ anri. n+;t-iprs
A.\rcra~t and Ship Stores 'T'rawlers - Jaoan
'T'otal.
Quant 1 ':.':'.i!..81 Value (~)
219 23,~74
810 ?8,990 ?,590
55,981
363
36.3
9,572 189
?. , 701 3,540
848,464 360 847
522,4~6 \64,713 12,720
3,152,368
4,717,900
15 27
2 14,391 10,191 4,500
29,126
591. 12,465
324 11,468
1,036
25,884
80
80
16,800 2,762
12,161 7,375
658,690 886
2,2S8 564,958 152,666
5,504 3,704,240
5,128,300
413 493
2 41,<87 32,220 1,800
76,215
"3mo1<e-:' l'fllh
A.ustralia Canada
less than· 1 60
100 240
1 892 210 600
NPw 7.Paland South A.~rica
Total
"tsh nriP.r\ 1 Salted or in BrinP
Australia f;h1na '-'on11: Kon11; .Jaoan Others Aircraf't an~ Ship Stores 'T'ra\jf) P,rs-J aoan
Total
f;rustaceans & ~olluscs Live
"'PW '7,P,al and OthP.rs
'T'otal.
Crustaceans and Molluscs Chilled "rozen sal.tP.d
Australia Canada China 'Ion~ Kon11: Jaoan 1.1al avasia. ".lew 7.eaJ anri' Paoua l\Tew Gui n~a riiona:a TT .K. Tl. S. A.
<lthP.Y'S
Total
400
C\1.•A~•.i_ty(K11:)
13?. 244 149 l.54
8,'HO 550 260
9,859
985 1,430
2,415
19,412 6,139 1,067
181 136
7 ,7.d.5 14,698
l ,3?.0 1,99~
234 3,838
18
56,783
1,703
Value ($)
1,583 1,843
708 2,499
25,110 1,650
780
34,173
882 4,290
5,172
145,711 53,564 10,012
1,468 89
52,373 39,750
6,436 8,214
27,658 231
34S,506
24-
r,:;,y\ar and Caviar Substitutes
Australia Denmar1< N"or"'fav f;w\ tzerl anrl
"T'o+;a.J.
"ish Pastes
Australia ~oain New Zeal.and .Tan an 11nited Kin11:dom
"'otal.
Other prepared or preserved fish canned
Australia Canada China Denmark Federal Republi , of Germany Hong Kong Japan New Zealand Norway Peru South Africa Spain United Kingdom Switzerland United States U.S. S.R.
Total
Crustaceans and Molluscs Pastes
Australia Japan Republic of Korea New Zealand Taiwan U.S.A.
Total
Prepared and Preserved crustaceans Molluscs
Australia Canada China Denmark France Hong Kong Japan Democratic Peoples Republic of Korea Republic of Korea Malaysia New Zealand Norway Taiwan United Kingdom United States
Total
TOTAL IMPORTS
34 265 275 l., 706
54 212 1 212
364 <,721
210 1,058 22 83 79
7,?&2 7,455 77 395
7,843 9,430
Quanti ty(Kg) Value ($)
2,356 8,810 160,101 305,237
922 1,826 307 1,102
6,000 4,800 258 754
4,624,592 3,261,893 75,170 64,554
363 3,057 775,754 478,618
6,125 4,156 30 141
22,293 21,315 31 75
3,682 12,436 167 783
5,678,151 4,169,547
312 506 27 128 11 108
327 1,052 26 166
1;027 7,955
1,730 9,915
1,464 8,967 75 1,127 21 125 13 69 76 715
103 590 1,062 9,566
26 121 147 769
5,622 30,980 839 4,910
9 81 313 1,606
69 2,085 1,035 6,815
10,905 68,526
10,571,822 9,877,172 -=-------=====-=============================================~
h) Local Fish Production
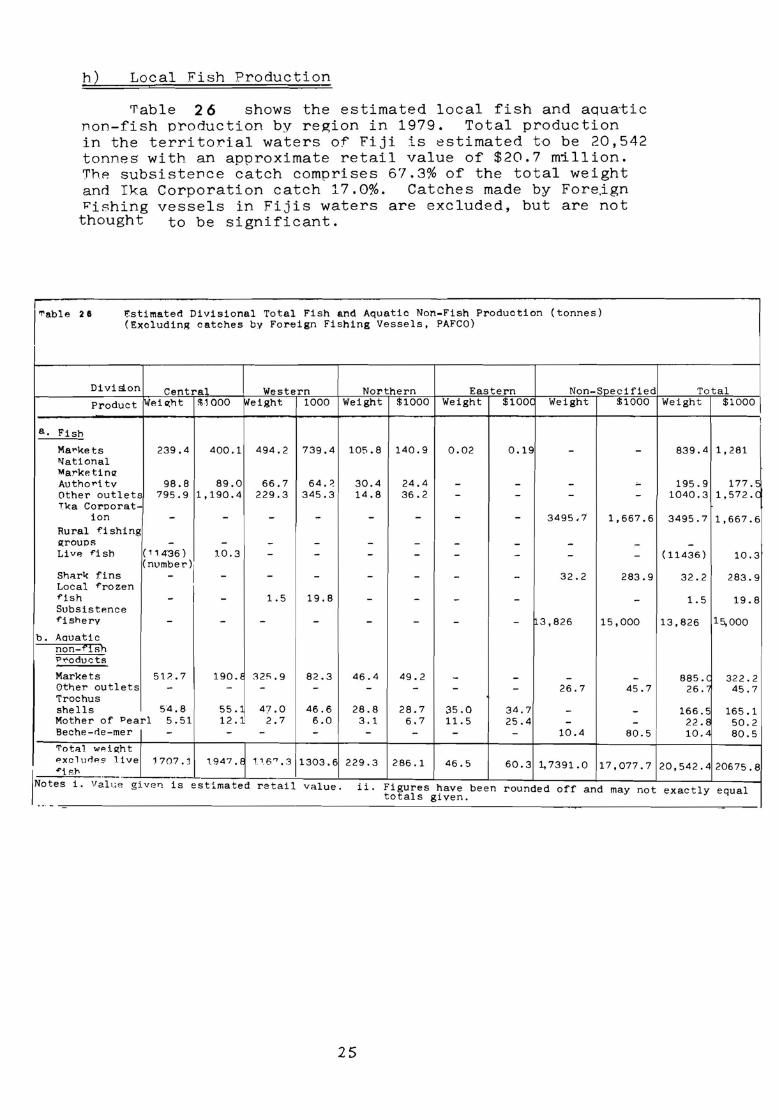
'l'able 2 6 shows the estimated local fish and aqua·tic non-fish p~oduction by region in 1979. Total production in the territorial waters of Fiji is estimated to be 20,542 tonnes with an approximate retail value of $20.7 m~llion. Th~ subsisteDce catch comprises 67.3% of the total weight and Ika Corporation catch 17.0%. Catches made by Forejgn ~ishing vessels in Fijis waters are excluded, but are not thought to be significant.
'!'able 28 l!:stimaterl Divisional Total Fish and Aquatic Non-Fish Production (tonnes) (Excludinp; catches by Foreign Fishing Vessels, PAFCO)
Divis.on Central Western Northern Eastern Non-Soecified Product ~eil;(ht i1000 Weight 1000 Weight $1000 Weight $100( Weight hooo
a. Fish
Markets 239.4 400.1 494.2 739,4 105,8 140.9 0.02 0.19 - -11/ational Mar-l<e ti niz Autho"i tv 98.8 89.0 66,7 64.? 30.4 24.4 - - - -Other outlets 795.9 1,190.4 229.3 345.3 14.8 36.2 - - - -Tl<a Coroorat-
ion - - - - - - - - 3495,1 1,667.6 Rural f'i shing 11:rouos - - - - - - - - - -Live f'ish (114'36) 10.3 - - - - - - - -Sh;i.rl< fins
(num~er)I - - - - - - - 32.2 283.9
Local f'rozen f'ish - - 1.5 19.8 - - - - -Subsistence f'isherv - - - - - - - - 13,826 15,000
b. Aauatic non-'l'!sh P,:'oducts
Markets 51?.7 190.l 12S,9 82.3 46.4 49.2 - - - -Other outlets - - - - - - - - 26.7 45.7 Trochus shells 54.8 55 .1 47,0 46.6 28.8 28.7 35.0 34.7 - -Mother of Pearl 5.51 12.1 2.7 6.0 3.1 6.7 11. 5 25.4 - -Beche-rte-mer - - - - - - - - 10.4 80.5
'T'ot,i.1 wei11:ht Pxclurles, live 1 707 . 1 1.947, 1.1.6" • . '3 1303.6 229.3 286. 1 46.5 60.3 1, 7391.0 17,077.7 l ~tP.l' ·- ·--
Notes i. Val1.;e given is estimated retail value. ii. Figures have been rounded off and totals given.
may not
25
Total Weight $1000
I
839.4 1,281
195.9 177.~ 1040.3 1,572.C
3495.7 1,667.6
-(11436) 10.3
32.2 283.9
1. 5 19.8
13,826 15,000
885. ( 322.2 26 . . 45.7
166.5 165.1 22. l 50.2 10.~ 80.5
20,542.4 20675. 8
exactly equal
V. THE WORK OF TH~ FISHERIES DIVISION
a) Total Resource Assessment and Management
i) r..ene ral .
Tn 1977 the Fisheries Division established a system o~ data collection intended to provide information relevant to the formulation and implementatioh of management oolicies, and to monitor the effects of such oolicies and also short and long term trends in ~isheries-relatect ~ields. Statistics are obtained from a number of sources, described in the following section, and it is hoped that their compilation over a period of time will enable Fisheries Division to achieve rational regulation and optimum exploitation of local fishery resources, by assessing current rates and densities of fishing, and the effects of such fishing on fish production.
Most fish produced locally for sale passes through some form of sales institution, such as a municipal market, roadside market, retail store, etc, and as such these points are well suited to the collection of ~ishery statistics. ~aturally, some fish is sold directly by th~ fisherman, and this will usually include most fish which are undersized, out of season, ooisonous, or illegal for some other reason, and which the vendor will therefore wish to be sold undetected by licensing or law enforcement officials. Despite this, the major portion of commercially caught fish passes through retail outlets and Fisheries Division staff regularly visit all municipal markets, and survey most other retail stores, hotels, etc. every quarter year. Municipal markets are visited on a random daily basis about 10 times a month
' although the freauency of visits will be reduced next year in order to save manpower. On a day when sampling occurs, the weight of each fishermans catch is recorded by soecies, and the total for each species obtained at the end of the day. From the known daily figures, monthly, auarterly and annual figures are computed.
During 1979, more detail was incorporated into the survey by the introduction of an interview system, in which the survey personnel record information on locality,fishing method~ catch etc which is voluntarily given by ind:i.vidual fishermen. This also is done on a random basis, (but depends upon the time available to the surveyor), and it is hoped that the information will enable the Division to build up a picture of the density of fishing in different areas, and the areas ability to withstand it, and consequently to devise a rational licensing system. This information is currently in the process of analysis, and more emphasis will be placed on this aspect in future. It is likely to be a long term undertaking.
Outlets other than municipal markets (such as stores, hotels, National Marketing Authority) are visited once a quarter and their proprietors are asked to complete standard forms in which they list their turnover, by weight and value, of all types of fish and fish products they handle. Naturally, s·ome proprietors keeo better records than others, and some occasionally are reluctant to provide information. For this reason the information concerning retail outlets, like that pertaining to municipal ~arkets, must be regarded as estimatPs. Consequently some of the data presented here do not correspond exactly with those presented in sections IV a) and IV c).
In addition to fish caught by commercial fishermen for sale, there is of course a substantial quantity of fish caught by consumers for their own use. This subsistence fishing is extremely important to most coastal and island villages, where fish comprise a major portion of the diet of most villagers. It is clear that such an important food source must be managed in such a way that it can continue to support a subsistence fishery. In many areas, exploitation is probably at levels which do not prevent any threat to the Fisheries involved, but it is suspected that overexploitation of some species may be occuring in some areas. As a prerequisite to taking steps to improve production by rural fishing c0mmunities, Fisheries Division conducted a survey of a number of coastal fishing villages in Fiji, to estimate levels of exploitation: this is described in detail in section V) a) iii)
ii) Fish sales survev.
Municipal market landings
During 1979, all municipal markets were surveyed in detail. The total estimated weight of fish sold in all markets was 865.53 tonnes, which corresponds closely to the official figure of 839.39 tonnes, and"represents an increase of 9.8% compared to last vear. The total value was estimated to be $1,373,202.20~ The highest landings were at Lautoka market, where 229.88 tonnes valued at $365,509.20 represents a 9% weight increase and a 21.6% value increase over 1978.203.67 tonnes (9.6% weight increase) valued at $345,416 (4.6% value increase) passed through Suva market.
The detailed survey also included aquatic non-fish products (molluscs, crustaceans, etc) of which an estimated 885.23 tonnes retailed for $357,694.75 -15.5% decrease in weight and a 9.8% decrease in value compared to last year. (The decrease is mainly due to a drop in production of the freshwater mussel Kai, probably due to flooding in 1977. Kai is a major constituent of non-fish sales, especially in areas around major rivers, such as Suva and Nausort).
21
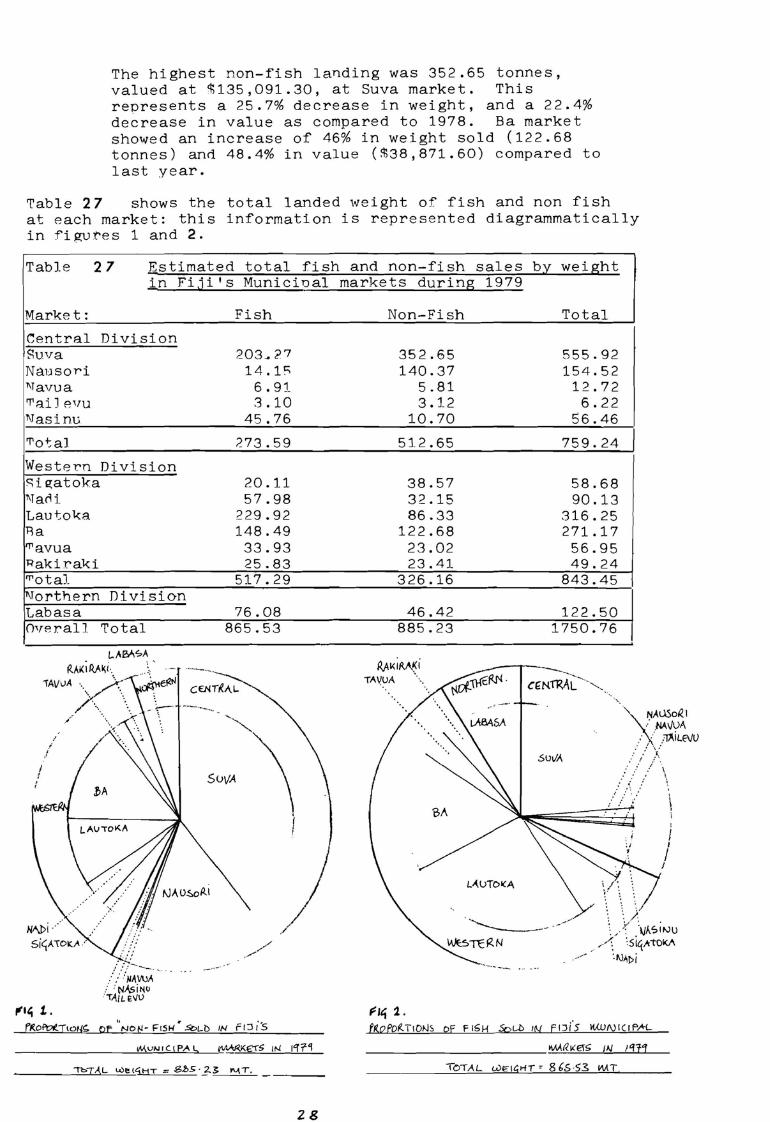
The highest n on-fish landing was 352.65 tonnes, valued at i135,091.30, at Suva market. This represents a 25.7% decrease in weight, and a 22.4% decrease in value as compared to 1978. Ba market showed an increase of 46% in weight sold (122.68 tonnes) and 48.4% in valu e (i38,871.60) compared to last year.
'T'able 27 shows the total landed weight of' fish and non fish at each market: this information is represe nted diagrammatically in figures 1 and 2.
Tabl e 27 Estimated total fish in Fiji's MuniciTJal
Market: Fish
Ce ntral Division Suv a 203J'?.7 Nausori 14.lS 1\Tavua 6.91 'T'ai J evu 3.10 1\Tasi nu 45.76
'T'otal ?. 73.59
Western Division Sigatoka 20.11 1\T a~ i 57.98 Lau t oka 229.92 Ba 148.49 'T'avua 33.93 J=?akiraki 25.83 'T'otaJ. 517.29 l\Torthern Division Labasa 76.08 Overall. 'T'otal 865.53
t.AM'=>A R.AK i P.A~i -. ~ , - ------
iAVvA ·v ~. -~e~ CENT~AL
and non-fish markets during
Non-Fish
352.65 140.37
5.81 3.12
10.70
512.65
38.57 32.15 86.33
122.68 23.02 23.41
326.16
46.42 885.23
R,,'\ K I/\/\,~. i TA\IUA
sales by weight 1979
Total
555.92 154.52 12.72 6.22
56.46
759.24 I 58.68 90.13
316.25 271.17 56.95 49.24
843.45
122.50 1750.76
~"" ·•··.... ... ---\;--· --~-,--..•..
/ , M Su~'\ \AuSoRI W..1/UA : :1'-iLNU
.-· :'\
itl4j 1.
. '•
::,i ,:",:""-;---..__
.: .: :/JAWI, ...- : NAsiNU 'TA/LEVU
)
28
/ ·,\
\ . \ i I
I I I
. ·---..____ ___ . ----·· \ \).· . '/ °IJASl"-1LJ . ,< :S~/,tOK/1
_/ ',!\}Jit>i ------·---
fl~ :2. fl{o fo~TIONS QF f 16 H Spu:. IN flJi 5 \(,(,Uf\) l( IPl'l'L
___________ ~r.1K'€f~ l>-J J'IJ"f
T<'.'lT AL w1c1t;>1T ~ 8 6'5 ·S.:S Vv\ T .
Sales from outlets other than municipal markets
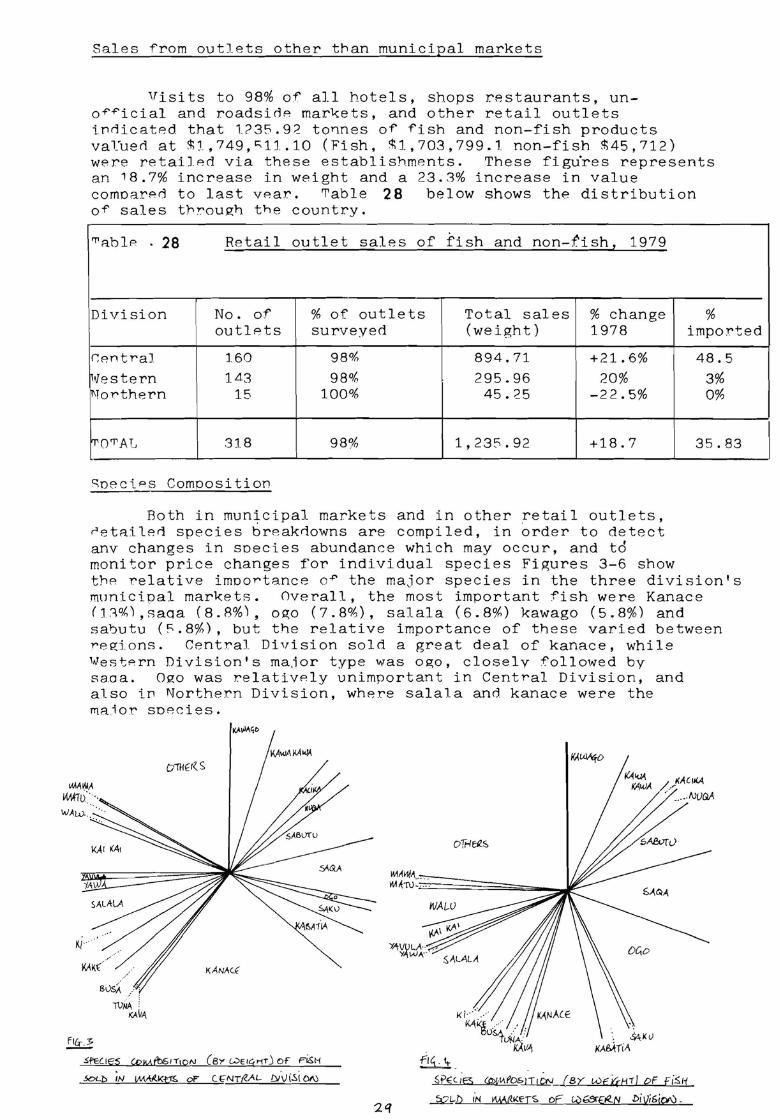
Visits to 98% of all hotels, shops restaurants, unOTTicial and roadside mar~ets, and other retail outlets inrlicated that 1.?35.92 tonnes of fish and non-fish products val'ueci at i1,749,i:;1:l.10 (Fish, i:J.,703,799.1. non-fish $45,712) were retailed via these establishments. These figu·res represents an 18.7% increase in weight and a 23.3% increase in value comoared to last vear. 'T'able 28 below shows the distribution of sales trr-ough the country.
,,.,able 28 Retail outlet sales of fish and non-fish 2 1979
Division No. of' % of outlets Total sales % change % outlets surveyed (weight) 1978 imported
r:entraJ 160 980,{, 894.71 +21.6%
~vestern 143 980,0 295.96 20% 11\Tor-thern 15 100°'6 45.25 -22.5%
'T'O'T'AT_, 318 98% 1,235.92 +18.7
~oecies Composition
Both in muntcipal markets and in other retail outlets, retailert species breakrtowns are compiled, in order to detect anv changes in species abundance which may occur, and to monitor price changes for individual species Figures 3-6 show
48.5
3% 0%
35.83
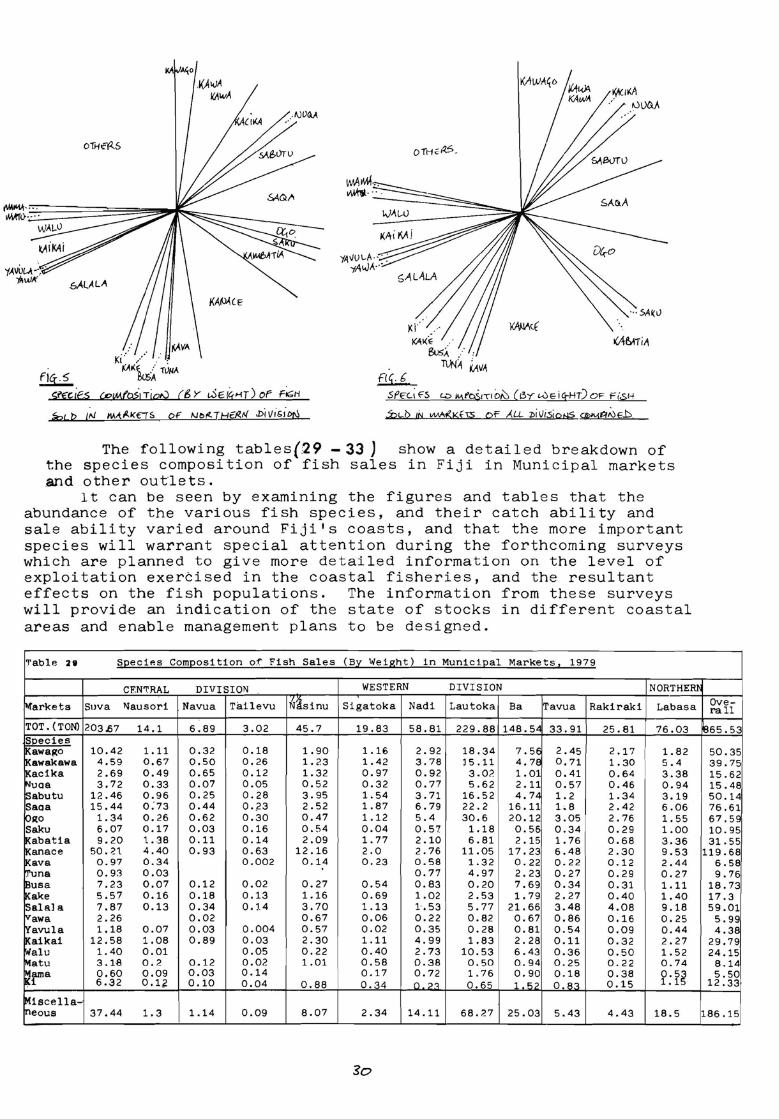
the relative imoor-tance o~ the major species in the three division's minicipal markets. Overall, the most important fish were Kanace (11%),saaa (8.8%), ogo (7.8%), salala (6.8%) kawago (5.8%) and sa~utu (S.8%), but the relative importance of these varied between regions. Central Division sold a great deal of kanace, while Western Division's ma~or type was o~o, closely ~allowed by saaa. Ogo was relatively unimportant in Central Division, and also in Northern Division, where salala and kanace were the ma.ior soecies.
~
80S~ /'
WNA ' KAVA.
KANII<.(
Sf'EC.IES Cp114r'b61T10N ( BY (..)Eff('1TJ OF A&li
SoLb iN l(IA-V.Kf'.§. oF C. P-IT(0L .D/v (Si OI\)
.fl4 . Ii- .
St'Ec,e; (a;,v"lf'Ob-1.I.!Qy_jBY W£k{:t11I OF fiS.1-{
__;QL-b 1N t\,\Af<KE'TS of c..y~£ii<..N l>iVi6iQN .
s,',lALlt
f!il $i'f:c:1fs
Ki : ,/ . · r:,ll(ki5~ TiJIIA
CDIM.fQS.1Tioi.J (gy t..)£/Ct>-tT)oF F;.;H £iL€__
sf1:c.; E=s = 1<1fci,1T1610 (13y w~iCi::HT) oF f'"i.sr--t
,i,L-b ,i, ~K(1s of' ALL :zii Vi.siof{S ®Mtl~E..b
The following tables(29 - 33 J show a detailed breakdown of the species composition of fish sales in Fiji in Municipal markets and other outlets.
lt can be seen by examining the figures and tables that the abundance of the various fish species, and their catch ability and sale ability varied around Fiji's coasts, and that the more important species will warrant special attention during the forthcoming surveys which are planned to give more detailed information on the level of exploitation exercised in the coastal fisheries, and the resultant effects on the fish populations. The information from these surveys will provid-e an indication of the state of stocks in different coastal areas and enable management plans to be designed.
Table 211 s2ecies Com2osition or Fish Sales (B:z: Weight) in Mun1c1Eal Markets 1 1979
CENTRAL DIVISION WESTERN DIVISION NORTHER~
t.farkets Suva Nausori Navua Tailevu N4sinu Sigatoka Nadi Lautoka Ba Tavua Rakiraki Labasa
TOT. (TON) 203 .57 14.1 6.89 3.02 45.7 19.83 58.81 229.88 148.54 33.91 25.81 76.03 Species Kawap:o 10.42 1.11 0.32 0.18 1.90 1.16 2.92 18,34 7.56 2.45 2.17 1.82 Kawakawa 4.59 0,67 0.50 0.26 1.23 1.42 3.78 15.11 4. 78 0.71 1.30 5.4 Kacika 2.69 0,49 0.65 0.12 1.32 0.97 0.92 3,0?. 1.01 0.41 0.64 3.38 ~uaa 3,72 0,33 0.07 0.05 0,52 0.32 0.77 5.62 2.11 0.57 0.46 0.94 ~abutu 12.46 0.96 0. 25 0.28 3.95 1.54 3.71 16.52 4. 74 1.2 1.34 3.19 Saaa 15.44 0.'73 0.44 o.n 2.52 1.87 6.79 22.2 16 .11 1.8 2.42 6.06 0p;o 1.34 0.26 0.62 0.30 0.47 1.12 5.4 30.6 20.12 3.05 2.76 1. 55 Saku 6.07 0.17 0.03 0.16 0.54 0.04 0.57 1.18 0.56 0.34 0.29 1.00 Kabatia 9.20 1.38 0.11 0.14 2.09 1. 77 2.10 6.81 2.15 1. 76 0.68 3.36 Kanace 50.21 4.40 0. 93 0.63 12.16 2.0 2.76 11.05 17.23 6.48 2.30 9.53 Kava 0.97 0.34 0.002 0.14 o. 23 0.58 1.32 0.22 0.22 0.12 2.44 '!'una 0. 93 0.03 0.77 4.97 2.23 0.27 0.29 0.27 Busa 7 .23 0.07 0.12 0.02 0.27 0.54 0.83 0.20 7.69 0.34 0.31 1.11 Kake 5.57 0.16 0.18 0.13 1.16 0.69 1.02 2.53 1.79 2.27 0.40 1.40 Salala 7.87 0.13 0.34 O. l.4 3.70 1.13 1.53 5.77 21,66 3.48 4.08 9.18 vawa 2.26 0.02 0.67 0.06 0.22 0.82 0.67 0.86 0.16 0.25 Yavula 1.18 0.07 0.03 0.004 0.57 0,02 0.35 0.28 0.81 0.54 0.09 0.44 Kaikai 12.58 1.08 0.89 0.03 2.30 1.11 4.99 1.83 2.28 0.11 0.32 2.27 Walu 1.40 0.01 0.05 0.22 0.40 2,73 10.53 6.43 0.36 0.50 1.52 t.fatu 3.HI 0.2 0.12 0.02 1.01 0.58 0.38 0.50 0. 94 0. 25 0. 22 0.74
irma 0.60 0.09 0.03 0.14 0.17 0.72 1. 76 0.90 0.18 0.38 0.53 6.32 o.1i 0.10 0.04 0.88 0.34 0 :><! 0.65 1 !i? 0.A'> 0.15 1.15
Miscella-neous 37.44 1.3 1.14 0.09 8.07 2.34 14.11 68 , 27 25 .03 5.43 4.43 18.5
so
Ove-rall
865.53
50.35 39.75 15.62 15.48 50.14 76.61 67.59 10.95 31.55
119. 68 6.58 9.76
18.73 17.3 59.01 5. 99 4.3€
29.79 24.15 8.14 5.50
12.33
186.15
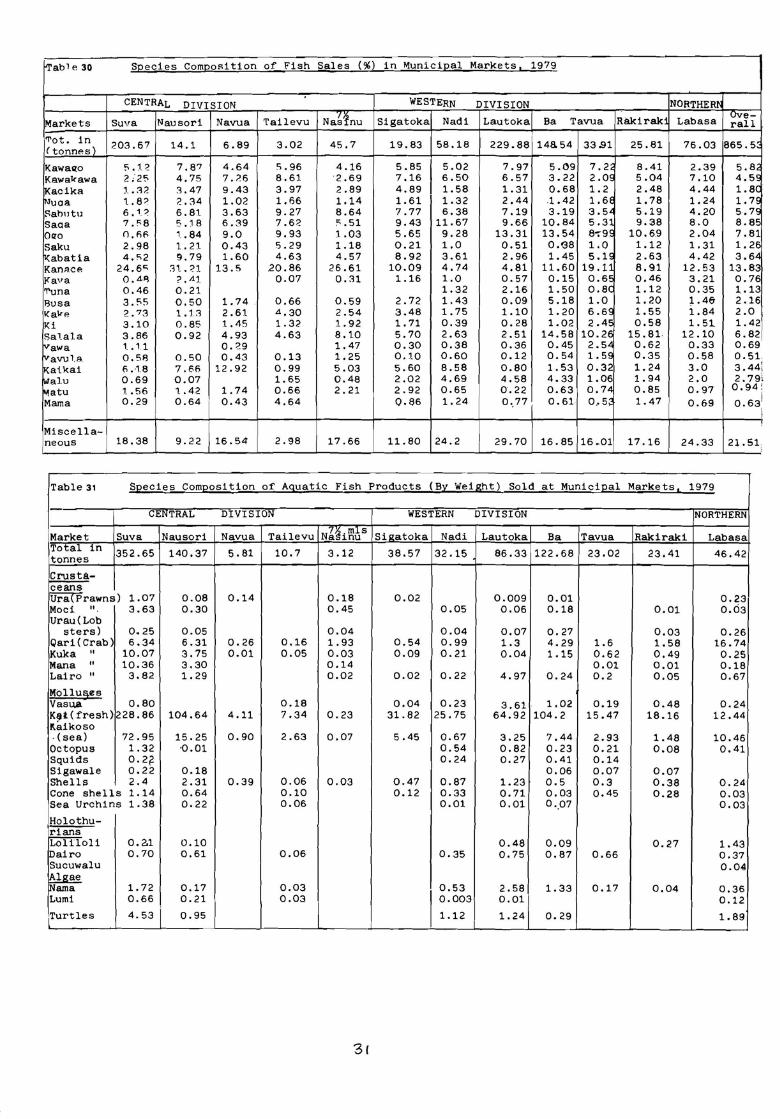
1-Tabl e 30 SE!ecies Com12osition of Fish Sales (%) in MuniciE!al Markets 1 1979
CENTRAL DIVISION WESTERN DIVISION NORTHER?i
Markets Suva Nausori Navua Tailevu Na~1nu Sigatoka Nadi Lautoka Ba Tavua Rakirakj Labasa vve-rall
'l'ot. in 203.67 14.1 6.89 3.02 45.7 19.83 58.18 229.88 148. 54 33 .91 25.81 76.03 865. 5, (tonnes)
Kawao:o 5.12 7,87 4.64 5.96 4.16 5.85 5.02 7.97 5 .09 7. 2. 8.41 2.39 5,82 Kawakawa 2,25 4.75 7 .'?.6 8.61 2.69 7.16 6.50 6.57 3.22 2,09 5.04 7.10 4. 5~ Kacika 1.::1?. ::l.47 9.43 3.97 2.89 4.89 1.58 1.31 0.68 1.2 2.48 4.44 1.8( Nuoa 1., 8? ?. .34 1.02 1.66 1.14 1.61 1.32 2.44 1.42 1.6€ 1. 78 1.24 1.7S Sab11tu 6, 1_ :> 6.81 3.63 9.27 8.64 7.77 6.38 7.19 3.19 3.5A 5.19 4.20 5.n Saaa 7 ."8 r:;. 18 6.39 7 .6'?. ,:; .51 9.43 11.67 9.66 10.84 5.31 9,38 0.0 8.85 Orm n. nf\ , .. 84 9.0 9.93 1.03 5,65 9.28 13.31 13.54 8-:-9I 10.6.9 2,04 7.81 Saku 2.98 1. 21 0.43 5.29 1.18 0.21 1.0 0.51 0.'(38 1.0 1.12 1.31 1.26 l(abatia 4.52 9. 79 1.60 4.63 4. 57 8.92 3.61 2.96 1.45 5.H 2.63 4.42 3.64 Kan1:i.ce 24.6c; ::11.. ?1 13.5 .20.86 26.61 10.09 4.74 4.81 11.60 19.11 8.91 12.53 13.83 J(ava O.Ml ?.Al 0.07 0.31 1.16 1.0 0.57 0.15 0.6~ 0,46 3.21 0.76 'l'una 0.46 0.21 1.32 2.16 1.50 0.8( 1.12 0.35 1.13 Busa 3.55 0.50 1. 74 0.66 0.59 2.72 1.43 0,09 5.18 1.0 1.20 1.46' 2.16 Kal<e 2.73 1 .1::1 2.61 A.30 2.54 3.48 1. 75 1.10 1.20 6 .6S 1.55 i.84 2.0
IJ<i 3.10 0.85 1.45 1.32 1.92 1.71 0,39 o. 28 1.02 2 .4~ 0.58 1.51 1.42 Sal.ala 3.86 0.92 4.93 4.63 8.10 5.70 2.63 2.51 14.58 10.26 15.81 12.10 6.82 lvawa 1. .11 0.29 1.47 0.30 0.38 0.36 0.45 2.5-'I 0.62 0.33 0.69 IVavula 0.5Fl 0.50 0.43 0.13 1.25 0.10 0.60 0.12 0.54 1. 59 0.35 0.58 0.51 l!<atkai 6 .·1.8 7.66 12.92 0. 99 5.03 5.60 8.58 0.80 1.53 0.32 1. 24 3.0 3.44\ ~alu 0.69 0.07 1.65 0.48 2.02 4.69 4.58 4.33 1.06 1.94 2.0 2. 79l Matu l.56 1.42 1. 74 0.66 2.21 2.92 0.65 0. 22 0.63 0,74 0.85 0.97 0.941
Mama 0. 29 0.64 0.43 4.64 Q.86 1. 24 o._77 0.61 o .. 5~ 1.47 0.69 0.63 1
I ' Miscella-
neous 18.38 9.22 16.54 2.98 17.66 11.80 24.2 29.70 16.85 16.01 17.16 24.33 2l.51
Table 31 SEecies ComEosition of Ag,uatic Fish Products (Bl Weisht) Sold at MuniciE!al Markets 1 1979
CENTRAL DIVISION WESTERN DIVISION NORTHERN
Market Suva Nausori Navua Tailevu Ni~1\!1GS Si2atoka Nadi Lautoka Ba Tavua Rakiraki Labasa Total in
352 . 65 140.37 5. 81 10.7 3 , 12 38.57 32.15 86.33 122.68 23 . 02 23.41 46 . 42 tonnes
Crusta-ceans rtir'a{prawns) 1.07 0.08 0.14 0 . 18 0 . 02 0 . 009 0 . 01 0 . 23 Moci " 3.63 0 . 30 0.45 0 . 05 0.06 0 . 18 0 . 01 0 , 03 Urau(Lob
s ters) 0 . 25 0.05 0 . 04 0 . 04 0 . 07 o. 27 0,03 0 . 26 Oari(Crab) 6.34 6.31 o. 26 0 , 16 1.93 0 . 54 0 . 99 1,3 4 . 29 1.6 1.58 16 . 74 Kuka " 10 . 07 3,75 0.01 0.05 0 . 03 0 . 09 o . 21 0.04 1.15 0 . 62 0 , 49 0 . 25 Mana " 10 , 36 3.30 0.14 0.01 0 , 01 0 . 18 Lairo " 3 . 82 1.29 0 . 02 0 . 02 o . 22 4.97 0. 24 0.2 0 , 05 0 , 67
Mollu!:ies Vasl.lJl 0.80 0 . 18 0 . 04 0.23 3 . 61 · 1 . 02 0.19 0 , 48 0 . 24 Ket<fresh) 228.86 104.64 4 . 11 7.34 0 . 23 31.82 25.75 64 . 92 104 . 2 15 . 47 18.16 12 . 44 11.aikoso • (sea) 72.95 15 , 25 0 . 90 2. 63 0.07 5 . 45 0.67 3.25 7.44 2 . 93 1.48 10 . 46 Octopus 1.32 ·0 . 01 0 . 54 0,82 0 . 23 0 . 21 0.08 0 . 41 Squids o.2F o. 24 0 . 27 0 . 41 0 . 14 Sigawale 0.22 0.18 0.06 0 . 07 0.07 Shells 2 . 4 2,31 0,39 0 . 06 0 . 03 0 . 47 0.87 1.23 0.5 0.3 0,38 0 . 24 Cone shells 1. 14 0 . 64 0 . 10 0.12 0,33 0.71 0 , 03 0,45 0 . 28 0 . 03 Sea Urchins 1.38 0.22 0 . 06 0 . 01 0.01 o ._o7 0,03
Holothu-rians Loliloli o. 2.1 0.10 0.48 0.09 0.27 1.43 Dairo 0. 70 0.61 0.06 0.35 0.75 0.87 0.66 0.37 Sucuwalu 0.0'4
~ ama 1.72 0.17 0.03
I 0,53 2.58 1.33 0.17 0.04 0.36
Lumi 0.66 0.21 0.03 0.003 0.01 0.12
Turtles 4.53 0.95 1.12 1.24 0.29 1.89
31
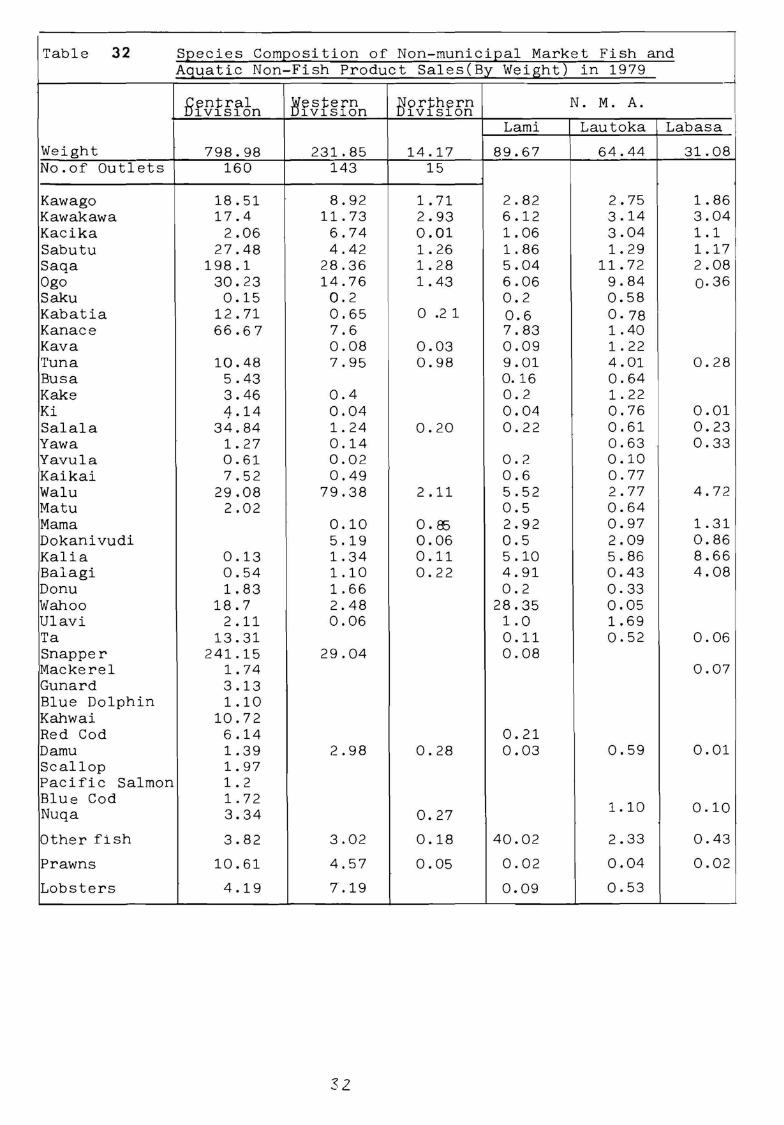
Table 32
Weight No.of Outlets
Kawago Kawakawa Kacika Sabutu Saqa Ogo Saku Kabatia Kanace Kava Tuna Busa Kake Ki Salala Yawa Yavula Kaikai Walu Matu Mama Dokanivudi Kalla Balagi Donu Wahoo Ulavi Ta Snapper Mackerel Gunard Blue Dolphin Kahwai Red Cod Damu Scallop Pacific Salmon Blue Cod Nuqa
Other fish
Prawns
Lobsters
Species Composition of Non-municipal Market Fish and Aquati~ Non-Fish Product Sales(By Weight) in 1979
Central D1v1s1on
Western Division
Northern Division
N. M. A.
Lami Lautoka Labasa
798.98 160
18.51 17.4
2.06 27.48
198.1 30.23
0 .15 12.71 66. 6 7
10.48 5.43 3.46 4 .14
34.84 1. 27 0.61 7.52
29.08 2.02
0 .13 0. 54 1. 83
18.7 2.11
13.31 241.15
1. 74 3 .13 1.10
10.72 6 .14 1.39 1. 97 1. 2 1. 72 3.34
3.82
10.61
4 .19
231.85 143
8.92 11.73
6.74 4.42
28.36 14.76 0.2 0.65 7.6 0.08 7.95
0.4 0.04 1. 24 0.14 0.02 0.49
79.38
0.10 5.19 1.34 1.10 1.66 2.48 0.06
29.04
2.98
3.02
4. 57
7.19
32
14.17 15
1. 71 2.93 0.01 1. 26 1. 28 1. 43
0 .2 1
0.03 0.98
0. 20
2.11
0. ffi 0.06 0.11 0.22
0. 28
0.27
0 .18
0.05
89.67
2.82 6.12 1.06 1.86 5.04 6.06 0.2 0.6 7.83 0.09 9.01 0.16 0.2 0.04 0.22
0.2 0.6 5.52 0.5 2.92 0.5 5.10 4.91 0.2
28.35 1.0 0.11 0.08
0.21 0.03
40.02
0.02
0.09
64.44
2.75 3.14 3.04 1. 29
11.72 9.84 0.58 0.78 1.40 1. 22 4.01 0.64 1. 22 0.76 0.61 0.63 0 .10 0.77 2.77 0.64 0.97 2.09 5.86 0.43 0.33 0.05 1.69 0.52
0.59
1.10
2.33
0.04
0.53
31.08
1. 86 3.04 1.1 1.17 2.08 o.36
0.28
0.01 0.23 0.33
4.72
1. 31 0.86 8.66 4.08
0.06
0.07
0.01
0.10
0.43
0.02
I
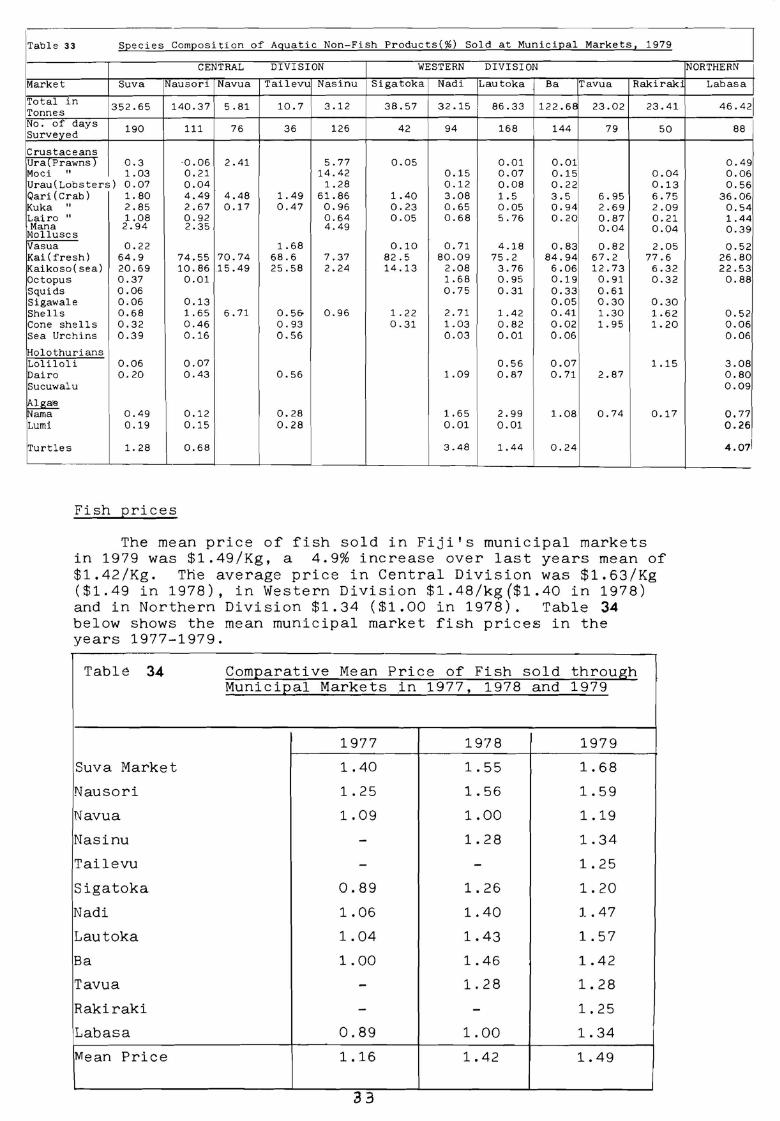
Table 33 Si:,ecies Comi:,osition of Aguatic Non-Fish Products(%) Sold at Municii:,al Markets, 1979
CENTRAL DIVISION WESTERN DIVISION
Market Suva Nausori Navua Tailevu Nasinu Sigatoka Nadi Lautoka Ba Tavua Rakiraki
Total in 352 .65 140.37 5.81 10.7 3.12 38.57 32.15 86.33 122.6E 23.02 23.41 Tonnes No. of days 190 111 76 36 126 42 94 168 144 79 50 Surveved
Crustaceans Ura(Prawns) 0.3 ·0.06 2.41 5.77 0.05 0.01 0.01 Moci II 1.03 0.21 14.42 0.15 0.07 0.15 0.04 Urau(Lobsters) 0.07 0.04 1.28 0.12 0.08 0.22 0.13 Qari(Crab) 1. 80 4.49 4.48 1. 49 61.86 1.40 3.08 1.5 3.5 6.95 6.75 Kuka II 2.85 2.67 0.17 0.47 0.96 0.23 0.65 0.05 0.94 2.69 2.09 Lairo II 1.08 0.92 0.64 0.05 0.68 5.76 0.20 0.87 0.21 Mana 2.94 2.35 4.49 0.04 0.04 Molluscs
Vasua 0.22 1.68 0.10 0.71 4.18 0.83 0.82 2.05 Kai(fresh) 64.9 74.55 70.74 68.6 7.37 82.5 80.09 75.2 84.94 67.2 77 .6 Kaikoso(sea) 20.69 10.86 15.49 25.58 2.24 14.13 2.08 3.76 6.06 12.73 6.32 Octopus 0.37 0.01 1.68 0.95 0.19 0.91 0.32 Squids 0.06 0.75 0.31 0.33 0.61 Sigawale 0.06 0.13 0.05 0.30 0.30 Shells 0.68 1.65 6.71 0. 5& 0.96 1. 22 2.71 1.42 0.41 1.30 1.62 Cone shells 0.32 0.46 0. 93 0.31 1.03 0.82 0.02 1. 95 1.20 Sea Urchins 0.39 0.16 0.56 0.03 0.01 0.06
!Holothurians Loliloli 0.06 0.07 0.56 0.07 1.15 Daire 0.20 0.43 0.56 1.09 0.87 0.71 2.87 Sucuwalu
~ ama 0.49 0.12 0.28 1.65 2.99 1.08 0.74 0.17 Lumi 0.19 0.15 0.28 0.01 0.01
Turtles 1.28 0.68 3.48 1.44 0.24
-
Fish prices
The mean price of fish sold in Fiji's municipal markets in 1979 was $1.49/Kg, a 4.9% increase over last years mean of $1.42/Kg. The average price in Central Division was $1.63/Kg ($1.49 in 1978), in Western Division $1.48/kg($1.40 in 1978) and in Northern Division $1.34 ($1.00 in 1978). Table 34 below shows the mean municipal market fish prices in the years 1977-1979.
Tabl~ 34 Comr2arative Mean Price of Fish sold through Municipal Markets in 1977, 1978 and 1979
1977 1978 1979
Suva Market 1.40 1. 55 1. 68
Nausori 1. 25 1. 56 1. 59
Navua 1.09 1.00 1.19
Nasinu - 1. 28 1.34
Tailevu - - 1. 25
Sigatoka 0.89 1.26 1. 20
Nadi 1.06 1.40 1.47
Lautoka 1.04 1.43 1.57
Ba 1.00 1.46 1.42
Tavua - 1.28 1. 28
Rakiraki - - 1. 25
Labasa 0.89 1.00 1. 34
Mean Price 1.16 1.42 1.49
33
NORTHERN
Lab as a
46. 421
88
0.49 0.06 0.56
36.06 0.54 1.44 0.39
o.52 26.80 22.53 0.88
0. 52 0.06 0.06
3.08 0.80 0.09
o. 77 0.26
4.07
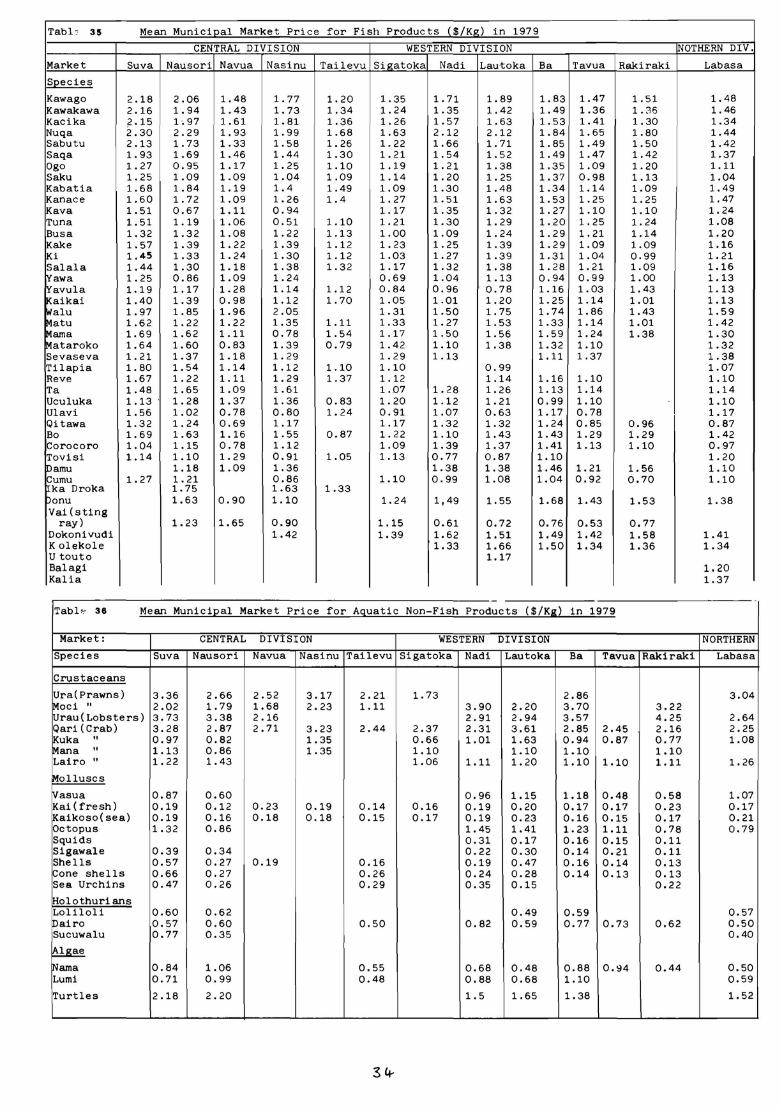
Tabl 0 35 Mean Municieal Market Price for Fish Products ($/Kg) in 1979
CENTRAL DIVISION WESTERN DIVISION NOTHERN DIV.
Market Suva Nausori Navua Nasinu Tailevu Sigatoka Nadi Lau-toka Ba Tavua Rakiraki Labasa
seecies
Kawago 2.18 2.06 1.48 1.77 1.20 1.35 1.71 1. 89 1. 83 1.47 1. 51 1.48 Kawakawa 2.16 1. 94 1.43 1.73 1.34 1. 24 1.35 1.42 1.49 1.36 1. 36 1.46 Kacika 2.15 1.97 1. 61 1.81 1.36 1. 26 1.57 1.63 1.53 1.41 1.30 1.34 Nuqa 2.30 2.29 1. 93 1. 99 1.68 1.63 2.12 2.12 1.84 1.65 1.80 1.44 Sabutu 2.13 1. 73 1.33 1.58 1. 26 1. 22 1.66 1. 71 1. 85 1.49 1.50 1.42 Saqa 1. 93 1.69 1.46 1.44 1.30 1. 21 1. 54 1. 52 1.49 1.47 1.42 1.37 Ogo 1. 27 0.95 1.17 1. 25 1.10 1.19 1.21 1.38 1.35 1.09 1.20 1.11 Saku 1. 25 1.09 1.09 1.04 1.09 1.14 1.20 1. 25 1.37 0.98 1.13 1.04 Kabatia 1.68 1.84 1.19 1.4 1.49 1.09 1.30 1.48 1.34 1.14 1.09 1.49 Kanace 1.60 1. 72 1.09 1.26 1.4 1. 27 1.51 1.63 1.53 1.25 1.25 1.47 Kava 1.51 0.67 1.11 0.94 1.17 1.35 1.32 1. 27 1.10 1.10 1.24 Tuna 1. 51 1.19 1.06 0.51 1.10 1.21 1.30 1. 29 1.20 1.25 1.24 1.08 Busa 1.32 1.32 1.08 1. 22 1.13 1.00 1.09 1. 24 1. 29 1.21 1.14 1.20 Kake 1.57 1.39 1. 22 1.39 1.12 1. 23 1.25 1.39 1.29 1.09 1.09 1.16 Ki 1.45 1.33 1.24 1.30 1.12 1.03 1.27 1.39 1.31 1.04 0.99 1.21 Salala 1.44 1.30 1.18 1.38 1. 32 1.17 1.32 1.38 1. 28 1. 21 1.09 1.16 Yawa 1. 25 0.86 1.09 1.24 0.69 1.04 1.13 0.94 0. 99 1.00 1.13 Yavula 1.19 1.17 1.28 1.14 1.12 0.84 0.96 0.78 1.16 1.03 1.43 1.13 Kaikai 1.40 1.39 0.98 1.12 1.70 1.05 1.01 1.20 1.25 1.14 1.01 1.13 Walu 1.97 1.85 1.96 2.05 1.31 1.50 1. 75 1.74 1.86 1.43 1.59 Matu 1.62 1. 22 1.22 1.35 1.11 1.33 1.27 1.53 1.33 1.14 1.01 1.42 ~ama 1.69 1.62 1.11 0.78 1. 54 1.17 1.50 1.56 1. 59 1.24 1.38 1.30 ~ataroko 1.64 1.60 0.83 1. 39 0.79 1.42 1.10 1.38 1.32 1.10 1.32 Sevaseva 1. 21 1.37 1.18 1.29 1. 29 1.13 1.11 1.37 1.38 Tilapia 1. 80 1. 54 1.14 1.12 1.10 1.10 0.99 1.07 Reve 1.67 1.22 1.11 1. 29 1.37 1.12 1.14 1.16 1.10 1.10 Ta 1.48 1.65 1.09 1.61 1.07 1. 28 1. 26 1.13 1.14 1.14 Uculuka 1.13 1. 28 1.37 1.36 0.83 1. 20 1.12 1.21 0.99 1.10 1.10 Ulavi 1.56 1.02 0.78 0.80 1.24 0.91 1.07 0.63 1.17 0.78 1.17 Qi tawa 1. 32 1. 24 0.69 1.17 1.17 1.32 1.32 1.24 0.85 0.96 0.87 Bo 1. 69 1.63 1.16 1.55 0.87 1. 22 1.10 1.43 1.43 1.29 1.29 1.42 Corocoro 1.04 1.15 0.78 1.12 1.09 1.39 1.37 1.41 1.13 1.10 0.97 Tovisi 1.14 1.10 1.29 0.91 1.05 1.13 0.77 0.87 1.10 1. 20 Damu 1.18 1.09 1.36 1.38 1.38 1.46 1.21 1.56 1.10 Cumu 1.27 1.21 0.86 1.10 0.99 1.08 1.04 0.92 0.70 1.10 ka Droka 1.75 1.63 1.33
Donu 1.63 0.90 1.10 1.24 1,49 1.55 1.68 1.43 1.53 1.38 Vai (sting
ray) 1.23 1.65 0.90 1.15 0.61 0.72 0.76 0.53 0.77 Dokonivudi 1.42 1.39 1. 62 1.51 1.49 1.42 1.58 1.41 K olekole 1.33 1.66 1.50 1.34 1.36 1.34 U touto 1.17 Balagi 1.20 Kalia 1.37
Tabl -,. 3 8 Mean Municieal Market Price for Agua ti c No n - Fish Products ($/Kg~ in 1979
Market : CENTRAL DIVISION WESTERN DI VISION NORTHERN
Spec ies Suva Nauso ri Navua Nasinu Tailevu S i gatoka Nadi Lautoka Ba Tavua Rakiraki Labasa
Crustaceans
Ur a(Prawns) 3.36 2 . 66 2. 52 3.17 2 . 2 1 1. 73 2 .86 3.04 Moci " 2 .02 1. 79 1.68 2,23 1.11 3 . 90 2 .20 3 . 70 3.22 Urau(Lobsters) 3.73 3 . 38 2. 16 2 . 91 2. 94 3 . 57 4 . 25 2 .64 Qari (Crab) 3 .2 8 2 .87 2 .71 3 . 23 2 . 44 2 .37 2.3 1 3 . 61 2 . 85 2.45 2 .1 6 2 .25 Kuka " 0 . 97 0 . 82 1.35 0.66 1.01 1.63 0.94 0 . 87 0.17 1.08 Mana " 1.13 0 . 86 1.35 1.10 1.10 1.10 1.10 Lai r o" 1. 2 2 1.43 1.06 1.11 1.20 1. 10 1.10 1.11 1. 26
Molluscs
IVasua 0 . 87 0 . 60 0 .96 1.15 1.18 0 . 48 0 . 58 1.07 Kai(fresh) 0.19 0 . 1 2 0 . 23 0 . 19 0 . 14 0 . 16 0 . 19 0.20 0 . 17 0 . 17 0 . 23 0.1 7 Kaikoso(sea) 0 . 19 0.16 0.18 0 . 18 0 . 15 0 . 17 0.19 0 . 23 0.16 0 .1 5 0 . 17 0 . 21 Octopus 1.32 0.86 1.45 1.41 1.23 1.11 0 . 78 0 . 79 Squids 0 . 31 0 . 17 0.16 0 . 15 0 . 11 Sigawale 0 . 39 0 . 34 0 . 22 0 . 30 0,14 0.21 0 . 11 Shells 0 . 57 0.27 0.19 0.16 0 . 19 0.47 0 . 16 0.14 0 . 13 Cone shells 0.66 0. 2 7 0 .2 6 0 . 24 0.28 0 , 14 0 . 13 0.13 Sea Urchins 0 .47 0 .2 6 0. 29 0.35 0 . 15 0 . 2 2
Holothurians Loliloli 0 . 60 0 . 62 0 . 49 0.59 0.57 OC>airo 0.57 0.60 o. 50 0 . 82 0 . 59 0 .7 7 0,73 0 . 62 0.50 Su cuwalu 0 . 77 0 . 35 0 . 40
~
~ama 0 . 84 1.06 0.55 0 . 68 0 . 48 0 . 88 0 , 94 0.44 0 . 50 Lumi 0 . 71 0 . 99 0 . 48 0.88 0.68 1.10 0 . 59
Turtles 2. 18 2 . 20 1. 5 1.65 1.38 1.52
34-
Of the different products sold, crabs, lobsters and prawns ~enerally fetched the highest retail prices in all areas surveyed. The highest priced fish were generallv Kawago, walu kawakawa, nuqa and sabutu. Tables 35 and 36 and show retail prices by market of all species of f~sh and non fish sold in Fiji's markets in 1979.
iii) Subsistence Fishery Survey
Introduction:
Prior to the commencement ~f the Subsistence Fishery Survey in July 1978 very little was known of the scope and magnitude of subsistence fishing activities in Fiji. Subsistence fishing is an important aspect of the socioeconomics of many village communities in the Pacific, but receives relatively little attention because it does not contribute directly to the economy in terms of a measurable cash flow. The main aims of Phase I of the survey were:
a)
b)
C)
Methods:
to improve the accuracy of previous estimates of Fiji's national annual fish catch
to obtain an indication of recent trends in subsistence catch and effort
to obtain some idea of the relative importance of scale fish, crustaceans, molluscs, and other edible marine organisms to the subsistence Fishery.
A list of Fijian villages was initially compiled with the assistance of the Bureau of Census and Statistics. The list included the number of households and the total population of each village and the villages were grouped according to Tikina, Province and Division. With the aid of charts and maps, the villages were then classified as 'coastal or inland'. A sample of approximately 10% of the coastal villages in each province was then selected (using a table of random numbers) for investigation by interview.
Letters were sent to all District Commissioners, Agricultural Officers and District Officers whose administrative areas included any of the survey villages. The letters were accompanied by a list of the villages to be visited, with timetabled dates for the interviews, and copies of a Fijian translation of the phase 1 questionnaire form for distribution to the appropriate Roko Tui's and villages. Information was then gathered by Fisheries personnel who visited each survey village, and by interviewing the Roko or other village spokesman, completed the standard form supplied for the purpose.
Because of financial restrictions and transport problems the original deadline fo~ completion of phase I, which was late 1978, had to be extended, as by that time only 40 of the 62 selected villages had been visited. Subsequently the rest of the survey was carried out, being completed in 1979.
35
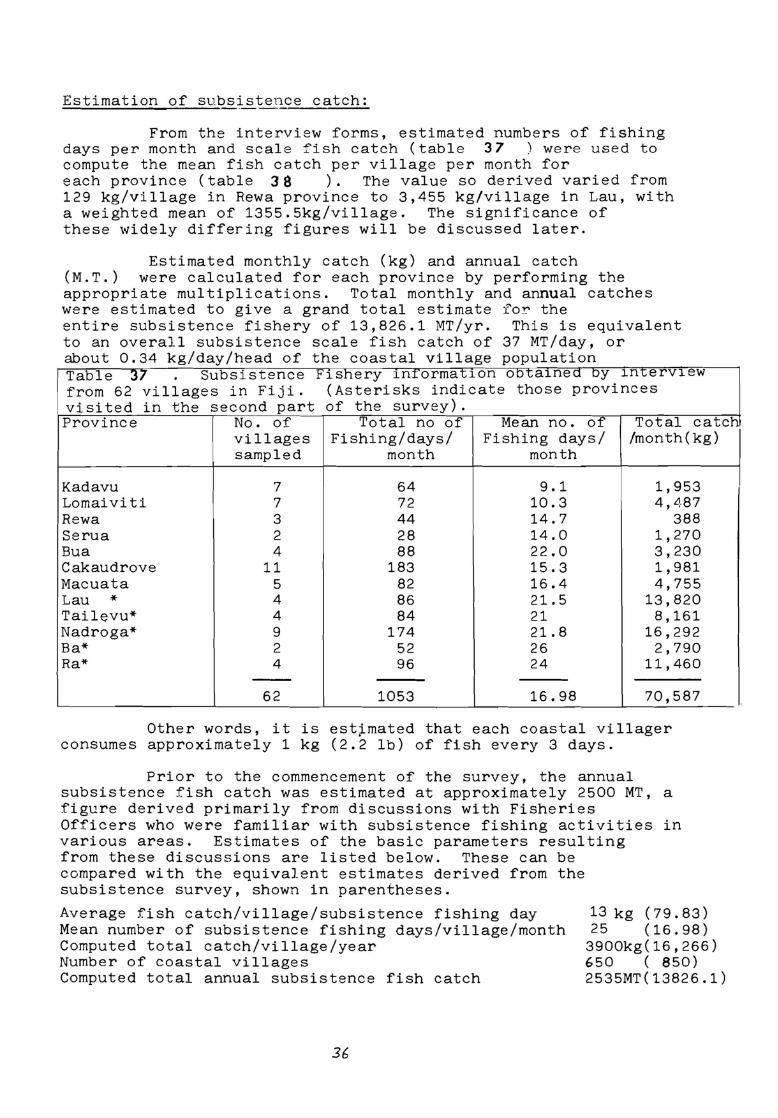
Estimation of subsistence catch:
From the interview forms, estimated numbers of fishing days per month and scale fish catch (table 37 ) were used to compute the mean fish catch per village per month for each province ( table 3 8 ) . The value so derived varied from 129 kg/village in Rewa province to 3,455 kg/village in Lau, with a weighted mean of 1355.5kg/village. The significance of these widely differing figures will be discussed later.
Estimated monthly catch (kg) and annual catch (M.T.) were calculated for each province by performing the appropriate multiplications. Total monthly and annual catches were estimated to give a grand total estimate fo~ the entire subsistence fishery of 13,826.1 MT/yr. This is equivalent to an overall subsistence scale fish catch of 37 MT/day, or about 0.34 kg/day/head of the coastal village population Table 37 Subsistence Fishery 1n1·ormat1on ootainea oy in-c;erview from 62 villages in Fiji. (Asterisks indicate those provinces visited in the second part of the survey). Province No. of Total no of Mean no. of Total catch
villages Fishing/days/ Fishing days/ /month(kg) sampled month month
Kadavu 7 64 9.1 1,953 Lomaiviti 7 72 10.3 4, ,'.!,87 Rewa 3 44 14.7 388 Serua 2 28 14.0 1,270 Bua 4 88 22.0 3,230 Cakaudrove 11 183 15.3 1,981 Macuata 5 82 16.4 4,755 Lau * 4 86 21. 5 13,820 Tailevu* 4 84 21 8,161 Nadroga* 9 174 21. 8 16,292 Ba* 2 52 26 2,790 Ra* 4 96 24 11,460
--62 1053 16.98 70,587
Other words, it is estimated that each coastal villager consumes approximately 1 kg (2.2 lb) of fish every 3 days.
Prior to the commencement of the survey, the annual subsistence fish catch was estimated at approximately 2500 MT, a figure derived primarily from discussions with Fisheries Officers who were familiar with subsistence fishing activities in various areas. Estimates of the basic parameters resulting from these discussions are listed below. These can be compared with the equivalent estimates derived from the subsistence survey, shown in parentheses.
Average fish catch/village/subsistence fishing day Mean number of subsistence fishing days/village/month Computed total catch/village/year Number of coastal villages Computed total annual subsistence fish catch
36
13 kg (79.83) 25 (16.98)
3900kg(16,266) 650 ( 850) 2535MT(13826.1)
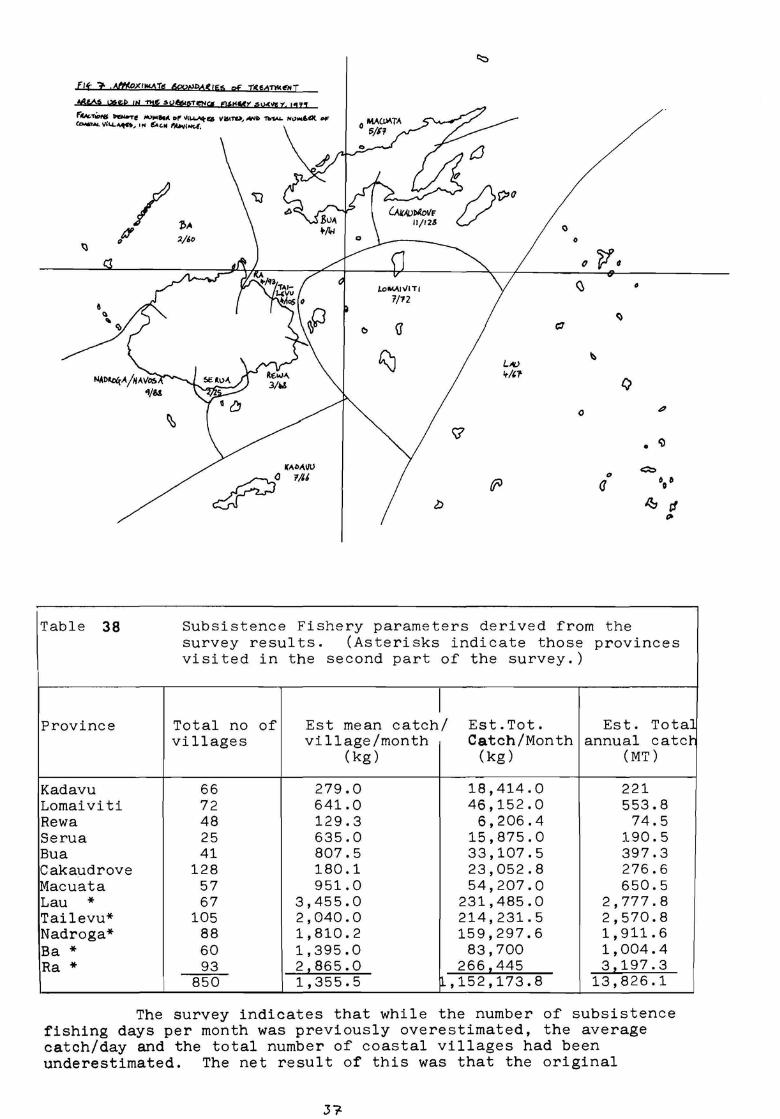
flt J': Affl(oXIMAT¢ 6Pw,IP,4,(1g:s pf !CMTIICe-NT
AAW iaecP: IN -nt§ .s965.15-re,,g flf .. Mr'. .su.cY1:r1 11'!1 f"w.,...,,. ~e .....,~ ..... Df" \IU.4..AtQ, Vl61TI.>., ANI) 1Wl,,,U.. H"11lCf.A o,F CDwiW,T ..... v,u........-,.. IN' e::.c..,. ,MV,NC.l.
0
()
(! c:,
~ L1'tJ ,,.;,-,.
0
Q P', ~ 0
~
~
Q
0 ,fl
• Ci)
0 <::::::>
(J 00 0
~ d "'
Table 38 Subsistence Fishery parameters derived from the survey results. (Asterisks indicate those provinces visited in the second part of the survey.)
I Province Total no of Est mean catch/ Est.Tot. Est. Tota]
villages village/month Catch/Month annual cater (kg) (kg) (MT)
Kadavu 66 279.0 18,414.0 221 Lomaiviti 72 641.0 46,152.0 553.8 Rewa 48 129.3 6,206.4 74.5 Serua 25 635.0 15,875.0 190.5 Bua 41 807.5 33,107.5 397.3 Cakaudrove 128 180.1 23,052.8 276.6 Macuata 57 951.0 54,207.0 650.5 Lau * 67 3,455.0 231,485.0 2,777.8 Tailevu* 105 2,040.0 214,231.5 2,570.8 Nadroga* 88 1,810.2 159,297.6 1,911.6 Ba * 60 1,395.0 83,700 1,004.4 Ra* 93 2 1 865.0 266 1 445 3 1 197.3
850 1,355.5 11,152,173.8 13,826.1
The survey indicates that while the number of subsistence fishing days per month was previously overestimated, the average catch/day and the total number of coastal villages had been underestimated. The net result of this was that the original
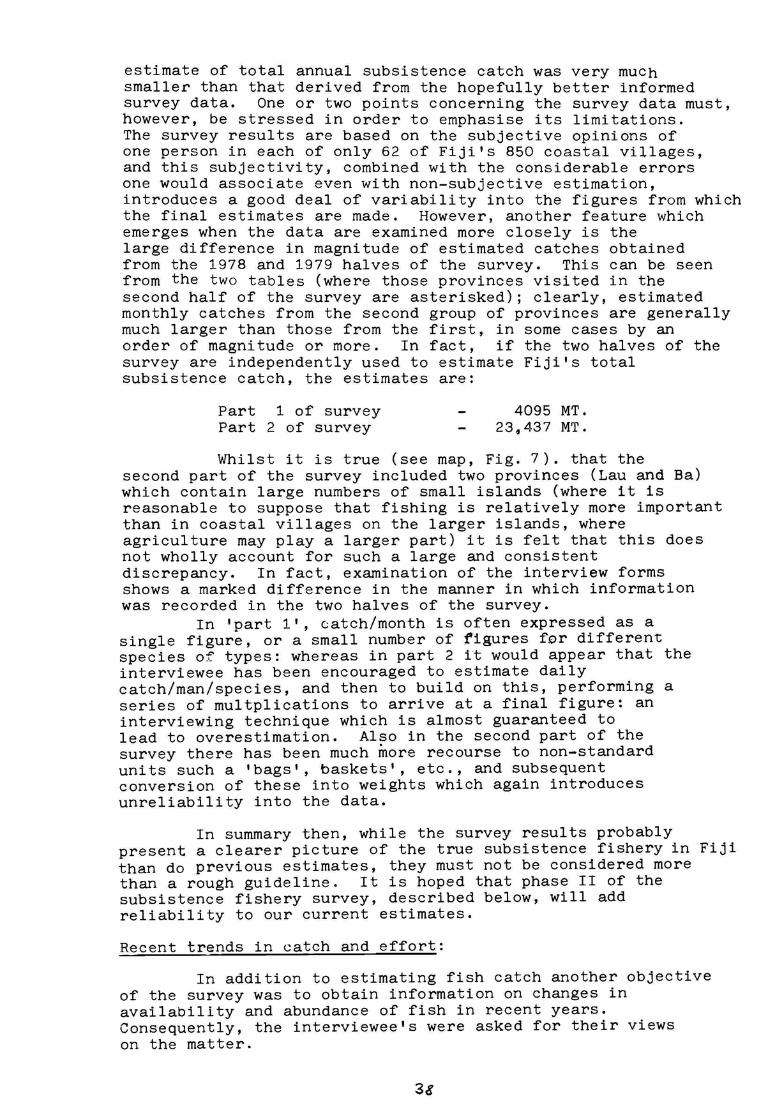
estimate of total annual subsistence catch was very much smaller than that derived from the hopefully better informed survey data. One or two points concerning the survey data must, however, be stressed in order to emphasise its limitations. The survey results are based on the subjective opinions of one person in each of only 62 of Fiji's 850 coastal villages, and this subjectivity, combined with the considerable errors one would associate even with non-subjective estimation, introduces a good deal of variability into the figures from which the final estimates are made. However, another feature which emerges when the data are examined more closely is the large difference in magnitude of estimated catches obtained from the 1978 and 1979 halves of the survey. This can be seen from the two tables (where those provinces visited in the second half of the survey are asterisked); clearly, estimated monthly catches from the second group of provinces are generally much larger than those from the first, in some cases by an order of magnitude or more. In fact, if the two halves of the survey are independently used to estimate Fiji's total subsistence catch, the estimates are:
Part 1 of survey Part 2 of survey
4095 MT. 23.,437 MT.
Whilst it is true (see map, Fig. 7). that the second part of the survey included two provinces (Lau and Ba) which contain large numbers of small islands (where it is reasonable to suppose that fishing is relatively more important than in coastal villages on the larger islands, where agriculture may play a larger part) it is felt that this does not wholly account for such a large and consistent discrepancy. In fact, examination of the interview forms shows a marked difference in the manner in which information was recorded in the two halves of the survey.
In 'part 1', catch/month is often expressed as a single figure, or a small number of ;figures for different species of types: whereas in part 2 it would appear that the interviewee has been encouraged to estimate daily catch/man/species, and then to build on this, performing a series of multplications to arrive at a final figure: an interviewing technique which is almost guaranteed to lead to overestimation. Also in the second part of the survey there has been much more recourse to non-standard units such a 'bags', baskets', etc., and subsequent conversion of these into weights which again introduces unreliability into the data.
In summary then, while the survey results probably present a clearer picture of the true subsistence fishery in Fiji than do previous estimates, they must not be considered more than a rough guideline. It is hoped that phase II of the subsistence fishery survey, described below, will add reliability to our current estimates.
Recent trends in catch and effort:
In addition to estimating fish catch another objective of the survey was to obtain information on changes in availability and abundance of fish in recent years. Consequently, the interviewee's were asked for their views on the matter.
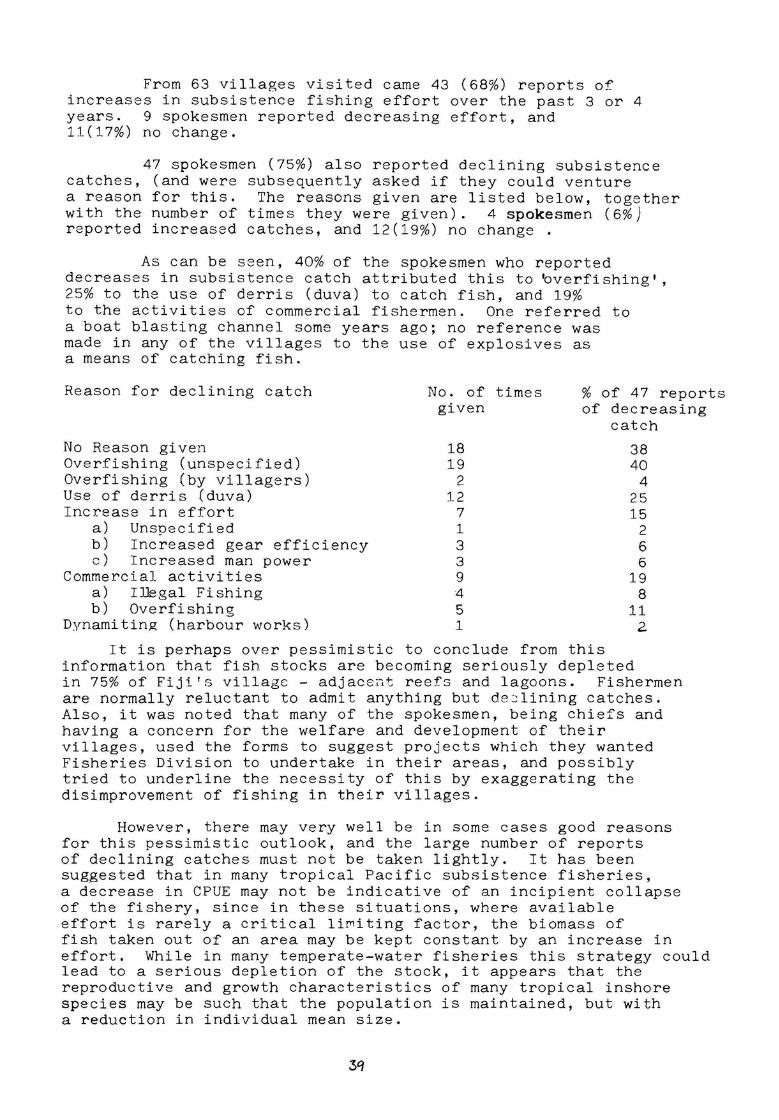
From 63 villages visited came 43 (68%) reports of increases in subsistence fishing effort over the past 3 or 4 years. 9 spokesmen reported decreasing effort, and 11(17%) no change.
47 spokesmen (75%) also reported declining subsistence catches, (and were subsequently asked if they could venture a reason for this. The reasons given are listed below, together with the number of times they were given). 4 spokesmen (6%) reported increased catches, and 12(19%) no change .
As can be seen, 40% of the spokesmen who reported decreases in subsistence catch attributed this to bverfishing', 25% to the use of derris (duva) to catch fish, and 19% to the activities of commercial fishermen. One referred to a boat blasting channel some years ago; no reference was made in any of the villages to the use of explosives as a means of catching fish.
Reason for declining catch No. of times given
% of 47 reports of decreasing
catch
No Reason given Overfishing (unspecified) Overfishing (by villagers) Use of derris (duva) Increase in effort
a) Unspecified b) Increased gear efficiency c) Increased man power
Commercial activities a) IJJegal Fishing b) Overfishing
Dynamiting (harbour works)
18 19
2 12
7 1 3 3 9 4 5 1
38 40
4 25 15
2 6 6
19 8
11 2.
It is perhaps over pessimistic to conclude from this information that fish stocks are becoming seriously depleted in 75% of Fiji's village - adjacent reefs and lagoons. Fishermen are normally reluctant to admit anything but de~lining catches. Also, it was noted that many of the spokesmen, being chiefs and having a concern for the welfare and development of their villages, used the forms to suggest projects which they wanted Fisheries Division to undertake in their areas, and possibly tried to underline the necessity of this by exaggerating the disimprovement of fishing in their villages.
However, there may very well be in some cases good reasons for this pessimistic outlook, and the large number of reports of declining catches must not be taken lightly. It has been suggested that in many tropical Pacific subsistence fisheries, a decrease in CPUE may not be indicative of an incipient collapse of the fishery, since in these situations, where available effort is rarely a critical li~iting factor, the biomass of fish taken out of an area may be kept constant by an increase in effort. While in many temperate-water fisheries this strategy could lead to a serious depletion of the stock, it appears that the reproductive and growth characteristics of many tropical inshore species may be such that the population is maintained, but with a reduction in individual mean size.
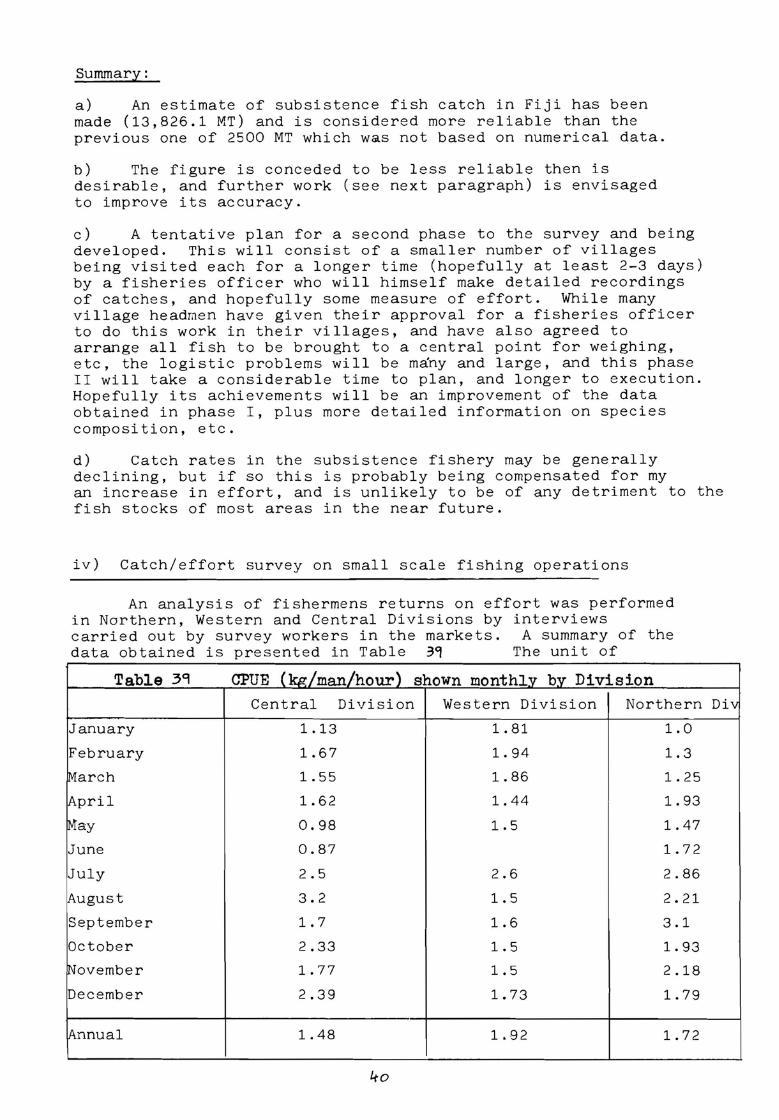
Summary:
a) An estimate of subsistence fish catch in Fiji has been made (13,826.1 MT) and is considered more reliable than the previous one of 2500 MT which was not based on numerical data.
b) The figure is conceded to be less reliable then is desirable, and further work (see next paragraph) is envisaged to improve its accuracy.
c) A tentative plan for a second phase to the survey and being developed. This will consist of a smaller number of villages being visited each for a longer time (hopefully at least 2-3 days) by a fisheries officer who will himself make detailed recordings of catches, and hopefully some measure of effort. While many village headmen have given their approval for a fisheries officer to do this work in their villages, and have also agreed to arrange all fish to be brought to a central point for weighing, etc, the logistic problems will be many and large, and this phase II will take a considerable time to plan, and longer to execution. Hopefully its achievements will be an improvement of the data obtained in phase I, plus more detailed information on species composition, etc.
d) Catch rates in the subsistence fishery may be generally declining, but if so this is probably being compensated for my an increase in effort, and is unlikely to be of any detriment to the fish stocks of most areas in the near future.
iv) Catch/effort survey on small scale fishing operations
An analysis of fishermens returns on effort was performed in Northern, Western and Central Divisions by interviews carried out by survey workers in the markets. A summary of the data obtained is presented in Table 39 The unit of
Table 39 CPUE (kn/man/hour) shown monthlv bv Division Central Division Western Division Northern
January 1.13 1. 81 1.0
February 1.67 1. 94 1.3
!March 1.55 1. 86 1. 25
!April 1.62 1. 44 1. 93
!May 0.98 1.5 1. 47
June 0.87 1. 72
July 2.5 2.6 2.86
\August 3.2 1. 5 2.21
September 1. 7 1.6 3.1
October 2.33 1. 5 1. 93
!November 1. 77 1.5 2.18
December 2.39 1. 73 1. 79
Annual 1. 48 1. 92 1. 72
I.to
Db

effort used is the man-hour: catch can be seen to vary ftom 1.48 to 1.92Kg/man hour. Monthly changes in catch per man hour can be seen to vary in a fairly irregular way. There is, however, a slight suggestion of a peak during the third quarter of the year in all 3 areas, but particularly in Northern division. There is no obvious reason why this sh~uld be so, artd it is probably due to ordinary sampling variation.
It is hoped, in the coming year to concentrate more of the market survey time into these catch/effort statisticsf and to make more detailed records of the interviewees catch at the market. This will lead to a better knowledge of the intensity of fishing in different mataqali areas and of the state of the stocks within them, and will in turn enable the Division to evaluate its licensing policy.
4-1
SPECIALIST SURVEYS
MUCH MATERIAL PRESENTED IN THE SECTION ENTITLED
SPECIALIST SURVEYS IS INTENDED FOR FUTURE
PUBLICATION, AND MAY NOT BE CITED OR USED IN
ANY ARTICLE OR PUBLICATION WITHOUT THE PRIOR
WRITTEN CONSENT OF THE CHIEF FISHERIES OFFICER.
42
b) Specialist surveys
i) Baitfish resource assessment
Introduction
During 1979, expansion of the Ika corporation fleet to the present 10 veBsels has resulted in baitfish stocks assuming a greater importance than previously. All Ika corporation vessels are pole-and-line boats, and rely on adequate supplies of live bait to stimulate the necessary feeding behaviour which results in the tuna's biting. The bait is usually captured at night in shallow coastal waters using the Japanese stick-held dip-net or bouke-ami- (although beach seines have been occasionally used) and consists mainly of very small fish, large numbers of which are juveniles. The bait are attracted to the vicinity of the boat by submerged and overhead lights, and by the same means lured over the nets, whi~h are then raised. Bait is scooped from the nets in a bucket and transferred to live-bait containers on deck ready for use in fishing. Because of the rate of use of the bait, and also the mortality which occurs in the bait tanks, most vessels find it necessary to catch bait nightly, or at least on alternate nights, when fishing. It is therefore clear that the tuna boats place absolute reliance on the availability of adequate supplies of bait, and for this reason Fisheries Division closely monitors changes in abundance of baitfish with a view to aiding the Ika Corporation in its activities.
The Divisions main supplier of information is the tuna fleet itself: standard data return forms are supplied to skippers, who are requested to fill in details of catch, effort, location, and estimated species composition. However, there are a number of disadvantages to such a system, not least the understandable reluctance of skippers of commercial vessels to bother themselves with form-filling. Daily data returns are usually accummulated and returned at the end of each month, although in some instances several months delay has occurred, and occasionally data fails to materialise altogether. (For this reason complete information for 1979 is not yet available, and so for the purposes of this report, analysis of information is performed on the basis of tuna fishing seasons - usually October to July or August rather than on calendar years. It should be noted therefore that the 1979 season actually commenced in September 1978).
Another problem is that baitfish catch data is based on non-standard units (buckets), which themselves are estimated rather than counted. Estimation is a necessary procedure as the contents of bucket are very variable. The data recorde~ on board the veasclscorrects as closely as possible for variations in bucket contents, and expresses totals as "standard" buckets: last year a standard bucket was found to contain approximately 1.8Kg of fish. In the following report, however, data is presented in terms of buckets rather than weight.
Table '-t-0 shows annual statistics of catch and effort for the 1976-1979 fishing seasons. (It must be noted that as information for the 1976 season commences in January, the data is incomplete, and absolute values for catch and effort are not comparable with those of other seasons, although the ratios (sets/night and catch/set) are.)
lt-3
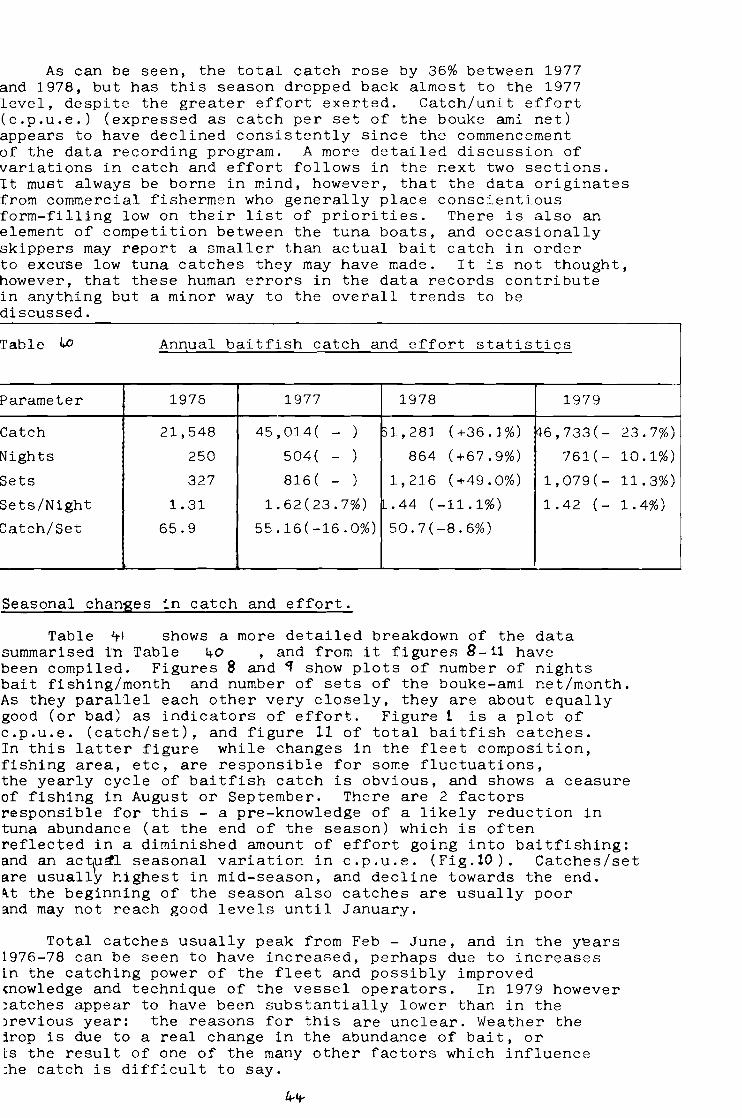
As can be seen, the total catch rose by 36% between 1977 and 1978, but has this season dropped back almost to the 1977 level, despite the greater effort exerted. Catch/unit effort (c.p.u.e.) (expressed as catch per set of the bouke ami net) appears to have declined consistently since the commencement of the data recording program. A more detailed discussion of variations in catch and effort follows in the next two sections. It must always be borne in mind, however, that the data originates from commercial fishermen who generally place conscientious form-filling low on their list of priorities. There is also an element of competition between the tuna boats, and occasionally skippers may report a smaller than actual bait catch in order to excuse low tuna catches they may have made. It is not thought, however, that these human errors in the data records contribute in anything but a minor way to the overall trends to be discussed.
Table l,.o Annual baitfish catch and effort statistics
Parameter 1975 1977 1978 1979
Catch 21,548 45,014( - ) 31,281 (+36.1%) i6,733(- 23.7%)
Nights 250 504( - ) 864 (+67.9%) 761(- 10.1%)
Sets 327 816( - ) 1,216 (+49.0%) 1,079(- 11. 3%)
Sets/Night 1.31 1.62(23.7%) .44 (-11.1%) 1.42 (- 1.4%)
Catch/Set 65.9 55.16(-16.0%) 50.7(-8.6%)
Seasonal changes in catch and effort.
Table ~I shows a more detailed breakdown of the data summarised in Table 40 , and from it figures B- 11 have been compiled. Figures 8 and~ show plots of number of nights bait fishing/month and number of sets of the bouke-ami net/month. As they parallel each other very closely, they are about equally good ( or bad) as indicators of effort. Figure 1 is a plot of c.p.u.e. (catch/set), and figure 11 of total baitfish catches. In this latter figure while changes in the fleet composition, fishing area, etc, are responsible for some fluctuations, the yearly cycle of baitfish catch is obvious, and shows a ceasure of fishing in August or September. There are 2 factors responsible for this - a pre-knowledge of a likely reduction in tuna abundance (at the end of the season) which is often reflected in a diminished amount of effort going into baitfishing: and an ac~f~l seasonal variation in c.p.u.e. (Fig.10). Catches/set are usually highest in mid-season, and decline towards the end. ~t the beginning of the season also catches are usually poor and may not reach good levels until January.
Total catches usually peak from Feb - June, and in the y~ars 1976-78 can be seen to have increased, perhaps due to increases ln the catching power of the fleet and possibly improved mowledge and technique of the vessel operators. In 1979 however )atches appear to have been substantially lower than in the ,revious year: the reasons for this are unclear. Weather the irop is due to a real change in the abundance of bait, or ls the result of one of the many other factors which influence :he catch is difficult to say.
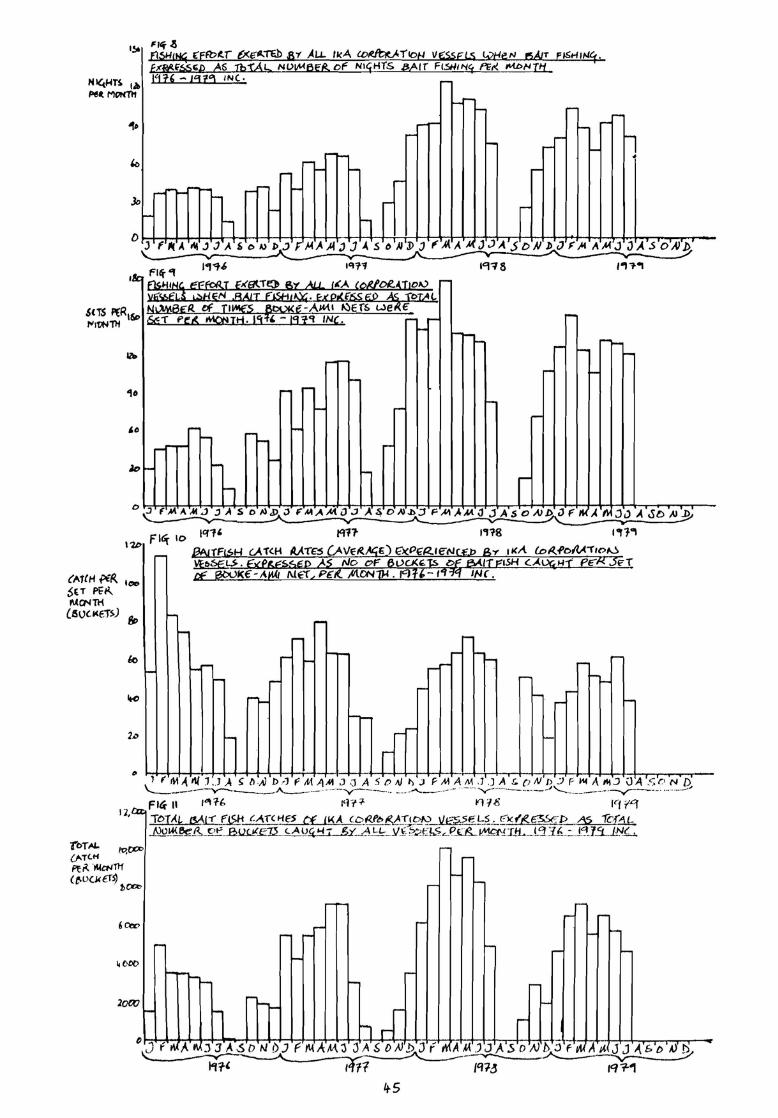
f)~i-11~ £'E~~, t'XE:'il.ieb ,5'1' .AU. ll<A w~,A,ftot:!_. Vf;~EI..S ~t:ie,N 156/T ,}('~f~1.~ ~s 1h!A6. NOI.M6fB. of N1~1-ffs ~If F1.sH11'1~ rr:~ MbNTH
flSf-f lN!:f,
lj:t, - l~l~ INC.. ---- - --- ,_ -- - -
I- - ------ - --- -,...- ..... -~ - --- -D '
--~ 7
J f II( A 1\1 j J .A 1 S e,,., b-' ~.AAJJ~So~~J,~.AMJ~ASDNbJF~A~JASO~b \.. -- - - - - - -1"'178 l"'lr ..
---- - --- ... -...
- -,o - -....... - -k> -
n l i l"U> Fl~ 10
BAJIFl~H v\t<H Ai(TE:$ (.AVe1Vt;E) f"><.P€"R.1€"N(£2 ,s-,, 11<A loll._~oM-r,010
(M{H f'iR '""' sn Pi:"-. M~TH
(l5UC.i<€TS) f,p
2oro
-
-
-
-
~L,S. f:1d~~S.:::zf:~ ~~ NO OF ~l>CJ<'-~ bF B,(/ff:'.!SH (.A~Mt Ee'I<. Je,T a: @t.>11:£-~ /\tE:'G Pel{ ADNW. 1<1U- 1-B<t INC.
----
--.....
- ---·-
---
--- -
-- --
--- - - -I- ---- - --- ..... r-- I-
---- ,.....
r -
-- ---- -
-- --
-~ rirf r
D ~~ j J ~~~~~ 111-, /117 1q13 t<lr"I
lt5
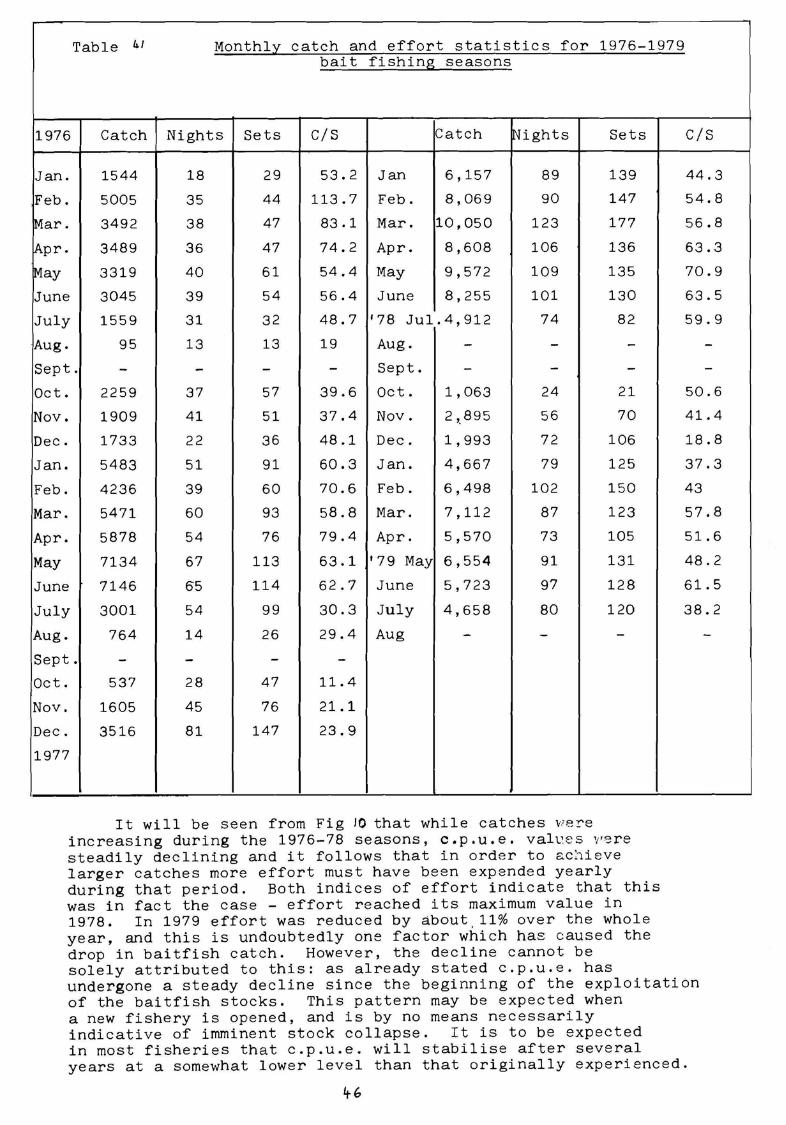
Table Id Monthly catch and effort statistics for 1976-1979 bait fishing seasons
1976 Catch Nights Sets C/S Catch Nights Sets
Jan. 1544 18 29 53.2 Jan 6,157 89 139
Feb. 5005 35 44 113.7 Feb. 8,069 90 147
Mar. 3492 38 47 83.1 Mar. 10,050 123 177
Apr. 3489 36 47 74.2 Apr. 8,608 106 136
May 3319 40 61 54.4 May 9,572 109 135
June 3045 39 54 56.4 June 8,255 101 130
July 1559 31 32 48.7 '78 Jul.4,912 74 82
Aug. 95 13 13 19 Aug. - - -Sept. - - - - Sept. - - -Oct. 2259 37 57 39.6 Oct. 1,063 24 21
Nov. 1909 41 51 37.4 Nov. 2 ,.895 56 70
Dec. 1733 22 36 48.1 Dec. 1,993 72 106
Jan. 5483 51 91 60.3 Jan. 4,667 79 125
Feb. 4236 39 60 70.6 Feb. 6,498 102 150
Mar. 5471 60 93 58.8 Mar. 7,112 87 123
Apr. 5878 54 76 79.4 Apr. 5,570 73 105
May 7134 67 113 63.1 '79 May 6,554 91 131
June 7146 65 114 62.7 June 5,723 97 128
July 3001 54 99 30.3 July 4,658 80 120
Aug. 764 14 26 29.4 Aug - - -Sept. - - - -Oct. 537 28 47 11.4
Nov. 1605 45 76 21.1
Dec. 3516 81 147 23.9
1977
It will be seen from Fig JO that while catches v.iere increasing during the 1976-78 seasons, c.p.u.e. values v,ere steadily declining and it follows that in order to achieve larger catches more effort must have been expended yearly during that period. Both indices of effort indicate that this was in fact the case - effort reached its maximum value in 1978. In 1979 effort was reduced by about . 11% over the whole year, and this is undoubtedly one factor which has caused the drop in baitfish catch. However, the decline cannot be
C/S
44.3
54.8
56.8
63.3
70.9
63 . 5
59.9
--
50.6
41.4
18.8
37.3
43
57.8
51.6
48.2
61. 5
38.2
-
solely attributed to this: as already stated c.p.u.e. has undergone a steady decline since the beginning of the exploitation of the baitfish stocks. This pattern may be expected when a new fishery is opened, and is by no means necessarily indicative of imminent stock collapse. It is to be expected in most fisheries that c.p.u.e. will stabilise after several years at a somewhat lower level than that originally experienced.
What does seem unusual is that the c.p.u.e. figures should show such a uniform decline in a 'stock' of fish which is geographically widespread, and fished in a shifting geographical pattern as this one is, The Ika boats usually follow the northward migration of the tuna during the season, and prefer to fish for bait as locally as possible, even though areas of greater abundance may be available further away. Thus no one area is continually fished throughout the year, and in such a widespread fishery for species which are not known to be highly migratory, one might expect the bait communities to respond independently as discrete local or regional populations. However, the reality seems to be a general response by the whole of the baitfish stock, and it may well be, therefore, that the showly changing c.p.u.e. figures are actually reflecting a change in abundance of baitfish in response to another causal factor completely unrelated to fishing effort, such as climate, oceaneographic conditions, etc.
The November and December 1979 catch figures are not yet available but are reportedly extremely poor, and have justified the F.R.V. Gonedaus being assigned to seek good baitfishing areas around Kadavu for the fleet. From the evidence of past records, poor catches are to be expected at the commencement of the season, and by mid January or early February hopefully catches will be back to at least the 40 buckets/set level. If the trend of declining c.p.u.e. continues in the future, however, it may result in further declines in total catch which in turn may necessitate Fisheries Division looking into methods of improving catches by investigating alternative sources, methods, etc. It is of course essential in this situation that information be received from the Ika boats promptly, so that the Division can undertake any necessary action in good time. All measures are thus being taken to encourage the timely return of data forms.
Geographical distribution of baitfishing effort
In order to allow a geographical analysis of baitfish abundance, Ika boats are asked to note the location of their baitfishing operations either by use of local area names or, preferably, reference to map coordinates. From this information a number of locations can be seen to be fished regularly, largely because the Ika skippers have previously found adequate supplies of baitfish in these sites, or more usually because they are closest to the area of current tuna fishing operations. For these reasons some areas are much more heavily and regularly fished than others, some of which may not be fished at all in any particular season.
For the purposes of analysis, each baitfish site is allocated a number. The approximate localities of the sites can be found from the Map (Fig 12) and in some cases can be seen to lie close together in natural groups which can be treated on bloc. Certain areas have clearly been more productive than others, either in terms of total baitfish catch, or catch rates: as will be seen, the two do not necessarily go hand in hand, and some areas which yield below average catch rates are supplying substantial proportions of the baitfish catch.
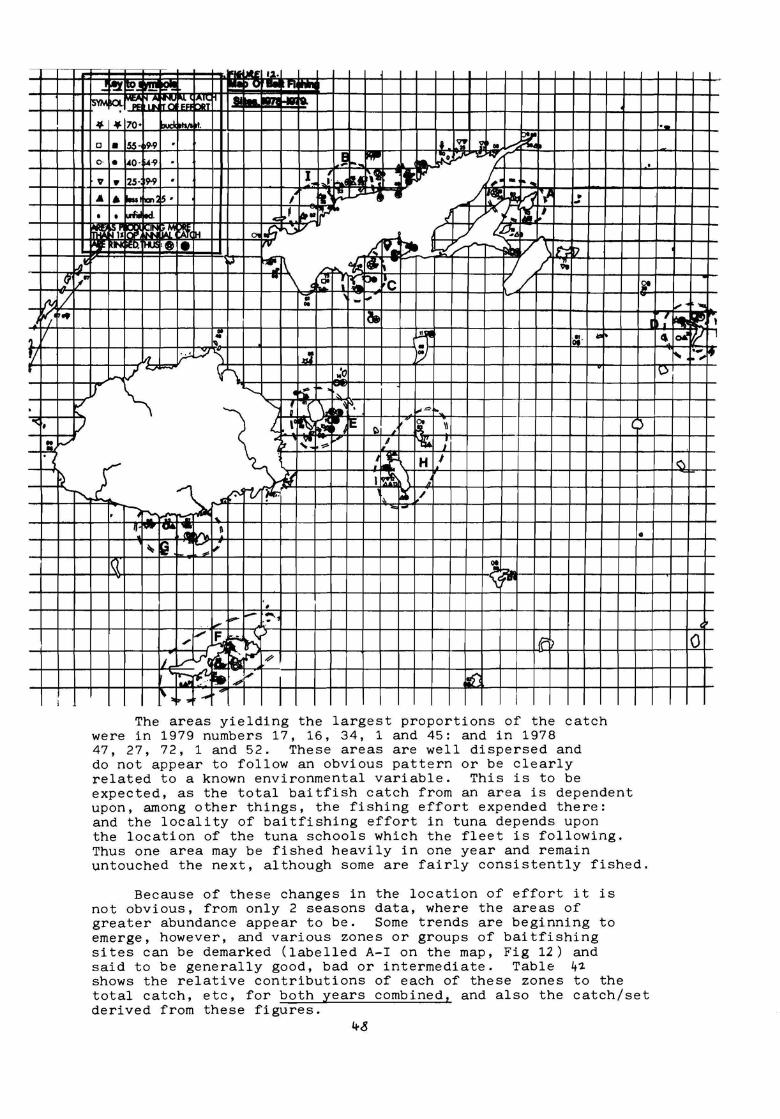
- ~ ·' 'II'/
'l I/
'I t
. ""• - ~
• - i---,
.2~ ~- -a ... ,.1.
J\,1-•r-1-
Im, ~ "':: ,,: ~~ ... , JATCn • .... I O:CI nllT '
• If. 70• ~..I i.... , . ·-• • 55· D9•9 . la '1!: ~ • J~ O· • ,o- M-9 . E .._ ,.,,. -~•-,.,.. 1::.....,./ , ...
' I_ I V • 25· 9-9 .
' -•· ... ~ u '\'i •• JC" I~• -.... / -~ ... . ·o ' /~eJtj.;; _jO '7 Al • -I 15 • .,..,.L..," ..
"""' ' -I -~ led, ~ ,/ ,,,. ;}J 4t:'-[!: ./
~ tu OP ...... ~ mM n, 1..c; '\.) / tP!~ ~ -.. '" ,cu, tU =• • , .. d9.:~ r--...~ [7 \ f'-: r,
l.41: ~ ~\ .r ...... _4b, ll!J, II - / 71
ft
!! [/' .. & : Ii. oe 'c V / ' 11il'
'"'/ '"ii ' ,: ~ ·-.. .. 1a. 11 { :
I~ 1i:l· ... (I 'I
A ,;..--'~ '\ :,J ~ v~- ¼'""\ ;o V
\..) ~
r "- 1r: ,-, ,_ I ·,_
V ' f
~~ .,.,,,i . _..,,.
"'·· I'\..
~ l.l L • E I ~v l II 0 ~ •'
I-/ "1:t ~ ~~ I ~ : .....
' ~-~£ }~\ H ,. ,~ \ ,
-~ -~rv .. .\ ~ ,/
' l
~,-,._ - .. -, - '""" ~ Q•I"""" .,. : a
V'la . ' ~
-_, Q ,_ . '\C _.,,
• .,.. - ::--~ . --
,v,!i ~ _I..,.) fr> -- ·r,
I/ vll"', ~ ~ ,re-' Q' ,., -~
~ 1:~:-:'9 ,,. I ~.• 4.,. I
The areas yielding the largest proportions of the catch were in 1979 numbers 17, 16, 34, 1 and 45: and in 1978 47, 27, 72, 1 and 52. These areas are well dispersed and do not appear to follow an obvious pattern or be clearly related to a known environmental variable. This is to be expected, as the total baitfish catch from an area is dependent upon, among other things, the fishing effort expended there: and the locality of baitfishing effort in tuna depends upon
•
the location of the tuna schools which the fleet is following. Thus one area may be fished heavily in one year and remain untouched the next, although some are fairly consistently fished.
Because of these changes in the location of effort it is not obvious, from only 2 seasons data, where the areas of greater abundance appear to be. Some trends are beginning to emerge, however, and various zones or groups of baitfishing sites can be demarked (labelled A-I on the map, Fig 12) and said to be generally good, bad or intermediate. Table 41 shows the relative contributions of each of these zones to the total catch, etc, for both years combined, and also the catch/set derived from these figures.
"" .
~ ~ • I 10411 r,
'· ·-, "'~
<'I
('
0
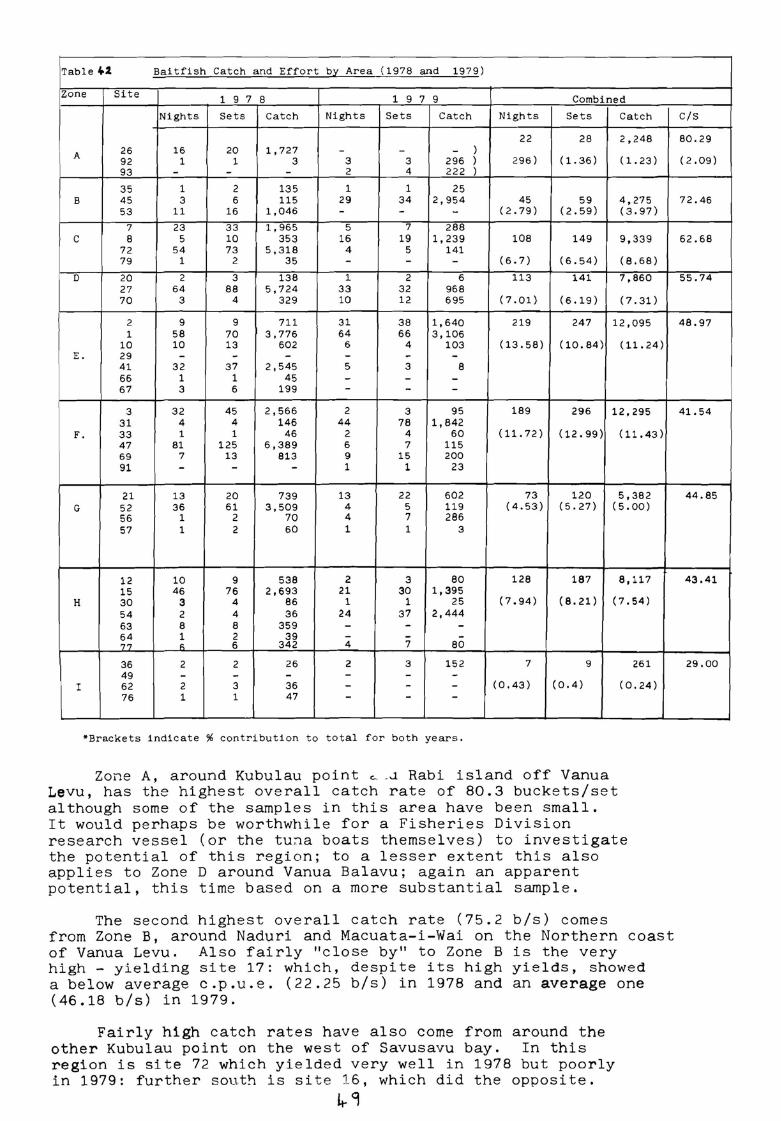
Table 41 Baitfish Catch and Effort bJ'.: Area (1978 and 1979)
Zone Site 1 9 7 8 1 9 7 9 Combined
Nights Sets Catch Nights Sets Catch Nights Sets Catch
22 28 2,248
A 26 16 20 1,727 - - - )
92 1 1 3 3 3 296 ) 296) ( 1.36) ( 1.23) 93 - - - 2 4 22 2 )
35 1 2 135 1 1 25 B 45 3 6 115 29 34 2,954 45 59 4,275
53 11 16 1,046 - - - (2.79) (2.59) (3,97)
7 23 33 1,965 5 7 288 C 8 5 10 353 16 19 1 ,2 39 108 149 9,339
72 54 73 5,318 4 5 141 79 1 2 35 - - - ( 6. 7) (6 . 54) (8.68)
D 20 2 3 138 1 2 6 113 141 7,860 27 64 88 5,724 33 32 968 70 3 4 329 10 12 695 (7.01) (6.19) (7.31)
2 9 9 711 31 38 1,640 219 247 12,095 1 58 70 3,776 64 66 3 , 106
10 10 13 602 6 4 103 (13 . 58) (10.84) (11.24) E. 29 - - - - - -
41 32 37 2,545 5 3 8 66 1 1 45 - - -67 3 6 199 - - -
3 32 45 2,566 2 3 95 189 296 12,295 31 4 4 146 44 78 1,842
F. 33 1 1 46 2 4 60 ( 11. 72) (12.99) (11.43) 47 81 125 6,389 6 7 115 69 7 13 813 9 15 200 91 - - - 1 1 23
21 13 20 739 13 22 602 73 120 5,382 G 52 36 61 3,509 4 5 119 (4.53) ( 5. 27) (5.00)
56 1 2 70 4 7 286 57 1 2 60 1 1 3
12 10 9 538 2 3 80 128 187 8,117 15 46 76 2,693 21 30 1,395
H 30 3 4 86 1 1 25 (7.94) (8.21) (7.54) 54 2 4 36 24 37 2,444 63 8 8 359 - - -64 1 2 39 - - -'7'7 "' 6 342 4 7 80
36 2 2 26 2 3 152 7 9 261 49 - - - - - -
I 62 2 3 36 - - - (0.43) (0.4) (0 . 24) 76 1 1 47 - - -
*Brackets indicate% contribution to total for both years.
Zone A, around Kubulau point~- _J Rabi island off Vanua Levu, has the highest overall catch rate of 80.3 buckets/set although some of the samples in this area have been small. It would perhaps be worthwhile for a Fisheries Division research vessel (or the tu~a boats themselves) to investigate the potential of this region; to a lesser extent this also applies to Zone D around Vanua Balavu; again an apparent potential, this time based on a more substantial sample.
The second highest overall catch rate (75.2 b/s) comes from Zone B, around Naduri and Macuata-i-Wai on the Northern coast of Vanua Levu. Also fairly "close by" to Zone Bis the very high - yielding site 17: which, despite its high yields, showed a below average c.p.u.e. (22.25 b/s) in 1978 and an average one (46.18 b/s) in 1979.
Fairly high catch rates have also come from around the other Kubulau point on the west of Savusavu bay. In this region is site 72 which yielded very well in 1978 but poorly in 1979: further south is site 16, which did the opposite.
lt-9
C/S
80 , 29
(2.09)
72.46
62.68
55.74
48.97
41.54
44.85
43,41
29.00
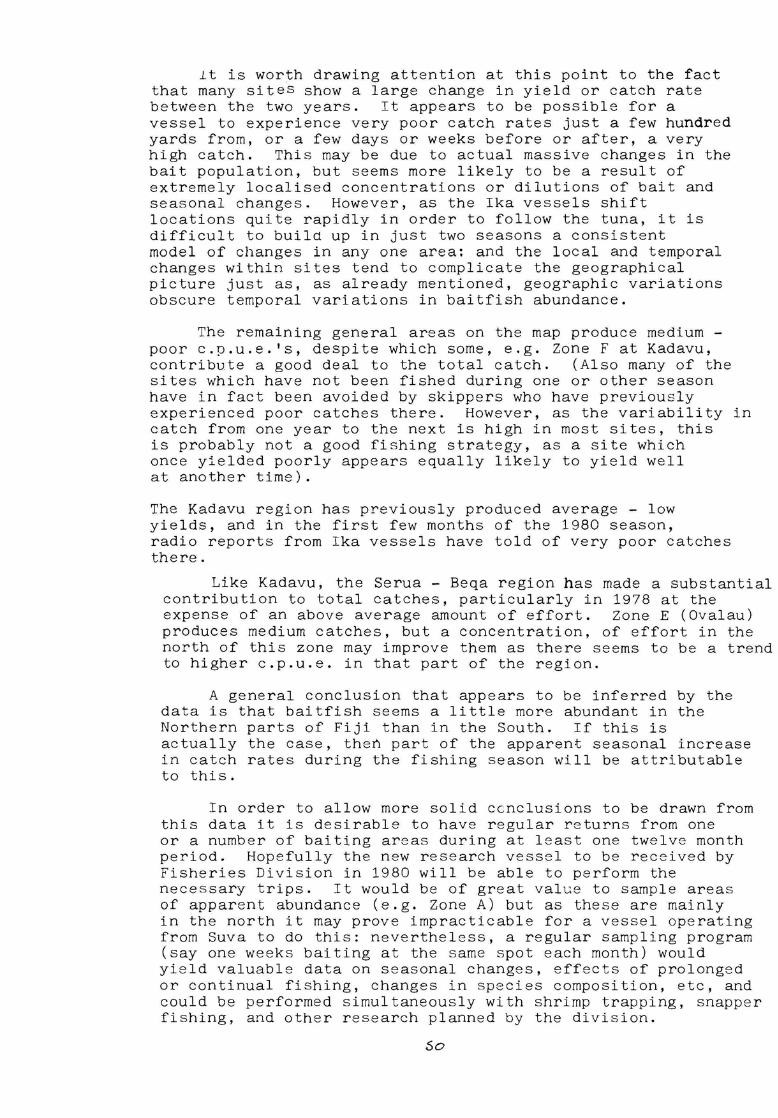
lt is worth drawing attention at this point to the fact that many sites show a large change in yield or catch rate between the two years. It appears to be possible for a vessel to experience very poor catch rates just a few hundred yards from, or a few days or weeks before or after, a very high catch. This may be due to actual massive changes in the bait population, but seems more likely to be a result of extremely localised concentrations or dilutions of bait and seasonal changes. However, as the Ika vessels shift locations quite rapidly in order to follow the tuna, it is difficult to builct up in just two seasons a consistent model of changes in any one area: and the local and temporal changes within sites tend to complicate the geographical picture just as, as already mentioned, geographic variations obscure temporal variations in baitfish abundance.
The remaining general areas on the map produce medium -poor c.p.u.e. 's, despite which some, e.g. Zone Fat Kadavu, contribute a good deal to the total catch. (Also many of the sites which have not been fished during one or other season have in fact been avoided by skippers who have previously experienced poor catches there. However, as the variability in catch from one year to the next is high in most sites, this is probably not a good fishing strategy, as a site which once yielded poorly appears equally likely to yield well at another time).
The Kadavu region has previously produced average - low yields, and in the first few months of the 1980 season, radio reports from Ika vessels have told of very poor catches there.
Like Kadavu, the Serua - Beqa region has made a substantial contribution to total catches, particularly in 1978 at the expense of an above average amount of effort. Zone E (Ovalau) produces medium catches, but a concentration, of effort in the north of this zone may improve them as there seems to be a trend to higher c.p.u.e. in that part of the region.
A general conclusion that appears to be inferred by the data is that baitfish seems a little more abundant in the Northern parts of Fiji than in the South. If this is actually the case, then part of the apparent seasonal increase in catch rates during the fishing season will be attributable to this.
In order to allow more solid ccnclusions to be drawn from this data it is desirable to have regular returns from one or a number of baiting areas during at least one twelve month period. Hopefully the new research vessel to be received by Fisheries Division in 1980 will be able to perform the necessary trips. It would be of great value to sample areas of apparent abundance (e.g. Zone A) but as these are mainly in the north it may prove impracticable for a vessel operating from Suva to do this: nevertheless, a regular sampling program (say one weeks baiting at the same spot each month) would yield valuable data on seasonal changes, effects of prolonged or continual fishing, changes in species composition, etc, and could be performed simultaneously with shrimp trapping, snapper fishing, and other research planned by the division.
So
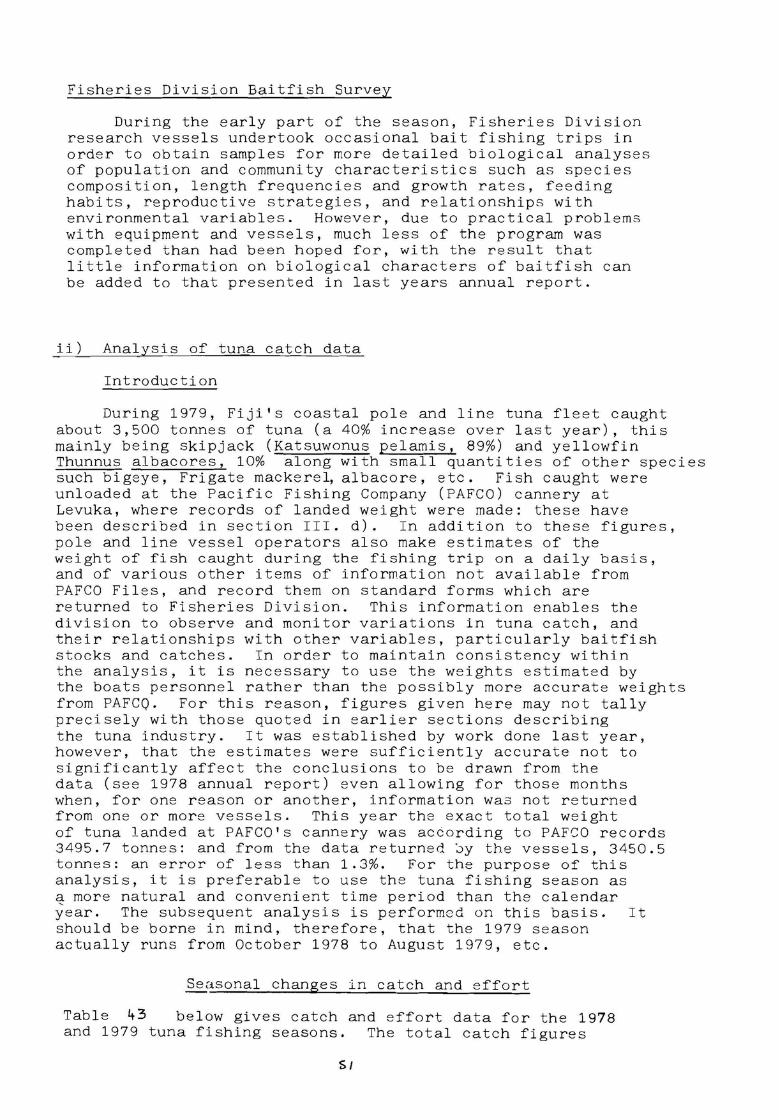
Fisheries Division Baitfish Survey
During the early part of the season, Fisheries Division research vessels undertook occasional bait fishing trips in order to obtain samples for more detailed biological analyses of population and community characteristics such as species composition, length frequencies and growth rates, feeding habits, reproductive strategies, and relationships with environmental variables. However, due to practical problems with equipment and vessels, much less of the program was completed than had been hoped for, with the result that little information on biological characters of baitfish can be added to that presented in last years annual report.
ii) Analysis of tuna catch data
Introduction
During 1979, Fiji's coastal pole and line tuna fleet caught about 3,500 tonnes of tuna (a 40% increase over last year), this mainly being skipjack (Katsuwonus pelamis, 89%) and yellowfin Thunnus albacores, 10% along with small quantities of other species such bigeye, Frigate mackere~ albacore, etc. Fish caught were unloaded at the Pacific Fishing Company (PAFCO) cannery at Levuka, where records of landed weight were made: these have been described in section III. d). In addition to these figures, pole and line vessel operators also make estimates of the weight of fish caught during the fishing trip on a daily basis, and of various other items of information not available from PAFCO Files, and record them on standard forms which are returned to Fisheries Division. This information enables the division to observe and monitor variations in tuna catch, and their relationships with other variables, particularly baitfish stocks and catches. In order to maintain consistency within the analysis, it is necessary to use the weights estimated by the boats personnel rather than the possibly more accurate weights from PAFCQ. For this reason, figures given here may not tally precisely with those quoted in earlier sections describing the tuna industry. It was established by work done last year, however, that the estimates were sufficiently accurate not to significantly affect the conclusions to be drawn from the data (see 1978 annual report) even allowing for those months when, for one reason or another, information was not returned from one or more vessels. This year the exact total weight of tuna landed at PAFCO's cannery was according to PAFCO records 3495.7 tonnes: and from the data returned ~y the vessels, 3450.5 tonnes: an error of less than 1.3%. For the purpose of this analysis, it is preferable to use the tuna fishing season as a more natural and convenient time period than the calendar year. The subsequent analysis is performed on this basis. It should be borne in mind, therefore, that the 1979 season actually runs from October 1978 to August 1979, etc.
Seasonal changes in catch and effort
Table 43 below gives catch and effort data for the 1978 and 1979 tuna fishing seasons. The total catch figures
s,
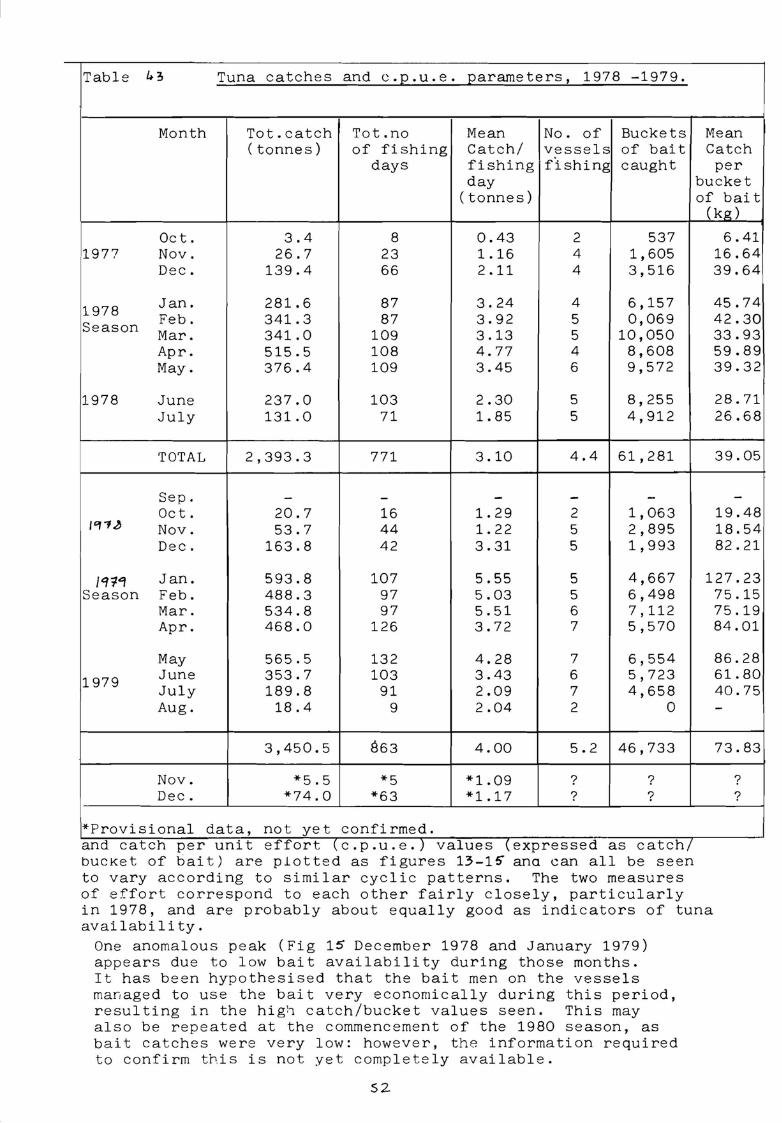
Table i 3 Tuna catches and c.p.u.e. parameters, 1978 -1979.
Month Tot.catch (tonnes)
Tot.no of fishing
days
Mean Catch/ fishing day
No. of Buckets Mean vessels of bait Catch fishing caught per
1977
1978 Season
1978
/~14 Season
1979
Oct. Nov. Dec.
Jan. Feb. Mar. Apr. May.
June July
TOTAL
Sep. Oct. Nov. Dec.
Jan. Feb. Mar. Apr.
May June July Aug.
Nov. Dec.
3.4 26.7
139.4
281.6 341.3 341.0 515.5 376.4
237.0 131.0
2,393.3
20.7 53.7
163.8
593.8 488.3 534.8 468.0
565.5 353.7 189.8
18. 4
3,450.5
*5.5 *74.0
8 23 66
87 87
109 108 109
103 71
771
16 44 42
107 97 97
126
132 103
91 9
863
*5 *63
*Provisional data, not yet confirmed.
(tonnes)
0.43 1.16 2.11
3.24 3.92 3.13 4.77 3.45
2.30 1.85
3.10
1. 29 1. 22 3.31
5.55 5.03 5.51 3.72
4.28 3.43 2.09 2.04
4.00
*1.09 *1.17
2 4 4
4 5 5 4 6
5 5
537 1,605 3,516
6,157 0,069
10,050 8,608 9,572
8,255 4,912
4.4 61,281
2 5 5
5 5 6 7
7 6 7 2
1,063 2,895 1,993
4,667 6,498 7,112 5,570
6,554 5,723 4,658
0
5.2 46,733
? ?
? ?
and catch per unit effort (c.p.u.e.) values (expressed as catch/ bucket of bait) are plotted as figures 13-1~ ana can all be seen to vary according to similar cyclic patterns. The two measures of effort correspond to each other fairly closely, particularly
bucket of bait
(kg)
6.41 16.64 39.64
45.74 42.30 33.93 59.89 39.32
28.71 26.68
39.05
19.48 18.54 82.21
127.23 75.15 75.19 84.01
86.28 61. 80 40.75
73.83
? ?
in 1978, and are probably about equally good as indicators of tuna availability.
One anomalous peak (Fig 15 December 1978 and January 1979) appears due to low bait availability during those months. It has been hypothesised that the bait men on the vessels managed to use the bait very economically during this period, resulting in the hig~ catch/bucket values seen. This may also be repeated at the commencement of the 1980 season, as bait catches were very low: however, the information required to confirm this is not yet completely available.
S2
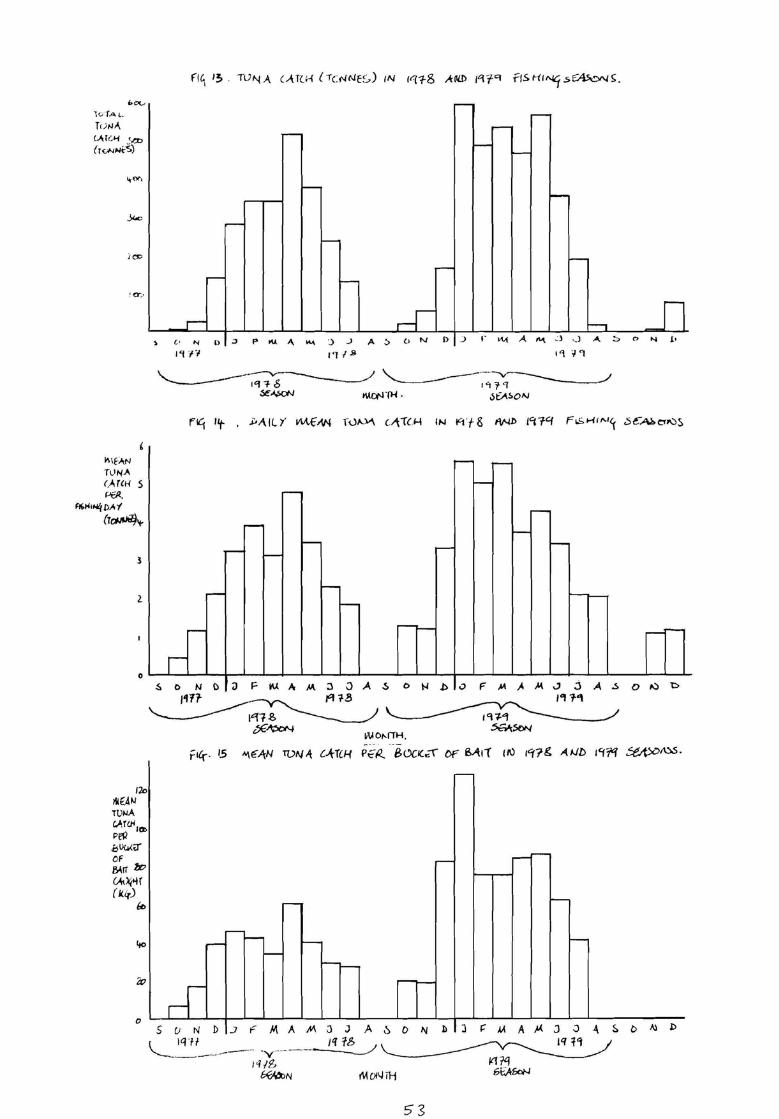
bot.,
1<dAi..
T( ) N,',
U,t,;~ ',t.:D
(tCN~i-S)
i C$0
~\f)tN T•.,INA <,.',TCH S Pffl-.
Flf,H1"4qt,~'(
(1~,._
3
}.
0
Im IM0i~ TVI-IA G,MUi1o, P(:'IJ .BUu<.r' OF MIT 1.D <Al:\•H (k.l()
lo
0
-
-----
--- -
,- r-----1 ' 0 "I I) :.> p OU ,\ ""' .) .) A :, (J N D
1'11 B
-
-- -- ----
-- -- -----
r !, 0 N () a F IU .It M ~ \J A ~ 0 1-1 .b
SUND .J F MAM J J A~ O "J b \____ 1q·,1 ______ _ _ -y ··----~
1<? / fJ ~N MOI\.Jir-1
53
- --f---
~
-
----
--, n J 1· ~ A. M ; ) ,_) A :::> e, "I 1•
- --
-- -
--
.:, F' .M j. ~ ., .J A .s 0 ,.::, t:>
J ~ M A µ J J ~ ~ D ~ D 1q t'f
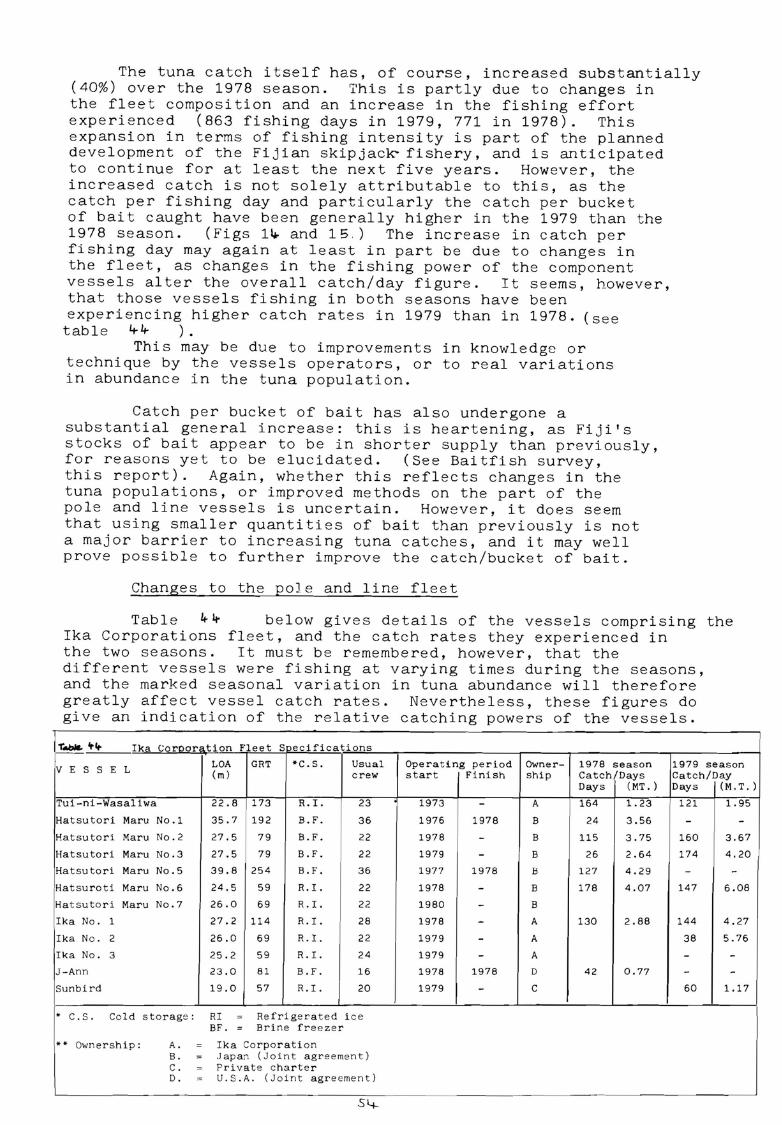
The tuna catch itself has, of course, increased substantially (40%) over the 1978 season. This is partly due to changes in the fleet composition and an increase in the fishing effort experienced (863 fishing days in 1979, 771 in 1978). This expansion in terms of fishing intensity is part of the planned development of the Fijian skipjack- fishery, and is anticipated to continue for at least the next five years. However, the increased catch is not solely attributable to this, as the catch per fishing day and particularly the catch per bucket of bait caught have been generally higher in the 1979 than the 1978 season. (Figs 1i.. and 15 . ) The increase in catch per fishing day may again at least in part be due to changes in the fleet, as changes in the fishing power of the component vessels alter the overall catch/day figure. It seems, however, that those vessels fishing in both seasons have been experiencing higher catch rates in 1979 than in 1978. (see tab 1 e 4- 4- ) •
This may be due to improvements in knowledge or technique by the vessels operators, or to real variations in abundance in the tuna population.
Catch per bucket of bait has also undergone a substantial general increase: this is heartening, as Fiji's stocks of bait appear to be in shorter supply than previously, for reasons yet to be elucidated. (See Baitfish survey, this report). Again, whether this reflects changes in the tuna populations, or improved methods on the part of the pole and line vessels is uncertain. However, it does seem that using smaller quantities of bait than previously is not a major barrier to increasing tuna catches, and it may well prove possible to further improve the catch/bucket of bait.
Changes to the pole and line fleet
Table 4~ below gives details of the vessels comprising the Ika Corporations fleet, and the catch rates they experienced in the two seasons. It must be remembered, however, that the different vessels were fishing at varying times during the seasons, and the marked seasonal variation in tuna abundance will therefore greatly affect vessel catch rates. Nevertheless, these figures do give an indication of the relative catching powers of the vessels.
'l"AbM. "'It Ika Coroor tion Fleet Snecifications
LOA GRT *C.S. Usual Operat ing period Owner- 1978 season 1979 season V E s s E L (m) crew start Finish ship Catch/Days Catch/Day
Days (MT.) Days (M . T.)
Tui-ni-Wasaliwa 22.8 173 R. I. 23 1973 - A 164 1.23 121 1.95
Hatsutori Maru No.1 35.7 192 B.F. 36 1976 1978 B 24 3.56 - -Hatsutori Maru No . 2 27.5 79 B.F. 22 1978 - B 115 3 . 75 160 3.67
Hatsutori Maru No,3 27.5 79 B.F. 22 1979 - B 26 2.64 174 4.20
Hatsutori Maru No.5 39.8 254 B.F. 36 1977 1978 B 127 4.29 - -Hatsuroti Maru No.6 24.5 59 R. I. 22 1978 - B 178 4.07 147 6.08
Hatsutori Maru No.7 26.0 69 R. I. 22 1980 - B
Ika No . 1 27.2 114 R. I. 28 1978 - A 130 2.88 144 4.27
Ika No . 2 26.0 69 R.I. 22 1979 - A 38 5.76
Ika No . 3 25.2 59 R. I. 24 1979 - A - -J-Ann 23.0 81 B.F. 16 1978 1978 D 42 0.77 - -Sunbird 19.0 57 R. I. 20 1979 - C 60 1.17
* c . s. Co ld sto rage : RI = Refrigerat e d i c e BF. = Bri n e fr e ez e r
** Own e r s hip : A. = Ika Co rpo rati on B. = Japan (Joint agree me nt ) C . = Private c hart e r D. = U. S .A . ( J o in t agre eme nt)
s4-
As can be seen the larger boats do not necessarily display the highest catch rates. The fishing power of a vessel depends on a complex of factors - its size, speed, etc, and the fishing strategies employed by the skipper and the crew, in addition to the availability of bait. The Hatsutori Maru No. 6 has produced relatively high catch rates in both seasons, and the HM No. 5, (which is no longer in service) in 1978. Other Hatsutori Maru vessels and the Ika No.1 and No. 2 also produce medium-high catch rates, while the Tui-ni-Wasaliwa and Sunbird both tend to produce low catches - the Tui because, despite its large size, it has a small crew and is not a pole and line boat but a converted trawler: and the Sunbird because it is a comparatively small vessel.
Another aspect of the tuna catch data which has been examined is the ratio of yellowfin to skipjack tuna. It was originally thought that a cyclic pattern of relative abundance of tuna occurred, but this does not now appear to be the case.
Summary:
It would appear, therefore, that in terms of three different measures of effort (catch/fishing day: catch/bucket of bait: catch/vessel) tuna catches appear to be on the increase. This conclusion concurs with the prospective expansion of the tuna fishery, and suggests Fijian tuna stocks are not suffering from over-exploitation at present. However, it must always be remembered that tuna are a highly.migratory fish and as such are subject to fishing in other national waters. At such times fishing mortality occurs which is unaccounted for by data analyses such as this one, carried out elsewhere. It is therefore essential that liaison between skipjack fishing countries be established and maintained in order to rationalise the management and optimise the exploitation of these tuna. This can be and is done via international bodies such as the Forum Fisheries Agency, the South Pacific Commission, etc, and the work of these bodies is of great importance for the long-term good of the Fijian tuna fishery.
iii) Skipjack Length - Frequency Data Analysis
In March 1978, Ika Corporation vessels were supplied with "Daily Tuna Length - Frequency Estimation Worksheets", in which the fork lengths of a sample of 10-20 fish (supposedly selected at random) from each school fished were to be recorded. In addition to enabling the Division to establish and monitor length distributions of Fiji Skipjack, these forms were also an attempt to standardise the method of estimating the weights of daily tuna catches. Vessel operators are provided with a key of skipjack lengths and their corresponding weights, derived from sources in the literature pertaining to Katsuwonus pelamis. The mean of the recorded fork lengths is calculated and multiplied by the total number of fish caught from that school to obtain the weight of the catch. Whilst this method of estimation has, in addition to errors associated with sampling, an inbuilt underestimation (due to the cubic relationship between weight and length), it is considered more reliable than the previously used method of guessing the average weight of fish caught from a member of schools, and multiplying up by the number of fish caught in that day. The method has therefore continued to be employed in the 1978 - 1979 fj_shing season.
55
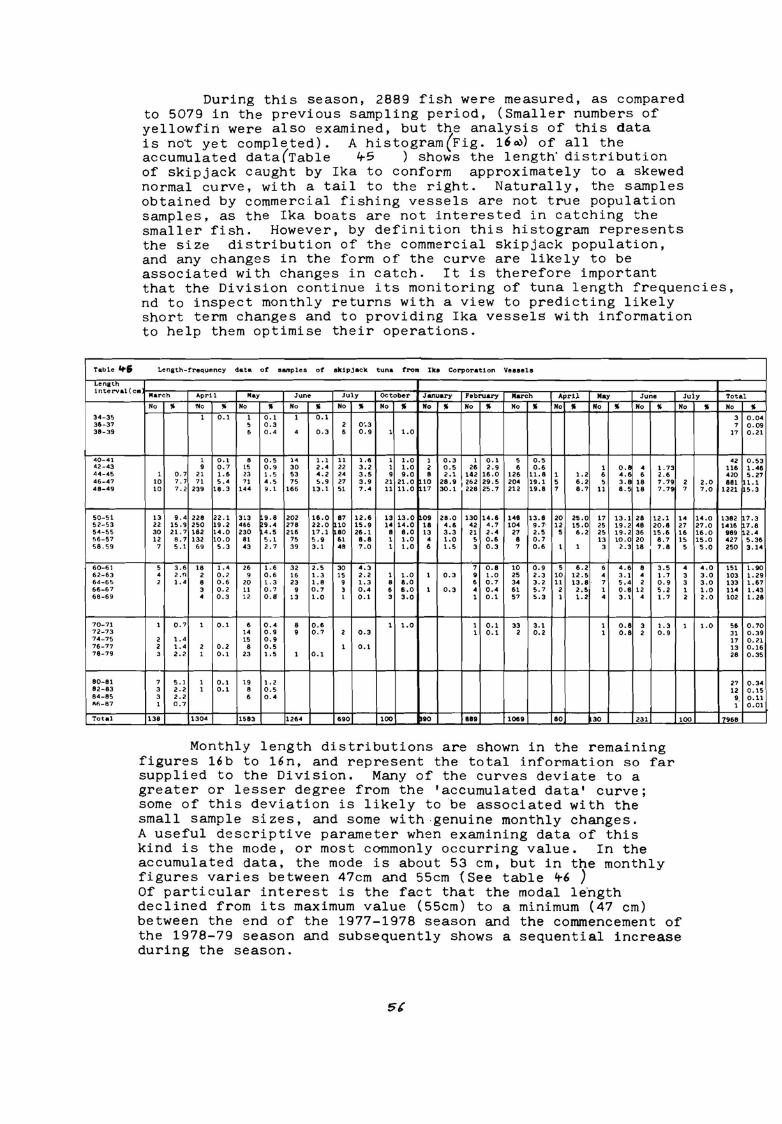
Table &fof Length interval(c11
During this season, 2889 fish were measured, as compared to 5079 in the previous sampling period, (Smaller numbers of yellowfin were also examined, but the analysis of this data is no·t yet completed). A histogram(Fig. 16a.)) of all the accumulated data(Table ~5 ) shows the length· distribution of skipjack caught by Ika to conform approximately to a skewed normal curve, with a tail to the right. Naturally, the samples obtained by commercial fishing vessels are not true population samples, as the Ika boats are not interested in catching the smaller fish. However, by definition this histogram represents the size distribution of the commercial skipjack population, and any changes in the form of the curve are likely to be associated with changes in catch. It is therefore important that the Division continue its monitoring of tuna length frequencies, nd to inspect monthly returns with a view to predicting likely short term changes and to providing Ika vessels with information to help them optimise their operations.
Lenath-rrequl'lncy data at s.,.ples at ek!pjack tuna tro10 Iko Corpora ti on Veeeele
March April May June July October January February March AprO Nay June July Total
34-35 36-37 38-39
40-41 42-43 44-45 46-47 48-49
50-51 52-53 54-55 56-57 58. 59
60-61 62-63 64-65 66-67 68-69
70-71 72-73 74-75 76-77 78-79
BO-Bl 82-83 84-85 Afi-87
Total
No " flo " Ho " Ho " Ho " No " No " No " No " Ho " No " No " 1 0.1 1 o. 1 1 0.1 5 0.3 2 0'.3 6 0.4 4 0.3 6 0.9 1 1.0
1 0.1 • o.s 14 1.1 11 ,. . 1 1.0 l 0.3 1 0.1 s o.s 9 0.7 15 0.9 30 2 .4 22 3.2 l 1.0 2 0.5 26 2.9 6 0.6 l o.e 4 l. 73
1 0.7 21 1.6 23 1.5 53 4.2 24 3.5 9 9.0 B 2. l 142 16.0 126 11.e 1 1.2 6 4.e 6 2 . 6 10 7. 7 71 5 .4 71 4.5 75 5.9 21 3.9 21 21.0 10
~~:~ '~~~ 29.S 204 19.1 5 6.2 5 3.8 18 1. 79
10 7. 2 239 18.3 144 9.1 166 lJ. l 51 7 .4 11 11.0 17 25. 7 212 19.B 1 8.7 11 e.5 18 7. 79
13 9.4 228 22. l 3 13 h.8 202 16.0 87 12,6 13 13. 0 09 28,0 130 14.6 148 13.8 20 25 .o 17 13. 1 28 12.1 22 15 .9 250 19 .2 466 ~9.4 278 22.0 10 15.9 U 14.0 18 4.6 42 4 . 7 104 9. 7· 12 15.0 25 19 .2 48 20.8 30 21. 7 182 14.0 230 4.5 216 17 .1 80 26.l B 8.0 13 3.3 21 2.4 27 2.5 5 6.2 25 19, 2 36 15 .6 12 8.1 132 10.0 81 5.1 75 5.9 61 B.B 1 1.0 4 1.0 5 0.6 B o. 1 13 10.0 20 B. 7
7 5 .1 69 5.3 43 2. 7 39 3.1 48 1.0 1 1.0 6 1.5 3 0.3 7 0.6 l l 3 2 .3 18 7 .B
5 3.6 18 1.4 26 1.6 32 2.5 30 4.3 1 O.B 10 0.9 5 6.2 6 4.6 8 3.5 4 2 .n 2 0.2 9 0.6 16 1.3 15 2. 2 1 1.0 1 0.3 9 1.0 25 2.3 10 12.S 4 3.1 4 1.7 2 1.4 8 0.6 20 1.3 23 1.8 9 1.3 8 a.o 6 0.1 34 3.2 11 13.8 1 5.4 2 0.9
3 0.2 11 0.7 9 0.1 3 0.4 6 6.0 1 0.3 4 o.4 61 5. 7 2 2.5 l 0.8 12 5 .2 4 0.3 12 0.8 13 1.0 l 0.1 3 3.0 1 0.1 57 5.3 1 1.2 4 3 .1 4 1. 7
1 o. 7 1 0.1 6 0.4 8 0.6 1 1.0 1 0.1 33 3. 1 1 0.8 3 1.3 14 0 . 9 9 0, 7 2 0 . 3 l O. l 2 0.2 1 O. B 2 0 . 9
2 1.4 15 0.9 2 1.4 2 0.2 8 0.5 1 0.1 3 2. 2 1 0.1 23 1.5 1 0. 1
7 5. l 1 0.1 19 1.2 3 2. 2 1 0.1 8 0.5 3 2. 2 6 0.4 1 0.7
138 1304 1583 1264 690 100 ~•o 889 1009 BO 30 231
Monthly length distributions are shown in the remaining figures 16b to 16n, and represent the total information so far supplied to the Division. Many of the curves deviate to a greater or lesser degree from the 'accumulated data' curve; some of this deviation is likely to be associated with the small sample sizes, and some with-genuine monthly changes. A useful descriptive parameter when examining data of this kind is the mode, or most commonly occurring value. In the accumulated data, the mode is about 53 cm, but in the monthly figures varies between 47cm and 55cm {See table ~6)
No
2 7
14 27 16 15
5
4 3 3 1 2
1
100
Of particular interest is the fact that the modal l~ngth declined from its maximum value (55cm) to a minimum (47 cm) between the end of the 1977-1978 season and the commencement of the 1978-79 season and subsequently shows a sequential increase during the season.
5(
" No " 3 0.04 1 o.09
17 0,21
42 0,53 116 1.46 420 5. 27
2.0 BBl 11.1 7.0 1221 ~5.3
14.0 1382 1.3 27 .0 1416 7 .8 16.0 989 2.4 15.0 427 5.36 5.0 250 3.14
4.0 151 1.90 3.0 103 1.29 3.0 133 1.67 1.0 114 1.43 2.0 102 1.28
1.0 56 0.10 31 0.39 17 o. 21 13 0.16 28 0.35
27 0.34 12 0.1!>
9 0.11 1 0 . 01
I 7968
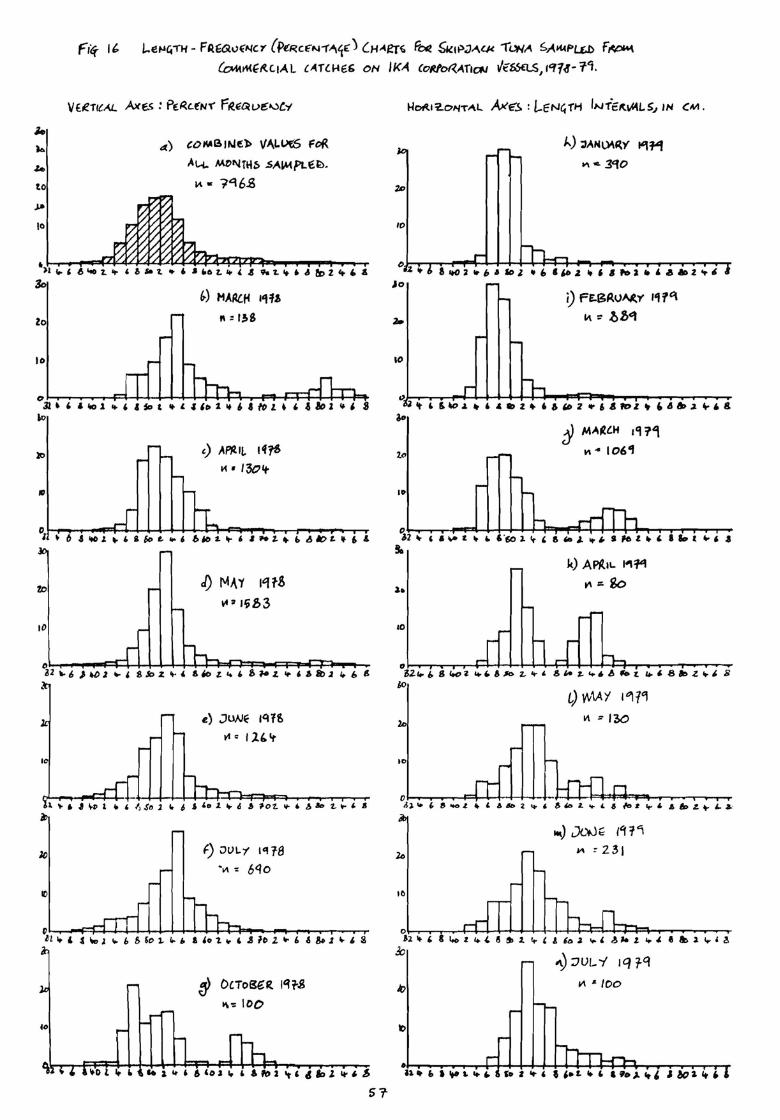
1..e~4,-.., - F~EGvf~,,.. (P€RcE"N1'J'\~E") CHA£n, ~ ~1i:>J-'\C1< ·n .. w"' SAK4PL..£b f~ {GM1~fftC.t,4.L CATlHeS ON IKA (O~ol<..Afla.J i/€~, ICfU- n.
<f) COMBJNf:l> VA,L~ FoR Al,i. MDl'llni~ .SA~PLE:t:>.
1,1. - ?'16.S
'>1 t,. , I, loO z. .,_ , 6 s- i. .,. 6 .a 6oa 1. ,._ , J 9a z. It , d &, Z ,. ' a
Zo
10
<,.) HA~M •1-fJ
"= 1!>6
o._ __ ,.............c:=1,-~>--"-+--4--~-&-..J.-;4-._..._~~-&--I-~,.,._ ll • ' ' liO 1 .,. , I fo t 1t l I ,o 1 If 6 & ~ L • , 4 .lo 1 i. ' S
'°
,0
ID
01......--...-=t=:::i--1-1-4,+~I-J:~:,J::.~~"4==~"""::J::~-........ az .,_ 1, > ~ z -.. , s So z ... , a -, z. .. , & ,. z. .,. , a ai 1 i.. " 4
10
f-) ;Jl)I.. "f , .. 18 ·111 " 6qo
01-..,.--F=l-4-+--+-J.-.4-+-4-~ ............ -4--1'"""'-------......... ~ ........ -.ll lo & i Ii.. l 1,. 6 f, '" 1- • 1, I ,o 2. .,. 4 J 'lo Z Ir I, ~ Bo J It & S
& •lToBtR 1cH·.8 ... .,, 100
51-
10
,o
10
i) Ft.BAUAt.Y 11 f '\ I,\ -:: .bl>-1
j M~~lH 1Cf 11:\ 11\ 4 1061
~2 "" 4 a -.. ~ Ii- 6o , ·go 1 Cr , g '° l, It 1, 9 ,e t. "" , I lo t ._ 6 j
!1.
10
0 1--r--.-.................... --..4--+--l-+-+-+-4-+-i-+-•1-+--.-................................... ...-......... ~z ... " s ,.,, i ... " a #o z., ... , a ,,. ,. ... • 1, "° ~ ,. , a a. z .,. 1, s
&o l) t,AAY 1"\J~
II\=- 130
IC
oi-. ........ ........-..--1~-++-+-+-4-• >...J....~11=$~ot,;,:-___. ............... ,......... __ ill '" 6 & "° ~ It ' .a Ill> 2 ... , & 4o 2. .,_ L 6 lo a ... , .a 6> z. ~ £.. ~ -
10
-) J<..)J.:: l'H 'i "' = 231
01-r-.-~~>--"-+-~f...-#-l--+-~1---1-~:::i.--4--4--1==1-............... --..-,.. &2 • I, & l.o z It- L I! 81 1 ,._ ( 4 '"' ;i ~ l ~ -. 1. • , I & ;i 1,, , .!I
ki
Jo ""• too
IO
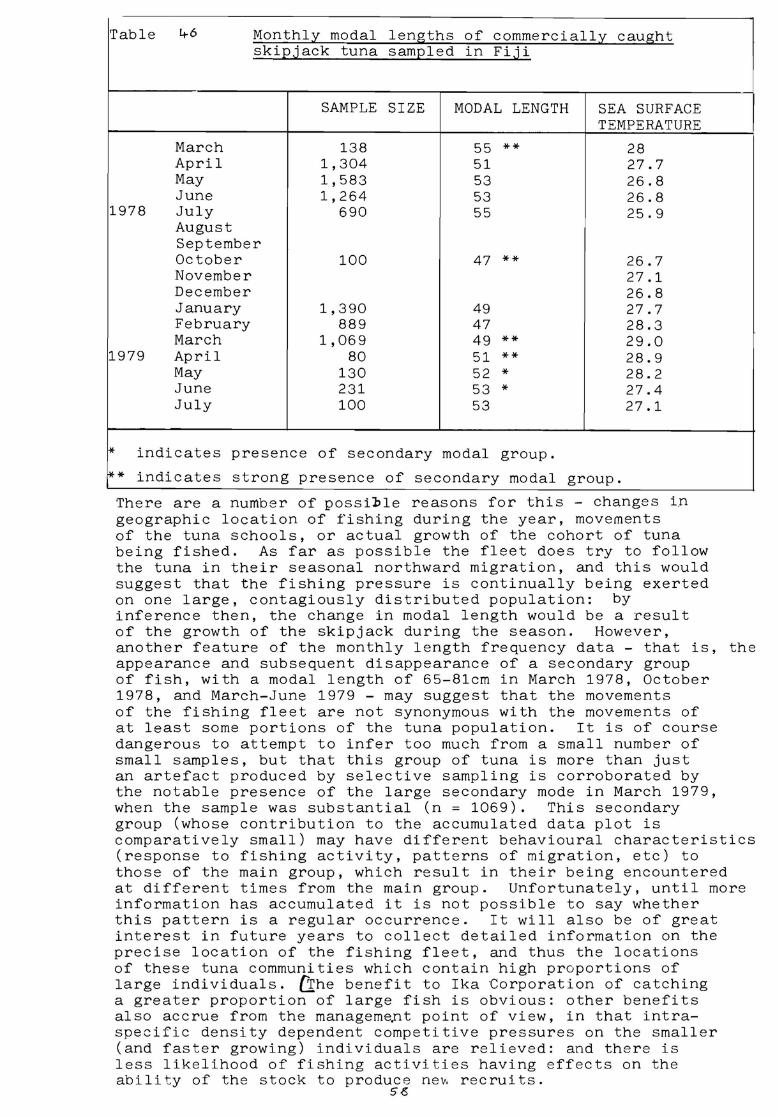
Table 4-6 Monthly modal lengths of commercially caught ski2jack tuna sam2led in Fiji
SAMPLE SIZE MODAL LENGTH SEA SURFACE TEMPERATURE
March 138 55 ** 28 April 1,304 51 27.7 May 1,583 53 26.8 June 1,264 53 26.8
1978 July 690 55 25.9 August September October 100 47 ** 26.7 November 27.1 December 26.8 January 1,390 49 27.7 February 889 47 28.3 March 1,069 49 ** 29.0
1979 April 80 51 ** 28.9 May 130 52 * 28.2 June 231 53 * 27 . 4 July 100 53 27.1
* indicates presence of secondary modal group.
** indicates strong presence of secondary modal group.
There are a number of possil>le reasons for this - changes i_n geographic location of fishing during the year, movements of the tuna schools, or actual growth of the cohort of tuna being fished. As far as possible the fleet does try to follow the tuna in their seasonal northward migration, and this would suggest that the fishing pressure is continually being exerted on one large, contagiously distributed population: by inference then, the change in modal length would be a result of the growth of the skipjack during the season. However, another feature of the monthly length frequency data - that is, the appearance and subsequent disappearance of a secondary group of fish, with a modal length of 65-81cm in March 1978, October 1978, and March-June 1979 - may suggest that the movements of the fishing fleet are not synonymous with the movements of at least some portions of the tuna population. It is of course dangerous to attempt to infer too much from a small number of small samples, but that this group of tuna is more than just an artefact produced by selective sampling is corroborated by the notable presence of the large secondary mode in March 1979, when the sample was substantial (n = 1069). This secondary group (whose contribution to the accumulated data plot is comparatively small) may have different behavioural characteristics (response to fishing activity, patterns of migration, etc) to those of the main group, which result in their being encountered at different times from the main group. Unfortunately, until more information has accumulated it is not possible to say whether this pattern is a regular occurrence . It will also be of great interest in future years to collect detailed information on the precise location of the fishing fleet, and thus the locations of these tuna communities which contain high proportions of large individuals. CThe benefit to Ika ·corporation of catching a greater proportion of large fish is obvious: other benefits also accrue from the manageme~t point of view, in that intraspecific density dependent competitive pressures on the smaller (and faster growing) individuals are relieved: and there is less likelihood of fishing activities having effects on the ability of the stock to produce nev. recruits.
5~
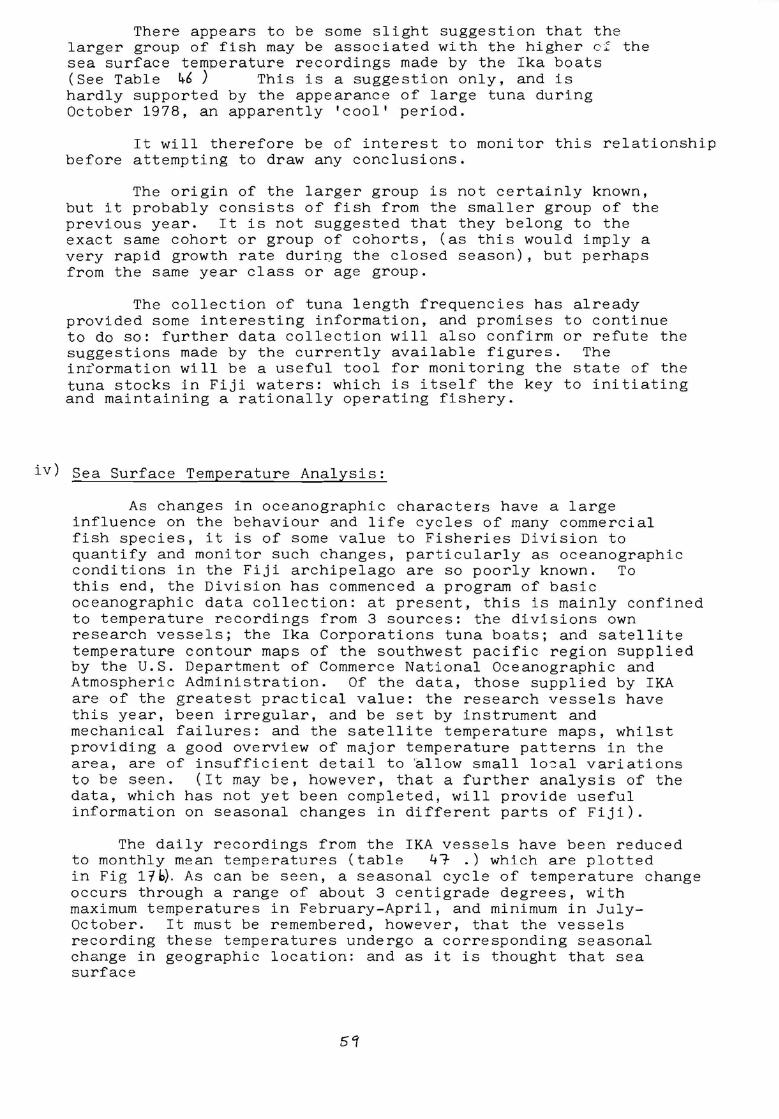
There appears to be some slight suggestion that the larger group of fish may be associated with the higher cf the sea surface temperature recordings made by the Ika boats (See Table ~6) This is a suggestion only, and is hardly supported by the appearance of large tuna during October 1978, an apparently 'cool' period.
It will therefore be of interest to monitor this relationship before attempting to draw any conclusions.
The origin of the larger group is not certainly known, but it probably consists of fish from the smaller group of the previous year. It is not suggested that they belong to the exact same cohort or group of cohorts, (as this would imply a very rapid growth rate duriDg the closed season), but perhaps from the same year class or age group.
The collection of tuna length frequencies has already provided some interesting information, and promises to continue to do so: further data collection will also confirm or refute the suggestions made by the currently available figures. The information will be a useful tool for monitoring the state of the tuna stocks in Fiji waters: which is itself the key to initiating and maintaining a rationally operating fishery.
iv) Sea Surface Temperature Analysis:
As changes in oceanographic characters have a large influence on the behaviour and life cycles of many commercial fish species, it is of some value to Fisheries Division to quantify and monitor such changes, particularly as oceanographic conditions in the Fiji archipelago are so poorly known. To this end, the Division has commenced a program of basic oceanographic data collection: at present, this is mainly confined to temperature recordings from 3 sources: the divisions own research vessels; the Ika Corporations tuna boats; and satellite temperature contour maps of the southwest pacific region supplied by the U.S. Department of Commerce National Oceanographic and Atmospheric Administration. Of the data, those supplied by IKA are of the greatest practical value: the research vessels have this year, been irregular, and be set by instrument and mechanical failures: and the satellite temperature maps, whilst providing a good overview of major temperature patterns in the area, are of insufficient detail to ~llow small lo~al variations to be seen. (It may be, however, that a further analysis of the data, which has not yet been completed, will provide useful information on seasonal changes in different parts of Fiji).
The daily recordings from the IKA vessels have been reduced to monthly mean temperatures (table 4~ .) which are plotted in Fig 11W. As can be seen, a seasonal cycle of temperature change occurs through a range of about 3 centigrade degrees, with maximum temperatures in February-April, and minimum in JulyOctober. It must be remembered, however, that the vessels recording these temperatures undergo a corresponding seasonal change in geographic location: and as it is thought that sea surface
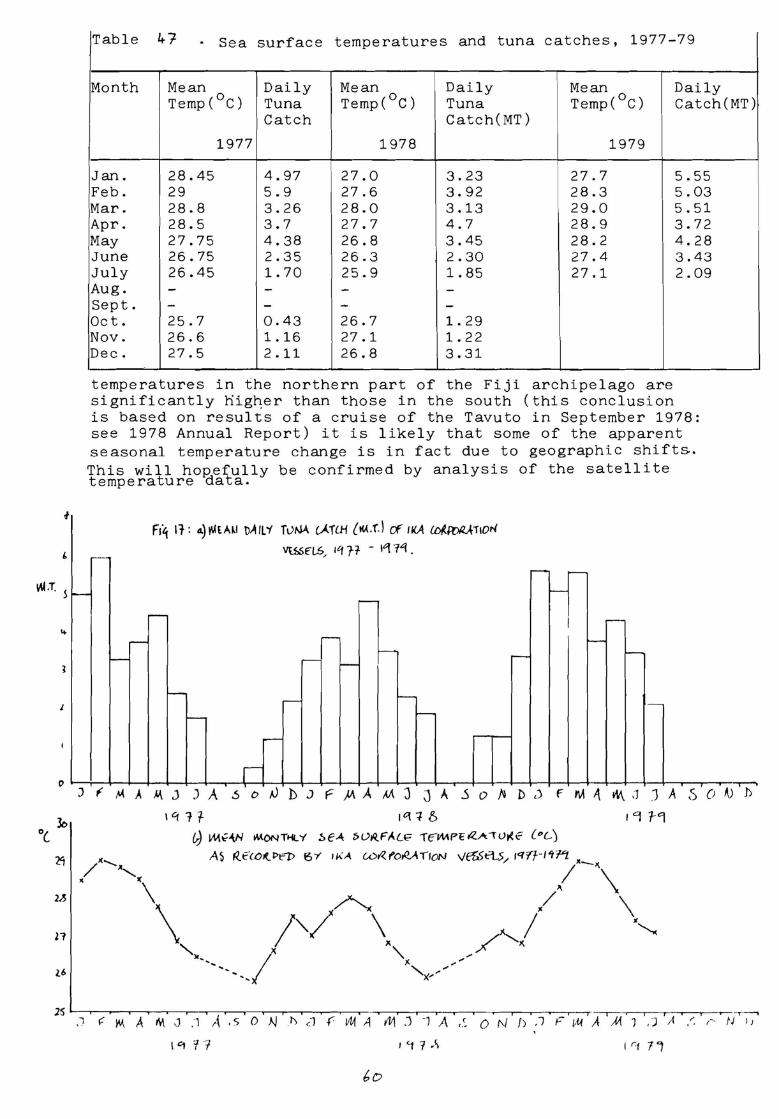
' ~-T. 5
C,
Table 4 7- . Sea surface temperatures and tuna catches, 1977-79
Month Mean Daily Mean Daily Mean Daily Temp( 0 c) Tuna Temp( 0 c) Tuna Temp( 0 c) Catch(MT)
Catch Catch(MT)
1977 1978 1979
Jan. 28.45 4.97 27.0 3.23 27.7 5.55 Feb. 29 5.9 27.6 3.92 28.3 5.03 Mar. 28.8 3.26 28.0 3.13 29.0 5.51 Apr. 28.5 3.7 27.7 4.7 28.9 3.72 May 27.75 4.38 26.8 3.45 28.2 4.28 June 26.75 2.35 26.3 2.30 27.4 3.43 July 26.45 1. 70 25.9 1. 85 27.1 2.09 Aug. - - - -Sept. - - - -Oct. 25.7 0.43 26.7 1. 29 Nov. 26.6 1.16 27.1 1. 22 Dec. 27.5 2.11 26.8 3.31
temperatures in the northern part of the Fiji archipelago are significantly hig~er than those in the south (this conclusion is based on results of a cruise of the Tavuto in September 1978: see 1978 Annual Report) it is likely that some of the apparent seasonal temperature change is in fact due to geographic shifts. This will hopefully be confirmed by analysis of the satellite temperature data.
Fi~ Ir: a._)l',IEA~I DAIL'i TvNA v'-"flH {K-(.f.) Cf IKA ldroR . ..H,ori
- Vli,.SElS, 1q H - 1q ·1.q .
- -- --- I ~
-~ -
~ --- ~ -'- -- ·---
- --r
J f M ,4, M J J A .5 o ~ b J f ,MA M J J A ..5 o ~ D ,) f MA. t\,\:J JASO 1-J h
, 4 1-4
I r:1 7 i
{,o
Also included in table ~r , and plotted as Figure lroJ are the monthly tuna catches made by IKA vessels in the last 3 years. As can be seen there appears to be some degree of association, although at this stage a causal relationship cannot be assumed. It appears that high catches tend to correspond inexactly to high surface temperature readings. It is known that the tuna shoals (mostly skipjack and yellowfin) fished by the IKA fleet migrate northwards at about the same time that sea surface temperatures decline (i.e. when the isotherms are also moving northwards), and the tuna boats follow the shoals. However, these seasonal temperature fluctuations also result in or coincide with cyclic changes in other factors, such as salinity with which it has been suggested that tuna catches may be related. (Bour and Galenon, 1979. The Development of Tuna Fisheries in the Western Pacific. S.P.C.) It is therefore difficult to determine exactly which factors, or group of factors, determine the areas of tuna congregation, but it is of practical value to know of the association between high catches and high temperatures. The next stage in this analysis is to attempt measurements of other oceanographic features, particularly salinity, probably during cruises of the fisheries division's vessels. It may also be possible to develop a means of predicting short term movements of isotherms using satellite temperature charts, and thus likely areas of tuna abundance, although this is a very tentative proposal at present. Nevertheless, the value of oceanographic information in understanding and predicting changes in the behaviour patterns of fish is recognised in the worlds major fisheries, particularly those for migratory species: and as expansion of the Fijian tuna fishery is planned, and indeed already occuring, it will be of value to increase the amount of oceanographic sampling performed by Fisheries Division in future years.
v) South Pacific Commission Skipjack Survey
In September 1977 the South Pacific Commission instigated a major survey aimed at investigating the availability of skipjack and other pelagic Tuna's, and baitfish stocks, in a large number of the localities within SPC's area of jurisdiction. An integral part of the survey is a tagging programme which will yield valuable information on patterns of migration, growth, and abundance of these highly migratory fish. Since the commencement of the tagging programme two extnesive cruises have been completed, during which fish were tagged and released in the territorial waters of 18 Pacific countries, including Fiji. Approximately 90,000 fish had been tagged at December 1979, and available information indicated that 2,588 tagged fish have been recovered, of which 140 have made international migrations. The greatest distance was covered by a skipjack tagged in Fiji and recovered in Frehch Polynesia - 1,688 nautical miles away. It is anticipated that tags will continue to be returned in years to come, and the long-term n~ture of the project makes it possible to make only tentative interpretations of the results at this stage. A northerly migration of tuna in Fiji waters is evident, and is the general trend experienced by the Ika Corporation Fleet. As further information is available, more subtle inferences as to skipjack movement in Fiji should be possible.
61
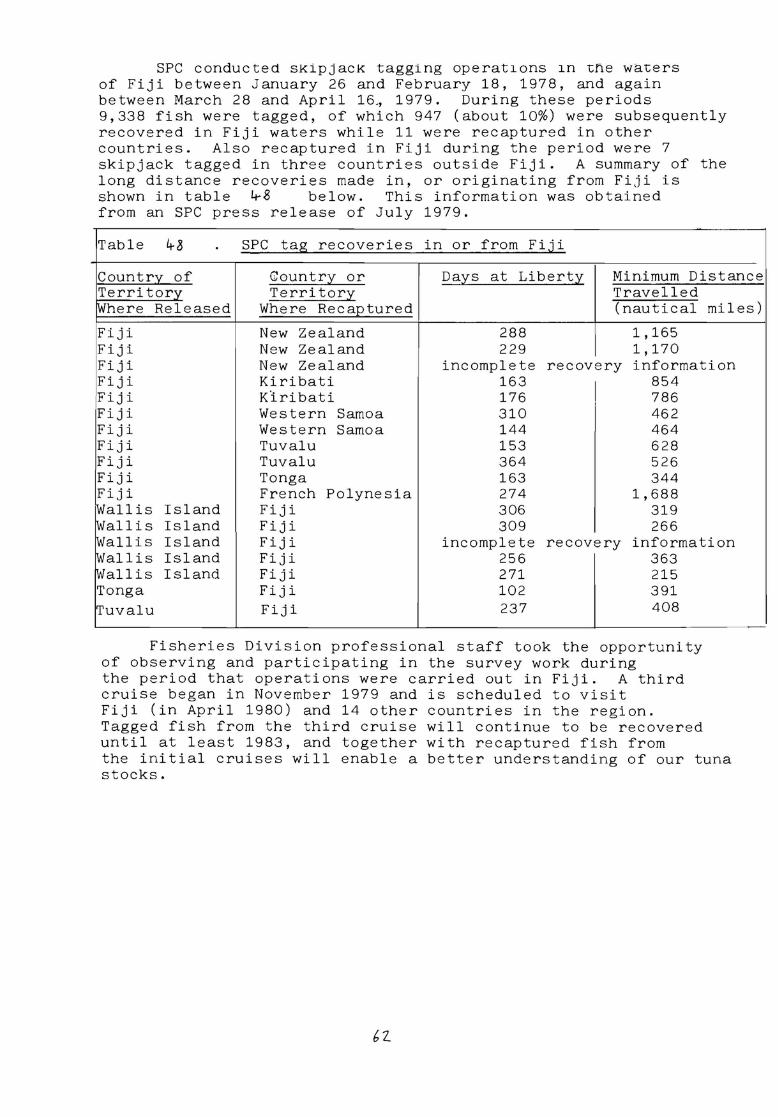
SPC conducted skipjack tagging operations in ~ne wa~ers of Fiji between January 26 and February 18, 1978, and again between March 28 and April 16., 1979. During these periods 9,338 fish were tagged, of which 947 (about 10%) were subsequently recovered in Fiji waters while 11 were recaptured in other countries. Also recaptured in Fiji during the period were 7 skipjack tagged in three countries outside Fiji. A summary of the long distance recoveries made in, or originating from Fiji is shown in table ~g below. This information was obtained from an SPC press release of July 1979.
Table 4-.3 SPC tag recoveries in or from Fiji
Countrv of Country or Days at Liberty Minimum Distance Territory Territory Travelled Where Released Where Reca2tured (nautical miles)
Fiji New Zealand 288 1,165 Fiji New Zealand 229 1,170 Fiji New Zealand incomplete recovery information Fiji Kiribati 163 854 Fiji K'iribati 176 786 Fiji Western Samoa 310 462 Fiji Western Samoa 144 464 Fiji Tuvalu 153 628 Fiji Tuvalu 364 526 Fiji Tonga 163 344 Fiji French Polynesia 274 1,688 Wallis Island Fiji 306 319 !Wallis Island Fiji 309 266 Wallis Island Fiji incomplete recovery information Wallis Island Fiji 256 363 !Wal 1 is Island Fiji 271 215 Tonga Fiji 102 391 Tuvalu Fiji 237 408
Fisheries Division professional staff took the opportunity of observing and participating in the survey work during the period that operations were carried out in Fiji. A third cruise began in November 1979 and is scheduled to visit Fiji (in April 1980) and 14 other countries in the region. Tagged fish from the third cruise will continue to be recovered until at least 1983, and together with recaptured fish from the initial cruises will enable a better understanding of our tuna stocks.
vi) Deep Water "Snapper" Resource Assessment
Introduction.
During 1979, Fisheries Division continued its programme of deep water snapper fishing, with the intention of investigating variations in fish size, abundance and species composition with depth, season and geographical location. Deep water snappers are a group of mainly lutjanid species, in some cases distantly related to commonly caught inner reef fishes, which are found in depths exceeding 50 fathoms on the outer reef slope. This years operations were intended to consolidate and conclude the Divisions programme of exploratory fishing, and in general have been less intensive than last year. Competition with other projects for vessel time also served to restrict the amount of fishing done. The initial phase of this project is, however, now virtually complete and will shortly be reported in detail in a separate internal publication. This report therefore constitutes an interim or progress statement only.
Techniques
The vessels used in the programme were the Kuita Qalo and the Mata-ni-Civa, ferro-cement vessels built specifically for handline fishing by the Division. Each accomodate a crew of 6, and on all occasions were manned by Fisheries staff. In some instances, a Japanese Fishing master, currently seconded to Fisheries Division, was in charge.
In addition, some fishing was performed on other Fisheries vessels, notably the Gonedau, concurrent with work on other projects (such as shrimp trapping). In some cases, records of catch and effort were inadequate for inclusion in the data: those records which appeared reliable were, however, used.
Fishing was done by means of droplines or handlines. Both use essentially the same gear, but the method of operation is slightly different. The rig itself consists of a weighted line with a number of hooks (usually 3 or 4, rarely 6) attached to individual traces about 80cm long, which are themselves spaced along the line at 2 m intervals, commencing lm away from the weight. (The rig is described in detail in the 1978 report). In droplining, the rig is lowered to touch the bottom and then moored off to a buoy, and retrieved about 1 hour later. When handlining, the rig is fished over the side of the boat by a crewman, and kept tight on the bottom by hand.
The difference in fishing technique arises because, when handlining, the line can be jigged as the fish is felt to bite, whereas a dropline relies on the fish hooking itself. On the other hand, however, it is usual for the crew to haul a handline after hooking one, or sometimes two, fish, whereas a dropline will remain in place and continue fishing until, in some cases, all the hooks are full. Despite these two slight differences of operation, it has not been possible to differentiate between droplines and handlines in terms of effectiveness, and no distinction is made in this study.
Bottom longlines were not used this year, as they had last year been seen to be unsuitable. The bait mainly used was skipjack (Katsuwonus pelamis) which had previously been frozen. The bait was cut into pieces and covered in salt for 1 - 2. hours before use to harden it. Occasionally other fish were used as bait when skipjack was not available.
Fishing Areas:
Fishing this year was concentrated in 4 major areas, which are illustrated in Fig 17. These were: Kadavu/Beqa (A: Grid squares 367,378,379 and 377, 385), Naigani (B: G.S. 382,398,399), Savusavu Bay (G: G.S. 198) and Bligh waters(D: G.S. 364). The reason for much of this localisation was the associated work (i.e. shrimp trapping) which was often performed simultaneously. Savusavu bay, however, was investigated to follow up last years indications of good catches there.
In addition, small amounts of data from other areas, eg. the Yasawas, was obtained, and contributed to the overall figures.
Species Caught.
In the main these were the same as those caught last year: however, a number of vernacular names have arisen for some of these species, many of which were not previously caught and thus have no, traditional names. In one or two cases a plurality of names are used, different ones being more familiar to some workers than to others. This variation in recorded names for some species of fish adds to the ever present danger of misi~entification of some of the more variable (in colour and pattern) types: and there is, therefor€, a possibility of misidentification in one or two cases. This is not of major occurrence and is unlikely to have modified the results appreciably. The more important species caught are fairly easily identifiable and are listed, with recommended vernacular names, below:
Lutjanidae: Pristipomoides flavipinnis
Etelis carbunculus
Etelis marshi
Aphareus rutilans
Lutjanus malabaricus
Lethrinidae: Gnathodentex mosambicus
Seriola rivoliana
Rosy jobfish
Ribbon-tail-jobfish
Marshes jobfish
Small - toothed jobfish
Scarlet sea - perch
Large-eyed sea bream
Amber jack
In addition, fish such as rock cod, dog-tooth tuna, snake mackerel and sharks were occasionally caught. In the case of the first three these were usually of very local occurrence: sharks were commonly caught in all area's fished.
The contribution of each of the major species to the total catch is shown in Table ~q below.
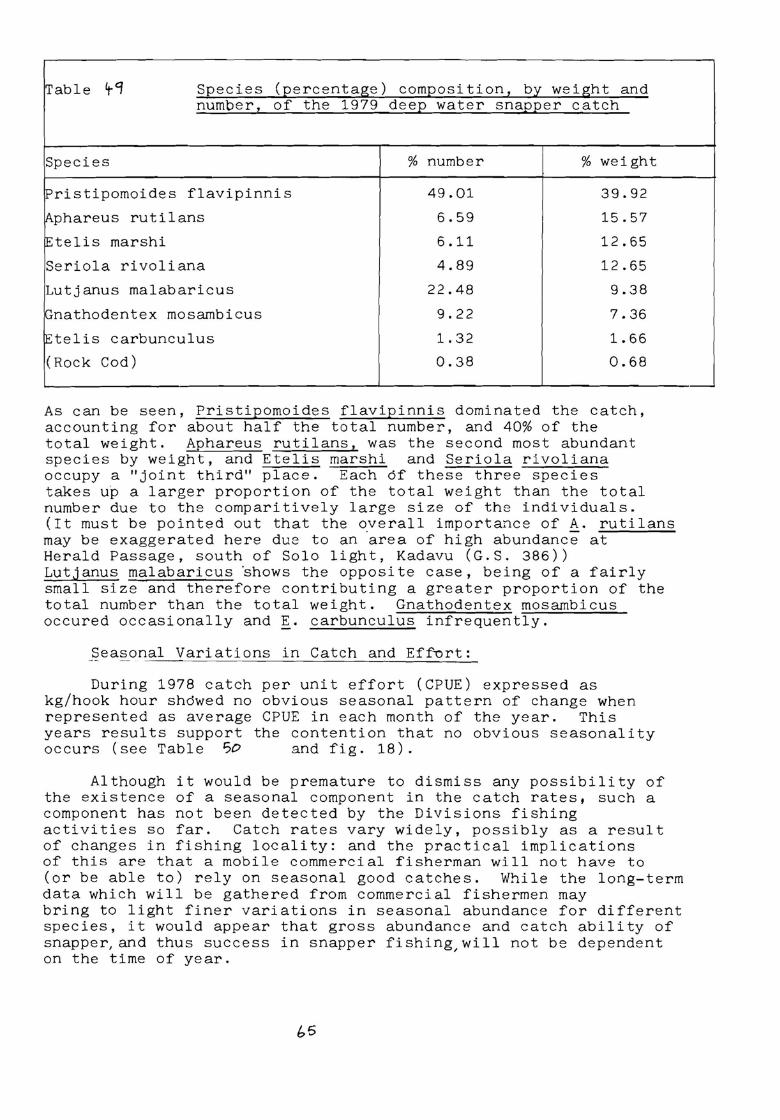
Table 't '1 Species (:12ercentage) com12osition 2 bJ'.'. weight and number, of the 1979 dee12 water sna:122er catch
Species % number % weight
Pristipomoides flavipinnis 49.01 39.92
Aphareus rutilans 6.59 15.57
Etelis marshi 6.11 12.65
Seriola rivoliana 4.89 12.65
Lutjanus malabaricus 22.48 9.38
IGnathodentex mosambicus 9.22 7.36
Etelis carbunculus 1. 32 1.66
(Rock Cod) 0.38 0.68
As can be seen, Pristi:12omoides flavi:12innis dominated the catch, accounting for about half the total number, and 40% of the total weight. Aphareus rutilans, was the second most abundant species by weight, and Etelis marshi and Seriola rivoliana occupy a "joint third" place. Each of these three species takes up a larger proportion of the total weight than the total number due to the comparitively large size of the individuals. (It must be pointed out that the o_verall importance of t:._. rutilans may be exaggerated here due to an area of high abundance at Herald Passage, south of Solo light, Kadavu (G.S. 386)) Lutjanus malabaricus ·shows the opposite case, being of a fairly small size and therefore contributing a greater proportion of the total number than the total weight. Gnathodentex mosambicus occured occasionally and E. carbunculus infrequently.
Seasonal Variations in Catch and Eff-ort:
During 1978 catch per unit effort (CPUE) expressed as kg/hook hour shdwed no obvious seasonal pattern of change when represented as average CPUE in each month of the year. This years results support the contention that no obvious seasonality occurs (see Table So and fig. 18).
Although it would be premature to dismiss any possibility of the existence of a seasonal component in the catch rates, such a component has not been detected by the Divisions fishing activities so far. Catch rates vary widely, possibly as a result of changes in fishing locality: and the practical implications of this are that a mobile commercial fisherman will not have to (or be able to) rely on seasonal good catches. While the long-term data which will be gathered from commercial fishermen may bring to light finer variations in seasonal abundance for different species, it would appear that gross abundance and catch ability of snapper, and thus success in snapper fishing,will not be dependent on the time of year.
1::,5
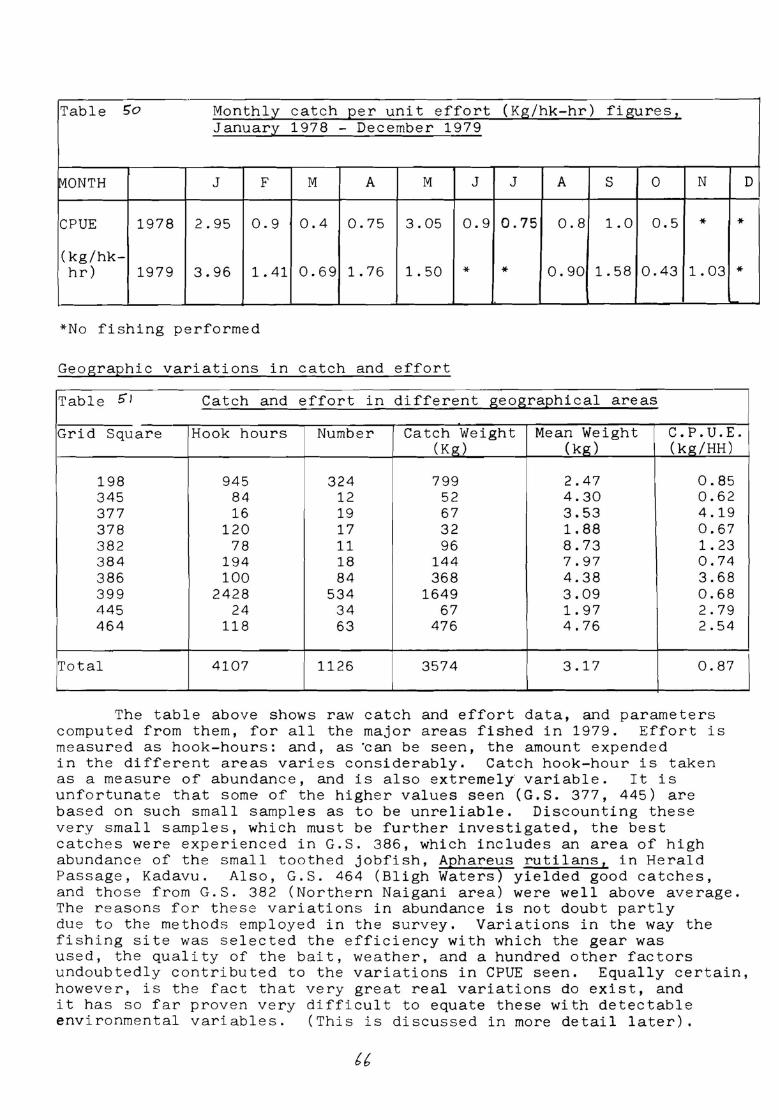
Table 5o Monthly catch 2er unit effort (Kg/hk-hr) figures z January 1978 - December 1979
MONTH J F M A M J J A s 0 N D
CPUE 1978 2.95 0.9 0.4 0.75 3.05 0.9 0.75 0.8 1.0 0.5 * *
(kg/hk-hr) 1979 3.96 1. 41 0.69 1. 76 1. 50 * * 0.90 1. 58 0.43 1.03 *
*No fishing performed
Geographic variations in catch and effort
Table 5"1 Catch and effort in different geogra2hical areas
Grid Square Hook hours Number Catch Weight Mean Weight C.P.U.E. (Kg) (kg) (kg/HH)
198 945 324 799 2.47 0.85 345 84 12 52 4.30 0.62 377 16 19 67 3.53 4.19 378 120 17 32 1.88 0.67 382 78 11 96 8.73 1. 23 384 194 18 144 7.97 0.74 386 100 84 368 4.38 3.68 399 2428 534 1649 3.09 0.68 445 24 34 67 1. 97 2.79 464 118 63 476 4.76 2.54
Total 4107 1126 3574 3.17 0.87
The table above shows raw catch and effort data, and parameters computed from them, for all the major areas fished in 1979. Effort is measured as hook-hours: and, as ·can be seen, the amount expended in the different areas varies considerably. Catch hook-hour is taken as a measure of abundance, and is also extremely variable. It is unfortunate that some of the higher values seen (G.S. 377, 445) are based on such small samples as to be unreliable. Discounting these very small samples, which must be further investigated, the best catches were experienced in G.S. 386, which includes an area of high abundance of the small toothed jobfish, Aphareus rutilans, in Herald Passage, Kadavu. Also, G.S. 464 (Bligh Waters) yielded good catches, and those from G.S. 382 (Northern Naigani area) were well above average. The reasons for these variations in abundance is not doubt partly due to the methods employed in the survey. Variations in the way the fishing site was selected the efficiency with which the gear was used, the quality of the bait, weather, and a hundred other factors undoubtedly contributed to the variations in CPUE seen. Equally certain, however, is the fact that very great real variations do exist, and it has so far proven very difficult to equate these with detectable environmental variables. (This is discussed in more detail later).
I
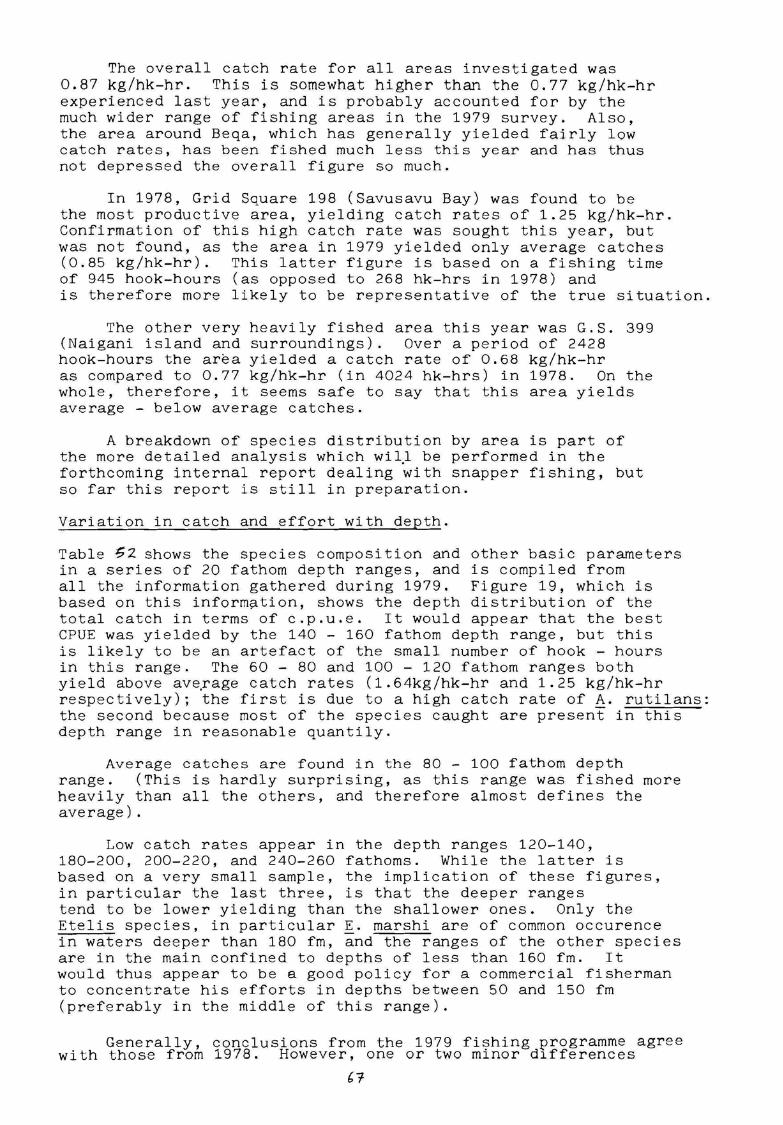
The overall catch rate for all areas investigated was 0.87 kg/hk-hr. This is somewhat higher than the 0.77 kg/hk-hr experienced last year, and is probably accounted for by the much wider range of fishing areas in the 1979 survey. Also, the area around Beqa, which has generally yielded fairly low catch rates, has been fished much less this year and has thus not depressed the overall figure so much.
In 1978, Grid Square 198 (Savusavu Bay) was found to be the most productive area, yielding catch rates of 1.25 kg/hk-hr. Confirmation of this high catch rate was sought this year, but was not found, as the area in 1979 yielded only average catches (0.85 kg/hk-hr). This latter figure is based on a fishing time of 945 hook-hours (as opposed to 268 hk-hrs in 1978) and is therefore more likely to be representative of the true situation.
The other very heavily fished area this year was G.S. 399 (Naigani island and surroundings). Over a period of 2428 hook-hours the area yielded a catch rate of 0.68 kg/hk-hr as compared to 0.77 kg/hk-hr (in 4024 hk-hrs) in 1978. On the whole, therefore, it seems safe to say that this area yields average - below average catches.
A breakdown of species distribution by area is part of the more detailed analysis which wil.l be performed in the forthcoming internal report dealing with snapper fishing, but so far this report is still in preparation.
Variation in catch and effort with depth.
Table 52 shows the species composition and other basic parameters in a series of 20 fathom depth ranges, and is compiled from all the information gathered during 1979. Figure 19, which is based on this inform~tion, shows the depth distribution of the total catch in terms of c.p.u.e. It would appear that the best CPUE was yielded by the 140 - 160 fathom depth range, but this is likely to be an artefact of the small number of hook - hours in this range. The 60 - 80 and 100 - 120 fathom ranges both yield above ave.rage catch rates ( 1. 64kg/hk-hr and 1. 25 kg/hk-hr respectively); the first is due to a high catch rate of A. rutilans: the second because most of the species caught are present in this depth range in reasonable quantily.
Average catches are found in the 80 - 100 fathom depth range. (This is hardly surprising, as this range was fished more heavily than all the others, and therefore almost defines the average).
Low catch rates appear in the depth ranges 120-140, 180-200, 200-220, and 240-260 fathoms. While the latter is based on a very small sample, the implication of these figures, in particular the last three, is that the deeper ranges tend to be lower yielding than the shallower ones. Only the Etelis species, in particular~- marshi are of common occurence in waters deeper than 180 fm, and the ranges of the other species are in the main confined to depths of less than 160 fm. It would thus appear to be a good policy for a commercial fisherman to concentrate his efforts in depths between 50 and 150 fm (preferably in the middle of this range).
Generally, conclusions from the 1979 fishing programme agree with those from 1978. However, one or two minor differences
{, 1
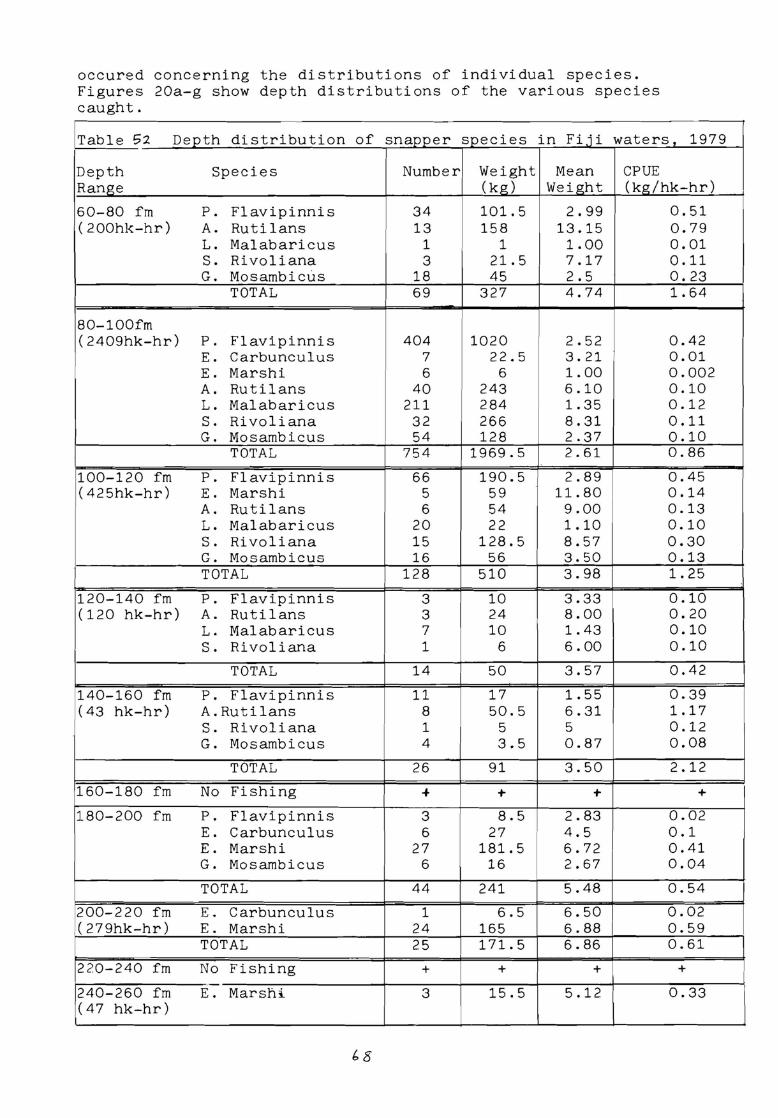
occured concerning the distributions of individual species. Figures 20a-g show depth distributions of the various species caught.
Table 52 Depth distribution of snapoer soecies in Fii i waters, 1979
Depth Species Number Weight Mean CPUE Range (kg) Weight (kg/hk-hr)
60-80 fm p. Flavipinnis 34 101.5 2.99 0. 51 (200hk-hr) A. Rutilans 13 158 13.15 0.79
L. Malabaricus 1 1 1.00 0.01 s. Rivoliana 3 21. 5 7.17 0.11 G. Mosambicus 18 45 2. 5 0.23
TOTAL 69 327 4.74 1.64
80-lOOfm (2409hk-hr) P. Flavipinnis 404 1020 2.52 0.42
E. Carbunculus 7 22.5 3.21 0.01 E. Marshi 6 6 1.00 0.002 A. Rutilans 40 243 6.10 0 .10 L. Malabaricus 211 284 1.35 0.12 s. Rivoliana 32 266 8.31 0.11 G. Mosambicus 54 128 2.37 0 .10
TOTAL 754 1969.5 2.61 0.86
100-120 fm P. Flavipinnis 66 190.5 2.89 0.45 (425hk-hr) E. Marshi 5 59 11.80 0.14
A. Rutilans 6 54 9.00 0 .13 L. Malabaricus 20 22 1.10 0.10 s. Rivoliana 15 128.5 8.57 0.30 G. Mosambicus 16 56 3.50 0 .13 TOTAL 128 510 3.98 1. 25
120-140 fm P. Flavipinnis 3 10 3.33 0 .10 (120 hk-hr) A. Rutilans 3 24 8.00 0.20
L. Malabaricus 7 10 1.43 0.10 s. Rivoliana 1 6 6.00 0 .10
TOTAL 14 50 3.57 0.42
140-160 fm P. Flavipinnis 11 17 1. 55 0.39 (43 hk-hr) A.Rutilans 8 50.5 6.31 1.17
s. Rivoliana 1 5 5 0 .12 G. Mosambicus 4 3.5 0.87 0.08
TOTAL 26 91 3.50 2.12
160-180 fm No Fishing -f. + + +
180-200 fm P. Flavipinnis 3 8.5 2.83 0.02 E. Carbunculus 6 27 4.5 0.1 E. Marshi 27 181.5 6.72 0.41 G. Mosambicus 6 16 2.67 0.04
TOTAL 44 241 5.48 0.54
200-220 fm E. Carbunculus 1 6.5 6.50 0.02 (279hk-hr) E. Marshi 24 165 6.88 0.59
TOTAL 25 171.5 6.86 0.61
220-240 fm No Fishing + + + +
240-260 fm E. Marshi 3 15.5 5.12 0.33 (47 hk-hr)
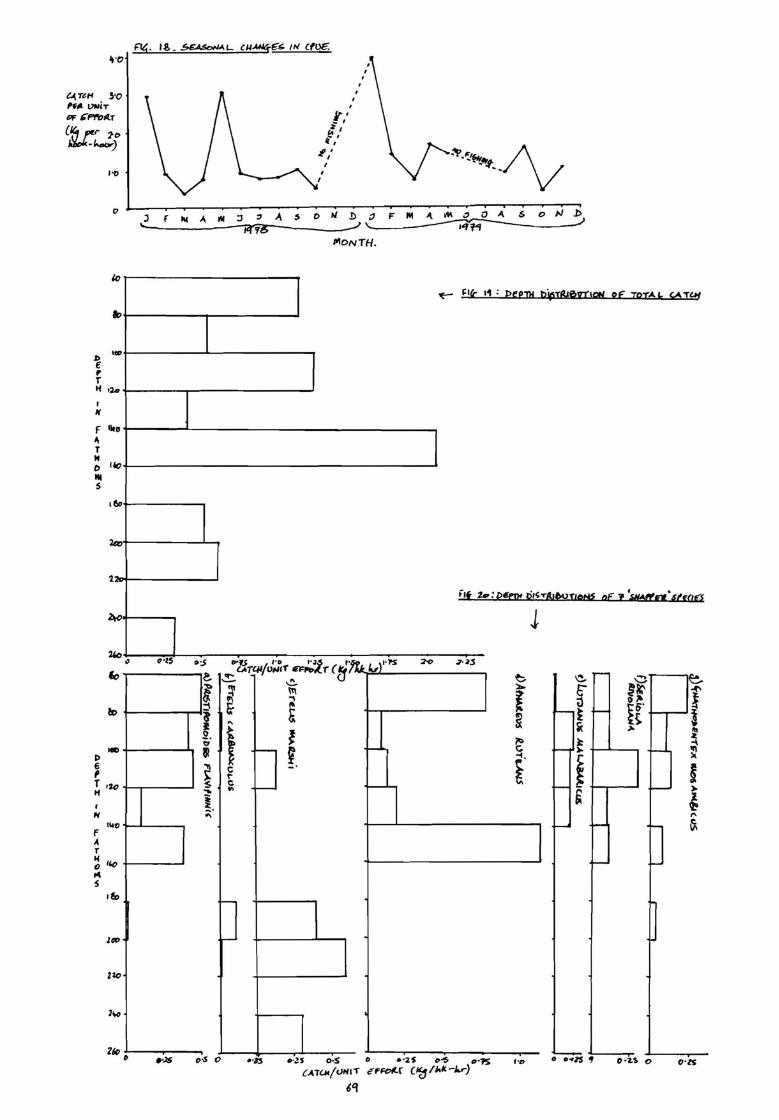
lj·t,
!·o C-'(T&t-1.
~-- 1-'NIT DF t.Pf'Otl.T (Ur 10
·"-)
l> € r r
l·O
0
Ito
H >lo
I I(
f llt ~
" T H t> 6(1
Ill s
6o
la,
1.
.\c
2'°
~-
J ....
I g . .$€ASo,,/"" L CU5"E°~ /1'1 CflJE.
, . . ,
f". - , ,t I
f:t, t,
I' I
A ~ C> " D ;:J F f Ill A Ill :::, :, _.J ;.r,~
flllr>NTH.
j
ens <>:5
T----7e, ... /·D ··~ t·,r£ ~l""s
I :, +----,---,,. " 81
¥ ..... i
Co
ll>
MIO I> e , T •:kl tf
'
"" -
~ --'l'1 ~ ~ ~ ~ £ "
t l r-
' C -I" e .,, C .
"' ;; 1'60
f A T 14
'"' 0
"' s 1&
r-
lf/0
zio
-
J
1~
lie 0 •·¥ c,,S 0 .. ,, .. O•
Ill A .s oN.l>
~ ~It,- 11 ;
j
••£ :z
2-o ~-~$
t ~ 0
f ~ f ~~
f o~. l H l ~ ~ ~ :
~ k -\ C ).
~ -4,
I I i ),
~ ' ,....
~
t•o 0 ... zs, 0•2.$ 0 O•lS
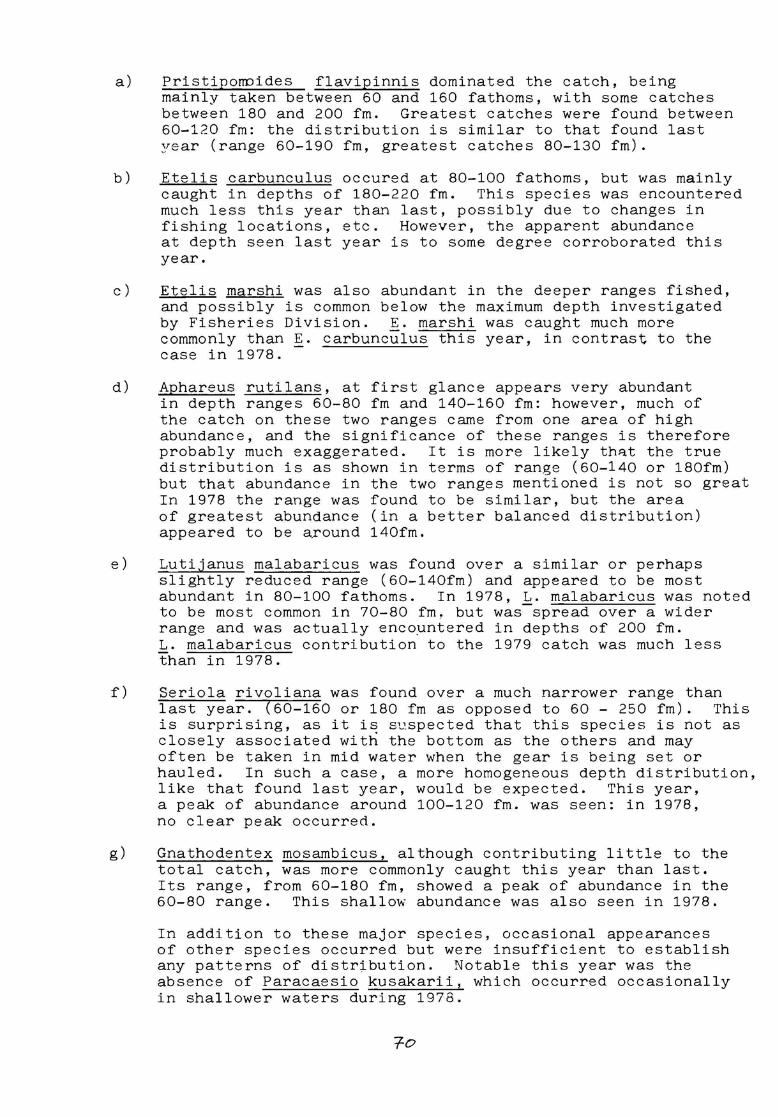
a)
b)
C)
d)
e)
f)
g)
Pristiporroides flavipinnis dominated the catch, being mainly taken between 60 and 160 fathoms, with some catches between 180 and 200 fm. Greatest catches were found between 60-120 fm: the distribution is similar to that found last year (range 60-190 fm, greatest catches 80-130 fm).
Etelis carbunculus occured at 80-100 fathoms, but was mainly caught in depths of 180-220 fm. This species was encountered much less this year than last, possibly due to changes in fishing locations, etc. However, the apparent abundance at depth seen last year is to some degree corroborated this year.
Etelis marshi was also abundant in the deeper ranges fished, and possibly is common below the maximum depth investigated by Fisheries Division. E. marshi was caught much more commonly than E. carbunculus this year, in contrast to the case in 1978.
Aphareus rutilans, at first glance appears very abundant in depth ranges 60-80 fm and 140-160 fm: however, much of the catch on these two ranges came from one area of high abundance, and the significance of these ranges is therefore probably much exaggerated. It is more likely th~t the true distribution is as shown in terms of range (60-140 or 180fm) but that abundance in the two ranges mentioned is not so great In 1978 the range was found to be similar, but the area of greatest abundance (in a better balanced distribution) appeared to be a.round 140fm.
Lutijanus malabaricus was found over a similar or perhaps slightly reduced range (60-140fm) and appeared to be most abundant in 80-100 fathoms. In 1978, L. malabaricus was noted to be most common in 70-80 fm, but was-spread over a wider range and was actually enco~ntered in depths of 200 fm. L. malabaricus contribution to the 1979 catch was much less than in 1978.
Seriola rivoliana was found over a much narrower range than last year. (60-160 or 180 fm as opposed to 60 - 250 fm). This is surprising, as it is s~spected that this species is not as closely associated with the bottom as the others and may often be taken in mid water when the gear is being set or hauled. In such a case, a more homogeneous depth distribution, like that found last year, would be expected. This year, a peak of abundance around 100-120 fm. was seen: in 1978, no clear peak occurred.
Gnathodentex mosambicus, although contributing little to the total catch, was more commonly caught this year than last. Its range, from 60-180 fm, showed a peak of abundance in the 60-80 range. This shallow abundance was also seen in 1978.
In addition to these major species, occasional appearances of other species occurred but were insufficient to establish any patterns of distribution. Notable this year was the absence of Paracaesio kusakarii, which occurred occasionally in shallower waters during 1978.
l-o
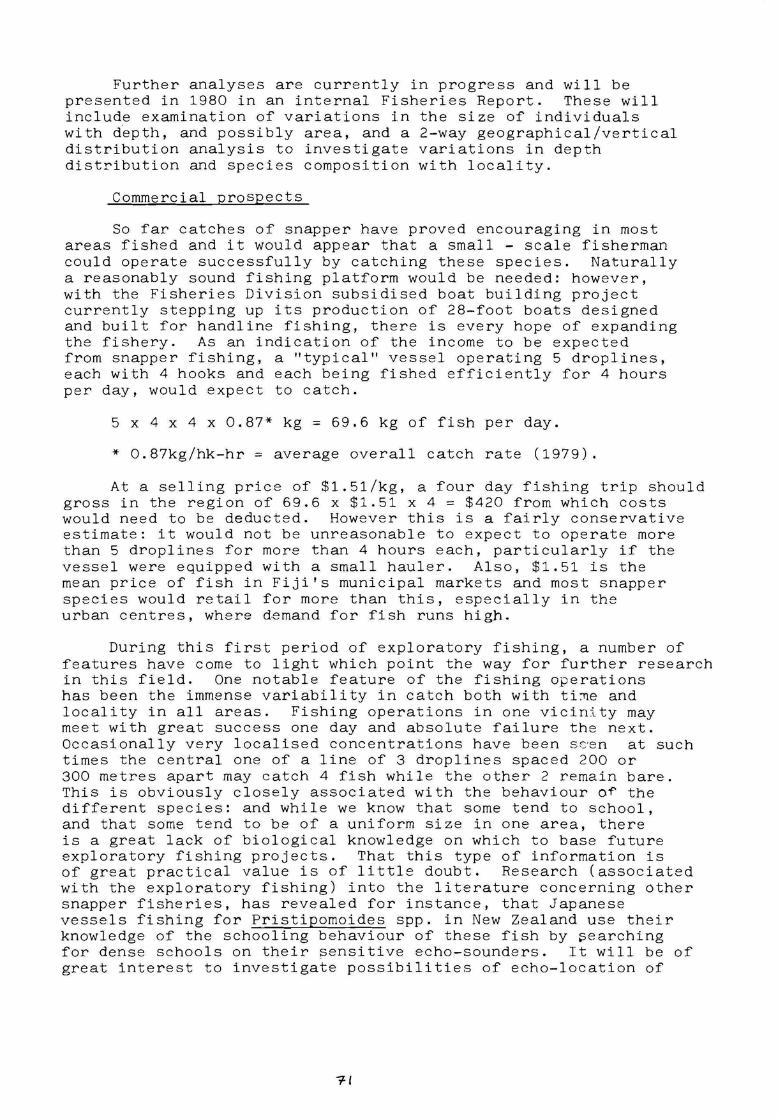
Further analyses are currently in progress and will be presented in 1980 in an internal Fisheries Report. These will include examination of variations in the size of individuals with d~pth, and possibly area, and a 2-way geographical/vertical distribution analysis to investigate variations in depth distribution and species composition with locality.
Commercial prospects
So far catches of snapper have proved encouraging in most areas fished and it would appear that a small - scale fisherman could operate successfully by catching these species. Naturally a reasonably sound fishing platform would be needed: however, with the Fisheries Division subsidised boat building project currently stepping up its production of 28-foot boats designed and built for handline fishing, there is every hope of expanding the fishery. As an indication of the income to be expected from snapper fishing, a "typical" vessel operating 5 droplines, each with 4 hooks and each being fished efficiently for 4 hours per day, would expect to catch.
5 x 4 x 4 x 0.87* kg= 69.6 kg of fish per day.
* 0.87kg/hk-hr = average overall catch rate (1979).
At a selling price of $1.51/kg, a four day fishing trip should gross in the region of 69.6 x $1.51 x 4 = $420 from which costs would need to be deducted. However this is a fairly conservative estimate: it would not be unreasonable to expect to operate more than 5 droplines for more than 4 hours each, particularly if the vessel were equipped with a small hauler. Also, $1.51 is the mean price of fish in Fiji's municipal markets and most snapper species would retail for more than this, especially in the urban centres, where demand for fish runs high.
During this first period of exploratory fishing, a number of features have come to light which point the way for further research in this field. One notable feature of the fishing operations has been the immense variability in catch both with ti~e and locality in all areas. Fishing operations in one vicinity may meet with great success one day and absolute failure the next. Occasionally very localised concentrations have been seen at such times the central one of a line of 3 droplines spaced 200 or 300 metres apart may catch 4 fish while the other 2 remain bare. This is obviously closely associated with the behaviour o~ the different species: and while we know that some tend to school, and that some tend to be of a uniform size in one area, there is a great lack of biological knowledge on which to base future exploratory fishing projects. That this type of information is of great practical value is of little doubt. Research (associated with the exploratory fishing) into the literature concerning other snapper fisheries, has revealed for instance, that Japanese vessels fishing for Pristipomoides spp. in New Zealand use their knowledge of the schooling behaviour of these fish by ~earching for dense schools on their sensitive echo-sounders. It will be of great interest to investigate possibilities of echo-location of
r-1
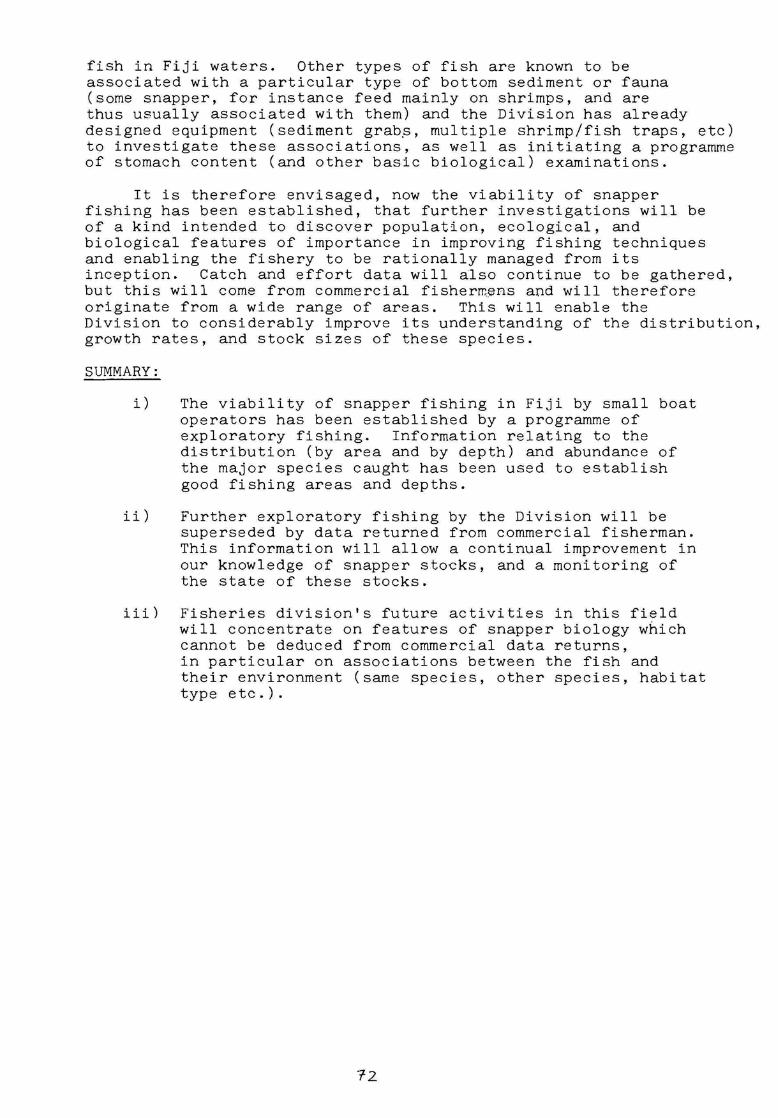
fish in Fiji waters. Other types of fish are known to be associated with a particular type of bottom sediment or fauna (some snapper, for instance feed mainly on shrimps, and are thus usually associated with them) and the Division has already designed equipment ( sediment grab.s, multiple shrimp/fish traps, etc) to investigate these associations, as well as initiating a programme of stomach content (and other basic biological) examinations.
It is therefore envisaged, now the viability of snapper fishing has been established, that further investigations will be of a kind intended to discover population, ecological, and biological features of importance in improving fishing techniques and enabling the fishery to be rationally managed from its inception. Catch and effort data will ~lso continue to be gathered, but this will come from commercial fisherrr~ns and will therefore originate from a wide range of areas. This will enable the Division to considerably improve its understanding of the distribution, growth rates, and stock sizes of these species.
SUMMARY:
i) The viability of snapper fishing in Fiji by small boat operators has been established by a programme of exploratory fishing. Information relating to the distribution (by area and by depth) and abundance of the major species caught has been used to establish good fishing areas and depths.
ii) Further exploratory fishing by the Division will be superseded by data returned from commercial fisherman. This information will allow a continual improvement in our knowledge of snapper stocks, and a monitoring of the state of these stocks.
iii) Fisheries division's future activities in this field will concentrate on features of snapper biology which cannot be deduced from commercial data returns, in particular on associations between the fish and their environment (same species, other species, habitat type etc.).
7-2
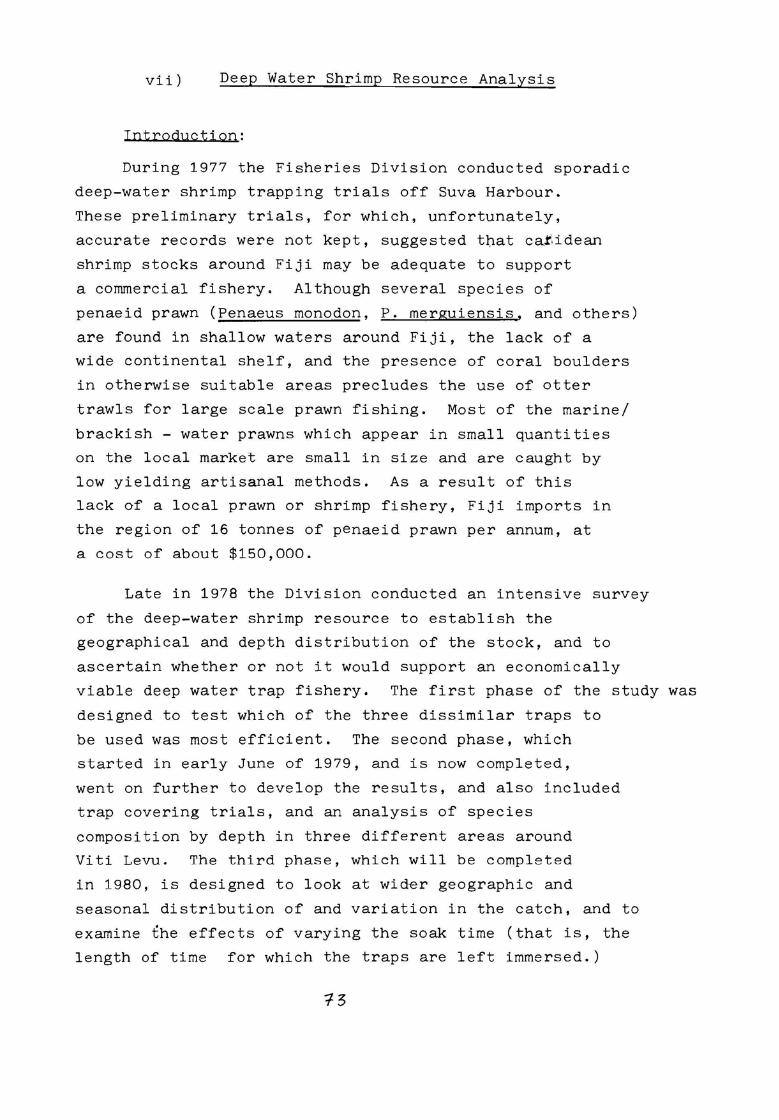
vii) Deep Water Shrimp Resource Analysis
Introduction:
During 1977 the Fisheries Division conducted sporadic
deep-water shrimp trapping trials off Suva Harbour.
These preliminary trials, for which, unfortunately,
accurate records were not kept, suggested that ca.t,idean
shrimp stocks around Fiji may be adequate to support
a commercial fishery. Although several species of
penaeid prawn (Penaeus monodon, P. merguiensis, and others)
are found in shallow waters around Fiji, the lack of a
wide continental shelf, and the presence of coral boulders
in otherwise suitable areas precludes the use of otter
trawls for large scale prawn fishing. Most of the marine/
brackish - water prawns which appear in small quantities
on the local market are small in size and are caught by
low yielding artisanal methods. As a result of this
lack of a local prawn or shrimp fishery, Fiji imports in
the region of 16 tonnes of penaeid prawn per annum, at
a cost of about $150,000.
Late in 1978 the Division conducted an intensive survey
of the deep-water shrimp resource to establish the
geographical and depth distribution of the stock, and to
ascertain whether or not it would support an economically
viable deep water trap fishery. The first phase of the study was
designed to test which of the three dissimilar traps to
be used was most efficient. The second phase, which
started in early June of 1979, and is now completed,
went on further to develop the results, and also included
trap covering trials, and an analysis of species
composition by depth in three different areas around
Viti Levu. The third phase, which will be completed
in 1980, is designed to look at wider geographic and
seasonal distribution of and variation in the catch, and to
examine the effects of varying the soak time (that is, the
length of time for which the traps are left immersed.)
13
It is also hoped to obtain information on distribution of
shrimps in relation to environmental variables such as
sediment type, oceanographic conditions etc., and on growth
and reproductive characteristics.
Dominant species:
Almost all the shrimps caught to date have been carids
of the family Pandalidae. Three genera - Heterocarpus,
Plesionika and Parapandulus - are represented by 6 main species,
which have been assigned the following provisional scientific
and vernacular names:
Heterocarpus gibbosus
Heterocarpus ensifer (sibogae)
Heterocarp4s laevigatus
Plesionika longirostris
Plesionika martia
high crowned shrimp
two spined shrimp
red tipped shrimp
stars and stripes shrimp
none
Parapandulus se~ratifrons pyjama shrimp
(The information on phase I and on general methodology contained
in this annual report is summarised from Fisheries Division
Technical report No. I, in which more detailed information and
discussion on phase I of the project can be found.)
Of the 6 species, the three Heterocarpus are by far the
most plentiful, and would probably form the basis to any
commercial fishery for shrimps. Nevertheless, the smaller
Plesionika longirostris cannot be dismissed as, although
less abundant, the non-Heterocarpus species appear to have
higher recovery rates (the proportion of high-value tail meat
expressed as a percentage of total weight). Plesionika
longirostris also has the added attraction of being found in
more accessible shallow water. The other two species have not,
so far, been found in quantities sufficient to justify a
fishery aimed at them.
Phase I (For more detail see Fisheries Division
technical report No. 1)
The three trap types to be tested were similar to those
used in other parts of the Pacific, notably Hawaii, Guam and
New Caledonia, and were as follows:
74
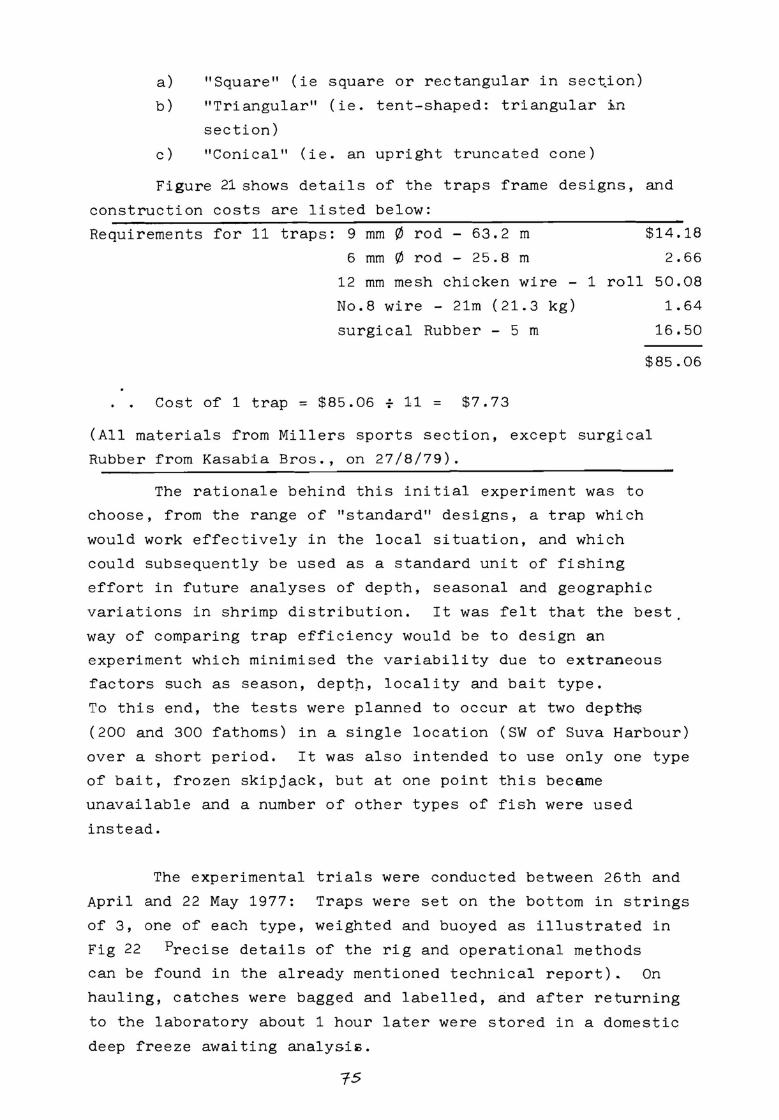
a) "Square" (ie square or rectangular in sect.ion)
b) "Triangular" (ie. tent-shaped: triangular in
section)
c) "Conical" (ie. an upright truncated cone)
Figure 21 shows details of the traps frame designs, and
construction costs are listed below:
Requirements for 11 traps: 9 mm 0 rod - 63.2 m $14.18
6 mm ¢ rod - 25.8 m 2.66
12 mm mesh chicken wire - 1 roll 50.08
No.8 wire - 21m ( 21. 3 kg) 1.64
surgical Rubber - 5 m 16.50
$85.06
Cost of 1 trap= $85.06 f 11 = $7.73
(All materials from Millers sports section, except surgical
Rubber from Kasabia Bros., on 27/8/79).
The rationale behind this initial experiment was to
choose, from the range of "standard" designs, a trap which
would work effectively in the local situation, and which
could subsequently be used as a standard unit of fishing
effort in future analyses of depth, seasonal and geographic
variations in shrimp distribution. It was felt that the best
way of comparing trap efficiency would be to design an
experiment which minimised the variability due to extraneous
factors such as season, deptn, locality and bait type.
To this end, the tests were planned to occur at two depth'$
(200 and 300 fathoms) in a single location (SW of Suva Harbour)
over a short period. It was also intended to use only one type
of bait, frozen skipjack, but at one point this became
unavailable and a number of other types of fish were used
instead.
The experimental trials were conducted between 26th and
April and 22 May 1977: Traps were set on the bottom in strings
of 3, one of each type, weighted and buoyed as illustrated in
Fig 22 Precise details of the rig and operational methods
can be found in the already mentioned technical report). On
hauling, catches were bagged and labelled, and after returning
to the laboratory about 1 hour later were stored in a domestic
deep freeze awaiting analysi~.
15
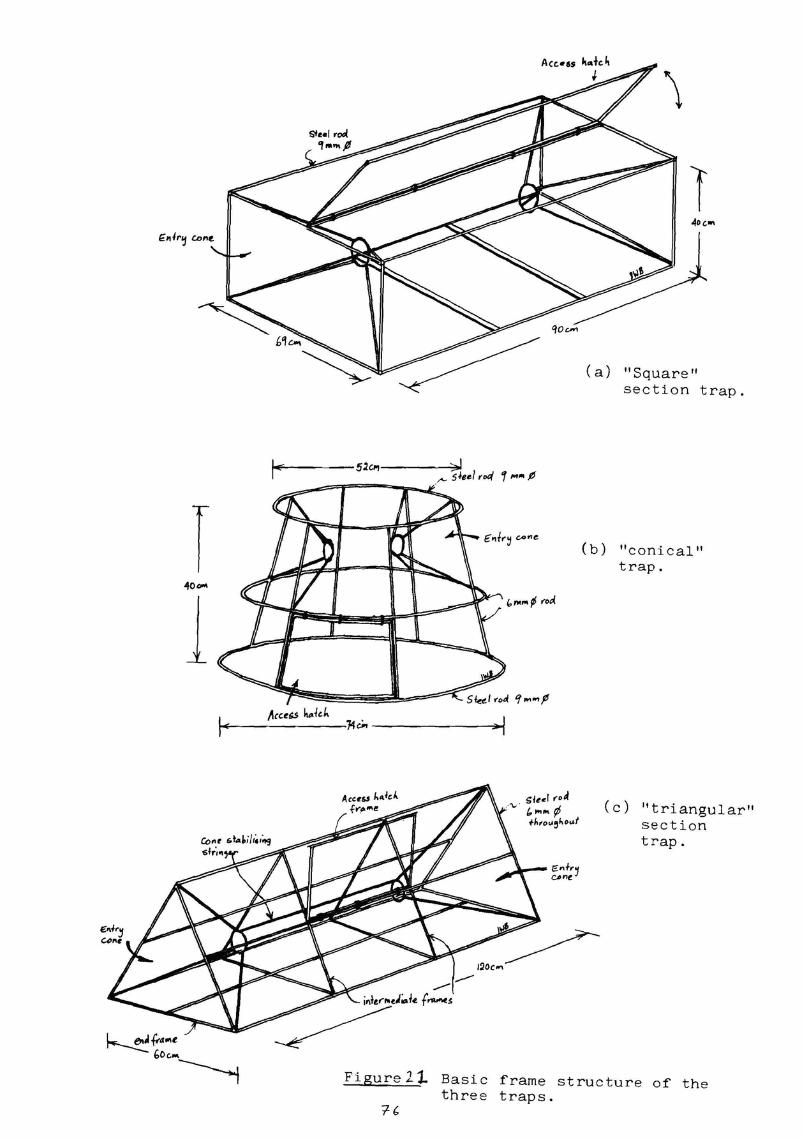
,~ I
40-
l 1-r
l,cce'5 h1>-./d,
5.2"'1
'k~
"" sJeel ,.q 1 ,..,. fJ
~lt!.,1 ,.-od
""'"' ¢ fnfoi,llj~O .. f
1
(a) "Square" section trap.
( b) "conical" trap.
( c) "t ri angular" section trap.
Figure 21 Basic frame structure of the three traps.
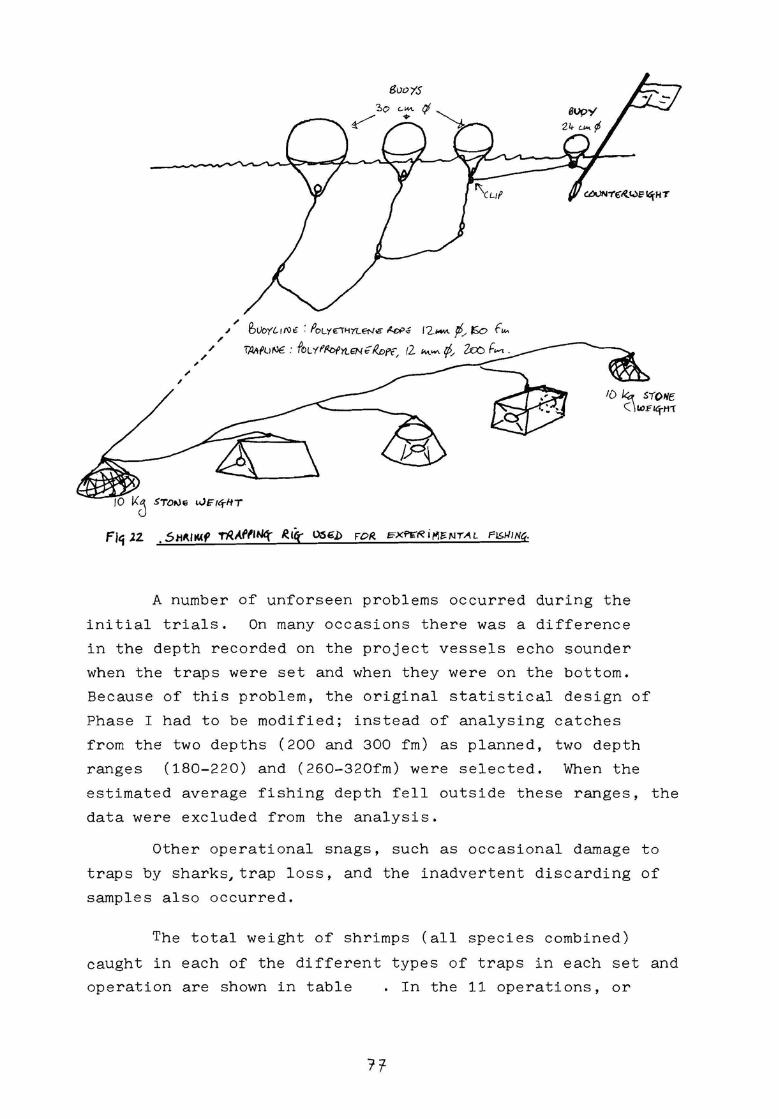
,. ",. ~Uo'(l1Ne : PoLyE"THYLEN€ N;,P.f 12-. /,, ,So f,,,,
,/ ~('uNE : fovrfr¾:,fYLtNei<L>Pf, 12 ""-'"' rf., 2aJ f..,,,.
,,."~ ---- ~
A number of unforseen problems occurred during the
initial trials. On many occasions there was a difference
in the depth recorded on the project vessels echo sounder
when the traps were set and when they were on the bottom.
Because of this problem, the original statistical design of
Phase I had to be modified; instead of analysing catches
from the two depths (200 and 300 fm) as planned, two depth
ranges (180-220) and (260-320fm) were selected. When the
estimated average fishing depth fell outside these ranges, the
data were excluded from the analysis.
Other operational snags, such as occasional damage to
traps by sharks, trap loss, and the inadvertent discarding of
samples also occurred.
The total weight of shrimps (all species combined)
caught in each of the different types of traps in each set and
operation are shown in table . In the 11 operations, or
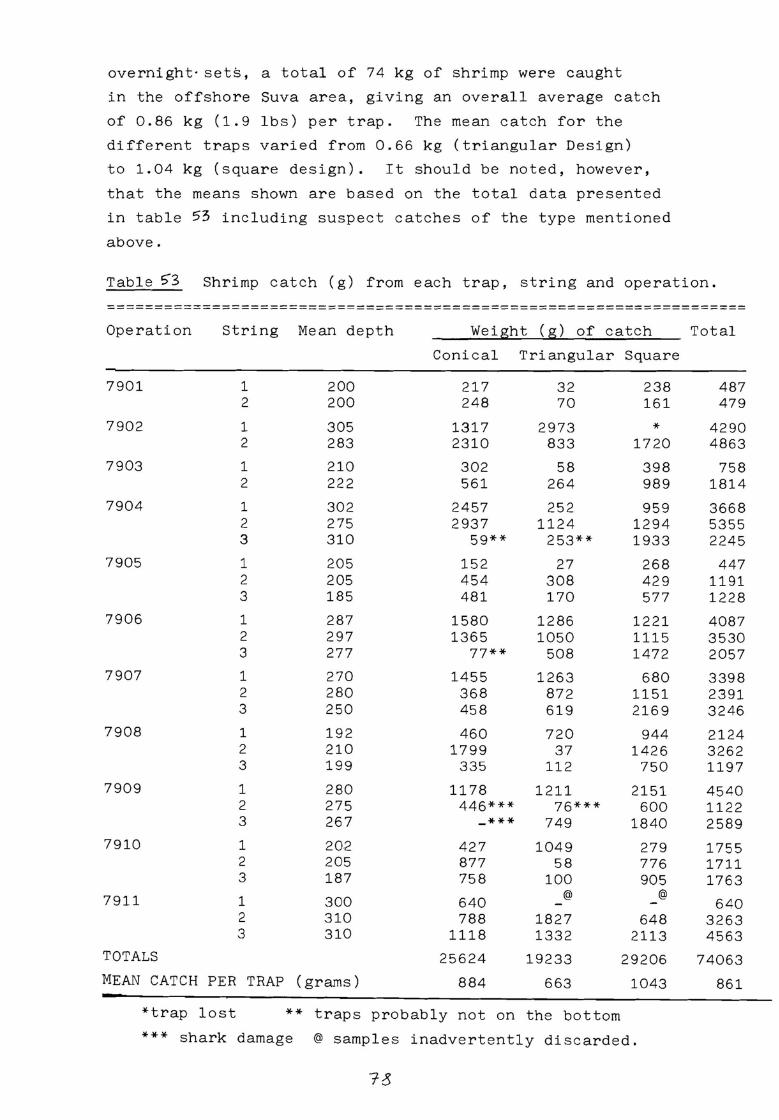
overnight· sets, a total of 74 kg of shrimp were caught
in the offshore Suva area, giving an overall average catch
of 0.86 kg (1.9 lbs) per trap. The mean catch for the
different traps varied from 0.66 kg (triangular Design)
to 1.04 kg (square design). It should be noted, however,
that the means shown are based on the total data presented
in table 53 including suspect catches of the type mentioned
above.
Table ~3 Shrimp catch (g) from each trap, string and operation.
==--==---=--------=---=------=-----------=-------------------------Operation
7901
7902
7903
7904
7905
7906
7907
7908
7909
7910
7911
TOTALS
String Mean depth
1 2
1 2
1 2
1 2 3
1 2 3
1 2 3
1 2 3
1 2 3
1 2 3
1 2 3
1 2 3
200 200
305 283
210 222
302 275 310
205 205 185
287 297 277
270 280 250
192 210 199
280 275 267
20-2 205 187
300 310 310
MEAN CATCH PER TRAP (grams)
Weight (g) of catch
Conical Triangular Square
217 248
1317 2310
302 561
2457 2937
59**
152 454 481
1580 1365
77**
1455 368 458
460 1799
335
1178 446***
***
427 877 758
640 788
1118
25624
884
32 70
2973 833
58 264
252 1124
253**
27 308 170
1286 1050
508
1263 872 619
720 37
112
1211 76***
749
1049 58
100 @
1827 1332
19233
663
238 161
* 1720
398 989
959 1294 1933
268 429 577
1221 1115 1472
680 1151 2169
944 1426
750
2151 600
1840
279 776 905
@
648 2113
29206
1043
*trap lost ** traps probably not on the bottom
*** shark damage @ samples inadvertently discarded.
Total
487 479
4290 4863
758 1814
3668 5355 2245
447 1191 1228
4087 3530 2057
3398 2391 3246
2124 3262 1197
4540 1122 2589
1755 1711 1763
640 3263 4563
74063
861
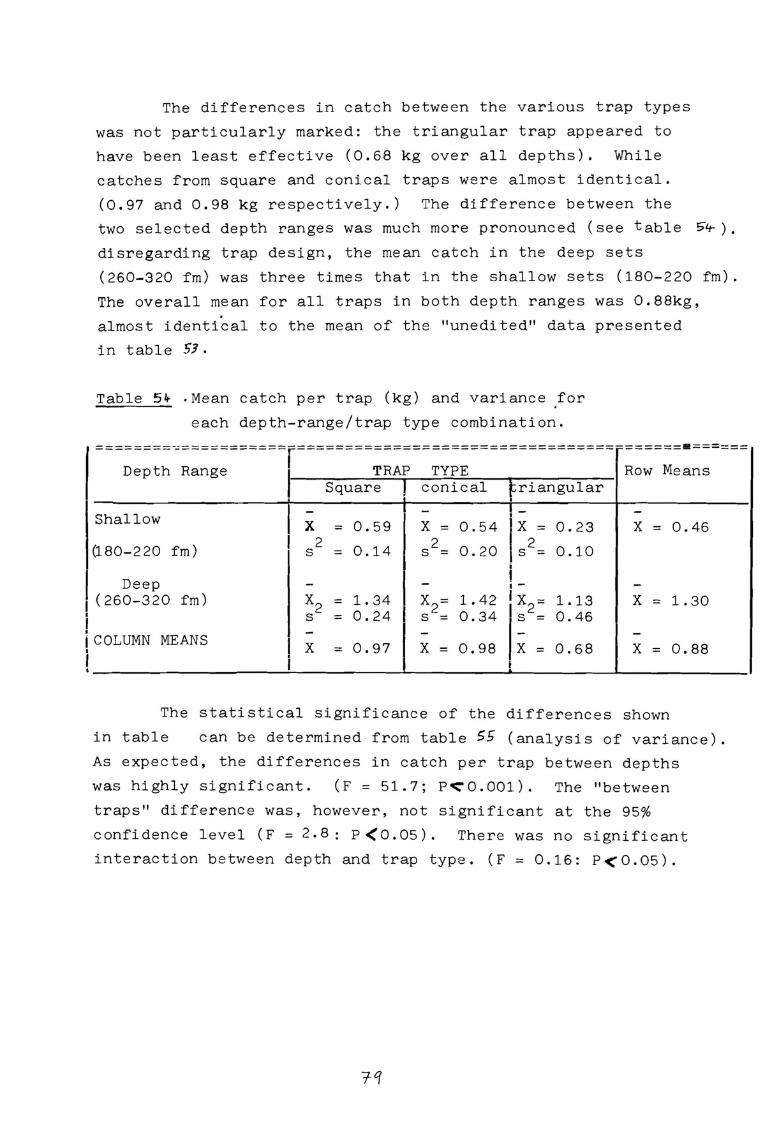
The differences in catch between the various trap types
was not particularly marked: the triangular trap appeared to
have been least effective (0.68 kg over all depths). While
catches from square and conical traps were almost identical.
(0.97 and 0.98 kg respectively.) The difference between the
two selected depth ranges was much more pronounced ( see table '5'4-).
disregarding trap design, the mean catch in the deep sets
(260-320 fm) was three times that in the shallow sets (180-220 fm).
The overall mean for all traps in both depth ranges was 0.88kg,
almost identical to the mean of the "unedited" data presented
in table SJ.
Table 5~ ,Mean catch per trap (kg) and variance for
each depth-range/trap type combination.
========~===========r==========-==-==-==-=--=--=-----=--==-== -------===
Depth Range I TRAP TYPE Row Means
I Square I conical Fri angular I
Shallow I - -
I :2: -
X = 0.59 X = 0. 54 0.23 X = 0.46
(180-2 20 fm) 2
0.14 2 0. 20 0 .10 s = s = I
Deep - - I .- -(260-3 20 fm) x2 = 1.34 X = 1.42 IX - 1.13 X = 1.30 2-
0.24 I 2 0.34 Is= 0.46 s = s = - - - -COLUMN MEANS I X = 0 .. 97 X = 0.98 X = 0.68 X = 0.88
I
I
The statistical significance of the differences shown
in table can be determined from table 55 (analysis of variance).
As expected, the differences in catch per trap between depths
was highly significant. (F = 51.7; P~0.001). The "between
traps" difference was, however, not significant at the 95%
confidence level (F = 2.8: P <0.05). There was no significant
interaction between depth and trap type. ( F = O .16: p < O. 05).
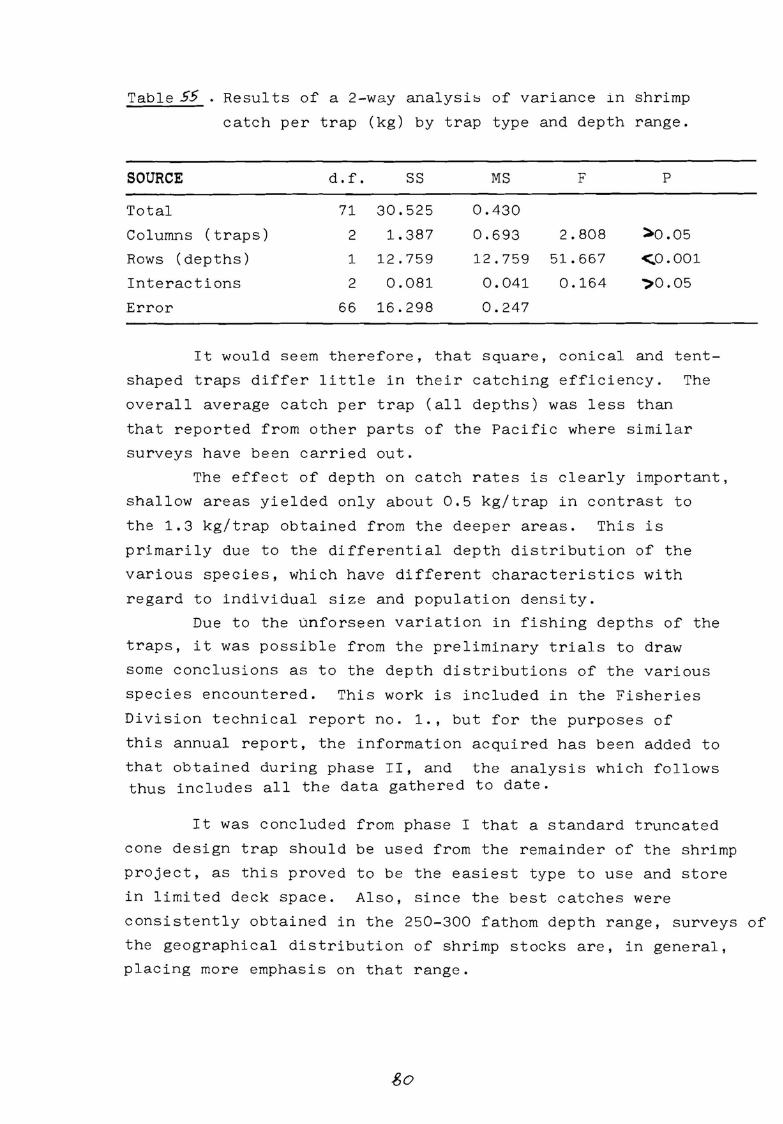
Table 55. Results of a 2-way analysi~ of variance in shrimp
catch per trap (kg) by trap type and depth range.
SOURCE d.f. ss MS F p
Total 71 30.525 0.430
Columns (traps) 2 1.387 0.693 2.808 ~0.05
Rows (depths) 1 12.759 12.759 51.667 <0.001
Interactions 2 0.081 0.041 0.164 ,0.05
Error 66 16.298 0.247
It would seem therefore, that square, conical and tent
shaped traps differ little in their catching efficiency. The
overall average catch per trap (all depths) was less than
that reported from other parts of the Pacific where similar
surveys have been carried out.
The effect of depth on catch rates is clearly important,
shallow areas yielded only about 0.5 kg/trap in contrast to
the 1.3 kg/trap obtained from the deeper areas. This is
primarily due to the differential depth distribution of the
various species, which have different characteristics with
regard to individual size and population density.
Due to the unforseen variation in fishing depths of the
traps, it was possible from the preliminary trials to draw
some conclusions as to the depth distributions of the various
species encountered. This work is included in the Fisheries
Division technical report no. 1., but for the purposes of
this annual report, the information acquired has been added to
that obtained during phase II, and the analysis which follows thus includes all the data gathered to date.
It was concluded from phase I that a standard truncated
cone design trap should be used from the remainder of the shrimp
project, as this proved to be the easiest type to use and store
in limited deck space. Also, since the best catches were
consistently obtained in the 250-300 fathom depth range, surveys of
the geographical distribution of shrimp stocks are, in general,
placing more emphasis on that range.
~o
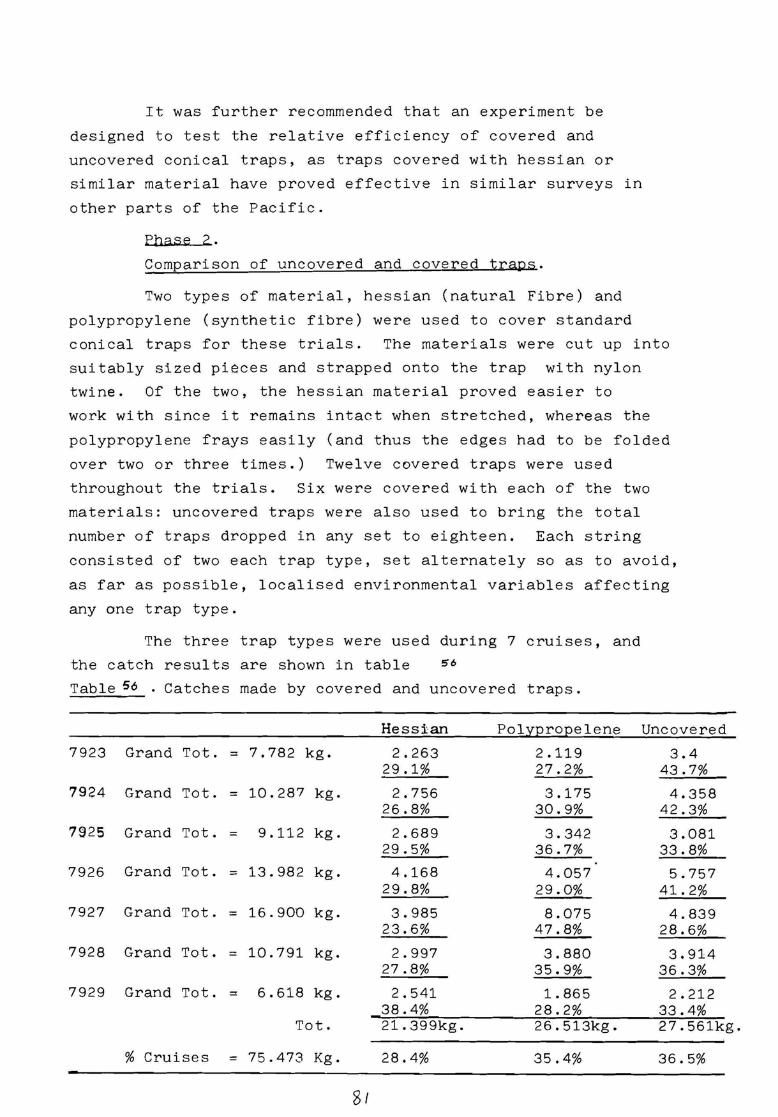
It was further recommended that an experiment be
designed to test the relative efficiency of covered and
uncovered conical traps, as traps covered with hessian or
similar material have proved effective in similar surveys in
other parts of the Pacific.
Phasi=: 2.
Comparison of uncovered and covered traps.
Two types of material, hessian (natural Fibre) and
polypropylene (synthetic fibre) were used to cover standard
conical traps for these trials. The materials were cut up into
suitably sized pieces and strapped onto the trap with nylon
twine. Of the two, the hessian material proved easier to
work with since it remains intact when stretched, whereas the
polypropylene frays easily (and thus the edges had to be folded
over two or three times.) Twelve covered traps were used
throughout the trials. Six were covered with each of the two
materials: uncovered traps were also used to bring the total
number of traps dropped in any set to eighteen. Each string
consisted of two each trap type, set alternately so as to avoid,
as far as possible, localised environmental variables affecting
any one trap type.
The three trap types were used during 7 cruises, and
the catch results are shown in table '56
Table 56 . Catches made by covered and uncovered traps .
Hessian Pol~:'.]2ro2e lene Uncovered
7923 Grand Tot. = 7,782 kg. 2.263 2.119 3.4 29.1% 27.2% 43.7%
7924 Grand Tot. = 10.287 kg. 2.756 3.175 4.358 26.8% 30.9% 42.3%
7925 Grand Tot. = 9.112 kg. 2.689 3.342 3.081 29.5% 36.7% 33.8%
7926 Grand Tot. = 13.982 kg. 4.168 4.057 5.757 29.8% 29.0% 41.2%
7927 Grand Tot. = 16.900 kg. 3.985 8.075 4.839 23.6% 47.8% 28.6%
7928 Grand Tot. = 10.791 kg. 2.997 3.880 3.914 27.8% 35.9% 36.3%
7929 Grand Tot. = 6.618 kg. 2.541 1. 865 2.212 38.4% 28. 2% 33.4%
Tot. 21. 399kg. 26.513kg. 27.561kg.
% Cruises = 75.473 Kg. 28.4% 35.4% 36.5%
81
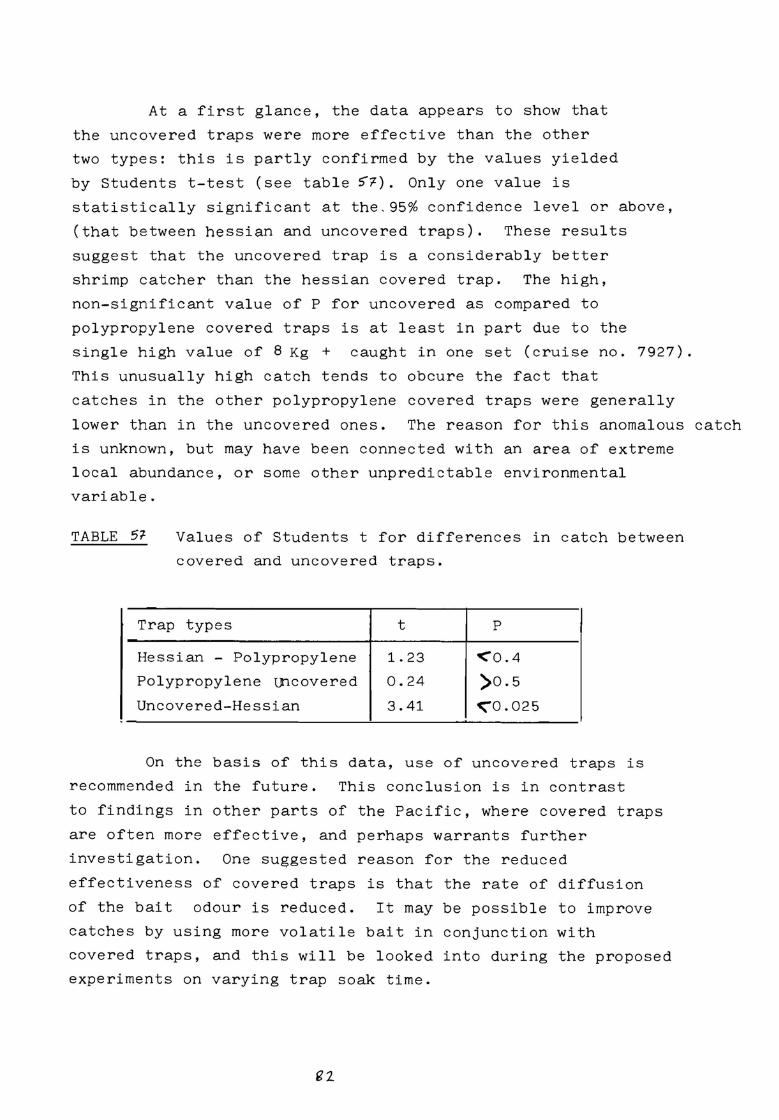
At a first glance, the data appears to show that
the uncovered traps were more effective than the other
two types: this is partly confirmed by the values yielded
by Students t-test (see table ~1). Only one value is
statistically significant at the,95% confidence level or above,
(that between hessian and uncovered traps). These results
suggest that the uncovered trap is a considerably better
shrimp catcher than the hessian covered trap. The high,
non-significant value of P for uncovered as compared to
polypropylene covered traps is at least in part due to the
single high value of 8 Kg + caught in one set (cruise no. 7927).
This unusually high catch tends to obcure the fact that
catches in the other polypropylene covered traps were generally
lower than in the uncovered ones. The reason for this anomalous catch
is unknown, but may have been connected with an area of extreme
local abundance, or some other unpredictable environmental
variable.
TABLE 57- Values of Students t for differences in catch between
covered and uncovered traps.
Trap types t p
Hessian - Polypropylene 1.23 <"'O. 4
Polypropylene uncovered 0.24 )0.5
Uncovered-Hessian 3.41 "o. 025
On the basis of this data, use of uncovered traps is
recommended in the future. This conclusion is in contrast
to findings in other parts of the Pacific, where covered traps
are often more effective, and perhaps warrants further
investigation. One suggested reason for the reduced
effectiveness of covered traps is that the rate of diffusion
of the bait odour is reduced. It may be possible to improve
catches by using more volatile bait in conjunction with
covered traps, and this will be looked into during the proposed
experiments on varying trap soak time.
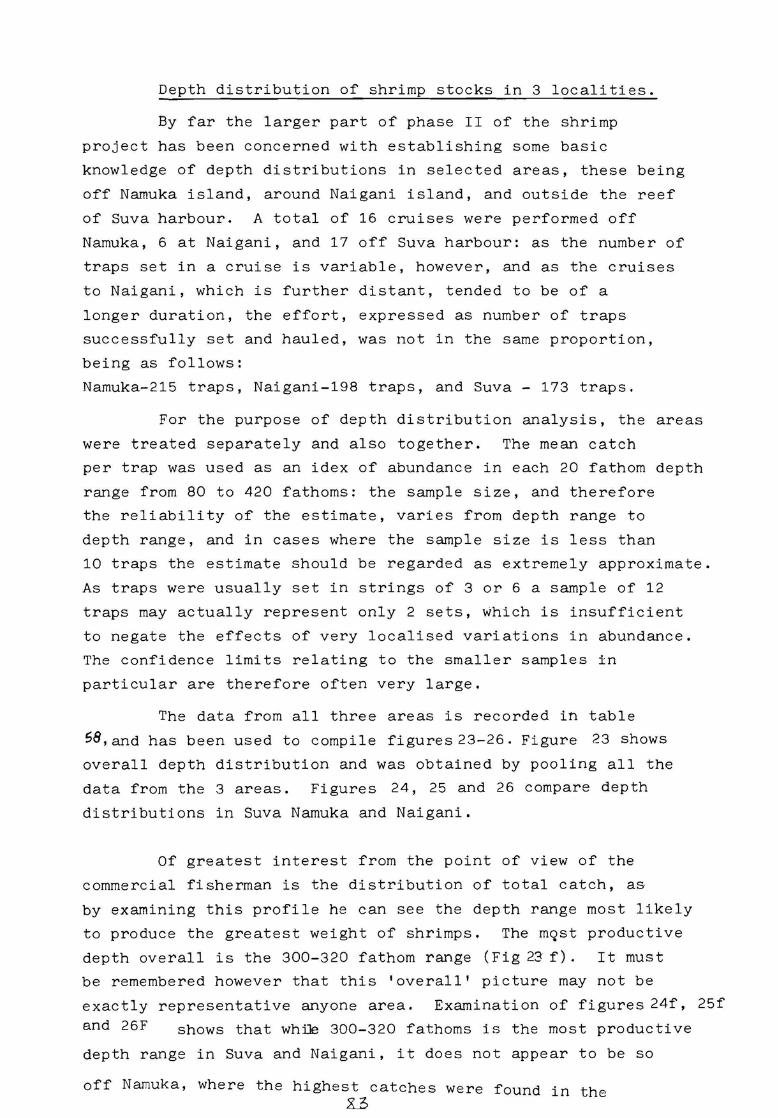
Depth distribution of shrimp stocks in 3 localities.
By far the larger part of phase II of the shrimp
project has been concerned with establishing some basic
knowledge of depth distributions in selected areas, these being
off Namuka island, around Naigani island, and outside the reef
of Suva harbour. A total of 16 cruises were performed off
Namuka, 6 at Naigani, and 17 off Suva harbour: as the number of
traps set in a cruise is variable, however, and as the cruises
to Naigani, which is further distant, tended to be of a
longer duration, the effort, expressed as number of traps
successfully set and hauled, was not in the same proportion,
being as follows:
Namuka-215 traps, Naigani-198 traps, and Suva - 173 traps.
For the purpose of depth distribution analysis, the areas
were treated separately and also together. The mean catch
per trap was used as an idex of abundance in each 20 fathom depth
range from 80 to 420 fathoms: the sample size, and therefore
the reliability of the estimate, varies from depth range to
depth range, and in cases where the sample size is less than
10 traps the estimate should be regarded as extremely approximate.
As traps were usually set in strings of 3 or 6 a sample of 12
traps may actually represent only 2 sets, which is insufficient
to negate the effects of very localised variations in abundance.
The confidence limits relating to the smaller samples in
particular are therefore often very large.
The data from all three areas is recorded in table
58, and has been used to compile figures 23-26. Figure 23 shows
overall depth distribution and was obtained by pooling all the
data from the 3 areas. Figures 24, 25 and 26 compare depth
distributions in Suva Namuka and Naigani.
Of greatest interest from the point of view of the
commercial fisherman is the distribution of total catch, as
by examining this profile he can see the depth range most likely
to produce the greatest weight of shrimps. The mQst productive
depth overall is the 300-320 fathom range (Fig 23 f). It must
be remembered however that this 'overall' picture may not be
exactly representative anyone area. Examination of figures 24f, 25f
and 26F shows that whiJe 300-320 fathoms is the most productive
depth range in Suva and Naigani, it does not appear to be so
off Namuka, where the highest catches were found in tho X__3 '--'
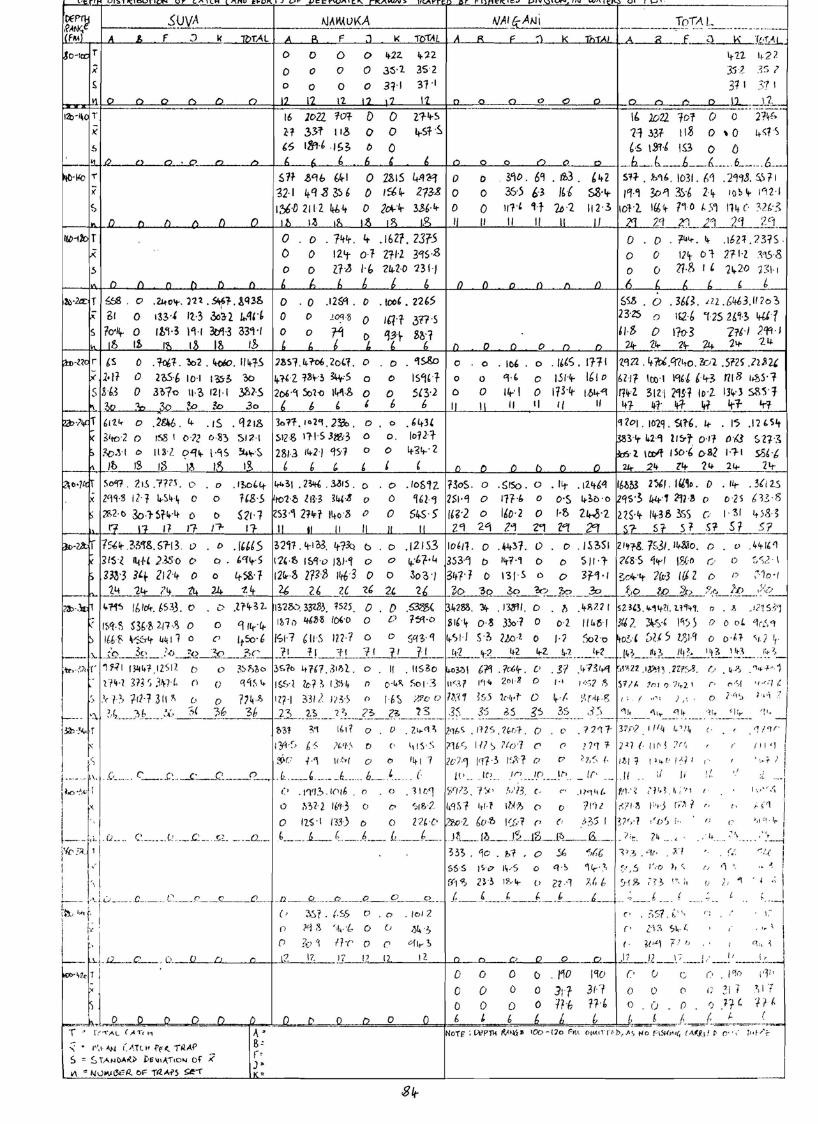
"
/\JAflALJKA ToTAL ---- - . ---- .---·- ,,_,_ ---·--------•····· ... --f f'---~.J'----'-'k·_--'Jb""-"-TA-"'LC.+--<->---.....__--''---~~~'---~"-=-+-'-~~-~-~~-~__..~--A.__&__.f ,1 K J~!,~
0 D 0 0
0 0 0 0 0 0 0 0
it22.
.35·1
3ll
lt12 11-2?
311 S'1 I
0 O Cl D J]_ __ I '2. _
Ii. 20?1 101 0 o 2Af, 'H .337- I IS O , 0 4-~1'> t-s t.9H tS.3 o ()
.~~~~1----'-'-----~~~~~~--+-'-'~~-><--~~-----""--f--b.-.L-.b ___ /i. ___ _ . 6 _____ /:i __ Q_..:_Q_
S?f .8% 64-1 0 ZSl5 '32-1 ti.9 ~ 3'.> 6 0 1~4-1:'.,6·D 2112 lib·lt 0 2cA-'lt-
4-'l'c'f 0 2?3-.8 0
3.%·4- 0
0
0
0
i'io. 69 . 12>3. €1t2 ~H-. Ml.. 1031. 6"1 .24'!J. ~\ti 3$·5 6,-3 ,~c 5-8·4- l'l'l 3o-'1 3.)-6 Z·lt IQb It- 192-1
111-L 1-t 'U-7. II 2·3 IO'l-·2. lf61t 7'l O I. 5'1 ltlf C ?U·?,
,..--~·....____......__...,._______..,_______._._______,...._-+-~~~~.____--'-"''---........._ _ __.,_.,___+-'-''---~-~l~I -~I ~I -~---'-'-I ----1.....,.__.__----"2""'.<i'-----'zl___ 2.:J--2'i ? <'J 1i I II
. ~01t-. ,n. %1-. !qU, ,33 ., li-3 .3o~2 J..lfd
0 11''!-3 l'H 3lfl·3 33'l ·I ,i I I lb 0 .T<ll,1. ~2. ~- llit-1-.S c) 2o.S-6 I0·I I~~ &> 0 3'1>7o ll·?> 121•1 Y-,]·.S
'""'--~;\,...,__~,1",Q ~ &, 3o
0 . 2W, . 4 • I 5 . Cj 2 12>
0 0 . 11tlt. '1- .1621. 237-5 o. jl44-. It .t6H.23?S. 0 0 12lt o-1 211·2 3"1S·g 0 ll't- C> 1 21- l·Z ~'\S-8
2H H, 24-2-o '231 · ! O l1-8 I ' '21t20 r<1-1
' I, .125"1. O . 100, . 22,s $S.& • 0 . 36(~. ,ll _[,41.,3,11 to:,
0 10'13 0 ,,n :;n-s 23-25 () IQ·& '125 2lH 4-U 1 0 14 () 1.3\- 3&·? &l-15 0 17o-3 7.?(, ·/ 2'r1· J
{, 2lt 1.4- Zit- Z4- 24- 1.i.
.0 . '1s.&o 0 . 0 . IO~ . o .,as. IHI 1_q22. '+?ri.97110. &:,1 .sns .h?>U
0 0 IS'1' t 0 0 "I·' C 15l·'t- 1610 /,2/1 lro·I 19,t 6 4·3 mB 1..r:,5·1
0 0 5{3·2 0 0 llt-·I 0 113·4- l-61+,"1 f'lit-2 3121 2'lH 10·2 131,:J ss~<f
' 6 6 I I II ti I/ II 41- 4l 1/-1" ltf H lrt
Jo?'f,1°2'1 . 2~. o, o .,43, '1201. 10'29.SI?·{,. ~ . 15 .IHSlt 1S8 I C>?2 r,.lJ°) :'.>12·1 512 g IHS 3/f,3 O o . loU't 3 'r t.M ll';,-"f o·l"I Oil $ 27-~ llH O'llt- I·% ~""~ 281-3 ili-21 'lS·1 ° 0 4-51t-· 2 -2 lc:o't 1so·6 oS2 1·7-1 s5N,
________ 1S~1GL~~-~--~t'------"-6-~'--=--'-~'--'--+--'-'-.......... '--"''--......... -"'------+-~~2_4_~l'-t-~-'-~-2~~--2-~--1 So'it. 21S .Tm. C,
. X zcns 12-1 4-Slt ~ 0
~2- o 3o-r 5r1t-·tt 0
..!l. 11 17-751,ft. ?,~'f&. 51-13. ()
115-z ~H 2350 0
:m·3 3q_ 212-~ 0
0
0
C ,,. D
Q.
0
. l~o,4-WB 521· t Ir
. IWS ,<ft,.·S
4-SH
l,l,~I • 2~ . .3.<51S. o . o . lo&,Z. r3oS. o .5ISo. o . 14- . 1211-t:4 16M3 2'Jf:/. 1'61o. D . I'-,- . 3Ci 25 to'N) lB-3 ~i.,-.8 0 0 'W-"1 251.q O 111-·l, 0 o·s 4-3b·o 'IS'~ 114·1 2lH O o·2S 6'1s-8 m-~ 2'fH llw.11 •' 0 S4-S · 5 1,i-2 o 160·2 O I·& 24-,6·2 2Z5·1t- lii--38 .)SS c I '51 4:,S-~ I I I 29 2'1 2"'1 Z"I 2"'! 2°1 i?- Sr .St H- Sr 57
32~1.1tlo3. 1t-r3ci b . o .12153 10,11. O .4-4.3"1. 0 . o . l.s2>51 21fr8 7£.3/.14-&lo. o o .4'tll'l
12,-~ l&'h> 1~1·1 o o 4-·l.7-•4 353·"1 o llt7·1 o c, S ll ·r ?(S·S ~ei,I l&·n C- o :',';?. I
12C..-3 zns tltf,3 0 0 30?>·1 34?·1 C, 13f·.S O O 3f'H ?,o4-'1t 2(.c·3 cuz D O :10-1
'2.4 _ '24- ?It ~~~~-_,_-~21,~~ZL_Zl ,, 2, '2 ?,o ~o 3o '?o _z.:, __ 3o _f,o t,o :J.o 71-!........!!..i_.::<r: 2.4 1. 4-1,.1-'!S 1/,lc:lt. g,33. C' • V .lr'+-32. i?,2&~ 33<83. 1525. D . D -~' 1+283. '.lit . '~'- D . lJ .~sn I H,3.lf-14-21. tl14t " . t, .121s.;;,1 fl>'f-5 S3!;-~2./?·,~ 0 0 9ttr·4, 1i10 4'1l 8 f()(,·o O {.,J t~·O sin o-'3 33o·1 0 o-2 114151 3U?. ~~-, \'i'.>~ () ()OL 'lr.',"!
l/,61'- ~--S::A (j~/t 0 C' lt5o·6 1-s,-1 bllS 112•7 0 D '.,CB-'1 lt--'>i·/ n, 2}.t:,-2 0 1·7 5oi-o ot., ;;us v,,q O o·l:1- ~,.J 1, .
-·· ).. _;,'o ___ .3r., ___ }<> ... 3o~'o __ )',(' _rl tl_cr-1 ___ ·:,, r' u _____ li-2 ___ ~-? . 42 4-2 _ _ ~-?. ____ 1~2 ____ M ___ rt1?, __ _/t1~- 1113 lid ,._ i:,.,. tr:,·:,?, r 11-71 l~lt1.12Sil o o 3'.>Mo :,b?t> l1U7.311',2., o Ii . IIS3o o3'-:>l l?'l .tc6lr. l' . l? _td' 'llt'f _,r,22.t,1,\1'., .227'.·,~. r.,. ~-!', _~,,-,•")
. UH~73';Jlff(, 0 () 'l%t.. 1~~,·l 1c-:n,U:;1, n o·lt!l,foi<~ 11'-37 1"1 ·1t 2018 o I·• 1•:S? ,~ S?N 1n 1r,·,>,.i_ 1 r• n·',I ,,,,.-If_
;, .'d:,'1-12-13111' (,> 0 774.9:, 11,-1 331/ 1'3-> (> lb~ 1,?[)0733 1 l55 2c-,,,t O it·/. ~\[ •IH'. ,, I.,., /,', • 0 1 ''') h•i1:• ·::. ?--~---· :,,1, ____ :~'., ;c 3b 36 2} __ 2.~----' -"~--- n ?.<', ____ ?_~---35 ___ ~_:5 35 gs 3:, 3 _ .. :_ -~'.'---"'• __ 01, ____ '1~'.-~1.'.>-:.... ·1,.
3a,-~ ..... r i~1 3'1 1~1? o V .2,.<1', ?.'lb~ Jll ~, .1(.r.•'t. O l' ?'2'11- 3,r,;>_1//,4 l,'/4 ( · . , ,•1!'Jr'
1~ 1?(1-~, {,":- ,'~</., o c• 1,1'.i · \ 71V, lll':,?r0'1 C' () /7'T"f 2~7(.11H ?r', , r 1,1,1 1
,:; ~l' '/.'\ H·'.-.1 o c, 11t1? zc l-1 1,11-3 l'.,q- o o ~7,~, /, 12>11 !''-'·' /J·/ 1 , -. ·, •• ;. J /
'---- '11,. __r • .. .. c ___ c, ... ...c· _c, _____ o ...•. b. ______ L ___ .L . .. /i __ L _ ( /(' __ 1r,_ 1n __ _1_r, ____ !,., _ 1r• ...... II :/ J; r /. , 1 1 •,c')·f,(; r ( 1 .11(r,?.U)16' n O . -~11:,<l '[/"I I ?), }Sl 1 ,1,/13, (, (·' ,11"1't(~ 1/l,,;: ;·1 1d,t1 ; .,., ( I,., .. ·.~
~ \) .~,2-2 16',-3 0 r;, ',1&? (1<J~d 1,1-1 tNJ:, c, o tl'i l ;<:? I ?i 1i 1,.J Ii,, f ,, r, /. ('l
0 I1s·I m) D O tU·C• 2:co). {,o -'b l"..S·i' (> (, _;\?,,'.> I ??',·1 ,'o', /.. 1·' (C
1--·· ,,. 1 o .. .. c ___ __ t , __ c .. .o. __ __ (.l_ t ___ ___ fi. ___ r, _______ 1, ____ f, ______ r, __ 1ll ___ f);, ___ 1~ 13 __ 10 _ ____ 13. __ _ __ 11r. 74 __ , . _. ,, :•, ____ .-:• •.• .J f'lv.';. 1 \ 33?,. r,o . ,:,1 • o 5G "',(,(, ,,~. •·11- . q r:t( I
I i ,. ~ !, 1 ,· SSS \S·o l~ •·S o <l·~ '1~- ., ~-',S I',,:, 1, ' r, ' ··. ·
:,;' I•, I r 4 . . i rr-i,;,._, 2L~ 1~.·~ c., zz.•1 J, .,f, :;,f9, n.~ ,,,;, 1, ;, '.,,
:. -- :' J,:. _____ c ___ __ c .. _, __ <'.' _ __ "·~· ____ ./l _ D . .. . Qc__....,O,c__ O _ _ __ C> ___ (,_ __ _ ( ___ _{, ___ {. ___ {, _ __ _ _(, ____ •• • ;, ___ _{ ., •• r . ..... -- ;_ --1 :~' ''"f' I c, :.'Dr. t.ss tJ . o . 101 2 ,, . ?, 'S7. i, "·, ; i·._-. I l . " ' ( l :· I o ,.,,., ·,,,.-•• o ., ot. ·.1, r• z-,. :, ~~-. , Ir\
, I [J ?o ·1 n-r· o c "'fl,..~ 1 _ ~1,.,, 7 , ,, l.j . I.2_ ___ Q _____ c, ___ Q __ ,___,__....>..L--+-"1"'"2_-'--'-17~. _J] __ i:.1~ ___,__,t2 __ ~12._--+---'~__.D_.Q__________Q_ __ o __ _o. .17 _ 12__,~ ______ j. __ 1, _____ 1_, __
•1-1d D o O 0 . /10 I'll> r., 0 c r> 100 ,·l1•
.,
-"s••----•-= 0 .. 0.-· -I .~ fi"''"\".-'iL ( ..... ,·, ,.,
::; • 1'1,1- A,i-J (JI.Tl.I• f'f(. itUf' S = S TANOAl<i> Ds11,,1,,,o ... Df ~
II\ ~ Nvl<V'3tll. OF' ,a.M~ $e-T
0 0 0 0 311 31 "f () 0 (l I ) .':I t 1, I "f
0 0 0 0 U-b H·l, O . c, _ O . '1 .n- (, ·n I.
_6 __ ~1,==t=,,,,6 J ____ ~~=~ j, __ =j=c~,~---~,= . Non·; WP"J\i ~~,.,. 100-1,0 r-,u 01«.1H <l>, .A , ti<> r'' \~(1••>(, (M.i_1! PC", ;,,f,"c·
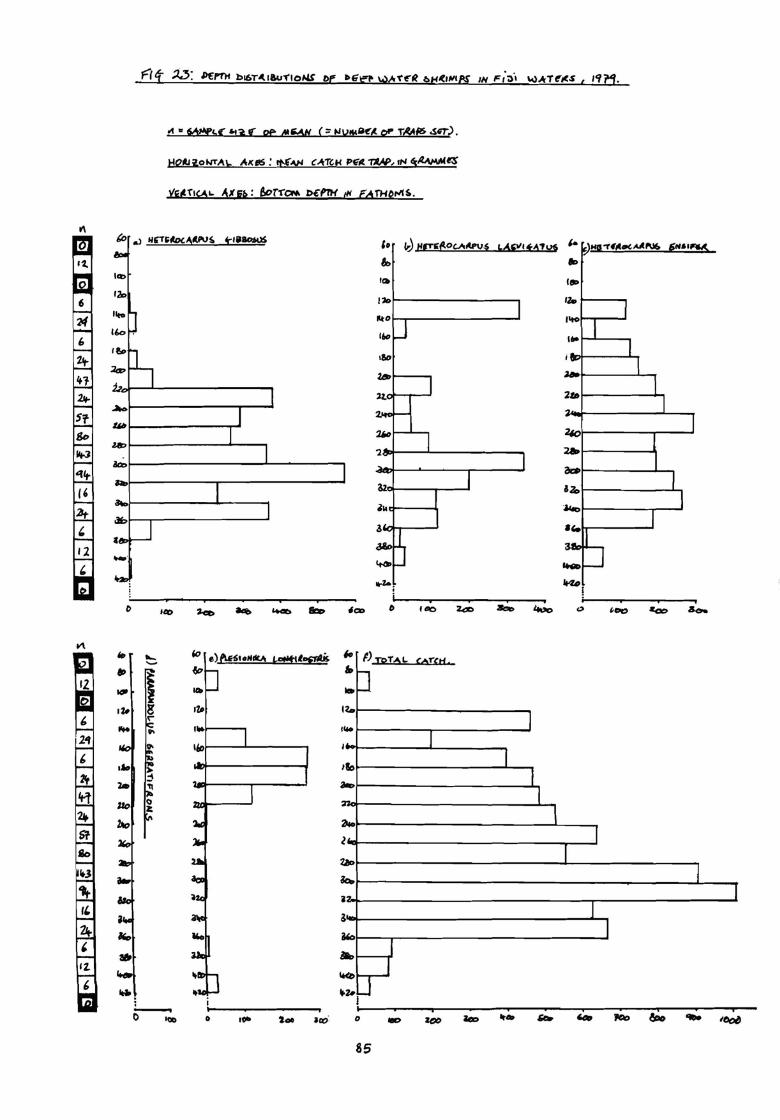
V\
12.
(,
'' ~ flJTC~0 '-".tPu§ bAii"• tA"ut ,. ;vHo -1.-,c.-(.....cruf. f"'•'fflC. &, ..
.-...---------"" 1-------~
·~ J,Ot-----------,
Ubl-----------, aa:,1------------------, .., _______________ ...
al<11----r---
6 II c:r----1. 8-,>-----------
-· 0
•• 11P
1&,1-----'-----
.. IZ.t--------....... ----
ti..t------.--------
1lo1-------------... a..t-------------...a...
IIID
Ile+-----
,.,.-._ __ a.----.._ ... 2t.oi------.....,
24()1------..-----' ~-----bi---------
&~t--------''-,
~--------'
"""! ------.--~ c:,
i~------------------r-----------
0 10- 0 ., --85
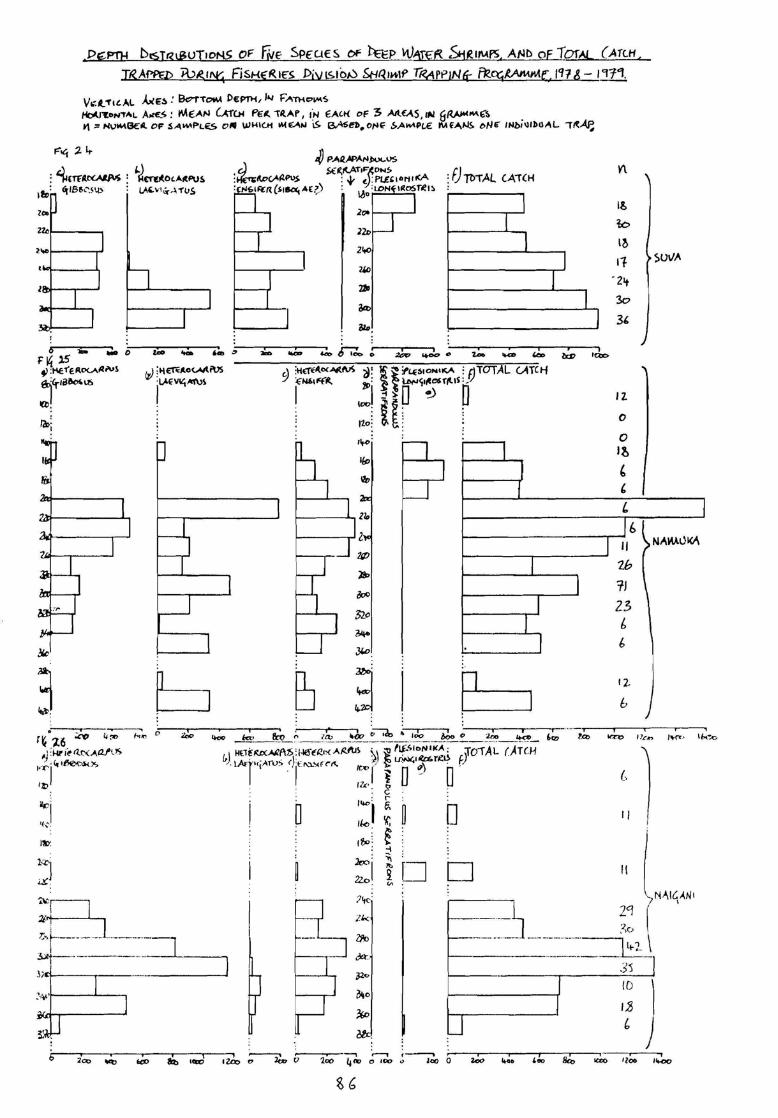
.DE;PfH t>istrs\iuJ,oN.S oF f,ve Spfut:s ~ h:EP WATER S,.jRuW'S, At-lb of Tor& (.ATc.H
TR.Ami> AJ&•~ flsi-<E:i'~.1E"S DivL~tot,) SHB11-+W TRArP1N4: FR.g:;MMM(; 1'118- 191''1.
V-.t_ 1'1t.Al. ME~: Bc7TTOMA Dt:PTH, ,.., F'-'ITHc>...-.S
~J'l:OH'TAL AJ1£5 : MEAN CM~ PE;(. TR.AP I ,·N €Alt( OF 3 ME"A.S , 1111 6RAll'""6'~ ., := NV~Bf:il OF 5AIMPL~ 01' U,Ml(.tl IM~,_. 6 ~eb.O/'IE' 5,.,4.w'Pt.E: I\Af..-_~ t,/-JE" /Nbi\11~0,\L i1'...(P,
F'"'4 1- Lt-
: '1i,rrit~ : "-J~o,•ieP\J~ ,.,,: "'s&,'.s~ : V.'-•·• '"'"A·n,s
lt•
Zli>r-----, 2"° ___ ,...
~ PAll.APANwc.-VS ,.J 5(~AAT1S'"i(ONS
:~l\.c>c.,',ltl>U.S. ; ~ ~J: Pl£'1"NIICA :C,-,'-lf'~:R(Sitki4-"E?,) : ~ 0 ' LDN~U!o.STll!I~
.2oo f--~--'
: f) Tt>T AL CA"T(I-I
1 I
I l
V\
11.
to I~
It I . 21t
I 3o
I 3,
0 - ~ D qp.S - - ,..,., - - WIO ~ o,---~--.--...... --. o •a.o f) :~1'ERD<.AollrV1
jl°rld~lb
e . la,;
:p , i
3 b 3 I . ~-.
r ~ l6 ~ 4 ~ ,,,., o
~ ;HI' i~ a.1:,0,aJ'US
,,·r,· C. 1t'l0oso,,
,-~
:B 't·----- --··-----·--7 ~----------- ---'-----
D
12.
0
0 1i
' ' ' 1---------...----1 I:,
'Q? f.a,
II
Zb TJ 2.3 I,
I,
12,.
b
= {.
I I
It
llrM?
I I I
10 ) 1.$ (,
.--, 0 IC!O
,-----, <> leo 0 '-"•
SU\/.A
l'HT• ~bot~
200-220 fm. range. This latter value, however, was based on
only 6 traps and may thus be anomalous: the cause of the high
catch was a very large (far above average) take of
Heterocarpus laevigatus (fig 25b),and it seems likely that
yields would usually be lower than that, in view of the
abundances of~- laevigatus at other depths in Namuka.
From figure 23~ total catch can be seen to tail off
above and below the 300-320 fm range, fairly smoothly, and more
gradually above than below. The apparent high catch in the
400-420 fm depth range is again due to an unusually high catch
of~- laevigatus off Namuka, and should not be treated as
representative of the true situation without more samples
being taken from that depth.
The ''cot al catch" plots ( Figs 24F, 25F and 26F} in the
three different areas show distinctly different forms. All
seem to approximate to the shape of a skewed normal curve, or part
of that shape, but the degree and direction of the skew varies.
The Suva plot encompasses the least number of depth ranges, and
thus shows the least complete curve, but catches appear to be
increasing with depth, and may well be greater at depths beyond
320 fm, which have not yet been fished. If more depth ranges
had been studied, the curve would probably appear similar in
form to that of the Naigani area, with a more gradual tail above
than below, but with the greatest abundance one or two depth
ranges deeper. The peak of the Naigani curve is also more
pronounced, as, outside the optimum fishing depth ranges, the
fall-off of catch is more pronounced: this is largely due to
the paucity of Plesionika longirostris, a species which makes
a fairly substantial contribution to 'shallow' water catches off
Suva, in Naigani. Again, however, the fairly small sample
sizes in the "shallow' ranges of Naigani may be responsible
for an unrepresentative picture.
In Namuka, the optimum fishing range appears to be from
200-260 fm. Although small sample size may be exaggerating
abundances in this range, the general shape of the curve suggests
that this is the true optimum depth. The curve is of a different
shape than the other two, and appears to approximate more closely
to a true normal distribution, with an even fall-off on either
ade of the peak.
The reasons for the differential depth distributions of
total catch in the three areas are not known, and it is
one of the objects of phase 3 to further investigate the
environmental variables which might be related to this.
However, knowledge of the difference which does exist between
areas is valuable, in that fishing strategies can be ootimised
according to the areas or depths of greatest abundance. As
the objectives of Fisheries Division is to investigate these
factors for the benefit of commercial fishermen, this
information already obtained will be valuable.
Of less direct interest to commercial fishermen, but
equally important to fisheries division from the stock assessment
and management point of view, is the more detailed breakdown
of depth distributions of different species presented in Figs
23-26 (Plesionika martia has been caught in such small quantities
that it has not been included here). As can be seen the
Heterocarpus species from the major component of the catch
on most occasions. The overall plots in figure 3 show that
H. laevigatus and ff· ensifer (c.f. sibogae) are distributed in
a similar pattern (although ff· ensifer is generally more abundant)
this being spread over a wide range of depths without a
pronounced peak. This is reflected by the individual area plots
for H. ensifer (although a fairly pronounced peak is found on
the Namuka plot, Fig 24b) but~- laevigatus, both in Naigani, where
it is rare and in Suva, shows distinct zones of greater abundance
between 280-320 fm. In Namuka, the pattern of distribution
appears somewhat different, ff. laevigatus being spread widely and
varying greatly in abundance. This may be done to a lot of
sampling error, but as it is so consistent, it seems likely
that the distribution of ff· laevigatus does follow a different
pattern from that in Suva and Naigani. This emphasises the
importance of environmental variables other than depth in
determining the distribution of these organisms.
H. gibbosus shows, in all 3 areas, a fairly consistent
pattern of distribution which is narrower than those of the
other two Heterocarpus species, being generally confined to
the 200-360 fm depth range. In Naigani B· gibbosus is the
dominant species:in Suva it ranks about equal with B· ensifer: and in
Namuka, ranks behihd B· ensifer but above B· laevigatus.
Of the two remaining species, Parapandulus seiratifrons
has been caught in insignificant quantities. Plesionika
longirostris, although caught in smaller amounts than the
Heterocarpus species, has been found to inhabit much shallower
water than they, and thus is more accessible to the fisherman
who is hauling traps by hand. In all 3 areas this species
is rare below 220 fathoms, and seems, on the basis of the
work done already, most abundant in 160-200 fm. Also, as
already mentioned, the greater proportion in this species of
high value tail meat compensates in a small way for the
generally smaller yields.
Thus the survey has shown the type of geographical
and depth variations to be expected in shrimps stocks around
Fiji, as well as providing detailed knowledge of 3 geographical
areas. Further work to be done in phase 3 will complement
knowledge of geographical distributions and their relationships
with environmental factors, provide further information on
methods and techniques, and qualify Fisheries Division personnel
to advise on fishing areas, gear, and methods.
Interim conclusions on the potential for a commercial
deep-water shrimp fishery in Fiji
Fisheries division has so far experienced a wide range
of catches in various areas: the mean value is about 662 g/trap,
which would currently have a first sale value of about $2.20
(Mean 1979 price of Ura in Suva mkt = $3.36/kg). This value is the
mean of catches from all depths in all areas, and higher catches,
which might bring the weight up to 800-900 g/trap, would be
expected by selecting depths and areas of greateP abundance).
However, catch rates in Fiji have proved generally lower than in
other parts of the Pacific and to compensate for this it would
be necessary for a commercial operator to be able to carry
and set a substantial number of traps in order to achieve an
acceptable profit margin. This requirement, combined with the
difficulties of this type of fishing and in particular the need
for plenty of working space, would necessitate the use of a
fairly large fishing platform, preferably equipped with some
sort of hauling gear to facilitate raising of the traps from ~q
deep water. It may well be therefore that the initial
investment required, the hard physical work involved, and
the risk of gear loss or low catches will be enough to
deter many fishermen from attempting this type of fishery.
Fisheries Division will therefore undertake to investigate the
possibilities of shimp capture by other means, and to
carefully examine the costs and profits of operating a small
shrimp fishing vessel. It will also be of interest to
investigate the profits which accrue to a fisherman who does his
own processing, as imported shrimp meat is often to be seen
for sale at much higher prices.
viii) Preliminary squid Fishing trials
Introduction
The fact that squid occur in the water of the Fiji archipelago has been known for some time, but in the absence of any specific attempt to evaluate the extent of the resource using commercial gear and techniques, the potential for a squid fishery in this country was not known. However, in March 1979 the Fisheries Division conducted a one-night squid sampling trip to a point about 4 miles off Su~a harbour in order to collect specimens of oceanic squid for research workers from the Smithsonian Institute (U.S.A.) This, and a subsequent one-night trip a week later, generated considerable interest in the commercial potential of Fiji's squid resource: one expert observer in particular expressed unreserved enthusiasm, and as a result of these trips, the Fisheries Division requested the Japanese Government to arrange for five distant water squid vessels, which were preparing to travel from New Zealand to Japan, to conduct a preliminary survey of the Fiji squid resource using current commercial gear and technology. The squid fishermens Association of Japan agreed to divert two of its vessels to Fiji for this purpose, and on May 29th the Meitoku Maru No. 3 (29 m. LOA) and the Shinei Maru No. 8(50 m LOA) arrived in Suva. A number of Fisheries Division personnel accompanied the vessels in their subsequent survey, which lasted for 1 week and fished a number of localities. Details of the catches experienced are in the following sections.
Subsequent to the visit of the two Japanese squid jigging vessels, one further one-night cruise was performed on the 29th November 1979, which was not successful, probably at least partly due to bright moonlight, which reduced the effectiveness of the underwater lights. The main purpose of this trip, however, was to practise the operation of a large sea-anchor prior to undertaking squid-fishing proper.
9o
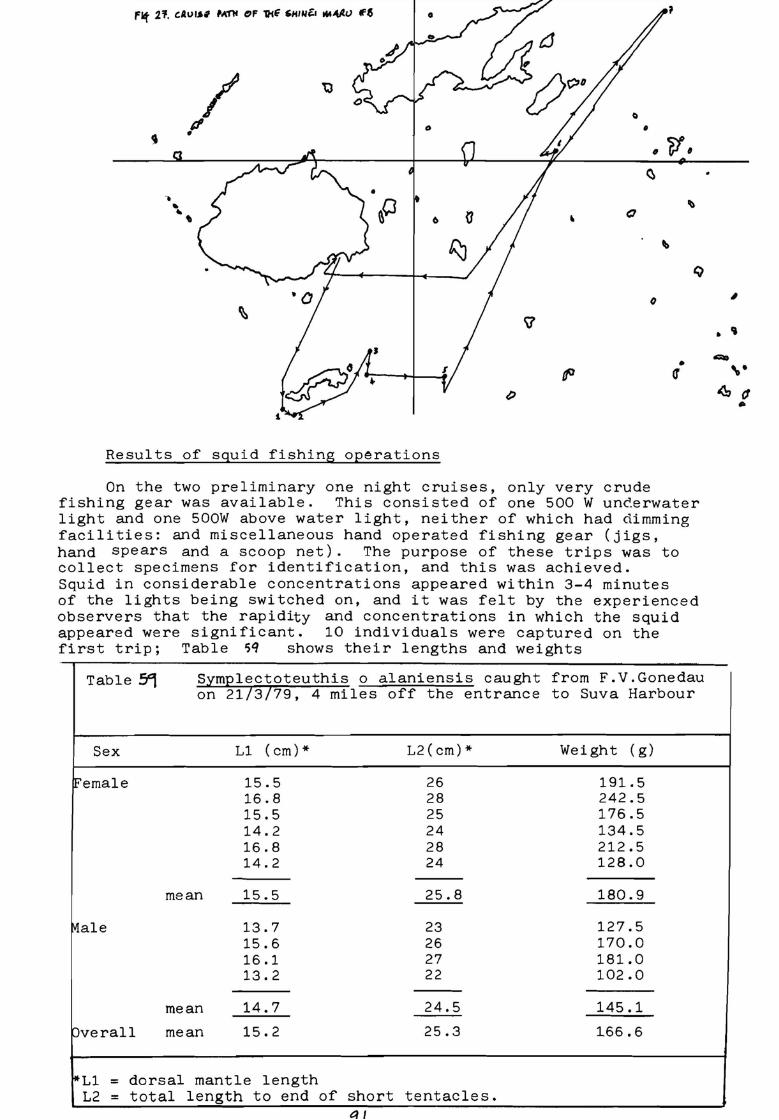
/ tl
Cl d' 0 •
9 • r/, , ~
• ~o lb
6 (1 Q
\
Q
0
• • q
Results of squid fishing operations
On the two preliminary one night cruises, only very crude fishing gear was available. This consisted of one 500 W uncerwater light and one 500W above water light, neither of which had dimming facilities: and miscellaneous hand operated fishing gear (jigs, hand spears and a scoop net) . The purpose of these trips was to collect specimens for identification, and this was achieved. Squid in considerable concentrations appeared within 3-4 minutes of the lights being switched on, and it was felt by the experienced observers that the rapidity and concentrations in which the squid appeared were significant. 10 individuals were captured on the first trip; Table sq shows their lengths and weights
Table SC, simplectoteuthis o alaniensis caught from F.V.Gonedau on 2173779, 4 miles off the entrance to Suva Harbour
Sex Ll (cm)* L2(cm)* Weight ( g)
female 15.5 26 191.5 16.8 28 242.5 15.5 25 176.5 14.2 24 134.5 16.8 28 212.5 14.2 24 128.0
mean 15.5 25.8 180.9
Male 13.7 23 127.5 15.6 26 170.0 16.1 27 181.0 13.2 22 102.0
mean 14.7 24.5 145.1
Overall mean 15.2 25.3 166.6
*Ll = dorsal mantle length L2 = total length to end of short tentacles.
I
. ' CID ,. ~ (J ..
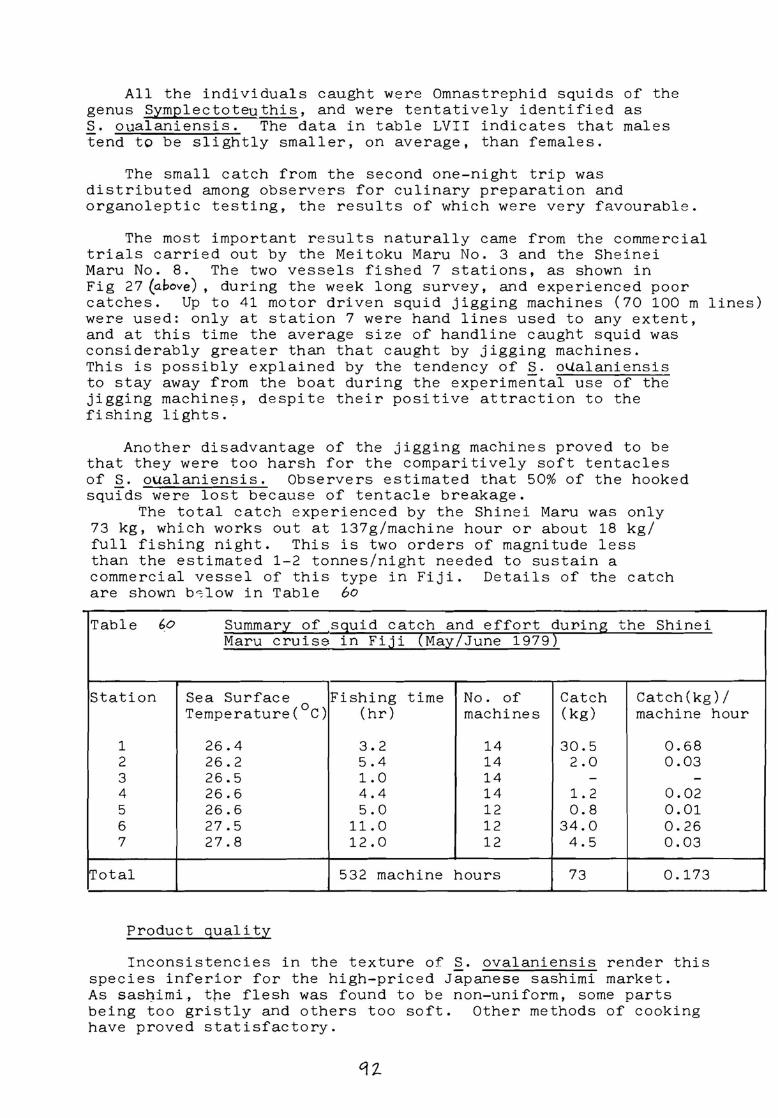
All the individuals caught were Omnastrephid squids of the genus Symplectoteuthis, and were tentatively identified as ~- oualaniensis. The data in table LVII indicates that males tend to be slightly smaller, on average, than females.
The small catch from the second one-night trip was distributed among observers for culinary preparation and organoleptic testing, the results of which were very favourable.
The most important results naturally came from the commercial trials carried out by the Meitoku Maru No. 3 and the Sheinei Maru No. 8. The two vessels fished 7 stations, as shown in Fig 27 (above) , during the week long survey, and experienced poor catches. Up to 41 motor driven squid jigging machines (70 100 m lines) were used: only at station 7 were hand lines used to any extent, and at this time the average size of handline caught squid was considerably greater than that caught by jigging machines. This is possibly explained by the tendency of s. oUalaniensis to stay away from the boat during the experimental use of the jigging machine?, despite their positive attraction to the fishing lights.
Another disadvantage of the Jigging machines proved to be that they were too harsh for the comparitively soft tentacles of S. oualaniensis. Observers estimated that 50% of the hooked squids were lost because of tentacle breakage.
The total catch experienced by the Shinei Maru was only 73 kg, which works out at 137g/machine hour or about 18 kg/ full fishing night. This is two orders of magnitude less than the estimated 1-2 tonnes/night needed to sustain a commercial vessel of this type in Fiji. Details of the catch are shown b s low in Table 60
Table 60 Summary of squid catch and effort during the Shinei Maru cruise in Fiji (Ma;:t/ June 1979
Station Sea Surface Fishing time No. of Catch Catch(kg)/ 0 Temperature( C) (hr) machines (kg) machine
1 26.4 3.2 14 30.5 0.68 2 26.2 5.4 14 2.0 0.03 3 26.5 1.0 14 - -4 26.6 4.4 14 1. 2 0.02 5 26.6 5.0 12 0.8 0.01 6 27.5 11.0 12 34.0 0. 26 7 27.8 12.0 12 4.5 0.03
Total 532 machine hours 73 0.173
Product quality
Inconsistencies in the texture of S. ovalaniensis render this species inferior for the high-priced Japanese sashimi market. As sas~imi. the flesh was found to be non-uniform, some parts being too gristly and others too soft. Other methods of cooking have proved statisfactory.
qz
hour
Conclusions of the initial assessment work, and future prospects.
On the basis of the Shinei Maru cruise, it does not .appeat' that Fiji's squid resources are likely to support a commercial fishery based on large vessels equipped with automatic squid machines. It is planned, however, that periodic spot sampling will be performed about once a month by a small Fisheries Division research vessel equipped with a few machines, in order to
a) detect seasonal variations in squid abundance b) determine whether modifications to the machinery will
render them more suitable for use in Fiji c) assess the geographical extent of the resource.
Work on testing other fishing techniques will also be carried out, in particular netting, using trawls, lift nets, and surrounding nets. It is possible that with the right fishing methods, substantial ~ishery could be based on this high-value resource.
ix) Beche-de-mer population studies
The aim of this two year South Pacific Commission sponsored in August 1977, is to study the biology of the commercially valuable species of beche-de-mer in order to estimate the maximum sustainable yield of the resource. For this purpose, detailed studies are being carried out by SPC Consultant Mr. M. Gentle on the distribution, abundance, growth and reproduction of the teatfish (Microthele nobilis), the most valuable species, and other selectes species.
(A full report on this project is to be published by the South Pacific Commission at the projects completion in August 1980) .
Distribution and a9undance
Surveys by free and SCUBA diving have shown that white and black teatfish and blackfish (Actinopyga ~- ) live in different habitats.White teatfish and blackfish are most numerous in the vicinity of seagrass (Syringodium isoetefolium.) meadows, whereas black teatfish were typically found on fine coral rubble or areas of flat dead coral on the reef top.
Because of their affinity for seagrass meadows, white teatfish were most common in lagoons close to large islands and particularly in the vicinity of river mouths. In such places they were easy to collect since they could be found in water only 3 or 4 metres deep. It is likely that these meadows of marine plants act as "traps" for organic detritus, the food of beche-de-mer.
As is typical of large reef invertebrates, the commercially useful species of beche-de-mer have beeh observed only in relatively low densities. In Laucala Bay, white teatfish were abundant. Large white teatfish (over 1.5 kg wet weight) comparatively occurred from 4m down to a depth of about 8m. Below Sm,, ("sand volcano" zone) they were much less abundant.
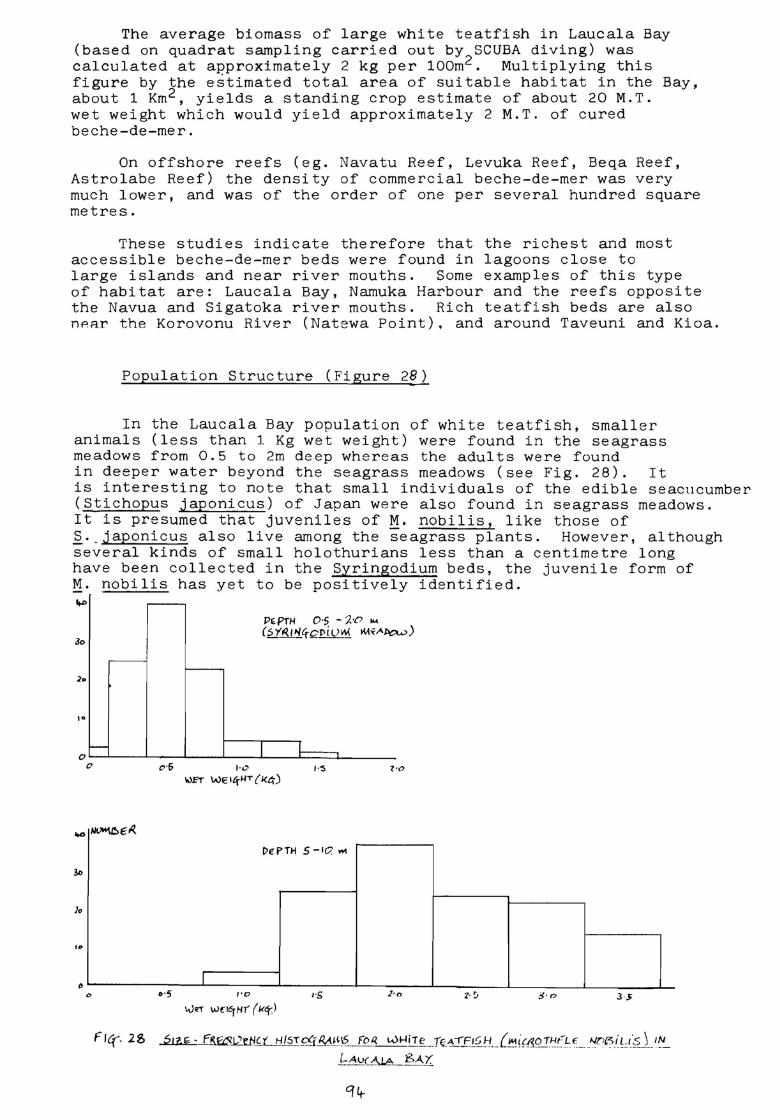
The average biomass of large white teatfish in Laucala Bay (based on quadrat sampling carried out by SCUBA diving) was calculated at approximately 2 kg per 100m2 . Multiplying this figure by the estimated total area of suitable habitat in the Bay, about 1 Km 2 , yields a standing crop estimate of about 20 M.T. wet weight which would yield approximately 2 M.T. of cured beche-de-mer.
On offshore reefs (eg. Navatu Reef, Levuka Reef, Beqa Reef, Astrolabe Reef) the density of commercial beche-de-mer was very much lower, and was of the order of one per several hundred square metres.
These studies indicate therefore that the richest and most accessible beche-de-mer beds were found in lagoons close to large islands and near river mouths. Some examples of this type of habitat are: Laucala Bay, Namuka Harbour and the reefs opposite the Navua and Sigatoka river mouths. Rich teatfish beds are also nP.~r the Korovonu River (Natewa Point). and around Taveuni and Kioa.
Population Structure (Figure 28)
In the Laucala Bay population of white teatfish, smaller animals (less than 1 Kg wet weight) were found in the seagrass meadows from 0.5 to 2m deep whereas the adults were found in deeper water beyond the seagrass meadows (see Fig. 28). It is interesting to note that small individuals of the edible seacucumber (Stichopus japonicus) of Japan were also found in seagrass meadows. It is presumed that juveniles of~- nobilis, like those of ~. __ japonicus also live among the seagrass plants. However, although several kinds of small holothurians less than a centimetre long have been collected in the Syringodium beds, the juvenile form of M. nobilis has yet to be positively identified. lt-0
Jo
2 ..
Pl'.PfH 0·5 - 'J.:C' ... (5y.q_l11fQPiU~ .«i,...~)
o..__._ _ _._ _ __.. __ ....._ _ __._ _ __._ __ 1.-__ _
0 , . .., 1 ·0 ->ET' WEl4"HT{J<t;)
..., ,IIVIO\OE: ,I{
De-PTH 5 -10,""
3o
lo
lo
t, I 0 l ' D 1·S 1·o Z·~ 3·o JS
Flq--. is ~£!~ __ L2tiK:L_t:/J~.I~Rt1.IHS Fo~ wµiTe ___ r~-~FJ~H J.-,ictJ.OTH("u ___ lJr,{3iLl's \ _IN
/.....Av( A.LA SA.t.
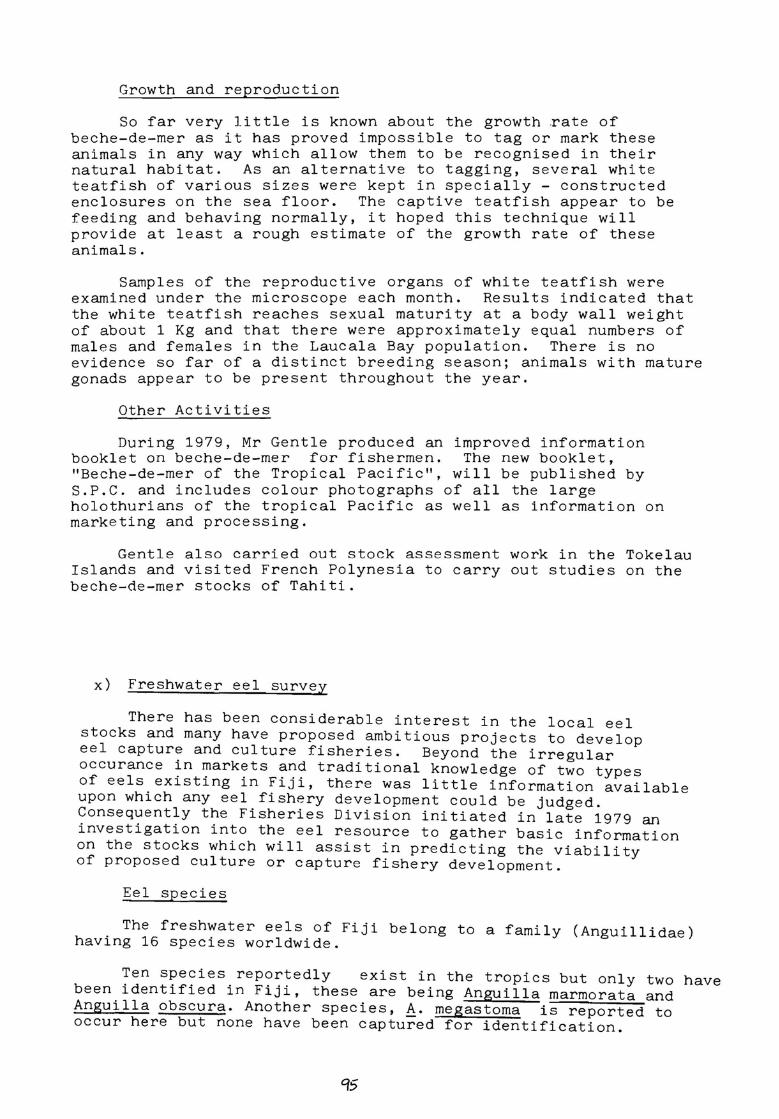
Growth and reproduction
So far very little is known about the growth rate of beche-de-mer as it has proved impossible to tag or mark these animals in any way which allow them to be recognised in their natural habitat. As an alternative to tagging, several white teatfish of various sizes were kept in specially - constructed enclosures on the sea floor. The captive teatfish appear to be feeding and behaving normally, it hoped this technique will provide at least a rough estimate of the growth rate of these animals.
Samples of the reproductive organs of white teatfish were examined under the microscope each month. Results indicated that the white teatfish reaches sexual maturity at a body wall weight of about 1 Kg and that there were approximately equal numbers of males and females in the Laucala Bay population. There is no evidence so far of a distinct breeding season; animals with mature gonads appear to be present throughout the year.
Other Activities
During 1979, Mr Gentle produced an improved information booklet on beche-de-mer for fishermen. The new booklet, "Beche-de-mer of the Tropical Pacific", will be published by S.P.C. and includes colour photographs of all the large holothurians of the tropical Pacific as well as information on marketing and processing.
Gentle also carried out stock assessment work in the Tokelau Islands and visited French Polynesia to carry out studies on the beche-de-mer stocks of Tahiti.
x) Freshwater eel survey
There has been considerable interest in the local eel stocks and many have proposed ambitious projects to develop eel captur~ and culture fisheries. Beyond the irregular occ~~ance ~n ~ark~ts ~~~ traditional knowledge of two types of vvls existing in FiJi, there was little information availablo upon which any eel fishery development could be judged. V
Consequently the Fisheries Division initiated in late 1979 an investigation into the eel resource to gather basic information on the stocks which will assist in predicting the viability of proposed culture or capture fishery development.
Eel species
The freshwater eels of Fiji belong to a family (Anguillidae) having 16 species worldwide.
0 !en s~e?ies_rep~~~edly exist in the tropics but only two have
bven identified in FiJi, these are being Anguilla marmorata and Anguilla obscura. Another species,~- megastoma is reported to occur here but none have been captured for identification.
95
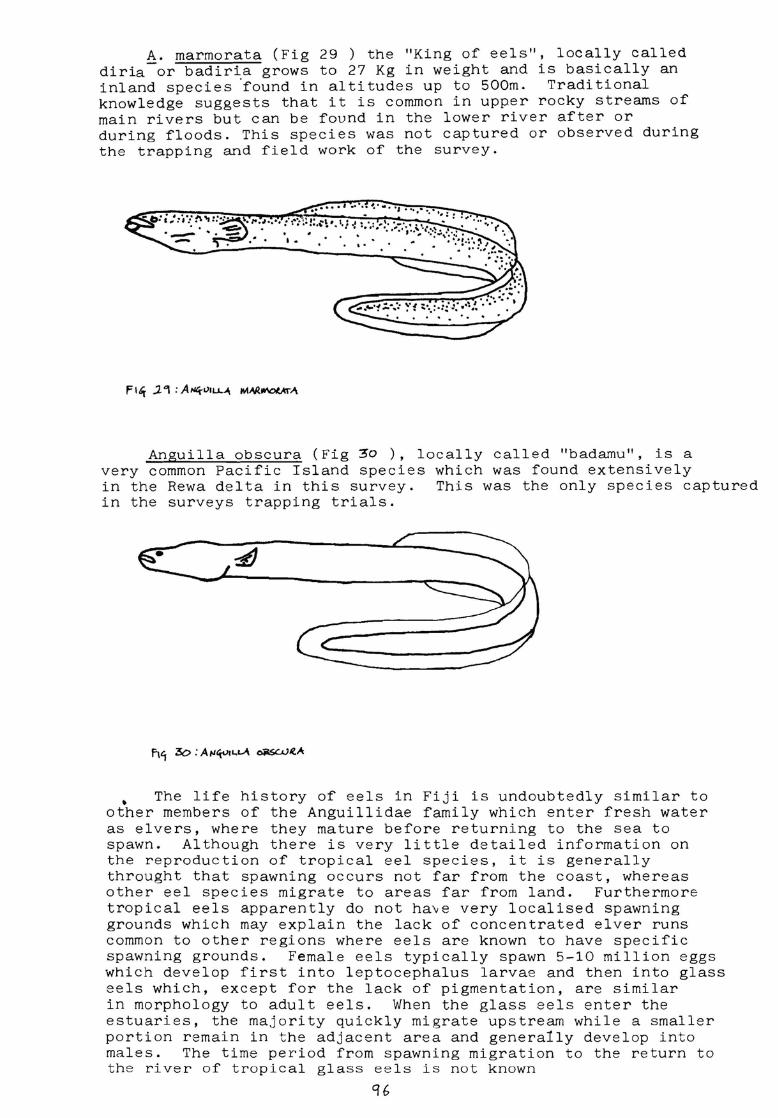
A. marmorata (Fig 29 ) the "King of eels", locally called diria-or badiria grows to 27 Kg in weight and is basically an inland species ·round in altitudes up to 500m. Traditional knowledge suggests that it is common in upper rocky streams of main rivers but can be found in the lower river after or during floods. This species was not captured or observed during the trapping and field work of the survey.
Anguilla obscura ( Fig 30 ) , locally called "badamu", is a very common Pacific Island species which was found extensively in the Rewa delta in this survey. This was the only species captured in the surveys trapping trials.
• The life history of eels in Fiji is undoubtedly similar to other members of the Anguillidae family which enter fresh water as elvers, where they mature before returning to the sea to spawn. Although there is very little detailed information on the reproduction of tropical eel species, it is generally throught that spawning occurs not far from the coast, whereas other eel species migrate to areas far from land. Furthermore tropical eels apparently do not have very localised spawning grounds which may explain the lack of concentrated elver runs common to other regions where eels are known to have specific spawning grounds. Female eels typically spawn 5-10 million eggs which develop first into leptocephalus larvae and then into glass eels which, except for the lack of pigmentation, are similar in morphology to adult eels. When the glass eels enter the estuaries, the majority quickly migrate upstream while a smaller portion remain in the adjacent area and generally develop into males. The time period from spawning migration to the return to the river of tropical glass eels is not known
96
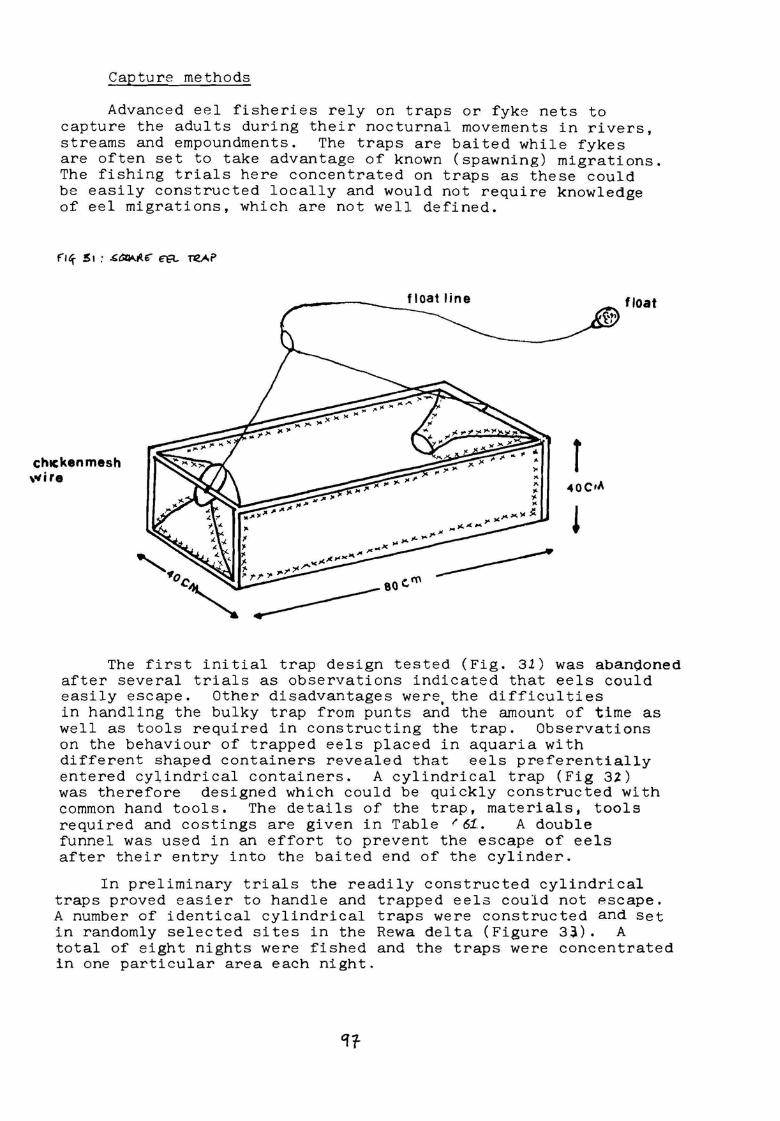
Capture methods
Advanced eel fisheries rely on traps or fyke nets to capture the adults during their nocturnal movements in rivers, streams and empoundments. The traps are baited while fykes are often set to take advantage of known (spawning) migrations. The fishing trials here concentrated on traps as these could be easily constructed locally and would not require knowledge of eel migrations, which are not well defined.
ch1ekenmesh ,.,ire
float line .iiJ float
~·
r
The first initial trap design tested (Fig. 31) was abanooned after several trials as observations indicated that eels could easily escape. Other disadvantages were, the difficulties in handling the bulky trap from punts and the amount of time as well as tools required in constructing the trap. Observations on the behaviour of trapped eels placed in aquaria with different shaped containers revealed that eels preferentially entered cylindrical containers. A cylindrical trap (Fig 3l) was therefore designed which could be quickly constructed with common hand tools, The details of the trap, materials, tools required and costings are given in Table "6t:. A double funnel was used in an effort to prevent the escape of eels after their entry into the baited end of the cylinder.
In preliminary trials the readily constructed cylindrical traps proved easier to handle and trapped eels could not escape. A number of identical cylindrical traps were constructed and set in randomly selected sites in the Rewa delta (Figure 33). A total of eight nights were fished and the traps were concentrated in one particular area each night.
'fr-
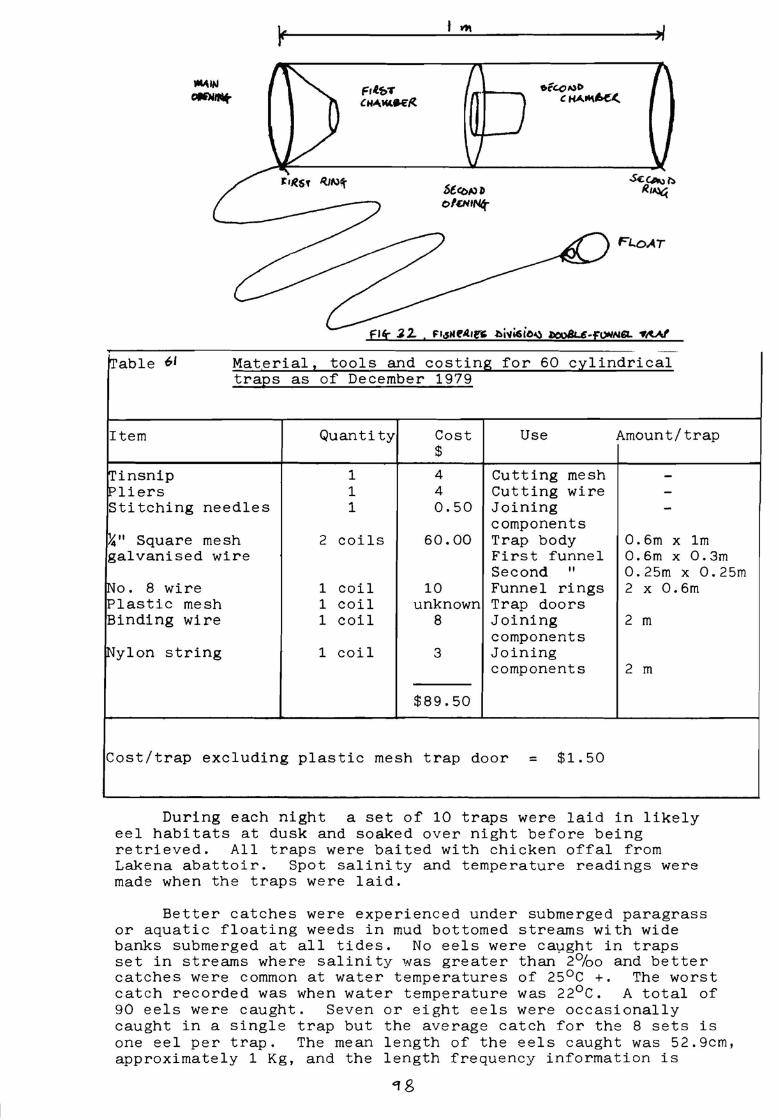
'"'
FL.oAT
- -IT'able 61 Material 1 tools and costins; for 60 cilindrical
traEs as of December 1979
Item Quantity Cost Use Amount/trap $
ttinsnip 1 4 Cutting mesh -IPliers 1 4 Cutting wire -Stitching needles 1 o. 50 Joining -
components ¼ II Square mesh 2 coils 60.00 Trap body 0.6m X lm galvanised wire First funnel 0.6m x 0.3m
Second II 0.25m x 0.25m No. 8 wire 1 coil 10 Funnel rings 2 X 0.6m Plastic mesh 1 coil unknown Trap doors Binding wire 1 coil 8 Joining 2 m
components Nylon string 1 coil 3 Joining
components 2 m
$89.50
Cost/trap excluding plastic mesh trap door = $1. 50
During each night a set of 10 traps were laid in likely eel habitats at dusk and soaked over night before being retrieved. All traps were baited with chicken offal from Lakena abattoir. Spot salinity and temperature readings were made when the traps were laid.
Better catches were experienced under submerged paragrass or aquatic floating weeds in mud bottomed streams with wide banks submerged at all tides. No eels were caµght in traps set in streams where salinity was greater than 2%0 and better catches were common at water temperatures of 25°C +. The worst catch recorded was when water temperature was 22°c. A total of 90 eels were caught. Seven or eight eels were occasionally caught in a single trap but the average catch for the 8 sets is one eel per trap. The mean length of the eels caught was 52.9cm, approximately 1 Kg, and the length frequency information is
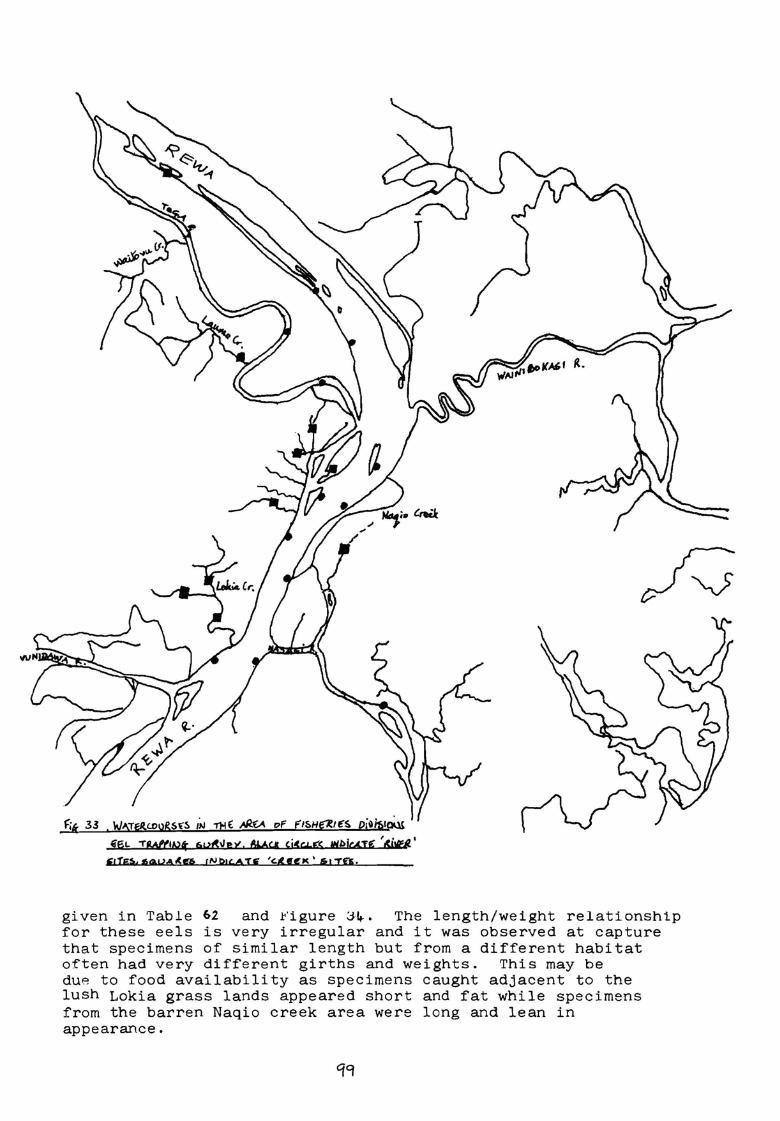
fit 33 • \y>i,TE/lc.DUR,S'f~ '"' !J::!( ~(A r:,f f1&HBI€!. p(llif>I~ ~ . . , . ,.,
ffiL "f"Ml(tt,>t §un,\ley. /\MC.« C!'CUf'.'( .Wl>ICA.U' ISl\fA ,1T6!r,tt4V6.CC6 1Nb14A.I€ 'c.(«<t<' ti!TG,
given in Table 62 and !"igure ::SI+-. The length/weight relationship for these eels is very irregular and it was observed at capture that specimens of similar length but from a different habitat often had very different girths and weights. This may be duP- to food availability as specimens caught adjacent to the lush Lokia grass lands appeared short and fat while specimens from the barren Naqio creek area were long and lean in appearance.
'i9
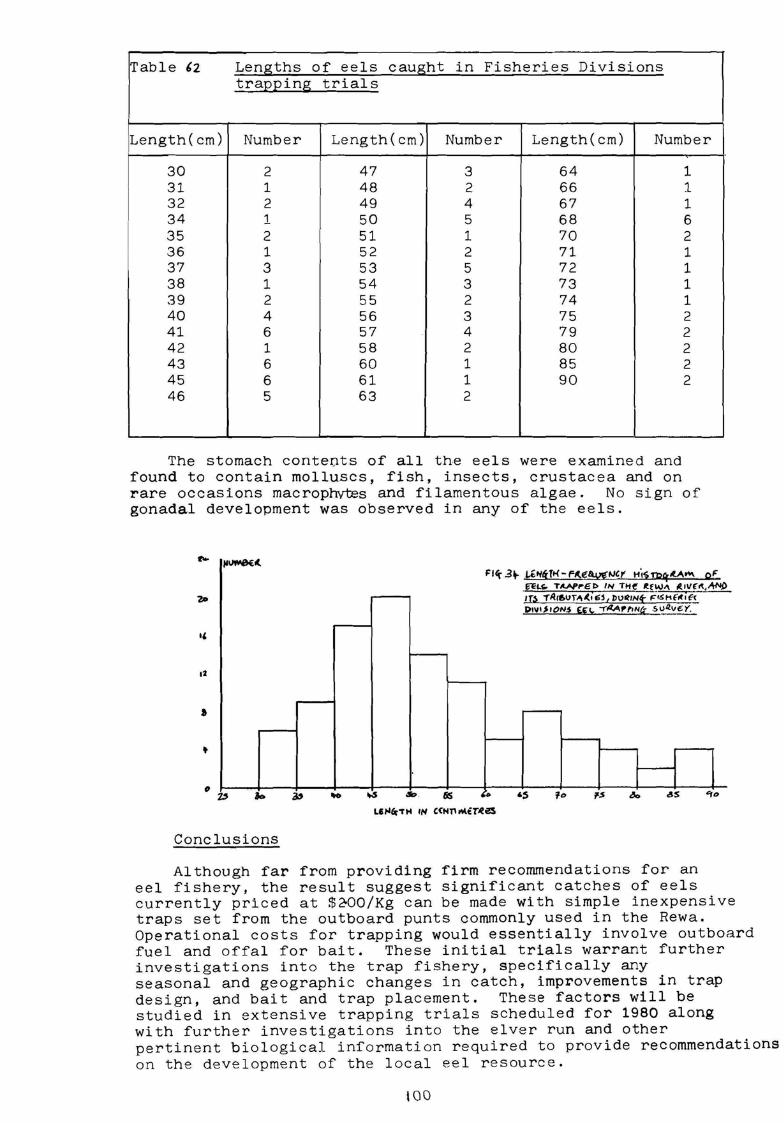
Table ,2 Lengths of eels caught in Fisheries Divisions tra22ing trials
Length(cm) Number Length(cm) Number Length(cm) Number
30 2 47 3 64 1 31 1 48 2 66 1 32 2 49 4 67 1 34 1 50 5 68 6 35 2 51 1 70 2 36 1 52 2 71 1 37 3 53 5 72 1 38 1 54 3 73 1 39 2 55 2 74 1 40 4 56 3 75 2 41 6 57 4 79 2 42 1 58 2 80 2 43 6 60 1 85 2 45 6 61 1 90 2 46 5 63 2
The stomach contents of all the eels were examined and found to contain molluscs, fish, insects, crustacea and on rare occasions macrophvtes and filamentous algae. No sign of gonadal development was observed in any of the eels .
.. ~.c. Flif .31t,- Ufi!i:TK- Fl(.e"A.l.li:,Jl;Y Hiill:!Q:.U.""' c,.IC
.~'-" TA.A#'f"Et> ,,.,, T11e- ltfWJ\ ,111.,vr",J'\N.O ,r~ -rA1&vrJ11(1Ei,l1>u~1"'t ,=-,.s11f"•f< l)fVISION.S £§:!. "l'~l'f>Nj[ sullve:Y.
-., -
12
t -
'"" ...s .so 65 ,o • 0 .s ,. lJo c5S "Jo
Conclusions
Although far from providing firm recommendations for an eel fishery, the result suggest significant catches of eels currently priced at $c00/Kg can be made with simple inexpensive traps set from the outboard punts commonly used in the Rewa. Operational costs for trapping would essentially involve outboard fuel and offal for bait. These initial trials warrant further investigations into the trap fishery, specifically any seasonal and geographic changes in catch, improvements in trap design, and bait and trap placement. These factors will be studied in extensive trapping trials scheduled for 1980 along with further investigations into the elver run and other pertinent biological in~ormation required to provide recommendations on the development of the local eel resource.
100
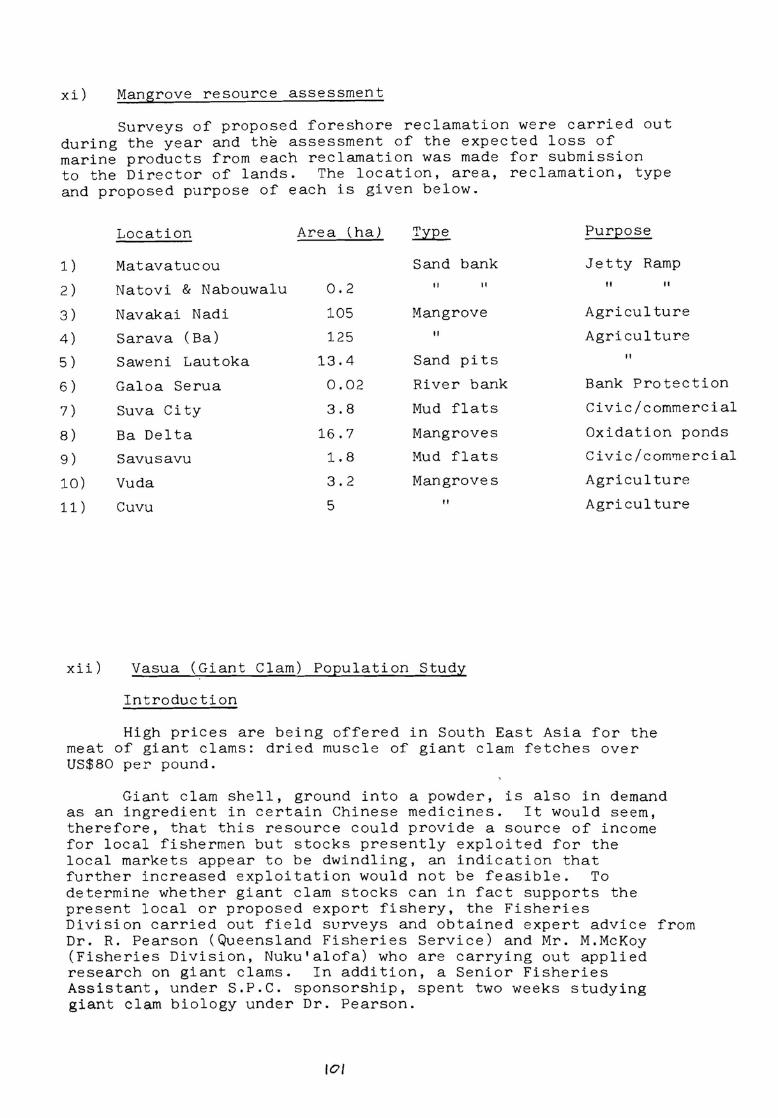
xi) Mangrove resource assessment
Surveys of proposed foreshore reclamation were carried out during the year and the assessment of the expected loss of marine products from each reclamation was made for submission to the Director of lands. The location, area, reclamation, type and proposed purpose of each is given below.
1)
2)
3)
4)
5)
6)
7)
8)
9)
10)
11)
xii)
Location Area {.ha) ~
Matavatucou Sand bank
Natovi & Nabouwalu 0.2 ti 11
Navakai Nadi 105 Mangrove
Sarava (Ba) 125 II
Saweni Lautoka 13.4 Sand pits
Galoa Serua 0.02 River bank
Suva City 3.8 Mud flats
Ba Delta 16.7 Mangroves
Savusavu 1. 8 Mud flats
Vuda 3.2 Mangroves
Cuvu 5 "
Vasua (Giant Clam) Population Study
Introduction
Purpose
Jetty Ramp II II
Agriculture
Agriculture II
Bank Protection
Civic/commercial
Oxidation ponds
Civic/commercial
Agriculture
Agriculture
High prices are being offered in South East Asia for the meat of giant clams: dried muscle of giant clam fetches over US$80 per pound.
Giant clam shell, ground into a powder, is also in demand as an ingredient in certain Chinese medicines. It would seem, therefore, that this resource could provide a source of income for local fishermen but stocks presently exploited for the local markets appear to be dwindling, an indication that further increased exploitation would not be feasible. To determine whether giant clam stocks can in fact supports the present local or proposed export fishery, the Fisheries Division carried out field surveys and obtained expert advice from Dr. R. Pearson (Queensland Fisheries Service) and Mr. M.McKoy (Fisheries Division, Nuku'alofa) who are carrying out applied research on giant clams. In addition, a Senior Fisheries Assistant, under S.P.C. sponsorship, spent two weeks studying giant clam biology under Dr. Pearson.
IOI
Summary of results
The results of research in Australia and Tonga show that giant clams are slow growing animals (time to maturity seventy plus years in the larger species) and that recruitment is typically erratic with juveniles being subject to intense predation. These life history features indicate that the sustainable yield of the resource is very low, and that the resource would not be able to support a sustained commercial fishery.
Field surveys in Fiji indicate that three species of giant clam occur here:
Tridacna maxima !· sguamosa T. derasa
A fourtn species, H1ppopus h1ppopus 1s Rnown only from shells and may be extinct in Fiji, as is the case in Tonga.
All species of giant clams are now uncommon near inhabited areas. This is particularly so of!· sguamosa and T. derasa which are now found almost exclusively on remote reefs.
The effects of fishing pressure on T. derasa were shown by comparative surveys of Na Vatu Reef (remote from land) and Aiwa Reef (near Lakeba). On Na Vatu Reef approximately 80% of the population consisted of empty shells which appeared clean and only recently dead. Evidence from this and other regions suggests that this may be due to collection by distant water fishing vessels. On Aiwa Reef (subsistence collection only) the majority of clams were living.
Conclusions and recommendations
Despite the value of giant clam products on the world market, it appears unlikely that this resource is able to support a sustained commercial fishery. Since the resource represents a useful source of protein at the subsistence level, it is recommended further commercial exploitation be discouraged. In order to encourage the rational management of this resource a pamphlet explaining the apparent low sustainable yields of vasua stocks is being prepared and will include current recommended management techniques for traditional owners of vasua beds.
102
c. Aquaculture
(i) Naduruloulou Fish Breeding Station
Carp breeding
The station was established in 1974 to provide the necessary facilities to breed grass carp (Ctenopharygodon idella) in large numbers for use in controlling Hydrilla and other aquatic weed infestations in the Rewa River. An adequate hatchery-laboratory complex, pond area (6.5 ha.) and brood stock of approximately 800 grass carp were established in earlier years. A major constraint to the attainment of large scale fry production has been the failure of the grass carp brood stock to obtain sexual maturity. The brood stock was imported in 1974 and was expected, by previous maturation trials conducted in ponds at Lami, to mature in at least four years. The station was managed from March 1976 to June 1979 by D.S.Murty, an Indian Aid consultant. Dr. C. Mitchell, a N.Z. grass carp expert, provided beneficial technical assistance to the maturation problem during his 1978 visit which was funded by N.Z. Aid programme.
Following D.S. Murty's departure, Fisheries Officer M. Lagibalavu, a B.Sc. Fisheries graduate from Mangalore University India, was appointed as station manager. He was assisted by Technical Officer II F.D.Mate who was transferred from Ravtravi and had worked on the initial grass carp maturation trials in the Lami ponds. A complete review of the project was made, ponds were drained, limed and cleared of extraneous fish and a new pond management scheme was formulated.
The new management scheme involved the termination of the feeding experiments'including that suggested by Mitchell in 1978 (annual report 1978), which due to the small size of carp stocked and presence of numerous extraneous fish did not yield conclusive results, and the adoption of Chinese pond management techniques recommended for grass carp maturation. In August this was implemented; all carp were fed Hydrilla three days per week and paragrass the remaining days at 100% of their body weight. In addition a special brood stock was fed a mixture of 50% fish meal, 20% rice seedling, 20% wheat bran and 10% wheat germ daily at 2% of their body weight. By September a large number of carp males fed the plain plant alone or plant and artificial food diets had matured and were oozing with milt. Dr. C. Mitchell , funded by a N.Z. Aid grant, again visited the project in October and assisted in selecting the larger ( > 4 kg) breeders for stocking into maturation ponds. these ponds were carefully managed maintaining the new feeding regime (plant and supplementary food) and fortnightly water changes. Regular inspection of these selected breeders was carried out and in late December the females began to show signs of maturity. The stations first breeding trials were scheduled to begin early in January.
103
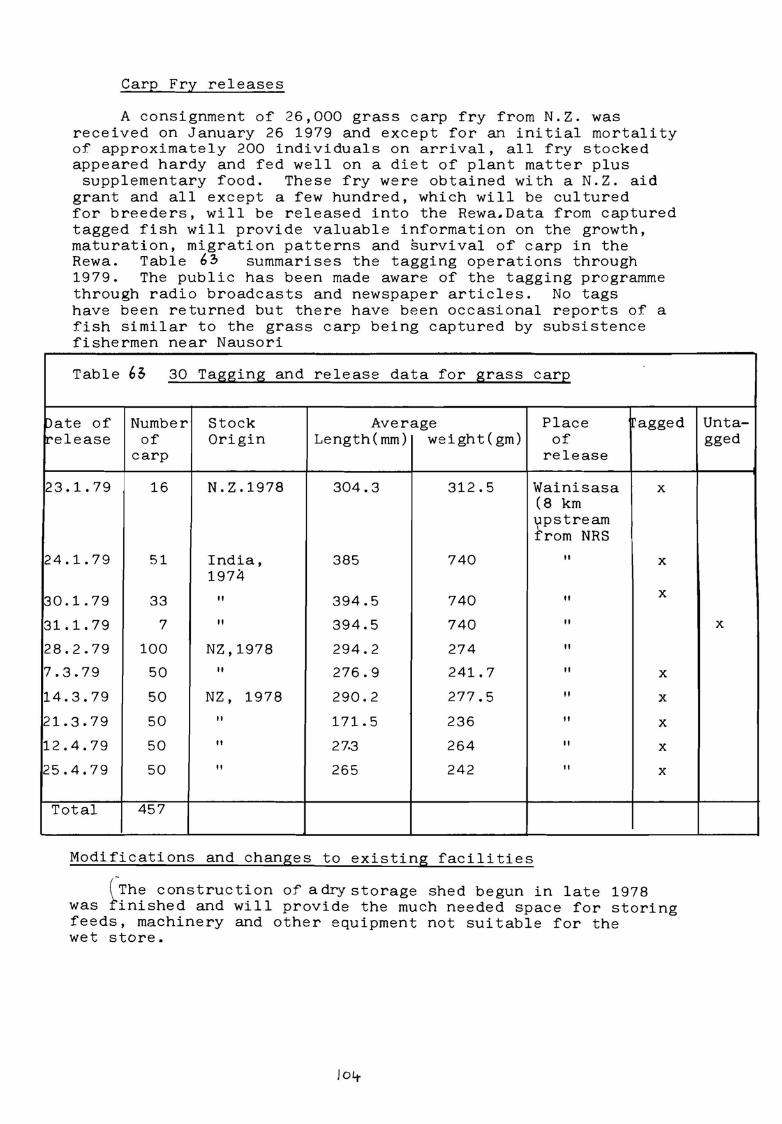
Carp Fry releases
A consignment of 26,000 grass carp fry from N.Z. was received on January 26 1979 and except for an initial mortality of approximately 200 individuals on arrival, all fry stocked appeared hardy and fed well on a diet of plant matter plus
supplementary food. These fry were obtained with a N.Z. aid grant and all except a few hundred, which will be cultured for breeders, will be released into the Rewa.Data from captured tagged fish will provide valuable information on the growth, maturation, migration patterns and survival of carp in the Rewa. Table 6~ summarises the tagging operations through 1979. The public has been made aware of the tagging programme through radio broadcasts and newspaper articles. No tags have been returned but there have been occasional reports of a fish similar to the grass carp being captured by subsistence fishermen near Nausori
Table 63 30 Tagging and release data for grass car:e
bate of Number Stock Average Place "agged ir-elease of Origin Length(mm) weight(gm) of
carp release
23. 1. 79 16 N.Z.1978 304.3 312.5 Wainisasa X
(8 km ypstream from NRS
24. 1. 79 51 India, 385 740 II X
1974
30.1.79 33 II 394.5 740 II X
31.1. 79 7 II 394.5 740 II
28.2.79 100 NZ,1978 294.2 274 II
7.3.79 50 It 276.9 241.7 II X
14.3.79 50 NZ, 1978 290.2 277.5 II X
21. 3. 79 50 II 171.5 236 II X
12.4.79 50 II 27,3 264 II X
25.4.79 50 II 265 242 II X
Total 457
Modifications and changes to existing facilities
( The construction o:f a dry storage shed begun in late 1978 was finished and will provide the much needed space for storing feeds, machinery and other equipment not suitable for the wet store.
}04-
Unta-gged
X
The water supply for the project is a small stream which drains an adjacent swamp. Water quality is far from optimum, pH is low, iron content is high and the quantity of water available significantly restricts pond water exchange. In order to provide water of adequate quality and quantity for the ponds and especially the hatchery, the possibility of utilizing river or well water will be investigated.
ii) Raviravi Fish Farm
The farm was established in mid 1972 to investigate the feasibility of utilizing reclaimed mangroves for mariculture. A small laboratory, storage sheds, modest accomodation, and 8 ha. of tidal ponds were constructed and trials were carried out on rea~ing fish as well as other marine products in a simple, extensive management technique. The research phase of the project was terminated in February 1978 and the project's results were compiled into the technical report "The Raviravi Fish Farm".
Prior to termination of the research phase of private companies were interested in a commercial undertaking of the project and one individual had with Fisheries Divisions assistance negotiated a firm joint venture agreement with Government which would commence in March 1979. Unfortunately Lands Department could not provide the necessary lease and prolonged delays led to the cancellation o:f the venture by the individual. The Fisheries Division has continued negotiations with the remaining interested parties but these discussions have been hampered by the unsettled issues of lease, access and future aquisition of land all of which are Lands Department's responsibility. At the end of 1979 negotiations with a large local company for a joint venture undertaking into intensive prawn culture were progressing well and expertise for the proposed venture had been arranged by the Fisheries Division with the Centre National Pour L'Exploitation Des Oceans, (CNEXO) an internationally respected prawn culture establishment located in Tahiti. The commencement date of this proposed joint venture was tentatively set at June 1981 but the fate of this undertaking depends on Land~ Departments ability to provide the necessary legal documentation by May 1980.
iii) Oyster and mussel culture project
Research into the cultivation of local and selected imported species of oysters and mussels, which included investigations by an FAO/UNDP consultant in 1974-1976, was terminated in late 1978 and the results were made available to interested investors. Large investors have reviewed the viability of a commercial undertaking but have declined to register firm proposals. Smaller pilot ventures into mussel culture may be a more prudent undertaking and have been encouraged. A small private company was assisted in starting a pilot mussel and oyster cultur~ farm at Pacific Harbour with seed donated by C.N.E.X.O. of Tahiti. One raft was stocked with trays containing the green mussel (Mytilus viridis) and the rock oyster (Crassastrea echinata) and initial growth was reportedly promising. In addition to
105
assisting this private venture the mussel culture demonstration facilities were maintained at Laucala Bay. Small shipments of the C.N.E.X.O. bred green mussel seed were received and placed into rafts and trays to replace to old stocks. Several villagers in the lower Rewa delta have shown interest in raising mussels but do not have the funds to independantly conduct pilot ventures. One villager having access to a suitable growing site will be carefully selected and encouraged to establish a small mussel farm with Fisheries Division assistance in 1980.
iv) Macrobrachium rosenbergii culture
A feasibility study into freshwater prawn culture (see Annual Report 1978) concluded: Macrobrachium rosenbergii culture could be viable in Fiji although definite economic predictions could not be made without results from local research and Government should not actively undertake a pilot venture as the expense could not be justified when compared to projects having more impact on increasing local fish production. In compliance with this, encouragement has been given to interested private individuals but Fisheries Division has not actively undertaken a demonstration project. Two private individuals have shown considerable interest in Macrobrachium culture and assistance has been concentrated on their plans for commercial prawn farming Fellowships in Hawaii on Macrobrachium culture were arranged for both individuals along with one of Fisheries staff, Technical Officer II F. Mate, and the three Lami freshwater ponds were leased to the two individuals for growth trials with seed requested from Hawaii. The trials are planned to commence in April 1980 with both private persons managing the ponds to obtain information needed to commence their own commercial prawn ventures.
v) Aquaculture Extension
The need for an advisory service in aquaculture has significantly increased in recent years. The insatiable demand for fish and fish products, difficulties in entering traditional commercial fisheries and their rather limited potential, growing protein deficiency in interior communities and escalating market prices have focused the public's attention on aquaculture. The Fisheries Division has long been aware of the potential of particular aquacultures and has assessed the feasibility of cultivating marine fish, prawns and bivalves. These investigations have proven to be very worthwhile investments as the resultirtg data provides a sound frame work upon which the merits of mariculture proposals can be judged and existing schemes can be developed. Twelve mariculture proposals were reviewed by the Division and three existing mariculture schemes received technical assistance in 1979. Of particular significance the technical advise provided the Selemi Village Fish Farm project of Korotubu, Ra which consists of 11 seawater ponds in a 2.5 ha reclamation, all of which has been manually constructed.
106

Unlike mariculture there have not been any significant investigation into freshwater culture systems. The potential is evident but without exotic species very little development can be made. Freshwater fish culture utilizing the Chinese major carps will without doubt be the most significant aquaculture development and the importation of a small nuclear stock has been proposed. A pilot farm into commercial fish culture was initiated in Navua as well as a subsistence pond project in Lutu, Wainibuka.
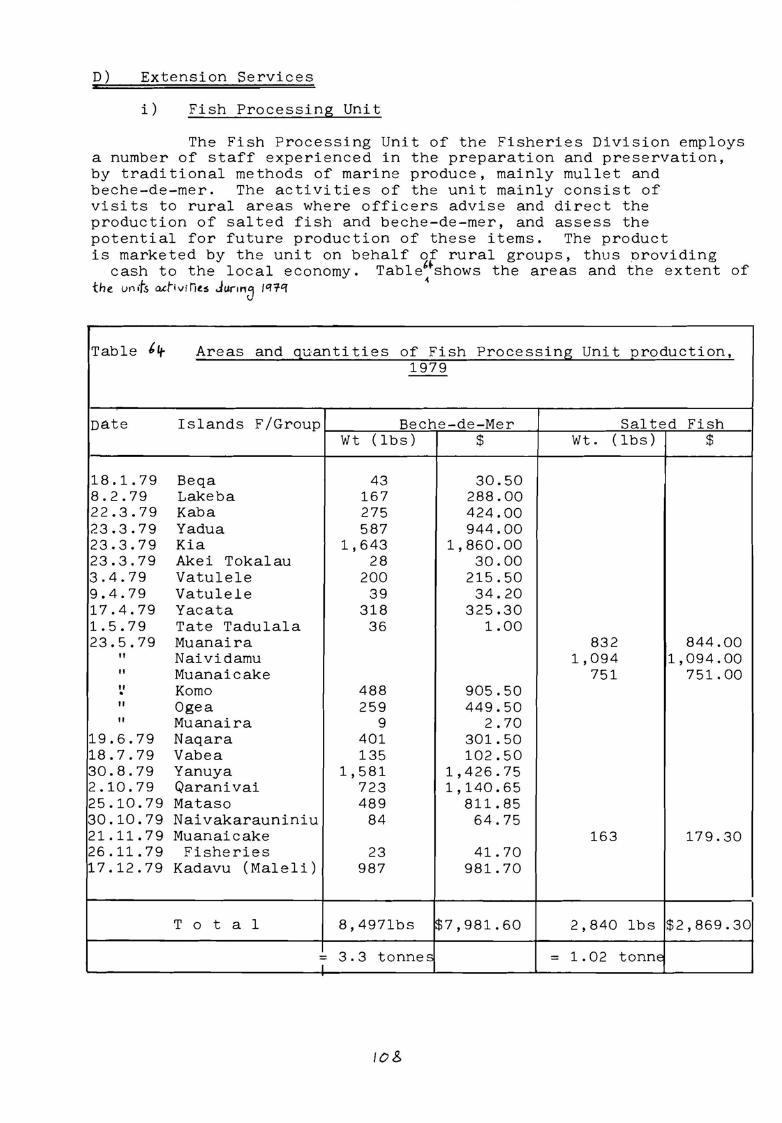
D) Extension Services
i) Fish Processing Unit
The Fish Processing Unit of the Fisheries Division employs a number of staff experienced in the preparation and preservation, by traditional methods of marine produce, mainly mullet and beche-de-mer. The activities of the unit mainly consist of visits to rural areas where officers advise and direct the production of salted fish and beche-de-mer, and assess the potential for future production of these items. The product is marketed by the unit on behalf of rural groups, thus oroviding
cash to the local economy. Table"shows the areas and the extent of ~
the un ;ts o.chvi nts Junn9 1q1q
Table blf-
nate
18.1.79 8.2.79 22.3.79 23.3.79 23.3.79 23.3.79 3.4.79 9.4.79 17.4.79 1.5.79 23.5.79
" " " . " "
19.6.79 18.7.79 30.8.79 2.10.79 25.10.79 30.10.79 21.11.79 26.11.79 17.12.79
IJ
Areas and quantities of Fish Processing Unit production, 1979
Islands F/Group Beche-de-Mer
Beqa Lakeba Kaba Yadua Kia Akei Tokalau Vatulele Vatulele Yacata Tate Tadulala Muanaira Naividamu Muanaicake Komo 0gea Muanaira Naqara Vabea Yanuya Qaranivai Mataso Naivakarauniniu Muanaicake Fisheries
Kadavu ( Maleli)
T o t a 1
Wt (lbs) $
43 167 275 587
1,643 28
200 39
318 36
488 259
9 401 135
1,581 723 489
84
23 987
30.50 288.00 424.00 944.00
1,860.00 30.00
215.50 34.20
325.30 1.00
905.50 449.50
2.70 301.50 102.50
1,426.75 1,140.65
811.85 64.75
41.70 981.70
8,497lbs $7,981.60
= 3.3 tonnes I
/OS
Salted Fish Wt. (lbs) $
832 1,094
751
163
844.00 1,094.00
751.00
179.30
2,840 lbs $2,869.30
= 1.02 tonnE
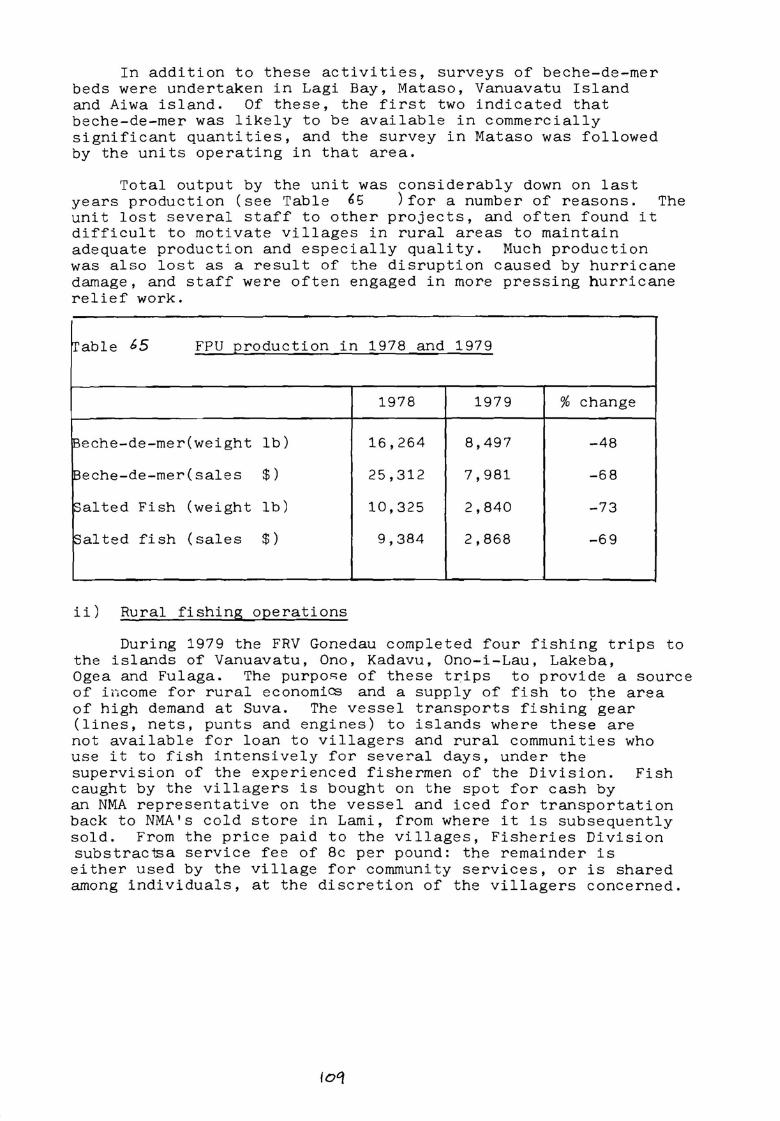
In addition to these activities, surveys of beche-de-mer beds were undertaken in Lagi Bay, Mataso, Vanuavatu Island and Aiwa island. Of these, the first two indicated that beche-de-mer was likely to be available in commercially significant quantities, and the survey in Mataso was followed by the units operating in that area.
Total output by the unit was considerably down on last years production (see Table 65 )for a number of reasons. The unit lost several staff to other projects, and often found it difficult to motivate villages in rural areas to maintain adequate production and especially quality. Much production was also lost as a result of the disruption caused by hurricane damage, and staff were often engaged in more pressing hurricane relief work.
Table 65 FPU production in 1978 and 1979
1978 1979 % change
~eche-de-mer(weight lb) 16,264 8,497 -48
Beche-de-mer(sales $) 25,312 7,981 -68
Salted Fish (weight lb) 10,325 2,840 -73
Salted fish (sales $) 9,384 2,868 -69
ii) Rural fishing operations
During 1979 the FRV Gonedau completed four fishing trips to the islands of Vanuavatu, Ono, Kadavu, Ono-i-Lau, Lakeba, Ogea and Fulaga. The purpose of these t~ips to provide a source of income for rural economi~ and a supply of fish to the area of high demand at Suva. The vessel transports fishing gear (lines, nets, punts and engines) to islands where these are not available for loan to villagers and rural communities who use it to fish intensively for several days, under the supervision of the experienced fishermen of the Division. Fish caught by the villagers is bought on the spot for cash by an NMA representative on the vessel and iced for transportation back to NMA's cold store in Lami, from where it is subsequently sold. From the price paid to the villages, Fisheries Division substrac1sa service fee of 8c per pound: the remainder is either used by the village for community services, or is shared among individuals, at the discretion of the villagers concerned.
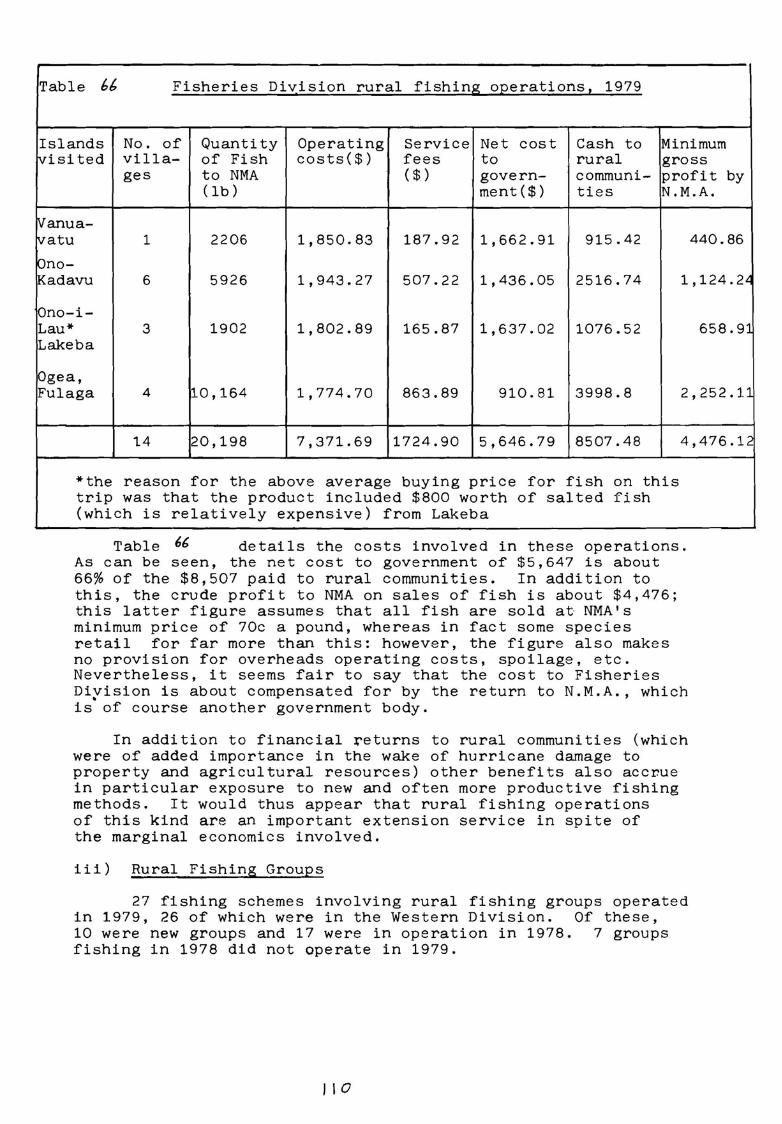
Table 66 Fisheries Division rural fishing 02erations 1 1979
Islands No. of Quantity Operating Service Net cost Cash to Minimum visited villa- of Fish costs($) fees to rural gross
ges to NMA ( $ ) govern- communi- profit by (lb) ment($) ties N.M.A.
Vanua-tvatu 1 2206 1,850.83 187.92 1,662.91 915.42 440.86
Ono-Kadavu 6 5926 1,943.27 507.22 1,436.05 2516.74 1,124. 2'-
Ono-i-Lau* 3 1902 1,802.89 165.87 1,637.02 1076.52 658.91 Lakeba
Ogea, Fulaga 4 10,164 1,774.70 863.89 910.81 3998.8 2,252.11
14 20,198 7,371.69 1724.90 5,646.79 8507.48 4,476.12
*the reason for the above average buying price for fish on this trip was that the product included $800 worth of salted fish (which is relatively expensive) from Lakeba
Table 66 details the costs involved in these operations. As can be seen, the net cost to government of $5,647 is about 66% of the $8,507 paid to rural communities. In addition to this, the crude profit to NMA on sales of fish is about $4,476; this latter figure assumes that all fish are sold at NMA's minimum price of 70c a pound, whereas in fact some species retail for far more than this: however, the figure also makes no provision for overheads operating costs, spoilage, etc. Nevertheless, it seems fair to say that the cost to Fisheries Di~ision is about compensated for by the return to N.M.A., which is of course another government body.
In addition to financial returns to rural communities (which were of added importance in the wake of hurricane damage to property and agricultural resources) other benefits also accrue in particular exposure to new and often more productive fishing methods. It would thus appear that rural fishing operations of this kind are an important extension service in spite of the marginal economics involved.
iii) Rural Fishing Groups
27 fishing schemes involving rural fishing groups operated in 1979, 26 of which were in the Western Division. Of these, 10 were new groups and 17 were in operation in 1978. 7 groups fishing in 1978 did not operate in 1979.
l 10
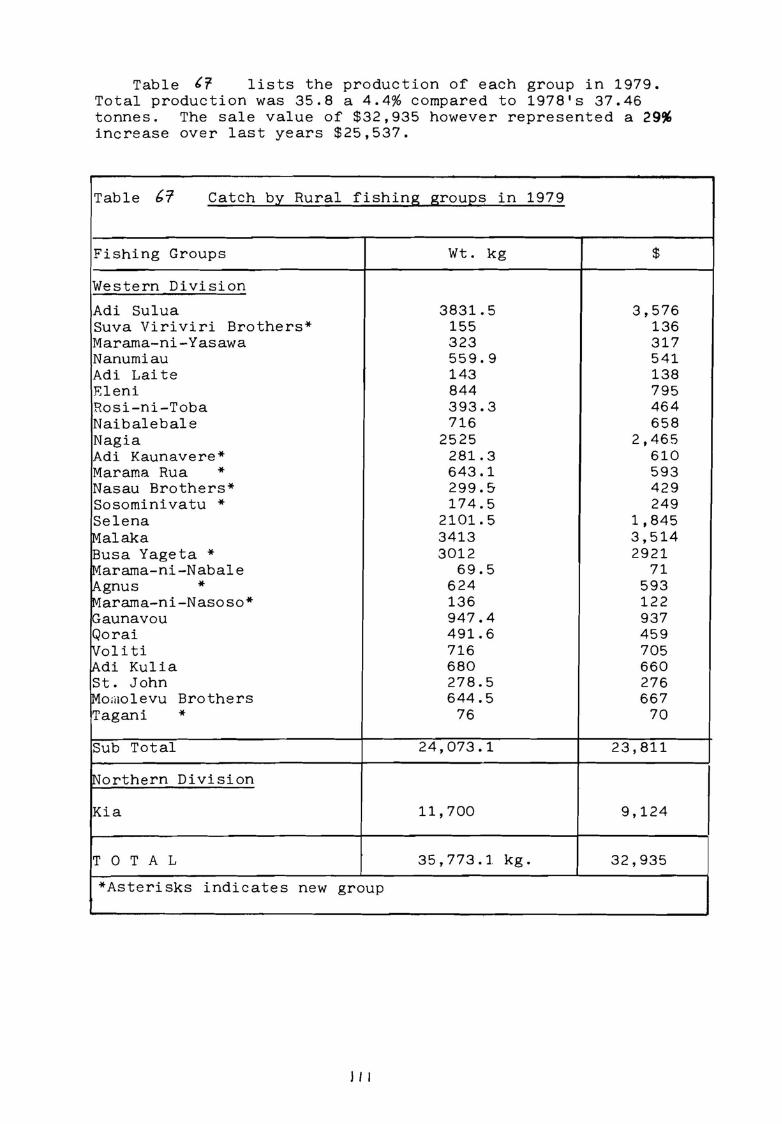
Table tr- lists the production of each group in 1979. Total production was 35.8 a 4.4% compared to 1978's 37.46 tonnes. The sale value of $32,935 however represented a 29% increase over last years $25,537.
Table bt' Catch by Rural fishing groups in 1979
Fishing Groups
Western Division
Adi Sulua Suva Viriviri Brothers* Marama-ni-Yasawa Nanumiau Adi Laite Eleni Rosi-ni-Toba Naibalebale Nagia Adi Kaunavere* Marama Rua * Nasau Brothers* Sosominivatu * Selena Malaka Busa Yageta * Marama-ni-Nabale Agnus * Marama-ni-Nasoso* Gaunavou Qorai IVoliti [Adi Kulia St. John 1Mo;i1olevu Brothers Tagani *
Sub Total
~orthern Division
Kia
T O T A L
*Asterisks indicates new group
l II
Wt. kg
3831.5 155 323 559.9 143 844 393.3 716
2525 281.3 643.1 299.5-174.5
2101.5 3413 3012
69.5 624 136 947.4 491. 6 716 680 278.5 644.5
76
24,073.1
11,700
35,773.1 kg.
$
3,576 136 317 541 138 795 464 658
2,465 610 593 429 249
1,845 3,514 2921
71 593 122 937 459 705 660 276 667
70
23,811
9,124
32,935
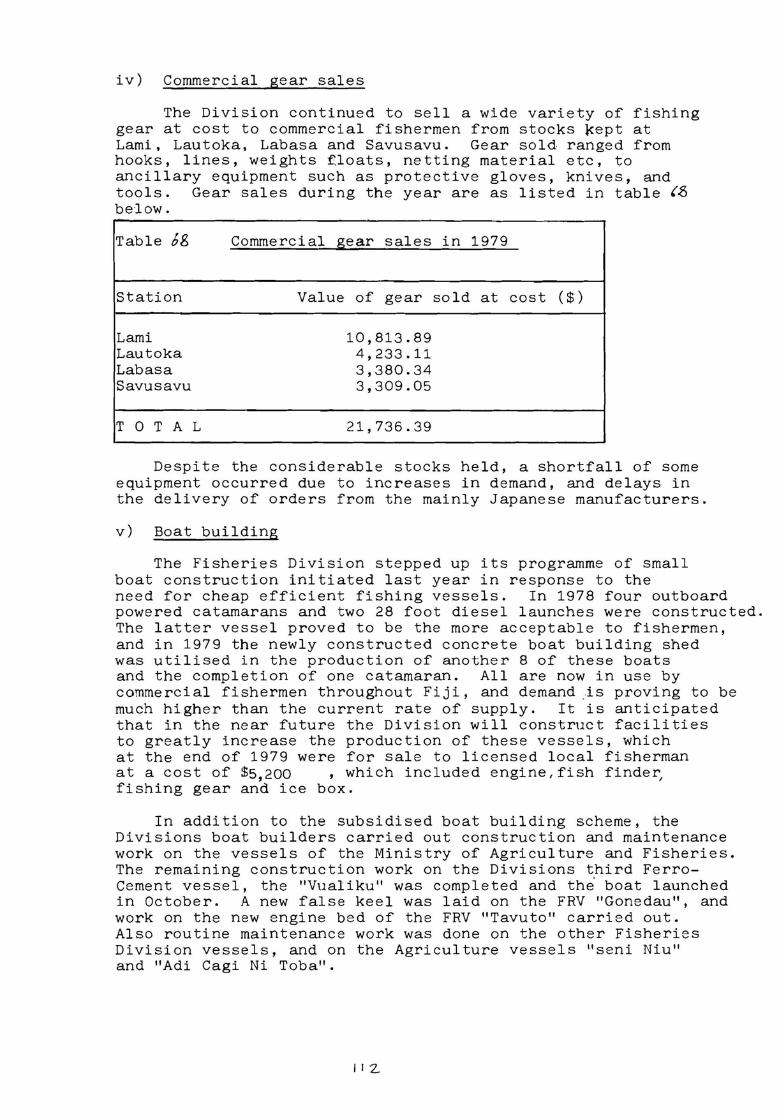
iv) Commercial gear sales
The Division continued to sell a wide variety of fishing gear at cost to commercial fishermen from stocks ~ept at Lami, Lautoka, Labasa and Savusavu. Gear sold ranged from hooks, lines, weights floats, netting material etc, to ancillary equipment such as protective gloves, knives, and tools. Gear sales during the year are as listed in table (S below.
Table Jg Commercial g;ear sales in 1979
Station Value of gear sold at cost ($)
Lami 10,813.89 Lautoka 4,233.11 Labasa 3,380.34 Savusavu 3,309.05
T 0 T A L 21,736.39
Despite the considerable stocks held, a shortfall of some equipment occurred due to increases in demand, and delays in the delivery of orders from the mainly Japanese manufacturers.
v) Boat building
The Fisheries Division stepped up its programme of small boat construction initiated last year in response to the need for cheap efficient fishing vessels. In 1978 four outboard powered catamarans and two 28 foot diesel launches were constructed. The latter vessel proved to be the more acceptable to fishermen, and in 1979 the newly constructed concrete boat building shed was utilised in the production of another 8 of these boats and the completion of one catamaran. All are now in use by commercial fishermen throughout Fiji, and demand _is proving to be much higher than the current rate of supply. It is anticipated that in the near future the Division will construct facilities to greatly increase the production of these vessels, which at the end of 1979 were for sale to licensed local fisherman at a cost of $5,200 , which included engine,fish finde~ fishing gear and ice box.
In addition to the subsidised boat building scheme, the Divisions boat builders carried out construction and maintenance work on the vessels of the Ministry of Agriculture and Fisheries. The remaining construction work on the Divisions third FerroCement vessel, the "Vualiku" was completed and the· boat launched in October. A new false keel was laid on the FRV "Gonedau", and work on the new engine bed of the FRV "Tavuto" carried out. Also routine maintenance work was done on the other Fisheries Division vessels, and on the Agriculture vessels "seni Niu" and "Adi Cagi Ni Toba".
I I 2..
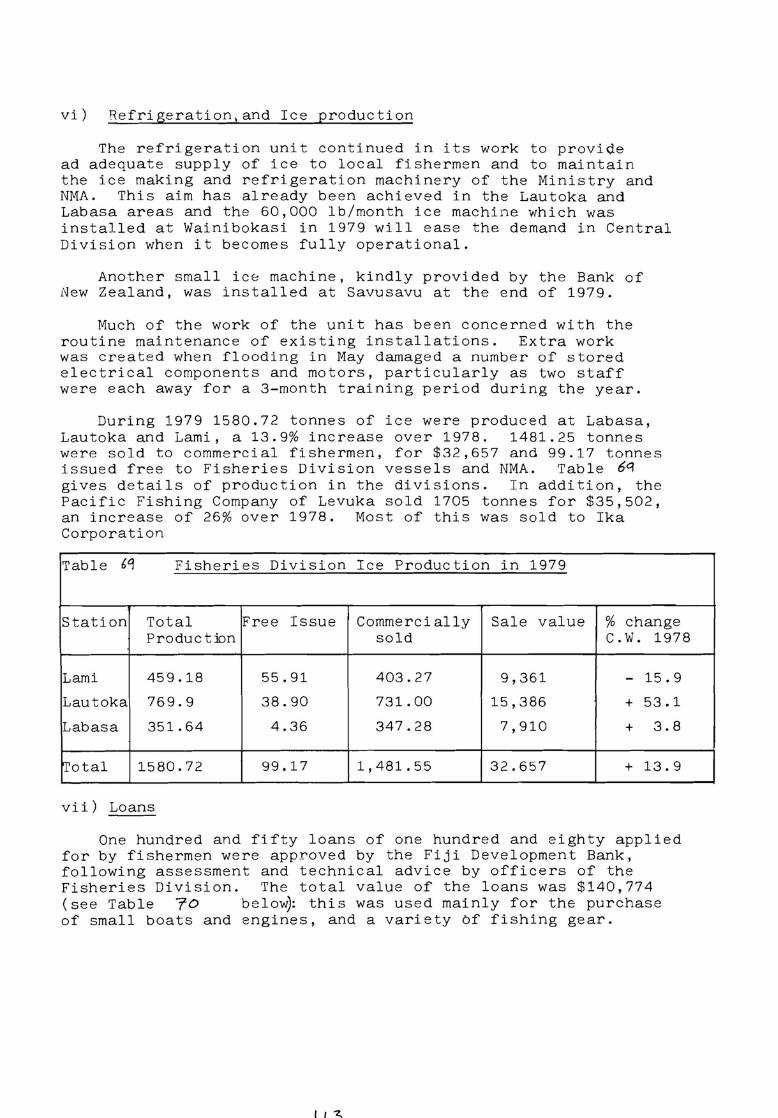
vi) Refrigeration,and Ice production
The refrigeration unit continued in its work to provide ad adequate supply of ice to local fishermen and to maintain the ice making and refrigeration machinery of the Ministry and NMA. This aim has already been achieved in the Lautoka and Labasa areas and the 60,000 lb/month ice machine which was installed at Wainibokasi in 1979 will ease the demand in Central Division when it becomes fully operational.
Another small ic8 machine, kindly provided by the Bank of New Zealand, was installed at Savusavu at the end of 1979.
Much of the work of the unit has been concerned with the routine maintenance of existing installations. Extra work was created when flooding in May damaged a number of stored electrical components and motors, particularly as two staff were each away for a 3-month t raining period during the year.
During 1979 1580.72 tonnes of ice were produced at Labasa, Lautoka and Lami, a 13.9% increase over 1978. 1481.25 tonnes were sold to commercial fishermen, for $32,657 and 99.17 tonnes issued free to Fisheries Division vessels and NMA. Table 6'l gives details of production in the divisions. In addition, the Pacific Fishing Company of Levuka sold 1705 tonnes for $35,502, an increase of 26% over 1978. Most of this was sold to Ika Corporation
Table 6q Fisheries Division Ice Production in 1979
Station Total Free Issue Commercially Sale value % change Product:ion sold c.w. 1978
Lami 459.18 55.91 403.27 9,361 - 15.9
Lautoka 769.9 38.90 731.00 15,386 + 53.1
Labasa 351.64 4.36 347.28 7,910 + 3.8
ITotal 1580.72 99.17 1,481.55 32.657 + 13.9
vii) Loans
One hundred and fifty loans of one hundred and eighty applied for by fishermen were approved by the Fiji Development Bank, following assessment and technical advice by officers of the Fisheries Division. The total value of the loans was $140,774 ( see Table ro below): this was used mainly for the purchase of small boats and engines, and a variety bf fishing gear.
I -z.
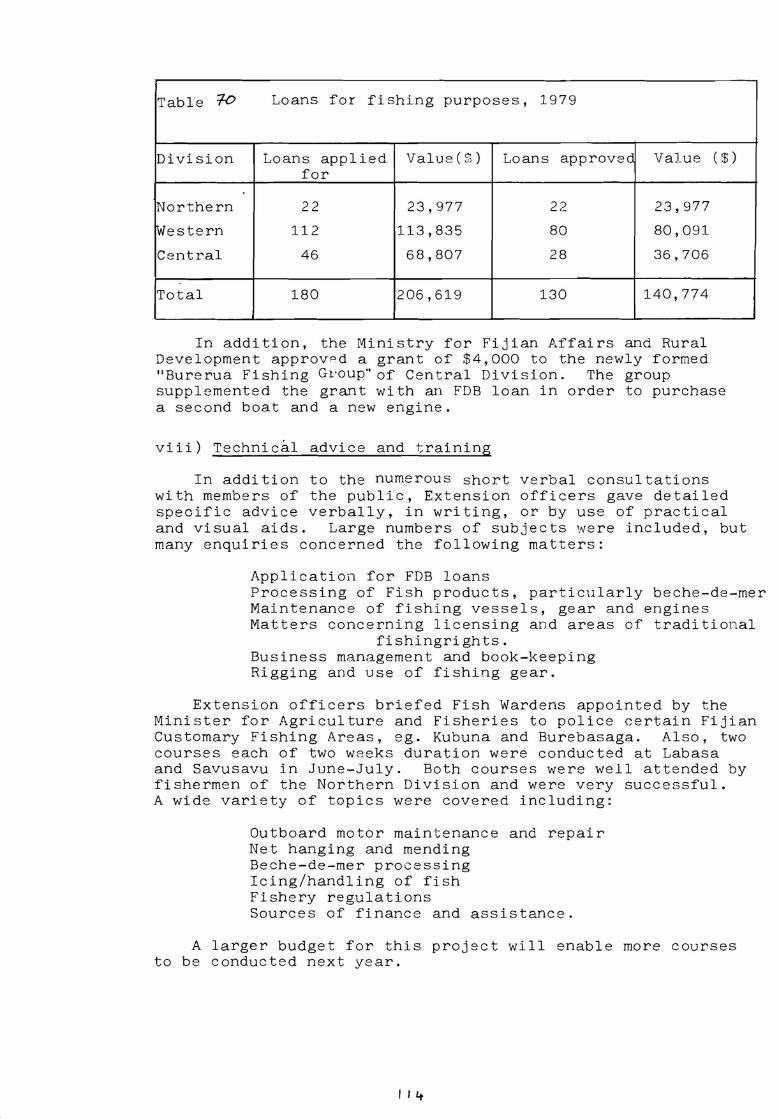
Table 70 Loans for fishing purposes, 1979
Division Loans applied Value( $ ) Loans approved Value ( $) for
Northern 22 23, 977 2 2 23, 977
Western 112 113,835 80 80,091
Central 46 68,807 28 36,706
Total 180 206,619 130 140,774
In addition, the Ministry for Fijian Affairs and Rural Development approvPd a grant of $4,000 to the newly formed "Burerua Fishing G1·oup·· of Central Division. The group supplemented the grant with an FDB loan in order to purchase a second boat and a new engine.
viii) Technical advice and training
In addition to the numerous short verbal consultations with members of the public, Extension officers gave detailed specific advice verbally, in writing, or by use of practical and visual aids. Large numbers of subjects were included, but many enquiries concerned the following matters:
Application for FDB loans Processing of Fish products, particularly beche-de-mer Maintenance of fishing vessels, gear and engines Matters concerning licensing and areas of traditional
fishingrights. Business management and book-keeping Rigging and use of fishing gear.
Extension officers briefed Fish Wardens appointed by the Minister for Agriculture and Fisheries to police certain Fijian Customary Fishing Areas, eg. Kubuna and Burebasaga. Also, two courses each of two weeks duration were conducted at Labasa and Savusavu in June-July. Both courses were well attended by fishermen of the Northern Division and were very successful. A wide variety of topics were covered including:
Outboard motor maintenance and repair Net hanging and mending Beche-de-mer proc e s s ing Icing/handling of fish Fishery regulations Sources of finance and as s istance.
A larger budget for this project will enable more courses to be conducted next year.
I I It

ix) Library and information services
The relocation of the Divisions library allowed additional space to made available for efficient cataloguing and storage of books, periodicals, documents and other literature. Internal use of the librarie r facilities was extensive, and over 2500 loans were made, to members of the public and other institutions as well as to Fisheries Division staff. Substantial quantities of literature have been acquired by direct purchase, from aid sources, and from private donors, and the library now has more than 150 feet of books. Other equipment, including a photocopier has also been added to the library, which is frequently used for the display of information films and slide programmes. A number of newspaper articles, radio broadcasts and information pamphlets on fisheries topics of current interest have also been released.
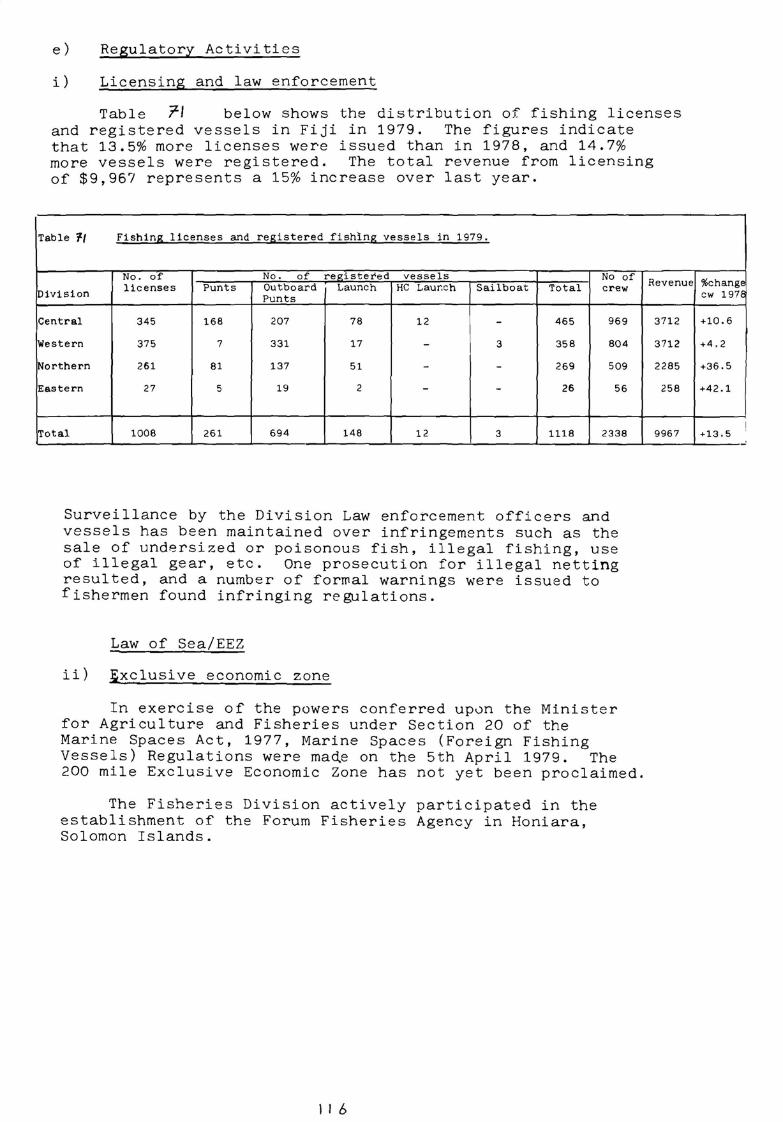
e)
i)
Regulatory Activities
Licensing and law enforcement
Table 'JI below shows the distribution of fishing licenses and registered vessels in Fiji in 1979. The figures indicate that 13.5% more licenses were issued than in 1978, and 14.7% more vessels were registered. The total revenue from licensing of $9,967 represents a 15% increase over last year.
Table 1-( Fishing licenses and resistered fishing vessels in 1979.
No. of' No. of' re11:ister'ed vessels No of
Division licenses Punts Outboard Launch HC Laur.ch Sailboat Total crew
Punts
Central 345 168 207 78 12 - 465 969
Western 375 7 331 17 - 3 358 804
Northern 261 81 137 51 - - 269 509
Eastern 27 5 19 2 - - 26 56
Total 1008 261 694 148 12 3 1118 2338
Surveillance by the Division Law enforcement officers and vessels has been maintained over infringements such as the sale of undersized or poisonous fish, illegal fishing, use of illegal gear, etc. One prosecution for illegal netting resulted, and a number of formal warnings were issued to fishermen found infringing regulations.
Law of Sea/EEZ
ii) ixclusive economic zone
In exercise of the powers conferred up0n the Minister for Agriculture and Fisheries under Section 20 of the Marine Spaces Act, 1977, Marine Spaces (Foreign Fishing Vessels) Regulations were maqe on the 5th April 1979. The 200 mile Exclusive Economic Zone has not yet been proclaimed.
The Fisheries Division actively participated in the establishment of the Forum Fisheries Agency in Honiara, Solomon Islands.
11 6
Revenue
3712
3712
2285
258
9967
%change cw 1976
+10.6
+4.2
+36.5
+42.1
I +13,5
-'
Related Documents