ID. 152 527 DOCONE1T RIME' 'SE 023 992 . \ AUTHOR Robitaille, David F.; And Others . TITLE , British Columbia Mathematics Assessment, 1977. Report y Number 3: Technical Report. 4. INSTITUTION British ColumbiaUniv., Vancouver. ,,.. PUB DATE Sep 77 NOTE 314p.; Prepared for the Learning Assessment Branch of the Ministry of Education; For related documents, see" SE 023.990-993; Not available in.hard copy due to marginal legibility of original document / - , ,. *DES PRICE DESCRIPTORS MP -$0.83 ,Plus Postage. BC Not Availa2ble from ED8S. Academic Achievement; *Educational Assessmin 1 *Educational Research; *Elementary Seqonda Bdubatioll; Grade 4rGrade 8; Grade 14 *I struction; *Mathematics EducattiOn; Needs Assessmen Teacher , Attitudes; Tests , I. '.. IDENT'IPIERS. *British Columbia ,1 , . ABSTRACT , , As part of the 1977 'British Col mtia Mathematics .. , Assessment,, over 100,000 students from Grades '8,' and 12 vere,given 1 tests designed to measure mastery of a limi -d number of important - mathematical skillS anal concepts. ApprOxim tell 3,500 teachers of ' mathematics at 'seven different grade lev = s (1,3,4,7,8110,12) con letid comprehensive questionnaires ealibg vith:numerout aspects of e Methods and materials in the.t- china of mathematics in the pro nce. This report is one of a f rnpart series and aives a review of the items and data from bdth t Student'Teste and Teacher Questionnaires. (MN) / / / , **** *************4*P************************************************ /* Reproductions supplied by EDRS are the best that can be made * / * from the original document. ** ***i************************************************i*************** / .

Welcome message from author
This document is posted to help you gain knowledge. Please leave a comment to let me know what you think about it! Share it to your friends and learn new things together.
Transcript
ID. 152 527
DOCONE1T RIME'
'SE 023 992. \
AUTHOR Robitaille, David F.; And Others .
TITLE , British Columbia Mathematics Assessment, 1977. Reporty Number 3: Technical Report. 4.
INSTITUTION British ColumbiaUniv., Vancouver.,,..
PUB DATE Sep 77NOTE 314p.; Prepared for the Learning Assessment Branch of
the Ministry of Education; For related documents, see"SE 023.990-993; Not available in.hard copy due tomarginal legibility of original document / -
, ,.
*DES PRICEDESCRIPTORS
MP -$0.83 ,Plus Postage. BC Not Availa2ble from ED8S.Academic Achievement; *Educational Assessmin 1*Educational Research; *Elementary SeqondaBdubatioll; Grade 4rGrade 8; Grade 14 *I struction;*Mathematics EducattiOn; Needs Assessmen Teacher ,
Attitudes; Tests ,I.
'..IDENT'IPIERS. *British Columbia,1, .
ABSTRACT
,
, As part of the 1977 'British Col mtia Mathematics..,
Assessment,, over 100,000 students from Grades '8,' and 12 vere,given
1
tests designed to measure mastery of a limi -d number of important- mathematical skillS anal concepts. ApprOxim tell 3,500 teachers of
' mathematics at 'seven different grade lev = s (1,3,4,7,8110,12)con letid comprehensive questionnaires ealibg vith:numerout aspectsof e Methods and materials in the.t- china of mathematics in thepro nce. This report is one of a f rnpart series and aives a reviewof the items and data from bdth t Student'Teste and TeacherQuestionnaires. (MN) /
/ /,
**** *************4*P************************************************/* Reproductions supplied by EDRS are the best that can be made *
/ * from the original document.** ***i************************************************i***************
/ .
,
I Vs.
sv.
BRITISH COLUMBIA .
MATHEMATICS. ASSESSMENT1977
la
Tee/tiff:cal RI-242,11
U S DEPARTMENT OF HEALTH.EDUCATION &WELFARENATIONAL INSTITUTE OF
EDUCATION
THIS DOCUMENT HAS BEEN REPRO.DUCEO EXACTLY AS RECEIVE° FROMHEPERSON OR OR4ANI2ATIbN
MIND IT POINTSOF VIEW OR OPINIONSSTATED 00 NOT NECESSARILY REFRESENT OFFICIAL NATIONAL INSTITUTE OF
EOuCAVON POSITION OR POLICY
"P MISSION TO REPRODUCE THISMATERIL HAS BEEN GRANTED
Janiei Sherrill
10 THE EDUCATION4L RESOURCESFORMAIION CENTER (ERIC) AND
SERS OF THE ERIC SYSTOI*
A .REPORT TO
2THE MINISTRY EDInAVONPROVINCE OF BRITISH COLUMBIA
1 I
THE B.C. MATHEMATICS ASSESSMENT
4
SIP
Report No. 3 ,
-1
TECHNICAL REPORT
0
Septembe4 1977 ^41
;
Mathematics Assessment Contract Team,
.
David F. Robitaille"(Chairman) - Faculty of Education, U.B.C.James M. Sherrill' - Faculty'of Education, U.B.C.
.Heather Kelleher . . - Teacher, New WeatminsterSchool District
-7--_-john Klassenr Teacher, North Vancouver Schooi-Districif
3
BRITISH COLLMBIA MATHEMATTCS ASSESSMENT (1976-77)
TECUNICAL REPORT
)
ob
The Technical Report has been prepared for teachers, researchers, andothers who may Be interested in, reviewing the items and the data m theStudent Tests and Teacher Questi\apnaire. Anyone requiring acc thedata tapes should contact the Director of the Learning Assessme :ranchof the Ministry of Education.
This volume is one in a series of four reports dealing with the Mathe-mattes Assessment. The other three are entitled Test Results, TeacherQuestionnaire, and Summary Report respectively. Copies of all reports may
%be obtained from the Learning Assessment, Branch.
The present report is divided into two Sections, with the first pageof each.section being labelled as Page 1. Section I concernsthe StudentTest results; and Section II concerns the-Teacher Ques_tio'nnaire.
Student Tests
Student Tests were constructed for administration at three grade levels:4, 8, and 12. The mathematics topics tested were selected from those topicswhich most informed observers would agree are among the essential conceptsand skirls of mathematics at the three levels tested: end of primary educa-tion, end of elementary eduation, and end, of public schooling.' Three'levels of cognitive behaviour, called domains, each sub-diyided into a
number of objectives, made up the framework of the assessment.
For each test, a. total administration time of ninety,minutes. yeas' allotted:,
thirty minutes for instructions, distribution, and collection of the'tesibooklets and answer.cards, arid sixty minutes for completton of'thefest..
# I
.
Pilot testing of the assessment instruments was lidicted'dwiang,the ,.
c..
late fall of 1976 in several school districts aordss th .! province: Approx-imately 250 students at each of the three grade levels involved wrote the '
tests',...and,their results were used in deciding upon the final for& of thetests. V 0-
i
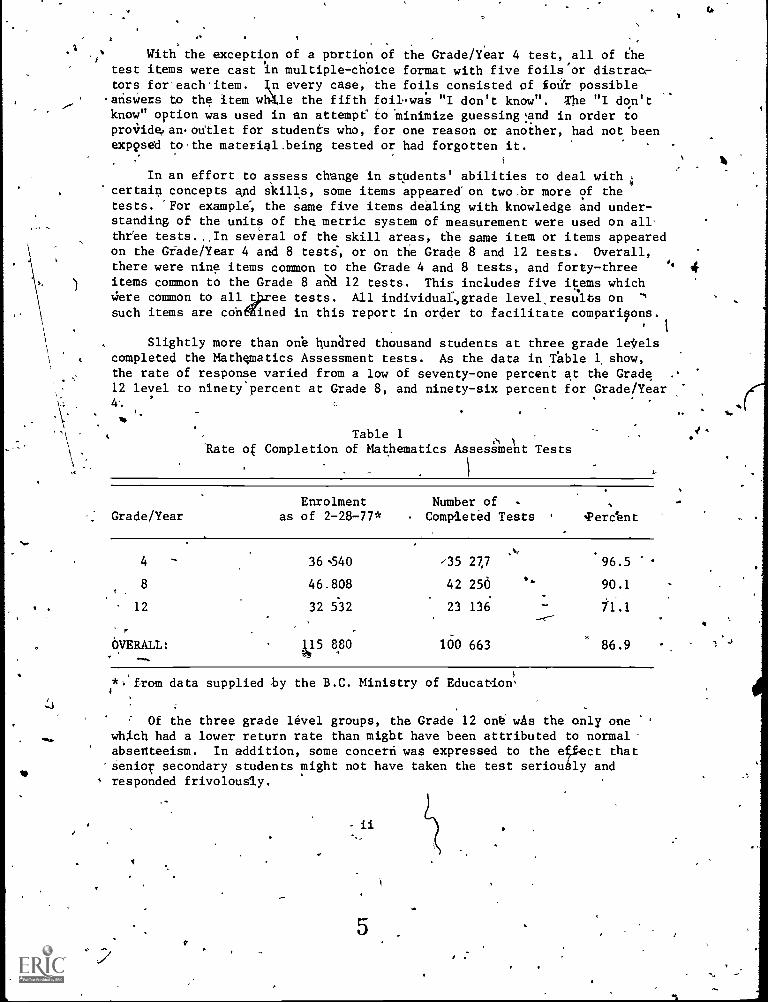
.%With the exception of a pbrtion of the Grade/Year 4 test, all of the
test items were cast In multiple- choice format with five foils or distraer-tors for'each-item. every case, the foils consisted of SoU'r possibleanswers to the item whkle the fifth foil.wa's "I don't know". The "I don'tknow" option was used in an attempeto *minimize guessing 'and in order topro4idepan.outlet for students who, for one reason or another, had not beenexp2sed to.the material.being tested or had forgotten it.
In an effort to assess change in students' abilities to deal withcertain concepts and skills, some items appearedon two .br more of thetests. *For example; the same five items dealing with knowledge and under-standing of the units of the metric system of measurement were used on allthree tests. In several of the skill areas, the same item or items appearedon the Gfade/Year 4 and 8 tests, or on the Grade 8 and 12 tests. Overall,there were nine items common to the Grade 4 and 8 tests, and forty-three
0,
items common to the Grade 8 ant 12 tests. This includes five items whichWere common to all Spree tests. All individuar,grade levelresUlts on '`
such items are congined in this report in order to facilitate comparisons.1
Slightly more than one hunared thousand students at three grade leelscompleted the Mathematics Assessment tests. As the data in fable 1. show,the rate of response varied from a low of seventy-one percent at the Grade12 level to ninety'percent at Grade 8, and ninety-six percent for Grade/Year
. .
Table 1.1
Rate of Completion of Mathematics Assessment Tests
Grade/YearEnrolment
as of 2-28-77*Number of
. Completed Tests 'Perc 'ent
4 - 36 540 /35 27,7 .96.5
8 46.808 42 256 90.1
12 32 5.32 23 136 71.1
OVERALL: 15 880 100 663 86.9
*. from data supplied by the B.C. Ministry of Education),
Of the three grade level groups, the Grade 12 on6 was the only onewhich had a lower return rate than might have been attributed to normalabsenteeism. In addition, some concern was expressed to the effect that
-senior secondary students might not have taken the test seriouAly andA responded frivolously.
ii
5
.4
A
fr
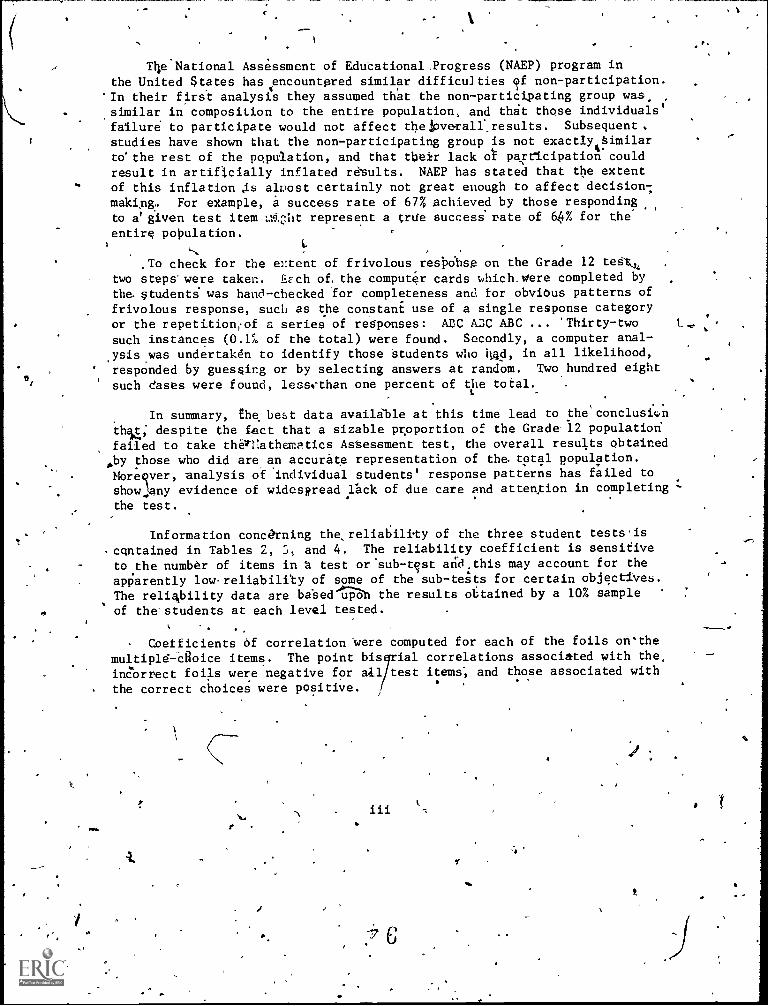
Tile- National Assessment of Educational, Progress (NAEP) program in
the United States has encountered similar difficu]ties Tf non-participation.In their first analysis they assumed that the non-participating group was.similar in composition to the entire population, and tht those individuals'failure to participate would not affect the!overallresults. Subsequent.studies have shown that the non-participating group is not exactly Similartethe rest of the pqpulation, and that their lack rA participation
4could
result in artificially inflated results. NAEP has stated that the extentof this inflation is aluost certainly not great enough to affect decision;making,. For example, a success rate of 67% achieved by those respondingto a' given test item 244-.:ht represent a true success rate of 64% for the
entire population.
To check for the el:tent of frivolous resbdhse on the Grade 12 tes-t,, .
two steps' were taken. EEch of, the computer cards which.were completed bythe studenti was hand-checked for completeness and for obvious patterns offrivolous response, such as the constant use of a single response categoryor the repetitionrof a series of responses: ABC ADC ABC ... 'Thirty-twosuch instances (0.1% of the total) were found. Secondly, a computer anal-ysis was undertaken to identify those Students who Ilqd, in all likelihood,responded by guessing or by selecting answers at random. Two hundred eightsuch eases were found, less, -than one percent of the total.
t
.
In summary, the, best data available at this time lead to the'conclusinthit; despite the fact that a sizable Koportion of the Grade. 12 populationfailed to take theltnathematics Astessment test, the overall results obtainedby those who did are an accurate representation of the total population.Nbrecver, analysis of 'individual students' response patterns has failed toshow.lsny evidence of widesRread lack of due care and attention in completing
the test.
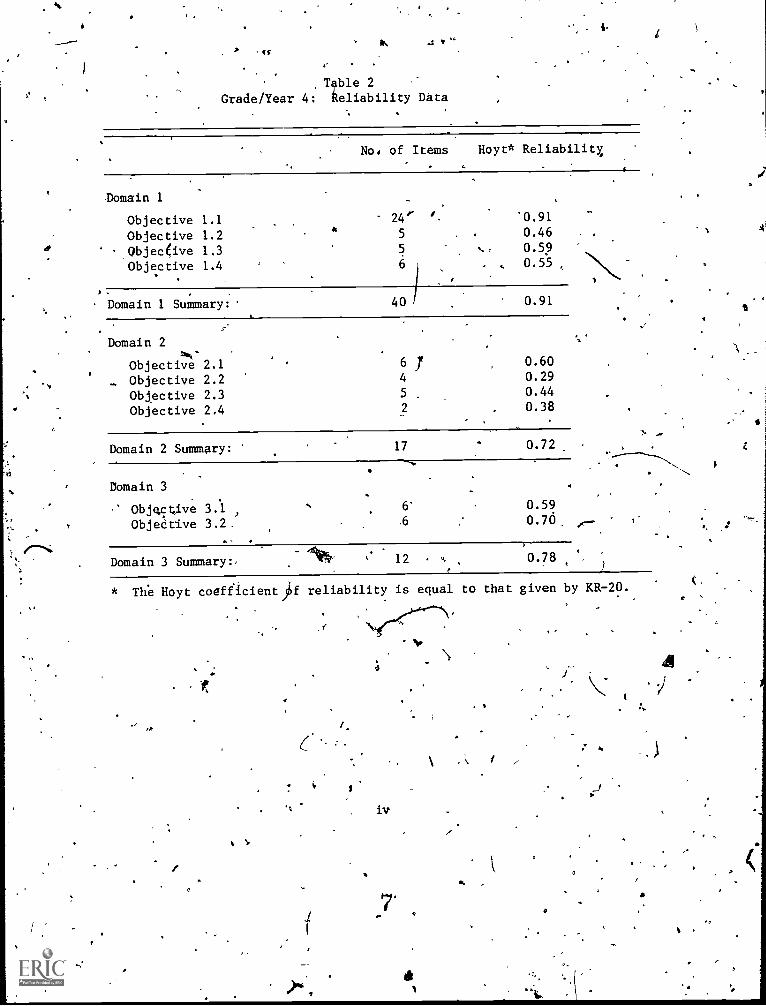
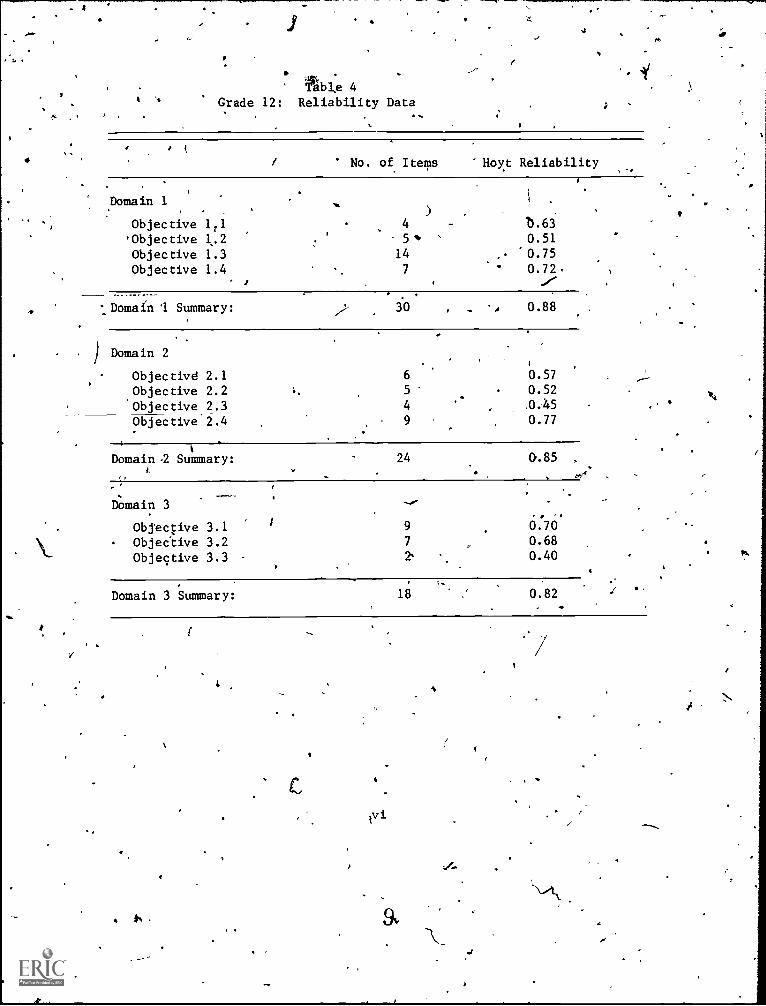
Information concerning the,reliatiiliy of the three student tests'is-contained in Tables 2, 5, and 4. The reliability coefficient is sensitive
to the number of items in t test oraub-test arid.this may account for the
apparently lowreliability of some of the sub-tests for certain objectives.The relig,bility data are baSedr7811 the results obtained by a 10% sample
of the-students at each level tested.
Coefficients df correlation-orrelation Ware computed for each of the foils on'the
multiple-'cRoice items. The point bis 'ial correlations associated with the,
incorrect foils were negative for ail test items; and those associated withthe correct choices were positive.
f
-
Table 2
Grade/Year 4: Reliability Data
No. bf Items Hoyt* Reliability,
omain 1
Objective 1.1 24' ' 0.91
Objective 1.26
5 . 0.46* Objective 1.3 5 ., 0.59
Objective 1.4 6 , 0.55
Domain 1 Summary:' 40 0.91
Domain 2i,.,-
Objective 2.1 . 6 7 0.60
- Objective 2.2 4 0.29
Objective 2.3 5 .0.44
Objective 2.4 2 0.38
Domain 2 Summary: 17 0.72
Domain 3
Objq.cave 3.1 6' 0.59
Obje6tive 3.2. 6 0.70 r--
Domain 3 Summary:, 4*- 12 0.78
Ws.
* The Hoyt coefficienqf reliability is equal to that given by KR-20.
),
N
iv
I
I
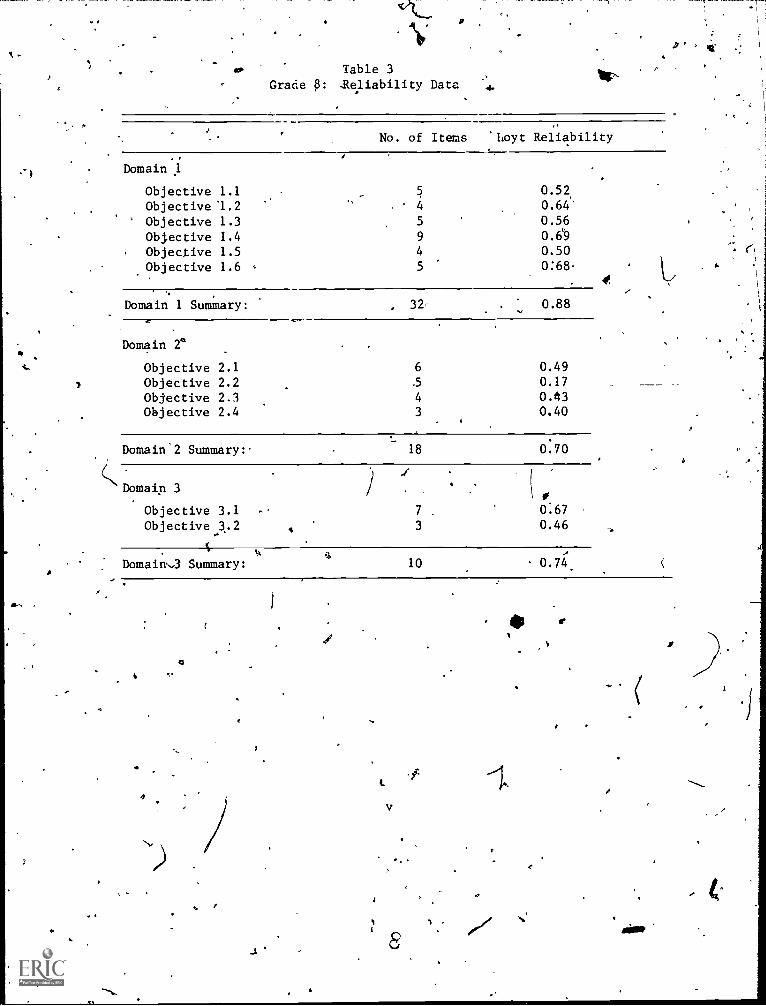
Table 3
Grade 8: .Reliability Data
O
No. of Items 'hoyt Reliability
Domain 1
Objective 1.1Objective 1.2
.4
0.52.
0.64'
' Objective 1.3 5 0.56
Objective 1.4 9 0.6'9
Objective 1.5 4 0.50
Objective 1.6 5 0:68.
Domain 1 Summary: , 32- 0.88
Domain 2'
Objective 2.1 6 0.49
Objective 2.2 .5 0.17 _
Objective 2.3 4 0.43Objective 2.4 3 0.40
Domain'2 Summary: 18 0.70
Domain 3 0
Objective 3.1 7 . 0:67
Objective 3.2 3 0.46
Domaim,3 Summary: 10 0.74.
S
tr.
O
v
_
6
3.
Table 4Grade 12: Reliability Data
ti .
No. of Items Hoyt Reliability
Domain I. .
. ,Objective 1:1 4 /3.63
'Objective 1..2 ' 0.51'0.75Objective 1.3 14
Objective 1.4 7 0.72.J
J
Domain 1 Summary: 30 0.88
) Domain 2
Objectivd 2.1 6 0.57
Objective 2.2 5 0.52"kr
Objective 2.3 4 0.45
9 0.77Objective 2.4
Domain / Summary: 24 0.85
Domain 3
Objective 3.1 9 0:70'
Objective 3.2 7 0.68
Objective 3.3 0.40
Domain 3 Summary: 18 0.82 I
gib
V
tvi
.nn
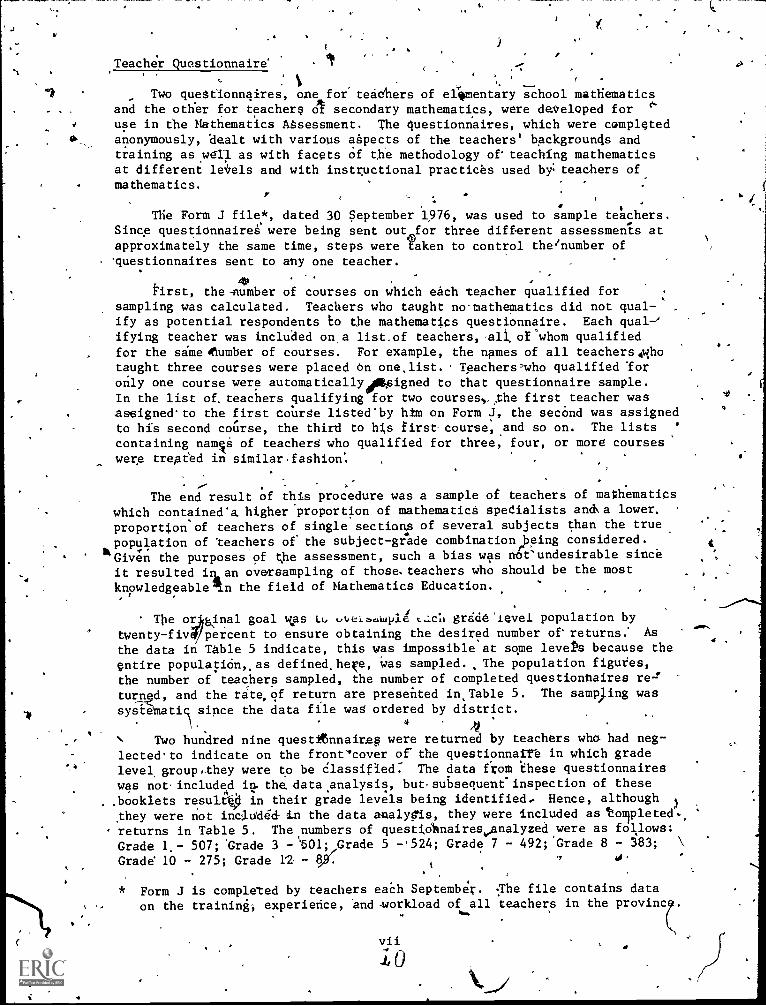
Teacher Questionnaire'
.. .._., -
Two questionnaires, one for teachers of el, oomentary school mathematicsand the other for teachers o secondary mathematics, were developed for '`
use in the Mathematics Atsessment. The questionnaires, which were completedanonymously, dealt with various aspects of the teachers' backgrounds andtraining as well as with facets of the methodology of teaching mathematicsat different le'i.els and with instructional practices used by: teachers ofmathematics.
. .
The Form J file*, dated 30 September 1976, was used to sample teachers.Since questionnairet were being sent out for three different assessments atapproximately the same time, steps were 'taken to control the/number of'questionnaires sent to any one teacher.
40first, the-number of courses on which each teacher qualified for
sampling was calculated. Teachers who taught no mathematics did not qual-'ify as potential respondents to the mathematics questionnaire. Each qual=ifying teacher was included ona list.of teachers,-alt orwhom qualifiedfor the same *umber of courses. For example, the names of all teachers4hotaught three courses were placed bn one,list. . Teachers'who qualified "foronly one course were automatically4psigned to that questionnaire sample.In the list of. teachers qualifying for two courses .,, the first teacher wasassigned.to the first course listed'by him on Form J, the second was assignedto his second course, the third to hits first course,and so on. The lists :containing namiS of teachers who qualified for three, four, or more courseswere treated in similar,fashion:
-
The end result of this procedure was a sample of teachers of mathematicswhich contained'a higher 'proportion of mathematicg specialists and\a lower.proportion of teachers of single sections of several subjects than the truepopulation of teachers of the subject-grade combination,being considered.
R Given the purposes of the assessment, such a bias was not'undesirable sinceit resulted Ilan oversampling of those. teachers who should be the most
knowledgeable .n the field of Mathematics Education.
The or ginal goal was tu grzide'level population by
twenty-fiv percent to ensure obtaining the desired number of returns: As
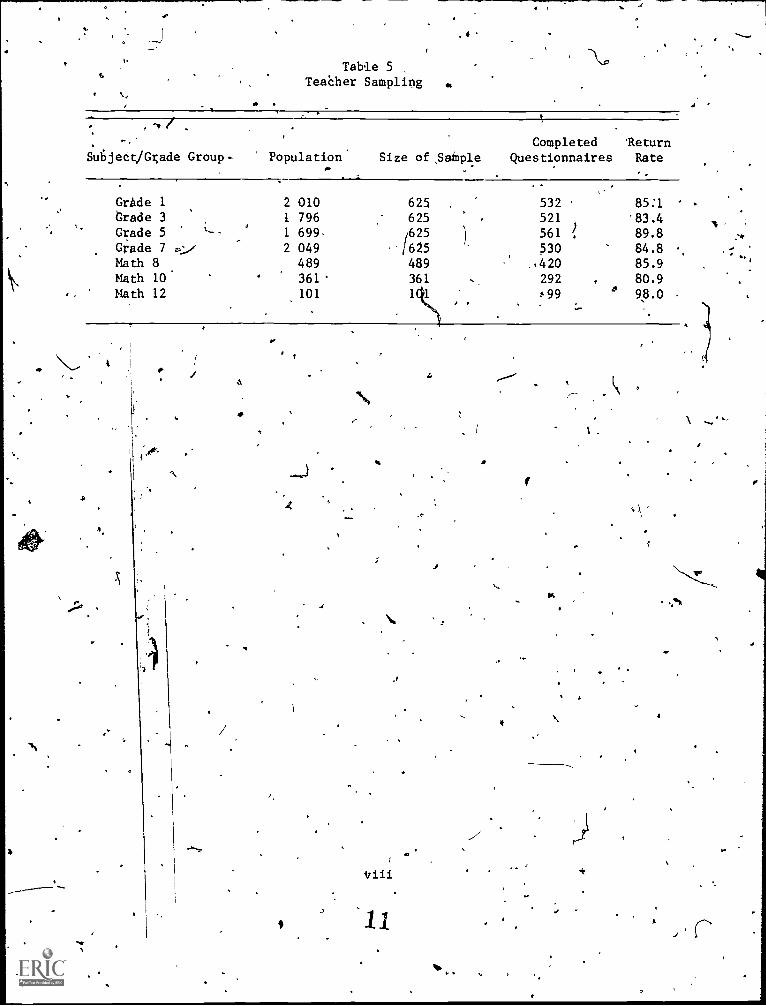
the data in Table 5 indicate, this was impossible at some levers because theentire populatiOn,,as defined.heKe, was sampled., The population figures,the number of teachers sampled, the number of completed questionnaires re=turned, and the rate,of return are presented in Table 5. The sam*ing wassysCematiq since the data file was ordered by district.
Two hundred nine questAnnaftes were returned by teachers who had neg-lectedto indicate on the front'cover of the questionnatre in which gradelevel group, they were to be Classified: The data frot these questionnaires
was not. included in. the, data analysis, but,subsequent'inspection of these
,booklets resu1t0 in their grade levels being identified.. Hence, although
they were not included -in the data analygis, they were included as 'Completed.,
returns in Table 5. The numbers of questiAnairesvanalyzed were as follows:Grade 1.- 507; 'Grade 3 -601; Grade 5 -'524; Grade 7 - 492;'Grade 8 - 583; \
Grade 10 - 275; Grade la -
Form J is completed by teachers each September. The file contains data
on the training; experience, and-workload of all teachers in the proving .
vii0
4
.
Table 5 ,
TeaCher Sampling .
Completed Return.
SuLjeZtjGr.ade Group. Population Size of,Sainple Questionnaires Rate
. .
Grade 1 2 010 625 532 ' 85:1trade 3 1 796 625 521 83.4Grade 5Gade 7
1
2
699.
049625
/625
)
L561
530/. 89.8
84.8Math 8 489 489 420 85.9Math 10. 361' 361 292 80.9Math 12 101 1 1 99 98.0
A
4
viii
I
.
B.C. Mathematics Assessment Technical Report
00,,TABLE OF CONTENTS
\
Page
Introduction
Section I 7 Student Test Results'
J>
r ,
Masteryof Number Facts.
Items 1 - 12_Items 13 - 24.
4
Addition of Whole NumbersItems 26, 28; 29, 32, 38
Sybtraction of Whole NumbersItems 25, 30, 33, 36,39
I
.
1
Itt, 3
4
5
7
P1Q
'
Grade/Year 4 - Objective 1.1:.
Obiective 3.2:
- Objective 1.3:
- Objective 1.4: Knowledge of Notation and TprminplogyItems-48, 49, 51, 66s d . .13Items 57, 63 14
15
17
- Objective 2.1: Place Value ConcePts'It&is 35, 44, 45, 46.Items 47, 50 . 18
4. .
- Objective Number Properties 19 1Items..27, 31, 34, 37 2]
- Objective 2.3: Measo-eMent oncepts 22Items 59, 6 24
Items 64, 6 25
Objective 2.4: pkaction Concepts .26
Items 58, 60 28
- Objective 3.1: Social Applications 29- Items 40,'42, 43 31 -7
Item 6914 32.. Items 55, 68
733
- Objectee 12: MathOatical Applications 34
Items 41, 52, 53 . , 36
- Jtems 54, 66, 67 37 r r
Section I - Student Test Results (continued)
'Grade/Year 8 - Objective 1:1: Combutationmith Whole NumbersItems 4, 8,16, 32, 4°
1
- Objective 1.2: Computation with Rational'Numbersin Fraction Form , 42
.Items 2, 6, 11, 29 45.
- Objective 1.3; Computation with Rational Numbersin Decimal Form 46
Items 1, 5, 15, 17, 28 49
- Objective 1.4: Knowledge of Notation and Terminology 50-Items'3, 7, 9, 20, 30, 33 53Items 34, 44: 45 54
Page
38'41
- Objective 1.5: Knowledge of GeometriC Facts 55Items 39, 40, 42, 55 58
,.
- Objective 1.6: Equivalent Forms of Rational Numbers 59. .Items 13, 31, 35, 46, 51 ' 62
- Objective 2.1: Number ContepteItems 10, 12, 14, 18, 47, 50
- *Objective 2.2: Measurement ConceptsItems 19, 21 22, 23,Item 43
- Obj.ec6., : ,Geometric ConceptsItems 38, 41,-52, 54
- Objective 2.4: Algebraic ConceptsItems 48, 56,, 57
I
- Objective 3.1: Solve Problems Involving Operalion'swith Whold Numbers, Fractions,Decimals, and Percent 80 .
Items 124 - 26 83Items 27, 58 84items 59, 60 85
- Objective 3.2: Solve Problems Involving Geometryand Measurement 86
.Items 36, 37, 53
6366
67
70
71
72
75
76
89
r
4
Section I - Studevtjeft Results
Grade/Year 12 - Objective 1.1:
(continued),.
- Objective
aw
Computation with Rational Numbersin Fraction Form
Items'2, 6.Items 11, 29
1.2: Computation with Rational Numbersin Decimal Form
Items 1, 5, 15Items 17, 28
- Objective 1.3: Knowledge of Notation and TerminologyItems 3, 7, 9Items 10, 20, 30Items 34, 39'Items 40, 42Items 44, 45Items 51, 62
- Objective 1.4:
- Objective 2.1.
Objective 2.2:4.
Objective 2.3:
Knowledge of Other AlgorithmsItems 4, 8, 13Items 16, 31, 35.\Item 46
mbar Concepts
I s 12, 14, 18It s 32, 47, 50
Measurement ConceptsItems 19, 21, 22Items 23, 43
Geometric Concepfis
Items 38, 41,Items 52, 54
Objective02,..4: Alge41741c ConceptsItems 48, -61W ITItems 57, 61, 63Items 64, 67, 68
Objective 3.1: Solve Problems Involving Operations,s with Whole Numbers, Fractions,
Decimal's, and Percent
Items 24 - 26Items 27; 58Items 59, 60, 71
Item 72
Page
909&97
98104105
106
11211314
15
'16117
118
124
125126 '
127
133134
135
141
142
143149
150
151
157
158159
160
`166
167
168169
Section I - Student Test Res s (continued)
Grade/Year 12 - Objecti 3.2: Solve Problems Involving Geometry
Page
,and Measurement.
170.,
. 4 Items'93, 36, 37 176
Items 49, 53, 65. 177
Item 66 ,178
- Objecttve 3.3: Solve Algebraic ProblemsItems 69, 70
Section Ir.- Teacher Questionnaire Results1'
Part I -'Background and General .1nforMation
179
185
Years of post-secondary educatiOk 1
Years of teaching experience 1
Levels taught 1
Major subject area 2
Mathematics content course 2
Mathematics method course 2
°Association membership 3
Attendance at conference mathematics sessions 3Attendance at workshop/in-service days 3
Attitude toward learning and teaching mathematics 4
Ease ofteaching mathematics at various grgsle levels 5
Enjoyment of teaching mathematics at various grade levels 6Importance of various subject areas for student's
success in school `N._.., . 8
Importance of various subject*areas for student's adultlife _ 13
Part II - Learning Outcomes
Grade 1Grade 3Grade 5Grade 7Gract8Grade 10Entering Grade, 8Upon graduation from secondary schoolLevels mathematics course should be required
151
A
191921'222426Z83541
0
V
t.
Pace
A
Section II - Teacher Questionnaire Results (continued)
Part III - Classroom Organization
Number of students :42'
.Time spent teaching mathematics se., el:420
TiMe spent teaching non-mathematics courses 43:Time spent on mathematics lesson' preparation and
marking 43Days spent teaching mathematicsClassroom /' organization (
,....
1.5Student organization 6,
Activities students engage4n n during mathematics"*
instruction 45
Part IV - Classroom Instruction7
. i /'
Tirre spent on five mathematics'contentyargas- 50.r,
Units of measurement used in non-mathematics classes 52
Units of measurement used in mathematics classes 53
Usefulness of various resources in planning lessons 53
Priority of.various factors in affecting success of. program , 61
Frequency of use of various media, materials and "methods 69Use of hand-held calculators
.181
Student's use of hand-held calculators C 81
Use of computeK, - 84,,
Importance of various evaluation techniques 85Availability of Learning Assistance Centre. 1 89AvWability of resource-persons for-mathematics 89 '
Availability of school-based Mathematics program 89
Time which students should spend on assignments 90
.10
Part V - Use of Textbooks
Is a textbook used? 91
Number of textbooks used 91
Type of textbook prescription preferred 91
Should outline of minimum learning outcomes be provided 92
Satisfaction with textbooks 92Number of pages students read in textbook 92
93kind of textbook preferred , 93 .
Importance of.various characteristics of textbooks 94
How textbook is used
t
1
9
4
S'e t' - Tbacher Questionnaire Results (continue'd) .
.
- -
. Part V-- 'Use, of Textbooks (continued)
e
Page
Importanceof various characteristics of teacher'sedition of textbook 96
', Grades 1,. 3 and E textbook ratings .10Grade 7 textbook ratings 106
Grade 8 textbock ratings 108
Crade 10 textboCtjatings 109
Grade 12 textbook ratings 112,
17
4
rf4
sd
e.
Ow.
1
IA
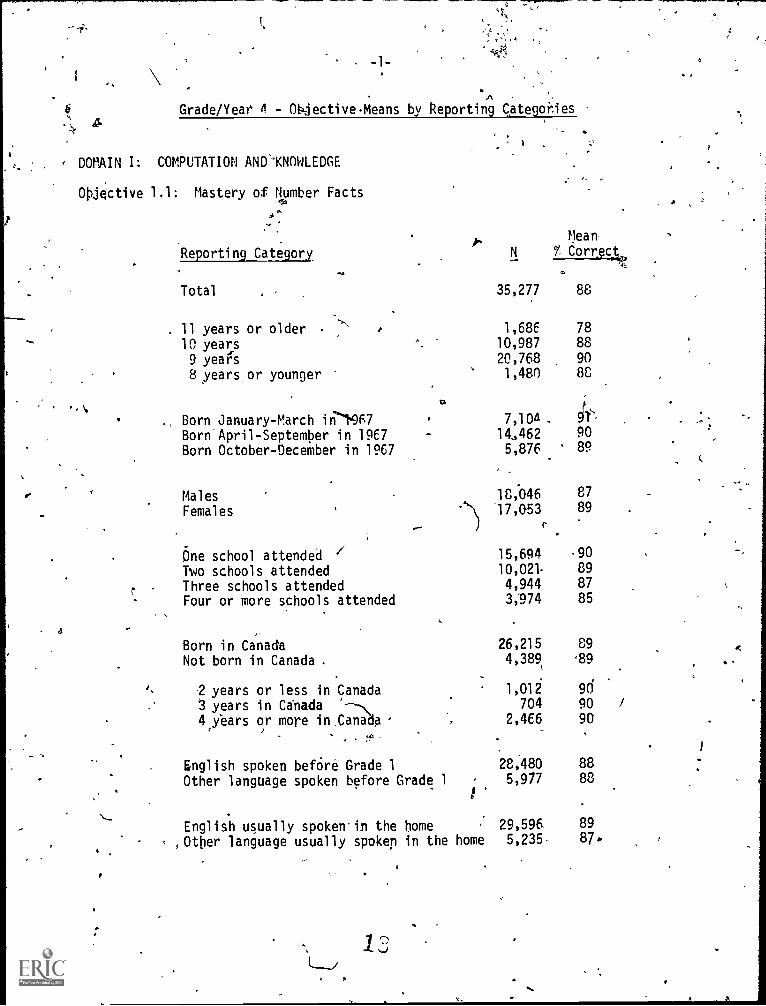
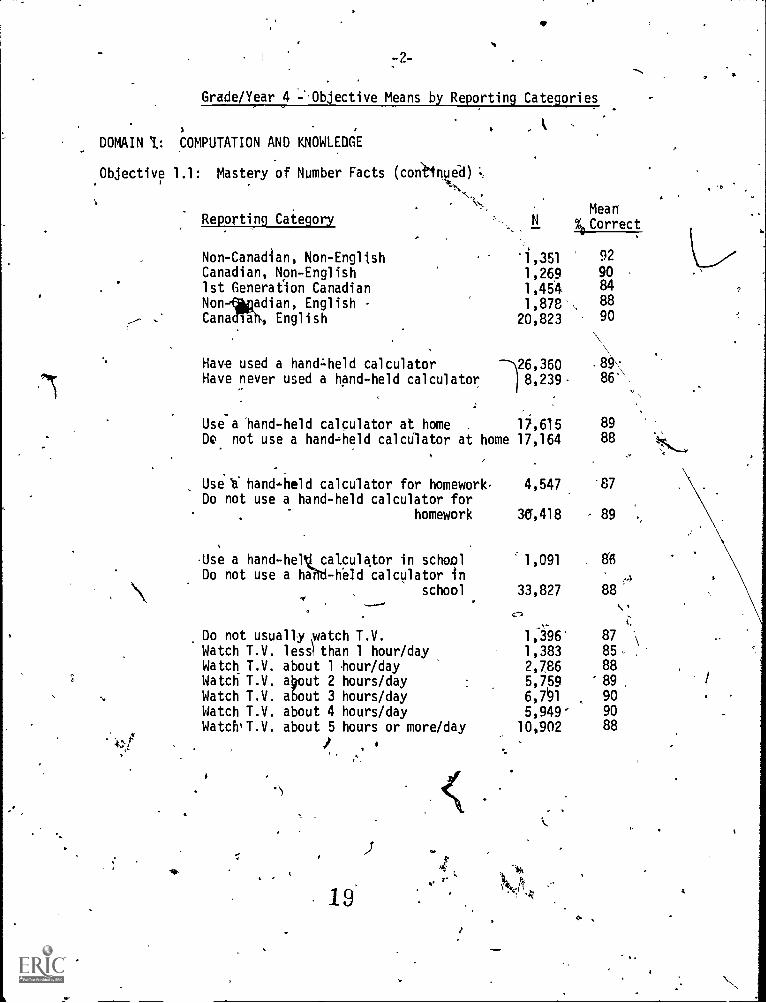
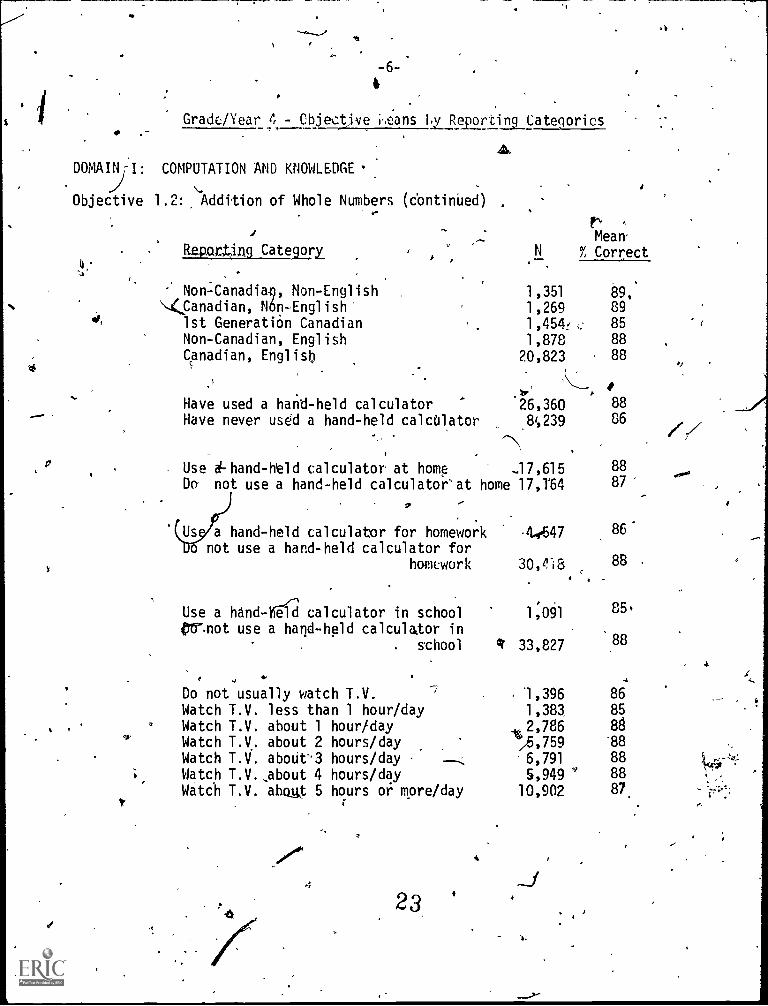
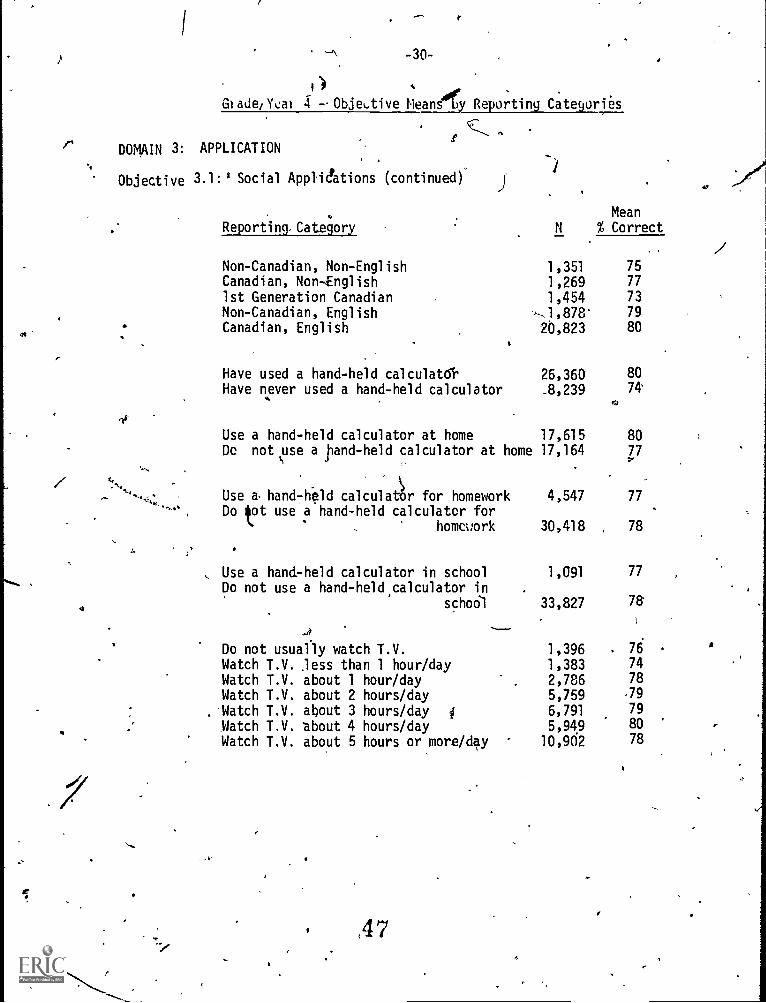
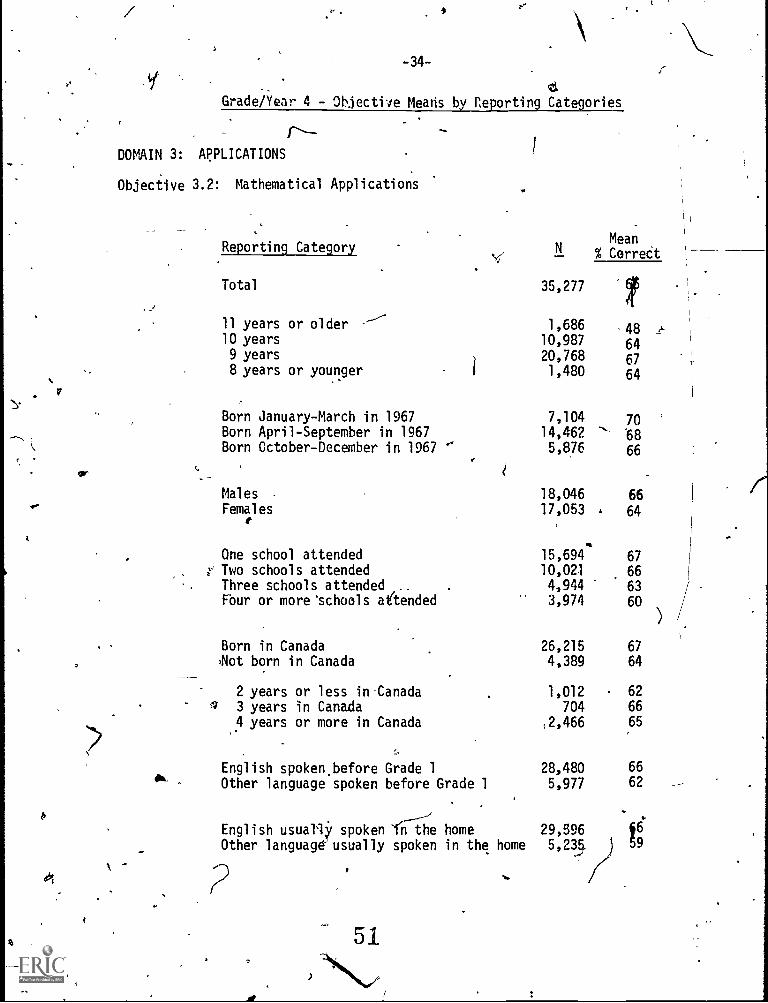
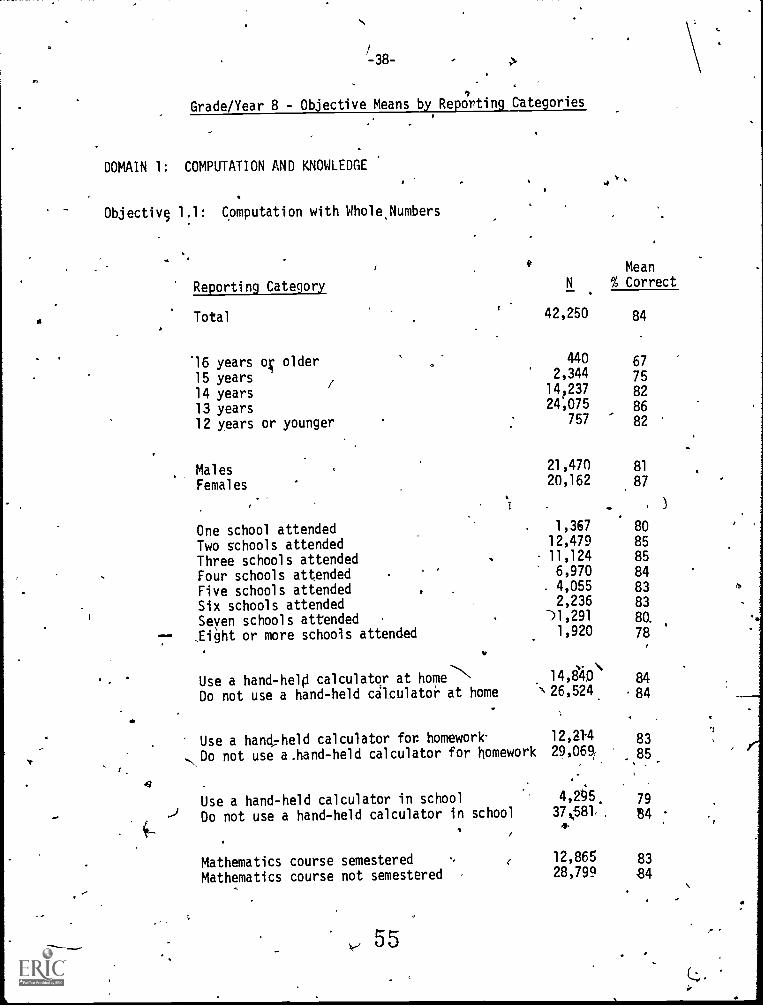
Grade /Year A - 0§jective.Means by Reporting Categories
DOMAIN I: COMPUTATION AND'-KNOWLEDGE
Objective 1.1: Mastery of Number Facts
,
A-Reporting Category N
Mean
ZCanula.,.611
Total 35,277 88
. 11 years or older 1,686 78
10 yens 10,987 88
9 years 20,768 90
8years or younger 1,480 8C
0
Born January-March irr'W7 7,104. 91-
Born'April-September in 1967 14,462 90
Born October-December in 1967 5,876 89
Males 1C,046 87
Females 17,053 89
One school attended / 15,694 '90
Two schools attended 10,021- 89
Three schools attended 4,944 87
Four or more schools attended 3;974 85
a
Born in Canada 26,215 89
Not born in Canada . 4,389 '89
years or less in Canada 1,012 96
'3 years in Canada 704 90 /
4ybars or more in_Canaap 2,466 90
inglish spoken befOre Grade 1 28,480 88
Other language spoken before Grade 1 5,977 88
English usually spokenin the home 29,596 89
,Other language usually spoken in the home 5,235- 87.
-2-
Grade/Year -Abjective Means by Reporting Categories
. , l
DOMAIN 1: COMPUTATION AND KNOWLEDGE
Objective 1.1: Mastery of Number Facts (coalnue-d) '.,
.,,.,
Reporting CategoryMeanCorrect
Non-Canadian, Non-English ,351 92
Canadian, Non-English 1,269 901st Generation Canadian 1,454 84
Non adian, English 1,878'N 88
Cana is English 20,823 90
,
Have used a hand:-held calculatornever used calculator
--)26,360Have nev ud a hand -held llt 8,239.
2 ,
\89'86'.
Use a hand-held calculator at home . 17,615 89
De not use a hand -held calculator at home 17,164 88
Use 'a hand held calculator for homework, 4,547 87Do not use a hand-held calculator for
homework 36,418 - 89
Use a hand -hell_ calculator in school 1,091 . 86
Do not use a hatl-Keld calculator in ,4
school 33,827 88
Do not usually watch T.V.Watch T.V. less1 than 1 hour/dayWatch T.V. about 1 .hour/dayWatch T.V. about 2 hours/dayWatch T.V. about 3 hours/dayWatch T.V. about 4 hours/dayWatch'T.V. about 5 hours or more/day
! ,
1
C)
1,396 87
1,383 85,
2,786 885,759 '89 ,
6,7'91 90
5,949' 90
10,902 88
4.
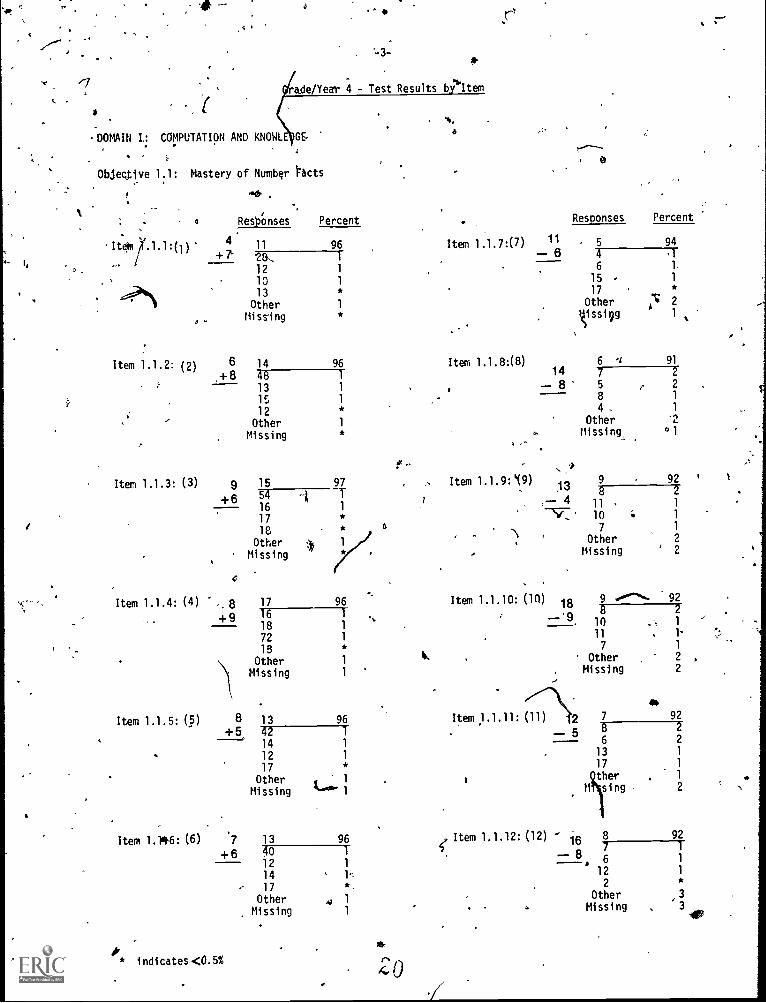
.7ade Year 4 - Test Results b Item
DOMAIN L: COMPUTATION AND KNOWL GE,a
a
Objective 1.1: Mastery of Number ;acts
otft .
4 Res 'ponses Percent Responses Percent
1
At041.1.1:(1) 96 Item 1.1.7:(7) 11 5 94
+7- 28. 1 6 4 .1...
,
12 1 6 1.
10 115 , 1
N 13 * 17*
Other 1 Other .V 2
.,Missing * Tssip
r1
Item 1.1.2: (2) 6 14 96 Item 1.1.8:(8) 6 -1 91
+8 48 114 7 2
13 1 -- 8 5 2
15 18 1
12 * 4 . 1
Other 1 Other 2Missing * ,.. Missing 01
,.,
Item 1.1.3: (3) 9 15 97 , Item 1.1.9:4(9) 9 92
+6 54 18 2
16 1
17 * 10 : 1
18a 7 1
Missing
;e/.- Missing ' 2
, 1Other 4 Other 2
Item 1.1.4: (4) 8 17 96
4-9 16 1
18 1
72 1
13Other 1
Missing 1
Item 1.1.10: (10) 18 9 *'"4*. 92
--.928
10 1
11 -: 1-
7 1
' Other 2 ,
Missing 2
ft
Item 1.1.5: (5) 8 13 96 Item 1.1.11: (11) 7 92
4-5 42 1 5 8 2
14 16 2
12 113 1
17 * 17 1
then 1
Missing k.o.Other
I M singthen
2 -,
Item 1.146: (6) '7 13 96
4-6 40 1
12 1
14 1-.
17 *,
Other 4 1
Missing 1
A* indicates <0.5%
Item 1.1.12: (12) - 16 8 92
4 7 1
-- 8 61
° 12 1
2
Other ,3
, Missing
-4-
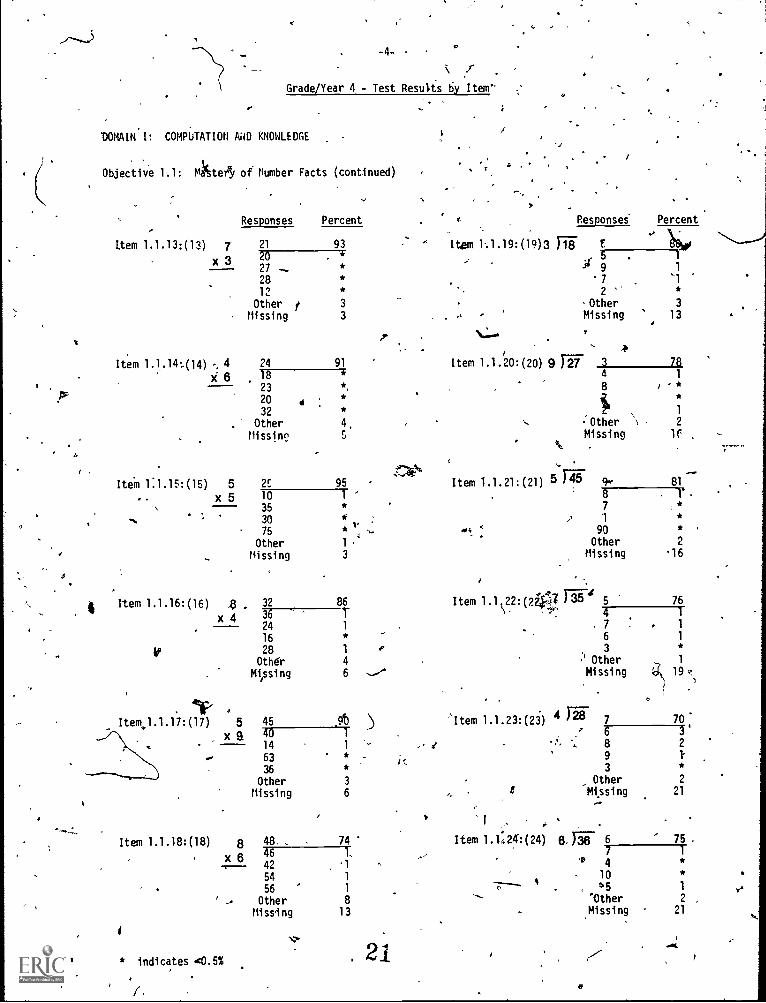
Grade/Year 4 - Test Results by Item'
DOMAIN I: COMPUTATION MD KNOWLEDGE
Objective 1.1: MXte6 of Number Facts (continued)
Ltem 1.1.13:(13) 7
x3
Responses Percent
p
-
*,..
e
'
)
$
_
f....*
,-. i
c.
t Res onses- Percent
21 93
'
1'
Item 11.19:(19)3 Fi f lEsier
20
27 -.28
12
Other f
Missing
24
- *
*
*
*
3
3
91
5 .
-."( 97
2
Other. - Missing
1
1
'1
*3
13
78Item 1.1.14:(14) -, 4
i 6
Item 1.1.20:(20) 9 T27 7 3
18
23
20 432
OtherMissine
25
*
*.
*
*
4,
5
95
4
8
OtherMissing
\..
Item 1.1.21:(21) 5 PT 4.,
1
*
1
2
1(
81IteM 1:1.15:(15) 5x 5 10
35
3075
OtherMissing
32
1
***
1
3
86
87
,, 1M4 4 90
OtherHissing
I .
,
** ,
2
16
76
. 1 .
-..
Item 1.1.16:(16)
x4
4t, 4Item 1.1 22:(2 of "U 5
36
24
16
28
OtherMissing
45
I1
*
1
4
6
.91)
\'1,. 4
. 76
3
.1 Other
Missing
''Item 1.1.23:(23) 4 MT 7
1
1
1
*
1
19
70
it
411P A
Item 1.1.17:(17) 5
x El 40
14
63
36
OtherMissing
48. .
1
1
*
*
3
6
74
..,.
6
, 89
3
, A, OtherMissing
' 1 , .
Item 1.1624:(24) 6, MT 6
3'2
1*
2
21
75 -
..
Item 1.1.18:(18) 8x6 46
42
54
56
OtherMissing
1,
, 11
1
813
7
* 4
i- 10
,,, 0.5
'OtherMissing
1
**
1
2
21
* indicates 40.5%
/.
, 21
m
ti
-5-
Jud
Grade /Yell 4 - pbjective Means by Reporting Categories0.
D MAIN I: COMPUTATION AND KNOWLEDGE
Objective. 1.2: Addition.of Whole Numbers
Reporting Cate0ory
Total
11 years or older10 years
9 yeaqs8 years or younger
C
MeanN .% Correct
.-35X7 89
'1,686
2°,7,460.
81,
87
88
87
Born-,January-March in 1967 . 7,104, 90Born April-September in 19 ,14,462 89Born October-December in 19670 6,876. 88
f18046 . 86
Females 17,063 89
One school attended v15;694 0 .
Two schools attended . 10,021 g8
Three.schoolsattended 4,944 .
Four or more schools..attended 3,974 86
,./.
Born in Canada 4. 26,215 813*A
Notiborn in Canada -.' 4,389 88
2 years or less in(Canada 1,012' 87
\, 3 years in Canada . 704 89
4 years or more in Can la 2,466 "88L.
English spoken before Grade 28,480 88
Other language spoken before Grade 1 51,977 87
English' usually spoken in the home 29,596 88,
Other language usually spoken in the home 5,235 86 ,
-6-
Grade/Year 4 - Objective i.eans IN Reporting Categories
DOMAINTI: COMPUTATION AND KNOWLEDGEj
Objective 1.2: ,Addition of Whole Numbers (continued)
URepottilig Categm.
Non-Canadialb Mon-English\4 Canadian, Mon-English'
1st Generation CanadianNon-Canadian, EnglishCanadian, English
a
MeaN 'X Correct
1,351 89,'
1,269 89
1,454f ,s 85
1,878 88
20,823 88
Have used a hand-held calculator 26,360 88
Have never used a hand-held calcOlator 81,239 86
Use 4-hand-Held calculator at home -17,615Da not use a hand-held calculatorat home 17,164
88
87'
a hand-held calculator for homework :44647 86.
o not use a hand-held calculator forhomework 30,t,18 88
Use a hand-Weld calculator in school013-Thot use a hand-held calculator in
. school
1:061
q 33,827
Do not usually watch T.V. -7 1,396Watch T.V. less than 1 hour/day 1,38aWatch T.V. about 1 hour /day
Watch T.V. about 2 hours/ day11,2
'
786
/5,759Watch T.V. aboUt3 hours/day 6,791
Watch T.V.,.about 4 hours/day 5,949 '
Watch T.V. ahoLgt 5 hours or more/day 10,902
2
23
85
88
86_
8588-88
888887
e,
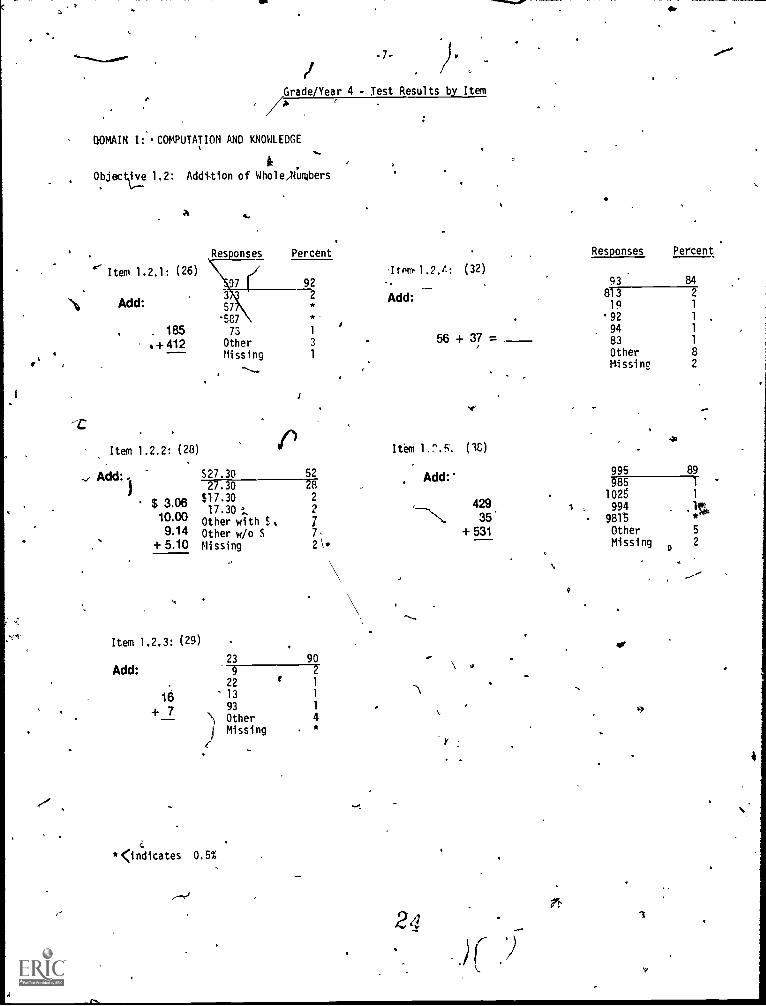
-7-/Grade/Year 4 - Test Results by ItemA.
r
DOMAIN I:, COMPUTATION AND KNOWLEDGE
kObjecti.1,2 1,2: Addition of Whole,NUmbers
a
4.- Item 1.2.1: (26)
4.
...
Responses Percent
Add:3
57587
. 185 73
* 4- 412 Othertti ss i ng
C
Item 1.2.2: (28)
-.., Add: i)
$ 3.0610.009.14
+ 5.10
92Item.1.2./1:
_Add:
. 56
(32)
+ 37 =
2
**
1
3
1
i
527.30 5227.30 28
$17.30 2
17.30 ;.. 2
Other with $, 7Other w/o S 7,Missing 21.
Item 1.2.3: (29)23
Add: 922
16 13
+ 7 93)OtherMissing
*<indicates 0.5%
e
902
1
1
1
4*
Item 1.:''.5-.
1
..
24
Add:
,e
,e,
O.
Responses Percent
93 84813 2
19 1
92 1
94 1
83 1
Other 8Mi ssi ng 2
(38)ea
995 89985 T
429 .1026
9941
!4r*35. 981t+ 531
\ 9
It'
P
Other 5
Missing 2D
ee
3
-
th.ti
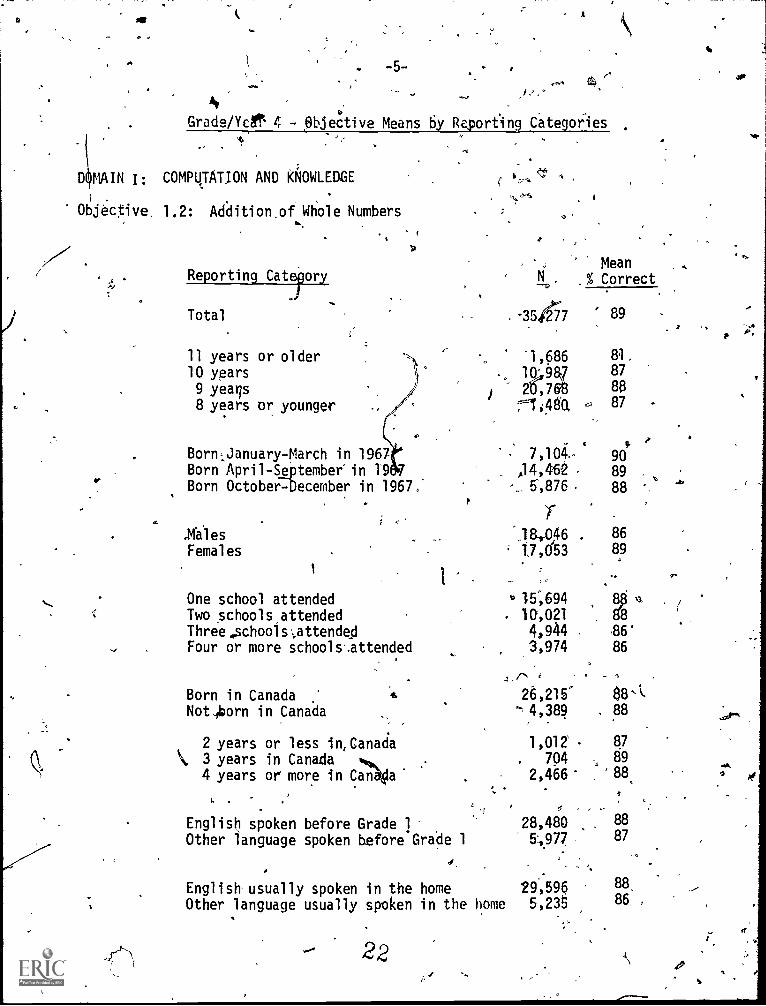
Year 4 - Objective Means.by.Reporting Categories
DOMAIN I: COMP TION AND KNOWLEDGE
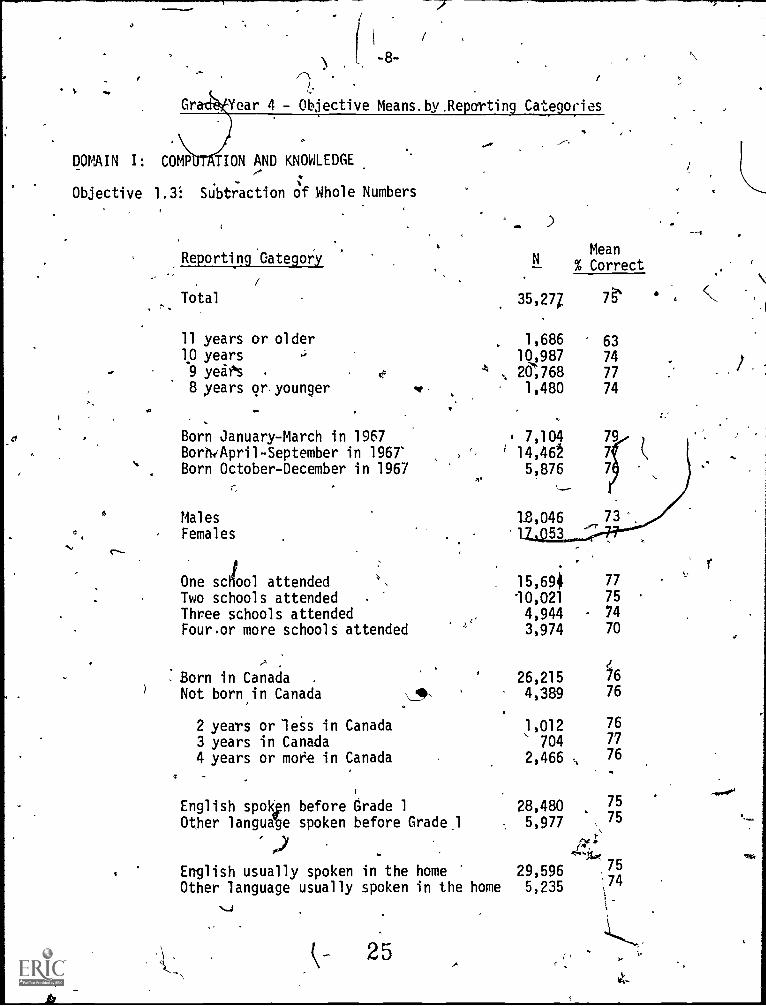
Objective 1.3: Subtraction of Whole Numbers
Reporting Category
Total
11 years or older10 years
9 year's .
8 years or. younger
Born January-March in 1967BorniApril-September in 1967'Born October-December in 1967
MalesFemales
One scIool attendedTwo schools attendedThree schools attendedFour.or more schools attended
Born in Canada .
Not born in Canada
2 years or less in Canada3 years in Canada4 years or more in Canada
English spokpn before Grade 1Other language spoken before Gradel
English usually spoken in the homeOther language usually spoken in the home
k_ 25
.
)
NMean
% Correct
35,277 7`
1,686 6310,987 74215;768 771,480 74
7,10414,462 7
5,876 7
15,69410,0214,9443,974
777574
70
26,215 6
4,389 76
1,012 76
704 77
2,466 76
28,480 75
5,977 , 75
29,5965,235 /4
1.
N
-9-
,)
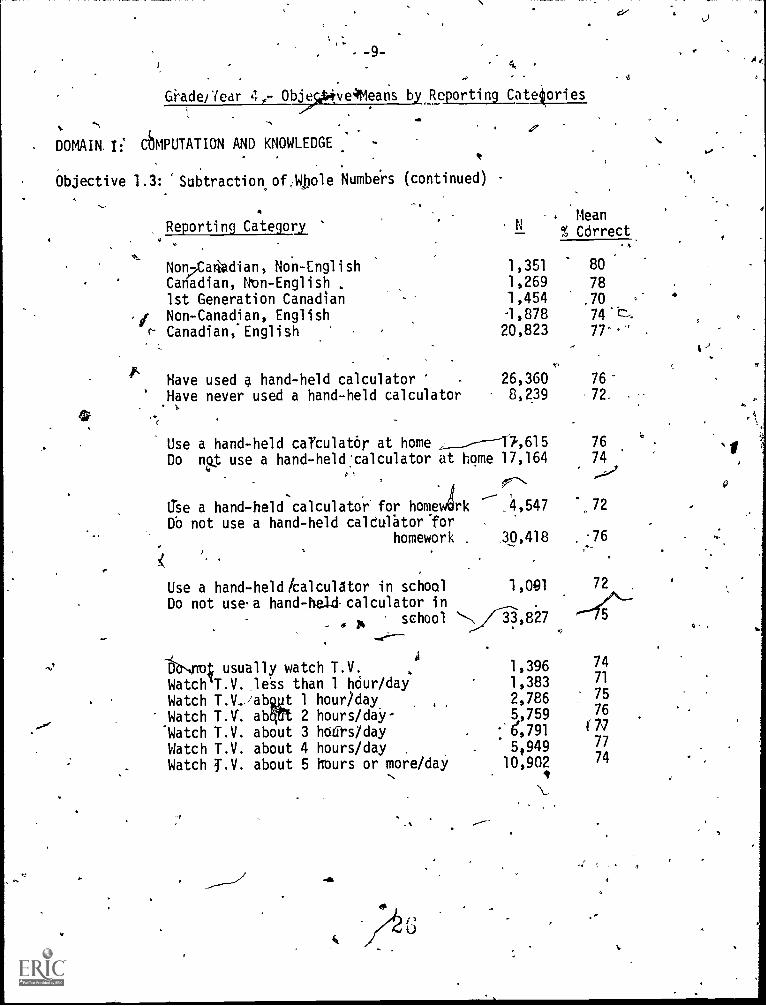
Grade/Year 4,- Obj v 41Means by Reporting Categories
DOMAIN, I: CbMPUTATION AND KNOWLEDGE
Objective 1.3: Subtraction ofiWbole Numbe'rs (continued)
Reporting Category.
No9.7Caliedi an , Non - English
Canadian, Non-English1st Generation Canadian
,1 Non-Canadian, EnglishCanadian, English
4
Mean
N % Cdrrect
1,351
1,2691,454-1,878
20,823
fikHave used a hand-held calculator . 26,360
Have never used a hand-held calculator 8,239
Use a hand-held caTculatOr at home .L___------14,615
Do nQt use a hand-held calculator at home 17,164,,
frv"
Erse a hand-held calculator' for homelk _4,547
DO not use a hand-held caldulator 'for -
80
78.70
7477-
t )
7672.
76
74
.-=--'
*. 72
homework
Use a hand-held /calculator in schoolDo not use.a hand-held calculator in
$ school
-
. .30,418
1,001
',N 33,827
-76
72
-15O-4-to: usually watch T.V. 1,396 74.
Watch T.V. less than 1 hOur/day 1,383 71
Watch T.V. abut 1 hour/day . ,
Watch T.V. ablt 2 hours/day-2,7865,759
75
76
Watch T.V. about 3 hafts/day : e, 791 f 77
Watch T.V. about 4 hours/day . 5,949 77,
Watch T.V. about 5 hours or more/day 10,902 74
N *
AIL
41
-10--
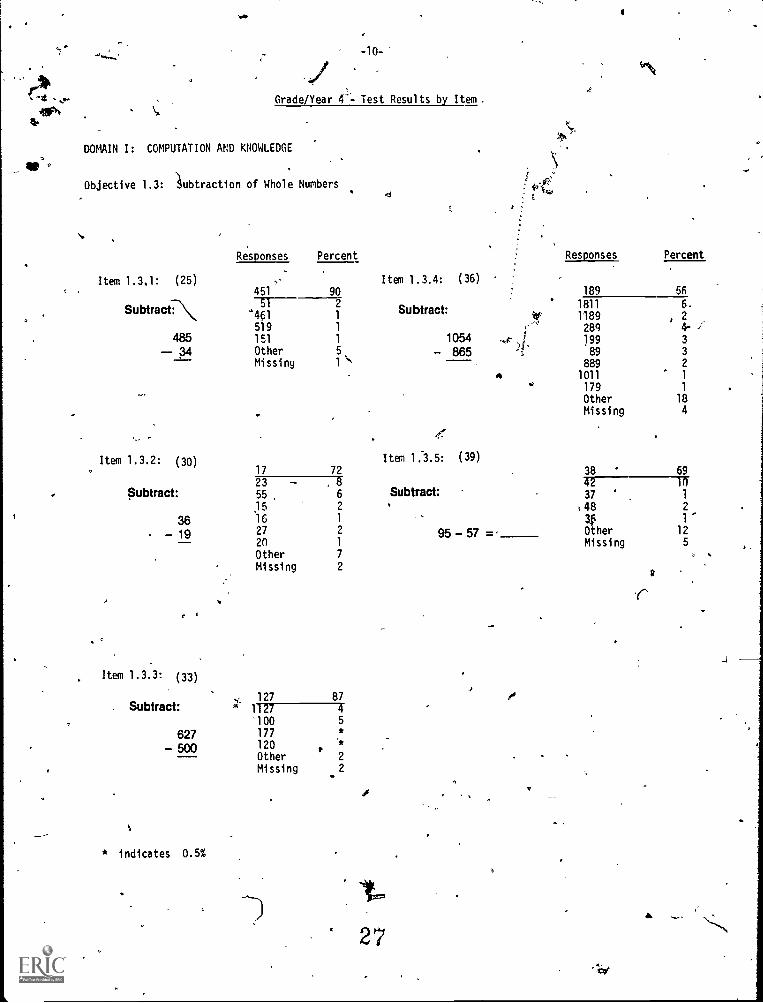
Grade/Year 4-- Test Results by Item .
DOMAIN I: COMPUTATION AND KNOWLEDGE
Objective 1.3: Subtraction of Whole Numbers
Item 1.3,1: (25)451 9057
Subtract:\'4-1 1
2 Subtract:519 1 ,-
485 151 1 1054 ,e 1
-- 34 Other 5 - 865 ,f
Missing 1 \...._
4
.
,-'
Item 1.3.2: (30) Item 1.'3.5: (39)
17 72
. Subtract: 55 , 6 Subtract:
15 2.
36 16 1
19 27 2 95 -, 57 -='20 1
Other 7
Missing 2
Responses Percent
Item 1.3.4: (36)
Item 1.3.3: (33)
Subtract127 87
1127 4
'100 5
627 177 *
- 500 120 t4,
Other 2
Missing 2
* indicates 0.5%
Responses Percent
189 56
' 11181189
289
19989
889
6.
2
4- i3
3
2
1011 1
179 1
Other 18
Missing 4
38 69
37
10
1
:48 2
af I
Other 12
Missing 5
Sr
27
-4
,
Grade/Year 4 - Objective Means by Reporting Categories
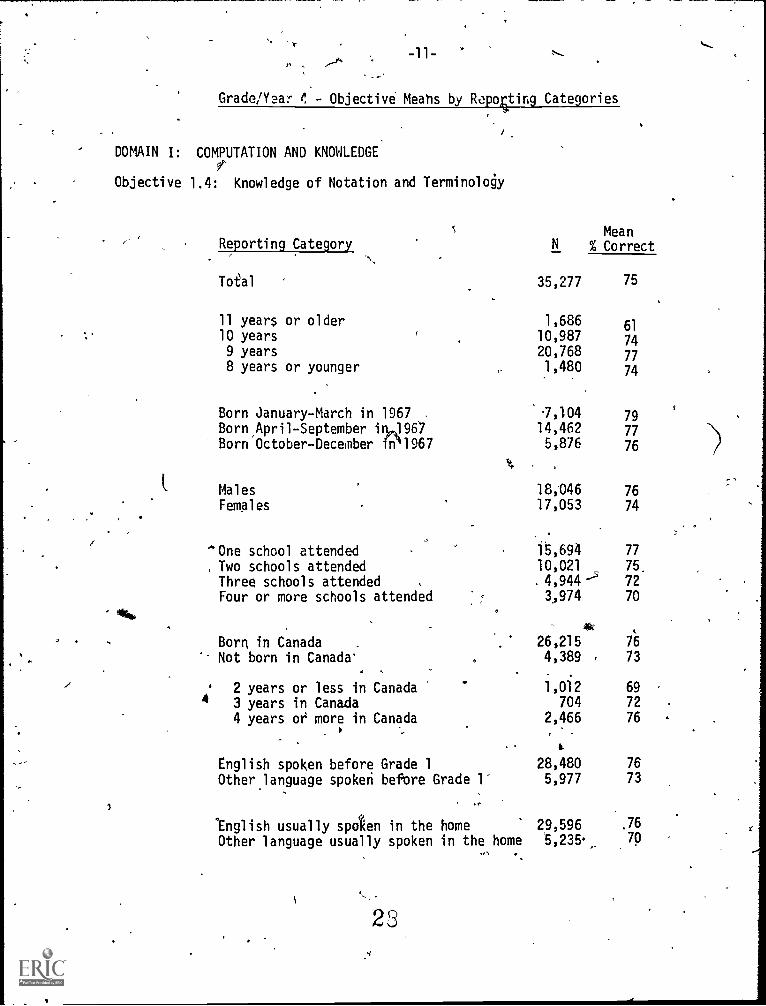
DOMAIN I: COMPUTATION AND KNOWLEDGE
Objective 1.4: Knowledge of Notation and Terminology
Reporting Category
Total
11 years or older10 years
9 years8 years or younger
Born January-March in 1967Born April- September in,4967Born October-December fn31967
MeanN % Correct
35,277 75
1,686
10,98720,7681,480
61
74
77
74
,104 79
14,462 77
5,876 76
Males 18;046 76
Females 17,053 74
One school attended 15,694 77
Two schools attended 10,021 75.
Three schools attended , . 4,944-5 72
Four or more schools attended 3,974 70
Born in Canada 26,215 76
Not born in Canada' a 4,389 73
2 years or less in Canada 1,012 694 3 years in Canada 704 72
4 years or more in Canada 2,466 76
'
English spoken before Grade 1 28,480
Other language spoken before Grade 1' 5,977
English usually spoken in the home 29,596Other language usually spoken in the home t,235,
23
76
73
.76
70
-12-
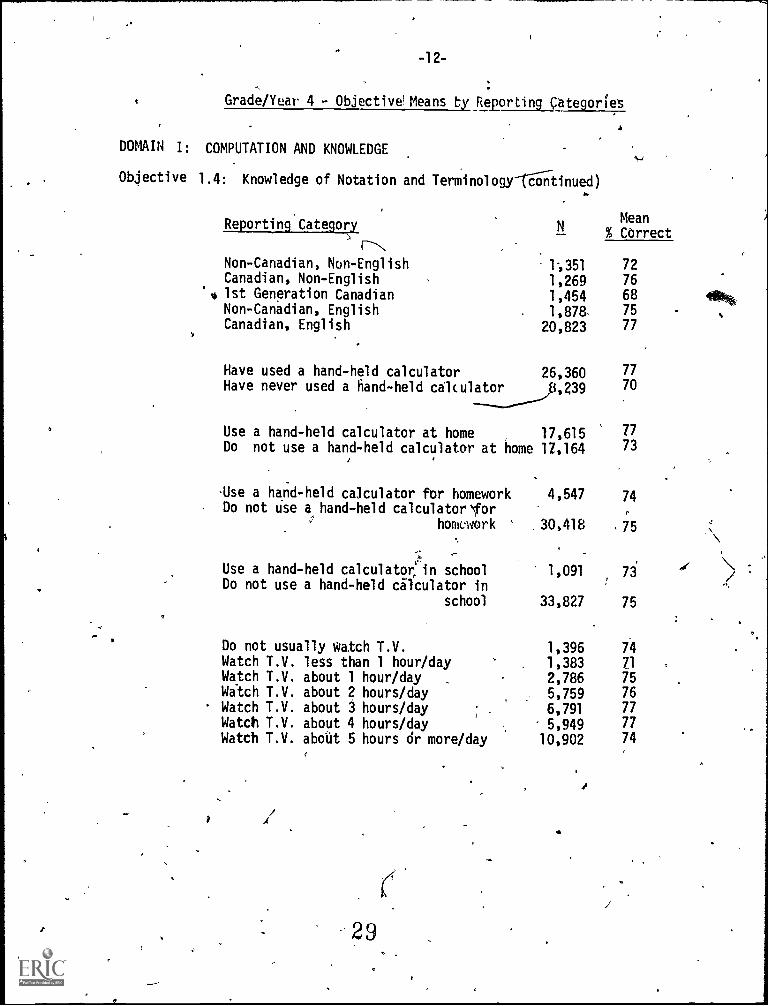
Grade/Year 4 - Objectivel, Means by Reporting categories
DOMAIN I: COMPUTATION AND KNOWLEDGE
Objective 1.4: Knowledge of Notation and Terminology continued)
S1
Mean
11"22---...tingaICalc-N
Correctr----N
Non-Canadian, Non-English 1051 72Canadian, Non-English , 1,269 76
',4 1st Generation Canadian 1,454 68Non-Canadian, English 1,878, 75Canadian, English 20,823 77
Have used a hand-held calculator 26,360Have never used a hand-held alculator____},239
Use a hand-held calculator at home 17,615 7773
77
70
Do not use a hand-held calculator at home 17,164
Use a hand-held calculator for homeworkDo not use a hand-held calculator for
homework
4,547
' .30,418
74
,75
Use a hand-held calculator n school 1,091 73Do not use a hand-held calculator in
school 33,827 75
Do not usually watch T.V. 1,396 74Watch T.V. less than 1 hour/day 1,383 71
Watch T.V. about 1 hour/day 2,786 75Watch T.V. about 2 hours/day 5,759 76Watch T.V. about 3 hours/day 6,791 77Watch T.V. about 4 hours/day 5,949 77Watch T.V. about 5 hours dr more/day 10,902 74
29
r-
-13-
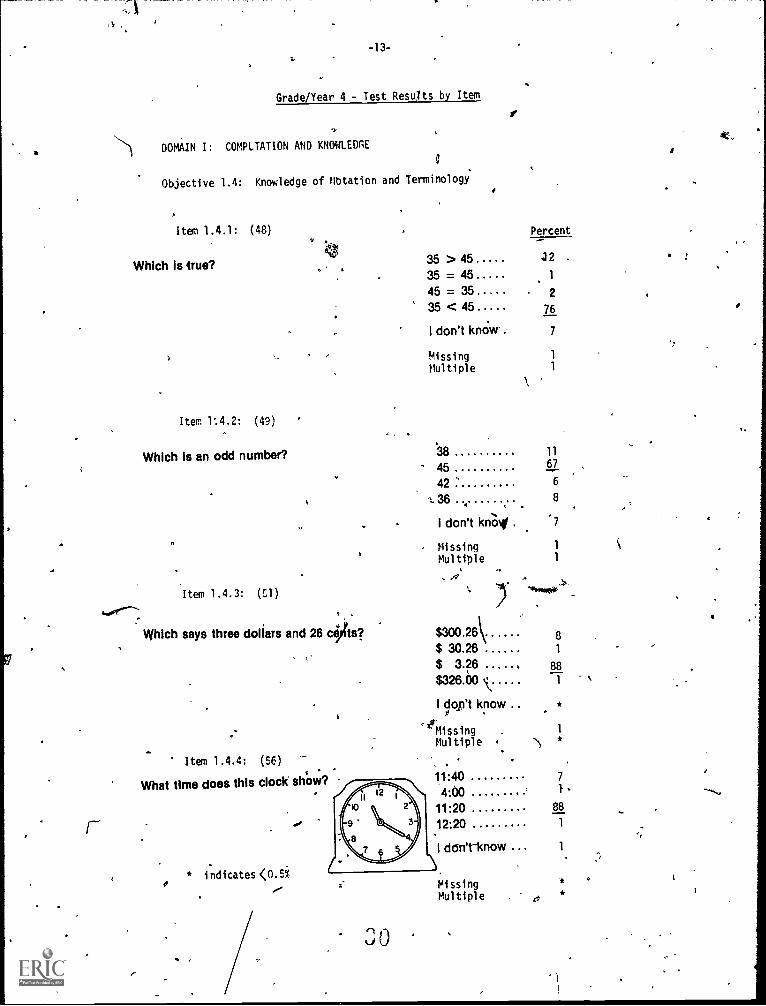
Grade/Yea 4 - Test Results by Item
DOMAIN I: COMPLTATION AND KNOWLEDGE
4
Objective 1.4: Knowledge of flotation and Terminology
Item 1.4.1: (48)V
Which is true?
Percent
35 > 4535 45 1
45 35 235 < 45 76
I don't km:ivy' 7
Kissing 1
Multiple 1
Item 1:4.2: (49) °
Which is an odd number? 38 11
45 67
42 6
36 8
I don't knint 7
MissingMultiple
Item 1.4.3: (Cl)
Which says three dollars and 26 cilts? $300.26$ 30.26$ 3.26 88
$326.00 1
1
81
I dop't know .. *
.,erMissing . 1
Multiple ' -. *
' Item 1.4.4: (56) ., .
.What time does this clock show? 11:40 7
4:00 I.
11:20 88
* indicates <0.5i
12:20 1
I don't-know ... 1
.30
MissingMultiple
**
a
----
t:141.
Grade/Year 4 - Test Results by Item
DOMAIN I: COMPUTATION AND KNOWLEDGE
Objective 1.4: Knowledge of Notation and Tei-minology
Item 1.4.5: (57). Perdent
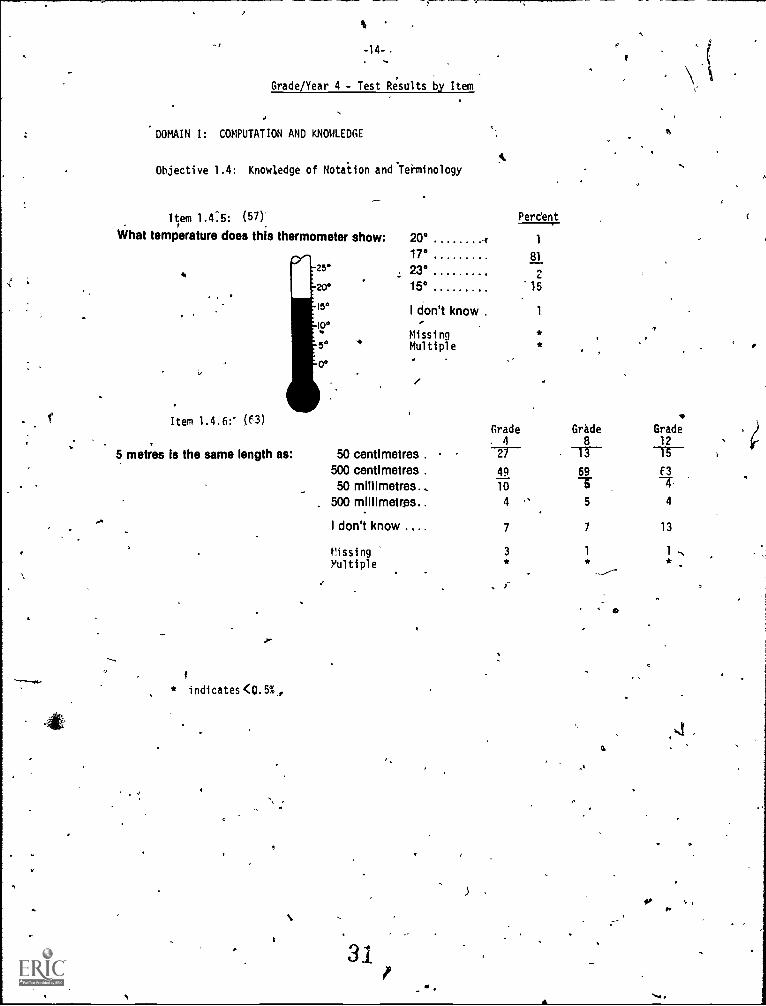
What temperature does this thermometer show: 20° -r 1
17° 8125° 23° 220° 15° 15
IMF15° I don't know . 1
10°Missing
5° Multiple
0°
Item 1.4.6:- (63)
5 metres is the same length as:
* indicates <O. 5%.,
50 centimetres .500 centimetres .
50 millimetres... 500 millimetres..
I don't know
Missing
Multiple
31
Grade Grade Grade4 8
-TY--12
-Tr-TT49 69 E3
10 5 74 - 5 4
7 7 13
3 1 1.* *
r
a
,
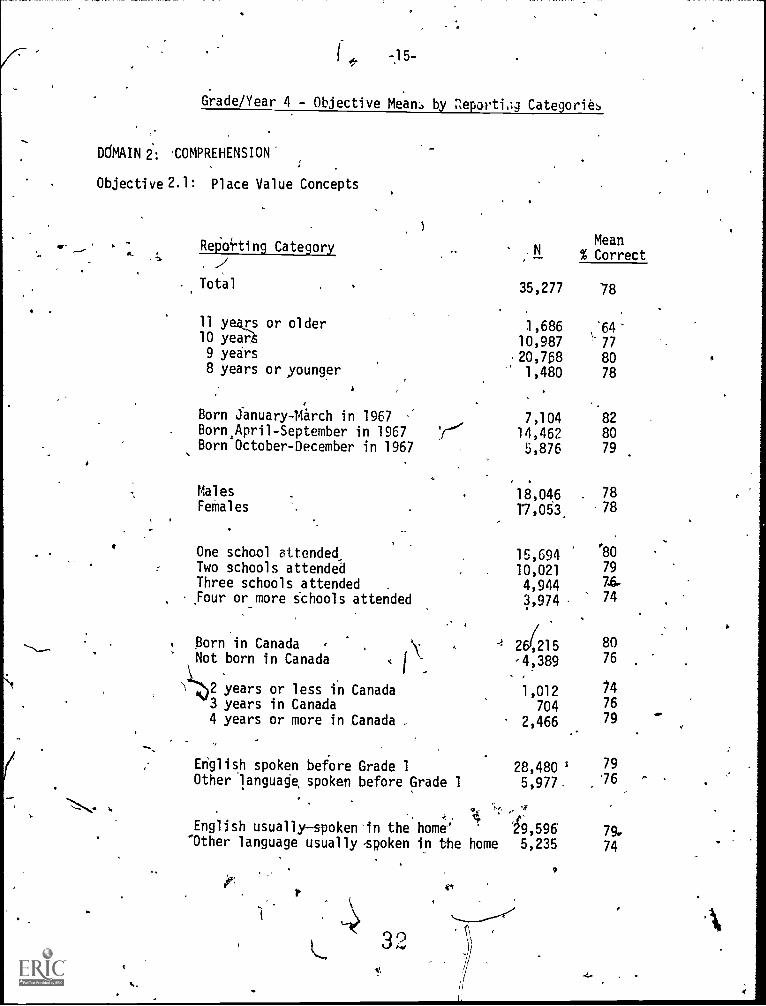
Grade/Year 4 - Objective Mean., by aeportUg Categories
DOMAIN 2: .COMPREHENSION'
Objective 2.1: Place Value Concepts
Reporting Category
Total
11 years or older10 year9 years8 years or younger
Born January -March in 1967
Born.April-September in 1967Born October-December in 1967
MalesFeMales
One school attendedTwo schools attendedThree schools attended .
Your or more schools attended
Born in CanadaNot born in Canada
2 years or less in Canada3 years in Canada4 years or more in Canada ,
English spoken before Grade 1Other language spoken before Grade 1
-1
0.
English usuallyspoken in the home''Other language usually - spoken in the home
35,277
1,68610,987
Mean% Correct
78
:64''77
.20,758 801,480 78
7,104 82
14,462 805,876 79
18,046 . 7817,053 78
15,694 '80
10,021 79
4,9444,974 74
26615 80
-4,389 76
1,012 74
704 76
2,466 79
28,480 ' 79
5,977. '76
-
"28,588 79.5,235 74
-4-
-16-\r,
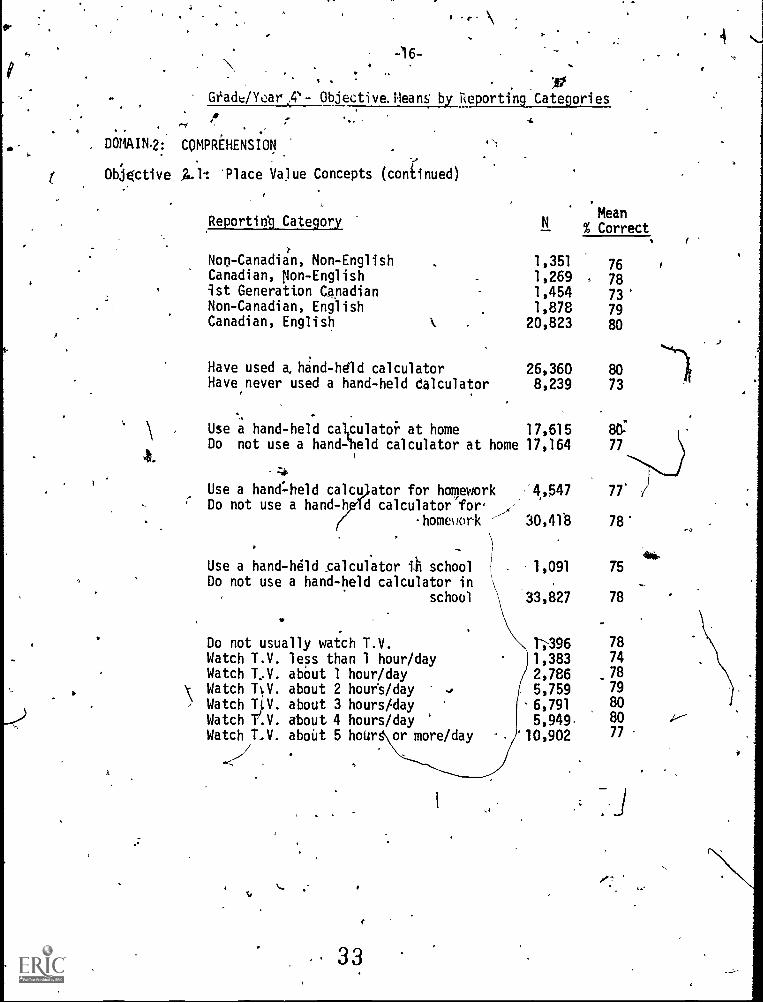
DOIIAIN.2: COMPREHENSION
Objective 2,.11
Geadegcar - Objective. Means by Reporting_ Categories
.
Mean% Correct
. .
'Place Value Concepts (continued)
Reporting Category
Non - Canadian, Non-English 1,351 76Canadian, Non-English 1,269
, 781st Generation Canadian 1,454 73'Non-Canadian, English 1,878 79Canadian, English 20,823 80
Have used a, hand-held calculator 26,360 80Have never used a hand-held dalculator 8,239 73
Use a hand-held cal,culatoi. at home 17,615Do not use a hand-held calculator at home 17,164 77
Use a handlheld calcu ator for homework ,A,647 77'
Do not use a hand -hgTd d calculator for'
homey 3u 30,418 78'
Use a hand-hdld calculator 4 school I 1,091Do not use a hand-held calculator in '
school 33,827
75
78
Do not usually watch T.V. TO96 78
Watch T.V. less than 1 hour/day 1,383 74Watch T.V. abOut 1 hour/day 2,786 78Watch about 2 hours /day 5,759 79
)
,
6,791 80Watch T V. about 3 hours/dayWatch .V. about 4 hours/day 6,949. 80
Watch T.V. about 5 hoUr or more/day '10,902 77/
--,
33
J
r
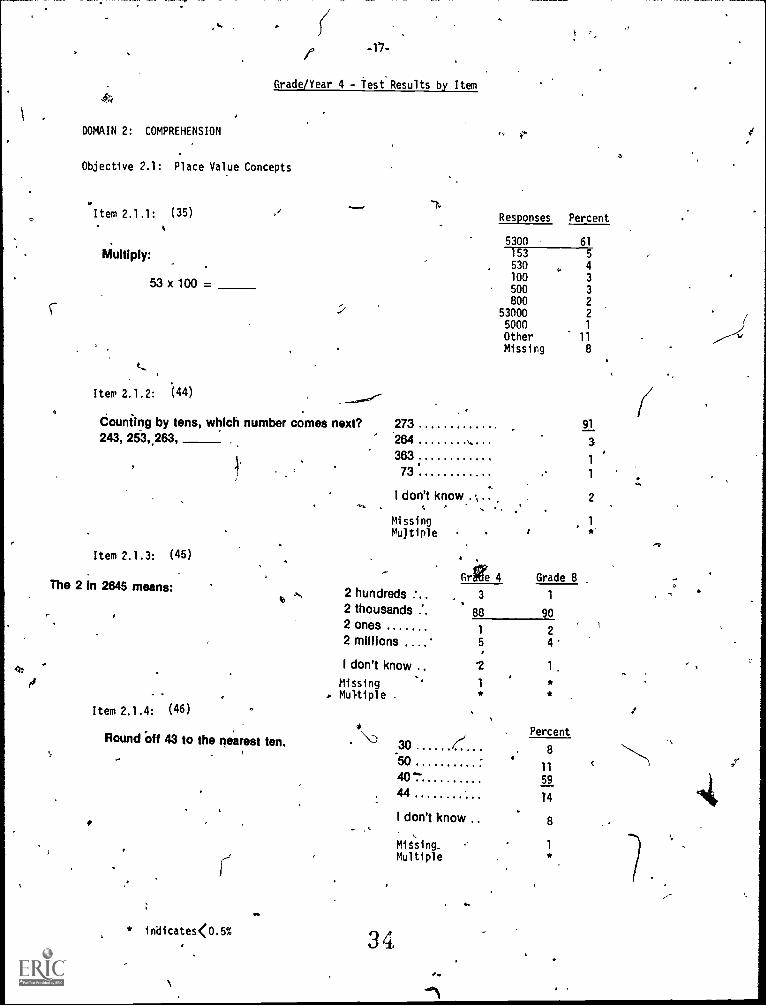
Item 2.1.1: (35)
DOMAIN 2: COMPREHENSION
Objective 2.1: Place Value Concepts
Multiply:
53 x 100 =
Grade/Year 4 - Test Results by Item
Responses Percent
5300 61153 5530 4100 3500 3800 2
53000 25000 1
Other 11Missing 8
L
Item 2.1.2: (44)
Counting by tens, which number comes next? 273 91
243, 263,,263, ____ 264 k.. . 3363
1
73 1
.I don't know .,,.. 2
-. - ... .
MissingMultiple
Item 2.1.3: (45)
The 2 in 2645 means: . 2 hundreds :..
.
4
Grge 4
1' or
Grade 8
, 3. 1
2 thousands :. 88 90,--
2 ones1 2
2 millions 5 4
I don't know '2 1
Missing. . * Multiple .
1
***
Item 2.1.4: (46)
Round Off 43 to the nearest ten.
9
* 1 cates< 0.5%
\30.504044
I don't know 8
Missing_Multiple
Percent
8
11
59
14
1
*
34
-18-
Grade/Year 4 - Results by Ieem
DOMAIN 2: COMPREHENSION
Objective 2.1: Place Value ConCepts (continued)
%A.
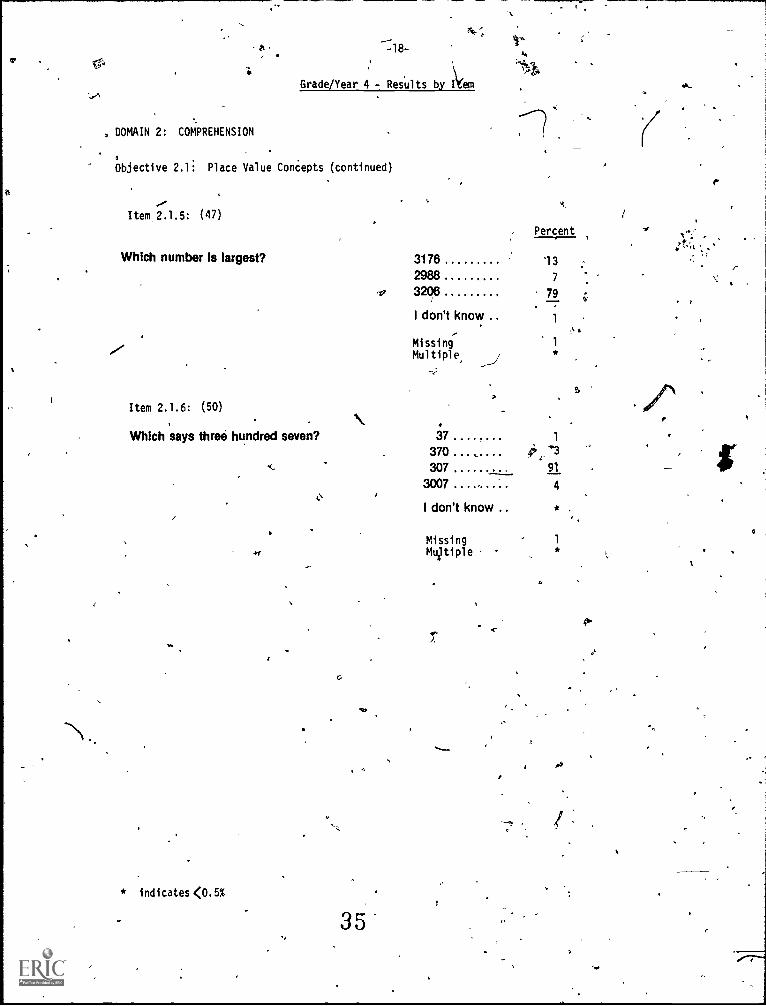
Item 2.1.5: (47)
Which number is largest? 31762988
17 3206
I don't know
Percent
I
.es:,
'13
7
79
1
MissingMultiple, ,/
Item 2.1.6: (50)
Which says three hundred seven? 37 1
ti
370 ...307
4;,91
3007 44.
I don't know *
4MissingMultiple
1
*
r.
* indicates 4(0.5%
35
-19- f
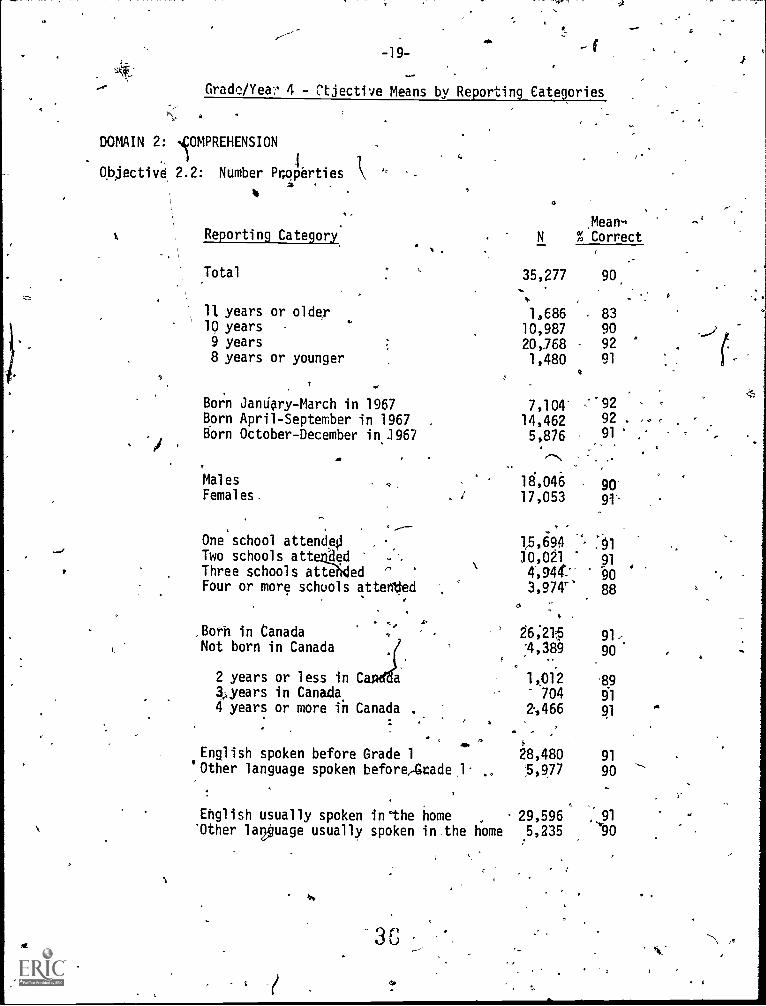
Grads /Yea 4 - Ctjective Means by Reporting Categories
DOMAIN 2: IOMPREHENSION
Objective, 2.2: Number Properties
Reporting Cate9ory
Total
11 years or older10 years
9 years8 years or younger
Born JanUary-March in 1967Born April-September in 1967 .
Born October-December in 1967
MalesFemales.
One school attende0Two schools atteadedThree schools attehdedFour or more schools atteated
Borh in CanadaNot born in Canada
2 years or less in CamtBaaeyears in Canada4 years or more in Canada
English spoken before Grade 1'Other language spoken before,Grade l
Ehglish usually spoken in'the home'Other la9uage usually spoken in the home
- t
3 fu
MeanmN % Correct
35,277 90
13686 8310,987 90
20,768 92
1,480 91
7,104 92
14,462 92 .
5,876 91 '
18,046 90'17,053 91--
15,6410,021 91
903,974' 88
26;215 91,'4,389 90
o ,
1,012 89704 91
2,466 91
28,480 91
5,977 90
29,596 91
5,235 90
k'
720-
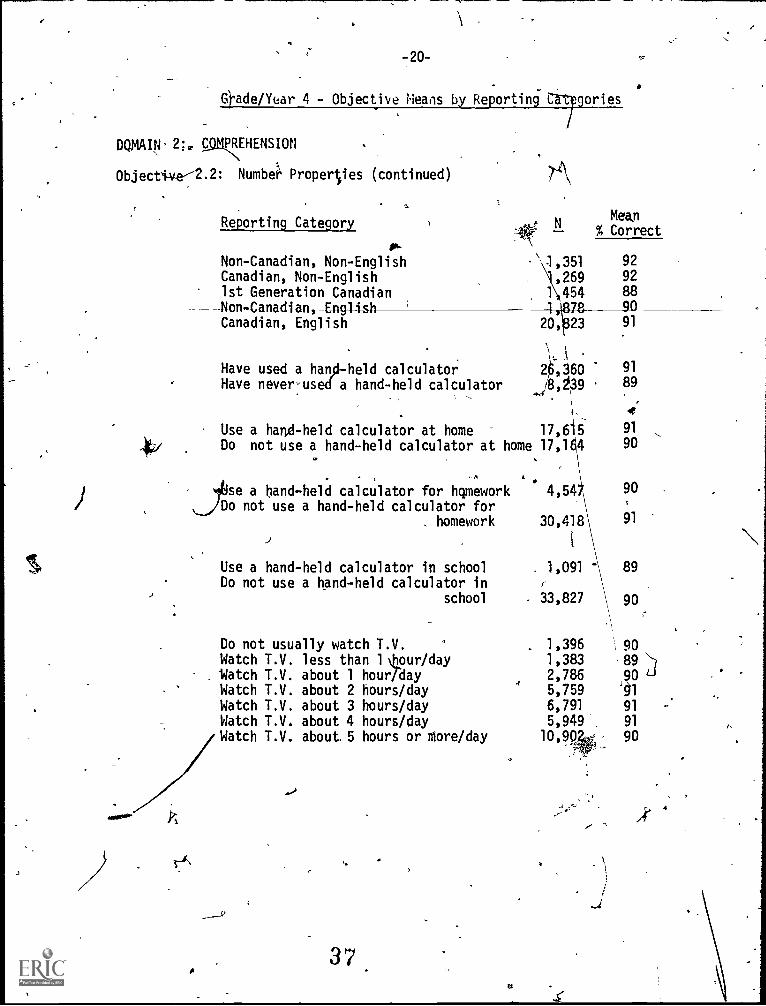
qade/Year 4 - Objective Means by Reporting Las. ories
COTHENSION
ObjectiAw2.2: Numbe' Properties (continued)
Reporting Category
Non-Canadian, Non-EnglishCanadian, Non-English1st Generation Canadian
mean
% Correct
.\1,351 92
,269 92
1 454 88
Non -Canadian,-Engli-sh 1-,
Canadian, English 20,:23 91
Have used a hanp-held calculator 2,160 91
Have never-used a hand-held calculator J8,239 89
Use a hand-held calculator at home 17,65 91
Do not use a hand-held calculator at home 17,1 4 90
se a hand -held calculator for hqmework 4,54Do not use a hand-held calculator for
homework 30,418
I
Use a hand-held calculator in school . 1,091
Do not use a hand-held calculator inschool - 33,827
Do not usually watch T.V. . 1,396 \
Watch T.V. less than 1 tour/day 1,383Match T.V. about 1 hour/dayWatch T.V. about 2 hours/day 5,759Watch T.V. about 3 hours/day 6,791
Watch T.V. about 4 hours/day 5,949Watch T.V. about. 5 hours or more /day 10,90
37.
90 .
91
89
90
90,89
0
91
91
90
4
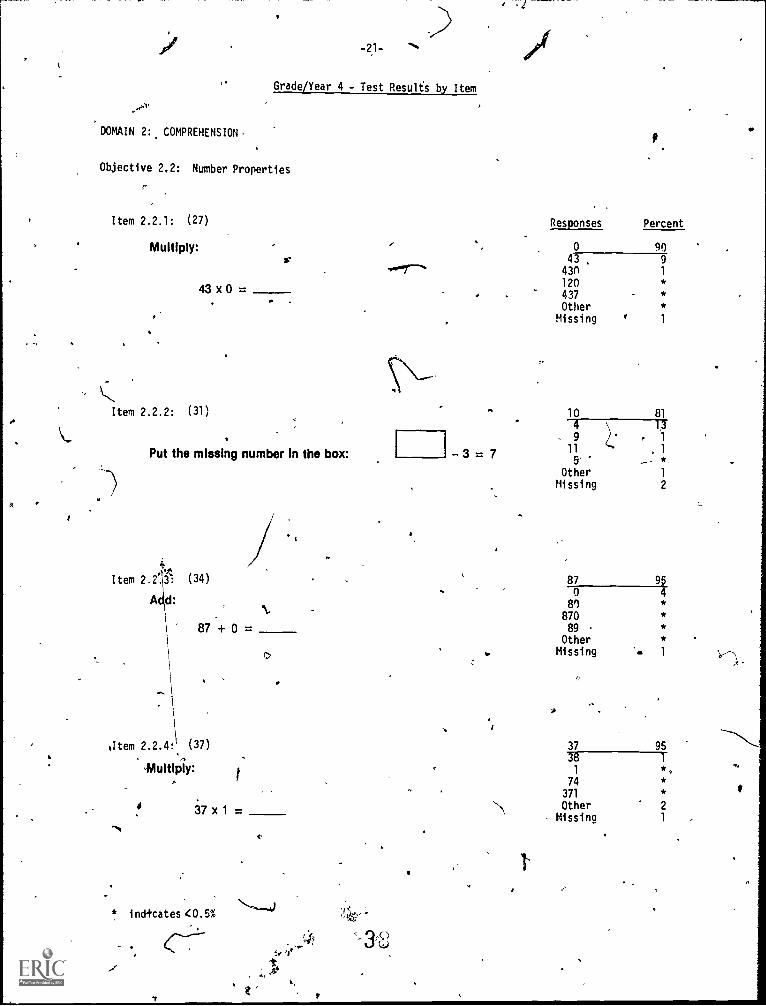
Grade/Year 4 - Test Results by Item
DOMAIN 2: COMPREHENSION
Objective 2.2: Number Properties
Item 2.2.1: (27)
Multiply:
43 x 0 =
cItem 2.2.2: (31)
Put the missing number in the box:
P.4
Item 2.2:3: (34)
A d: ti87 + 0 =
hItem 2.2.4: (37)
Multiply:
37 x 1 =
* indicates <0.5%
44-
, -1
f
Responses Percent
0 9043 9
430 1
120437
OtherMissing 1
10 81
4 -r3
9 - 1
3 = 7 11
5
. 1
*
Other 1
Missing 2
87 9
0
89870
89
1-
OtherMissing 1
37 95
3er 1
1 *,
74371
Other 2
Missing 1
.O
Grade/Year 4 - Objective Mans by Reporting Categories
DOMAIN 2: COMPRVENSION
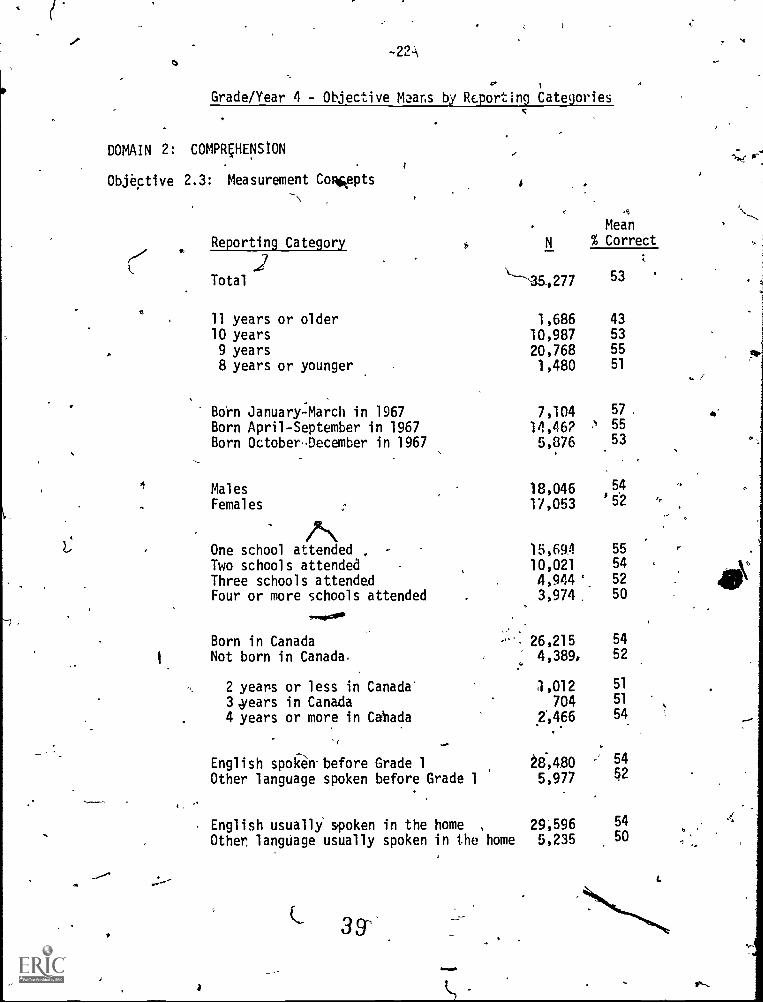
Objective 2.3: Measurement Cowepts
(''Total
Reporting Category
11 years or older10 years9 years8 years or younger
Born January-March in 1967Born April-September in 1967Born October-December in 1967
MalesFemales
.7\
a
One school attended ,
Two schools attendedThree schools attendedFour or more schools attended
Born in CanadaNot born in Canada,
2 years or less in Canada3,years in Canada4 years or more in Cabada
English spoken before Grade 1Other language spoken before Grade 1
--,
English usually spoken in the home ,
Other, language usually spoken in the home
39-
Mean% Correct
53
1,686 43
10,987 53
20,768 55
1,480 51
7,104 57 ,
14,462 55
5,876 53I
18,046 54
17,053 '52
15,694 55
10,021 54
4,944 52
3,974. 50
26,215 54
4,389, 52
1,012 51
704 51
g,466 54
28,480 54
5,977 52
29,596 54 ,.5,235 50
-6-
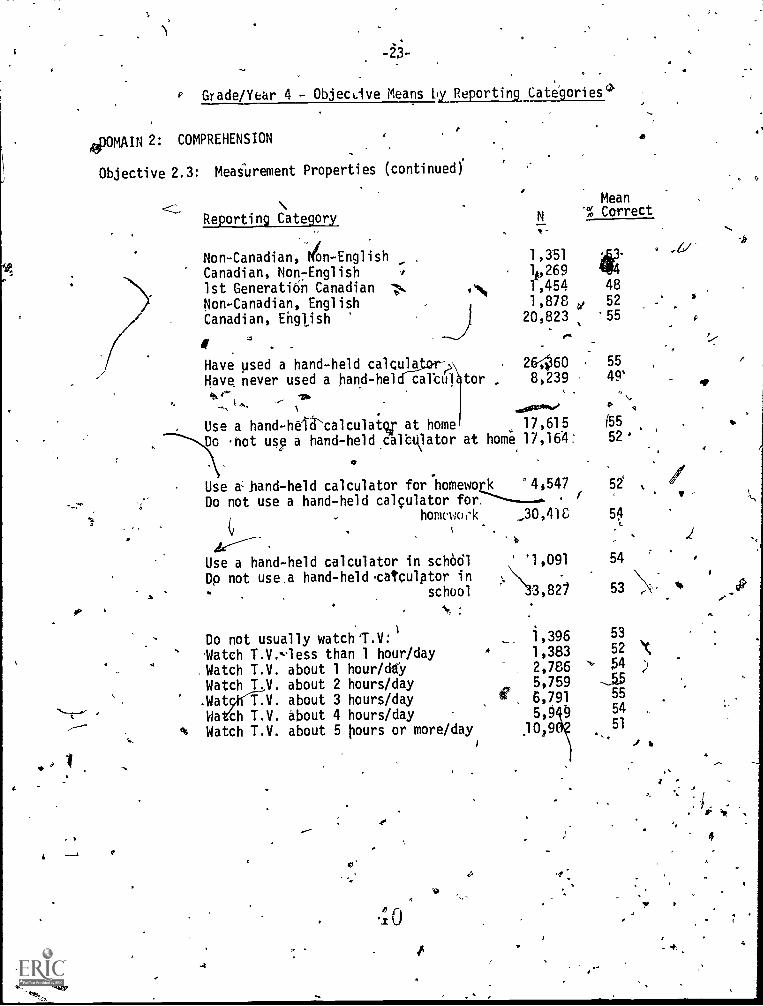
P Grade/Year 4 - Objective Means byReporting Categories`
4omAIN 2: COMPREHENSION
Objective 2.3: Measurement Properties (continued)
I
Reporting Category
Non-Canadian, /on-EnglishCanadian, Non - English
1st Generati6n CanadianNon-Canadian, EnglishCanadian, English
N-
MeanI Correct
1,351 4-1t, 269
1,454 48
1,878 4, 52
20,823 .55
Have ised a hand-held calculatarrA 2 60
Have never used a hand-held-carculktor , 8,239
.00201%04
Use a hand-he' itcalculatv at home 17,615
Do not use a hand-helcLcaltglator at home 17,164:
Use a: }land -held calculator for .homework °4i547
Do not use a hand-held calculator forte /
homcwook _30,41C
Use a hand-held calculator in sch661Dp not use .a hand-held .catculptor in
school
Do not usually watch'T.V:Match T.V.--ess than 1 hour/day.Watch T.V. about 1 hour/d0Watch T V. about 2 hours/day-1.11,0.V. about 3 hours/dayWa ch T.V. about 4 hours/dayWatch T.V. about 5 pours or more/day
.A
;0
1,3961,3832,7865,759
ir 6,7915,0
.1019
55
49'
,
(55
52
52
54
-6/
54
53 \N:
53
52 Xro 54 )
SS55
54
51,,
1
7
0
-24- ,
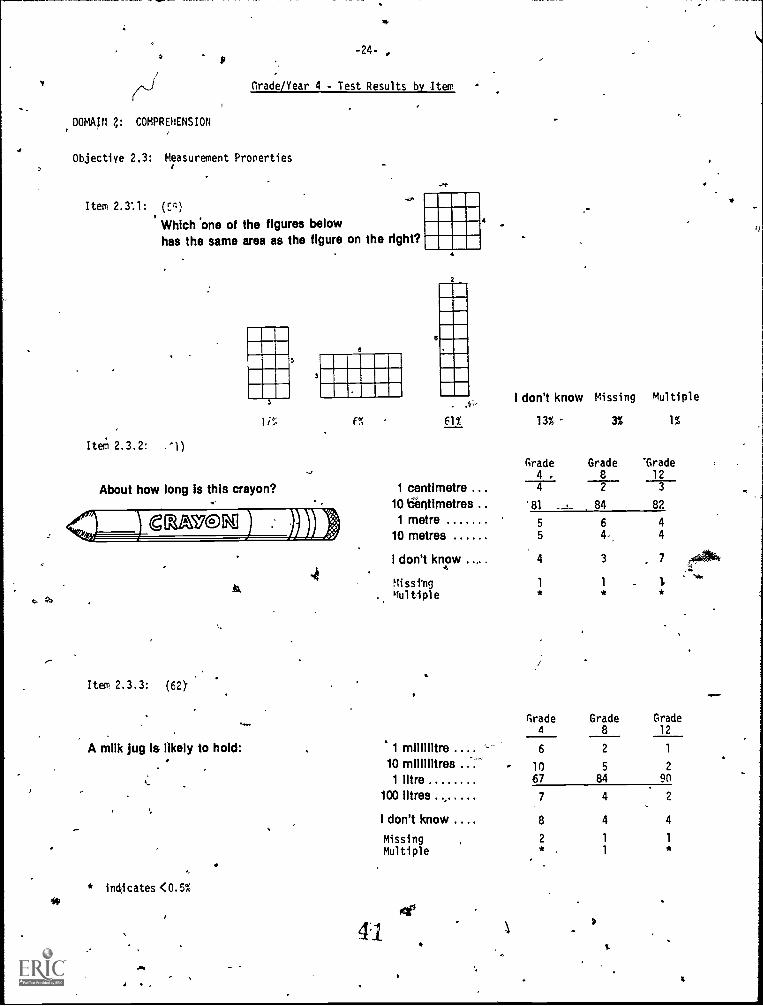
Grade/Year 4 - Test Results by Item
DOMApt 2: COMPREHENSION
Objective 2,3: Measurement Properties
Item 2.3:1: (En)
Which one of the figures belowhas the same area as the figure on the right?
5
3
Ii;
Item 2.3.2: '1)
About how long is this crayon?
3
6
4'1,:catavem
f%
Item 2.3.3: (60'
A milk jug Is likely to hold:
* indicates <0.5%
1 ,
6
2
61%
4 3
I don't know Missing Multiple
13% 3% 1%
Grade Grade "Grade
4 . 8 12
4 2 3
.. 81 ....t... 84 82
5 6 4
5 4 4
1 1
1 centimetre ...10 Centimetres1 metre
10 metres
I don't know .....
Nisstngmultiple
1 millilitre ....10 millilitres ... .1 litre
100 litres
I don't know ....MissingMultiple
40
4:1
Grade Grade
.1111.
Grade4 8 12
6 2 1
10 5 2
67 84 90
7 4 2
8 4 4
2 1 1
1
-25-
Grade/Year 4 - Test Results by Item
DOMAIN 2: COMPREHENSION-
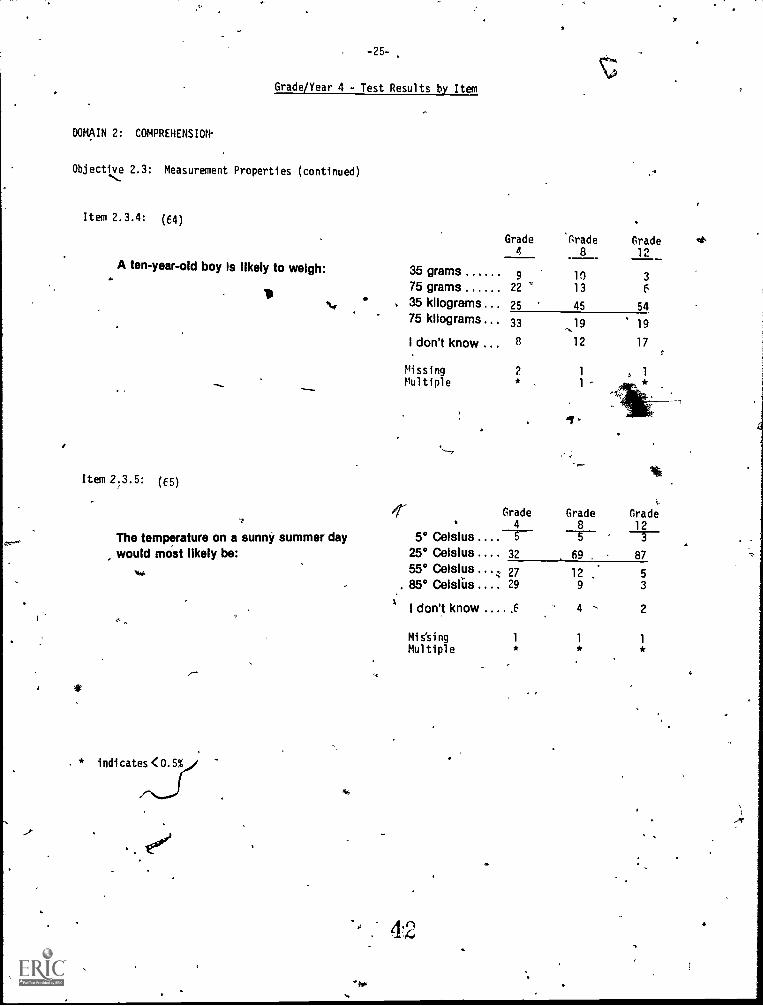
Objective 2.3: Measurement Properties (continued)
Item 2.3.4: (64)
A ten-year-old boy is likely to weigh:
1 ti
35 grams75 grams35 kilograms75 kilograms
Grade Grade Grade 44
8 12
9 10 322 13 6
25 45 54
33 N 19 19
8 12 17I don't know ...
Missing 2 1
Multiple 1
Item 2.3.5: (65)
-c
The temperature on a sunny summer day.
5° Celsius ....rGrade
4
Grade
8
t.
Grade12-75
would most likely be: 25° Celsius .... 32 69 . 87
,.... 55° Celsius 27 12 : 5. 85° Ceisiiis .... 29 9 3
I don't know .... .6 4 - 2
Miesing 1 1 1
Multiple * * *
. * indicates <0.5%
4'2a
-26-
N4
Grade/Year 4 - Objective Means by Reporting Categories
DOMAIN 2: COMPREHENSION
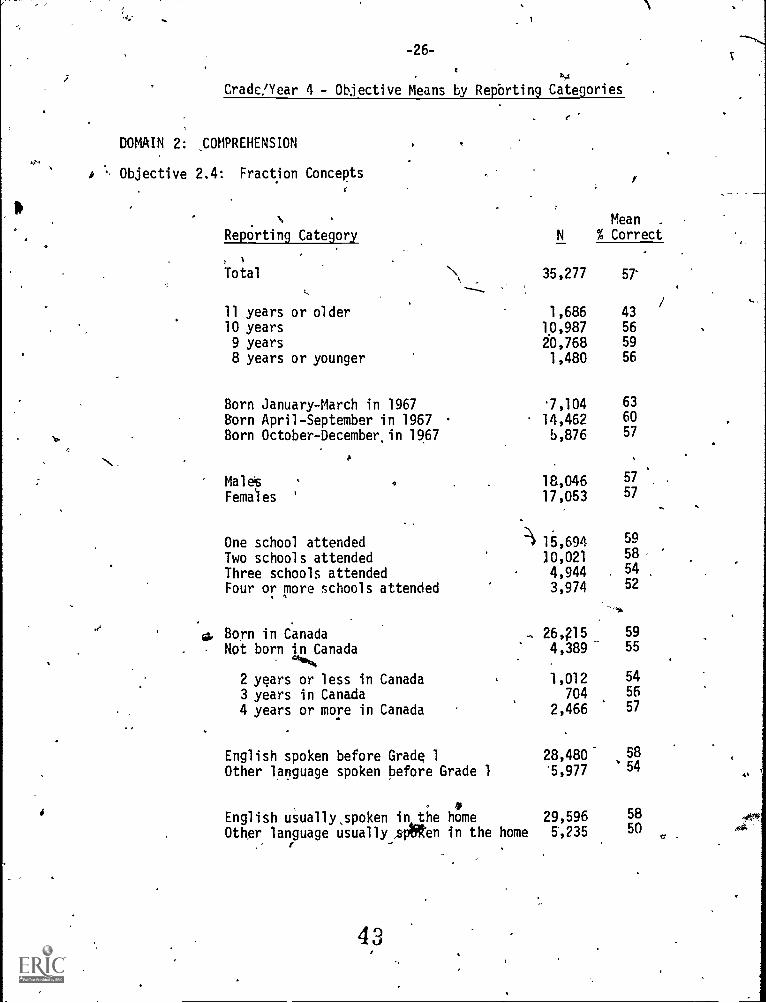
a Objective 2.4: Fraction Concepts
Reporting Category N
Mean .
% Correct
Total 35,277 57'
11 years or older 1,686 4310 years 10,987 56
9 years 20,768 59
8 years or younger 1,480 56
Born January-March in 1967 7,104 63
Born April-September in 1967 14,462 60
Bern October - December, in 1967 5,876 57
Males 9 18°,046 57 .
Females ' 17,053 57
One school attended 15,694 59
Two schools attended 30,021 58
Three schools attended 4,944 54
Four or more schools attended 3,974 52
al, Born in Canada - 26415 59
Not born in Canada 4,389ca,,...
55
2 years or less in Canada 1,012 54
3 years in Canada 704 56
4 years or more in Canada 2,466 57
English spoken before Grade 1 28,480 58
Other language spoken before Grade 1 '5,977 54
0English usually,spoken in the home 29,596 58
Other language usually_rspaRen in the home 5,235 50
4;
-27- - .°
a
GliAde/Year 4 - Objective Means by Reporting Categories
DOMAIN 2: COMPREHENSION
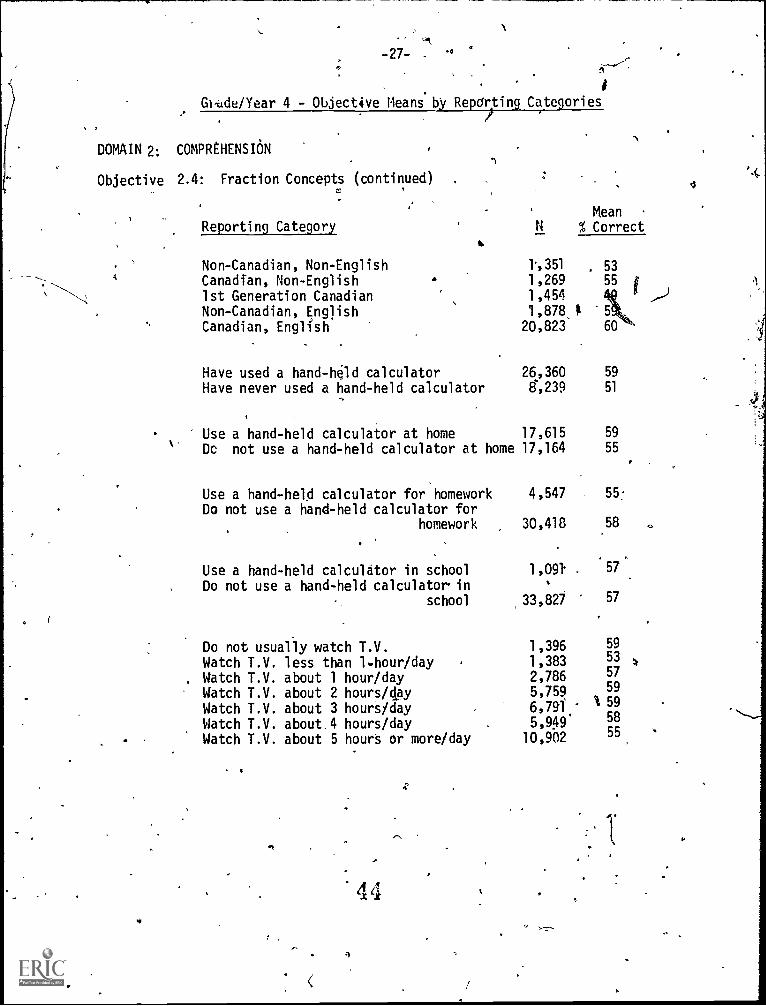
Objective 2.4: Fraction Concepts (continued)
4
1
Reporting Category
Non-Canadian, Non-EnglishCanadian, Non-English1st Generation CanadianNon-Canadian, EnglishCanadian, English
Have used a hand-hOd calculatorHave never used a hand-held calculator 8,239 51
Mean% Correct
1,351 53
1,269 55 i
1,4541,878,120,823 60
5
26,360 59
Use a hand-held calculator at home 17,615
Dc not use a hand-held calculator at home 17,164
Use a hand-held calculator for homework 4,547
Do not use a hand-held calculator forhomework 30,418
Use a hand-held calculator in school 1,091
Do not use a hand-held calculator inschool ,33,827
Do not usually watch T.V. 1,396
Watch T.V. less than .hour /day 1,383
. Watch T.V. about 1 hour/day 2,786
Watch T.V. about 2 hours /day 5,759
Watch T.V. about 3 hours/day 6,70 4
Watch T.V. about .4 hours/day5,949
Watch T.V. about 5 hours or more/day 10,902
4 4
59
55
55:
58
.57',
57
59
53
57
59
5958
55
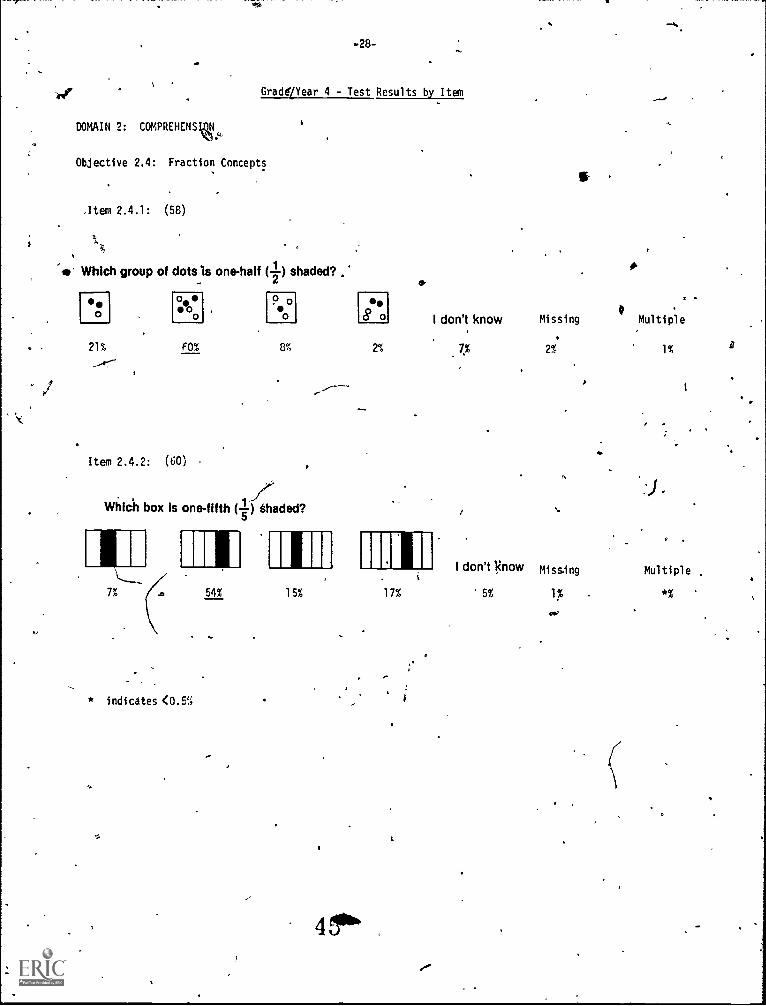
DOMAIN 2: COMPRENENN,
Objective 2.4: Fraction Concepts
-28-
Grader/Year 4 - Test Results by Item
Item 2.4.1: (58)
1Air Which group of dots Is one-half (-2 ) shaded?
se0
21%
oe00
Pso0 8o I don't know Missing Multiple
FO% 8% 2% 7% 2%
Item 2.4.2: (SO) .
Which box is one-fifth (1) Shaded?
7%
* indicates <0.5%
54% 15%
456'
17%
10'
I don't know missing
5% 1% -
Multiple
*% '
A
,
-29-
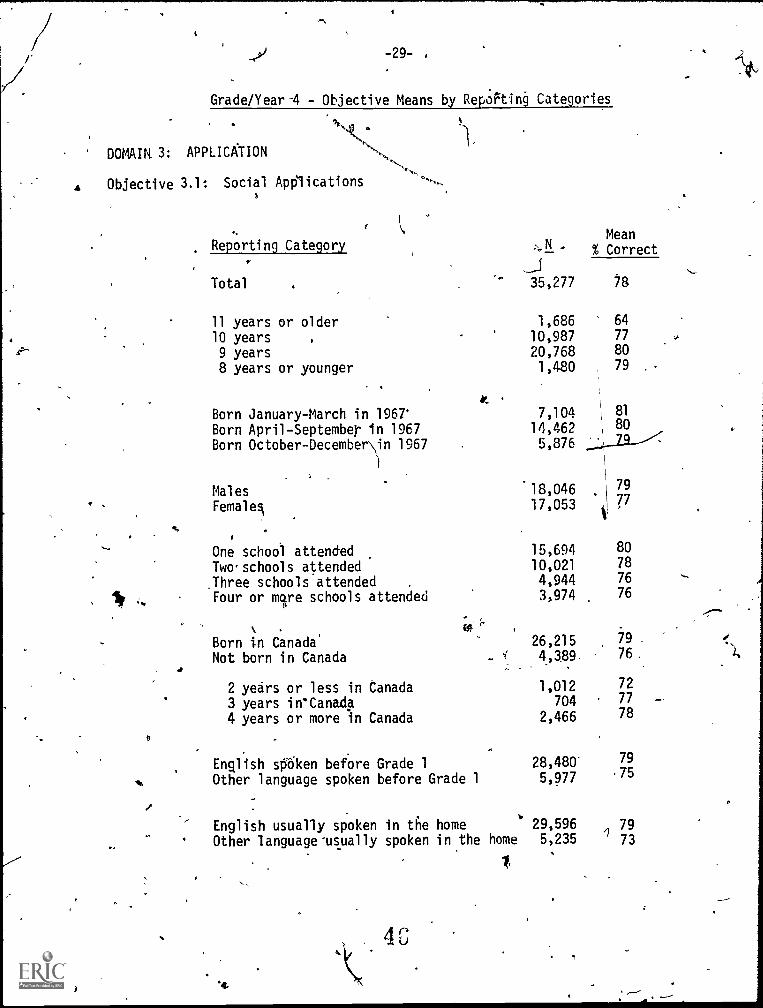
Grade/Year-4 - Objective Means by Reporting Categories
DOMAIR 3:
Objective 3.1:
APPLICATION
Social Applications
Reporting CategoryMean
% Correct
Total 35,277 78
11 years or older 1,686 64
10 years 10,987 77
9 years 20,768 80
8 years or younger 1,480 79
Born January-March in 1961' 7,104 81
Born April-September in 1967 14,462 \ 80
Born October - December \in 1967 5,876
MalesFemale;
18,04617,053
7977
One school attended 15,694 80
Two schools attended 10,021 78
.Three schools attended . 4,944 76
Four or more schools attended 3,974 76
,
Born in Canada' 26,215 79
Not born in Canada 4,389 76,
2 years or less in Canada 1,012 72
3 years in4Canada 704 . 77
4 years or more in Canada 2,466 78
English spoken before Grade 1Other language spoken before Grade 1
28,4805,977
79
75
English usually spoken in the home 29,596 79Other language' usually spoken in the home 5,235 ' 73
.4,
4 '
-30-
Grade/Year 4 ObjeLtive MeanecReporting Categories
DOMAIN 3: APPLICATION
Objective 3.1: g Social Applications (continued)1
MeanReporting. Category N % Correct
Non-Canadian, Non-EnglishCanadian, Non - English
1st Generation CanadianNon-Canadian, EnglishCanadian, English
1,351 75
1,269 77
1,454 73
-,1,878' 79
20,823 80
Have used a hand-held calculat* 26,360 80
Have never used a hand-held calculator _8,239 74
Use a hand-held calculator at home 17,615 80De not use a pand-held calculator at home 17,164 77
s
te
- ; Use a hand-hpld calculatr for homework 4,547 77
Do tot use a hand-held calculator forhomework 30,418 , 78
Use a hand-held calculator in school 1,091 77
Do not use a hand-held calculator inschool 33,827 78.
Do not usually watch T.V. 1,396 . 76
Watch T.V. ,less than 1 hour/day 1,383 74
Watch T.V. about 1 hour/day 2,786 78
Watch T.V. about 2 hours/day 5,759 79.Watch T.V. about 3 hours/day 4
Watch T.V. about 4 hours/day6,791
5,949
79
80
Watch T.V. about 5 hours or more/day 10,902 78
,47
-31-
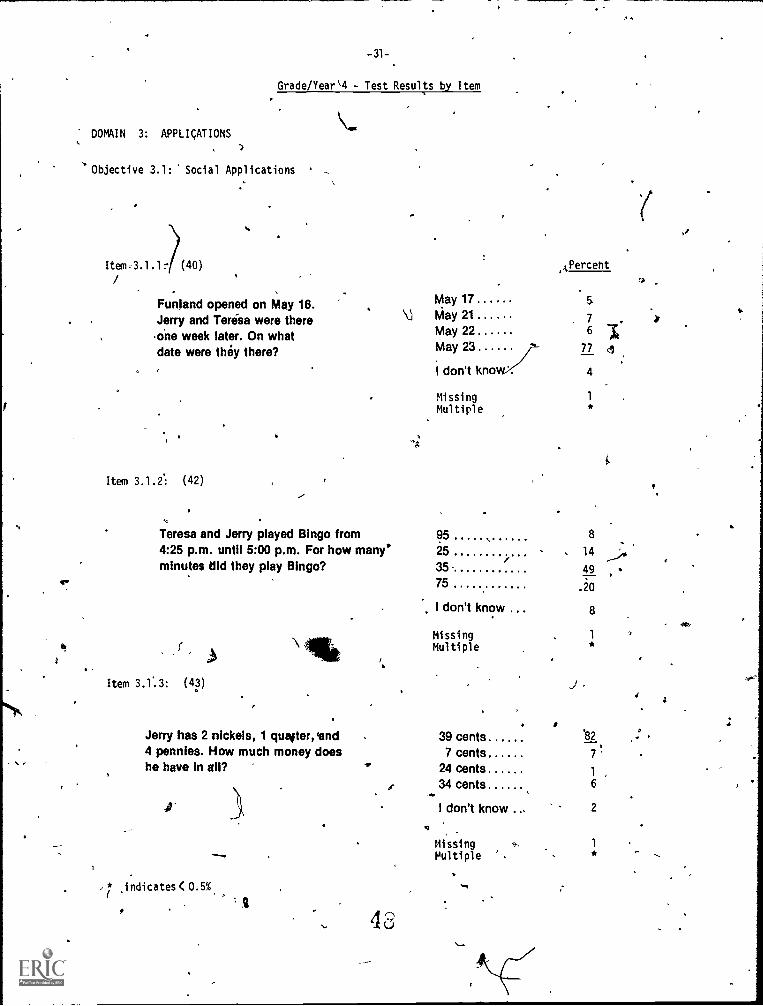
Grade/Year - Test Results by Item
DOMAIN 3: APPLICATIONS
Objective 3.1: Social Applications
Item-3.1.1 (40)
Funland opened on May 16.Jerry and Terisa were thereone week later. On whatdate were they there?
Item 3.1.2': (42)
May 17\J May 21
May 22May 23
I don't know/MissingMultiple
,.tPercebt
7 .16
77
4
1
Teresa and Jerry played Bingo from4:25 p.m. until 5:00 p.m. For how many'minutes bid they play Bingo?
Item 3.1..3: (43)
Jerry has 2 nickels, 1 quatter,and4 pennies. How much money doeshe have in all?
9525
3575
I don't know
MissingMultiple
39 cents7 cents
24 cents34 cents
I don't know
MissingMultiple
8
14
49
.20
8
1*
82
7
1 ,
6
2
1*
0
indicates < 0.5%4
43
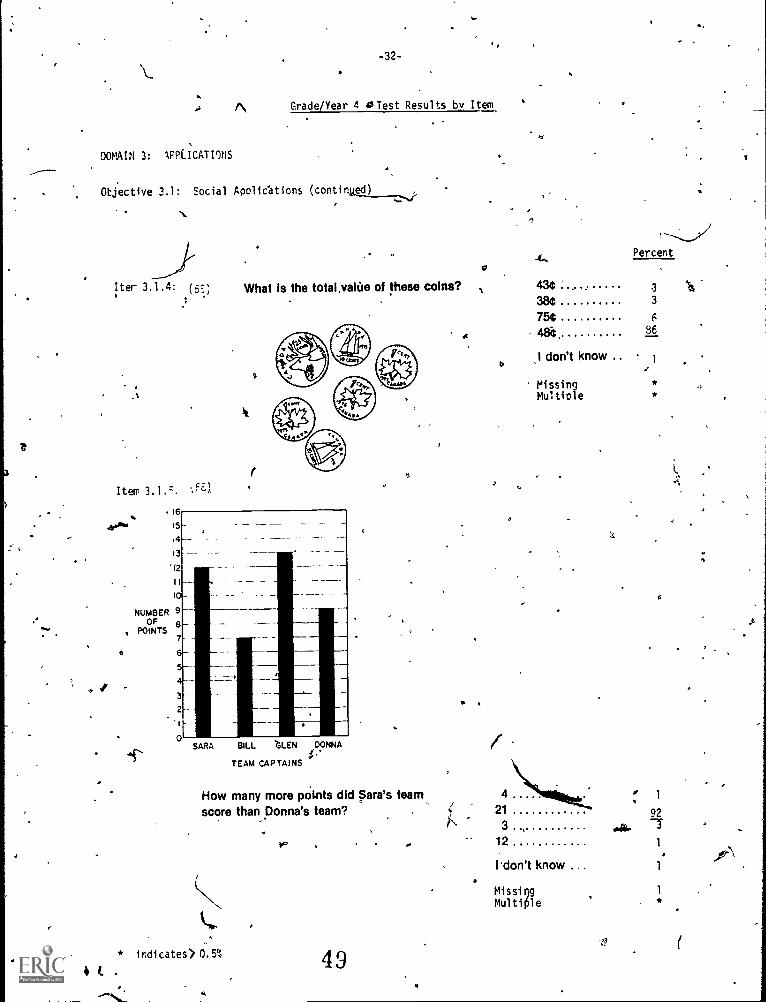
-32-
A Grade/Year 4 4 Test Results by Item
DOMAIN 3: 'PPLICATIO ?IS
Objective 3.1: Social ApoliCations
4f.
Iter 3.1.4:
Item 3.1.7. 60
16
.4.4
13
.12
II --10-
NUMBER 9POIF 8NTS
-
7,
3
2
1^
0SARA
9
What is the total,vaiiie of these coins? ,
MU. 'LEN DONNA,w
TEAM CAPTAINS
e
(
Percent
43$ 3 ah
384 3
754 6
484. 36
I don't know .. 1
MissingMultiple
How many more points did Sara's team 4 0 1
score than Donna's team? , i, 21 92
. IN 3 411.. 7s. a 12 1
NL
* indicates) 0.5% 49
ition't know ... 1
Missi 1
Multiplee
Cf
I
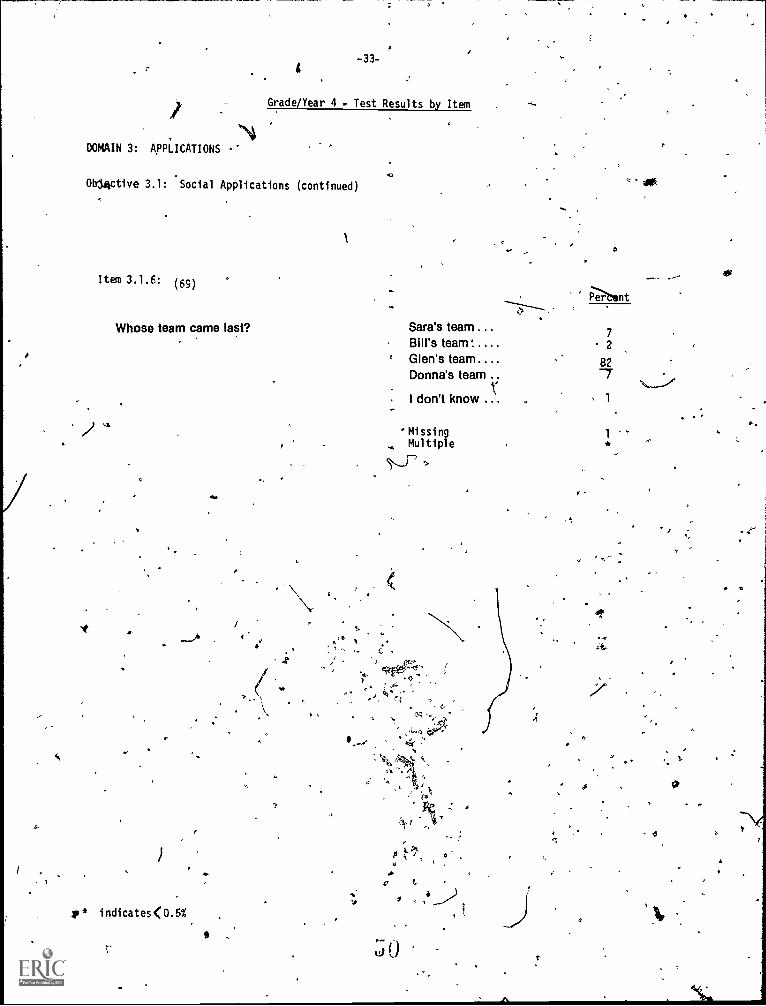
DOMAIN 3: APPLICATIONS
L-33-
Grade/Year 4 Test Results by Item
Obctive 3.1: Social Applications (continued)
Item 3.1.6: (69)
Whose team came last?
)
p* indicates(O.5%
Sara's team ...Bill's team'Glen's teamDonna's team
I don't know
7
a
827
Missing 1
Multiple
4 cU
o *
4.
A
Or
-34-
Grade/Year 4 - Objective Meads by Reporting Categories
DOMAIN 3: APPLICATIONS
Objective 3.2: Mathematical Applications
Reporting Category
Total
11 years or older10 years
9 years8 years or younger
Born January-March in 1967Born April-September in 1967Born October-December in 1967 '
Males ,
FemalesI
One school attendedt Two schools attendedThree schools attended ..
Fbur or more'schools attended
Born in CanadaGNot born in Canada
2 years or less in Canada3 years in Canada4 years or more in Canada
English spoken before Grade 1Other language spoken before Grade 1
English usually spoken homeOther languagevusually spoken in the home
51
35,277
1,686
Mean% CorreCt
4810,987 6420,768 671,480 64
7,104 70
14,462 685,876 66
18,046 6617,053 , 64
15,694 6710,021 664,944 633,974 60
26,215 67
4,389 64
1,012 62
704 66
,2,466 65
28,480 66
5,977 62
29,5965,235
.
/ -35-
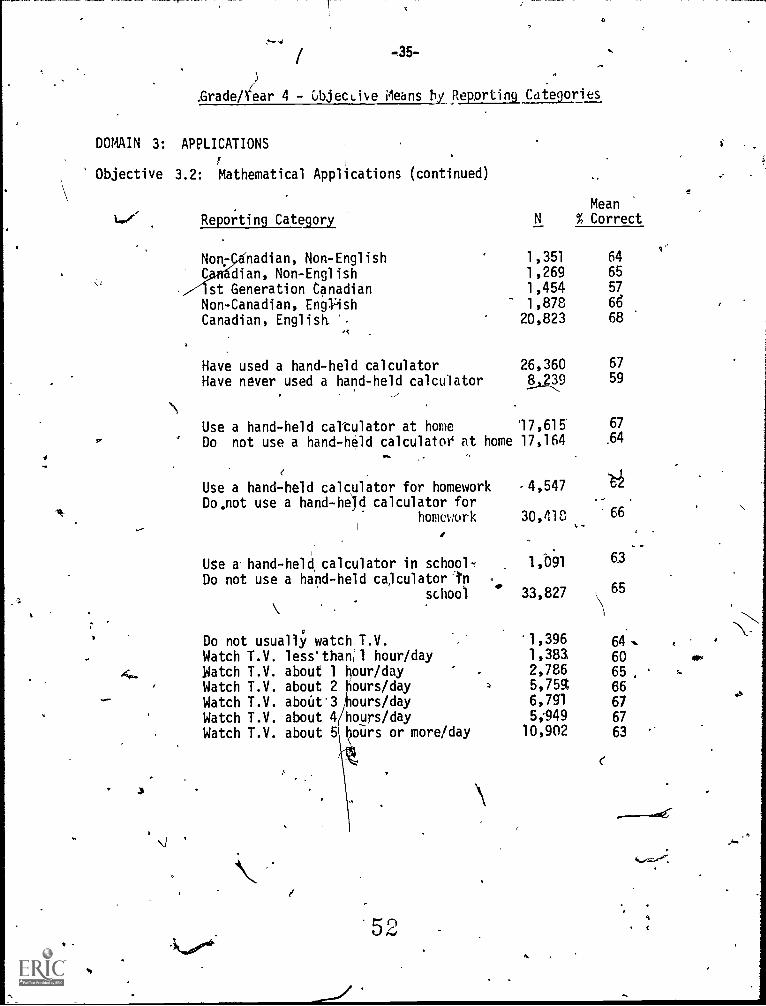
.Grade /Fear 4 - UbjecLil,e Means by Reporting Categories
DOMAIN 3:
Objective
../'
i
,-
-
A.
APPLICATIONSr
3.2: Mathematical Applications
Reporting Category
(continued)
N
1,351
1,2691,4541,878
20,823
calculator 26,360calculator 8,2 39
------..
at home 17,615'
calculator at home 17,164.-
.
.
for homework 4,547calculator for
how:work 30,4181
.
in school 1,bil
calculator' ll
school 33,827
T.V. '1,396
hour/day 1,383hour/day 2,786ours/day , 5,75%ours/day 6,791
hours/day 5;949
hours or more/day 10,902
Mean% Correct
.
,.N
Non: nadian, Non-EnglishC dian, Non-Englishst Generation Canadian
Non-Canadian, EnglishCanadian, English. ',
Have used a hand-heldHave never used a hand-held
Use a hand-held calculatorDo not use a hand-held
r
Use a hand-held calculatorDo.not use a hand-held
Use a. hand-held, calculatorDo not use a hand-held
Do not usually watchWatch T.V. less*than'lMatch T.V. about 1Watch T.V. about 2Watch T.V. about 3Watch T.V. about 4Watch T.V. about 5
64
65
57
6668
67
59
67
.64
14
'66
63
65
64s .
6065 ,
,.
66
6767
63
3
. it...."s
\
,.
e
.....-...--,..01-
4,......---).
4
(
-3F-
Grade/Year 4 - Test Results by Item
DOMAIN APPLICATIONS
Objective 3.2: Mathematical Applications
Item'3.2.1: (41)
The roller coaster has 8 carswith 4 wheels on etich car. How manywheels are there on the roller coaster?
e"
Item 3.2.2: (52)
Percent
12 12
21
32 79
24 4
I don't know 2
MissingMultiple
Skana can Itimp 627 centimetres high.Hyak can jump 5 metres high. How muchhigher can Skana jump than Hyak?
/
Item 3.2.3: (53)
1(7 centimetres . .
622 centimetres ..22 centimetres ..
632 centimetres .
4,\
39
-23
148
.1 don't know .... 15
Missing 1
Multiple
On Monday, 185 people saw the morning 597 .... ..It, -whale shows and 412 people saw the 697afternoon whale shows. How many people 327saw the whale shows that day? 373
* indicates<0.5%
53
I don't know ..
MissingMultiple
;8
2.
2
3
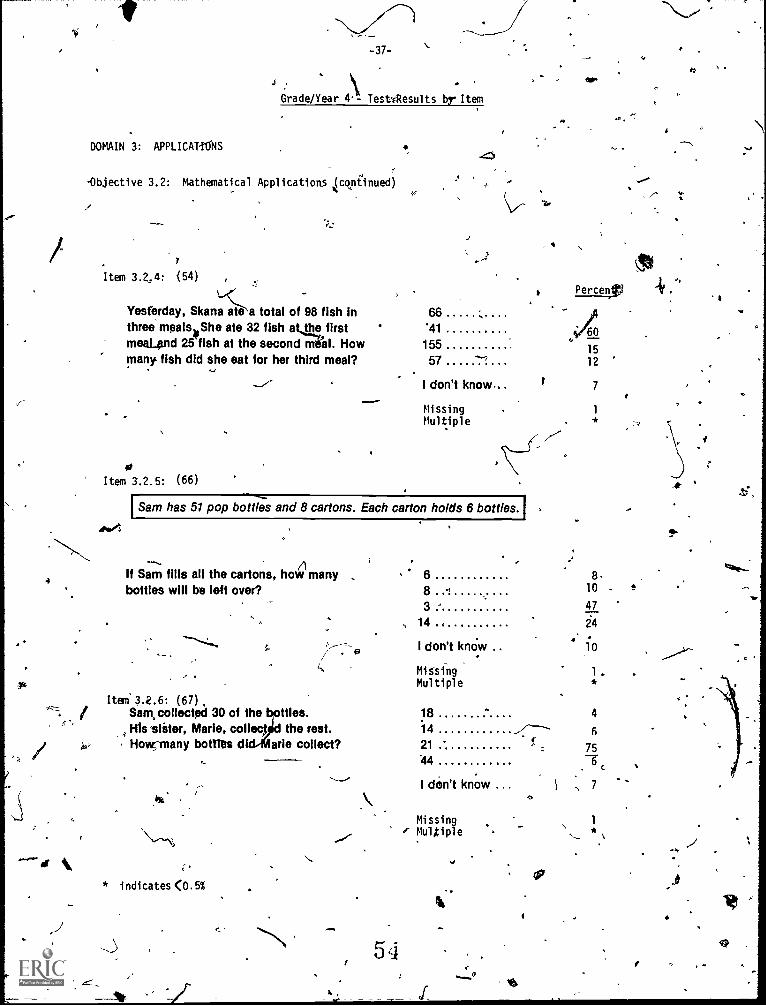
ISam has 51 pop bottles and 8 cartons. Each carton holds 6 bottles.
-37-
Grade/Year 4- Test Results by-Item
DOMAIN 3: APPLICATIONS-45
-Objective 3.2: Mathematical Applications c nued)
,
Item 3.2,4: (54)
ar
P e rYesferday, Skana ate a total of 98 fish in 66three meals
41LieShe ate 32 fish at, first '41 i/60
meaLand 25 fish at the second ."111. How 155 15many fish did she eat for her third meal? 57 --7 12 .
Item 3.2.5: (66)
.44104,
4
At k
I don't know... t 7
MissingMultiple
If Sam fills all the cartons, how many 6bottles will be left over? 8
3
14
I don't knOw
MiSsingMultiple
Item. 3.2.6: (67).Sankcollected 30 of the ttles.theHis sister, Marie, collect the rest.How;many botttlYs d arie collect?
ti
* indicates <0.5%
54
AV
810 - e
47
24
10
1.*
18 4
14 6
21 754 7
I thin/ know S 7
MissingMultiple
1
41-
If
aCf
38-
Grade/Year 8 - Objective Means by Reporting Categories
DOMAIN 1: COMPUTATION AND KNOWLEDGE
Objectivg 1:1: Computation with Whole.Numbers
c,
Reporting Category N.
42,250
Mean
% Correct
Total 84
16 years o older 440 67
15 years 2,344 75
14 years 14,237 82
13 years 24,075 86
12 years or younger 757 82
Males 21,470 81
Females 20,162 87
, )
One school attended 1,367 80
Two schools attended 12,479 85
Three schools attended 11,124 85
Four schools attended 6,970 84
Five schools attended . 4,055 83
Six schools attended 2,236 83
Seven schools attended 71,291 80.
.11 ,Eight or more schools attended 1,920 78
Use a hand-held calculator at horpe'N 14,840 84
Do not use a hand-held calculator at home 26,524. 84
Use a handrheld calculator for. homework- 12,21.4 83
Do not use a.hand-held calculator for homework 29,069/ .85
w -)
Use a hand-held calculator in schoolDo not use a hand-held calculator in school
4,26537,;581 ,
79
84
Mathematics course semestered 12,865 83
Mathematics course not semestered 28,799 84
55
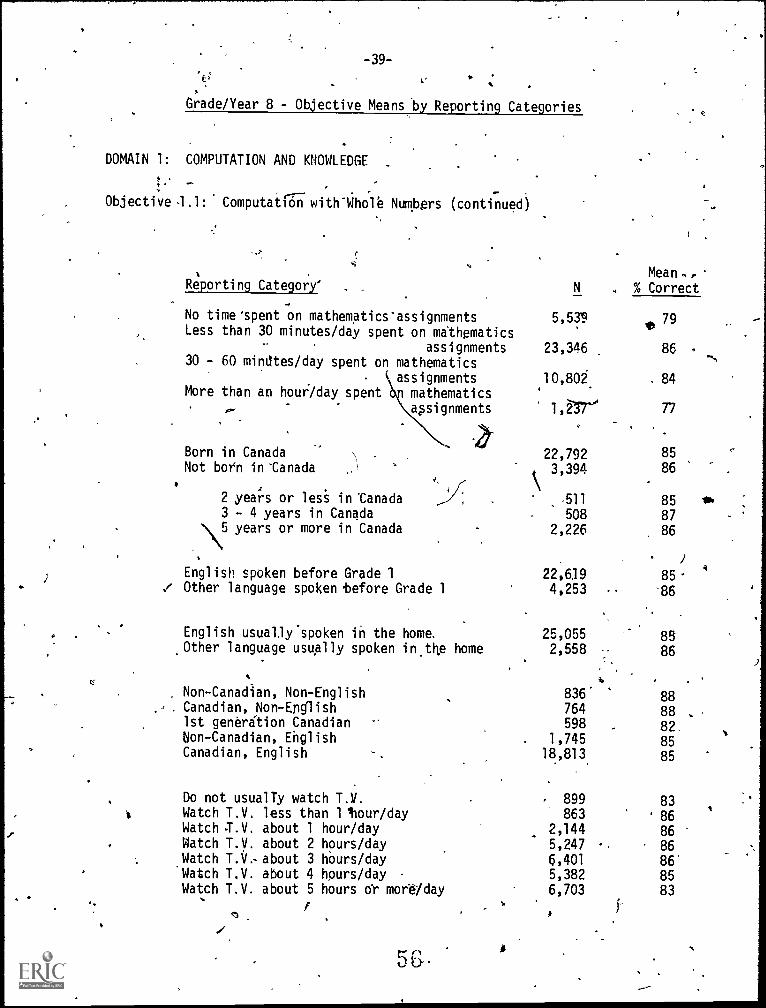
-39-s
Grade/Year 8 - Objective Means by Reporting Categories
DOMAIN 1: COMPUTATION AND KNOWLEDGE .
t .
.
r-r.--Objective 1.1: Computation with-Whole Numbers (continued)
Reporting Category' ,
No time'spent on mathematics'assignments
Less than 30 minutes/day spent on mathematics
assignments30 - 60 minutes /day spent on mathematics
assignmentsMore than an hou0day spent mathematics
assignments
Born in CanadaNot born in 'Canada )
2 years or lesi in-Canada3 - 4 years in Canada
\:5 years or more in Canada
English spoken before Grade 1." Other language spoken before Grade 1
English usually'spoken in the home.Other language usually spoken inthe home
Non-Canadian, Non-English. Canadian, Non-Epg1ish1st generation CanadianSon-Canadian, EhglishCanadian, English
Do not usually watch T.V.
i Watch T.V. less than 1 Sour/dayWatch J.V. about 1 hour/day
. Watch T.V. about 2 hours/dayWatch T.V. about 3 hours/day'Watch T.V. about 4 hours/dayWatch T.V. about 5 hours or more/day
N
5,539
23,346
10,80.
Mean,,% Correct
79
86 .
. 84
77
22,792 85
3,394 86
-511 85 ibb
508 872,226 86
/
22,619 85-4
4,253 -86
25,055 852,558 - 86
836' 88764 88 ,
598 82,. 1,745 85
18,813 85
899 83863
' 86
. 2,144 865,247 - 866,401 865,382 856,703 83
r .1--
.
.,1 #
5A
8--
CI
-40-
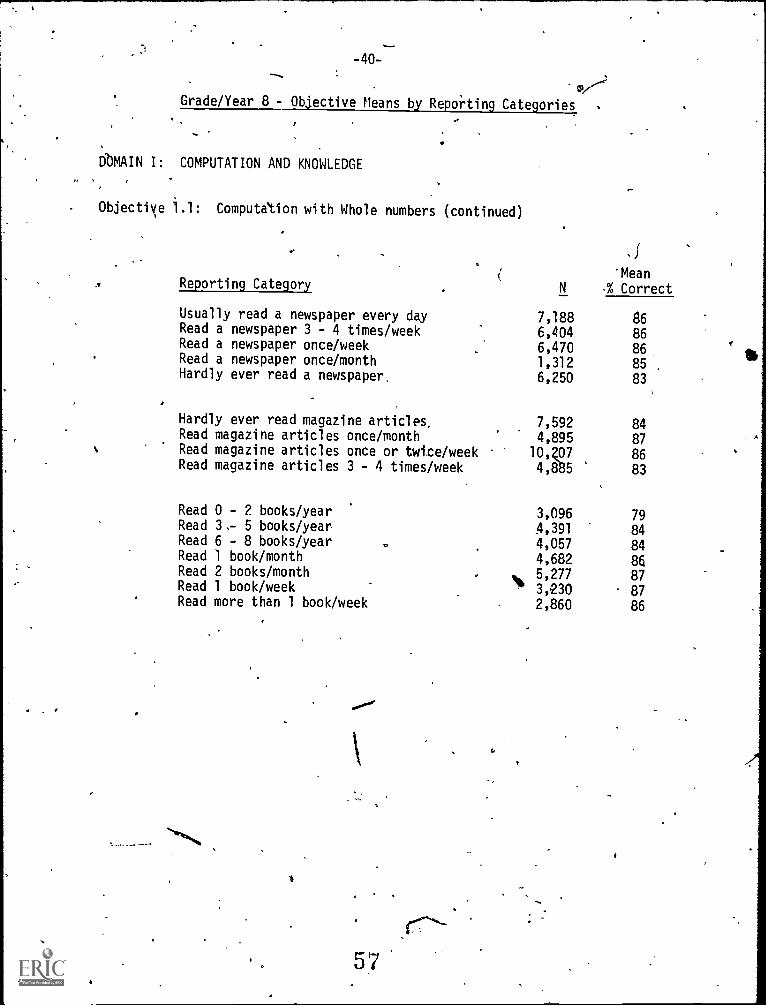
Grade/Year 8 - Objective Means by Reporting Categories .
DbMAIN I: COMPUTATION AND KNOWLEDGE
Objective i.1: Computation with Whole numbers (continued)
si'Mean
Reporting Category N I Correct
Usually read a newspaper every day 7,188 86Read a newspaper 3 - 4 times/week 6,404 86Read a newspaper once/week 6,470 86Read a newspaper once/month 1,312 85Hardly ever read a newspaper. 6,250 83
Hardly ever read magazine articles, 7,592 84Read magazine articles once/month 4,895 87Read magazine articles once or twice/week 10,Z07 86Read magazine articles 3 - 4 times/week 4,885 83
Read 0 - 2 books/year 3,096 79Read 3.- 5 books/year 4,391 84Read 6 - 8 books/year . 4,057 84Read 1 book/month 4,682 86Read 2 books/month r %, 5,277 87Read 1 book/week ' 3,230 87Read more than 1 book/week . 2,860 86
57
-41-.
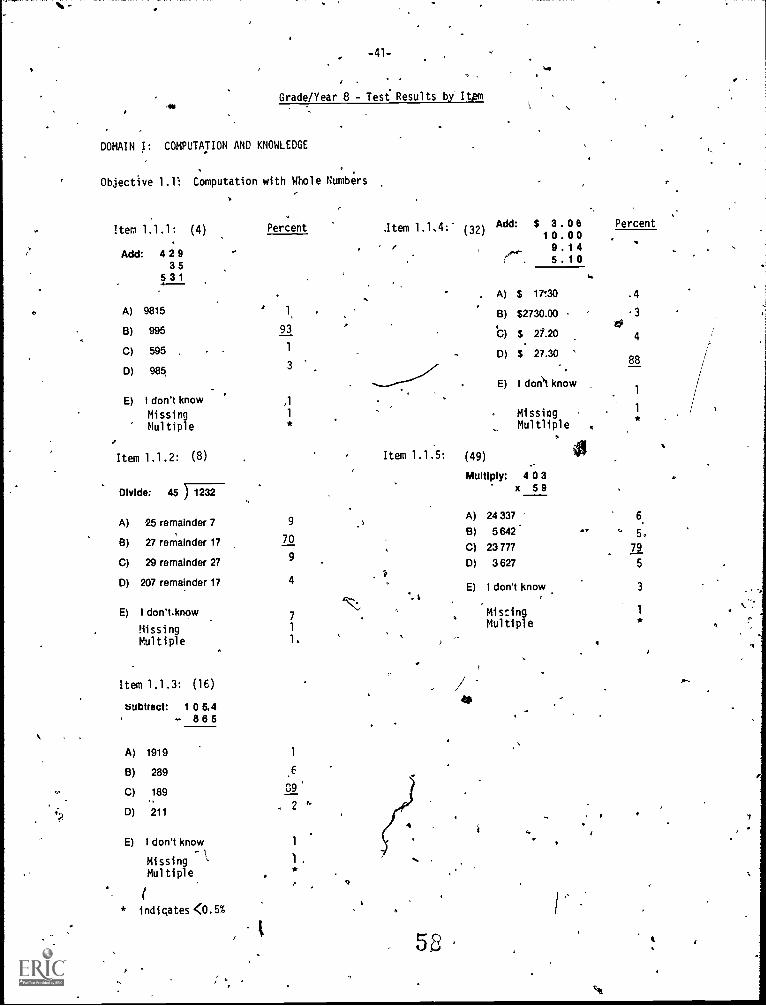
Grade/Year 8 - Test Results by Item
DOMAIN COMPUTATION AND KNOWLEDGE
Objective 1.1: Computation
Item 1.1.1: (4)
with Whole Numbers
Percent
Add: 4 2 935
5 3 1
A) 9815 1,
B) 995 93,
C) 595 1
0) 985.3
E) I don't know ,1
Missing 1
Multiple *
Item 1.1.2: (8)
Divide: 45 T1232
A) 25 remainder 7 9
B) 27 remainder 17 70
C) 29 remainder 27 9
0) 207 remainder 17 4
E) I don't.know 7
Missing 1
Multiple 1.
Item 1.1.3: (16)
subtract: 1 0 5,4- 865
A) 1919 1
B) 289
C) 189 C9
2 "D) 211
E) I don't know
MissingMultiple
1
* indicates 4(0.5%
.Item 1.1.4:' (32)
.*
Add: $ 3 . 0 6 Percent1 . 0 09.14
(.44-. 5.10
A) $ 17'.30
B) $2730.00 3
C) $ 21.200
4
0) $ 27.30. '88
-.....---:----7 . E) I donut know1
Missing 1
*Multliple .
Item 1.1.5: (49) 41
I.
4
58
Multiply: 4 0 3x 59
A) 24 337
B) 5642
C) 23 777
D) 3627
E) I don't know
MistingMultiple
4
za
6
' 5.
79
5
3
O
-42-
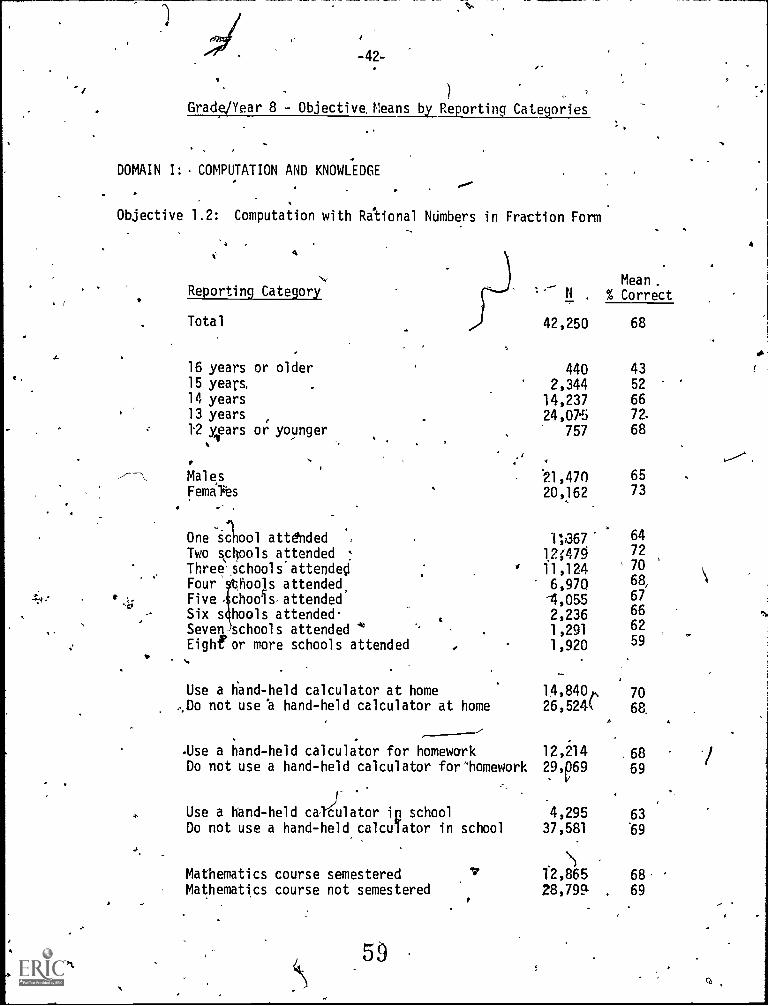
Grade/Year 8 - Objective. Means by Reporting Categories
DOMAIN I: COMPUTATION AND KNOWLEDGE
Objective 1.2: Computation with Ralional Numbers in Fraction Form
4
Reporting Category
Total
16 years or older15 years,
14 years13 years
12 o' ars or. younger.
.
,
. .-,
MalesFemalits
. -, .
One school att&ided ..
Two schools at_ tended
Three.schools attendee '
Four pools attended,Five,chools,attendedSix s hools attended-
.
Seven schools attended *Eighfor more schools attended ,
Use a tiand-held calculator at home,Do not use a hand-held calculator at home
.Use a hand-held calculator for homeworkDo not use a hand-held calculator for homework
Use a hand-held calLator in school
Do not use a hand-held calcuFator in school
%I
Mathematics course semestered f2,865 68'Mathematics course not semestered 28,799 . 69
N
4
Mean.% Correct
42,250 68
440 43
2,344 52
14,237 6672.
757 68
.
21,470 65
20,162 73
1;367' 64
12;47011,124
72' 70
6,970 68,
14,055 67
2,236 66
1,291 62
1,920 59
14,840t, 7026,524k
b
68.
12,214 .6829,p69 69
4,295 6337,581 '69
4.
-43-
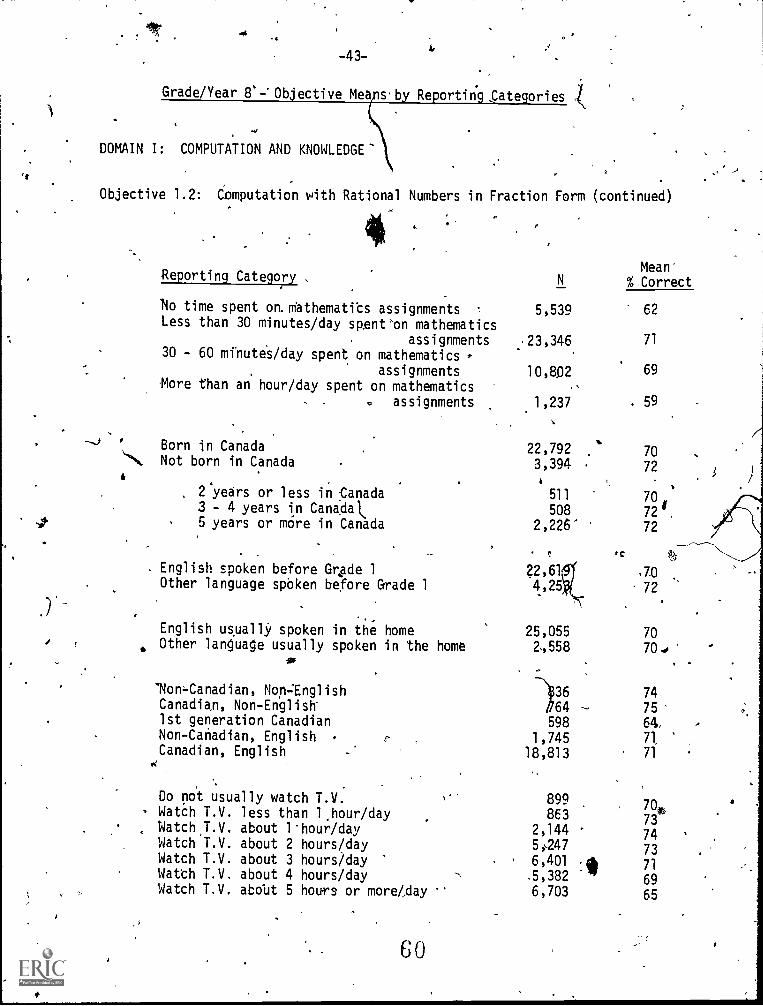
Grade/Year 8`-' Objective Means by Reporting ,Categories
DOMAIN I: COMPUTATION AND KNOWLEDGE
Objective 1.2: Computation with Rational Numbers in Fraction Form (continued)
4.
4Reporting Category ,
No time spent on.mathematibs assignmentsLess than 30 minutes/day sp.ent'on mathematics
assignments30 - 60 minutes /day spent on mathematics ,
.
. assignmentsMore than an hour/day spent on mathematics
assignments
Born in CanadaNot born in Canada
2 years or less in Canada3 - 4 years in Canada5 years or more in Canada
English spoken before Grade 1Other language spoken before Grade 1
English usually spoken in the homeOther language usually spoken in the home
'Non- Canadian, Non:English
Canadian, Non-English-1st generation CanadianNon-Canadian, EnglishCanadian, English
Do not usually watch T.V.Watch T.V. less than 1,hour/dayWatch T.V. about l'hour/dayWatch T.V. about 2 hours/dayWatch T.V. about 3 hours/dayWatch T.V. about 4 hours/dayWatch T.V. abolit 5 hours or more/day
60
N
5,539
23,346.
10,8)32
1,237
22,7923,394
3: 511
508
2,226" '
Mean'
%.Correct
.
62
71
69
59
70
72
70772
72
1
Z2,61
4,25 72,
25,055 7024558 70 .
)36 7464 75598 64,
1,745 718,813 71
899863
2,1445,,247
6,401 ,igh
.5,382 'w6,703
70a73
7473
71
69
65
..
t
..
I
IN
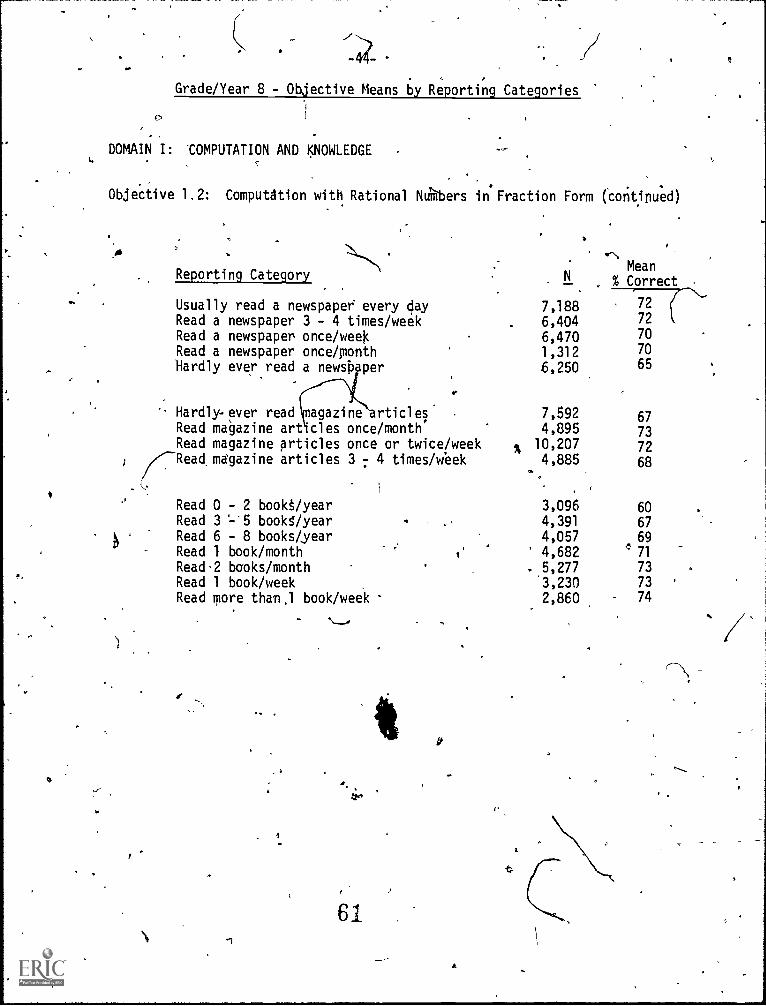
(Grade/Year 8 - Objective Means by Reporting Categories
DOMAIN I: COMPUTATION AND KNOWLEDGEL
,-
....`7...
. - . .
Objective 1.2: Computation with Rational Numbers in Fraction Form (continued). .
r
Reporting Category
Usually read a newspaper every gayRead a newspaper 3 - 4 times/weekRead a newspaper once/we0Read a newspaper once/monthHardly ever read a newspaper
.
..
- Hardly-ever read agazine rticlesRead magazine articles once/monthRead magazine articles once or twice/week
//,'Read magazine articles 3 7 4 times/week
Read 0 - 2 bookt/yearRead 3 %-5 bookg/yearRead 6 - 8 books/yearRead 1 book/monthRead2 books/monthRead 1 book/weekRead more than,1 book/week
.,.
N
.. .
a,
in
61
-...-...
0
A
Mean11 , % Correct
7,1886,4046,4701,312.6,250
7,5924,895
A 10,2074,885
'
3,0964,391
4,0574,682
. 5,2773,2302,860
72
72
70
70
65
67
73
72
68
60
67
69
'''' 71
73
7374
\
or
sot
-46-
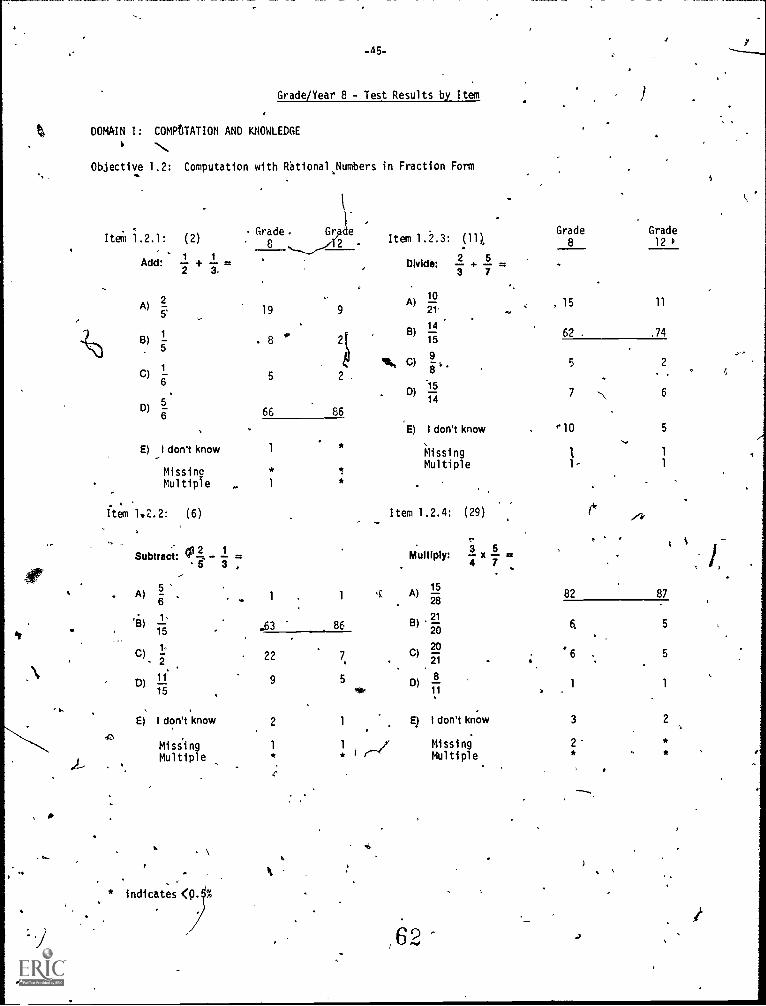
Grade/Year 8 - Test Results by Item
DOMAIN I: COMPUTATION AND KNOWLEDGE
Objective 1.2: Computation with Wational,Numbers in Fraction Form
Item 1.2.1: (2)
1 1Add: IF + =
2A)
5'
1B)
5
C)
D)5
6
E) I don't know
MissingMultiple
Grade.8
)-Gr de
2Item 1.2.3: (11).
Divide:3
2 5
+ 7
1
201.
14B) .7415
9C)
8
)D)
14
5
E) I don't know
MissingMultiple
Grade8
Grade12 1
19
8
5
66
9
2
..
86
, 15
62 .
11
5
7
4" 10
11-
\
2
6
5
1
1
1
1
ti
Item 1.2.2: (6)
Subtract: 04. -5
A)5
6
13)1,
15
1C)
.
- 2
1'D)
1--15
E) I don't know
MissingMultiple
=3 ,
1
.63
1
86
22
9
2
5
1
.
* indicates <p.
It
Item 1.2.4: (29) (`'
3 5Multiply: x =
A)15
28
21B)
20C)
21
D) -811
4
E) I don't know
Mi ss i ng
Multiple
6
7
82 87
5
`6 5
1 1
3
2`*
6
9
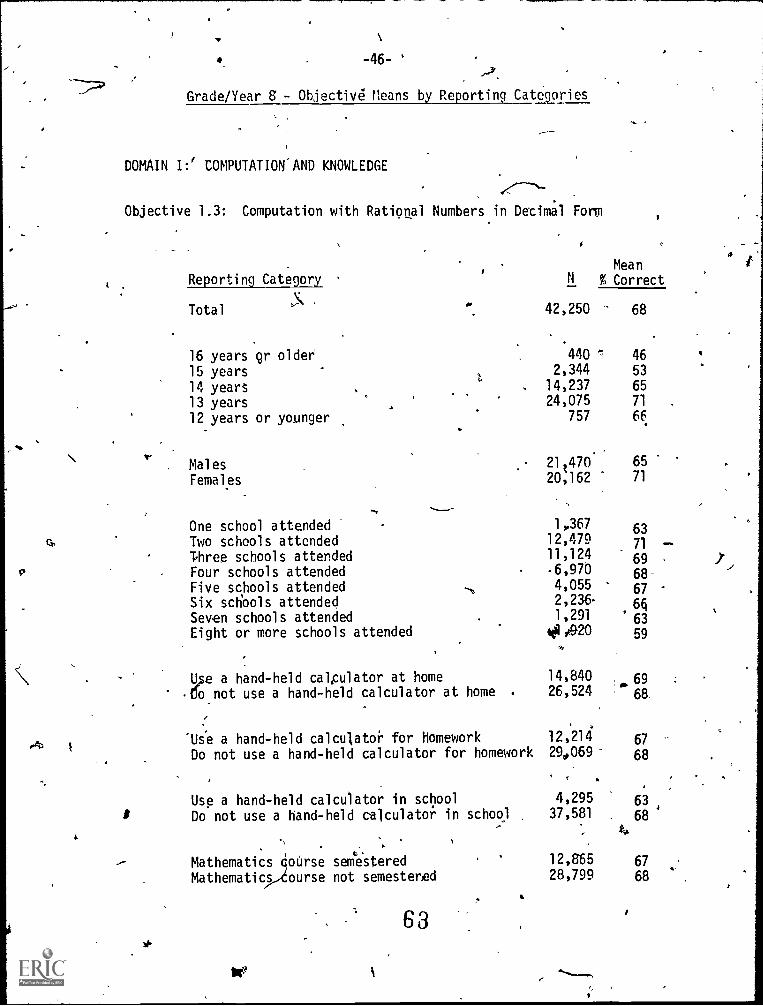
# -46- ' 1Grade/Year S - Objective Means by Reporting Categories
DOMAIN I:' COMPUTATIONAND KNOWLEDGE
Objective 1.3: Computation with Rational Numbers in Decimal Form
.
MeanReporting Category % Correct
Total 42,250 68
16 years gr older 440 46
15 years 2,344 53
14 years 14,237 65
13 years 24,075 71
12 years or younger 757 66
Males 21070 65
Females 20,162 71
One school attendedTwo schools attendedThree schools attended
1,36712,47911,124
63
71
69
Four schools attended .6,970 68-Five schools attended 4,055 - 67
Six schools attended 2,236- 66
Seven schools attendedEight or more schools attended
1,291
lei ?Dm
° 63
59
U,,se a hand-held calculator at home 14,840 69
-filo not use a hand-held calculator at home . 26,524 68.
Use a hand-held calculator for homework 12,214 67
Do not use a hand-held calculator for homework 290069- 68
Use a hand-held calculator in school 4,295 63
Do not use a hand-held celculator in school 37,581 68
to
Mathematics obrse serriestered 12,865 67
Mathematics ourse not semesterkd 28,799 68
63 I
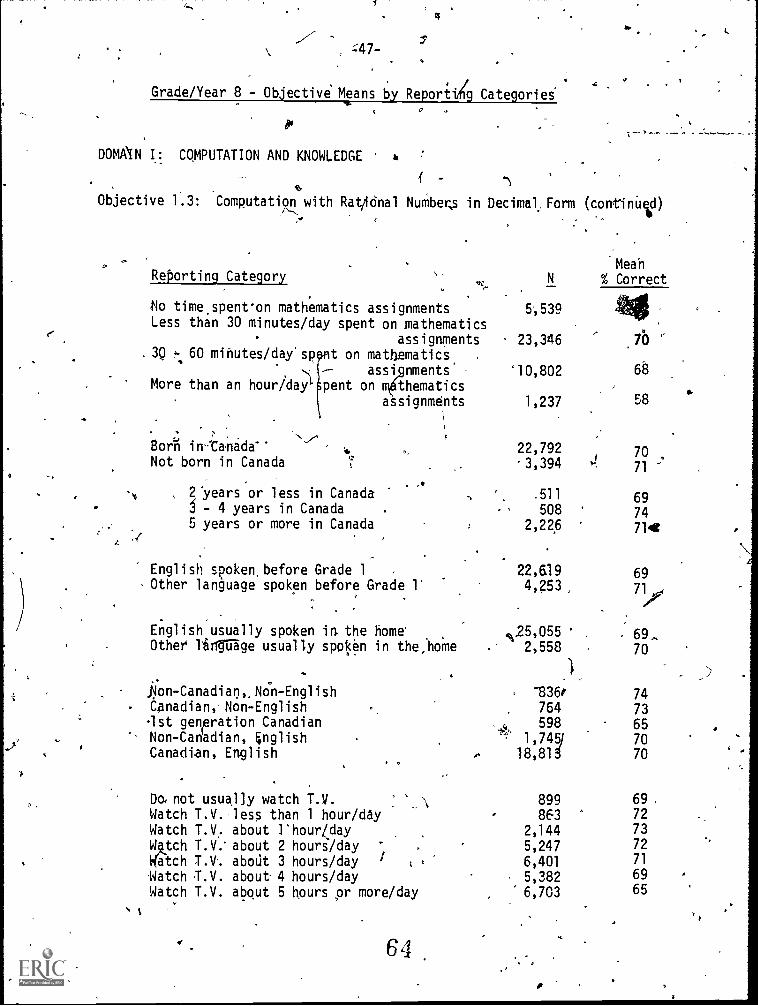
=47-2
Grade/Year 8 - Objective Means by Reporting Categories
DOMAIN I: COMPUTATION AND KNOWLEDGE
f -
Objective 1.3: Computation with Rat4Onal NuMberts in Decimal. Form (continUid)
O
A
Reporting Category
No time.spent-on mathematics assignments 5,539Less than 30 minutes/day spent on mathematics
assignments 23,346. 3Q - 60 minutes/day'sp t on mathematics
asst nments '10,802More than an houridaY pent on thematics
assignments 1,237
Born in--tanadewNot born in Canada
2 'years or less in Canada- 4 years in Canada
5 years or more in Canada
22,792-3,394
Meah% Correct
.7b
68
58
70
71
.511 69508 74
2,226 714c
English spoken before Grade 1 , 22,619 69Other language spoken before Grade l' 4,253, 71
:
English usually spoken in the home' 25 055.
Other' lingage usually spoken in the,home . 2,558 70
J8,1on-Canadian,,Non-English
Canadian, Non-English1st generation CanadianNon- Canadian, EnglishCanadian, English
Do, not usua.l]y watch T.V.
Watch T.V. less than 1 hour /day
Watch T.V. about l'houridayW,Qtch T.V. about 2 hour/dayWitch T.V. about 3 hours/dayMatch T.V. about 4 hours/dayWatch T.V. about 5 hours pr more/day
t
64
1836f 74764 73598 65
1,745) 7018,815 70
899- 8E3
2,144
5,247
6,401
5,3826,703
69 .
72
7372
71
6965
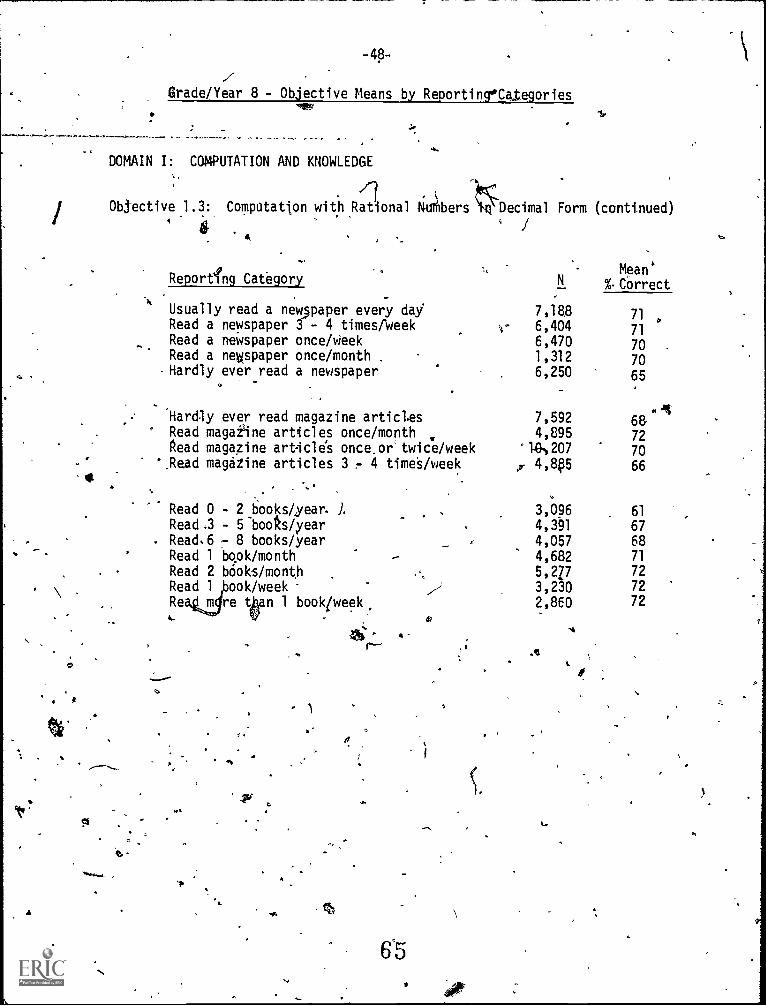
-48-
Grade/Year 8 - Objective Means by ReportingoCalegories
I.
DOMAIN I: COMPUTATION AND KNOWLEDGEass
Objective 1.3: Computation with Rat1ional tiut6ersDecimal Form (continued)
.
Reporting Category NMean'
%. Correct
Usually read a newspaper every dayRead a newspaper 3 - 4 timesfweekRead a newspaper once/Week
%7,1886,4046,470
71 .
71
70 .
Read a newspaper once/month . 1,312 70-Hardly ever read a newspaper 6,250 65
Hardly ever read magazine articles 7,592 68.Read magailne articles once/month 4,895 72Read magazine article's once. or twice/week 1GN207 70
',Read magaZine articles 3 r 4 time's /week
Read 0 - 2 books/,year. I.
, 4,80
3,096
66
61
Read .3 - 5 boots/year 4,391 67. Read.5 7 8 books/year 4,057 68
Read 1 book/month - 4,682 71
Read 2 books/month 5,2Z7 72
Read 1 ,book /week 3,230 72
Re m re ten 1 book/week, 2,850 72
qa.
65
S.
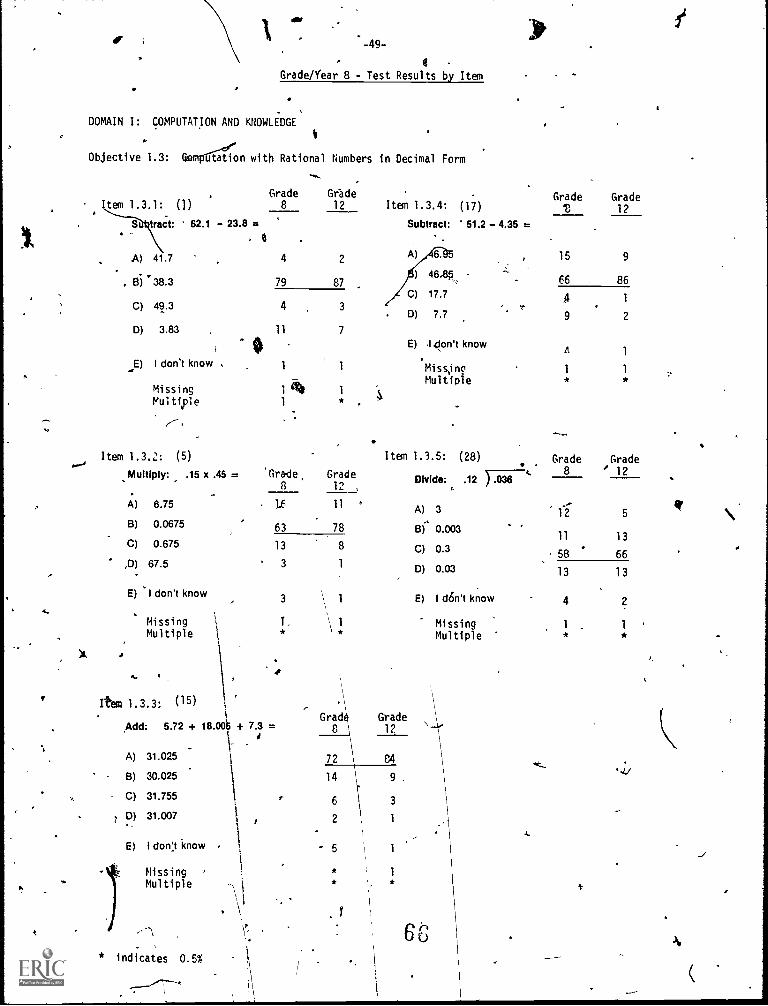
-49-
8
Grade/Year 8 - Test Results by Item
DOMAIN I: COMPUTATION AND KNOWLEDGE
Objective 1.3: Gompifaion with Rational Numbers in Decimal Form
tem 1.3.1: ())S tract: 62.1 - 23.8
A) 41.7
8) 38.3
C) 49.3
D) 3.83-
E) I don't know
MissingMultiple
Item 1.3.2: (5)
Multiply: .15 x .45 =
A ) 6.75
B) 0.0675
C) 0.675
,D) 67.5
E) I don't know
MissingMultiple
Item 1.3.3: (15)
Add: 5.72 +
A) 31.025
B) 30.025
C) 31.755
? D) 31.007
E) I don:t know
MissingMultiple
4
79
4
11A
1
1 441
Grade Gr"ade8 12
=
8
2
87
3
7
*
'Grade Grade
. Le 11 °
63 78
13 8
3 1
3 \ 1
1,
18.005 + 7.3
. ,
indicates 0.5%
' Grade GradeItem 1.3.4: (17) '8 12
Subtract: 51.2 - 4.35 =
A) 6.
46.85 -
C) 17.7
D) 7.7
E) 144on't know
MissingMultiple
15 9
66 86
4 1
9 2
A 1
1 1
* *
Item 1.3.5: (28) . Grade Grade8 12
Divide: .12 F1.3-6 4.
A) 3 12 5
Grad Grade8 12
72
14 9 .
6 3
2 1
- 5 1
*1
*
Bi* 0.00311 13
C) 0.3 58 66
D) 0.03 13 13
E) I d6n't know 4 2
Missing 1 , 1
Multiple *
6;
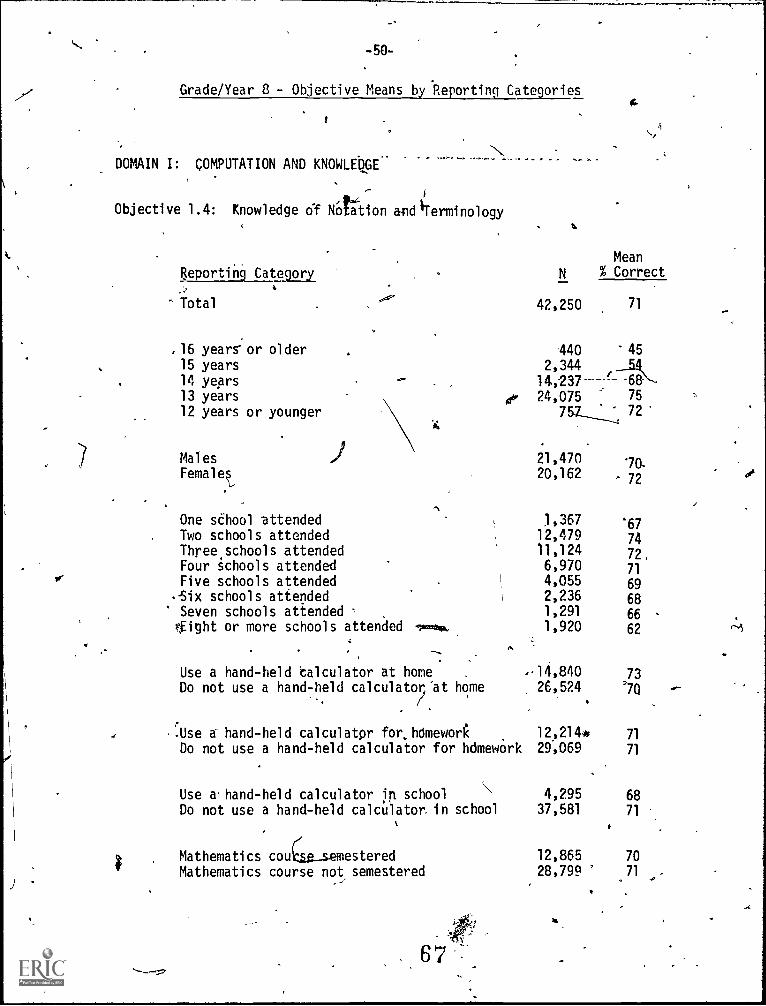
V
-50-
Grade/Year 8 - Objective Means by Reporting Categories
DOMAIN I: COMPUTATION AND KNOWLEDGE
Objective 1.4: Knowledge of NOtion andlTerminology
Reporting Category
Total
16 years- or older
15 years
14 years13 years
12 years or younger
MalesFemales
I
One school attended. Two schools attended
Three schools attendedFour schools attendedFive schools attended
..Six schools attendedSeven schools attendedlight or more schools attended
0
Use a hand-held calculator at homeDo not use a hand-held calculator'at home
40
Use a hand-held calculator for.hdmeworkDo not use a hand-held calculator for hdmework
Use a hand-held calculator in schoolDo not use a hand-held calculaton in school
Mathematics coucu_s.emesteredMathematics course not semestered
Mean
N % Correct
42,250
-440
2,344
71
-45
24,075 75
72
21,47070..
20,162 -72
1,367 '6712,479 7411,124 72,6,970 714,055 692,236 681,291 661,920 62 r-5
,14,840 7326,524 77o
12,214* 71
29,069 71
4,295 6837,581 71
12,865 70
28,799 71
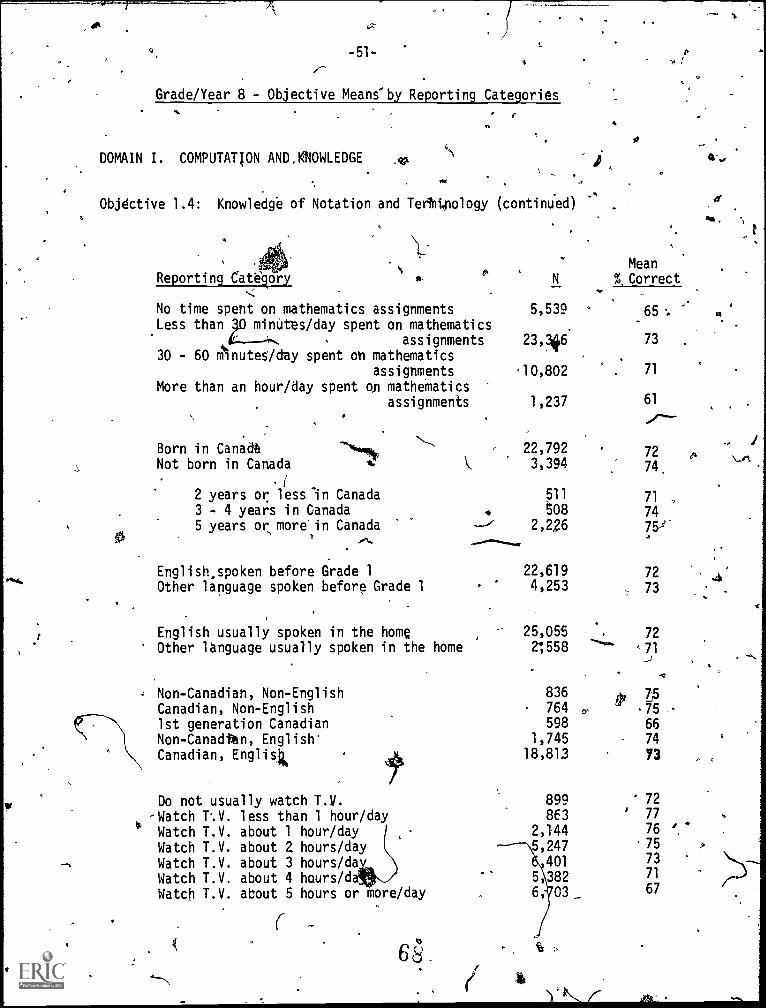
62,
-51-
Grade/Year 8 - Objective Means'by Reporting Categories.
DOMAIN I. COMPUTATION AND.KNOWLEDGE
Objective 1.4: Knowledge of Notation and TerKnology (continued)
Reporting Category
No time spent on mathematics assignmentsLess than 30 minutes /day spent on mathematics
assignments30 - 60 niNnutesiday spent on mathematics
assignmentsMore than an hour/day spent on matheMatics
assignments
Born in CanadeNot born in Canada
2 years or less in Canada3 - 4 years in Canada5 years or more-in Canada
English spoken before Grade 1Other language spoken before Grade 1
English usually spoken in the homeOther language usually spoken in the home
Non-Canadian, Non-EnglishCanadian, Non-English1st generation CanadianNon-Canadthn, English'Canadian, Englislk
Do not usually watch T.V.-Watch T.V. less than 1 hour/day
Watch T.V. about 1 hour/dayWatch T.V. about 2 hours/dayWatch T.V. about 3 hours/daWatch T.V. about 4 hours/daWatch T.V. about 5 hours or more/day ,
°
O
N
5,539
2346.
-
Meanorrect
65 -..
73 .
10,802 : 71
1,237 61
22,792 723,394 74_
511 71
508 742,226
7.5)-
22,619 724,253 73
- 25,055 7224,558 71
836764 ,
t? 75598 66
1,745 74
18,813 73
899 72
863 ' 77
2,144 76 '
5,247 .75
401 73
5,382 71
6, 03 67
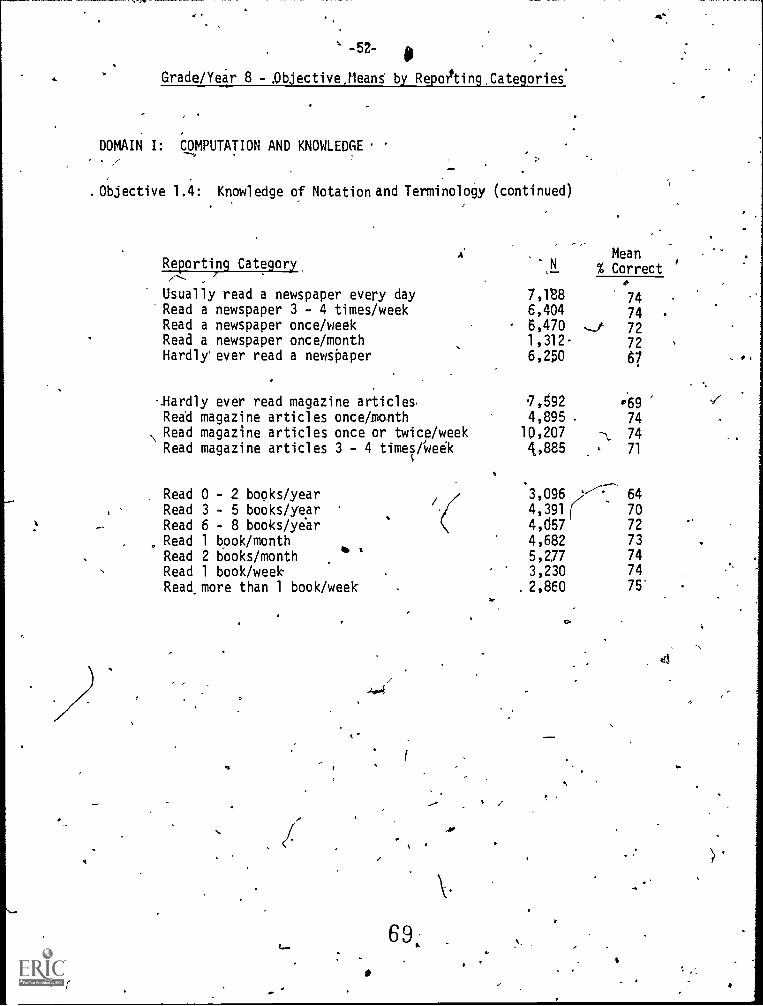
-52- e
Grade /Year 8 - .Objective,Means by Repdting.Categories.
DOMAIN I: COMPUTATION AND KNOWLEDGE
. Objective 1.4: Knowledge of Notation and Terminology
AReporting Category
(continued)
-
NMean
% Correct
Usually read a newspaper every day 7,188 74Read a newspaper 3 - 4 times/week 6,404 74Read a newspaper once/week 6,470 72Read a newspaper once/month 1,312- 72Hardly ever read a newspaper 6,250 61
-.Hardly ever read magazine articles, 7,592 *69Read magazine articles once/morith 4,895 - 74Read magazine articles once or twice /week 10,207 1, 74Read magazine articles 3 - 4 times/week 4,885 71
Read 0 - 2 books/year 3,096 64
Read 3 - 5 books/year 4,391 ( 70Read 6 - 8 books/year 4,d57 72
Read 1 book/month 4,682 73
Read 2 books/month14.
5,277 74
Read 1 book/week 3,230 74
Read, more than 1 book/week .2,860 75'
69,
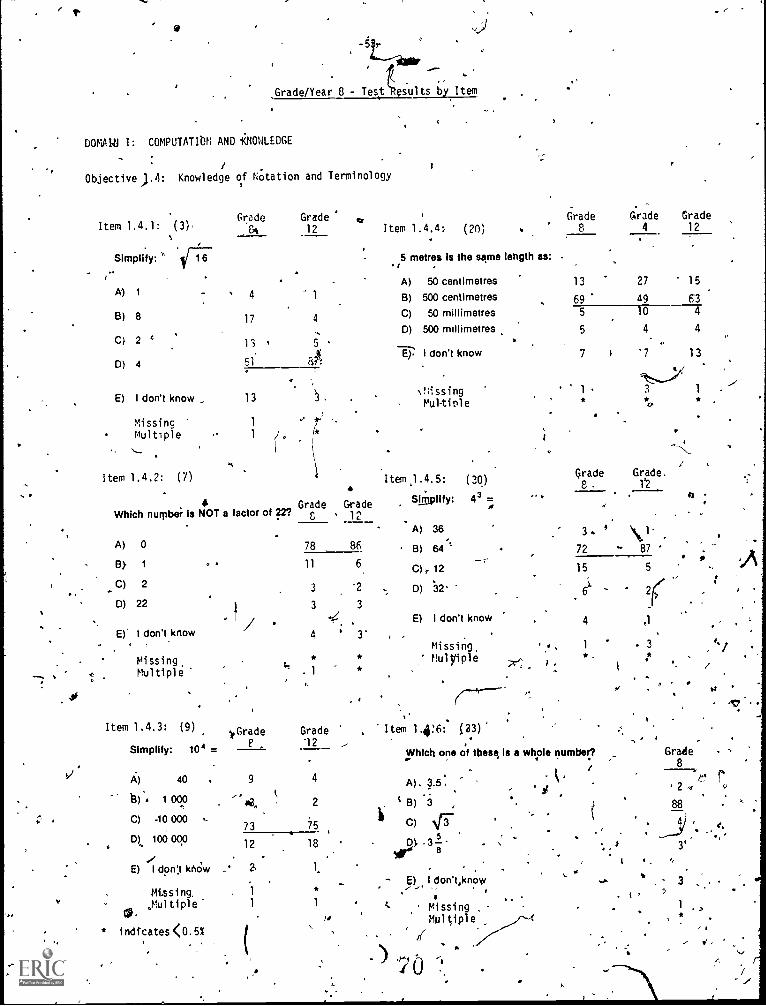
-5
Grade/Year 8 - Test esults by Item
DOMARI I: COMPUTATION AND 'KNOWLEDGE
Objective 1.4: Knowledge of Notation and Terminology
Item 1.4.1: (3)-
Simplify: CIT
A) 1
B) 8
C) 2 4
D) 4
E) I don't know
MissingMultiple
ti
Item 1.4.2: (7)
Grade Grade12 Item 1.4.4: (20)
5 metres is the same length as:tA) 50 centimetres
B) 500 centimetres
C) 50 millimetres
D) 500 millimetres
-13.: I don't know
nissingMultiple
4
17
11 ,
51
1
4
5
aA
13
1
3 ,
Grade GradeWhich numbei Is NOT a factor of 22? E , 12
A) 0
8). 1
C) 2
D) 22
E)' I don't know
MissingMultiple
78 86
11 6
3 '2
3 3
4 3
Item 1.4.3: (9) it Grade Grade
Simplify: 10 12
A) 40 9 4
b) 1 000 2
C) -10 00073
0), 100 00012 18
E) I don't khOw a
Missing,Mul tiple 1 1
indicates <0.5%
Item ,1.4.5: (30)
Sfmplify: 43 =
A) 36,
8) 64
C)). 12
D) 32'
E) I don't know
Missing,Hui yiple
*
Grade Grade Grade8 4 12
13 27 15
69 49 635 10 4
5 4 4
7 F '7 13
1 3 1
Grade Grade.8 , 1°2
3. \ 172 - 87
15 5
2(4 tl
1 3*,
,Item 1.4:6:s 33)
Which one of these, Is a whole number?
Idon't.knoW
Missing ,
Multiple
) .7
e r2 u
1
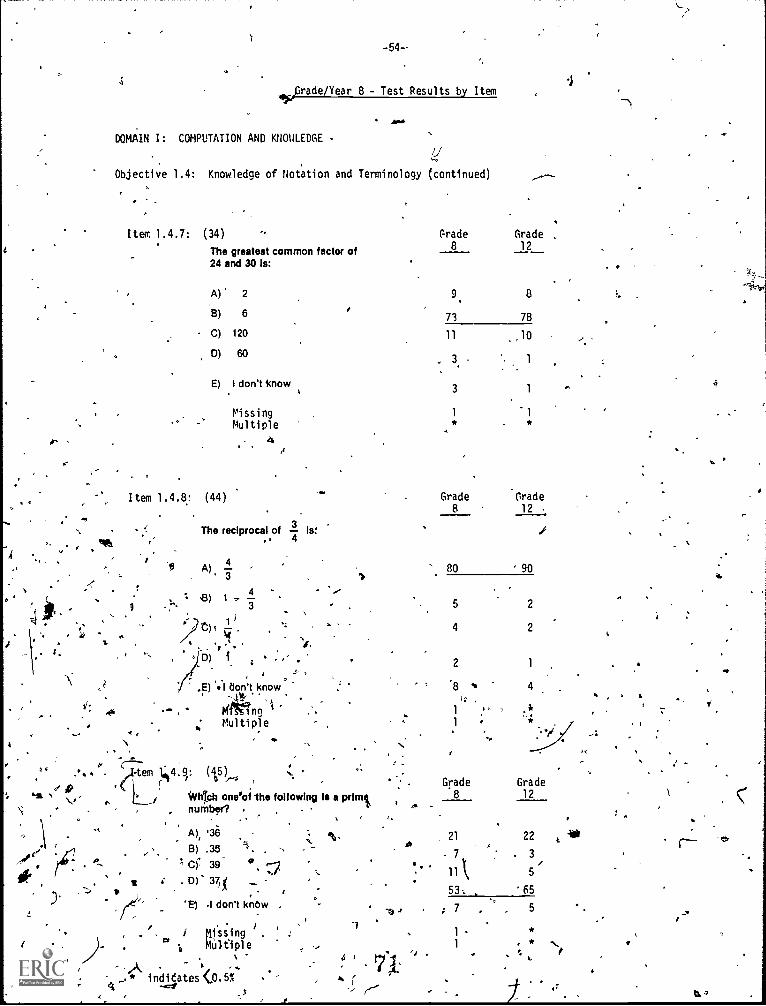
-54-.
gale /Year 8 - Test Results by Item
DOMAIN I: COMPUTATION AND KNOWLEDGE -
U
Th
-
Objective 1.4: Knowledge of Notation and Terminology
Item 1.4.7: (34)
The greatest common factor of24 and 30 Is:
A) 2
13) 6
- C) 120
0) 60
E) I don't know
MissingMultiple
. ,t
OPItem 1.4.8: (44)
(continued)
Grade8
Grade1 2
8
78
.
r,
9.
73
11
3.
3
1
*
Grade
,10
1
-1*
Grade
,
0
The reciprocal of 3
4
.
,E) +1 don't know
gfIftngMultiple
1-tem 1;4.9/. (115)
oneci -the following Is a prim%
8 12
80 90
, number? ,.- A), ,38
ass, , 21 22 411
B) .35 ,- 7 . 3p CC 39 o .z c 4, ' Ilk 5
,
5
4
2
8 4 ,
2
2
I
1
1
Grade Grade8 12
i . . CO' 374v 53: 65
-E-) 1 don't kn Ow.
,
.; 7 . 5
, - i ti_l ssing . , 1 - *
'dr ...,) A. ',.* indidates.0.5%
. .r
, . .s.4 ) Vil 4 ''
..4.
e s .-- . cr 1, Multiple , -- 1
-.73, .3 1-"'" - ,7
r--
eL,
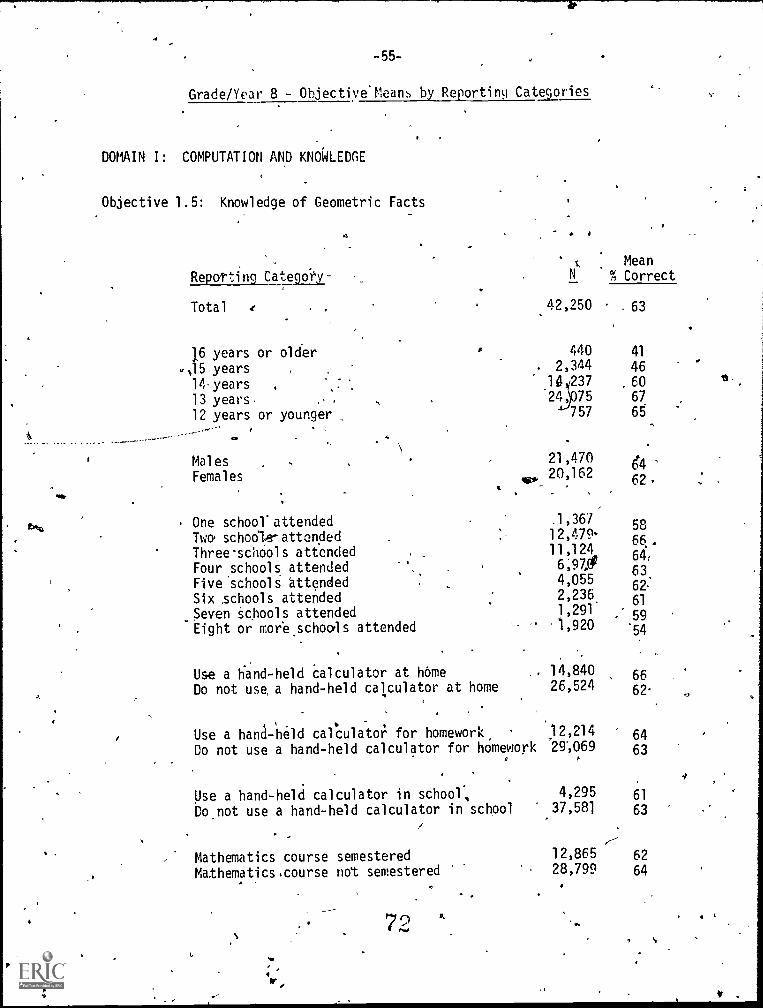
-55-
Grade/Year 8- Objective'Means by Reporting Categories
Mb.
DOMAIN I: COMPUTATION AND KNOWLEDGE
Objective 1.5: Knowledge of Geometric Facts
Reporting Category
t
42,250
4402,344
10 237'24, 75
757
21,47020,162
.1,367
12,47911,1246,97,.4
4,0552,2361,291.
'1,920
14,84026,524
12,21429;069
,
4,29537,581
12,86528,799
Mean% Correct
Total e
16 years or older a
.,15 years .
14, years
13 years.
12 years or younger
MalesFemales
One school attendedTwo' schodle-attendedThree-schOols attendedFour schools attendedFive schools attendedSix schools attended
_Seven c}pools attended
Eight or mor.eschouls attended
Use a hand -held calculator at homeDo not use, a hand-held calculator at home
Use a hand-held calculator for homework '
Do not use a hand-held calculator for hOmework,
Use a hand-held calculator in school,Do.not use a hand-held calculator in school
Mathematics course semesteredMathematics .course not semestered
. 63
41
46
,6067
65
62,
5866.64,
63.
6261
59'54
66
62.
6463
6163
6264
7 9ti
ti
.9
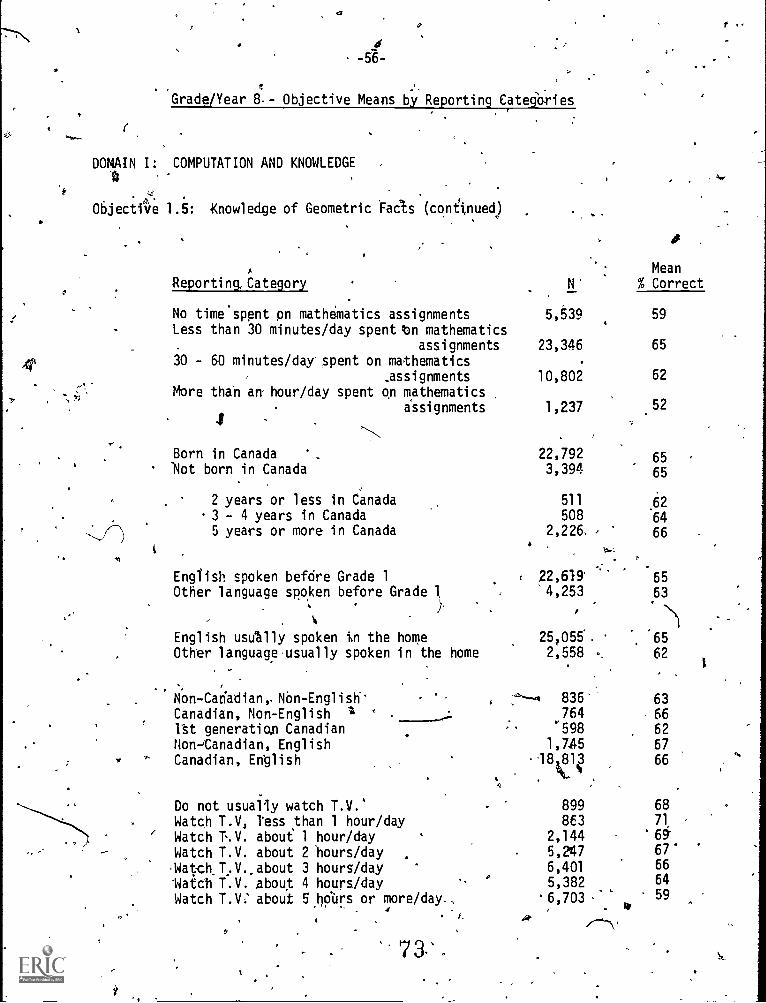
-56- -
Grade/Year 8- Objective Means by Reporting Categories
DOMAIN I: COMPUTATION AND KNOWLEDGE.0
Objecti'Ve 1.5: Knowledge of Geometric Facts (continued)
Reporting, Category
No time'spent on math6matics assignmentsLess than 30 minutes/day spent to mathematics
. assignments30 - 60 minutes/day' spent on mathematics
_assignments
More than -an- hour/day spent on mathematicsassignments
4
Born in CanadaNot born in Canada
, 2 years or less in Canada
.,
3 - 4 years in Canada5 years or more in Canada
4
English spoken befOre Grade 1Other language spoken before Grade 1)
English usually spoken in the homeOther language usually spoken in the home
Non-Canadian Nbn-English'Canadian, Non-English 1 .
l'st generatiop CanadianNon - 'Canadian, English
, Canadian, English
Do not usually watch T.V.'Watch T.V, Tess than 1 hour/day
' Watch T.V. about 1 hour/day- Watch T.V. about 2 hours /day
.Watch_T,V..about 3 hours/dayMatth T.V. about 4 hours/day
,
Watch T.V: about 5bobrs or more/day.,
I
732.
N'
5,539
23,346
10,802
1,237:
0
Mean% Correct
52
59
65
62
22,792 653,394 65
511 62508 64
2,226, , 66' . u...
,
22,6IS 654,253 63
25,055 652,558 -. 62
.:."1 836'' 63764 66
. '598 621,745 67
,-18181
/66
899 68
863 71
2,144 65,247 67'
6,401 66
5,382 64
6,703 ,'*
59
Asr
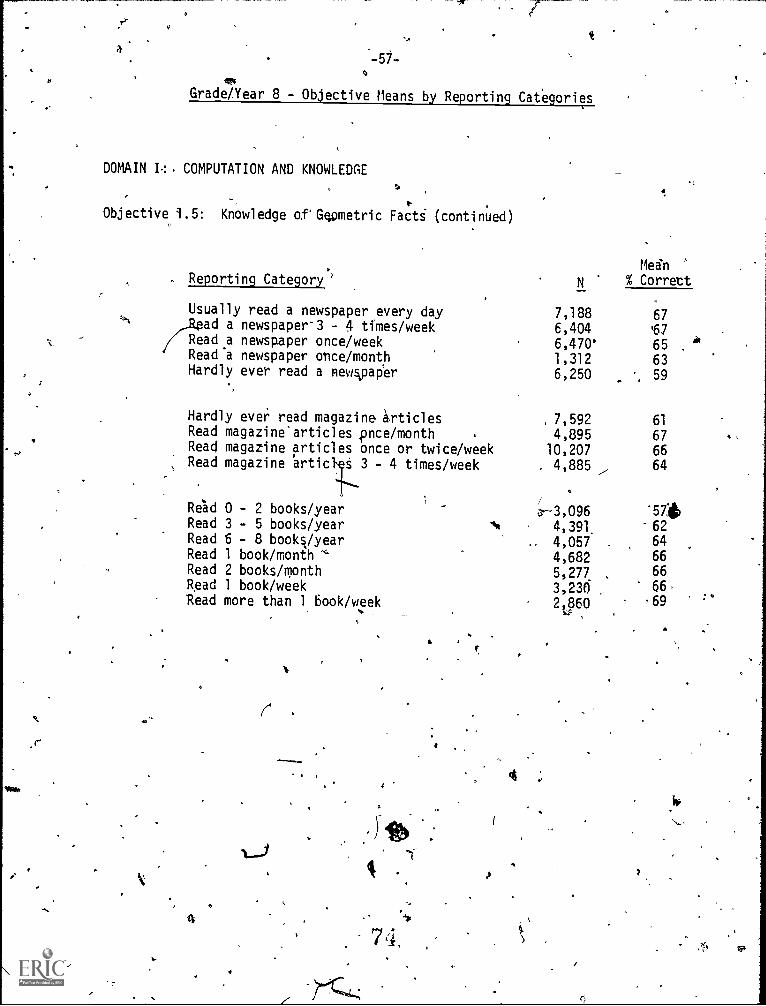
-57-4
Grade/Year 8 - Objective Means by Reporting Categories
DOMAIN I-: COMPUTATION AND KNOWLEDGE
Objective 1.5: Knowledge of' Gwmetric
Reporting Category
Facti (continued)
N
MeSn
% Correct
Usually read a newspaper every day 7,188 67ad a newspaper-3 - 4 times/week 6,404 '67
(-4Read newspaper once/week 6,470' 65 . eRead a newspaper once /month 1,312 63Hardly ever read a newspaper 6,250 59
Hardly ever read magazine articles, 7,592 61
Read magazine' articles puce /month . 4,895 67Read magazine articles once or twice/week 10,207 66Read magazine articles 3 - 4 times/week . 4,885 64
Reld 0 - 2 books/year 3,096 P57.4Read 3 - 5 books/year 4,391. 62Read 6 - 8 books/year 4,057 64Read 1 book/month 4,682 66Read 2 books/month 5,277 66Read 1 book/week 3,230 66Read more than 1 book/week 2,860 -69
r
4
A
I
7
4
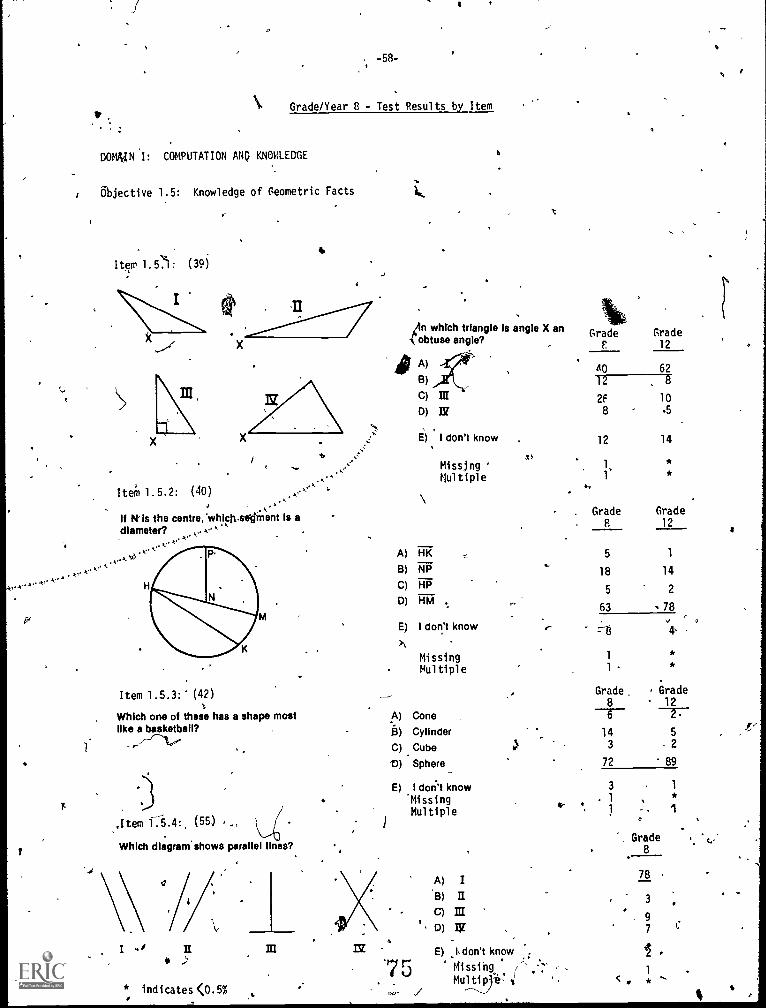
-58-
\ Grade/Year 8 - Test Results by Item
DOWN COMPUTATION AND KNOWLEDGE
Objective 1.5: Knowledge of Geometric Facts
Item 1.5.): (39)
'ten 1.5.2: (40)..k.k
if ft Is the centre:whIckeeri,ment is adiameter?
A''
I
Item 1.5.3:' (42)
Which one of these has a shape mostlike a basketball?
,Item 13.4: (55)
Which dlagranshows parallel lines?,
I S#
* indicates <0.5%
III 13E
;In which triangle Is angle X anobtuse angle?
A)
B)
C)
D)
III
E) I don't know
ISMissjngMul tiple
A) HKB) NPC) HPD) HM
E) I don't know
GradeF.
Grade12
AO 6212 8
2f 108 .5
12
1
14
**
. Grade Grade8 12
5 1
18 14
5 2
63 78v4,
Missing 1
Multiple 1 -
Grade . Grade8 12
14 53 2
72 89
A) Cone
13) CylinderC) Cube
D) Sphere
E) I don't know'MissingMultiple
A) I'13) IIC) III
D) IK
E) h don't know
.75 14i ssi
. Multiiji- 4
3 1
. 14-
3
Grade8
78
3
97
1
0 *
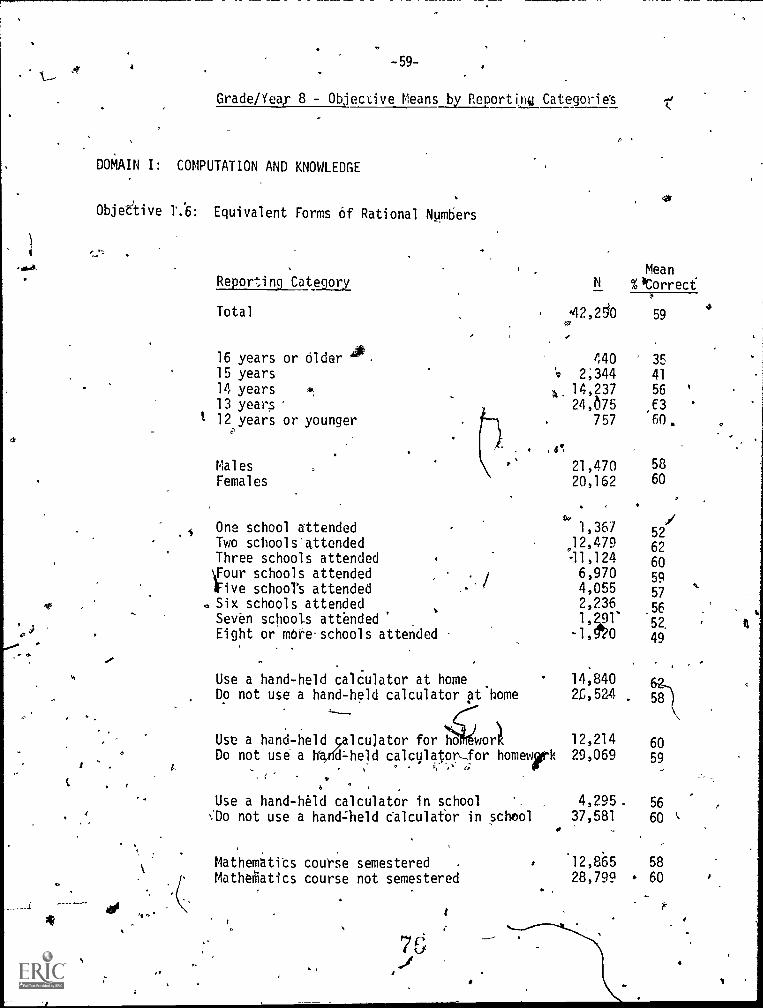
-59-
Grade /Year 8 - Objective Means by Reporting Categories
DOMAIN I: COMPUTATION AND KNOWLEDGE
Objective 1'.6: Equivalent Forms Of Rational Numbers
I
9
Reporting Category
Total
16 years or Older15 years
14 years13 year12 years or younger
MalesFemales
s One school attendedTwo sthools'attendedThree schools attendedFour schools attendedrive schoolt attendedSix schools attendedSeven schools attendedEight or more schools attended
o.
Mean% Correct
-42,240 59 4
440 35
'9 2;344 41
A, 14,237 56 '
24,675 E3757 60.
,4!
21,47020,162
6.
5860
1,367 52I.12,479 62-11,124 606,970 594,055 572,2361,1'
-1,g7o
56
52.
49
Use a hand-held calculator at home 14,840Do not use a hand-held calculator at home 2I;,524
Use a hand-held calculator for ho wort 12,214Do not use a h d=held calculapprfor homework 29,069 59
Use a hand-held calculator in school 4,295. 56
%To not use a hand-Meld talculatOr in school 37,581 60
60
Mathematits course semesteredMatheMatics course not semestered
.12,865 58
28,799 60
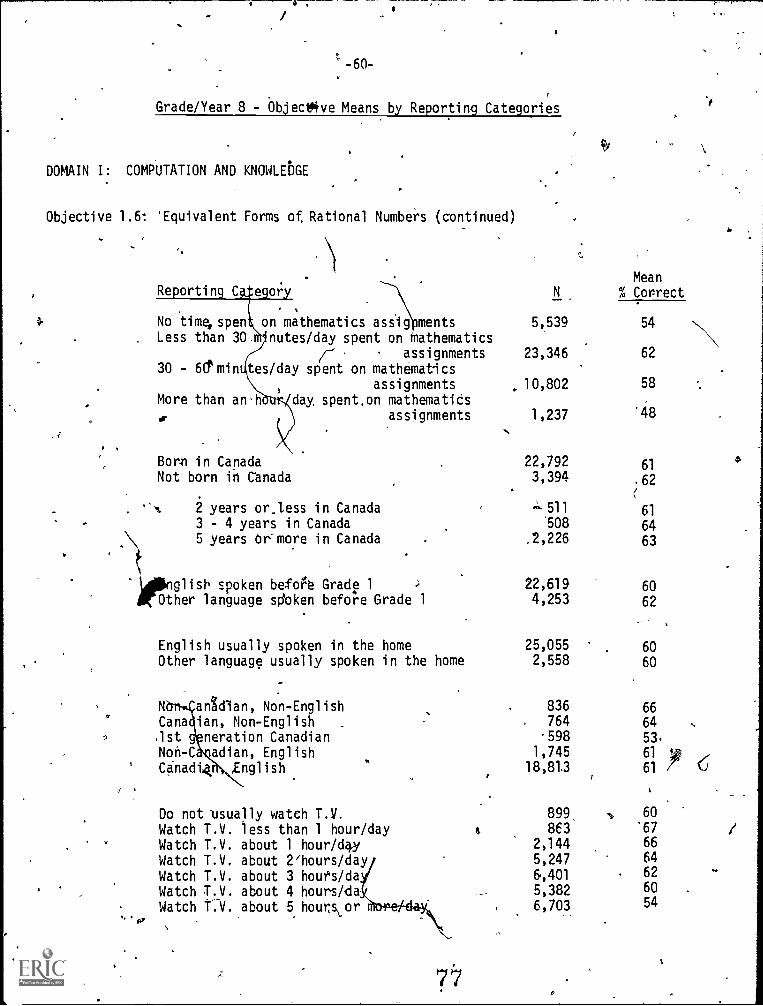
-60-
Grade/Year 8 - Objectilive Means by Reporting Categories
DOMAIN I: COMPUTATION AND KNOWLEDGE
Objective 1.6: 'Equivalent Forms of Rational Numbers (continued)
Re ortin C e or
,
No time,spen, on mathematics assig ments, Less than 30. 'nutes/day spent on mathematics
. assignments30 - 6Cmin tes/day spent on mathematics
assignmentsMore than an-ho, day, spent,on mathematids
assignments
Born in CanadaNot born in Canada
2 years or_less in Canada3 - 4 years in Canada5 years or'more in Canada
Otglish spoken befort Grade 1her language spibken before Grade 1
English usually spoken in the homeOther language usually spoken in the home
N angdlan, Non-EnglishCana ian, Non-English .
1st neration CanadianNon-C adian, EnglishC4nadtk ,English
.
Do not usually watch T.V.Watch T.V. less than 1 hour/day k
Watch T.V. about 1 hour/day
Watch T.V. about 21hours/dayWatch T.V. about 3 houts/daWatch T.V. about 4 hoursidaWatch T.V. about 5 hours,or
77
N
MeanI Correct
5,539 54
23,346 62
10,802 58
1,237 '48
22,792 613,394 .62
-.-511 61508 64
.2,226 63
22,619 604,253 62
25,055 602,558 60
836 66, 764 64
'598 53.
1,745 61 up ,,
18,813,
61 /- Ct
899 .1,60
863 '67
2,144 66
5,247 64
6,401 . 62
5,382 60 .
6,703 54
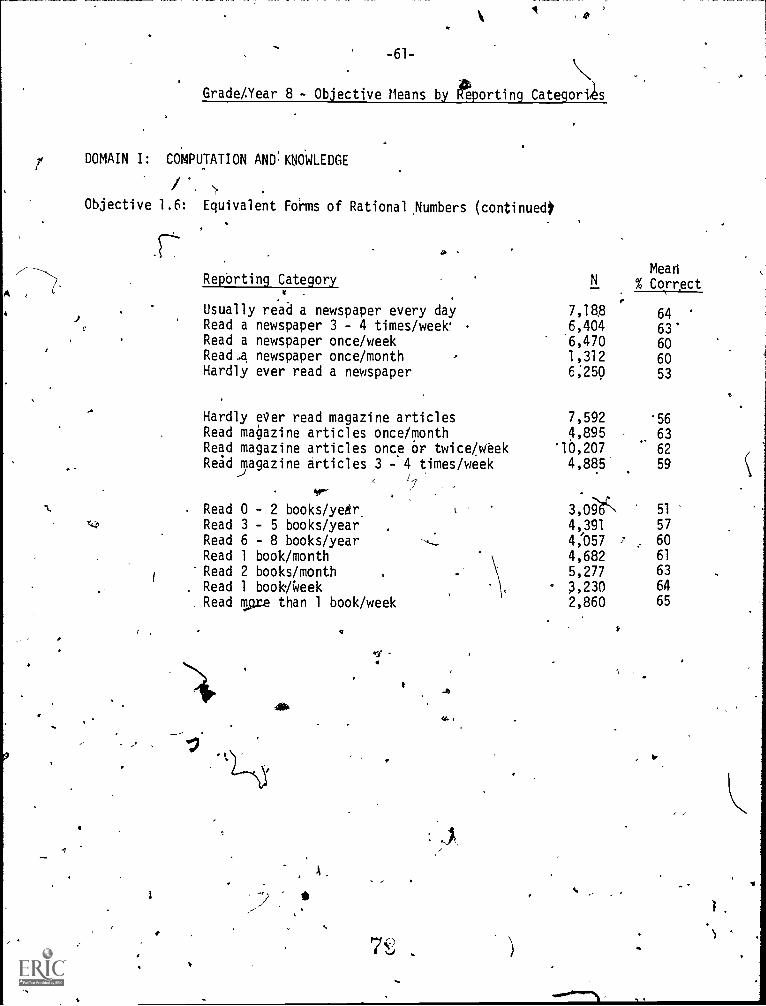
-61-
Grade.Year 8 - Objective Means by Reporting Categori.s
DOMAIN I: COMPUTATION AND4N6WLEDGE
Objective 1.6: Equivalent Forms of Rational Numbers (continuedt
MeanReporting Category N % Correct
Usually read a newspaper every day 7,18,8 64Read a newspaper 3 - 4 times/week° 6,404 63'Read a newspaper once/week 6,470 60Read.a newspaper once/month 1,312 60Hardly ever read a newspaper 6;250 53
Hardly ever read magazine articles 7,592 56
Read magazine articles once/month 4,895 63Read magazine articles once or twice/week '10,207 62
Reid magazine articles 3 -4 times/week,/
4,885 59
1, Read 0 - 2 books/yeeir,17
3,096-N 51
Read 3 - 5 books/year 4,391 57
Read 6 - 8 books/year 4:057 60
Read 1 book/month 4,682 61
Read 2 books/month 5,277 63
Read 1 bookikek ,230 64
Read sore than 1 book/week 2,860 65
P7J
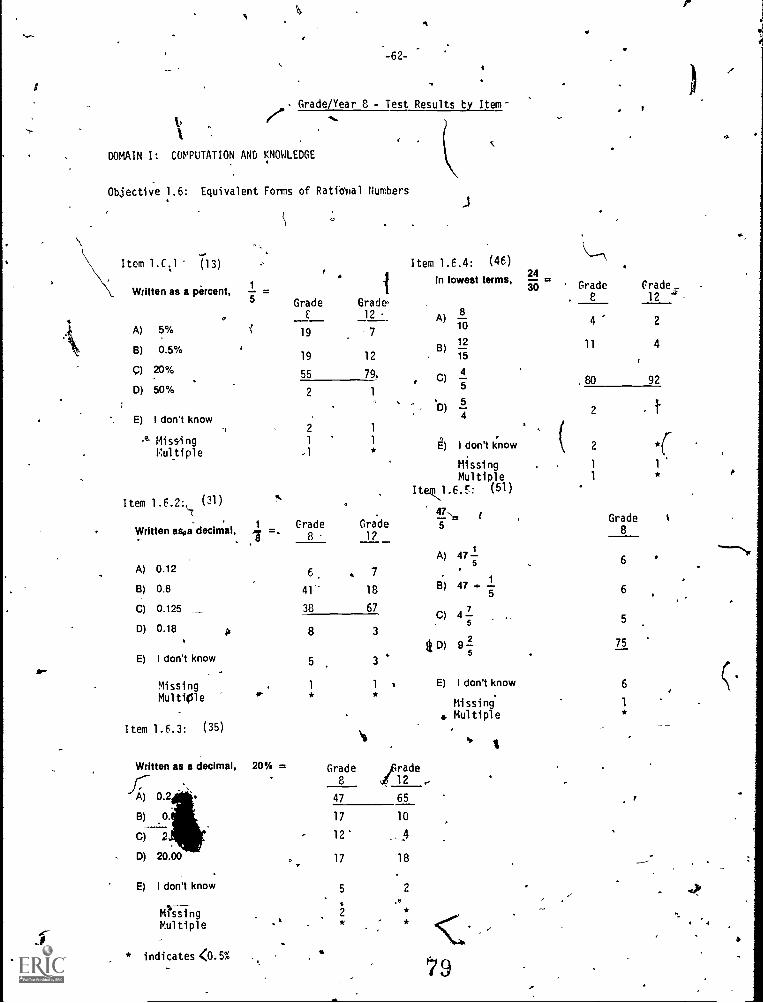
Grade/Year 8 - Test Results by Item
DOMAIN I: COMPUTATION AND KNOWLEDGE
Objective 1.6: Equivalent Forms of Rational Numbers
Item 1 .C..1 (13)
Written as a percent,
A) 5%
B) 0.5%
Q) 20%
D) 50%
E) I don't know
MissingMultiple
Item 1.6.2: (31)
Written asoa decimal,.
A) 0.12
B) 0.8
C) 0.125
D) 0.18
E) I don't know
MissingMultiple
Item 1.6.3: (35)
Written as a decimal,
A) 0.2
B)
C) 2
D) 20.00
E) I don't know
MissingMultiple
* indicates (0.5%
1
5 GradeC
19
19
55
Grade12
7
12
79.
Item 1.6.4: (46)24
In lowest terms,30
8A)
10
12B)
15
4, C)5
5
4
E) I don't know
MissingMultiple
Grade. 8
Grade12
4
11
80
2
4
922
2
1
1
1
1
2
2
1
1 *
ti
Itew,1.6.5: (51)
1 =.a
.-
Grade8
Grade12
1
47'5
A) 475
1B) 47 +
5
7C) 4
5
2D) 9
5
E) I don't know
Missing* Multiple
Grade8
1
6
6
5
75
6
*
6,41'
7
18
67
8
5
1
*
3
3`1
20% = Grade rade8 4 12 .-
47 65
17 10
12' 417 18
5 2
79
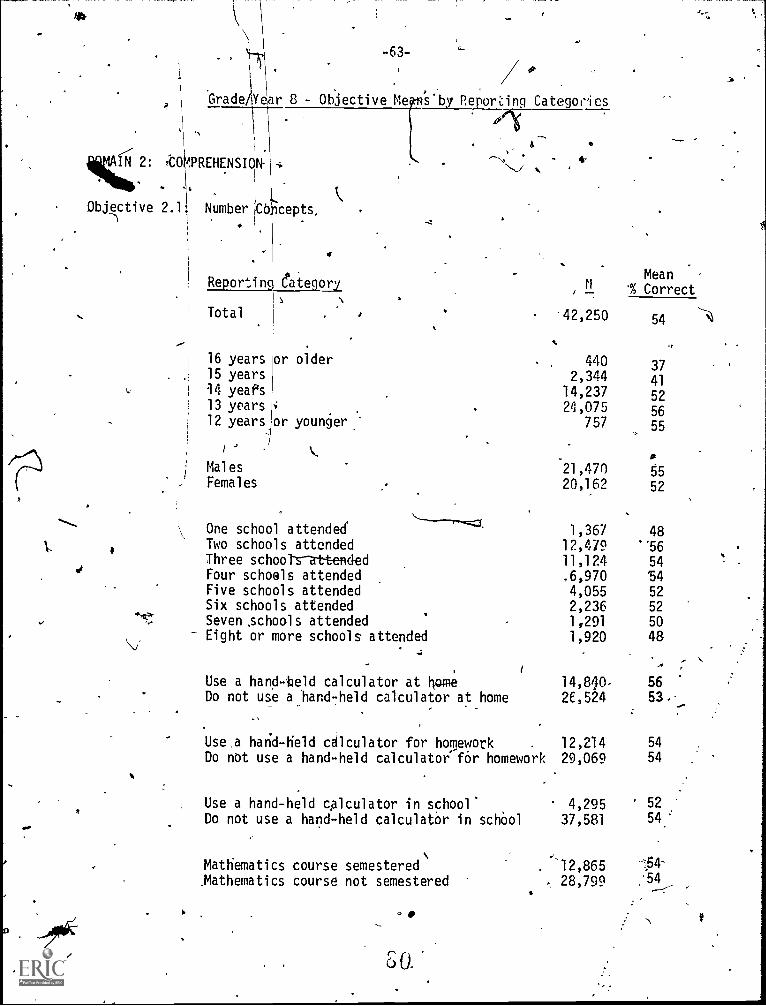
-63-
GradeAY ar 8 - Ob)ective Me by Repor'cing Categories
1;1164 2: ;C0PREHENSION-
Objective 2.11 Number cepts,
I
1
! Re ortin
Total
' 16 years
. 15 years
14 years13 years12 years
MalesFemales
Gate or%
or older
or younger_
mr--1One school attended
.
Two schools attendedThree schools attendedFour schools attendedFive schools attendedSix schools attended
...., .
Seven schools attendedEight or more schools attended
/16
a
Use a hand-held calculator at IlameDo not use a Mand-Meld calculator at home
1,367 4812,479 "5611,124 54,6,970 '54
4,055 52
2,236 52
1,291 50
1,920 48
14,810- 56
2E,524 53,-
21,075757
21,470 5520,162 52
77.
Mean'% Correct
.42,250 54
, 4402,34414,237
37
41
52
56
55
Use a hand-held calculator in school.Do not use a hand-held calculator in school
Mathematics course semestered_Mathematics course not semestered
Use,a harid-Held calculator for homework . 12,214 54
54Do not use a hand-held calculator for homework 29,069
4,295 52
37,581 54 '
. 12,86528;799 .54
S a
f
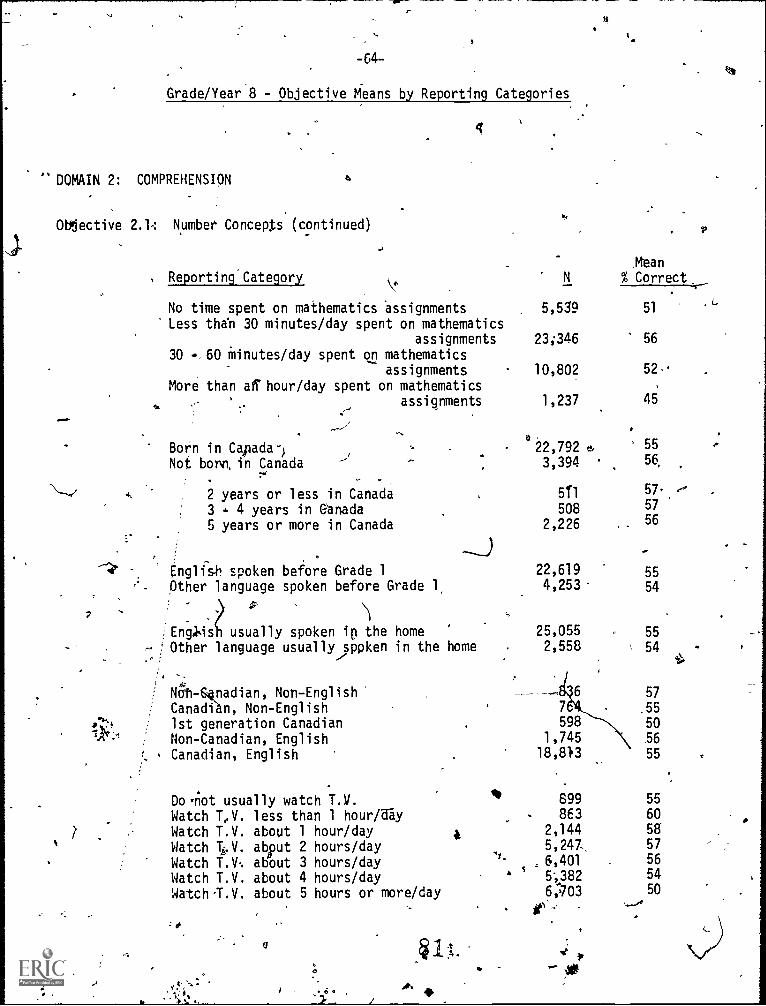
0.
-64-
Grade /Year 8 - Objective Means by Reporting Categories
DOMAIN 2: COMPREHENSION 4
Objective 2.1,: Number Concepts (continued)
ti
, Reporting Category
No time spent on mathematics assignmentsLess tha'n 30 minutes/day spent on mathematics
assignments30 60 minutes /day spent on mathematics
assignments
More than aff hour/day spent on mathematicsassignments
Born in Capada-)Not born, in Canada
2 years or less in Canada3 - 4 years in eanada5 years or more in Canada
English spoken before Grade 1- Other language spoken before Grade 1,
En gl,is usually spoken in the home, !Other language usually spoken in the home
nadian, Non-EnglishCanadi n, Non-English1st generation CanadianNon-Canadian, EnglishCanadian, English
Donot usually watch T.V.Watch T,V. less than 1 hour /ay
Watch T.V. about 1 hour/dayWatch 1.V. abput 2 hours/dayWatch T.V about 3 hours/dayWatch T.V. about 4 hours/dayWatch-T.V. about 5 hours or more/day
a
I
N
. 5,539
23;346 56
10,802 52
1,237 45
,Mtan
% Correct
51.
0
22,792 e,
3,394
511
508
2,226
22,6194,253
25,0552,558
7,598
1,74518,813
IP* 899863
2,1445,247,
6,401
s 5;3826:703
55
56,
57. e°57
56
55
54
55
54
57
.55
50
5655
55
605g57
56
54
50
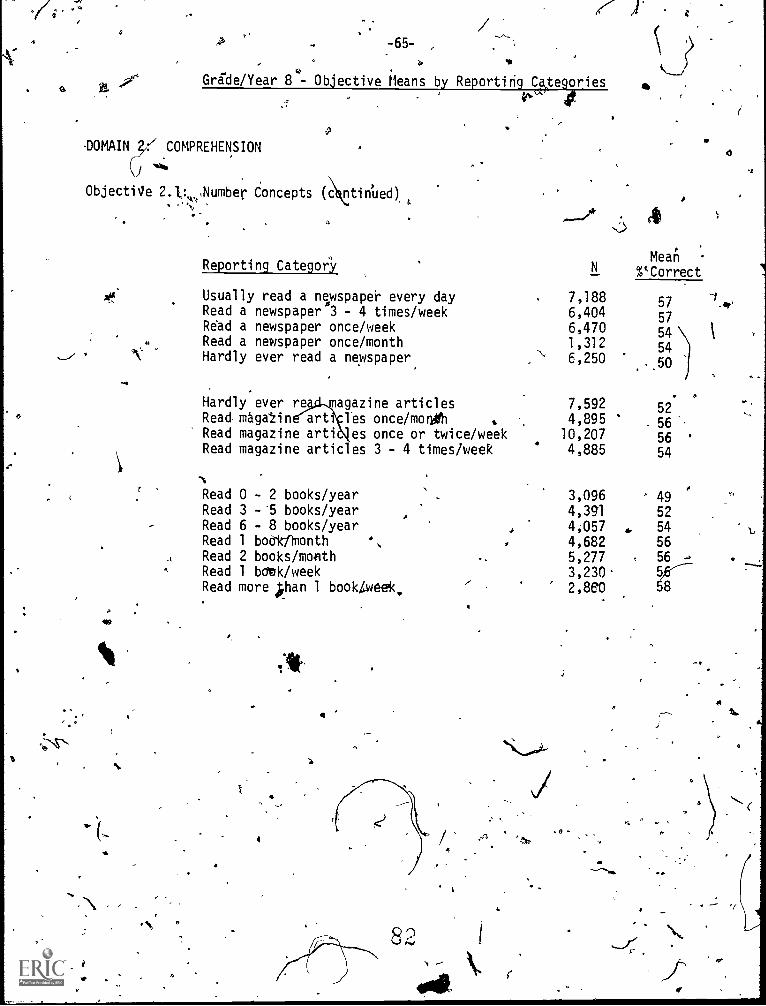
-65- ,
..;"4 Grade /Year 8 - Objective Means by Reporting Categories4,
-DOMAIN COMPREHENSION
Objective 2.1%.,Number Concepts (tinted)
Reporting Category
Usually read a newspaper every day 7,188Read a newspaper °3 - 4 times/week 6,404Read a newspaper once/week 6,470Read a newspaper once/month 1,312Hardly ever read a newspaper 6,250
0
Hardly ever re agazine articles 7,592Read. maga'2in arts les once /morph 4,895Read magazine arti es once or twice/week 10,207Read magazine artic es 3 - 4 times/week 4,885
,
Read 0 - 2 books/yearRead 3 --5 books/year
,
3,0964,391
Read 6 - 8 books/year 4,057Read 1 bootftionth .
, , 4,682Read 2 books /month 5,277Read 1 1:0.0k/week
Read more pan 1 booktweek./
3,2302,860
.
Mean%'Correct
57
57
54
54
50
49
5
8
S
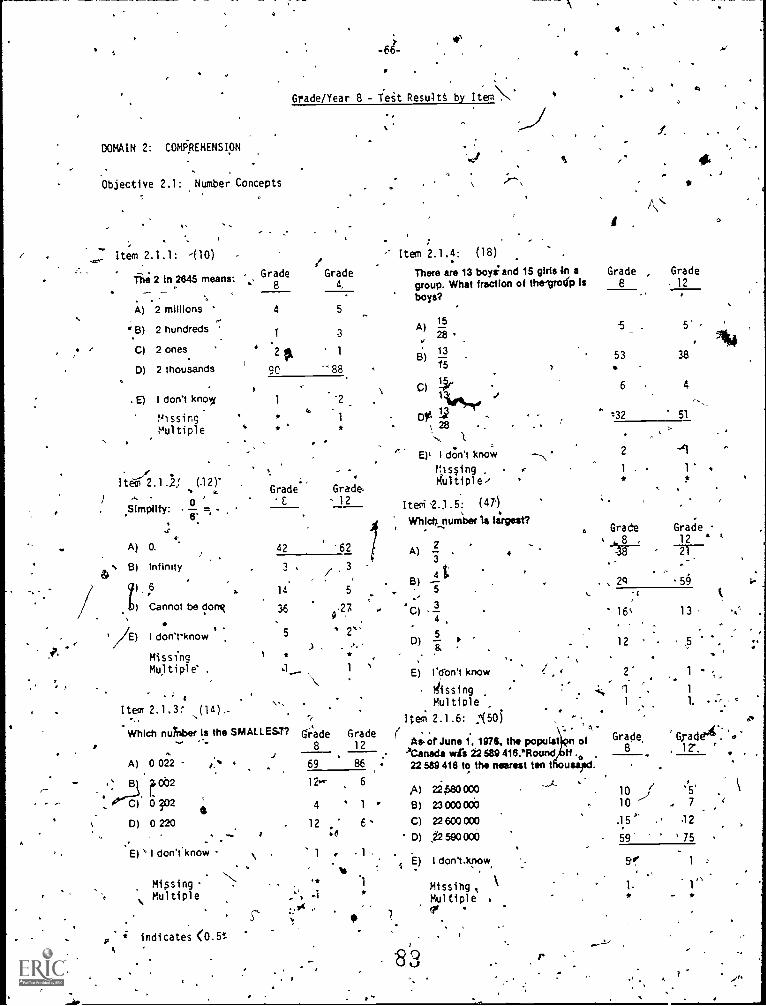
DOMAIN 2: COMPREHENSION
Objective 2.1: Number Concepts
Item 2.1.1: -00)
The 2 In 2645 means:
A) 2 millions
.13)
C) 2 ones.
0) 2 thousands
2 hundreds
E) I don't know
ssi ngMultiple
!tali-2.1.2:: (12)'
Simplify:o =
A)
B)
.0
0.
Infinity
6
Cannot be dorrR
I don't-know
HisSingMultiple' .
Grade8
4
Grade/Year 8 - feat Results by Item\
Grade4,
5
1 3
20, 1
90 -88
1
GradeC
2_
1
Grade,12
42 '62
3 , / 3,
,. 14 5
36027
.
5 2"s
)
1 =
Item 2.1.3:'
Which nariber Is the SMALLEST?
A) 0 022
rb2C) 0 302
0) 0 2204
.E) I don't'know
a 44
Mi3singMultiple
9 indicates (0.51.1,
grade8
Grade12
69 86
12- 6
4 ' 1
12 661 1
r
S
Item 2.1.4: (18)
There are 13 boys; and 15 girls In agroup. What fraction of theirotfp Isboys?
1A)
5
ZS
1B)
3
15
C1 14"1303..ar,
014\ 28
Er I dc3n't know
si ngHulstiple,
Iteri s2.) .5: (47')
WhIcb number is largest?
A)2
.3
8)5
3C)
0)
4
50
a
E) I'dOn't know
PissingMultiple
Item. 2.1.6: °(50)f'
.5 '9"
As, of June 1, 1976, the palmist ofCanada will 12 589 416 "Round ff .022 589 418 to the nearest ten t usapd.
J
Grade8
, Grade12
-5 . 5'
53
638
. 4
=32 51
2
1 ,
. Grade Grade, 12
. 2g 59
44
A) zigeomo
B) 23000000
C) 22 600 000
0) &soma
E) I don'tknow,
Missibg 1
Multiple .q
r
16 1 3 ' 5
12 ° 5
2' 1 -
11 1,
Grade,8
'Grade4. d''
10
.
5'
10-3
7
.15 .12
59 ' 75
1. 1"
, ?
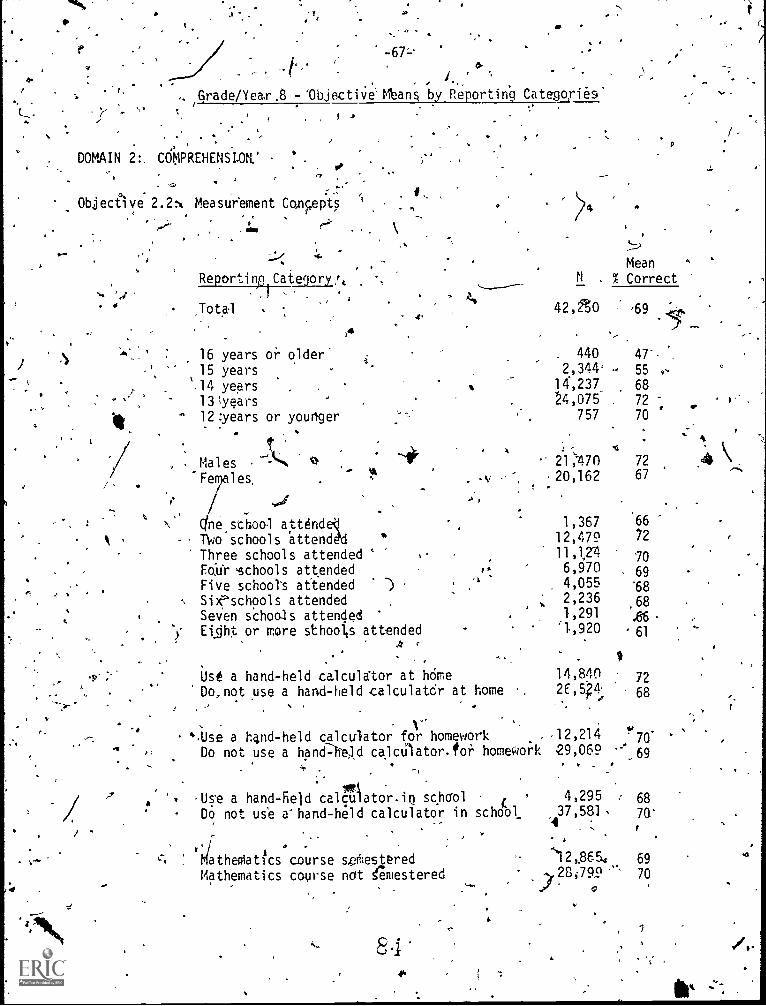
t
-67--.
Grade/Year8 - 'Objective'Mbans by Reporting Categories'
.
DOMAIN 2:. Cdt1PREHENSLON.'
Objecilve 2.2h Measurement Concepts '
4
/
s
s
r.`' , i r;-. .
Reportine Category!,
-
Mean
N % Correct
44,
,Tota4.
16 years or older15 years
42,n0
440
2,344...
.69
47'
55
.14 years 14,237 68
13 years 24,075 72
12:years or younger 757 70
. 4
. Males 2.1;1170 72
Ferles. . .v 20,162 671;
/..01
'66\ One, school attende 1,367
-- Two schools attended 12,479 72
Three schools attended 11,124 70Fo:dr schools attended
-Five school's attended -)
6,9704,055
. 69
'68
Sischools attended 2,236
Seven schools attended 1,291,68
.66
Ei.ght or more shoos attended '1,920 61
list a hand-held calculator at horse 14,840 72
Do. not use a hand-held calculatdr at home 2C,5. ?4 68
`.Use a 4nd-held calculator for homework .12,214 ?70-
Do not use a hand=he,ld calcUlator.for homework 29,069.
. .
lti,-Use a hand-field calculator.in schoolDo not use a-hand-held calculator in school_
'itiatheffiatics course s.cMesttred
Mathematics course 1-Icit lemestered
t-
24a
4,295 . 6837,581, 70
A
'12,.8654 69
..,28;799 70
lir -"-:
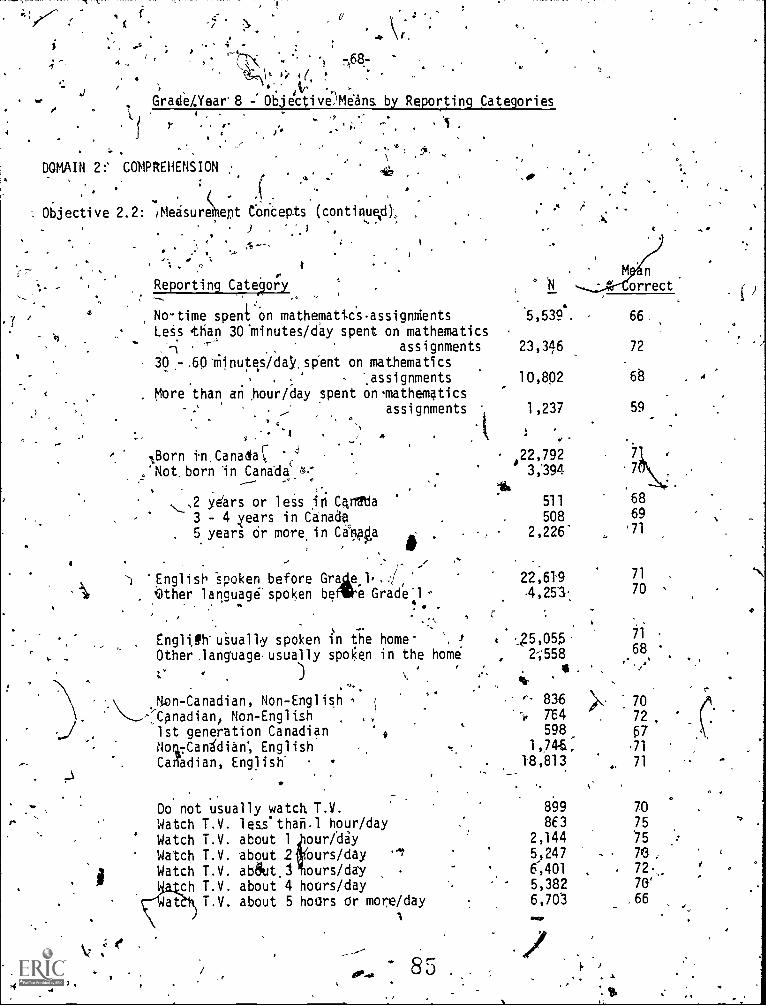
'
, t(
...,S ;
44 _ k 1 7,,68.-
. 1, 4 (.... / % toa, .. , ..,
... Grade /,Year' 8 -, Objective,,Means by Reporting Categories.
.1 .
I ., ,,, -r . . ,.
"MP
J
:. , . ..DOMAIN 2:' COMPREHENSION ...
.
..
. (_ "(
. ,
..
Objective 2.2: /Measurement Concepts (continued),,
.4
Reporting Category
No-time spent on mathematsassignMentsLeSs than 30.minutes/day spent on mathematics
'' assignments30 ,.- .60 Illinutes/d4r, spent on mathematics
, assignmentsMore than an hour /day spent on Tiathematics
, 4assignments
. 'A
, --
.Born ii,Canalac 'c4
Not, born In Canada 4.- ..-
"'---- -
2 years or les'in Catba3 - 4 years in Canada5 Or more in Canogayears
?" 41
.,
) --
--1 English Spoken before Grapie. 1 , .f
e;Other language' spoken befilis Grade'l -
,
! .
Englith' usually spoken i:
n the home- ', /
Other lanpage usually spoken in the home,
\.
,
A`
,
..
"ton- Canadian,an , Non-Engl ish.
-Canad i an, Non - English , 1
1st generation Canadian #
Notl:Ca nd i an', English ,
Canadian, English.ng) i s h.
Do not usually watch T.V.Watch T.V. less' thaii.1 hour/day
Watch T.V. about 1 our/day
11(
Watch T.V. about 2 ours/day ''',
Watch T.V. abijut.1 ours/daych T.V. about 4 hours/day
T.V. about 5 hours or more/day1
8 5 .
, .
.
*5,5394. 66 ,
23,346 72
10,802 68 A
1,237 59
,22,7923;394 7
511 68508 69
2,226 '71
22,619 71 ti
-4,253 70
t ....5,055
, 2-;558
*
e-,-
'
836.. 7'64
598
1,746.:
18,813
899863
2,144
5,247
6;401.
5,3826,70'3
.
)k :
71
68
70
72
677171
70
75
'75
76,72._70'
66
r
.:
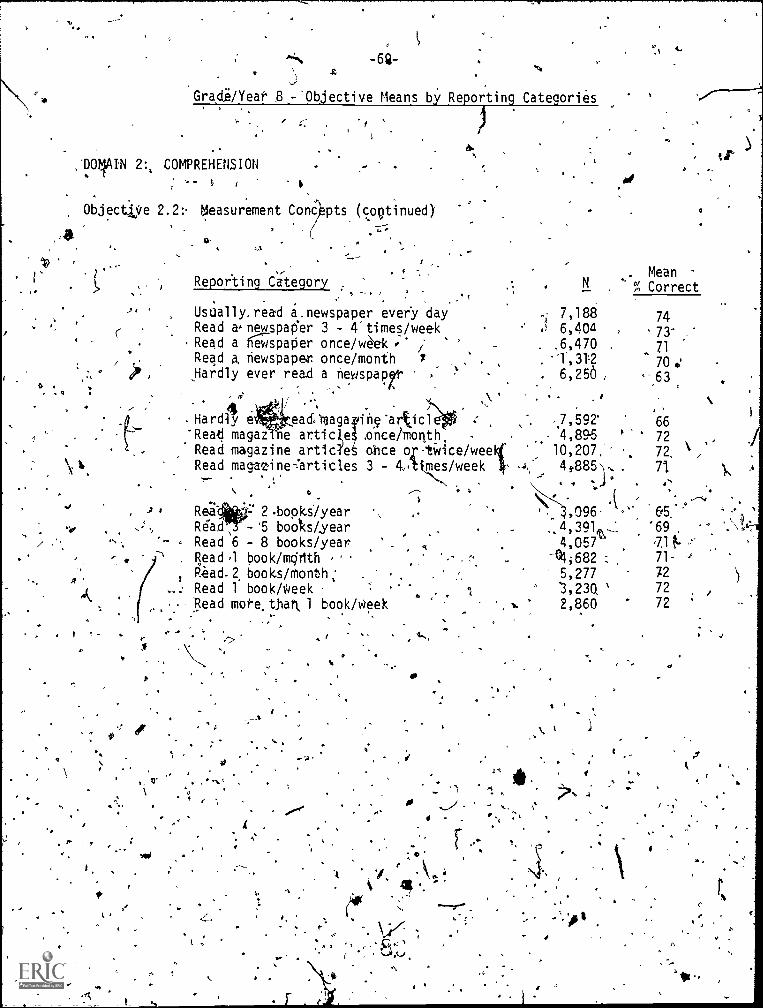
v*
0. .
: -6-- il- .
,4
J..
.
Gradi/Yeat 8 ,-'Objective Means by Reporting Categories
)
a
DOMAIN 2:, COMPREHENSION
Object:tie 2.2: Measurement Cone (coQtinuedY
. I
.'
Reporting Category .
'
Usually. read a, newspaper every dayRead a. nelopap'er 3 - 4' times/week
Read a keWspaPer once/v4ek jRead a newspap6r. once/month
Hardly ever read a newsPair
Hardl 6,i, eacPmaga 4ing-articl :
'Read magaz ne articke knee/month, ..
Read magazine artic'e ace or Iiiice/weeltRead magazine-:articles 3 - 4,:tiges/week 4, .4,
.1404.
Rea 2 booksiyearRead, - '5 books /year
Read 6 - 8 books/year. Read .1 book/m(14th
Read- 2 books/month.,: Read 1 book/Week "
- Read mof-e, thak 1 book/Week
4'r
0' . `N.',
i
I
.
,
0
. Mean. % Correct
.; 7,188
d 6,404,6,470 .
1, 3i2
6,256
74
73-
71
70 6.
63
66
4 '
4,896 ' 7210,207, 72. ,
40385), . 71
,O96.
4,3914,057'1
-04,682,
5,277
2,860
$
1
0 -,
k al,.(
c4/ 1
J1 "LIA
,
r
&5.
'69
71- ei
72
72
72
4
I
.1
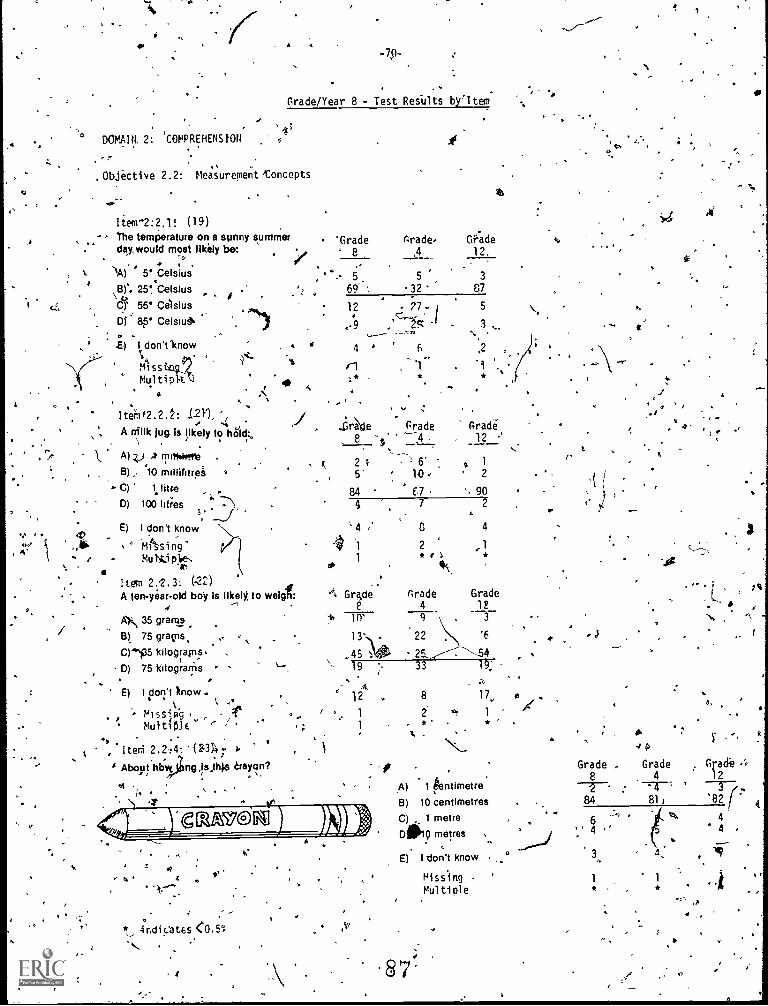
V
V fO,
1 4'
4'
- A
.
Grade/Year 8 - Test Restilts bYItem
DOMP,Itl, 2: 'COMPREHENSION;
- r
Objective 2.2: Measurement -toncepts
Iten'2:2.1 ! (19)
64 The temperature on a sunny summer 'Grade Arade Of:adeday, would most likely be:
sr- ' 8 4 12,
i `1A) 5' Celsius 5.
3
Br. 25! Celsius 69 , 32 87
12 27- 1 5
.- 9,_15' .1
. 3t
.,.- ...- '-' ,,
E) I don't `know 4 t 4 ' 6 ,24,, ..
14'!'ii ss tan cl I'. iMu) tiplt. ' it 1* * *
' *
C) 55' CelsiusD) x 85' Celsius.
Itehi#2.2.L S211,.0
A Milk Jug Is likely to hold:.
A) vB),. '10 millilitre;C) 1 litreD) 100 Hires
E) I don't know
Mihing". Mu iNti 1511eN
in
.
c
, .
Lra,e Grade Grade.8 2 _12
2; 6' ; q 1
2
84 C7 ' 904 7 2
8 4
2 1
*
Item 2.2.3: ( .22)
A ten-year-old boy Is
AN 35 grams
B) 75 gracris.
C)"135 kilogfainsD) 75 Kiiogranis ,E) I don't know .
4
tAlssin -
Multi01 '
-
-1
"i°//
to weigg:
,
...
;
(
Gr4de trade4
Grade12
'6
10'
13'\,45
22
19
A12
1
1
4,
,
33
8
2*
1§;
17
1
*,t.
Item 2.2:4: (23 7 .._,, . - ,.
,' About hbw ng.Is.th}s crayon?
1 i
* indicates CO.S=y
-11
A) 1 centimetre
B) 10 centimetres
C) , 1 metre
DOW metres
E) I don't know
HissingMultiple
87
rs,
Grade Grade Gract8 4 12
84 81 '82 (
4 e4,..
464
4. yq
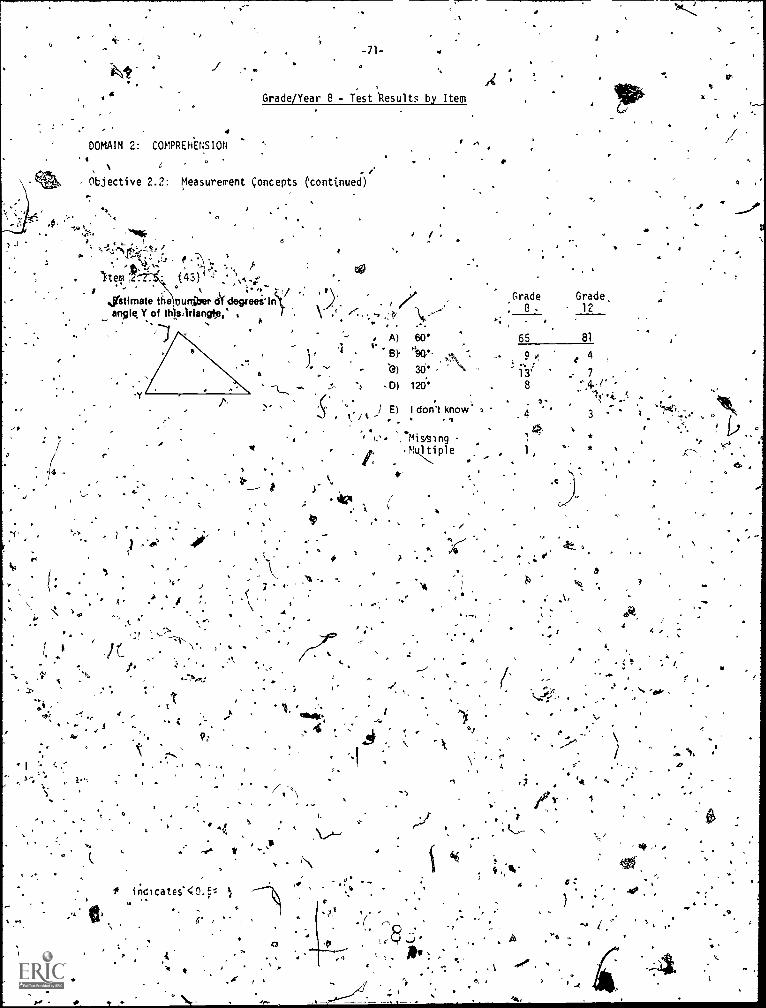
-71-
-s
4 Grade/Year 8 - Test 'Results by Item
DOMAIN 2: COMPREHENSION
Objective 2.2: Measurement Concepts (continued)
.1
e, . -,
. IteT "I'.'`... : (43), ',6 ,00
, . .
: '''"-.
. ,. s/ ; I
estimate the ounPaer of degrees'Int.S.,
- rGrade
- . 8 . 12./Grade
angle. Y of th sArlangfp, .
, ,. .; . .. ,
- A) 60' 65 81
l' - 'BY Imr
13'
e 4
'0) 30' ... !9 o,
i- '> .D) 120' 8,4./. .
lri. !,1,
..) , ,:/1j E) I don't know' .:. -
43
k., , Missinga ,
*.
-, . FILQsti p 1 e 1 *
f..
a-
r
r
o ,
1
,A
.
.:!, -1-
-g.m.
-s .f.; . - .
S
'04 ,e ;
5.4,- .
,
0
'
0,
5
A
*
,4
-4.
6
indica4es.
.4'
It 4
N.e
(4,
1 4
o
I4
411
A,
.4
k.
a4
\,
e,
4. I.',
bit,4
a
A
r
;.1/0
Sb ,
\
=4*
'o
14
.
V
.9
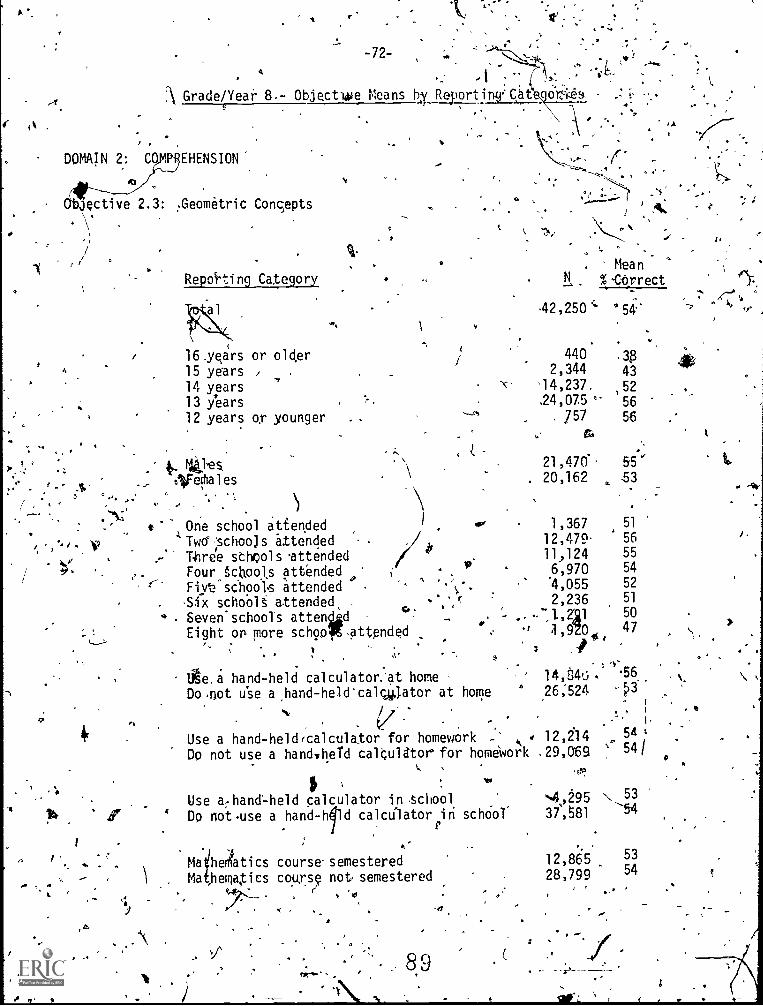
r
A
-72-
-1A Grade/Year 8.- Objectwe Means by Reportintr cat
DOMAIN 2: CO
1
O
(
/
EHENSION
Active 2.3: ..Geometric Concepts
V
.4r
(t.
Repoi-ti ng Category
16 .years or older
15 years /
14 years13 !ears
12 years or younger
flees.
tVeftbales
t' One school attendedTWO' ''schooa s attended
Thrde sthQols .attendedFour,,f,sttool,s attended
Nye schools attended-Six schools attended, .
Seven'school-s atten d
Eight or, more schop. .attended-
4
/)
?,"
Cr ' °
&4,
tge. a hand-held calculator,at homeDo not u'se a hand-held'calqyjator at home
Use a hand-held(calculator for homework -' 12,214
Dp not use a handvheid caltulator for homework 29,069
00e9
h.
r).
se _
. MeanN %.Cbrrect
:
.42,250 *54"
440
2,34414,237.,24,07.5
, 757
3{3
43
,52
56
56
21,470 55'20,162 53
1,367 51
12,479 56
11,124 55
6,970 54
'4,055 52
2,236 51
-.11,221 50
4.1 4,970. 47
;
14,84,;.'
26;524 fr)3
-.t
54 I`. 54/
°
Use a:-hand'-held calculator in ,school4
Dp not fuse a hand -hold calculator ri schOol.
..-
Maiheltics course semesteredMa ,hematics cousrs not semestered
v
N 53
37,581 54
12,855. 53
28,799 54
I
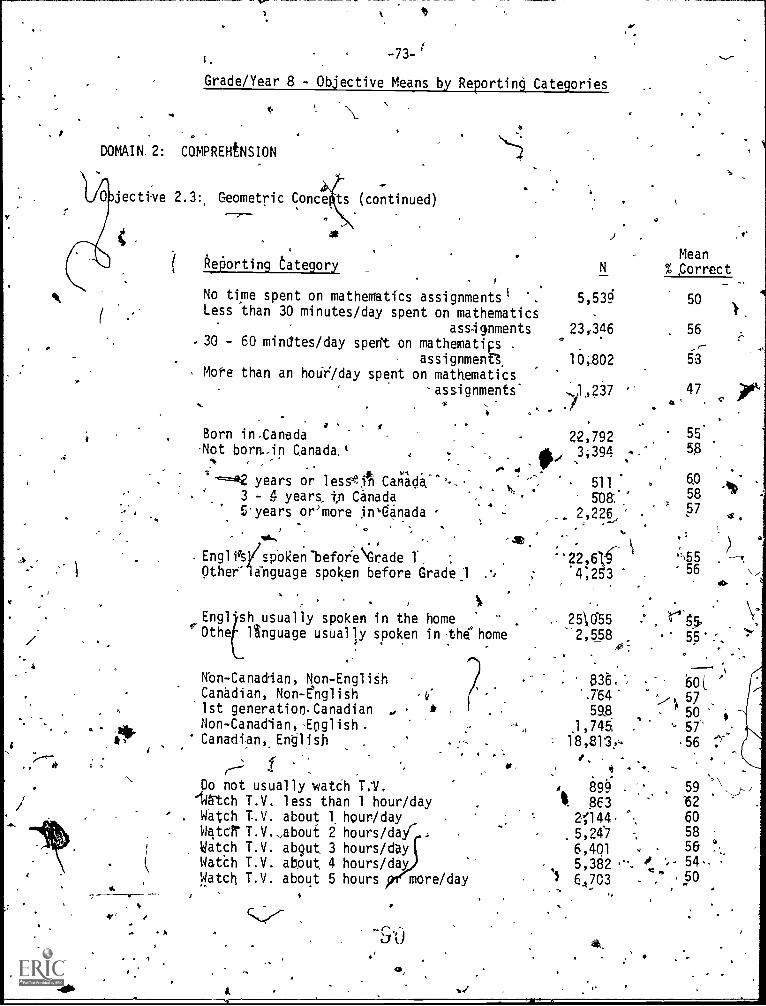
-73-
Grade/Year 8 - Objective Means by Reporting Categories
O
DOMAIN 2: CQMPREHPNSION
Y
jective 2.3:, Geometric Conce (continued)
( kefiorti ng Category
V . .No time spent on mathematics assignments _
Less than 30 minutes/day spent on mathematicsass-ignments
- 30 - 60 minutes /day spent on mathemati .
ssignmentMore than an hou-Oday spent on mathematics
..assignments'
,, .
Born in Canada,
-Not born.,in Canada., 4 -,s.,,,,
years or lese:t1) Cana '. 1,,3 - 4 f,n Canadayears.
. .- . 5'years or'more fnuganada..
....' Jio.
A A
.
Engli?s(spORen-befor'e\Grade 1', ',
Other' aliguage spoken before Grade.:1 ..,
MeanN % Correct
5,530 50
23,346 56,-
a 16;802 53
..1,,237 '. 0 '
47 )0K
22,792 55.
_3;394 -.° 58
6,0. 511 .58506....
2)22.6_, ,57 4*..
),-,
z-22,61'9 :'\554;261 56 \)
4.
English usual ly spoken in the home 250-55 rig.5.Othe Inguage usually spoken in .the home 2,558 - 55:.
Kon-Canadlan, Non-Engl iShCanadian, Non - English te"
1st generation-Canadian , * .
Non-Canadian, InglishCanadian, English
Do not usually watch T.11.-14atch T.V. less than 1 hour/day
. Watch T.V. about 1 hour/dayT.V.,about 2 hours/da,{
Watch T.V. abgut 3 hours/dayWatch T.V. about, 4 hours/dayWatch T.V. about 5 hours more/day
,: 836,-, 60.
'-764 it 5759.8 , r 50
.1,745 .4 '.. 57"18,81'3,4 .56
, . 59 ;`,,,)/11. 863 '62
2.;144, 605,24'7 -, 58
6,401 , 56 c.i..
5,382 .'-_ 0 '-- 54 :,, .,703.7- 50
- of
Grade/Year 8 - Objective 1eaA.6/ Reporting,Categories
DOMAIN 2: OMPREHENSON
4
Objective'2.3: Geometric Concepts (continued)
a
Reporting Category
^
4.1 Usuallxread a newspaper eve\r)day.Read 'hewspaper 3 4 times/week.Read newspaper once/week
'Pea a newspaper:Once/monthdly ever read,a newspaper
/
Hardly eGer read magAzine artiRead magazine arti6let.once/month
- Mad magazine article's' once..or twice/week
Read magazine p7tjcles,3 - A, times/Week,,
f'ilw,
,Read 0 -. 2 books/year c
! .Read 3,7, 5 books/year .
Read 6 - 8 bo6ks/year-Rad 1 bo9k/month
,
. Read 2 books/month. VRead 1 bggic/week-,
.
'i
Read mOrrthan 1 bukiweek.
..
\, ...
. . 1
...
-
O r.. 1
A
V MeanN Correct
7,188 57
6,404 57
6,470 56
1,312 54
6,250 50
7,592 51
4,895 57
10,207 57
4°,885 55 . ;
3,096 49
4,391 °53
4,057 2 ,
4,682, .56
5,277 57
3,230 t 58
2 860 ,58
I 4.
110
r 04.
cl
4
.i
Cy
ti
91.
1
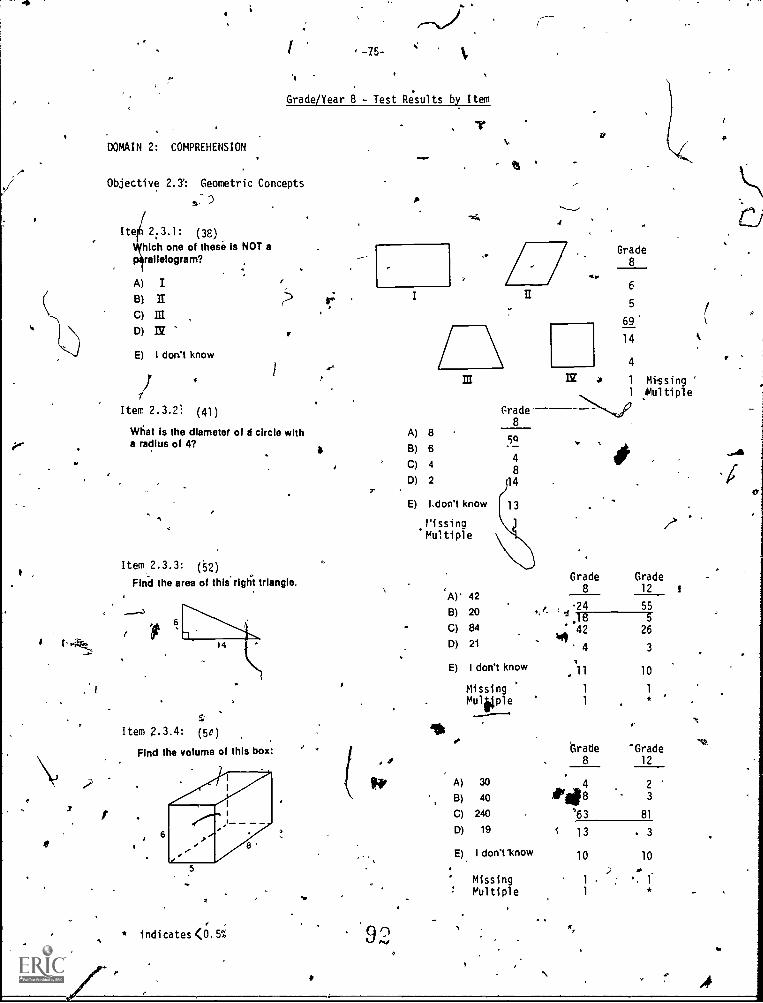
e
-75-
Grade/Year 8 - Test Results by Item
DOMAIN 2: COMPREHENSION
Objective 2.3": Geometric Concepts
Iteil 2:3.1: (3E)Which one of these is NOT a
rallelogram?
E) I don't know
Item 2.3.2: (41)
What is the diameter of a circle witha radius of 4?
Item 2.3.3: (52)
Find the area of this.righi triangle.
t* 14
Item 2.3.4: (5e)
Find the volume of this box:
* indicates <0.5i
I
I
III
A) 8
8)
C) 4
D) 2
E) ',don't know
rissingMultiple
*
IY
Grade8
6
5
69
14
4
1 Missing '
1 41ultiple
8
Grade Grade8
A)- 4212 t
B) 20 '`f. I,i' 55
C) 84 425
26- WID) 21 4 3
E) I don't know ,1 1 10
Missing 1 1
Multiple 1 *
Grade 'Grade8 12
A) 30 4 2
B) 40 #1111 8 3
C) 240 '`63 81
D) 19 13 3
E) I don't 'know 10 10
..)
Missing 1 : '.1
Multiple 1 *
A
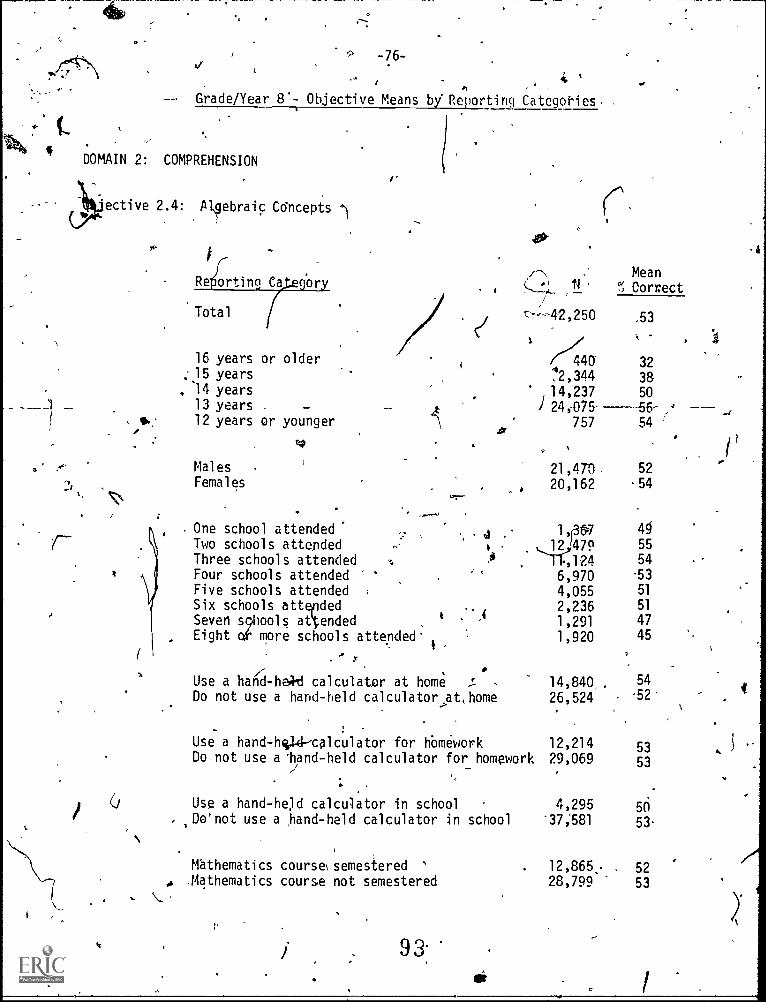
-76-
Grade/Year 8.- Objective Means by Reporting Categories
DOMAIN 2: COMPREHENSION
ective 2.4: Algebraic Cdncepts )
P
t
/--\ MeanResorting or ('; Correct
r.-.;-42,250 .53Total
16 years or older.-15 years
14 years13 years
lb: 12 years or younger
a
MalesFemales
.r
. One school attendedTwo schools attended ..,
Three schools attended -.A
Four schools attended , ,
Five schools attendedSix schools atteindedSeven s lools attended . '4
Eight more schools attended'1 ,
y
/'Use a hand -hard calculator at home sDo not use a hand-held calculator at
k
home
Use a hand-hq14--calculator for homeworkDo not,use a'hand-held calculator for homework
Use a hand -held calculator in school
Do'not use a hand-held calculator in school
Mathematics coursesemestered '
A Mathematics course not semestered
9 ,3.
a
.
440 32
$2,344 38.
,14,237 50
/ 24,-075- ---56-
757 54
21,470. 52
20,162 54
1, 41
12 479 55
,124 54
6,970 '53
4,055 51
2,236 51
1,291 47
1,920 45
14,840 ,54
26,524 '52.
12,214 5329,069 53
4,295 56'37;581 53.
12,865. 5228,799' 53
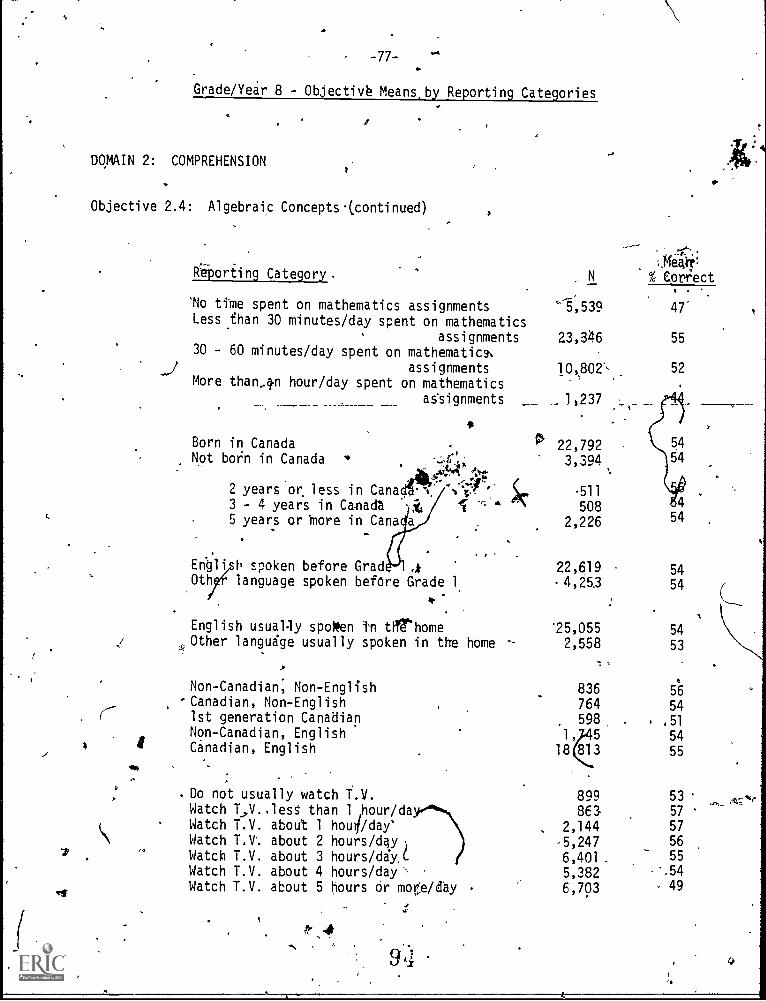
-77-K
Grade /Year 8 - Objectivb Means,by Reporting Categories
DOMAIN 2: COMPREHENSION
Objective 2.4: Algebraic Concepts-(continued)
Reporting Category.
'No time spent on mathematics assignments
Less than 30 minutes/day spent on mathematics
assignments30 - 60 minutes/day spent on mathematics%
...I assignmentsMore than,p hour/day spent on mathematics
a
N
.....,
JfeipT.
% Correct. ..
',539 47'
23,346 55
10..802\ 52
assignments _ L237 ,.-%--
Born in Canada . ft, 22,792.,
Not born in Canada ' 3,394
44' 4"''3- 4 years in Ca-nadZ -ji, 1 '':4 S'C. 508
2 years or less in Cana .". 1 v., -511
5 years or more in Canada 2,226
Enbli I) spoken before Grad 4 22,619 54Oth language spoken before Grade 1 4,253 54
English usually spoken hi tRrhomeOther langudge usually spoken in the home -
,
Non-Canadian; Non-English'Canadian, Non-Englishr 1st generation CanadianNon-Canadian, English
i Canadian, English...
ilk
to
.
Do not usually watch T.V.Watch T,V..les5 than 1 shour/daWatch T.V. about 1 hou4/day*Watch T.V.. about 2 hours/duWatch T.V. about 3 hours/ddyLWatch T.V. about 4 hours/dayWatch T.V. about 5 hours or more /day
'25,055 542,558 53
836764598 .
56
54. ,51
1, 5 5418 813 55
899 53
861 57
2,144 57
-5,247 56
6,401 _ 55
5,382 .',54
6,793 - 49
Az: e
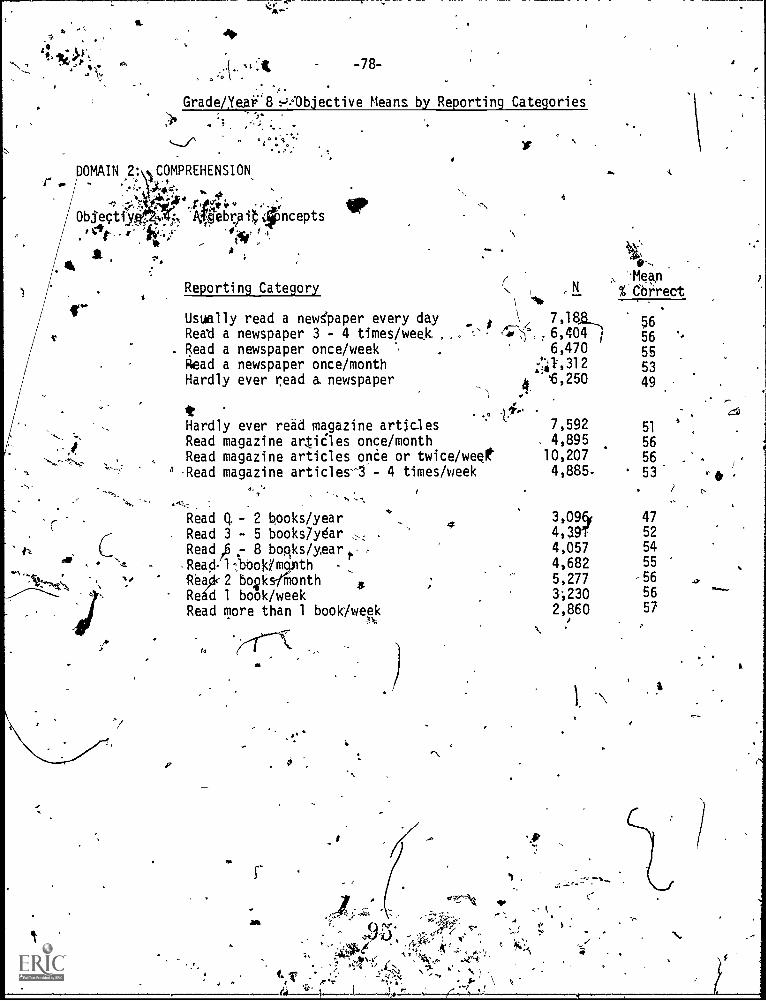
4
-. -78-
Grade/Year-8 -.-;:Objective Means by Reporting Categories
°
DOMAIN 2: *1COMPREHENSION,
ht9ebriai
r
ObSectiy
St.
114
,4
'nceptssir
Reporting Category4
Usually read a newspaper every dayReat a newspaper 3 - 4 times /week
. Read a newspaper once/weekRead a newspaper once/monthHardly ever read a. newspaper
Hardly ever read magazine articlesRead magazine al-idles once/monthRead magazine articles once or twice/wee
1 Read magazine articles-3 - 4 times/week
Read Q. - 2 books /year
Read 3 - 5 books7y0arRead /6 8 boqks/yeart.ReacIlltoklmgAth
Rea 0c2 bqksffilonth aRedd 1 book/weekRead more than 1 book/week
la
4
N
41.
A
14P#11
%tor'rect
7,18.6,4046,470
;TiT,312
6,250
56
56
55
53
49
4:13
7,592 51 '
. 4,895 5610,207 564,885. 53
473,094(
4,39T 52
4,057 54
4,682 55
5,277 -56
3;230 56
2,860 57
;1..7
ti
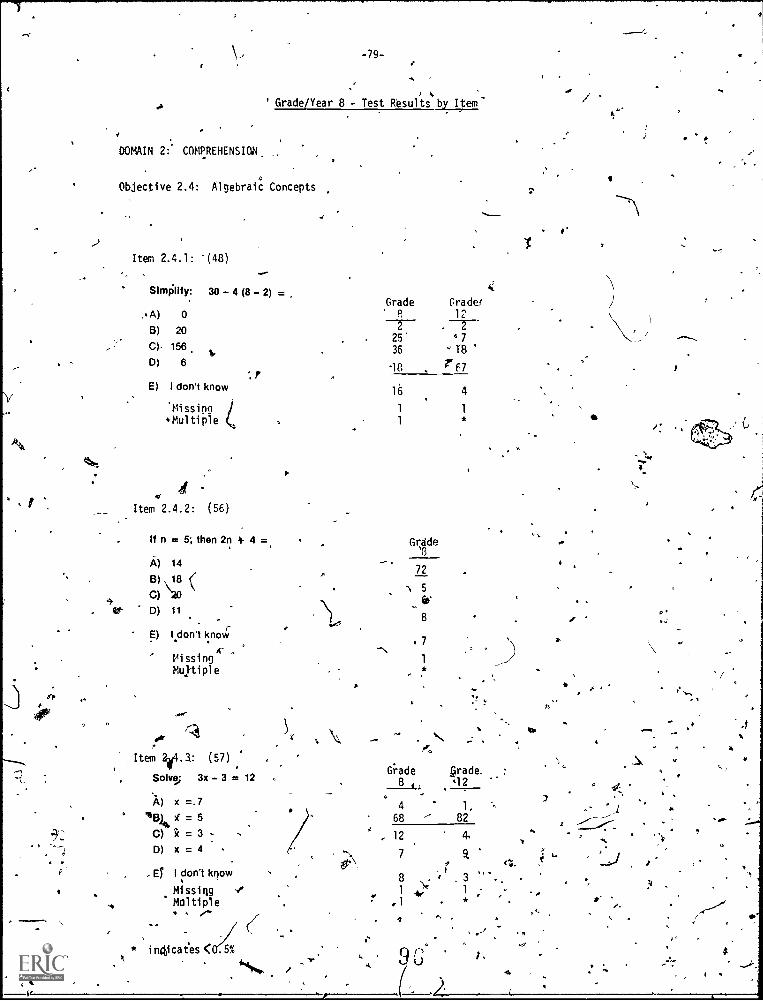
9.
-79-
' Grade/Year 8 - Test Results by Item
DOMAIN 2: COMPREHENSION.
Objective 2.4: Algebraic Concepts
k
Item 2.4.1: '(48)
Simplify: 30 - 4 (8 - 2) =
A) 0
Grade Grade!12
B) 20 2
25
24 7
C)- 156 36 '18D) 6
-18 1.67
E) I don't know16 4
'Missing 1 1
*Multiple 1
Item 2.4.2: (56)
n = 5; then 2n 4. 4 =,
A) 14
B) 18 (
Cl AO
D) 11
E) I don't kno47
.ssi ng 1
Muyti pl e
Grade
72
5
8
Item 204.1: (57)
Solve; 3x - 3 =
A) x =.7
-
12
-.
6ade8 ...:
*..
..: .
Grade.
t12
.
a.
. -
4 1,
11184, )e = 5 68 --- 82
C) x =3 12 4. tD) x = 4
(*rt.
ET I don't 19ow8
Missiqg ." 1 1 ; 0Multiple *
* indicates < 5% 9 I.
.
3
J
.4.
...Z,1 /
'
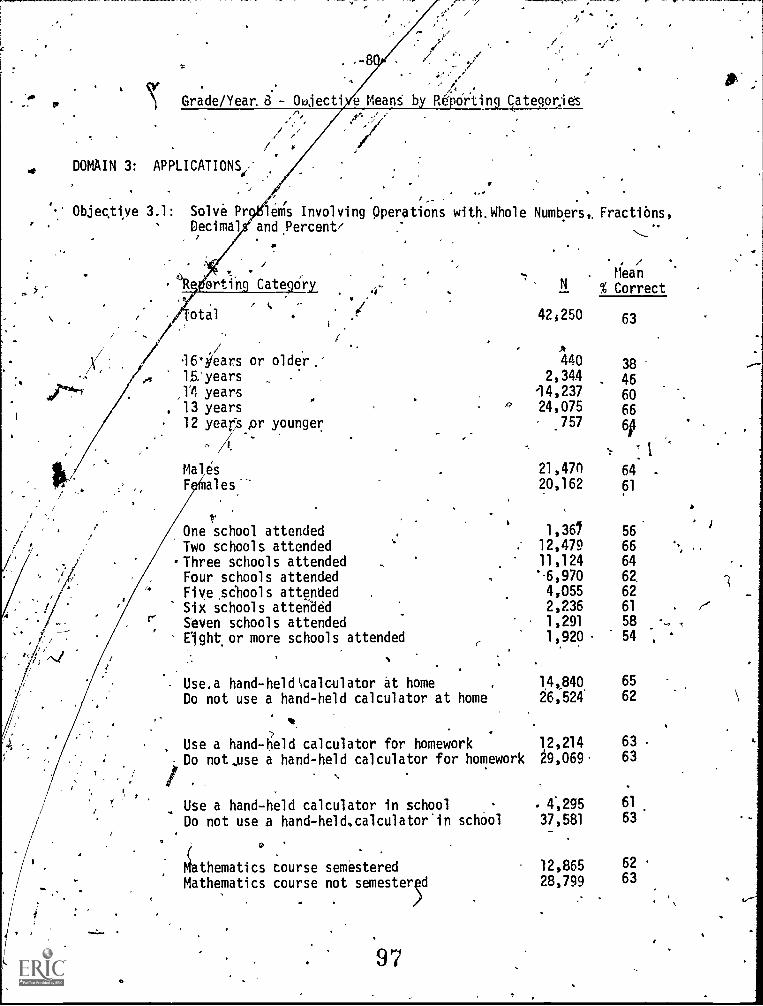
'.*
. "
Grade/Year. 8- Oujecti e Mean b ortinipategorjes
DOMAIN 3: APPLICATIONS/
Jl
Objec.tive 3.1: Solve Pr ..'ems Involving Operations with.Whole Numbers,. Fractions,' Decimal and.Percent/
, ortin Cate ory.
otal
,/6'Years or older.'15:years,14 years
. 13 years12 yeah pr younger
O
MalesF: ales
One school attendedTwo schools attended
-Three schools attendedFour schools attendedFive sehools attendedSix schools attendedSeven schools attendedEightor more schools attended
1
Use.a hand-held1/4calculator at home
Do not use a hand-held calculator at home
Use a hand-held calculator for homeworkDo not .use a hand-held calculator for homework
Use a hand-held calculator in schoolDo not use .a hand-held,calculator.in school
Mathematics course semesteredMathematics course not semester d
97
MeanLl % Correct
425250
4402,344
14,23724,075
757
21,47020,162
63
38
4660
66
6t
164 .
1,36/ 5612,479 6611,124 64'-6,970 62,
4,055 62
2,236 61 ('
1,291 58 --
1,920 54
14,840 65
26,524 62
12,214 63
9,069 63
4;295 61
37,581 63.
12,865 62
28,799 63
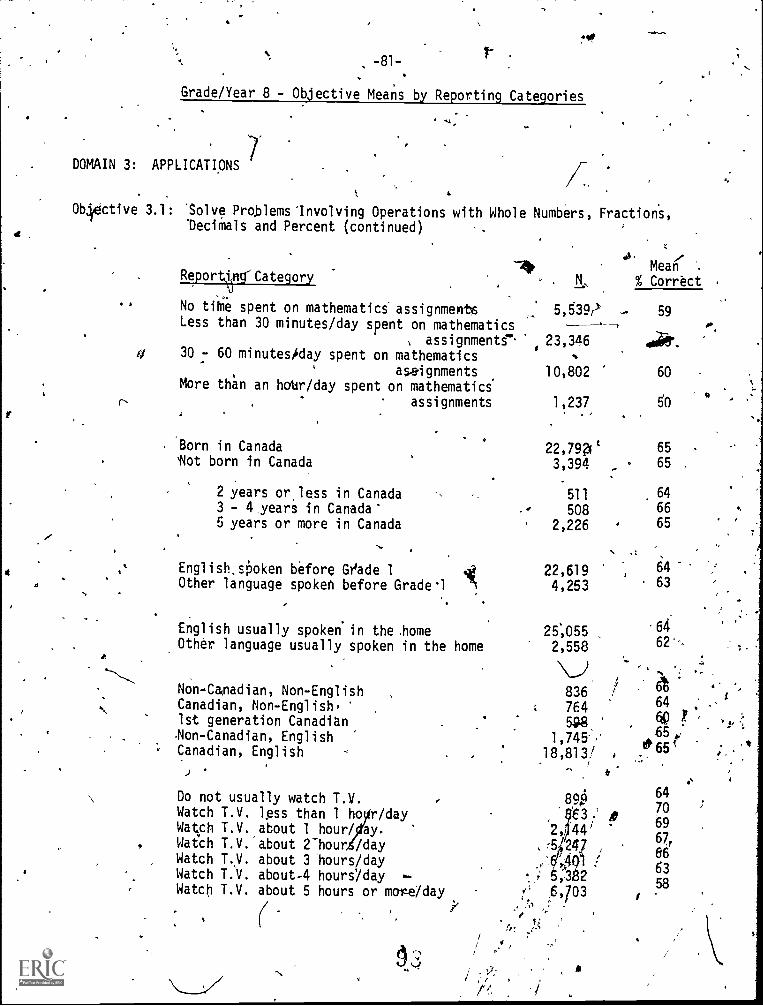
4,
-81-
Grade/Year 8 - Objective Means by Reporting Categories
DOMAIN 3: APPLICATIONS
t .
Obctive 3.1: 'Solve Problems' Involving Operations with Whole Numbers, Fractions,'Decimals and Percent (continued) ,.
MeanReport4 i Category
. K, % Correct
No time spent on mathematics assignments 5,539r) 59Less than 30 minutes/day spent on mathematics
assignments' 23,346 41;03'.
30 - 60 minuteshday spent on mathematicsaseignments 10,802 60
More th*an an hohr/day spent on mathematicir, assignments 1,237 SO
Born in Canada 22,79?0*Not born in Canada 3,394
2 years or,less in Canada 5113 - 4 years in Canada* 5085 years or more in Canada 2,226
English.skken before Grade 11(
22,619Other language spoken before Grade1 4,253
English usually spoken.in the.home 25;055Other language usually spoken in the home 2,558
Non-Canadian, Non-English 836Canadian, Non-English, 7641st generation Canadian 598ion-Canadian, English 1,745-'Canadian, English 18,813/ i
Do not usually watch T.V.Watch T.V. less than 1 ho r/dayWatch T.V. about 1 hour/ ay.Watch T.V. about 2-hour /dayWatch T.V. about 3 hours/dayWatch T.V. about-4 hours/dayWatch T.V. about 5 hours or move/day
/
65
. 65 .
64
66
65
64
63
6462*--
64y6p
tt-65t,65
,
89 64,4
70E3 9
5920 44'
675;247
.4 ,:4g 63can58
4,703
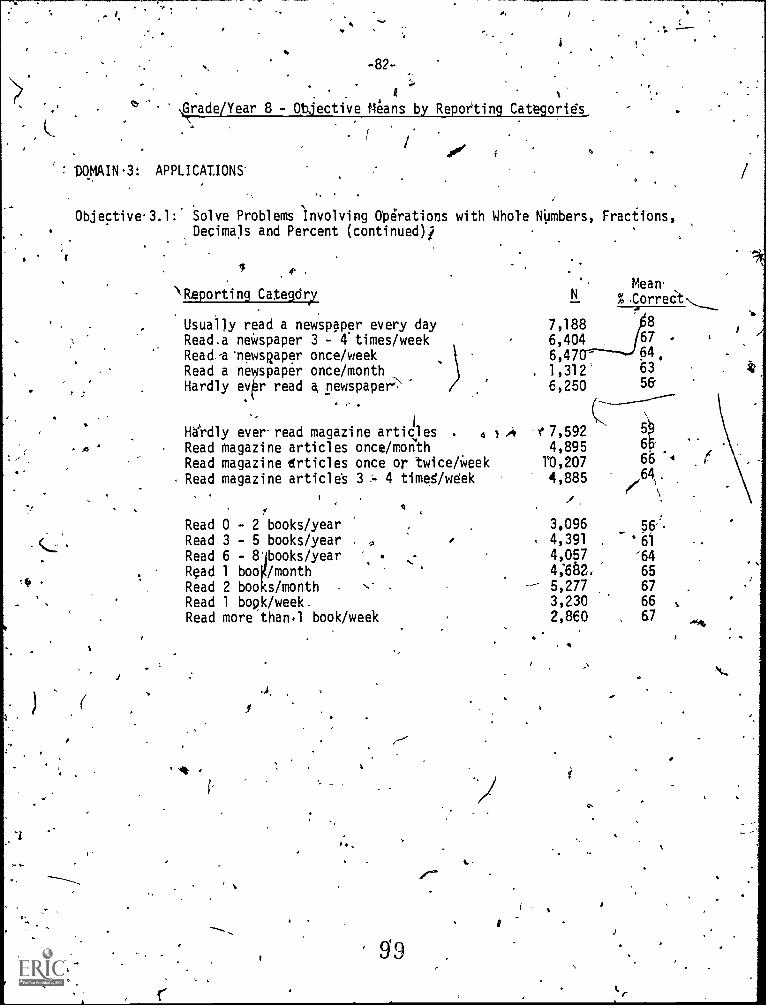
.
1r
-82-
4.3rade/Year 8 - Otjective Means by Reporting Categories
: -DOMAIN-3: APPLICATIONS'
Objective.3.1: Solve Problems Involving Operations with Whole Nimibers, Fractions,Decimals and Percent (continued)i
j
\Reporting Categdry
Usually read a newspaper every dayRead.a newspaper 3 - 4 times/weekRead-a'newspaper once/weekRead a newspaper once/monthHardly ever read a, newspaper> /3
A .
Hardly ever-read magazine articles 4
Read magazine articles once/morithRead magazine drticles once or twice/WeekRead magazine article's 3 4 timed /week
Read 0 - 2 books/yearRead 3 - 5 books/yearRead 6 -Read 1 boo /month
.
Read 2 boo s/monthRead 1 bopk/week.Read more than..1 book/week
g9
$._
N.Mean.
% CorrectN___
7,188 8
6,404 67
6,47 64.
1,312' 63
6,250 56
A 7,592-1.
4,89556
r0,207 66 .4
4,885 ,64,
3.096 56''.
. 4,391 '614,057 644:632, 65
-- 5,277 67
3,230 66 .
2,860 67"`"IS
1
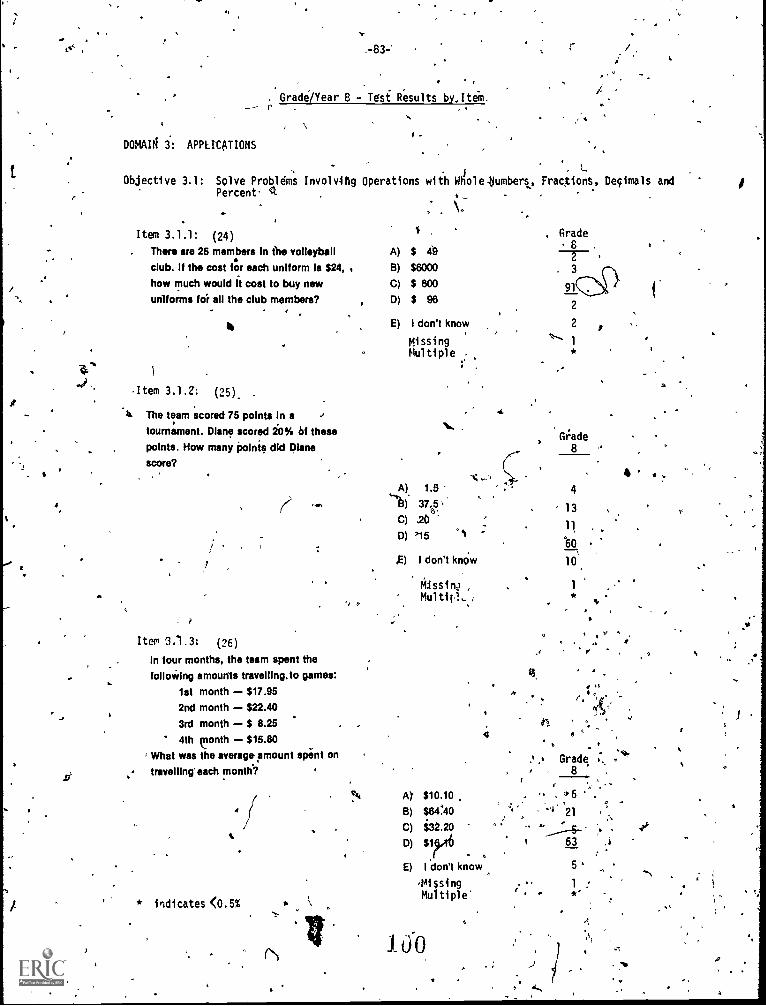
4
11.
DOMAIN 3: APPLICATIONS
.-83- r
I .
Grade/Year 8 - Test Results by. Item.
-
Objective 3.1: Solve Probldms Involvitig Operations with Whole lumbers., Fractions, Decimals andPercent
Item 3.1.1: (24). There are 25 members In the volleyball
club. If the cost for each uniform Is $24,
how much would It cost to buy newuniforms foi all the club members?
- ,
Item 3.1.7:
ts The team scored 75 points In a
tournament. Diane scored 20% of these
points. How many points did Dianescore?
01.
Item 1.3: (26)
In four months, the team spent the
folloWing amounts travelling.to games:
1st month $17.95
2nd month $22.40
3rd month $ 8.25
4th month $15.80
What was the average amount spent on
travelling' each month.?
* indicates <0.5%
A) $ 49
B) $6000
C) $ 600
D) $ 96
E) I don't know
MissingMultiple
Grade82
91
2
2
1
A) 1.5
13) 37.5
C) 20D)'15 '1
g) I don't knew
,
Gt:ade8
4 '
4
13
11 ,
*6.g,
10
Mlssiry ,
Mul
!"4i A). $10.10
B) $64!40
C) $32.20
D) vieE) I don't know
MisingMultiplei
00
41.
.. Grade8
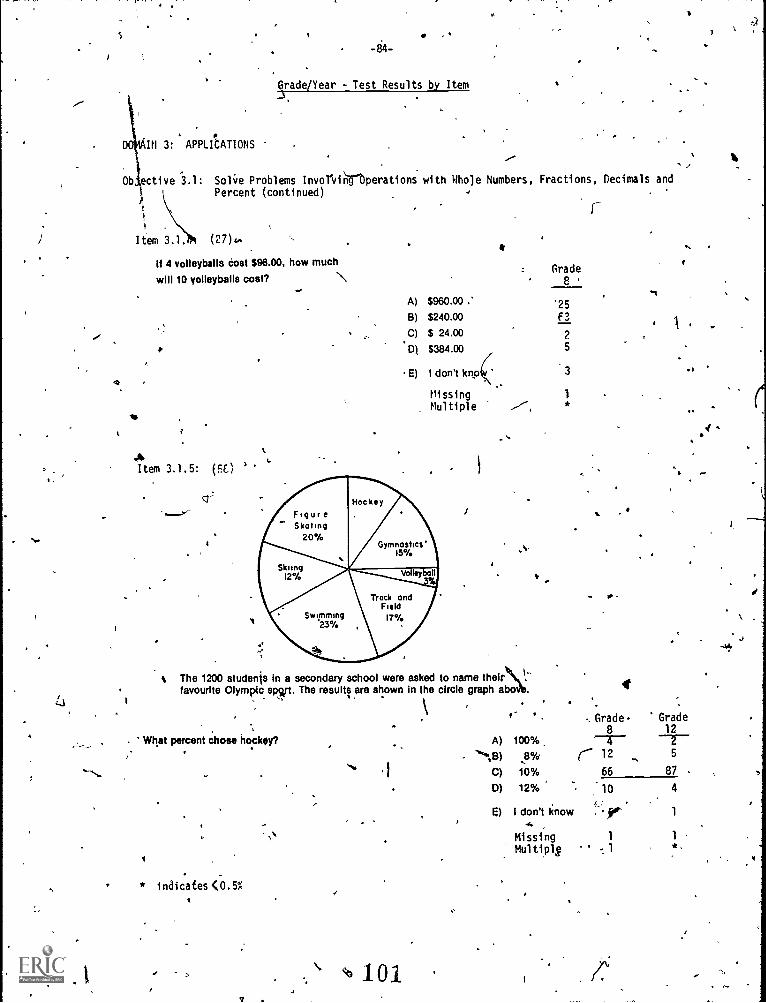
IN 3: APPLI8ATIONS
Ob ective 3.1:
Grade /Year - Test Results by Item
SolVe Problems InvonieOperations with Whole Numbers, Fractions, Decimals andPercent (continued)
41
Item 3.1. (27)..
If 4 volleyballs Cost $96.00, how much
will 10 volleyballs cost?
A) $960.00
B) $240.00
C) $ 24.00
D) $384.00
E) I don't kno
hissingMultiple
Grade8'
.1
'25f3
25
3
1*
Item 3.1.5: (5E)1
Cr'
A
- 0.
I% The 1200 atudenis in a secondary school were asked to name their ,
favourite Olympic spirt. The results are shown in the circle graph abo ., .
What percent chose hockey? A) 100%
4
Grade8-4-
Grade12
'4%8) .8% 12 5
C) 10% 66 87
D) 12% 10 4
e) I don't know r 1
4.Missing 1 1
Multiply *,4
* indicates (0.5%
> 101
4
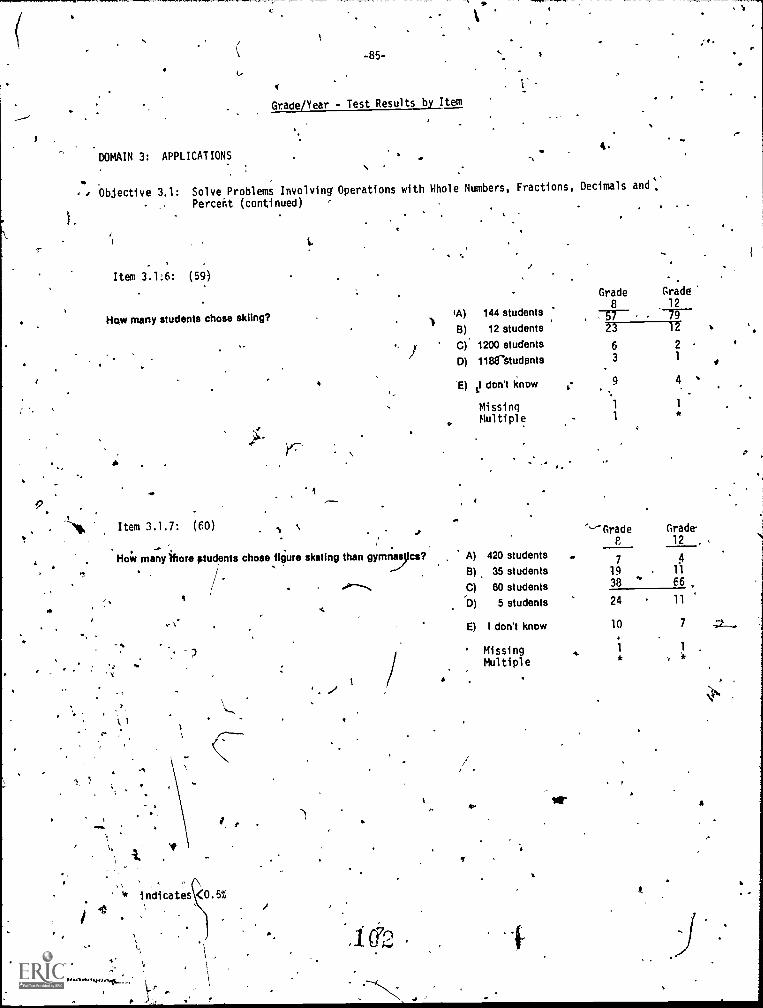
k,
DOMAIN 3: APPLICATIONS
Grade/Year - Test Results by Item
-
+ Objective 3.1: Solve Problems Involving Operations with Whole Numbers, Fractions, Decimals and':
Percent (continued) ,
Item 3.1:6: (59)
How many students chose skiing?
.
'A) 144 students
B) 12 students
C) 1200 students
D) 118ErStudants
E) II don't know
MissingMultiple
Grade Grade
8 12
,
23 12
6 2
3 1
9
.
4
1
9
Item 3.1.7: (60). 0
Hoiv many iitore 1udents chose figure skating than gymnylcs?
7
.k
i
A) 420 students
B) 35 students
C) 60 students
D) 5 students
E) I don't know
MissingMultiple
10 7
1 1
4 .10
'Grade Grade.
8 12 ,
7 419 11
38 66
24 11
I
ti
.4t indicates <0.5%
* 4
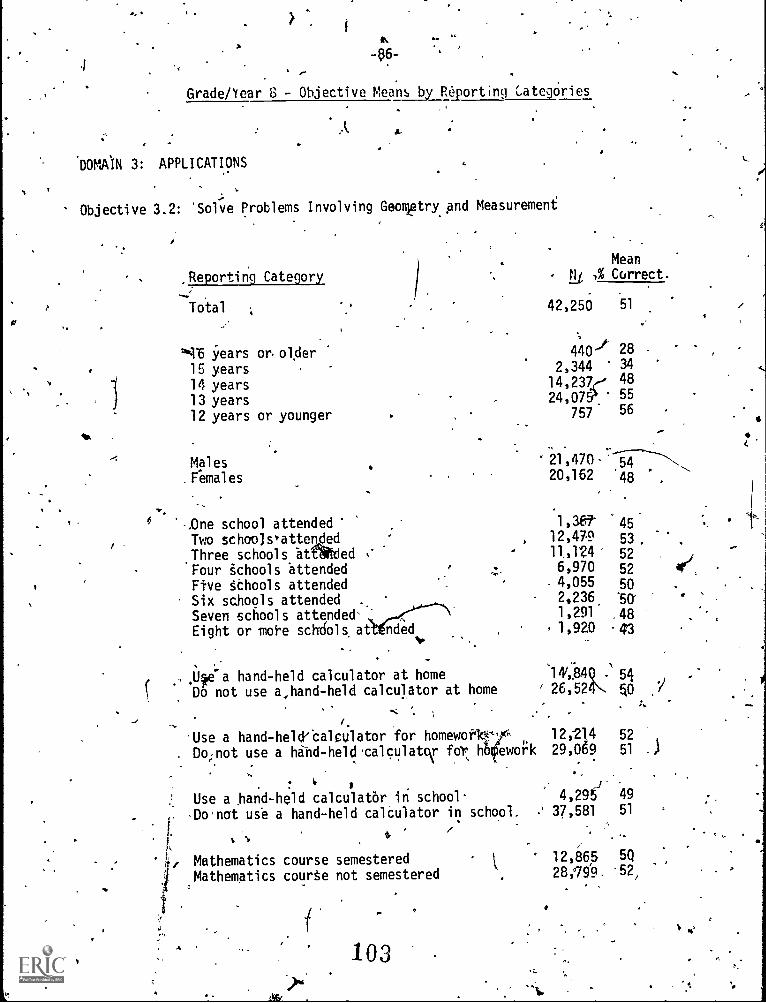
-86-
Grade/Year 8 - Objective Means by Reporting Categories
'DOMAIN 3: APPLICATIONS
Objective 3.2: 'Solve Problems Involving GeoniFtry and Measurement
,Reporting Category
Mean4 Correct.
51Total ; 42,250
'16 ;ears or older 440f15 years 2,344
14 years 14,23Zr'
13 years 24,079
12 years or younger 757
Males. Femal es
6 .-.0ne school attendedTwo schoolsvatten ed.Three schools at ed
Four schools attendedFive schools attendedSix schools attended ..
Seven schools attended'Eight or more schdols. at
c
nded
28
3448
5556
,
20,162 '48
1,367-, 12,479 53.
1,124 526,970 524,055 502,236. .51,291 ,481,920 -4'3
:,. ,
.14e a hand-held calculator at home 14/,.84,
54_,
Do not use a,hand-held calculator at home ' 26,52 50 .7
/.
Use a hand-held%taltulator for homewoftrr 12;214 52
Do; not use a hand-held.calculat5r fdr holpwork 29,069 51 .)
$
Use a hand-held calculatOr in schoolDo.nat use a hand-held calCulator in school.
a
1, Mathematics course semesteredMathematics course not semestered
103
../
'
4,29537,581
.
49
51
12,865 5Q
28,199- 52,
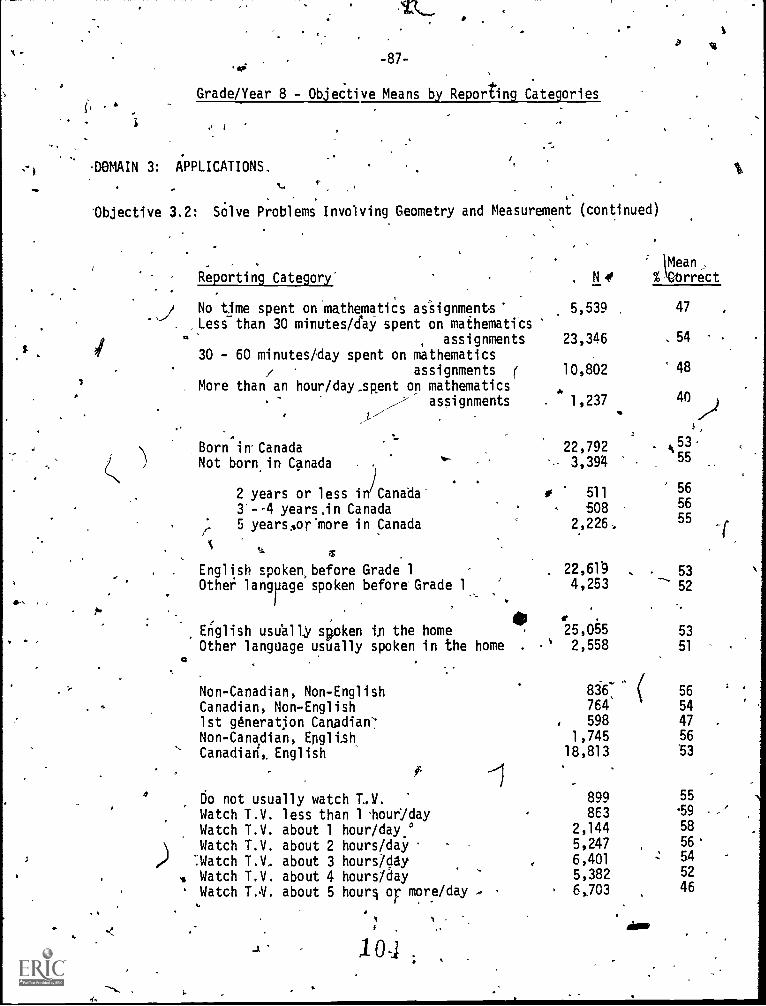
1
-87-
Grade/Year 8 - Objective Means by Reporting Categories
DGMAIN 3: APPLICATIONS,
'Objective 3.2: SOlve Problems Involving Geometry and Measurement (continued)
, .
Reporting Category . N4
No time spent on mathematics as'Signments 5,539 ,
Less than 30 minutes/day spent on mathematicsassignments 23,346
30 - 60 minutes/day spent on mathematics7 assignments ( 10,802
More than an hour/day_spent on mathematicsassignments . 1,237
... t.1
Born in.CanadaNot born in Canada .
..22 ,792
3,394
2 years or less in/Canada 0 511
3 --4 years,in Canada 508 ,
5 yearsAormore in Canada
S
English spoken before Grade 1 . 22,619Other language spoken before Grade 1 4,253
English usually spoken in the home 25,055Other language usually spoken in the home 2,558
Non-Canadian, Non-EnglishCanadian, Non-English1st generatjon Canadian':Non-Canadian, EnglishCanadian, English
t
Do not usually watch T..V. 899I
836:764598
1,74518,813
Watch T.V. less than 1 ourYday 8E3
\ Watch T.V. about 2 hours/day
2,144Watch T.V. about 1 hour/day.°
/I :Watch T.V. about 3 hoursiday , 6,401
, Watch T.V. about 4 hours/day 5,382
Watch T.. about 5 hourl or more/day , , 6,703
1 04
1Mean,VGOrrect
47
, 54
48
40
. 53.55
56
56
55
, 53
52
53
51
Ant
56
54
47 .
56
53
55
-59
58
56
54
52
46
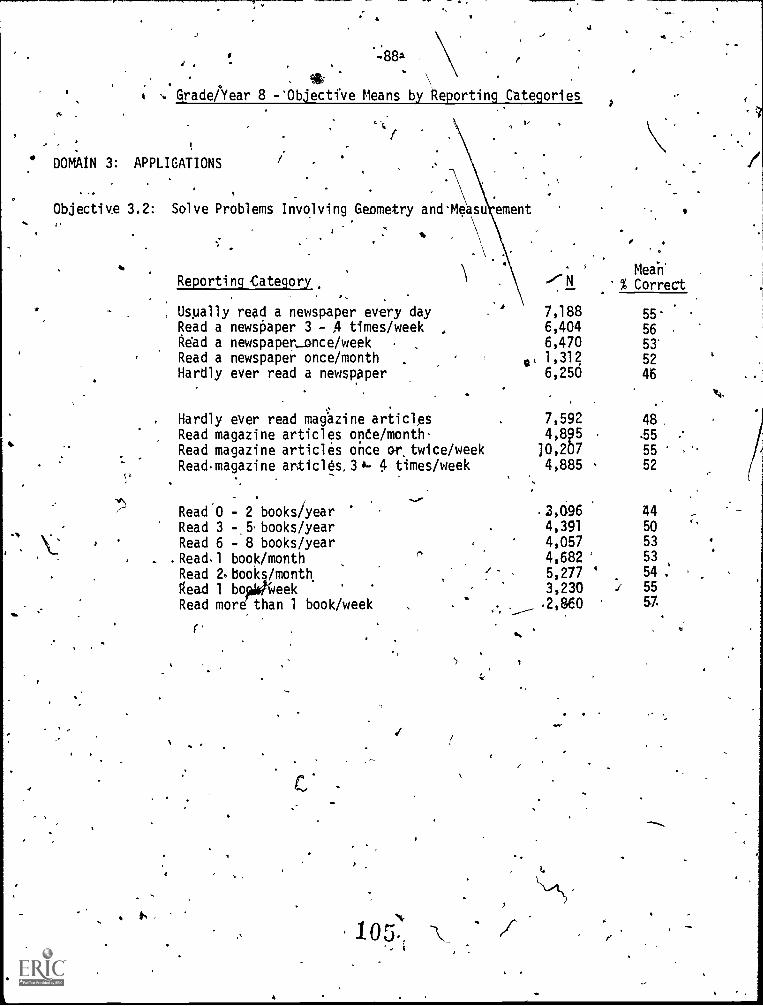
gib
's Grade/Year 8 - 'Objective Means by Reporting Categories
.
DOMAIN 3: APPLICATIONS
Objective 3.2: Solve Problems Involving Geometry and-Me su ement
Mean'Reporting -Category N % Correct
Usually read a newspaper every day 7,188 55.Read a newspaper 3 - 4 times/week 6,404 56Read a newspaper_once/week 6,470 53'
Read a newspaper once/month 1,312 52Hardly ever read a newspaper 6,250 46
Hardly ever read magazine articles 7,592 48Read magazine articles onde/month 4,895 .55
Read magazine articles once ortwice/week 10,207 55
Read.magazine articles.3.- 4 times/week 4,885 52
Read0 - 2 books/year 3,096 44
Read 3 -5,books/year 4,391 50
Read 6 - 8 books/year 4,057 53
.Read.1 book/month 4,682 53
Read 2% hooks /month 5,277 ' 54 :
Fead 1 bopidWeek 3,230 55
Read more than 1 book/week -2,860 57.
C,
lo
r
(
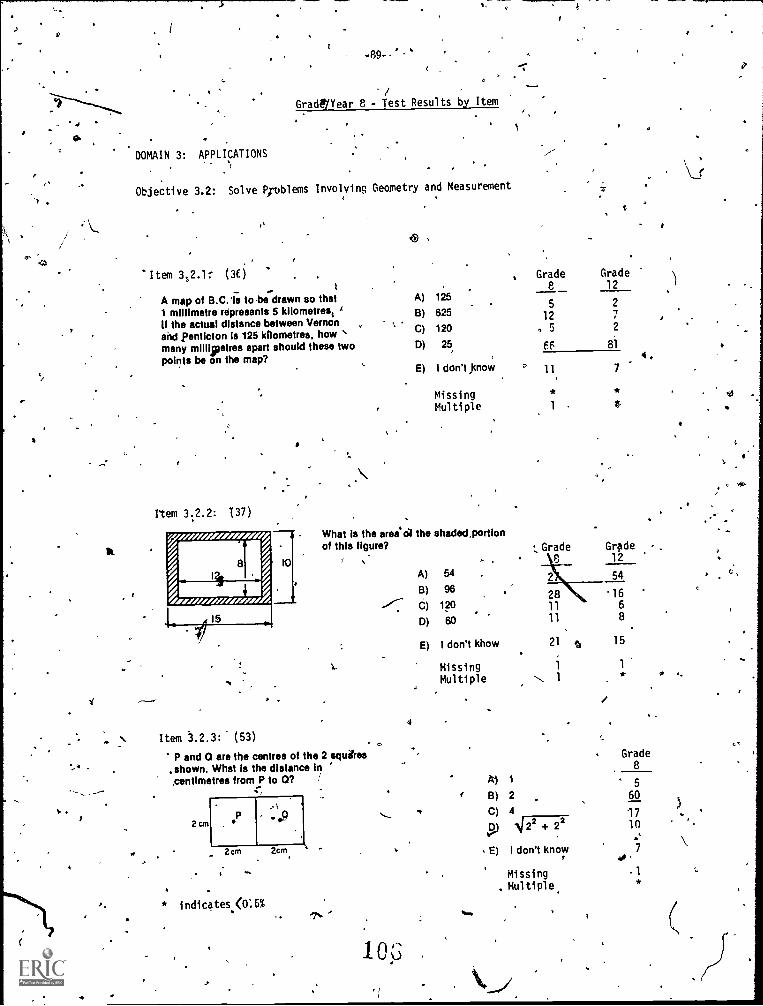
al
..
r
0,
4
zi
.,
(
r
- al
oco
i
--,_ _.....
*
k
,
,..
DOMAIN 3: APPLICATIONS.. ,i
89-.
/GradYear 8 - Test Results by Item
Objective 3.2: Solve Pjoblems Involving Geometry and Measurement
'Item 3,2.1: (3E)
--- /4 1
A map of B.C.Is to be drawn so that1 millimetre represents 5 kilometres, AIf the actual distance between Vernon ,,
and Penticton Is 125 kilometres, how ".many milllyetres apart should these twopoints be on the map?
Item 3.2.2: (37)
11111111111111,....e//z/z/zzezz/zzz A
,
. \ Item 3.2.3: (53)
a
6 ,
Grade8
Grade12
o
A) 125
B) 6255
1227
C) 120 ,5 2
D) 25 EF 814.
E) I don't know 11 7
Missing * *
Multiple 1 4.
What is the area the shaded,portIonof this figure?
e
1.
.*
0
P and 0 are the centres of the 2 squires.shown. What is the distance in ',centimetres from P to 0?
.0.
..2
Grade8
Grade12
A) 54 54B) 96
6 1p2811
166
D) 60 11 8
E) I don't khow 21 t 15
Missing 1
Multiple -, 1* *
Al 1
r B) 2
C) 4
D) 1,1-277F222cm4/
_ 2cm 2cm . E) I don't knowa
. .
* indicates (0:6%1%.
10
4r.
Missing. Multiple.
Grade8
60
710.
74-
1
*
)
I
..
)
(
.
.
,
1,,
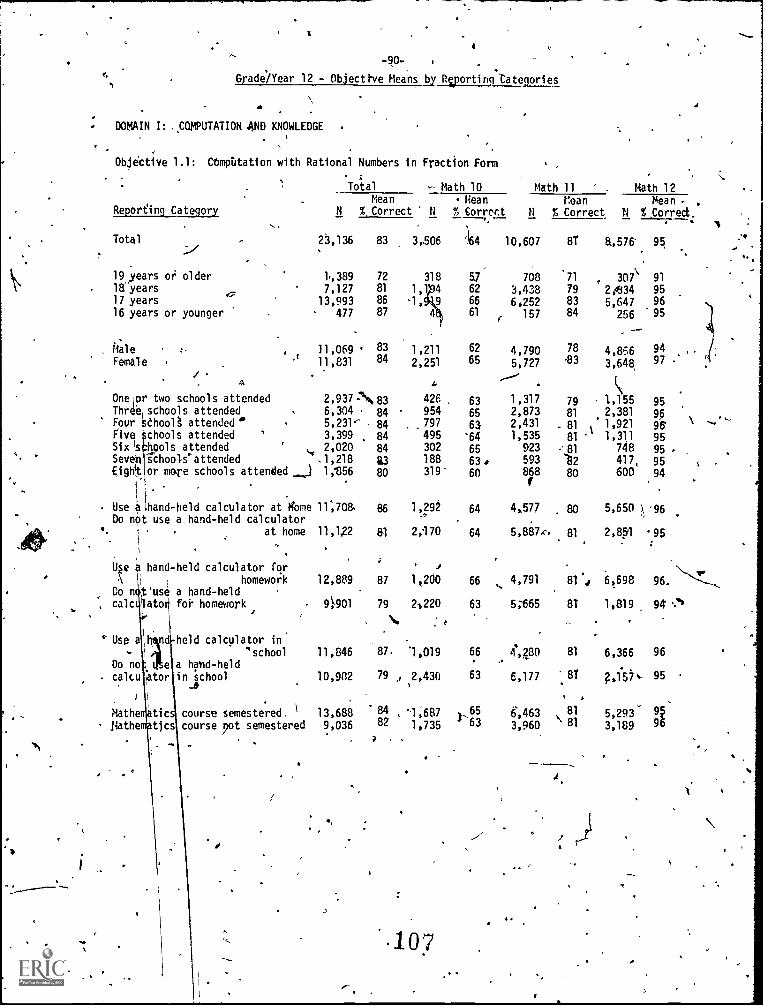
-90-
Grade/Year 12 - Objecttve Means 1,,y %porting 'Categories
a
DOMAIN 1: COMPUTATION AND KNOWLEDGE
.Objective 1.1: COmpritation with Rational Numbers in Fraction Form
, ,-,
Total - Math 10 Math 11 . Math 12Mean Mean Moan Mean .
Reporting Category N %. Correct N % Correct N % Correct T.1 % Correct.
Total 23,136 83,-,:
.
19 years or older 1.,389 7218' years 7,127 81
17 years 13,993 8616 years or younger 477 87
11ale 3 11,069 83Female , 11,831 84I
2,937-N83r schools attended
One or two schools attended, 6,304 , 84Thr
our Fdhoo.Q attended ' 5,231,- . 84rive chools attended ' .3,399 , 84
2,020 84Six hools attendedSeven schools attended .1,218 23E,ight. or gore schools attended ...1 1,1356 80
1 . . .
i* .
Use a ihand-held calculator at ifome 11;708. 86Do not use a hand-held calculator
m.- 1 at home 11,122 81
Ue hand-held calculator forhomework
Ilo homeworkDo n tul a hand-heldcalc at
Use
Do nocalcu
Mathe- Path
12,889 87
9901 79
3,506 `1164
.
318 571,1 4 62
-1, 9 66
4 61
62
2,251 65
426 63954 65
F 797
302 6635
495 '64
13798, 66g a
1,211
held calculator in'school 11,846 87,
a hand-heldin school 10,982 79 ,,
tic,
tjcscourse semestered. \ 13,688 84 ,
9,036 82course pot semestered, ? .
64
64
1,292
2,170
1,200
21220
66
63
1,019 66
2,431) 63
'1,687 ),651,735 63
.107
10,607
.
8T 84576' 95,
708 '71 , 307\ 913,438 79 2;634 956.252 83 5,647 96
r 157 84 256 95
4,790 78 4,856 94
5,727 -83 3,648 97
.-----
1,317 79 1,155 952,873 81 2,381 962,4311,535
. 8181
11,921 96
923 ., 81 748 95593 -82868 80f
4.577 , 80 5,650 ,96
5,887 81 2,851 '95
4,791 81 6,698 96.
5;665 8T 1,819 94' ..",
etpo 81 6,366 964 .
6,177 81 ?,157.- 95
6,463 81\ 5,293- /3,960
.
81 3,189
4
S
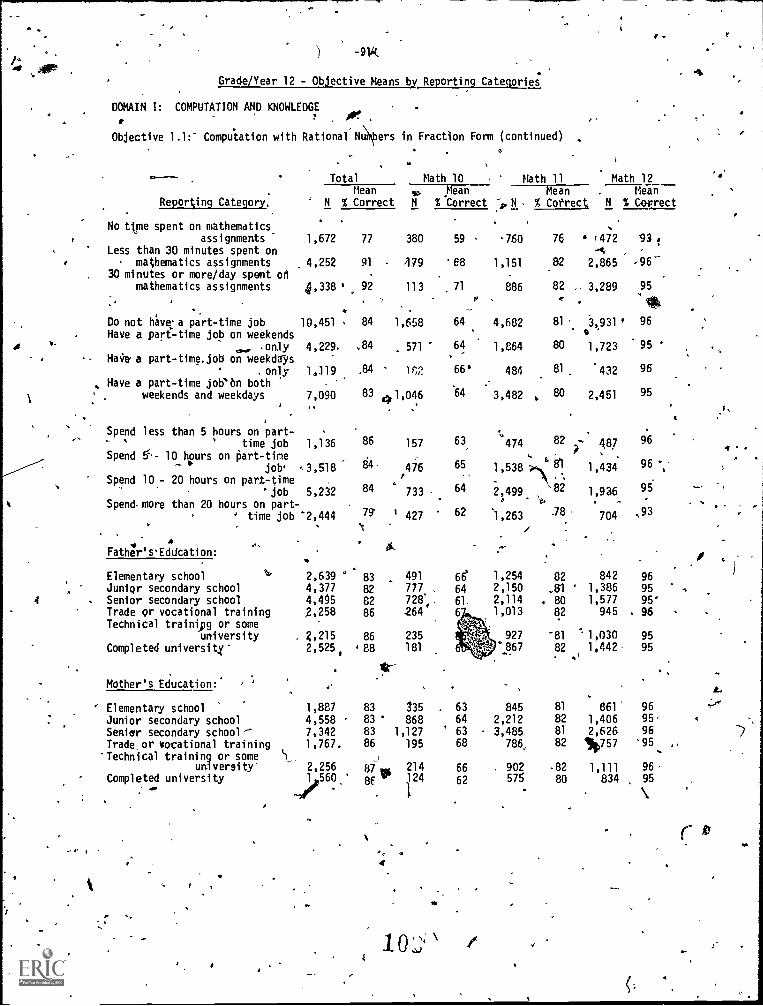
4.-
-9V(. s
Grade/Year 12 - Objective Means by Reporting Categories
DOMAIN I: COMPUTATION AND KNOWLEDGE
Objective 1.1:- Computation with Rational Nu ers in Fraction Form (continued)
0
Total Math 10 Math 11 Math 12Mean sc. Mean Mean Mean
Reporting Category. N % Correct N % Correct A. N % Correct N % Correct
No ttme spent on mathematics_assignments
Less than 30 minutes spent onmathematics assignments
30 minutes or more/day spent onmathematics assignments
Do not Wave: a part-time jobHave a part-time job on weekends
.onlyHav a part-time.job on weekdays
. only
Have a part-time jobnn bothweekends and weekdays
1,672
4,252
4,338
10,451 7
4,229.
1,119
7,090
77
91
,92
84
,84
.84
83
380
479
113
1,658
571
1C2
41,1,046
Spend less than 5 hours on part-" ' time job 1,136Spend 10 hours on part -time
-job' 3,518
Spend 10 - 20 hours on part-time'job 5,232
Spend. more than 20 hours on part-' time job
A
Father' vEdUcati on:
*2,444
w
Elementary school st0, 2,639 0
Junior secondary school 4,377
Senior secondary school 4,495Trade or vocational training 2,258
59 -760 76
'68 1,151 82
71 886 82
64 4,682 81'
64 1,864 80
66' 484
'64
81
3,482 . 80
86 157 83e 474 82
476 65. 1,538 ;s811
84 733 64 2,499P'79-
.4 427 62 '1,263 .78
83-
491 66'
82 777 . 64
82 728,, 61.
Technical training or someuniversity
Completed university
Mother's Education:*
. 2,2152,525, '
. .
' Elementary school 1,887
Junior secondary school 4,558 '
Senior secondary school - 7,342Trade, or vocational training 1,767.'Technical training or some \,.
university' 2,256Completed university 1560 '
I
86 264 6
86 23588 181
!-
83 335
83 86883 1,12786 195
_I
87 gg 2148f Ir 124
1O
1,254 822,150 .81
2,114 . 801,013 82
927 -81
'867 82
63 845
64 2,212
' 63 3,48568 786,
66 902
62 575
81
82
81
82
-82 1,111 9680 834 95
'472 '93 .
-.0C, ,
2,865 -96--
. 3,289 95
3,931' 96a
1,723 95
'432 96
2,451 95
- 487 96
1,434 96 .-
1,936
704 "93
F842 96
' 1,386 951,577 95-945 96
1,030 951,442 95
L661 96 "-^"
1,406 95 4
2,626 96
10757 "95
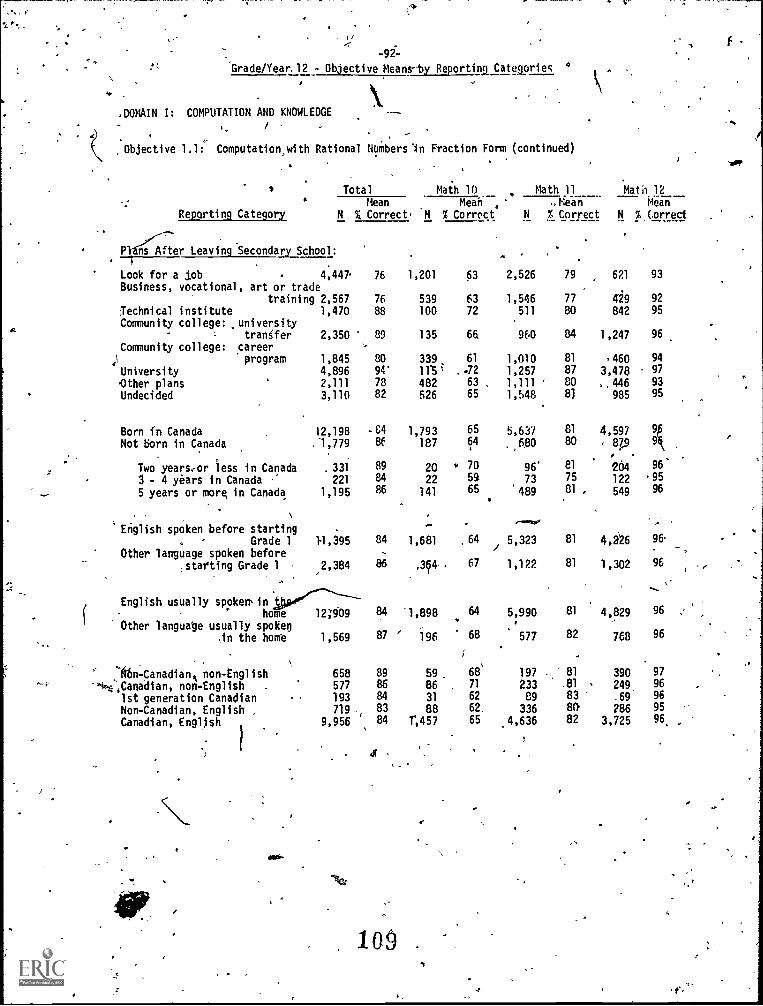
I
-92-
"Grade /Year, 12 - Objective Means-by Reporting Categ9riec
,DOMAIN I: COMPUTATION AND KNOWLEDGE
/
Objective 1.1: Computation,with Rational NuMbers '411 Fraction Form (continued)
Reporting Category
Secondary School:Plfns After Leaving
Look for a jobBusiness, vocational
(technical instituteCommunity college:
Community college:
UniversityOther plansUndecided
Total Math 10 Math 11
Mean Meah ,MeanN ii Correct, N % Correct N 7 Correct
4,447,
, art or tradetraining 2,567
1,470universitytransfer 2,350
careerprogram 1,845
4,896
2,111
3,110
Born in CanadaNot born in Canada
Two yearsfor less in Canada3 - 4 years in Canada5 years or more in Canada
12,198
. 331
221
1,195
English spoken before startingGrade 1 11,395
Other language spoken before,starting Grade 1 , 2,384
,
English usually spoken, inhome 12;909
Other language usually spokenin the home 1,569
' 'ObnICanadian non-English'*14:',,Canartian, non-English ,
1st generation CanadianNon-Canadian, English ,Canadian, English
1
658577193
719 -,
9,956
76 1,201 63 2,526 79
76 539 63 1,546 77
88 100 72 511 80
89 135 66 960 84
80 339 61 1,010 81
94' 11'5' 1,257 87
78 482 63 1,111 80
82 526 65 1,548 8)
C4 1,793 65 5,637 81
86 187 64 6.80 80
89 20 * 70 96' 81
84 22 55 73 75
86 141 65 489 Cl ,
84 1,681 .64 6,828 81
86 ,364- 67 1,122 81
84 '1,898 64 5,990 81
87 ' 196 68 577 82
89 59 68' 197 81
86 86 . 71 233 .81
84 31 62 89 83
83 88 62, 336 8084 1,457 65 .4,636 82
al
, 0 .
Math 12Meg
N %,Correct
621 93
429 92
842 95
1,247 96
460 94
3,478 97
446 93
985 95
4,597
8Z9
9
9,
264 96'
122 .95
549 96
4,i26 96.
1,302 96
4,829 96
768 96
390 97249 96
.69 96286 95
3,725 96 ,
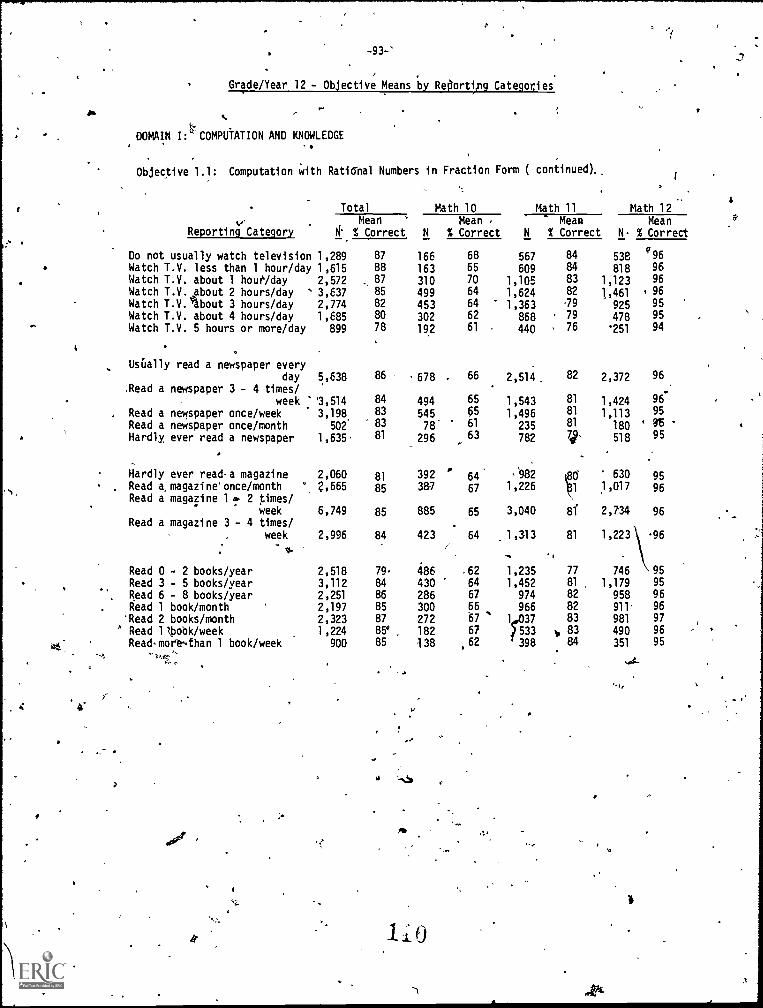
'ti.
I.
-93-'
Grade/Year 12 - Objective Means by Reporting Categories
ti
DOMAIN I: `~COMPUTATION AND KNOWLEDGE.
Objective 1.1: Computation with Ratiftal Numbers in Fraction Form ( continued)._
Total
V MealReporting Category g' % Correct
. -
Do not usually watch television 1,289 87
Watch T.V. less than 1 hour/day 1,615 88Watch T.V. about 1 hour/day 2,572 . 87Watch T.V. about 2 hours/day ' 3,637 85
Watch T.V.Ibout 3 hours/day 2,774 82
Watch T.V. about 4 hours/day 1,685 80
Watch T.V. 5 hours or more/day 899 78
Usually read a newspaper everyday 5,638 86
.Read a newspaper 3 - 4 times/week 3,514 84
Read a newspaper once/week 3,198 83
Read a newspaper once/month 502 83
Hardly, ever read a newspaper 1,635' 81
Hardly ever read-a magazine 2,060 81
Read a. magazine'once/month °, 2,665 85Read a magaiine 14. 2 times/
week 6,749 85Read a magazine 3 - 4 times/
week 2,996 84
Read 0 - 2 books/year 2,518 79Read 3 - 5 books/year 3,112 84
Read 6 - 8 books/year 2,251 86
Read 1 book/month 2,197 85
Read 2 books/monthRead 1 lbobk/week
2,3231,224
87
85e
Read.more-4han 1 book/week 900 85
r4
4I'
Math 10 Math 11 Math 12Mean , Mean Mean
N % Correct N % Correct N. % Correct
166
163310499453
302192
68
65
7064
6462
61
,678 . 66
494 65
545 05
78' 61
296 63
392 ' 64.3 &7 67
885 65.
423 64
486 .62
430 64
286 67
300 66
272 67 '
182 67
138 .62
119 7
1,1051,6241,363
868440
2,514
1,543
1,496235
782
:9821,226
3,040
1,313
-1,2351,452974
966
533
398
:11
538v96
83 1,721 99:82 1,461 96
.79 925 9579 478 95
, 76 '251 94
82 2,372 96
81 1,424 96'
81 1,113 95
81 1809.6 .
74' 518 95
8d 630 951,017 96
81 2,734 96
81 1,223 96
77 746 95
81 1,179 95
82 958 9682
9483 91811.
v 83 490 96
84 351 95
I
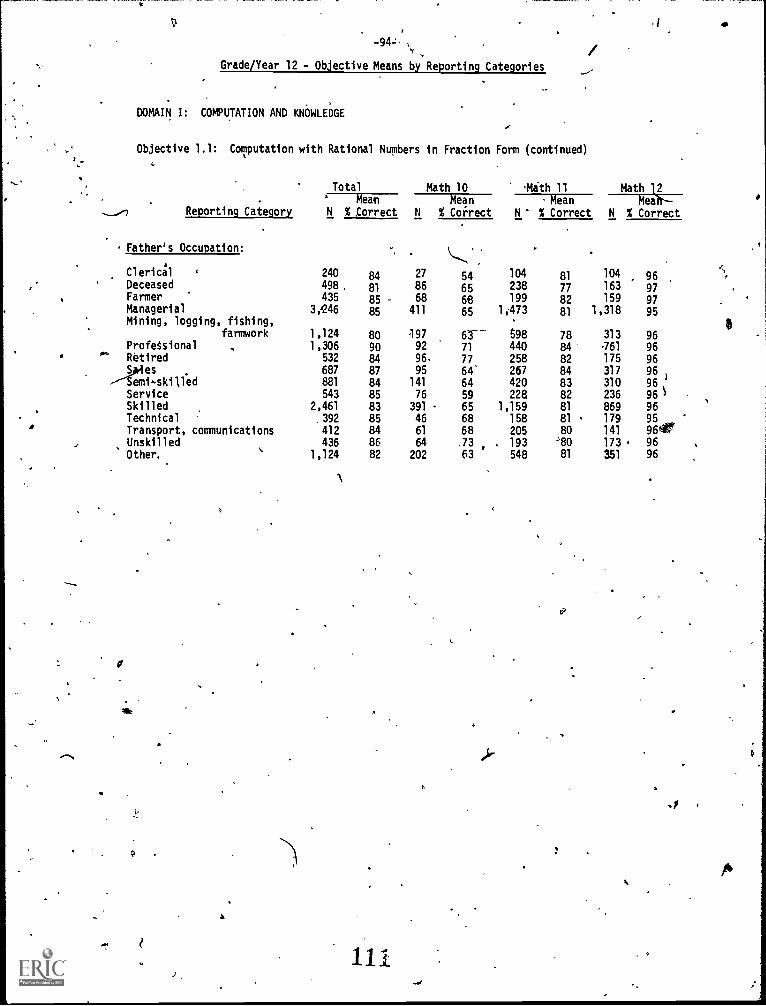
if
Grade/Year 12 - Objective Means by Reporting Categories
DOMAIN I: COMPUTATION AND KNOWLEDGE
Objective 1.1: Computation with Rational Numbers in Fraction Form (continued)
Reporting Category
Total Math 10 'Math 11 Math 12Mean
N % CorrectMean
N % Correct'Mean
N % CorrectMee
N % Correct
Father's Occupation:.
,
,
Clerici'l 240 84 27 54 104 81 104 96Deceased 498 81 86 65 238 77 163 97Farmer 435 85 68 68 159 97Managerial 3,246 85 411 65 1,473 81 1,318 95Mining, logging, fishing,
farmwork 1,124 80 197 6Y-- 598 78 313 96ProfeSsional , 1,306 90 92 71 440 84 -761 96Retired 532 84 96. 77 258 82 175 96Wes . 687 87 95 64 267 84 317 96emi-skilled 881 84 141 64 420 83 310 962Service 543 85 76 59 228 82 236 96Skilled 2,461 83 391 65 1,159 81 869 96Technical 392 85 46 68 158 81 179 95Transport, communications 412 84 61 68 205 80 141 961,Unskilled
.Other.
436
1,1248682
64
202
,73
'63. 193
548
.10
81
173 .
351
96
96
a
111
.1
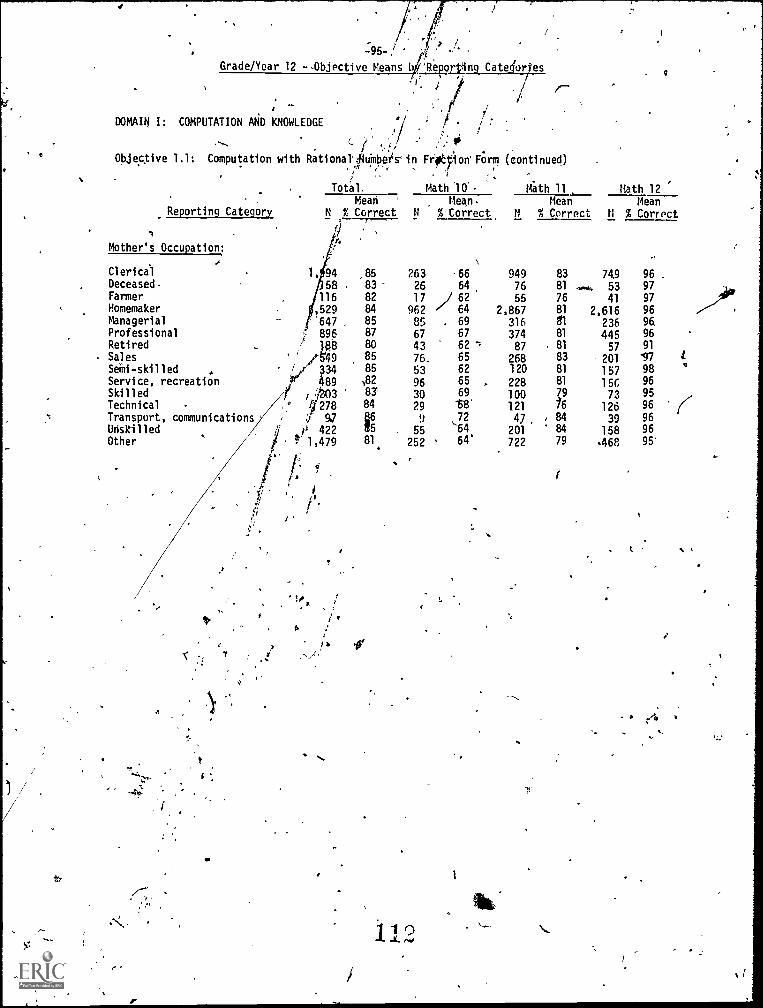
t.
Grade/Year 12 Objective Means'b
DOMAIN I: COMPUTATION AND KNOWLEDGE
L
Objective 1.1: Computation with Rational' 4mbees'in
Total.
MeadReporting Category Correct
Mother's Occupation:
Clerical
Deceased.
FarmerHomemakerManagerialProfessionalRetiredSales
Semi- skilled ,
Service, recreationSkilledTechnical
Transport, communicationsUdskilledOther
N %
1, 9458
116
,529
'.647896
/P9 84
334489
3
/2781, 97
4227' 1,479
a
f'
1 I
Repgrpla CateOrtes
/
/*
.
FrOVion' Form (continued)
I
Math '10'-
Mean.N % Correct
Math 11
MeanM % Correct
0
Math 12
MeanN % Correct
85 263 -66 949 83 74,9 96. 83' 26 64 76 81 ......, 53 97
82 17 ,/ 62 55 76 41 9784 962 64 2,867 81 2,616 9685 85 69 316 81 236 9E87 67 67 374 81 445 96
8580 43
76,
6265
-; 87268
81
8357
201
91
1785 63 62 120 81 157 98)82 96 65 228 81 15G 9683. 30 69 100 79 73 9584 29 68' 121 / 126 96
9 ,72 4) , 84 39 9655 -64 201 84 158 96
81 252 64' 722 79 468 95'
112
1
It'
4.0
.
O
I.
(
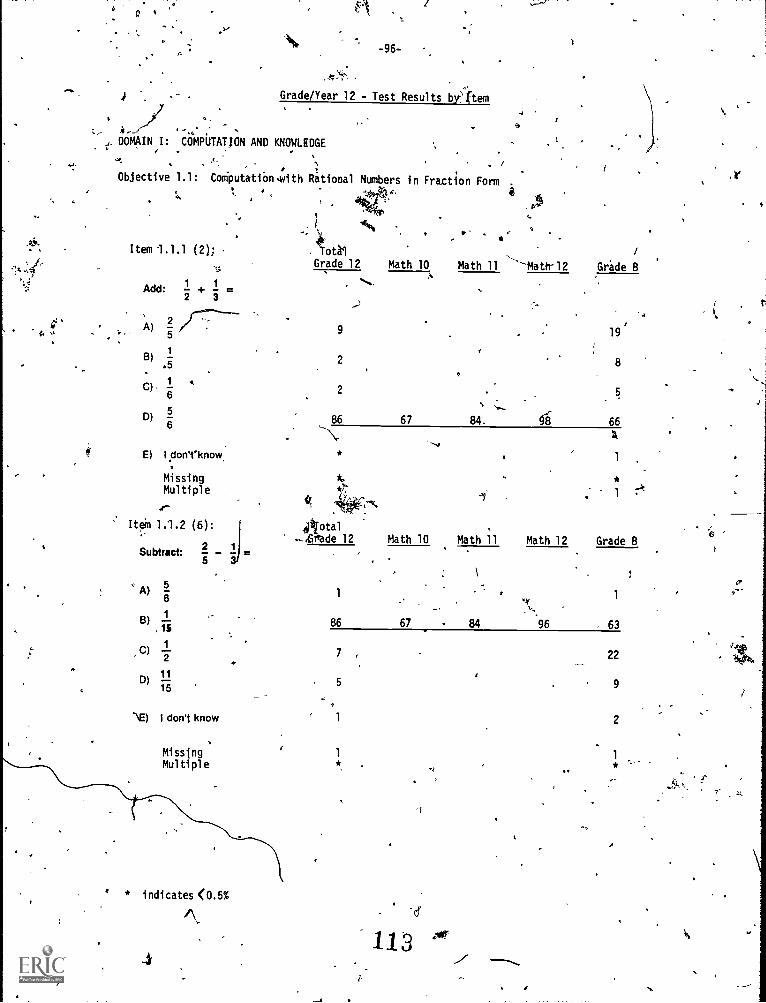
R
-96-
4 Grade/Year 12 - Test Results biftem
i.
e DOMAIN I: COMPUTATION AND KNOWLEDGE
,
Objective 1.1: CoMputatiOnZith Rational Numbers in Fraction Form .
-43,pf
Item 1.1.1 (2);
Add:1 1+ =2 3
/77-s--5
1
.5
1
6
5
6
A)
B)
C)
D)
E) Idon't-know
MissingMultiple
I* 1.1.2 (6):
Subtract: 2- -5
\E) I don't know
MissingMultiple
* indicates <0.5%
4
'AR
ThalGrade 12
. .,
9
2
2
Math 10
rt
*'
Math 11 -1.1ath-12
5
86 67 84. 98 66a
1
401otal-,Gitade 12
1
*
1
Math 10 Math 11 Math 12 Grade 8
1
86 67 84 96 . 63
7 22
5 9
1 2
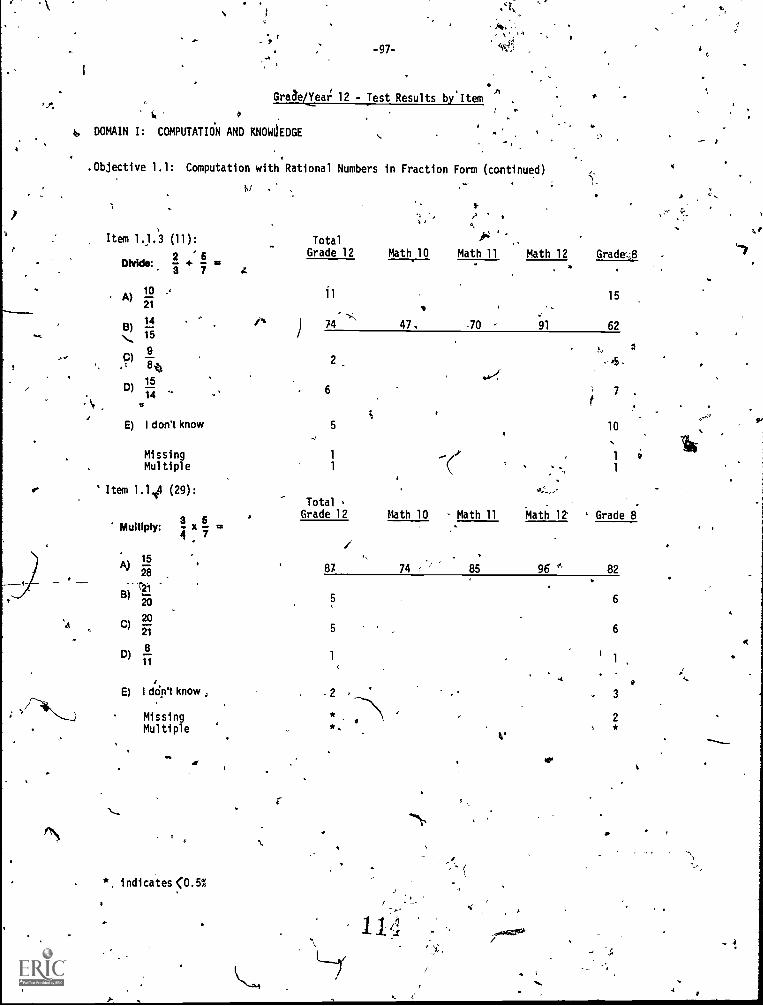
-97-
GraaeCeat 12 - Test Results by'Item
k, DOMAIN I: COMPUTATION AND KNOWLEDGE
.Objective 1.1: Computation with Rational Numbers in Fraction Form (continued)
s-
,, , ? .I, ..
Item 1.1.3 (11): Total fr .,Grade 12 Math 11 Math 12 Grad2 6 Math 10
Divide: + .
A)21
1011 15
B)14 tt, ) 74' 47, .70
...
91 6215
9P) at . '5.
15 4....
D) ,Th .. 6 ' 7 .
g
E) I don't know 5 10
(1'Missing 1 '1 iv
' Item 1.1,4 (29):
1 - - 1
4.:..:
Total .
Grade 12 Math 10 'Math 11 Math 12 Grade 83 6Multiply: - x
A)
B)
C)
D)
15
28
721
20
20
21
8
11
4
E) I cldn't know
MissingMultiple
4
*, indicates <0.5%
or
Mul tipl e
87 74 r 85 96 °' 82
5
2
or
3
6
6
1
2*
<
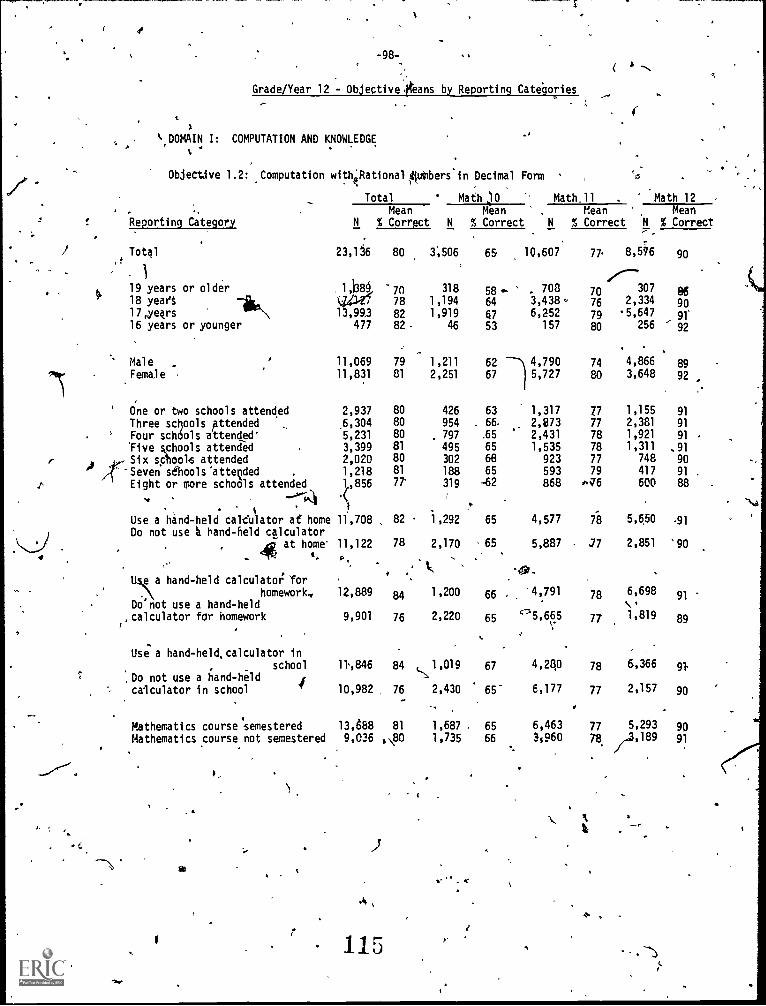
-98-,
Grade/Year 12 - Objective. Bans by Reporting Categories
',DOMAIN I: COMPUTATION AND KNOWLEDGE
Objective 1.2: Computation witheationalpnbers.in Decimal Form
c.
MaleFemale
#,)
.4,
Total...
. , Meanf. Reporting Category N % Correct
i Total 23,136 80a
1
19 years or older, 1#138§ '70
17,ye4rslik,\
W/,187 7813,9,4; si,
18 yeart
16 years or younger
11,069 79
11,831 81
' One or two schools attended 2,937 80
Three schools Attended .6,304 80
' Four schools attended' 5,231 80
'Five schools attended 3,399 81
Six schools attended 2,020 80
-Seven saools'attegded 1,218 81
Eight or more schools attended 1,856 77'
4 ,
%
Use a hand-held caldulator of home 11,708 82
Do not use a hand-held calculator, .A at home' 11,122 78
Us, a hand-held calculatotl. forA homework, 12,889 84Do'not use a hand-held
,calculator far homework 9,901 76
Use'a hand-held,calculator inschool 11,846 84 5Do not use a and-held
/calculator in school 10,982 76
Mathematics course.semestered 13,688 81
Mathematics course not semestered 9,036 ,\80
115
f
Math 10 Math_11 . Math 12Mean , Mean Mean
N % Correct N % Correct N % Correct
3,506 65 10,607 77' 8,54 90
307318 708 70 861,194
58
1,9193,438- 76 2,334 90
6,N; -5,647 gi
46 256 92
1,211 62 4,790 74 4,866
12,251 67 5,727 80 3,64889
92
426 63 1,317 77 1,155 91
954 66. 2,873 77 2,381 91
797 .65 2,431 78 1,921 91
495 65 1,535 78 1,311 ,91
302 68 923 77 748 90
188 65 593 79 417 91 .
319 -62 868 0q6 600 88 .
.''
1,292 65 4,577
2,170 , 65 5,887
1,200 66 , . 4'791
2,220 65 '5,665
1,019 67
2,430 65-
4,200
6,177
1,687. 65 6,4631,735 66 2;960
78 5,650
J7 2,851
78 6,698
\'
77 1,819
77 5,293
78 ,3,189
78
77
6,366
2,157
,
-91
'90
91 -
89
9,
90
go
91
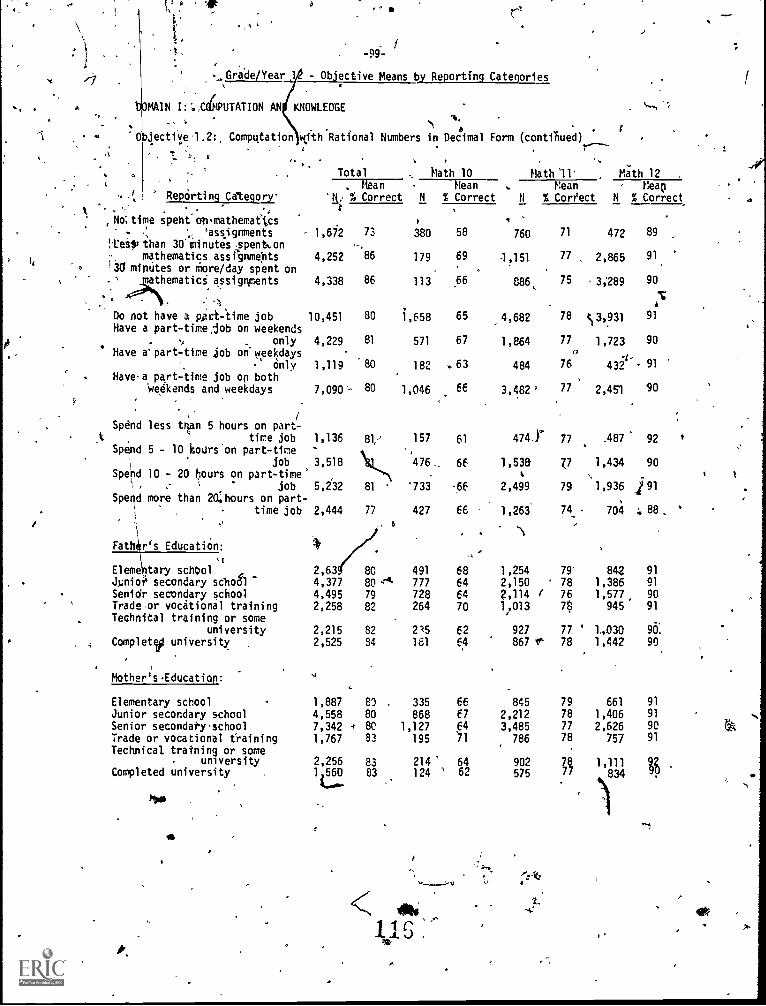
,,Grade /Year
-99-/
Ob'ective Means by Reporting Categories
MAIN l:',CiMPUTATION AN. KNOWLEDGE
Compqtation rcithRational Numbers in Decimal Form (contiTmed)
, . . ,
Total , Math 10 Math 11' Math 12Mean . Mean Mean Meap.
Reporting Category 'a, % Correct N % Correct Ii % Correct N % Correct .
spent on,mathemaetcs ,-,No;time
- ', :assignments - 1,672 73 380. ,
Ieilifthan 30'minutes spent,on -,
mathematics,assfgnments 4,252 86 179I3U minutes or More/day spent on
thematici assignments 4,338 86 113
." --4
Do not have a pit -time job 10,451 80 1,658Have a part-time, ob on weekends
. only 4,229 81 571
Have a-part-time job on weekdaysonly 1,119 'ao 182
Have.a part-time job on bothweekends and weekdays 7,090'- 80 1,046
Spend less trtan 5 hours on partt tire job 1,136 81,-' 157
Spend 5 - 10 hours'on 'part-timejob 3,518 476_
Spehd 10 - 20 ?ours on part-time', ; job 5,232
Spend more than 20; hours on part-time job 2,444
Fatlir's Education:
Eleme\tary school
,
2,639 80 491
81
77
s
'733
427
Jimioi secondary sctio61 4,377 80 -'11- 777Senidr secondary school 4,495 79 728Trade .or vocational training 2,258 82 264Technical training or some
university 2,215 82 215, Completip university 2,525 84 181
Mother'sEducation: .
Elementary school 1,887 83 335Junior secondary school 4,558 80 868Senior secondary-school 7,342 4 80 1,127Trade or vocational training 1,767 83 195Technical training or sore
university 2,256 83 214Completed university 1560 83 124
a
I,.
0
58
69
66
760
4,151
886,
71
77 .
75
65 _4,682 78
67 1,864 770
63 484 76
66 3,482' 77
61 474,Y 77
66 1,538 Z7
-66 2,499 79
66 1,263 74
68 1,254 79'
64 2,150 78
64 2,114 ( 7670 1,013 7$
62 927 77 '
64 867 10- 78
66 845 79
E7 2,212 78
64 3,485 77
'71 786 78
64 902 78' 62 575 77
k.......
< 4411
11 .
472 89
2,865 91.
. 3;289 90
S 3,031 91
1,723 90
432 91
2,451 90
.487 92
1,434 90
1,936 191
704 88 '
842 91
1,386 91
1,577, 90
945 91
1.,030 90.
1,442 90
661 91
1,406 91
2,626 90
757 91
1,111 4834
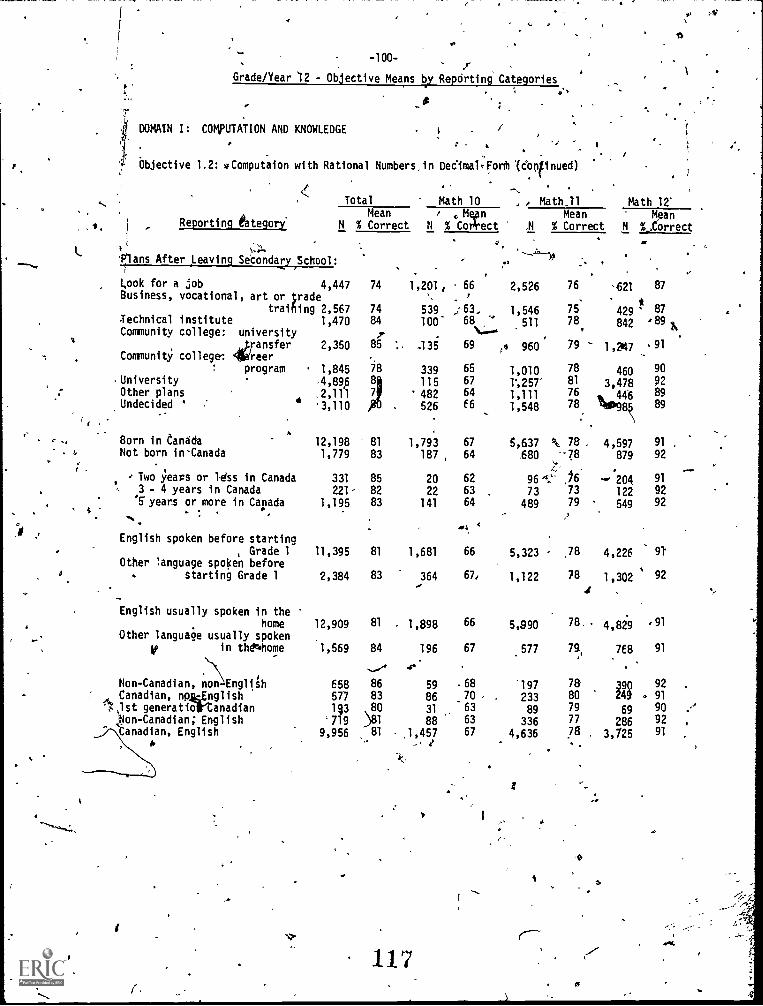
L
vd
4
4
-100-.r
Grade/Year 12 - Objective Means by Reporting Categories
DOMAIN I: COMPUTATION AND KNOWLEDGE
Objective 1.2: *Computaion with Rational Numbers,in DeeimalrForM '(continued)
Reporting category
ans After Leaving
Look for a jobBusiness, vocational
Technical instituteCommunity college:
Community college:
UniversityOther plansUndecided '
8orn in CanadaNot born in'Canada
Total
MeanN % Correct
SecondavSchool:
4,447, art or trade
training 2,5671,470
universitygansfer 2,350
program 1,845,4,896
.2,111
3,110
12,1981,779
Two years or Idss in Canada 3313 - 4 years in Canada 221-
1,195*5 years or more in Canada
English spoken before startingGrade 1
Other language spOcen beforestarting Grade 1
11,395
2,384
English usually spoken in thehome 12,909
Other language usually spokenin th.ftome 1,569
Non-Canadian, jonEngliMiCanadian, npianglish
r 1st generatioirCanadianYon-Canadian; English'Canadian, English
658577
113
`7199,956
Math 10 , Math,11 Math 12'
o Mepn Mean ManN % Covect 1.1 % Correct N %,Correct
74 1,201, 66 2,526 76 ,621 87
74 539 ;63_ 1,546 75 429 8784 100- 68 511 78 842 '891,,
85,
.13 69 is 960 79 1,247 91
78 339 65 1,010 78 460 908
1414
67
6412571,111
81
763,478
1,
92
89
526 f6 1,548 78_446
IMID98 89
81 1,793 67 6,637 k 79. 4,597 91
83 187 , 64 .680 879 92
...11
85 20 62 ,,6 -v. 204 91
82 22 63 73 73 122 9283 141 64 489 79 549 92
24,4
81 1,681 66 5,323 - ,78 4,226
83 364 67f 1,122 78 1,302 92
.
81 1,898 66 5,990 78. 4,829 '91
84 196 67 .577 79, 768 91
86 59 .68 197 78 390 92
83 86 70 233 80 249 . 91
80 31 '63 89 79 69 90
)81 88 63 336 77 286 9281 .1,457 67 4,636 78 3,725 91
-4;
117
(
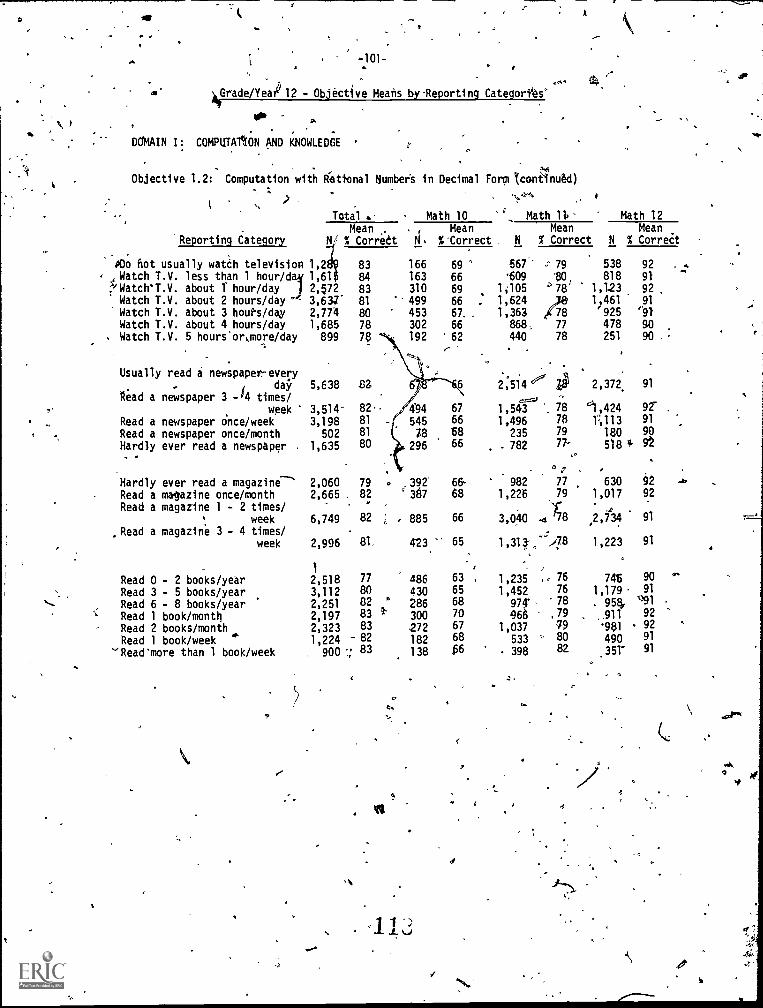
a
\
a Grade /Years l2 - Objective Means by-Reporting Categories'
DCMAIN I: COMPUTAAON AND KNOWLEDGE
Objective 1.2: Computation with k"ettonal Number's in Decimal Form Icontlnad)t
4
Total Math 10 Math 11 Math 12
ean , ( Mean Mean Mean'Reporting Category % Corrett N. %'Correct _ N % Correct N % Correct
100 not usually watch television 1,2 83 166 69, A Watch T.V. less than 1 1,61 84
'/Watch'T.V. about 1 hour/day 2,572 83163 66310 69
Watch T.V. about 2 hours/day '- 3,637- 81 '- 499 66
Watch T.V. about 3 hours /day 2,774 80 453 67Watch T.V. about 4 hours/day 1,685 78 302 66
. Watch T.V. 5 hoursor,more/day 899 78 192 62-
,-
Usually read a newspaper-everyday 5,638 82
Read a newspaper 3 -14 times/week 3,514- 82 04 67
Read a newspaper Once/week 3,198 81
Read a newspaper once/month 5022080
545gi78
ever read a newspaper . 1,631 296 66
Hardly ever read a magazine'Read a magazine once/monthRead a magazine 1 - 2 times/
weekRead a magazine 3 - 4 times/
week
Read 0 - 2 books/yearRead 3 - 5 books/yearRead 6 - 8 books/yearRead 1 book/monthRead 2 books/monthRead 1 book/week '''
Read'more than 1 book/week
2,060 79
2,665 82.
6,749 82
2,996 81,
1
2,5183,112
2,2512,1972,3231,224
900
77
808283838283
, 392- 66-
387 68
885 66
423 65
486430286300
272182138
lv
63
656870
6768f6
567- 79
'609 601,105 '' 78'
. 1,624, 1,363 4:
868, 77
440 78
538818
1,1231 461
'925478251
92
91
92
91
'91
9090
4
2;514' VII 2,372 91
1,543 0 78 '1,424 92-
1,496 78 l':,113 91
235 79 180 90
782 77- 518 q, 92
982 77 630 92
1,226 79 1,017 92
3,040 41 68 ,2,734 91
,i7.8 1,223 91
, .
1,235 .. 76 746 90 9.
1,452 76 1,179 91
974 78 984. v91
966 .79 _911 92
1,037 79 0 92
533 w 80 490 91
398 82. 351" 91
9 4 4
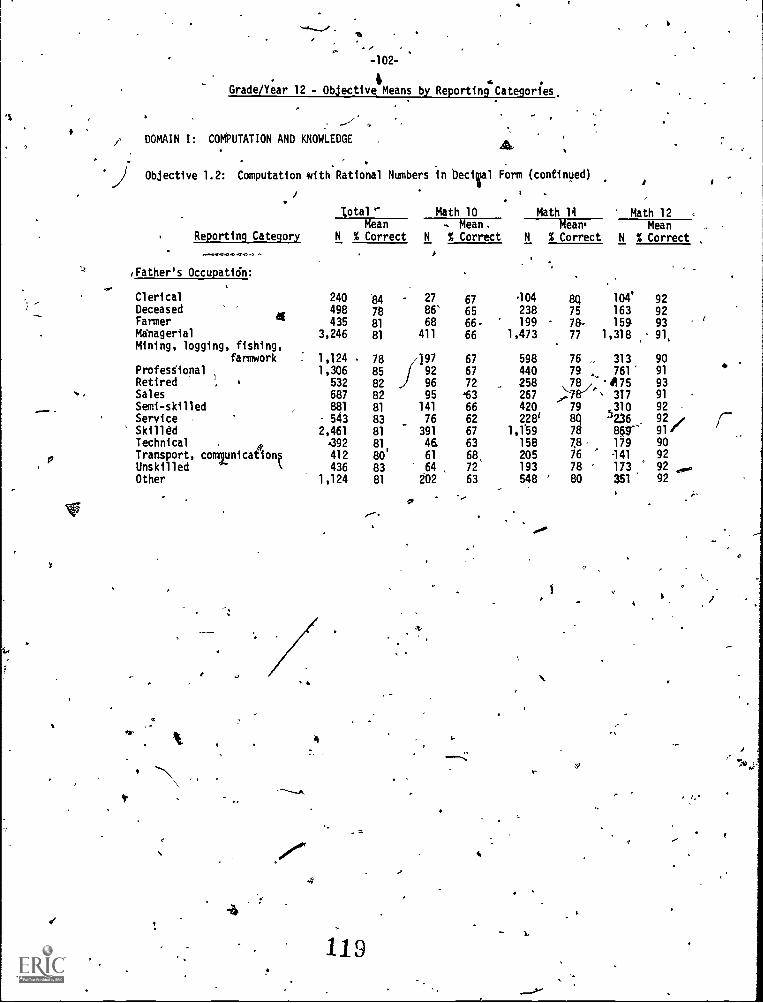
t
-102-
4Grade/Year 12 - Objective Means by Reporting Categories.
DOMAIN I: COMPUTATION AND KNOWLEDGE
Objective 1.2: Computation with Rational Numbers in becilal Form (continued)
) .
.
total*" Math 10 Math 14 Math 12Mean , Mean, Means Mean
Reporting Category N % Correct N % Correct N % Correct N % Correct
I
,Father's Occupation:
ClericalDeceasedFarmer 41
Managerial
Mining, logging, fishing,farmwork
ProfessionalRetiredSalesSemi-skilledService -
SkilledTechnical .
Transport, comnjunicationtUnskilledOther
240
3
498'84
°81
- 27
86'
68411
1,124 781,306 85 92
532 82 96687 82 95881 81 141
543 83 76
2,461 81_
391
4192 81 46412 80' 61
436 83 64 ,
1,124 81 202
o
119
67
656666
67
67
72
'63
6662
67
63
68,
72
63
04238199
1,473
598440
2582674202281
1,159158205193548 '
.
8875
78-
77
76 _
79
78 /"
79
8078Z8-76
7880
104'
163159-
1,318
313761
11175
317
310J236864r-179-141
173351
929293
e
91,
9091
9391
9292 ,,91,9092
92 .....
92
4
.00
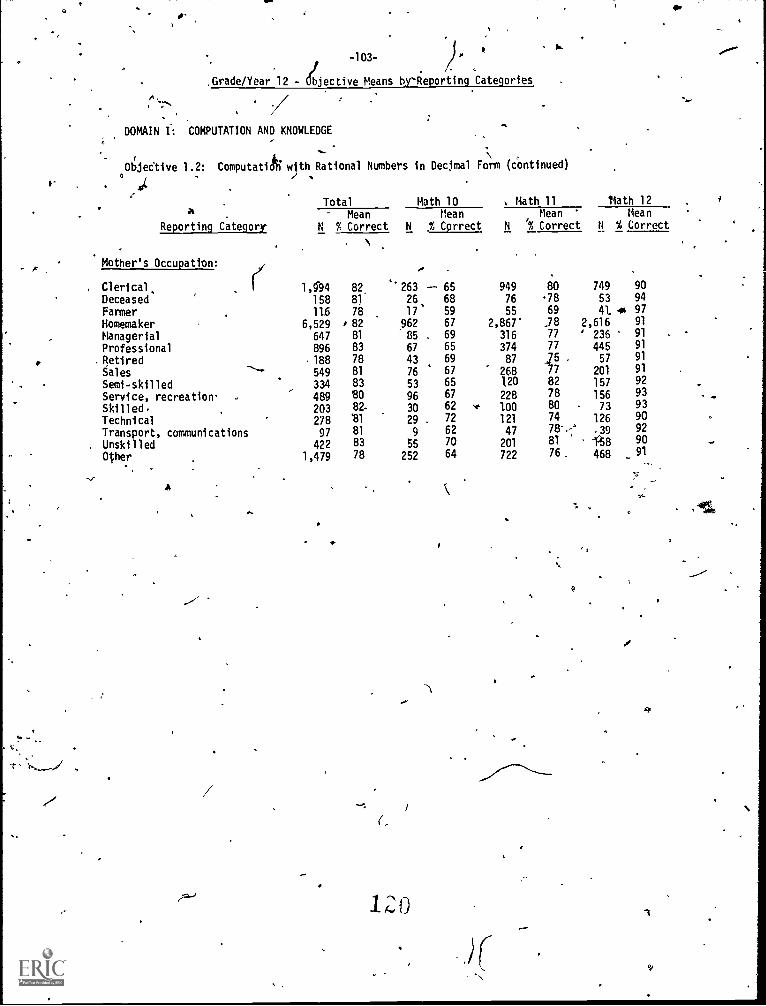
o
-103-)14
.Grade/Year 12 - Objective Means by-Reporting Categories
"r- /DOMAIN COMPUTATION AND KNOWLEDGE
Objective 1.2: ComputatikwIthRational Numbers in Decjmal Form (continued)
X4
a
Reporting Category
Total Math 10 1 Math 11 'lath 12
Mean Mean Mean Mean
N % Correct N ,% Correct N % Correct N % Correct
Mother's Occupation:
(
-,_
1,594
158116
6,529
647
896. 188
549
334
489203278
97
4221,479
82
81
78
' 82
81
8378
81
83BO
82-
In
81
83
78
''263 --26
17'
96285
67
43
76
53
9630
299
55
252
Clerical,DeceasedFarmerHomemakerManagerialProfessionalRetiredSalesSemi-skilledService, recreation' ,
SkilledTechnicalTransport, communicationsUnskilledOther
a
65 949 80 749 90
68 76 78 53 94
59 55 69 41 41 97
67 2,867' .78 2,616 91
69 316 77 ' 236 91
65 374 77 445 91
69 87 - 57 91
67 268..:78
77 201 91
65 120 82 157 92
67 228 78 156 9362 * 100 80 73 9372 121 74 126 90
62 47 78'-'-' .39 92
70 201 81 -.(8 9064 722 76. 468 91
3
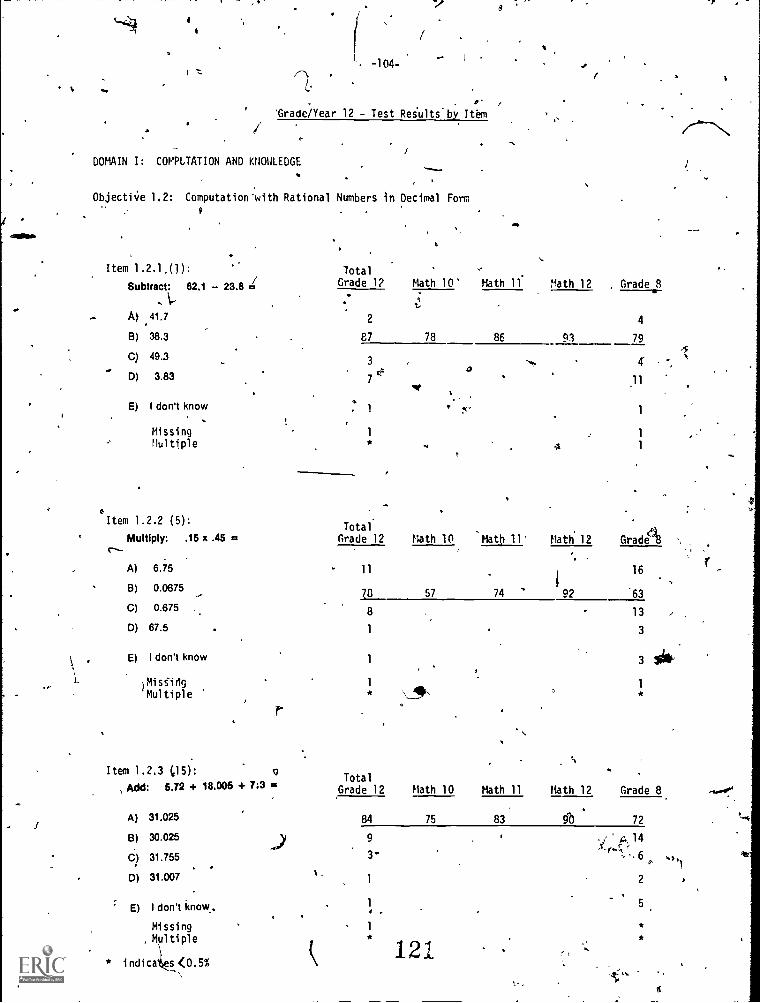
4
ti
8
- -1(14-
'Grade/Year 12 - Test Results by Item
DOMAIN I: COMPLTATION AND KNOWLEDGE
Objectiie 1.2: Computation 'with Rational Numbers in Decimal Form
Item 1.2.1.(1):Subtract: 62.1 - 23.8 =
M 41.7
8) 38.3
C) 49.3
D) 3.83
E) I don't know
MissingHui tiple
6
Item 1.2.2 (5):Multiply: .15 x .45 =
A) 6.75
8) 0.0675
C) 0.675
D) 67.5
E) I don't know
)MissingMultiple
r
Item 1.2.3 (15): 9
, Add: 6.72 + 18.005 + 7.3 4*
A) 31.025
B) 30.025
C) 31.755
D) 31.007
E) I don't know,,
Missingultiple
* indica <0.5% k
I
lotalGrade 1? Math 10' Math 11 lath 12 Grade 8
2 4
87 78 86 9i 79
3
7e
11
. 1 c 1
1 1
1
TotalGrade 12 Math 10 Math Il Math 12 Grades
11
1
16
78 57 74 92 63
8 13
1 3
1
*
TotalGrade 12 Math 10 Math 11 Math 12 Grade 8
84 75 83 0 72
9
31
1
4 .
1
x,14',. ,.6
2
,5
121
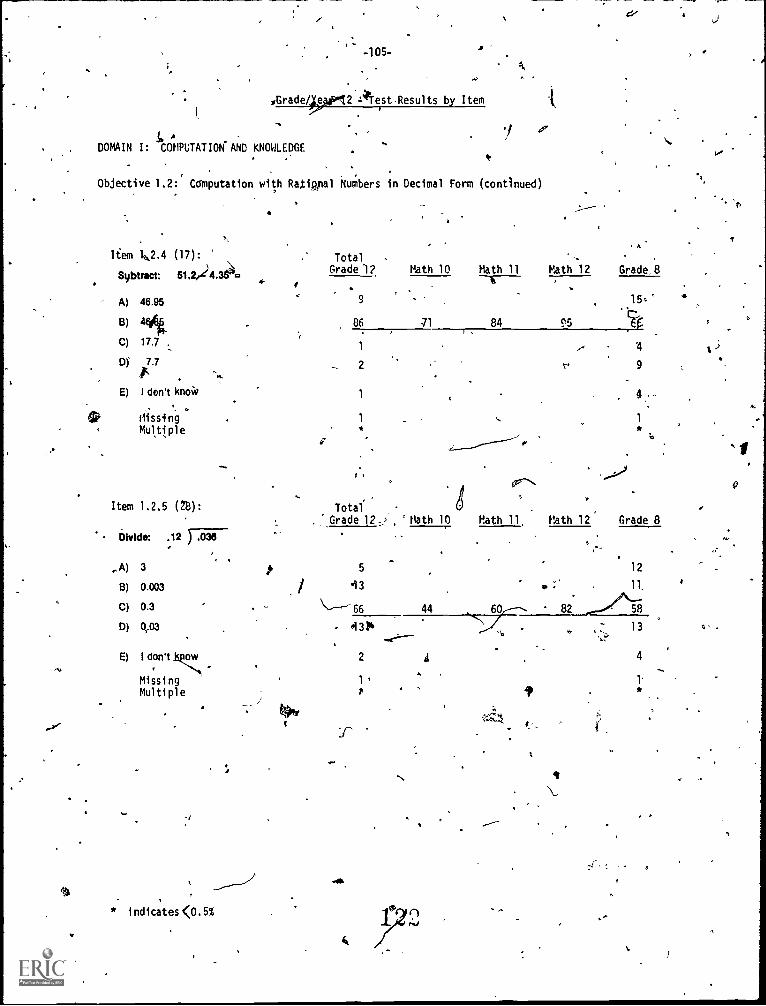
-105-61,
oGrade$W0T2 141est.Results by Item
DOMAIN I: COMPUTATION* AND KNOWLEDGE#
Objective 1.2: Computation with Ratippal Numbers in Decimal Form (continued)
Item 1ba.2.4 (17):
Sybtract: 61.2,24.364=
A) 46,95
B) 4-C) 17.7
Di 7.7ar
E) I don't knoW
itissingMultiple
4-I
.. 4
TotalGrade 1? Math 10 Math 11 Math 12 Grade 8
-Th----9
86 .71 84
2
1
15t
4
9
4-1
*
r" 0
Item 1.2.5 (28): Total. .
Grade 12_2 , ' Math 10 Math 11 Math 12 Grade 8
- Divide: .12 )70-3-6, ' ,....
,A) 3 t 5 12
B) 0.003 / 13 p :' , 11.
C) 0.3 ,\------66 44 60 82....../573
D) 0.03 *13/ 13 on
E) t don't 1SFow 2
Missing 1
Multiple
* indicates <0.5%
k
4
cf
Iov
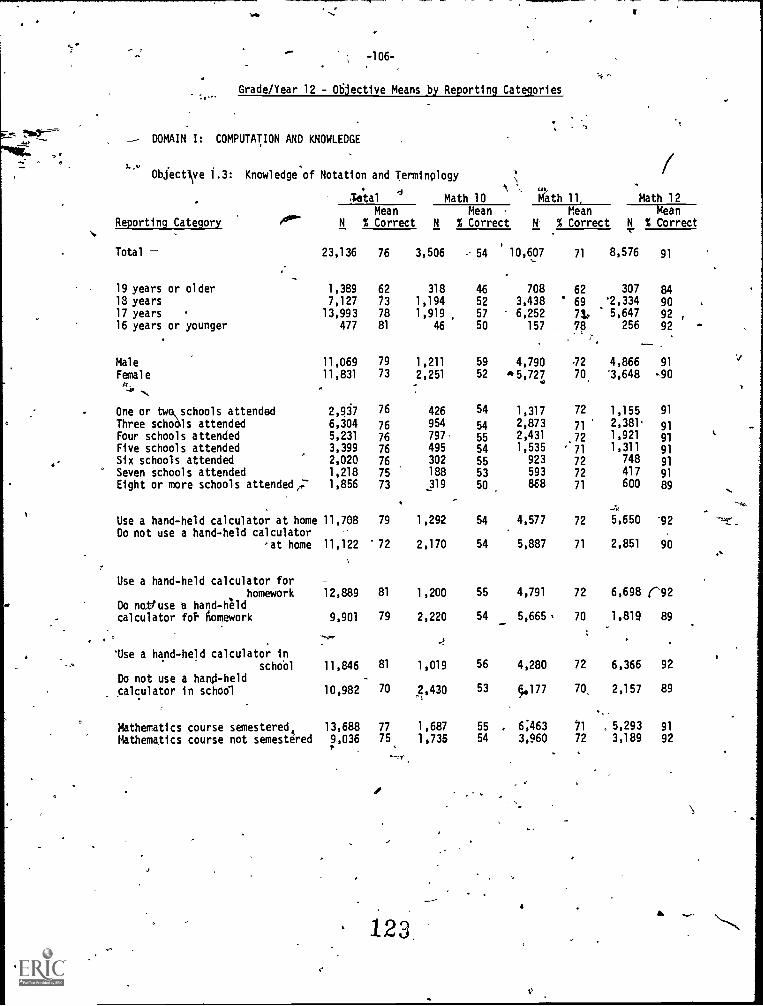
-106-
Grade/Year 12 - 06jective Means by Reporting Categories
- DOMAIN I: COMPUTATION AND KNOWLEDGE
Objective 1.3: Knowledge of Notation and Terminology ,
N
Reporting Category
(.3
fetal ' Math 10'Math
11, Math 12Mean Mean Mean -Mean
001'"" N % Correct N % Correct N % Correct N % Correct
Total 23,136
19 years or older18 years
17 years16 years or younger
1,389
7,12713,993
477
Male 11,069
Female 11,831
One or two,,schools attended 2,937
Three schools attended 6,104Four schools attended 5,231
Five schools attended 3,399
Six schools attended 2,020
Seven schools attended 1,218
Eight or more schools attended,; 1,856
Use a hand-held calculator at home 11,708Do not use a hand-held calculator
at home 11,122
Use a hand-held calculator forhomework 12,889
Do notuse a hand-heldcalculator foF homework 9,901
Use a hand-held calculator inschool 11,846
Do not use a hand -held
calculator in school 10,982
Mathematics course semesteredt 13,688
Mathematics course not semestered 9,036
76 3,506 54 10,607 71 8,576 91
62 318 46 708 62 307 84/3 1,194 52 3,438 * 69 '2,334 9078 1,919 57 6,252 71, 5,547 9281 46 50 157 , 78 256 92
79 1,211 59 4,790 2 4,866 91
73 2,251 52 45,727 70. '3,648 ,90
7766
426
954
54
54
1,317
2,873
72
71
1,1552,381,
91
91
76 797 55 2,431 72 1,921 91
76 495 54 1,535 ' 71 1,311 91
76 302 55 923 72 748 91
75 188 53 593 72 417 91
73 319 50 868 71 600 89
--.
79 1,292 54 4,577 72 5,550 -92
72 2,170 54 5,887 71 2.851 90
81 1,200 55 4,791 72 6,698 ('92
79 2,220 54 5,665, 70 1,819 89
81 1,019 56 4,280 72 6,366 92
70 2,430 53 177 70, 2,157 89
77 1,687 55 6;463 51 , 5,293 91
75 1,735 54 3,960 72 3,189 92
.may
123,
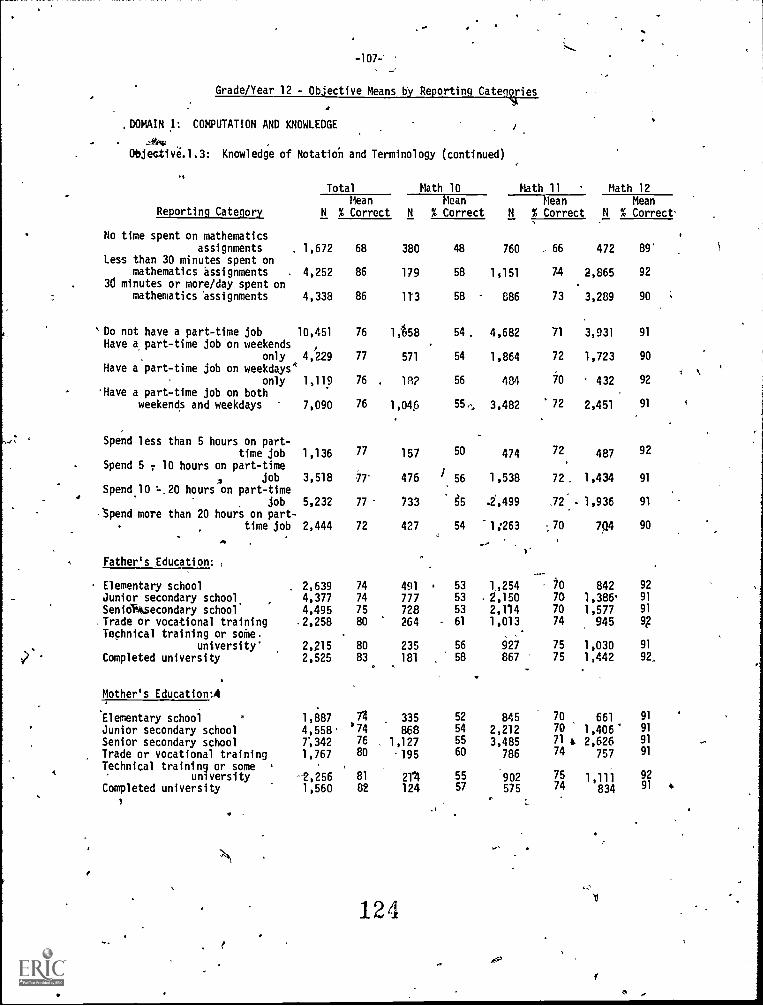
Grade/Year 12 - Objective Means by Reporting Categvies
.DOMAIN I: COMPUTATION AND KNOWLEDGE
.
Objective.1.3: Knowledge of
1
Reporting Category
Notation and Terminology (continued)
Total Math 10 Math 11 Math 12Mean
N % Correct N
380
179
1T3
1,"658
571
1R2
1,046
157
476
733
427
491
777728264
235
.
181
335
8681,127-195
211124
Mean Mean% Correct N % Correct
MeanN % Correct'
No time spent on mathematicsassignments ,
Less than 30 minutes spent onmathematics assignments .
30 minutes or more/day spent onmathematics assignments
Do not have a part-time jobHave a, part-time job on weekends
onlyHave a part-time job on weekdays'
onlyHave a part-time job on both
weekends and weekdays
Spend less than 5 hours on part-time job
Spend 5 7 10 hours on part-timejob
Spend 10 L.20 hours on part-timejob
'Spend more than 20 hours on part-time job
Alt
Father's Education:
1,672
4,252
4,338
10,451
,
4,229
1,119
7,090
1,136
3,518
5,232
2,444
2,6394,3774,4952,258
2,2152,525
1,887
4,5587;3421,767
-2,2561,560
68
86
86
76
77
76
76
77
47.
77
72
74
74
7580
80
83
74
17476
80
81
82
,
.
/
.
48
58
58
54,
54
56
55,,
50
56
g5
54
5353
53
61
56
58
52
54
5560
5557
760
1,151
886
4,682
1,864
484
3,482
474
1,538
.2,499
-1;263
)
1,254. 2,150
2,1141,013
927867
8452,2123,485
786
902575
. 66
74
73
71
72
70
72
72
72 .
321-
:70
_
* 70
7G7074
75
75
70
70
71 t74
7574
472
2,865
3,289
3,931
1,723
. 432
2,451
487
1,434
1,936
7Q4
8421,386'
1,577945
1,0301,442
661
1,406"2,626
757
1,111834
89'
92
90
91
90
92
91
92
91
91
90
92
91
91
92
91
92,
91
91
91
91
9291
Elementary schoolJunior secondary school.
,
Seniaitsecondary schoolTrade or vocational trainingTechnical training or some.
university'Completed university
Mother's Education:4
Elementary schoolJunior secondary schoolSenior secondary schoolTrade or vocational trainingTechnical training or some .
universityCompleted university
"3
0
124
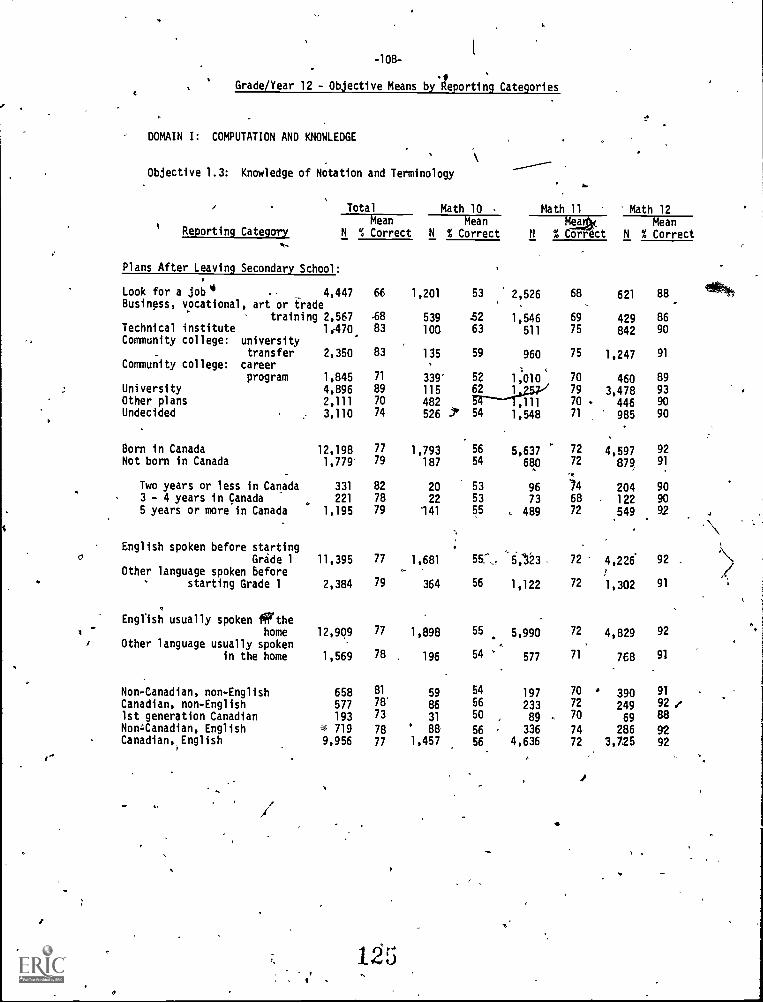
-108-
Grade/Year 12 - Objective Means byleporting Categories
DOMAIN I: COMPUTATION AND KNOWLEDGE
Objective 1.3: Knowledge of Notation and Terminology
0
Reporting Category
Total
MeanN % Correct
Plans After Leaving Secondary School:
66
68
83
83
71
89
70
74
77
79
82
7879
77
79
77
78 .
81
78'
73
78
77
Look for a job 4,447Business, vocational , art or trade
training 2,567Technical institute 1,470Community college: university
transfer 2,350Community college: career
program 1,845University 4,896Other plans 2,111Undecided 3,110
Born in Canada 12,198Not born in Canada 1,779
Two years or less in Canada 331
3 - 4 years in Canada 221
5 years or more in Canada 1,195
English spoken before startingGrade 1 11,395
Other language spoken beforestarting Grade 1 2,384
English usually spoken gthehome 12,909
Other language usually spokenin the home 1,569
Non-Canadian, non-English 658Canadian, non-English 5771st generation Canadian 193No0Canadian, English 719
Canadian,English 9,956
I
Math 10Mean
N % Correct
Math 11 Math 12
tUSIK MeanPf % Correct N % Correct
1,201 53 2,526
539 52 1,546100 63 511
135 59 960
339' 52 1,010115 621 .257/482 5----7,111526 54 1,548
1,793 56 5,637187 54 680
2022
141
53 9653 7355 , 489
1,681 5:323
56 1,122364
1,898
196
59
86
31
881,457
55 5,990
54 ' 577
54 19756 23350 89
56 336
56 4,636
68 621 88 AtIvr,
69 429 86
75 842 90
75 1,247 91
70 460 89
79 3,478 9370 446 90
71 985 90
72 4,597 9272 879 91
/4 204 9068 122 90
72 549 92
72 4,226 92
72 1,302 91
72 4,829 92
71 768 91
70 390 91
72
7024969
92 e88
74 286 92
72 3,725 92
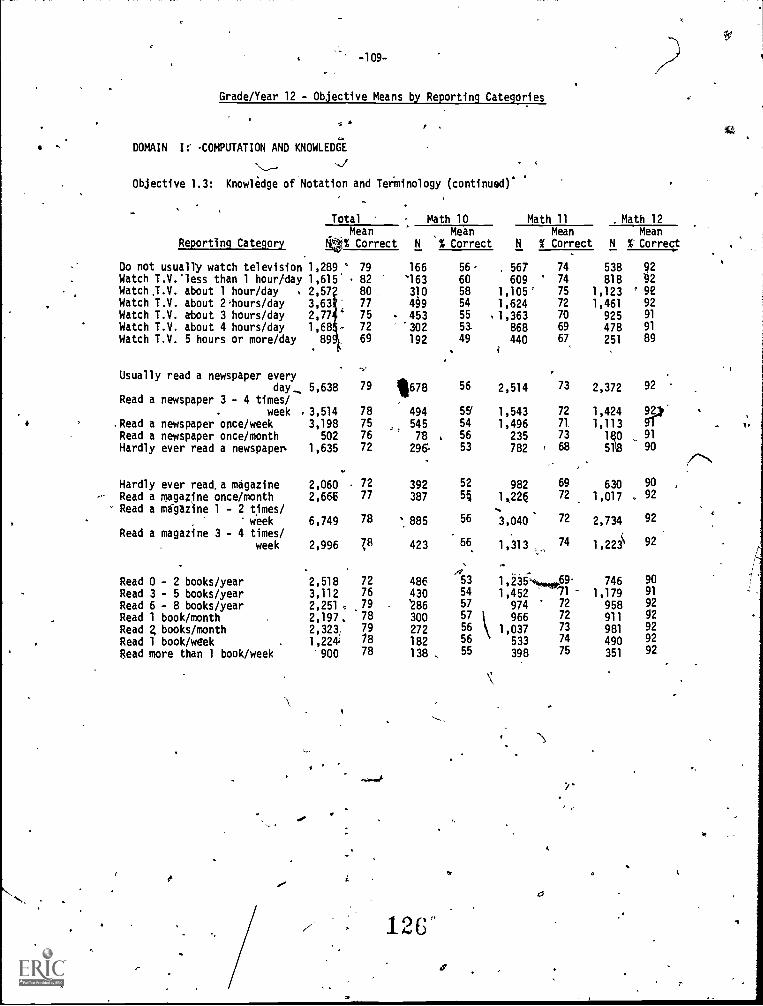
-109-
Grade/Year 12 - Objective Means by Reporting Categories
DOMAIN I:' COMPUTATION AND KNOWLEDGE
\-Objective 1.3: Knowledge of Notation and Terminology (continuod
Total Math 10 Math 11 . Math 12Mean Mean Mean Mean
Reporting Category kyr% Correct N % Correct N % Correct N % Correct
Do not usually watch television 1,289 ° 79 166Watch T.V.°1ess than 1 hour/day 1,615 82 '163Watch .T.V. about 1 hour/day , 2,57 80 310Watch T.V. about 2,hours/day 3,63 77 499Watch T.V. about 3 hours/day 2,77 75 453Watch T.V. about 4 hours/day 1,68 72 "302Watch T.V. 5 hours or more/day 89 69 192
Usually read a newspaper every- Y
day_ 5,638 79
Read a newspaper 3 - 4 times/week 3,514 78
.Read a newspaper once/week 3,198 75
Read a newspaper once/month 502 76
Hardly ever read a newspaper 1,635 72
Hardly ever read.a magazine 2,060 72
Read a magazine once/month 2,666 77
Read a magazine 1 - 2 times/week 6,749 78
Read a magazine 3 - 4 times/week 2,996 78
Read 0 - 2 books/year 2,518 72
Read 3 - 5 books/year 3,112 76
Read 6 - 8 books/year 2,251 79
Read 1 book/month 2,197. 78Read 2 books/month 2,323, 79Read 1 book/week 1,2241 /8
Read more than 1 book/week 900 78
11678
494545
78 ,
296-
392387
`, 885
423
486430'286
300
272182138 ,
1O6"
56- . 567 74 538 9260 609 74 818 92
58 1,105' 75 1,123 ' 92
54 1,624 72 1,461 92
55 .1,363 70 925 91
53 69 478 91
49 440 251 89
56 2,514 73 2,372 92
5& 1,543 72 1,424 9ht.54 1,496 71 1,11356 235 73 180 91
53 782 r 68 5118 90
52 982 69 630 90
5 1,,22Q 72 1,017 92
56 3,040 72 2,734 92
56 1,313 74 1,2221" 92
. ..
53 1,2367,4,,,0,69' 746 90
54 1,452 '71 1,179 91
57 974 72 958 92
57 k 72 911 52
1,037 981 92
56 \ 533 74 490 92
55 398 75 351 92
7/
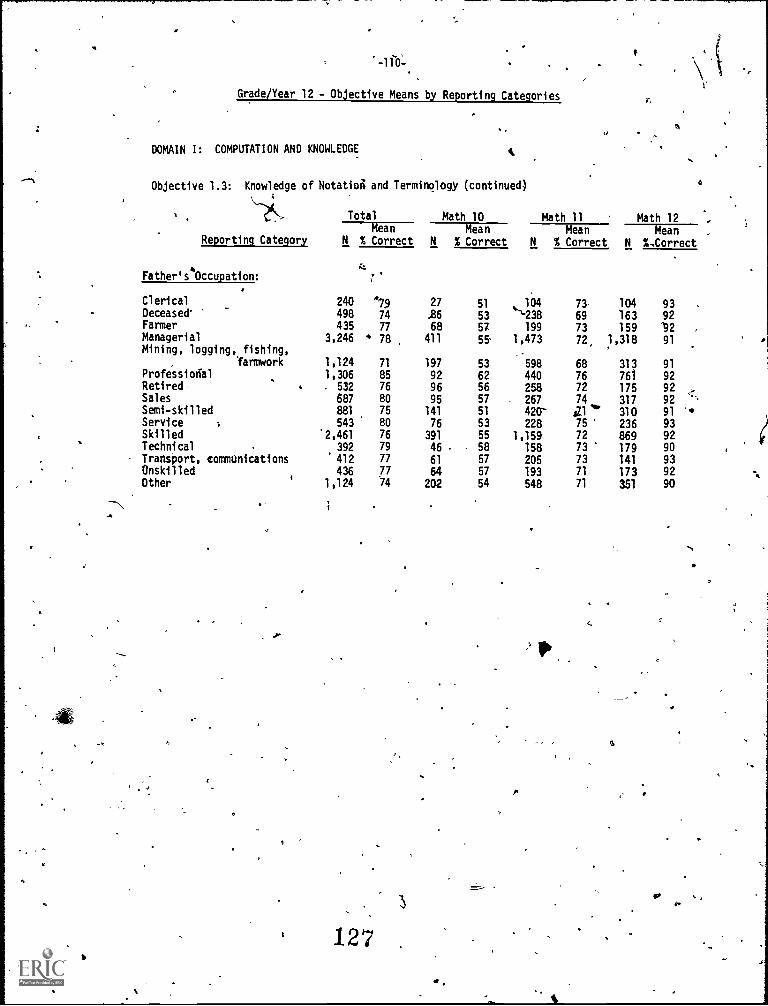
I
Grade/Year 12 - Objective Means by Reporting Categories
DOMAIN I: COMPUTATION AND KNOWLEDGE
Objective 1.3: Knowledge of Notatioi and Terminology (continued)
---7,).,- Total Math 10 Math 11 Math 12 ,
Mean Mean Mean MeanReporting Category N % Correct N % Correct N % Correct N %Zorrect
Father's4Occupation:
4
240498
435
3,246
1,124
1,306. 532
687881
543
'2,461
392
412436
1,124
k,..
;
479
74
77
' 78
71
85
76
8075
80
76
79
77
7774
27
2668
411
197
9296
95
141
76
391
46
61
64202
51
5357
55
53
6256
57
51
5355
5857
57
54
Clerical
Deceased*Farmer
ManagerialMining, logging, fishing,
TarmworkProfessionalRetired,SalesSemi-skilledService i
SkilledTechnical
Transport, communicationsOnskilled
I
Other
127
104 73. 104 93-1-238 69 163 92199 73 159 132
1,473 72 1,318 91
598 68 313 91
440 76 761 92
258 72 175 92, 267 74 317 92
420- ill '" 310 91
228 75 236 931,159 72 869 92
158 73 179 90
205 73 141 93
193 71 173 92
548 71 351 90
,
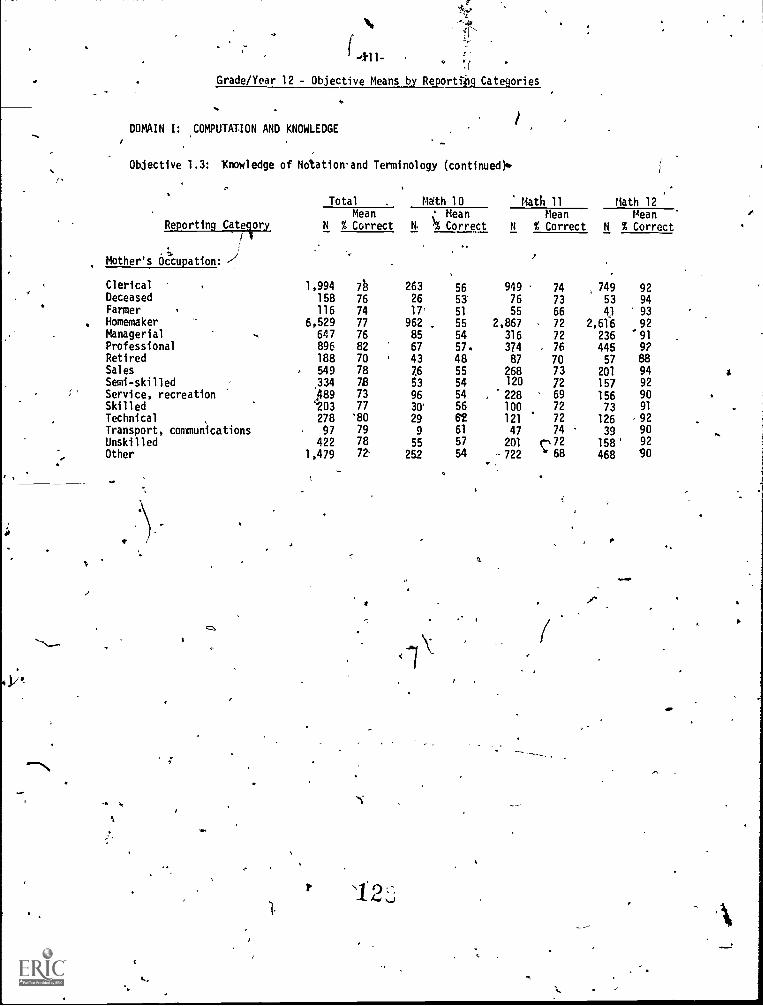
;#
411-
Grade/Year 12 - Objective Means by Reportillg Categories
DOMAIN I: COMPUTATION AND KNOWLEDGE
Objective 1.3: Knowledge of Notation and Terminology (continued)*
Reporting Category
Total Math 10 Math 11 Math 12Mean
-N % CorrectMean
N. 7% Correct N
Mean% Correct
MeanN % Correct
Mother's Occupation:
Clerical 1,994 713 263 56 949 74 749 92Deceased 158 76 26 53 76 73 53 94Farmer 116 74 17' 51 55 66 43 93Homemaker 6,529 77 962 . 55 2,867 72 2,616 92Managerial 647 76 85 54 316 72 236 '91Professional 896 82 67 57. 374 . 76 445 9?Retired 188 70 . 43 48 87 70 57 88Sales 549 78 7,6 55 268 73 201 94Semi-skilled 72 53 54 120 72 157 92
Service, recreation,334
1189 73 96 54 . 228 69 156 90Skilled 1203 77 30' 56 100 72 73 91
Technical 278 '80 29 62 121 72 126 92Transport, communications 97 79 g 61 47 74 39 90
Unskilled 422 78 55 57 201 (.-\ 72 158' 92
Other 1,479 7a 252 54 -722 ' 68 468 90
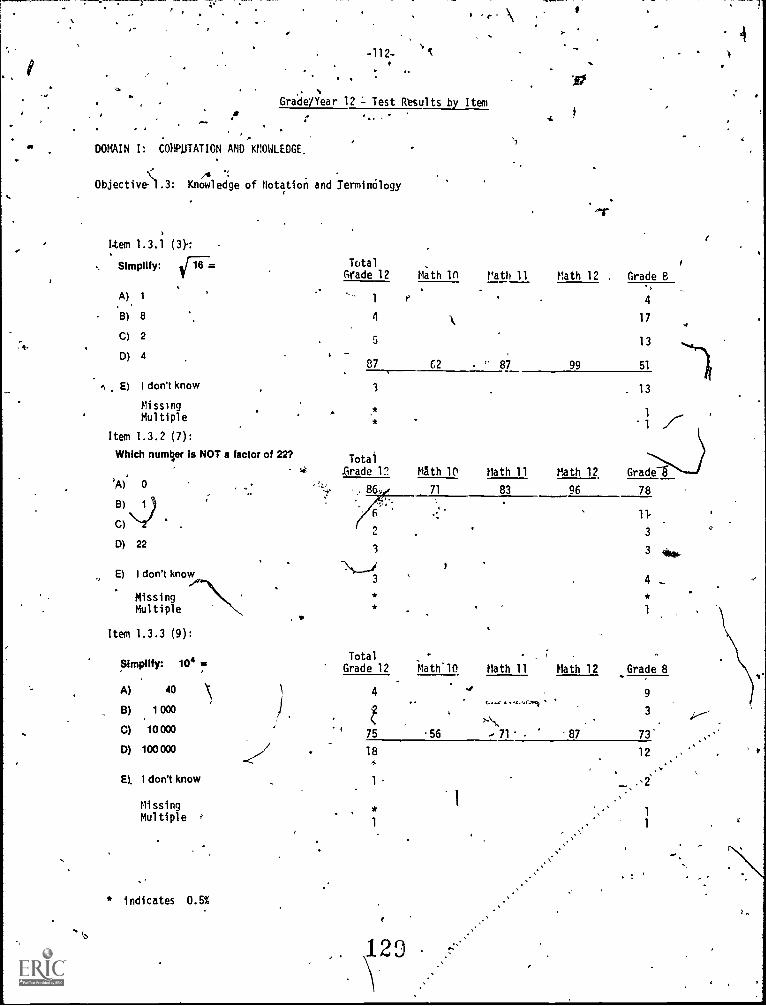
Grade /Year 12 = Test Results by Item..
DOMAIN I: COMPUTATION AND KNOWLEDGE.
Objective 1.3: Knowledge of Notation and Termintilogy
Item 1.3.1 (3}:
Simplify: ifTrit
A) 1
.13) 8
C) 2
D) 4
E) I don't know
MissingMultiple
Item 1.3.2 (7):Which number is NOT a factor of 22?
'A) 0
B)
C)
D) 22
E) I don't know
MissingMultiple
Item 1.3.3 (9):
Simplify: 104
TotalGrade 12 Math In Math 11 Math 12
1 i4
5
87 C2 87 99
3
*
Totalse .Grade 12 MSth 10 Math 11 Math 12
... 8G 71 83 96
3
3
*
*
TotalGrade 12 Math10 Math 11 Math 12
A) 40
B) 1 000
C) 10000
D) 100000
El I don't know
iii ssingMultiple
4
75 56 71' .87
186
1
*1
* indicates 0.5%
42
Grade 8
4
17
13
51
13
Grade
78
11
3
3 40..,
4 ...
*
Grade 8
9
7312 s.
1
1
4
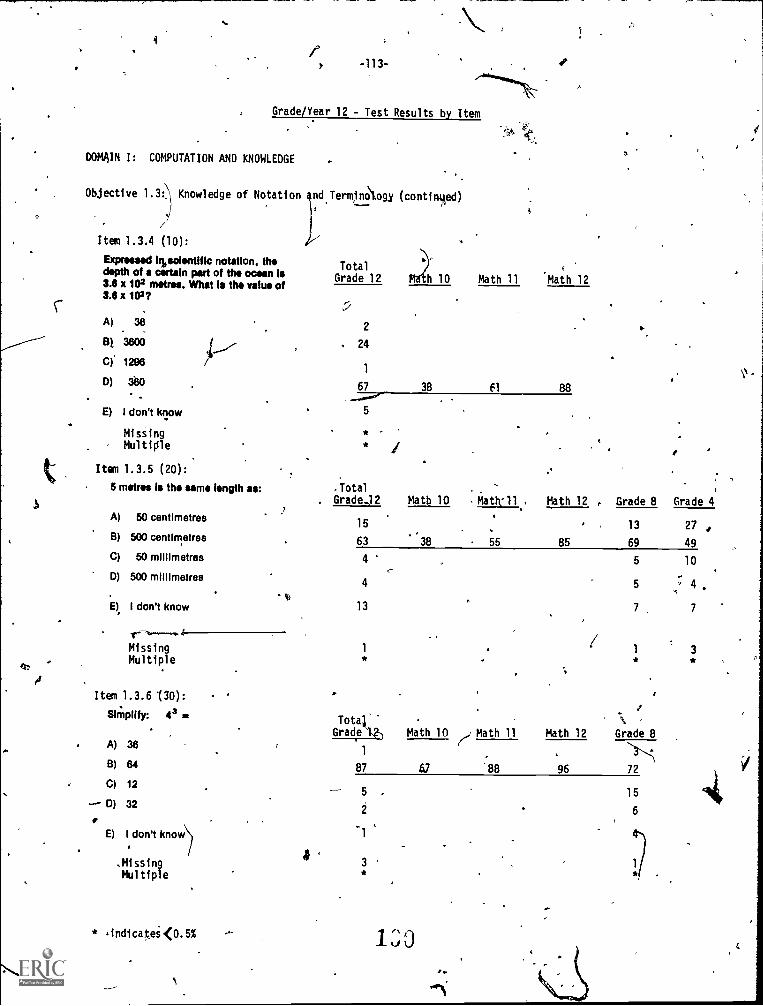
c
ra
r-113-
Grade/Year 12 - Test Results by Item
DOMAIN I: COMPUTATION AND KNOWLEDGE
Objective 1.3:1 Knowledge of Notation dTerminclogy (continied)
Item 1.3.4 (10):
Expressed hlsolentific notation, thedepth of a certain part of the ocean Is3.6 x 102 metres. What Is the value of3.6 x 102?
TotalGrade 12
1
67
A) 362
.B) 3600 24
C)' 1296
D) 360
E) I don't krlow 5
Missing *- Multiple *
Item 1.3.5 (20):5 metres Is the same length as: .Total
Grade 12 Math 10 - Math! 11, Math 12 , Grade 8 Grade 4
Math 11 Math 12
38 61 88
A)
B)
C)
D)
E)
50 centimetres
500 centimetres
50 millimetres
500 millimetres
I don't knowm
15
63 38 55 85
13
69
27 i49
4
4
13
1
*
<-
. (
5
5
1*
10.., 4
7
3*
v-- 4-
MissingMultiple
fE) I don't know
.MissingMul tiple
41)
'Item 1.3.6 130):
ISiMplify: 43 - Tote 1 \Totak
Grade 4-) Math 10 (i Math 11 Math 12 Grade 8A) 38
1
B) 64 87 57 '88 96 72
C) 125 15
-- 0) 322 6
3 41)
* ,indicatei<0.5% 1 0
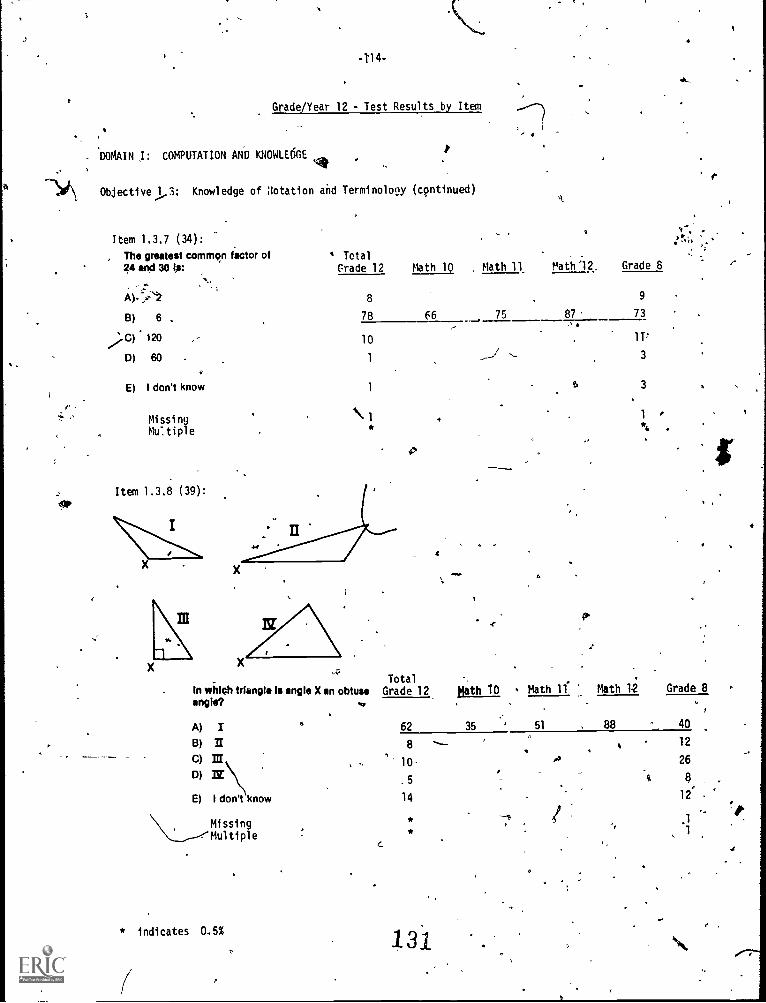
-11 4-
Grade/Year 12 - Test Results by Item
DOMAIN I: COMPUTATION AND KNOWLEDGE
Objective ,1,3: Knowledge of Notation and Terminology (cpntinued)4.
Item 1.3.7 (34):
, The greatest common factor of24 sod 30 4:
)W zB) 6 .
;C) 1200) 60 -
E) I don't know
MissingMultiple
Total
(=rade 12 Math 10 , Math 11 Math :12,
es4
Grade S
8
78 E6 75 87
9
73
10
1
\
,
--/ -
,1T'
3
3
1
*4
Item 1.3.8 (39):
X
4
A
In width triangle Is angle X an obtuseangle
A) IB) II
C) lII
0) 7YZ\
E) I don't know
Mtipg- Multiple
Total
Grade 12 Math 10 Math 11 Math 12 Grade 8
62 35 51 88 40
8
10
5
14
**
il
12
* indicates 0,5% 131
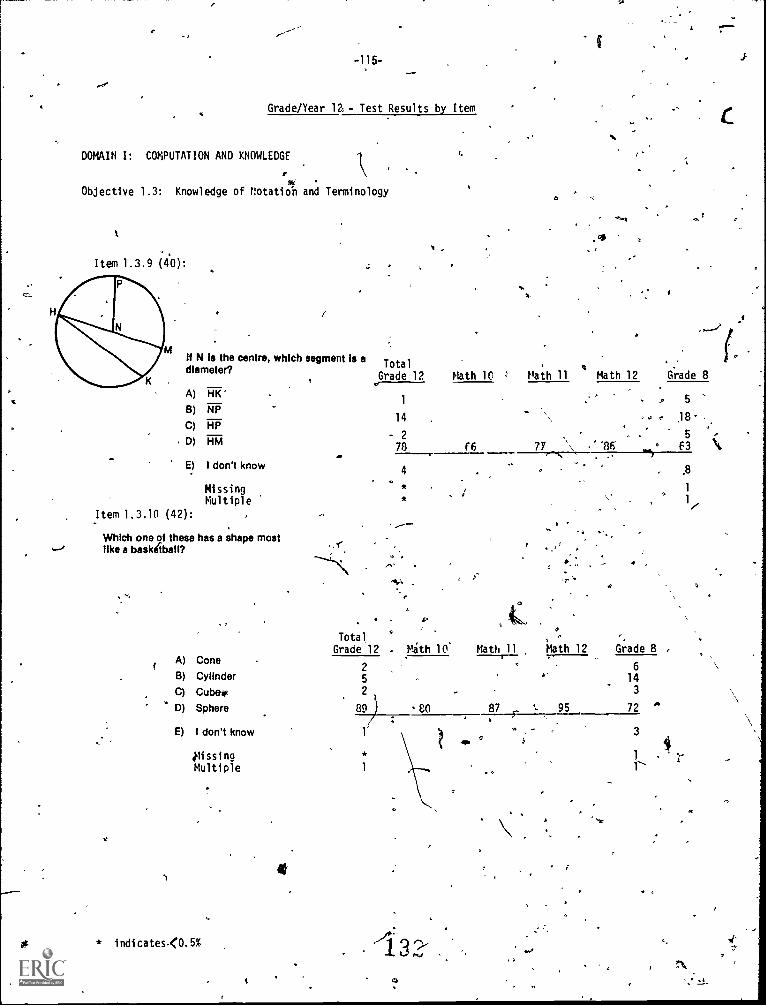
Grade/Year la - Test Results by Item
DOMAIN I: COMPUTATION AND KNOWLEDGE
Objective 1.3: Knowledge of Notatio'n and Terminology
t
Item 1.3.9 (40):
I-
If N is the centre, which segment is adiameter?
A) HK
B) NP
C) HP
D) HM
E) I don't know
MissingMultiple
Item 1.3.10 (42):
Which one of these has a shape most ..r.like a basketball?
A) Cone2
. 6B) Cylinder 5 ' 14C) Cuba* 2 3
D) Sphere 89) CO, .
87 ..- 95 72..
E) I don't know 1
TotalGrade 12
1
14
2
78
4
*
Math 10 Math 11 Math 12 Grade 8
(6 77
I,
r 5
,18
5\ '86 5 63
\
4-\-
Total,Grade 12 !lath 10' Math 11 Math 12 Grade 8
,MissingMultiple
* indi cates<0. 5%
3
A
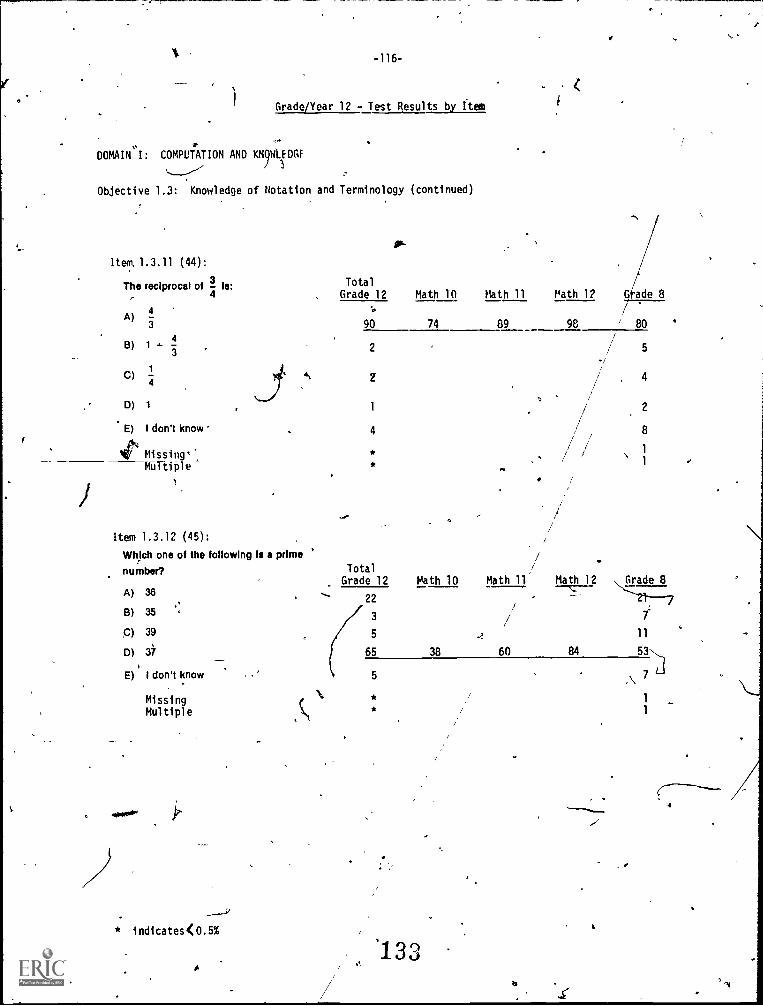
-116-
Grade/Year 12 - Test Results by Item
DOMAIN I: COMPUTATION AND KNQWIEDGF)
Objective 1.3: Knowledge of Notation and Terminology (continued)
Rem 1.3.11 (44):
The reciprocal of 3la:
4
4
3A)
B) 1
C)1
4
4
3
D) 1
E) I don't know
Missingt.,
Multiple
Item 1.3.12 (45):
SP-
Total
Grade 12 Math 10 Math 11
90 74 89
2
4. 7
1
4
Which one of the following Ii a prime
number?
A) 36
B) 35
C) 39
D) 37
E) I don't know
Total
Grade 12
22
5
65
5
Missing
Multiple
* indicates<0.5%
Path 1? G ade 8
98 / 801
/ 5
/ 4
2
8
1
1
//
Math 10 !lath 11 Math 12
,Grade 8
/
60 84 53'38
.,!
/11
7
1 3 3a
\ 7
1
1
4
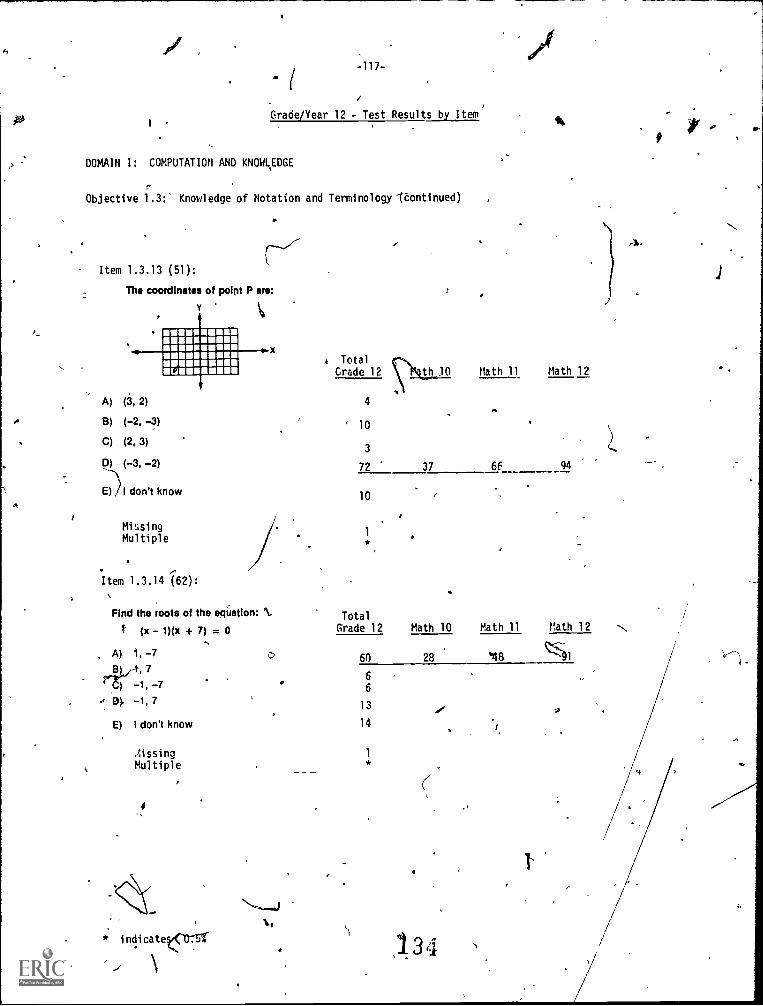
03
ft-
-117-
Gracie/Year 12 - Test Results by Item
DOMAIN I: COMPUTATION AND KNOWLEDGE
Objective 1.3:' Knowledge of Notation and Terminology I-continued)
Item 1.3.13 (51):
The coordinates of point P are:
Y11
SIII111111E11111111111111M111111111111111111M011II SI MN II MN MIII MI II111211O1M11111011
A) (3, 2)
B) (-2, -3)
C) (2, 3)
D) (-3, -2)
EDI don't know
MissingMultiple
Item 1.3.14 (62):
Find the roots of the equation: N.
(x - 1)(x + 7) = 0
* TotalGrade 12
4
' 10
Math 11 Math 12
3
72 37 6F 94
10
1
*
TotalGrade 12 Math 10 Math 11 Math 12
91A)
B)
)
14
E)
1,-74, 7-1, -7-1, 7
I don't know
AissingMultiple
0 60 28 48
66
13
14
1
*
ee
4
* indicate
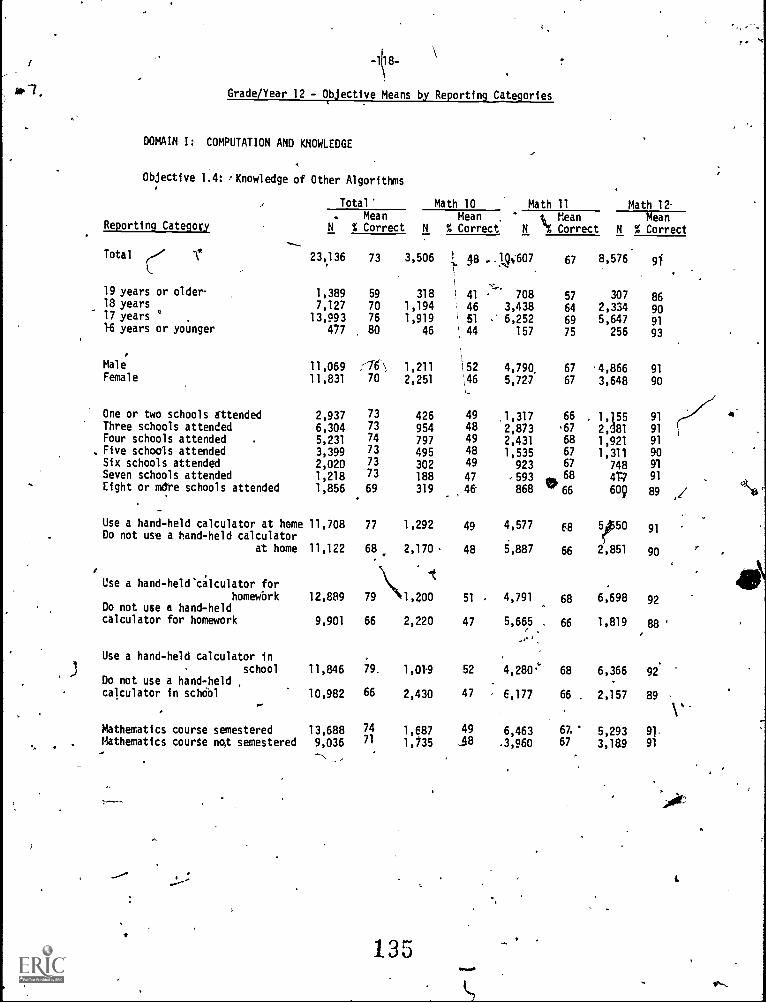
3
Grade/Year 12 - Objective Means by Reporting Categories
DOMAIN I: COMPUTATION AND KNOWLEDGE
Objective 1.4: Knowledge of Other Algorithms
Total' Math 10 Math 11 Math 12-. Mean Mean 4 Mean Nan'
Reporting Category N % Correct N
---
Total .,/ li' 23,136 73 3,506
19 years or older- 1,389 59 31818 years 7,127 70 1,19417 years . 13,993 76 1,91916 years or younger 477 80 46
Male 11,069 (76. 1,211Female 11,831 70 2,251
One or two schools attended 2,937 73 426Three schools attended 6,304 73 954Four schools attended 5,231 74 797Five schools attended 3,399 73 495Six schools attended 2,020 73 302Seven schools attended 1,218 73 188Eight or mete schools attended 1,856 69 319
Use a hand-held calculator at home 11,708 77 1,292Do not use a hand-held calculator
at home 11,122 68 2,170
Use a hand -held calculator for
homewbrk 12,889 79 1,200Do not use et hand-heldcalculator for homework 9,901 66 2,220
Use a hand-held calculator inschool 11,846 79. 1,01-9
Do not use a hand-held ,
calculator in schabl 10,982 66 2,430
Mathematics course semestered 13,688 74 1,687Mathematics course_nqt semestered 9,036 71 1,735
135
% Correct N "% Correct N % Correct
,
1 48 _19007 67 8,576 9}
, ..
41 ' 708 57 307 8646 3,438 64 2,334 9051 ,' 6,252 69 5,647 91
' 44 157 75 256 93
f52 4,790, 67 '4,866 91
,46 5,727 67 3,648 90
49 1,317 66 1,155 91
48 2,873 '67 2,381 91
49 2,431 68 1,921 91
48 1,535 67 1,311 90
49 923 67 748 91
47 .593 0, 68 4T7 91
46- 868 IF 66 609 89
49 4,577 68 5,50 91
48 5,887 66 2,851 90
51 4,791 68 6,698 92
47 5,665 66 1,819 88
52 4,2800 68 6,366 92
47 6,177 66 . 2,157 89
49 6,463 61 5,293 91,
98 .3,960 67 3,1a9 91
rl
r
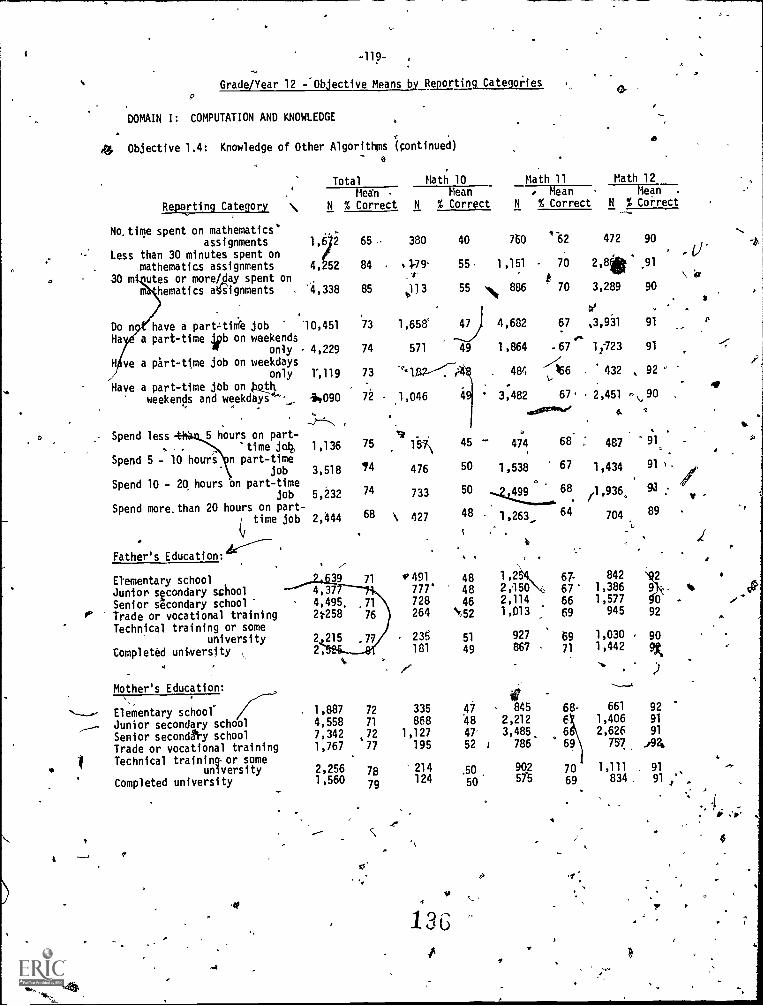
-11p-
Grade/Year 12 --Objective Means by Reporting Categories
DOMAIN I: COMPUTATION AND KNOWLEDGE
Objective 1.4: Knowledge of Other Algorithms (continued)
e
Reporting Category \
TotalMean
N % Correct
No, time spent on mathematics"assignments 1,92
Less than 30 minutes spent onmathematics assignments 4,S2
30 utes or more /day spent on
hematics assignments - *4,338
,
Do n have a part4tim, b job "10,451Ha a part-time jpb on weekends
only - 4,229
H ve a part-time job on weekdaysonly 1',119
Have a part-time job on kt4,,weekends and weekdays' 44090
Spend less 5 hours on part-'time je4
n part-timejob
Spend 10 - 20 hours on part-timejob
Spend more. than 20 hours on part-time job
Father's Education :4-------:
Elementary schoolJunior secondary schoolSenior secondary schoolTrade or vocational trainingTechnical training or some
university
Completed university4
Spend 5 - 10 hours
Mother's Education:
Elementary schoolJunior secondary schoolSenior secondNy schoolTrade or vocational trainingTechnical training-or some
university
Completed university
1,136
3,518
5,232
2,444
65
84
85t.113
Math 10Mean
N % Correct
_Math 11 Math 12
MeanN
380 40 760
55 1,151
55 886
73 1,656'
74 571
73
72 - 1,046
47 J 4,682
49 1,864
. 464
3,482
% Correct N % Correct
62
70
472
2,8ilt
90
91I)*
st70 3,289 90
.
67 ,3,931 91
es-67 1,723 91
432 , 92
67' 2,451 - 90
a I
75 157\ 45 474
/4 476 50 1,538.
74 733 50 .....z
68 \ 427 48 1,263_
. i .
t,
39 71
4,374,495714256 76
2 215 ,77
2
1,887
4,5587,3421,767
72
71
,7277
2,256 78
791,560
rP491 48
777' 48728 46264 lt52
23 51
181 49
335
8681,127195
47
4647-
52
214 ,60
124 50
4
136
1,22,1502,1141,013
927
867
ir845
2,2123,485
, 786
922
575
68
67
68.
64
68-
6Sj6
69
7069
67- 842
67 1,386
66 1,57769 945
69 1,03071 1,442
487 91
1,434 91
1,936°
91
704 89
90
2
92
661 921,406 91
2,626 91
1137 A2.
1,111 91
834 91
r -
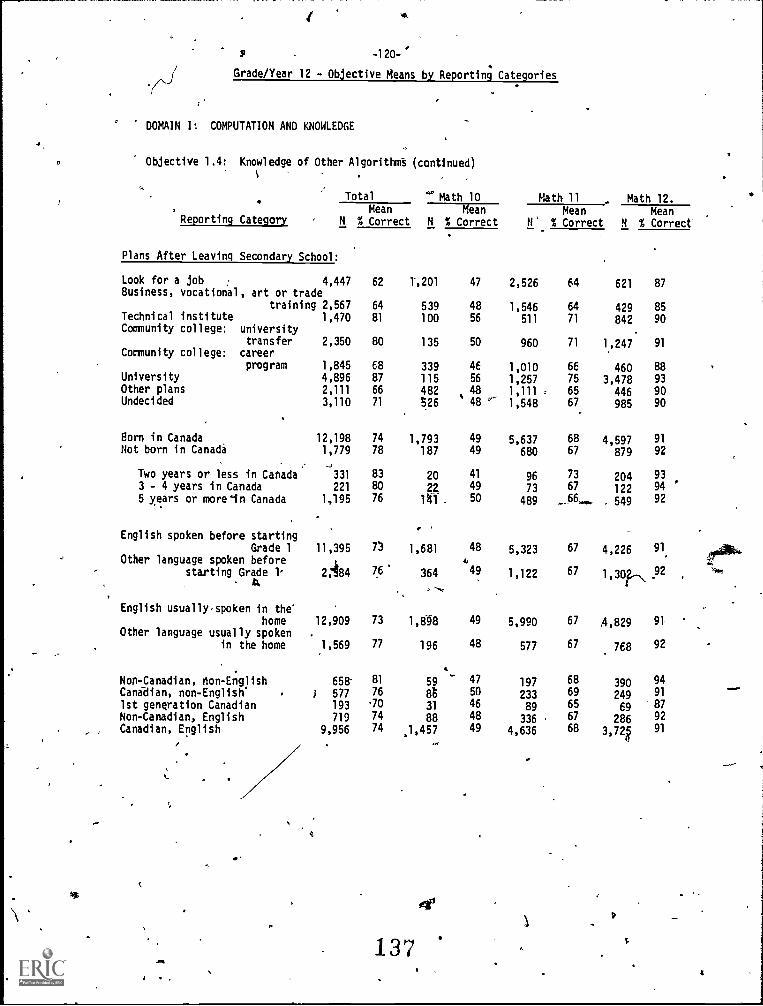
s -120 -
Grade /Year 12 - Objective Means by Reporting Categories
DOMAIN I: COMPUTATION AND KNOWLEDGE
Objective 1.4: Knowledge of Other Algorithmt (continued)
Total 4° Math 10 Math 11 _ Math 12.Mean Mean
'Reporting Category N % Correct N % Correct N'
Mean% Correct
MeanN % Correct'
Plans After Leaving Secondary School:
Look for a job : 4,447 62 1,201 47 2,526 64 621 87Business, vocational, art or trade
training 2,567 64 539 48 1,546 64 429 85Technical institute 1,470 81 100 56 511 71 842 90Community college: university
transfer 2,350 80 135 50 960 71 1.,247. 91Community college: career
program 1,845 68 339 46 1,010 66 460 88University 4,896 87 115 56 1,257 75 3,478 93Other plans 2,111 66 482 48 1,111 : 65 446 80Undecided 3,110 71 326 48 '' 1,548 67 985 90
Born in Canada 12,198 74 1,793 49 5,637 68 4,597 91
Not born in Canada 1,779 78 187 49 680 67 879 92
Two years or less in Canada,331 83 20 41 96 73 204 93
3 - 4 years in Canada5 years or more in Canada
221
1,195
80
76
22.
liff,
4950
73489
6766-...
122549
9492
. ,
English spoken before startingGrade 1 11,395 n 1,681 48 5,323 67 4,226 91.
Other language spoken before kstarting Grade 1 2,484
/2.
76 364
--,
49 1,122 67 1,30.\ 52 ,
English usuallyspoken in thehome 12,909 73 1,08 49 5,990 67 .4,829 91
Other language usually spokenin the home .1,569 77 196 48 577 67 768 92
Non-Canadian, non-English 658 81 59 47 197 68 390 94
Canadian, non-English' ) 577 76 Bt 50 233 69 249 91
1st generation Canadian 193 70 31 46 89 65 69 87
Non-Canadian, English 719 74 88 48 336 , 67 286 92Canadian, English 9,956 74 .1,457 49 4,636 68 3,72k 91
.
137
so,
4
1
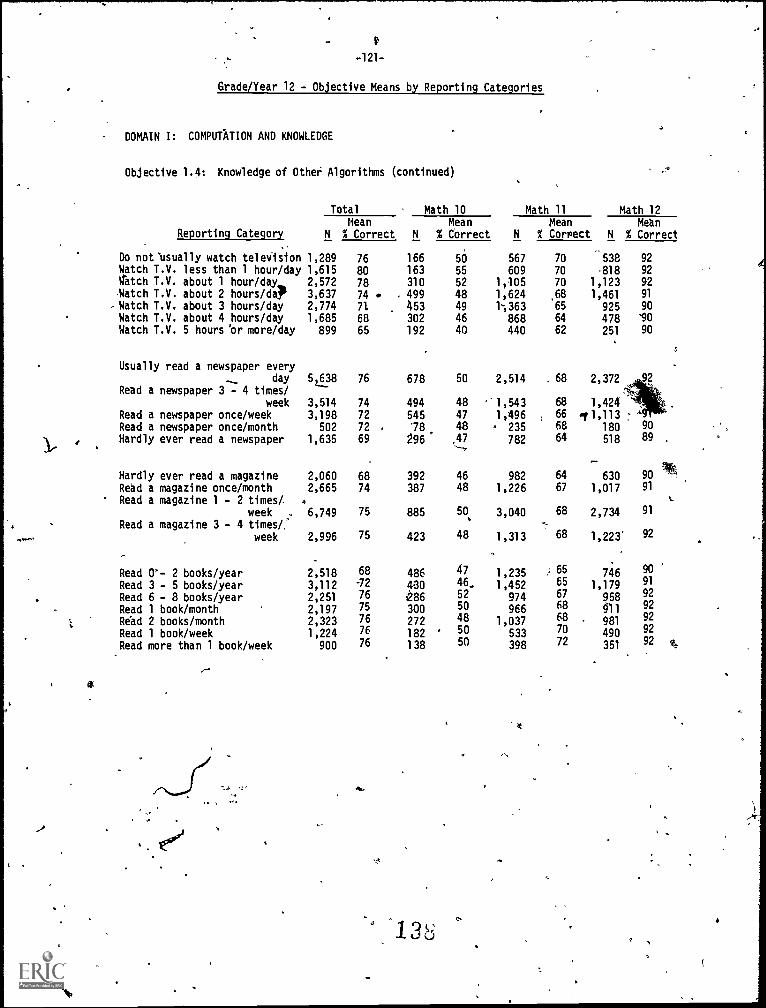
... -121 -
Grade /Year 12 - Objective Means by Reporting Categories
DOMAIN I: COMPUTATION AND KNOWLEDGE
Objective 1.4: Knowledge of Other Algorithms (continued)
Reporting Category
Total
MeanN % Correct
Do not'llsually watch television 1,289Watch T.V. less than 1 hour/day 1,615
76
80Latch T.V. about 1 hour /day 2,572 78Watch T.V. about 2 hours/dajP 3,637 74 .Watch T.V. about 3 hours/day 2,774 71Watch T.V. about 4 hours/day 1,685 68Watch T.V. 5 hours 'or more/day 899 65
Usually read a newspaper every-._ day 5,638 76
Read a newspaper 3 - 4 times/week 3,514 74
Read a newspaper once/week 3,198 72
Read a newspaper once/month 502 72 ,
Hardly ever read a newspaper 1,635 69
Hardly ever read a magazine 2,060 68Read a magazine once/month 2,665 74Read a magazine 1- 2 times /. .
week . 6,749 75
Read a magazine 3 - 4 times /.'
week 2,996 75
Read 0'- 2 books/year 2,518 68
Read 3 - 5 books/year 3,112 -72
Read 6 - 8 books/year 2,251 76
Read 1 book/month 2,197 75
Read 2 books/month 2,323 76
Read 1 book/week 1,224 76
Read more than 1 book/week 900 76
Math 10 Math 11 Math 12Mean Mean Metn
N % Correct N % Correct N % Correct
166
163310
499453302
192
678
494545
Z9:
392387
885
423
486430286300272182138
50 567 70
55 609 70
52 1,105 70
48 1,624 68
49 1;363 65
46 868 64
40 440 62
50 2,514 . 68
48 '1,543 68
47 1,496 , 66
* 235 68
,44 782 64
46 982 64
48 1,226 67
50. 3,040 68
48 1,313 68
47 1,235 65
46, 1,452 65
5250
974966
67
68
48 1,037 68
50 533 70
50 398 72
538 92
.818 92
1,123 92
1,461 91
925 90
478 '90
251 90
2,372
1,42411,113
180 90
518 89 .
630 90
1,017 91
2,734 91
1,223' 92.
7461,179
958911
981
490
351
90
91
92
92
92
92
92
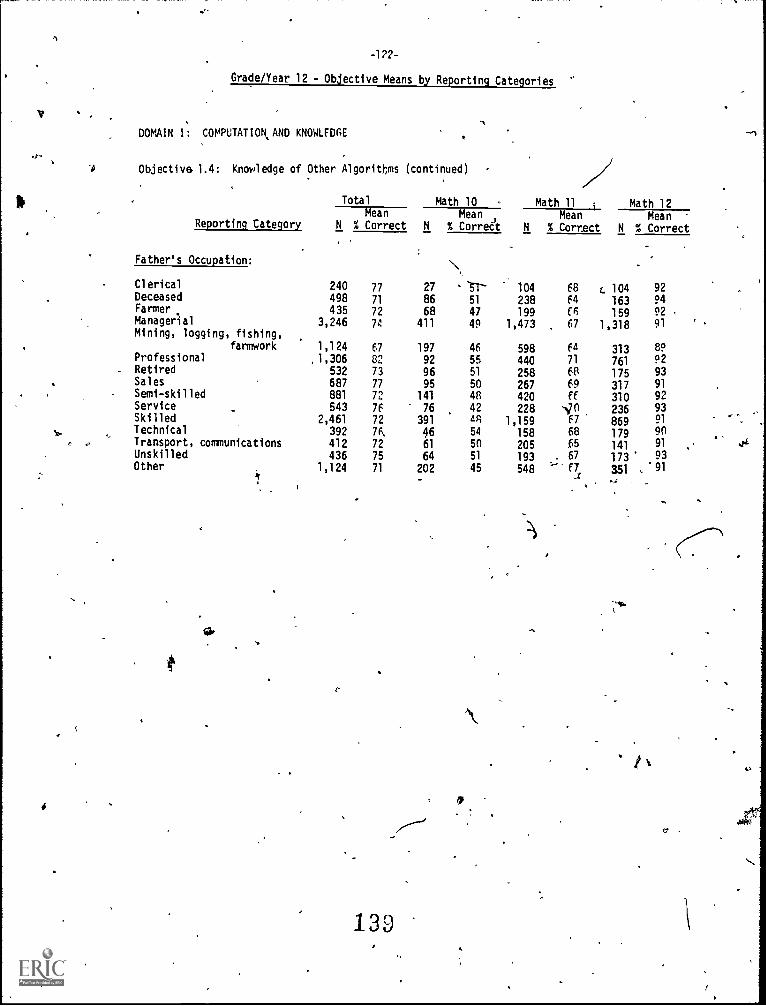
-122-
Grade/Year 12 - Objective Means by Reporting Categories
DOMAIN I: COMPUTAT1ON.AND KNOWLEDGE
Objective- 1.4: Knowledge of Other Algorithms (continued)
Reporting Category
Total Math 10 -
MeanN % Correct N
Mean% Correct
Father's Occupation: \\
Clerical 240 77 27 3TDeceased 498 71 86 51Farmer 435 72 68 47Managerial 3,246 74 411 49Mining, logging, fishing,
farmwork 1,124 67 197 46Professional 1,306 82 92 55Retired 532 73 96 51
Sales 687 77 95 50Semi-skilled 881 72 141 48Service 543 7F 76 42Skilled 2,461 72 391 'R
Na Technical 392 76. 46 54C Transport, communications 412 72 61 50
Unskilled 436 75 64 51
Other
i!
1,124 71 202 45
13 9
Math 11 Math 12Mean Mean
N % Correct N % Correct
104 68L238 F4
104N
199 (6 159 92
1,473 67 1,318 91
313 89440 1 761 92258 68 175 93
267 69 317 91
420 ff 310 92228 'IP 236 93
1,159 F7 869 91
158 68 179 90
205 65 141 91
193 67 173 93548 f7 351 '91
i.,
0
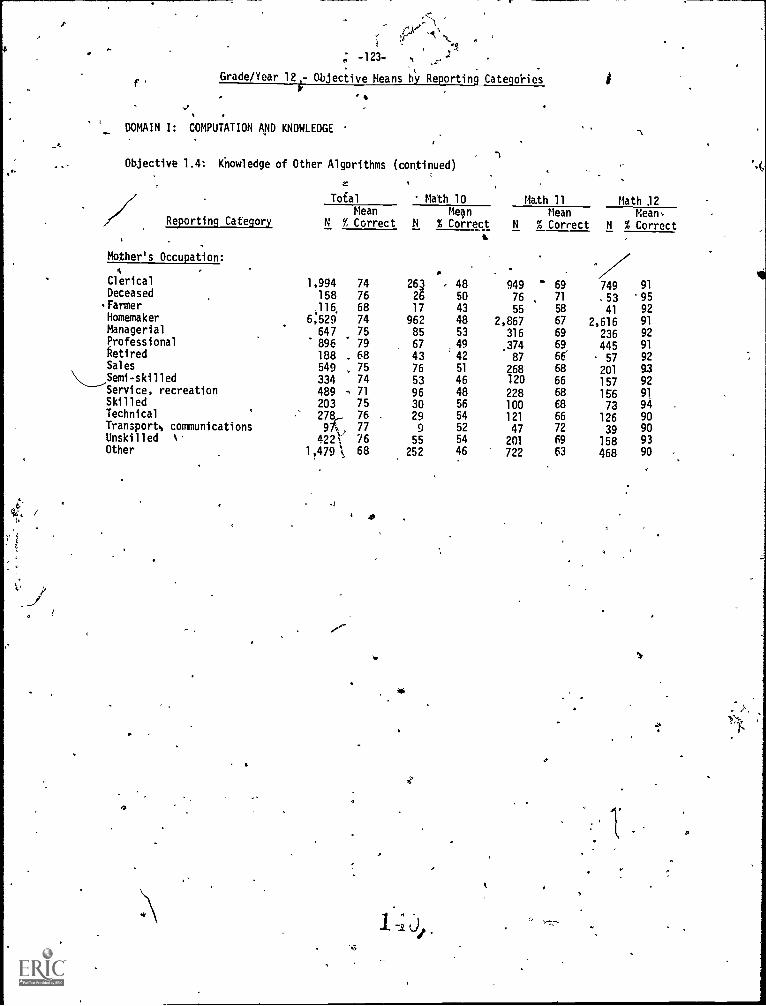
; -123. N
Grade/Year 12, Objective Means by Reporting Categories
0 41
DOMAIN I: COMPUTATION AND KNOWLEDGE
Objective 1.4: Knowledge of Other Algorithms (continued)
Reporting Category
Taal Math 10 Math 11 Math 32Mean
N if', Correct
MeanN % Correct
...
a
N
Mean% Correct
Mean,N % Correct
Mother's Occupation:4
Clerical 1,994 74 265 48 949 ' 69 749 91Deceased 158 76 2 50 76 71 .53 95Farmer 68 17 43 55 58 41 92Homemaker
,116.
6,529 74 962 48 2,867 67 2,616 91Managerial 647 75 85 53 316 69 236 92Professional 896 79 67 49 69 445 91Retired 188 . 68 43 42
.374
87 se 57 92Sales 549 75 76 51 268 68 201 9.3
\,.___,Semi-skilled
Service, recreation334 74489 ' 71
53
96
4648
120
228
66
68157
15692
91Skilled 203 75 30 56 100 68 73 94Technical 278,_ 76 29 54 121 66 126 90Transports communications 97v. 77 9 52 47 72 39 90Unskilled ' 422, 76 55 54 201 69 158 93Other 1,479 \ 68 252 46 722 63 468 90
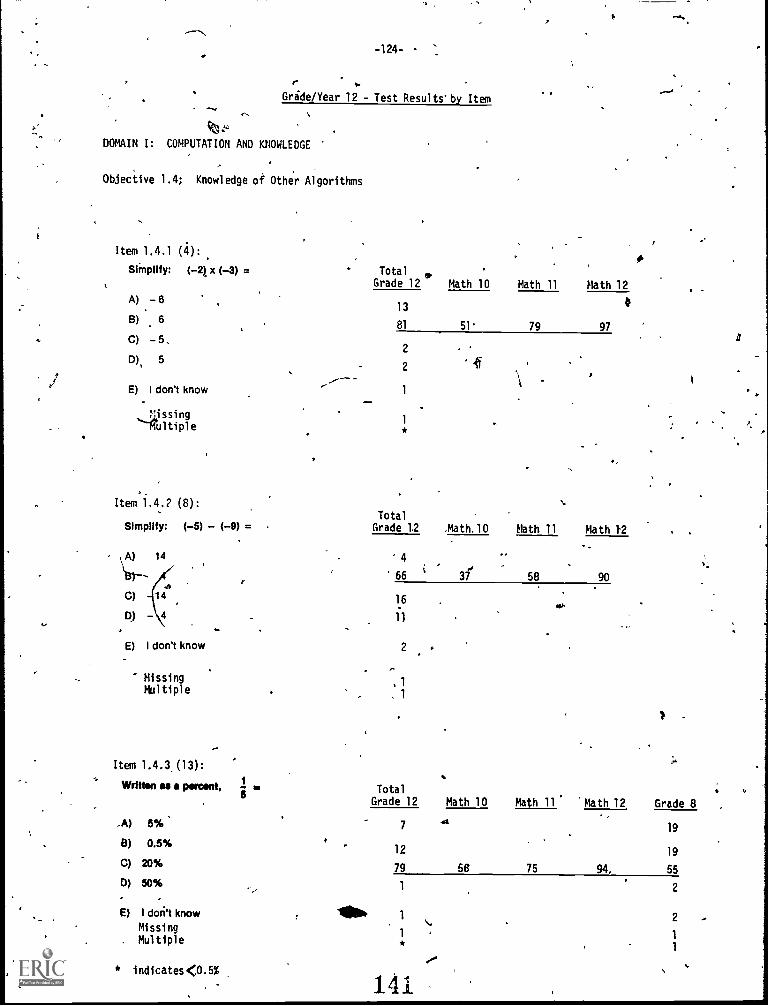
-124-
Grade /Year 12 - Test Results- by Item
DOMAIN I: COMPUTATION AND KNOWLEDGE
Objective 1.4; Knowledge of Other Algorithms
Item 1.4.1 (4):Simplify: (-2) x (-3) =
A) 6
B) 6
C) -5,
0) 5
E) I don't know
Wssing
Item 1.4.? (8):
Simplify: (-5) - (-9) =
Total 6.Grade 12 Math 10 Math 11 Math 12
13 4
81 51' 79 97
2
2
4
Total
Grade 1.2 ,Math.10 Math 11 Math 12
Ak) 14 4
66 t 3i 58 90
C) 1a 16
- 4 11
2E) I don't know
MissingMultiple
Item 1.4.3.(13):
.A) 5%
B) 0.5%
C) 20%
D) 50%
E) I doti't know
Missing. Multiple
* indicates (OAS
Total5
Grade 12 Math 10 Math 11 Math 12 Grade 8
7
*b.
12
79
1
14.
19
56 75 94, 55
2
Wrftten es percent,
.419
2
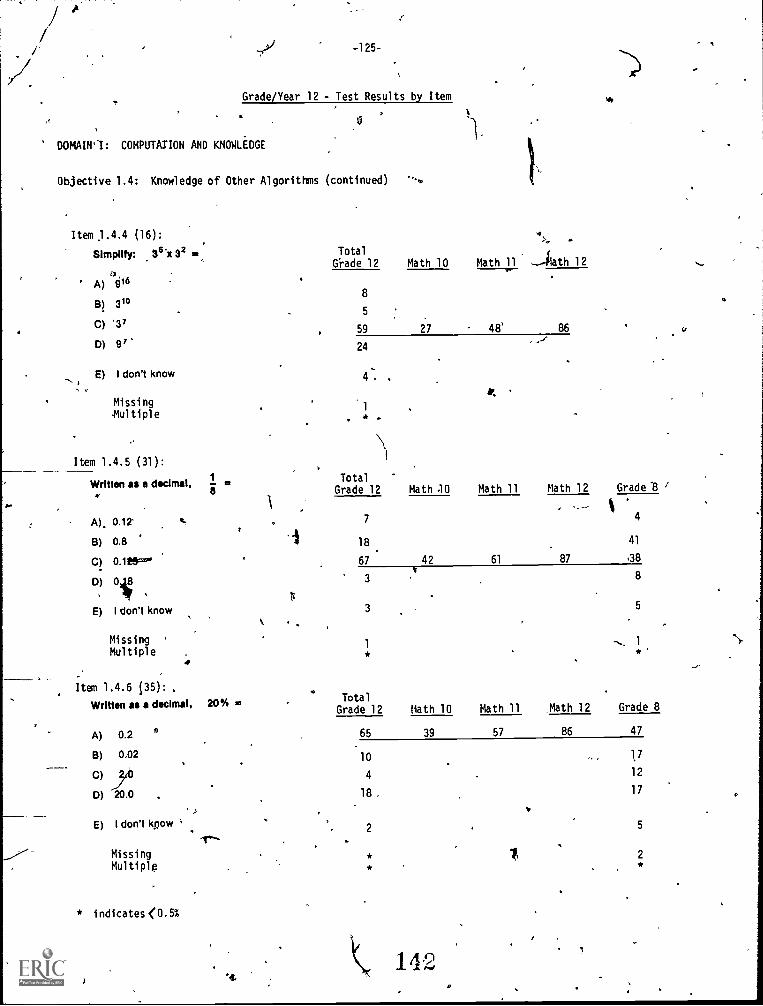
-125-
Grade/Year 12 - Test Results by Item
DOMAIVI: COMPUTATION AND KNOWLEDGE
Objective 1.4: Knowledge of Other Algorithms (continued)
Item 1.4.4 (16):
Simplify: 35)(32 Ia.
ex,
' A) 916
B) 310
C) '32
D) 9''
E) I don't know
, e
MissingMultiple
Item 1.4.5 (31):
Written as a decimal,
TotalGrade 12 Math 10
k. -
Math 11 lath 12
8
5
59 27 48' 86
24
4. ,It
1
TotalGrade 12 Math .10 Math 11 Math 12 Grade '.8 1
A). 0.12 7 4
B) 0.8.1
18 41
C) 0.1e9=0," 67 42 61 87 .38
D) 01 3v
8
li
E) I don't know 3 5
MissingMultiple
It 1.4.6 05):
1
*
Written as a decimal, 20% .2 TotalGrade 12 Math 10 Math 11 _Math 12 Grade 8
A) 0.2 65 39 57 86 47
B) 0.02 10 17
C) )0 4 12
D) 20.0 18 , 17
1,
E) I don't know s,
2 5
1
*
MissingMul ti plg
* indicates <0.5%
'4.
*
14
2
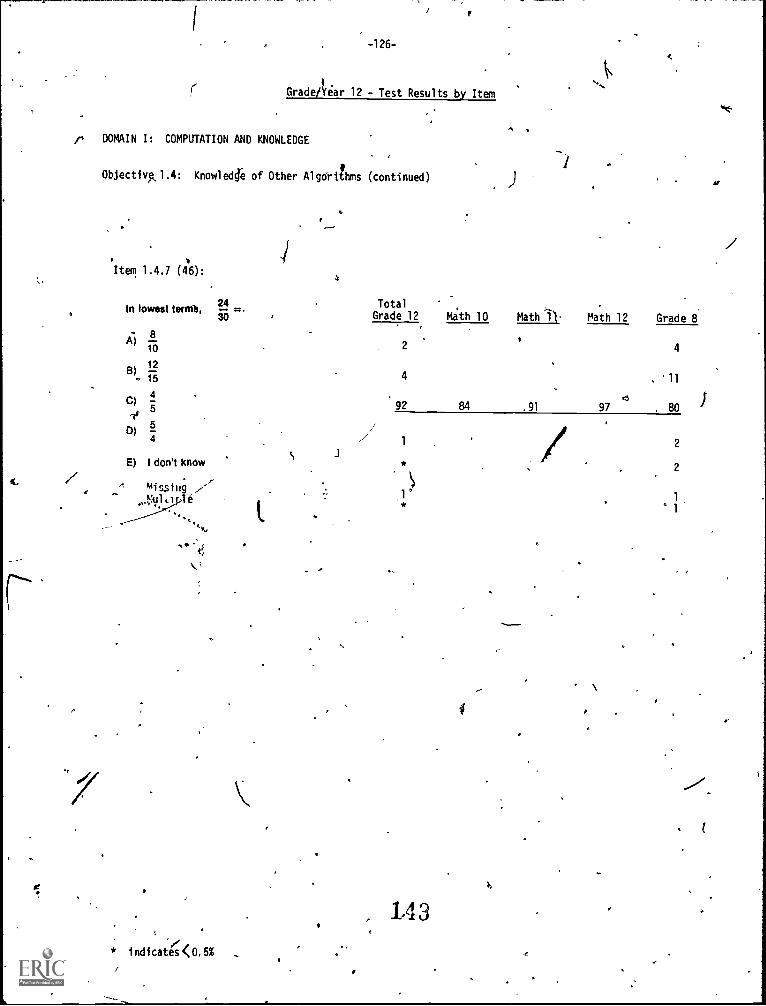
c.
t
ti
I
-126-
Gradefnear 12 - Test Results by Item
p DOMAIN I: COMPUTATION AND KNOWLEDGE
Objectiy,1/41.4: Knowleddre of Other Algorithms (continued)
Item 1.4.7 (46):
1
In loweattermls, E. r....Total
Grade 12 Math 10 Math)). oath 12 Grade 8
Al 810 2
s
4
12B).15 4 , 11
C) 92 84 .91 97 . 80 I4 c.5
--,0) 5 /4
t, .1
1 / 2
* 2E) I don't know
mt ss g ,/mulo
ty
* i ndicates \ 0.5% _
, 143
4
4./
1
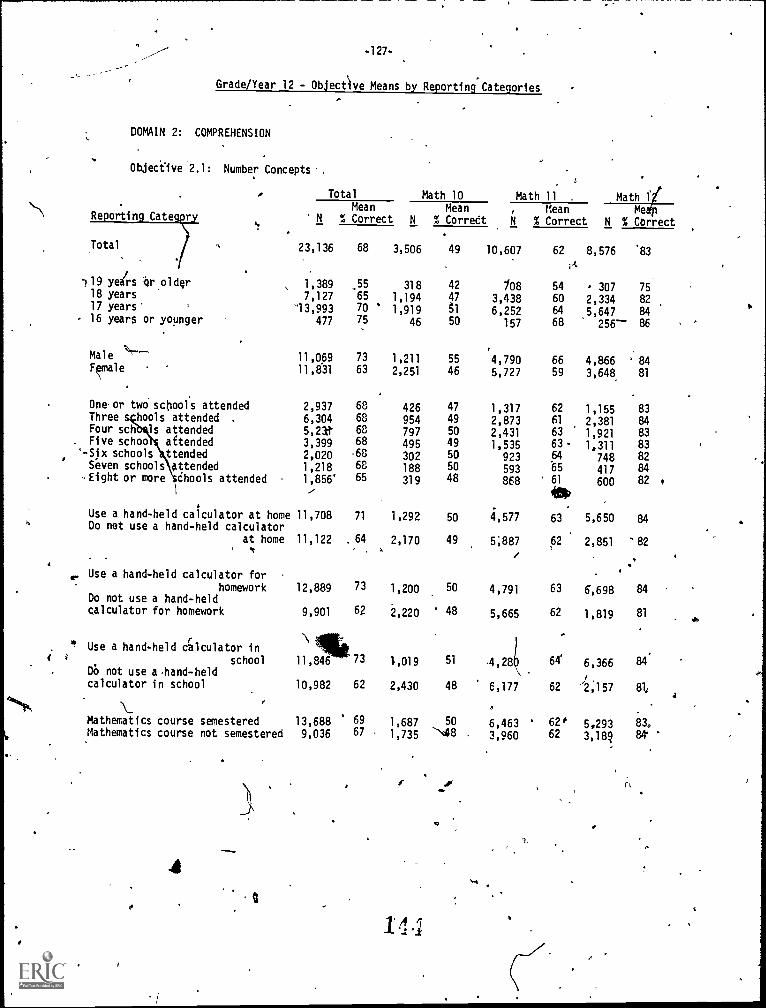
-127-
Grade/Year 12 - Object'We Means by Reporting Categories
DOMAIN 2: COMPREHENSION
Objective 2.1: Number Concepts ,
. Total Math 10 Math 11 . Math 1Mean Mean Me
\--1Mean p
Re ortin Cate r N % Correct N % Correct h % Correct N % Correct
Total,
119 yelrs brolder18 years17 years'
16 years or younger
MaleFrale
kt.
23,136
1,3897,127
"13,993
477
11,069
11,831
Oneor two schools attended 2,937Three hools attended . 6,304Four sch is attended 5,23
. Five schoo attended 3,399
',..Six schools ttended
'218Seven schools attended 1,218Eight or more chools attended 1856'
Use a hand-held calculator at home 11,708Do not use a hand-held calculator
at home 11,122"s
,. Use a hand-held calculator for
homework 12,889Do not use a hand-heldcalculator for homework 9,901
Use a hand-held calculator in
school 11,846DO not use a,hand-heldcalculator in school 10,982
Mathematics course semestered 13,688Mathematics course not semestered 9,036
4
.
68 426 47 1,317 62 1,155 8368 954 49 2,873 61 2,381 846C 797 50 2,431 63 1,921 8368 495 49 1,535 63. 1,311 83
.658 302 50 923 64 748 8268 188 50 593 65 417 8465 319 48 868 61 600 82
4110,
69 1,687 50 6,463 ' 62° 5,293 83.67 1,735 'Ng8 3,960 62 3,188 84'
68 3,506 49 10,607 62 8,576 '83
.55 318 42 108 54 307 7565 1,194 47 3,438 60 2,334 8270 1,919 51 6,252 64 5,647 8475 46 50 157 68 256-- 86
73 1,211 55 4,790 66 4,866 ' 8463 2,251 46 5,727 59 3,648 81
71 1,292 50 4,577 63 5,650 84
64 2,170 49 5;887 62 2,851 -82
73 1,200 50 4,791 63 6,698 84
62 2,220 48 5,665 62 1,819 81
73 1,019 51 ,4,28k 6( 6,366 84'
62 2,430 48 6,177 62 ''2,157 814
. 0 r
1:1 .1
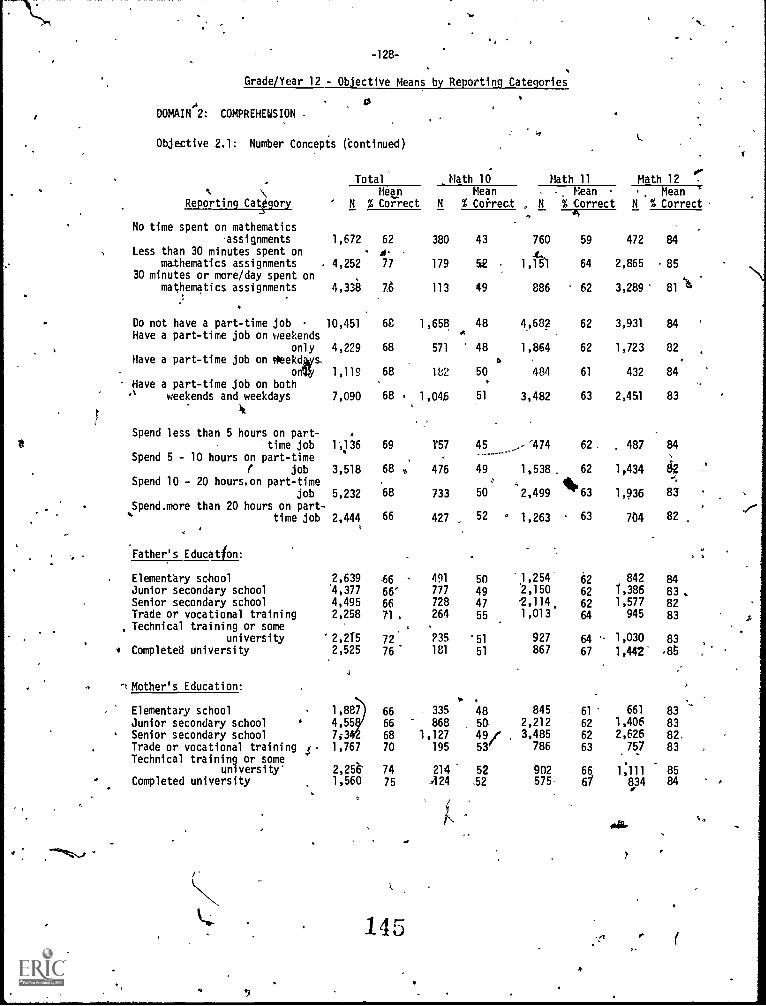
-128-
Grade/Year 12 - Objective Means by Reporting Categories
ADOMAIN 2: COMPREHEUSION
Objective 2.1: Number Concepts (*continued)L
,...-
Total Math 10 Math 11 Math 12 .
Mean Mean , Mean . Mean '
Reporting Ca4gory ' N % Correct N % Correct , N % Correct N % Correct-4S---
No time spent on mathematics-assignments 1,672
Less than 30 minutes spent onmathematics assignments 4,252
30 minutes or more/day spent onmathematics assignments 4,338
.,
Do not have a part-time job 10,451Have a part-time job on weekends
only 4,229Have a part-time job on Neek4s.
on %, 1,119
Have a _part -time job on bothA weekends and weekdays 7,090
Spend less than 5 hours on part-time job 1.9,136
Spend 5 - 10 hours on part-timer job 3,518
Spend 10 - 20 hours,on part-timejob 5,232
Spend.more than 20 hours on part-time job 2,444
Father's Education:
Elementary school 2,639Junior secondary school '4,377
Senior secondary school 4,495Trade or vocational training 2,258
, Technical training or someuniversity '2,215
Completed university 2,525
't Mother's Education:
Elementary school 1,887
Junior secondary school 4,55Senior secondary school 70Trade or vocational training ,.. 1,767
Technical training or someuniversity' 2,256
Completed university 1,560
62 380 43 760 59 472
rt-
77 179 52 . 1,181 64 2,865
76 113 49 886 62 3,289
68 1,658 48 49682 62 3,931
68 571 48 1,864 62 1,723t.
68 182 50 484 61 432
68 . 1,046 51 3,482 63 2,451
69 T57 45.....
_.---p474 62 487
68 6 476 49 1,538 62 1,434
,API
68 733 50 2,499 63 1,936
66 427 52 ° 1,263 63 704
.56 491 50 '1,254 62 842
66' 777 49 2,150 62 1,386
66 728 47 1,114. 62 1,57771 . 264 55 1,013 64 945
72' 235 '51 927 64 - 1,030
76 181 51 867 67 1,42
., .
66 335 48 -845 61 661
66 868 50 2,212 62 1,406
68 1,127 49` 62 2,626
70 195 53' 786 63 757. .
74 214 52 902 66 1,11175 124 .52 575- 61 834
145
4
49.
84
85
81 14
84
82
84
83
84
82 ,'
-,
83
82
84
83 .82
83
83
.85
838382.
83
8584
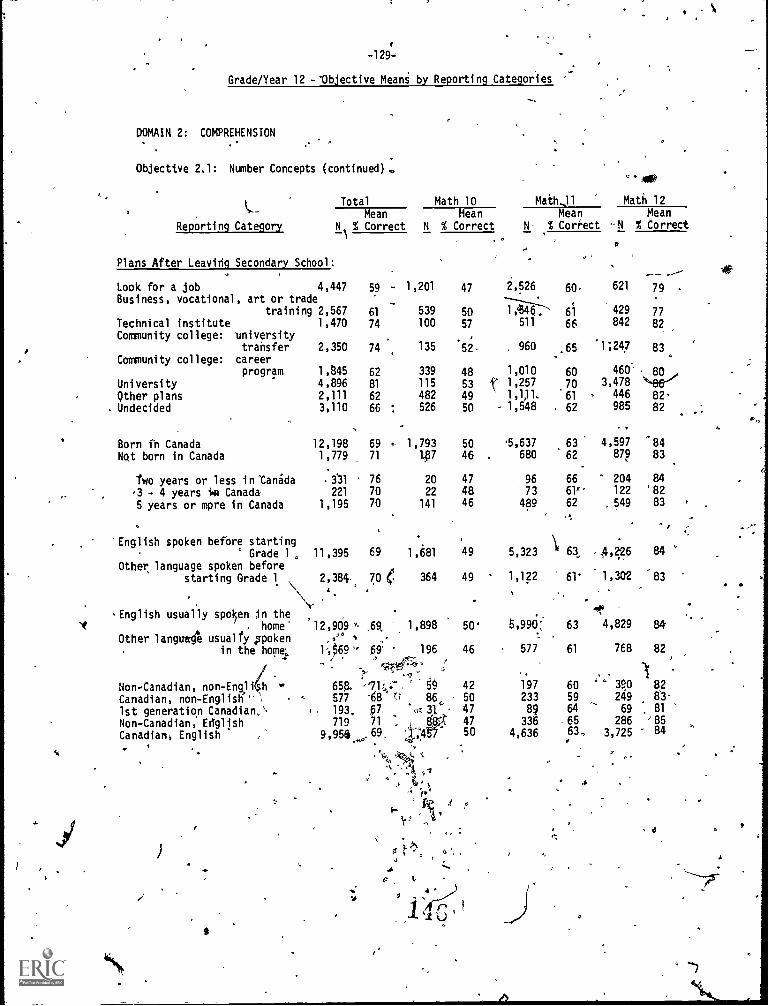
Grade/Year 12 -lobjective Means by Reporting Categories
DOMAIN 2: COMPREHENSION
Objective 2.1: Number Concepts (continued)
Reporting Category
Plans After Leaving Secondary School:
"401,
Total Math 10 Math X11 Math 12
Mean Mean Mean Mean
NA% Correct N % Correct N- % Correct -N % Correct
Look for a job 4,447
Business, vocational, art or trade59 - 1,201
..
training 2,567 61 539
Technical institute 1,470 74 100
Community college: universitytransfer 2,350 74 135
Community college: careerprogram 1,845 62 339
University 4,896 81 115
Qther plans 2,111 62 482
Undecided 3,110 66 : 526
Born in Canada 12,198 69 1,793
Nat born in Canada 1,779 71 1.07
two years or less in °Canada 331 76 20
-3 - 4 years i.0 Canada 221 70 22
5 years or mare in Canada 1,195 70 141
'English spoken before startingGrade 1 11,395 69 1,681
Other language spoken beforestarting Grade 1 2,384. 70 (5, 364
English usually spoi5en in thehome' '12,909 '6 1,898
Other language usually spoken ."
in the home. 1:469.,
.t
6i 196
I/
Non-Canadian, non-Engli(sh ..,
Canadian, non-English '',1st generation Canadian,Non-Canadian, EdglishCanadian, English
,
.,
9
65g.577193.
719, 956
------
47 2,526 60, 621 79
50 771.344:: 61 429 77
57 511 66 842 82
-.
52. . 960 65 1;247 83
. °
48 1,010 60 460' 80
53 l' 1,257 70 3,478 .%.86.--
49 ' 1,111. '61 , 446 82-50 - 1,548 , 62 985 82
50 '5,637 63 4,597 '8446 680 62 879 83
47 , 96 66 204 84
48 73 61r' 122 '82
46 489 62 , 549 83
49 5,323 \ 63 4,226 84
49 1,122 61' 1,302 '83
50 5,990: 63 4,829 84'
46 577 61 768 82
.... 614` ',c.-. 1-'71,i,,:7,. ' 59 42 197 60 '''' 390 82
'68 (; 86, 50 233 59 249 6367,, .0131 47 89 64 69 ', 81
71 7. 8!' 47 336 65 286 '8569, :17.4 50 4,636 63, 3,725 84
., .
.,,..'....4
2
0
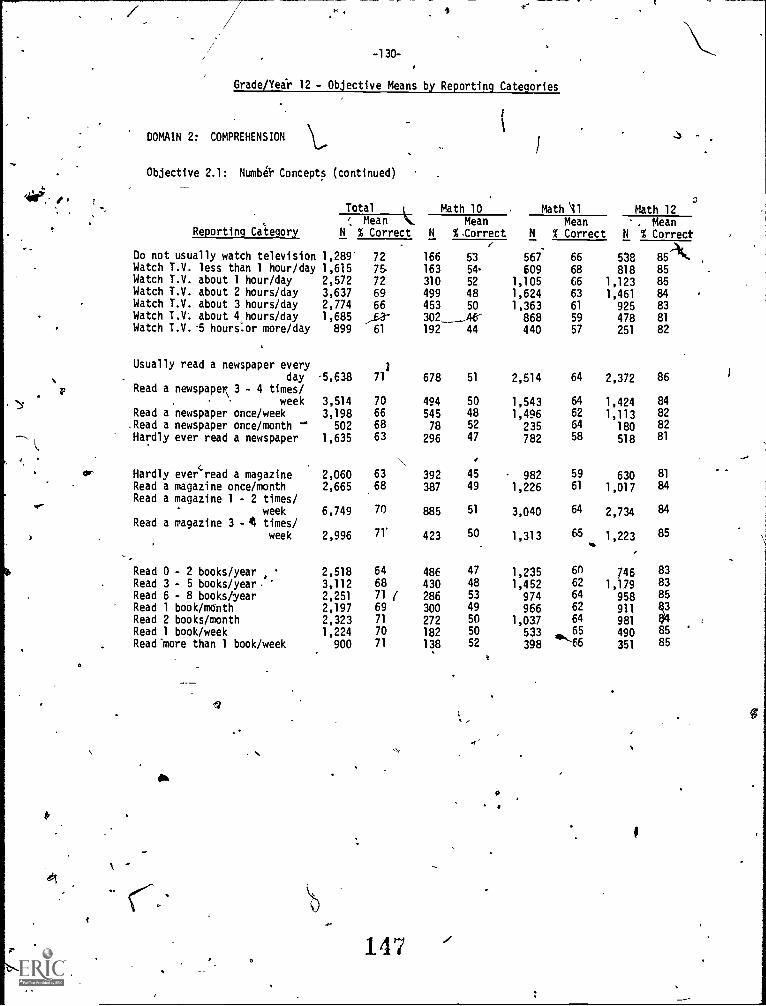
-130-
Grade /Year 12 - Objective Means by Reporting Categories
DOMAIN 2: COMPREHENSION
Objective 2.1: Numbei. Concepts (continued)
o
Total ( Math 10 . Math 11 Math 12Mean NL Mean Mean . Mean
Reporting Category N % Correct N %Correct N % Correct N % Correct
Do not usually watch television 1,289'Watch T.V. less than 1 hour/day 1,615Watch T.V. about 1 hour/day 2,572Watch T.V. about 2 hours/day 3,637Watch T.V. about 3 hours/day 2,774Watch T.T. about 4 hours /day 1,685Watch T.V. -5 hours:or more/day 899
Usually read a newspaper every. day -5,638
Read a newspaper; 3 - 4 times/
week 3,514Read a newspaper once/week 3,198.Read a newspaper once/month -" 502Hardly ever read a newspaper 1,635
L
or Hardly ever4'read a magazine 2,060Read a magazine once/month 2,665Read a magazine 1 - 2 times/
week 6,749Read a magazine 3 -4 times/
week 2,996
Read 0 - 2 books/year 2,518Read 3 - 5 books/year 3,112Read 6 - 8 books/year 2,251Read 1 book/month 2,197Read 2 books/month 2,323Read 1 book/week 1,224Read'more than 1 book/week 900
a
fi
72
,
166 53 567 66 518 85
75. 163 54 609 68 818 8572 310 52 1,105 66 1,123 8569 499 48 1,624 63 1,461 8466 453 50 1,363 61 925 83a- 302__46r 868 59 478 81
61 192 44 440 57 251 82
1
71 678 51 2,514 64 2,372 86
70 494 50 1,543 64 1,424 8466 545 48 1,496 62 1,113 82
68 78 52 235 64 180 82
296 47 782 58 518 81
63 392 45 982 59 630 81
68 387 49 1,226 61 1,017 84
70 885 51 3,040 64 2,734 84
423 50 1,313 65 1,223 85
64 486 47 1,235 6n 746 83
68 430 48 1,452 62 1,179 83
71 ( 286 53 974 64 958 85
69 300 49 966 62 911
71 272 50 1,037 64 981
70 182 50 533 65liih"--66
490 85
71 138 52 398 351 85
147
s
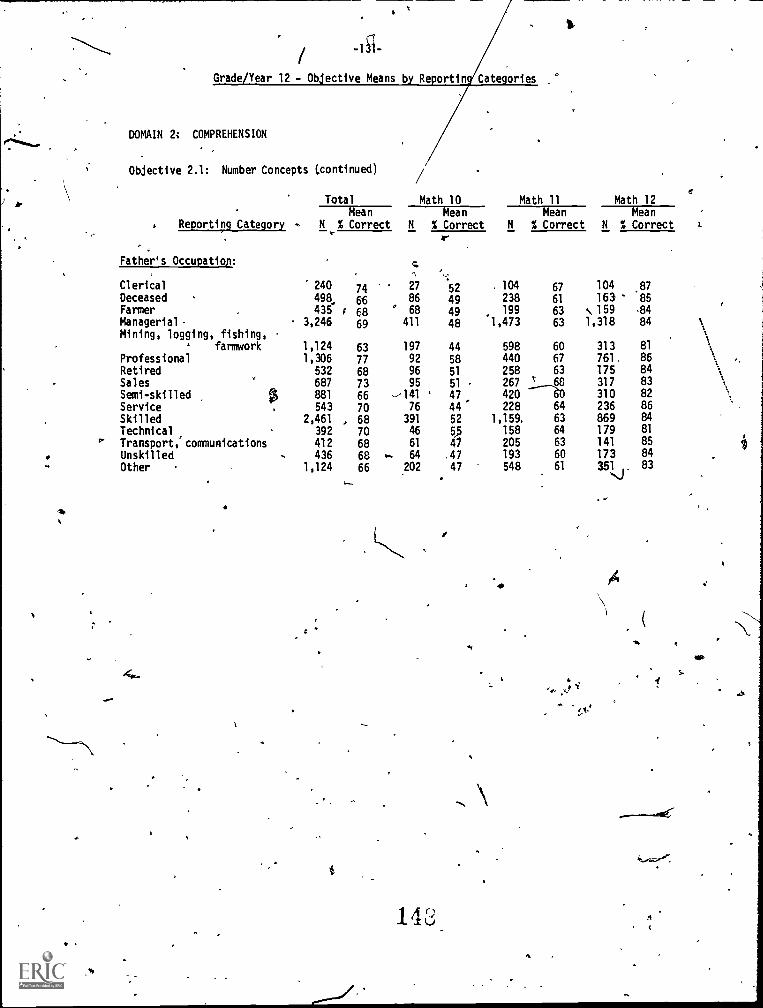
-1S1-
Grade/Year 12 - Objective Means by Reporting Categories
DOMAIN COMPREHENSION
Objective 2.1: Number Concepts (continued)
Total Math 10 Math 11 Math 12Mean Mean Mean Mean
Reporting Category T N % Correct N % Correct N % Correct N % Correctr
Father's Occupation:
Clerical 240 74 27 52 . 104 67 104 87
Deceased 498 66 86 49 238 61 163 '85
Farmer 435 t 68 ° 68 49 199 63 .. 159 84Managerial- 3,246 69 411 48 1,473 63 1,318 84
Mining, logging, fishing,formwork
-
1,124 63 197 44 598 60 313 81
Professional 1,306 77 92 58 440 67 761, 86
Retired 532 68 96 51 258 63 175 84
Sales 687 73 95 51 267 1-68 317 83
Semi-skilled 881 66 --141 ' 47 420 60 310 82
Service 543 70 76 44' 228 64 236 86
Skilled 2,461 , 68 391 52 1,159, 63 869 84
Technical 392 70 46 55 158 64 179 81
Transport, communications 412 68 61 47 205 63 141 85
Unskilled 436 68 .. 64 ,47 193 60 173 84
Other 1,124 66 202 47 548.
61 351 _ 83'...J
C
1
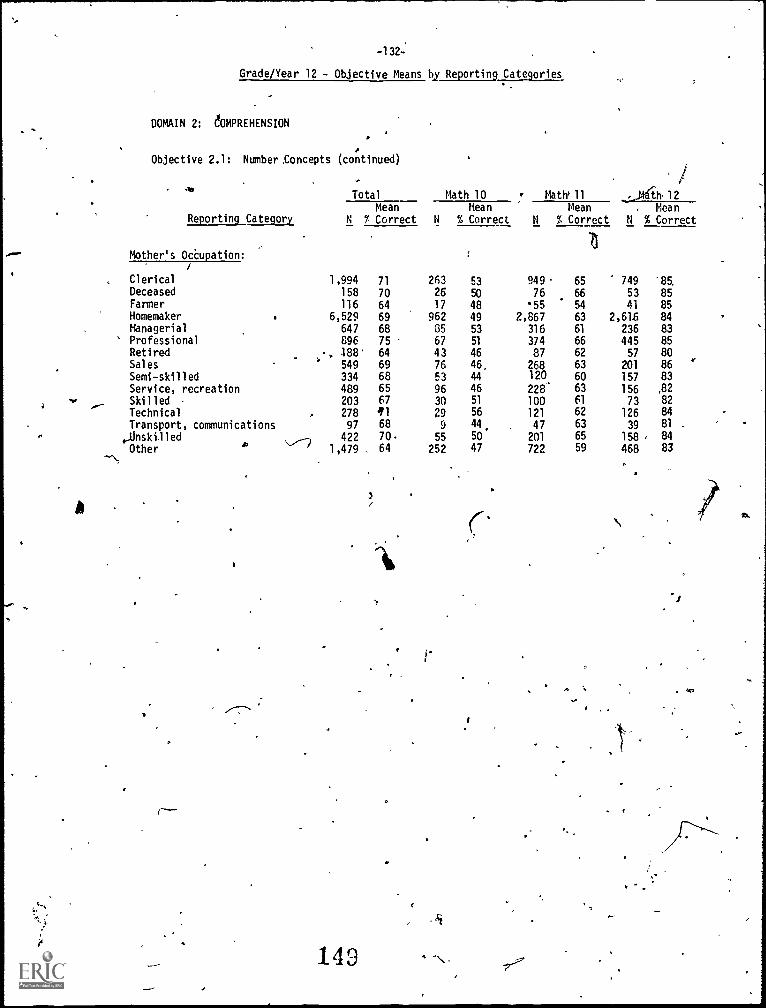
-132 -
Grade /Year 12 - Objective Means by Reporting Categories
DOMAIN 2; COMPREHENSION
Objective 2.1: Number. .Concepts (continued)
AI,
Reporting Category
Total Math 10 Maths 11 ,_Miih. 12
MeanN % Correct N
Mean
% CorrectMean
N % Correct
,
N
Mean
% Correct
Mother's Occupation:
Clerical 1,994 71 263 53 949 65 749 '85.
Deceased 158 70 26 50 76 66 53 85Fanner 116 64 17 48 '55 54 41 85Homemaker 6,529 69 962 49 2,867 63 2,616 84Managerial 647 68 85 53 316 61 236 83Professional 896 75 67 51 374 66 445 85Retired , 188' 64 43 46 87 62 57 80Sales 549 69 76 46, 268 63 201 86
Semi-skilled 334 68 53 44 120 60 157 83Service, recreation 489 65 96 46 228' 63 156 .82
Skilled 203 67 30 51 100 61 73 82
Technical 278 11 29 56 121 62 126 84
Transport, communications 97 68 9 44, 47 63 39 81
422 70 55 50 201 65 158 , 84
Other 1,479 64 252 47 722 59 468 83
r--
143
3(
1
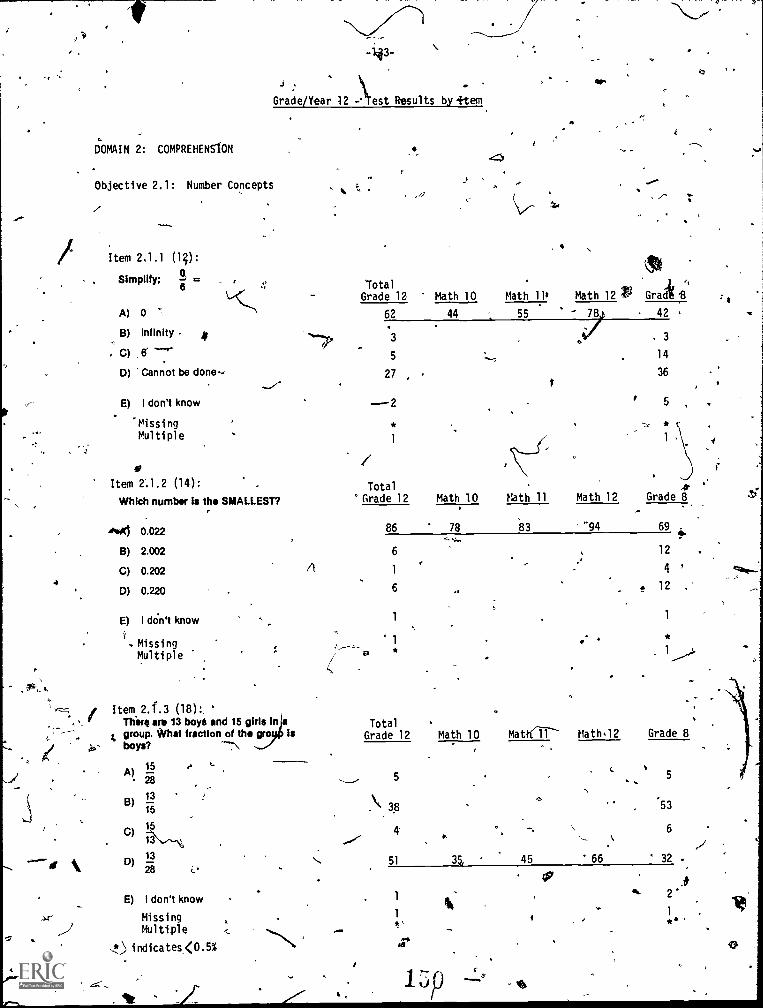
DOMAIN 2: COMPREHENSION
Objective 2.1: Number Concepts
Item 2.1.1 (12):
. Simplify;6
k
A) 0
B) Infinity
C)
D) 'Cannot be done
E) I don't know
MissingMultiple
J
Grade/Year 12 )Yest Results by +tem,.
Item 2.1.2 (14):Which number Is the SMALLEST?
"01 0.022
B) 2.002
C) 0.202
D) 0.220
E) I dOn't know
i. MissingMulti ple
Item 2. 'f.3 (18):Thar, are 13 boy* and 15 girls In agroup. What fraction of the gr Isboys?
15
28
13
15
15
13
28
A).
B)
C)
D)
E) I don't know
MissingMultiple
indicates.<0.5%
'TotalGrade 12 Math 10
62 44
3
5
27
2
/Total
Grade 12 Math 10 Math 11 Math 12 Grade 8
dh
111,10
Math 1.11 Math 12 S3 Grah;55 42
. 3
14
36
5 ,
86 78 83 "94 69 .
6
1
6
I*
:4.. f12
4 '
12 .'
1
*
, 1
TotalGrade 12 Math 10 Mat 11 Math.12 Grade 8
c .5 , 5
.\. 38 53
4' ,.. \ 6-./51 35, .45 66 32 .,
1.... 2'II"
$t1 1, **
or%
.6
.
I
:
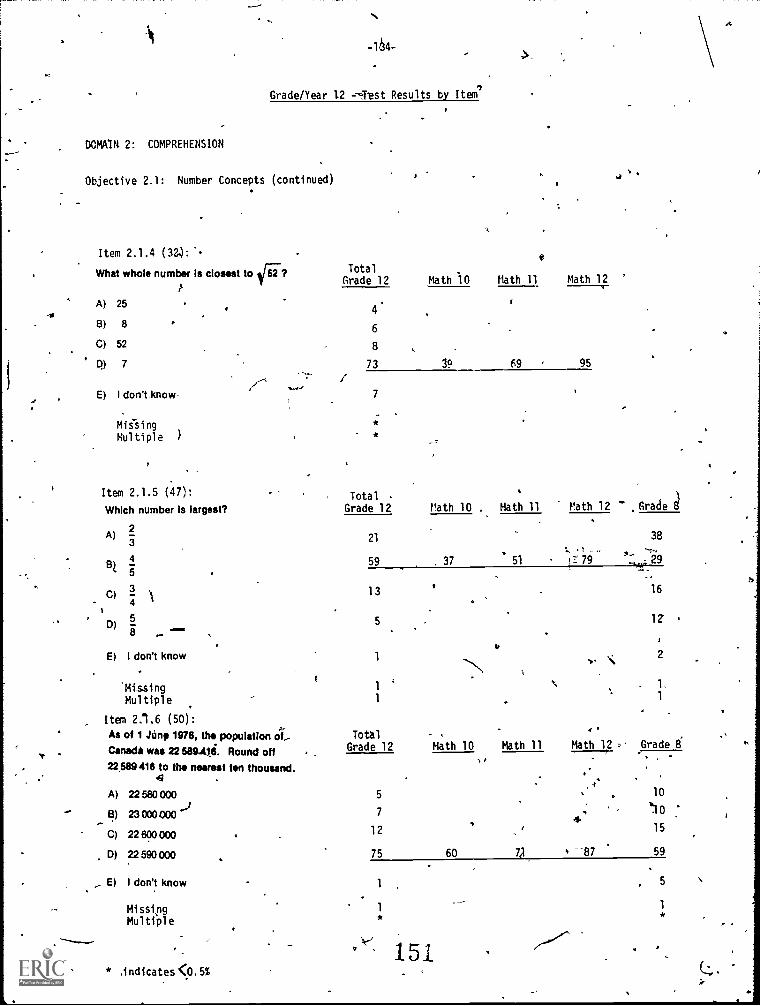
a
-164-
Grade/Year 12 --Test Results by Item'
DOMAIN < 2: COMPREHENSION
Objective 2.1: Number Concepts (continued)
Rem 2.1.4 (32..):
1
What whole number Is closest to t67?
A) 25
B) 8
C) 52
E) I don't.know-
Mis-singMultiple )
Item 2.1.5 (47):Which number Is largest?
2A)
3
4St
5
3C)
4
5D)
8
E) I don't know
MissingMultiple
Item 2.1.6 (50):As of 1 Amp 1976, the population otCanada was 22 589.41i. Round off
22589418 to the nearest ten thousand.
TotalGrade 12 Math 10 Math 11 Math 12
Grade 11
4.
6
8
73 19 69 95
*
*
TotalGrade 12 Math 10 Math 11 Math 12
21
59 . 37.
51 17-: 79
38
._ -17-i 29
13
5
1
1
1
Toth.'Grade 12 Math 10
v
Math 11 Math 12 =
16
12
2
Grade 8
A) 22 580 000
B) 23000000
C) 22 690 000
D) 22 590 000
E) I don't know
MissingMultiple
5
12
75 60 71 s 87
10
'10
15
59
1
1
5
1
*
* ndicates <0. 5%151
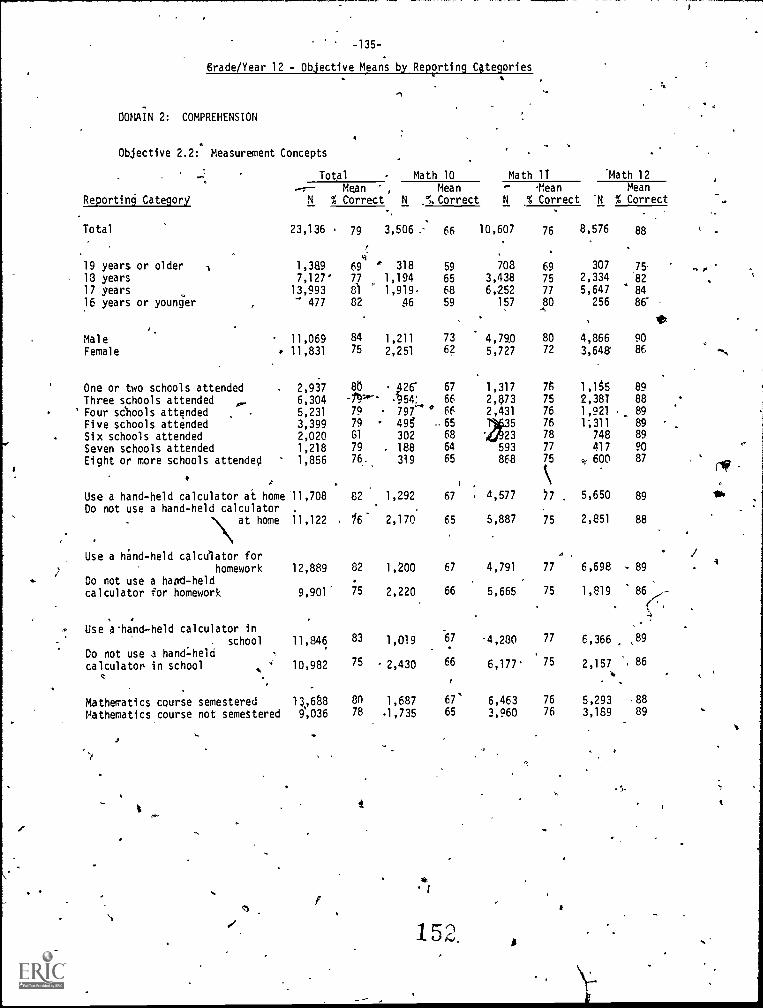
-135 -
Grade /Year 12 - Objective Means by Reporting Categories
DOMAIN 2: COMPREHENSION
Objective 2.2: Measurement Concepts
Total , Math 10 Math 11
--7-- Mean r , Mean - 'Mean
Reporting Category N % Correct N .'",..Correct N % Correct
Total 23,136 7g 3,506 .- 66 10,607 76
i',
19 years or older A 1,389 69s ' 318 59 708 69
13 years 7,127' 77 1,194 65 3,438 75
17 years 13,993 Cl 1,818 68 6,252 77
16 years or younger 477 82 46 59 157 80
Male 11,069 84 1,211 73 4,79.0 80
Female 11,831 75 2,251 6? 5,727 72
One or two schools attended 2,937 8b $26' 67 1,317 7g
Three schools attended' Four schools attended
6,3045,231
-19"--
79
:954:797-' 0
66
66
2,$732,431
75
76
Five schools attended 3,399 79 495 65 1635 76
Six schools attended 2,020 81 302 68 '4P23 78
Seven schools attended 1,218 79 188 64 593 77
Eight or more schools attended 1,856 76 319 65 868 75
Use a hand-held calculator at home 11,708 82 1,292 67 4,577 77
Do not use a hand-held calculatorat home 11,122 , /6' 2,170 65 5,887 75
Use a hand-held calculator for 0
homework 12,889 82 1,200 67 4,791 77
Do not use a hapti-heldcalculator for homework 9,901' 15 2,220 66 5,665 75
Use a-hand-held calculator inschool 11,846 83 1,019 67 -4,230 77
Do not use a hand =heldcalculator in school 4.
t10,982 75 2,430 66 6,177. 75
Mathematics course semestered 13,688 80 1,687 67' 6,463 76
Mathematics course not semestered 9,036 78 1,735 65 3,960 76
00.
152.
'Math 12
Mean
'N % Correct
8,576 88
307 75,
2,334 82
5,647 84
256 86-
4,866 90
3,648' 86
1,155 89
2,38T 88
1,921 89
1;311 89
748 89
417 90
.,, 600 87
5,650 89
2,851 88
6,698 ,. 89
1,819 86 ,,,-
CI'.
6,366 89
2,157 , 86
5,293 ,88
3,189 89
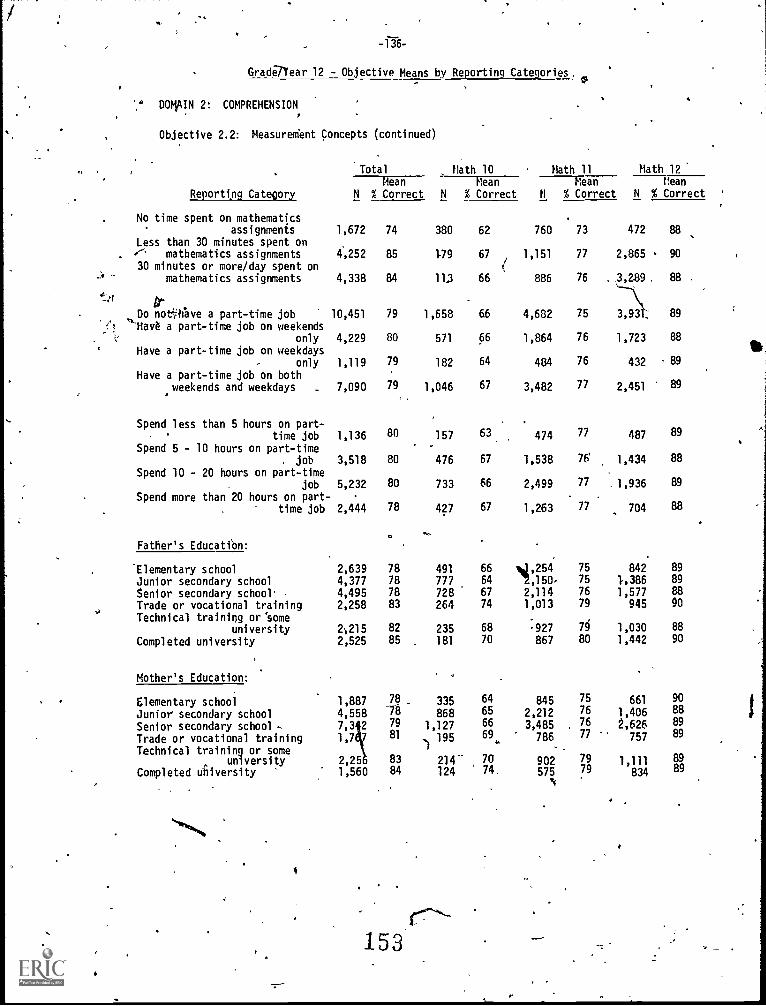
YID
416-
Grade7Year 12 - Objective Means by Reporting Categories.
DOgAIN 2: COMPREHENSION,
Objective 2.2: Measuredent Concepts (continued)
Reporting Category
,
Total Math 10 . Math 11 Math 12'Mean Mean Mean Mean
N % Correct N % Correct N % Correct N % Correct '
No time spent on mathematicsassignments 1,672 74 380 62 760 73 472 88
Less than 30 minutes spent onF'' mathematics assignments 4,252 85 179 67
/
1,151 77 2,865 90
30 minutes or more/day spent onmathematics assignments 4,338 84 113 66 886 76 3,289 . 88 .
`4(4r
Do not4iblve a part-time job 10,451 79 1,658 66 4,682 75 3,93 . 89
'6 'Have a part-time job on weekendsonly 4,229 80 571 66 1,864 76 1,723 88
Have a part-time job on weekdaysonly 1,119 79 182 64 484 76 432 89
Have a part-time job on bothweekends and weekdays . 7,090 79 1,046 67 3,482 77 2,451 89
Spend less than 5 hours on part-time job 1,136 80 157 63 474 77 487
Spend 5 - 10 hours on part-time..
. job 3,518 80 476 67 1,538 76' 1,434
Spend 10 - 20 hours on part-time. job 5,232 80 733 66 2,499 77 1,936
Spend more than 20 hours on part-time job 2,444 78 427 67 1,263 77 704
Father's Educatibn:
89
88
89
88
, .
'Elementary school 2,639 78 491 66 NJ,254 75 842 89
Junior secondary school 4,377 78 777 64 '2,150, 75 1,386 89
Senior secondary school. , 4,495 78 728 67 2,114 76 1,577 88
Trade or vocational training 2,258 83 264 74 1,013 79 945 00
Technical training or 'some ,
university 2215 82 235 68 '927 79 1,030 88
Completed university 2,525 85 181 70 867 80 1,442 90
Mother's Education:
Elementary schoolJunior secondary schoolSenior secondary school -Trade or vocational trainingTechnical training or some
universityCompleted university
1,887
4,558
1,7
78
-ID
79
81
335
8681,127
195
64
65
66
69
8452,212
3,485786
2,25 83 214- 70 9021,560 84 124 74 575
153
75
76
76
77
7979
661
1,4062,626
757
1,111834
90
8889
89
8989
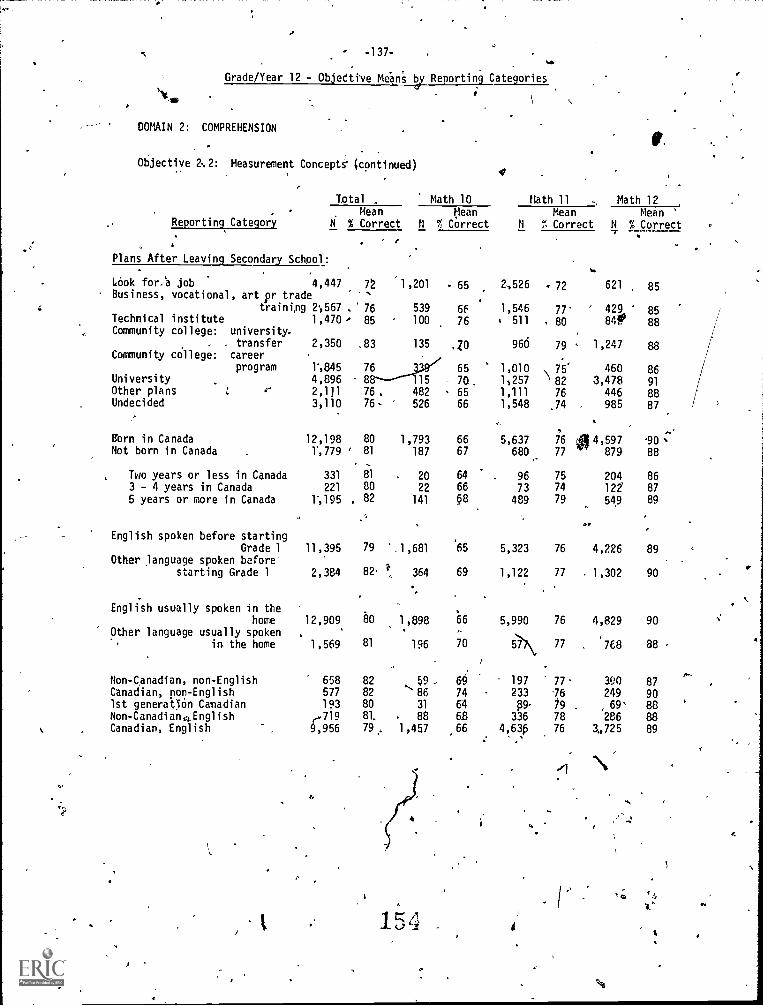
-137- .
Grade/yeavategories
DOMAIN 2: COMPREHENSION
Objective :2: Measurement ConceptS° (continued)
Reporting Category
Total . Math 10 Math 11 , Math 12Mean Mean Mean Mean '
N % Correct H % Correct N l'. Correct N % Correct
Plans After Leaving Secondary School:
. f
Look fora job 4,447 n '1,201Business, vocational, art pr trade `
training 2;567 , 76 539Technical institute 1,470 85 - 100Community college: university.
. transfer 2,350 .83 135Community college: career
program 1',845 76University 4,896 8 15Other plans : 4- 2,1)1 76 . 482Undecided 3,110 76- 526
born in Canada 12,198 80 1,793Not born in Canada 1,779 ' 81 187
Two years or less in Canada 331 81 203 - 4 years in Canada 221 80 22
5 years or more in Canada 1-095 . 82 141
English spoken before startingGrade 1 11,395 79 '1,681
Other language spoken before'starting Grade 1 2,384 82. 364
English usually spoken in thehome 12,909 80 1,898
Other language usually spokenin the home 1,569 81 196
Mon-Canadian, non-English 658 82 59
Canadian, non-English 577 82 '851st generatliOn Canadian 193 80 31
Non-CanadianaEnglish r-719 81. 88
Canadian, English 9,956 79, 1,457
65 2,526 72 621 85
6f 1,546 77 429 8576 s 511 80 847 88
.70 960 79 - 1,247 88
65 1,010 75' 460 8670 15257 '82 3,478 91
65 1,111 76 446 8866 1,548 .74 . 985 87
66 5,637 76 /814,597 -90
67 680 77 879 88
64 96 75 204 8666 73 74 122 87
68 489 79 549 89
'65 5,323 76 4,226 89
69 1,122 77 . 1,302 90
66 5,990 76 4,829 90
70 6..7\7\ 77 768 88
64 197 77- 390 8774 233 ,6 249 9064 ff9 79 . 69' 8868 336 78 286 88
,66 4,63k 76 3,.725 89
.
1. C7"o 1 -
w.
I
f.
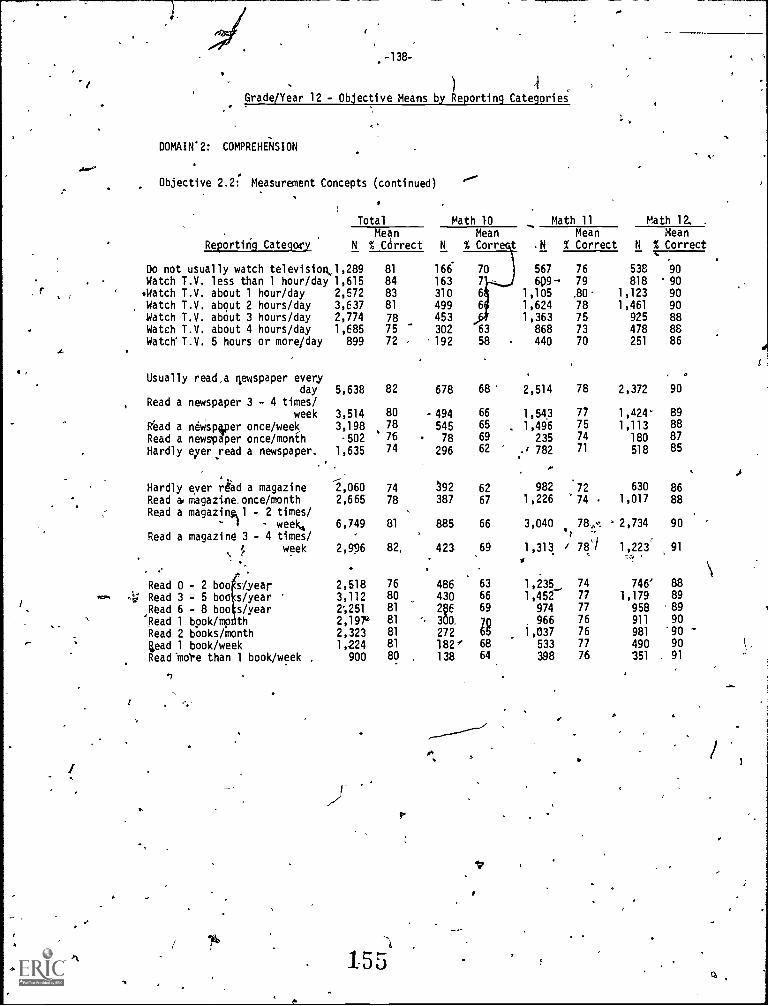
4
Grade/Year 12 - Objective Means by Reporting Categories. .
DOMAIN2: COMPREHENSION
Objective 2.2:. Measurement Concepts (continued)
Reporting Category
Total
MeanN % Correct
Math 10
MeanN % Corre t
Do not usually watch television) ,289Watch T.V. less than 1 hour/day 1,615
81
84166
163
(*Watch T.V. about 1 hour/day 2,572 83 310Watch T.V. about 2 hours/day 3,637 81 499Watch T.V. about 3 hours/day 2,774 78 453Watch T.V. about 4 hours/day 1,685 75 302
Watch' T.V. 5 hours or more/day 899 72 ' 192
Usually read,a gewspaper everyday 5,638 82 678
Read a newspaper 3 - 4 times/week 3,514 80 -424
Read a neWspiper once/week 3,198 78 545
Read a newspaper once /month -502 76 78
Hardly eyer read a newspaper, 1,635 74 296
Hardly ever read a magazine 2,060 74 392
Read a magazine.once/month 2,665 78 387
Read a magazing,1 - 2 times/week,
Read a magazine 3 - 4 times/6,749 81 885
week.,
2,926 2, 423
Read 0 - 2 boo siyear 2,518 76 486SO. 4 Read 3 - 5 boo s/year 3,112 80 430
Read 6 - 8 boo s/year 2;251 81
Read 1 book /mp th 2,197'4 81 300,
Read 2 books/month 2,323 81 272
'ead 1 book/week 1,224 81 182'Read'molT than 1 book/week 900 80 138
)%.
'7
155
70
7
6
6
63
58
68
66
6569
62
6267
66
69
63
66
69
IR68
64
567
6091,1051,6241,363
868440
1,452974
, 9661,037
533
398
Math 11Mean
.N % Correct
76
79.80.
787573
70
2,514 78 2,372 90
1,543 77 1,424. 89
1,496 75 1,113 88
235 74 180 87782 71 518 85
982 72 630 861,226 74 1,017 88
3,040 78,..: . 2,734 90
8 1,311 / 78*/ 1,223' 91
74
77
77
7676
77
76
Math la .
MeanN % Correct
538 90
818 90
1,123 90
1,461 90
925 88478 88251 86
746'
1,179958911
981
490
351
8889
8990
'90 -90
91
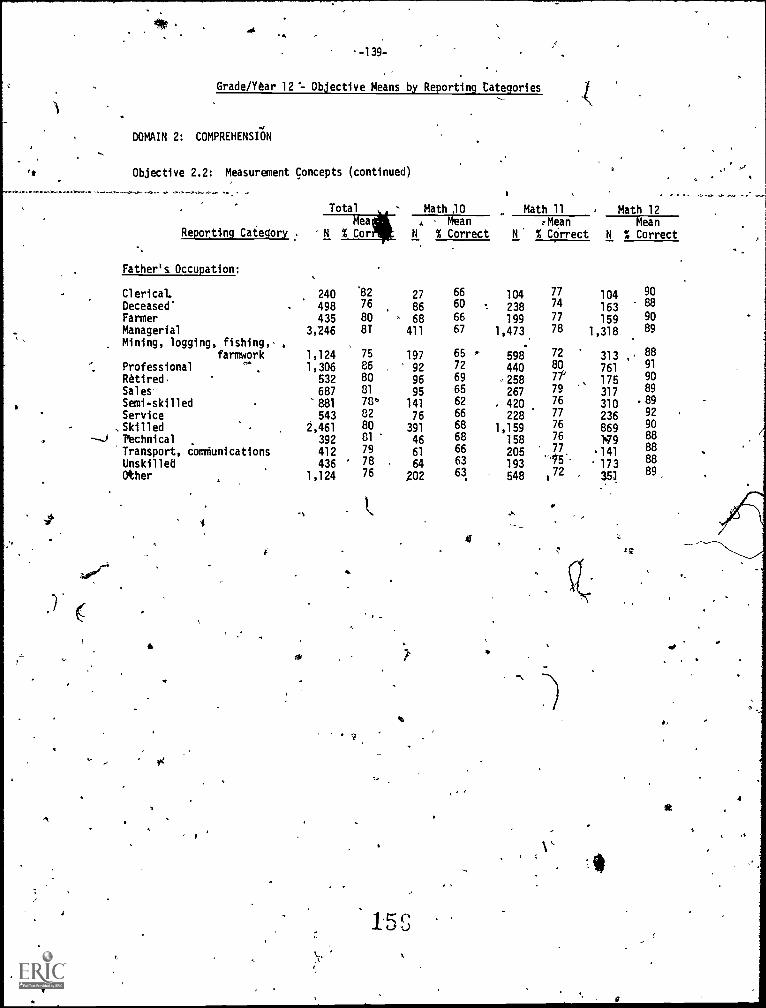
t
4
'-139-
Grade/Year 12 t. Objective Means by Reporting Categories
DOMAIN 2: COMPREHENSION
Objective 2.2: Measurement Concepts (continued)
#'
. .. ......
Total Math 30 Math 11 , Math 12Mea 6 Mean ,Mean Mean
Reporting Category . N % Cor N % Correct N % Correct N % Correct
Father's Occupation:
Clerical.
Deceased'FarmerManagerial
Mining, logging, fishing,farmwork
Professional...
.
Retired,SalesSemi-skilledService
,Skilled.l'echnical
Transport, communicationsUnskilledOther
240498435
3,246
1,1241,306
532
'881
5432,461
392
412436
1,124
'82
76
8081
75
86
8?78°82
80
797876
'
27
86
68411
197
92
96
95141
76
391
46
61
64
202
6
PC
`,1
6660
66
67
6572
69
6562
66
686866
6363
104
238
1991,473
598440258267
. 420228
1,159158205193548
77
74
77
78
72
80
7179
76
77
76
76
77
-15*
472
104
163159
1,318
313 ,-761
175317
310236
869)79
.141
173351
9088
90
89
88
91
90
89
.8992
90
888888
89,
158
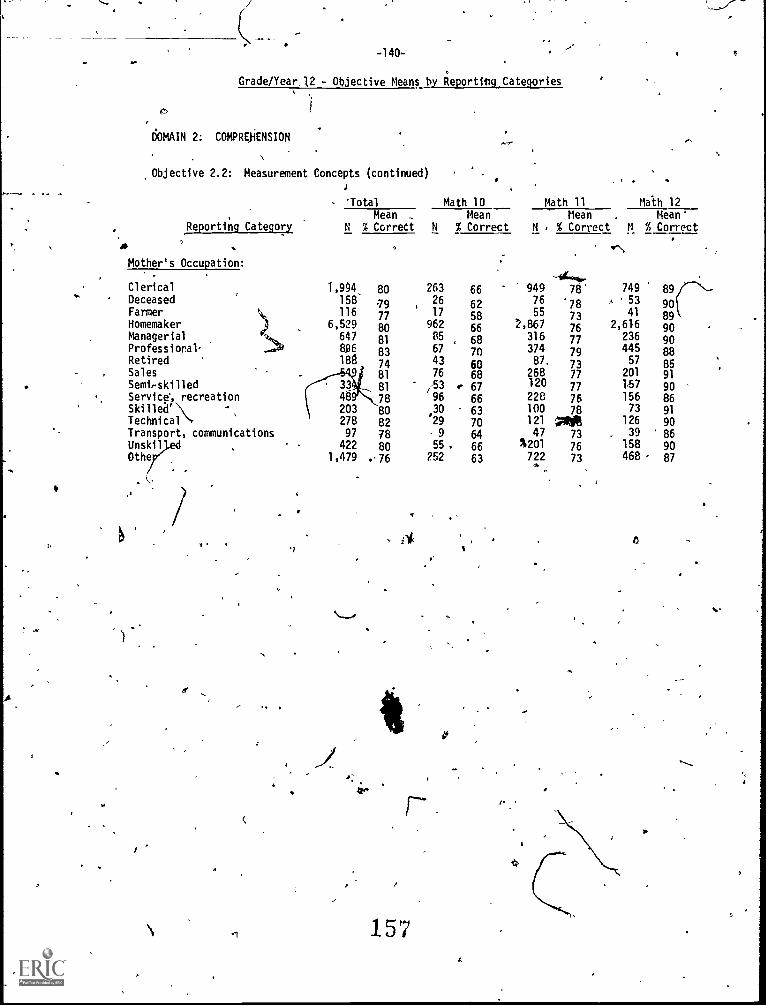
-140 -
Grade /Year. 12 - Objective Means by ReportitgCategories
DOMAIN 2: COMPREJIENSION
Objective 2.2: Measurement Concepts (continued)
- 'Total Math 10 Math 11 filth 12
Mean Mean Mean . Mean'Reporting Category N % Correct N % Correct H % Correct M % Correct
Mother's Occupation:
Clerical 1,994 80Deceased 158 ,7,-v .
116
ManagerialProfessional,
647
896 8381
Farmer 110 77
Homemaker 6,529 80
Transport, communicationsTechnical `,.
Sales
SemiskilledService', recreation
Skilled' \
Retired
,
-('-''-1(81
203 8708
18$ 74
278 82
81
Unskil
Othe 1,479 0.76
422 8708
nr,
n.
157
263
26
962
61;677:
X53
30
'29
2.55295
66
666765868;
60
6667
6370
666463
9497655
2,867316374
120
100
47
722
..,,,..78'
787376
77
77
78
73
73
749
, 53
41
236
57
11162756637
39
158468
89
90
8885
89996010
86
9087
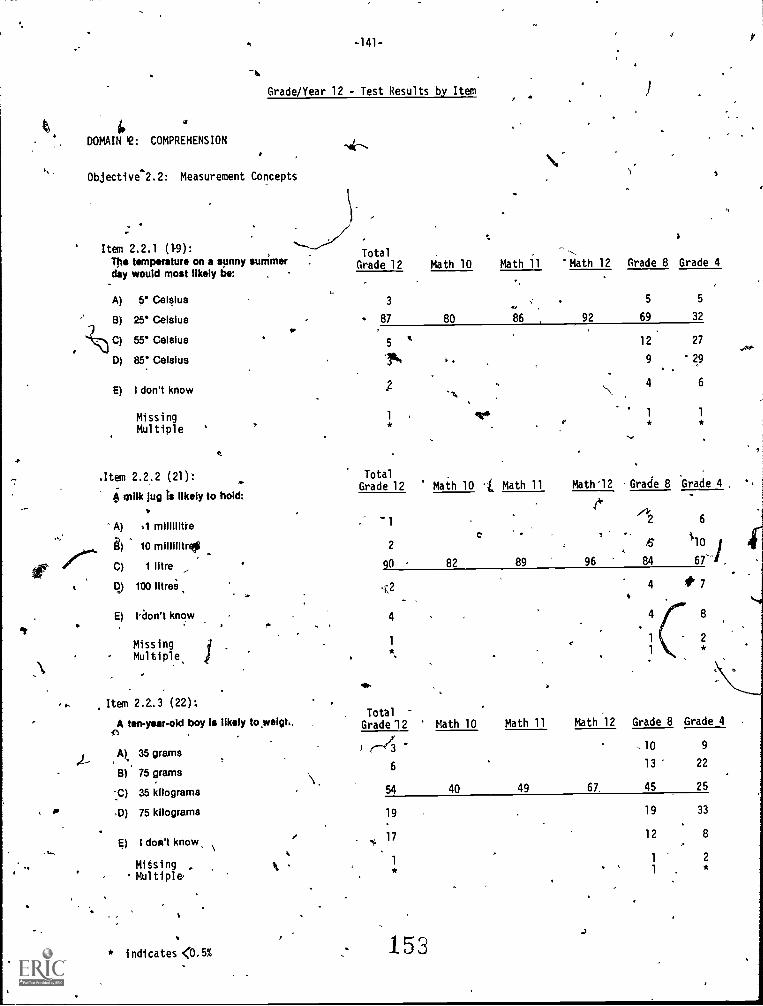
,
-141 -
Grade /Year 12 - Test Results by Item
DOMAIN 02: COMPREHENSION
Objective'2.2: Measurement Concepts
Item 2.2.1 (1-9):The temperature on a sunny summerday would most likely be:
A) 5' Celsius
8) 25' Celsius
C) 55' Celsius
D) 85' Celsius
E) I don't know
MissingMultiple
TotalGrade 12 Math 10 Math 11 Math 12 Grade 8 Grade 4
3
87 80
5
2
1*
5 5
86 92 69 32
12 27
9 p4 6
.Item 2.2.2 (21): TotalGrade 12 Math 10 L Math 11 Math '12 Grade 8 Grade 4 ,
A milk jug is likely to hold:4k
A) .1 millilitre
10 millilitre*
C) 1 litre
D) 100 Wei
E) (iion't know
MissingMultiple
Item 2.2.3 (22):.
2 6
2 5 10
90 82 89 96 84 .
A ten-year-old boy Is likely to weigh.
A) 35 grams
B) 75 grams
IC) 35 kilograms
.D) 75 kilograms
E) I don't know,
MitsingMultiple.
TotalGrade 1 2 Math 10 Math 11 Math 12 Grade 8 Grade 4
I
6
54 40 49 67,
10
13
45
9
22
25
19
17
1
19
12
1
1
33
8
2*
* indicates <0.5% - 153
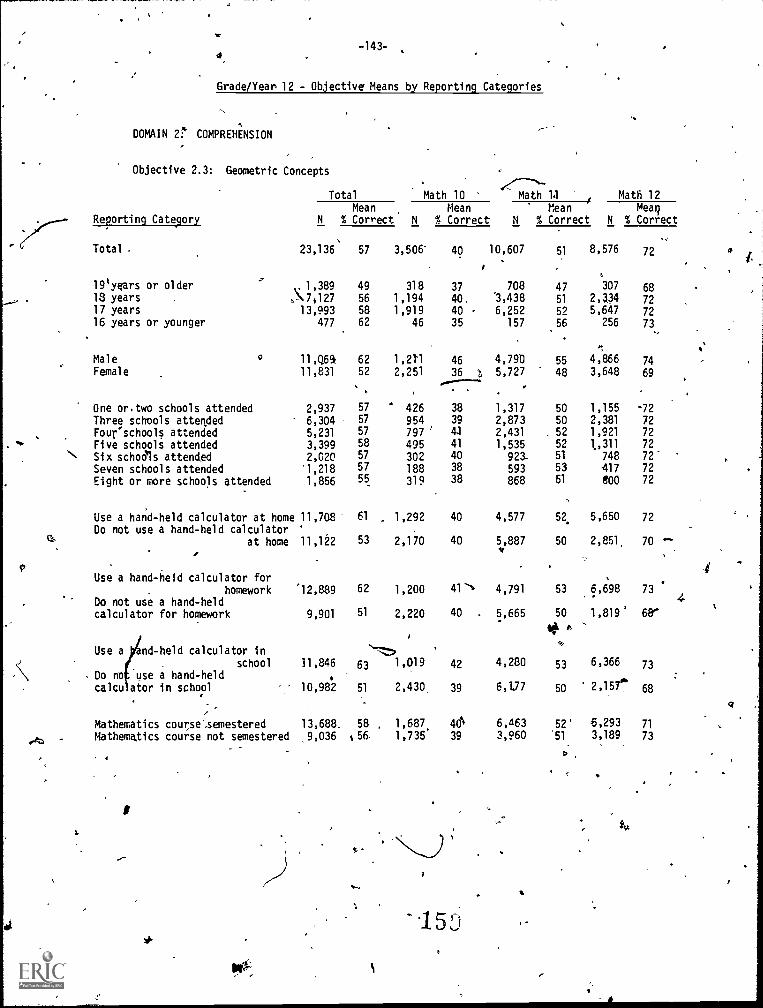
-143-
Grade/Year 12 - Objective' Means by Reporting Categories
DOMAIN 2:4' COMPREHENSION
Objective 2.3: Geometric Concepts
Reporting Category
Total .
19'years or older18 years17 years16 years or younger
MaleFemale
Total Math 10 Math 14 Math 12Mean Mean Mean Meat)
N % Correct N % Correct N % Correct N % Correct
23,136
1,389
,N7,12713,993
477
11,Q6911,831
One or.two schools attended 2,937Three schools attended 6,304Four schools attended 5,231
-.. Five schools attended 3,399.,
Six schodls attended 2,020Seven schools attended '1,218
Eight or more schools attended 1,856
c.1>
9
Use a hand-held calculator at home 11,708Do not use a hand-held calculator '
at home 11,122
Use a hand -held calculator for
homeworkDo not use a hand-heldcalculator for homework
Use a rand -held calculator in
school 11,846
Do no use a hand-heldcalcu ator in school 10,982
.,
Mathematics coursesemestered 13,688_
Mathematics course not semestered .9,036
12,889
9,901
0,
57 3,506- 40 10,607 51 8,576 72
49 318 37 708 47 307 6856 1,194 40, 3,438 51 2,334 7258 1,919 40 6,252 52 5,647 7262 46 35 157 56 256 73
62 1,211 46 4,790 55 4,866 7452 2,251 36 t 5,727 48 3,648 69
57 426 38 1,317 50 1,155 .7257 954 39 2,873 50 2,381 7257 797 ' 41 2,431 , 52 1,921 72
58 495 41 1,535 52 1,311 72
57
57 302188
40
38
923.
593
51
53
748
-417
72'
72
55 319 38 868 51 800 72
61 1,292 40 4,577 52, 5,650 72
53 2,170 40 5,887 50 2,851, 70 --
62 1,200 41'b 4,791 53 6,698 73
51 2,220 40 5,665 50 1,819' 68'
0
Otk
''' '
63 1,019 42 4,280 53 6,366 73
51 2,430, 39 6,177 50 '2,157.7. 68
58 , 1,687. 40eb 6,463 52' 8,293 71
i 56- 1,735 39 3,960 '51 3,189 73
D-
1
15D
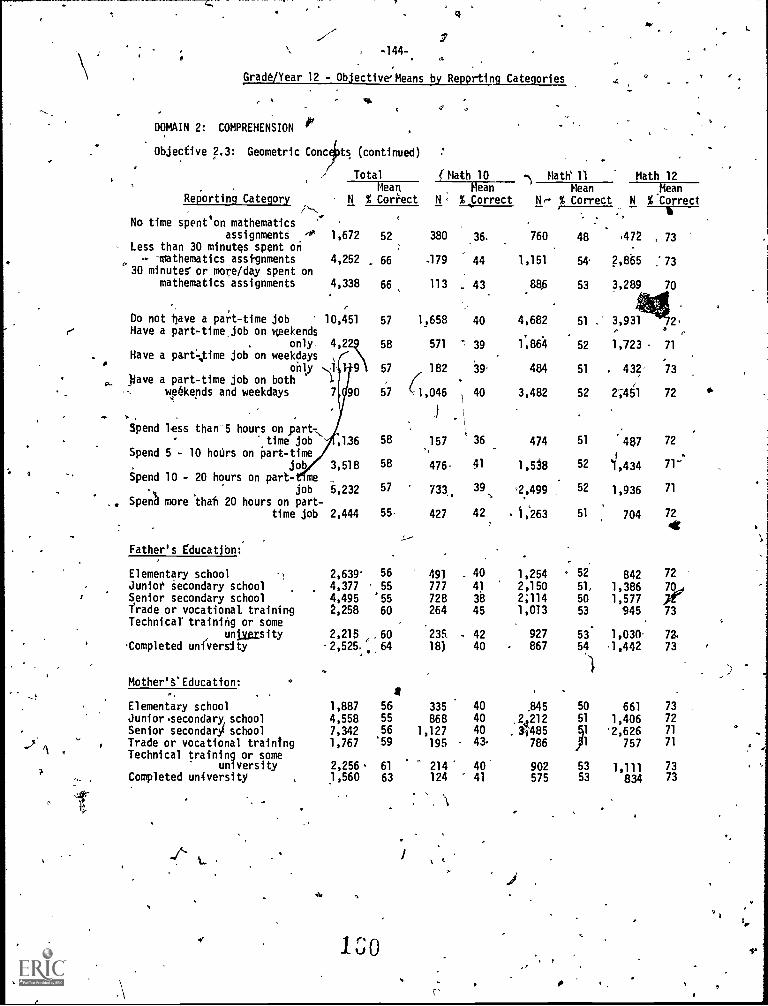
r"
-144-
Grade/Year 12 - Objective' Means by Reporting Categories
DOMAIN 2: COMPREHENSION 411'
Objective 2.3: Geometric Conc ts (continued)
Total
Reporting CategoryMean
N % Correct
No time spent'on mathematicsassignmentS 40 1,672
Less than 30 minutes spent onmathematics assignments 4,252
30 minutes' or more/day spent onmathematics assignments 4,338
Do not gave a part-time job 10,451
52
. 66
66
57Have a part -time. job on weekends
only 4,22 58Have a part-,Xime job on weekdays ,
only -II: 9 57
0. )ave a part-time job on bothweekends and weekdays 7 90 57
Spend less than-5 hours on part%time job 0,36 58
Spend 5 - 10 hairs on part -timejob 3,518 58
Spend 10 - 20 hours on part- me
job 5,232 57
Spend more that 20 hours on part-time job 2,444 55-
Father's nucation:'
Elementary school 2,639 56
Junio secondary school 4,377 55
Senior secondary school 4,495 '55Trade or vocational training 2,258 60Technical training or some
university 2,215 .60-Completed university
Mother's'Educatfon:a
Elementary school 1,887 56Junior.secondary, school 4,558 55
Senior secondary school 7,342 56
Trade or vocational training 1,767 '59
Technical training or someuniversity 2,256 t 61
Completed university 1,560 63
.1 tr; 0
( hlath 10
MeanN. % Correct
-) Maths 11
Mean _Mean
N % C %orrect N Correct
380
.179
36.
44
760
1,151
111 : 43 88.6
1,658 40 4,682
571 39 1,864
182 39- 484
(1,046 40 3,482
J
157 36 474
476. 41 1,518
733 39 '2,499
427 42 1,263
491 . 40 1,254777 41 2,150728 38 2;114264 45 1,013
235 - 42 927
18) 40 867
335 40
,
.845
868 40 ,242121,127 40 ..34485
195 43- 786
214 40 902124 41 575
c--
48 ,472 , 73
54 ?,865 :73
53 3,289
51 '3,931
52 1,723 71
51 . 432 73
52 2;451 72
51 487
52 1,434
52 1,936
52
51,
5053
8421,386 7
1,577945
53 1,030- 72.
54 ,442 73
50 66151 1,406
'2,626
757
53 1,111 7353 834 73
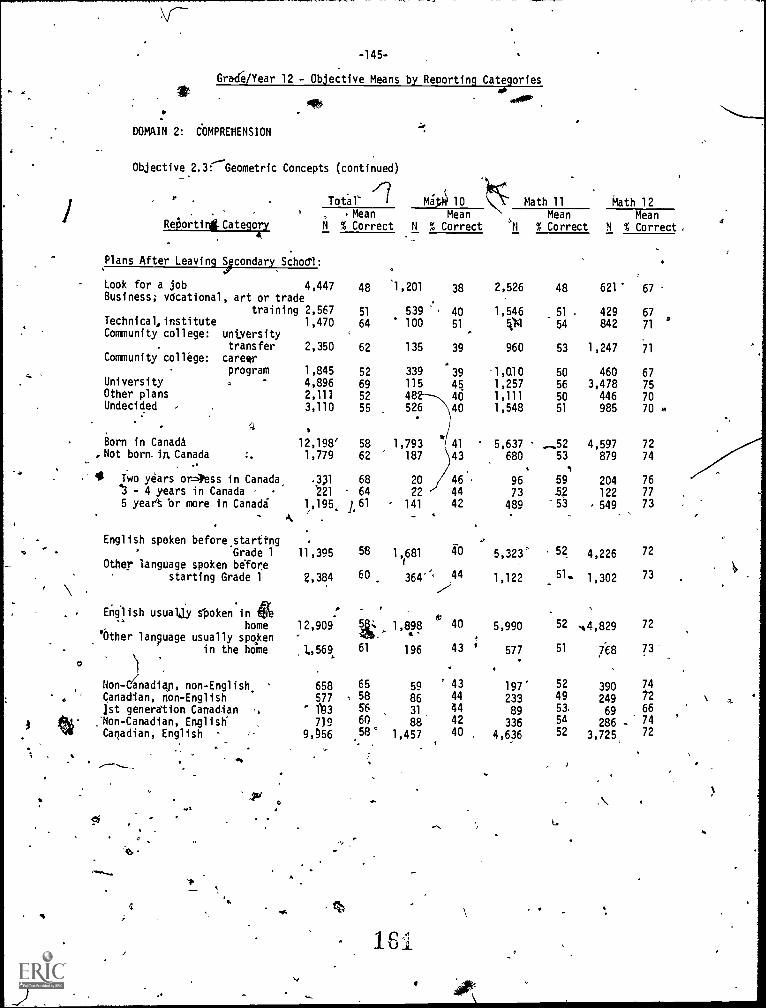
3
-145-
Grade/Year 12 - Objective Means by Reporting Categories
onolo
DOMAIN 2: COMPREHENSION
Objective 2.3r-Geometric
4111#
Concepts (continued)
Re6ortinitCategory
Total`
N
'Mean% Correct
Plans After Leaving ycondary Schodl:
48
51
Look for a job 4,447Business; vdcational , art or trade
training 2,567Technical, institute 1,470 64Community college: university
transfer 2,350 62Community college: arm-
program 1,845 52University 4,896 69Other plans 2,111 52Undecided 3,110 55
Born in Canada 12,198' 58Not born. in. Canada 1,779 62
. # Two years orPess in Canada .3X 6843 - 4 years in Canada '221 645 year br more in Canada
k1,195. 161 '
English spoken before startingGrade 1 11,395 58
Other language spoken beforestarting Grade 1 2,384 60
English usually spoken in 416home 12,909
'Other language usually spoken
flin the home 61
Non-dnadiap, non-English, 658 65
. Canadian, non-English 577 58
]st generation Canadian f93 56
:Non-Canadian, English' 739 60
Canadian, English 9,§56 58'
M41 10Mean
N % Correct
1,201 38
539 40' 100 51
135 39
339
115
48526
39aq4040
1,793 V 41187 43
20 46
22 44
141 42
1,1681 40
44
1,898 40
196 43
59 ' 43
86 44
31 44
88 42
1,457 40
161
Math 11
Mean
% Correct
Math 12Mean
N % Correct ,
2,526 48 621' 67
1,546 51 . 429 6754 842 71
960 53 1,247 71
-1,010 50 460 671,257 56 3,478 751,111 50 446 701,548 51 985 70 .
5,637 ° -52 4,597 72680 53 879 74
1
96 59 204 76
73 5.? 122 77
489 53 549 73
5,323' 52 4,226 72
1,122 51. 1,302 73
5,990 52 -44,829 72
577 51 768 73
197' 52 390 74
233 49 249 t2
89 53. 69 66
336 5A 286 - 74
4,636 52 3,725 72
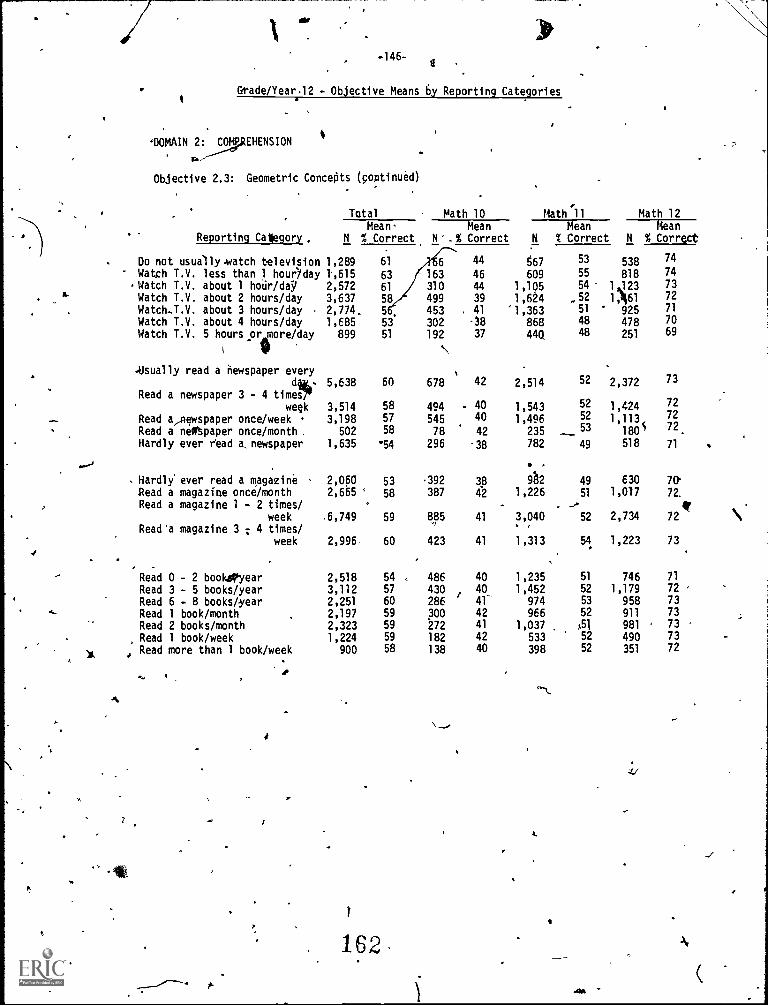
-146-g
Grade/Year12 - Objective Means 6y Reporting Categories
'DOMAIN 2:.50g.REHENSION
Objective 2.3: Geometric Concepts (continued)
Total Math 10 Math'll Math 12Mean Mean Mean Mean
Reporting Category N % Correct N.% Correct N % Correct N % Correct
Do not usually match television 1,289 61
Watch T.V. less than 1 hour/day 1,615 63. Watch T.V. about 1 hour/daY 2,572 61
Watch T.V. about 2 hours/day 3,637 58Watch.T.V. about 3 hours/day 2,774. 5,Watch T.V. about 4 hours/day 1,685 53Watch T.V. 5 hoursoramore/day 899 51
i IP
-Usually read a newspaper every5,638 60
Read a newspaper 3 - 4 timcie!
week 3,514 58
Read a_ newspaper once/week 3,198 57
Read a newspaper once/month . 502 58
Hardly ever read anewspaper 1,635 54
Hardly' ever read a magazine 2,060 53Read a magazine once/month 2,665 ' 58
Read a magazine 1 - 2 times/ °
week .6,749 59
Read 'a magazine 3 ; 4 times/
week 2,996 60
Read 0 - 2 bookOyear 2,518 54 .,
Read 3 - 5 books/year 3,112 57
Read 6 - 8 books/year 2,251 60
Read 1 book/month 2,197 59
Read 2 books/month 2,323 59
Read 1 book/week 1,224 59
Read more than 1 book/week 900 58
162
.6
163310499
453302192
\
44
4644
39
41
-38
37
567
609
1,1051,6241,363
86844Q
53
55
54
,5251
48
48
538818
1.1231,11461
925
478251
74
74
7372
71
7069
678 42 2,514 52 2,372 73
494 40 1,543 52 1,424 72
545 40 1,496 52 1,113 72
78 42 235 53 180S 72.
296 -38 782 49 518 71
392 38 g2 49 630 70387 42 1,226 51 1,017 72.
-,' it885 41 3,040 52 2,734 72
r
423 41 1,313 54. 1,223 73
486 40 1,235 51 746 71
430 40 1,452 52 1,179 72
286 41- 974 53 958 73
300 42 966 52 911 73
272 41 1,037 . X51 981 , 73
182 42 533 52 490 73
138 40 398 52 351 72
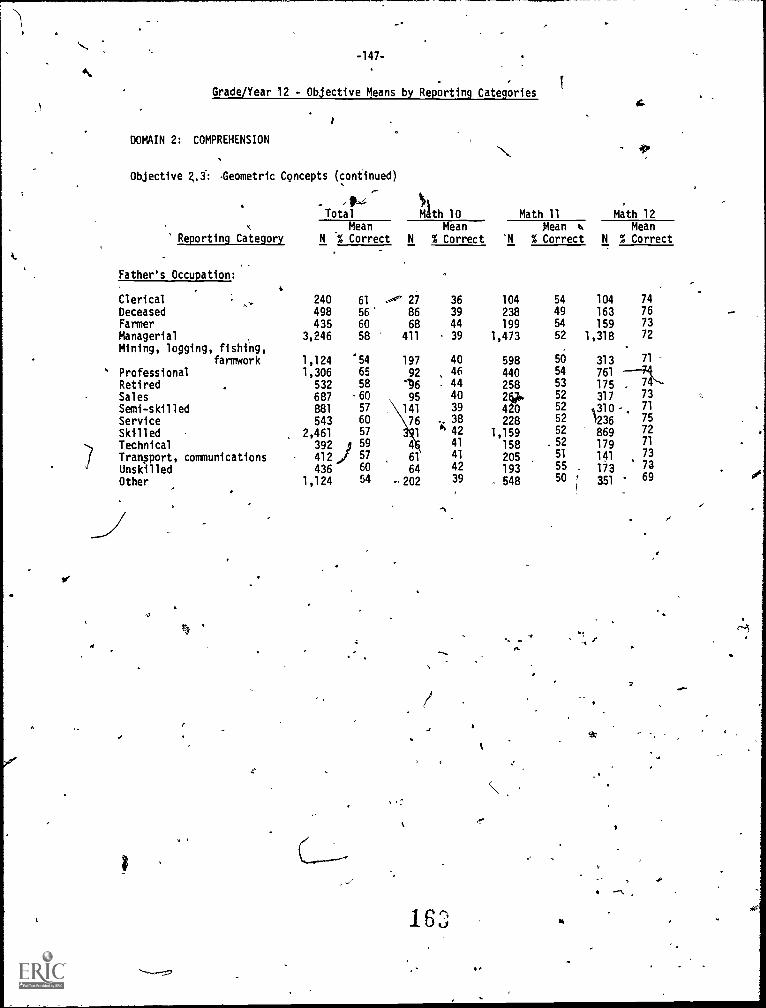
*%.
-147-
Grade/Year 12 - Objective Means by Reporting Categories
DOMAIN 2: COMPREHENSION
Objective -Geometric Cgncepts (continued)
Total/Mdth 10 Math 11 Math 12
Mean Mean Mean t. MeanReporting Category N % Correct N % Correct 'N % Correct N % Correct
Father's Occupation:
Clerical 240 61
Deceased 498 56
Farmer 435 60
Managerial 3,246 58
Mining, logging, fishfilg,farmwork 1,124 '54
` Professional 1,306 65
Retired 532 58
Sales 687 60Semi-skilled 881 57
Service 543 60
Skilled 2,461 57Technical392 ) 59
Transport, communications 412 J 57
Unskilled 436 60
Other 1,124 54
,.;-." 27 36 104 54 104 74
86 39 238 49 163 76
68 44 199 54 159 73411 39 1,473 52 1,318 72
197 40 598 50 313 71
'96 - 44 258 53 175
-492 46 440 54 761
95141
761 -4
4
. 61
64
-202
40 26 0,
39 42038 2284241
1,159158
41 20542 193
39 , 548
1,1
52 317 73
52 310 - 71
52 1235 75
55; 7g 771
51 141 73
55-
173 73
50 , 351 - 69
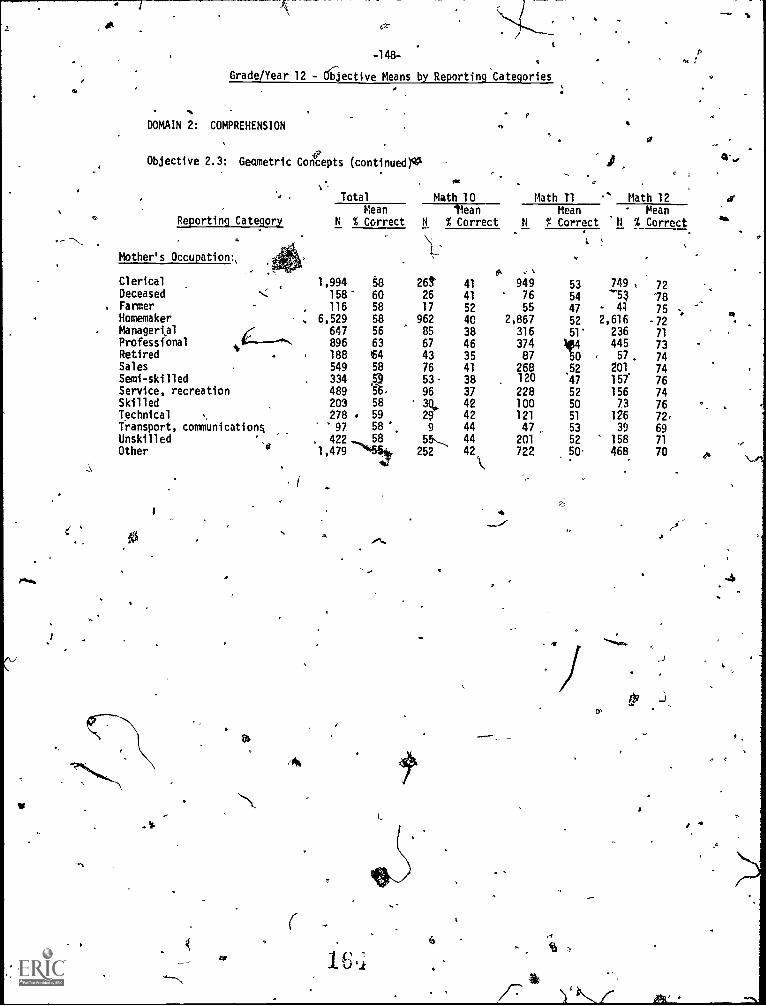
"44
-148-
Grade/Year 12 - 013j ecti ve Means by Reporting Ca tegor i es
DOMAIN 2: COMPREHENSION
Objective 2.3: Geqmetr I c Concepts (continued
Reporting Category
Mother' s Occupation
Clerical
DeceasedFarmer
HomemakerManagerialProfessionalRetiredSal es
Semi- skilled
Service, recreationSkilledTechnicalTransport, communi cati orA
UnskilledOther o
w.
or
Total
MeanN % Correct
1,994 8158 60
, 116 58
.. 6,529 58647 56
896 63188 C4549 58
334 51489 '5'6.
203 58
278 5997. 58 '
. 422 581,479
L
er
0
Math 10 Math 11 Math 12
64
/lean Mean MeanN % Correct N % Correct 'N % Correct
26326
17
962
85
67
43
76
53
96
30,,,
29
9
55,..,
252
41
41
52
4C38
463541
3837
4242444442
.et, .
9497655
2,867316374
87268120
228100121
47201
722
4
53
54
4752
51'
;Irci
52'47
52
50
51
5352
50'
749 %
'53' 41
2,616
23644557 .
201
157
15673
12639
158468
rn
72
/875
-7271
73
74
74767476
72
6971
70
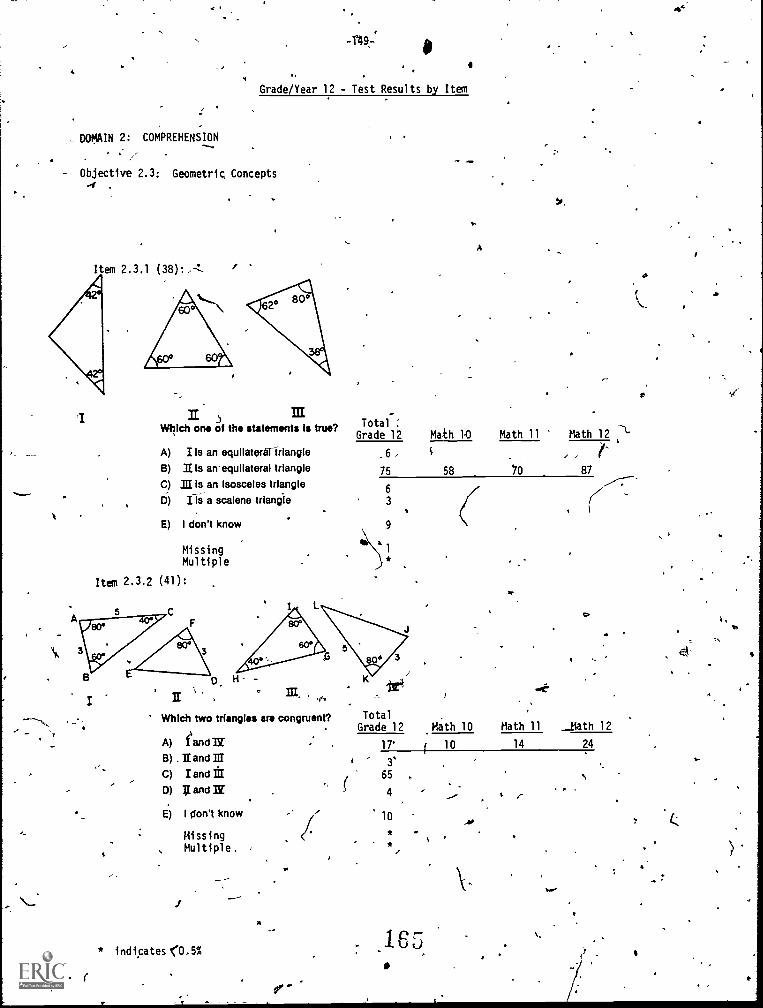
- 1s49;
Grade/Year 12 - Test Results by Item
DOMAIN 2: COMPREHENSION
/'Objective 2.3: Geometric Concepts
Item 2.3.1 (38):
,I IIWhich one of the statements is true?
A) I Is an equllateraTirlangle
B) II is an-equilateral triangle
C) III is an isosceles triangleD) I Is a scalene triangle
E) I don't know
MissingMultiple
Item 2.3.2 (41):
TotalGrade 12
6
75
6
3
9
1
A
Math 1,0
58
I, a .
' Which two triangles are congruent?
A) I and YE
B) nand HIC) land III
D) Iiand8
E) I don't know
HissingMultiple.
,/
* indicates <0.5%
A
Math 11 Math 12 -1-
70 87
TotalGrade 12 Math 10 Math 11 _Bath 12
17' t 10 14 24
3'65 ,
4
AO
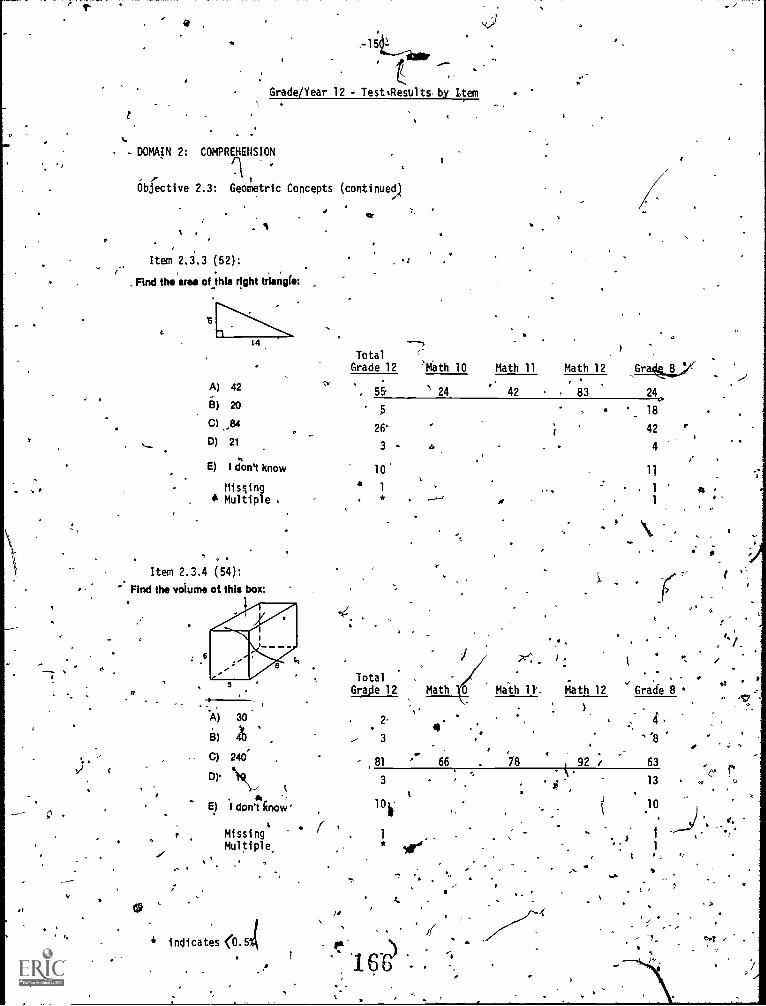
O
a
15Lar
t .,..Grade/Year 12 - TesttResults by Item
DOMAIN 2: COMPREHENSION
Objective 2.3: Geometric Concepts (continued)
Item 2.3.3 (52):
Find thesrea of this right triangle:
14
41*
t
e
=
A) 42
6) 20
C)
D) 21
E) I don't know
Misting4 Multiple
O
TotalGrade 12
`-`Math 10
55 ' 24
5
26
3 -
10'1
*-y,
10c
Item 2.3.4 (54):Find the volume of this box:
6) 1_C) 240
Dp
E) I don't know'
MissingMultiple.
* indicates <0.5%(
I
/
11"
Math 11 Math 12 Grks,..8.,, ..
42 , 83 240,
- 18
i 42 '.
- 4
1)
. 1 is1
, ,
0
TotalGrade 12 Math Math 11'= Math 12 Grade 8
2
3o' .
81 ' 66
3
.
.92 t
1
4'8
63
13
.10
st
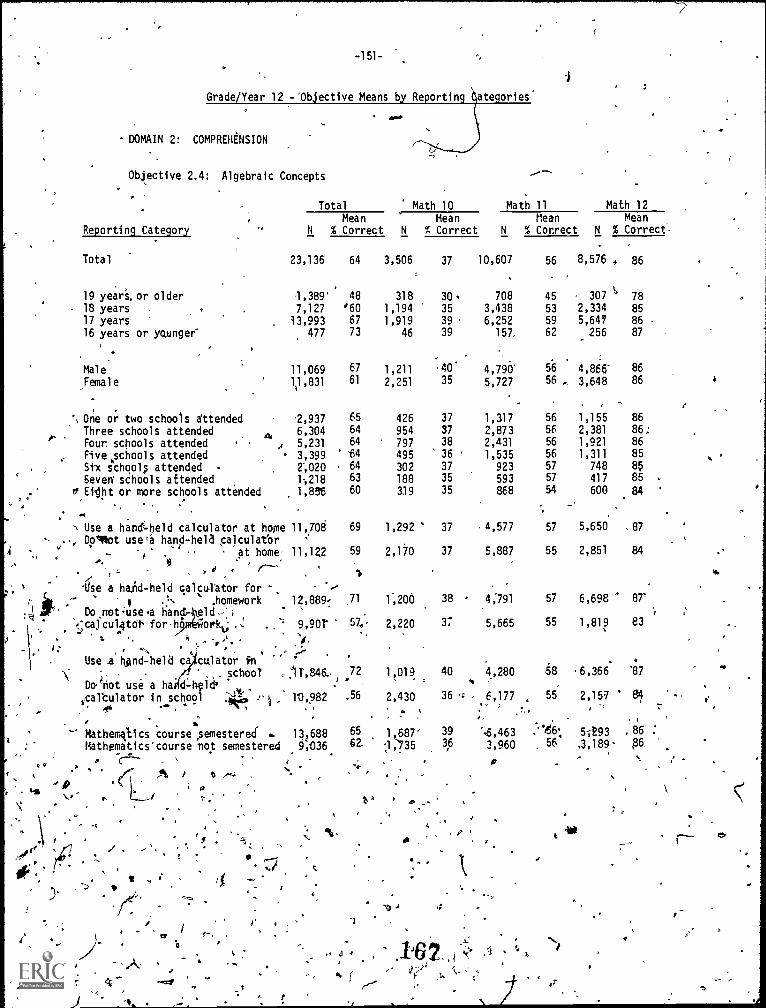
to
-151-
Grade/Year 12 -'Objective Means by Reporting categories'
DOMAIN 2: COMPREHENSION
Objective 2.4: Algebraic Concepts
Reporting Category
Total
19 year's. or older- 18 years
17 years16 years or younger
Total Math 10 Math 11 Math 12Mean Mean Mean Mean
N % Correct N % Correct N % Correct N % Correct-
23,136 64
-1,389' 487,127 '60
13,993 67477 73
. .°
Mal e 11,069 67
Female 1,1,831 61
's One or two schools attended 2,937Three schools attended 4 6,304Four, schools attended 4 5,231Five ,schools attended ' 3,399Stx Sthool attended 2',020Seven' schools attended 19218
ft Ei-ht or more schools attended 1,836, ' . - . .'
.
.. ,' 3 ,
" Use a hand-held calculator at home 11,708-- ,. Dot use a hand-held ralculatbr -'i. at home 11,122. # -
,
656464'64646360
use a hand-held calculator for - -,-;' ,4 Do ,not :use a nand:- d ,,:
,;ca1culatrit, for NS iiork; .,, . '' 9,9or
( 1 1-. homework 12,889-
ti
,
69
59
,71
57:
, 1\ 41 ' : 'Use a nand-held ca culator fn
school 0
Do-riot use a ha. (-41c1*vcaltulator in school ,ik,,z,. .Pit
46 ' , ', t*
Mathenktics course*semestered .Mathematicscourse not semestered
r;'' .
'11',846.
10,982, .
13,6889;036
72
.56
6562.
CC 4
pis r,
J
I%
t4
. .
1,211 40. 4,790 56 4,866-2,251 35 5,727 56 , 3,648
3181,1941,919
46
.
3,506 37 10,607 56 8,576
1,292 37 4,577 57 5,650
2,170 37 5,887 55 2,851
1,200 38 .4;791 57 6,698
2,220 37 5,665 55 1,819
30 708 45 30735 3,438 53 2,33439 . 6,252 59 5,64739 157. 62 256
426 37 1,317 56 1,155954 37 2,873 56 2,381797 38 2,431 56 1,921495 36 ' 1,535 56 1,311302 37 923 57 748188 35 593 57 417319 35 868 54 600
1,019 40 4,280 58 6,366'
2,430 36 '4, t 6,177 55 2,157a
1,687' 39 '.6,463 5-;P93;735 3,6 3,960 56 3,189
I,
st,
1
t
86
78858687
8686
8686;8685
884
.87
84
87'
83
'87
86ps.
CY
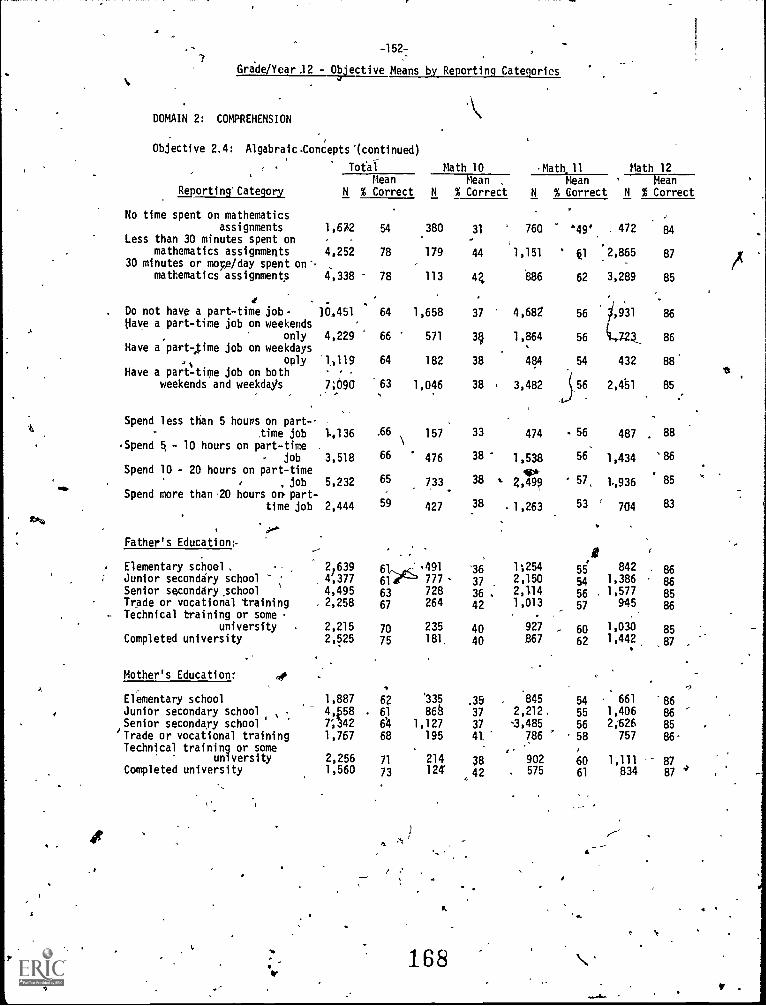
-152-
Grade/Year 12 - Objective Means by Reporting Categories
DOMAIN 2: COMPREHENSION
Objective 2.4: Algabraic.Conceptslcontinued)
Total Math 10 Math.11 Math 12Mean Mean , Mean '---Mian
% Correct N T Correct
'49' .-472 84
8761 2,865
62 3,289 85
-
56 ,931 86
.11$
Reporting' Category N
1,672
4,252
4,338
10.451
4,229
'1,119
-
7;090
,136
3,518
5,232
2,444
24
/,
63;;
4,4952,258
2,2152,525
1,8874,5587',342
1,767
2,2561,560
% Correct N % Correct N
760
1,151
886
4,682
1,864
484
3,482
474
1,538
2,49?
1,263
1;2542,1502,1141,013
927
867
.
845
2,212,
3,485786
902. 575
No time spent on mathematicsassignments
Less than 30 minutes spent onmathematics assignments
30 minutes or mope /day spent on-mathematics assignmentse.
Do not have a part-time job-Have a part-time job on weekends
onlyHave a part-,time job on weekdays
,. only
Have a part-time job on bothweekends and weekdags
Spend less than 5 hours on part-time job
'Spend 5 - 10 hours on part-timejob
Spend 10 - 20 hours on part-timejob
Spend more than ,20 hours on part-time job
Father's Education:.
54
78
78
64
66
64
63
.66
66
65
59
63
67
7075
62
61
611
68
71
73
.380
179
113
1,658
571
182
1,046
157
476
733
427
491777 ,
728264
235181
'335
568
1,127195
214124'
31-
44
42
37
3§
38
38
33
38
38
38
.36
37
36 .
42
4040
.35
37
37
41
38
42
,
-
Elementary school,Junior secondary schoolSenior seconddry .schoolTrade or vocational training ,
Technical training or someuniversity
Completed university
Mother's Education:
Elementary schoolJunior secondary school -
, .
Senior secondary school'Trade or vocational trainingTechnical training or some
universityCompleted university
I
. ti 168
56 86
54 432 BB.
J,56 2,451 85...
56
56
57,
53
0
487
1,434
1936
704
88
' 86
85
83
55 842 8654 1,386 66
56 1,577 85
57 945 86
1,03060 1,9 851,44262 87
5455
56
58
6061
,
661 '861,406 862,'626 85
757 86.
1,111 87
834 87 4
4
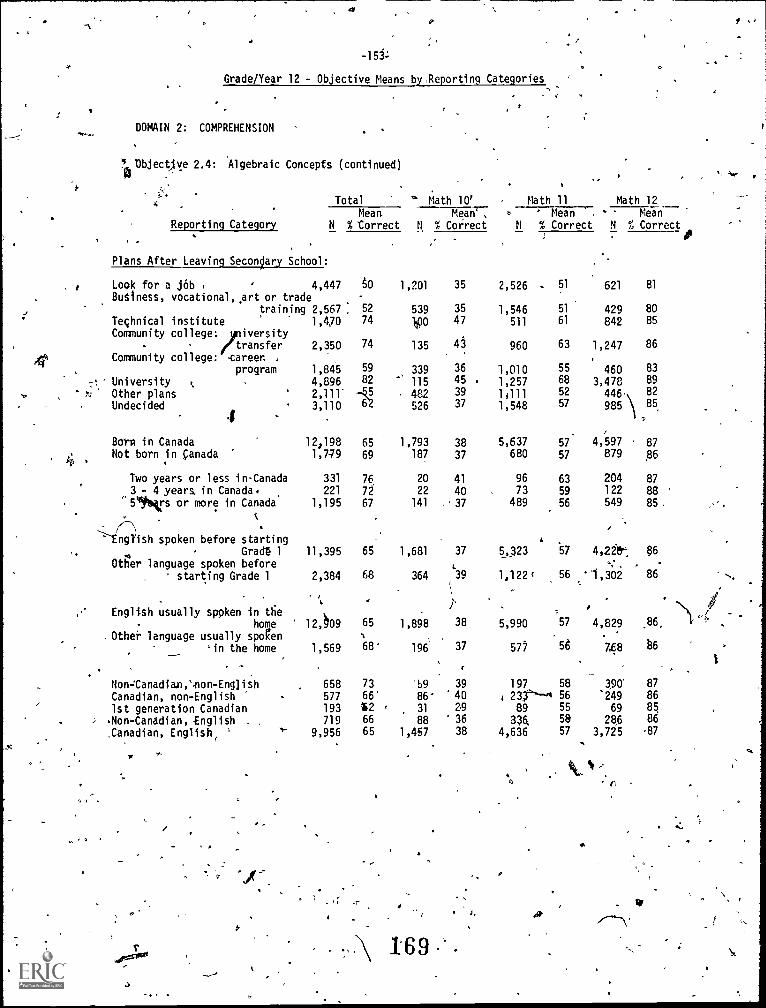
a
-153;
Grade/Year 12 - Objective Means by.Reporting Categories '
DOMAIN 2: COMPREHENSION
4.1bjectiye 2.4: Algebraic Concepts (continued)ja
Total ' Math 10' Math 11 Math 12Mean Meari:
Reporting Category N % Correct N % Correct0 - Mean . Mean
N % Correct N % Correct
I G.
Plans After Leaving Seconlary School:
4.
Look for a job 4,447 tO 1,201 35 2,526 51 621 81
Business, vocational ,,art or tradetraining 2,567 52 539 35 1,546 51 429 80
Technical institute 1,470 74 1 O 47 511 61 842 85
Community college: tiversity
ransfer 2,350 74 135 43 960 63 1,247 86
Community college: -career. ,
program 1,845 59 339 36 1,010 55 460 83
University 4,896 82 115 45 1,257 68 3,478 89
Other plans 2,111' 4 4a2 39 1011 52 446 82
Undecided 3,110 526 37 1,548 57 9851 86,
Barn in Canada 12,198 65 1,793 38 5,637 57 4,597 87
Not born in Canada 1,7-79 69 187 37 680 57 879 86
Two years or less in-Canada 331 76 20 41 96 63 204 87
3 - 4 years. in Canada. 221 72 22 40 73 59 122 88
"5!tteirs or more in Canada 1,195 67 141 .37 489 56 549 85.
-"-lng11)ish spoken before startingGrady 1 11,395
Other language spoken before
65 1,681 37
"38
5023 57 4,226" $6
starting Grade 1 2,384 48 364 1,122c 56 '1,302 86
English usually spoken in theo
home 12,h9 65 1,898 38 5,990 57 4,829 .86,
Other language usually spokenIn the home 1,569 68' 196 37 577 58 748 136
Non-:Canadian,%non-English 658 73 '1,,9 39 197 58 390. 87
Canadian, non-English 577 66 86- 40 233''-.4 56 '249 86
1st generation Canadian 193 %2 31 2.9 89 55 69 85
Non-Canadian, English 719 66 88 36 335, 58 286 86
,Canadian, English, 9,956 65 1,457 38 4,636 57 3,725 87
169:-
4
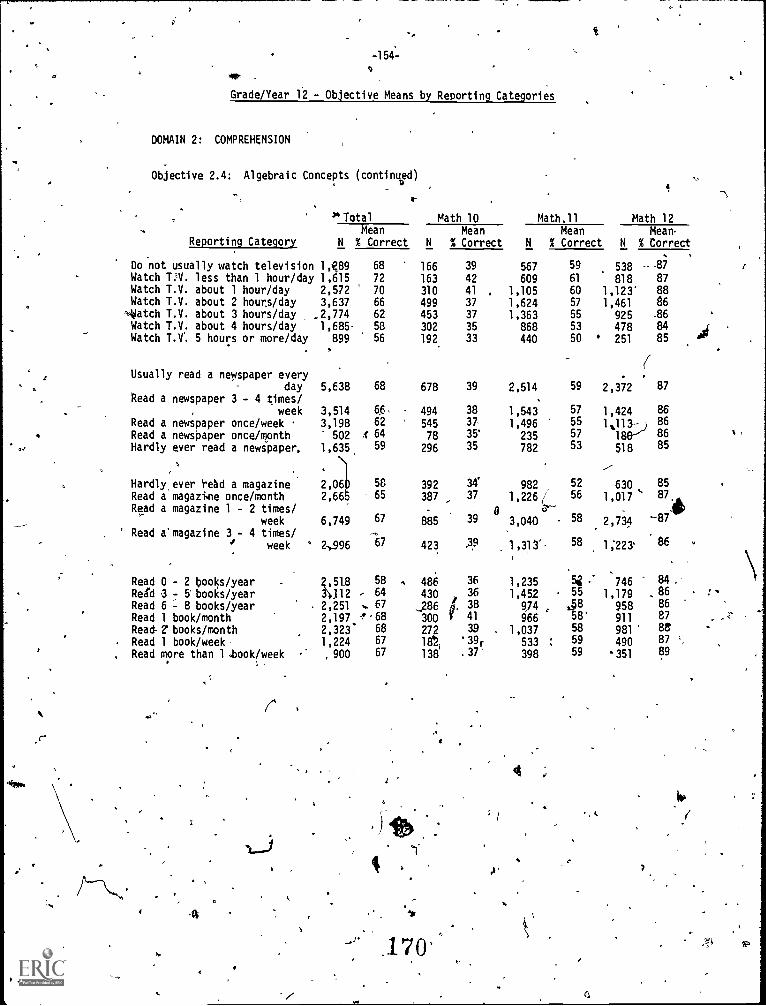
a
-154-
Grade/Year 12 - Objective Means by Reporting Categories
DOMAIN 2: COMPREHENSION
Objective 2.4: Algebraic Concepts (continued)
'4Total Math 10 Math.11 Math 12Mean Mean
Reporting Category N % Correct N % CorrectMean
N % CorrectMean,
N % Correct
Do not usually watch television 1,09 68 166 39 567 59 538 --.93
Watch T.V. less than 1 hour/day 1,615 72 163 42 609 61 818 87Watch T.V. about 1 hour/day 2,572 70 310 41 . 1,105 60 1,123' 88Watch T.V. about 2 hours/day 3,637 66 499 37 1,624 57 1,461 86Watch T.V. about 3 hours/day _2,774 62 453 37 1,363 55 925 -86
Watch T.V. about 4 hours/day 1,685 58 302 35 868 53 478 84Watch T.V. 5 hours or more/day 899 56 192 33 440 50 251 85
(Usually read a newspaper every 0 /
day 5,638 68 678 39 2,514 59 2,372 87
'Read a newspaper 3 - 4 times/ .
, week 3,514 6.6, 494 38 1,543 57 1,424 86
Read a newspaper once/week - 3,198 62 545 37 1,496 55 1,113-J 86Read a newspaper once/nlonth 502 4' 64 78 35' 235 57 180-- 86
Hardly ever read a newspaper, 1,635 59 296 35 782 53 518 85
,-
Hardly, ever ?lad a magazine 2,06 SC 392 34' 982 52 630 85Read a magazine once/monthRead a magazine 1- 2 times/
2,66,
week' Read a'magazine 3,- 4 times/
6,749
65
67
-67
387. 37
-
885 390
1,226( 56Zr-
3,040 58
1,017 ' 87,,_
fl-,4IP
2,734 '''''
week . 2,996 423 .39 1,313. 58 1;223' 86
Read 0 - 2 books /year 2,518 58 , 486 36 1,235 5 - 746 84
Rek1 3 - 5' books/year 112 - 64 430 36 1,452 55 1,179 .86 :Read 6 - 8 books/year 2,251 %,, 67 A: 38
9,74 *.,§8 958 86
Read 1 book/month 2,197 `,-68
_gm300 V 41
,
966 58 911 87
Read- 2' books/month 2,323. 68 272 39 1,037 58 981 88
Read 1 book/week 1,224 67 182, '39r 533 : 59 490 87
Read more than 1 .book/week, 900 67 138 .37' 398 59 351 89
4
170ti
4
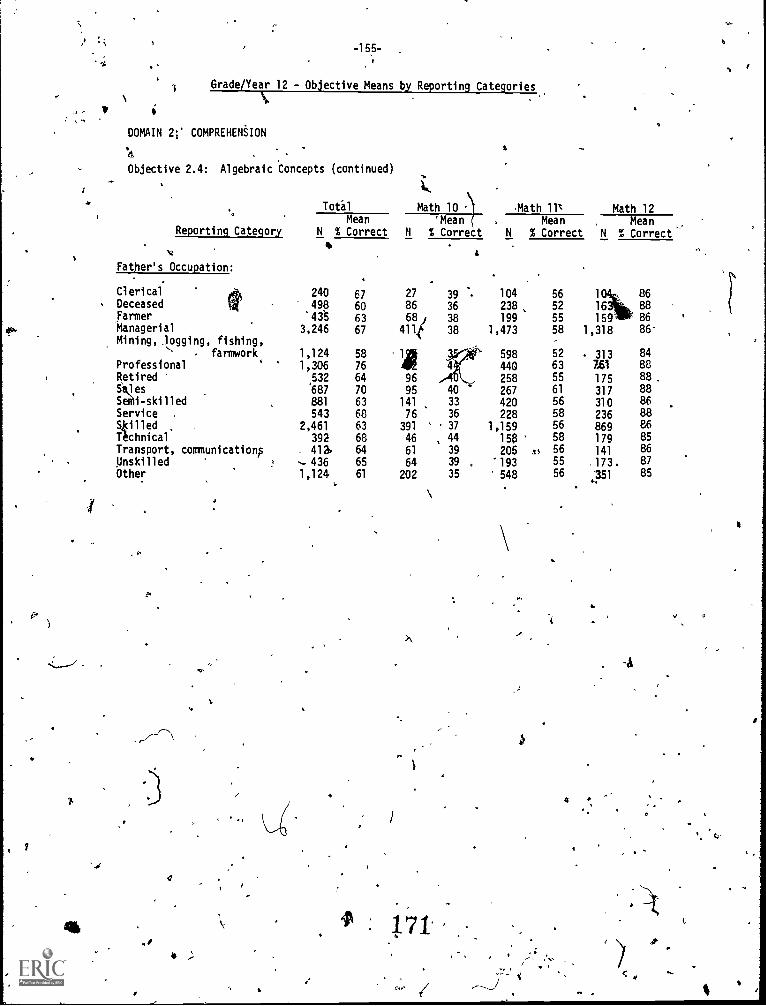
I
-155-
Grade/Year 12 - Objective Means by Reporting Categories
DOMAIN 2;' COMPREHENSION
tObjective 2,4: Algebraic Concepts (continued)
Total Math 10Mean 'Mean
Reporting Category N % Correct N % Correct
Father's Occupation:
240
49843
3,246
1,1241,306
532
687881
5432,461
392412.
4361,124
67
6063
67
58
76
64
70
63
6863
68
64
65
61
Clerical
DeceasedFarmerManagerial
Mining, logging, fishing,. farmwork
Professional,
RetiredSlesS i-skilledService .
SkilledTechnicalTransport, communicationsUnskilled
.
Other
27 39 %86 36
681 38411t 38
95141
76
391
46
61
64
202
).
.171
40
33
36
37
44
39
39
35
Math 111 Math 12
N
104
238
1991,473
598
440
258
267
420
2281,159
158
205
193
548
Mean% Correct
MeanN % Correct
1,
56
52
55
58
52
6355
61
56
585658
5655
56
1
16
1591,318
313
7.61
175317310
236
869179
141
.173.
.351
8688
86
86
8488888886
888685
86
87
85
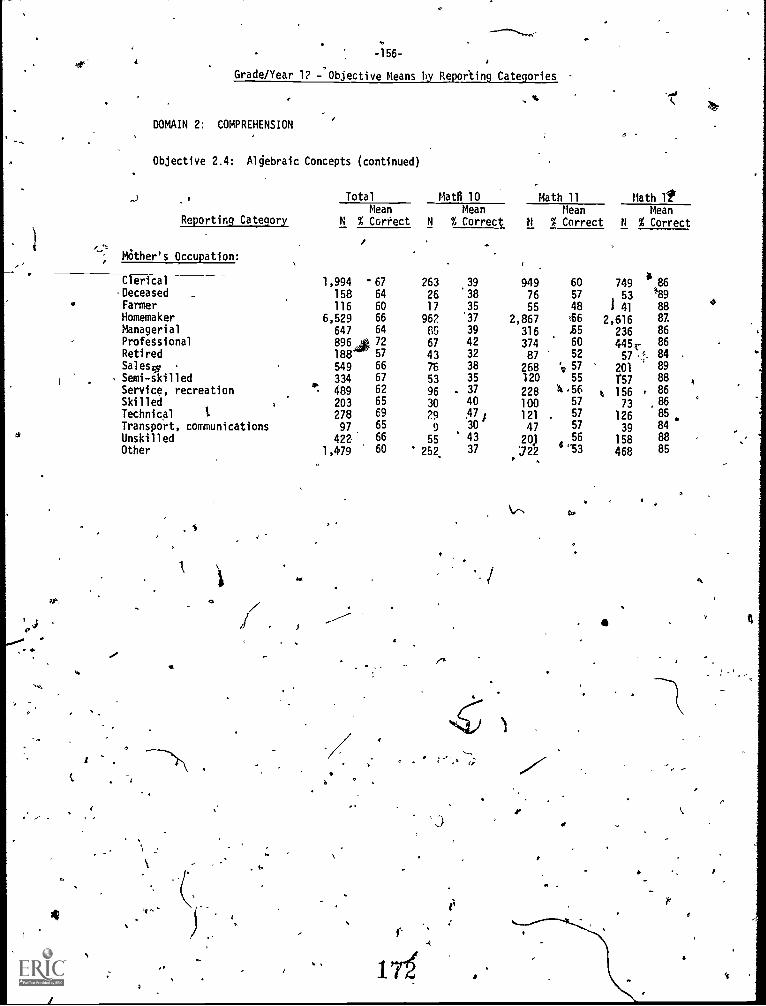
I
-156 -
Grade /Year 12 ;Objective Means by Reporting Categories
DOMAIN 2: COMPREHENSION
Objective 2.4: Algebraic Concepts (continued)
Reporting Category
Total Matti 10 Math 11 Math IMean
N % Correct N
263
26
17
96285
67
43
76
53
96
30
299
55
252.
Mean% Correct N
9497655
2,867316
37487
268120
228100121
47
201
;722.
Mean Mean% Correct N % Correct
Mother's Occupation:
1,994 -67158 64
116 60
6,529 66
647 64
8964 72188' 57549 66
334 67
.-.. 489 62
203 65
278 69
97 65
422 66
1,479 60
39
38
35
'37
39
4232
38
35
3740
47 /30
43
37
6057
48
t66
.65
6052
'9 5755
4,5657
5757
564 13
749
, 531 41
2,61623644557
1
2011.57
t 15673
126
39158
468
86
't9
88
878686
84
8988
86
. 86
8584°488
85
i
Clerical
-DeceasedFarmerHomemakerManagerialProfessionalRetiredSal es,,
Semi-skilledService, recreationSkilledTechnical
Transport, communicationsUnskilledOther
1.
°,1
a
' .
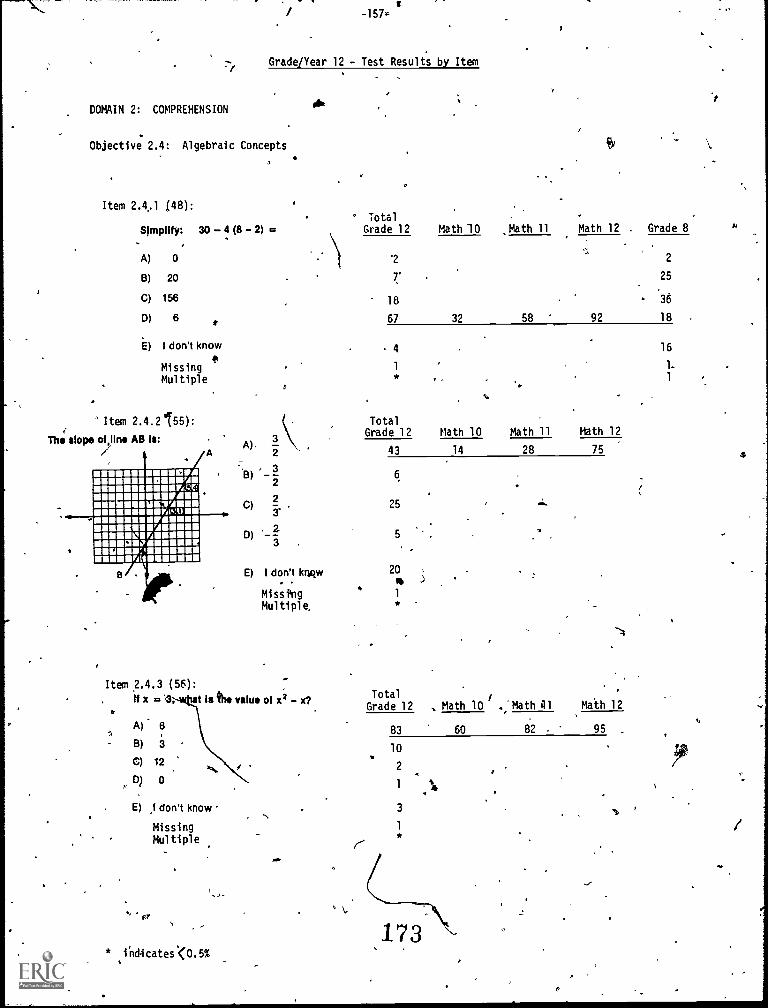
-157
Grade/Year 12 - Test Results by Item
DOMAIN 2: COMPREHENSION
Objective 2.4: Algebraic Concepts CitY
Item 2.4..1 (48):° Total
SImplIty: 30 - 4 (8 - 2) = Grade 12 Math 10 ,Math 11 Math 12 . Grade 8
--,A) 0 '2 2
B) 20 Z. 25
C) 156 18 .36
D) 6 67 32 58 92 18
E) I don't know 4 16411
Missing 1 1.
Multiple * 1''
Item 2.4.2155):The slope Wolin. AB 111: 3
A)A 2
3B)
C)2
D)
EMMENEMMEN 11111M111PUMIME 1111111M11111MMUS MIOrakl) NMMEM NUMMI1110. /421711111111.111111.11111111111111M11111011111111
Item 2.4.3 (56):
E) I don't kn,qw
MissingMultiple.
TotalGrade 12 Math 10 Math 11 Math 12
43 14 28 75
25
5
20
1
*
M x t Is tut value of x2 - x?GradeTotal
12
A)
B) 3
C) 12
D) 0
E) .1 don't know
MissingMultiple
* ind4cates*<0.5%
Math 10 Math 41 Math 12
83 60 82 95
10
2
1
3
1
*
173
(
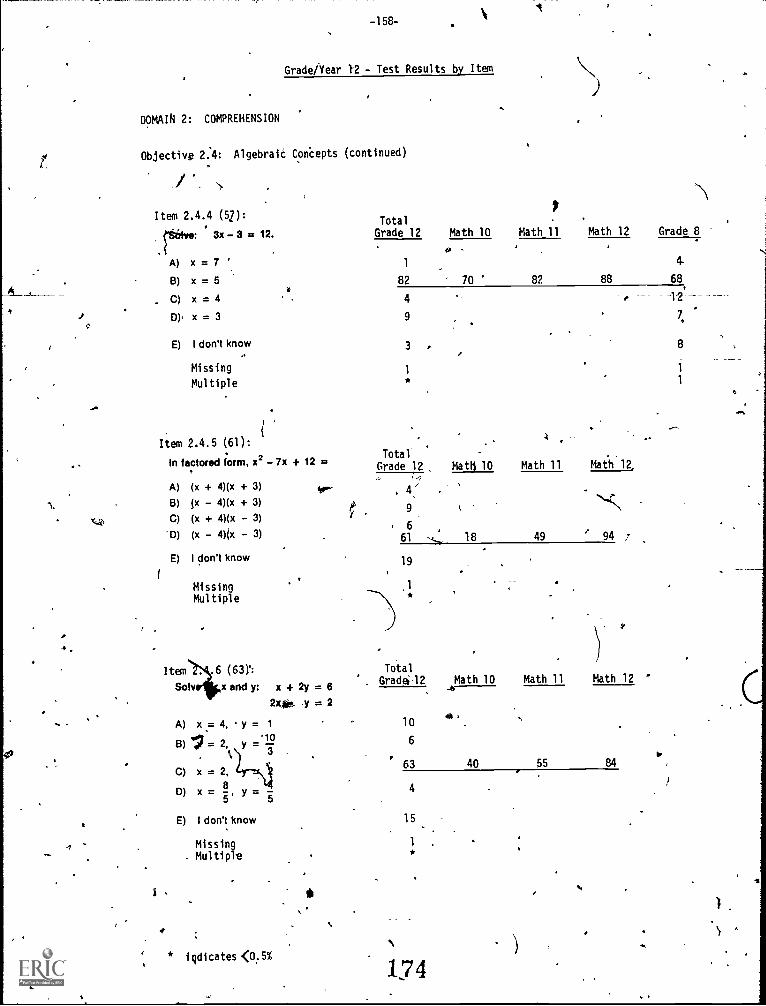
-158-
Grade/Year l2 - Test Results by Item
DOMAIN 2: COMPREHENSION
Objectiv* 2.4: Algebrak ConCepts (continued)
rItem 2.4.4 (5Z):
Total
: 3x - 3 = 12. Grade 12 Math 10
0 -
A) x = 7 1 4-
B) x = 5 82 70 82 88 68,
C) x = 4 4
x= 3 9 7,
E) I don't know 3 . 8
Math 11 Math 12 Grade 8
Missing 1
Multiple
Jib
Item 2.4.5 (61):In factored form, x2 - 7x + 12 =
A) (x + 4)(x + 3) Sr-13) fx - 4)(x + 3)
'cLZ C) (x + 4)(x - 3)'D) (x - 4)(x - 3)
E) I don't know
Missing ,1
Multiple
TotalGrade 12 MatO 10 Math 11
4:
1
9
661 18 49 94 7
19
4.Item . .6 (63)':Solt' x and y: x + 2y = 8
2x4kia. y = 2
A) x = 4, y = 1
8) 1 = 2, y 1C) x = 2,
8D) x= y= 5
E) I don't know
Missing- Multiple
* Wicates 1;075%
Total
. Grad6-12 Math 10 Math 11 Math 12
10
6
63 40 55 84
4
15
1
*
174
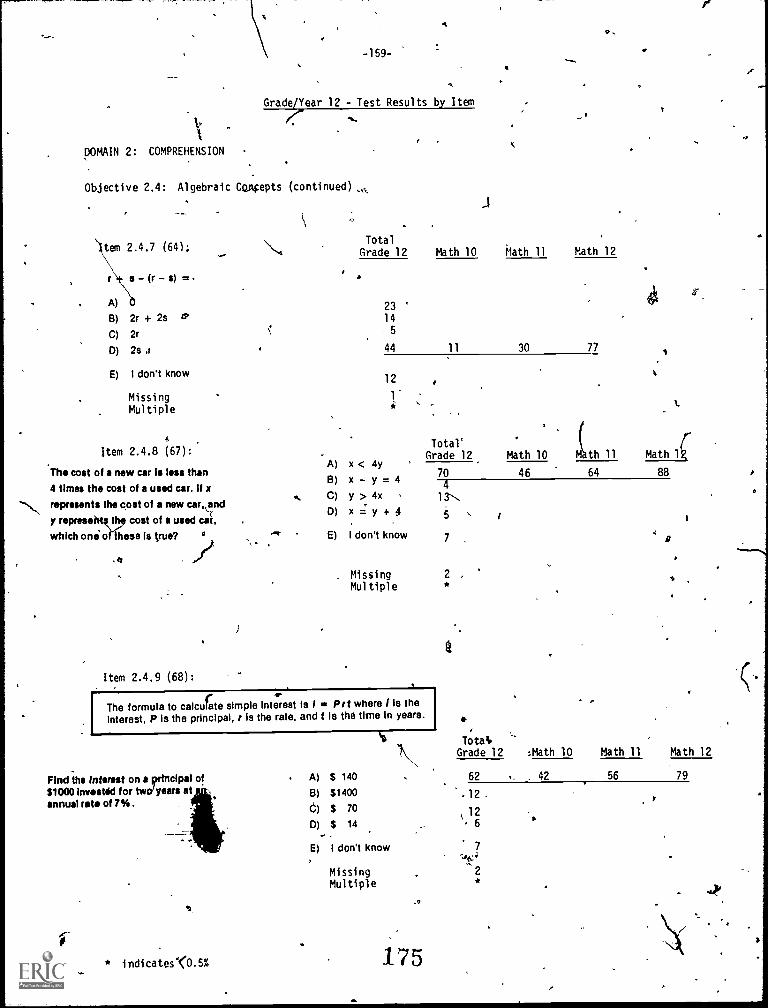
-159-
Grade/Year 12 - Test Results by Item
DOMAIN 2: COMPREHENSION
Objective 2.4: Algebraic CoAcepts (continued) ,.
\letn 2.4.7 (641;
-(r -s) = .
A)
B) 2r + 2sC) 2r
D) 2s
E) I don't know
MissingMultiple
s.
Item 2.4.8 (67):
The cost of a new car Is less than
4 times the cost of a used car. If x
represents the cost of a new car, and
y represe th cost of a used car,
which one o these Is true? °
.11.47
Item 2.4.9 (68):
TotalGrade 12 Math 10 Math 11 Math 12
2314
5
44 11 30 77
12
A) x < 4yB) x - y = 4C) y > 4xD) x = y + 4
E) I don't know
Total'Grade 12
70413.
5
7 ,
Missing 2Multiple
The formula to calculate simple Interest Is 1 II POwhere I Is theInterest, Pis the principal, r Is the rate. and t Is the time In years.
Find the Interest on a principal of$1000 Invistid for twoiyears atannual rate of 7%.
I* indicates'<0.5%
A) $ 140B) $1400
$ 70
D) $ 14
E) I don't know
MissingMultiple
175
tit
Math 10 M th 11 Math lt7,
46 64 88
41.
Tota4
9
1'
Grade 12 :Math 10 Math 11 Math 12
62 42 56 79
-12
,126
7
2*
7
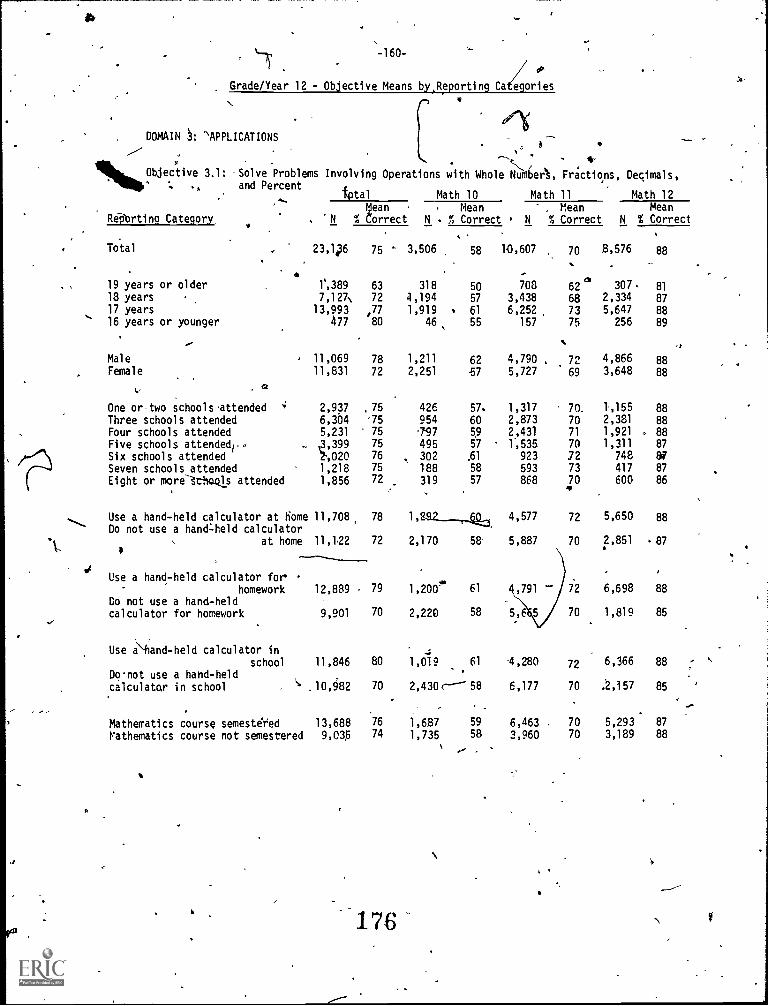
%-T-160-
Grade/Year 12 - Objective Means by,Reporting Ca eg/ories
DOMAIN 3: '`APPLICATIONS
4.
1N%Objective 3.1: -Solve Problems Involving Operations with Whole NuAer'§, Fractions, Decimals,
and Percent'otal Math 10 Math 11 Math 12
.---Mean Mean , Mean Mean
Re 'orting Category "N % Correct N % Correct N % Correct N % Correct.
Total 23,1,p6
4
19 years or older 1,38918 years 7,127%
17 years 13,993s' 16 years or younger 477
...
Male 11,069
Female 11,831
, 41L,
One or two schools 'attended 4 2,937
Three schools attended 6,304Four schools attended 5,231
Five schools attended,. 0 ,3,399
Six schools attended 2., 020
Seven schools attended 1,218
Eight or moreltilocls attended 1,856
Use a hand-held calculator at home 11,708Do not use a hand =held calculator
at home 11,122
Use a hand-held calculator forhomework 12,889
Do hand-heldnot use acalculator for homework 9,901
Use `hand-held calculator inschool 11,846
Donot use a hand-heldcalculator in school `" 10,482
Mathematics course semesteeed 13,688
Mathematics course not semestered 9,036
. -
75 3,506 58 10,607 70 8,576 88, -
..
63 318 50 708 62 4. 307 81
72 4,194 57 3,438 68 2,334 87,77 1,919 61 6,252 73 5,647 8880 46 55 157 75 256 89
%
78 1,211 62 4,790 , 72 4,866 8872 2,251 -57 5,727 69 3,648 88
75 426 57. 1,317 70. 1,155 88'75 954 60 2,873 70 2,381 8875 797 59 2,431 71 1,921 . 8875 495 57 ,535 70 1,311 87
76 302 Al 923 72 748 8W
75 188 58 593 73 417 87
72 319 57 868 70 600 86
78 1, 4,577 72 5,650 88
72 2,170 58- 5,887 70 2,851 87
79 1,2009* 61 4,791 - 72 6,698 88
70 2,220 58 5,6 70 1,819 85
80 1,019 61 ,280 72 6,366 88
70 2,430(---- 58 6,177 70 .2,157 85
76 1,687 59 6,463 70 5,293 87
74 1,735 58 3,960 70 3,189 88
176 V
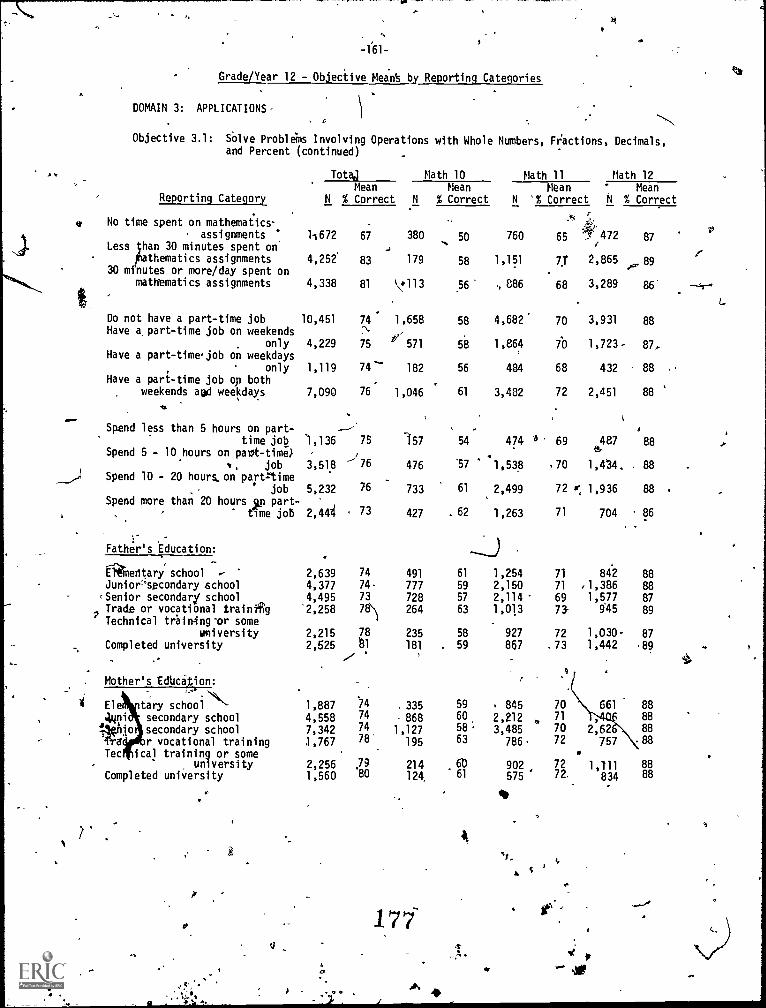
at
-161-
Grade/Year 12 - Objective Means by Reporting Categories
DOMAIN 3: APPLICATIONS-.
Objective 3.1: SOlve ProbleMs Involving Operations with Whole Numbers, Fr'actions, Decimals,and Percent (continued) .
Totaa Math 10 Math 11 Math 12Mean Mean Mean " Mean
Reporting Category N % Correct N % Correct N '% Correct N % Correct
4, No time spent on mathematics-assignments 7 11672
Less an 30 minutes spent onMathematics assignments 4,252
30 minutes or more/day spent onmathematics assignments 4,338
Do not have a part-time job 10,451Have a,part-time job on weekends
only 4,229Have a part-timejob on weekdays
only 1,119Have a part-time job op both
weekends agd weekdays 7,090
Av.
Spend less than 5 hours on part-time job 1,136
Spend 5 - 10 hours on pa 0t -time}a, job 3,518
Spend 10 - 20 hours, on part time
job 5,232Spend more than 20 hours n part-
time job 2,441
1- -
Father's Education:
Eigiedtary schoolJunior,*secondary school
Senior secondary schoolTrade or vocational trainiigTechnical train4nvor some
wiversityCompleted university
Mother's Edlicition:
2,6394,3774,495'2,258
2,215
2,525
tary school \ss. 1,887secondary school 4,558
lo secondary school 7,342ra r vocational training 1,767Tec cal training or some
university 2,256Completed university 1,560
1'.
qo
67 380 50 760 65 472 87
83 179 58 1,151 TT 2,865 89
81 113 56 , 886 68 3,289 86'
74:\
1,658 58 4,682' 70 3,931 88
75 571 58 1,864 70 1,723 87,
74 182 56 484 68 432 88 ..
76 1,046 61 3,482 72 2,451 88
5
A
75 157 54 474 0 69 487 88
- 76 476 '57 1,538 .70 1,414. . 88
76 733 61 2,499 72 sr, 1,936 88
73 427 62 1,263 71 704 86
74 491 61 1,254 71 842 8874, 777 59 2,150 71 /1,386 88
73 728 57 2,114 69 1,577 87
7e 264 63 1,013 7 05 89
78 235 58 927 72 1,030° 8781 181 59 867 .73 1,442 89
.'
74 . 335 59 , 845 70 661 8874 868 60 2,212 71 $
8874 1,127 58. 3,485 70 2,62. 8878
.
195 63 786 . 72 757 . 88
79 214 60 902 77i. 1,711 88'80 124, 61 834 88
177-
A
to
""
a
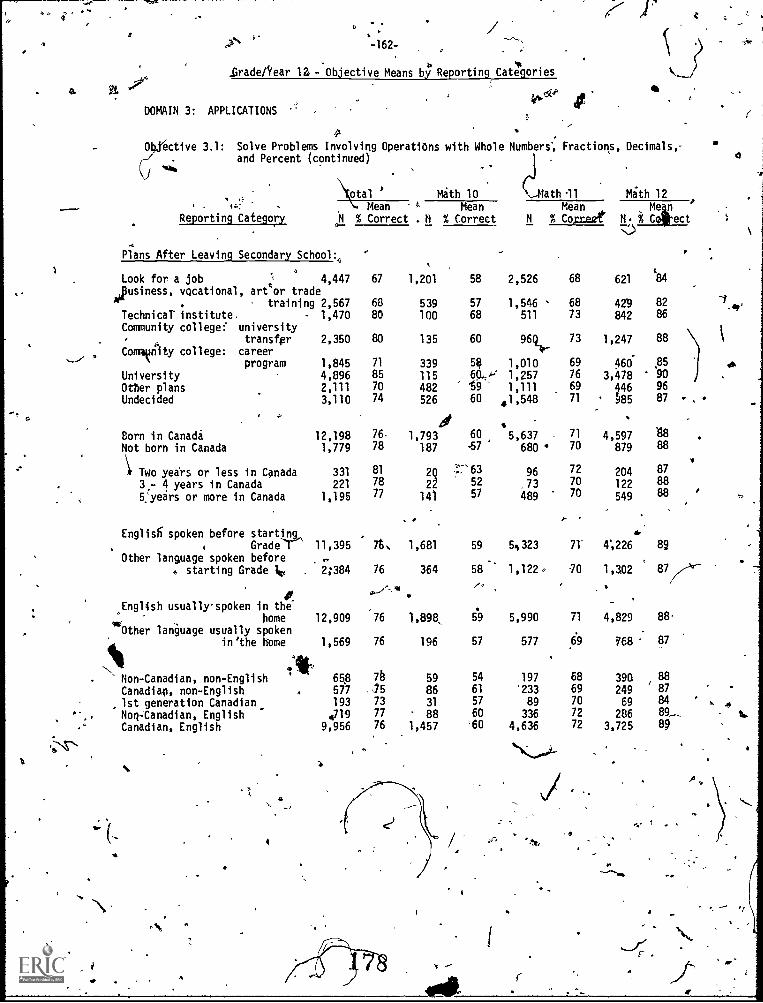
-162-
JGradernear is - Objective Means by Reporting Categories
4
DOMAIN 3: APPLICATIONSk-t< tit
P..
.
04jective 3.1: Solve Problems Involving Operations with Whole Numbers; Fractions, Decimals,-and Percent (continued)
0.
Total ' Math 10 Math 11 Mith 12A
. 4.;.' . Mean Mean Mean MeReporting Category N % Correct . M % Correct N % Cpr.r.ezr N. % C ect
7Z)
Plans After Leaving Secondary School:,
Look for a job :, 4,447Iopusiness, vocational, art trade
. , training 2,567Technical institute, 1,470Community collegef university
transfer 2,350Commknity college: career
program 1,845
University 4,896Otter plans 2,111
Undecided 3,110
Born in Canada
I ,P
12,198Not born in Canada 1,779
TWo years or less in Canada3,- 4 years in Canada5years or more in Canada
331
221
1,195
Englis6 spoken before starting
, ( Grade'r-\ 11,395Other language spoken before
starting Grade lir 2;384
.English usually spoken in thehome
Other language usually spokenin'the home
SNon-Canadian, non-EnglishCanadian, non-English1st generation Canadian.Non-Canadian, EnglishCanadian, English
's
12,909
1,569
658577193
4719
9,956
'
i.76- 1,793 60 5,637 71 4,597
78 187 '57 680 70 879
67 1,201 58 2,526 68 621 '84
68 539 57 1,546 68 429 82
80 100 68 511 73 842 86
80 135 60 96( 73 1,247 88
71 339 54 1,010 69 460 8585 115 60,,-k' 1,257 76 3,478 ° 90
70 482 19 1,111 69 446 96
74 526 60 41,548 71 §85 87
81 20 ;:'8378 22 5277 141 57
..
7B. 1,681 59 54323 71 4226 89
76 364 58 1,122, 70 1,302 87
_
76 1,898, 59 5,990 71 4,829 88
76 196 57 577 69 768 : 87
7/3 59 54 197 68 39(1 88
'75 86 61 '233 69 249 87
73 31 57 89 70 69 84
77 88 60 336 72 ,286 89
76 1,457 '160 4,636 72 3,725 Eir
96,73489
72
7070
204
122
549
88
878888
I
e
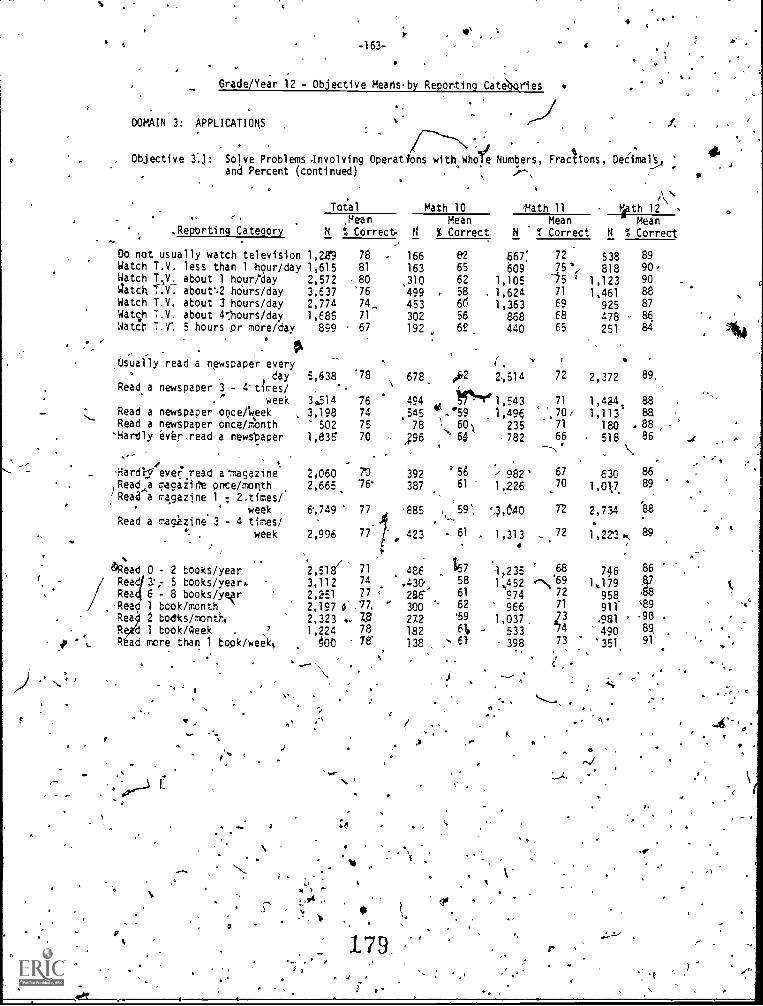
-163-
Grade/Year 12 - Objective Mearisby Reporting Cate4qtles
DOMAIN 3: APPLICATIONS
4
Objective 3.1: Solve Problems .Involving OperatIons with Whole Numbers, Fracttons, Dectimal_iSand Percent (continued)
Total Math 10 'Math 11 Myth 12,Mean Mean Mean Mean
,Reporting Category N A Correct. N % Correct N 1' Correct N % Correct
Do not usually watch television 1,28'9 78 166 82 567; 72 538 89Watch T.V. less than 1 -hour/day 1,615 81 163 65 *609 _75', 818 90'Watch T..V., about 1 houri'day 2,572 80 ,310 62 1,105 75 ' 1,123 90latch T.V. about-.2 hOurs/day 3,637 '76 499 58 . 1,624 71 1,461 88'Watch T.V. about 3 hours/day 2,774 74,.. 453 6d 1,363 69 925 87Watch T.V. about 4'.'hours/day 1,685 71 302 56 868 68 478 86...latch T. V'. 5 hours or more/day 899 67 192 62 440 E5 251 84
Osual ly read a newsPaper everyday 5,638 .78 678, fr2 21514 72 2,372 89,
Read a newspaper 3 - 4' times/ .
week 3.514 76 494 .., tirSge 1,543 71 1,424. 88Read a newspaper ooce/iteek 3,198 74 .545 '.'59 1,494 ., 70 1,113 8.a'...Read a newspaper once/month 502 75 78 \,, 601 235 71 180 , 88Hardly evbr.read a newspaper 1,635 70 ,?96 ." 64 -782 66 518 86 .i...
. .
_ ,Hardiliever" 'r ead a 'magazine 2,060 70 392 5b -' 982 67 630 86
.
ma ine 1 : 2.times/Read a cazRead
-c-a magaiirre pre /month 2,665 '76° 387 61 1,226 70 1,017 89
/
week 6',749 77 885 , 59'. `,3,640 72 2,734 '138
Read a magazine 3 - 4 times/week 2,996 77 423 - 61 . 1,31 3 - 72 1,221 i.,. 89.
4
'Read 0 - 2 books/year 2,518/ 71 485. 457
Read 3:,- 5 books/year. 3,112 74 .430' 586 - 8 books /yMr 2,251 77 , 286' 61
Read 1 took/month ' 2,197 0' :77 '' 300 ' 62Rea 2 bodks/month, 2,323 .. 7.5: 272 '59R d 1 bookNeek . ,? 1,224 78 182 61,
R ad more than 1 book /week, X00 75 138 ` 61.. .
.....- ,\
9
.10
179
1,235 681,452 -\69
974 72966 71
1,037 73533 *14
398 73
7461,179
958.911.981490
'351.
e . ,
/ -.
c. ,
r
8
8996
91
A+
10,
0
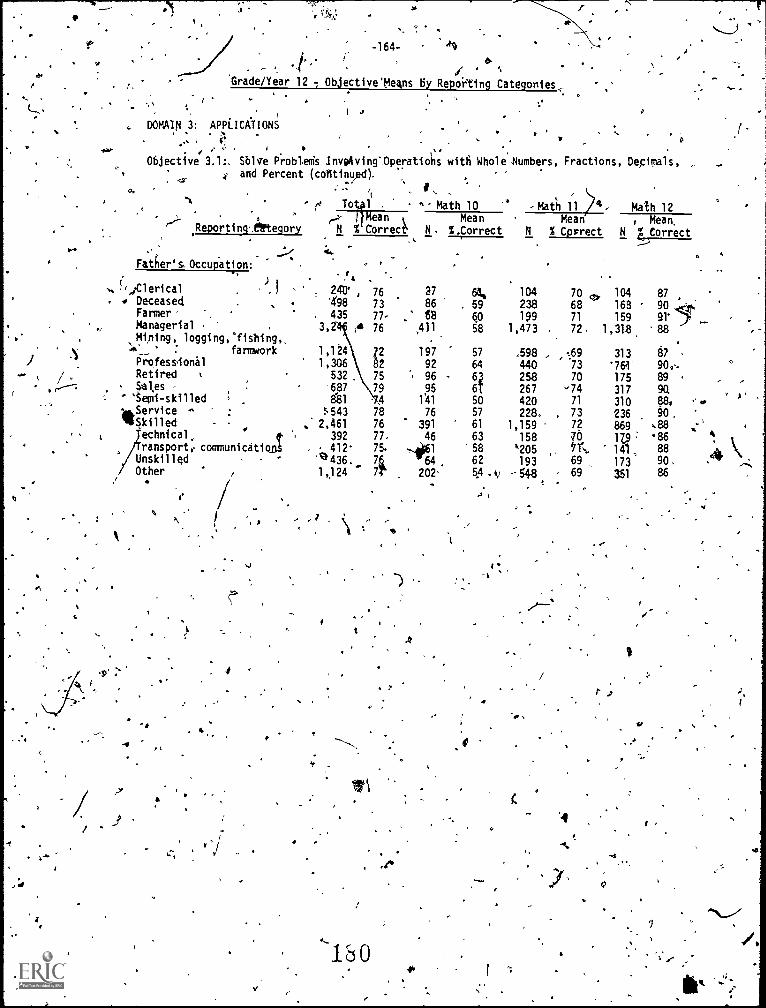
se
r.
-164- `i)
I "o.. '1j'.
Grade /Year 12 .7 ObjectiveMeans by Reporting Categonies,. . ..
I
,.. DOMAIN 3: APPLICATIONS . , . .'.,1 , il _
, r
Objective 3.1;. Salve Problerris Invoiving',Operatioi; with Whole Numbers, Fractions, Depir.nals,i and Percent (cofitinuAd).- -...
'II ' To 1 . - Math 10 -* - Math 11 >1,a Math 12
....
, , ' e ,....-.31-1en k Mean Mean , Mean.P"1- ReportingArtegory N % Correct N. %.Correct N % Correct N
C.w Correct..
, Father' s, Occupation:.,,t4 . )
!,,Clerical 241:r , 76 27 6,1, 104 70 cDeceased . '498 73 86 . 59Farmer . 435 77. 88 60
238 68199 71
. Managerial 3,2 A 76 All 58 1,473 72, 1
o Mining, 1 oggi ng, 'fisbing,,
t
/114' , . farmork 1,124 /2 197 57 .598 -.69Professional 1,306 8Z 92 64 440 73Retired A 532 . 75 96
6i258 70
Sales - 687 79 95 6! 267 '74" 'Semi-skilled 881 4 141 50 420 71
Service - p543 78 76 57 228. , 73*ak,
15killed .. 2,461 76 391 61 1,159 72.ethnical 392 77. 46 63
. 412. 75. .4661 58 *205 ',..
158 70.i
nskilled 64'0436. 7g, 193 69
J
U
ransporte comunicatio
^ I
1,1 24 7 202 6.4 ei -- 548 69-
1
t
10
o
104 87163 90159 9V
, 318 88
313 87
.764' 909..175 89317 90.310 88, ''*,236 90,
869 88
Other-
1Z9 86141 88173 90.
:
351 86
4'
'4
7
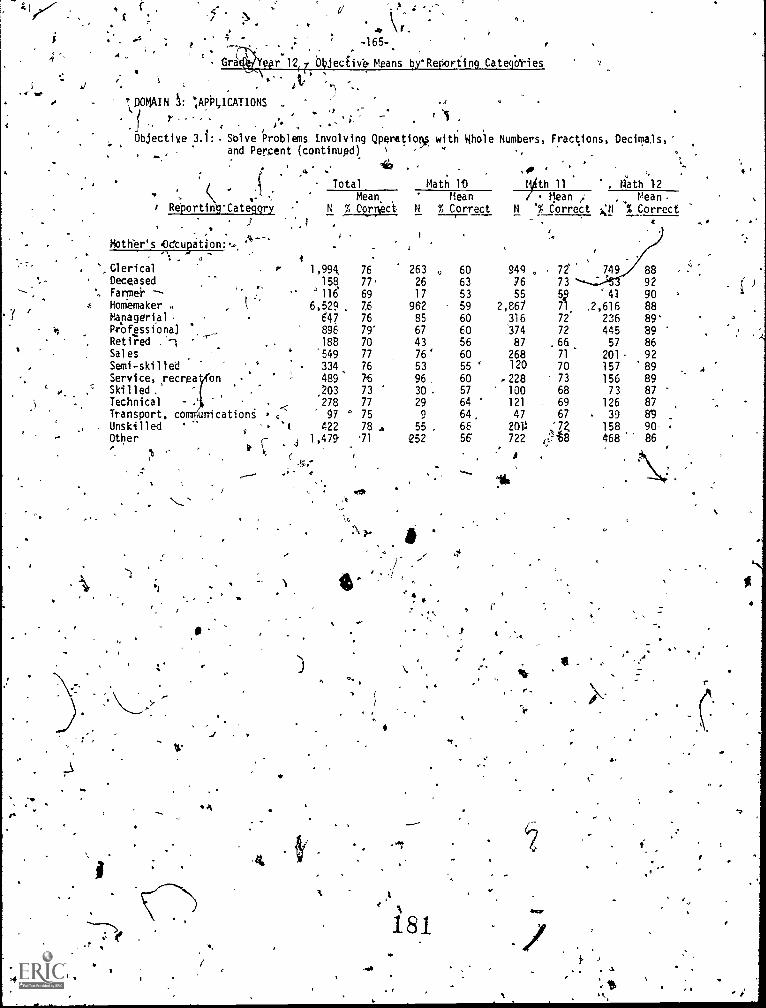
,DOMAIN ,APPLICATIONS
1 '
z,
-165-$ .Gra Ar 124 4,ieciivi Means byReport'ing Categ.dries
$t"
'
. . $$
Objective 3.i: Solve Problems Involvingand Percent (continued)
( -Reportin\g`Categcry
Mother's OctuDation:-
` ClericalDeceasedFanneiHomemakerManagerialRrbfessionai _RetiredSal esSemi - skilledService, ,recrea onSkilled.TechnicalTransport. co .urricationUnskilled -
e
OtherC
.
Qpereti
TotalMean,
N
.
Oot}s with liho:le
Math 10' Mean
N % Correct
Numbers, Fractions, Decimals,',40
tyth 11 , M'ath 12
Mean Pearl
N '% Correct M % Correct
4
1,994, 76 263 60 949 72' 88 4
158 77 26 63 76 73 92116. 69 17 53 55 41 90
6,529 7,6 962 59 2,667 .2,616 8847 76 85 60 316 72 236 89'
896 79 67 60 '374 72 445 89188 70 43 56 87 , 66 57 86
'549 77 76' 60 268 71 201 92334 76 53 55 120 70 157 89489 76 96. 60 .228 73 156 89
,203 73 30 . 57 100 68 73 87278 77 29 64 121 69 126 87
97 75 9 64, 47 67 39 n422 78 4 55 66 201! :7Z 158 90-
j 1,479 .71 252 56 722 ,,:q8 468 86
a
°
.41
A
181.OCP
a
`,
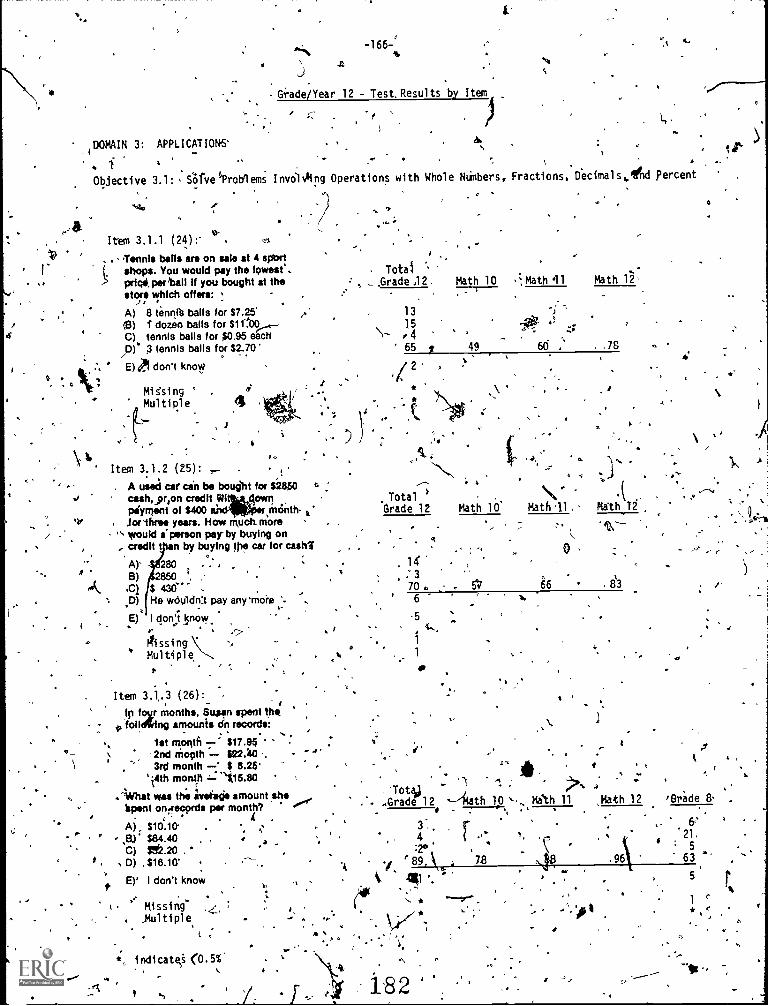
DOMAIN 3: APPLICATIONS'
f
Objective 3.1: SOivel'Problems InvoWing Operations with Whole NUmbers, Fractions, Decimal s,,,ittid Percent
"',\J
Grade/Year 12 - Test, Results by Item4
-1662
t '
6t,
Item 3.1.1 (24):- .
Tennis bails are on sale at 4 spbrtshops. You would pay the lowest .pica. per ball If you bought at thestore which offers:if 4
A) 8 limp balls for $7.25'(3) 1 dozen balls for $11A)0C) tennis balls for $0.95 each
/D)* 3 tennis balls for $270'
E)0.1.1 don't knoW
Mi .
Multiple
Total_ .Grade .12
13
465 //2
Math 10 - ',Math 1
,
Math 1.27
49 60 . ..78
6
f.Item 3.1.2 (25): . ,
A used car can be bought for $2850 6 ;caskyrion credit GTlpiiyment of $400 aiw er month- kJorihree years. How much morewould iperson pay- by buying oncredit n by buying !ft. car for cash'
Al- 280B)
.C1
D)
E) I don't know
14,
'
S 410 r- .
He vidi1dn3 pay anymore
tlissing` Multiple
Item 3..3 (26):1p fogy months, Susan spent thefollAing amounts Sn records:
.. 1st month $17.98 "'2nd month 622.403rd month S 8.28'
'Ath month ."4116.80
.ivhat was the inreiage amount shekporst onrrecprds per month?
. XA), $10:10' .58.)* $84.40C) 1.t.20 ,
D) ,$18.10`
E)' I don't know
t Kissing'.Multiple
t
*, indicates (0.5%.
*;f ti
Total /'
Grade 12
7
14 .
Math 10' Math '11 ,
0
.7
70 . 5q6
-5
) - A
,1%T o t aoj ).- ..Grade 12 ---'Math 10 Math 11
. :"
,341
.6
.0
Math 12 ,Oride
'21.5
.96 63 "'
r5
1
*1
V .
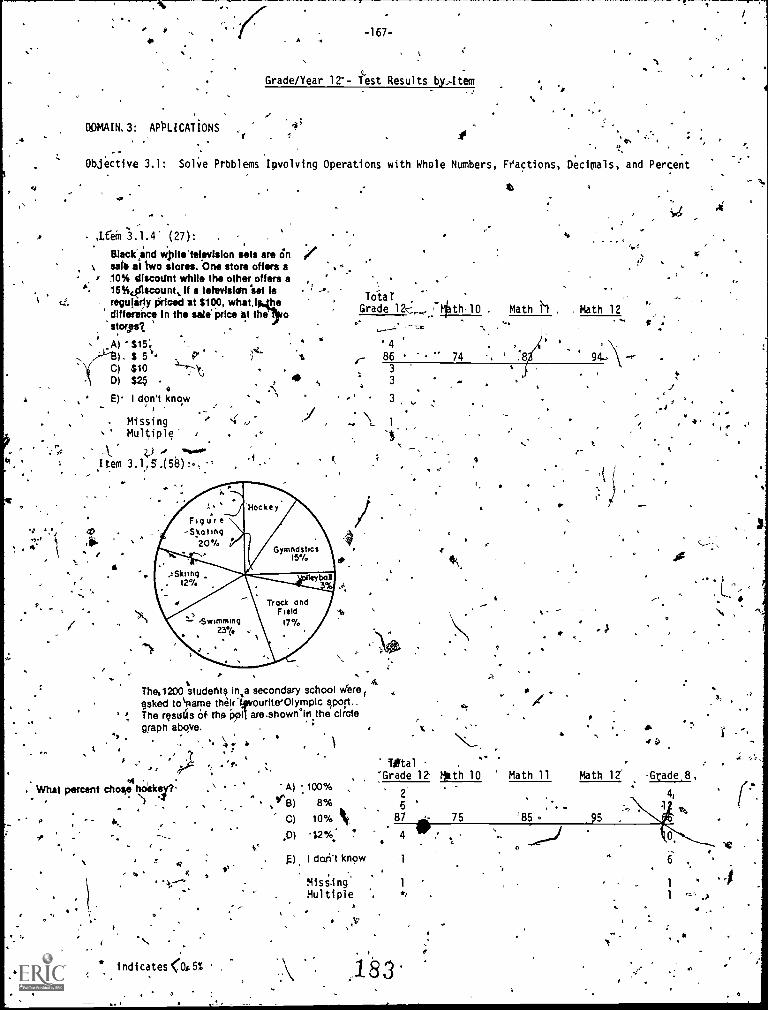
a
A
DDMAIN, 3: APPLICATIONS
-167-
Grade/Year 12-- Test Results by,Item '
.
Objective 3,1: Solve Prbblems Ipvolving Operations with Whole Numbers, Fractions, Decimals, and Percent
.1,661 3.1.4 (27): .
Black' and W.olletelevislon sets are Onsafe at two stores. One store offers a
/ 10% discodnt while the other offers a". 15%ofiscount. If a television set is
reguyidy priced at $100,difference In the sale price M the ostoma? '
A)I. S 5
C) 410D) $2.5
E) I don't know
. Missing -fMultiple'
Item 315.(58):,.
4
TotalGrade 12. M th-10 . Math h . . Math 12
- enn
'486 74
3
3
3
1 1
The,1200 student inta secondary school Are,gsked to \name their frourite'Olymplc gpoft..
1 The nasulls Of tnp are.shown'In.the circlegraph above.
What percent chose noetcey?-
P
t Missing. Multiple
1, 1
x
-, *- Titala Meth 10
-
Math 11 Math 12' Grade.8,A) :100% 2 . -
2' 41trB) 8% 5 1
C) 10% N 87 ift 75 85 = 95
.0) -12%; z ..
g), I don't know
d 4
se
t 4 e
a
Indicates <14 5% ,
-1
183.O
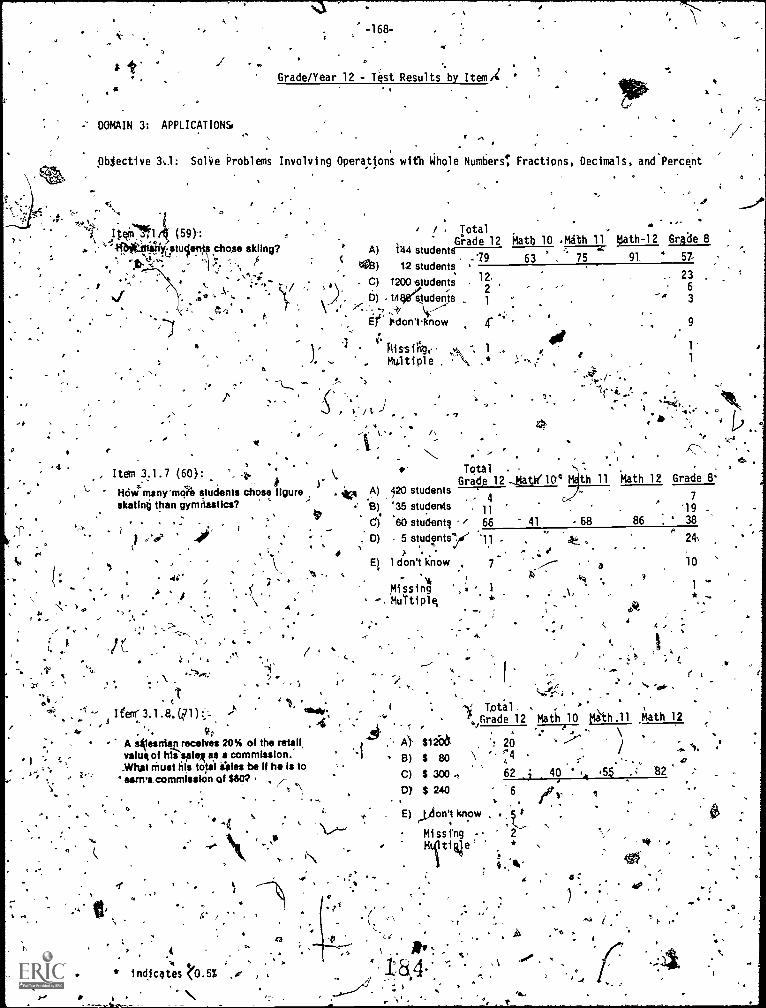
1
t*
DOMAIN 3: APPLICATIONS.
-168-
Grade/Year 12 - Test Results by Item ,A '
pblective Solve Problems Involving Operations with Whole Numbers: Fractions, Decimals, and'Percent
r-
's
1n77 (59):litpucke.rtcholse skiing?J, '
, , -S'.
:
TotalGrade 12 Math 10 'Math 11 kiath-12 Grade 8
A) 1'44 studentS-7( 79 63 , 75 91. 57-
..-0) 1.2 students.. 23 .
- C) 1200 students
. 0) .1/I8i4tudents
iidon'tknow
'1 Hissing;1. - Multiple ,
. ,
Item 3.1.7 (60: '_
Mciw'many:mA students chose figure 3 , A)skating than gymnastics? '13)
C)
0)
.
14 " Item'. 3.1.8, (4.71)::,..
4f;- A stkiesn iazreceives 20% of the retail,
valuq of his saleq as s commission.,Whit must his total itilles be If he Is to
commission of $80?
-
Ats"
.1 /'
6
t,
"bor.. 4a
P 4
* indicates (0.5%
3 V
N
1
Total -
Grade 12-tett( 104 th 11 Math 12 Grade 8120 students
35 students , 11
'60 studentl / 66 41 68 86
5 students?' '1) . * 241
) . -
- ,---" - a 10
'
63
9
1'1
7
1938
,MissingMuTti plq
(
.4.
.7--7---,,,,,.. \A} $12b6. 7 20 ' --- iB) $ 80 \I ''.:,4
82C) $ 300 .t 62 j 40 ' ,4 '5 ''0) $ 240
.E) ArJon't know , .,._4:_
Missing - 2MI tiqe
;9,
4,
*
. :, / k
. 7, (.
f. .., ,,.,.
( t
`..,,g4... .. , .
4S
*
"t,' total '`,,Grade 12 Math 11) tialh .11 Math 12
e,
4
a
.
5'
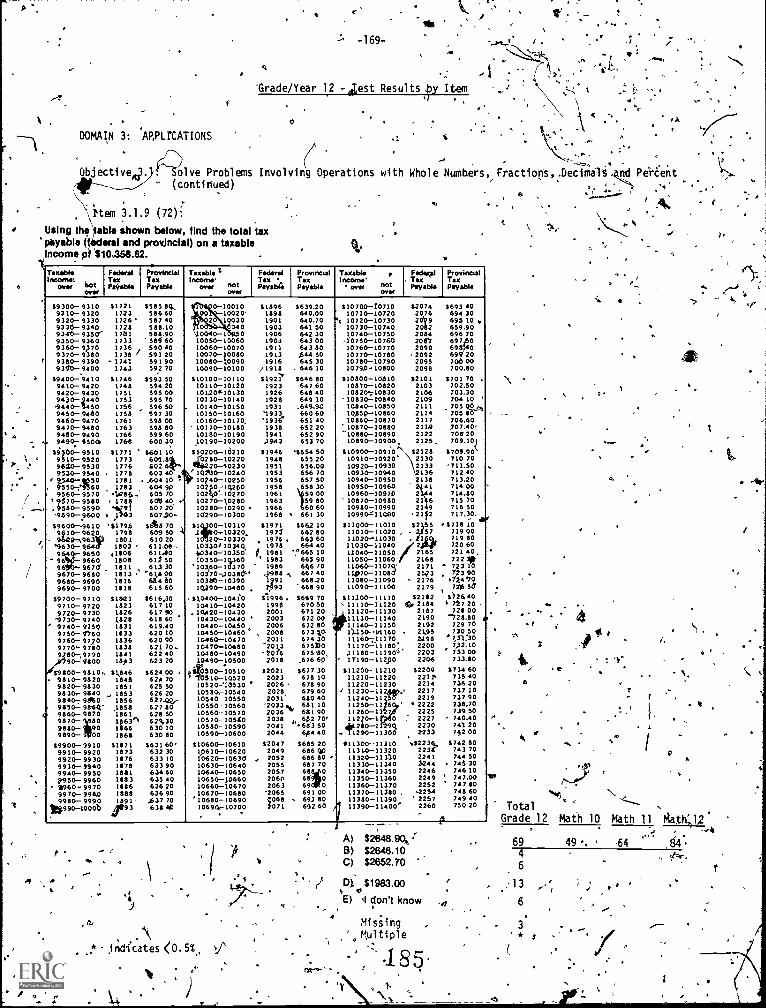
r
1 . .
DOMAIN 3: AP,PLTCATIONS
*
4
-169-
'Grade/Year 12 -zest Results .by Item
(Objectivek? f9olve Problems Involving Operations
(continued)
\item 3.1.9 (72):# Using the tablebie Shown below, find the total tax
payable (Sclera! and provincial) on a taxableincome pf $10.358.62.
1
A
..t A .
. '
t A
with Whole Numbers,,yractiops,,.DecimaiS 4Peeht,.
. e
a
TaxableIncome: ,_
over not449.
FederalTaxPayable
ProvincialTaxPayable
Taxable 1Income.
over notMg
FederallaxPayab lir
ProvincialTaxPayable
Taxable 44,
Income.over not
000,t
FedeaxlTaxPayable
ProvincialTaxPayable
$9300- 93109310- 93209320- 93309334.934093415- 9350r6350- 93609360- 9.7709370- 93809933:0,3: 9390
'99400- 94109410- 94209420- 943094)0-24409440-64509450-94609460-94709470- 94009480- 9490
. 9490- 5500$9500- 95109510- 9520962.0-95309530-9540
' :::::-.Cg9560-9570
' 570-9530.9500 -9590-9690- 9600$9600-96109§10-966P-9963
9630- '5649650
' 96 96604670
9670- 96809680- 96909690-9700
59700-97109710 -97209720- 97309730- 9740
" 9740- 21509750- 27609760- 97709770' 97809 30-, 9790
90- 41100894100- 98100.9810-98209820- 98309830,934093407 93609350- 9864'9860- 98709870-9000 - 09390- 00
99900- 99109910- 99209920- 99309930 -79409940- 99502950- 9960111960- 99709970-99359900 - 9990
10690-100073
$172117231726'17281751173317361738 '
-1741
$1746174817511753175617581761176317661766
$17711773177617781141
' *5084;178
:1/.113
51794179810011003 '
100618081011101318161018
$18211023102678281031103318361838184118,43
$1,84618431851
,"18531856,1853186111363'.1566106$
3107110731076107818011033100618881891
1593
$5135134.586 60587 40500.10520.90
586 60590 40591 20:LI %4
$59350594 20595 00595 70596 50597 3059000598 80599 60600 30
$601 10601.13k,..602 6603 40
10044 9100 ;605 7060$ 40 .'607 20607.20.
3070 ,609 50 A610 20611.0061410612 50613 30
'634 00634 30615 60
3616,30617 1061771618 60619.40620 10620 90621 70.622 40623 20
362400
624 70625 50626 20627329/7627 80628 5062%30630 10630 80
$631 60'632 30633 10633 90634 60635 40636 20636 90
437 70631145
.0-1001010020'
''t 00300* 0.100040-1 00050-10060
10060-10070100/0-3008010080-(009010090-10100
910100-1011010110-10120101202-1013010130-10140
. 10140-1015010150-1016010160-1017010170-1018010180-1019010190- 10200
$$0200-10210,14160-10220
20-50230610430 -10240
sr 10;40-1025010220-10,25010240=1027010270-1,028010200 -1029010290-10300
1 10320.1 24.'10330103304 10340,05340-1036010350-13360
'103,60-1037010370-J038(2'103M-1039010,390-10.100
$60400-1041010410-10420
10430-1044010440-1045010450-1046010460-1047010470-10.8010480-10490113490-10500
#46.00,10' 0510-14520
10520-'1,753010530,1054010540-1055010550-1056010560-1057010570-1055010580- 1059010590-10600
310600-106101,0610-1062010620-1063d10630-1064010640-1065010650-1066010660-1067010670-1068010680-10690106906-10700
$1096 3639.201898 640.00 L,1901 640.701903 641 501906 642 301903 643 001911 647801913 444 501916 645 30
/1910 . 646 1031921 $646 80
1923 647 601926 640401928 649 101931 .649.40'1933 660 60'1935' 651 401938 652 201941 652 90
.1943 653 70$1946 9654 50 ,
1948 655 201951 656.001953 656 701956 657 501958 658 301961 159 001963 59 801966 60 601968 661 30
$1971 $64,2 101977 662001976 . 663 601978 664 40
1,_ 1901 "7665 10' 1903 665 90
1906 646 70.1988 .., 667 401391 668.20
93 66090
31996. 3649 701990 670 502001 671 20 ,2003 672 002006 672 80
, 2008 673 30-2011 674 30
'2013 675330-50i6 67580,2018 .676 60
32021 3677 302023 678 102026 678 902028 679 602031' 680 402033,,, 681 102036 631 902038 60270'2041 .6153 502044 6,84 40
$2047 $605202049 606 30
,, 2052 686 802055 6077020572060 68 02063 69 0
'2065 691 00006$ .- 669932 860
69260
910700-70710 $2074 76934010710-10720 2076 694 3010720-1073010730-10740
20/9 695 10 y20 2 659.90
1.0740-10750 2084 696 7010750-10760 20e7 697,5010760-1077010770 -10700
22009920 214,"21g
10700 -10790 2095 700 001079.0-10800 2098 700.00
910000 -10310 $2101 $701 70 .10010 -10020 2103 702.5010820;10830 2106 703.30
'10030 -50040 2109 704 10 '10340-10350 2111 705 QP,40,14650 -10860 2114 705 0010060 -10070 2117 706.60
10070 -10000 2114 707.40,-10880-10890 2122 702 2010890-10900 2125 709.10
$10900-10910.\ $2120 $709.90A.
10920-10930'2130 710 702133 '711.50
10930-10940 1315 712 4010940-1095010950-10960
513$ 713.2041 714 00
10070 -1090010960-10970 2 4 714.00
21116 715 0010980-10990 2149 716 5010990=11000 .21 2 717.30.
011.311000-11010 32 5 $7113 10
11010-11020 , - 57 719 0011020-.11030 . 1¢(11, 719 8011030-11040 2", 720 6011040-11050 2165 7214011050-11060 2168 722 VP11060-11070, 2171 723 10144.7o-1105044 2l.,73 , 7'3 9011080-11090 , 2176 .7450011090-11100 2179 7246 Str. ,
911100-11110 92102 $726 40` 11110-11120 01. 2184 72720 ,, 11120,11130 2107 720 00
*11130-11140 2190 -728.80 a11140-11150 2192 729 7011.150-P1160 2395 730 5011160711170 2498 .731:3011170-11180' 2200 722.10311130-11190'4 2203 7370017190-112.00 2206 733.00
311200- 11210 $2209 3734 6011210-11220 2211. 735 4011220-11230 2214 734 20
1 11230-1123W 2217 737 102219 737 90
11250-11 6 2222 738,7011260-11 7 2225 739 50
.. 1290 -11300
112/0.-1 0 2227 740.40al 2110-1 4 2230 741 20
2233 742 00
$11340-11310 632234. $742 801131.0-11320 2234 743 7011320-11350 2241 744 SO11330-11340 2.244 745 3011340-11350 2246 746 1011350-11360 2249 ' 747.0011360-11370 2252 747 0011370-11300 . 2254 7406011300 -11390 ' 2257 749 40
1 11390-11400' 2260 750 20
it
OP
r
1
indicatescates <0.5%.,
41
e
a.
4.
`1.
.e
***)., NTotal
Grade 12 Math 10 Math 11 )lath' 1,2
A) S2848.90,,,;B) $2848.10
69 49 . 644
C) $2852.70 6
D). $1983.00 ...13E) 'I don't know 6
Missing 3Multiple * $
A.85.
t
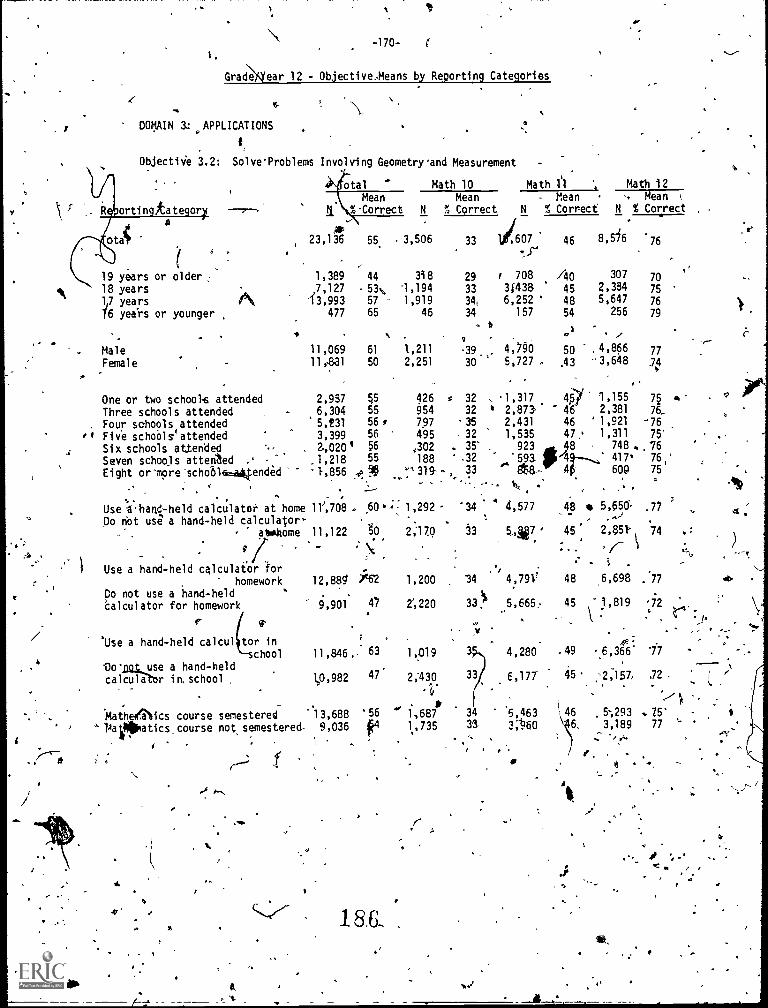
r
-170-
Gradear 12 - Objective.Means by Reporting Categories
t.
DOMAIN 3:.oAPPLICATIONS
Objectiv.e 3.2: Solve-Problems Involving Geometry 'and Measurement
Math 10 Math 11 Math 12
Mean - MeanMeanN % Correct N % Correct N % Correctortin
o
ate or
23,136 55, 3,506 33 11(607 46 8,5/649
(
.
19 years or older ,: 1,389 44 398 29 r 708 /40 307
18 years ,7,127 53 1,194 33 31438 45 2,3417 years .01t, 1 3,993 57 1,919 34, 6,252 ' 48 5,647
16 yerirs or younger 477 65 46 34 157 54 256
*t$ . ,
7 '. ..
11,069 61 1,211 39 4,70 50 . 4,866 77
11,221 50 2,251 30 5,727 , .43 -3,648 .74
,
One or two school attended 2,937 q5 426 * 32 . 1,317 4,0" 1,155 75 a 1
Three schools attended 6,304 55 954 32 4 2,873 46 2,381 76_
Four schools attended 5,t31 56 r 797 35 2,431 46 ' 1,921 -.76
,# Five schools` attended 3,399 56 495 32 1,535 47 1,311 75'
tSix schools attended , 2.,020 56 4302 . 35' . 923 48 748 .. 76
Seven schools attended .. - .1,218 55 188 32 _.' 593 419--.., 417 76
Eight or-more -school-a...Wended 1,856 ..7, pp r 319- - 33 Eta. 4t 608 75.
MaleFemale
76
70
75
76
79
- .,, ,
Use -8.hari4-held calculator at
,
home 11',708 . 60u.;: 1,292 34 4 4,577 48 * 5,053. .77 '. , ts
00 riot use a hand-held calculator- ., .
.i
. - abd)tome 11,122 tO 2:170,
33 547 ' 45 3,851' 74
9.
, . : \ :, ." C:* ,
1
- .
.., ..
Use a hand-held calculator for ,: 1
f homework 12,889' 762 1,200 34 4,791' 48 6,698 .'77
. Co not use a hand -held '
calculator for homework 2c220 33, _5,665.. 45 ,-.1,819 '729,901 .47
1./y . . - .. .
Use a hand-held calcul for in;
chool 11,846,-. 63g ;
1,019 3 4,280 .49 .6,366 '77 -
4 DcmLuse a hand-heldcalculabr i n. school
_ .
1,0,982 47 2;430 33 6,177 45 :2 157,, .72 -
-V ,
* .
,' -.
'math,e02Nics course semestered .13,688 '56 ".' 1,687 34 5,463 46 5;293 . 75' -
'` PatiMatics_ course not semestered- 9,036 fe 33 3;1160 5 3,189 77 '
i -,
. . ,, , , ,.,..i
4
4 . '.
% _. .-
-
/
18.6_.
O
wd
."
,
vb.
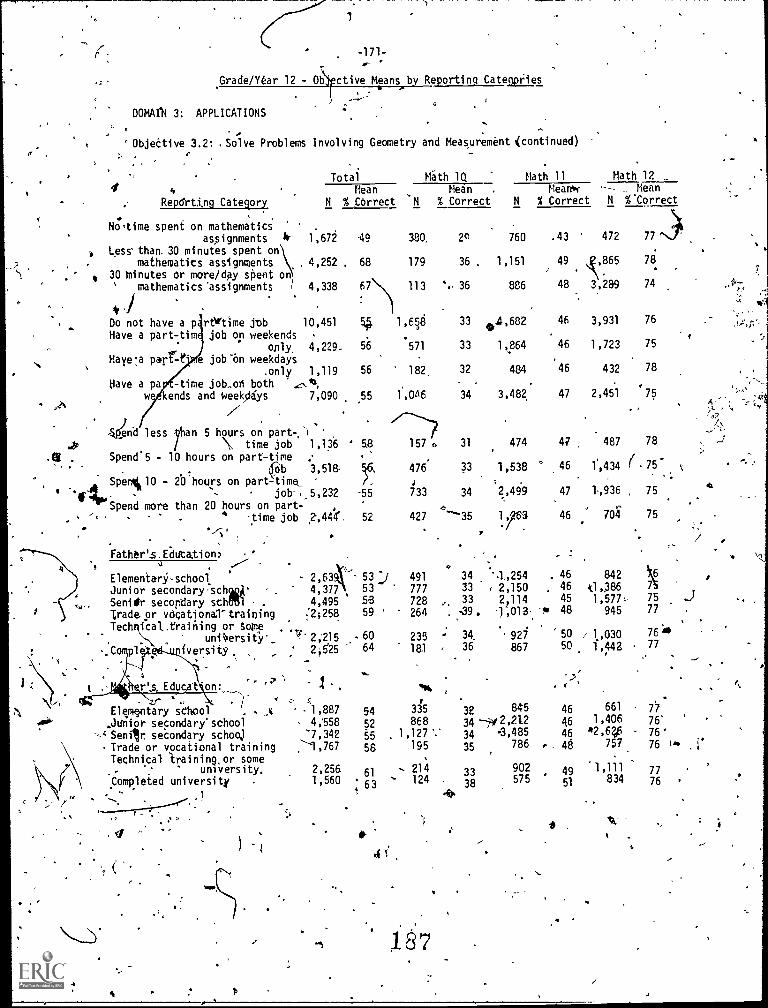
1
-171-
.Grade/Year 12 - Ob ctive Means by Reporting Categories, -
DOMAIN 3: APPLICATIONS
ObjeCtive 3.2: . Solve Problems Involving Geometry and Measurement continued)
I 4Total
Mean , Mearm-° Meth IQ Math 11 Math 12
Mean Mean
Reparting Category N % Correct N % Correct N % Correct N %.Correct.
No*time spent on mathematicsassignments it 1,672 49 380, 2e 760 .43 472 77
Less' than. 30 minutes spent onmathematics assignments 4,252 . 68 179 36 . 1,151 49 ,865 78
30 minutes Or more/day spent onmathematics 'assignments 4,338 67 113 .., 36 886 48 3,289 74
Do not have a p rftr6me job 10,451 5,15. 1,658 33 4041,682 46 3,931 76
Have a part-.tim job on weekendsonly, 4,229- 56 571 33 1,864 46 1,723 75
Have :a part-t e job *an weekdaysonly 1,119 56 182 32 484 46 432 78
Have a pa -time job..on both 4.04, . .
w kends and Week$ys 7,090 55 1,046 34 3,482. 47 2,451 '75/ ...
f,.4)enil less an 5 hours on part -,1
" time job 1,136 ' 5.8
Spend5 - 10 hours on part-time6b 3,518-
Spertd.10 - 20 hours on part -times14).- job 5,232
Spend more than 20 hours on part-, - time job 2,444', 52. ..--*
,
Father's, Edutati on, ...----- .
Elementar-school 2,634:- 53 j 491 34 '4,254Junior secondary sch * 4,377 53 777 33 # 2,150Senior secondary sch . 4,495 53 728 ,.. 33 21114
Trade or wicationa.1- training :2058 59 264 . -39 . .1 ,013,,CoTechrizl..training or SolneOunersify_ .": 2;215 .60 235 - 34. ' 92
.
pl fversit9 2 }5'25 64 181 . 36 867
157 0 31 474 47 487 78
476' 33 1,538 46 1,434 ( 75-
733 34 2,499 47 ,936 , 75
427 '35 1.,76,3 46 7011 75
tg
0-)-
. _r ' .,./Elementary school . ,i 1,887
.Junior secondary' school 4,558'--., Senilr, secondary schooj '7,342
Trade or vocational training .'-'1,767Technical Iraining,or some. university. 2,256 61 - 214 33
Completed university 1,560 ; 63 - 124 . 38
40.
54 315 32 845
52 868 34 - --742,21.255 . 1,127 '.' 34 3,48558 195 35 786
902575
4
41.
187
46 84246 kl ,,38645 1,577:
"! 48 945
50 / 1,03050 1,442
. '
464646
r 46
4951
a.
6611 ,406
2,62fi757
1,111834
7577
7677
7.7
76'
766.7 i.* .
7776
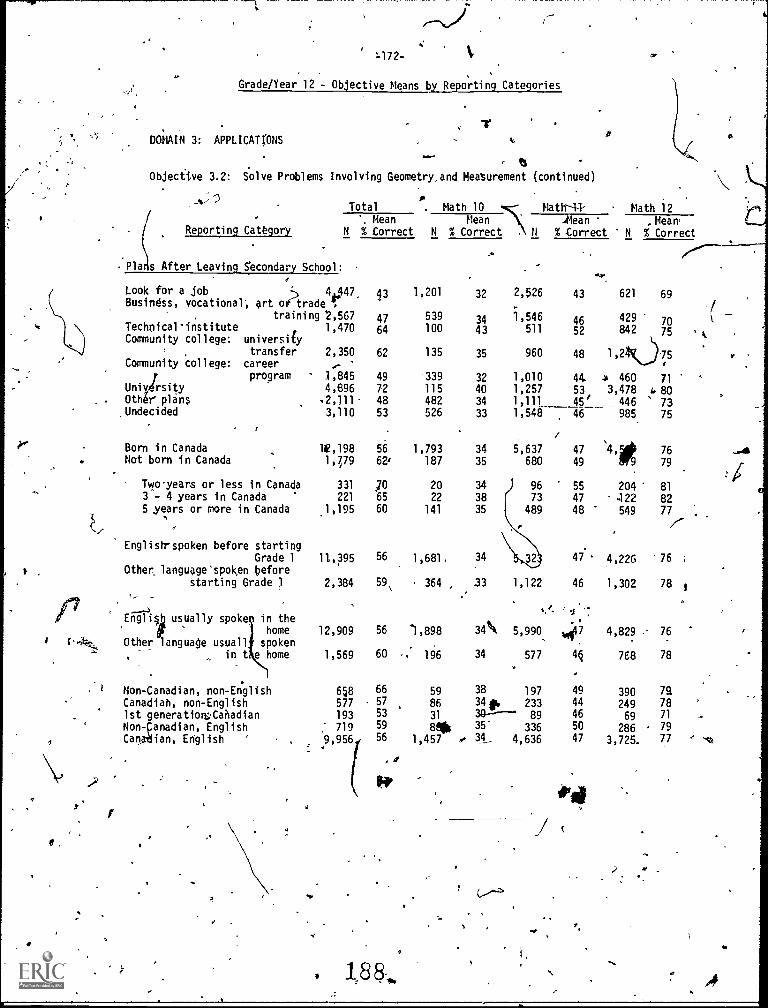
L172-
Grade/Year 12 - Objective Means by Reporting Categories
DOMAIN 3: APPLICATIONS
Objective 3.2: Solve Problems Involving Geometry, and Measurement (continued)
Reporting Category
Total.
' Mean
. Math 10 Matb-1.1-
Mean ./Mean
Math 12Mean
N % Correct N % Correct ; /1 % Correct N % Correct
Plans After Leaving Secondary School:.
Look for a job 4 447 43 1,201 32 2,526 43 621 69Business, vocational; art oftrade le.
training 2,567 47 539 34 1,546 46 429 70Technical institute 1,470 64 100 43 511 52 842 75Community college: university
transfer 2,350 62 135 35 960 48 1, 2 75 .
Community college: career ..,-- '
program 1,845 49 '339 32 1,010 44 4 460Uni rsity 4,896 72 115 40 1,257 53 3,478Oth r plans 2,111 48 482 34 1,111 45' 446Undecided 3,110 53 526 33 1,548 46 985
U
Born in CanadaNot born in Canada
71
80
7375
/,
1E,198 56 1,793 34 5,637 47 '4, 761,7,79 62' 187 35 680 49 79
Twoears or less in Canada 331 ;0 20 34 96 55 204 813 - 4 years in Canada 221 65 22 38 73 47 422 825 years or more in Canada 1,195 60 141 35 489 48 549 77
English-spoken before startingGrade 1 11,395 56 1,681, 34 32 47, 4,226 76
Other language'spoken beforestarting Grade 1 2,384 59\ 364 33 1,122 46 1,302 78 I
/II. -.....
Englip usually spoke in the..".. "A :
home 12,909 56 1,898 34%, 5,990 4.7 4,829 .. 76c-.4... Other language usuall spoken
. , in t e home 1,569 60 .. 196 34 577 44 768 78
e.
Non-Canadian, non-EnglishCanadiah, non-English1st generation CahadianNon-panadian, EnglishCanailian, English '
719 59
577 57
129i
656 66 59
86
9,956 56 1,457 14- 4,636 47
.
14.
188..
390 7a249 78
69 71
286 , 79
3,725. 77
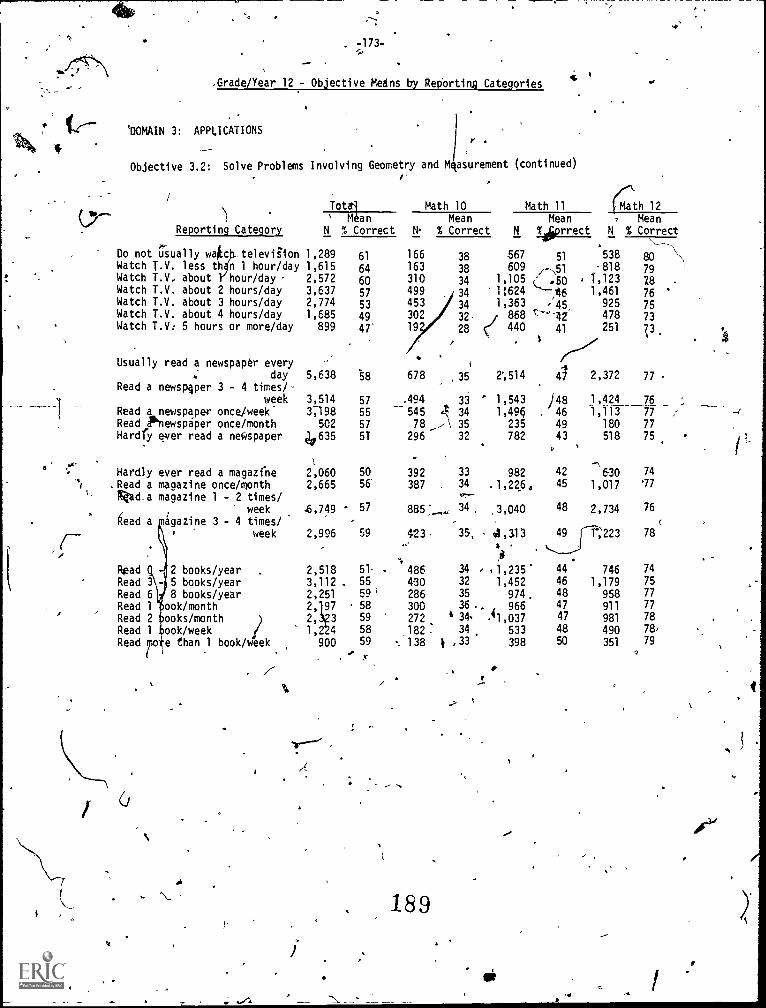
,Grade/Year 12- Objective Means by Reporting Categories'
a
`DOMAIN 3: APPLICATIONSr ,
Objective 3.2: Solve Problems Involving Geometry and M asurement (continued)
Total Math 10 Math 11 Math 12Mean
Reporting Category N % CorrectMean Mean ,
No % Correct N %,iliprrect N
Mean% Correct
*Do not usually wakc televii"ion 1,289
Watch T.V. less th n 1 hour/day 1,615Watch T.V, about hour/day 2,572Watch T.V. about 2 hours/day 3,637Watch T.V. about 3 hours/day 2,774Watch T.V. about 4 hours/day 1,685Watch T.V: 5 hours or more/day 899
Usually read a newspaper every ,
. day 5,638Read a newspaper 3 - 4 times/
week 3,514Read a newspaper once/week- 3;158Read newspaper once/month 502
Hardly ever read a newspaper 4,635
1
Hardly ever read a magazine 2,060.Read a magazine once/month 2,665NZad.a magazine 1 - 2 times/
. week 5,745tread a magazine 3 - 4 times/
0 week 2,996
Road 2 books/year 2,518Read 3 5 books/year 3,112Read 6 8 books/year 2,251Read 1 ook/month 2, 97Read 2 ooks/month 2, 3
Read 1 ook/week 1, 4
Read rote than 1 book/week 900
61
64
6057
53
49
47'
58
57
55
57
5T
50
56'
57
59
5155
59;58
59
58
59
166 38 567 51 538
163 38 609 /-51 818310 34 1,105 (' t , 1,123
499 34 1:624 ---- 1
453 34 1,363 , 45, 925302 32. 868 c--42 47819 28 440 41 251
f......7.i
678 35 2',514 47 2,372
.494 33 ' 1,543 ) 48 1,424545
_,34 1,495 . 46 1,113
78 35 235 49 180
296 32 782 43 518P '
..1392 33 42
387 . 34 .1,9464 1,(1??
885:....--,( 34, .3,040 48 2,734.
423, 35, -, 41,313 49 1%223".
-
°.
486 34 , <1,235 44 746
430 32 1,452 46 1,179
286 35 974, 48 958300 36 .
.1
, 966 47 911
272 6 34 1,037 47 981
182 : 34 533 48 490
-. 138 i ,33 398 50 351
\---,
8079
78
7675
73
73
77
__7677
77
75
'774;
76
78
74
75
77
7778
78,
79
\)
2
189
a
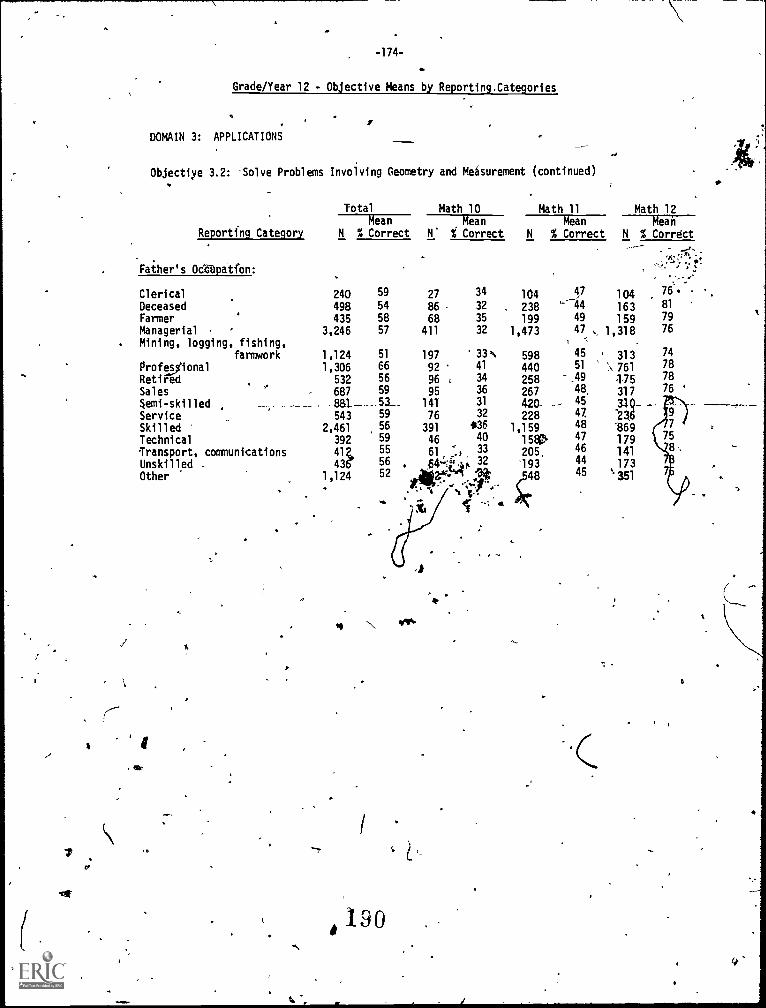
-174-
Grade/Year 12 - Objective Means by Reporting,Categories
1
DOMAIN 3: APPLICATIONS
Obiectiye 3.2: 'Sol ve Problems Involving Geometry and Measurement (continued)
Reporting Category
Total Math 10 Math 11Mean
N % CorrectMean
N % CorrectMean
N % Correct
Father's Odapatfon:
240 59
498 54
435 58
3,246 57
1,124 51
1,306 66532 56
687 59.. ma____. 53_543 59
2,461 56
392 59
41Z. 55
436 .
1,124 52
27 34
86 - 32
68 35
411 32
197 33 o
92 41
96 c 3436
141 31
76 32
391 $3646 40
61 :., 33
.644.:P.1; 32
ev'mAM 4-
104238199
1,473
598440258267420.
2281,159
1 520
205.
19348
47
' 4449
47
45
51
-49
48'_45
47.
48
47
46
44
45
,,
.
Clerical
DeceasedFarmerManagerial ,
Mining, logging, fishing,farmwork
Profelyi ona 1
RetiredSal es
semi- skilled __ . _ ________
ServiceSkilledTechnicalTransport, communicationsUnskilled -
Other
I
*190
. ..
Math 12Mean
N % Correct
104 ,
76'
163 81
159 79
1,318 76
313 74
\ 761 78
T75 78
7631731Q-.236 §--
1869 7
179 75
141 8
173*. 351
q'
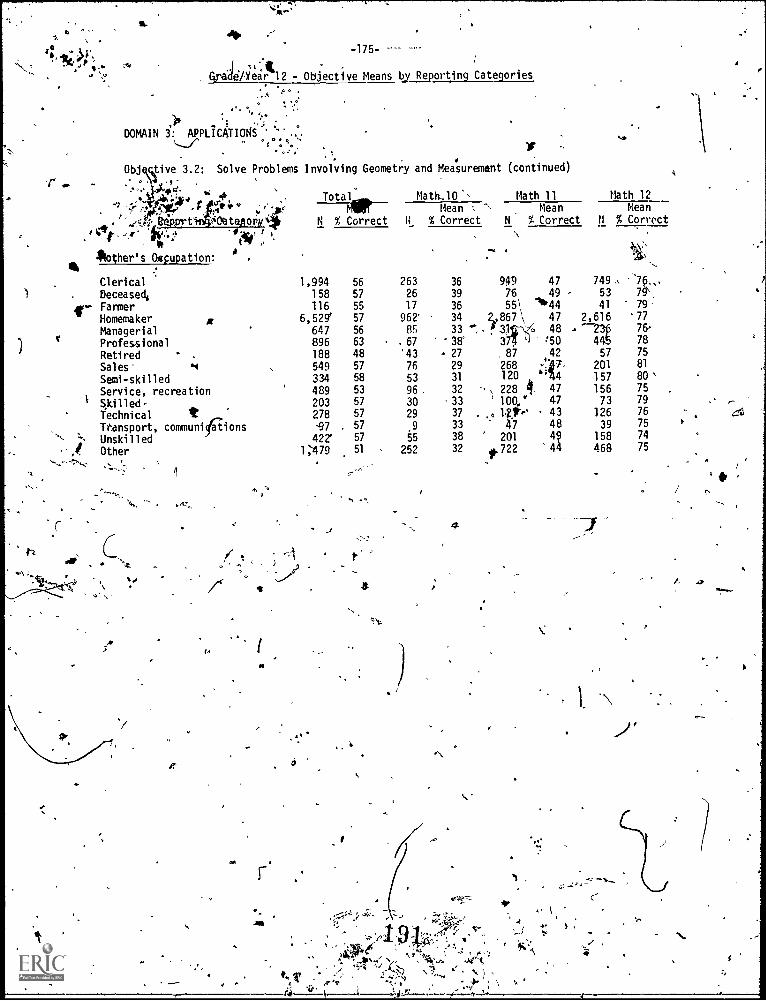
-
L 4
Ctriiidgejt1 2 - Objective Means by Reporting Categories"t *o. ,
-175-
.. ..
,), ' '... :
DOMAIN 3: APPLICATIONS ...c.--/-'
Obj iive 3.2: Solve Problems Involving Geometry and
e.1
-;;* i.,0-r t
*other's Oqupation:
ClericalDeceasedtFarmerHomemakerManagerialProfessionalRetiredSales- 6,4
Semi-skilledService, recreationSkilledTechnicalTrensport, communifiionsUnskilledOther
R
tQ,00 ry1 )
a
3,
p
I
ti
Measurement (continued)
Total Mativ.10 Math 11Mean Mean
N % Correct It % Correct N % Correct
Math 12Mean
% Correct
1,994 56 263 36 949 47 7491 58 57 26 39 76 49 , 53116 55 17 36 55\ 1'44 41
6,529' 57 962 34 2867 \ 47 2,616647 56 85 33 '',. ! 3 0 48896 63 . 67 38° 3 :50 4188 48 '43 27 87 42 57549 57 76 29 268 -447% 201
334 58 53 31 120 ''14 '157
489 53 96 32 228 al. 47 156203 57 30 33 ' 100,* 47 73278 57 29 37 . ., 1Zir,' 43 126
57 9 33 47 48 39
42? 57 55 38 201 49 1581;479 51 252 32 .722 44 468
r
4
a
,8 ,
?:40ec ' '
_Sp..:";%
", ^ -40. \r '
se.
,,. '76.79',79
.777G787581
80757976757475
'es
P-
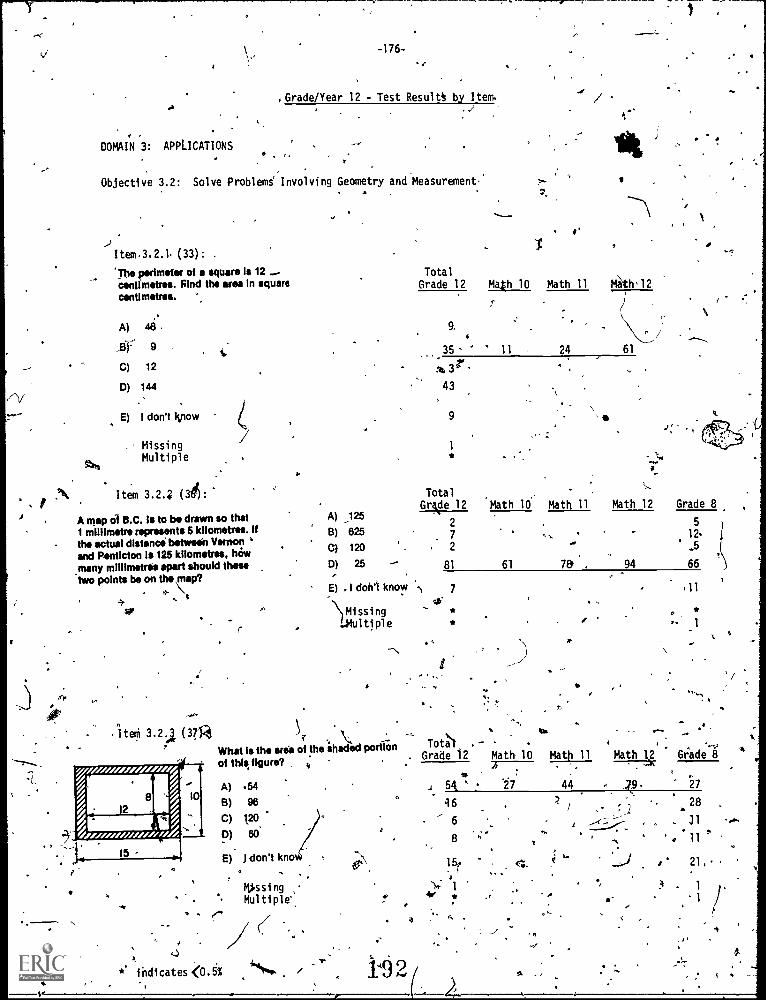
/ V
DOMAIN 3: APPLICATIONS
-176--
Grade/Year 12 - Test Results by Item.
0
Objective 3.2: Solve Problems` Involving Geometry andMeasurement
, .
Item.3.2.1. (33): .
'The perimeter of a squats Is 12centimetres. Find the area In squarecentimetres.
A) 48
A: 9
C) 12
0) 144
E) I don't know
Missing
5t*tiMultiple
Item 3.24 (A:
A map of B.C. Is to be drawn so that1 millimetre represents 6 kilometres. ifthe actual distance; between Vernonand Penticton is 125 kilometres, howmany millimetres apart should thesetwo points be on the map?
.
r
A) 125
B) 625
C) 120
0) 25
E) .1 don't know 7
Missing.Multiple
TotalGrade 12 Math 10 Math 11 Mkh°12
9.
...35 11 24 61
za 3r.43
9
- :..7..
TotalL
Grkle 12 'Math 10 Math 11 Math 12 Grade 8
2 57
.. 12-2 ." _5
81 61 70 . 94 66, -
1
a'*
*
N
,11
,
Itelj 3.2.1 (3rAl .) '\'..r . -
..What Is the arei of the shaded portion Totes
of this, figure? , ,,, .Grade 12 Math 10 Math 11 Math y Gi:adeg
*A) .54 54, ' 27 44 . .T9 : 27
B) 96.
.16 ?
C) 120.: 2 . 28
4.
6
0) 604
4. --1. , . . 11 .....
8..
.4 11
E) Jdon't kno ''''
4,..
Missing .. i *,- 1
* 'le *. . - 1 Fl
.. -..
, , / ( . 4 . . .,
-, _-/ .,.
,..)
at. indicates X0.5% So... ' -149
15
10
.
4
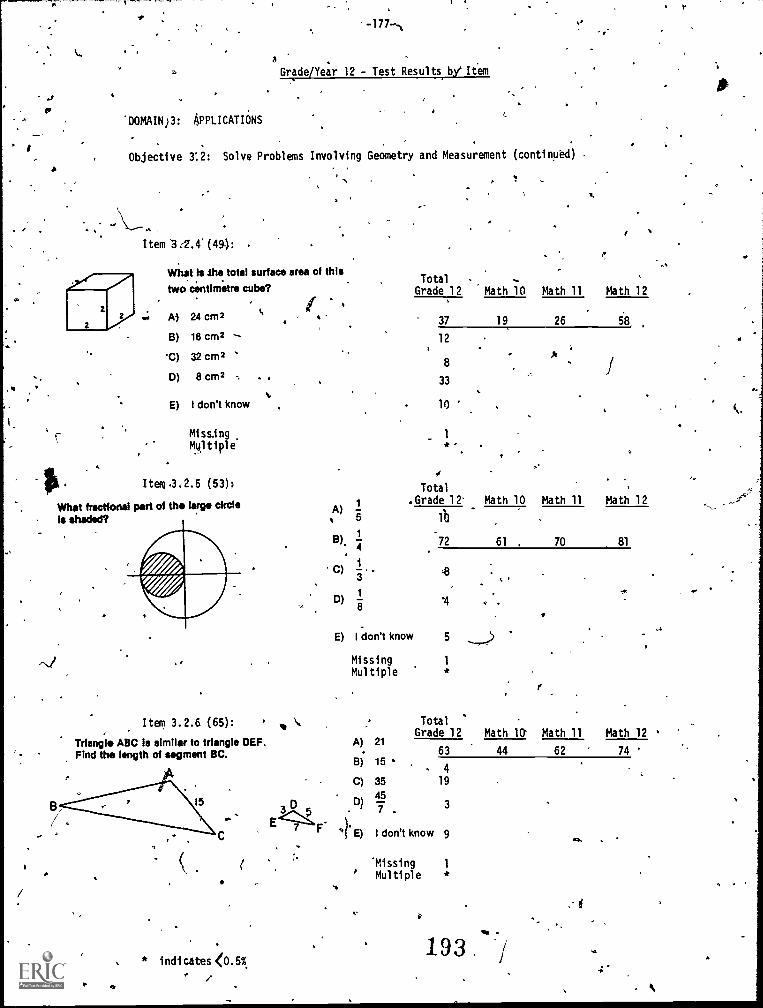
a
Grade/Year 12 - Test Results by Item
'DOMAIN)3: APPLICATIONS
Objective 312: Solve Problems Involving Geometry and Measurement (continued) -
Item '3 ./.4' (49-).:
What is the total surface area of this
two centimetre cube?
A) 24 cm2
TotalGrade 12 Math 10 Math 11 Math 12
37 19 26 58
B) 18 cm2 12
'C) 32 cm2
D) 8 cm2 .
E) I don't know 10
8
33
MissingMOtiple
at:m.3.2.5 (53):
What fractional part of the large circleIs shaded?
Item 3.2.6 (65): \ .
Triangle ABC is similar to triangle DEF.Find the length of segment BC.
* indicates <0.5%.
*
Total1 .Grade 12' Math 10 Math 11 Math 12
A)5 lb
B). 4
1
72 61 70 81
C)1 -3
1D)
8'4 , .
E) I don't know 5
Missing 1
Multipler
TotalGrade 12 Math 10 Math 11 Math 12
A) 2163 44 62 74
B) 15- 4
C) 35 19
D)45
37
°?' E) I don't know g
'Missing 1
Multiple
193. .*./
d
y
4e
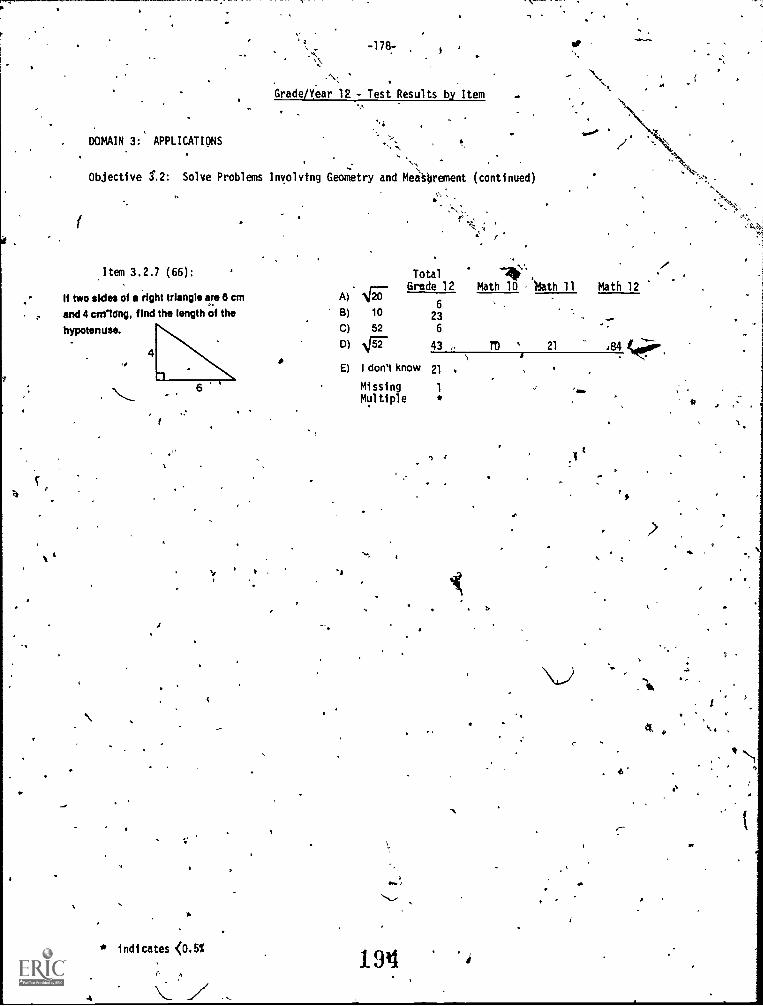
-
DOMAIN 3: APPLICATIONS
,-1787
.S4+.SZ,
Grade/Year 12 - Test Results by Item
, '
Objective 3.2: Solve Problems Involving Geometry and Mea'sttrement ( conti nued)
Item 3.2.7 (66):
If two sides of a right triangle are 8 cm
and 4 cmlong, find the length of the
hypotenuse.
I
TotalGrade 12
E) I don't know
MissingMultiple
Math 10 - 'Math 11 Math 12
623
6
43 11) 21 .84
21
1
t
..4
* indicates <0.5%
1/1'
194
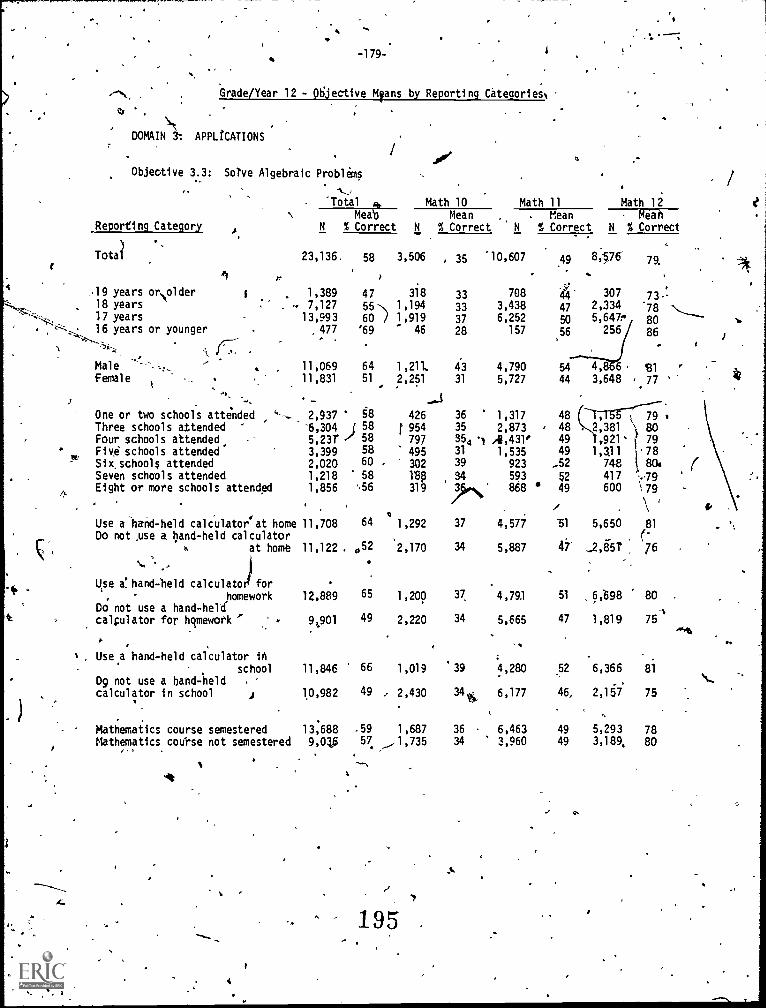
-179:
Grade/Year 12 - 06jective Means by Reporting CategorieS
DOMAIN 3: APPLICATIONS
Objective 3.3: Solve Algebraic Problems
-., °
'Total 4. Math 10 Math 11 Math 12Meab Mean . . Mean , Mean
N % Correct N % Correct N % Correct N % Correct
I
Reporting Category I
.0"
19 years orNolder 1 1,38918 years . 7,12717 years 13,993
. .,.,.16 years or younger , 477'"4..., ,
.
1
.One or two schools attended
,2,937
Three schools attended -6,304Four schools attended, 5,231`
Fiv. schools attended 3,399Six,schools attended 2,020Seven schools attended 1,218
4 Eight or more schools attended 1,856
) 4 ,Total 23,136
Male 11,069female 11,831
58 3,506
47 318.55-\ 1,194
60 / 1,919'69 46
64 1,211.
51 2,251
' 8 426
."
i 58 t 95458 797
58 49560 302
58 18?.-56 319
Use a-hand-held calculatorlat home 11,708 64
Do not use a hand -held calculator
at home 11,122 . ,52
ti ,
1,292
2,170
Use a' hand -held calculators for
homework 12,889 65 1,200Do not use a hand-heldcalculator for hqmework ' 4 9,901 49 2,220
Use a hand-held calculator inschool
Dg not use a hand -held ,
calculator in school
11,846 66 1,019
10,982 49 - 2,430
Mathematics course semestered 13,688 .59 1,687
Mathematics course not semestered 9,046 57 _.,..1,735
414
195
35 10,607 49
33 708 4'33 3,438 47
37 6,252 50
28 157.
56
43 4,790 54
31 5,727 44
36 1,317 4835 2,873 ' 48
354 ', /6,431' 49
31 1,535 4939 923 _52
34 593 52
,o, 868 49
37 4,577 51
34 5,887 47
37. .4,791 51
34 5,665 47
'39 4,280 52
34* 6,
177 46,
36 6,463 4934 3,960 49
8,..576 79.
307 73..
2,334 '78
5,647f, 80256 86
t
4,8 6 813,648 77
-17131779-. 2,381 \ 80
,921' ( 791,331 178748 t 806 (417 %-79600 179
\5,650 81
(-.2,85? 76
6,698 80 .
1,819 75.44
6,366 81
2,157 75
5,293 783,189, 80
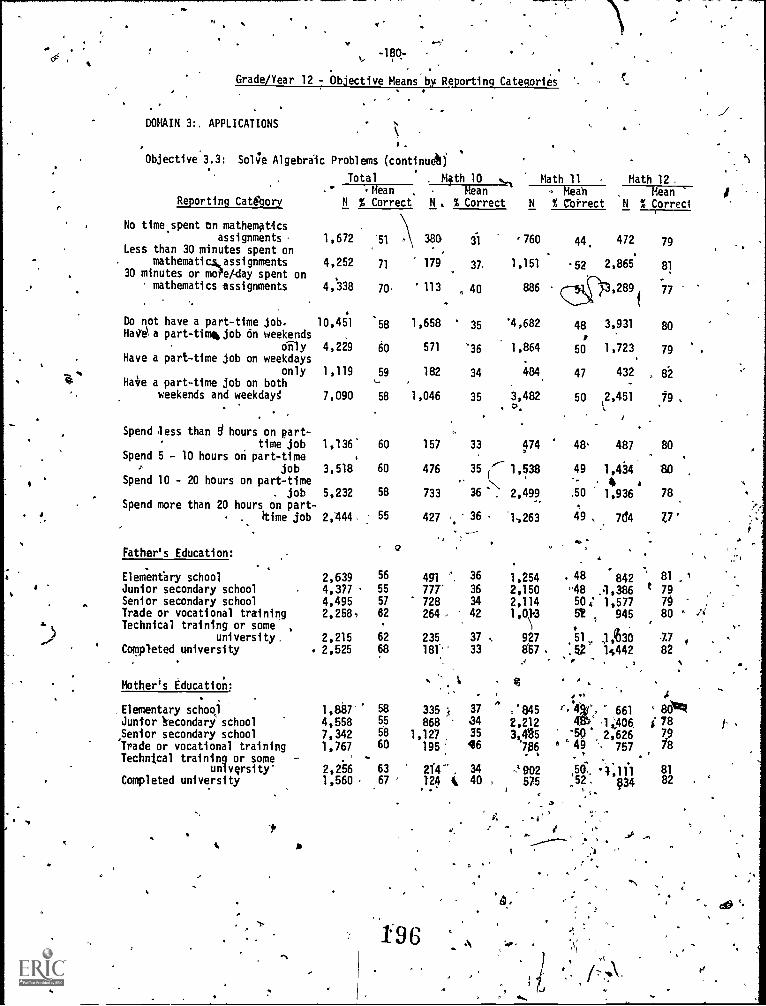
-UP-
Grade/Year 12 - Objective Means tv Reporting Categories. .
DOMAIN 3:. APPLICATIONS
Objective 3.3: Solh Algebraic Problems (continueh)
Total . Math 10 Math 11 Math 12 .Mean Mean . Mean Mean
Reporting Catdbory N % Correct N . % Correct N % Correct N % Correct
No time, spent on mathematics
assignments . 1,672 '51 380 31 '760 44, 472 79Less than 30 minutes spent on
.
. mathematick assignments 4,252 71 179 37. 1,151 -52 2,865 8130 minutes or mofe/day spent on
mathematics assignments 4,338 70. 113 , 40 886 ,289( /7
Do not have a part-time job. 10,451 '58 1,658 35 '4.882 48 3.931 80NaVia part-timabjob on weekends
only 4,229 60 571 "36 1,864 50 1.123. 79Have a part-time job on weekdays
only 1,119 59 182 34' 484. 47 432 , 824 ' Naoe a part-time job on bothweekends and weekdayl 7,090 58 1,046 35 3,482 50 2,451 19 ,
.
i
Spend less than d hours on part- .
time job 1,136 60 157 33 474 48, 487 80Spend 5 - 10 hours on part-time .
job 3,518 60 476 35 ('- 1,538 49 1,434 8DSpend 10 - 20 hours on part-time .N .- : 4 a
. job 5,232 58 733 36 . 2,499 .50 1,936 78-Spend more than 20 hours on part- .
., . ?time job 2,444. : 55 427 c 36 '1,263 49 , 7C14 Z7'
.,. -.
.
Father's Education:0
,
.
Elementary school 2,639 56 491 '', 36 1,254 48 842 81 i
Junior secondary school 4,377 55 777 36 2,150 -48 .1,386 t 79. 4
Senior secondary school 4,495 57 728 34 2,114 50.' 1,577 79Trade or vocational training 2,258, 82 264 , 42 1,01.3 52 945 80Technical training or some , 1
.
-14 university, 2,215 62 235 37 .. 927 51, 3;630 7 0Completed university . 2,525 68 181' 33 8'67 :52 14442 82
Mother's Education:.
Elementary schoolJunior secondary schoolSenior secondary school'Trade or vocational trainingTechnical training or some
university'Completed university
1 ,8i37 58 335s 37
4,558 55 868 .
7,342 58 1,127 35
1,767 60 195. 46
2,256 63 214 , 341,560 - 67 ' 124 iw 40.
196
:8452,2123,485
786
6.;
e.'4,1V°* 661 ' 904.1006, i 78
'5011.. 2,626 9'49 757 7Z8
- '
902 ,50..
575 52 834,8182
. y
,
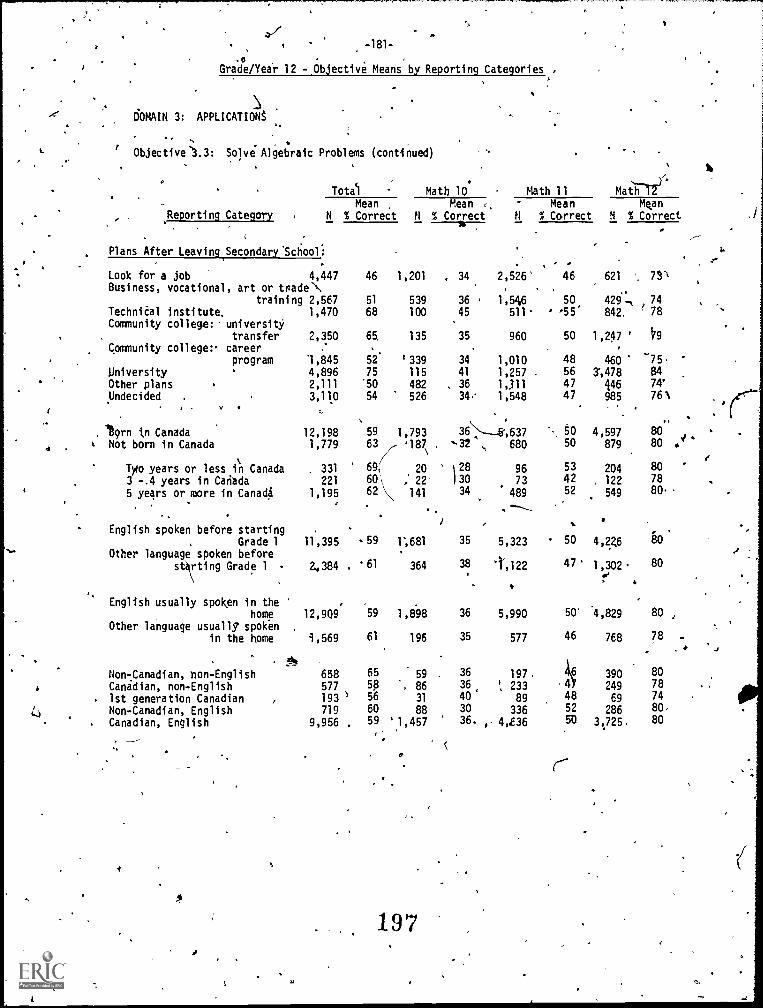
- -181-
Grade/Year 12 - Objective Means by Reporting Categories
DOMAIN 3: APPLICATIONS
.,
Objective *3.3:
Reporting
Solve'Aliebraic Problems (continued)
Category
Tota)
MeanN % Correct
Math 10' Math 11Mean - Mean
N % Correct N % Correct.
Plans After Leaving, Secondary School:
46 1,201
51 539
68 100
65, 135
52 '33975 115'50 482
54 526
Look for a job 4,447Business, vocational , art or trade\
training 2,567Technical institute. 1,470Community college:. university
transfer 2,350Community college: career
program 1,845University 4,896Other plans 2,111
Undecided . 3,110'V
torn .0 Canada 12,198 59 1,793
IRt Not born in Canada 1,779 63 '187
/Ty4o years or less in Canada . 331 6;3 -.4 years in Cariada 221 60\ ;
5 years or more in CanaO 1,195 62 \\ 141
English spoken before startingGrade 1 11,395 59 1;681
Other language spoken beforestting Grade 1
English usually spoken in the
2.384 , 61 364
home 12,909 59 1,898Other language usually spoken
in the home 1,569 61 196
Non-Canadian, non-English 658 65 59
Canadian, non-English 577 50 . 86
1st generation Canadian 193 1 56 31
Non-Canadian, English 719 60 88
Canadian, English 9,956 59 '1,457
197
"
Math T2Mean
N % Correct
34. 2,526' 46 621 . 73\,
36 1,546 50 429., 74
45 511 55' 842, 78
35 960 50 1,247 ' 69
34 1,010 48 460 -75.
41 1,257 56 3',478 8436 Lyn 47 146 74'
34.- 1,548 47 985 761
I
36;----.5,637 50 4,597 80
'-32 , 680 50 879 80
96 53 204 80
73 42 122 78
34 489 52 549 80
35 5,323 50 4,226 80
38 '1,122 47' 1,302. 80
4
36 5,990 50' 4,829 80 ,
35 577 46 768 78 .
36 197. 390 80
36 ; 233 44 249 78
40' 89 48 69 74
30 336 52 286 80.' 36. , 4,636 50 3,725, 80
O.
/6.
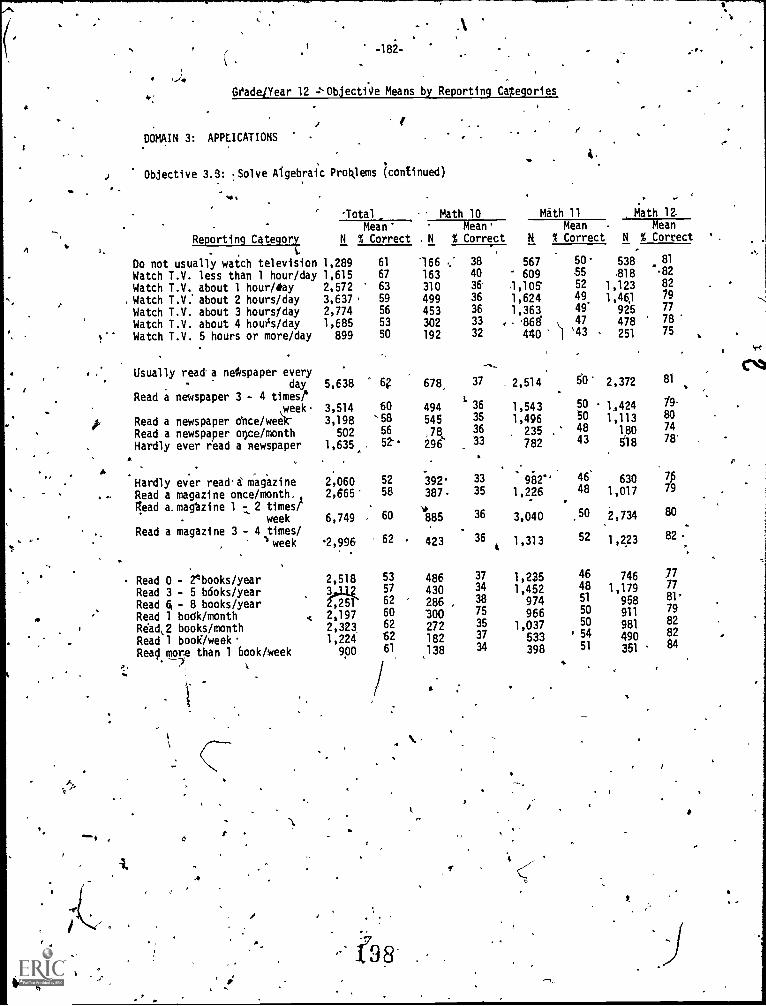
6eadelYear 12 4'ObjectiOe Means by Reporting Categories
DOMAIN 3: APPLICATIONS
Objective 3.5: Solve Algebraic Problems (continued)
....
Total
t..
Math 10 Math 11 Math 1Mean' Mean' Mean Mean
Reporting Category N % Correct . N % Correct N % Correct N.
% Correct
Do not usually watch television 1,289Watch T.V. less than 1 hour/day 1,615Watch T.V. about 1 hour/day 2,572
Watch T.V: about 2 hours/day 3,637
Watch T.V. about 3 hourslday 2,774
Watch T.V. about 4 houh/day 1,685
' Watch T.V. 5 hours or more/day 899
.5..
fr
.
Usually read a newspaper everyday 5,638
Read a newspaper 3 - 4 times/'
3,198,week- 3,514
Read a newspaper once /weekRead a newspaper once/month 502
Hardly ever read a newspaper 1,635.
Hardly ever read'a maiazine 2,060
Read a magazine once/month.i 2,665
Read a. magtzine 1 -;2 times/- week 6,749
Read a magazine 3 - 4 times/1 week 2,996
Read 0 - nooks/year 2,518
Read 3 - 5 bdoks/year 3,,71
Read 6 - 8 books/year ,251
Read 1 bodk/month 2,197
Read,2 books/month 2,323Read 1 book/week- 1,224
Read more than 1 book /week 9p0
61
67
63
59
56
53
50
'166
163
310
499453302192
' 38
40
36'
3636
3332
-.
567609
,1061,6241,363
, .868r ,
440 1
5055
52
494947
'43
538
8181,1231,461
925478
251
81
82827977
78
76
4 678 37 . 2,514 5b- 2,372 81
60
'58
494
545
36
35
1,5431,496
50
501,4241,113
79-
80
56 36 235 ,
48 180 74
. 62,78,.
296 33 782 43 518 78'
.
52 392 33 9824' 46' 630 7p
58 387 35 1,226- .
48 1,017 79
60 1(85 36 3,040 .50 2,734 80
, 62 423 36 1,313 52 1,223 82
53 486 37 1,235 46 746 77
57 430 34 1,452 48 1,179 77
62 286 , 36 974 51 958 81
60 300 75 966 50 911 79
62 272 35 1,037 50 981 82
6261
182:138
37
34533398
I 54
51490351
8284
;:9 8
a
Is
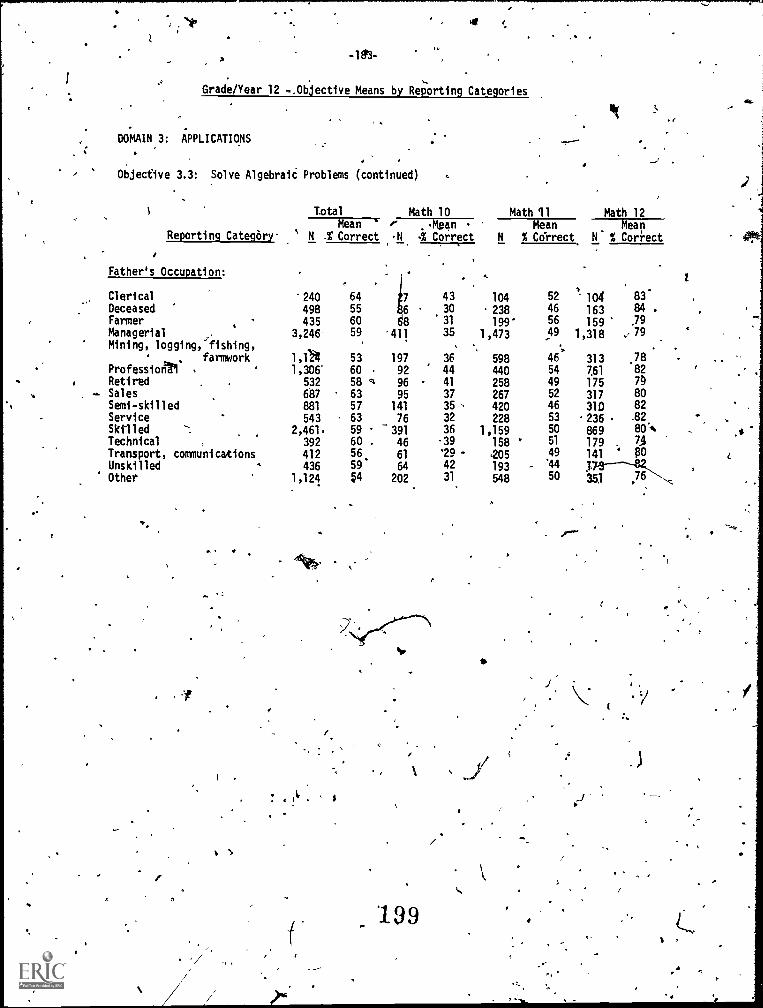
4
Grade/Year 12 -..Objective Means by Reporting Categories
DOMAIN 3: APPLICATIONS
Objective 3.3: Solve Algebraii Problems (continued)
Ma,
Reporting Category-
T.otalMean `
N I Correct
Father's Occupation:
'
.
240498435
3,246
1,11141,306'
532687881543
2,461.392412436
1,124
64556059
5360 .
58 '';6357635960565954
ClericalDeceasedFarmerManagerialMining, logging,'ffishing,
' farmworkProfessiorM ,
Retired .
SalesSemi - skilledServiceSkilled --Technical
1
Transport, comunicationsUnskilledOther
Math 10 Math 11 Math 120" Mean Mean MeanN Correct N % Correct N % Correct
.
7
6
88'411
197929695
141
39176
4661
20264
199
433031
.364441
37353236
3929 -4231
..
10423817993*
598440258267420228
1,159158.205193548
5245659
,.464594
524653505149'4450
,
11°6 43 8483
159 791,318 v 79
313 78177651 87i
317 80310 82236 . .82869 80.*179 . 7,4,
141 PO
763i5TI-N,...
I
,
\,
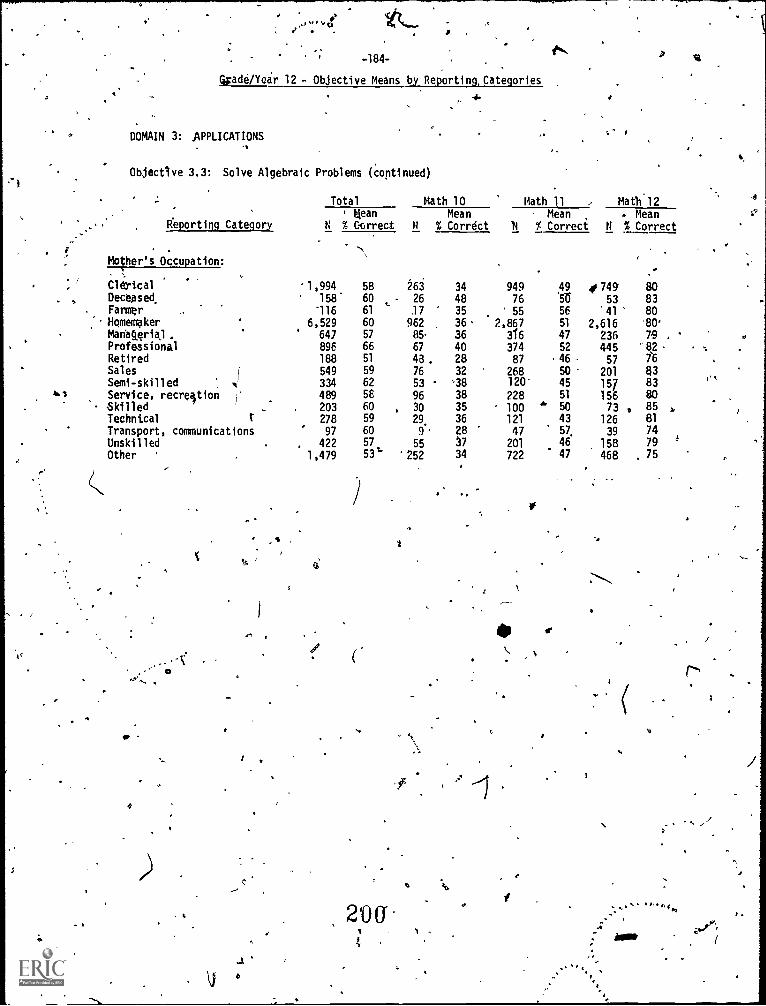
as
,- -..
; -184-
Uade/Year 12 - Objective Means by Reporting, Categories
DOMAIN 3: APPLICATIONS
Objective 3.3: Solve Algebraic Problems (Continued)
'6.
- Total Math 10 Math 11 , Math 12Kean Mean Mean . Mean
Reporting Category N % Correct 14 % Correct N % Correct N % Correct.
.
. . ..\
Mother's Occupation:
. .
Clerical '1,994 58Deceased. 158 60Farmer . '116 61
Homemaker 6,529 60Maria§erial . 647 57
Professional 896 66Retired 188 51
Sales 549 59
Semi-skilled.
334 62
Service, recreation 489 58
Skilled 203 60
Technical t 278 59
Transport, communications 97 60
Unskilled . 422 57.Other 1,479 53"
4
tA
a
t
200'
263 34 949 49 4 749 8026 48 76 511 53 8317 35 55 56 '41 80962 36 2,867 51 2,616 '80'
85 36 316 47 236 79 .
67 40 374 52 445 82
48 , 28 87 46 57 7676 32 268 50 201 4353 "36 120 45 157 83
96 38 228 51 156 80, 30 35 100
450 73 , 85
29, 36 121 43 126 81
9. 28 47 57, 39 74
55 37 201 46 158 79
252 34 722 47 468 75
*k.
V
0
I
it
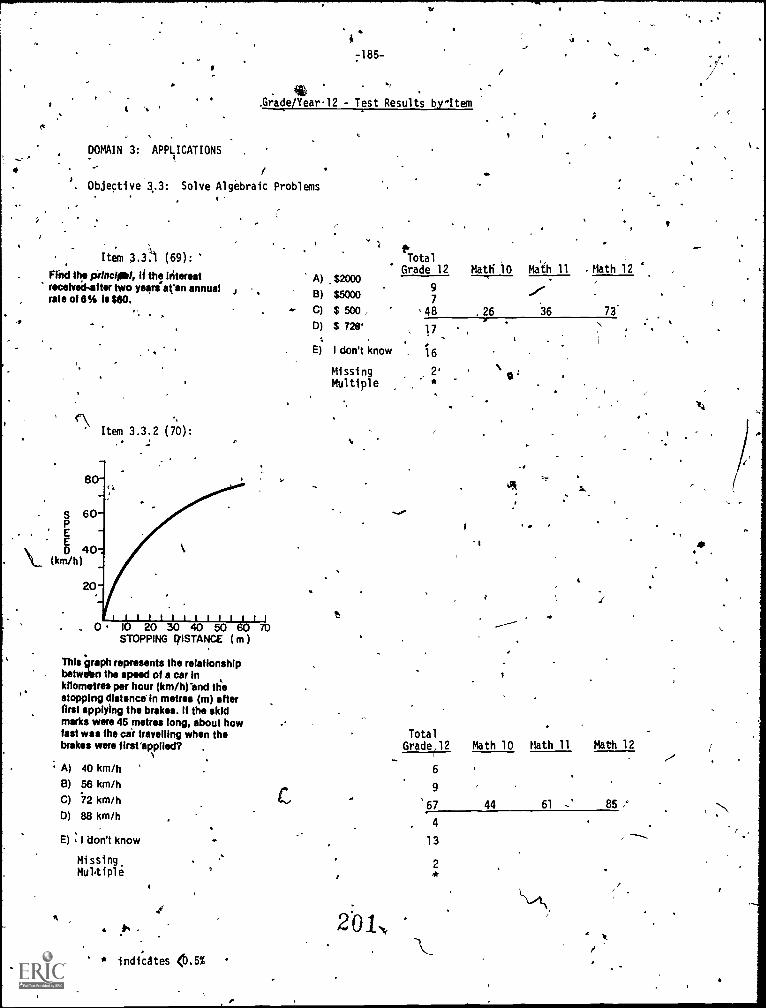
ro
I
.
-185-
.Grade/Year-12 - Test Results by-Rem. .
DOMAIN 3: APPLICATIONS
ObJective 3.3: Solve Algebraic Problems
TotalItem 3.3:1 (69): TotalFihd the Onctobt, 11 the interest Grade 12 Matti i0 Math 11 Math 12
received -after two years annual J
A) .$2000
rate of 6% Is 660. B) $5000 se'7
.., C) $ 500 , 48 . 26 36 73...
Co) $ 72fr 1 7
E) I don't know .. 1 6
Missing 2 04Multiple *
f\.\ Item 3.3.2 (70):
ilitttilititti_ 0 10 20 30 40 50 60 70
STOPPING gISTANCE (m)
f
. .
4
This graph represents the relationshipbetween the speed of a car inkilometres per hour (km /h and thestopping distance in metres (m) afterfirst applying the brakes. If the skidmarks were 45 metres long, about howfast was the car travelling when thebrakes were fIrst'applled?
A) 40 km/h
13) 56 km/hC) 72 km/hCo) 88 km/h
E) I don't know
Missinge
41
* indicites <0.5%
C
TotalGrode
(12 Math 10 Math 11 Matti 12
6
9
67 44 61 85
. 4
1 3
2
S
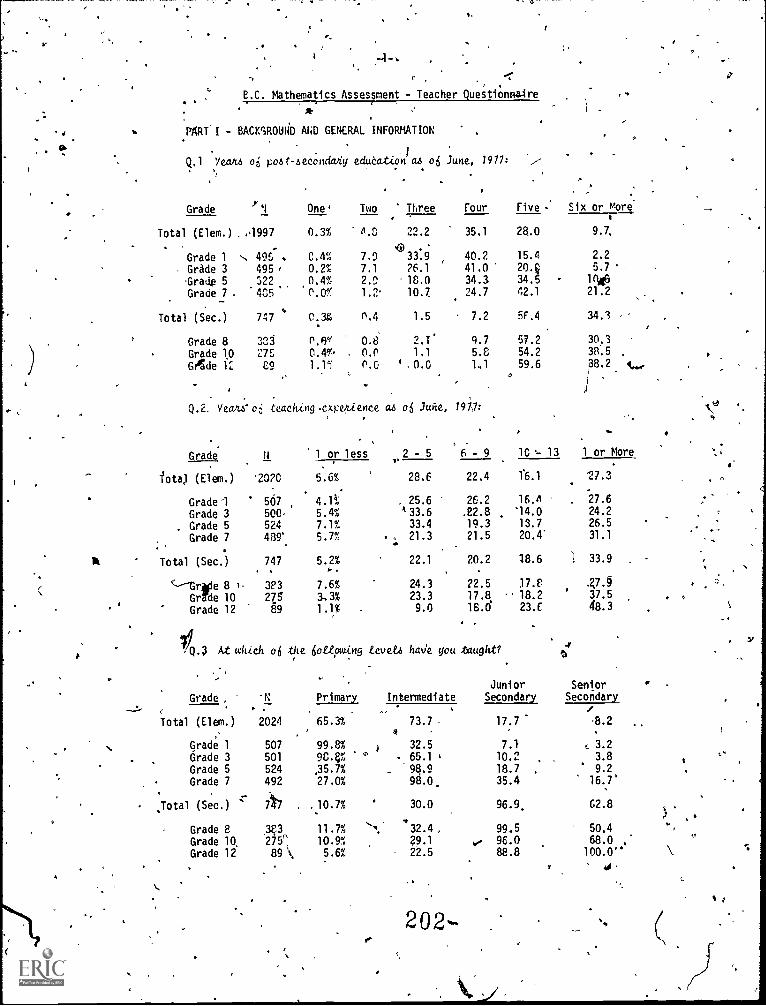
1,
,..-
' .c
a .
E.C. Mathematics Assessment - Teacher Questionnaire.
-. % PART I - BACKGROUND AND GENERAL INFORMATION
1st
4(1.1 Veane oti post-secondariy eduCation az, o6 June, 1911: ,---
. .
Grader / One. Two Three lour Five : Six or mor
.
.
7
Total (Elem.) .,1997 0.3% 4.3 22.2 35.1
6Grade 1 '. 495
.
. C.45 7.9 33. 9 40.2
Grade 3 495 , 0.2% 7.1 26.1 41.0
'Grade 5 522 0.4% 2.9 18.0 34.3
Grade 7 . '405 0.0'1, 1.2' 10.7 24.7
Total (Sec.) 747 0.3g 0.4 1.5 7.2
,
Grade 8 333 0.65' 0.8 2.T' 9.7
Grade 10 275 0.e, 0.0 1.1 5.8
GAde 12 89 1.11' 0.0 1 .0.0 1.1
Q.2. Veane"oz,: teaching.cxren,ience as 06 Juke, 1971:
. ,
Grade N 1 or less 2 - 5 6 - 9
28.0
15.420.G
34.
42.1
SEA
57.254.2
59.6
10 .- 13
1
,
9.7,
2.2
5.7
lr
21.2
34.3
30.3
38.5 .
?8.2 4,,.,
1 or More,
fotaj (Elem.) '2070 5.6% 28.6 22.4
Grade-1 507 4.1A , 25.6 26.2
Grade 3 500 5.4% 33.6 .22.8
. Grade 5 524 7.1% 33.4 19.3
Grade 7 489' 5.7% . 21.3 21.5
Total (Sec.) 747 5.2% 22.1 20.2.
(--Grille 8 1- 303 7.6% 24.3 22.5
Gr de 10 275 3.3% 23.3 17.8
Grade 12 89 1.1% 9.0 18.0
1'6.1
16.4'14.013.7
20.4'
18.6
17.818.2
23.E
27.3
27.624.226.5
31.1
33.9
,Z7.9
37.5
48.3
AVQ.3 At which o6 the liattpwing &yea have you taught?
Grade , N PrimaryA,
IntermediateJuniorSecondary
SeniorSecondary
,..2:,, /
Total (Elem.) 2024 65.3% 73.7 17.7 .8.2
4
Grade 1 507 99.8% 32.5 7.1 c 3.2
Grade 3 501 90.4% ° . 65.1 ' 10.2 3.8
Grade 5 524 ,35.7% '98.9 18.7 9.2
Grade 7 492 27.0% 98.0_ 35.4 16.7'
Total (Sec.) 4 71'7 .10.7% 30.0 96.9. 62.8
Grade 8 30, 11.7% `',.' '32.4 , 99.5 50,4
Grade 10, 275" 10.9% ?9.1 vo 96.0 68.0 ,'
Grade 12 89 cs, 5.6% 22.5 88.8 100.0"
, 4
202-
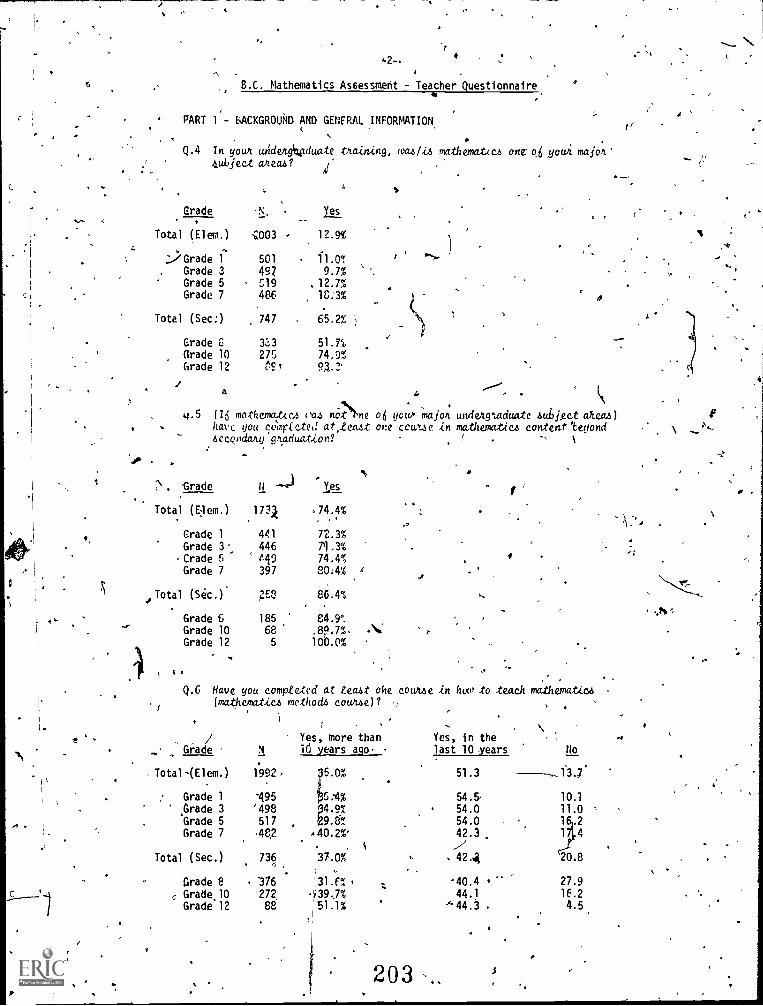
,
,2- r4
B.C. Mathematics Assessment - Teacher Questionnaire
PART 1 - bACKGROUNO AND GENERAL INFORMATION
Q.4 In your uAdenAgduate tnaining, cocusia mathematAce one o6 yours majors4uLject aneas?
C
Grade ,N,
003
41_ --
Yes
12.9%
C
Total (Elem.)
2..,Grade 1 501 11.0%Grade 3 497 9.7%
Grade 5 C15 .12.7%Grade 7 486 1C:3%
Total (Sec:) 747 . 65.2%
Grade S 3a3 51.71
(trade 10 275 74.9%
Grade 12 tEf 51.2'
/------a . , .
4.5 (16 mathematccA tvs n6Nne o6 yow' majors undengtaduate aukigce aheas), have you cd'ilIrtete(: at,teast one CCUt4C in mathematics content1eyond
sect:oda/14 paduation? ! ,.,
1
',40
-Grade
_
N
173
'Yes
,74.4%Total (Elem.)
4, Grade 1
Grade 3
441
44672.3%
71.3%
Crade 5 445 74.4% I
Grade 7 397 80:4%
Total (Set.) 2E8 86.4%
Grade t 185 84.9°,
Grade 10 68 .8p.7%.
Grade 12 5 100.0%
Q.6 Have you completed at 1 ea4t ohe couue in had to teach mathematic's(mathematic4 method4 cower?
Yes, more than Yes, in theGrade N -16 years ago last 10 years No
-Total-(Elem.) 1992, 35.0% 51.3 -f3./
Grade 1 495 5:4% 54.5 10.1
Grade 3 '498 .9% 54.0 11.0
Grade 5 517 9.6% 54.0 1 .2
Grade 7 ,48.2 40.2% 42.3 1 4
Total (Sec.) 736 37.0% 42.4 20.8
Grade 8 "376 ;31.F% '40.4 27.9
C Grade 10 272, 39,7% 44.1 16.2
Grade 12 88 51.1% " 44.3 4.5
203
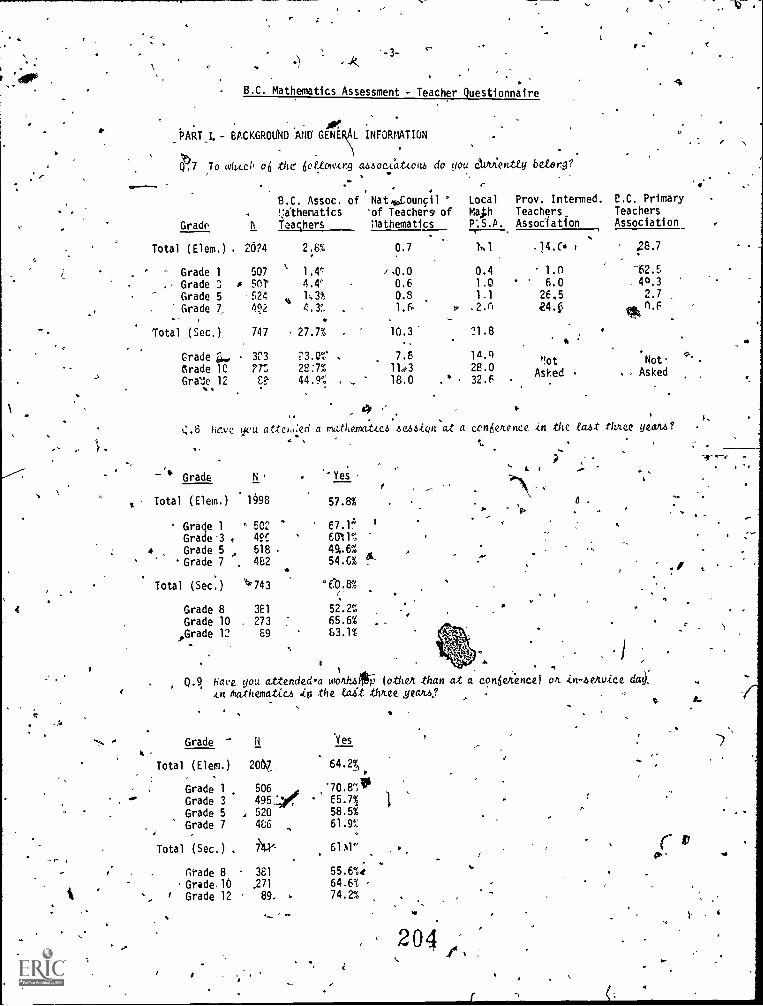
4
t
'-3--
B.C. Mathematics Assessment - Teacher Questionnaire
Ale,
I.PART I - BACKGROUND ANY GENE L INFORMATION
1P7 To wh4ch ofl the ketotarg cwoceatou4 do you 84/vienzty betarg?
Grade N
2624
507
SOT-524492
747
3C3
2Tt
C.?-
B.C. Assoc. ofrdthematics
feacherS
. .
Nat.%Council °
of Teachers ofMathematics
LocalMa,th
Prov. Intermed.TeachersAssociation
C.C. PrimaryTeachersAssociation
Total (Elem.) .
Grade 1
Grade 3 I
Grade 5Grade 7,
Total (Sec.)
GradeGrade 1CGrate 12
2.8%
1.4°'
4.4'
1.3%
, 27.7%
P3.022:7%
44.9%
0.7
/,0.0
0.6
0.8
10.3
7.8
11a3
18.0
r
0.41.0
1.1
.2.n
21.8
14.928.0
32.6
.14.6d
1.06.026.5244
t
'!cit
Asked
/ 28.7
-62.549.3
2.7
Ak0.6
Not'- Asked
"
Q.8 tlave yeti attch.:ed a mathemat4e4 easion at a con6enence in .the &At three yeau?
Grade N
Total (Elem.) 1998
Grade 1 ' 502
Gradel t 4SC
Grade 5 518 .
'Grade 7 452
Total (Sec.) '°743
Grade 8Grade 10Grade 12
, Q.9
3E1
273
89
w
Ye;
57.8%
87.e80'11%
49..6%
54.6%
"Cb.8%
52.2%65.6%53.1%
1
Have you attended.a uonh6447.) (othen than at a conSetence) on .in-zertvice da4,
in MathematZu ip the tait .three geat? -
a .
Grade - N
2061,
'Yes
64.4Total (Elem.)
Grade 1 506 '70.01Grade 3 495' 85.7%
Grade 5 , 520 58.5%
Grade 7 466 61.9t
Total (Sec.) .61x1"
Grade 8 381 55.6%4
-Grade.16 .271 64.6%
Grade 12 89. 74.2%
'
1
204
r
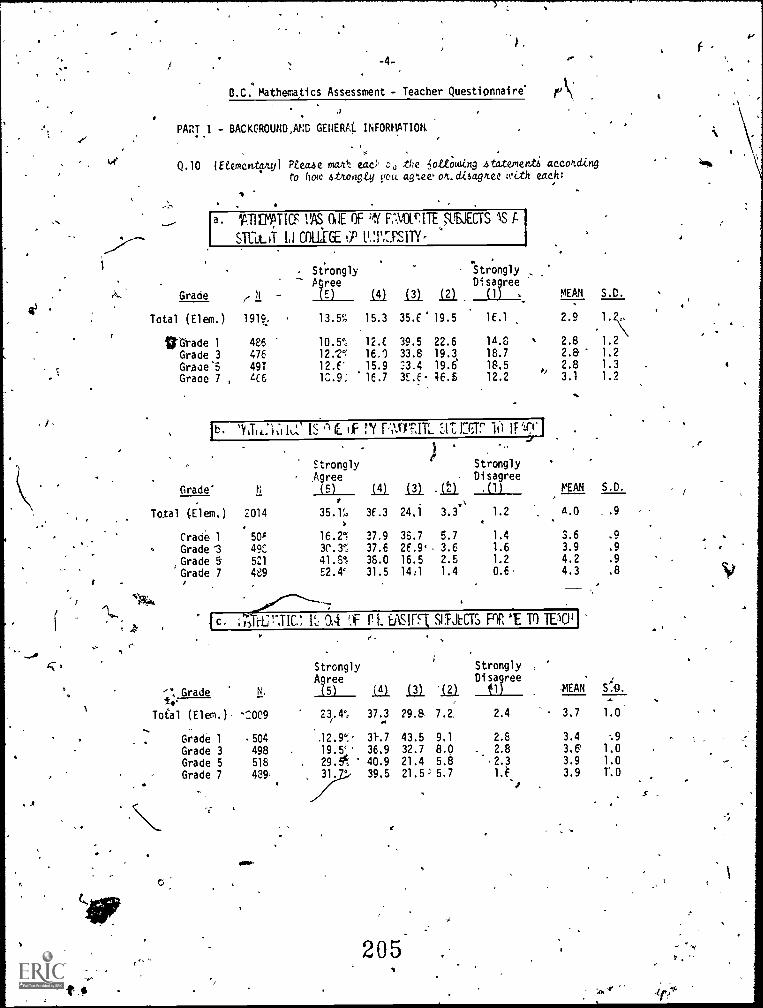
..
-4-'
PART
Q.10
I -
lEtementyuf1
B.C. Mathematics Assessment - Teacher Questionnaire'
accondingeach:
BACKCROUND.AND GENERAL INFORMATION
Peectae mcal: eacl' o the ,olloaLing .statertentito how attongEy vett agtee. on. claagnee with
a. wriUPTICF ME OF "Y F-,VOLT ITE REJECTS
grit. IT L I COLLEGE G' 1.1.1IV:PSITY
.Strongly Stronglyi4ree Disagree
Grade / n (E) L41 La in (1) . MEP.N S.D.
Total (Elem.)
trgrade 1
1919: ' 13.5% 15.3 35.6' 19.5 16.1
486 10.5', 12.6 39.5 22.6 14.6
2.9
2.8
1.2
1.2Grade 3 476 12.2% 16.0 33.8 19.3 18.7 2.8," 1.2Grade'5 49T 12.6" 15.9 33.4 19.8 18.5 2.8 1.3Grade 7 , 466 18.9. 16.7 36.6- 46.5 12.2 ''' 3.1 1.2
ri
A
.02
lb. ItTir.:1,-1 ') tE If rY l'aVCIFITL 1:Clr it) If 'ICI'
StronglyAgree -
StronglyDisagree
Grade' ti 15) In L3.1 .111 (1) MEAN S.D.
Total (Elem.) 2014 35.1',. 36.3 24.1 3.3. 1.2 4.0 , .9
Crade 1 50% 16.2% 37.9 38.7 5.7 1.4 3.6 .9Grade 3 49C 3('.3% 37.6 26 .9 - 3.6 1.6 3.9 .9Grade 5 521 41.6% 38.0 16.5 2.5 1.2 4.2 .9Grade 7 489 52.4' 31.5 14:1 1.4 0.6 4.3 .8
Grade N.
Total (Elem.) "2009
Grade 1 504Grade 3 498Grade 5 518Grade 7 489,
o4 N. b\SIFFI SI EJECTS 'E TO 1E10,1
StronglyAgree(5) La23.4'. 37.3
.12.9%. 31.719.5' 36.929.5(.. 40.931. 39.5
StronglyDisagree
,
.L3./ '(2) 41) MEAN S.^...
29.8 7.2. 2.4 3.7 1.0
43.5 9.1 2.8 3.4 932.7 8.0 . 2.8 3.8 1.021.4 5.8 .2.3 3.9 1.021.5.= 5.7 1.t 3.9 T.0
'',
205 .
S
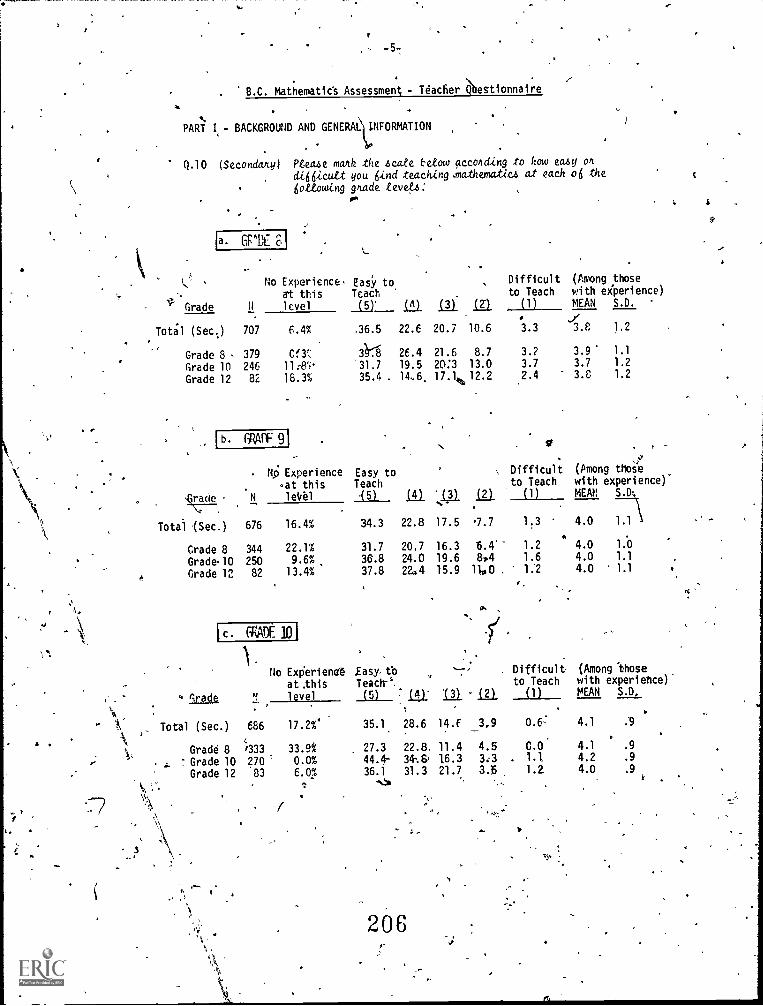
-5-
B.C. Mathematic's Assessment - Tdader 4estionnaire
PART I - BACKGROUND AND GENERALVNFORMATION
.
Q.10 (Secondary! Maze maniz .the acate betow acconding to how eaay Ohdi66Clat you 6.ind teaching .mathematics at each o6 the
ialowing grade teve4:
L' ' No Experience. Easy to Difficult (Among those
at this Teach to Teach with experience)
Grade N level (5) (A) (3). (2 w (1) MEAN S.D.
Tot;1 (Sec.) 707 6.4% .36.5 22.6 20.7 10.6 3.3 J.P. 1.2
Grade 8 379 Cfr. 3k1 26.4 21.6 8.7 3.1 3.9 1.1
Grade 10 246 11:87 '31.7 19.5 20-.1 13.0 3.7 3.7 1.2
Grade 12 82 18.3% 35.4 14,6, 17.1 12 2 2.4 3.8 1.2
ib. 91
'
6R414:t
r
Ns; Experience Easy toat this Teach
,race . N letrel AIL AL IA (2)
Total -(Sec.) 676 16.4% 34.3 22.8 17.5 7.7
Grade 8 344 22.1% 31.7 20.7 16.3 15.4''
Grade10 250 9.6% 3G.8 24.0 19.6 8,4
Grade 12 82 13.4% 37.8 22.4 15.9 11..0 .
c . (*DE
sr.
Difficult (Among thos.e
to Teach with experience)(1) MEAN L
1.3 4.0 1.1 \
1.2 4.0 1,0
1.6 4.0 1.1
1.2 4.0 1.1
g Grade
Total (Sec.)
No Experiena Easy tb Difficult (Among 'those
at .this Teach"' to Teach with experience)
level (5) IA): La (1) MEAN S.D,
686 17.2% 35.1 28.6 14.f __3,9 0.6: 4.1 .9
Grade 8 4/333 33.9% 27.3 22.8. 11.4 4.5 C.0 4.1 .9
Grade 10 270 ' 0.0% 44.4- 34.S, 16.3 3:3 1.1 4.2 .9
Grade 12 '83 6.0%. 36.1 31.3 21.7 3.6 1.2 4.0 .9
-g.s
206t.
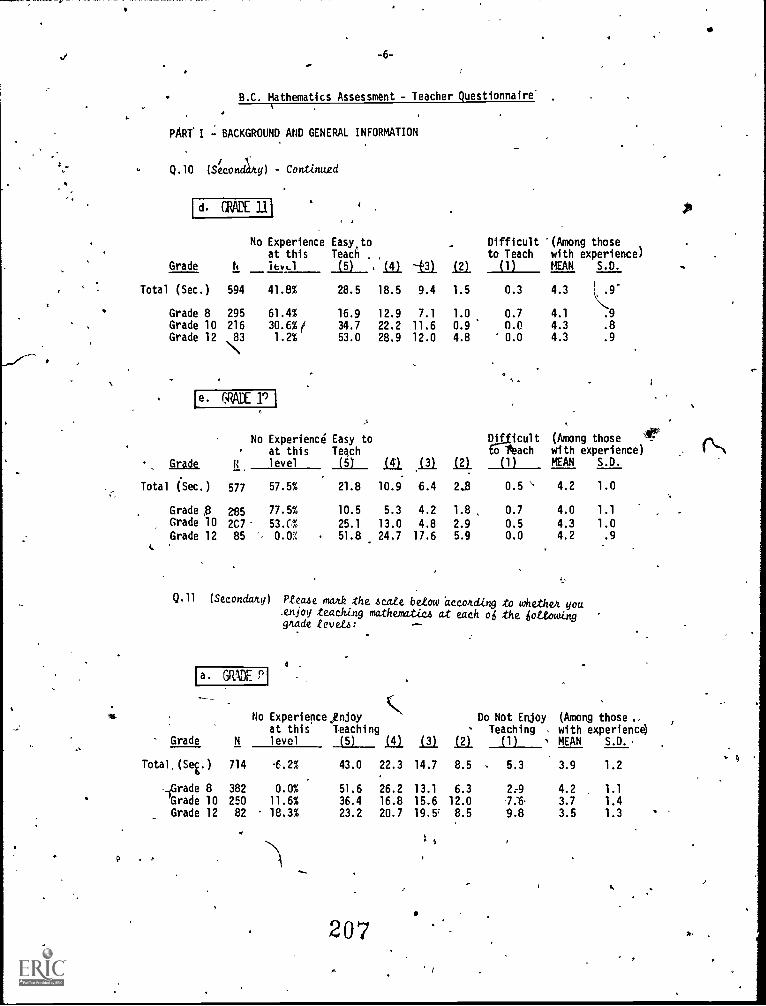
Id. GRADE ll 1
-6-
B.C. Mathematics Assessment - Teacher Questionnaire'
PART I BACKGROUND AND GENERAL INFORMATION
Q.10 (Seconly) - Continued
No Experience Easy,toat this Teach .
Difficult (Among thoseto Teach with experience)
Grade h lteLl (5) u -3) 121 (1) MEAN S.D.
Total (Sec.) 594 41.8% 28.5 18.5 9.4 1.5 0.3 4.3
Grade 8 295 61.4% 16.9 12.9 7.1 1.0 0.7 4.1 .9
Grade 10 216 30.6% ( 34.7 22.2 11.6 0.9 0.0 4.3 .8
Grade 12 83 1.2% 53.0 28.9 12.0 4.8 0.0 4.3 .9
Easy toTeach
DifficulttO /each
(Among those 11.1r
with experience)
le. RADE 11 I
No Experienceat this
auk level (5) LI/ 4211-2):
(1) MEAN S.D.
Total (Sec.) 577 57.5% 21.8 10.9 6.4 2.8 0.5 ` 4.2 1.0
Grade .8 285 77.5% 10.5 5.3 4.2 1.8 , 0.7 4.0 1.1
Grade 10 2C7- 53.C% 25.1 13.0 4.8 2.9 0.5 4.3 1.0
Grade 12 85 - 0.(r 51.8 24.7 17.6 5.9 0.0 4.2 .9
Q.11 (Secondary) Ptease mach the ecate betow according to whethe4 you_enjoy teaching mathematics at each oi the 6a2tominggrade teveLs:
a. GRADE
No Experienceynjoyat this Teaching
Grade N level (5) ka
Do NOt Enjoy (Among those -Teaching with experience
La (1) MEAN S.D.
Total,(Sei.) 714 -6.2% 43.0 22.3 14.7 8.5 5.3 3.9 1.2
_,Grade 8 382 0.0% 51.6 26.2 13.1 6.3 2,9 4.2 1.1
Grade 10 250 11.6% 36.4 16.8 15.6 12.0 3.7 1.4Grade 12 82 18.3% 23.2 20.7 19.5' 8.5 9.8 3.5 1.3
207
;,
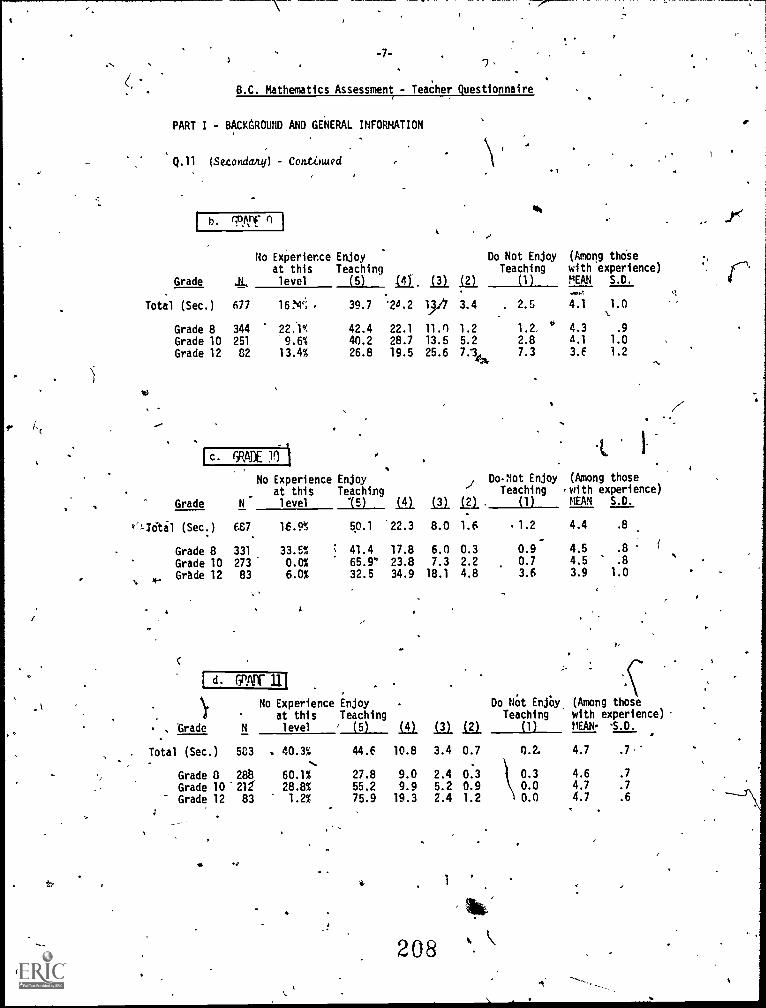
r
4-7-
7,
8.C. Mathematics Assessment - Teacher Questionnaire
PART I - 8ACK8ROUND AND GENERAL INFORMATION
Q.11 (Secondary) - Cemanued1
h. TPA- n
No Experience Enjoy Do Not Enjoy (Among those
at this Teaching Teaching with experience)
Grade IL, level
Total (Sec.) 677 IVA'',
Grade 8 344 22.1%Grade 10 251 9.6%Grade 12 82 13.4%
lc. GRADE )0 1
(5) Sia In M39.7 '24.2 9i7 3.4
42.4 22.1 ii.n 1.2
40.2 28.7 13.5 5.2
26.8 19.5 25.6 7.1ex
(1) MEAN S.D.....,
. 2.5 4.1 1.0
1.2. l' 4.3 .9
2.8 4.1 1.0
7.3 3.E 1.2
1
No Experience Enjoy I Do.Not Enjoy (Among those
at this Teaching Teaching with experience)
Grade N- level 15) 1.41 i31 121. (1) MEAN S.D.
v'17citi1 (Sec.) 667 16.95 50.1 '22.3 8.0 1.6 , 1.2 4.4 .8
Grade 8 331 33.5% ; 41.4 17.8 6.0 0.3 0.9 4.5 .8
Grade 10 273 0.0% 65.9° 23.8 7.3 2.2 0.7 4.5 .8
4-s.
Grade 12 83 6.0% 32.5 34.9 18.1 4.8 3.6 3.9 1.0-
C
EnjoyTeaching
. Do Not EnJOy
Teaching
1d. GRAT 111
.
No Experienceat this
, trade N level ' (5) 151 1.41 1.21 (1)
Total (Sec.) 583 . 40.3% 44.6 10.8 3.4 0.7 0.2.
... .
Grade 8 2818 60.1% 27.8 9.0 2.4 0.3 0.3
Grade 10 217 28.8% 55.2 9.9 5.2 0.9 0.0
Grade 12 83 1.2% 75.9 19.3 2.4 1.2 0.0
4
1/4
208
(Among those
(
with experience)MEAN. -S.D.
4.7 .7,"
4.6 .7
4.7 .7
4.7 .6
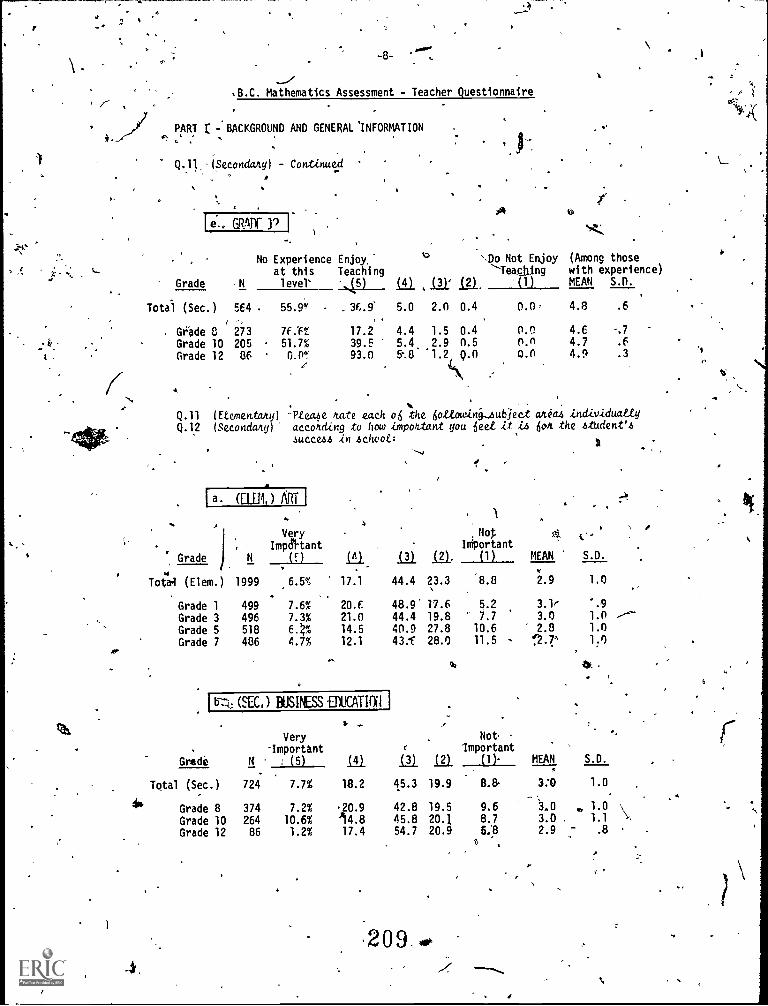
15--4: (SEC.) 13USINESS -ED UCATIal I
ar-
I
2.4.*
. .
(
0.
-8_ --".
B.C. Mathematics Assessment - Teacher Questionnaire
PART r -BACKGROUND AND GENERAL INFORMATION
Q.11 (Secondany) - Continued
$1
Grade N
564
273
20586
No Experience Enjoy,'at this Teachinglevel' '45) (4)
12. 'Do Not Enjoy (Among those
''''Teac ng with experience)
j Ill 1MEAN S.D.
Total (Sec.)
Gi.ade 8
Grade 10Grade 12
. 55.9"
7f.'f
51.7%0.0°:'
- ,3C.9'
17.239.593.0
5.0
4.45.458
,
2.0 0.4 0.0,
1.5 0.4 0.02.9 0.5 0.n'1.2 9.0 0.0
4\
4.8
4.64.74.9
.6
-.7
.F
.3
.
Q.11 (Etementany). -Piea4e rate each the 4ottowini.6ubjeCt individuatty
Q.12 (Secondary) aceonding to how .important you ieet U ,1.4 lion the 4tUdent'4
succeze in aehoot:
I a. (apt) ART
4.*. A
Very)6
Grade N (F) laImpdhant
Total (Elem.) 1999 6.5*; 17.1
Grade 1 499 7.6% 20.6
Grade 3 496 7.3% 21.0
Grade 5 518 6.2% 14.5
Grade 7 486 4.7% 12.1
Very-Important
4,*
Gredi Ft
724
37426486
. (5) iil
18.2
.20.9
14.817.4
Total (Sec.)
Grade 8Grade 10Grade 12
7.7%
7.2%
10.6%1.2%
.
' I,Not x*?x
I % et.,
IMportant(3) (1) MEAN S.D.
44.4
_(.21.
23.3 '8.8 2.9 1.0
48.9 17.6 5.2 3.1/ ".9
44.4 19.8 7.7 3.0 1.0 ---40.9 27.8 10.6 2.8 1.0
43. 28.0 11.5 f2.7.-" 1:0
e
(3)
,
.
L21
Not-
Important(1) MEAN S.D.
45.3 19.9 8.8, 3:0 1.0,
42.8 19.5 9.6 0 . 1 .?45.8 20.1 8.7 3.0 ,
54.7 20.9 L 2.9 .8
s
,2O9
6
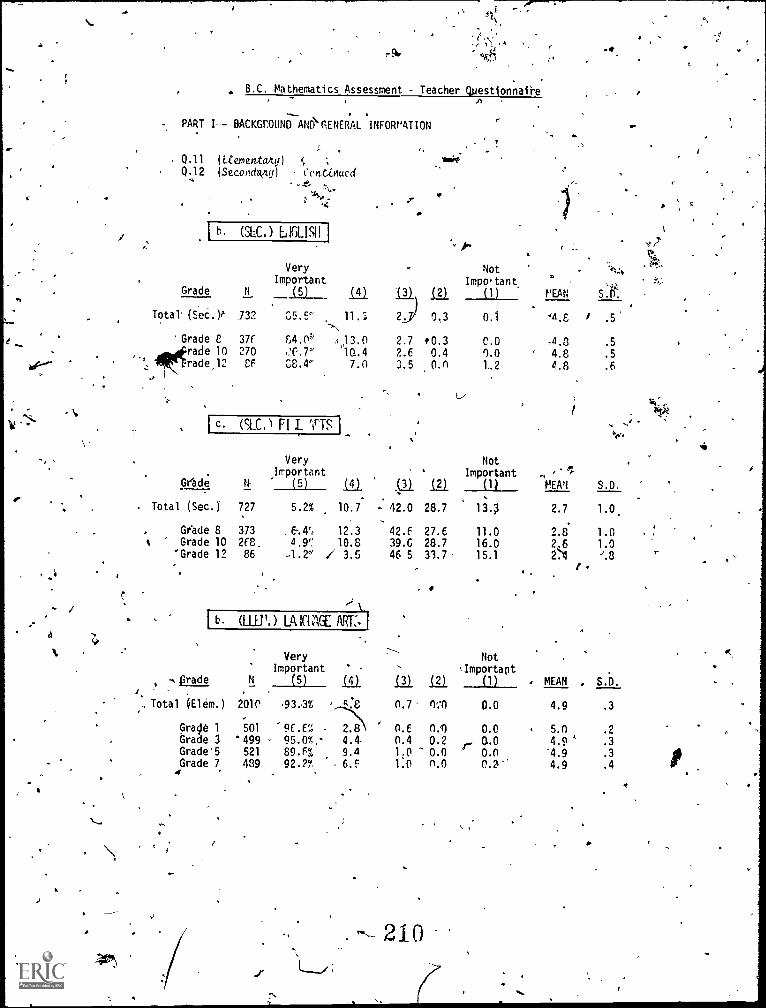
a
.r
9h, *si4
B.C. Mathematics Assessment - Teacher QmestionnaqeA
PART I-- BACKGPOUND AND-GENERAL INFORMATION
Q.11 (Ltementany)Q.12 (Secondetny) Continua
b. (SLC,) LIGLISII
Grade
Total. (Sec.)/
Grade Erade 10rade,12
F.
VeryImportant
.
U (5) (4) '(3) (2)
732 35.E' 11.; 2 0,3
37( 84.0" 13.0 2.7 t0.3270 .26.7' °K1.4 2.6 0.4E6 CE.4' 7.0 3.5 o.n
I c. (SE.) Fl L TTS
Grade 4
727
373
2E8,
86
VeryImportant
(5) (4)
. Total (Sec.)
, Grade 8t Grade 10
'Grade 12
5.2%
. 6.4'.0
4.9°:
-1.2" /
10.7'
12.3
10.83.5
1 b. (LW'.) L4 ICI AT ART:, I
4
NotImportant
(1) MEAN
ti
44,4
5.K.
0.1 '4.8 I .5
C.0 4.8 .5
0.0 4.8 .5
1.2 4.8 .6
Le'
Not' Important
Pi ta (11 MEAN S.D.
- 42.0 28.7
42.6 27.639.G 28.7
46 5 33.7.
Very,---,
Important ' -
0 '''L.14f N (5) (4) La (2)
Total (Elem.) 2010 .93,3% c..8 0.7 11,..n
Grape 1 501 -9(.6% - 2.8 0.6 n.nGrade 3 '499 - 95.0%,' 4.4 0.4 0.2Grade'5 521 89.E 9.4 1.0 0.0Grade 7 489 92.2Y. . 6.f 1.0 n.0
0
4
. 210
13.3 2.7 1.0.
11.0 2.8 1.016.0 2.6 1.015.1 2' ,'.8
1.
Not'Important
(1) . MEAN . S.D.
0.0 4.9 .3
0.0 5.0 .2
a.o 4.9 ' .3
0.0 '4.9 .3
0.2 4.9 .4 111
0
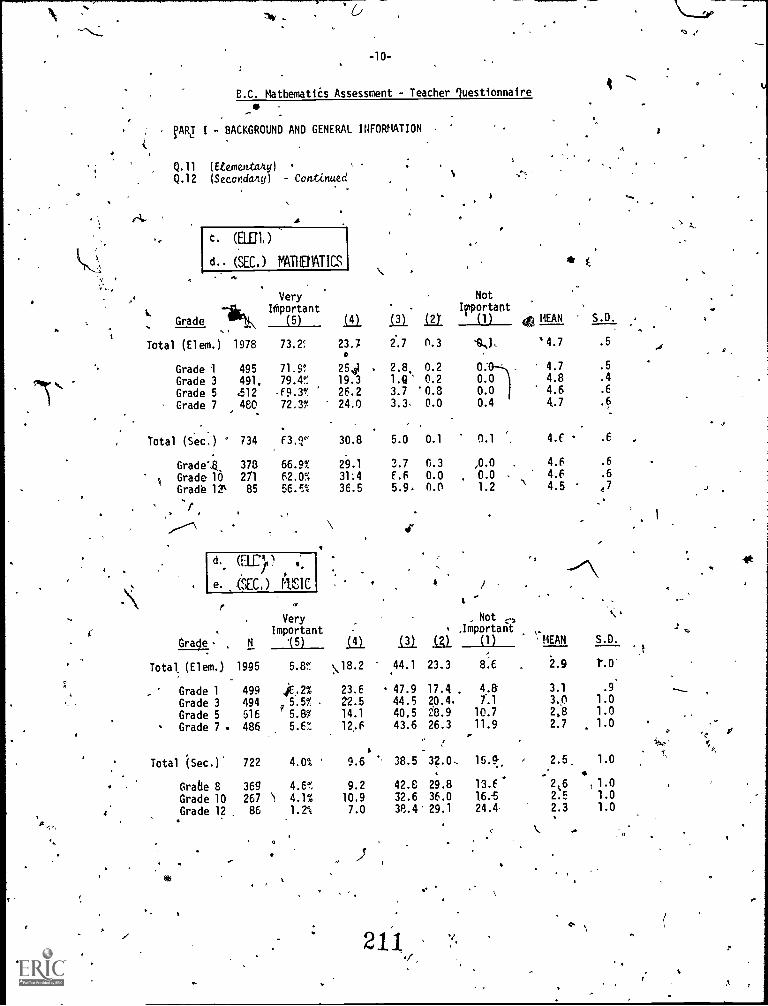
-10-
B.C. Mathematics Assessment - Teacher questionnaire
V1RJ I - BACKGROUND AND GENERAL INFORMATION
Q.11 (Ctementany) ,
Q.12 (Secondany) - Continued
c. (El_n)
d.. (SEC.) MATHEflATICS
Very
;,.
GradeliMportant
(5) La
Total (Elem.) 1978 73.2; 23.7O
Grade 1 495 71.9 2541
Grade 5 12 .69.3% 26.2Grade 3 491, 79.4% 19.3
.5
Grade 7 480 72.3% 24.0
.
Total (Sec.) ' 734 f3.2" 30.8
Grade',EL 378 66.9% 29.1
iGrade-10 211 62.0% 31:4
Grade 12' 85 56.5% 36.5
f
d. C1171 1
e. ,(SEC.) IIJSIC
Grade , N
VeryImportant
15) LaTotal (Elem.) 1995 5.8% ,.18.2
Grade 1 499 .A.2% 23.6
Grade 3 494 . 5.5% 22.5
Grade 5 516 r 5.&% 14.1
Grade 7 486 5.6". 12.6
Total (Sec.)' 722 4,0% 9.6
4 , Grade 8 369 4.6% 9.2
Grade 10 267 ' 4.1% 10.9
4. Grade 12 86
o
1.2% 7.0
Not. Irportapt
ill 121 (1) MEAN
2,7 0.3 11,), '4.7
2,8. 0.2 2:(1
4.8, 4.7
3.7 '0.8 0.01.Q' 0.2
4.6
3.3. 0.0 0.4 4.7
,
5.0 0.1 0.1 4.( -
3.7 0.3 ,0.0 4.6
6.6 0.0 , 0.0 . 4.6
5.9. n.o 1.2 ` 4.5 -
,r
Not ,,important
La.44.1 23.3
47.9 17.4 .
44.5 20.4.
40,5 28.9
43.6 26.3
4.a1.1
10.7
11.9
(1) MEAN
8.6 2.9
3.1
3.02,8
2.7
38.5 32.0 15.9
42.8 29.8 1-3.6
32.6 36.0 16.538.4' 29.1 24.4
2 11%y,
S.D. ,-
.5
.4
.5
.6
.6
,
.6 ,
.6
.6
,7
S.D.
r.o
.9
1.01.01.0
2.5, 1.0
2,6 11.02.5 1.0
2.3 1.0
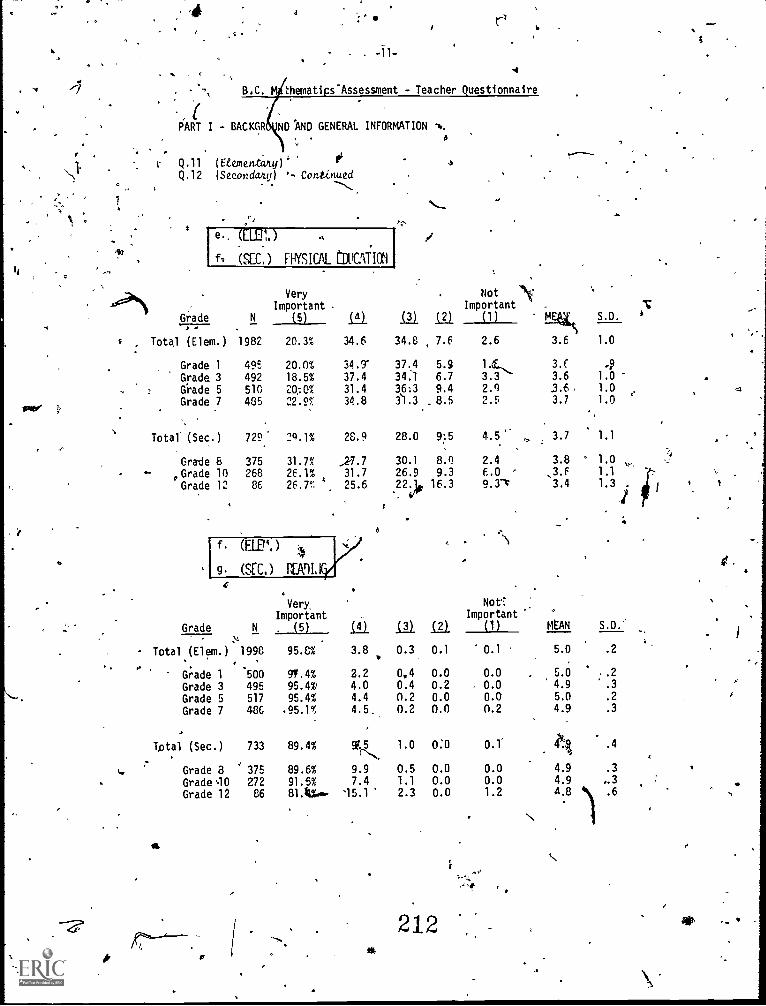
4 a
4
B.C. thematips-Assessment - Teacher Questionnaire
PART I - BACKGR ND AND GENERAL INFORMATION N.
Q.11
Q.12(6EementUrty)h
(Secondary) '- Continued
a
e., (UR.) .
fi (SEC]) WYSICAL EDUCATION
6N
Very
Important .
Grade-7--..7---
N (5) Eli 13) 12/.
, Total (Elem.) 1982 20.3% 34.6 34.8 7.6
Grade 1 495 20.0% 34.9' 37.4 5.9
Grade 3 492 18.5% 37.4 34:1 6.7
Grade 5 510 20:0% 31.4 36:3 9.4
Grade 7 435 22.9% 34.8 3`I.3 . 8.5
Total (Sec.) 729' 20.1% 28.9 28.0 95
Grade 8 375 31.71 ,27.7 30.1 8.0
,Grade 10 268 26.1%A
31.7 26.9 9.3
Grade 12 86 26.7', 25.6 221, 16.3
f. (E12%) 4
g. (SCC.) PEADIJ
VeryImportant
Grade N.
(5) 'Si/In
N .
Total (Elem.) 1998 95.8% 3.8 0.3 0.1
. .
Grade 1 500 9Y.4% 2.2 0,4 0.0
Grade 3 495 95.4 %' 4.0 0.4 0.2
Grade 5 517 95.4% 4.4 0.2 0.0
Grade 7 486 .95.1% 4.5. 0.2 0.0
Total (Sec.) 733 89.4% 995 1.0 0:0
Grade 3 375 89.6% 9.9 0.5 0.0
Grade 10 272 91.5% 7.4 1.1 0.0
Grade 12 86 81.11%ah. '15.1 2.3 0.0
*a
V
NotImportant
(1) S.D.
1;*
2,6 3.6 1.0
1.C.,
3.3 ---
3.0
3.6
41.0
2.0 3.6= 1.0
2.5 3.7 1.0 '
3.7 1.1
2.4 3.8 ° 1.0
6.0 1:;
9.3-v
,3.63.4 1
di
NotImportant
(1) MEAN S.D.'
0.1 5.0 .2
0.0 5.0 ,.2
0.0 4.9 '.30.0 5.0 .2
0.2 4.9 .3
0.1W .4
0.0 4.9 .3
0.0 4.9 ..3
1.2 4.8 1 .6
212 *,
I
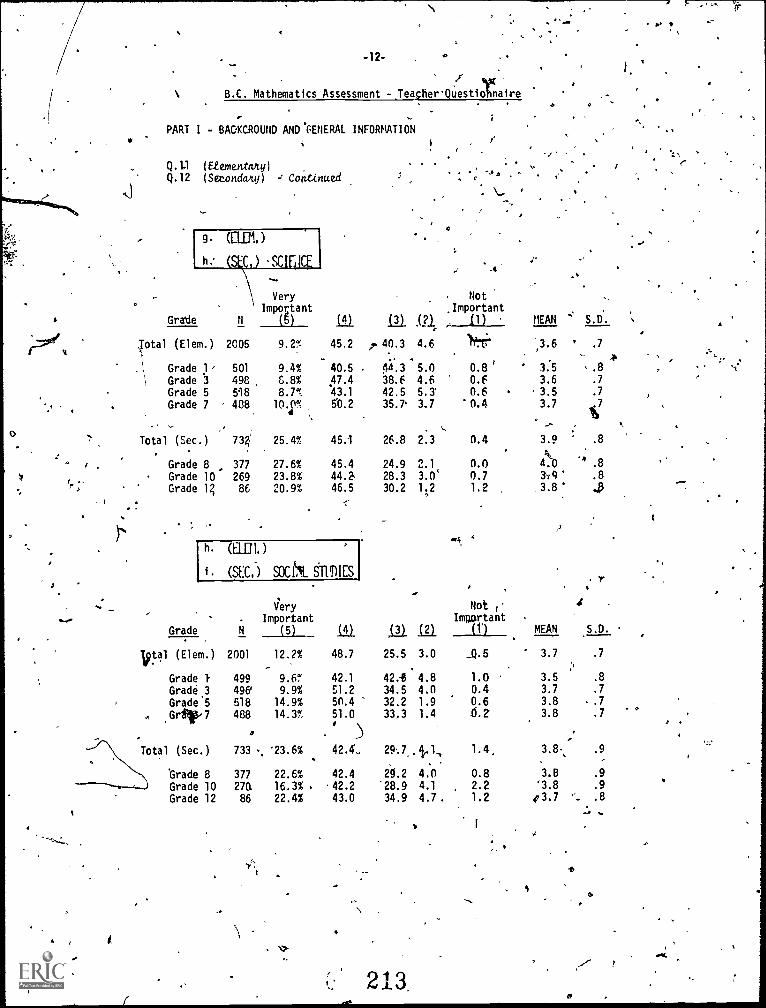
B.C. Mathematics Assessment -TeacherQuestianaire
PART I - BAOKGROUND ANDFENERAL INFORMATION
Q.11 (Etementaity)
Q.12 (Setondany) Continued
VeryImportant
Not,Important
. Grade N (g) iil Ill (21 11)
,Total (Elem.) 2005 9.2"! 45.2 7 40.3 4.6 )11..T.
.1
t
Grade 1, 501 9.4% 40.5 44.3 5.0 0.8`Grade 3 498 6.8% 38.6 4.6 0.F
' Grade 5 518 8.7w,
.47.4
43.1 42.5 5.3' 0.6
'.' .. Grade 7 488 10.0%
4, 50.2 35.7 3.7 '0.4'
oTotal
...,
(Sec.) 732' 25.4% 45.1 26.8 2.3 0.4
..,
/ , Grade 8 377 27.6% 45.4 24.9 2.1 0.0
Grade 10 269 23.8% 44.2, 28.3 3.0' 0.7
Grade 1 86 20.9% 46.5 30.2 1;2 1.2
o
,
h. (l nn.)
(SEC.) SOCtAL SIUDIES
VeryImportant
Grade N (5)
iptal (Elem.)
Grade }Grade 3Grade 5Grlip,7
2001 12.2%
499-
9.6".
496? 9.9%
518 14.9%
488 14.3%
0
otal (Sec.) 733 % '23.6%
Grade 8 377 22.6%
Grade 10 270, 16.3% .
Grade 12 86 22.4%
_At
,
Not TImportant
ill 111 1,21
48.7 25.5 3.0
_01_O.5
,
42.1 42.4 4.8 1.0 '
51.2 34.5 4.0 0.450.4 ' 32.2 1.9 0.651.0 33.3 1.4 6.2f
T 42.4_ 29..7,.,i,l, 1.4,
42.4 29.2 4.0 0.8.42.2 '28.9 4.1 2.2
43.0 34.9 4.7 . 1.2
213
.
MEAN SD.
.7,3.6
3.5 .8* ,
,
3.6 .7
3.5 .7
.
3.7 .7
3.9 .8
4.k0 -4 .8
3t4* .8
,3.8* hp
. r
4
MEAN S.D
3.7 .7
3.5 .8
3.7 .7
3.8 .7
3.8 .7
..
.
r.3.8. .9
3.B .9
'3.8 .9
473.7
a
O
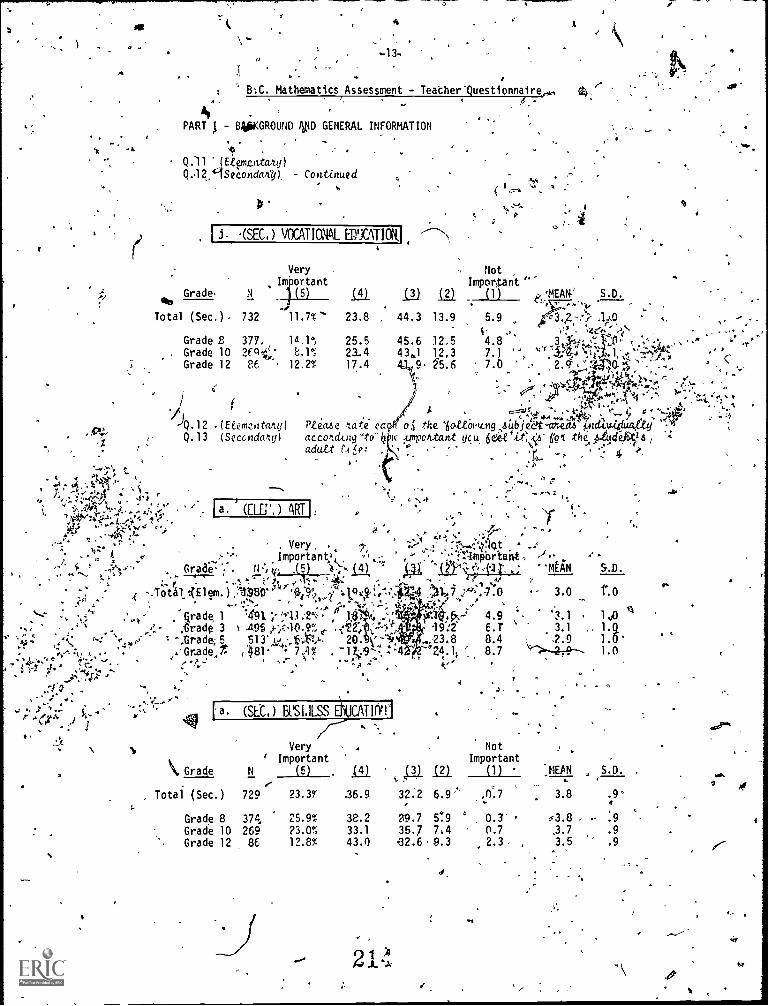
Olt
1:1
4
-13-
-8:C. Mathematics Assessment - Teather-Questionnaire,,,e.
A
PART - BOKGROUND OD GENERAL INFORMATION
Q.11 (Etpnenzan.y)2 (9Seconcliv77l, - Continued
I
Grade,ftw
Total (Sec.)
Grade .8Grade 10Grade 12
377. la.1% 25.5260.: 8.1% 21.4et 12.2% 17.4
(SEC.) VOCATIONAL EDTATI04,1
VeryImportant
N 5 (4)
732 11.7%"- 23.8
Not ,
Imporant(3) (2) (1) e:MEAN' S.D.
44.3 13.9
45.6 12.543,1 12,3
9. 15.6
5.9- de
4.8 ,(1
7.1 :-.;.-11/*;7.b rerpo ./ 2 .7,-,
1:7:41111.4i4X)
4
T
-
I)Q.12 (Eicmenttuy)
Q.13 (SeccndaPc
? 4101i."" '"e
i.41
P4ease tate eaaccoPutolgadutt C.
ra (ELLI'. ) ART I
. Very ,Important',
Grad 11.;ti.; (,.;)
t(Elem. ) .:1.15(130 " .9;9% - 3.0 to
e,o the lottoto.c.ng itb j edt cveaacdZw4fucfyt.
:linp0 Arta Yirt ytti 6Qt the Ad.
..r
2. tss
e
47". - ',;>-.44:igrt
r MEAN"'
A.
..1"..... ' : r ` ...,.! . : . . ,..,t . : Ar f' , ''' ''.
t/ . rade 1 1491 ;-`11.-2`:-. irlfrit, ''' .1if.fs,--' 4.9 '3.1 . 140,- ,r
-...- '.. .- 4 ' '.
. 4 - .- .4,. Lade 3 1 495 ,i-*0.19.9%,,.. -121- . -19'.1 6.1 ` 3.1 . 1.Q^ Grade, 5 513 144:,.t.t.,-,, 20. V: .23.8 8.4 2.9 1.0...Grade,7: (1,181 7 .1% . -17,1,9"., -. -*Z4.1, 'I 8.7 ->---279---- 1.0
se ,,,,, -, ; ,
, '*;.;
Gracie
Total (Sec.)
(SEC.) EVSIISS
VeryImportant
(5) (4) 421 121.-
729 23.37 .36.9 32.2 6.9
Grade 8 374. 25.9% 38.2Grade 10 269 23.0% 33.1Grade 12 86 12.8% 43.0
.3.
NotImportant
(1)
,n.7
.MEAN S.D.
3.8 9'4
99.7 59 9 0.3 43.835.7 7,4 0.7 .3.7 .932.6 9.3 2.3 3.5 .9
efe
,
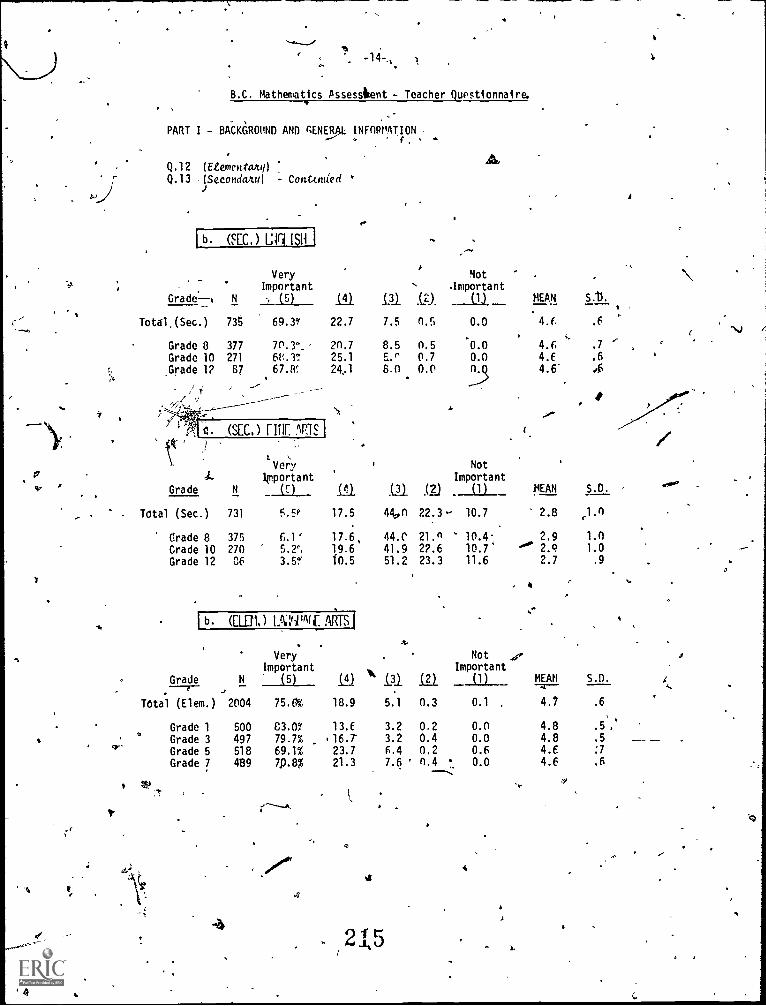
-14,,
B.C. Mathematics Pssessitent - Teacher QuEstionnaire.
.
PART I - BACKGROUND AND GENERAL INFORMATION
Q.12 (Etementang)Q.13 (Secondano) - Conttocied
VeryImportant
Grade.---1 N _LIL i41
Tot61,(Sec.) 73S 69.3/ 22.7
Grade 8 377 70.3". 20.7
Grade 10 271 61',.1',.' 25.1
Grade de 1? 87 67.W 24,1
[b (FEC,) Uhf ISII
(SEC.) NNE 12d
S.
' ..
Veryimportant
Grade N 1....W 11
Total (Sec.) 731
_
5.5P 17.5
Grade 8 375 6.1' 17.6,
Grade 10 270 5.2', 19.6
Grade 12 C6 3.5/ 10.5
b. (EL.pt) U1,:1114(( ARTS!
. .
VeryImportant
Grade N (5) 14)---f- ,.Total (Elem.) 2004 75.8% 18.9
Grade 1 500 C3.09' 13.E
Grade 3 497 79.7% .16.7Grade 5 518 69.1% 23.7
Grade 7 489 7P.8% 21.3
(3J
7.5
8.5E.'
8.0
(3)
Not
- .Important.W (1) MEAN
c
S:11.
.6
.7
.6
S.D.
c1.0
1.01.0
.9
S.D.
n.s 0.0 4.6
n.5 '0.0 4.60.7 0.0 4.E
0.0
1
4.6'
(....
Not
Important
(1) MEAN
44,0
44.041.951.2
. .
'' L31
5.1
3.2
3.2
6.47.6 '
.(2)
22.3- 10.7 2.8
21.9 10.4 2.9
2?.6 10.7' "". 2.0
23.3 11.6 2.7
n
Not .,y-
Important(2) (1) MEAN
0.3 0.1 , 4.7
0.2 0.0 4.80.4 0.0 4.8
0.2 0.6 4.6
0.4 0.0 4.6-----,
.6
.5
.5
:7.6
ii
2.15
4
ti
j
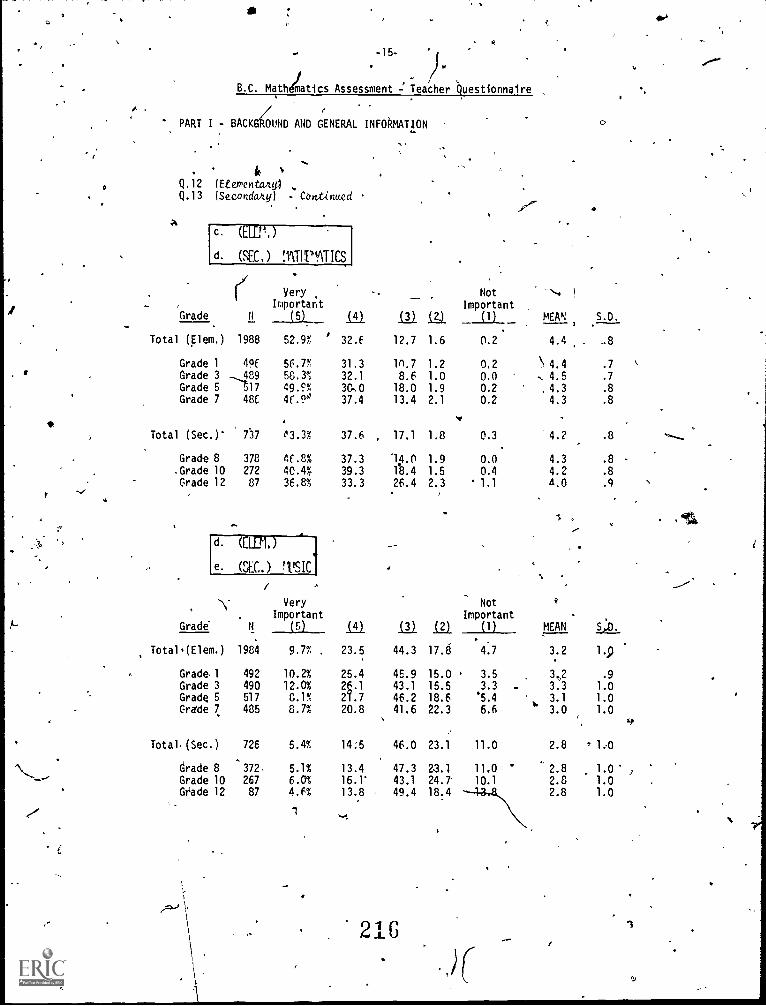
-15-
B.C. Mathhtics Assessment - Teacher Questionnaire
PART I - BACKGROUND AND GENERAL INFOPMATION
.
Q.12 fEtementwq0Q.13 (Secondary) - COntinued
c.
d. (SEC.) MTIT'llgICS
VeryImportant
Grade N S5) ill
Total (Elem.) 1988 52.9% 32.f
Grade 1 49C 56.7% 31.3Grade 3 -489 58.3% 32.1
Grade 5 17 49.S'% 30,0Grade 7 48C 4(.9°' 37.4
Total (Sec.)- 737 e3.3% 37.6
Grade 8 378 4(.8% 37.3.Grade 10 272 40.4% 39.3Grade 12 87 36.8% 33.3
d. (CUM.)
e. (SEC.) IISIC
Grade.
N
VeryImportant15) II/
Total(Elem.) 1984 9.7% . 23.5
Grade, 1 492 10.2% 25.4Grade 3 490 12.0% 2.1Grade 5 517 C.1% 27.7Grade 7 485 8.7% 20.8
Total (Sec.) 726 5.4% 14:5
trade 8 372 5.1% 13.4Grade 10 267 6.0% 16.1'
Grade 12 87 4.f% 13.8 .
__
(3)
,
(2)
Not
Important(1)
-.,
MEAN
)
S.D1 .
12.7 1.6 0.2 4.4 -8
ln.7 1.2 0.2 4.4 .7
8.6 1.0 0.0 . 4.5 .7
18.0 1.9 0.2 , 4.3 .8
13.4 2.1 0.2 4.3 .8
17.1 1.8 0.3 4.2 .8
14.0 1.9 0.0 4.3 .8
1.8.4 1.5 0.4 4.2 .8
26.4 2.3 ' 1.1 4.0 .9
'' Not fImportant
01 11). (1).
44.3 17.6 4.7
45.9 15.0 ' 3.5
43.1 15.5 3.3 .
46.241.6
18.622.3
'5.4
6.6I.
46.0 23.1 11.0
47.3 23.1 11.0
43.1 24.7' 10.1
49.4 18.4
MEAN S.
3.2 1.9
3,2 .9
3.3 1.0
3.1 1.03.0 1.0
2.8 , 1.0
2.8 1.02.8 1.02.8 1.0
3
44'
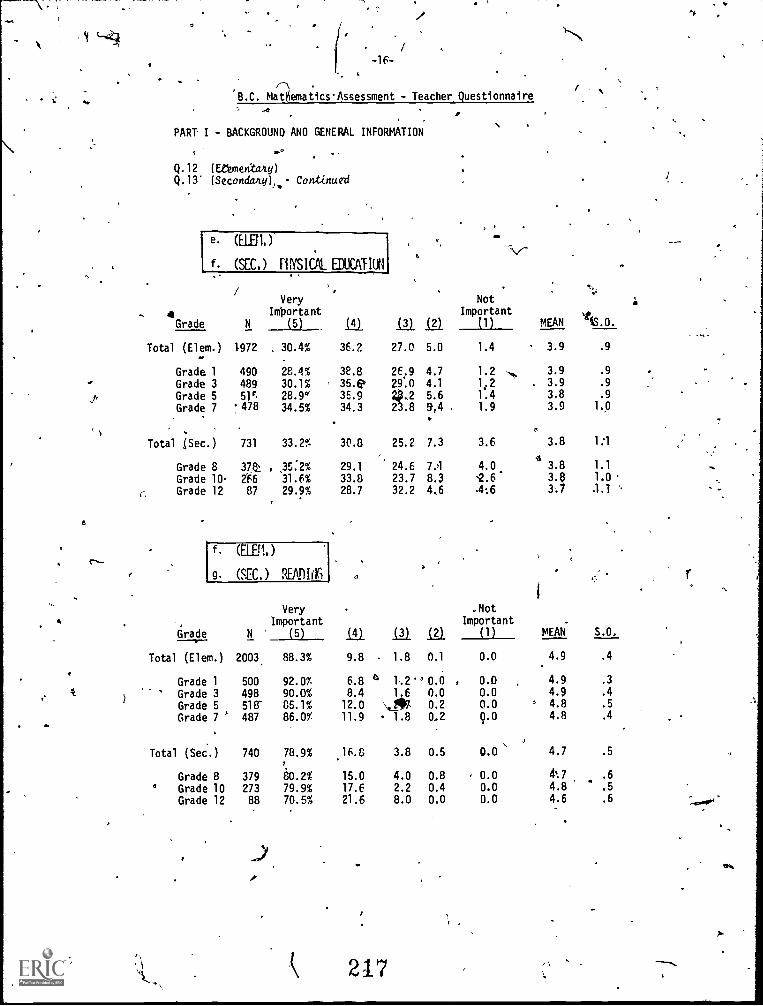
B.C. Mat ematicsAssessment - Teacher Questionnaire
O
PART I - BACKGROUND ANO GENERAL INFORMATION
Q.12 (Ettmentany)
Q.13' ISecondany)).- Contixuell
- 4Grade
e (E121.)'
f. (SEC.) FIlYSICAL EDUCATION
12..).
NotImportant
(1) MEANNt4S0.
VeryImportant
(5) ka
Total (Elem.) 1972 . 30.4% 36.2 27.0 5.0 1.4 3.9 .9
Grade 1 490 28.4% 38.8 26.9 4.7 1.2 ,, 3.9 .9
Grade 3 489 30.1% 35.0' 29.0 4.1 1.2 3.9 .9
Grade 5 51c 28.9w 35.9 2$,,2 5.6 1.4 3.8 .9
Grade 7 '478 34.5% 34.3 23.8 9,4 . 1.9 3.9 Lo
Total iSec.) 731 33.2% 3D.8 25.2 7.3 3.6 3.8 1:1
Grade 8 378! , 35.2% 29.1 24.6 7A 4.0 3.8 1.1
Grade 10, 2S6 31.6% 33.8 23.7 8.3 -2.6- 3.8 1.0 .
r, Grade 12 87 29.9% 28.7 32.2 4.6 -4-.6 3:7 3.1
8
.
.NotImportant
f. (ELEM.)
g. (SEC.) READIIG
VeryImportant
Grade N (5) ii). Igi (1)
Total (Elem.) 2003 88.3% 9.8
_01
. 1.8 0.1 0.0
Grade 1 500 92.0% 6.8 4 1..2'' 0.0 , 0.0
, Grade 3 498 90.0% 8.4 1.6 0.0 0.0
Grade 5 518" C5.1% 12.0 \,__AV. 0.2 0.0
Grade 7 ' 487 86.0% 11.9 1.8 0.2 0.0
Total (Sec.) 740 78.9% 16.8 3.8 0.5 0.0 \
Grade 8 379 80.2% 15.0 4.0 0.8 0.0
grade 10 273 79.9% 17.6 2.2 0.4 0.0
Grade 12 88 70.5% 21.6 8.0 0.0 0.0
217
I
MEAN S.0,
4.9 .4
4.9 .3
4.9 .4
4.8 .5
4.8 .4
4.7 .5
4:7 .6
4.8 .5
4.6 .6
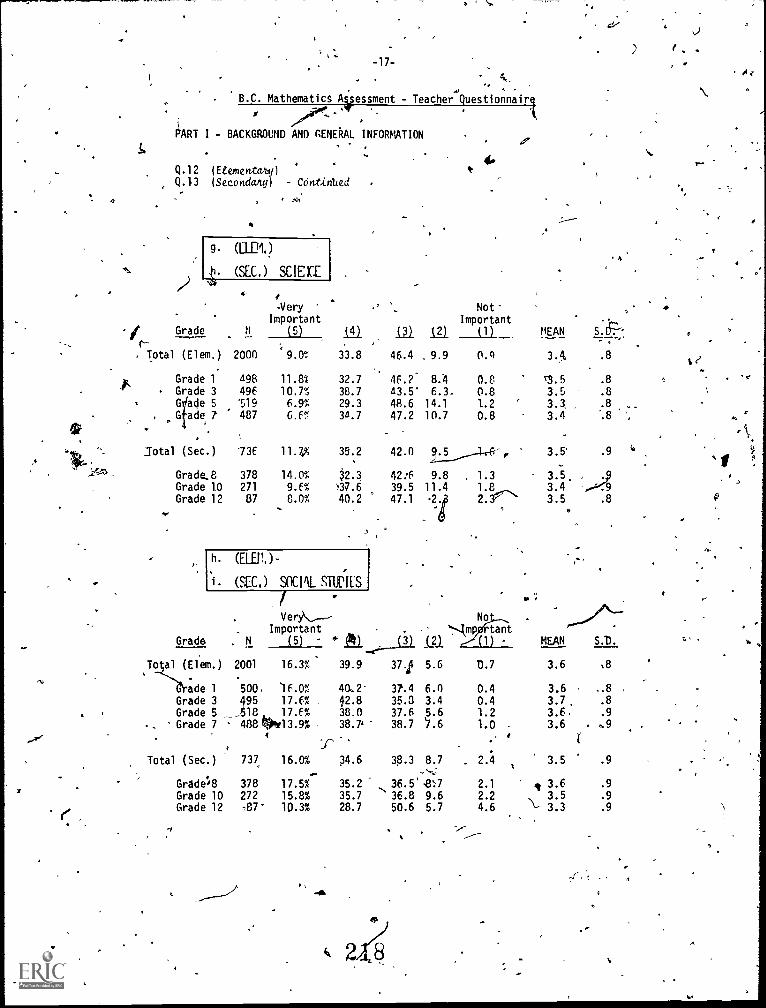
-17-
B.C. Mathematics Assessment Teacher Questionnairl
FART I - BACKGROUND AND GENERAL INFORMATION
Q.12 (Etementatty)
Q.13 (Secondary) COmtatted
o Si
4-
4,
f .
-Very . NotImportant
-1 Grade N (5) (4) (3) (2) (1) MEAN SL.--,:
Total (Elem.) 2000,
9.0% 33.8 46.4 , 9.9 0.q 3. .8
Grade 1 498 11.8% 32.7 46.2' 8.4 0.8 t3.5 .8
Grade 3 496 10.7% 38.7 43.5' 6.3, 0.8 3.5 .8
. ad5 '519 6.9% 29.3 48.6 14.1 1.2 3.3 ,' .8
G e 7 487 6.f% 34.7 47.2 10.7 0.8 3.4
.07
,
.dotal (Sec.) '73E 11.79; 35.,2 42.0 .21.......1-.45-, 3.5' .9 `'
Grade.8 378 14.0% 32.1 42:6 9.8 , 1.3 . 326. , 4Grade 10 271 9.f% 37.6 39.5 11.4 1.8, 3.4 ;,=<-9
-
Grade 12 87 8.0% 40.2 47.1 2.5y ' 3.5 .8 0
4,
r h (ELE11.
(SEC.) SOCIAL STUPIES
4- :
Verk.--- No ,-#"\7-Important mp tant
Grade . N (5) * (It) ......,____(k. (2) (11 MEAN S.D.
To al 2001 16.3% 39.9 37.1 5.6
.
D.7 3.6 t8
ade 1 500, 16.0% 40.2- 37.4 6.1) 0.4 3.6 .8Grade 3 495 17.6% 42.8 35.8 3.4 0.4 3.7, .8
Grade 5 _____,518.__ 17.E% 38.0 37.6 5.6 1.2 3.6. .9
. Grade 7 4881003.9% 38.74 38.7 47.6 1.0 3.6 . .9
Total (Sec.)
4
737 16.0a 34.6 38.3 8.7 2.4 3.5 .9
Grade.08 378 17.5% 35.2 36.5'8:7 2.1 i 3.6 .9
Grade 10 272 15.8% 35.7 '36.8 9.6 2.2 , 3.5 .9
Grade 12 ,87- 10.3% 28.7 50.6 5.7 4.6 "- 3.3 .9
4
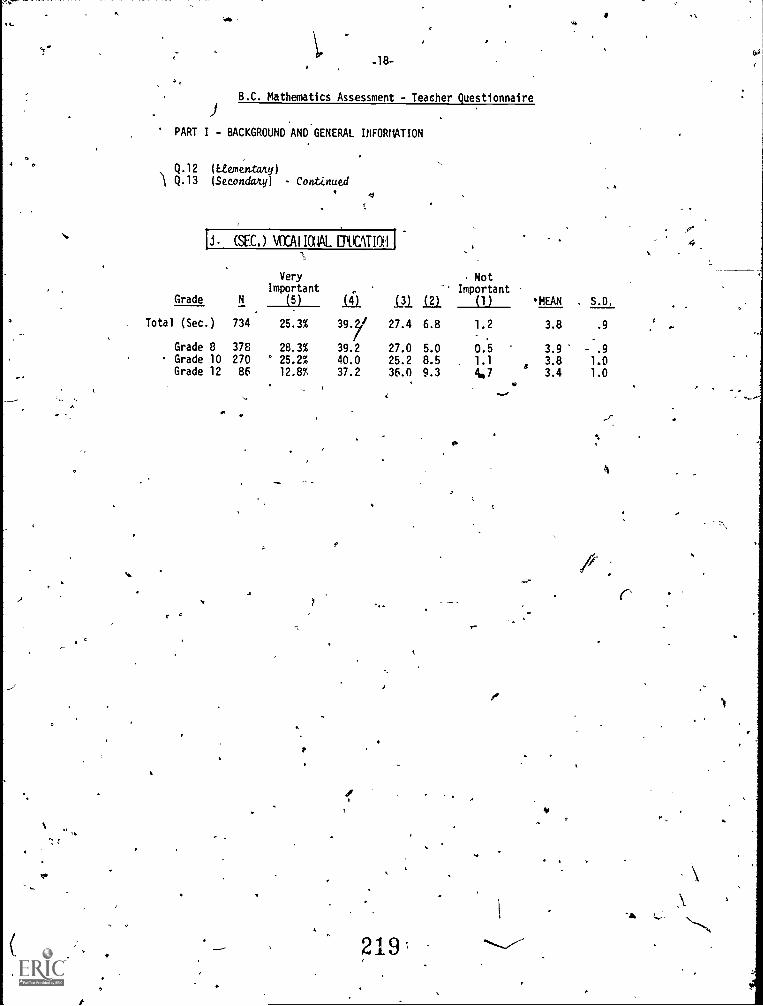
Yob
-18-
B.C. Mathematics Assessment - Teacher Questionnaire
PART I - BACKGROUND AND GENERAL DIFORMATION
Q.12 (Etementany)
A Q.13 (Secondary) - Continued
. li (SEC.) MiCAI IOUAL ERCITIOil I
4.
Grade N
VeryImportant
(5) 01 (3) 1.21
NotImportant
'MEAN , S.D.
Total (Sec ) 734 25.3% 39.y 27.4 6.8
_011.2 3.8 .9
Grade 8 378 28.3% 39.2 27.0 5.0 0.5 3.9 - .9Grade 10 270 ' 25.2% 40.0 25.2 8.5 1.1 3.8 1.0Grade 12 86 12.8% 37.2 36.0 9.3 4.7 3.4 1.0
219
p
.
4
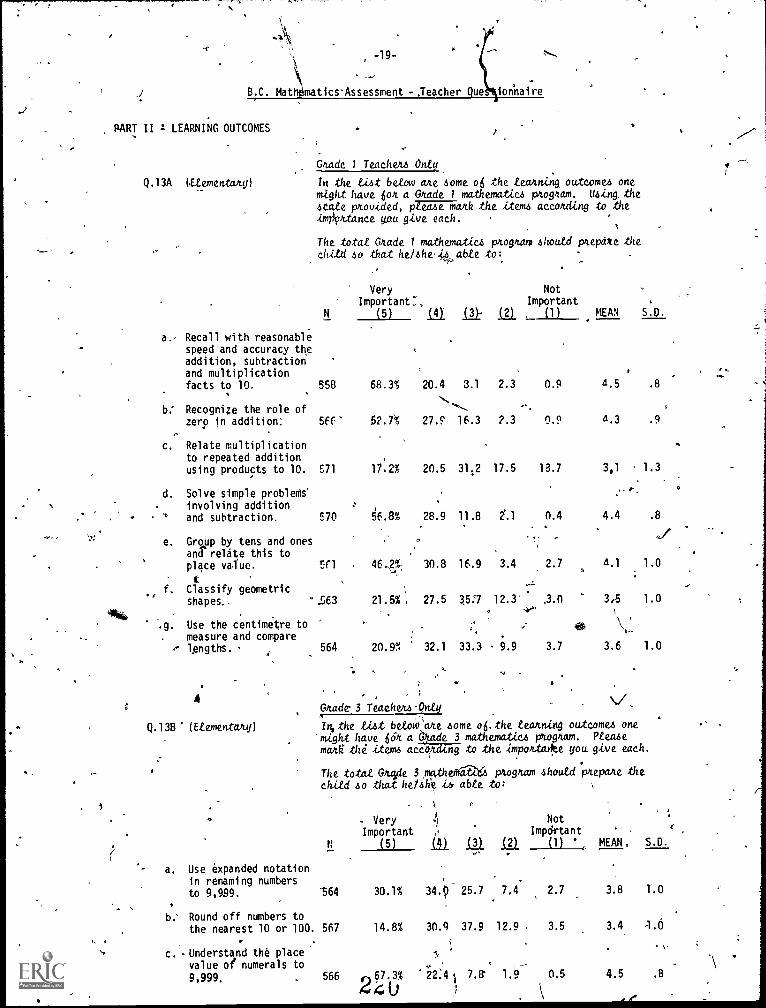
ti
-19-
B.C. MatOgmaticsAssessment -.Teacher Que ionnaire
BART II 4 LEARNING OUTCOMES
Q.134 (tementaty)
,
Grade 1 Teachem Onty
/ta the List below an some oS the eating outcomes onemight have Son a Grade I mathematics program. Using, the
scale pnovided, 0'U-47-Ranh the items according to theimeontance you give each.
The totat Grade 1 mathematics program should p4elodu thechild so that he/she,i4 abte to:
N
a. Recall with reasonablespeed and accuracy theaddition, subtractionand multiplicationfacts to 10. 558
b: Recognize the role ofzero in addition: 566
c. Relate multiplicationto repeated additionusing products to 10. 571
d. Solve simple problemsinvolving additionand subtraction. E70
e. Group by tens and onesang'relate this toplace vague. trl
tf. Classify geometric
shapes.. -.563
.g. Use the centimWe to. measure and compare, lengths.
,564
4
Q.1313 (EtementaAyl
Very
Important:,
NotImportant
CO ill (3)- igl , (1) MEAN S.D.
68.3% 20.4 3.1 2.3 0.9 /1.5 .8
52.7% 27.E 16.3 ?.3 0.9 4.3 .9
17:2% 20.5 31,2 17.5 13.7 3,1 1.3
56.8% 28.9 11.8 2.1 0.4 4.4 .8
46.,,g%, 30.8 16.9 3.4 2.7 4.1 1.0
:21.5%, 27.5 15:7 12.3' 3.0 3,5 1.0
.
,
40.
\,_
20.9% 32.1 33.3 9.9 3.7 3.6 1.0
Grade- 3 Teachens.9nty
In, the tist betour; ane some OS. the .learning outcomes one
'might have OA a Grade 3 mathematics pkognam. Please
monk the items accondiwg to the impoAtce you give each.
The tote NA 3 mat/10104 pnognam should p4epate the
chitd so that he/de able to:
M
a. Use expanded notationin renaming numbersto 9,999. '564
b; Round off numbers tothe nearest 10 or 100. 567
c. -Understand the placevalue of numerals to
9,999. 566
. VeryImportant
(5)
'',
'..A
,'
Al
34.§
30.4
22:44
"
ill
25.7
37.9
7.8'
ill
7.4
12.9
1.9
NotImpdrtant
(1) MEAN, S.D.
30.1%
14.8%
c,f7.3%4 4 0
2.7
, 3.5
0.5
3.8
3.4
4.5
T.0
1.6
t
.B
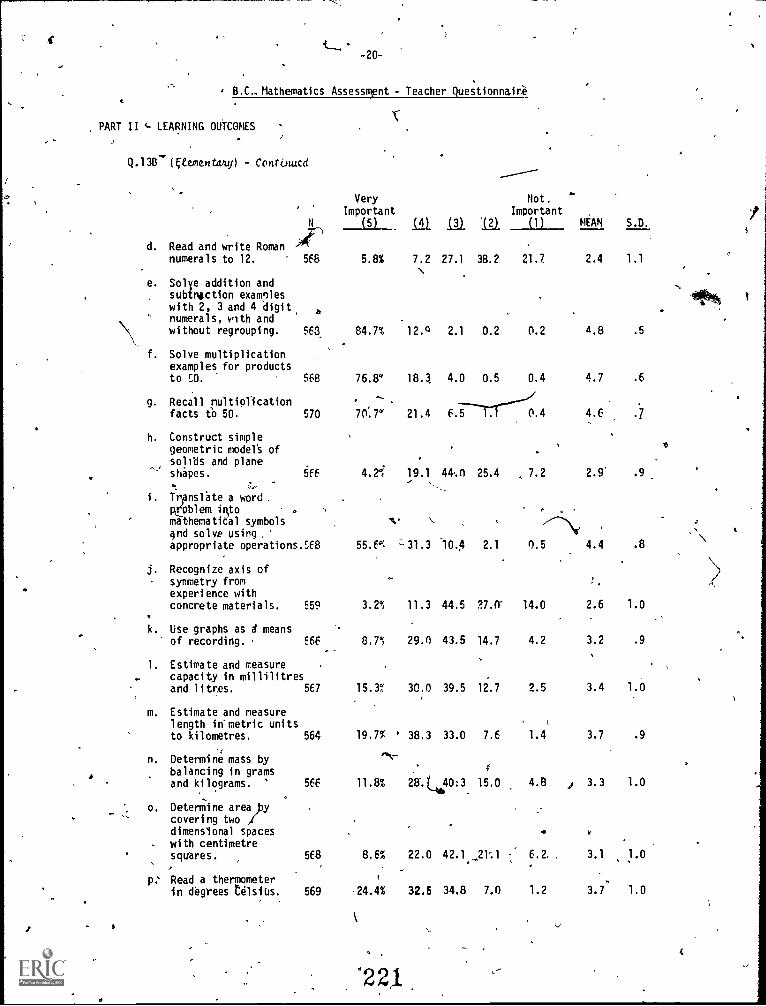
t
-20-
B.C. Mathematics Assessment - Teacher Questionnaire
PART II t LEARNING OUTCOMES
Q.13riktementaty) - Continued
d. Read and write Romannumerals to 12. 558
e. Solve addition andsubingction exampleswith 2, 3 and 4 digitnumerals, with andwithout regrouping. 563
f. Solve multiplicationexamples for productsto O. 568
facts to 50. 570
g. Recall rmltiofication
h. Construct simplegeometric model's of
solids and planeshapes. 5E6
t ,T,
i. Trpnsl'ate a word.RtOblem into .
mathematical symbols4nd solve using.appropriate operations-5E8
j. Recognize axis ofsynnetry fromexperience withconcrete materials. 559
k. Use graphs as g meansof recording. 56f
1. Estimate and measurecapacity in millilitresand litres. 567
m. Estimate and measurelength in'metric unitsto kilometres. 564
n. Determine mass bybalancing in gramsand kilograms. ' 56E
o. Determine area bycovering two A(dimensional spaceswith centimetrescpiares. 5E8
p: Read a thermometerin degrees Celsius. 569
VeryImportant
(5) 1. 121
Not,Important
(1) MEAN S.D.
5.8% 7.2 27.1 38.2 21.7 2.4 1.1
84.7% 12.0 2.1 0.2 0.2 A.8 .5
76.8% 18.1 4.0 0.5 0.4 4.7 .6
. -
70.7w 21.4 e.i171------jo.4 4.6 .7
.
4.2*c 19.1 44.0 25.4 7.2 2.9' .9
N. , 7\55.5°1. '31.3 10.4 2.1 0.5 4.4 .8
-
3.2% 11.3 44.5 27.0' 14.0 2.6 1.0
8.7% 29.0 43.5 14.7 4.2 3.2 .9
15.3% 30.0 39.5 12.7 2.5 3.4 1.0
19.7% 38.3 33.0 7.6 1.4 3.7 .9
11.8% 28 .440:3 15.0 4.8 3.3 1.0
8.6% 22.0 42.1_21:1 6.2.. 3.1 1.0
24.4% 32.5 34.8 7.0 1.2 3.7 1.0
°
'221
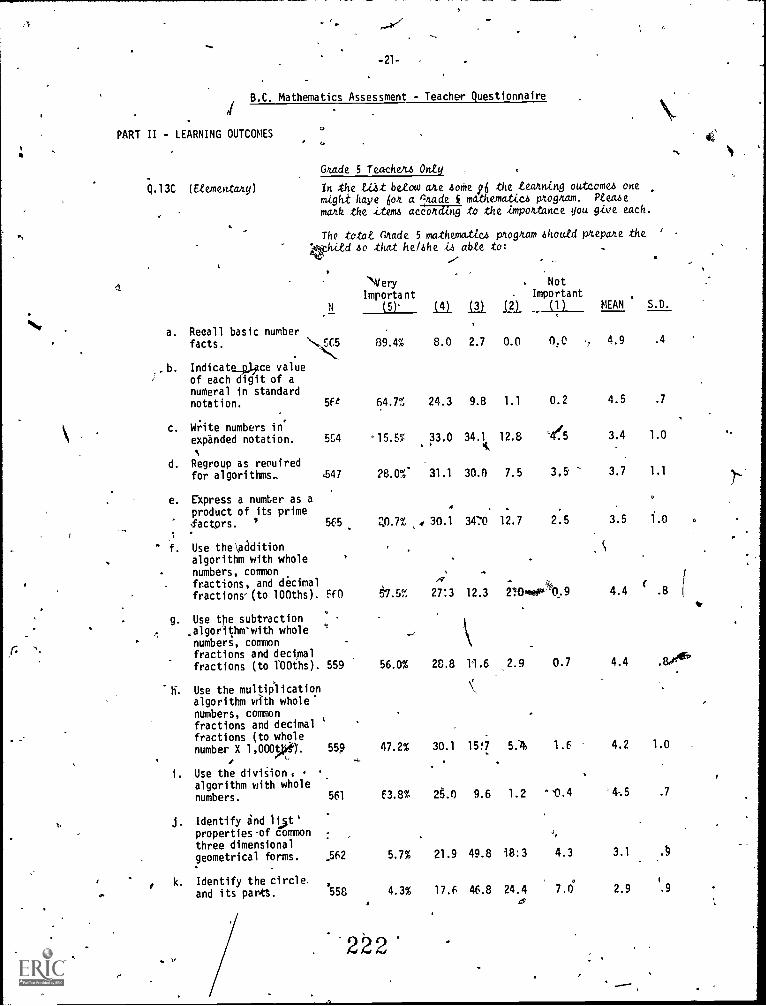
-21-
B.C. Mathematics Assessment - Teacher Questionnaire
PART II - LEARNING OUTCOMES
Q.13C (Eternentany)
co
Grade 5 Teacheu Onty
In the t1At betow ate 4o/he 26 .the teming outtome4 onemight have on a made $ mathematiee program. Ptea4e
mark the item acconding to the .importance you give each.
The totat nude 5 mathernattc.4 program 4houtd prepare the '
had 4o that hehhe id abte to:
N
a. Recall basic numberfacts.
N.4\5.b Indicat ce value
1'of each digit of anumeral in standardnotation. 5fe
c. Write numbers inexpanded notation. 5C4
d. Regroup as reouiredfor algorithms- 547
e. Express a number as aproduct of its prime
actors. 565
f. Use the additionalgorithm with wholenumbers, commonfractions, and decimalfractions' (to 100ths). Ff0
g. Use tie subtraction,algorithm"with whole 9'
numbers, commonfractions and decimalfractions (to lOOths). 559
h. Use the multiplicationalgorithm with wholenumbers, commonfractions and decimal '
fractions (to wholenumber X 1,000). 559
i. Use the diwkion,algorithm with wholenumbers. 561
Identify and 1W'propertiesof commonthree dimensionalgeometrical forms. .562
0 k. Identify the circle.and its parts. 558
VeryImportant
(5)' j DI
. Not, Important
ill CO
89.4% 8.0 2.7 0.0 0,0
64.7% 24.3 9.8 1.1 0.2
'15.5% 33.0 34.1 12.8 '.4e5
28.0%9 31.1 30.0 7.5 3.5
0.7% 30.1 349:'0 12.7 2.5
-k
57.5% 27:3 12.3 2?Ovom-0.9
56.0% 28.8 11.6 2.9 0.7
47.2% 30.1 15!7 5./h if
63.8% 25.0 9.6 1.2 ^10.4
5.7% 21.9 49.8 18:3 4.3
4.3% 17.6 46.8 24.4 7.0
&?,
MEAN S.D.
4.9 .4
4.5 .7
3.4 1.0
3.7 1.1
s
3.5 1.0
4.4 ( .8
4.4 .8010tv
4.2 1.0
2.9 .9
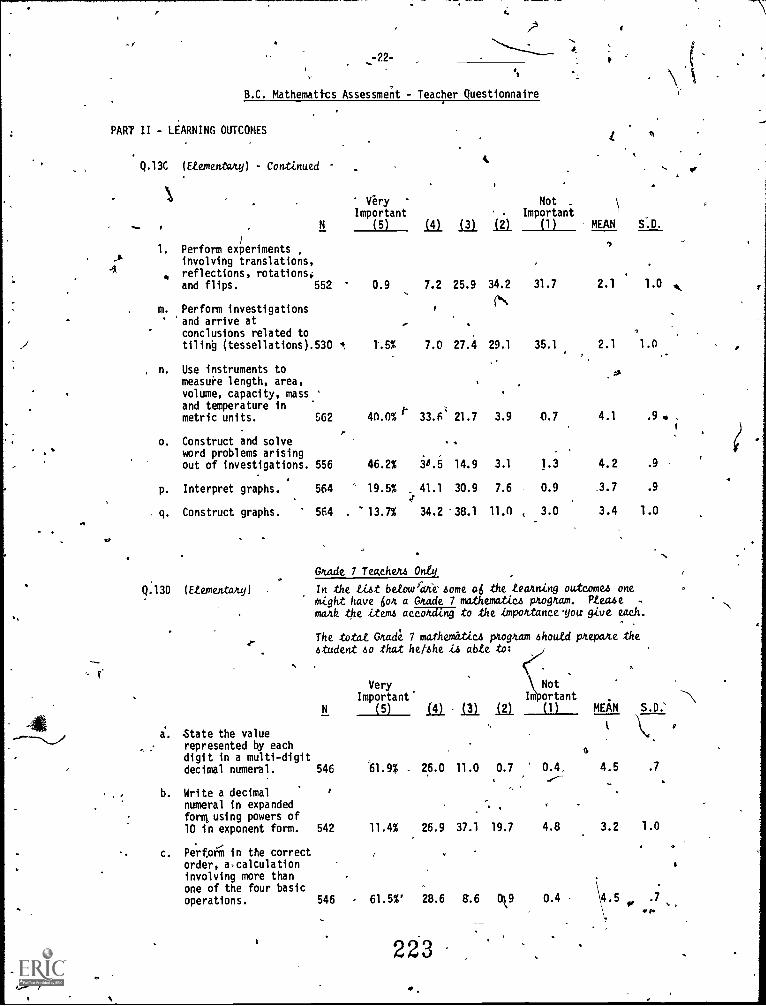
_722-
B.C. Mathemattcs Assessment - Teacher Questionnaire
PART II - LEARNING OUTCOMES
Q.13C (Etementaky) Continued
N
1. Perform experiments ,
involving translations,reflections, rotations;and flips. 552
m. Perform investigationsand arrive atconclusions related totiling (tessellations).530
n. Use instruments tomeasure length, area,volume, capacity, massand temperature inmetric units. 562
o. Construct and solveword problems arisingout of investigations. 556
p. Interpret graphs. 564
q. Construct graphs. 564
VeryImportant
(5) L41 (3)
.uNot _
Important(1) MEAN S.D.
0.9 7.2 25.9 34.2 31.7 2.1 1.0
1 1'.5% 7.0 27.4 29.1 35.1 2.1 1.0
40.0% 33.6 21.7 3.9 0.7 4.1 .9
7.
46.2% 3t'.5 14.9 3.1 1.3 4.2 .9
19.5% 41.1 30.9 7.6 0.9 .3.7 .9.
4-
. '13.7% 34.2 '38.1 11.0 , 3.0 3.4 1.0
Grade 7 Teoteheu Only
Q.13D (Etementany) In the tiet betmcrecoome o6 the teauing outeomeo onemight have 6olt a Grade 7 mathematteo pugum. Mew.mark the itema acTIFEWIT .to the impottance.yott give each.
The totat 0/Lade 7 mathematteo pkogkam <showed pitepake the
i. State the valuerepresented by eachdigit in a multi-digitdecimal numeral.
b. Write a decimalnumeral in expandedforg using powers of10 in exponent form.
c. Perform in the correctorder, acalculationinvolving more thanone of the four basicoperations.
student 60 that helzhe h abte to:
N
VeryImportant
(5) 12). IIINot
Im ortant(1)
.
MEAN S.D.'
-.\
.0.11 0
o.
546 61.9% . 26.0 11.0 0.7 0.4. 4.5 .7
542 11.4% 26.9 37.1 19.7 4.8 3.2 1.0
546 61.5 %' 28.6 8.6Crk9
0.4 \4.5 .7
1.0.
223
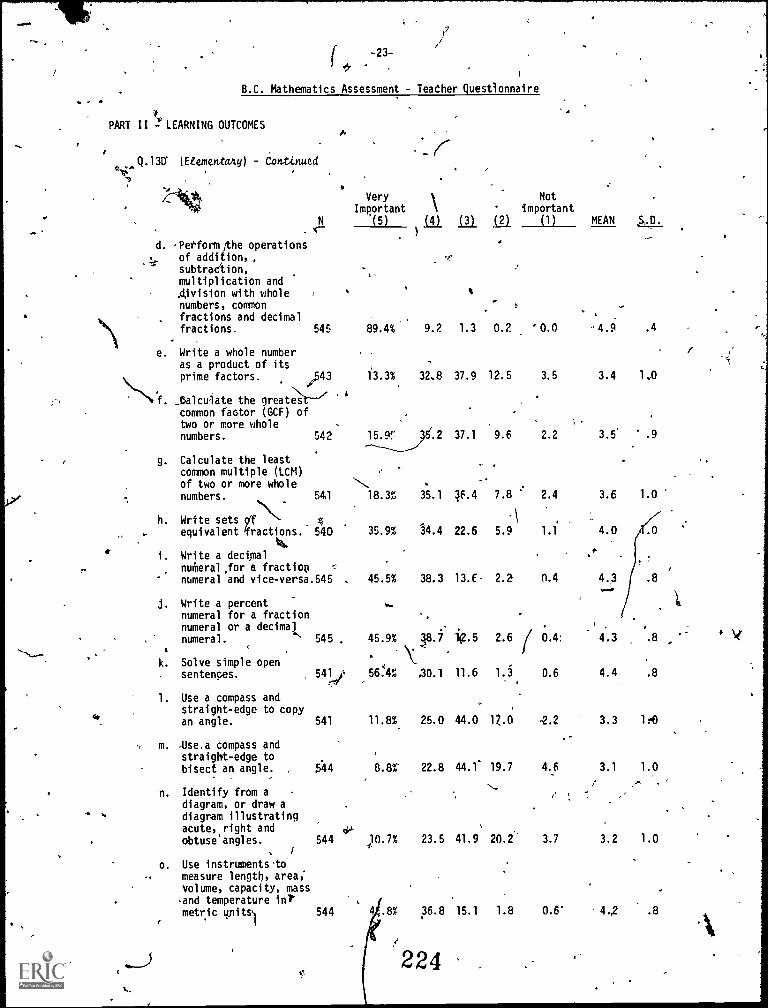
( -23-
45.
B.C. Mathematics Assessment - Teacher Questionnaire
PART II -'' LEARNING OUTCOMESI.
Q.13U (Etementany) - Continued
d. 'Perform /the operations
of addition,
multiplication anddivision with wholenumbers, commonfractions and decimalfractions. 545
e. Write a whole numberas a product of itsprime factors. ;43
f. _5alcu4ate the greatt"-'common factor (GCF) oftwo or more wholenumbers. 542
g. Calculate the leastcommon multiple (LCM)of two or more wholenumbers. 541N
h. Write sets 9T 4. equivalent 'fractions. 540
it.e
. Write a decimalnumeral for a fractiop ,-'
numeral and vice-versa.545
j. Write a percentnumeral for a fractionnumeral or a decimalnumeral. ' 545 .
k. Solve simple opensentences. 541"
1. Use a compass andstraight-edge to copyan angle. 541
m. ..Use,a compass and
straight-edge tobisect an angle. 544
n. Identify from adiagram, or draw adiagram illustratingacute, right andobtuse'angles. 544
o. Use instrumentsomeasure length, area;volume, capacity, massand temperature intmetric gnitsl 544
VeryImportant
(5)
Notimportant
Di 11) (1) MEAN
89.4 %' 9.2 1.3 0.2
13.3% 32.8 37.9 12.5
'
15.9.2 37.1 9.6
,,..
18.3% 35.1 36.4 7.8
\
35.9% 14.4 22.6 5.9
i
45.5% 38.3 13.E 2.2
11.8% 25.0 44.0 17..0
8.8%" 22.8 44.1 19.7
)0.7% 23.5 41.9 20.2'
.8% 36.8 15.1 1.8
*-
45.9% 18.7 ig.s 2.6
\56:4% .30.1 11.6 1.5
'224
.
1/
"'0.0 '4.9 .4
3.5 3.4 40
2.2 3.5 .9
2.4 3.6 1.0
1.1 4.0
.
n.4 4.3 .8
.2 3.3 le0
4.6 3.1 1.0
3.7 3.2 1.0
0.6' 4,2 .8
4
0.4: 4.3
0.6 4.4 .8
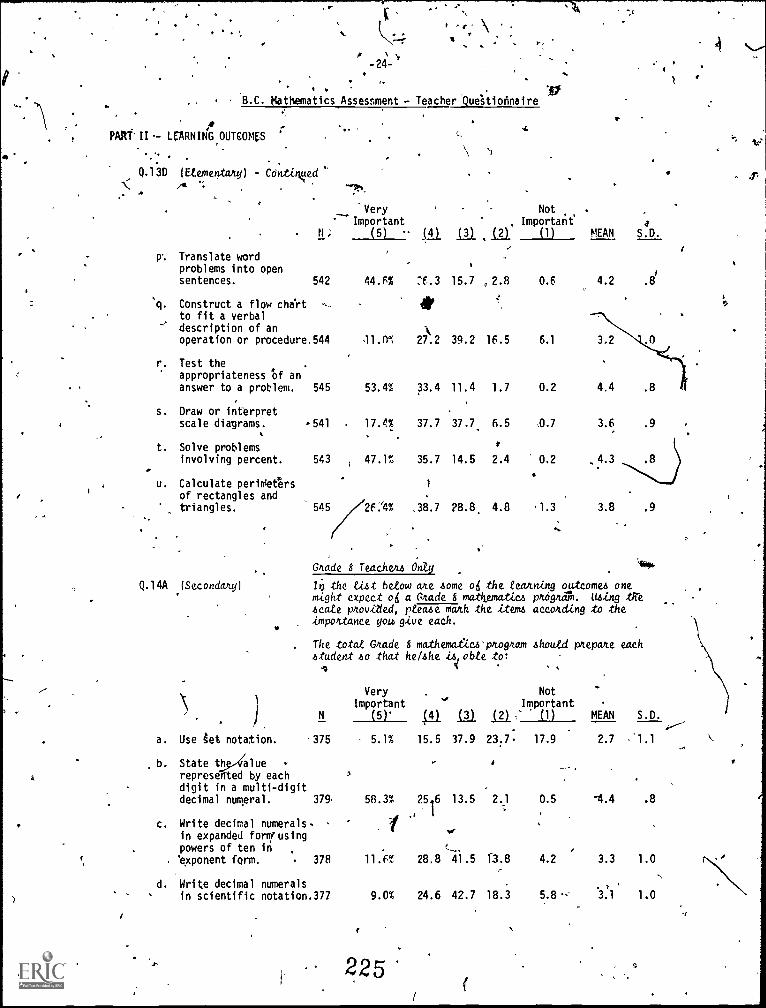
ti
e -
-24 -ti
B.C. Mathematics Assessment - Teacher Questionnaire
PAR1 II- LEARNINBOUTCOMES
Q.13D (Etementarty) - Ccintiqued
p Translate word
'44
-"."`-
.
Very , Not .
-- Important Important' a
N ; (5) AL (3) An (1) MEAN S.D.
problems into opensentences. 542
'q. Construct a flow chirtto fit a verbaldescription of anoperation or procedure.544
r. Test theappropriateness tf ananswer to a problem. 545
s. Draw or interpretscale diagrams. -541
t. Solve problemsinvolving percent. 543
u. Calculate periMetersof rectangles and _
triangles. 545
Q.14A (Secondalty)
)
a. Use get notation. 375
44.6% :6.3 15.7 , 2.8 0.6
11.0% 27.2 39.2 16.5 6.1
53.4% 33.4 11.4 1.7
17.4% 37.7 37.7. 6.5 .0.7
, 47.1% 35.7 14.5 2.4 0.2
1
2f:4% .38.7 28.8, 4.8 '1.3
0.2
'
4
4.2 .8
3.6 .9
4.3 .8
3.8 .9
4.4 .8
Gude 8 Teachem 0114
In the tat betow ane Acme o6 the le/liming outcome4 onemight expect ci6 a kade 8 matkematica pnogna. Wing th-e.scate pnovided, please math the item!, acconding to the.importance yea give each.
The totat Gnade 8 mathemat:i.calvtognam .should pupate eachstudent so that he/Ahe ib,% able to:
N
b. State th aluerepresented by eachdigit in a multi-digitdecimal numeral. 379
c. Write decimal numerals.in expanded formrusingpowers of ten inxponent form. 378
d. Write decimal numeralsin scientific notation.377
5.1% 15.5 37.9 23:7 17.9
9.0% 24.6 42.7 18.3
Very Not
Important Important
(5)' i ,s (1) MEAN S.D.
4
58.3% 2511 6 13.5 2.1 0.5 14.4 .8
if ..
t-. ,
e 11.6% 28.8 41.5 13.8 4.2 3.3 1.0
5.8 - 3.1 1.0
2.7 1.1
225f
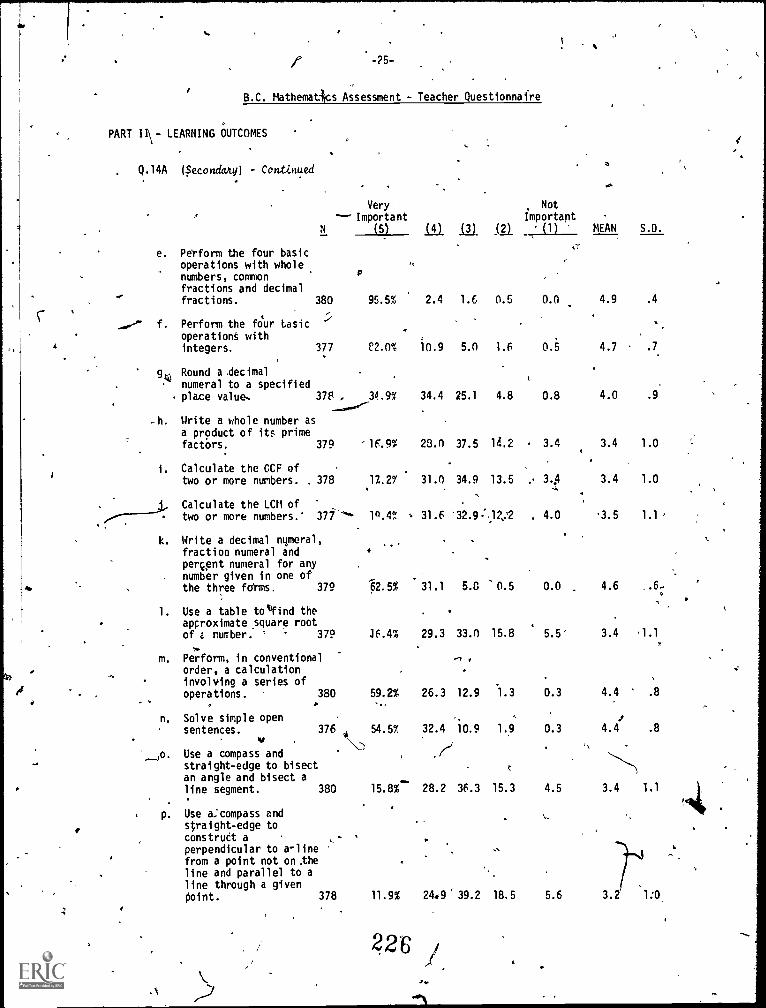
fL
9
I°
B.C. Mathematics Assessment - Teacher Questionnaire
PART Hy- LEARNING OUTCOMES
Q.14A (Secondemy) - Continued
Very--- Important
(5)
e. Perform the four basicoperations with wholenumbers, commonfractions and decimalfractions. 380 95.5%
f. Perform the fOur tasic :>
operation withintegers. 377 C2.0%
gtRound a decimalnumeral to a specifiedplace value,. 37B X34.9%
-h. Write a whole number asa product of its primefactors. 379 -1F.9%
i. Calculate the CCF oftwo or more numbers. , 378 17.29'
Calculate the LCM ofs-------4: two or more numbers.' 377''''"- 19.4%
k. Write a decimal numeral,fraction numeral andpercent numeral for anynumber given in one ofthe three foYms. 379 62.5%
ate
1. Use a table to find theapproximate rootsquareof e number. ' 379 J6.4%
m. Perform, in conventionalorder, a calculationinvolving a series ofoperations. 380 59.2%
. . -.
n. Solve simple opensentences. 376 54.5%
m. Use a compass andstraight-edge to bisectan angle and bisect aline segment. 380 15.8%.-
p. Use a:compass a.
nd
straight-edge toconstruct aperpendicular to a-linefrom a point not on theline and parallel to a
throughline a given
Point. 378 11.9%
226
Not
Important(4) (3) (2) (1) MEAN S.D.
q":"
2.4 1.6 0.5 0.0 4.9 .4
10.9 5.0 1.6 0.5 4.7 .7.
34.4 25.1 4.8 0.8 4.0 .9
23.0 37.5 14.2 3.4 3.4 1.0
31.0 34.9 13.5 3.11 3.4 1.0
31.6 '32.9)2:2 4.0 3.5 1.1,
31.1 5.0 '0.5 0.0 4.6 ,.6-
.
29.3 33.0 15.8 5.5' 3.4 '1.1A
-1 .
26.3 12.9 '1.3 0.3 4.4 .8
-. i32.4 10.9 1,9 0.3 4.4 .8
, ij.
c
28.2 36.3 15.3 4.5 3.4 1.1
249'39.2 18.5 5.6 3.2 1 :0
J.
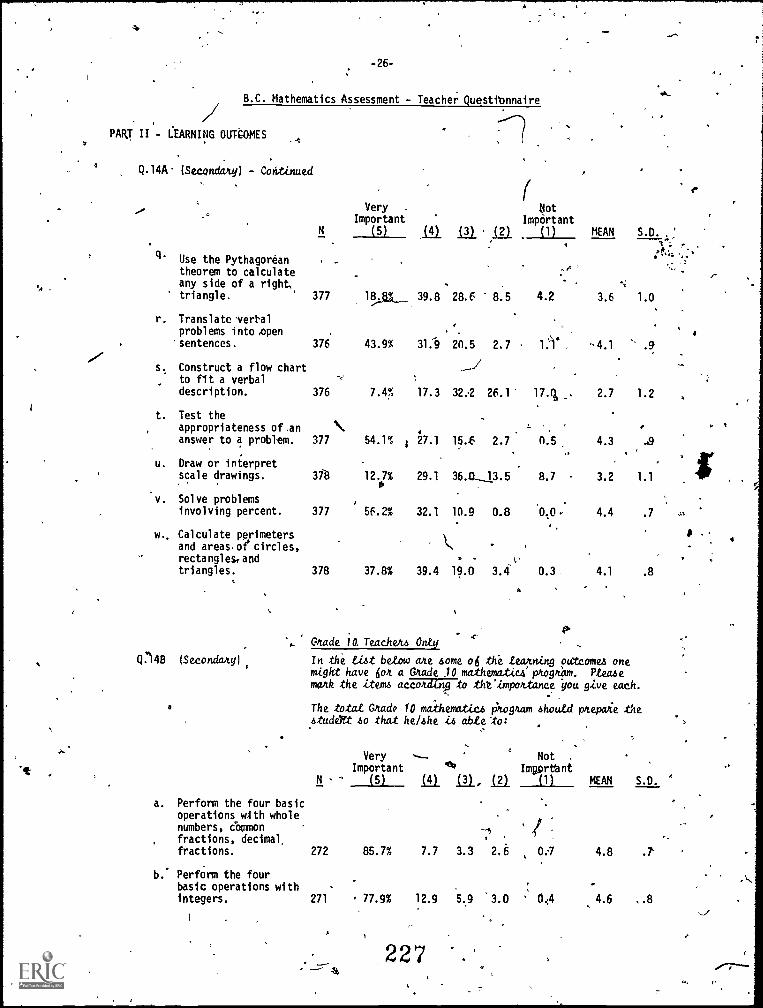
`t
/PART II - LEARNING OUTCOMES
-26-
B.C. Mathematics Assessment - Teacher Questionnaire
Q.14A (Seam& 4y) - Coritimued
...Very .
ImportantN (5) _14.1
.q. Use the Pythagoreantheorem to calculateany side of a right,triangle. 377 18,41..._ 39.8
r. Translate vertalproblems into ,opensentences. 376 43.9% 31.9
s, Construct a flow chartto fit a verbal ...,
description. 376 7.4% 17.3
t. Test theappropriateness of.an \answer to a problem. 377 54.1% 2I 7.1
u. Draw or interpretscale drawings. 318 12.0 7% 29.1
v. Solve problemsinvolving percent. 377 56.2% 32.1
w.. Calculate perimetersand areas.oecircles,rectangles,andtriangles. 378 37.8% 39.4
Q:148 (Secondang)
4
elL
DI (2)
NotImportant
(1) MEAN S.D. .
I-
.
p
1
28.6 8.5 4.2 3.6 1.0
20.5 2.7 0' -4.1 ' .9
-/
32:2 26.1 174 , 2.7 1.2
15.E 2.7 n.5 4.3
36.07_13.5 8.7 3.2 1.1
10.9 0.8 '0,0: 4.4 .7
k,.
4
.
19.0 3.4 0.3, 4.1 .8
Grade ia Teachens Onty
In the List betow are some o6 thi tea4ning outcomes onemigkt have 04 a Grade .10 mathematies'imogn'am. Pteasemark the items according to tht'impo4tance you give each.
The totat Grade 10 mathematics P4oglumn should p4epaie thestudelte so that he/she Zs able :to:
a. Perform the four basicoperations with wholenumbers, commonfractions, decimal,fractions.
b. Perform the fourbasic operations withintegers.
Very --- NotImportant 4%,
ImpprttntN (5) ka In, in (11 MEAN S.D.
. / :
272 85.7% 7.7 3.3 2.6 0:7 4.8 .7
271 77.9% 12.9 5.9 '3.0 0.,4 4.6 ,.8
__....-
227 .
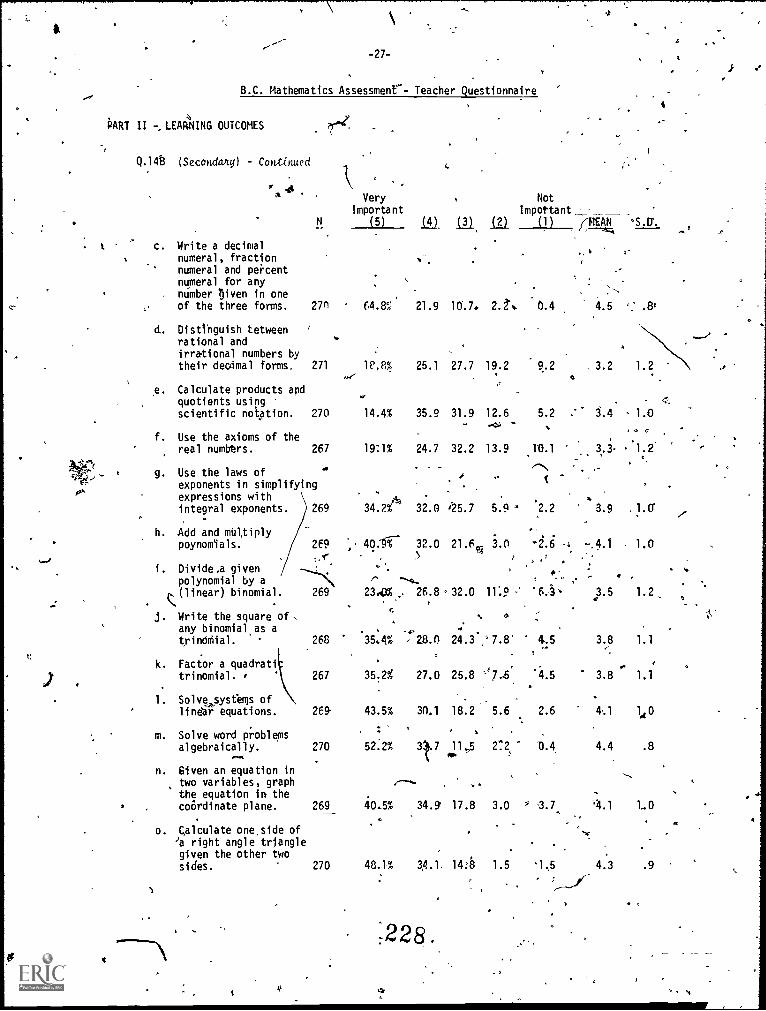
a.
- 27-
B.C. Mathematics Assessment-- Teacher Questionnaire
BART II -, LEARNING OUTCOMES
Q.14i3 (Secondary) Continued
1\
4
c. Write a decimalnumeral, fractionnumeral and percentnumeral for anynumber Tjiven in oneof the three forms. 27n
d. Distinguish betweenrational andirrational numbers bytheir dec4mal forms. 271
e. Calculate products apdquotients usingscientific notation. 270
f. Use the axioms of thereal numbers. 267
g. Use the laws of.
exponents in simplifyingexpressions withintegral exponents. 269
...
h. Add and mUl,tiply
poynomlals. 269
.c
polynomial by ai. Divide,a given
Olinear) binomial. 269
j. Write the square ofany binomial as a
k. Factor a quadratitrinomial.
1. Solve systems oflinear equations.
m. Solve word p;-oblems
algebraically.
268
267
269
270
n. Given an equation intwo variables, graphthe equation in thecoordinate plane. 269
o Calculate one, side of
ia right angle trianglegiven the other twosides. 270
t
Very Not
Important Impottant; _
(5) 1.1) 121 (1)
EA.K 21.9 10'.7. 2. 2'. 0.4 4.5
se"1C,8% 25.1 27.7 19.2 9.2
35.4% 28.0 24.3 7.8' 4.5
35.2Y, 27.0 25.8 '5.6 4.5
43.5% 30.1 18.2 5.6 2.6
52.2% 3.7 m1.1,5 2..:2 D.4
.----- ..
40,5% 34.9 17.8 3.0 3.7
.
.
14.4% 35.9 31.9 12.6 5.2
.
19:1% 24.7 32.2 13.9 10.1
.
---'`.f
t
. . ..
pli4- ,
34.2% 32.0 425.7 5.9 2.2
48.1% 14:b 1.5 '1,5
- 40:ff- 32.0 21.N 3.0 -2.6 -;
....,_
) Y,
-% .
.-
,,
2300% , 26.8 ., 32.0 11:9 -' '6.4*
,. d
; 2 2 8 .
4
7FIEAN 'SAY.
3.2 1.2
- .:- 3.4 1.0
.I C
3.3. 1.2
.
3.9 .1.0'
-.4.1 1.0
*
. ,
).5 1.2
3.8 1.1
3.8 1.1
4.1 140
4.4 .8
'4.1 1,0
4.3 .9
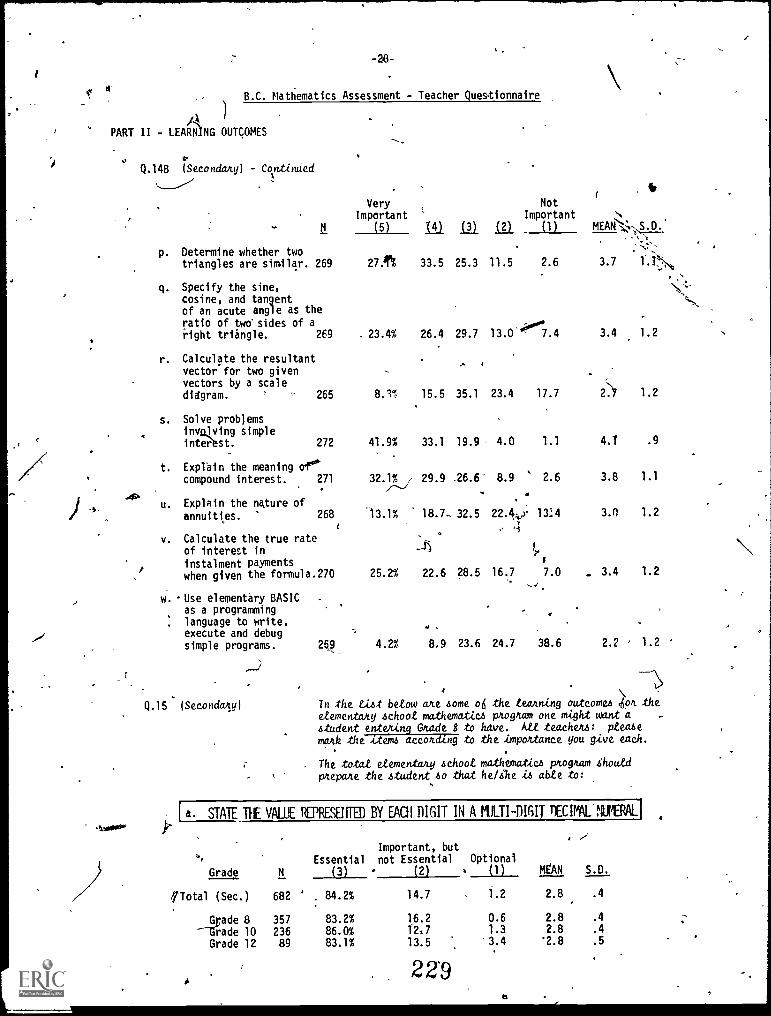
-24-
B.C. Mathematics Assessment - Teacher Questionnaire
k
PART II - LEARNING OUTCOMES
Q.14B (S econdary) - Coe-bided
Very Not
Important Important .s.",,
N (5) ...01 121 12.1 (I) MEAW-7,,,,,S.D..
p. Determine whether twotriangles are similar. 269 27" 33.5 25.3 11.5 2.6 3.7 LT,:
Specify the sine,cosine, and tangentof an acute angle as theratio of two' sides of a 4000right triangle. 269 . 23.4% 26.4 29.7 13.0 7.4 3.4 1.2
q.
r. Calculate the resultantvector for two givenvectors by a scalediagram. ., . 265 8.1*: 15.5 35.1 23.4 17.7 2(.7 1.2
s. Solve problemsinvplving simpleinterest. 272 41.9% 33.1 19.9 4.0 1.1 4.1 .9
t. Explain the meaning ofcompound interest. 271 32.1% , 29.9 .26.6 8.9 4 2.6 3.8 1.1
.-----/ .
u. Explain the nature of
annuities. 268 13.1% 18.7- 32.5 22.4,-,x 13I4 3.0 1.2
is
, ..5
v. Calculate the true rate , °
of interest in ......q,
cinstalment payments ;
when given the formula.270 25.2% 22.6 28.5 16.7 7.0 - 3.4 1.2,...
w. Use elementary BASICas a programminglanguage to write,execute and debugsimple programs.
--)
249 4.2% 8.9 23.6 24.7 38.6 2.2 1.2
\Q.15 (Secondary) In the tist blow are some o6 the teakning outcomes .bon .the
elementary schoot mathematics program one might want a ..
student entening Grade 8 to have. AU -teachers: pleasemark the item according .to .the impoktance you give each.
The totat etementang school mathematics pkogkam shoutdpupa/1.e .the student so that he/ihe is able to:
Ia. STATE TIE VALUE (4:PRESENTED BY EACH DIGIT IN A riLTI-DIGI TIECIMAL.NIVERAL
s.,
EssentialGrade N (3)
/Total (Sec.) 682 . 84.2%
Grade 8 357 83.2%
--Trade 10 236 86.0%
Grade 12 89 83.1%
Important, butnot Essential Optional
(2) e (1) MEAN S.D.
14.7 1.2 2.8 .4
16.2 0.6 2.8 .4
12,7 1.3 2.8 .4
13.5 '3.4 2.8 .5
22Ses
4
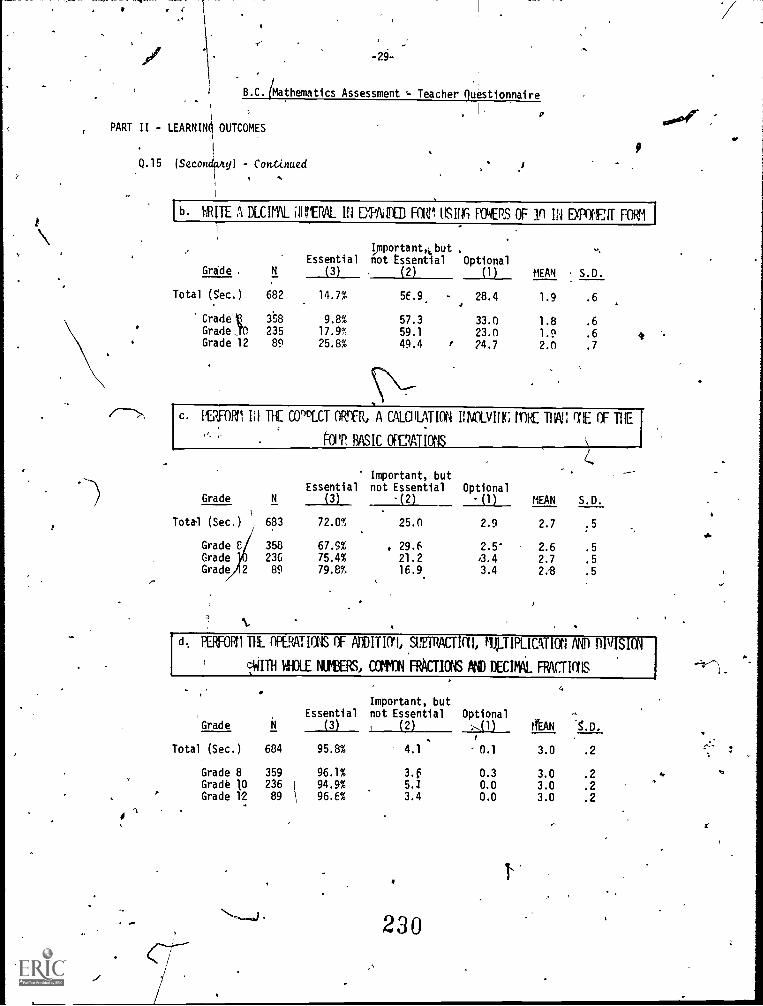
-29-
B.C. (Mathematics Assessment
PART II - LEARNING OUTCOMES
Q.15 (Secon
ea.
- Continued
Teacher uestionnaire
f
,
I b. 1.111TE A DECIMAL. 1111tERAL IN DTAILOO) FO(" US Ii FOPS OF lo IN MIDI FORM I
Grade .
Essential
(3)
Total (5ec.) 682 14.7%
Crade 358 9.8%Grade J0 235 17.9%Grade 12 89 25.8%
ImportantOutnot Essential Optional
(2)
56.9
57.359.1
49.4 r
(1) MEAN S.D.
28.4 1.9 .6
33.0 1.8 .6
23.0 1.9 .6
24.7 2.0 .7
PERFORM 1;1 TIC COnICT ORITR, A CALCIILATION INVOLVING l'OIC TM!: rrIE OF THE
ATP BASIC OPERATIN
Grade N
Important, but
1)
Essen3tial not Ess2ential Opti(onal
MEAN S.D.
Total (Sec.)
Grade 8
GradeGrade
)
2
683
358236
89
72.0%
67.9%75.4%79.8%
25.0
. 29.621.216.9
2.9
2.5'
3.43.4
2.7
2.62.7
2.8
.5
.5
.5
.5
),
PERFOR1TIL OPERATIONS OF ADDITIO'1, SUETRACT1011, 11.11.TIPLIDT111 AND D1vISION
DswiTH W,FIOIE NutERs, cam FRACTIGIS DECIMAL FRACTIONS
EssentialImportant, butnot Essential Optional
-S.D.Grade (3) (2) :,(1) ALAN
Total (Sec.) 684 95.8% 4.1 0.1 3.0 .2
Grade 8 359 96.1% 3.6 0.3 3.0 .2Grade 10 236 94.9% 5.1 0.0 3.0 .2Grade 12 89 96.6% 3.4 0.0 3.0 .2
230
1'
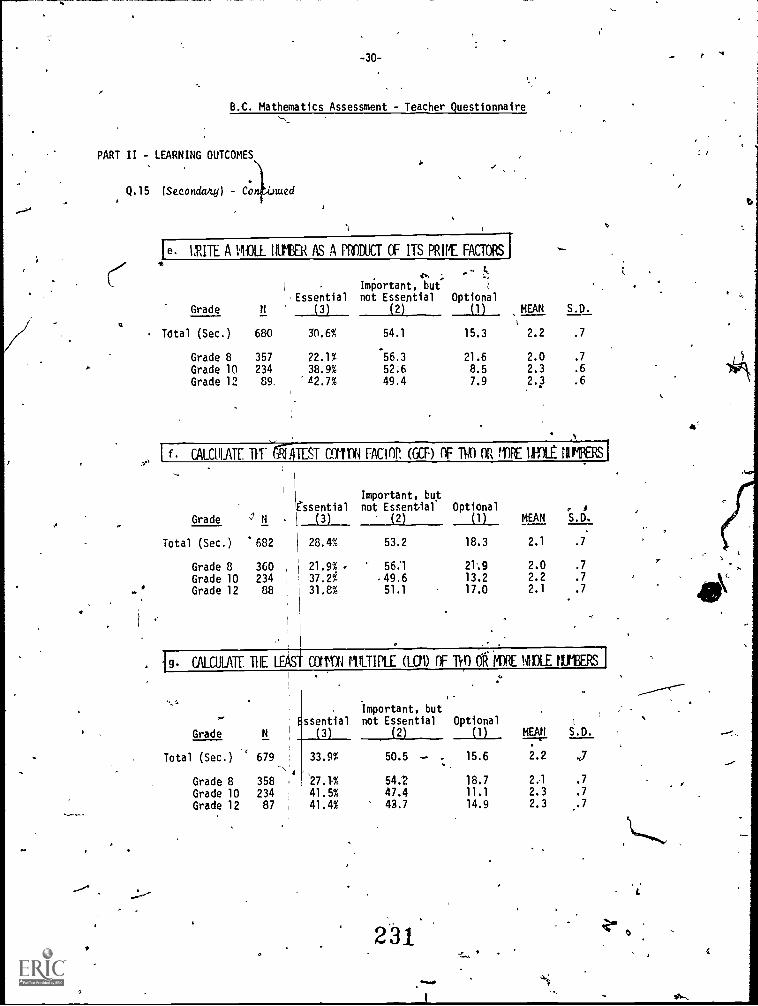
-30-
B.C. Mathematics Assessment - Teacher Questionnaire
PART II - LEARNING OUTCOMES
Q.15 (Secondaky)
(
wed
'
le. WRITE A ;MOLL 119130i AS A PRODUCT OF ITS PRIZE FACTORS
Important, but1,Essential not Essential Optional
Grade N (3) (2) (1) MEAN S.D.
Total (Sec.) 680 30.6% 54.1 15.3 2.2 .7
Grade 8 357 22.1% 56.3 21.6 2.0 .7
Grade 10 234 38.9% 52.6 8.5 2.3 .6
Grade 12 89, -A2.7% 49.4 7.9 2.3 .6
1 f. CALCULATE T11--ZTEST FACIOR (GU) OF NO OR !PPE UROI
Grade Nessential
(3)
Total (Sec.) '682 28.4%
Grade 8 360 , 21.9%
Grade 10 234 37.2%
Grade 12 88 , 31.8%
Important, butnot Essential Optional
(2) MEAN S.O.
53.2 18.3 2.1 .7
56:1
49.651.1
21.9 2.0 .7
13.2 2.2 .7
17.0 2.1 .7
I9. CALCULATE TIE LEASt rtILTIPLE (L01) OF 1r (0 IMRE IJIDLE tIUTERS
..,
Grade N
679
35823487
1
I
1
;
ssential
3
Important, butnot Essential
(2)
OptionalLu MEAN
2.2
2.1
2.32.3
1
S.D.
Total (Sec.) '
Grade 8Grade 10Grade 12
33.9%
27.1%1
1
41.5%41.4%
.
50.5
54.247.443.7
15.6
18.711.1
14.9
.J
.7
.7
,.7
231
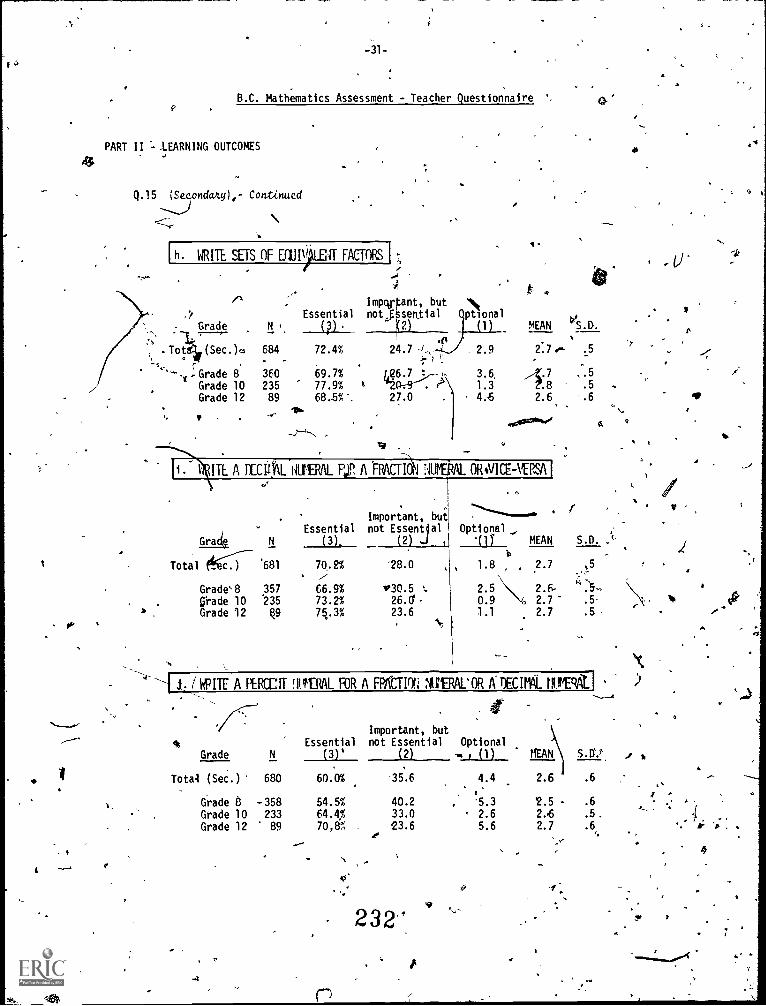
f
o°
-31-
B.C. Mathematics Assessment - Teacher Questionnaire9
PART II - ,LEARNING OUTCOMES
4 J
Q.15 ,.....ife5.ondatcy),- Cont-Lnued
h. WRITE SETS OF ECIJI)LEIT FACTORS]
t% Impvtant, but 'N.', Essential not,,Esential ptional
. Grade,---7- N (2) ',-,
. Tot (Sec.),4 684 72.4% 24.7 -/.. . . -',-'
;Grade 8 360 69.7%Grade 10 235 77.9% tGrade 12 89 68.5%^. 27.0 .
lb
2.9
3.6,1.34.5
MEAN S.D.
1:7.8
2.6
, .5.5.6
.00wasfwo
ITE A DECOL 1411UAL PjP, A 'FRACTI 1 NUNEML ORWICE-WRSA I
. Important, buts
' Essential not Essentlal 1
Gra4 N (3). (2) J c
Total (.1:) '681 70.2% '28.0
Grade'8 357 66.9% 30.5 s.Qiade 10 235 73.2% 26.0' -Grade 12 Q9 7§,.3% 23.6
Optional-(1) MEAN S.O.
1.8 2.7 .5
2.50.9 <, 2.7 .51.1 2.7 .5
1. WPITE A PERCCIT 9.11RAL FOR A FRACTION NWERAL'OR A DECIMAL rIVERAII
1
Grade N
680
-358233
89
Tota4 (Sec.)
Grade 8Grade 10Grade 12
4
2'
14.
A
EssentialImportant, butnot Essential Optional
(3)' (2) > > (1) MEAN S.A.4
60.0% 35.6 4.4. ,
2.6 .6,
54.5% 40.2 ,c
5.3 '2.5 - .664.4% 33.0 ° 2.6 2.6 .5.70,8%
.e.23.6 5.6 2.7 .6
232-
4
7
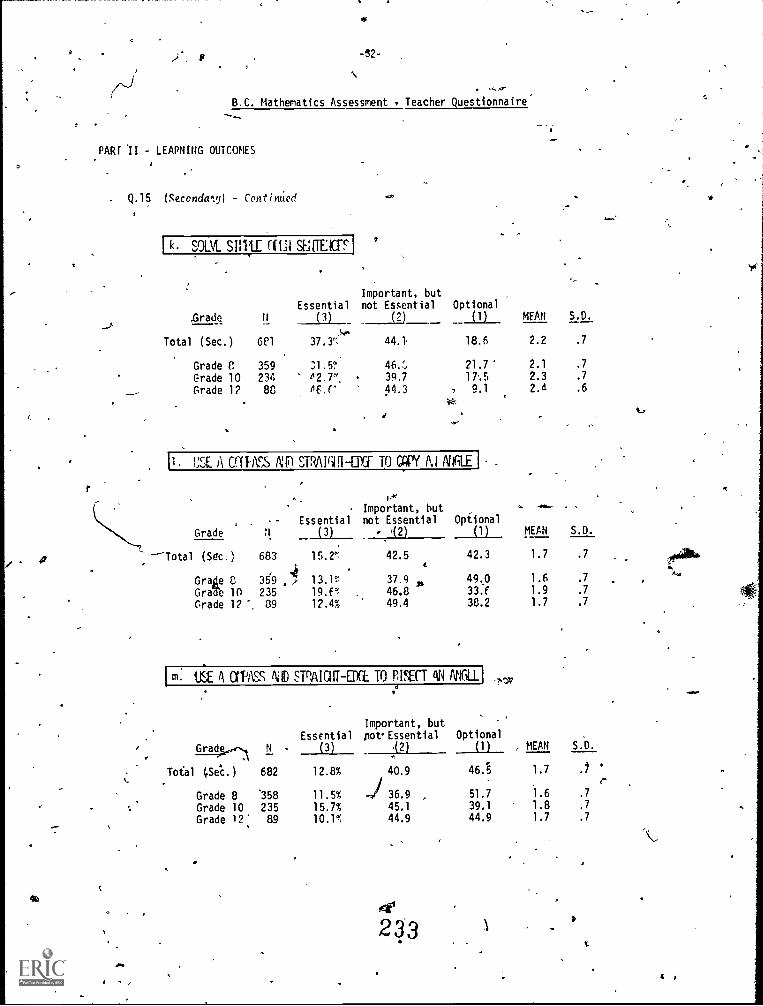
II, USE A allASS AS) STRANIII-OYI TO GAR`( 1`..1 NfiLE 1
4'
-52-
4+1.
B.C. Mathematics Assessment Teacher Questionnaire
PART II - LEARNING OUTCOMES
. Q.15 (Secondaltyl - Contimied
r
1 k. SOU SUItE 1(111 SUE:CFI
Grade N
Essential
(3)
Important, butnot Essential
(2)
Optional
(1) MEAN S.D.
Total (Sec.) 6el..%..
37.3 44. 18.6 2.2 .7
Grade C 359 31.5% 46.E 21.7 2.1 .7
Grade 10 234 e2.7% . 39.7 17.5 2.3 .7
Grade 12 88 ne..e^ 44.3 7 9.1 2.A .6
Grade N
P
Essential
(3)
Important, butnot Essential
q2)Optional
(1) MEAN S.D.
--Total (Sec.) 683 15.2% 42.5 42.3 1.7 .7t
Grate C 359 y 37.9 49,0 1.6 .7
Grab 10 235 19.f% . 46.8 33.f 1.9 .7
Grade 12 39 12.4% 49.4 38.2 1.7 .7
m. USE A CflASS AND STPAICIET-OXL TO BISECT AN 1'NGLL1
Important, but
Essential notEssential Optional
Grad N (3) 42) (1) , MEAN S.D.
Total (.5e.c.) 1 682 12.8% 40.9 46.5 1.7 .7 '
-1.6
r
Grade 8 *358 11.5% -4/ 36.9 , 51.7 .7
Grade 10 235 15.7% 45.1 39.1 1.8 .7
Grade 12' 89 10.1% 44.9 44.9 1.7 .7
4
L
;
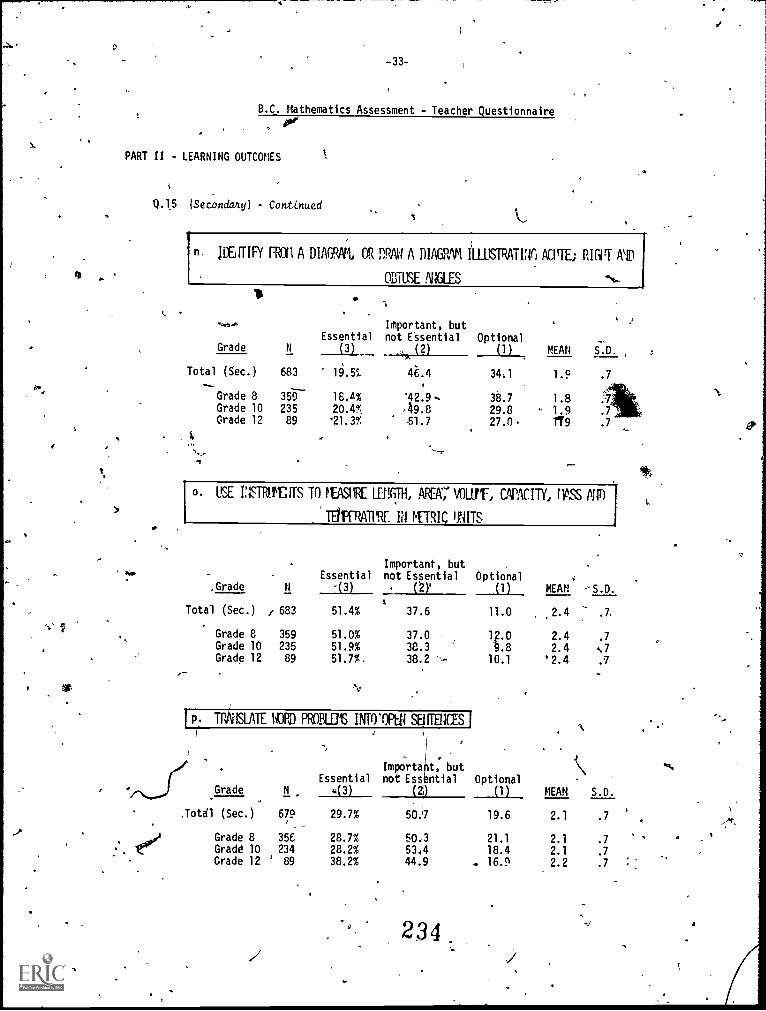
e.
-33-
.
B.C. Mathematics Assessment - Teacher Questionnaire
I-
PART II - LEARNING OUTCOMES
1 .1.5 (Secondary) - Conti.nued
n. WEJTIFY Fitli A DIAGRAM., OR DRAW A DIAGRVI illBSTRATINO ACIrTE; RIOT AID
OBTUSE ANGLES
1
IMportant, butEssential not Essential Optional
Grade N (3) (2) (1) MEAN S.D. c
Total (Sec.) 683 19.55 4.4 34,1 1.9
Grade 8 359 15.4% '42.9-, 38.7 1.8Grade 10 235 20.4% 19.8 29.8 , 1.9Grade 12 89 21.3% 51.7 27.0, 119
.7
o. USE rtSTREITITS TO ITASURE LOGTH, AREA,' VOLUT, CAPACITY, ntiss PMin
TEIVIRATPRE. III f[ TRIO ifrNITS
Important, but ,
Essential not Essential Optional,Grade N -(3) oy (1)
4
Total (Sec.) / 683 51.4% 37.6 11.0
Grade 8 359 51.0% 37.0 l .0Grade 10 235 51.9% 38.3
iJ
Grade 12 89 51.7%. 38.2 -- 10.1
j P. m, 'SLATE 140P0 PROBLEM IP/0Ni surrEm
Grade
IOW (Sec.)
Grade 8Grade 10Grade 12
Essential
_
Important, butnot Ess ntial Optional
N 443) (2) (1)
679 29.7% 50.7 19.6
356 28.7% 50.13 21.1234 28.2% 53.14 18.4
' 89 38.2% 44.9 . 16.9
234
,,
MEAM ,S.D.
2.4 .7,
2.4 .7
2.4 0'2.4 .7
MEAN S.D.
2.1 .7
2.1 .7
2.1 .7
2.2 .7
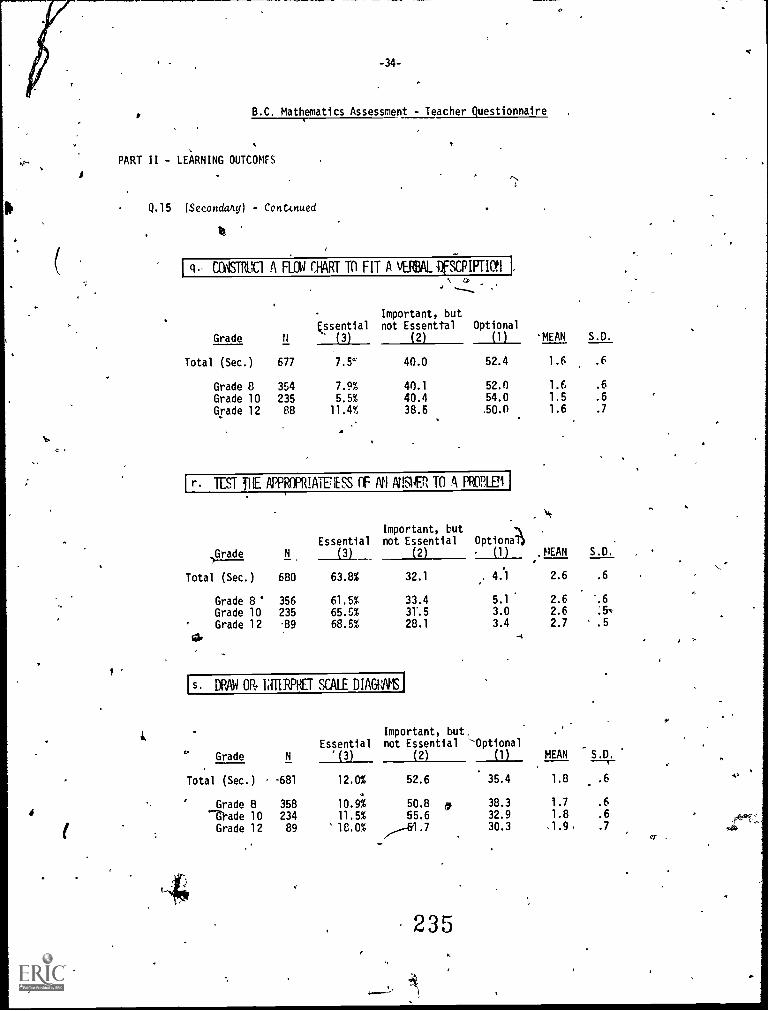
-34-
B.C. Mathematics Assessment - Teacher Questionnaire
PART II - LEARNING OUTCOMES
0
Q.15 (Secondary) Contknued
q. CNISTTCC1 A FLOW CHART TO FIT A vERBALIDFSCRIPTIOM
Essential
\ Co
Important, butnot Essential Optional
Grade N (3) (2) ILL MEAN S.D.
Total (Sec.) 677 7.5°.' 40.0 52.4 1.6 .6
Grade 8 354 7.9% 40.1 52.0 1.6 .6
Grade 10 235 5.5% 40.4 54.0 1.5 .6
Grade 12 88 11.4% 38.6 .50.0 1.6 .7
I r- TEST 111E APPROPRIATEISS OF Afl N13f.r; TO A PROPLE1
Important, butEssential not Essential Optional
G)_ rade N (3) (2) :ILL ,MEAN S.D.
Total (Sec.) 680 63.8% 32.1 . 4.) 2.6 .6
Grade 8 * 356 61.5% 33.4 5.1 2.6 '.6
Grade 10 235 65.5% 31.5 3.0 2.6 .5A.
Grade 12 89 68.5% 28.1 3.4 2.7 .5
0.,
I s. DRAW OR. hiTIRPKET SCALE DIAGIMS I
-
iEssential
Important, butnot Essential -Optional
Grade N '(3) (2) (1) MEAN S.D.
Total (Sec.)(Sec.) -681 12.0% 52.6 35.4 1.8 .6
Grade 8 358 10.9% 50.8 * 38.3 1.7 .6
.11.ade 10 234 11.5% 55.6 32.9 1.8 .6
Grade 12 89 ° MO% -61.7 30.3 .1.9. .7
'
235
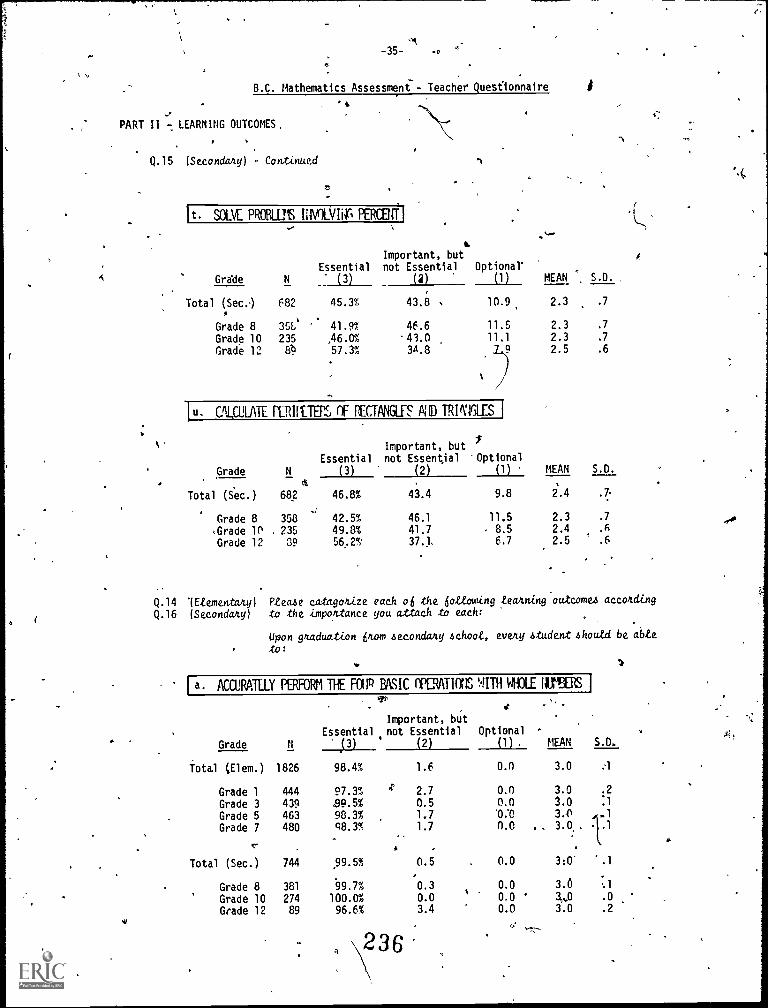
4
-35-
B.C. Mathematics Assessment - Teacher Questionnaire
PART II LEARNING OUTCOMES.
Q.15 (Secondary) - Cont,Lnued
Optional'
It. SOLE PROBLEM PERCENT'
Important, but
Essential not EssentialGrdde N (3) (2) (1)
Total (Sec.) F82 45.3% 43.8 . 10.9,$
Grade 8 35E,' '' 41.9% 46.6 11.5
Grade 10 235 )46.0% 43.0 11.1
Grade 12 8?1 57.3% 34.8 L9
lu- CALCULATE PERIIIIEPS OF PECTANGLFS AND TRPINGLES I
MEAN *. S.D.
2.3 .7
2.3 .7
2.3 .7
2.5 .6
Essential
Important, butnot Essential Optional
Grade N (3).
(2) (1) MEAN S.D.. 4
Total (Sec.) 682 46.8% 43.4 9.8 2.4 .7
..,
Grade 8 358 42.5% 46.1 11.5 2.3 .7
<Grade W , 235 49.8% 41.7 8.5 2.4 AGrade 12 39 56.2%. 37.1. 6.7 2.5 .6
Q.14 Ittementatyl Ptea,se catagonize each o6 the Otto:ding teaming outcoma according
Q.16 (Secondary) to the .importance you attach to each:
Upon paduat,Zon Vtom zecondany 4choot, et/ay 4tadent 4houtd be abLe
to:
a. ACCURATELY PERFORM THE HO BASIC OPERATIMS WITH WHOLE HMIS
Important, but
Essential not Essential Optional -
Grade N (3) (2) (1) . MEAN S.D.
Total (Elem.) 1826 98.4% 1.6 0.0 3.0 ..1
Grade 1 444 97.3% .1' 2.7 0.0 3.0 .2
Grade 3 439 9 9.5% 0.5 0.0 3.0 :1
Grade 5 463 98.3% 1.7 T):0 3.4l .1
Grade 7 480 q8.3% 1.7 0.0 . _ 3.0, , .1
* -
Total (Sec.) 744 99.5% 0.5 0.0 3:0" ".1
Grade 8 381 99.7% 0.3 0.0 3.6 -.1
Grade 10 274 100.0% 0.0 0.0 3,,,0 .0
Grade 12 89 96.6% 3.4 0.0 3.0 .2
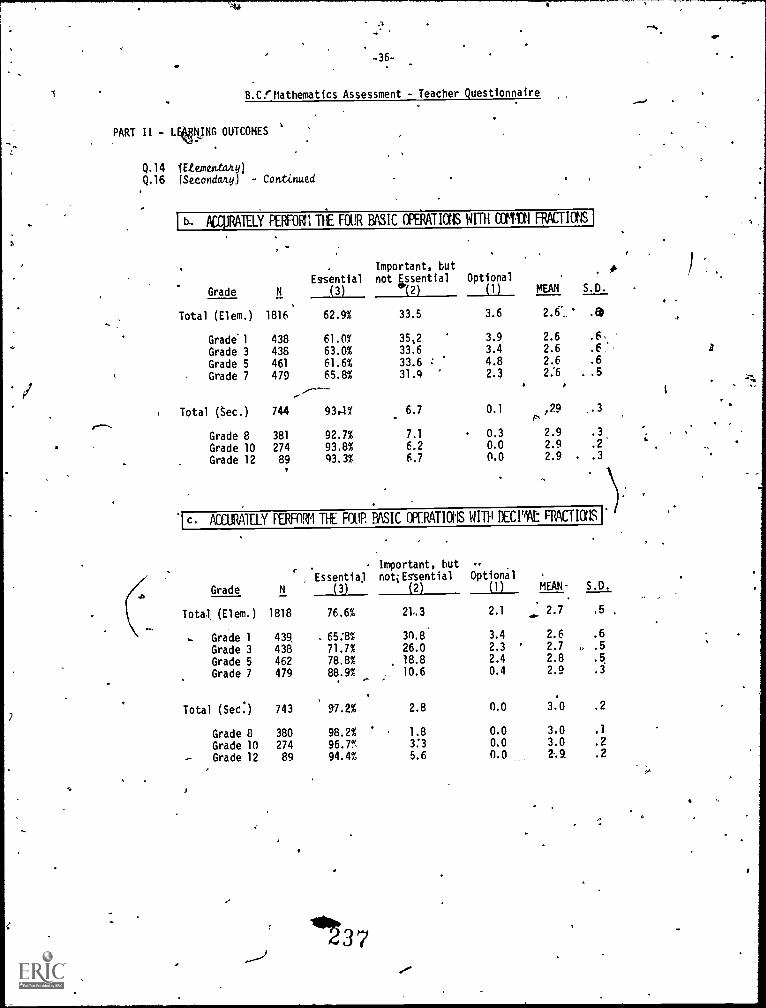
-36-
B.C1Mathematics Assessment - Teacher Questionnaire
PART II - 160JNG OUTCOMES '
Q.14 lEtementa.A.0
Q.16 (Secondary) - Continued
[10- ACCIRATELY PERFORM TIE FOUR BASIC OPERATIONS FRAmals]
Grade
Total (Elem.)
Grade'l
Grade 3Grade 5Grade 7
Total (Sec.)
Grade 8Grade 10Grade 12
Essential
(3)
1816 62.9%
438 61.0%438 63.0%
461 61.6%479 65.8%
744 93,4%
381 92.7%
274 93.8%89 93.3%
Important, but
not Essential
(2)
33.5
35,2
33.6
33.6 :
31.9
6.7
7.1
6.2
6.7
Optional(1) MEAN S.D.
3.6 2.fi .6)
3.9
3.4
4.82.3
2.6 .6,
2.6 .6
2.6 .6
2:6 . .5
0.1 ,29 .3
0.3
0.0
0.0
2.92.9
2.9
.3
.2'
.3
1c. AcCURAILY PERFORM THE FIE BASIC OPERATIONS WITH DECIMAL FRACTICOSI
Grade
rEssentiaj
(3)
Important, but
not; Essential
(2)
Optio(1nal
) MEAN- S.D.
Total (Elem.) 1818 76.6% 21.3 2.1 2.7 .5
Grade 1 439 65:8% 30.8 3.4 2.6 .6
Grade 3 438 71.7% 26.0 2.3 2.7 .5
Grade 5 462 78.8% /8.8 2.4 2.8 .5
Grade 7 479 88.9% 10.6 0.4 2.9 .3
Total (Set.) 743 97.2% 2.8 0.0 3:0 .2
Grade 8 380 98.2% ' 1.8 0.0 3.0 .1
Grade 10 274 96.7% 3:3 0.0 3.0 .2
Grade 12 89 94.4% 5.6 0.0 2.8 .2
37_-}
4P
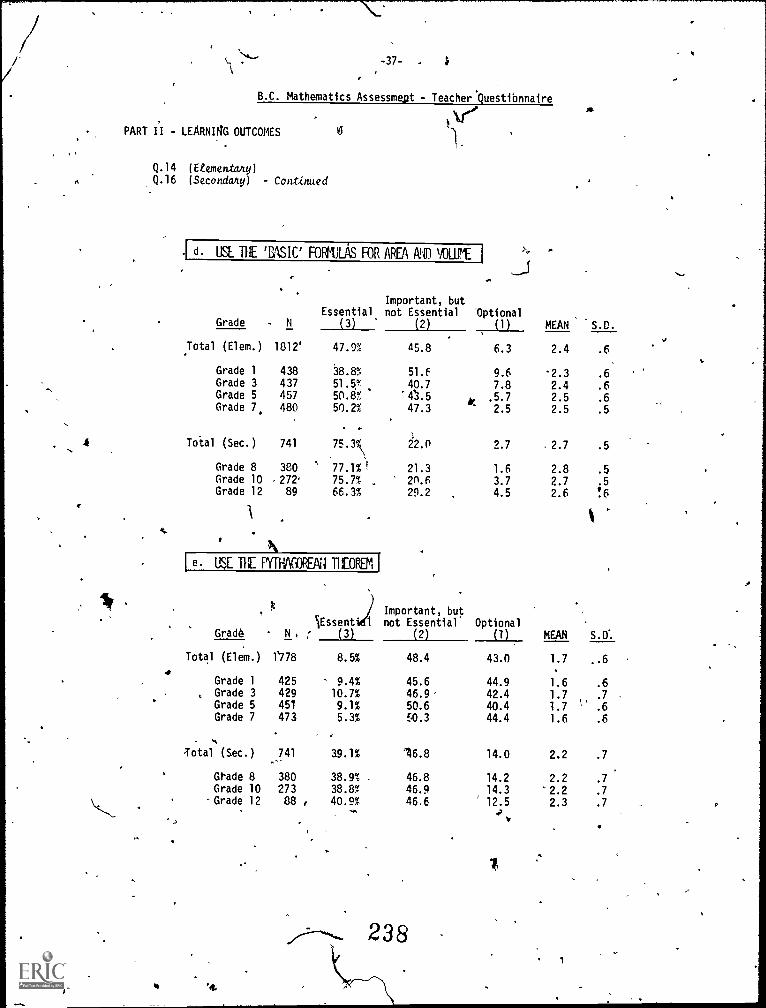
-37- 5
B.C. Mathematics Assessmept - Teacher.Questibnnaire
PART II - LEARNING OUTCOMES
Q.14 (Etementaky)Q.16 (Secondary) - Continued
d. USE THE TASIC' FORVULAS FOR AREA P) VOLUME
Grade - NEssential
(3)
Important, butnot Essential
(2)
'Optional
(1) MEAN S.D.
Total (Elem.) 1812' 47.9% 45.8 6.3 2.4 .6
Grade 1 438 38.8% 51.6 9.6 -2.3 .6Grade 3 437 51.5y 40.7 7.8 2.4 .6Grade 5Grade 7,
457480
50.8%50.2%
'43.547.3
k. .5.72.5
2.52.5
.6
.5
- .1
4 Total (Sec.) 741 75.3% 22.0 2.7 2.7 .5
Grade 8 380 77.1%) 21.3 1.6 2.8 .5Grade 10 -272' 75.7% . 20.6 3.7 2.7 .5Grade 12 89 66.3% 29.2 4.5 2.6 !6
A
e a TIE MINOPEAll TI OREN
Essenti)Grade N (3)
Total (Elem.) 1'778 8.5%
Grade 1 425 9.4%Grade 3 429 10.7%Grade 5 451 9.1%Grade 7 473 5.3%
Total (Sec.) 741 39.1%
Grade 8 380 38.9% .
Grade 10 273 38.8%-Grade 12 88 , 40.9%
Important, butnot Essential
(2)
Optional
(1) MEAN S.D.
48.4 43.0 1.7 ..6
45.6 44.9 1.6 .646.9 42.4 1.7 .7
50.6 40.4 1.7 \' .650.3 44.4 1.6 .6
146.8 14.0 2.2 .7
46.8 14.2 2.2 .7
46.9 14.3 2.2 .7
46.6 12.5 2.3 .7
238
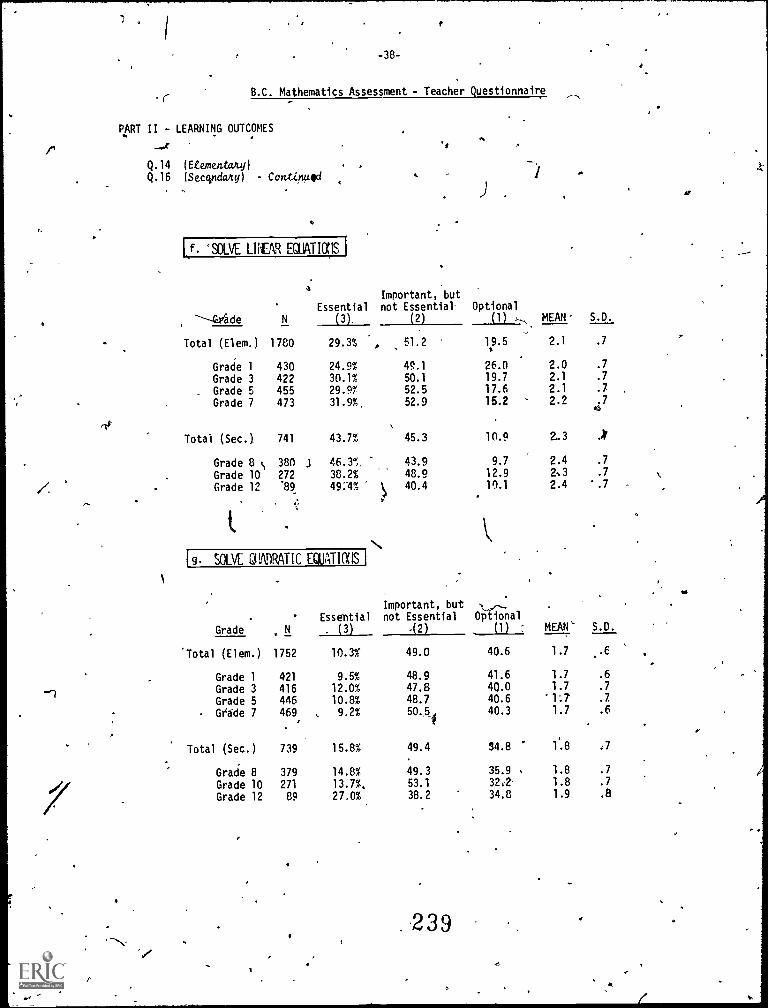
,
r
-38-
B.C. Mathematics Assessment - Teacher Questionnaire
PART II - LEARNING OUTCOMES
r
Q.14 (Etementany)Q.16 (Secondary) - Contingid
Lf 'SOLVE LINEAR EQUATITS
made N
Essential
(3),
Important, butnot Essential
(2)
Optional(1) MEAN' S.D.
J'
Total (Elem.) 1780 29.3% , 51.2 19.5 2.1 .7
Grade 1 430 24.9% 49.1 26.0 2.0 .7
Grade 3 422 30.1% 50.1 19.7 2.1 .7
_ Grade 5 455 29.97 52.5 17.6 2.1 .7
Grade 7 473 31.9%, 52.9 15.2 2.2 .7.t.
Total (Sec.) 741 43.7% 45.3 10.9 2.3 .*
Grade 8 t 380 J 46.37 43.9 9.7 2.4 .7
Grade 10 272 38.2% 48.9 12.9 2 .7
Grade 12 '89 49:4% k 40.4 10.1 2.4 '.7
,
,
Important, butnot Essential
.
\-,--Optional
[g SOLVE QUADRATIC EQUATIONS
1
Essential
Grade N . (3) .(2) (1) 7 MEAN° S.D.
'Total (Elem.) 1752 10.3% 49.0 40.6 1.7 .
Grade 1 421 9.5% 48.9 41.6 1.7 .6
1 Grade 3 416 12.0% 47.8 40.0 1.7 .7
Grade 5 446 10.8% 48.7 40.6 '1:7 .7
Gedde 7 469 9.2% 50.5, 40.3 1.7 .6
?
_
Total (Sec.) 739 15.8% 49.4 34.8 1.8 :7
Grade 8 379 14.8% 49.3 35.9 % 1.8 .7
Grade 10 271 13.7%, 53.1 32:2' 1.8 .7
Grade 12 89 27.0% 38.. 2 34.8 1.9 .8
239
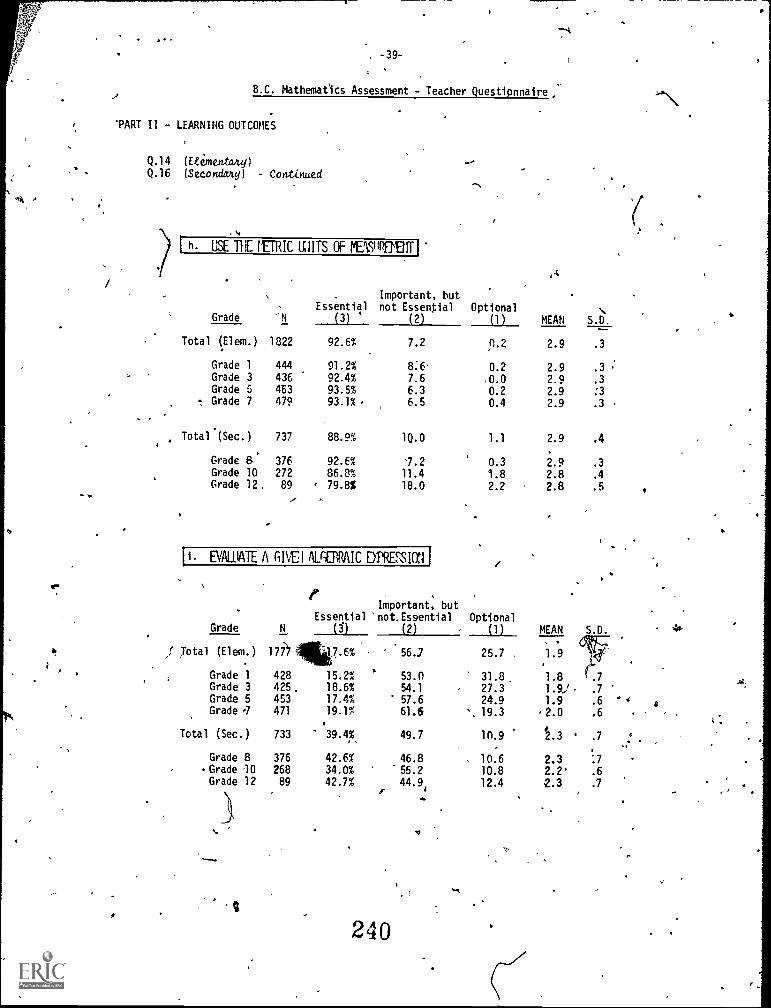
-39-
B.C. Mathematics Assessment - Teacher Questionnaire
'PART II - LEARNING OUTCOMES
Q.14 (E6mentaty)Q.16, (Secondiay) Continued
h. USE THE IETRIC 111ITS OF NEWRIFEtir I
.
EssentialImportant, butnot Essential Optional
Grade -N (3) (2) (1) MEAN S.D.
Total (Elem.) 1822 92.6% 7.2 9.2 2.9 .3.
Grade 1 444 91.2% 8:6- 0.2 2.9 .3Grade 3 436 92.4% 7.6 0.0 2.9 .3Grade 5 4t3 93.5% 6.3 0.2 2.9 :3
,., Grade 7 479 93.1% . 6.5 0.4 2.9 .3
Total(Sec.) 737 88.9% MO 1.1 2.9 .4
Grade 8 376 92.6% .2 0.3 2.9 .3Grade 10 272 86.8% 11.4 '1.8 2.8 .4Grade 12, 89 ' 79.8% 18.0 2.2 2.8 .5
..,
EVALUATE A GIEI Alf-CRAIC DTRMIrti I
Important, butEssential 'not.Essential Optional
Grade N (S) (2) (1) MEAN S.D.
.56-7
. . 470.;I Total (Elem.. ) 177), 7.6% 25.7 . 1.9
Grade 1 428 15.2% 53.0 31.8, 1.8Grade 3 425. 18.6% 54.1 27.3 1.9) .7Grade 5 453 17.4% 57.6 24.9 1.9 .6Grade -7 471 19.1% 61.6 ', 19.3 .2.0 .6
.
Total (Sec.) 733 39.4% 49.7 10.9 '.3 ' .7
.
Grade 8 376 42.6% 46.8 . 10.6 2.3 :7.Grade 10 268 34.0% 55.2 10.8 2.2 .6Grade 12 89 42.7% 44.9,
r12.4 2.3 .7
240
Nak
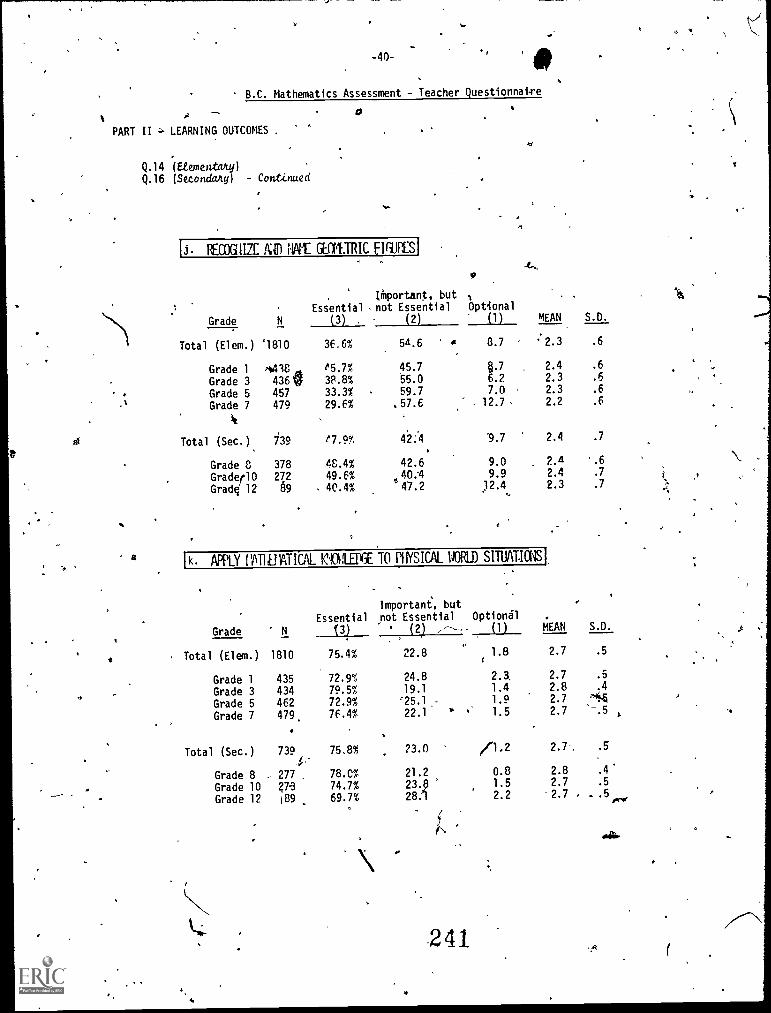
-40-'e
B.C. Mathematics Assessment - Teacher Questionnaire
A
PART Il LEARNING OUTCOMES ,
Q.14 (Etementaay)Q.16 (Secondary) Continued
1i. REcoanzE AM NAME GEOMETRIC EIWESI
9, .
Important, but ,
Essential not Essential Optional
Grade N (3) , (2) (1)
Total (Elem.) '1810 36.6% 54.6 4 8.7 '
Grade 1 4436 A e5.7% 45.7 il.7
Grade 3 436 3R.8% 55.0 6.2
Grade 5 457 33.3% 59.7 7.0
Grade 7 479 29.6% .57.6 , 12.7
4
Total (Sec.) 739 e7.9% 42 :4 '9.7
Grade 8 378 48.4% 42.6 9.0
Grader10 272 49.6% ..40:4 9.9
Gradc 12 89 40.4% 47.2 32.4- ,
a
MEAN S.D.
1k. APPLY f 'ATI,IPATICAL K(MLIEDGE TO PINSICAL WORLD SITUATIONS!
Total (Elem.) 1810 75.4% 22.8 1.8
Important, but
Essential not Essential Optional
Grade N t3) (2) ,----- (1)
Grade 1 435 72.9% 24.8 2.3.
Grade 3 434 79.5% 19.1 1.4
Grade 5 462 72.9% '25.1 - 1.9
Grade 7 479, 76.4% 22.1i. 1.5
Total (Sec.) 739 75.8% 23.0 /1,2
Grade 8 277 78.0% 21.2 0.8
Grade 10 273 74.7% 23.8 1.5
Grade 12 189 69.7% 28.'1 2.2
241
-.2.3 .6
2.4 .6
2.3 .6
2.3 .6
2.2 .6
2.4 .7
2.a '.6
2.4 .7
2.3 .7
MEAN S.D.
2.7 .5
2.7 .5
2.8 .4
2.7 "42.7 "-.5 ,
2.7-. :5
2.8 .4"
2.7 .5
2.7 . . .5 rv,
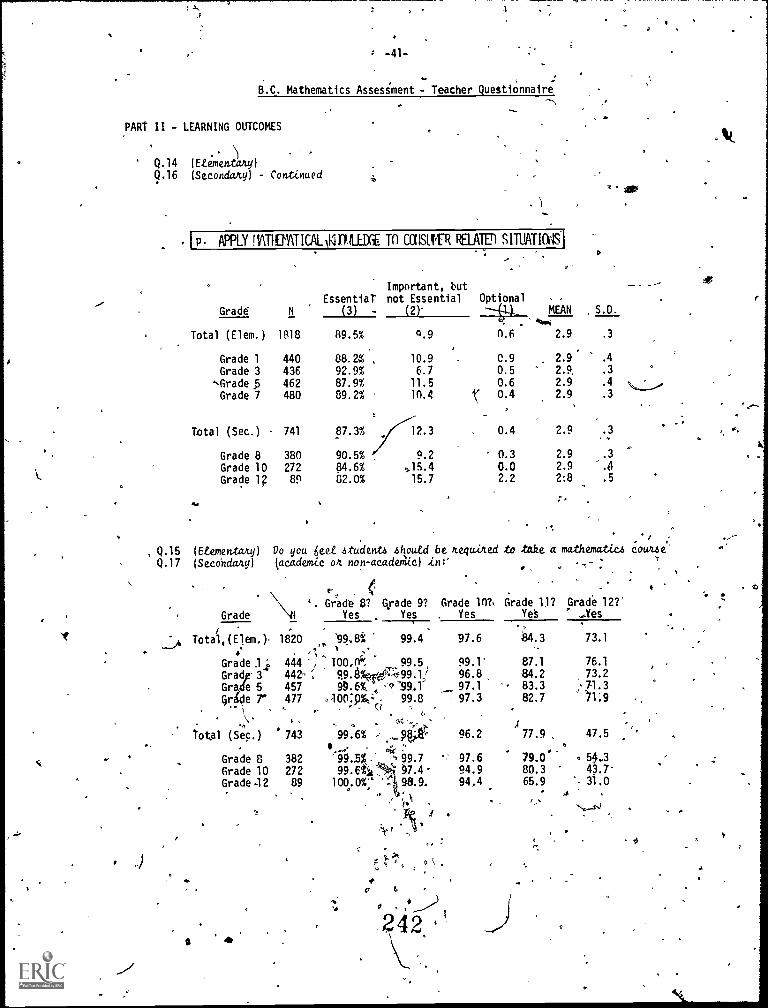
-41-
B.C. Mathematics Assessment - Teacher Questionnaire
PARE II - LEARNING OUTCOMES
Q.14 Etementany)9.16 (Secondary - Continued
APPLY !VITNErATICALItiJ l LEDGE TO (BEHR RELATE) SITLATIAiSjD
Important, but ____ _-
Essential' not Essential Optional
Grade N (3) - (2)- 44,._ MEAN , S.D.
44.4
2.9 .3
2.9 .4
2.9, .3.
2.9 .4 ..,,,_-_,,
2.9 .3
Total (Elem.) 1618 69.5% q.9 0.6
Grade 1 440 88.2% t 10.9 C.9
Grade 3 436 92.9% 6.7 0.5
',Grade 5 462 87.9% 11.5 0.6
Grade 7 480 89.2% 10.4 'k" 0.4
Total (Sec.) , 741 87.3% 12.3 , 0.4
Grade 8 380 90.5% 9.2 ' 0.3
\..Grade 10Grade 12
272
89
84.6%62.0%
05.415.7
0.02.2
2.9 .3
2.9 .3
2.9 -.A2:8 .5
/ -
, Q.15 (Ettmentany) Do you lied student4 showed be nequked to take a mathematics comae.'"
Q.17 Seeolidany) (, academic on non-aeadviie) Am:"
P.
5
, (
Grade
\\\ '.Grade 8? Grade 9? Grade 10?, Grade 11? Grade 12?'Yes Yes , Yes Yet ,Yes
Total,(Elem.). 1820 '98.8% 99.4 97.6 84.3 73.1..' 1 .
Grade .1,, 444 "'; Too.(*. 99.5 99.1' 87.1 76.1
Grad 3 442- ' 99.6 -:<99.1! 96.8, 84.2 73.2
Gr e 5 457 98.6%.. --98.1 97.1 ' 83.3 11.1:;
6r e 7°477 .100.:A- , 99.8 97.3 82.7,
1 'c .
\,. . ,
. 6
499.6% , .418;AP 96.2 77.9 , 47.5
Grade 8 382 99.5%, '., 99.7 97.6 79.0 t 5#-3
Grade 10 272 99.84, 97.4 94.9 80.3 43.7.
Grade 42 89 100,0 %0` -, 98.9. 94,4 65.9 31.0,
Total (Sec.) 4 743
/ 'fo.± 4
O t
.;
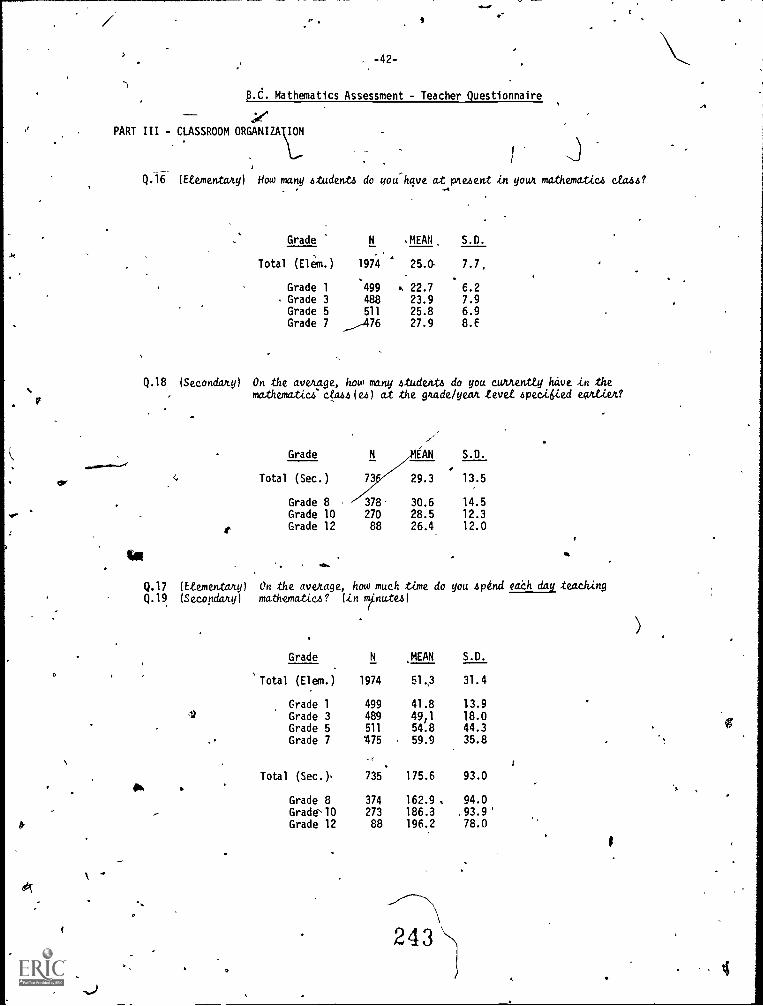
Or
-42-
p.d. Mathematics Assessment - Teacher Questionnaire
47/
PART III - CLASSROOM
Q.16 (Etementany) How many 4tudent4 do gouehave at pkezent in your mathematic4 ata44?
Grade N ,MEAN S.D.
Total (Elem.) 1974 25.0, 7.7,
Grade 1 499 22.7 6.2Grade 3 488 23.9 7.9Grade 5 511 25.8 6.9Grade 7 -476 27.9 8.E
Q.18 (Secondary) On the average, hotamany 4tudent4 do you cu./meaty have in .themathematic4-cta44(c4) at the 2/Lade/yea& Levet 4peciiiied evEtien?
Grade N 6N S.D.
Total (Sec.) 73. 29.3 13.5
Grade 8 378- 30.6 14.5
Grade 10 270 28.5 12.3
t Grade 12 88 26.4 12.0
Q.17 iEtementaky) On the average, how much time do you 4pind each day teachingQ.19 (Secondary) mativematice (in nfnute4)
Grade N MEAN S.D.
'Total (Elem.) 1974 51,3 31.4
Grade 1 499 41.8 13.9
Grade 3 489 49,1 18.0Grade 5 511 54.8 44.3
Grade 7 475 59.9 35.8
Total (Sec.), 735 175.6 93.0
Grade 8 374 162.9 94.0
Grade` 10 273 186.3 ,93.9'Grade 12 88 196.2 78.0
I
243
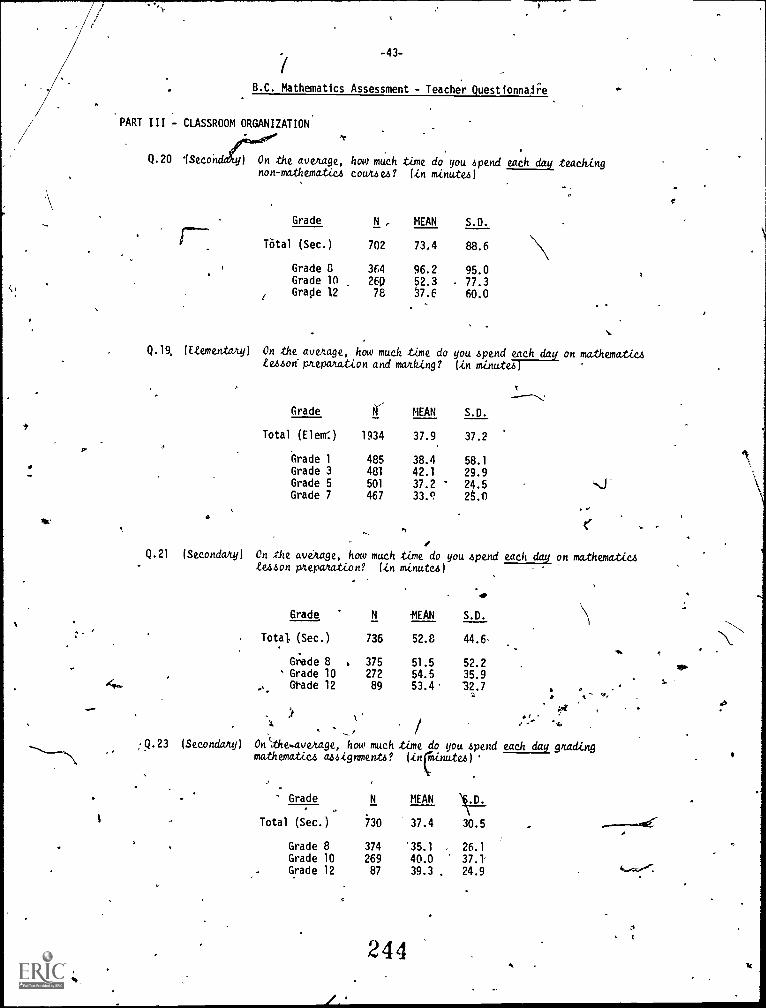
-43-
B.C. Mathematics Assessment - Teacher Questionnaii:e
PART III - CLASSROOM ORGANIZATION
dirge°Q.20 1Secon 1 On the ave/tage, how much time do you spend each day teaching
non-mathematia cout4e4? (in minute4)
Grade N , MEAN S.D.
TOtal (Sec.) 702 73,4 88.6
Grade 8 364 96.2 95.0Grade 10 260 52.3 77.3Grade 12 78 X7.6 60.0
s.
Q.19, (Etementaky) On the average, how much time do you spend each day on mathematic4teAsoiptepaution and ma/thing? (in minutes)
Grade N MEAN S.D.
Total (Elena) 1934 37.9 37.2
Grade 1 485 38.4 58.1Grade 3 481 42.1 29.9Grade 5 501 37.2 24.5Grade 7 467 33.9 25.0
IQ.21 (Secondary) On the average, how much time do you spend each day on mathew-au
.lesson puwation? (in minute4)
'4,
Grade N
736
MEAN S.D.
Total (Sec.) 52.8 44.6
Grade 8 . 375 51.5 52.2 IP&Grade 10 272 54.5 35.9Grade 12 89 53.4 32.7 0
)k /
Q.23 (Secondary) Onkhe.avenage, how much time do you spend each day gradingmathematiu assignments? (itinute4)
Grade N MEAN V.D.
1 Total (Sec.) 730 37.4 30.5 ---01Grade 8 374 '35.1 26.1Grade 10 269 40.0 37.Grade 12 87 39.3 24.9
244
1.
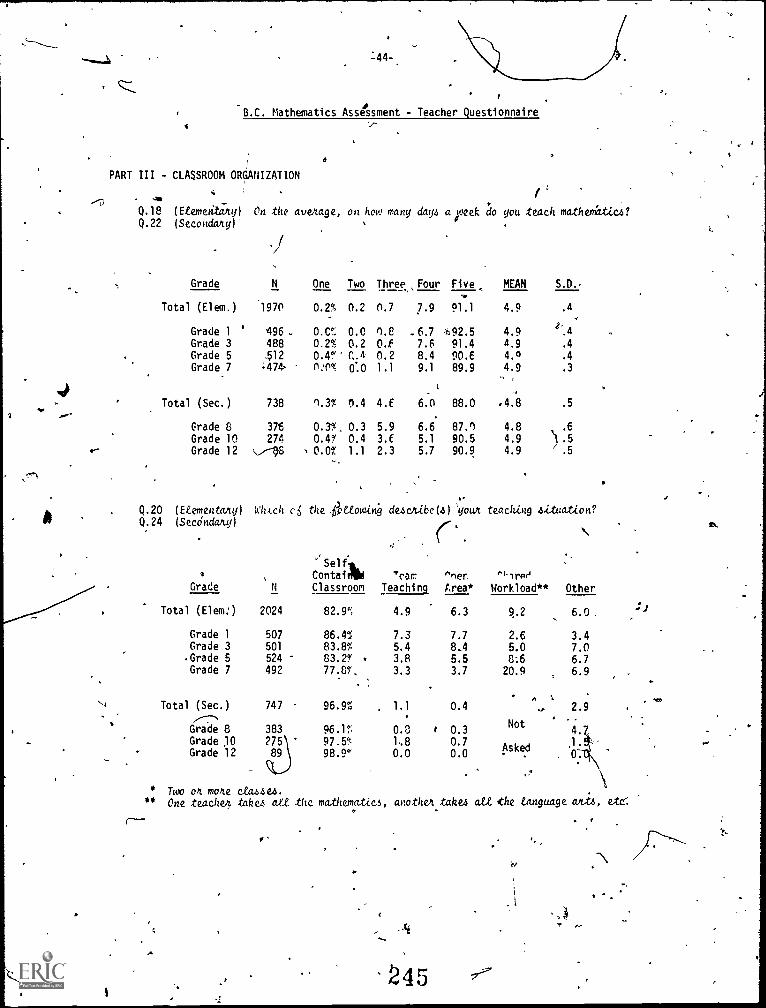
:44-,
B.C. Mathematics Assessment - Teacher Questionnaire
PART III - CLASSROOM ORGANIZATION
AM
Q.18 (Etementany) On the average, on how many days apeek I) you teach mathematiceQ.22 (Secondakyr
Grade N
'1970
496.488
.512
;474,
738
37t
274
.7-p6 1.
One
0.2%
0.C°:
0.2%
0.4%(':P
n.3%
0.3%.0.4%0.0%
Two
0.2
0.00.2
r,.4
0:0
D.4
0.3
0.41.1
Three,Four
0.7 7.9
7.8 _6.70.f 7.60.2 8.4
1.1 9.1
4.E 6.0
5.9 6.6
3.E 5.1
2.3 5.7
Five MEAN S.U.
Total (Elem.)
Grade 1 '
Grade 3Grade 5Grade 7
Total (Sec.)
Grade 8Grade 10Grade 12
91.1
.02.591.490.689.9
88.0
87.')
90.590.9
.
4.9
4.9d.9
4.0
4.9
.4.8
4.8
4.9
4.9
.4
4
.4
.4
.3
.5
.6
.5
.5
41
. Q.20 (Etementmny) Ouch 06 the ttowing due/Lac(.) 'pur teaching aituation?Q.24 (Secdndaty)
Grade N
2024
507
501
524
492
747
38327589
. .
Self iL
dbClassroom
'carTeaching
nner.
Area*(91r0r1
Workload** Other
Total (Elem:)
Grade 1Grade 3.Grade 5Grade 7
Total (Sec.)
Grade 8Grade 10Grade 12
82.9%
86.4%83.8%83.2" ,
77.8%.. .
96.9%.
96.1"/,
97.5%98.9'
4.9
7.35.43.83.3
. 1.1
0.3 I
180.0
6.3
7.78.4
5.53.7
0.4
0.30.7
0.0
9.2
2.6
5.08:620.9
A
Not
Asked- .
6.0.
3.47.0
6.76.9
2.9
4.
0-irk\
* Two oh mope ctaaaea.One .teacher tahez att the mathematics, anothektahea oil the Language antis, etc:
f
, s
'Z45
11.
oc,
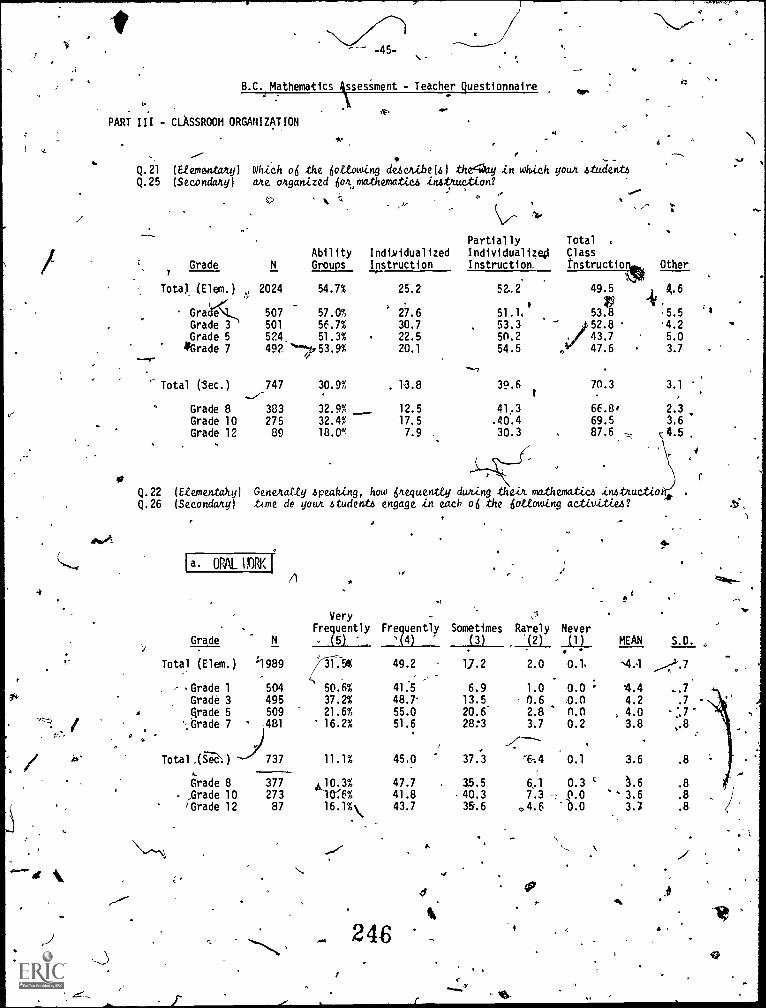
4
B.C.JMathematics Assessment - Teacher questionnaire
.
PART III CLASSROOM ORGANIZATION
Q.21 (EtementamlQ.25 (Secondary)
WILZeh o6 the Ottowing dderabe(4) the4i ay in which your 4.61:iiintaare organized donmathematicA inst/2414.ton?
J.
NJ,
Grade
'l
AbilityGroups
...,
IndividualizedInstruction
,. o'
PartiallyIndividualizedInstruction.
.....-
Total .
Classtnstructions,
.
.
Other7
Total_ (Elem.) 2024 54.7% 25.2 52,2 49.5 A.6
Graded 507 57.0% 27.6 51.1.V
53.8 .5.5:
Grade 3 501 56.7% 30.7 53.3 52.8 '4.2
Grade 5 524 51.3% 22.5 5n.2 /43.7 5.0
*Grade 7 492 `"7,53.9% 20.1 54.5 . 47.6 3.7
Total (Sec.) 747 30.9% . 13.8 39.6 70.3 3.1
Grade 8 383 32.9% 12.5 41,3 6E.8' 2.3
Grade 10 275 32.4% 17.5 .40.4 69.5 3,6
Grade 12 89 18.0", 7.9 . 30.3 87.6 4.5
Q.22 (Etemenbahy) Geneltatty ocaking, how 64equentty during than mathematica inattuctioQ.26 (Secondary tone de your atudent4 engage in each o6 the 6ottotoing activiti.e4?
4918
VeryFrequently
e
Frequently Sometimes
1
Rarely Never
ts
la. ORNLIM
Grade (5) '(4) (3) (2) (1) MEAN S.D
Total (Elem.) '"1989 49.2 1J.2 2.0 0.1. N4.1 .1.A.7
Grade 1 504 50.6% 41.5 6.9 1.0 0.0 4.4 -.7Grade 3 495 37.2% 48.7- 13.5 0.6 0.0 4.2 .7 -
Grade 5 509 21.6% 55.0 20.6 2.8 n.0 , 4.0%Grade 7 16.2% 51.6 28:3 3.7 0.2 3.8 ,13
;A' Total ,(S-e.) 737 11.1% 45.0 37.3 1'6:4 0.1 3.6 .8
Grade 8 377 10.3%4186%
47.7 35.5 6,.1 0.3 .6 .8
Grade 10 273 41.8 .40.3 7.3 0.0 - 3.6 .8
'Grade 12 87 16.1%\ 43.7 35.6 ,4.6 b.o 3.3 .8
24B
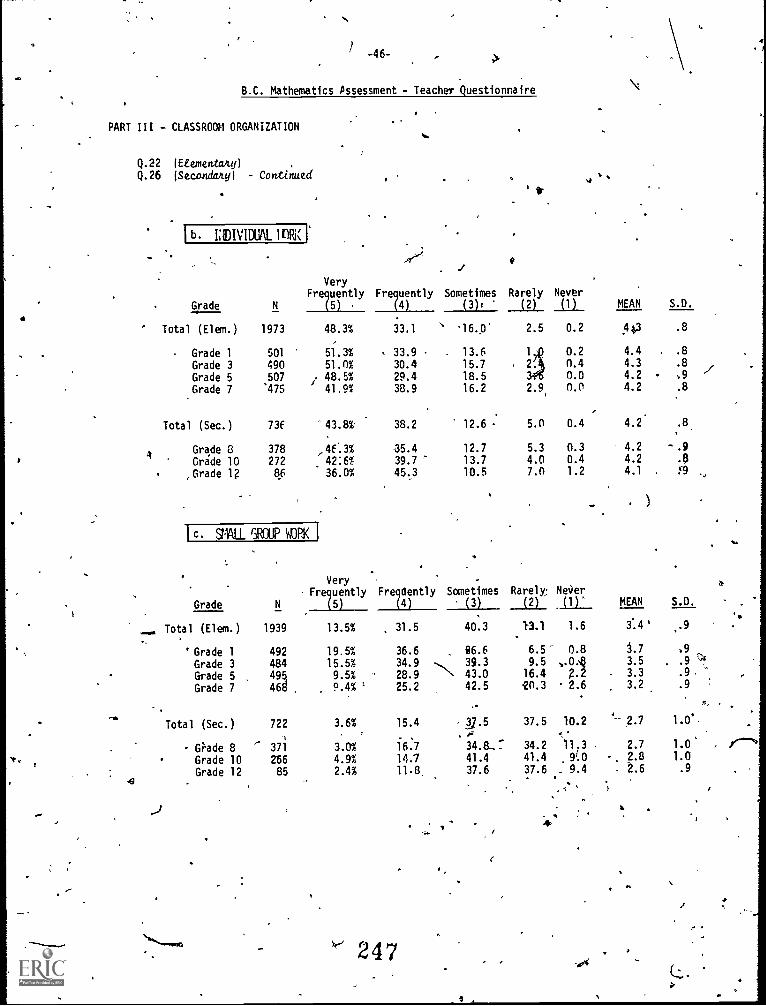
/MO
1 -46-
B.C. Mathematics Pssessment - Teacher Questionnaire
PART III - CLASSROOM ORGANIZATION
Q.22 (Etementmty)Q.26 (Secondary) - Continued
1 b EDIVIDUAL 1nRi(
VeryFrequently
Grp ade N (5)
' Total (Elem.)
Grade 1
Grade 3Grade 5Grade 7
Total (Sec.)
1973
501
490
507
.475
73E
/
48.3%
51.3%51.0%48 5%
41.9%
-43.8%
4Grade 8 378 ,4f..3%
Grade 10 272 42:6%,Grade 1? 8.6 36.0%
I c. S1WLL 1 JP 4,13PY
Grade
Total (Elem.)
' Grade 1
Grade 3Grade 5Grade 7
-,.
Total (Sec.)
- Grade 8Grade 10Grade 12
te .
.4)
Frequently Sometimes(4) (3)r
33.1 " -16.9°
33.9 . 13.6
30.4 15.7
29.4 18.538.9 16.2
.
38.2 12.6
35.4 12.7
39.7 ' 13.7
45.3 10.5
VeryFrequently Frequently Sometimes
N (4) (3)
1939 13.5% 31.5 40.3
492 19.5% 36.6 . 86.6
484 15.5% 34.9 .., 39.3
, 495 9.5% 28.9 \ 43.0
468 9.4% ' 25.2 42.5
722 3.6% 15.4 21.5,--
371 3.0% 16.7 34.8...7
266 4.9% 14.7 41.4
85 2.4% 11.8 37.6
24 7
1 t
Rarely Never(2) (1) MEAN S.D.
2.5 0.2 AO .8
1 0.2 4.4 . .8
, 2. 0.4 4.3 .8
0.0 4.2 ,9
2.9 0.0 4.2 .8
.
5.0 0.4 4.2 .8.
5.3 0.3 4.2 - .9
4.0 0.4 4.2 .$
7.0 1.2 4.1 , !-9
Rarely. NeVer(2) (1)" MEAN S.D.
1.3.1 1.6 3.4' ,.9
6.5- 0.8 1.7 A9.5 ,.04 3.5 .
9 '16.4 g.2 3.3
120.3 2.6 3.2 .9
37.5 10.2 2.7 1.0'
4.34.2 11.3 , 2.7 1.0'
41.4 9!0 -, 2.8 1.0
37.6 . 9.4 , 2.6 .9
44
I
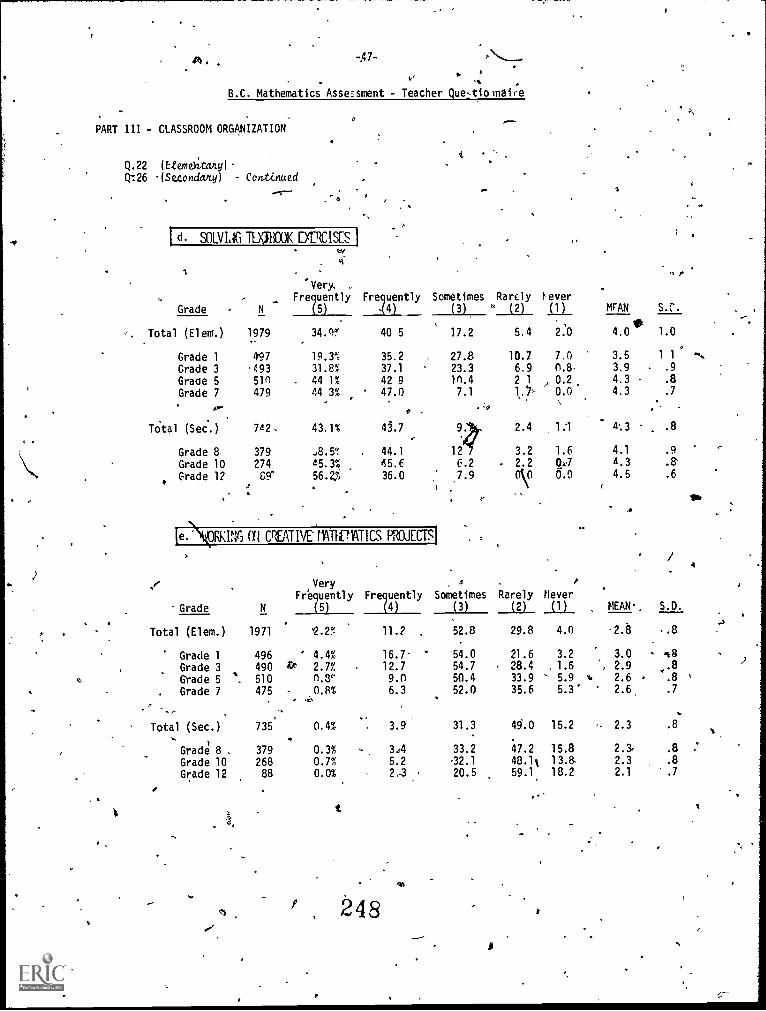
B.C. Mathematics Assersment - Teacher Que,tioinaire
PART III - CLASSROOM ORGANIZATION
Q.22 (Etemehtany)Q:26 -(Secondary) - Continued
1 d. SOLVIZ 11)51300K DTRCISES
.
1 . ,',
Very, Frequently Frequently Sometimes Rarely t,ever
Grade , N (5) 4 (3) " (2) (1) MEAN s.r.
Total (Elem.) 1979 34.9% 40 5 17.2 5.4 2:0 4.0. 1.0
.
Grade 1 497 19.3% 35.2 27.8 10.7 7.0 3.5 1 1 -..,
Grade 3 493 31.8% 37.1 23.3 6,9 0.8. 3.9 . .9
Grade 5 51n 44 1% 42 9 1n.4 2 1 , 0.2 4.3 - .8
Grade 7 479 44 3% 47.0 7.1 0, 0.0 4.3 .7
. ._
Total (Sec.) 7a2 43.1% 0.7 9i.. 2.4 1.1 4% 3 , .8
Grade 8 379 ..8.5*: . 44.1 12 7 3.2 1.6 4.1 .9
Grade 10 274 a5.3% 45.6 (.2 2.2 11.7 a.3 .Grade 12 CT 56.2 36.0 7.9 0\0 0.0 4.5 .6
RKING 1t CrIATIVE PATIPATICS MEM' .
Very , r .r
Frequently Fr rntly Sometimes Rarely Never
Grade N (3) (2) (1) MEAN, S.D.
.
Total (Elem.) 1971 /.2% 11.2 , 52.8 29.8 4.0 ,2.8 ..8
Grade 1 496 ' 4.4% 16.7 ' 54.0 21.6 3.2 3.0 1.8
Grade 3 490 & 2.7% 12.7 54.7 28.4 . 1.6 , 2.9 .8
Grade 5 *. 510 n.3" 9.0 50.4 33.9 ' 5.9 r. 2.6 .8
Grade 7 475 - 0.8% 6.3 52.0 35.6 5.3' 2.6, .7
' '').,
' ,
Total (Sec.) 735 0.4% 3.9 31.3 49.0 15.2 - 2.3 .8
Grade 8 . 379 0.3% 3,4 33.2 47.2 15.8 2.1 .8
Grade 10 268 0.7% 5.2 32.1 48.1% 13.8 2.3 .8
Grade 12 88 0.0% 2...2 20.5 59.1 18.2 2.1 .7
No.
,
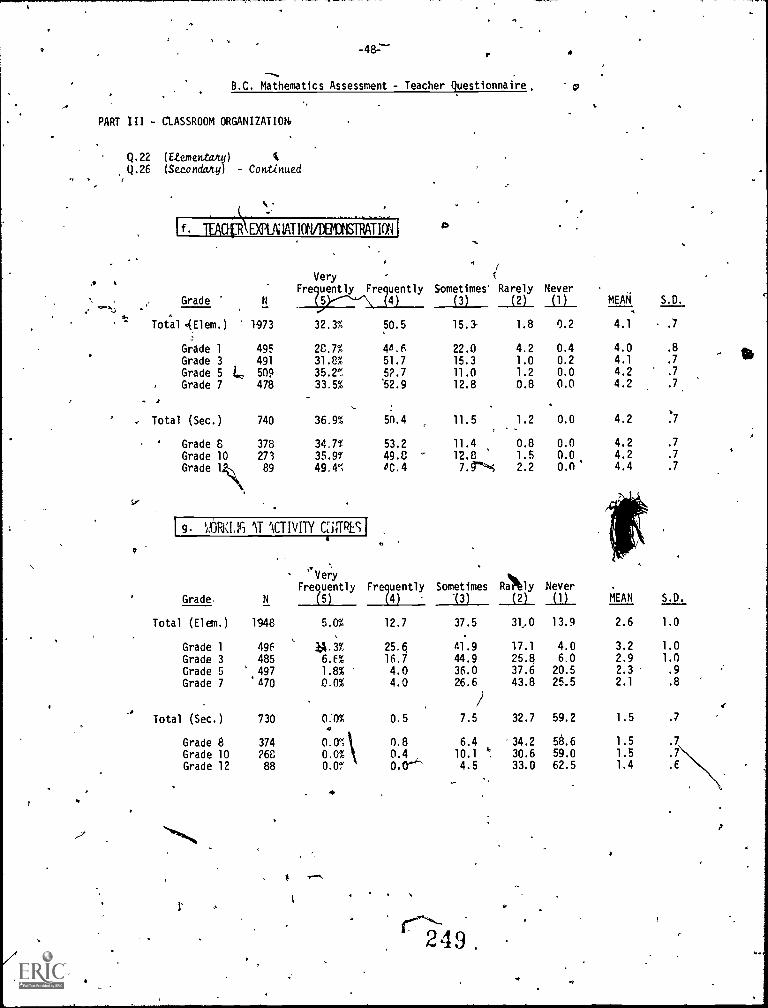
-48--
B.C. Mathematics Assessment - Teacher Questionnaire,
PART III - CLASSROOM ORGANIZATION
Q.22 (Etementatv)
Q.26 (Secondaty) Continued
4
SP
Sometimes' Rarely Never
If. RAW E41-MATIONABOISTRATIMI
Very -.9
Fre uently Fre uentlyGrade N 5 4 (3) (2) (1) MEAN S.D.
Total 4Elem.)z,
Grade 1
1973
495
32.3%
28.7%
50.5
421,6
15.1 1.8
22.0 4.2
0.2
0.4
4.1
4.0
.7
.8
Grade 3 491 31.8% 51.7 15.3 1.0 0.2 4.1 .7
Grade 5 L 509 35.r 5?.7 11.0 1.2 0.0 4.2 .7
Grade 7 478 33.5% '52.9 12.8 0.8 0.0 4.2 .7
. .
Total (Sec.) 740 36.9% 5n.4 11.5 1.2 0.0 4.2 :7e
Grade 8 378 34.7% 53.2 11.4 0.8 0.0 4.2 .7
Grade 10 273 35.9% 49.0 12.8 1.5 0.0 4.2 .7
Grade 89 49.4". 0C.4 7.g'4.5 2.2 o.n' 4.4 .7
1 9. 4!oN1.16 1T '\CTIVITY CifITES I
VeryFrequently Frequently Sometimes Rankly Never
Grade N (5) (4) '(3) (2) (1)
Total (Elem.) 1948 5.0% 12.7 37.5 31,0 13.9,
Grade 1 49E IA.3% 25.6 41.9 17.1 4.0
Grade 3 485 6.E% 16.7 44.9 25.8 6.0
Grade 5 497 1.8% 4.0 36.0 37.6 20.5
Grade 7 470 0.0% 4.0 26.6 43.8 25.5
)
Total (Sec.) 730 0.0% 0.5 7.5 32.7 59.2
Grade 8Grade 10
374
768
0.0A0.0%
0.80.4
6.410.1 '''.
34.2
30.6
58.6
59.0
Grade 12 88 0.0r 0.e.' 4.5 33.0 62.5
r-"`--.249
MEAN S.D.
2.6 1.0
3.2 1.0
2.9 1.0
2.3 .9
2.1 .8
1.5 .7
1.5
1.51.4
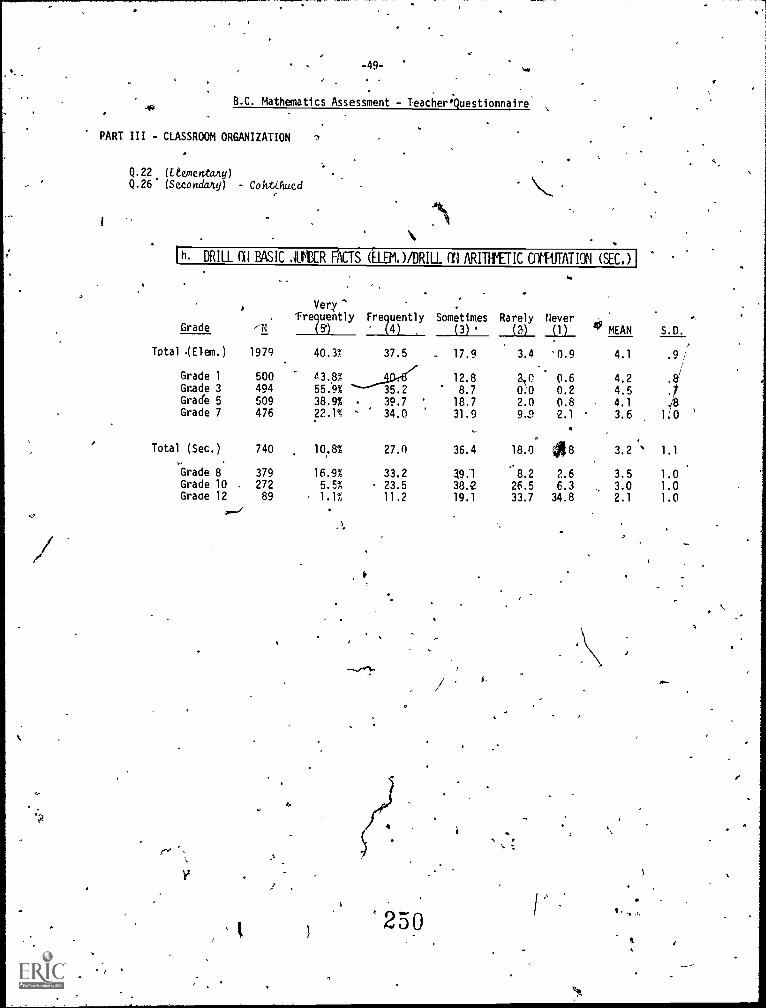
-49-
B.C. Mathematics Assessment - Teacher'Questionnaire'
PART III - CLASSROOM ORGANIZATION
1
Q.22 (Etementaty)Q.26. (Secondary) - CaLtaued
h. DRILL al BASIC AMER FACTS (.111311 )/DRILL ft ARITIITTIC CffliJfATICN (SEC.)
Grade
l
,-N
VeryTre uently
5
Frequently(4)
.
Sometimes(3) *
Rarely(2)
Neverit
.
..
w MEAN S.D.
/.
Total E1-em.) 1979 40.3% 37.5 .. 17.9 3.4 '0.9 4.1 .9/
Grade 1 500 43.8% 12.8 20 0.6 4.2Grade 3 494 55.9% .L"r35.2 8.7 0.0 0.2 4.5Grade 5 509 38.9% 39.7 ' 18.7 2.0 0.8 4.1Grade 7 476 22.1% - 34.0 31.9 9.9 2.1 3.6 1 '
Total (Sec.) 740 10.8% 27.0 36.4 18.0 8 3.2 1.1. ,Grade 8 379 16.9% 33.2 39:1 8.2 2.6 3.5 1.0Grade 10 . 272 5.5% - 23.5 38.2 26.5 6.3 3.0 1.0Grace 12 89 1.1% 11.2 19.1 33.7 34.8 2.1 1.0
ra
250
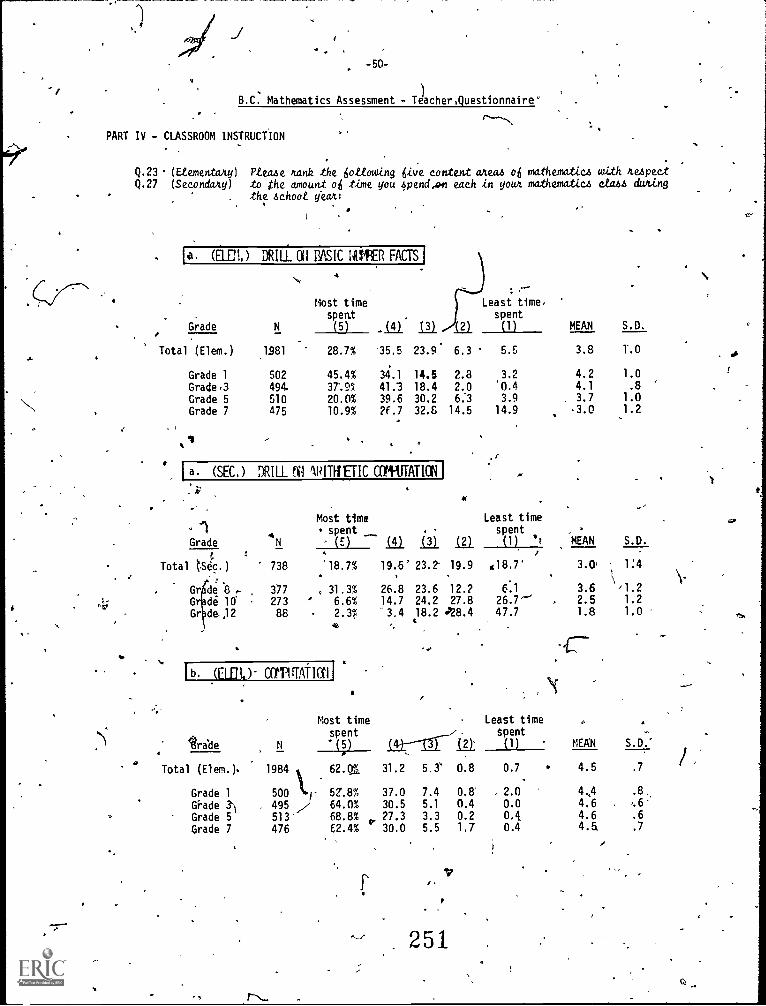
-50-
o
B.C. Mathematics Assessment - jacher,Questionnaire'
PART IV - CLASSROOM INSTRUCTION
.
Q.23. (Etementarcy) Ptea4e /tank the liottowing 6ive content anea4 o6 mathematiu worth respectQ.27 (Secondary) .to the amount o6 time you 4pend,on each in your mathematia cta44 darting
' . the achoot year:c
Most time
. , spentGrade N (5) _ill' 1_31 (2)
Total (Elem.) 1981 28.7% .35.5 23.9 6.3
Grade 1 502 45.4% 34.1 14.5 2.8
Grade,3 494., 37'.9,". 41.3 18.4 2.0
Grade 5 510 20.0% 39.6 30.2 6:3
Grade 7 475 10.9% 2f.7 32.6 14.5
;
1
la. (ELM) DRILL OH WiSIC NIPPER FACTS
a. (SEC.) DRILL %I 1RITHE1'IC
Grade
4
Total tSec.) 738
Gr de 8 , 377 ,, 31.3% 26.8 23.6 12.2
G de 10 273 '' 6.6% 14.7 24.2 27.8
Gr de ,12 88 2.3% '3.4 ,18.2 4,28.4
Most timespent .
.
4N (E) (4) (3) (2)
18.7% 19.6' 23.2. 19.9
45
*.
lb. (01211.)- UTPLITATIGI
Least time-spent(1) MEAN S.D.
5.5 3.8 T.0
3.2 4.2 1.0
'0.4 4.1 .8
3.9 , 3.7 1.014.9 -3.0 1.2
Least timespent(1) '? MEAN S.D.
/.
118.7' 3.0, 1:4
6.1 3.6 i1.226.7-- , 2.5 1.2
47.7 1.8 1.0
Most time Least time .
spent spent
ra'de N (5) La-----ar-I21.Il
Total (Elem.). 1984 62.01 31.2
Grade 1 500 . 5Z.8% 37.0
Grade 3) 495 64.0% 30.5
Grade 5
,,J
513- 68.8% 27.3
Oracle 7 476 62.4% 30.0
5.3' 0.8
7.4 0.8'
5.1 0.4
3.3 0.25.5 1.7
I
251
(1) MEAN S.D.'
0.7 4.5 .7
2.0 4,4 .8
0.0 4.60.4 4.6 .6
0.4 4.5 7
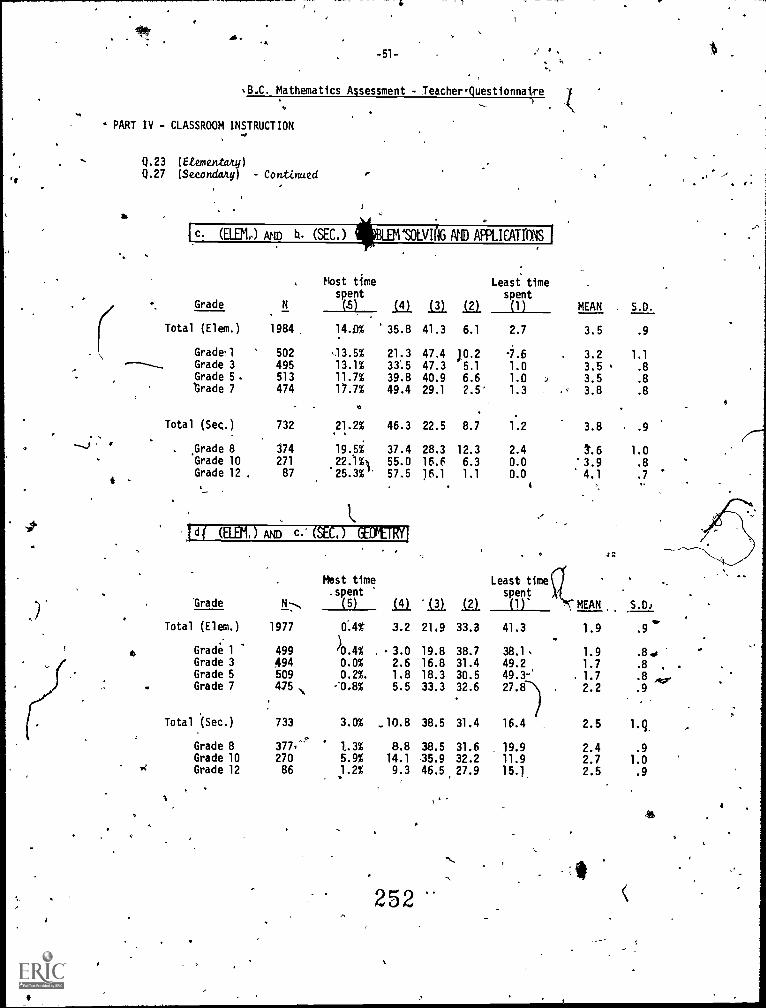
*. 4.
%B.C. Mathem
PART IV - CLASSROOM INSTRUCTION
(
t
ra
-51-
atics Assessment - TeacheroQuestionnatre 1
Q.23 (Etementany)Q.27 (Secondary) - Continued
Ict (Mgt) AND h. (SEC.) 40BLIEWSOLVIAG AND APPLICATIONS
Most timespent
Grade N (.5) ill 121.
Total (Elem.) 1984 14.D% '35.8 41.3
Grade'l 502 13.5% 21.3 47.4Grade 3 495 13.1% 33.5 47.3Grade 5. 513 11.7% 39.8 40.9trade 7 474 17.7% 49.4 29.1
Total (Seq.) 732 21.2% 46.3 22.5
.Grade 8 174 19.5% 37.4 28.3Grade 10 271 22.1%A. 55.0 16.6Grade 12 . 87 25.3%1 57.5 16.1
t
1) (UHL) Arc c: (SEC.) GENTRY!
Grade N-:..,
Most time.spent
(5) /Ai .121
Total (Elem.) 1977 0.4%' 3.2 21,9
Grade 1 499 )0.4% . .3.0 19.8Grade 3 494 0.0% 2.6 16.8Grade 5 509 0.2%. 1.8 18.3
. Grade 7 475 .,., -11.8% 5.5 33.3
Total (Sec.) 733 3.0% _10.8 38.5
Grade 8 377=.e .
1.3% 8.8 38.5Grade 10 270 5.9% 14.1 -35.9
lot Grade 12 86 .1.2% 9.3 46.5,
a
252
Least timespent
igl (1) MEAN . S.D.
6.1 2.7 3.5 .9
10.2 .6 3.2 1.1
5.1 1.0 3.5 . .8
6.6 1.0 > 3.5 .8
2.5' 1.3 3.8 .8
8.7 1.2 3.8 - .9
12.3 2.4 3.6 1.06.3 0.0 *3.9 .8
1.1 0.0 4.1 .7
IL
Least timespent(1)
4 C
MEAN. 5.0,
33.3 41.3 1.9 .9
38.7 38.1 . 1.9 .8431.4 49.2 1.7 .8 , .
30.5 49.3-' . 1.7 .8 Aw32.6 27.8 2.2 .9
31.4 16.4 2.5 1.g,
31.6 19.9 2.4 .9
32.2 11.9 2.7 1.027.9 15.) 2.5 .9
4*
I
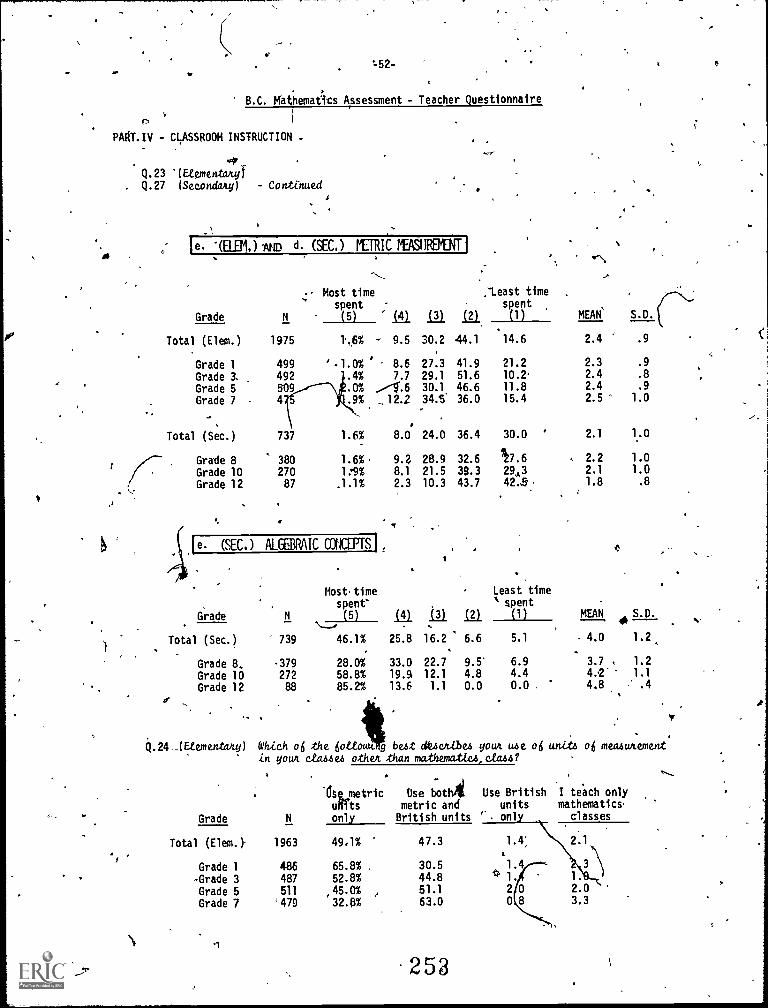
JT
=52-
B.C. Mlhematits Assessment - Teacher Questionnaire
PART.IV - CLASSROOM INSTRUCTION .
Q.23 Etementemyr. Q.27 (Seconda&y) - Continued
ie. -(ELEM.) AND d. (SEC.) PETRIC MEOREMYTI
Grade N
1975
- Most timespent
(5) 141
- 9.5Total (Elem.) 1,6%
Grade 1 499 '.1.0% ' 8.6
Grade 3. 492 .4% 7.7
Grade 5 309 .0% ..-,1.6
Grade 7 4 .9% 12.2
Total (Sec.) 737 1.6% 8.0 24.0 36.4
Grade 8 380 1.6%, 9.2
Grade 10 270 1:9% 8.1
Grade 12 87 .1.1% 2.3
le. (SEC.) ALGEBRAIC CONCEPTS'
:Least timesent
La ial (p1)MEAN' S.D.
30.2 44.1 14.6 2.4 .9
,
27.3 41.9 21.2 2.3 .9
29,1 51.6 10.2 2.4 .8
30.1 46.6 11.8 2.4 .9
34.5' 36.0 15.4 2.5 ' 1.0
30.0 ' 2.1 1.0
28.9 32.6 17.6 . 2.2 1.0
21.5 39.3 29,3 2.1 1.0
10.3 43.7 42.9 1.8 .8
. .
Most time Least time
Grade N
739
-37927288
spent"
(5) 111
25.8
33.019.513.6
121'16.2
22.712.1
1.1
` spent
IL (1) MEAN S.D.%.
Total (Sec.)
Grade 8.Grade 10Grade 12
NZ./
46.1%
28.0%58.8%85.2%
6.6 5.1
9.5* 6.94.8 4.40.0 0.0
. 4.0
3.7
4.2"
4.8
4$
1.2.
. 1.21.1
.4
4.24 _(temenzaky) Which oli the liottow g be dkAcaibe4 yowl. uee o6 unii6 oi mea4unementitin your ctabbe4 othen thannzaholatics,class?
. ,--...
isunetric Use 1;othAi Use British I teach only
uffits metric and units mathematics.
N o0/ British units 1. onlGrade classes
Total (Elem.> 1963 49,1% 47.3 2.1
"I,1.4:
Grade 1 486 65.8% . 30.5 1.4 3'
-Grade 3 487 52.8% 44.8 * 1. 1.
Grade 5 511 , 51.1 2 0 2.0
Grade 7 '479
,45.0%32.8% 63.0 0 8 3.3
253
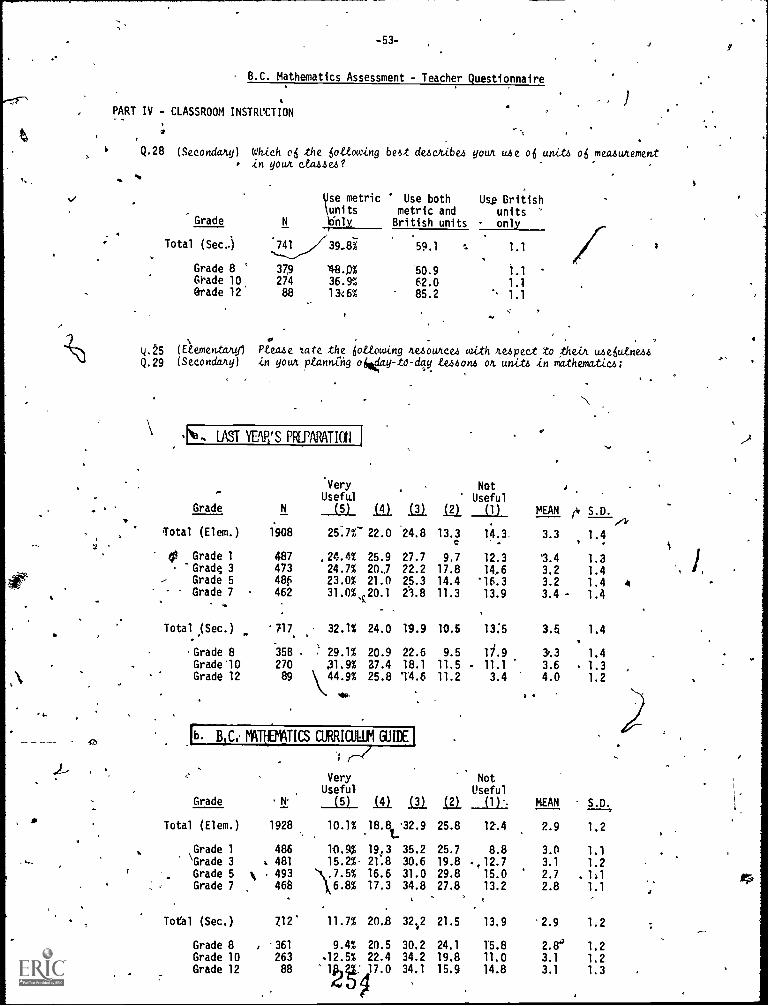
e
43,
-53-
B.C. Mathematics Assessment - Teacher Questionnaire
PART IV - CLASSROOM INSTRUCTION
S
I
Q.28 (Secondaty) Which the tiottowing best descAibes your use units measumment, in your classes?
se metric ' Use both Us. Britishunits metric and units
Grade Nr
lily British units - only
Total (Sec-) '741//39.8% 59.1 -. 1.1.
Grade 8 ° 379 48.D% 50.9 1.1Grade 10 274 36.9',.', 62.0 1.1@rade 12 88 l3x6% 85.2 - 1.1
0 -
Q.25 feeementaml ',tease tate the 6attowing tesounces with tespect to thaL'L useliutness
Q.29 (Secondany) £n yours ptanning oilley-to-day tessons o. and t4 in Mathematics;
LAST YEAR'S PIVARATI(11
7
.
.
"
Grade N
1908
48747348f
462
717,
35B
27089
VeryUsefu,1
(5) ill.
in L2).
'24.8 13.3e
27.7 9.722.2 17.825.3 14.423.8 11.3
19.9 10.5
22.6 9.5
18.1 11.5
14.6 11.2
NotUseful
(1)
A
MEAN 14. S.D.
Total (Elem.)
40 Grade 1-Grade 3
, Grade 5Grade 7
.
Total (Sec.)
Grade 8Grade10Grade 12
25.7%- 22.0
>24.4% 25.924.7% 20,723.0% 21.031.0%,K20.1
. .
32.1% 24.0
29.1% 20.931.9% 27.4
\ 44.9% 25.8
1.4:3,
12.314,6'16.313.9
13:5
11.9- 11.1
3.4
3.3
3.43.23.2
3.4 -
3.5
303.6
4.0
ri,
1.4
1.31.41.4 *1.4
1.4
1.4
1.31.2
.1b %Cs' MATkIEMATICS CURRICULUM GUEDEI
e--e/
, . VeryUseful
NotUseful
Grade N- (5) 1.4.1 ill 0_ (1).. MEAN S.D.t
Total (Elem.) 1928 10.1% 18.8,'32.91
25.8 12.4 2.9 1.2
Grade 1 486 10.9% l93 35.2 25.7 8.8 3.0 1.1\Grade 3 . 481 15.2% 21.8 30.6 19.8 .,12.7 3.1 1.2Grade 5 % 493 `1\7.5% 16.6 31.0 29.8 15.0 2.7 , 111Grade 7 468 6.8% 17.3 34.8 27.8 13.2 2.8 1.1
Total (Sec.) 712' 11.7% 20.2 32..2 21.5 13.9 '2.9 1.2
Grade 8 , '361 9.4% 20.5 30.2 24.1 15.8 2.1e 1.2Grade 10 263 -12.5% 22.4 34.2 19.8 11.0 3.1 1.2Grade 12 88 34.1 15.9 14.8 3.1 1.3
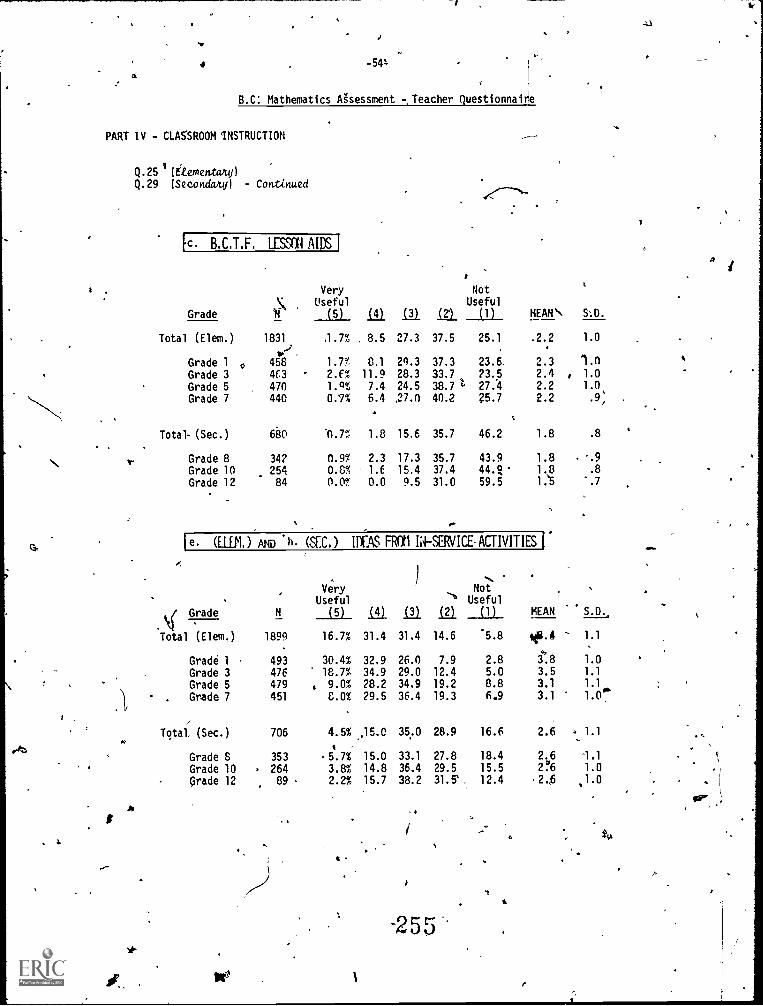
N,
cf.
-54=
B.C: Mathematics Assessment Teacher Questionnaire
PART IV - CLASSROOM INSTRUCTION
Q.25*Ittementanyl
Q.29 (Secondary) Continued
Not
Useful
[c. B.C.T.F, LESSON AIDS j
Very\ Useful
Grade N (5) ill 121 ill (1) MEAN\ SA.
Total (Elem.) 1831 .1.7% , 8.5 27.3 37.5 25.1 .2.2 1.0
tt',Grade 1 , 4g8 1.7% 8.1 29.3 37.3 23.6. 2.3 1.nGrade 3 463 2.f% 11.9 28.3 33.7 23.5 2.4 , 1.0
Grade 5 470 1.9% 7.4 24.5 38.7 t 27.4 2.2 1.0
Grade 7 440 0.9% 6.4 27.0 40.2 ?5.7 2.2 .9;
Total- (Sec.) 680 -n.n 1.8 15.6 35.7 46.2 1.8 .8
*- Grade 8 342 0.9% 2.3 17.3 35.7 43.9 1.8 '.9
Grade 10 254 0.C% 1.6 15.4 37.4 44.Q- 1.8 .8
Grade 12 84 0.0% 0.0 9.5 31.0 59.5 1:t -.7
e. (ELEM.) AND *h (SEC.) IDEAS FROM IN-SERVICE ACTIVITIES
,
VeryUseful
)%,
NotUseful
Grade N (5) (4) La RI (1) MEAN S.D.t(
Total (Elem.) 1899 16.7% 31.4 31.4 14.6 *5.8 lip.4 1.1
Grade 1 493 30.4% 32.9 26.0 7.9 2.8 3.8 1.0
Grade 3 476 18.7% 34.9 29.0 12.4 5.0 3.5 1.1
Grade 5 479 , 9.0% 28.2 34.9 19.2 8.8 3.1 1.1
Grade 7 451 C.0% 29.5 36.4 19.3 6.9 3.1 1.0'b
Total, (Sec.) 706 4.5% ,15.0 35..0 28.9 16.6 2.6 1.1
*
Grade S 353 -5.7% 15.0 33.1 27.8 18.4 2.6 1.1
Grade 10 > 264 3.8% 14.8 36.4 29.5 15.5 2% 1.0
Qrade 12 89 2.2% 15.7 38.2 31.5 12.4 .2.A .1.0
t
-255
. ,
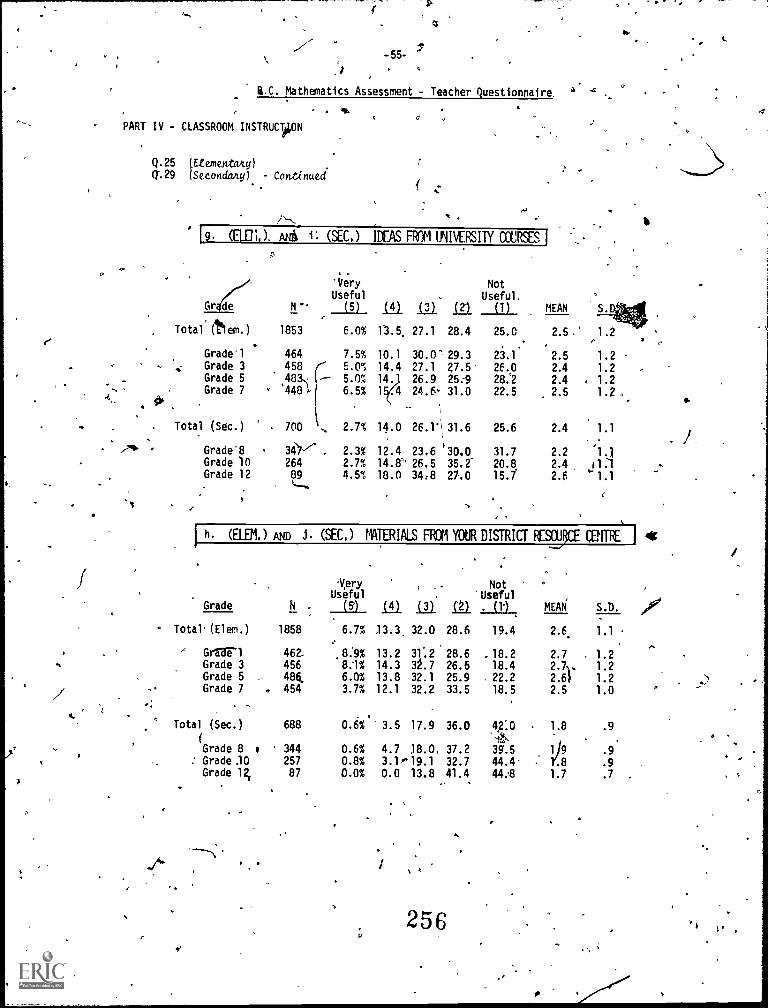
.
v-
a
S.C. Mathematics Assessment - Teacher Questionnaire,
PART IV - CLASSROOM INSTRUCTikON
Q.25 (Eteme)vtany)
Q".29 (Secondary) - Continued
a
4,
I
O 1
-
,e."1111.
,
1.2'
1.2
1.2. T.2
1.2 .
1.1
10Si. 1
` 1.1
.
lg. (Ell.). AM& 1: (SEC.) IDEAS FR P UNIVERSITY COURSES I
Gra/c11( N.
1853
464
458483.
' 4481,
700
. 36/264
89, t....,
, .
'Very
Useful
(5)
Not, Useful.
ill 121 In _ILI_
l3.5. 27.1 28.4 25.0
10.1 30.0", 29.3 23.1
14.4 27.1 27.5' 26.014. 26.9 25:9 28:21 .4 24.6- 31.0 22.5
1
14.0 26.1'\ 31.6 25.6
12.4 23.6 !30.0 31.714.8'' 26.5 35.2 20.818.0 34:8 27.0 15.7
MEAN
Total(tTem.)
Grade'l
4 Grade 3Grade 5Grade 7
Total (Sec.)
Grade'8Grade 10Grade 12
.
6.0%
7.5%
5.0%
5.0%6.5%
2.7%
, 2.3%2.7%4.5%
2.5.`
2.5
2.4
2.4
2.5
2.4
2.2
2.4
2.6
(ELM.) AND J. (SEC.) MATERIALS FROM YOUR DISTRICT RESOURCE OBiTRE 14c
Grade
1
N
1858
462.
456485,.
. 454
688
344
25787
VeryUseful .
(5) III (3) IL
28.6
28.626.525.9
33.5
36.0
37.232.741.4
'Useful. (1) MEAN S.D.
,
n
)
Total' (Elem.)
GrE31-1Grade 3Grade 5Grade 7
Total (Sec.)
(Grade 8: Grade .10
Grade 12,
.
,8:9%
6.7% 13.3. 32.0,
13.2 31.28:1% 14.3 3L76.0% 13.8 32.1
3.7% 12.1 32.2
0.5%' 3.5 17.9
0.6% 4.7 18.0.0.8% 3.10'19.10.0% 0.0 13.8
19.4
.18.218.422.2
18.5
42104
14".
39..5
44.4
44:8
2.6.
2.7 .
2.71l.
2.6}
2.5
1.8
119.8
1.7
1.1
1.21.2
1.2
1.0
.9.
.
.9
.9
.7
I
0
256
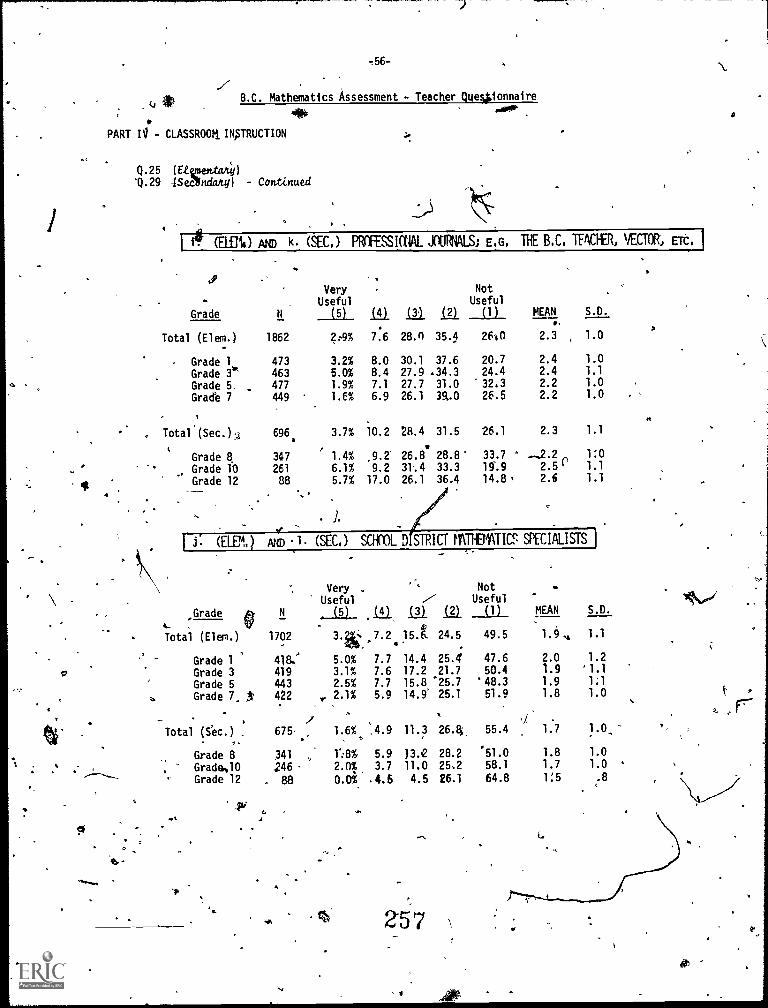
PART II) - CLASSROOM. INSTRUCTION
8.C. Mathematics Assessment - Teacher Que4ionnaire
404. saw..
Q.25 (Ettpentaitifl
Q.29 4Seellndany) - Continued
1-7# aim AND k. (SEC.) PROFESSIONAL JOURNALS; E.G. THE B.C. TEACHER, VECTOR, Erni
.1P
-
Grade
,
N
1862
473
463477
449
6960
347
261
88
Very
Useful(5)
.
(4) (3 1.21
NotUseful
(1)
°
MEAN
2.3
2.42.42.22.2
2.3
-,2.22.5,2.6
S.D.
1.0
1.01.1
1.01.0
1.1
1:01.1
1.1
Total (Elem.)
Grade 1
Grade 3*Grade 5Grade 7
1
, Total(Sec.).4
k
Grade 8Grade 1'0
Grade 12
A
2:9%
3.2%5.0%1.9%1.6%,
3.7%
1.4%
6.1%5.7%
7.6
8.08.47.1
6.9
10.2
,9.2
9.217.0
28.n 35.4
30.1 37.627.9 .34.327.7 31.0
26.1 39..0
28.4 31.5
26.8 28.8'3.4 33.326.1 36.4
2610
20.724.432.3
26.5
26.1
33.7
19.914.8
I.
1 j: (ELEM.) ANrD A. (SEC.) SCHOOL D STRICT n11143iATICS SPECIALISTS j
Very ..% Not .
Useful ./) UsefulMEAN S.D.
1.9, 1.1
_Grade N
1702
(5) .1_41 in izilo
,7.215.6, 24.5
(1)
Total (Elem.) 3.ik 49.5
Grade 1 418: 5.0% 7.7 14.4 25.4 47.6
Grade 3 419 3.1% 7.6 17.2 21.7 50.4
Grade 5 443 2.5% 7.7 15.8 25.7 '48.3
Grade 7. j' 422 2.1% 5.9 14.9' 25.1 51.9
- /Total (Sec.) ,
Grade 8
675
341
1.6%
1%-8%
',4.9
5.9
11.3
13.2
2641
28.2
55.4
51.0
. Grade,10 246 - 2.0% 3.7 11.0 25.2 58.1
Grade 12 . 88 0.0% .4.5 4.5 26.1 64.8
ly
2.0 1.2
1.9 '1.1
1.9 1.1
1.8 1.0
, .
1.7 1.0.
1.8 1.0
1.7 1.0
1:5 .8. '
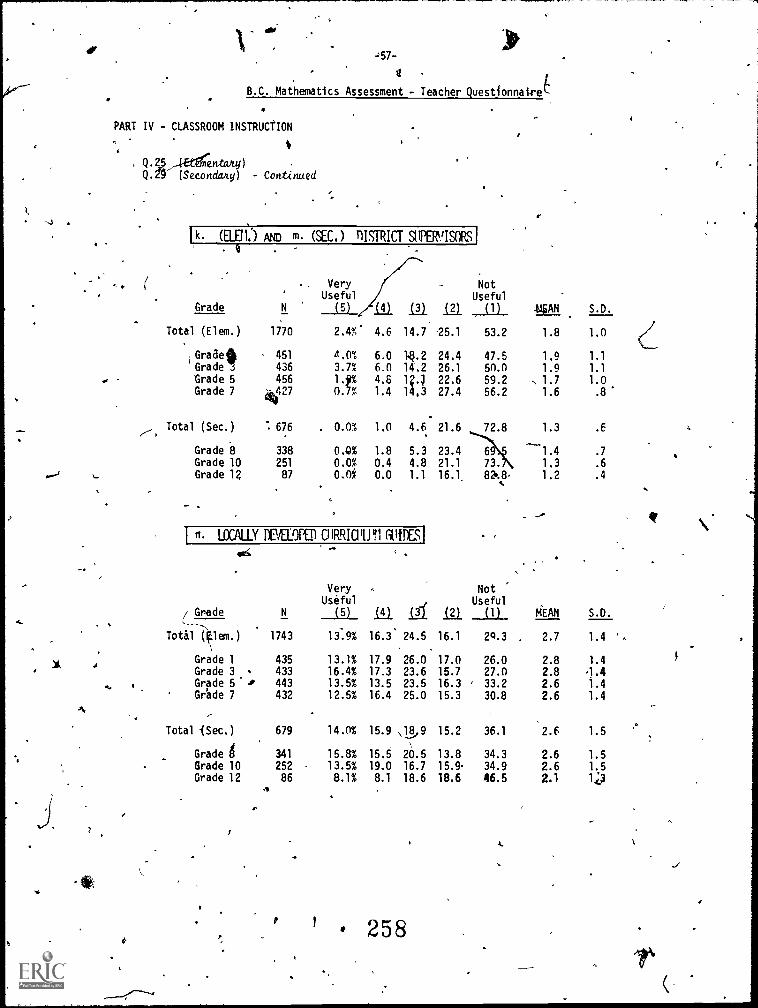
-3
dr=57-
B.C. Mathematics Assessment - Teacher Questfonnaire
PART IV - CLASSROOM INSTRUCtION
Q.25 ,4egentany)(Seconddity) - Continued
(
/-- r
Grade 8 338Grade 10 251
...--d , Grade 1? 87
1 k. ,(ELET1.) AND rn (SEC.) nISTRICT SUPERVISORS
Grade N
Total (Elem.) 1770
iGraBl , 451
Grade 436
Grade 5 456
Grade 7 4127
VeryUseful
NotUseful
(5) kli 12) 121 (1) 4.15AN S.D.
2.4%. 4.6 14.7 5.1 53.2 1.8 1.0
4.0% 6.0 1,8.2 24.4 47.5 1.9 1.1
3.7% 6.0 14.2 26.1 50.0 1.9 1.1
1.-9% 4.6 1?.j 22.6 59.2 , 1.7 1.00 ,%. 1.4 14,3 27.4 56.2 1.6 .8
0.0% 1.0 4.6 21.6 72.8 1.3 .6
0.8% 1.8 5.3 23.4 6 1.4 .7
0.0% 0.4 4.8 21.1 73.7\ 1.3 .6
0.0% 0.0 1.1 16.1, 820 1.2 .4k
Total (Sec.) 676 .
n LOCALLY DEVELOPED CIIR.RICPLPtl GUIDES]
/ Grade N
VeryUseful
(5)(
Total (Elem.).
1743 13.9%
. Grade 1Grade 3
435
433
13.1%16.4%
Grade 5 ' 443 13.5%Gr'ade 7 432 12.5%
Total iSec.) 679 14.0%
Grade g 341 15.8%Grade 10 252 13.5%Grade 12 86 8.1%
4
O
NotUseful
_01 j 12).. (1) MEAN S.D.
16.3' 24.5 16.1 2Q.3 2.7 1.4 '
17.9 26.0 17.0 26.0 2.8 1.417.3 23.6 15.7 27.0 2.8 .413.5 23.5 16.3 , 33.2 2.6 1.416.4 25.0 15.3 30.8 2.6 1.4
15.9 48 9 15.2 36.1 2.6 1.5
15.5 20.5 13.8 34.3 2.6 1.519.0 16.7 15.9 34.9 2.6 1.58.1 18.6 18.6 46.5 2.1 1:4P
# 258
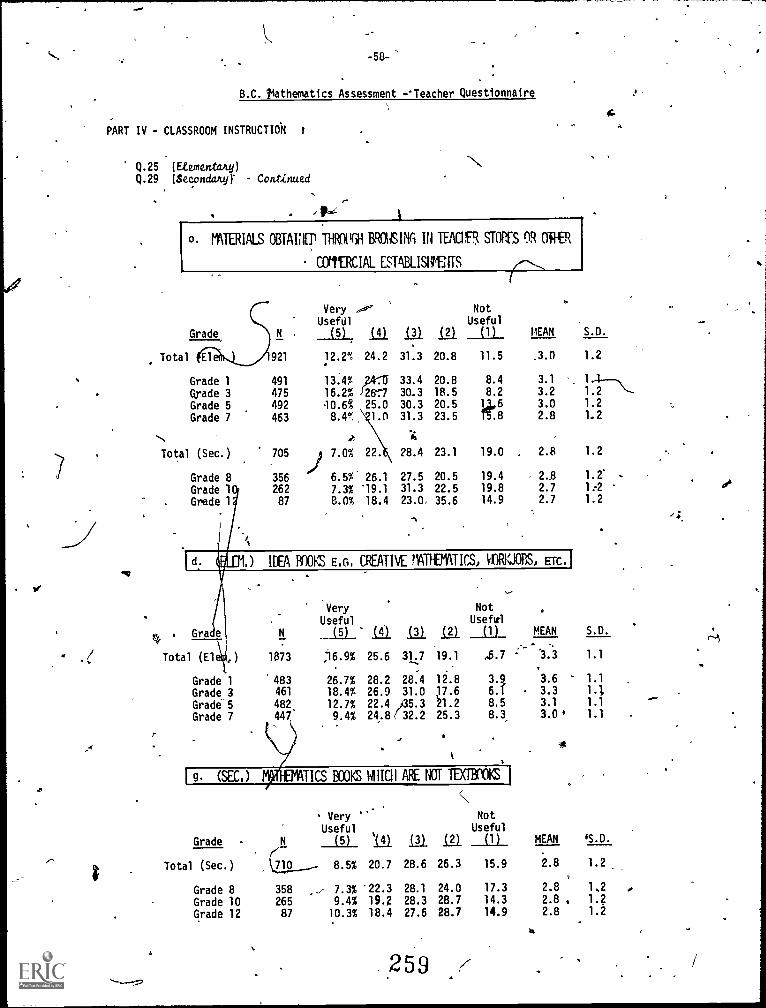
-58-
B.C. Mathematics Assessment --Teacher Questionnaire
PART IV - CLASSROOM INSTRUCTION
Q.25 (Etementaky)
Q.29 (Secondary)' - Continued
MATERIALS OBTAINFP THROVGH BRONSING III TEACHER STOWS OR OTVER
COMMERCIAL ESTABLISRENTS
Grade N
Very 00'Usefdl
(5) In 13.I 12.I
NotUseful
(1) MEAN S.D.
Total E1 921 12.2% 24.2 31.3 20.8 11.5 _3.0 1.2
Grade 1 491 13.4% 4 W 33.4 20.8 8.4 3.1 1.1
1.2 \--grade 3 475 16.2% 2677 30.3 18.5 8.2 3.2
Grade 5 492 0.68 25.0 30.3 20.5 11.6 3.0 1.2
Grade 7 463 8.4w, 1.0 31.3 23.5 T5.8 2.8 1.2
,t, .i.
Total (Sec.) 705 7.0% 22. 28.4 23.1 19.0 2.8 1.2
Grade 8 356 6.5%. 26.1 27.5 20.5 19.4 2_8 1.2' .
Grade 1 262 7.3% '19.1 31.3 22.5 19.8 2.7 1:2
Grade 1. 87 8.0% 18.4 23.0, 35.6 14.9 2.7 1.2
Grace
Total (El
Grade 1Grade 3Grade 5Grade 7
.) IDEA BOOKS E.G. CREATIVE MATHEMATICS, VORKJOBS, ETC.'
N
VeryUseful
(5) isA ..01
NotUseful
1_21 _w_ MEAN S.D.
1873 ;16.9% 25.6 31.7 19.1 ..15.7
,_-3.3 1.1
. .
.3.6483 26.7% 28.2 28.4 12.8 3.i 1.1
461 18.4% 26.9 31.0 17.6 6.7 3.3 1.1
482. 12.7% 22.4 )35.3 21.2 8.5 3.1 1.1
447 9.4% 24:81 32.2 25.3 8.3. 3.0 4 1.1
i g . ( SEC.) TICS BOOKS WHICH ARE NOT TIDROOKS i
Grade N
VeryUseful
(5)
''
111 i2) illNotUseful
(1) MEAN 'S.D.
Total (Sec.) 710 8.5% 20.7 28.6 26.3 15.9 2.8 1.2
Grade 8 358 .7 7.3% '22.3 28.1 24.0 17.3 2.8 1,2
Grade 10 265 9.4% 19.2 28.3 28.7 14.3 2.8 , 1.2
Grade 12 87 10.3% 18.4 27.6 28.7 14.9 2.8 1.2
.259
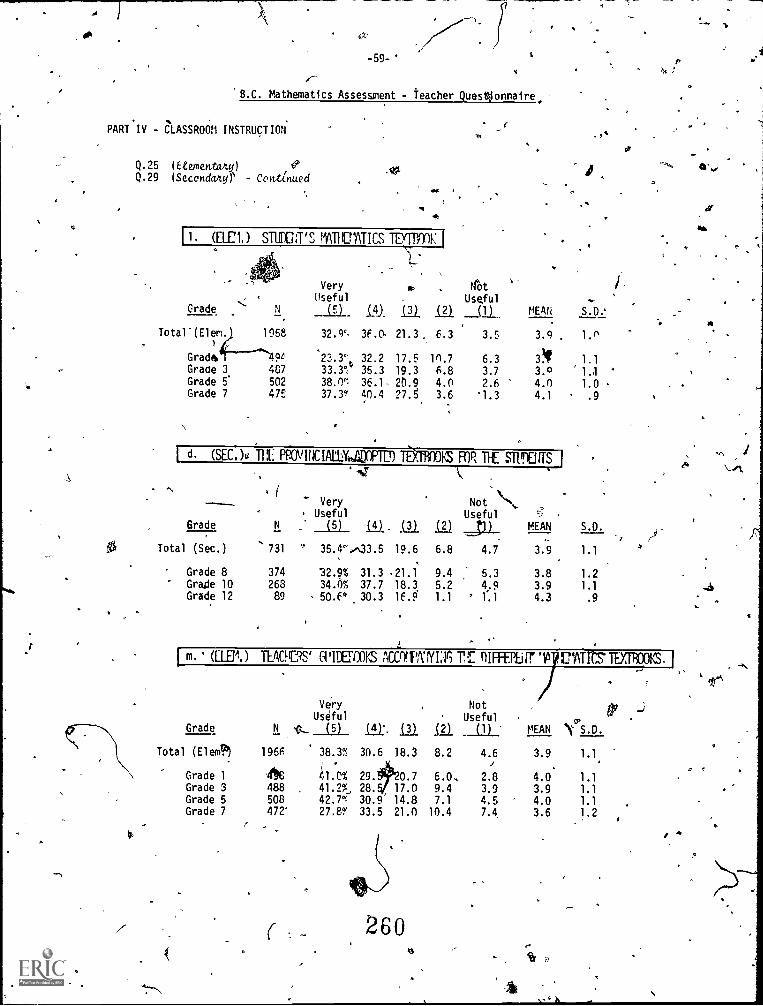
-59-
'8.C. Mathematics Assessment - Teacher Questjonnaire.
PART'IV - CLASSROOM INSTRUCTION
Q.25 (Etemeataxy)Q.29 (Secondany)` - Comanued
11. (ETA) STMT'S MUTATICS Tim : I
. ,
O
VeryUseful
4.
.
. 4otUseful -..
grade N Lfl, i41 ill 121 MEAN S.D.'___(11_'.
Total'(Elem)i
1958 32.9°. 36.0. 21.3, 6.3 3.E 3.9 . 1.n
Grada. .90 '23.3% 32.2 17.5 11).7 6.3 3! 1.1Grade 3 487 33.3°:" 35.3 19.3 6.8 3.7 3.0 1.1 '
Grade 5' 502 38.0% 36.1, 20.9 4.0 2.6 4.0 1.0Grade 7 475 37.3% a0.4 27.5 3.6 1.3 4.1 .9
d (SEC.)tt THE FROVINCIAllYJOOPTED TbOWOI\S FOP, TIE Simons J
1.
...
Grade N
731
374
26389
VeryUseful
(5) J. 1.?../
6.8
9.4
5.2
1.1
NotUseful
t1) MEAN S.D.
4
Total (Sec.)
Grade 8Grade 10Grade 12
.(21
' 35.4%,n33.5 19.6
32.9% 31.3 21.134.0% 37.7 18.350.f% 30.3 16.9
4.7
5.3
4.9' l'.1
3.9
3.8
3.94.3
1.1
1.2
1.1
.9
1 m. (ELIT,) TIAGIDS' GVIDET,01/S ACCrYTAIYIA 11,11: DIFFEPLiir )5 ItylitS'TEY,TROOKS.
r
Very 0NotUseful Useful
Grade N lt____LEL_ J. .0), /21 (1) MEAN YPS.D.
Total (EleA 1966 38.3% 30.6 18.3 8.2 4.6
Grade 1 AC 41.C% 29. 0.7 6.0.I "
2.8Grade 3 488 , 41.2%, 28. 17.0 9.4 3.9Grade 5 508 42.7% 30.9 14.8 7.1 4.5Grade 7 472' 27.8% 33.5 21.0 10.4 7.4
260a
3.9 1.1
4.0 1.1
3.9 1.1
4.0 1.1
3.6 1.2
a
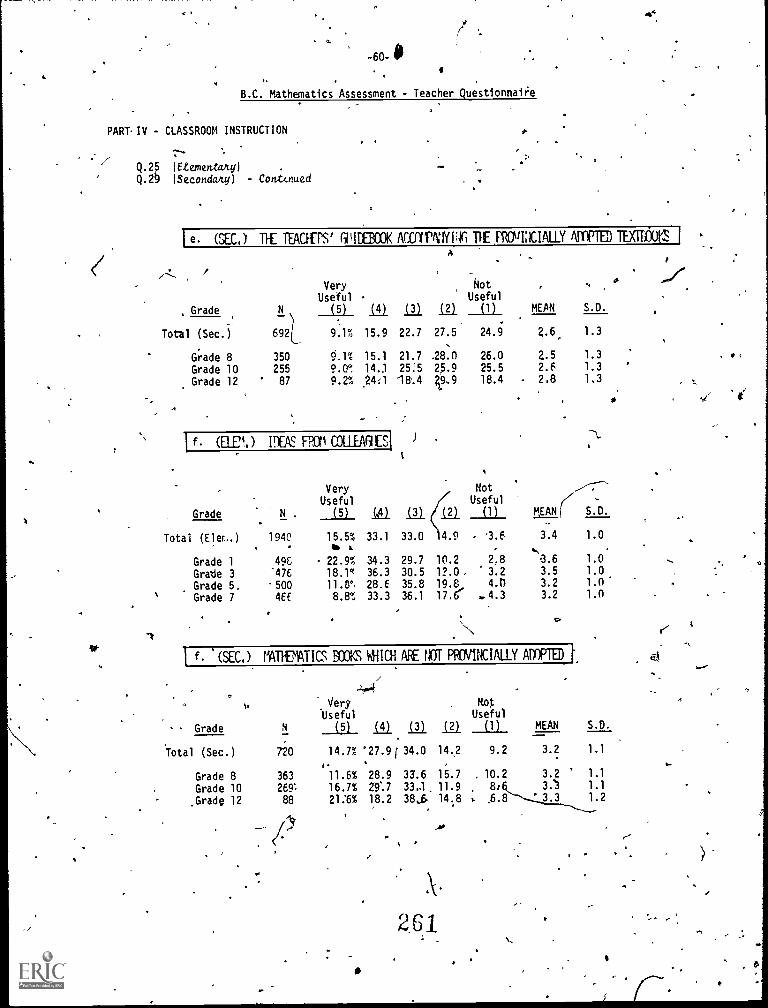
1 f . (SEC,) fiATTEIATI BCOKS MICH ARE flOT PROVINCIALLY AWED t
a
ti
3.
-60-10
B.C. Mathematics Assessment - Teacher Questionnaire
PARTIV - CLASSROOM INSTRUCTION
/Q.25 (Etementaky)
Q.2'§ (5econdarcy) Cont4nued
to
1 e (SEC.) TEE TEACEEPS' GIIIDEBCOK ACMPANYITI TIE .PRIXICIALLY ArOPTE) TIXTBOOKSA
f. (ELD, ) PEAS FP111 COLIIKIES1
/-7-,,/
--.
Very Not
Useful Useful
Grade N (5) j La La (1) MEAN S.D.
Total (Sec.) 692 15.9 22.7 27.5 24.9 2.6 1.3
Grade 8 350 9.1% 15.1 21.7 -28.0 26.0 2.5 1.3
Grade 10 255 9.0'. 14.3 25:5 25.9 25.5 2.6 1.3
Grade 12 ' 87 9.2% 24:1 18.4 ;99 18.4 2.8 1.3
1.
Very Not ,,-;---
Grade N . (5) .11 La La (1)_ MEAN( S.D.Useful Useful
Total (Elec..) 1940 15.5% 33.1 33.0 4.9 - 3.6 3.4 1.0tis a
Grade 1 49C 22.9% 34.3 29.7 10.2 2.8 13.6 1.0
Grade 3 -476 18.r 36.3 30.5 12.0, 3.2 3.5 1.0
Grade 5. -500 11.8°, 28.6 35.8 19.8 3.2 1.0
Grade 7 4E6 8.8% 33.3 36.1 17.6- .4.3 3.2 1.0
I>
Very-Useful
Grade N (5)
'Total (Sec.) 720 14.7%
Grade 8 363 11.6%
Grade 10 2E9, 16.7%
.Grade 12 88 21:6%
/-4e4
Not
in La i_21
'27.9( 34.0 14.,2
28.9 33.6 15.7
29".7 33.1, 11.9
18.2 38,6 14.8
,A0
2.61
Useful(1) MEAN S.D.
9.2 3.2 1.1
, 10.2 3.2 1.1
8, 3.'3 1.1
a ,6.8 ' 3.3 1.2
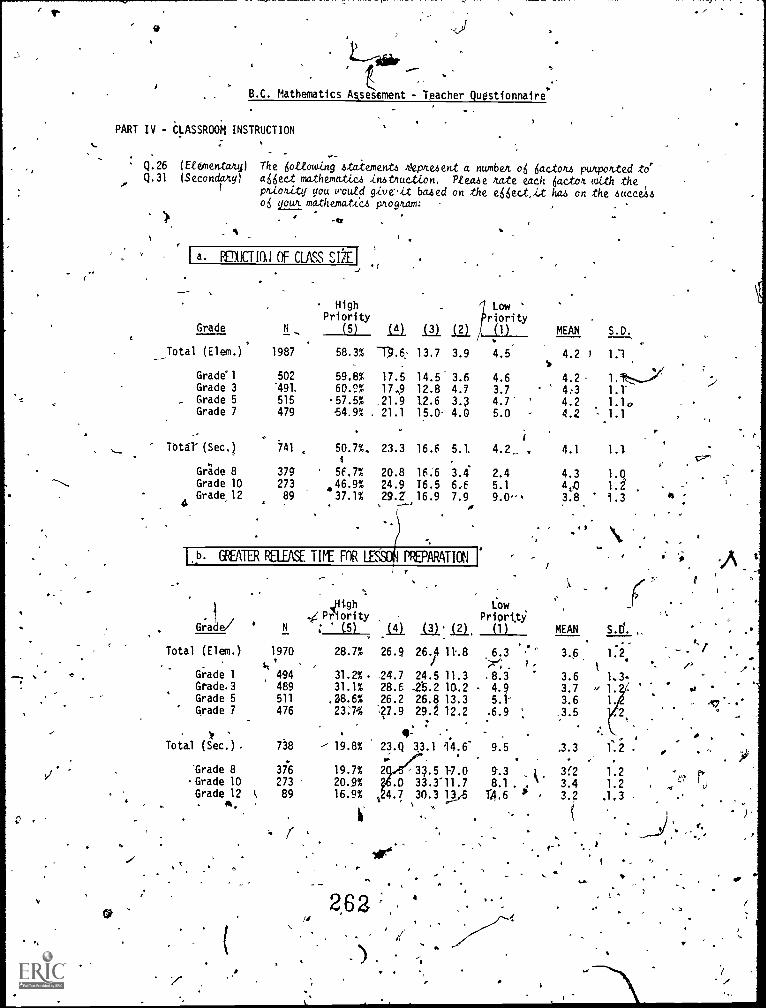
B.C. Mathematics Assessment - Teacher Questionnaire'
PART IV - CLASSROOM INSTRUCTION
Q.26 (Etementaty) The liottowing steciements Alepnesent a number o6 liactou pultiootted to'Q.31 (Secondary) algect mathematics instAuction. Ptease rate each liactot with .the
piionity you woutd givcit bated on the elgect,it hao on the succeSsob your mathematkas pug/tams
-tr)1.
_
Lai. 1_31.
LowPriority
L2i. (1) MEAN S.D.
a. IEDUCTIRI OF CLASS StEr
Grade N
HighPriority
(5), . .
Total (Elem.) 1987 58.3% 71.6: 13.7 3.9 4.5 4.2 1.1t,
Grade'l 502 59.8% 17.5 14.5 3.6 4.6 4.2 1.1L":.:,-....X
Grade 3 491. 60.9% 17.9 12.8 4.7 3.7 4:3 LTGrade 5 515 .57.5% 21.9 12.6 3.3 4.7' 4.2 1.10Grade 7 479 .54.9% . 21.1 15.0 4.0 5.0 - 4.2 - 1.1
. ,.
,....Total' (Sec.) 141 50.7%. 23.3 16.6 5.1 4.2._ , 4.1 1.1
s
Grade 8 379 56.7% 20.8 16.6 3.4 2.4 4.3 1.0-- Grade 10 273 446.9% 24.9 16.5 6,6 5.1 4:A 1. .
Grade 12 89 37.1% 29.2' 16.9 7.9 9.0 3.8 1.3 a
1.1). GREATER RELEASE TIME FOR LE 1 PRTARATICM r
--. .
- 1
,High Low
/.,,/, Priority Priority
.
Grade/ N ; (5)
Total (Elem.) 1970 28.7%
Grade 1 494 31.2%.Grade,3 489 31.1%Grade 5 511 38.6%
' Grade 7 476 23.7%.
Total (Sec.) . 738 --- 19.8%
'Grade 8 376 19.7%Grade 10 273 20.9%Grade 12 89 16.9%. A.
V
I
ila 121' in, (1)
/
'
MEAN S.D._
.
.
26.9 26.4 11..8
24.7 24.5 11.328.6 42.5.2 10.226.2 26.8 13.3',27.9 29.2 12.2
,
4- .
23.Q 33.1 14.6'
2 33.5 17.0.0 33.3'11.7
4.7 30.3 13,5
6.3
.8.34.95.1-
.6.9
-
9.5
9.38.1 .
1:46
..'
:
,
'
3.6.
3.63.73.63.5
.3.3
3(23.4
3.2
1.2.
1,3-
.-, 1.
1
2,
1.,2
1.21.2
.1.3
262.
-) .
..
per P
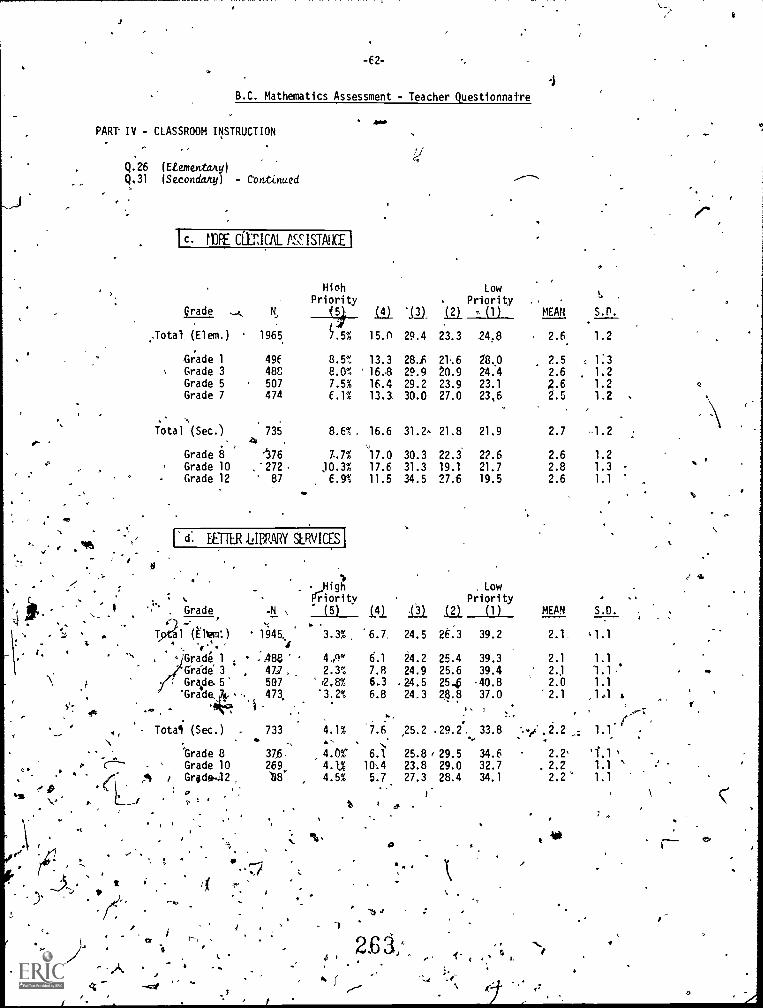
-62-
B.C. Mathematics Assessment - Teacher Questionnaire
10*PART IV - CLASSROOM INSTRUCTION
Q.26 (Etementahy)Q.31 (Seconda.ny) Continued
Li
LowPriority . 1
I c. riyE cLicx ft.F.is-rmicE I
HiohPriority
6rade ,--.'. N. (54 .13) , (1) MEAN S.P..(1)_ (2)
°
:Total, (Elem.) 1965 7.5% 15.0 29.4 23.3 24.8 , 2.6 1.2
Grade 1 49E 8.5" 13.3 28_6 21.6 28,0 2.5 < 1:3Grade 3 488 8.0% 16.8 29.9 20.9 24.4 2.6 . 1.2Grade 5 507 7.5% 16.4 29.2 23.9 23.1 2.6 1.2Grade 7 474 E.1% 13.3 30.0 27.0 23,6 2.5 1.2
.. ,
Total (Sec.) 735 8.6%. 16.6 31.2, 21.8 21.9 2.7 1.2/- 4
Grade 8 '4376 7.7% 17.0 30.3 22.3 22.6 2.6 1.2Grade 10 .272 10.3% 17.6 31.3 19.1 21.7 2.8 1.3 -
Grade 12 87 6.9% 11.5 34.5 27.6 19.5 2.6 1.1 *
dI [ETU .1.4P,PARY SERVICES I
slae
\A'
v
PriorityHigh
Priority. Grade
)-N = (5) .L41 DI 1.?../
$
al
-- $
T (Eltir:) 145, 3.3% '6.7. 24.5 26.3
4 Grade 1 -488 ' 4..9" 6.1 24.2 25.4
Grade' 3 , 47/, 2.3% 7.8 24.9 25.6. Grade. 5' 507 12.8% 6.3 .24.5 25.0
'Gride4t: -,-
473. 3.2% 6.8 24,3 28.8
.. .
Iota/ (Sec.) . 733 4.1% 7.6 ,25.2 29.2. ., ,,
'Grade 8 376 ., 4.0%' 6.1 25.8,29.5Grade 10 269 4.1% 10.4 23.8 29.0
/ Grad :12 IBC 4.5% 5.7 27.3 28.4
; 0 CT. ' '
' 0 .
I
, LowPriority .
(1) MEAN S.D.
39.2 2.1. =1.1
39.3 2.1 1.1
39.4 2.1 1.140.8 2.0 1.1
37.0 2.1 ,1,1 $
Z
i'''-. 33.8 ,%0)' .2.2 _; 1.1-~
4
34.6 2.2' 1.132.7 . 2.Z 1.1 '
34.1 2.2 1.1
of xt 411
2.6 3 ...4 ' ,' "t° (
e,e .4 i ....4 e
, -
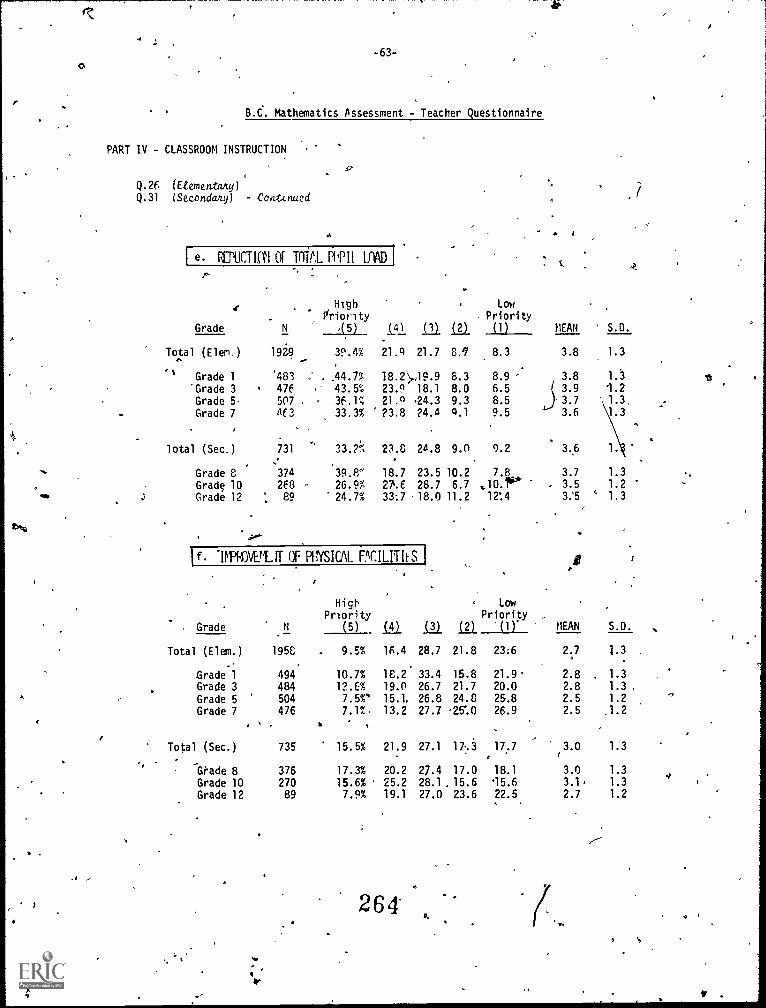
-63-
B.C. Mathematics Assessment - Teacher Questionnaire
PART IV - CLASSROOM INSTRUCTION
Q.26 (EtementatylQ.31 (Secondany) Contxnued
4
IUUCTIR1 Of TOTAL 1'11111 1.441) r
.
HighVrioity
LowPriority
Grade N .(5) 141 (1) (2) (1) MEAN ' S.D.
Total (Elem.) 1929, ...
39.4% 21.Q 21.7 8./ 8. 3 3.8 1.3
" Grade 1 '483 ..' . .44.7% 18.2;,..,19.9 8.3 8.9 3.8 1.3
'Grade 3 . 47E ..' 43.5% 23.9 18.1 8.0 6.5 3.9 1.2Grade 5 507 , - 3F.1t 21.9 .24.3 9.3 8.5 .3.7 1.3,
- Grade 7 4E3 33.3% ?3.8 ?4.4 Q.1 9.5 3.6 1.3
4,
lotal (Sec.) 731 33.711, 23.8 24.8 9.0 9.2 3,6
Grade 8 `374 39.8" 18.7 23.5 10.2 7.8 3.7 1.3
Grade 10 2E8 - 26.9% 271.E 28.7 6.7 .10.1** 3.5 1.244 3 Grade 12 ; 89 24.7% 33:7 18.0 11.2 12:4 3:5 1.3
1f IPPINPLIT OF ITYSICAL ..((..ILITItS ,11
e
High . Low
Priority Priority
Grade N. - (5) (4) (3) (2) '(1). MEAN S.D.
Total (Elem.) 195E 9.5% 16.4 28.7 21.8 23:6 2.7 1.3
:Grade 1 494 10.7% 18.2 33.4 15.8 21.9' 2.8 1.3
Grade 3 484 12.6% 19.0 26.7 21.7 20.0 2.8 1.3
Grade 5 504 7.5%' 15.1, 26.8 24.8 25.8 2.5 1.2
Grade 7 476 7.1t. 13.2 27.7 25.0 26.9 2.5 .1.2
Total (Sec.) 735 15.5% 21.9 27.1 17.3 17.7 3.0 1.3
Grade 8 376 17.3% 20.2 27.4 17.0 18.1 3.0 1.3
Grade 10 270 15.6% 25.2 28.1, 15.6 5.6 3.1,, 1.3
Grade 12 89 7.9% 19.1 27.0 23.6 22.5 2.7 1.2
264'4
tt
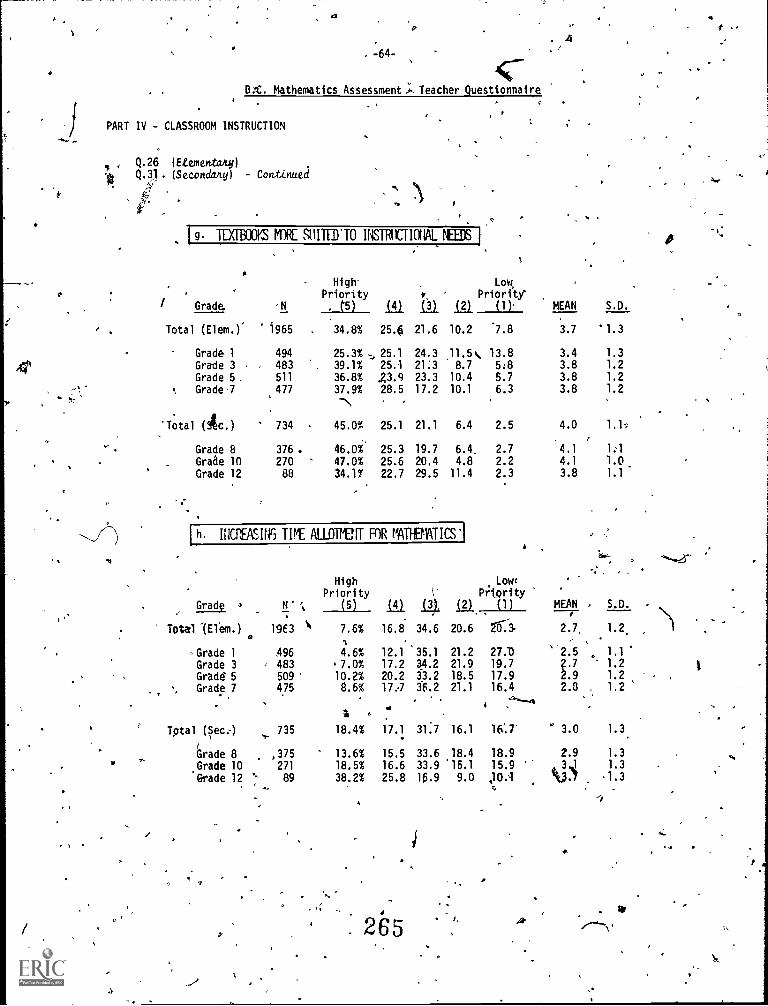
ti
J
-
. :64-
B:C. Mathematics Assessment.L,Teacher Questionnaire
PART IV - CLASSROOM INSTRUCTION
Q.26 (Etementany)
Q.41- (Secondary) - Continued
I g. TEXTBOOKS MORE SIIITIFTO INSTRUCTIONAL IIIDS
A
A
HighPriority v., .
LotPriority
Grade 'N.
('5) 1.1/ 1..2/. (1)' MEAN S.D.
Total (Elem.)' 1965 34.8% 25.6
1.1/.
21.6 10.2 '7.8 3.7 ' 1.3
Graded 494 25.3% . 25.1 24.3 11 .5 13.8 3.4 1.3
Grade 3 483 39.1% 25.1 21:3 8.7 5:8 3.8 1.2
Grade 5 , 511 36.8% 23.9 23.3 10.4 5.7 3.8 1.2
1, Grade? 477 37.9% 28.5 17.2 10.1 6.3 3.8 1.2
'Total (4c.) ' 734 45.0% 25.1 21.1 6.4 2.5 4.0 1.1-
Grade 8 376 . 46.0% 25.3 19.7 6.4 2.7 4.1 1:1
Grade 10 270 47.0% 25.6 20.4 4.8 2.2 4.1 1.0.Grade 12 88 34.1' 22.7 29.5 11.4 2.3 3.8 1.1
ri
MEAN
,
, S.D. .
°-.-2;'"
i
,
Ih. INCPEASINr] TIME ALLOTTIT FOR MATHEMATICS''
Grady 4 ti. ''
1963
496, 483
509475
,
-,-735
,375271
89
HighPriority
(5) ka 14
16.8 34.6.
12.1 '35.117.2 34.220.2 33.217:7 36.2
-
.
17.1 31:7
15.5 33.6
16.6 33.9
25.8 15.9
Lowe
Priorityial (1)
Total (Elam.)
Grade 1
Grade 3Grade 5Grade 7
Total (Sec:)
Grade 8Grade 10
'Grade 12
7.6%1
4.6%.7.0%10.2%8.6%
1 *
18.4%
13.6%18.5%38.2%
20.6 2 .1
21.2 27:021.9 19.718.5 17.921.1 16.4
i ..-'--4
16.1 16:7'
18.4 18.915.1 15.9
9.0 ;10.1
-7-2.7,
2.5?.7
2.92.8
' 3.0
2.93,1
k3.7
1.2.-
1.1
1.2
1.2
. 1.2 s
1.3
1.3
1.3
1.3
_ 265 1
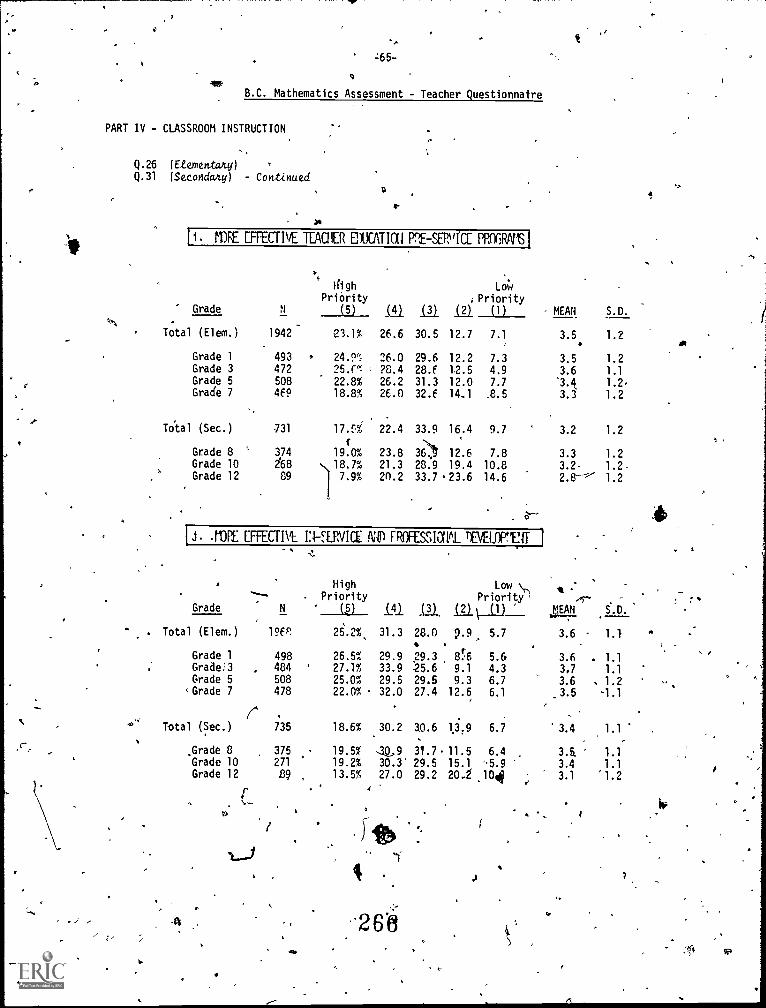
=65-
B.C. Mathematics Assessment - Teacher Questionnaire
PART IV - CLASSROOM INSTRUCTION
Q.26 (Etementany)Q.31 (Secondary) - Continued
O r
ji MIT IFFECTBE TEACHER PT-SEPACE PROGRNE
Hi gh
PriorityLoW
;PriorityGrade N (5) (1 (3) (2) (1) MEAN S.D.
Total (Elem.) 1942 23.1% 26.6 30.5 12.7 7.1 3.5 1.211
Grade 1 493 , 24.9", 26.0 29.6 12.2 7.3 3.5 1.2Grade 3 472 25.r" 28.4 28.f 12.5 4.9 3.6 1.1Grade 5 508 22.8% 26.2 31.3 12.0 7.7 '3.4 1.2.Grade 7 469 18.8% 26.0 32.6 14.1 .8.5 3.1 1.2
1Total (Sec.) 731 17A 22.4 33.9 16.4 9.7 3.2 1.2
r
Grade 8 ' 374 19.0% 23.8 36. 12.6 7.8 3.3 1.2Grade 10 268 18.7% 21.3 28.9 19.4 10.8 3.2 1.2Grade 12 89 17.9% 20.2 33.7 '23.6 14.6 2.8.-"'' 1.2
I .113PE EFFECTIVE NIP rRassmil nEvEumir
r
---Grade
ti
N
196P.
498. 484
,
508478
735
375271
139
HighPriority
(5) L41
31.3
29.933.929.532.0
30.2
3Q,930.3'27.0
(3)
Low '\.\
Priority'Ill\ (1)
*rr
421
3.6
3.6 .
3.7
3.6
_3.5
3.4
3.43.1
S.D.:-.
. Total (Elem.)
Grade 1Graae13Grade 5
'Grade 7
Total (Sec.)
Grade 8Grade 10Grade 12
26.2%,
26.5%27.1%25.0%22.0%
18.6%
19.5%19.2%13.5%
28.0
29.3
.
:25.6
29.527.4
a0.6
31.7
29.529.2
9.9 5.7
8:6 5.69.1 4.39.3 6.7
12.6 6.1
1.1.9 6.7
11.5 6.4 .
15.1 '5.920.2 .1001
1.1
1.1
1.1
. 1.2
-1.1
1.1
1.1
1.1
'1.24
4
.26'6
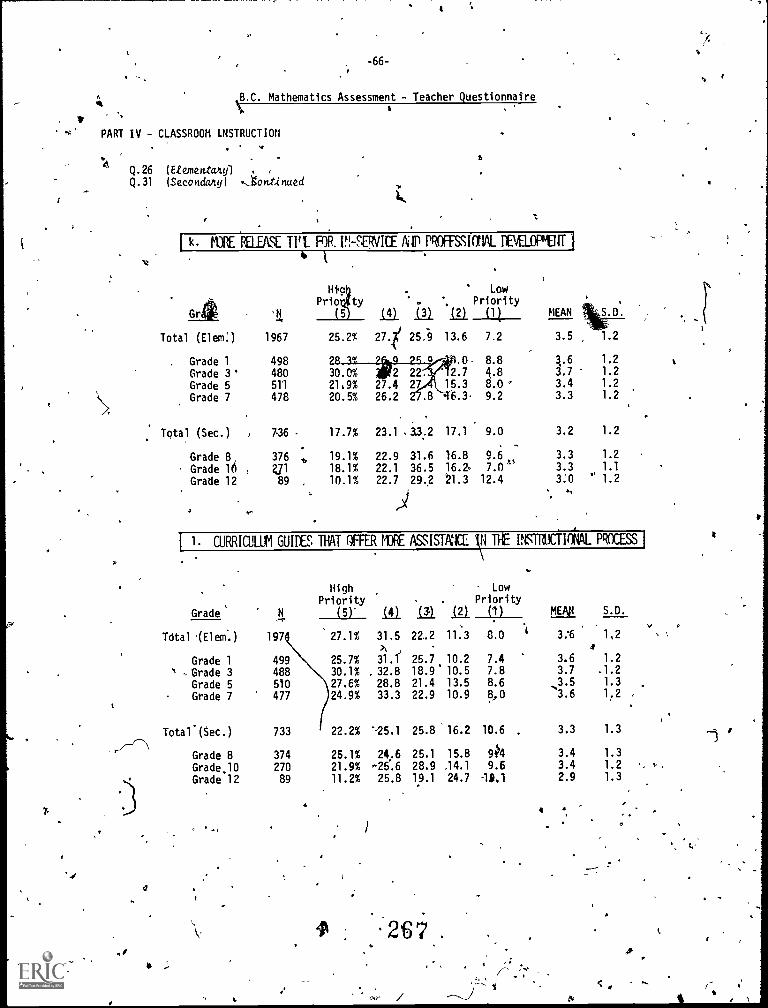
,
PART IV - CLASSROOM INSTRUCTION
4
-66-
B.C. Mathematics Assessment - Teacher Questionnaires
St
Q.26 (Etementakyl
Q.31 (Secondartyl .lontinued
i
I lc RELEASE TIT FOR. IN-SERVICE UP PROFFSSIMAL DEVELOPUIT
GrIt . 14
1967
498480511
478
736
376Z71
89
-1,,
HtgPrio ty
Lai
27,
.
.(11
25.9
0
in
13.6
.02.7
15.3
6.3
17.1
16.816.2.
21.3
LowPriority01 MEAN
Total (Elem:)
Grade 1
Grade 3'Grade 5Grade 7
Total (Sec.) ,
Grade 8Grade 16 ,
Grade 12
25.2%
28
7.2
8.8
4.88.0 '
9.2
9.0
9.6 ..,-
7.0'-12.4
3.5
3.6
3.73.43.3
3.2
3.33.33:0
30.0%21,9%20.5%
17.7%
19.1%18.1%10.1%
2 .4
26.2
23.1
22.922.1
22.7
27
,33:2
31.636.529,2
*r ,-)
S.D.
1.2
1.2
1.21.21.2
1.2
1.2
1.1
' 1.2
1. CURRICULUM GUIDES THAT OFFER MORE ASSISTANCE T THE INSTRUCTIRAL PROCESS1
Grade' N
HighPriority
(5) j. .j 1.2.1
.
LowPriority
(1)
44-
MEAN S.O.
.
Total (Elem'.) 1974 27.1% 31.5 22.2 11.3 8.0l 3:6 1,2
> j 4
Grade 1 499 25.7% 31.1 25.7 10.2 7.4 3.6 1.2
, Grade 3 488 30.1% 32.8 18.9' 10.5 7.8 3.7 .1.2
Grade 5 510 27.6% 28.8 21.4 13.5 8.6 1.3
Grade 7 477 24.9% 33.3 22.9 10.9 8,0,3.53.6 1,2
Toter(Sec.) 733 22.2% '-25.1 25.8 '16.2 10.6 . 3.3 1.3 1,/-/-\
Grade 8 374 25.1% 24.6 25.1 15.8 9h 3.4 1.3
Grade.10 270 21.9% -26.6 28.9 .14.1 9.6 3.4 1.2
Grade 12 89 11.2% 25.8 19.1 24.7 -19,1 2.9 1.3
4
I
Hr
4,
I
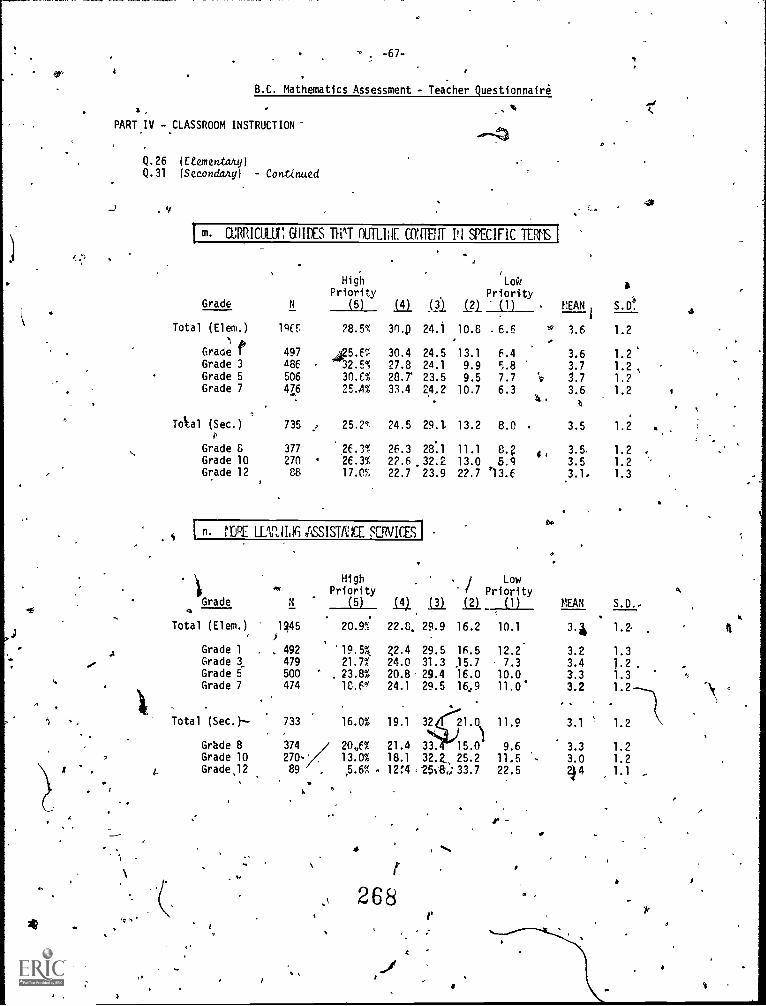
-67-
B.C. Mathematics Assessment - Teacher Questionnaire
PART IV - CLASSROOM INSTRUCTION
Q.26 (Etementany)Q.31 (Secondary) - Continued
.
0
I m. CURRICULUil GIIIDES DOT DUTLLIE COITETIT III SPECIFIC TEF
High Lai ,Priority Priority
Grade N (5) itta (.3). S2.)_ Lin_ MEAN , S.D!
Total (Elem.) lqff, 28.5% 30.p 24.1 10.8 . 6.6 '3''
i
3.6 1.2
Grade 497 30.4 24.5 13.1 6.4 3.6 1.2Grade 3
4025.69=
486 32.5% 27.8 24.1 9.9 S.8 3.7 1.2Grade 5 506 30.C% 28.7 23.5 9.5 7.7 '1; 3.7 1.2Grade 7 416 25.A% 33.4 24,2 10.7 6.3
It .
3.6
t
1.2
Total (Sec.)e,
Grade 6
735 .., 25.2% 24.5 29.1.
377 26.3% 26.3 2811
13.2 8.0 .
11.1 84 a,
3.5
3.5.
1.2
1.2 .
Grade 10 270 26.3% 2?.6 .32.2 13.0 5.9 3.5 1.2 c
Grade 12 88 17.C% 22.7 23.9 22.7 '13.6 3.1, 1.3
.4 n. LLARILIG ASSISTIVIil SERVICES
..High
Priority
. , / Low'f Priority
Grade N (5) (4) (3) (2) (1) MEAN S.D..
.. ,
Total (Elem.)J1945 20.9% 22.8. 29.9 16.2 10.1 3.4 1.2
Grade 1 . , 492 '19.5%. 22.4 29.5 16.5 12.2 3.2 1.3
.0* Grade 3 479 21.7% 24.0 31.3 15.7 , 7.3 3.4 1.2Grade 5, 500 . 23.8% 20.8 29.4 16.0 10.0 3.3 1.3Grade 7 474 1C.6q 24.1 29.5 16:9 11.0' 3.2 1.2
Total (Sec.).- 733 16.0% 19.1 32 21.0 11.9 3.1 1.2
Grade 8 374 20,6% 21.4 33. 15.0 1 9.6 3.3 1.2O Grade 10 270,' 13.0% 18.1 32.2, 25.2 11.5 3.0 1.2
I Grade,12 89 . ,5.6% . 12!4 ,2518.:33.7 22.5 214 1.1
4
4
,
r268
1'
S
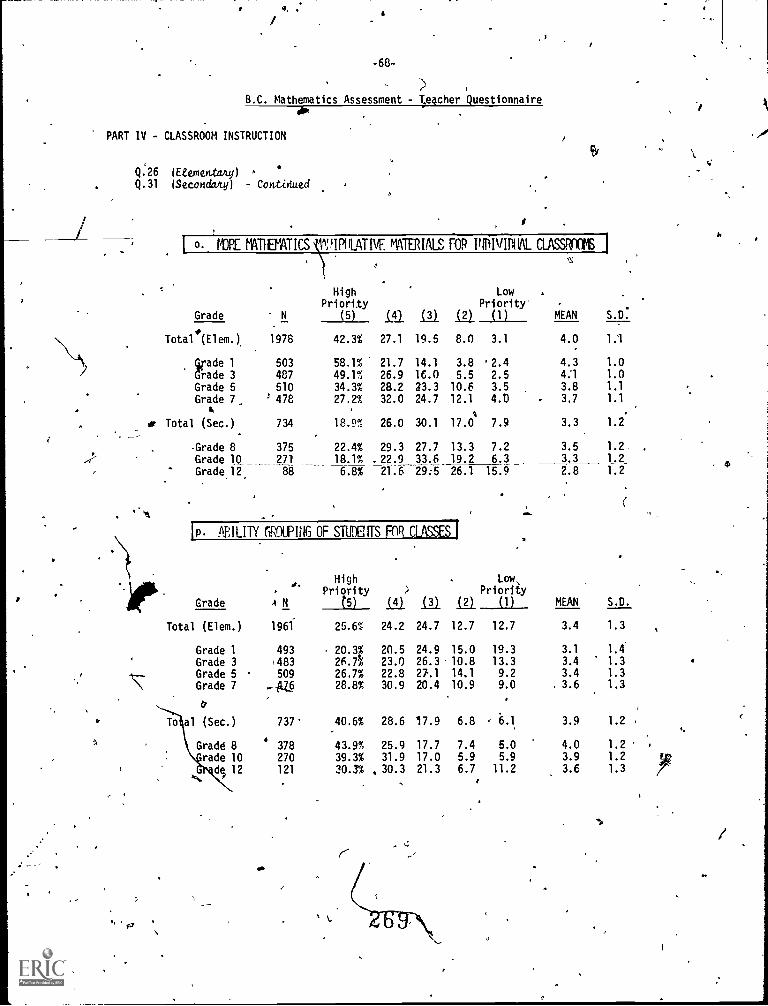
1p .ABILITY (-ROWING OF S1 1E05 FOR CLASSES I
eo.6
-68-
>8.C. Mathematics Assessment - Tieacher Questionnaire
PART IV - CLASSROOM INSTRUCTION
Q.26 (Etementany)Q.31 (Secondary) - Con,titiued
I
0, MORE MATERIALS FOR INIIIVIDIM CLASSROOMS 1
HighPriority
LowPriority'
Grade N (5) (4) (3) ial (1) MEAN S.D.
Total*(Elem.). 1978 42.3% 27.1 19.5 8.0 3.1 4.0 1.1
grade 1 503 58.1% 21.7 14.1 3.8 '2.4 4.3 1.0
Grade 3 487 49.1% 26.9 16.0 5.5 2.5 4:1 1.0
Grade 5 510 34.3% 28.2 23.3 10.6 3.5 3.8 1.1
Grade 7 ' 478 27.2% 32.0 24.7 12.1 4.D 3.7 1.14
9
or Total (Sec.) 734 18.9% 26.0 30.1 17.0 7.9 3.3 1.2
Grade 8 375 22.4% 29.3 27.7 13.3 7.2 3.5 1.2
Grade 10 27/ 18.1% -22.9 33.6 19.2 6.3 3.3 1.2g.
88 6.8% 21.6 29:5 26.1 15.9 2.8 1.2Grade 12
tc
Grade
**
AN
1961
493;483
509....11.76
737
' 378270
121
HighPriority
('5)
)
(4) (3)
.
(2)
Low,Priority
(1) MEAN S.D.
Total (Elem.)
Grade 1Grade 3Grade 5Grade 7
tit
al (Sec.)
Grade 8rade 10def12
25.6%
20.426.7%26.7%28.8%
40.6%
43.9%39.3%30.3% ,
24.2
20.523.022.830.9
28.6
25.931.9
30.3
24.7
24.926.3-27.120.4
17.9
17.7
17.021.3
12.7
15.010.814.1
10.9
6.8
7.45.9
6.7
12.7
19.313.39.29.0
c 6.1
5.05.9
11.2
3.4
3.1
3.4
3.4. 3.6
3.9
4.03.93.6
1.3
1.41.31.31.3
1.2
1.21.21.3
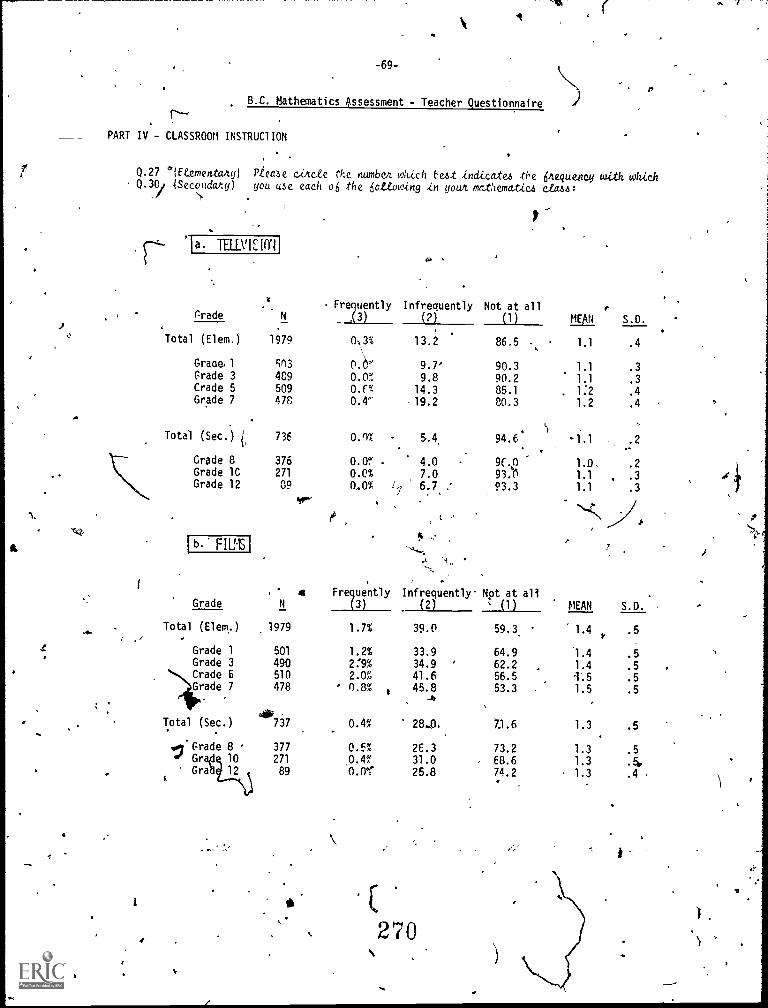
-69-
0
B.C. Mathematics Assessment - Teacher Questionnaire
PART IV - CLASSROOM INSTRUCTION
Q.27 *(Etementalty) P.eemlle emcee the numbea which Emt indicate4 the inequency with whichQ.30/ (Secondary) you use each o6 the liottowing in yam. mattematic4 case:
'Ia. TELL\112.10-11
trade
t
N
Fre uently. 3
Infrequently
(2)
Not at all(1)
r
MEAN S.D.
Total (Elem.) 1979 0,3% 13.2 86.5 1.1 .4
Grace. 1 503 o.eo 9.7' 90.3 1.1 .3Trade 3 489 9.8 90.2 1.1 .3Crade 5 509 0.r% 14.3 85.1 . 1:2 .4Grade 7 478 0.4' 19.2 80.3 1.2 .4
11
,
Total (Sec.) 736 0.n% 5.4, 94.6. -1.1 .2-
Grade 8 376 0.0% 4.0 9c,p 1.0. .2Grade 1C 271 0.0% 7.0 93.0 1.1 .3Grade 12 39 0.0% i 6.7 : 93.3 1.1 .3
b. FILIE
. e Fr
N
rntlyGrade
Total (Elem.) 1979 1.7%
Grade 1 501 1.2%Grade 3 490 2:9%Crade 5 510 2.0%Grade 7
.
478 . 0.8%1
Total (Sec.) '737 0.4%
.
..1 Grade 8 . 377 0.5%e Grap 10 271
Grab 12 i 89,0.4%
0.0%'
Infrequently. Npt at all(2) k (1) MEAN
7 I
S.D.
39.0
33.9
34.941.645.8
.41
28.0.
2E.331.025.8
59.3.
64.9' 62.2
56.553.3
71.6
73.2
, 68.674.2
1.4
1.4
1.4
T.51.5
1.3
1.31.3
, 1.3
t.5
.5
.5
.5
.5
.5
.5
.4,
.4 ,
270
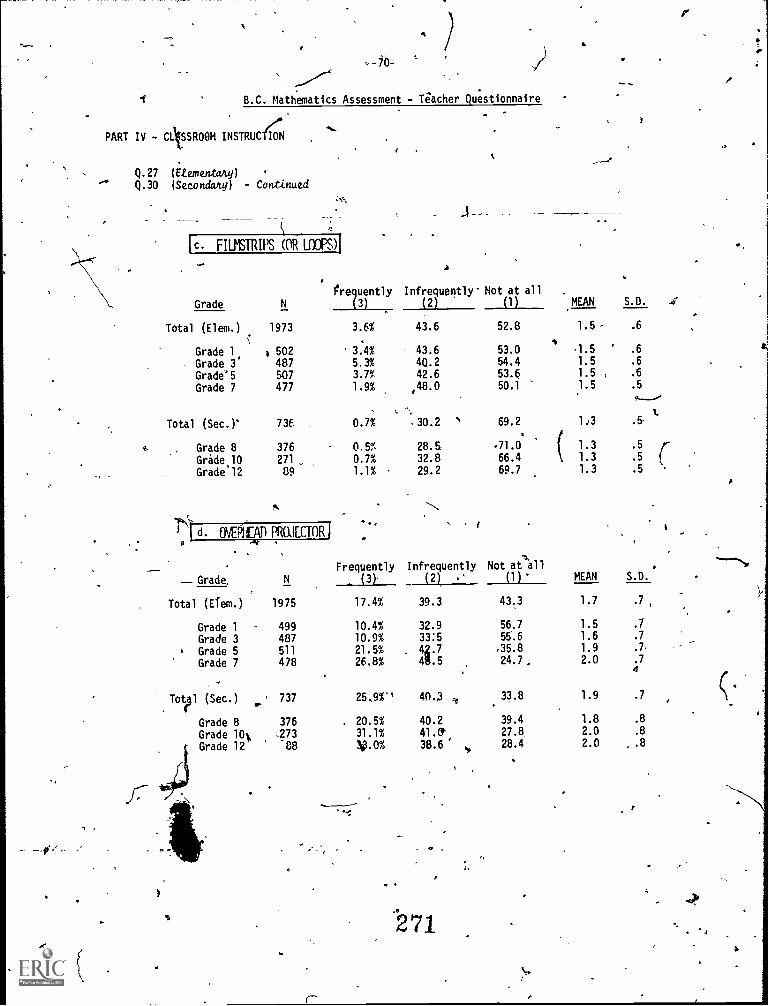
A
B.C. Mathematics Assessment - Tiacher Questionnaire
PART IV - ClkSSROOM INSTRUCTION
Q.27 (Etementam)" Q.30 (Secondary) - Continued
[c. FILMSTRIPS (OR LOOFS)1
WO.
Grade N
1973
502487507477
736
376271
89
frequently
(3)
Total (Elem.)
Grade 1
- Grade 3'Grade'5Grade 7
Total (Sec.)'
Grade 8Grade 10Grade"12
-
.
3.6%
3.4%5.3%
3.7,'
1.9%
0.7%
0.7%1.1%
ti
r\od. ovEPJEIJ) PRWECTOR I
- Grade
Total (Efem.)
Grade 1Grade 3Grade 5Grade 7
Totar l (Sec.)
Grade 8Grade 14Grade 12
f
A
Infrequently' Not at all(2) (1) MEAN S.D.
.
43.6 52.8 1.5 .6
43.6 53.0 1.5 .6
4Q.2 54.4 1.5 .6
42.6 53.E 1.5 , .6
,48.0 50.1 1.5 .5
.30.2 '', 69.2 113 .5
28.5 -71.0 ( 1.3 .5
32.8 66.4 1.3 .5
29.2 69.7 1.3 .5
Frequently Infrequently Not at all
N (3) (2) ' (1)` MEAN S.D.
1975 17.4% 39.3 43.3 1.7 .7
499 10.4% 32.9 56.7 1.5 .7
487 10.9% 33:5 55.6 1.6 .7
511 21.5% . 4Z.7 .35.8 1.9 .7
478 26.8% 4S.5 24.7 2.0 .7.
4
737 25,9%" 40.,3 33.8 1.9 .7
376 , 20.5% 40.2 39.4 1.8 .8
-273 31.1% 41.0' 27.8, 2.0 .8
-C8 V.o% 38.6 ' 28.4 2.0 , .8
4271
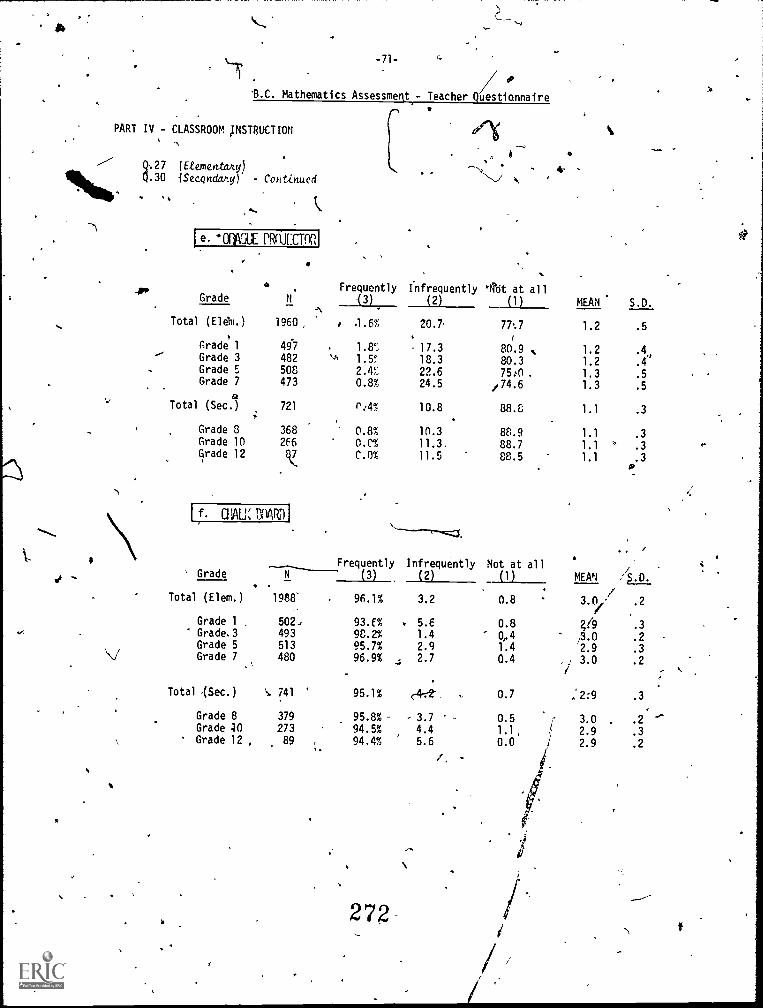
-71-
S.C. Mathematics Assessmerit- Teacher Questionnaire
rPART IV - CLASSROOM ,INSTRUCTION
(6tementany)
Nib
.30 iSecondany) Continued
I e. "OPM rRaiECTOP,I
Gradeo
N.
Frequently
'(3)aa
Total (Eldhi.) 1960 , 1 .1.6%
Grade') 497 1.KGrade 3 482 `,6 1.5°Grade 5 508 2.4%Grade 7 473 0.8%
Total (Sec.)a
721 r:4%
Grade 8 368 0.8%Grade 10 266 0.0%Grade 12
IV.C.0%
am; tywn I.
4-.../ a,
Sa.
Infrequently 'abt at all(2) (1) MEAN S.D.
20.
17.318.3
22.624.5
10.8
10.3
11.3.11.5
Frequently Infrequently' Grade N (3) (2)
Total (Elem.) 1988' 96.1% 3.2
Grade 1 502, 93.6% . 5.6Grade.3 493 98.2% 1.4Grade 5 513 95.7% 2.9V Grade 7 480 96.9% , 2.7
Total Sec.) 741 95.1% (-4-eft
Grade 8 379 95.8% - - 3.7 -
Grade 40 273 94.5% 4.4Grade 12 , 89 94.4% 5.6.
272
1.
77.7
1
1.2
80.9 , 1.280.3 1.275:0 . 1.3
/74.6 1.3
88.8 1.1
88.9 1.1
88.7 1.1 '
88.5 1.1
.5
.4
.4'
.5
.5
.3
.3
.3
.3
i
Not at all(1) MEAN 4.0,
0.8 3.0,i4 .2(
0.8 4(9 .3
0,4 ,,3.0 .21.4 2.9 .30.4 , 3.0 .2
i
0.7 :2:9 .3
0.51.1,
0.0
3.0 .2
2.9 .3
2.9 .2
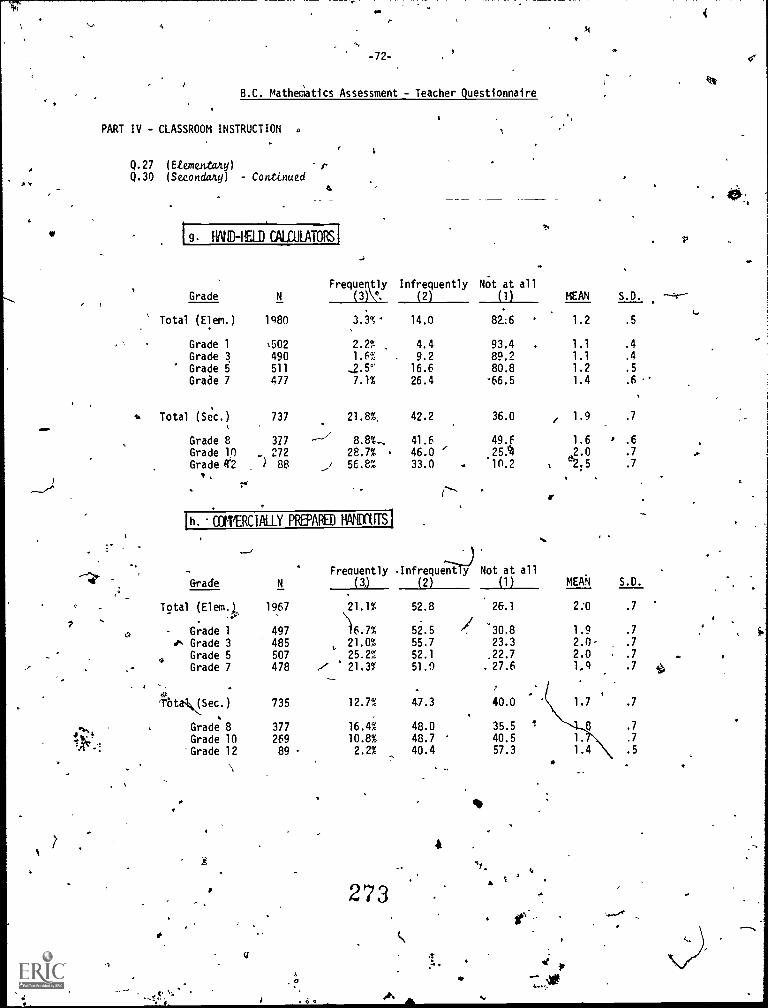
-72-
B.C. Mathematics Assessment - Teacher Questionnaire
PART IV - CLASSROOM INSTRUCTION
Q.27 (Etementnityl pQ.30 (Secondary) Continued
4
19. CALCULATORS(
Grade N
1980
..;
Frequently
(3)\'',
" Total (Ele(n.) 3.3%-
Grade 1 %502 2.2%
Grade 3 490 1.6%
Grade 5 511 -2.5°'Grade 7 477 7.1%
. Total (Sec.) 737 21.8%.,
Grade 8 377 ..--/ 8.8 %-.
Grade 10 .. 272 28.7%Grade 4e2 ) 88 1 56.8%
n. COWERCIALLY PREPARED RAIIDRETS
--4r
.
-
Grade N
1967
497
Frequently(3,)
Total (Eiemi,.
a 'Grade 1
21.1%
16.7%
ro- Grade 3 485 21.0%
Grade 5
.- Grade 7507
47825.2%
,,, 21.3%
---11;
Tbtak(Sec.) 735 12.7%
. .
.1.% Grade 8 377 16.4%
1)i.,! Grade 10 269 10.8%
Grade 12 89 2.2%
*A-
273
Infrequently(2)
Not at all
(1) MEAN S.D.
14.0 82:6 1.2 .5
4.4 93.4 1.1 .4
9.2 89.7 1.1 .4
16.6 80.8 1.2 .5
26.4 -66.5 1.4 .6 .
42.2 36.0 / 1.9 .7
41.6 49.F 1.6 .6
46.0 ` 25.% _2.0 .7
33.0 . .1(1.2 , '2.5 .7
Infrequently) Not at allS.D.(2) (1) MEAil S
52.8 26.1 2:0 .7
52.5 I. 30.8 1.9 .7,
55.7 23.3 2.0- .7
52.1 ,22.7 2.0 . .7
51.0 . 27.6 1,9 .7
47.3 40.0 1.7 .7
48.0 35.5 8 .7
48.7 ' 40.5 1 .7
40.4 57.3 1.4 .5
0 0 }1. AILti
..
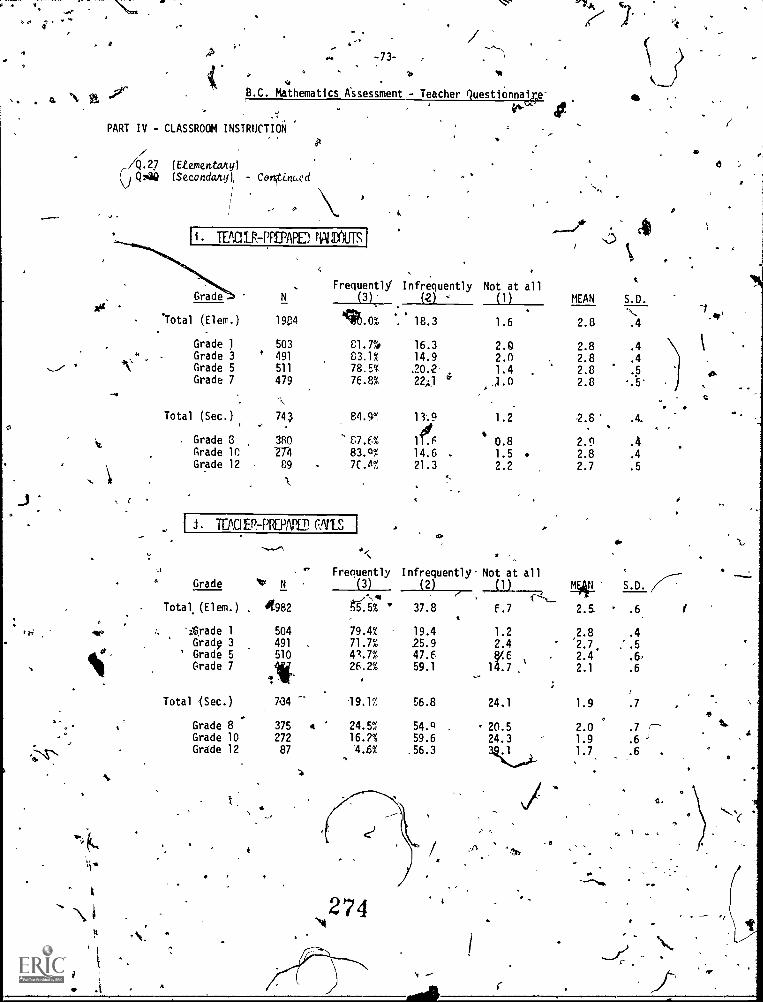
4 r
.2
-73-
B.G. Mathematics Assessment - Teacher Questionnaiie
PART IV - CLASSROOM INSTRUCTION
S
(10.27 (Etementany)(SecondaA0 - Colt.in4cd
I i Tal LR-P1 EPAPO 411 JUTS I
Frequently
(3)
:Total (Elem.) 1984 116.0%
Grade 1Grade 3
503
491
81.7%.
C3.1%Grade 5 511 78.5%Grade 7 479 76.8%
-.,
Total (Sec.) 74a 84.4r' '
Grade 3 380 S7.6%Grade le 2T4 83.0%Grade 12 89 76.4%
ER-PREPAID MU-\
Infrequently Not at all
(2) ' (1) MEAN
18.3 1.6 2.8
16.3 2.0 2.814.9 2.0 2.8.20.2 1.4 2.822;1 LO 2.8
11.9 1.2 -2.8
16 .0.8 2.9
14.6 . 1.5 2.821.3 2.2 2.7
4,
Frequently Infrequently. Not at allGrade 41r II' (3) (2)
/(1)
, 1`..._._
Total. (Elem.) 4982 55.5% " 37.8 6.7
'Arade 1 504 79.4% 19.4 1.2Grady 3 491 71.7% 25.9 2.4
' Grade 5 510 4'.7% 47.6Grade 7
I.26.2% 59.1 li'1.i 2
Total iSec.) 7.34 19.17 56.8 24.1
A
trade 8 375 a 24.5%Grade 10 272 16.2%Grade 12 87 4.6%
4
1
54.0 20.559.6 24.356.3
Ye
c
S.D.
.4
.4
.4
.5
.4
.4
.5
NWI S.D.
2.5 .6
2.8 .4
'2.7. : .5
2.4 .6'
2.1 .6
1.9
2.0 .7 r-1.9 .6
1.7 .6 .
a.
.
274
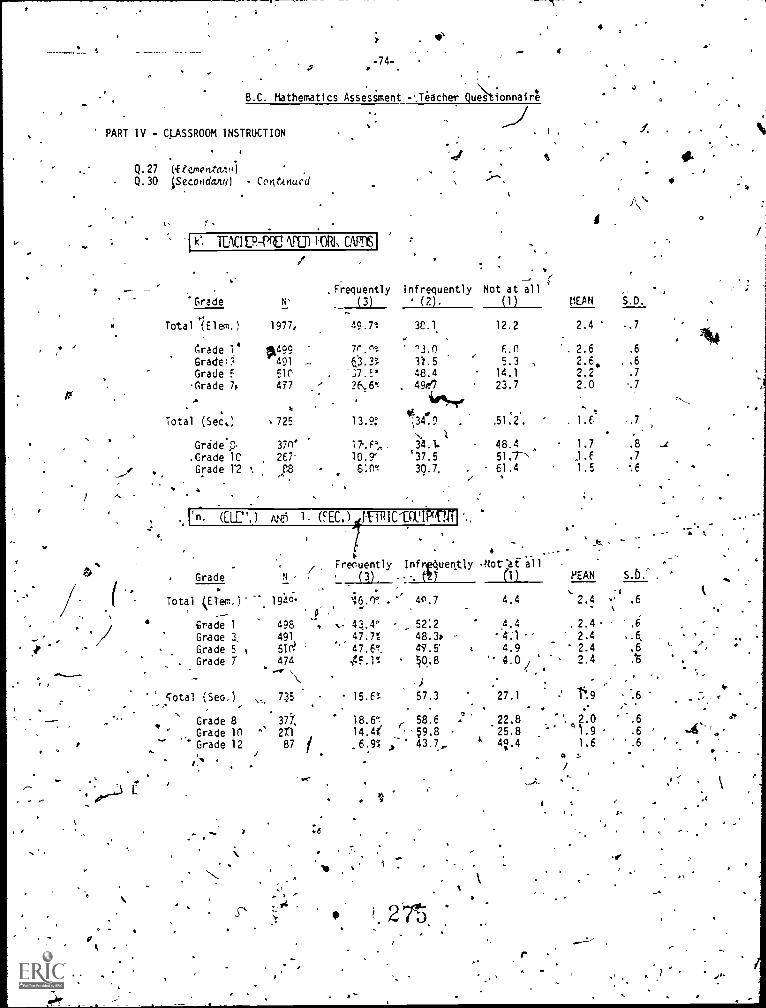
Vt.
-74-. .
B.C. Mathematics Assessment -Jeacher Questionnaire
PART IV - CLASSROOM INSTRUCTION
Q.27 itemeutaitt/Q.30 J,Seconda itif) Continued
I k' IDOL-P.-PT kril) GAP
4
O
td
. .
. Frequently Infrequently Not at al 1'Grade tv (3) (2). (1) MEAN S.O.
Total (Elam.) 1977, 49.74 3C.1. 12.2 2.4 -.7
Grade 1 4 tk499 7C.,.: "3.0 r 6.0 ; 2.6 .6Gracle,3 491 0.3'; 3/.5 5.3 , 2.6, . .6Grade 5 510 2,7 .E° 48.4 14.1 2.2 .7
Grade 7. 477 - 26,,,,6= . 4907 23.7 2.0 .7.,. iieS-ove
II. :tTotal (Sec.', 725 13.9: ',34.9 . ,51.2. ' . 1.6 -7
,. 1. ,
Grade C' rn 1 7-.P, 34.1. 48.4 1.7 .8 _c
.Grade 1C 267- 10.2 r '37.5 51.T" 1.6 .7Grade l'2 ,. .118 6'.0`f 39.7, 61.4 1.5 .6
..,
e"-
.
t-olf
..e4.
' . ', (1 )
Frequently Inf uently -Mot :al allGrade N - (3).
. - .Total kEtem.)' 19.46 16.0'. . 40.7 4.4
Grade 1 498 , .: 43.e 52:2 4.4Gracie a 491 47.7% 48.3r 4:1Grade 5 $ 51(i? 47.6". 4.7.5' 4.9
I
. Grade 7 . 474 .,45.1°4 O.8/
.8 '' 4.0....- , ,.,
_
cotal (Sec.) ,, 735 15.6*; 57.3 27.1., ' . -
Grade 8 317; 18.6"- 58.6 . 22.8. o -
Grade 10 ^s 2r1 14.4f 59.8 25.84
Grade 12 87 f .6.9% .,"' 43.7.. ,, 4c).4J .
..1.
,.
-
rn. (ET%) AT, 1. (FEC./
S.
11-11 IC -C11,11RVICI ,
:6
:%.
le SAs
r
-
s
MEAN S. b . . -..
-( (2.4 -' .6
. 2.42.4 -
2.4 .6 y'. ', 2.4 ..6
,-' , '-' 1`.9
....
', 2.0 ,....9 .6 ' Ar'`,
1.6(. : . - .
/.
e"
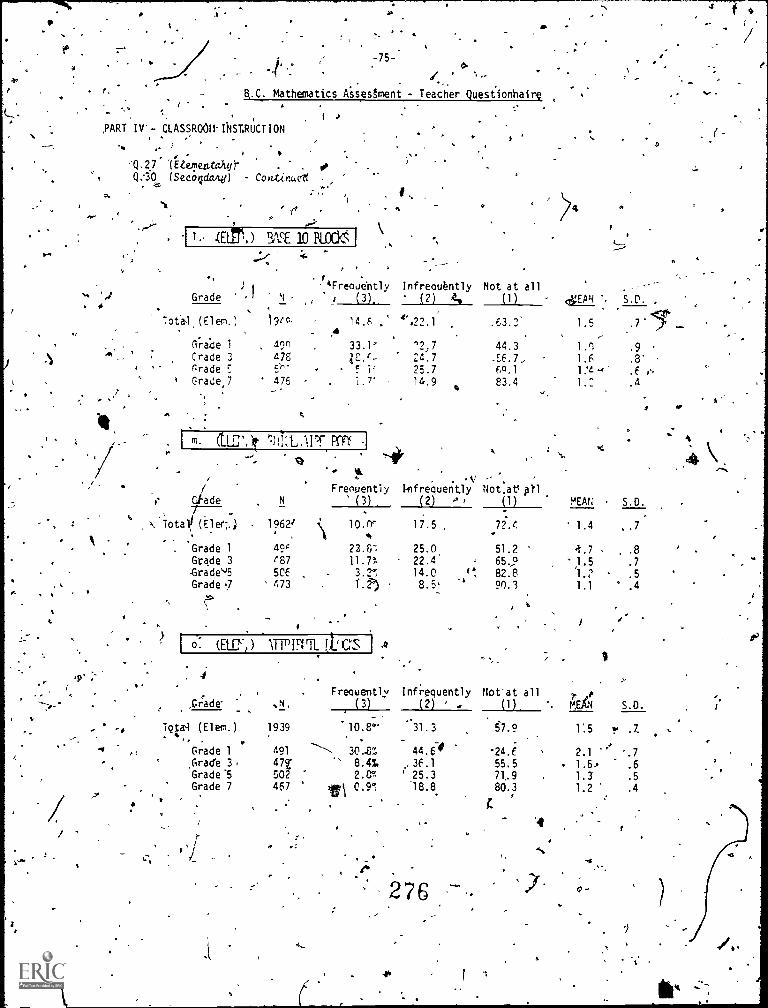
yr
a
/
a t
-1..-:75-*
4.I ..--. .
Q.C. Mathematics Assessment - Teacher Questionnaire .. .
i. - ...
'.. ,' .1
,PART IV'- CLASSROOM. INST.RUCT ION
' I(:).2,7" Arte,r1 en.r.rOuj)- . .
0:30 (Secoqdang) Co ritirtuclf
.. 'I
- ,
".p.,' . r=e ,1 1. 4E1 r.) M.CE 10 BLCCk ]
), I
.
'
t4Freoudntly` '1 Grade i (3).* .
Totel(Elem.) 19E0 14.6 ,:'
Carara-oe 1 49n 33.1': Crade 3 478 ?8.,--
r:rade E ep,- 5 1;rape 7 ' 476 . 1.7'-
/
,
4
Infrequently Not at all(2) 44 (1) oVIAN '. S.D. ,
'',22.1 .63.2 1.5 .7 <3.....
"2,7 44.3 1.n. .924.7 -E6.7, 1.6 .8'25.7 60.1 1:4 ''' . E -
C 14.94 83.4 1.2 .4
P:ni,:t.I.lor pm .1
. ../ Frenuently Infrequently Not.at pl
e lade N (3) 12) -*, (1) MEAN - S.D.
Total/ (Elee-.; 1962' 10.0' 17.5 . 72.4 1.4 , .7*4
Grade 1 49P 23.&: 25.0 51.2 4.7 , .8Grade 3 e'87 11.7% 22.4 65..9 ,1.5 .7Grade-'5 50E 3.2', 14.0 r.
, 82.8 1.2 - .5Gradeq ' 473 T.f, - 8.5, 90.3 1.1 ' .4
0: taff) LIZICZ 1
Frequently Infrequently Notat all ,i, p,C:rade' ,N, (3) (2) . (1)_ .. Mail S.D.- .
Nal (Elem.) 1939 10.8°' 31.3 57.9.
Grade 1f
491 ------ 30.87, 44.64 24.EGrate 3, 47 ' 8.4%, , 3f.1 55.5Grade '5 502 2.8"- ' 25.3 71,.9Grade 7 467 iri 0.9", 18.8 80.3
. ._ i'..
ra r
,
.d=
276
'4
1'.5 r .7.
2.1 '" .71.5' .61.3 .51.2 .4
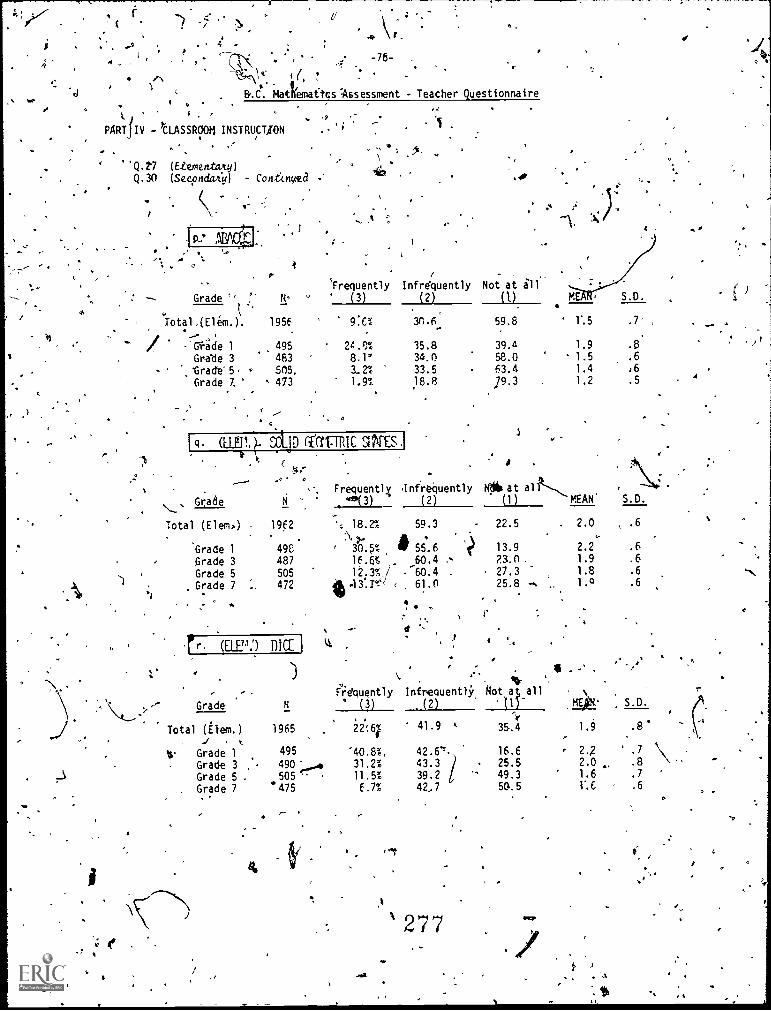
)
4
.0\
-76- .
Mattemaftcs:Assessment Teacher Questionnaire
6 ,
PART IV -tLASSROOM INSTRUCTION
' (Ettmentaxy)Q.30 (Secpnda/4:0 - Con6<rgred
-1P. ,EPOC6j:
, I -
'Frequently Infrdquently Not at all
Grade " , N', v ' (3) (2) (1)
75otal,(Elem.). 1956 9:C% 3n.6' 59.8. .
.., .
..
GY4de 1 39.4495 24.63 35.8
Grade 3 483 8.1' 36.0 58.0
', 'Grade' 5 v 505. 3.21 33.5 63.4
Grade 7. ' , 473 1.9% 18.8 79.3
, e
lg. (EMT,)- Sip riCrI7RIC WIFESI1
),, ( e .
.4,-
..
, ,-. Frequently ,Infrequently WM, at all
`...'
L......---
Grade N ''. '10(3) (2) (1) MEAN' S.D.
,
Total (Elem) 19E2 ', 18.2% 59.3 22.5 2.0 , .6
. '2N, ,....
Grade 1 498 ' 30.5% IVA
55.6 '1) 13.9 2.2
..
.6
Grade 3 487 16.6f. _ 60.4 23.0. 1.9 .6
Grade 5 505 12.3%,) . _60.4 27.3 1.8 .6
si
. Grade 7 I, 472 11.13:T1 z 61.0 25.8 -. 1.0 .6
0
S.D.
.7' ,
1.9 .8
1.5 .6
1.4 .6
1.2 .5
rr (ELEP,) niCCJ
: , ) \ ". NI
e , fidquently Infrequently Not at all
, .-- Grade N (4) . (2) 11) 1-14N . S.D.
...
Total (fleet.) 1965 22:6q."f
41.9 k 35.4 1.9 .8..., t -.
t Grade 1 495 '40.8%, 42.6' 16.6 2.,2 .7
Grade 3 490 L... 31.2%
'. .
43.3 /39.2
.
49.325.5
' 1.6
2.0 .8
Grade 5 . 505 11.5% .7
Grade 7 .475 6.7% 42,7 50.5 1''.6 .6
0 ,I
277
I
I
A
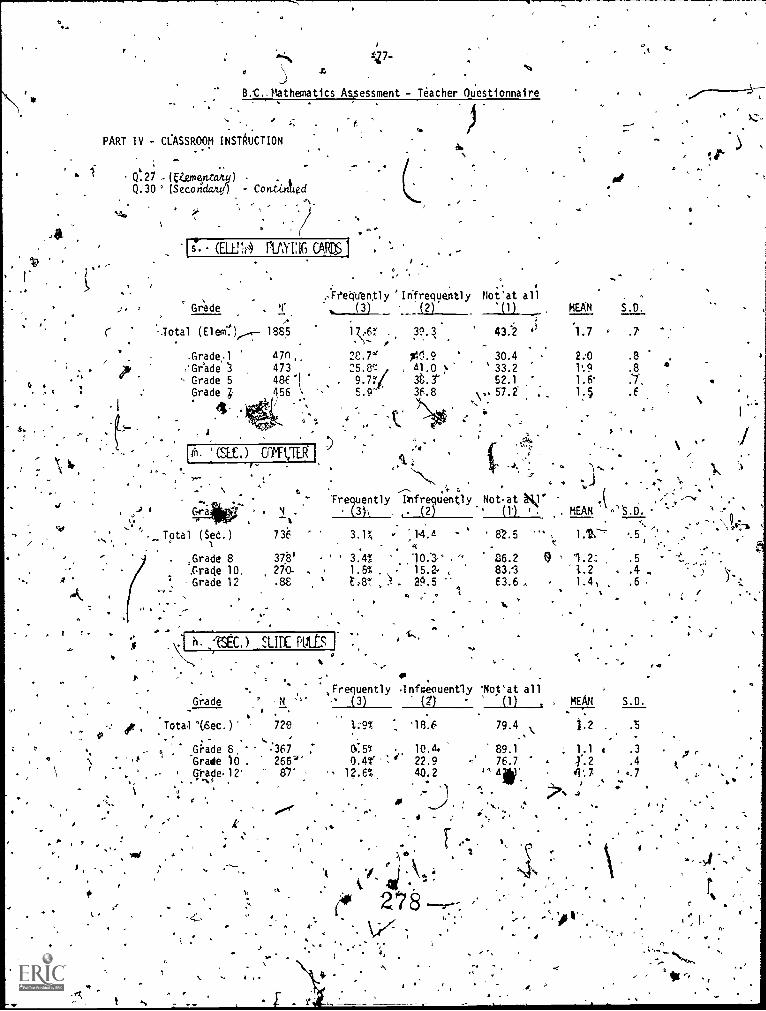
0
1'4%klo
B.C. *, Mathematics Assessment - Teacher Ouestionnaire
PART IV - CCASSROOM INSTRUCTION.
-27 , (ttemsn-tang) .
Q.30 ° (Secondwuj) Contbffigd
(milt) PUNEIG CARaS1
..
.-.Feetiu'eritly Infrequently Not'at all,Grade . y -b (3) (2) '(1)
. .
( '- _Total (El erti),,.....--.-- 1885 1 ..61 _ 39'3 43;2 ''''-
O
I
f -
,'Grade 473 25.8`z , , 41.0 . ' 33.230.4-Grade,.1 470 n di.7°1 O.9
Grade 5 486'1 9.7%ii 3t.3'''' 52.1Grade k 456 5.9"' 36.8 v. 57.2' ,. / .
pi. cntwrip;1I
N.\\ `
MEAN
...-
ss .D.
11.
.1.7
2:01%9
1.6'1.5
.7
.8
.8
f
1040
\
Total (Sed.)
.
'Fr uently Itifreqtien tly Hot. at Ne .( O
3 . (2) (1') 1 . MEAN .''S.D.
736 3.1; 4 8:2.5 '
Grade 8 378' ' ' 3.41 £6.2krade 10, 270- 1.5% 15.2. 83.1Grade 12 88 E.8% . 29.5
a63.6 ,
-h. 'TSEC,) _SLIDE PULES
.00
N.
a
.51.2 . 41.4, .6
, /
Fr uently Infueouently 'Not'at all' 3 (21 . MEAN S.D.
Total ''(iSec.)' 720 1:9% I '18.6 79.4 1.2 .5
o Giade 8,...
-, 367 ; 6:5% 10.4 89.1 . 1.1 .3'$'- Grade 10 . 266'' 0.4f s- d 22.9 -' 76.7 12 .4
grade, 12' 87'. . 1!, .
1 ?. 6% 40.2 v. ii *. 7 ' .7,- , , ;
". . . a..-,1 : ,,
I- :k ,
ledla
t
278V 'f
'0.
ti
4.
1.
V .
' 0
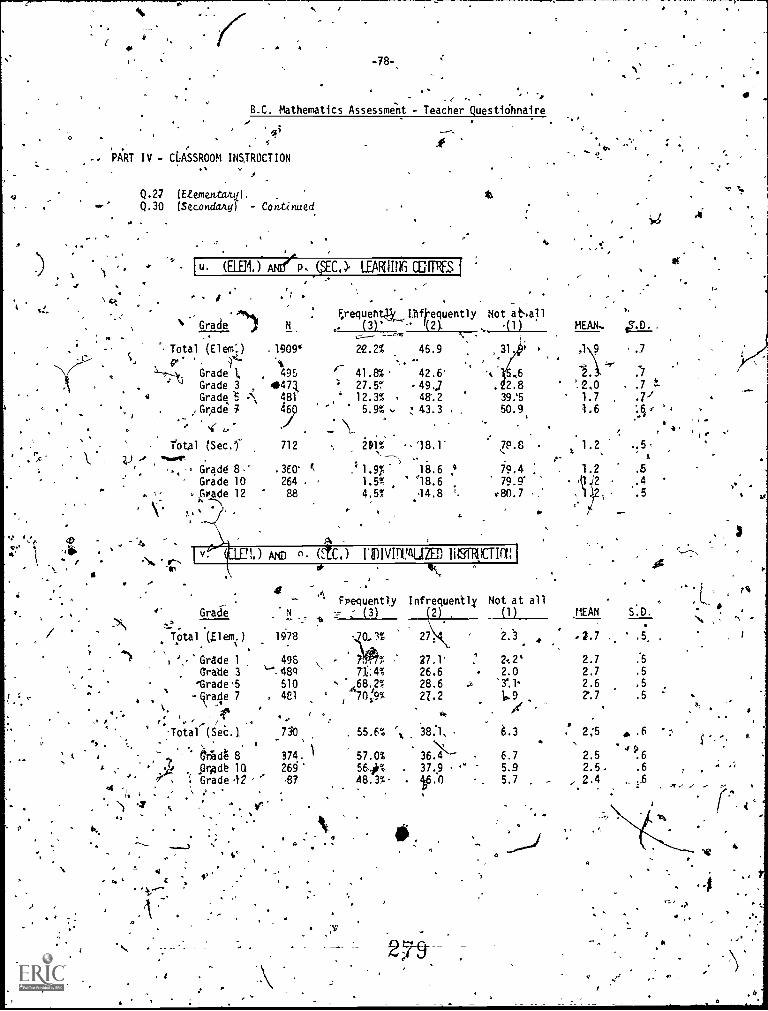
-78-
.e ,
B.C. Mathematics Assessment - Teacher Questionnaire
13.41
PART IV - CLASSROOM INSTRUCTION
Q.27 (Etementany.).Q.30 (Secondary) - Continued
5: t''
. 111. (ELE1,) Aft(P- (SEC,), LEARIING COPES I. . --
,. ,':_ .
-. F,requent.b, Lhfkequently Not atN,a11 ., Grade N (3) - In 41) MEAN., J.D..'-.
-', Total (El em".) .1909' 24.2% 45.9 31, 1 ,
4,as . )L '4). . , 4
-.7
rraaddee 13, 4449A r- 41.8% < 42.6'' 27.5% 49.; . 2.8 ' 1,2,0 , .7 t-
6 I. -r. .7
4 Grade., 6, ; 481 ' 12.3% 48-.2 39:5 1.7 .7-1.
s., - ,
,., Gr,ade 5 4.7 5.9% . ; 43.3 . 50.9, 1.6 3' '_ .,
.....- ,,
fatal (Sec.'1' 712 -. 291% - '18.1' 79.8 1.2, ..5 < '\ ____z) ... womre .
/9.4 .
:- i, 4 - Gr4d6 8 .' .3E0' c .; 1.97 '1.8.6 c' 1.2 .5
_< ' '18.6 79.9"Grade 10 264 . < 1.5% 2 .4. s - Grade 12 88 4.5% 1 4.8 '. .80.7 : .5
V. " - , ,
st
.
I
:
.-. 4
A
a -
4
.
\,..
,,'
$
ti
A
I
l 4
1.) arm n (C.) l'IDIVIr1l.'QIIZE9 litgRCTIT, I
Gracie
of :A_.
N_ .: t.1978
498 -
510481
710, <
374. \269-87
:N7
Frequently(3)
Infrequently2
Not at all(11,
,Total (Elem.)
d Grade 1Grate 3
'Grade .5-Gratle 7\ -41
, f-Total (SeC. 1
, 'L vat 8.GrAdt 10Grade -12- - '
,, ' - V
0. n7.. %7);:4%68.2%70,9%
. 55.6%
57.0%564%48.3%-
',
.
27,
27.1'26.628.627.2
38.1,...,
36A37.94 .0
-
"
2t 2'2.0
.
1.
6.3
6.75.95.7
.
,
MEAN S.D.N. 5,
' .5, .
2.7 52.7 .52.6 .52,7' .5
,' 2;5 .. .6 '-.
2.54 So
6
2.5- .6, 2.4 . ._6
4
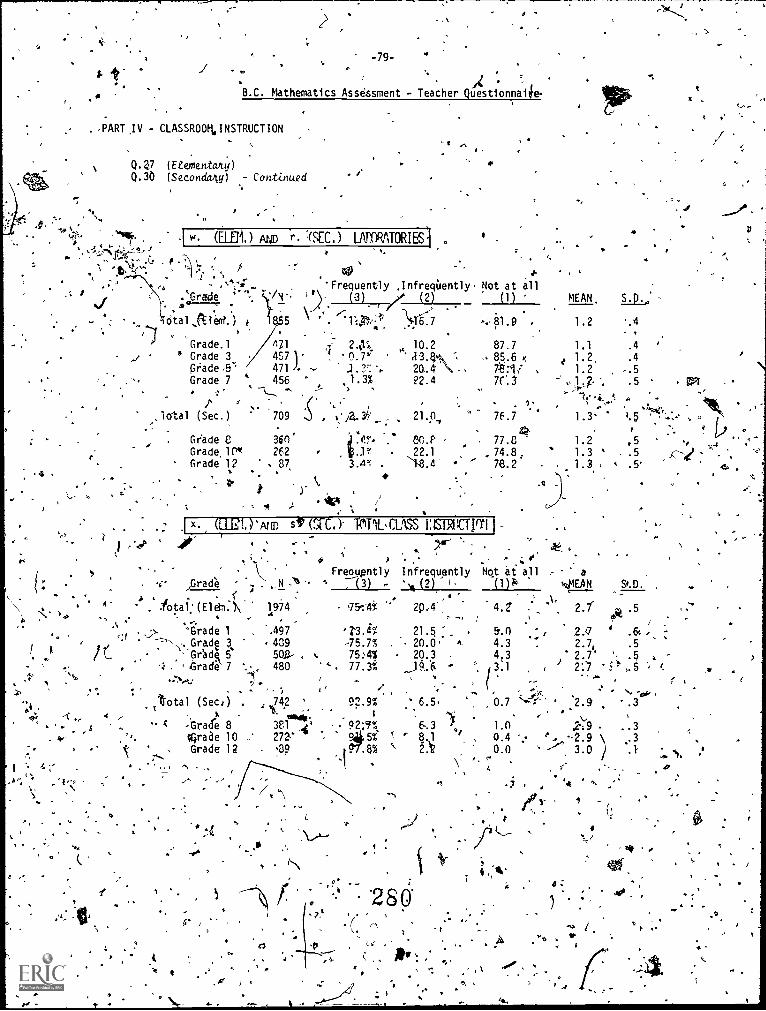
2
-79-./ - . . ,,
.r " ,.B.C. Mathematics Assessment - Teacher Questionnaite
. .PART IV - CLASSROOtt INSTRUCTION
°,1;;;';#
3,
-1
Q.2.7 (Etententaity)Q.30 (Secondaity) Continued
o
Oof
r
.
. .1 w. apt ) AUD
aisv.1 7
.`Grade VI. ' /) (.3) 2, (2). . .
" -*.' ,,-. _,4" --1 ..?
Otal ,(76ierrt.) (8 5 " . 1:,0,-.;,1" A1'6.7 81.9 1.2 .4
I s,
Grade. 1 471 2.,P, , 10 2 87.7
r. '(SEC.) UTIRATORI ES
Frequently , I nfreciiiently . Not at all(1) MEAN,
a
1.1 .4.../ a, ... 85.6 e, ? 1.2, .4
phde .5'; 471 4. - .1.r. ', 20_4 761 , 1.2 -.5Grade 7 " 456 1.3% 22.4 7(.3 ..1.?. *. .5 171.!: ..,
i ,,
(.4.-4,..,,, .
Total (Sec. ) 7()9 , 1: /2... 34' 21,0,. 76.i 1.3 1. 5 ' . ',..,.. .. ,,,Ibt,- s,,. 1.. .
.e
.,.. .
a: , i bGrade 8 360 J0 8,).p 77. 8 1.2
'
Grade, 1( 262 L.1`," 22.1 74.8, 1.3 s , .5 4-,1 s' .
Grade 12 . 87, 3,4.: - `18.4" 78.2 1.3 , ' .5' 4tt )-
t \ .4
*11
(.21e ) 'Atip sir (SIC ). PTIL, CBS'S LISTIACTIrrli -7 '
, ,,a 404.
5
'Gs° ,Grade ..
. .
. . . 4 , .\ ,,. 2. ..* Total; (El el-n. X
A. , 2. 'Grade 1 ,
f ' -:'''' Grad 3
I, / k- -Grdg 5.,,, - .: . ' Grade' 7 '..
. .. . .sa' ...":,,,,,, 1.
.> : , - '
dotal (Sec,) . .0 ,'
.. , , - ; -Grade 8. te- ' ,. trade 10 -*
-s....'Grade 12
I. 4 '`. . 'e ..
, .. . . .,'''' ot.,a '',
, A ' '.. eFrequently Infrequently Not at all a
(3)-.'' "- , -4 (2) 1'N- (1)g 1,41EAN S#..
1974A
, ,.497409508- , .480
. ',
742 '/ -trimk%
381 4272-'39
' '751' 0 4 2P 4 4.2' .
Z3. Li% 21.5 : . . 5.0.45.7% . -. 20.0. 4 4.375:4% 20.3 . 4,3
`> 77.3% ,,19.'6 - . 3.1
(. ./
92.9% 6.5 0.7
92;/% Es.. 3 1.09,4 5%. .c - 8.1 41 0.4
..17.8% ' 2.1 0 . 0, ...
1
-ii". ,..1,' n i-
. , 4
4
,s
,
280'-7'
't)
'', 2.f ,,,,,, .5,t,w,
,
,... , 2.s7 '` .6 . - s. 2.7, .5
, 2.7' ', . 5 ,, 217 ,i' ,. 5 i.
( ,....
---., I
S... .0,fr....e4----',' 2.9 .3. ,
2:9 .1 3.. '.. -2.9 \ .3
' --- 3.0 1 .1
7. .
"
a
_
a
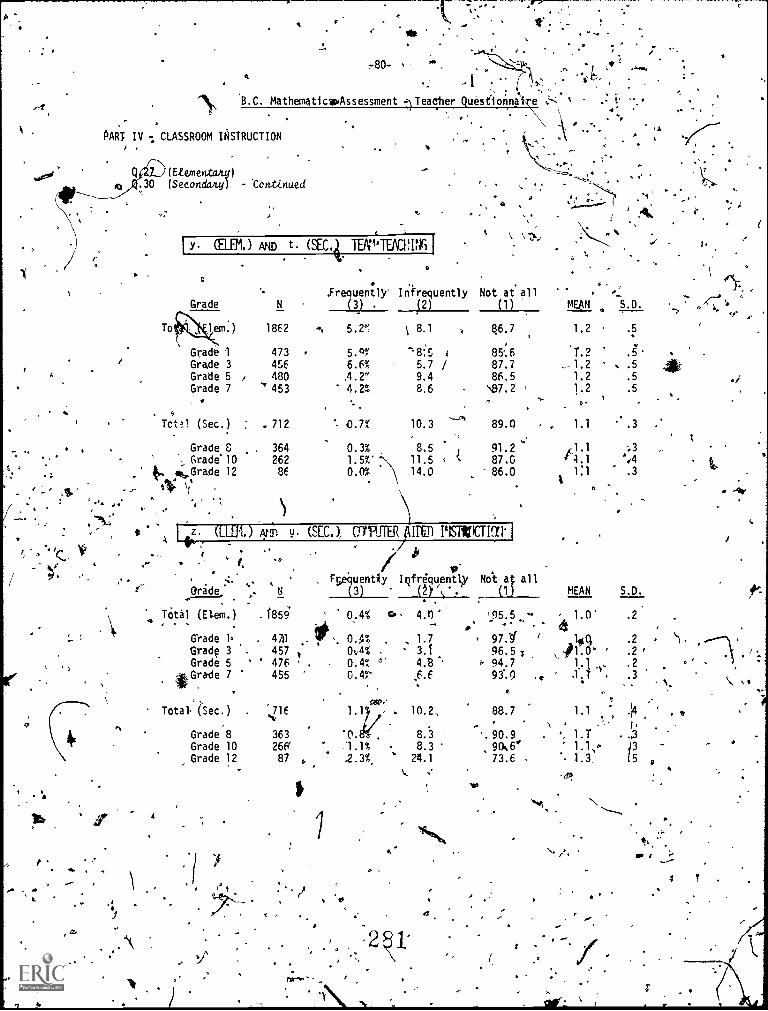
,80-0
rT
4 ' 1
0,,
B.C. Mathematic Assessment 1Teacher QuestIonna e
PART IV CLASSROOM INSTRUCTION,
(Etementany)
.30 (Secondary) - 'Continued
1-0
1
.44
1Y (Ep.) AND t TEPIF.AHING 1
.Fr uently' InfrequentlyN 3
5.2", 8.11862 .6,
Grade 1 473
Grade 3 456A Grade 5 / 480
Grade 7 '453
Total (Sec.) : . 712 .
, Grade 8 364
Grade'10 262t ek,Grade 12 86
9
(#
ss,
j
\
,7 4
4
At (UM.) '.14.1 v. (SEC.)46
Orade_,.
TOW (Elem.) .f859
Grade 1 ,
Gra4 3 .
Grade 5 "*Grade 7 '
Total (Sec.)
Grade 8Grade 10Grade 12
1,1
470
457
476
455
5.Q%
6.6%
A.2"4.2%
5.7 /9.4
8.6
.0.7% 10.3
A
Not at all(1)
8.6.7
85-.6
87.7
86.5"87.2
-
4
04
MEAN*
S.D.
1.2 .5
'1.2 .g.
1.2 .5
1.2 .5
1.2 .5
89.0 . 1.1
0.3% 8.5 91.21.5%' ;\ 11.5 a 't 87.00.0% 14.0 86.0
('JWJIER r erER tu itismicrir.ii.1
V'Frpequent y Wrequentl.y Nol at all
(3) (2} L (1)
1.1L
1:1 .3
MEAN S.D.
.2
.2 `).
.2
.2 6 '
.3
0.4% ci- 4.n '95 5 . 1.0'r' .,
-1.7 . 97.g ' Ilig3.1 96.5 z \P1.0'4.8 , 9 94.76.6 93..0 .. .111 l'
0.4% .
00%0.4% 4'
OAT.
'716 1.1 . 10.2,6e.
363 'O.
26ff '1.1% 8.3
87 . 2.3%. 24.1
4
88.7
90.990k6'73.6 .
S
1.1
. 1.T .31.1,. 43. 1.3, (5
t
t.
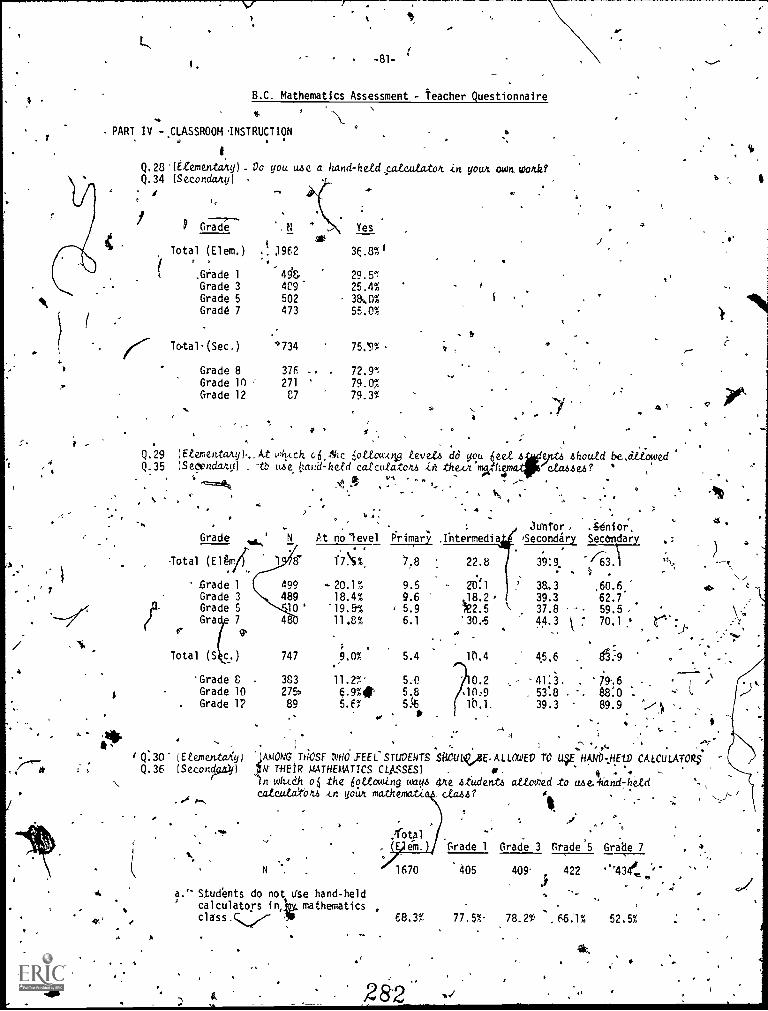
-B.C. Mathematics Assessment - Teacher Questionnaire
PART IV - CLASSROOM 'INSTRUCTION
I
Q. 28 (eZementany) Do you u,se a hand-hdd .5.4.!_cat.atok in your mum Wale?Q.34 (Secondary)I
4.
N
3962
Grade
Total (Elem.) .,
_Grade 1 49TE,
Grade 3 4C9Grade 5 502Grade 7 473
Total% (Sec.) '734
Grade 8 37fGrade 10 '- 271Grade 12 C7
-
f
ra
Yes
s
O
:.3F,.8%
29.5%25.4%38,0% 1
55.0%
to
75.'9% r-
72.9%79.0%79.3%
-r .
Q.35 (5q.ondany) . -tb u,seitand-hefd catcubatou in .thew mA:th4Q.29 (EZementany).,At whkch oithc 6ottacAn4 teve.6 do you ie.:L.491.6 ehoutd be.dtimwed
'0.22$64e.4?
Grade .4,...'I.
8
499489
104
747
383275$
89
U-tr
At no level Primary rntermedi
-Total (Elk/ t
.Grade 1Grade 3Grade 5Gracie 7
'4'
Total (S
'Grade 8Grade 10
. Grade 1?
175 %
- 20.1%18.4%
' 19.9%11.8%
9.0%
11.2%§.9%.5.6%
/.8
9.59.6
i 5.96.1
5.4
5.05.85k
: 22.8
2D'.108,27E2.5'30.6
1r.4
?10:910.2.
1.0.1.
i Q:30 (Etementa4)Q.36 (Secon )
'.(AMONG TtiOSE tytio .FEEL STUDENTSJIN- THEiR MATHEA'ATICS CLASSES)
witteh o the iottowing Locumeateithte)1.6.4.n youn. matitemati.
.
a." Students do not use hand-heldcal culators i n, mathematics
irotp1em.
1670
68.3%
28'2-
,hintor . . "SOni or,Secondary Secondary
39:9 '43)38..339.337.844.3
,60.5'62.759.5"
7 70.1
4.5,6 . 6:9
, 53:8 . '. 88:0 ....
-41:3 , '79.6
39.3 89.9. "..-/)
: ' . .. ", ,
,,,- , A. ' . "'''SliCtilsZ,JE. ALLOWED TO lig NAND -,NE-LD CALCULATORS.
r * .. .Ore 4tUdents attouled .to uze.tand-hdd
ecease?
..Grade 1 Grade 3 Grade 5
405 409
77.5% 78.2, , 66.1% 52.5%
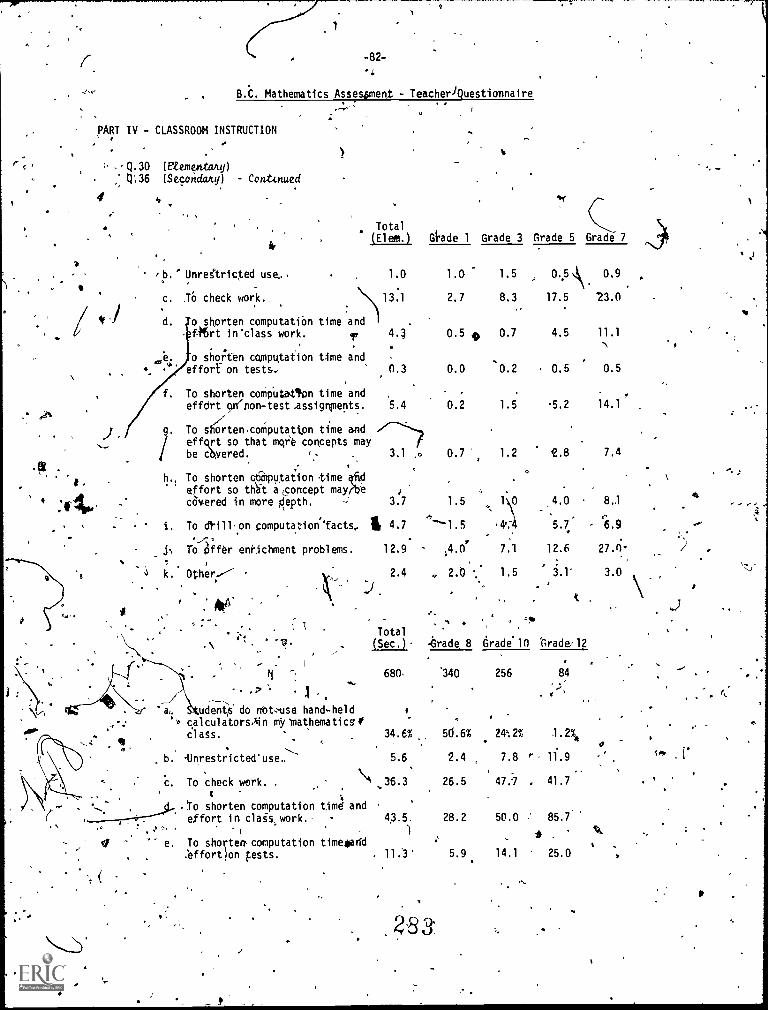
ft
-82-.4
B.C. Mathematics Assespent - TeacheriQuestionnaire
PART IV - CLASSROOM INSTRUCTION.
Q.30 (EtementaAy)Q:36 (Secoitdany) Coraxnued
4 4
Total(Elem.)
.o
Gcade 1 Grade 3
t'f
Grade 5 Grade 7
#
11,
b.' Unrestricted use.. 1.0
13.1c. TO check work.
4'1 d. o shorten computatibn time andf-Mrt in'class work. .F# 4.4
o shoken computation time andefforts on tests. 0.3
,
f. To shorten computatifon time andeffdrt odnon-test .assignments. 5.4
g. To srten.coMputatton time and/ effctrt so that mo,4 concepts may/ be cb,vered. 3.1
h.1 To shorten mutation time fideffort so tha-t a .concept may( ecovered in more plepth. 3.7
i. To cf1111.on computationcfacts, I, 4.7
j% To Offer enrichment problems. 12.9
t k. Other/ 2.4
1.0
2.7
0.5
0.0
0.2
0.7
1.5
'1.54.0'
2.0
1.5
8.3
0.7
0.2
1.5
1.2
1'0
7.1
1.5
0
0.,5,\.
17.5
4.5
0.5
5.2
42.8
4.0
5.7.°
12.6
3.1'
0.9
23.0
11.1\0.5
14.1
7,4
8..1
'6.9
3.0
- , .
I" a,. udent° do ntit,--use hand-heldcalculatorsAin my 'mathematics-iclass.
b -Unrestricted'use..
C. To check work. .
shorten computation time andeffort in clags, work.
e. To shorten, computation timeorid. 2effort)on tests.
Total(Sec.) Grade. 8 drade. 10
4(
trade/ 12
680, .340 256
.
84
t
34.6%
5.6
50.6%
2.4
24:2%
7.8 r
I . 2%4
11.9 too
36.3 26.5 47.7 . 41.7
'4.3.5 28.2 50.0 85.7
* .44%
. 11.3' 5.9 14.1 25.0
283p
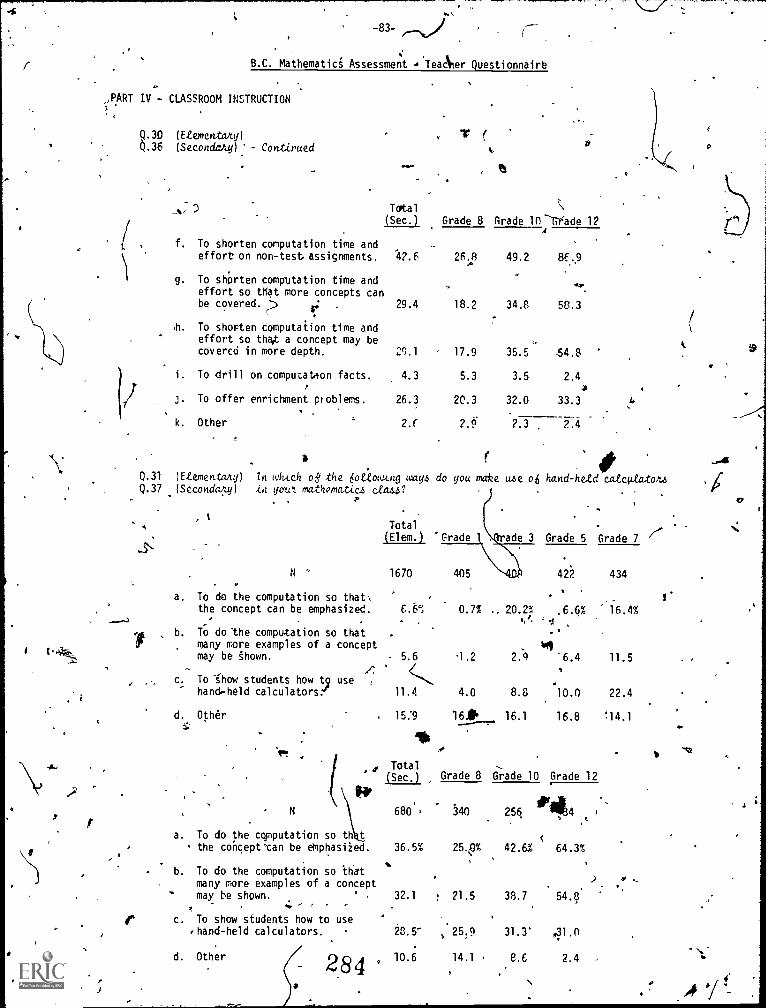
I
t
-83-
B.C. Mathematics Assessment TeacSer Questionnaire
,PART 1.1/ - CLASSROOM INSTRUCTION7
if
Q.30 (E-eernentany)
Q.36 (Secondat,y) Continued
. .
%.,-, ") Total C!Seca Grade 8 Grade 10Thfade 12
f. To shorten computation time andeffort on non-test assignments.
g. To shorten computation time andeffort so that more concepts canbe covered. (2)
41. To shorten computation time andeffort so thAt a concept may becovered in more depth.
i. To drill on computation facts.7
j. To offer enrichment problems.,
k. Other,
47,
42.6 26:8 49.2 8f.9
29.4 18.2 34.8 58.3
29.1 17.9 35.5 -54.8
4.3 5.3 3.5 2.4alt
26.3 20.3 32.0 33.3.
2.( 2.9 2.3 2.4
40P
Q.31 (Etementaity) In which o6, the liottowkng ways do you mate use os hand-had catcgatouQ.37 (Secondany) in gout mhoma ctd64?p
N °
- -
a. To do the computation so thatthe concept can be emphasized.
b. To do 'the computation so thatmany more examples of a conceptmay be "shown.
.. i':
c. To show students how tg use ,
hand -held calculators:"
d. Other
'I,' .
,
N
a. To do the computation so th tthe concept'can be eMphasiied.
b. To do the computation so that
Total
(Elem.) 'Grade 1 ade 3 Grade 5 Grade 7
i
1670
,
6.6%
405
0.7% . 20.2%41
422
.
.6.5%,
434
16.4%
*45.6 1.2 2.9 '6.4 11.5
c,11.4 4.0 8.8 10.0 22.4
15:9 '16.* 16.1 16.8 14.1.,-
1101
Total(Sec.) Grade 8 Grade 10 Grade 12
many more examples of a concept- may he shown.
I" c, To show students how to use ,
.'hand -held calculators.
d. Other
680, 340 256, IIN14
36.5% 25.e% 42.6% 64.3%
?
32.1 ! 21.5 38.7 54.8
28.5" :25:9 31.3' ,31.0
284 ° 10.6 14.1 . 8.6 2.4
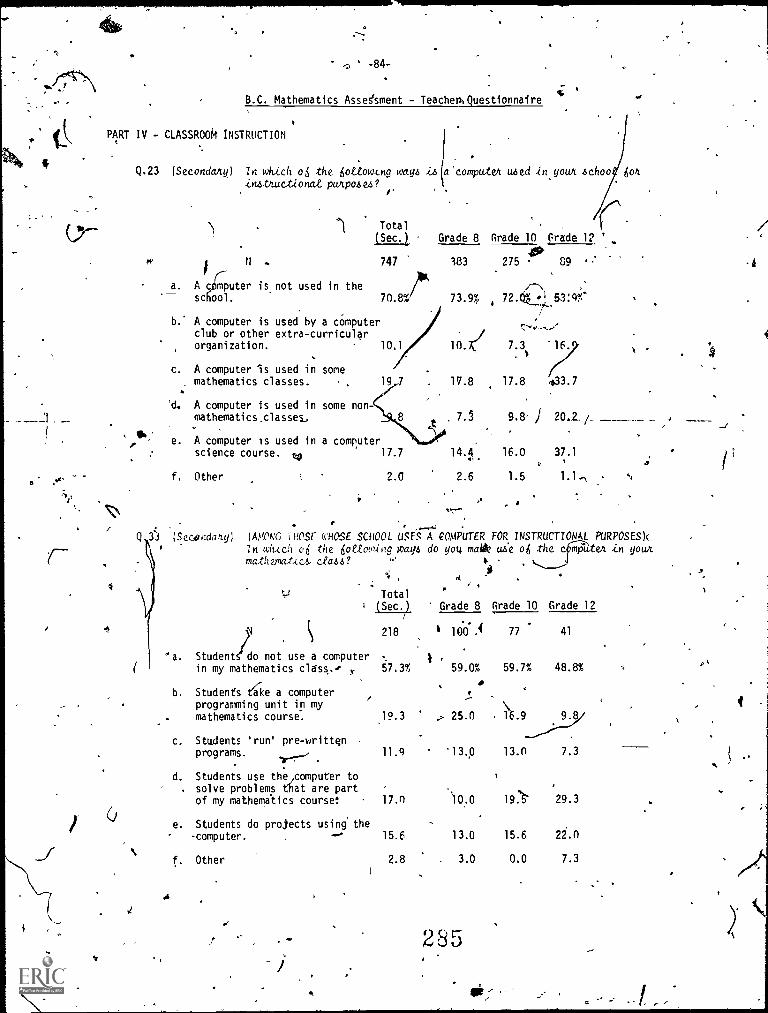
' -84-
B.C. Mathematics Assessment - TeachenklQuestionnaire
PART IV - CLASSROOM INSTRUCTION
Q.23 (Secondary) In which o6 the 6ottowing ways is a 'computeit used 4n your sehoot So
inzttuctionat purposed?, .
II .a. A c mputer
sc ool.
is_ not used in the
Total
(Seca Grade 8 Grade 10 Grade 1? '
747 183 275 - 89
70.8% 73.9% 72.1021 53:9%.
b.' A computer is used by a computerclub or other extra-curricularorganization. 10.1
c. A computer is used in sonemathematics classes.
A computer is used in some non-mathematics_classes,
197
e. A computer is used in a computerscience course. t,0 17.7
f. Other
10. 7.3 -16.
17.8 17.8 433.7
7.1 9.8' j 20.2 _
14.q 37.1o
2.0 2.6 1.5
er-
Q x33 (SecendaAy) (AMONG THOSE (CHOSE SCHOOL USES A COMPUTER FOR INSTRUCTIONAL PURPOSESIt
In whtch o6 the WINO-4)1g AMPS do yo4 maw cde o6 the c &UWE in yourmathematccs- daze t,
*a. Students do not use a computerin my mathematics class.- y
b. Students take a computerprogramming unit in mymathematics course.
,1
c. Students 'run' pre-writtenprograms.
"s-r-" .
d. Students use the,computer to. solve problems that are part
of my mathematics courser
e. Students do projects using the-computer.
f. Other
Total
(Sec.) Grade 8 Grade 10 Grade 12
218 77 41
57.3% 59.0% 59.7% 48.8%
19.3 25.0 9.8
11.9 '13.0 13.0 7.3)
'
17.0 )0.0 19.;'' 29.3
15.6 13.0 15.6 22.0
2.8 . 3.0 0.0 7.3
285
-4
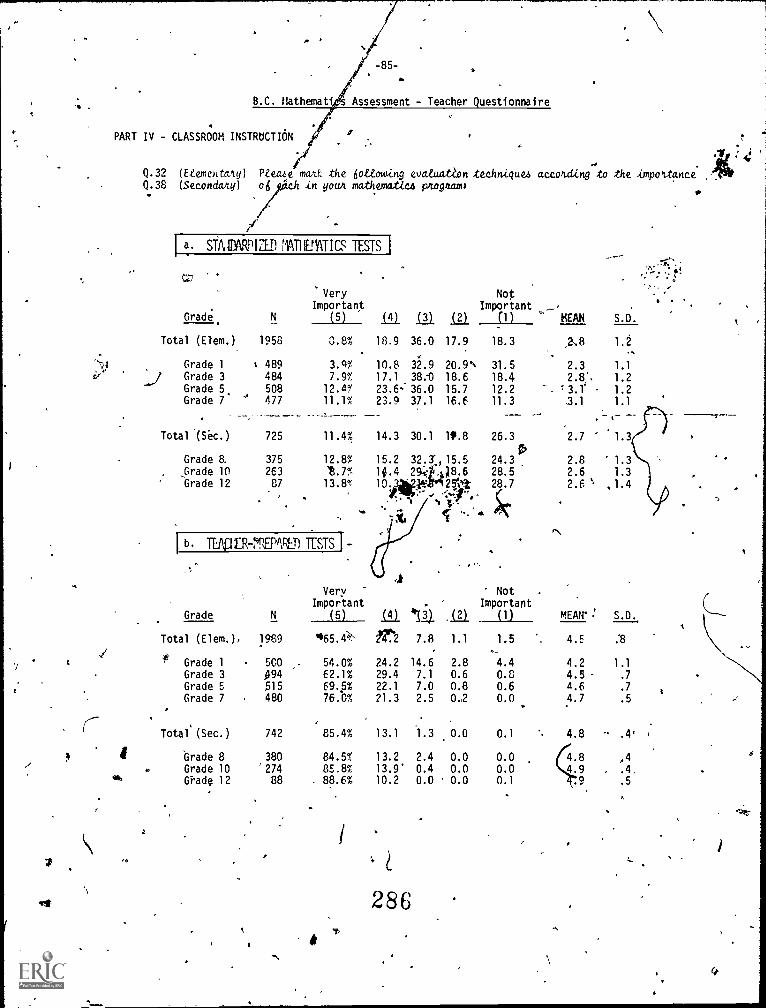
1
7
yip
-44
aY
-85-
B.C. Mathemati Assessment - Teacher Questionnaire
PART IV - CLASSROOM INSTRUCTION
I
I 0
iiQ.32 (EZemextaty) necat maAk the iotemoing am-foot:6n teehnique4 acconding to the impottanceQ.38 (Secondary) oti yich in yam mathematics fortogaams
ifa. STAIPARDIall MTIMITICS TESTS I
Grade.
Total (Elem.) 1958
Very NotImportant Important
N (5) (4) (3) (2) (1) MEAN
Grade 1 4 489LI Grade 3 484
Grade 5 508Grade 7 477
Total '(Sec.) 725
Grade 8.
Grade10
Grade 12
0.8% 18.9 36.0 17.9 18.3
3.4% 10.8 32.9 20.9% 31.57.9% 17.1 38:0 18.6 18.412.4% 23.6.: 36.0 15.7 12.211.1% 23.9 37.1 16.6 11.3
11.4% 14.3 30.1 111.8 26.3
375 12.8% 15.2 32.3;,15.5263 14.7% 14.4 294,08.6 28.587 13.8't 10.3,112.10".125:41 28.7
24.3
Grade
Total (Elem.),
Grade 1Grade 3Grade 5Grade 7
Total' (Sec.)
Grade 8Grade 10Gi..ade 12
VeryImportant
(5)
1969 *65.4 .-
2,.8 1.2
2.3 1.1
2.8% 1.2
1.2
3.1 1.1
2.7 1.3
2.8 1.3
2.6 1.3
2.6 .1.4
NotImportant
(4) 414 121 (1) MEAN': Si..
4!2 7.8 1.1 1.5 4.5 :8,_
500 54.0% 24.2 14.6 2.8 4.4 4.2 1.1
494 62.1% 29.4 7.1 0.6 0.8 4.5 .7
515 69.5% 22.1 7.0 0.8 0.6 4.6 .7
480 76.0% 21.3 2.5 0,2 0.0 4.7 .5
742 85.4% 13.1 1.3 0.0 0.1 4.8
380 84.5%'274 85.8%
88 . 88.6%
13.2 2.4 0.013.9' 0.4 0.010.2 0.0 0.0
I
286
0.00.00.1
4.9.9
0
.4.
,4
.4.
.5
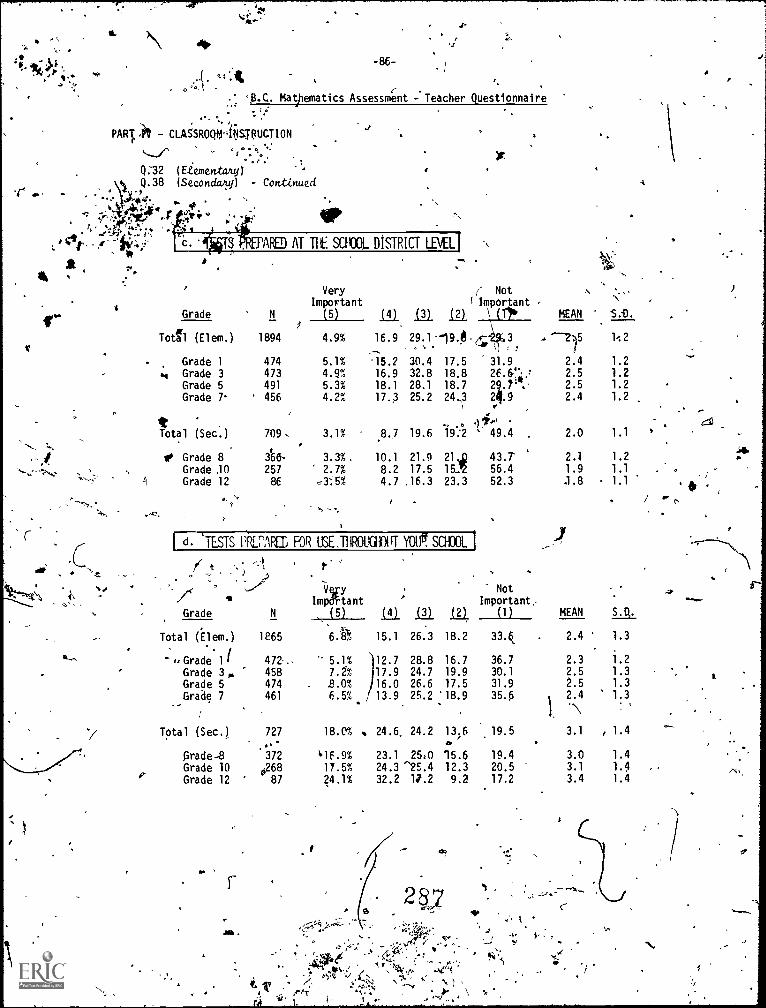
-r
*4
-86-
I
.p.c. Mathematics Assessment - Teacher Questionnaire
PART A - ELASSROQM6TBUCTION
....
Q:32 (EiementalujI,
\k. Q.38 (Secondary) - Continued
,:..I7,4.:e.
L ' Cei .^2: .;;'-' C .
J
ARED AT TIE SCHOOL DISTRICT LEVEL!
it"
VeryImportant
( Not('Important -
Grade N (5) (4) ill ial \
Totail (Elem.) 1894 4.9% 16.9 29.1 "19.A. 3
. -
Grade 1 474 5.1% .15.2 30.4 17.5 31.9
4 Grade 3 473 4.9% 16.9 32.8 18.8 26.6%:Grade 5 491 5.3% 18.1 28.1 18.7 29.7'.Grade 7 ' 456 4.2% 17.3 25.2 24,3 2q.9
1 V
.
1%.4Total (Sec.) 709, 3.1% 8.7 19.6 19.'2
-,i. e Grade 8 3166- 3.3% 10.1 21.9 21D 43.7'
Grade .10 257 2.7% 8.2 17.5 15J2 56.4
Grade 12 86 4.7 .16.3 23.3 52.3
I d. 'TESTS l'f/rAPII FOR USE.THROMillri YOlg SC! -DoL
Grade N
Total (Elem.) 1865
',Grade 1t 472Grade 3. 458Grade 5 474
Grade 7 461
Total (Sec.) 727
Grade -8 372
Grade 10 6268
Grade 12 ' 87
s.
MEAN S.O.
---95 1:2
2.4 1.2
2.5 1.22.5 1.2
2.4 1.2
2.0 1.1
2.1 1.2
1.9 1.1
.1.8 1.1
'Veiry
Impdf..tant
(5) 'Lli
A
ill 1_24
Not
Important,
(1) MEAN S.Q.
6.8 15.1 26.3 18.2 33.6. 2.4 1.3
5.1% 12.7 28.8 16.7 36.7 2.3 i.2
7.2t 17.9 24.7 19.9 30.1 2.5 1.3
B.0% 16.0 26.6 17.5 31.9 2.5 1.3
6.5% 13.9 25.2 '18.9 35.6 2.4 1.3
18.0% % 24.6, 24.2 13;6 19.5 3.1 , 1.4..
X16.9% 23.1 25.0 15.6 19.4 3.0 1.4
17.5% 24.3 -25.4 12.3 20.5 3.1 1.4
24.1% 32.2 147.2 9.2 17.2 3.4 1.4
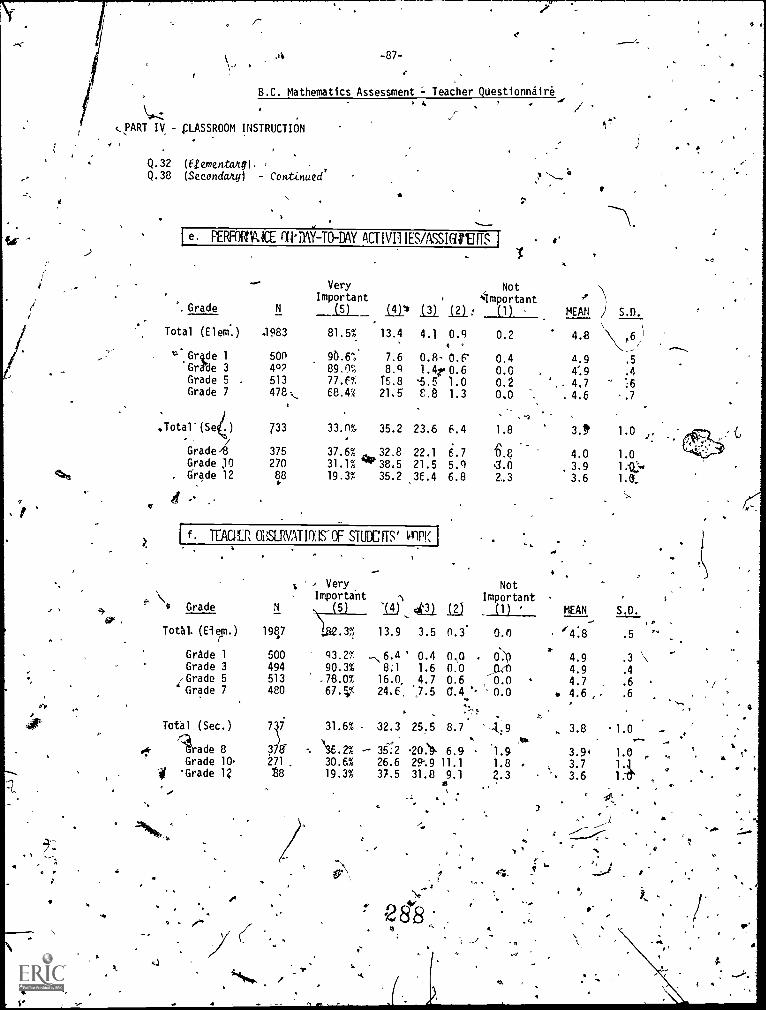
erp
1
tee
.1 1
-87-
B.C. Mathematics Assessment = Teacher Questionnaire
..~PARTIV - p.ASSROOM INSTRUCTION
Q.32 (6/ementaq).Q.38 (Seeondanyl Continued'
,
I e. PERFORMICE 01111AY-TO-DAY ACTIVII IES/ASSIU$131TS
1
.4
4
Very Not--
Important , 4important., Grade N (5) (4)" (3) 121f (1) MEAN 2 S.D.
ITotal (Elem.) 1983 81.5% 13.4 4.1 0.9 0.2 4.8 ,6/. .
...
e.'Gr4de 1 500 90.6%. 7.6 0.8- 0.P 0.4 4.9 .5GrAle 3 492 89.0% 8.9 1.4r0.6 0.0 4'.9 .4Grade 5 . 513 77.6% 15.8 .5.5 1.0 0.2 ,. 4,7 :6Grade 7 478-. 68.4% 21,5 8.8 1.3 0.0 . . 4.6 .7
. ..
.Total'(Se4) 733 33.0% 35.2 23.6 6.4 1.8 3., 1.0
.-1\
Grade4 375 37.6% .._32.8 22.1 6.7 fi. 4.0 1.0Grade )0 270 31.1% 'w38,5 21.5 5.9 4.0Grade 12 S8 19.3% 35.2 36.4 6.8 2,.3
3.9 1:1'4..
3.6 1.0..
f. TEAGER OaRVATIMS-OF STUDEITS1
'11 Grade
Total. (Elem.)
Very NotImportant ' Important
(5) 14) 4.11 12) (1) ' MEAN S.D.
197 182.3% 13.9 3.5 0.3. 0.0 '4:8 .5
Grade 1 500 93.29' -, 6.A ' 0.4 0,0 0:9 4.9 .3 \Grade 3 494 90.3% 8:1 1.6 0.0 GLA 4.9 .4Grade 5 513 .78.0% 16.0, 4.7 0.6 -0.0 . 4.7 .6
4 Grade 7 480 67.S;- 24.6. ',7.5 G.4 ". 0.0 4.6 , . .6
Z.
Total (Sec.)
rade 8Grade 10'Grade 12
o.
7i 31.6% . 32.3 25.5 8.7 s-.1,9 3.8 . 1.0. ..-
3i8. -. \36.2% - 35':2 -209- 6.9 1.9 3.94 1.0271 . 30.6% 26.6 29'.9 11.1 1.8 .. 3.7B 1.419.3% 37.5 31.8 9.1 2.3 3.6
.
.
J,
,1 ' ,.
4-1' l,) I. t ,. ..
'.* (
e 8 8 ,L
alb
or.
4
S
V
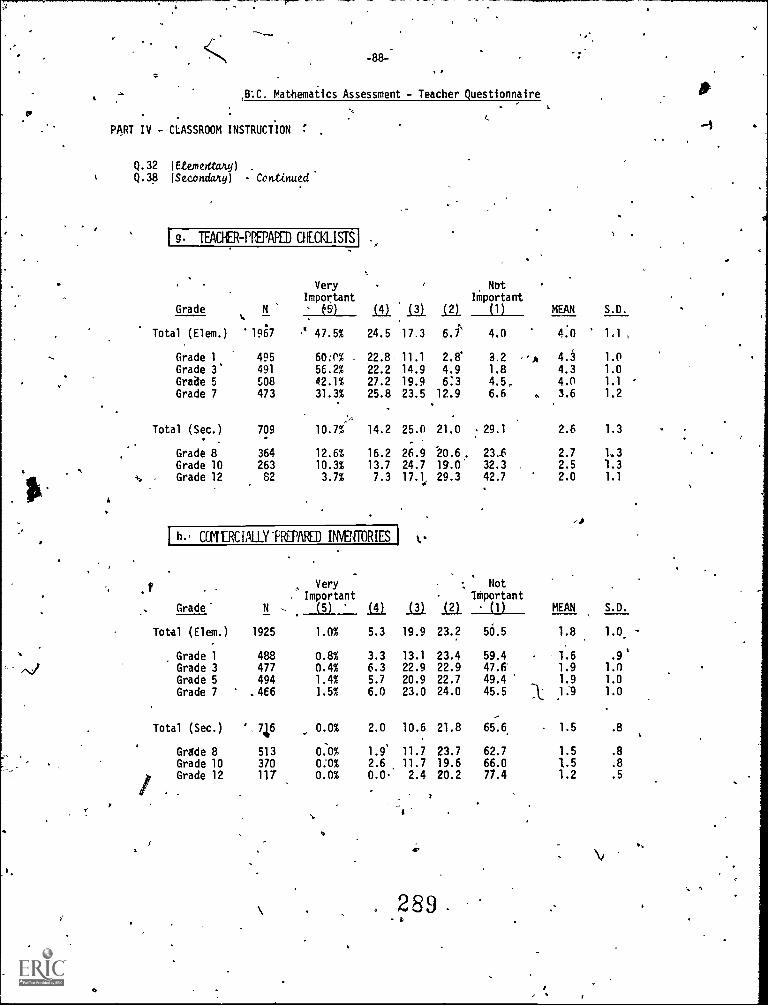
-88--
,W.C. Mathematics Assessment - Teacher Questionnaire
1..
PART IV - CLASSROOM INSTRUCTION .
Q.32 lEtemeatany) .
Q.38 (Secondaty) - Continued
1 g. TEACHER-PPEPAPED CHEMISTS'
Very'
ImportantNot
IMportantGrade N (1) Ili : ill L21 (1)
Total (Elem.) 1967 ,' 47.5% 24.5 17.3 6.i' 4.0
Grade 1 495 60:0% 22.8- 11.1 2.8' 3.2 ,,,Grade 3' 491 56.2% 22.2 14.9 4.9 1.8
Grade 5 508 42.1% 27.2 19.9 6:3 4.5,Grade 7 473 31.3% 25.8 23.5 12.9 6.6 .
:,.
Total (Sec.) 709 10.7% 14.2 25.0 21.0 : 29.1
Grade 8 364 12.6% 16.2 26.9 20.6. 21.6
Grade 10 263 10.3% 13.7 24.7 19.0' 32.3 .
-h. . Grade 12 82 3.7% 7.3 17 1i
29.3 42.7
1 h., afTERCIALLYTREPARED INVENTORIES%.
NotVery .
. .
Important -
,
ImportantGrade- N , (5) jai _DI IQ_ (1)
Total (Elem.)
Grade 1Grade 3Grade 5Grade 7
Total (Sec.)
Grade 8Grade 10
i Grade 12
dr
1925 1.0% 5.3 19.9
488 0.8% 3.3 13.1
477 0.4% 6.3 22.9
494 1.4% 5.7 20.9
.466 1.5% 6.0 23.0
'.746 0.0% 2.0 10.6
513 0.0% 1.9' 11.7370 0:0% 2.6 11.7117 0.0% 0.0 2.4
. ..
ti
23.2 50.5
23.4 59.422.9 47.622.7 49.4
24.0 45.5 1
21.8 65.6.
23.7 62.7
19.6 66.0
20.2 77.4
289 .
MEAN S.D.
4:0 1,1 ,
4.3 1.0
4.3 1.0
4.0 1.1
3.6 1.2
2.6 1.3
2.7 1.3
2.5 1.32.0 1.1
MEAN S.D.
1.8 1.0_
1.6 .9'
1.9 1.0
1.9 1.0
1.9 1.0
1.5 .8
1.5 .8
1.5 .8
1.2 .5
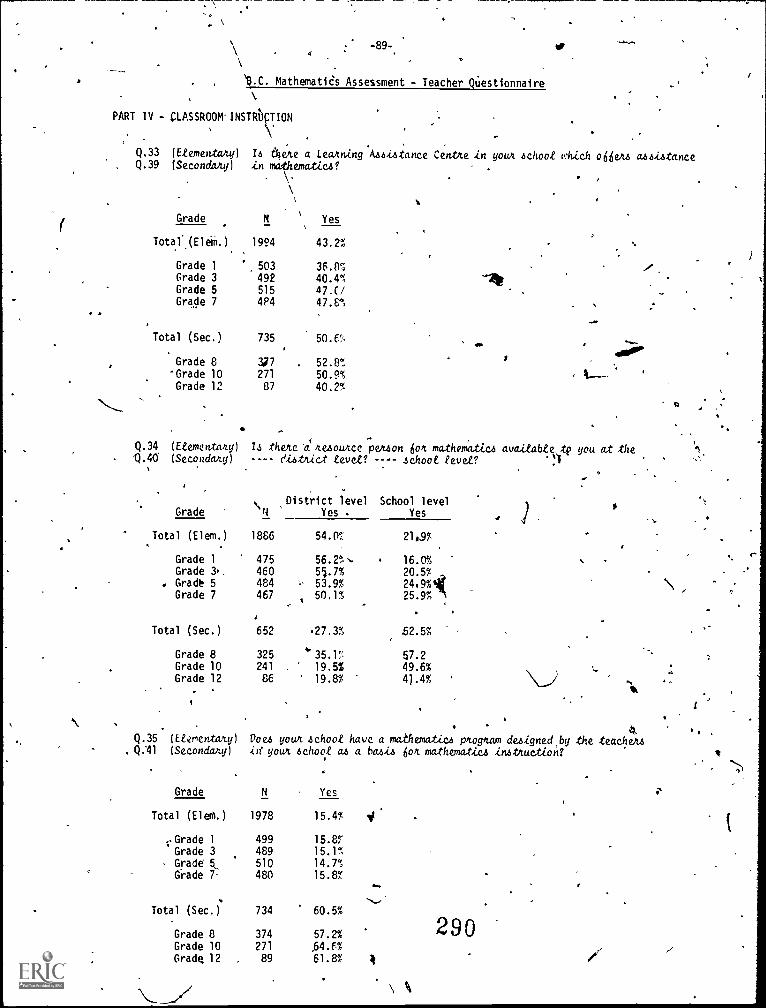
-89- rr4
Mathematics Assessment - Teacher Questionnaire
PART IV - LASSROOM.INSTRbION
Q.33 (Etementaty) Ia gene a Learning Usiatance Centre in your zchoot which o66eAz azeiatance, Q.39 (Secondaty) in mathematica?
\
Grade
1994
Yes
Total' (Elem.) 43.2%
Grade 1 503 36.8%Grade 3 492 40.4% -241Grade 5 515 47.C/Grade 7 4P4 47.C%
Total (Sec.) 73541.
Grade 8 377 . 52.8%a
'Grade 10 271 50.9%Grade 12 87 40.2%
Q.34 (Elementary) Is thete'c twit/me petzon bon mathemtica avaitabte,A you at theQ.40 (Secondany) eiztiact tevet? zchoot tevet? .!,
Grade0
1,1
1886
,
District levelYes .
School levelYes
Total (Elem.) 54.0% 2107,
Grade 1 475 56.2%., 16.0%Grade 3. 460 55.7% 20.5X
. Gra0 5 484 53.9% 24.9%1Grade 7 467 50.1% 25.9%
Total (Sec.) 652 .27.3% 52.5%
Grade 8 325 35.1% 57.2Grade 10 241 19.5% 49.6% 'on
Grade 12 86 19.8% 4).4%
Q.35 (Etementilly) Voez your zchoot have a mathematica ptogtam deeigned,by the teachemQ:41 (Secondary) iii your zchoot az a hazia bon mathematics inattuction?
Grade N Yes
Total (Eleth.) 1978 15.4X 4
.Grade 1 499 15.8%Grade 3 489 15.1%Grade 510 14.7%Grade 7- 480 15.8%
Total (Sec.) 734 60.5%
Grade 8 374 57.2%Grade 10 271 54.f%Grade 12 89 61.8% i
290/
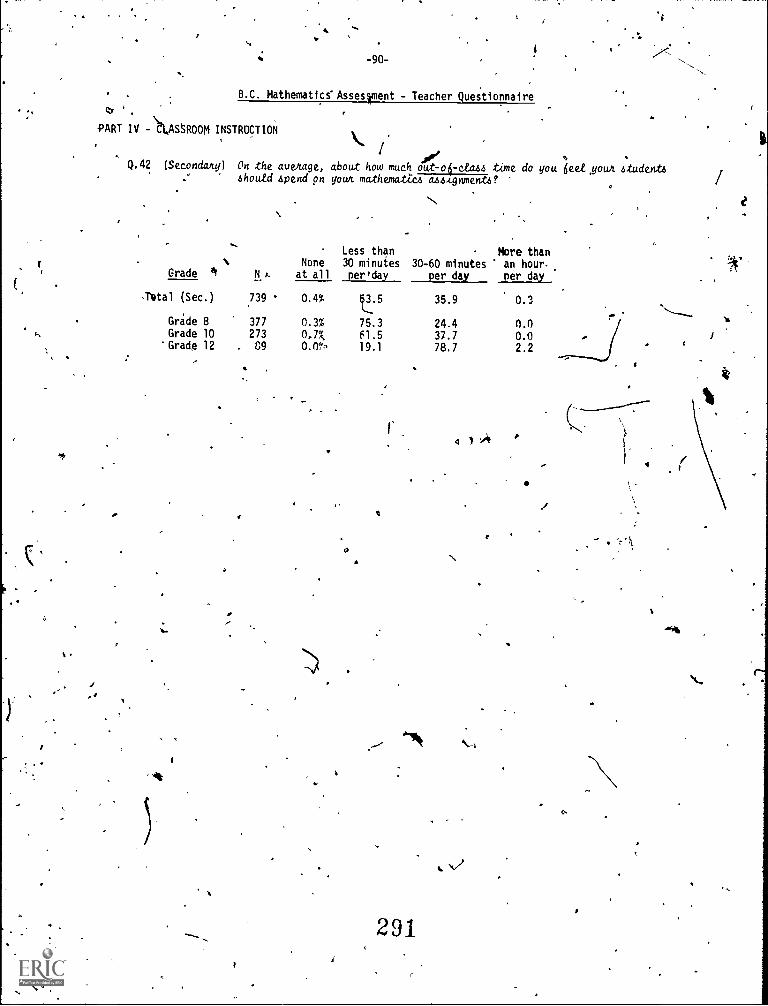
-90-
B.C. Mathematics" Assesrent - Teacher Questionnaire
.
PART IV ihAStROOM INSTRUCTION
oQ.42
/11.
.$0"(Secondany) On the average, about how much out-oi-ci.a.66 time do you beef ,your 6tudent6
.
zhowed oend on yom mathemat2C4 a4.64.gnmente
Grade
Less than More thanNone 30 minutes 30-60 minutes an hour.
N p. at all per1day per day per day
siQtal (Sec.) 739 ' 0.4% 63.5
Grade 8 377 0.3% 75.3F, Grade 10 273 0.7 61.5
'Grade 12 , C9 0.01'. 19.1
r
-
35.9 0.3
24.4 0.037.7 0.078.7 2.2
4 1 'A
r
291
Kt,
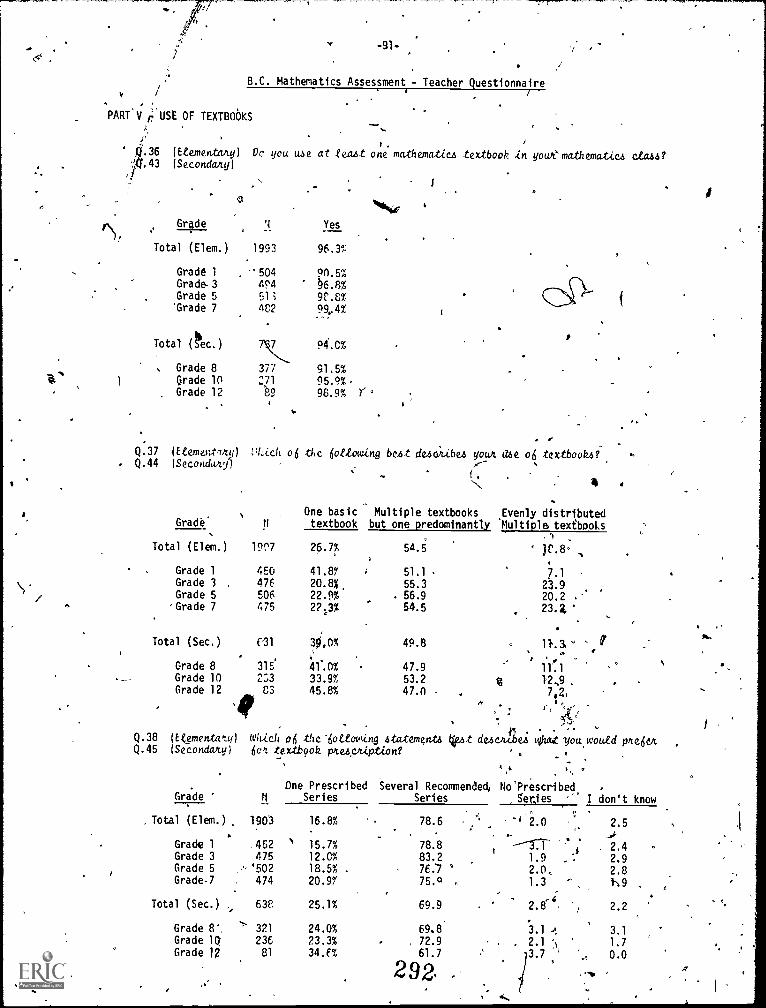
-91-
B.C. Mathematics Assessment - Teacher Questionnaire
PART'ii 6, USE OF TEXTBOOKS
#.36 (Etementaky) Do you use at leort one mathematics textbook in youemathematics claw?11%43 (Secondary)
.
o
Gride2.
,,Yes
Total (Elem.) .1993 96.3%
Grade 1 , -504 90.5%Grade-3 494 36.8%Grade 5 51; 9£.8%'Grade 7 4E2 99,4%
...
Total (Sec.)
Grade 8grade 10Grade 12
7
377
271
e9
94.0%
91.5%95.9%-98.9% Y'
p
Q.37 atement/Ay)Q.44 (Secondary)
a,
MLch o6 the hollowing but deaoicibe4 your d4e oh textbook4?
One basic Multiple textbooks Evenly distributedGrade' P textbook but one predominantly Multiple textbooks
..1
Total (Elem.) 194.'7 26.7% 54.5. jr.8,,
Grade 1 4E0 41.87 51.1 7.1Grade 3 , 476 20.8%. 55.3 23.9Grade 5 506 22.9% 56.9 20.2 ..
220% 54.5'Grade 7 475 23.2,
Total (Sec.) 01 30,0% 49.8 11.3 - .,
Grade 8 315' 011.0% 47.9 11.p, 1
Grade 10 233 33.9% 53.2 4 12,9 ,
Grade 12 E3 45.8% 47.0 - . 7,2,
'41/1
A
.;`
'Q.38 (Ekementatq) Which oh the-hollowing statements (*et deacnkPbea (Oat you would puhaQ.45 (Secondary) hot ttextbook peaptiption?
...' ,
'...
One Prescribed Several Recommended, No'PrescribedGrade ' q Series Series genies I don't know
Total (Elem.) 1903 16.8% 78.6
Grade 1 452 A15.7%
.
78.8Grade 3 475 12.0% 83.2Grade 5 ,'502 18.5% 76.7 °
Grade-7 474 20.97 75.0
Total (Sec.) 638 25.1% 69.9
Grade 8 s'-' 321 24.0% 69.8Grade 10 236 23.3% , 72.9Grade 1? 81 34.f% 61.7
292.
'4 2.0 2.5
%.; . 2.41.9 .. 2.92.0, 2.81.3 h9
2.8 2.2
3.1 3.1
. 2.1 ' 1.7
' 0.0
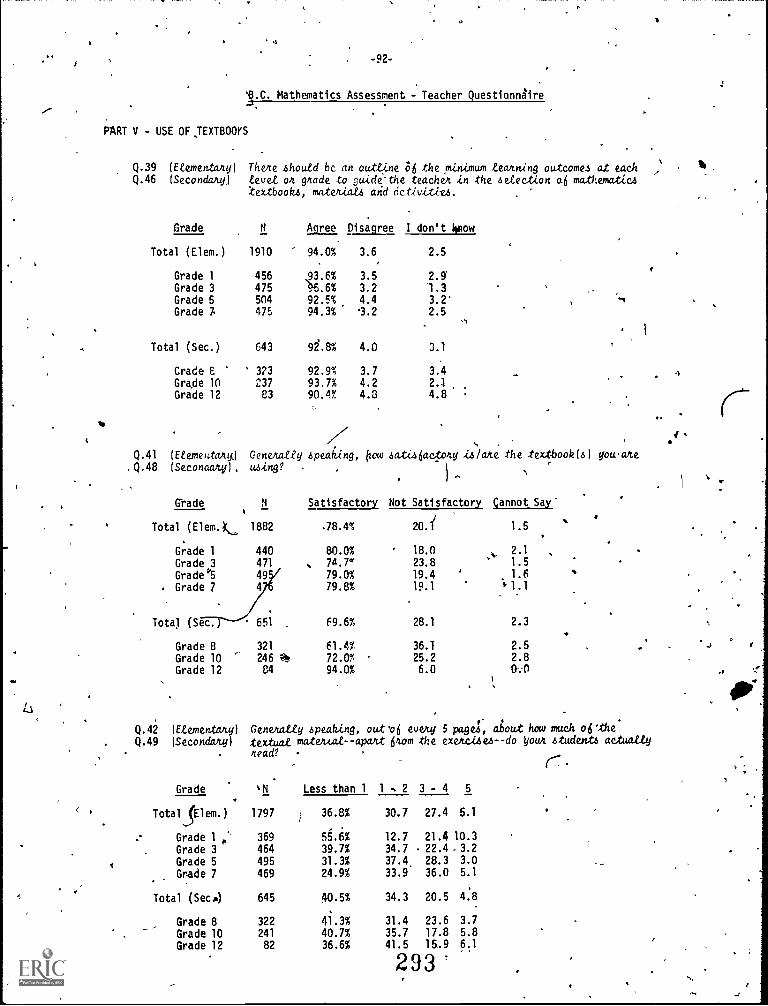
' 4
-92-
'IX. Mathematics Assessment - Teacher Questionnaire
PART V - USE OF,TEXTBOOYS
Q.39 (Etementaky) Thum shoutd be an outtine 86 the minimum tealminy outcomes at eachQ.46 (Secondary,) tevet on gad to guide-the teacher in the setection o.6 mathematica
- textbooks, mateniatz and activitiv.
Grade N Agree Disagree I don't hmow
Total (Elem.) 1910 94.0% 3.6 2.5
Grade 1 456 93.6% 3.5 2.9Grade 3 475 5.6% 3.2 1.3Grade 5 504 92.5% 4.4 3.2'
Grade 7 475 94.3% .2 2.5...
Total (Sec.) 643 0.8% 4.0 3.1
Grade E " 3?3 92.9% 3.7 3.4 4Grkde 10 237 93.7% 4.2 2.1
Grade 12 83 90.4% 4.3 4.8
Q.41 fEtementav) Gene/tatty speaking, pow satizSacSoky Waite the textbooklal youate,Q.48 ( Secondary), using? .
Grade N Satisfactory Not Satisfactory Cannot Say'
Total (Elem.L
t
1882 .78.40 20.1 1.5
Grade 1 440 80.0% 18.0 2.1 ,
Grade 3 471 , 74.70 23.8 ' 1.5
Gradet 49 79.0% 19.4 1.6
. Grade 7 4 79.8% 19.1 + 1.1
Total (Sec. 651 , 69.6% 28.1 2.3
Grade 8 321 61.4% 36.1 2.5
Grade 10 246 72.0% 25.2 2.8
Grade 12 84 94.0% 6.0 0.0
Q.42 (Etementaty) Gene/catty speaking, out every 5 pageS, about how much otheQ.49 (Secondary) textume matetkat--apart Oom the exetei6e4--do your atudente actuatty
It.ead? r.Grade N Less than 1 1 -. 2 3- 4 5
Totalem.) 1797 36.8% 30.7 27.4 5.1
Grade 1 , 369 55.6% 12.7 21.4 10.3
Grade 3 464 39.7% 34.7 . 22.4 . 3.2
Grade 5 495 31.3% 37.4. 28.3 3.0
. -Grade 7 469 24.9% 33.9 36.0 5.1
Total (Sec..) 645 40.5% 34.3 20.5 4.8
Grade 8 322 41.3% 31.4 23.6 3.7
. Grade 10 241 40.7% 35.7 17.8 5.8
Grade 12 82 36.6% 41.5 15.9 6.1
293
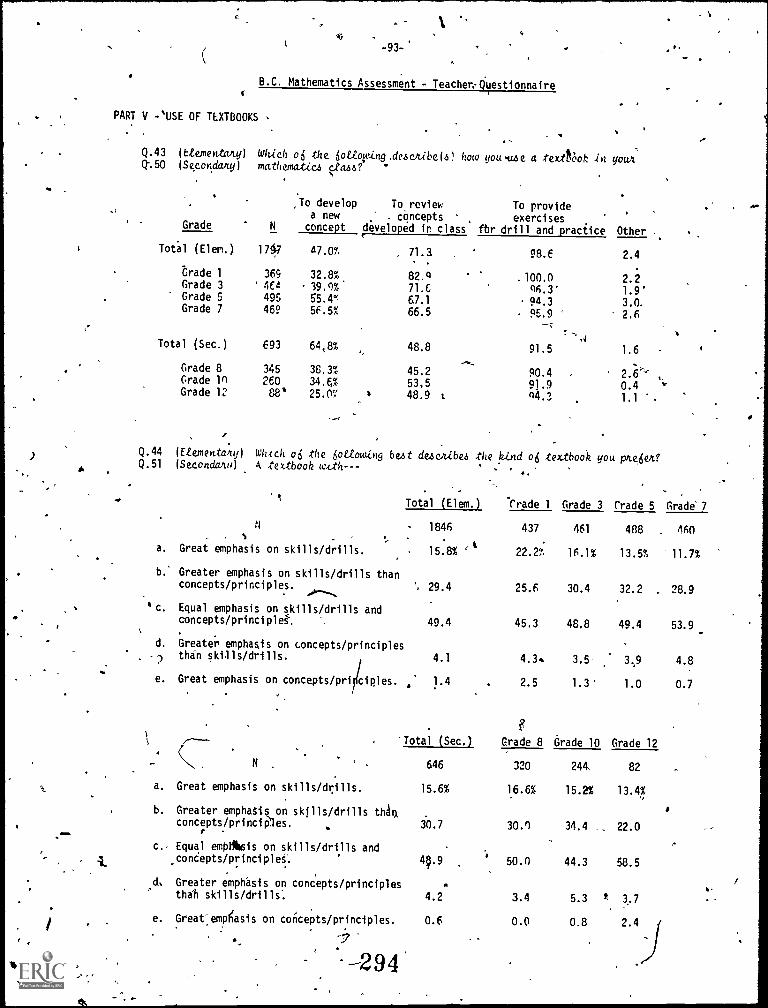
I
(
f
PART V -.'USE OF TEXTBOOKS
-93-
B.C. Mathematics Assessment - Teacher.AJestionnaire
Q.43 Iktementany) Wick op the iottqioing.dezutibe(6) how you.use a textt6ok In yourQ.50 (Secondary) mathematics a.6.6:7
Grade
To developa newconcept developed
To review
conceptsit class
To provide
exercisesfbr drill and practice Other
Total (Elem.) 1719 47.0% 71.a 98.6 2.4
trade 1 369 32.8% 82.9 .100.0 2.2Grade 3 4E4 39.9%* 71.0 96.3' 1.9'Grade 5 495 55.4% 67.1 94.3 3.0.Grade 7 469 55.5% 66.5 95.9 2.6
Total (Sec.) 693 64,8% 48.8 91.5 1.6
Grade 8 345 38.3% 45.2 90.4 226".Grade 10 260 34.6% 53,5 9].9 0.4Grade 12 88' 25.0'1 48.9 t 94.3 1.1
Q.44 (Etementalty) Much oi the 6ottowing best deseltibes .the kind ob textbook you pnetiert?Q.51 (Secoada/tu) A textbook cukth---a.
Total (Elem.) -Grade 1 Grade 3 Grade 5 Grade' 7
1846 437 461 488 . 460
a. Great emphasis on skills/drills. 15.8%
b.' Greater emphasi s on skills/drills thanconcepts/princi ples. 29.4
c Equal emphasis on skills/drills andconcepts/princi ples. 49.4
d. Greater emphasi s on concepts/principlesthan ski.11s/dri lls. 4.1
22.2"
25.6
45.3
4.3.
16.1%
30.4
48.8
3.5
13.5%
32.2 ,
49.4
3,9
11.7%
28.9
53.9
4.8
e. Great emphasis on concepts/pri ciples. . 1.4 2.5 1.3' 1.0 0.7
?'Total (Sec.) Grade 8 Grade 10 Grade 12
OM%
N ,
a. Great emphasis on skills/drills.
b. Greater emphatik on skills/drills third
concepts/principles.r -
c.. Equal empAmis on skills/drills andconeepts/principleS.
d, Greater emphasis on concepts/principlesthall skills/drills:
e. Great'emOasis on concepts /principles..
.
646
15.6%
30.7
4§.9
4.2
0.6
320
16.6%
30.9
50.0
3.4
0.0
244,
15.2%
34.4
44.3
5.3
0.8
82
13.4%
22.0
58.5
* 1.7
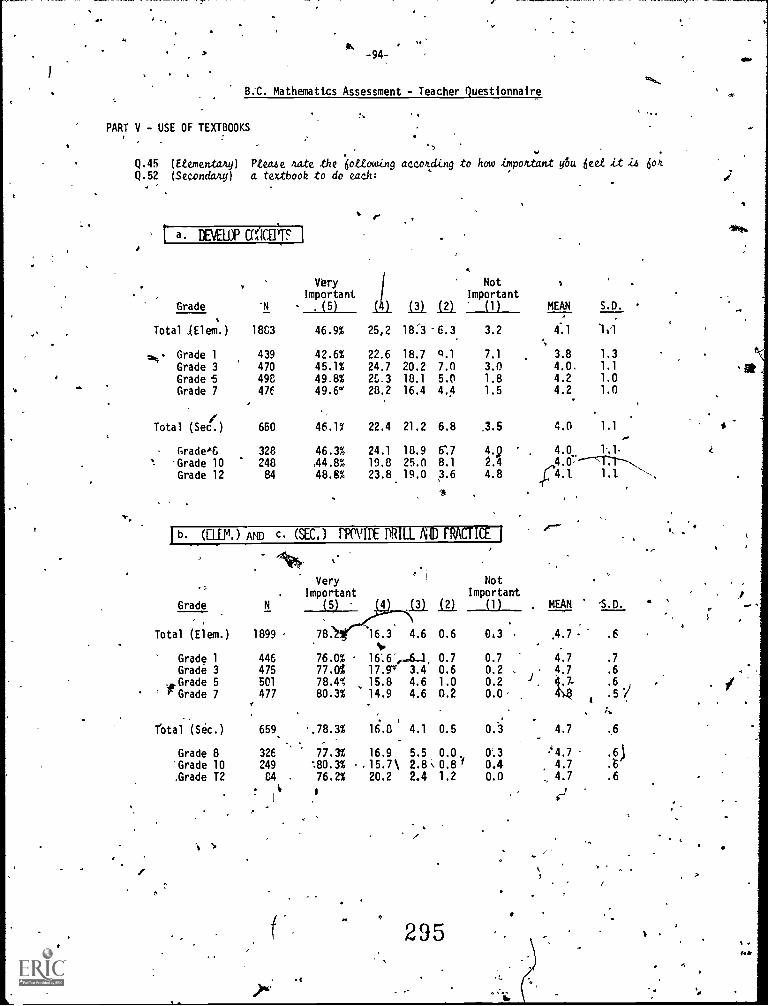
B.C. Mathematics Assessment - Teacher Questionnaire
PART V - USE OF TEXTBOOKS
Q.45 (Etementany) Ptea4e nate the 6ottowing acco4ling to how impottant ybu beet Lt i4Q.52 (Secondary) a textbook to do each:
a DBIELOP ar.ICETTF 1
ziq
Grade U
Total (Elem.) 1863
Grade 1 439
Grade 3 470
Grade 5 49C
Grade 7 47E.
Total (Sec.) 660
GradeAC 328
's. 'Grade 10 248
Grade 12 84
IImportant ImportantVbry Not 1
. (5) ill 1_21 (1)
46.9% 25,2 18:3 6.3 3.2
42.6% 22.6 18.7 0.1 7.1
45.1% 24.7 20.2 7.0 3.0
49.8% 25.3 18.1 5.0 1.8
49.6w 28.2 16.4 4.4 1.5
MEAN S.D.
4.1 10'
3.8 1.3
4.0. 1.1
4.2 1.0
4.2 1.0
46.13' 22.4 21.2 6.8 .3.5 4.0 1.1,...
46.3% 24.1 18.9 6.7 4.1? ' . 4.0 Ll.A4.8% 19.8 25.0 8.1 2.4 4.07 ---\--r-r-,,
48.8% 23.8 19.0 3.6 4.8 .r4.1 1.1 1.----.
jb.JELLM.) AND c. (SEC.) PPOVIDE DRILL AAD PRACTICE I
VeryImportant
Grade N (5) 131_(_21
Total (Elem.) 1899 78. 16.3 4.6 0.6.
N.
Grade 1 446 76.0% 16:6,--6.1, 0.7
Grade 3 475 77.04 17.9* 3.4 0.6
Grade 5 501 78.4% 15.8 4.6 1.0' F Grade 7 477 80.3% 14.9 4.6 0.2
..
rotal (Sec.) 659 .78.3% 16.8 1 4.1 0.5-
Grade 8 326 77.3% 16.9 5.5 0.0.'Grade 10 249 :80.3% ,15.7\ 2.8. 0.8/.Grade T2 C4 . 76.2% 20.2 2.4 1.2
. 41
I
295
NotImportant
(1) MEAN 'S.D.e
0,3 ', ,4.7 .6
0.7 4.7 .7
0.2 . 4.7 .6
0.2 14.7- . 6
0.0-1
.5 Y
.
0.3 4.7 .6
0°.3 .'4.7 .6)
0.4 4.7 .t
0.0 4.7 .6
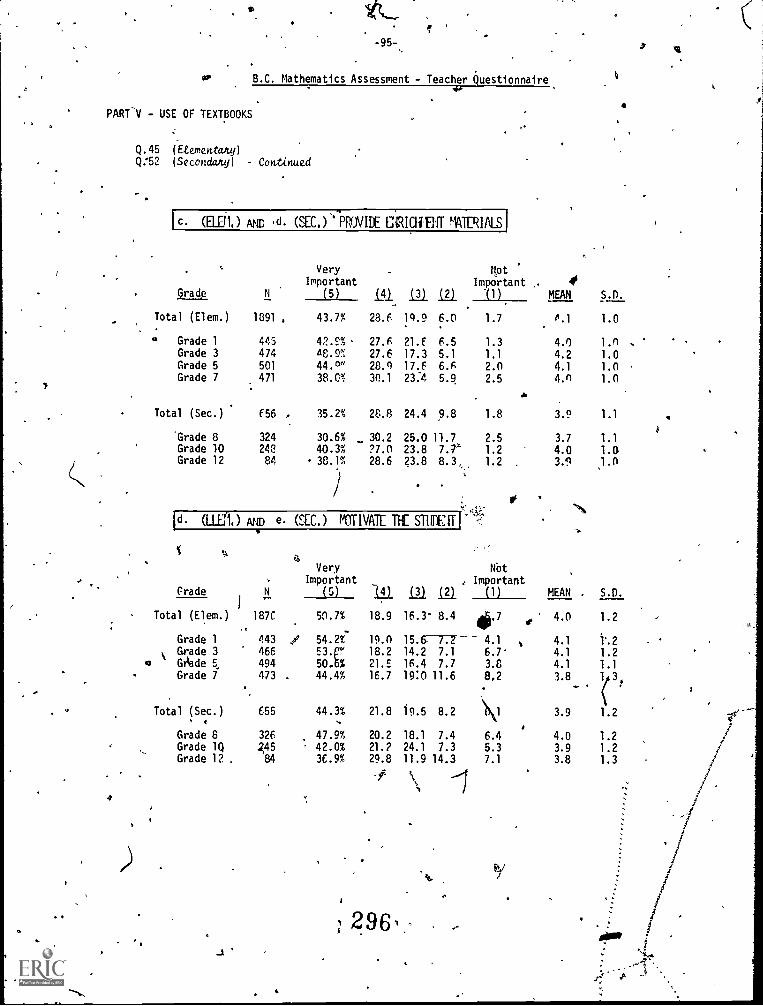
-95-
0, B.C. Mathematics Assessment - Teacher Questionnaire
PART'V - USE OF TEXTBOOKS
Q.45 (ftementaky)Q:52 (Secondary) Continued
11.0
I c. (ELUL ) AND ,d (SEC.) PROVIDE [3:1RIC11.11.1T 1VERIALS
VeryImportant
!tot
Important , . 4Oracle N (5) Ea La 121 -(1) MEAN S.D.
Total (Elem.) 1391 , 43.7% 28.6 10.9 6.0 1.7 0.1 1.0
Grade 1 445 42.9% 27.6 21.E 6.5 1.3 4.0 1.nGrade 3 474 A8.9%, 27.6 17.3 5.1 1.1 4.2 1.0Grade 5 501 44.0" 28.) 17.6 6.6 2.0 4.1 1.0Grade 7 471 38.C% 30.1 23:4 5.9, 2.5 4n 1.0
Total (Sec.) E56 , 35.2% 28.8 24.4 9.8 1.8 3.9 1.1
'Grade 8 324 30.6% 30.2 25.0 11.7 2.5 3.7 1.1Grade 10 242 40.3% ?7.0 23.8 7.e 1.2 4.0 1.0Grade 12 84 38.1% 28.6 23.8 8.3, 1.2 3.9 1 . n
Id. (LLEn.) AND e (SEW MOTIVATE THE STHUTI
Grade
Total (Elem.
Grade 1Grade 3Griade 5
Grade i
Very NotImportant , Important
N (5) ig. Ili igi (1) MEAN . S.D.
187C 50.7%
443 / 54.2%466 E3.p"494 50-6%473 44.4%
Total (Sec.) 655 44.3%t
Grade 8 326 47.9%Grade 1Q 2:45 42.0%Grade 12 . 84 36.9%
18.9 16.3- 8.4 4.7 e 4.0 1.2
19.0 15.6- 7. 4.1 ,, 4.1
18.2 14.2 7.1 6.7 4.1 1.221.5 16.4 7.7 3.8 4.1 1.116.7 19:0 11.6 8.2 3.8
I(21.8 19.5 8.2 /,1 3.9 1.2
20.2 18.1 7.4 6.4 4.0 1.221.? 24.1 7.3 5.3 3.9 1.229.8 11.9 14.3 7.1 3.8 1.3
296
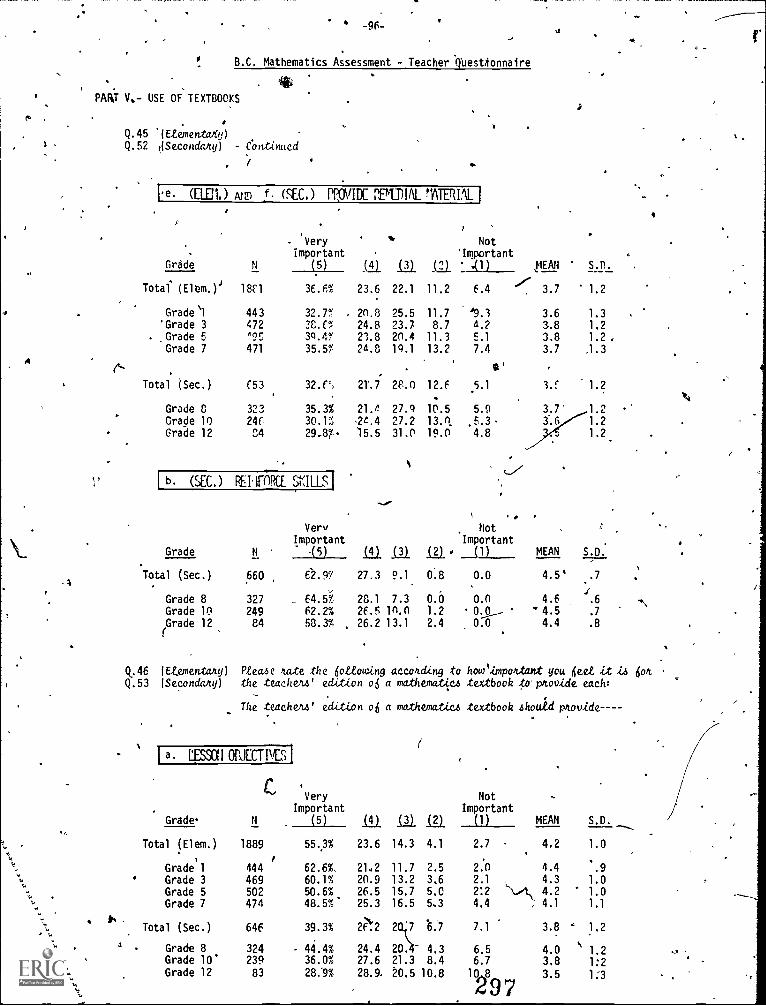
A
-96-
B.C. Mathematics Assessment - Teacher 'Questionnaire
PART V.- USE OF TEXTBOOKS
4
Q.45 .(EtementaKyiQ.52 4Secondaty) - Continued
,
'Very
importantGrade N (5)
Total (Elem.)' 18'1 36.6%
Grade `1 443 32.7%'Grade 3 472 38.0,Grade 5 .26 39.4%
Grade 7 471 35.5%
b. (SEC.) REIAIRE St ILLS 1
Ie (EL 1,) (SEC.) PROVIDE PENDIAL rATERIAL
Grade 8 323 35.3% 21.4 27.9 10.5 5.0Grade 10 246 30.1% -2t.4 27.2 13.(1 .5.3Grade 12 04 29.874 '15.5 31.0 19.0 4.8
Not'Important
ili (11 41)
23.6 22.1 11.2 E.4
20.8 25.5 11.7 '9.3
24.8 23.7 8.7 4.2
21.8 20.4 11.3 5.1
24.8 19.1 13.2 7.4
eL 121
Total (Sec.) C53 32.6°, 21.7 28.0 12.6 5.1
1 .,
Very MotImportant Important
Grade N 5) (4) (3) .(.21 ___(1)......_
Total (Sec.) 660 62.97 27.3 9.1 0.8 0.0
Grade 8 327 _ E4.5'7. 28.1 7.3 0.0 0.0Grade 10 249 62.2% 2E.5 MO 1.2 0..gGrade 12 84 58.3% 26.2 13.1 2.4 0.0
r
MEAN S.D.
3.7 1.2
3.6 1.33.8 1.2
3.8 1.2 ,
3.7 .1.3
3.0 1.2
1.2
1.2
1.2.
.
MEAN S.D.
4.5' .7
4.6 '.6
" 4.5 .7
4.4 .8
01.46 lEtgmentany) Pteahe tate the Ottowing accouting to holotimpottant you lied itQ.53 (Secondary) the teacheW edition o6 a mathemat4c4 textbook to. ptooide each:
The teachenh' edition os a mathematic...5 textbook 4houid
1 a Mai OBJECTIVES
C
Grade.
Total (Elem.) 1889
,
rade 1 444
Grade 3 469
Grade 7 474Grade 5 502
. fr,
Total (Sec.) 646
Grade 8 3244
Grade 10' 239
Grade 12 83
VeryImportant
(5)
NotImportant
In (1) MEAN S.D.
55.3% 23.6 14.3 4.1 2.7 4.2 1.0,
G 62.6%. 21.2 11.7 2.5 2.,0 4.4 .9
60.1% 20.9 13.2 3.6 2.1 4.3 1.0
4.1 1.148.57.' 25.3 16.5 5.3 4.4 \-.1.,1
50.6% 26.5 15.7 5.0 2:2 4.2 1.0
39.3% 2? .2 6:7 7.1 3.8 ' 1.2
- 44.4% 24.4 20. 4.3 6.5 4.0 1.236.0% 27.6 21.3 8.4 6.7 3.8 1:228.'9% 28.9, 20.5 10.8 3.5 1:3
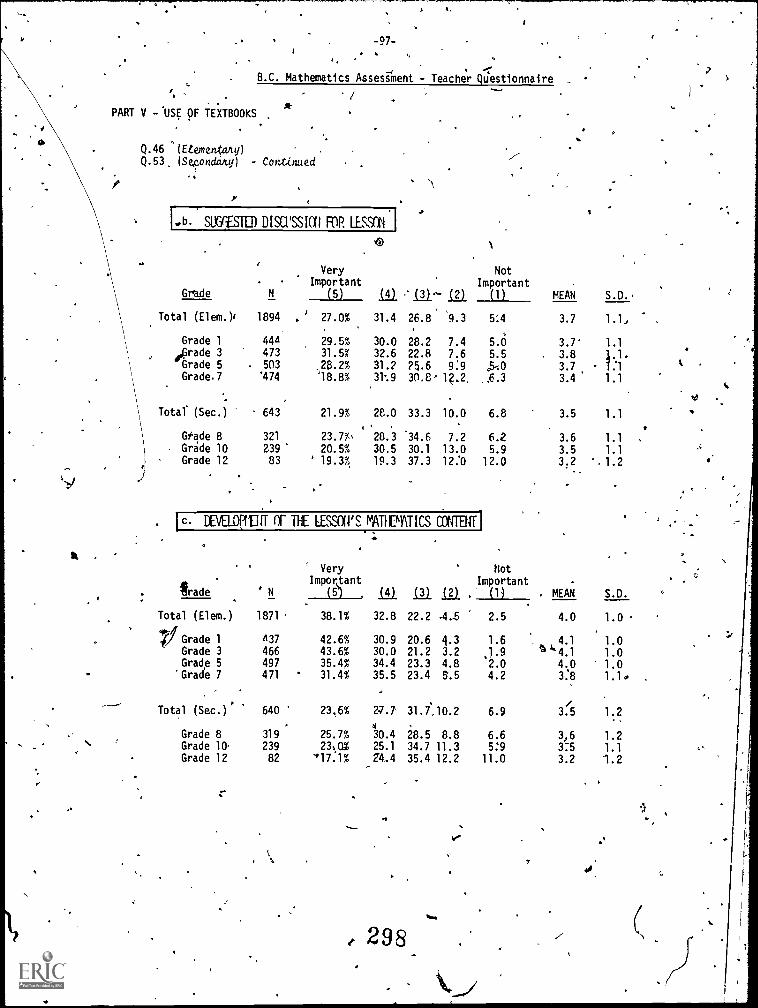
o.
-97-
B.C. Mathematics Assessment - Teacher Questionnairesr
/PART V -.USE OF TEXTBOOKS
Q.46 '(Etementany)Q.53, (Secondary) - Contiatued
SLIGrf_STO DISCUSSION FOR LESSON.
1
Grade N
VeryImportant
(5) La in
NotImportant
(1) MEAN
Total (Elem.) 1894 ' 27.0%
.(2).'.
31.4 26.8 '9.3 5:4 3.7
Grade 1 444 29.5% 30.0 28.2 7.4 5.0 3.7'trade 3 473 31.5% 32.6 22.8 7.6 5.5 3.8' Grade5 . 503 28.2% 31.2 75.6 9:9 c5:0 3.7Grade.7 '474 18.8% 31%9 30.8- 12.2. ,6.3 3.4
Total (Sec.) 643 21.9% 28.0 33.3 10.0 6.8 3.5
. .
Grade 8 321 23.7%, 28.3 '34.6 7.2 6.2 3.6Grade 10 239 20.5% 30.5 30.1 13.0 5.9 3.5Grade 12 83 ' 19.3% 19.3 37.3 12:0 12.0 3.2 ',
I c. DEVEL0(11311- Of THE LESSON'S MATIPATICS CRITElfri
lk
. tirade
'
' N
e VeryImportant
(5) lila
Total (Elem.) 1871 38.1% 32.8
le Grade 1 431 42.6% 30.9Grade 3 466 43.6% 30.0Grade 5 497 35.4% 34.4
'Grade 7 471 31.4% 35.5
Total (Sec.) 640 23.6% 2W.7
Grade 8 319 25.7% 30.4Grade 10 239 23.0% 25.1
Grade 12 82 -97.1% 14.4
NotImportant
in In . (1) . MEAN S.D.
22.2 .4..5
20.6 4.321.2 3.223.3 4.823.4 6.5
31.7,10.2
28.5 8.834.7 11.335.4 12.2
< 298
kr°
2.5 4.0 1.0
1.6 4.1 1.0.1.9 l''4.1 1.02.0 4.0 1.04.2 3:8 1.1w
6.9 53./ 1.2
6.6 3,6 1.25:9 3:5 1.111.0 3.2 1.2
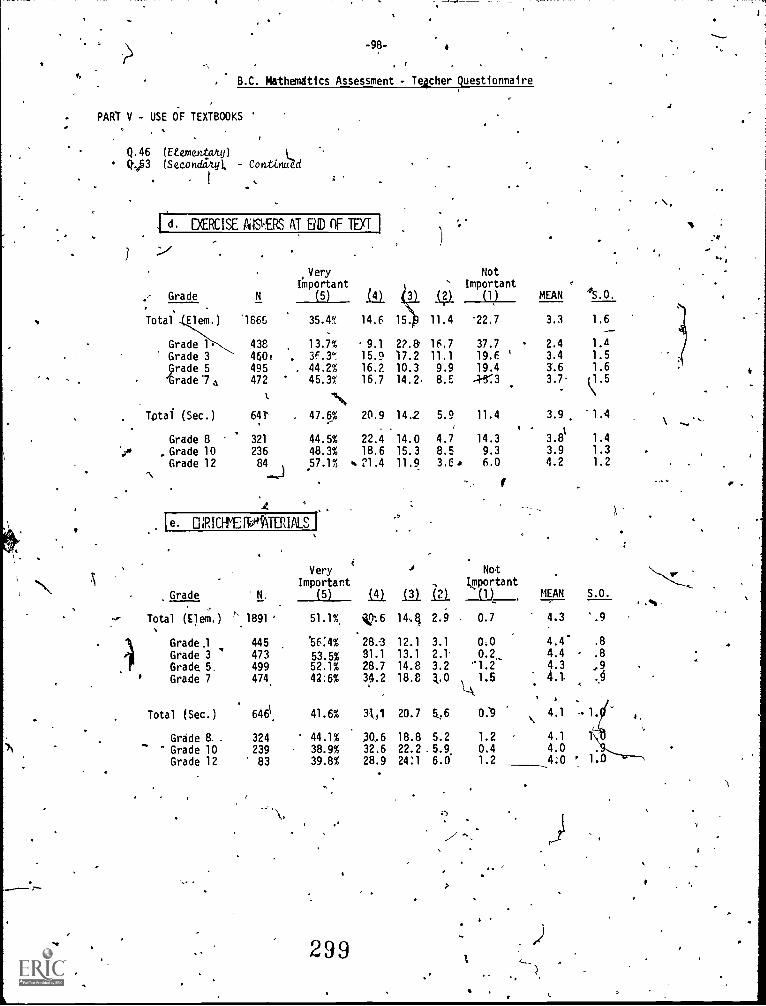
le. ENRICNITITATERIALS 1
-98- 4
B.C. Mathematics Assessment - Teacher Questionnaire
PART V - USE OF TEXTBOOKS '
Q.46 (Etementalty)
Q.453 (SecondatyL Continued
!
rc-1- EXERCISE AilSIERS AT MD (IF TEXT 1
.- Grade N
,VeryImportant
(5) ill
Total '186S 35.4% 14.6
Grade 1- 438 13.7% 9.1
Grade 3 4E0f 3F.3% 15.9
grade 5 495 44.2% 16.2
13rade7 4 472 45.3% 16.7
Total (Sec.) 64T 47.6% 20.9
Grade 8 321 44.5% 22.4..e, , Grade 10 236 48.3% 18.6
Grade 12 84 , 57.1% ... 21.4N......-1
Grade N,
VeryImportant
(5) ka
Total (Elem.) ' 1891 ' 51.1% 40:6
Grade.1 445 '56:4% 28.1
Grade 3 ' 473 53.5% 81.1
Grade 5. 499 52.1% 28.7
Grade 7 474. 42:6% 34.2
Total (Sec.) 646 41.6% 31,1
Grade 8, . 324 44.1% 30,6
Grade 10 239 38.9% 32.6
Grade 12 83 39.8% 28.9
299
4
3 (2)
NotImportant
(1) MEAN 45.0.ti
15 11.4 '22.7 3.3 1.6
22.8' 16.7 37.7 2.4 1.4
17.2 11.1 19.E 3.4 1.5
10.314.2.
9.98.E
19.4 3.63.7
1.6
Q.5
14.2 5.9 11.4 3.9 "1.4
14.0 4.7 14.3 3.81 1.4
15.3 8.5 9.3 3.9 1.3
11.9 3.6, 6.0 4.2 1.2
i Not
Important
ill 12114,q 2.9
12.1 3.1
13.1 2.1.
14.8 3.2
18.8 3..0
20.7 5,6
18.8 5.222.2 5.9.
24:1 6.0
(1) MEAN
0.7 4.3
0.0 4.4'0.2 4.4
'1.2 4.3
1.5 4.1.
0:9 4.1 -
1.2 4.1
0.4 4.01.2 4:0 '
1
I'
1.0
, . .
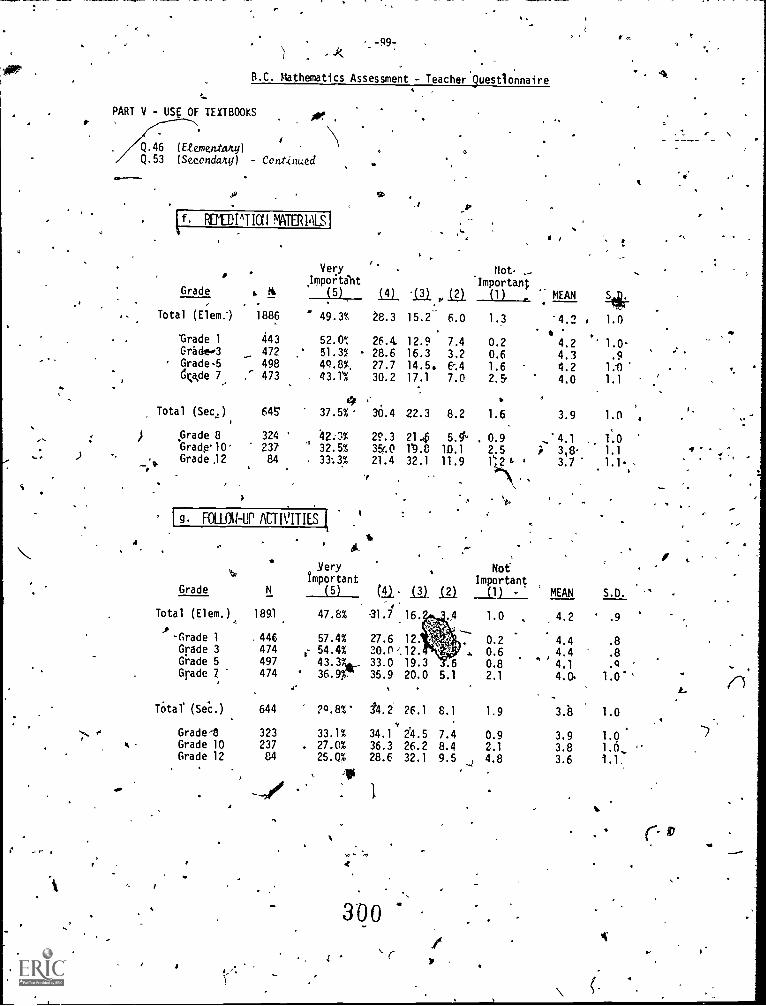
w.
B.C. Mathematics Assessment - Teacher 9uestlonnaire,
PART V - USE OF TEXTBOOKS
Q.46 (Etementam)Q.53 (Secondary) - Continued
I
st
(f RUEDIATIC(1 W+TERIALS I
Grade 6 ti
.
VeryImpor:tilit
(5) (4)
Total (Elem:) 1886 49.3% 28.3
'Grade 1 443 52.0', 26.4Grade -3 472 51.3% 28.6Grade-5ka,de 7
498,' 473
49.8%,
43.T%27.7
30.2
Total (Sec,) 645 37.5% 30.4
f ,Grade 324 42:"..1% 29.3Grade10. 237 32.5% 350Grade 32 84 33:3% 21.4
[g FOLLOW-UP ACTIVITIES t
O
Grade
`t
Total (Elem.),
-Grade 1Grade 3Grade 5Grade 7
N
1891
.446474497474
YeryImportant
(5)
Not. -Important
ill A. (1) MEAN
15.2- 6.0 1.3 "4.2 1.0
12.9 7.4 0.2 4.2 1.016.3 3.2 0.6 4.3 .914.5. 6%4 1.6 4.2 1017.1 7.0 2.5- 4.0 1.1
22.3 8.2 1.6 3.9 1.0 ,
214 5.4 0.9 ,' 4.1 1.019.8 10.1 2.5 3,8 1.132.1 11.9 1:2 s ' 3.7 1.1-
0.1.- 1]).
47.8% -31.7 16.
57.4%54.4%
43.3%,6_36.9r
27.6 12.
20.0/12.33.0 19.335.9 20.0
NotImportant
.(2). _DLL: MEAN S.D.
1.0 4.2 .9
0.2 4.4 .8
0.6 4.4 .8.6 0.8 " 4.1 .9
5.1 2.1 4.0 1.0' '
TOtal (SeC.) 644 ?a.8 %' 14.2 26.1
Grade-8 323 33.1% 34.1 2'4.5tt Grade 10 237 27.0% 36.3 26.2
Grade 12 C4 25.Q% 28.6 32.1
11
1
300
8.1 1.9 3.8 1.0
7.4
8.4
9.5
0.92.1
4.8
3.93.8
3.6
Ic
11,
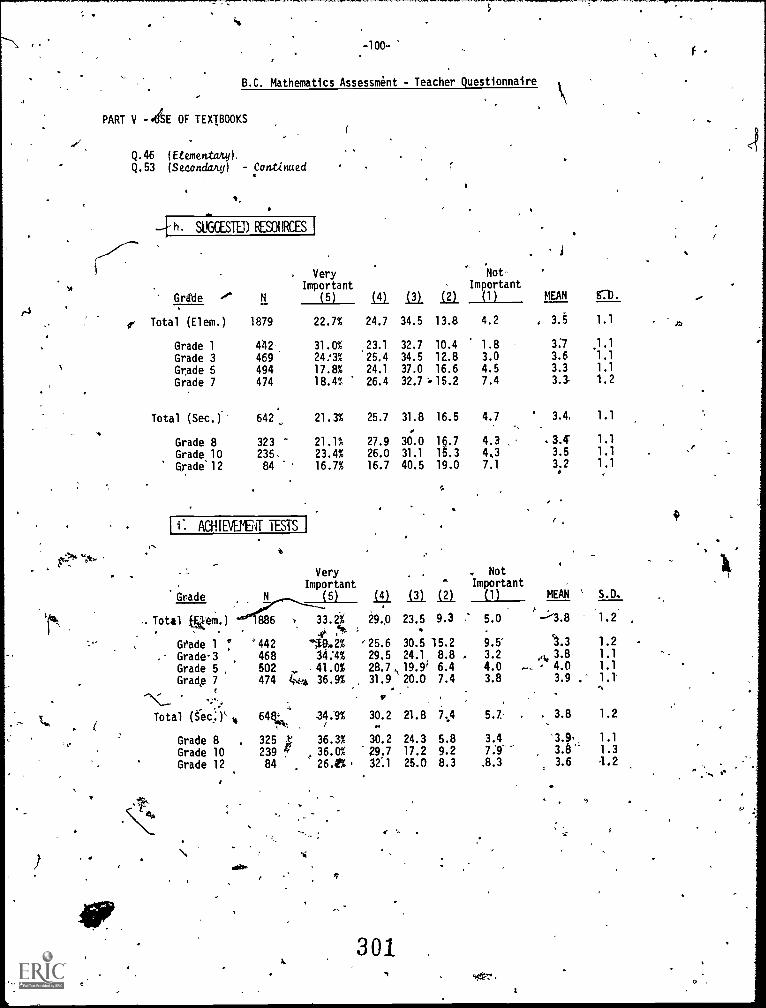
-100-
B.C. Mathematics Assessment - Teacher Questionnaire
PART V -44E OF TEXTBOOKS
Q.46 (Etementax0.Q.53 (Secenddity) - Continued
V
4h SUGGEST) RESOURCES I
VeryImportant
Not
Important
Grgde (5) 1.11 121 1_21 (1)
Total (Elem.) 1879 22.7% 24.7 34.5 13.8 4.2
Grade 1 442 31.0% 23.1 32.7 10.4 1.8
Grade 3 469 24:3% 25.4 34.5 12.8 3.0
Grade 5 494 17.8% 24.1 37.0 16.6 4.5
Grade 7 474 18.4% 26.4 32.7 -15.2 7.4
Total (Sec.)'' 642 21.3% 25.7 31.8 16.5 4.7
Grade 8 323 21.1% 27.9 30.0 15.7 4.3
Grade 10 235, 23.4% 26.0 31.1 l3.3 4.3
Grade' 12 84 16.7% 16.7 40.5 19.0 7.1
i: ACCEVENCIT TESTS
Grade
VeryImportant
(5)
Total kqeM.).
1886 33.21
Gade 1 ! '442 1.41.2%
Grade-3 468 34:4%
Grade 5 , 502 41.0%Grade 7 474 14 36.9%
Total (§ec:)' % 645t4 11.1%
Grade 8 . 325 1-; 36.3%
Grade 10 239 , 36.0%
Grade 12 84 26.2%.
MEAN 570.
, 3.5 1.1
3.7
3.6
3.3
3.
3.4.
. 3.43.5
3;2
.1.1
1.1
1.1
1.2
Not
Important
(1) MEAN S.D.
29,0 23.5 9.3 5.0 1.2
30.5 15.2 9.5' '3.3 1.2
24.1 8.8 , 3.2 3.8 1.1
19.9' 6.4 4.0 4.0 1.1
20.0 7.4 3.8 3.9 1.1
'25.6
29.5
28.7,31.9
30.2 21.8 7,4 5.7 . 3.8 1.2
30.2 24.3
29.7 17.2
32:1 25.0
301
5.8 3.4 3.99.2 7:9 3.6
8.3 ,8.3 3.6
1 . 1
1 . 3
4.2
O
(
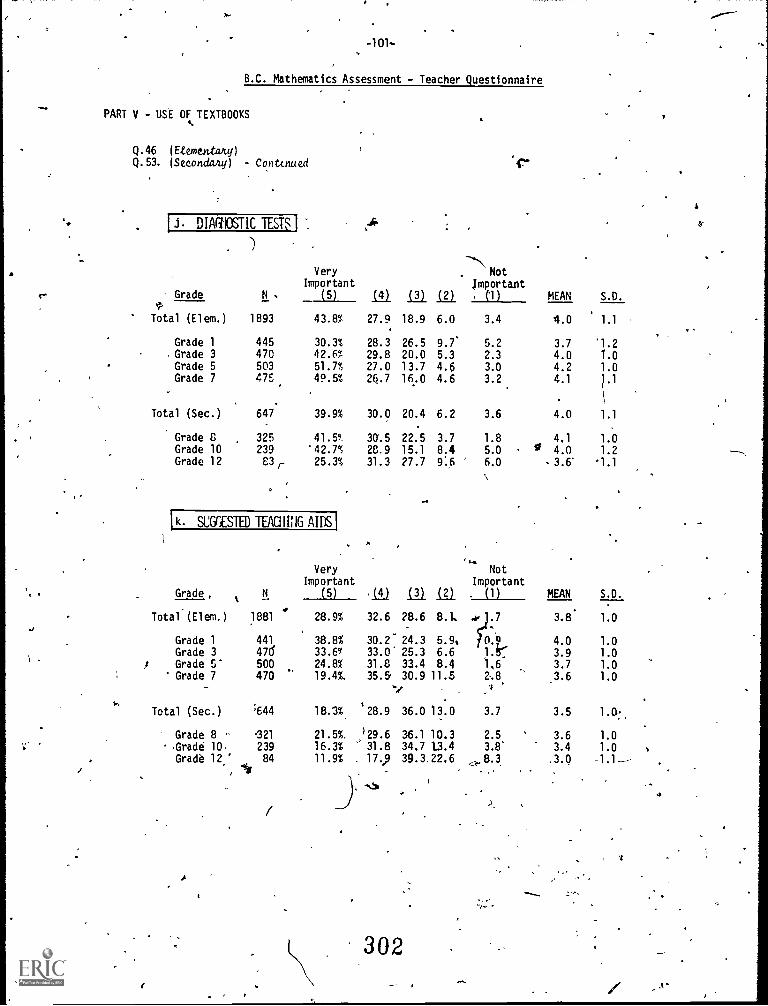
J
/
-101-
B.C. Mathematics Assessment - Teacher Questionnaire
PART V - USE OF TEXTBOOKSt.
Q.46 (EtementaAy)Q.53. (Secondwuj) - Contcnued
I i. DIAGIOSTIC TESTS I
)
VeryImportant
Grade N . (5) (4)
Total (El em. ) 1893 43.8% 27.9
Grade 1 445 30.3% 28.3Grade 3 470 42.6% 29.8Grade 5 503 51.7% 27.0Grade 7 475 49.5% 26.7
. ,
Total (Sec.) 647. 39.9% 30.0
Grade 8 325 41.59 30.5Grade 10 239 '42.7%, 28.9Grade 12 83 r 25.3% 31.3
i k. SUGGESTED TEACHING AIDS I
Grade_
Total (Elem.)
t
.....N. Notjmportant
a-
(3) (2) . (1) MEAN S.D.
18.9 6.0 3.4 4.0 1.1
26.5 9.7' 5.2 3.7 '1.220.0 5.3 2.3 4.0 1.013.7 4.5 3.0 4.2 1.016.0 4.6 3.2 4.1 J.1
20.4 6.2 3.6 4.0 1.1
22.5 3.7 1.8 4.1 1.015.1 8.4 5.0 . 0 4.0 1.227.7 9:6 ' 6.0 3.6' '1.1
-,..Very Not
Important ImportantN (5) .14) 1_31 In . (1) MEAN S.D.
1881 * 28.9% 32.6
Grade 1 441 38.8% 30.233.6 33.0Grade 3 476
A Grade 5' 500 24.8% 31.8Grade 7 470 19.4%. 35.5.
Total (Sec.) ;644 18.3% '28.9
Grade 8 - 121 21.5%. )29.6Grade 10. 239 16.3% 31.8Grade 12 ' 84 11.9% , 17.,
,
-.Sh
/
.4
e
28.6
24.325.3
8.1,
5.9,6.6
4, j.7
?.1.
3.8*
4.03.9
1.0
1.01.0
33.4 8.4 1,6 3.7 1.030.9 11.5 2.8 3.6 1.0
-.e 4 .
36.0 13.0 3.7 3.5 1.0,
36.1 10.3 2.5 3.6 1.034.7 '1.3.4 3.8' 3.4 1.039.3 22.6 .r 8.3 ,3.0 -1.1-
302
...I.....
I.\ / ...,-, ,
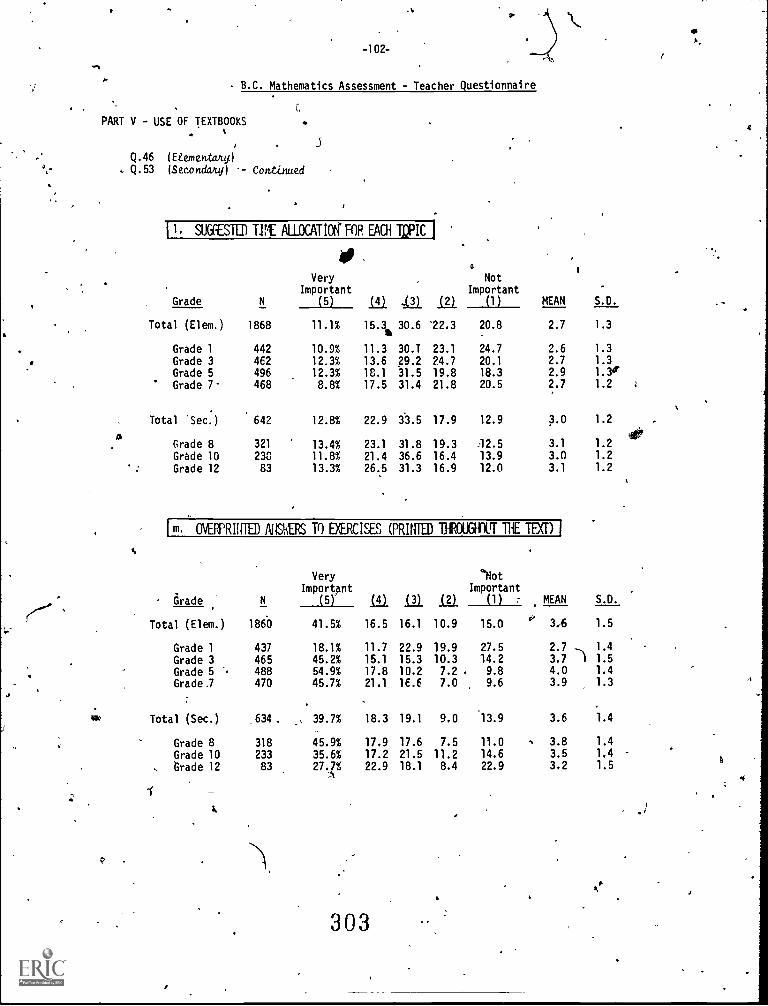
o.
-102-
B.C. Mathematics Assessment - Teacher Questionnaire
PART V - USE OF TEXTBOOKS
J
Q.46 (Etementaky)Q.53 (Secondary - Continued
o
NotImportant
11. SUGCESTED TIVE ALLOCATION' FOR EACH TDPIC
VeryImportant
Grade N (5) Ili -1.1). 1..2/ (1) MEAN S.D.
Total (Elem.) 1868 11.1% 15.3 30.6 '22.3 20.8 2.7 1.3
Grade 1 442 10.9% 11.3 30.T 23.1 24.7 2.6 1.3
Grade 3 462 12.3% 13.6 29.2 24.7 20.1 2.7 1.3
Grade 5 496 12.3% 18.1 31.5 19.8 18.3 2.9 1.3.,
Grade 7 468 8.8% 17.5 31.4 21.8 20.5 2.7 1.2 1
A
Total 'Sec.) 642 12.8% 22.9 33.5 17.9 12.9 3.0 1.2
sieGrade 8 321 13.4% 23.1 31.8 19.3 .12.5 3.1 1.2
Grade 10 238 11.8% 21.4 36.6 16.4 13.9 3.0 1.2
Grade 12 83 13.3% 26.5 31.3 16.9 12.0 3.1 1.2
OVERPRINTED ANSWERS TO EXERCISES (PRINTED THROUGHOVT THE TEXT)
- Grade N
VeryImportant
(5)° IL i21 in
NotImportant
(1) MEAN S.D.
Total (Elem.) 1860 41.5% 16.5 16.1 10.9 15.0o,
3,6 1 5
Grade 1 437 18.1% 11.7 22.9 19.9 27.5 2.7 -, 1.4
Grade 3 465 45.2% 15.1 15.3 10.3 14.2 3.7 1 1.5
Grade 5 '. 488 54.9% 17.8 10.2 7.2 . 9.8 4.0 1.4
Grade.7 470 45.7% 21.1 16.6 7.0 9.6 3.9 1.3
Total (Sec.) 634. ., 39.7% 18.3 19.1 9.0 13.9 3.6 1.4
Grade 8 318 45.9% 17.9 17.6 7.5 11.0 , 3.8 1.4
Grade 10 233 35.6% 17.2 21.5 11.2 14.6 3.5 1.4
trade 12 83 27.?% 22.9 18.1 8.4 22.9 3.2 1.5
303
.
r
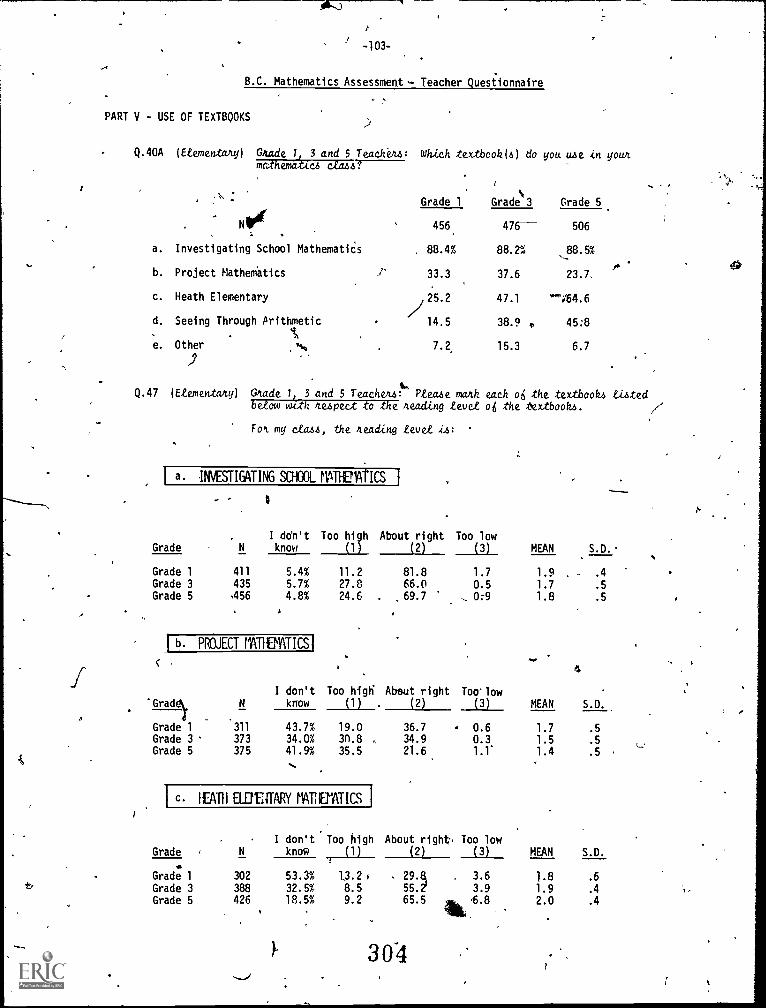
I a. INVESTIGATING SCHOOL MTHEMATICS 1
-103-
B.C. Mathematics Assessment s. Teacher Questionnaire
PART V - USE OF TEXTBOOKS
Q.40A (Elementary) Grade 1 3 and 5 Teacheu: Which textbook(e) do you use in yourmath es cL44.07-------
oror
a. Investigating School MathematiCs
b. Project MatheMatics
c. Heath Elementary
d. Seeing Through Arithmetic
e. Other
Grade 1 Grade 3 Grade 5
456
88.4%
33.3
/125.2
14.5
506
88.5%
23.7.
:64.6
45:8
6.7
476
88.2%
37.6
47.1
38.9
15.3
0
Q.47 ( Elementary) Grade 1; 3 and 5 Teachers Please math. each oti the textbooks Listedbelow uu th /tweet to the heading Level oti the textbooks. /For my daze, the heading Levee is:
Grade N
Grade 1 411
Grade 3 435
Grade 5 456
I do'n't Too high About right Too lowknow (1) (2) (3) MEAN S.D.-
4
5.4% 11.2 81.8 1.7 1.9 , - .4
5.7% 27.8 66.0 0.5 1.7 .5
4.8% 24.6 . 69.7 . 0:9 1.8 .5
J b. PROJECT rATIOATICS1
4
I don't Too high' About right Too'low'Grad N know (1) . (2) (3) MEAN S.D.
'311Grade 1 43.7% 19.0 36.7 0.6 1.7 .5Grade 3 373 34.0% 3O.8 . 34.9 0.3 1.5 .5Grade 5 375 41.9% 35.5 21.6 1.1 1.4 .5
c. IEATII ELETEITARY MATIETATICS
Too lowI don't Too high About rightGrade , N knout (1) (2) (3) MEAN S.D.
Grade 1 302 53.3% 13.2, , 29.4 . 3.6 1.8 .6
Grade 3 388 32.5% 8.5 55.2+ 3.9 1.9 .4
Grade 5 426 18.5% 9.2 65.5 ,6.8 2.0 .4
304
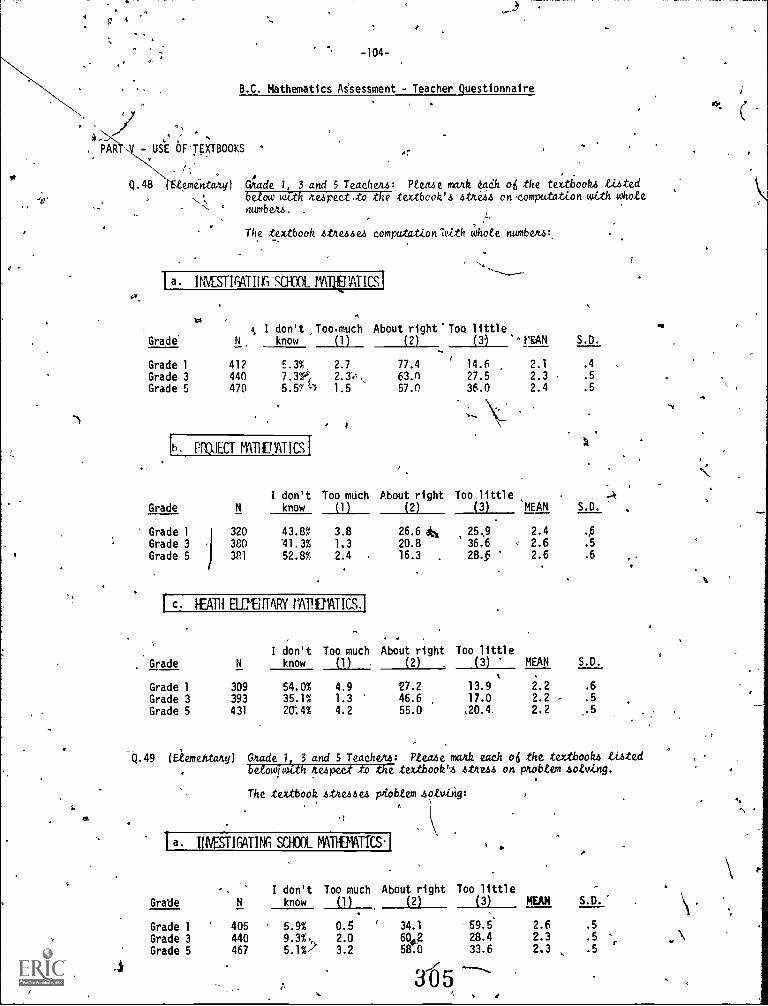
1 c. IfATH BLINTARY rAMETIATICSA
la. IMESTIGATING SCHOOL MATOATTCS-1
-104-
B.C. Mathematics Assessment - Teacher Questionnaire
)7 4 . .4
. PAR USE GFJEXTBOOKS ;..
Q.48 lECemen,tany1 Grade 1, 3 and 5 Teacheu: Ptease mink each of the textbooks Listed. Nt, betow with ke4pect.to the textbeek'a atneu, on .computation with whole
,... , numbem.
4
The textbook stnesses computationiath whote numbew.
I a. INVESTIGATInG SCNOOL firclJATICS-1
Grade N
Grade 1 41?
Grade 3 440
Grade 5 470
A I don't ,Too.much About right-Too littleknow (1) (2) (3) s'lili4AN S.D.
E.3% 2.7 77.4 14.6 2.1 .4
2.1.%3, 63.n 27.5 2.3 .5
5.57 1.5 57.0 36.0 2.4 .5
Grade N
Grade 1 41?
Grade 3 440
Grade 5 470
b. PROJECT mknumicsi
1
I don't Too mulch About right Too little . ....k
Grade N know (1) (2) (3) MEAN S.D.
Grade 1 320 43.8% 3.8 26.6 4 25.9 2.4 .6
Grade 3 380 41.3% 1.3 20.8 36.6 . 2.6 .5
Grade 5 381 52.8% 2.4 16.3 . 28.§ 2.6 .6
Q.49 (Elemehtatyl Grade It._ 3 and 5 Teacheu: Pteaae mark each oi the textbooh4 listedbetowiwth /tweet to .the textbook't dtAvhd on pkobtem sotving.
I don't Too much About right Too little
Grade N know (1) (2) . (3) MEAN S.D.
Grade 1 309 54.0% 4.9 27.2 13.9 2.2 .6
Grade 3 393 35.1% 1.3 46.6 17.0 2.2 - .5
Grade 5 431 20'.4% 4.2 55.0 .20.4 2.2 ,.5
Q.49 (Elemehtatyl Grade It._ 3 and 5 Teacheu: Pteaae mark each oi the textbooh4 listedbetowiwth /tweet to .the textbook't dtAvhd on pkobtem sotving.
The textbook stnessa pitobtem
,/*
305
,/*
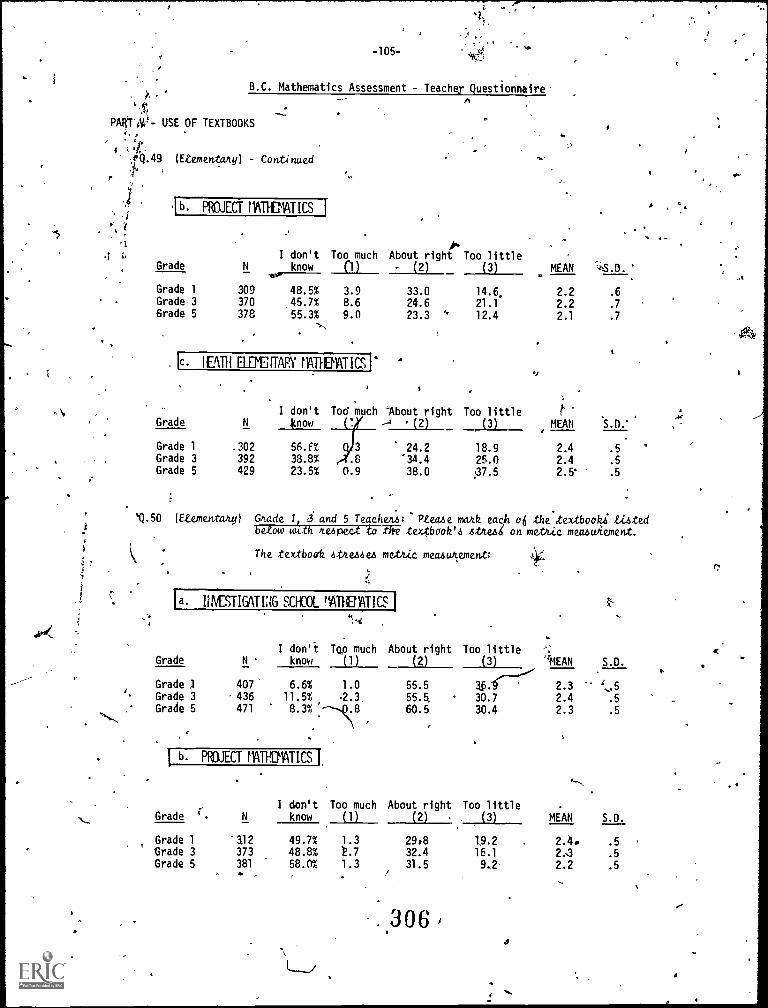
lc. lEATH ELETEITARY riATI-IBIAT ICS I
3
-105-
B.C. Mathematics Assessment - Teacher QuestionnaireA
PAkTA0 - USE OF TEXTBOOKS
4.49 (Elementang) - Continued
;z
-1
ib. pRoJECTMIlEmATICS I
Grade
p
/ft
I don't Too much About right Too littleN know (1) - (2) (3) MEAN %,S.B.'
0.
Grade 1 309 48.5% 3.9 33.0Grade 3 370 45.7% 8.6 24.6Grade 5 378 55.3% 9.0 23.3
14.6. 2.2 .6
21.1 2.2 .7
'' 12.4 2.1 .7
I don't To m ch -About right Too little tGrade ' ' (2) (3) MEAN 's.n:
Grade 1 _302 56.ft 3 24.2 18.9 2.4 .5Grade 3 392 38.8% .8 34.4 25.0 2.4 .5
Grade 5 429 23.5% 0.9 38.0 ;37.5 2.5 .5
)Q.50 (Fiementan.y) Grade 1t 3 and 5 Teachena: Pteaae mark each o5 the textbooki aatedbelow mth 'tweet to 75i textbook's 4,tnea6 on metkic meaauument.
The textbook stneasa met/tic measultement:
r'
ia. INVESTIGATING SCHOOL MATHBATICS I
I don't Top much About right Too little . 4Grade N know (1) (2) (3) 'MEAN S.D.
Grade 1 407 6.6% 1.0 55.5 3fi.
Grade 3 436 11.5% .2.3. 55.E 30.7Grade 5 471 8.3% .8 60.5 30.4
1 b. PROJECT MATHEMATICS I
2.3 ,.52.4 .5
2.3 .5
I don't Too much About right Too littleGrade N know (1) (2) (3) MEAN S.D.
Grade 1 -al2 49.7% 1.3 29,8 1,9.2 2.44 .5Grade 3 373 48.8% Y.7 32.4 16.1 2.3 .5
Grade 5 381. ,
58.0% 1.3.
31.5 9.2, 2.2 .5
3O6
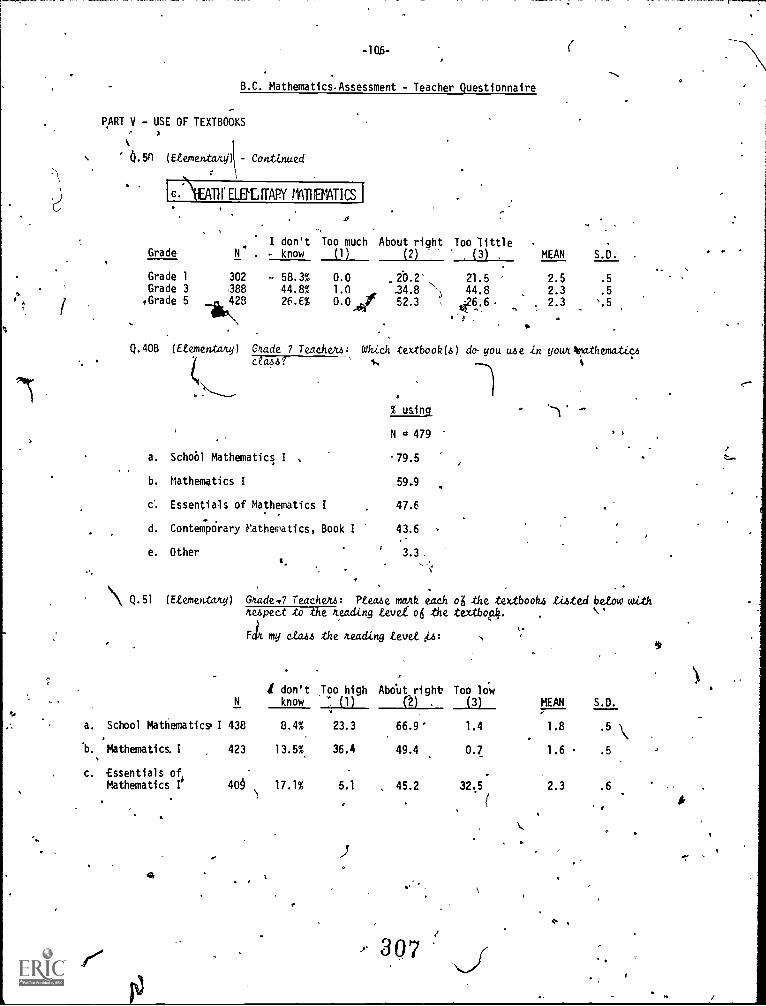
-1Q6-
PART V - USE OF TEXTBOOKS,
4.5n mentaAyl - ContAlnued
MATH'ie. T/1' ELEILITARY INTICS
,I don't Too much About right Too little
Grade N" - know (1) (2) , (3) -MEAN S.D.
Grade 1 302 - 58.3% 0.0 20.2' 21.5 2.5 .5Grade 3 388 44.8% 1.0 24.8 '''\ 44.8 2.3 .5,Grade 5 23 26.6% 0.0 52.3 426.6 2.. 3 '.5
B.C. MathematicsAssessment - Teacher Questionnaire
-,
Q.40B (6.6.ementany) Gtade 7 Teachas:, textbook(s) do- you wee in you/Anathematiceclass?
% using
N 0 479
a. School Mathematics I , 79.5
b. Mathematics I 59.9
c'. Essentials of Mathematics I 47.6
d. Contemporary Mathematics, Book I 43.6
e. Other 3.3.1.
ae.
.
Q.51 lEtementaAy) Gude7 TeacheAs: nease mak each o6 the .textbooks tieted below withuspect to the /Leading level oti the textbot4. \
FL my cease the neading Levee A2
N
a. School Mathematics. I 438
'b. Mathematics. I 423
c. Essentials of,Mathematics r 40
i don't Too high Abobt rightknow (1) ($) .
8.4% 23.3 66.9'
13.5%, 36.4 49.4
17.1% 5.1 , 45.2
Too low(3) MEAN
1.4 1.8
0.7 1.6 '
32;5 2.3
307
S.D.
.5
.5
.6
,
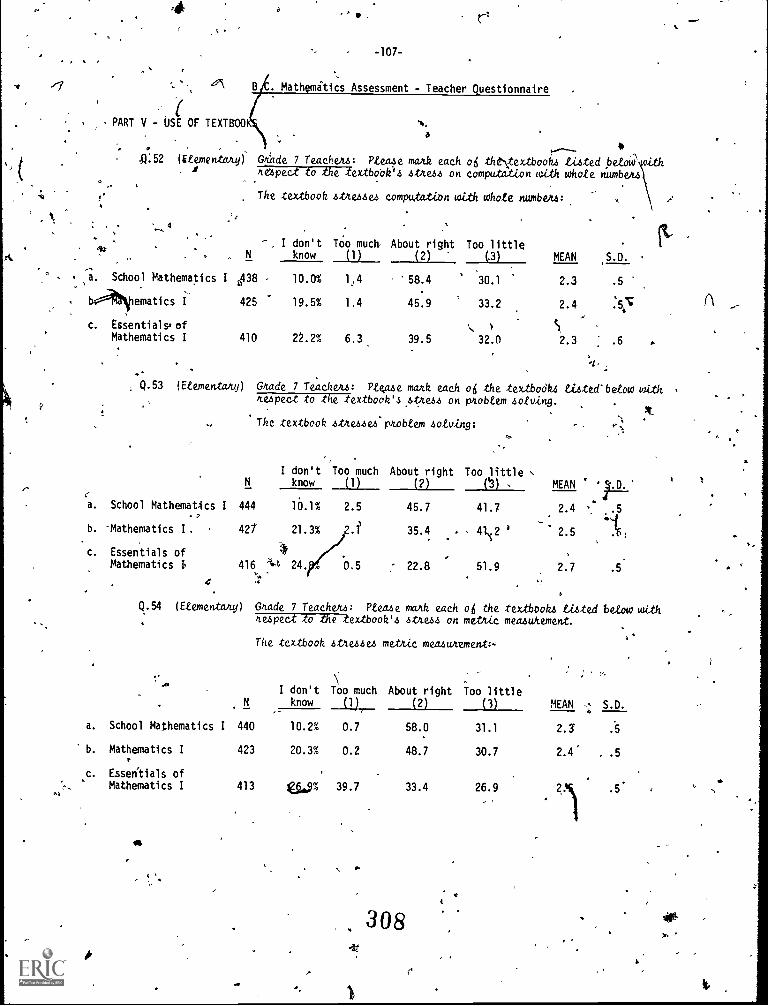
- PART V - USE OF TEXT800
-107-
. Mathemitics Assessment - Teacher Questionnaire
6;
P:52 (Etementalty) G4de 7 Teachem: P/eaae mark each o6 tht%4xtbooka Liated petoi4; ith4 hapect to the textbookla atheza on computation with who! numbehz
The textbook 45tAeAbeh computation with whole numbeu:
-. I don't Too much, About right Too little,. N know (1) (2) (3) MEAN S.D.
i. School Mathematics I 8438 - 10.0% 1,4 58.4 30.1 2.3 .5
ImoRNIematics I
c. essentials, of
425 19.5% 1.4 45.9 33.2 2.4 .53V
Mathematics I 410 22.2% 6.3 39.5 32.0 2.3 : .6
, Q.53 (Etementany) Gude 7 Teachers: Pteaae mark each os the textbodk4 Lated'betow with/tweet to the textbook's ,a4M.4.6 on phobtem aotoing.
The textbook atheaaea'phobtem sotving;
I don't Too muchN know (1)
a. School Mathematics I 444 10.1% 2.5
b. -Mathematics I, 42/ 21.3% J.c. Essentials of 1#
Mathematics b 416 1,.1, 24. ro 0.5''
e
About right(2)
Too little
e3) , MEAN
45.7
35.4 .
, .
: 22.8
41.7
- 4112
51.9
'
2.4
2.5
2.7 .5
Q.54 (Etementahyl Grade 7 Teachers: Please marsh each os the textbooks .Gated below with/tweet to the textbook's atheza on methic meazuhement.
The textbook atheaaea methie momuhtment:
N
I don'tknow
...
a. School Mathematics I 440 10.2%
b. Mathematics I
r
423 20.3%
c. Essentials ofMathematics I 413 6 9%
fs
SIB
Too much About right Too little(1), (2) (3) MEAN a S.D.
0.7 58.0 31.1 2.3*
0.2 48.7 30.7 2.4' , .5
39.7 33.4 26.9 .5.
308ar
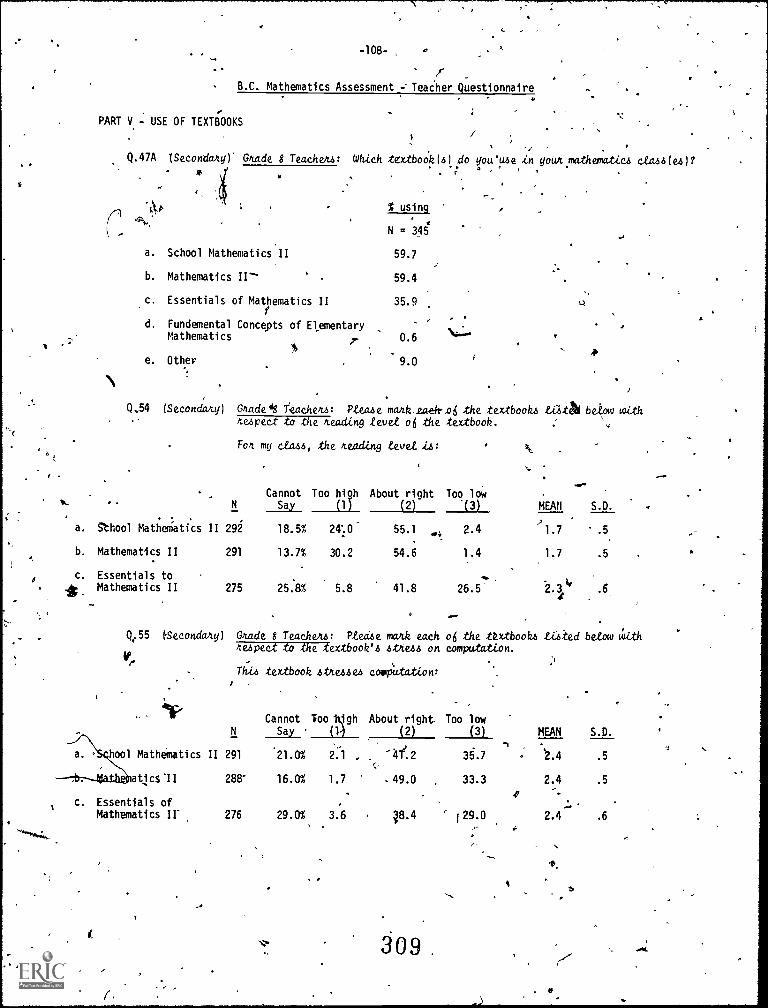
-108-.
O
B.C. Mathematics Assessment --Teacher Questionnaire
PART V - USE OF TEXTBOOKS
0.47A 1Secondahyl' Grade 8 Teacheu: Which textboOk(s) do you'u6e in yoUn mathematics ciaas(es)?* .
% using
44$:'
N = 34
59.7
59.4
a. School Mathematics II
b. Mathematics II"
c. Essentials of Mathematics II 35.9
Ad. Fundemental Concepts of Elementary
Mathematics 0.6
e. Other 9.0
A
Q.54 (Secondary) Guded8 Teaches: Reuse mank_eaek.oti the textbooks Lath be4o withtweet to the /Leading tent oti the textbook.
F04 my Ct446, the /Leading tevet J.
Cannot Too high About right Too low1, N ay (1) (2) .(3) MEAN S.D.
; .
a. 5thool Mathematics II 29i,,
1.7 .518.5% 24:0' 55.1 2.4
b. Mathematics II 291 13.7% 30.2 54.6 1.4 1.7 .5
c. Essentials to +.11; Mathematics II 275 25.8% 5.8 41.8 26.5 2.3 if .6_
e .
4
Q,55 fSecondday) Grade 8 Teaches: Meese mark each oti the ttxtbooks below with/tweet to the textbook's stneas on computation.
11",
Thia textbook Attease4 computation:
Cannot Too illjgh About right Too lowN Say (14 (2) 3 MEAN S.D.
-,
hool Mathematics II 291 21.0% 2.1 , -4f.2 36.7 . .2.4 .5
atics-II 288' 16.0% 1.7 .49.0 33.3 2.4 .5
-..47.
.
Mathematics IF 276 29.0% 3.6 . 0.4 129.0 2.4- .6
c. Essentials of
309
1 . a
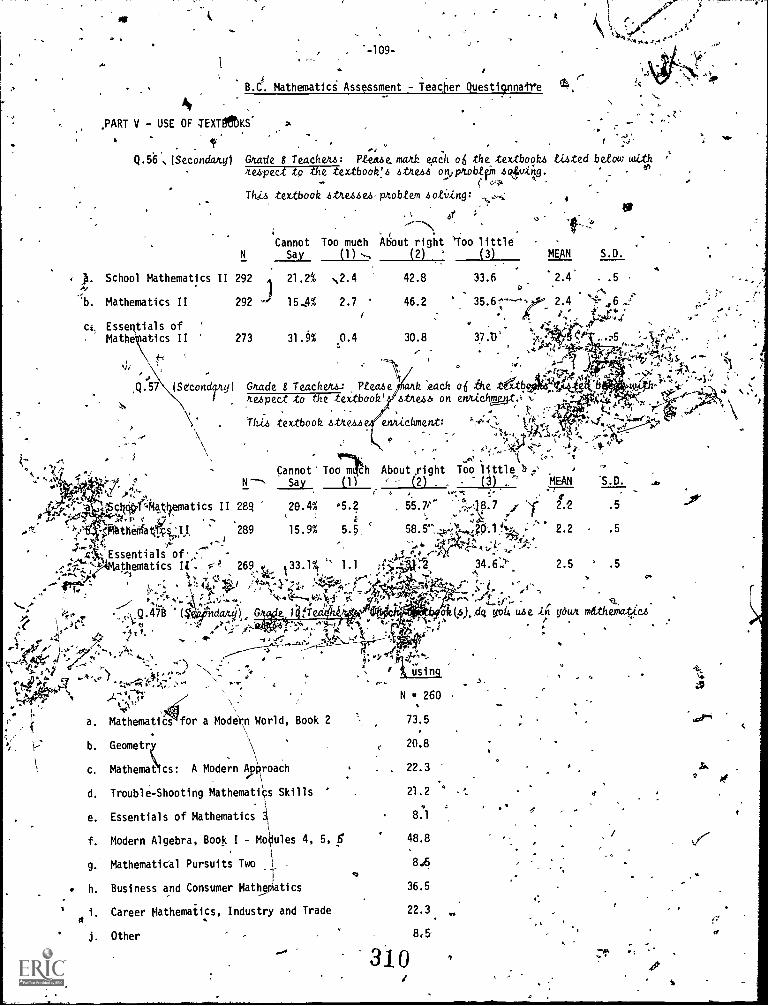
se
,PART V
A
B.C. Mathematics Assessment - Teacher QuestivinatreA
USE OF TEXTit()KS.
(Secondanyi Gutle 8 Teachens: Ptekese.mank each the .textbooks tizted below withnespect to the textbook's stness olteptobtfin sofviiv.
(This. textbook stresses paobtein soloing: .ti
N
). School Mathematics II 292
:b. Mathematics II 292
ck, EsseRtials of '
Mathebiatics II
,Q57
-"-
fSecondry)
st,..---...,
Cannot Too much About right sic() littleSay (1) ---.. (2) ' (3)
21.2t 2.4 42.8 33.6
-.1 15..4% 2.7 46.2 ' 35.61,----,i
.. .273 31.9% 0.4 30.8 37.D'
h A-"
.'1!/'(Gtuade 8 Teachene.: Ptease ank 'leach o6Itezpect to the textbook' .6.tile,54, on enitLehrAellt.1`
ehnichmenti- <iLv .A1.14
- At
MEAN S.D.
2.4 . .5,."`"
2.4 6
;*
al
:ft;,U.17:44.Artr%.
.'"AAf'T ,
.ThLts textbook strew
atics II 289
289
-./
P-Z.
Cannot' Too rtlh About right TOo s
Say (1) (2) - (3) MEAN..7
20.4% 05.2 I 2.22.2 .515.9% 5.5
0.. tc-Essentials of --
atilernatics N - 269 133 1%. ' 1.1.,
1.7,ga indatui), e 1 .!7." 4ti 4
ft
_j1'13./- 4.-
...,
a.
.4, iftvoy:
Mathematics for a Modern World, Book 2
b. Geometr
c. Mathematics: A Modern Api\roach
d. Trouble-Shooting Mathemati4 Skills ';
e. Essentials of Mathematics J,
f. Modern Algebra, Book I - Modules 4, 5, .6"
Mathematical Pursuits Two J_
Business and Consumer Math e tics
g.
h.
ai. Career Mathematics, Industry and Trade
j. Other
2.5 .5
" 1,1.:1-clia(A),.dcg yolk use ././a Owt nxithematliza
a.
f using
N 260
73.5
20.8
22.3
21.2
8:1
48.8
8.5
36.5
22.3
3108,5
fa.
Tr. ,
itip
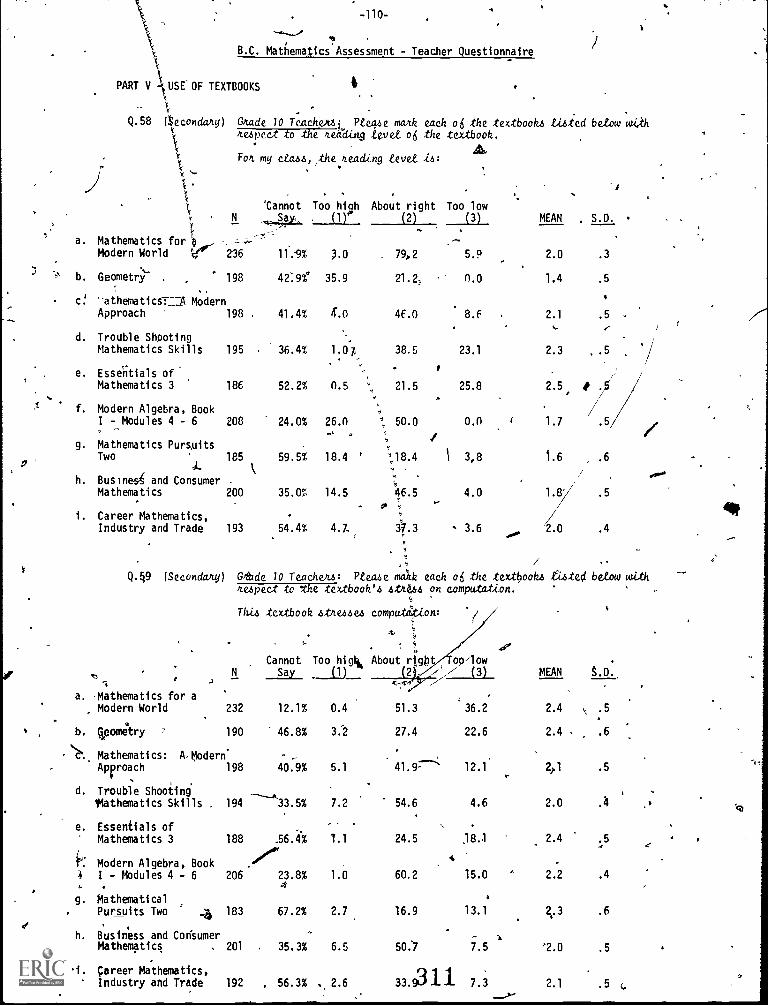
7,
PART V
-110-
B.C. Mathematics Assessment - Teacher Questionnaire
USE' OF TEXTBOOKS
Q.58 (tecondany)
4 .
Gnade 10 Teachwi.. Maze mark each ol5 the textbooks tisied below withtweet to the teadin9 level oti the textbook.
Fort my class, ,the /Leading &vet 4:4:
a.
b.
c!
d.
e.
f.
g
h.
Mathematics for ._. --
Modern World 236 11.-9%
Geometry`` 198
-athematics= ModernApproach 198
Trouble ShootingMathematics Skills
Essentials ofMathematics 3 1
Modern Algebra, BookI - Modules 4 - 6
Mathematics PursuitsTwo 185 59.5% 18.4
J. kBusinesi and Consumer -
Mathematics 200 35.0% 14.5
4.7.,
Career Mathematics,Industry and Trade 193
. . .
'Cannot Too high About right Too lowN -4...10L. (1) (2) (3) MEAN ,
--_-,,--...
'.0 79,2 5.9 2.0
42:9f 35.9 21.2, 0.0 1.4
41.4% 4.o 4f.0 8.F . 2.1
195 , 36.4% 1.0X 38.5 23.1 2.3
186 52.2% 0.5 21.5 25.8 2.5
208 24.0% 26.0
54.4%
50.0
' 7,18.4
46.5
.5,
I
1.0
o.n 1.7
3,8 1.6
4.0
- 3.6.000.
1.8'
2.0
Q.59
+:1
(Secondary Mhde 10 Teachers: Please molk each ol5 the textbookstespect to 'the textbook's 441E446 on computation.
'1
This textbook stresses computation: 7/
S.D.
.3
.5
.5
, .5
.5
4
tfisted below
a t
gbtSay MEAN
Cannot Too higlk About r
d.
a. -Mathematics for aModern World
b. geometry
Mathematics:Approach
Trouble Shooting'Mathematics Skills
Essentials ofMathematics 3
A,Modern198
e.
Modern Algebra, Book4 I - Modules 4 - 6 206 23.8%. 4
g. MathematicalPursuits Two .4 183 67.2%
h. Business and Con'sumerMathematics . 201 35.3%
i. Career Mathematics,Industry and Trade 192
232 12.1% 0.4
190 46.8% 3.2
40.9% 5.1
194 ----33.5% 7.2
188 .56:4 T.1
1.0
2.7 16.9
6.5
56.3% . 2.6
51.3 36.2
27.4 22.6
41.9:--
54.6 4.6
24.5 38.1
4
60.2 15.0
12.1
13.1
50:7 7.5
33.0 1 I- 7.3
2e3
2.4 r .5
2.4 .6
2,1 .5
2.0 .4
2.4 .5
2.2 .4
.6
'2.0 .5
2.1 .5
with
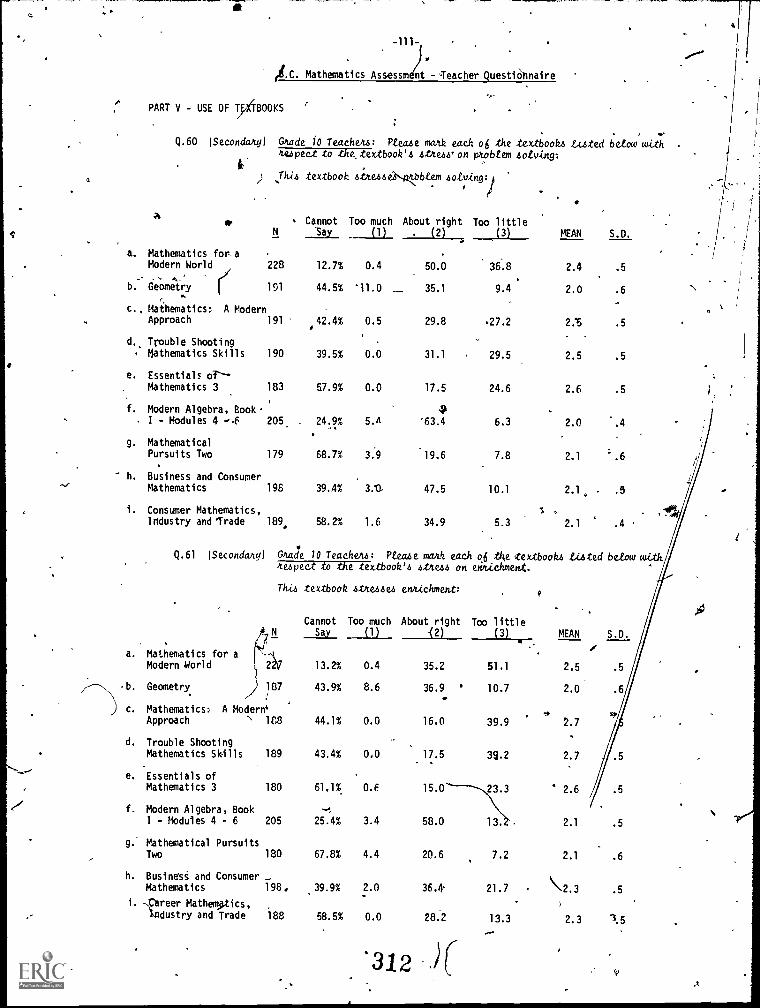
-111-
$
ig.C. Mathematics Assessm)nt - Teacher Questiiilinaire
PART V - USE OF TEXTBOOKS
a
Q.60 (Secondarty) Grade 10 Teacheu: Ptea,se maith each o6 the textbookz &6ted betow with .
446pect to the.textbook14 4t4e54'on pkobtem Aotvingl
) Thi4 textbook 6tne66e3y ubtem
Cannot Too much About right Too littleN Say (1) . (2) (3) MEAN S.D.
a. Mathematics for aModern World 228 12.7% 0.4 50.0 36.8 2.4 .5
b. Geometry 191 44.5% '11.0 ..... 35.1 9.4 2.0 .6
c., Mathematics: A ModernApproach 191
#42.4% 0.5 29.8 .27.2 2.5 .5
d. Trouble Shooting_
Mathematics Skills 190 39.5% 0.0 31.1 , 29.5 2.5 .5
e. Essentials or--Mathematics 3 183 57.9% 0.0 17.5 24.6 2.6 .5
f. Modern Algebra, Book. 4I - Modules 4 -..f 205 . 24.9% 5.4 '63.4 6,3 2.0 ..4
.4.
g. Mathematical /
/
Pursuits Two 179 68.7% 3.9 19.6 7.8 2.1 '.6
h. Business and ConsumerMathematics 196 39.A% 3. 47.5 10.1 2.10 .5
i. Consumer Mathematics,Industry and 'Trade 189, 58.2% 1.6 34.9 5.3
,.
2.1 .4
Q.61 (Secondary) Grade 10 Teacheu: Ptea6e marsh each 0,6 the textbook4 tiated betow withtweet to the textbook14 4tice64 on entichment.
',Ilia textbook 4tice44e4 enAichment:
Cannot Too much About right Too littleSay (1) i2) (3) MEAN S.D.
a. Mathematics for aModern World
'1
13.2% 0.4 35.2 51.1 2.5
b. Geometry ) 187 43.9% 8.6 36.9 10.7 2.0t .
c. Mathematics: A Modern+.,*
Approach \ 188 44.1% 0.0 16.0 39.9 2.7
d. Trouble ShootingMathematics Skills 189 43.4% 0,0 17.5 39.2 2.7
e. Essentials ofMathematics 3 180 61.1% 0.6 15.0- -..3.3 ' 2.6 .5
f. Modern Algebra, Book --...
I - Modules 4 - 6 205 25.4% 3.4 58.0 132'. 2.1 .5
g. Mathematical PursuitsTwo 180 67.8% 4.4 20.6 7.2 2.1 .6
h. Businesi and Consumer ..Mathematics 198. 39.9% 2.0 36.4' 21.7 \2.3 .5
i. .ctreer Mathematics,,
)
Industry and Trade 188 58.5% 0.0 28.2 13.3 2.3 11.5
312 )1
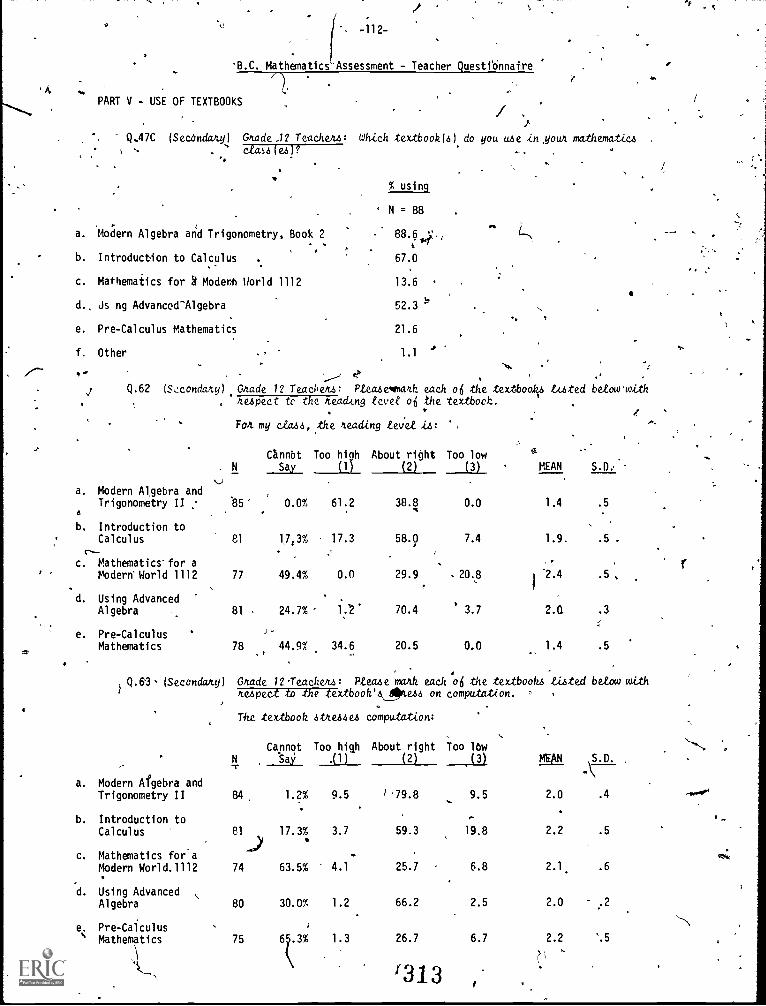
GP
.B.C. Mathematics-Assessment - Teacher Questionnaire
PART V - USE OF TEXTBOOKS
Q.47C (Secondary) Grade .12 Teachenz: Which extbook(s), do you use in Noun mathematicae.ta.s,s ( e.-6)?
a. Modern Algebra and Trigonometry, Book 2
'1111tral
N = 88
b. Introduction to Calculus 67.0
c. Mathematics for a Modern World 1112 13.6 ,
d.. Js,ng Advanced-Algebra 52.3=
e. Pre-Calculus Mathematics 21.6
f. Other 1.1 ''',,,
J Q.62 ( Secondary) .Ghade 12 Teachers: Pteazelmath each of the extboak6 tued betow-with. . ne4pect to the teackng tevet oi the textbook.
. 4
Fot my eica,s,the reading tevet 4:4: ..,
annbt Too high About right Too lows
N Say (1) (2) (3) MEAN S.D.,-
..)
a. Modern Algebra andTrigonometry II : 85' 0.0% 61.2 38.8 0.0 1.4 .5
6
b. Introduction toCalculus 81 173% - 17.3 58.0 7.4 1.9. .5 .
c.._
c. Mathematics. for a .,.
Modern' World 1112 77 49.4% 0.0 29.9 .20.8 1 -2.4
d. Using AdvancedAlgebra 81 - 24.7% 1:2' 70.4 3.7 2.0. .3
e. Pre-Calculus '-
Mathematics 78 44.9% 34.6 20.5 0.0 1.4 .5' -
Q.63- (Secondary) Gnade 12-Teacheitz: &ease mark each oti the textbooks tisted below withnespect to the textbookOke,s,s on computation.
The textbook 4the44e4 computation:
a. Modern Algebra and
141,
CannotSay
Too high.(1)
b.
Trigonometry II
Introduction to
84 1.2% 9.5
Calculus 81 17.3% 3.7
c. Mathematics for a..)
d.
Modern World.1112
Using Advanced
74 63.5% 4.1
e.
Algebra
Pre-Calculus
80 30.0% 1.2
MatheMatics 75 1.3
About right Too low
(2) ,(3) MEAN .\S.D. ,
1.79.8 9.5
-
2.0 .4
59.3 19.8 2.2 .5
25.7 6.8 2.1. .6
66.2 2.5 2.0 ;2
26.7 6.7 2.2 '.5
'313 o
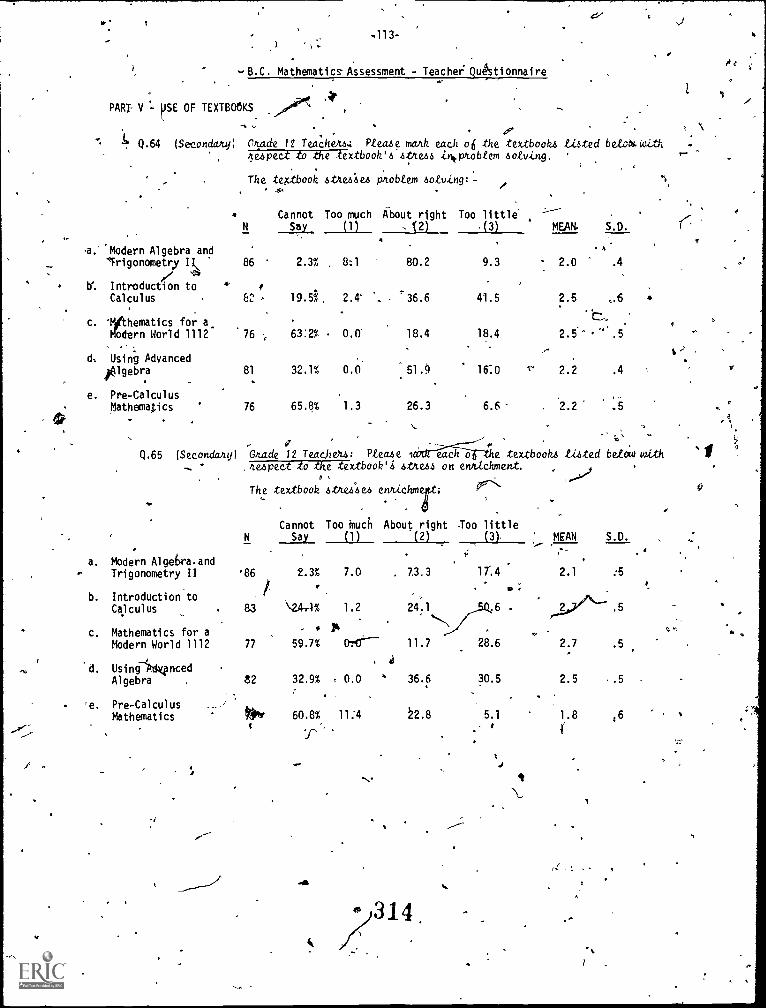
.113-
>
-B.C. Mathematics Assessment - Teacher: Qu4Wonnaire
PART V SE OF TEXTBOOKS'
1' Q.64 (Secondary) Onade 12 Teachers.; Pteaae mark each ob the textbooks tisted betotttwithneapect to the textbook's atmaa inooftobtem satving.
The textbook stAula pnobtem saving: -
a.' *Modern Algebra andITrigonom, II
b.. Introduction toCalculus
c.
rematics for a.Modern World 1112
d, Using Advanced)41gebra
e. Pre-CalculusMathematics
Cannot Too much About right Too little'N Say (1) 2) (3) MEAN. S.D.
.44
86 2.3% 811 80.2 9.3 2.0 .4
82 19.5% . 2.4' ", 36.6 41.5 2.5 ,.6
76 63:2% , 0.0' 18.4 18.4 2.5- .5
t81 32.1% 0.0 51.9 16:0 2.2 .4
76 65.8% 1.3 26.3 6.6 , 2.2 .5- 1,
Q.65 (Secondary)
a. Modern Algefora.andTrigonometry II
b. Introduction toCalculus
c. Mathematics for aModern World 1112
d. Using need
Algebra .
'e. Pre-CalculusMathematics
V
,Gade 12 Teacheha: Fteaae
.
1 each o e textbooks Listed betoW withstkeaa on en/tic/meat.
P:renniehm ;
About right .Too little
.,a
I
9
4e4peet to the textbook'i
The textbook 6theibe.6
Cannot Too MuchN Say *(2) (3), MEAN S.D._ill
;-,
'86 2.3% 7.0 , 73.3 1r.4 2.1 :5
.:
\2A-,4% 1.2 24.1 6 .5
0 it
.,\ow
77 59.7% Ore-- 11.7 28.6 2.7 .5
E2 32.9% , 0.0 ' 36.6 30.5 2.5 . .5
*V 60.8% 11:4 2.8 5.1 1.8 :6
Ir
314,
Related Documents