WP 1 Page 1 of 19 Subpage 1 of 2 Capitalized Costs Disallowed in Previous ICC Orders (1), (2) Line Docket No. Docket No. Docket No. Docket No. Docket No. Docket No. Docket No. Docket No. Docket No. Docket No. Docket No. Docket No. Docket No. Docket No. Total No. 05-0597 07-0566 10-0467 11-0721 12-0321 13-0318 14-0312 15-0287 16-0259 17-0196 18-0808 19-0387 20-0393 21-0367 Col (B) thru (O) (B) (C) (D) (E) (F) (G) (H) (I) (J) (K) (L) (M) (N) (O) (P) 1 Adjustments to Rate Base 2 Gross Plant (5,975) $ (1,355) $ (967) $ (1,305) $ (2,675) $ (3,354) $ (4,505) $ (1,360) $ (8,645) $ (209) $ (402) $ (900) $ (495) $ (485) $ (32,632) $ 3 Accumulated Depreciation 2,455 491 281 349 653 816 993 267 1,499 30 50 91 36 24 8,034 4 Deferred Income Taxes 736 154 92 114 219 275 343 96 552 13 19 35 15 9 2,672 5 Adjustments to Rate Base (2,784) $ (710) $ (594) $ (842) $ (1,803) $ (2,263) $ (3,169) $ (997) $ (6,594) $ (166) $ (333) $ (774) $ (444) $ (452) $ (21,926) $ 6 Depreciation (150) $ (34) $ (24) $ (33) $ (67) $ (84) $ (113) $ (34) $ (217) $ (5) $ (10) $ (23) $ (12) $ (12) $ (818) $ Notes: (1) This adjustment removes from rate base the net book value and from test year Rate base and O&M expense the effect of the incentive compensation and other costs disallowed in prior ICC dockets and other proposed reductions. (2) See Pages 2 - 15 for details. (3) See Pages 16 - 19 for details. (4) Gross Plant and Accumulated Depreciation is before Jurisdictional Allocators Applied on General and Intangible Plant. (A) Commonwealth Edison Company Removal of Capitalized Costs (In Thousands) Description Docket No. 22-____ ComEd Ex. 1.02 Page 1 of 176

Welcome message from author
This document is posted to help you gain knowledge. Please leave a comment to let me know what you think about it! Share it to your friends and learn new things together.
Transcript

WP 1
Page 1 of 19
Subpage 1 of 2
Capitalized Costs Disallowed in Previous ICC Orders (1), (2)
Line Docket No. Docket No. Docket No. Docket No. Docket No. Docket No. Docket No. Docket No. Docket No. Docket No. Docket No. Docket No. Docket No. Docket No. Total
No. 05-0597 07-0566 10-0467 11-0721 12-0321 13-0318 14-0312 15-0287 16-0259 17-0196 18-0808 19-0387 20-0393 21-0367 Col (B) thru (O)
(B) (C) (D) (E) (F) (G) (H) (I) (J) (K) (L) (M) (N) (O) (P)
1 Adjustments to Rate Base
2 Gross Plant (5,975)$ (1,355)$ (967)$ (1,305)$ (2,675)$ (3,354)$ (4,505)$ (1,360)$ (8,645)$ (209)$ (402)$ (900)$ (495)$ (485)$ (32,632)$
3 Accumulated Depreciation 2,455 491 281 349 653 816 993 267 1,499 30 50 91 36 24 8,034
4 Deferred Income Taxes 736 154 92 114 219 275 343 96 552 13 19 35 15 9 2,672
5 Adjustments to Rate Base (2,784)$ (710)$ (594)$ (842)$ (1,803)$ (2,263)$ (3,169)$ (997)$ (6,594)$ (166)$ (333)$ (774)$ (444)$ (452)$ (21,926)$
6 Depreciation (150)$ (34)$ (24)$ (33)$ (67)$ (84)$ (113)$ (34)$ (217)$ (5)$ (10)$ (23)$ (12)$ (12)$ (818)$
Notes:
(1) This adjustment removes from rate base the net book value and from
test year Rate base and O&M expense the effect of the incentive compensation and other costs disallowed
in prior ICC dockets and other proposed reductions.
(2) See Pages 2 - 15 for details.
(3) See Pages 16 - 19 for details.
(4) Gross Plant and Accumulated Depreciation is before Jurisdictional Allocators Applied
on General and Intangible Plant.
(A)
Commonwealth Edison Company
Removal of Capitalized Costs
(In Thousands)
Description
Docket No. 22-____ComEd Ex. 1.02
Page 1 of 176

Line
No.
1 Adjustments to Rate Base
2 Gross Plant
3 Accumulated Depreciation
4 Deferred Income Taxes
5 Adjustments to Rate Base
6 Depreciation
(A)
Description
WP 1
Page 1 of 19
Subpage 2 of 2
Other Adjustments (3), (4)
PORCB Supply Admin 2021 Test Year
Rider EEPP (Intangible Plant) (Intangible Plant) Adjustments
Pages 16 Page 17 Page 18 Page 19
(Q) (R) (S) (T)
(38,546)$ (16,505)$ (3,769)$ (821)$
2,651 16,505 3,769 21
5,181 - - 3
(30,714)$ -$ -$ (797)$
(846)$ -$ -$ (21)$
Notes:
(1) This adjustment removes from rate base the net book value and from
test year Rate base and O&M expense the effect of the incentive compensation and other
costs disallowed in prior ICC dockets and other proposed reductions.
(2) See Pages 2 - 15 for details.
(3) See Pages 16 - 19 for details.
(4) Gross Plant and Accumulated Depreciation is before Jurisdictional Allocators Applied
on General and Intangible Plant.
(In Thousands)
Commonwealth Edison Company
Removal of Capitalized Costs
Docket No. 22-____ComEd Ex. 1.02
Page 2 of 176

WP 1
Page 2 of 19
Commonwealth Edison Company
Removal of Capitalized Costs Disallowed in ICC Dkt. No. 05-0597 - 2021 Actual
Line Total
No. Amount 2005 2006 2007 2008 2009 2010 2011 2012 2013 2014 2015 2016 2017 2018 2019 2020 2021 Amount
(B) (C) (D) (E) (F) (G) (H) (I) (J) (K) (L) (M) (N) (O) (P) (Q) (R) (S) (T)
1 Gross Plant (5,975)$ (5,975)$
2 Tax Rate 28.51% 28.51% 28.51% 28.51% 28.51% 28.51% 28.51% 28.51% 28.51% 28.51% 28.51% 28.51% 28.51% 28.51% 28.51% 28.51% 28.51%
3 Book Depreciation Rate 2.44% 2.44% 2.44% 2.44% 2.31% 2.31% 2.31% 2.31% 2.31% 2.45% 2.45% 2.45% 2.45% 2.45% 2.51% 2.51% 2.51%
4 Annual Book Depreciation 146$ 146$ 146$ 146$ 138$ 138$ 138$ 138$ 138$ 146$ 146$ 146$ 146$ 146$ 150$ 150$ 150$ 2,455$
5 Net Book Value at 12-31-21 (3,520)$
6 Tax Depreciation Rate 3.75% 7.22% 6.68% 6.18% 5.71% 5.29% 4.89% 4.52% 4.46% 4.46% 4.46% 4.46% 4.46% 4.46% 4.46% 4.46% 4.46%
7 Annual Tax Depr (Ln 1 * Ln 6) 224$ 431$ 399$ 369$ 341$ 316$ 292$ 270$ 266$ 266$ 266$ 266$ 266$ 266$ 266$ 266$ 266$
8 Deferred Taxes ((Ln 7 - Ln 4)*Ln 2) 22$ 81$ 72$ 64$ 58$ 51$ 44$ 38$ 37$ 34$ 34$ 34$ 34$ 34$ 33$ 33$ 33$ 736$
9 Amount to be Excluded from Rate Base (2,784)$
(In Thousands)
Description
(A)
Docket No. 22-____ComEd Ex. 1.02
Page 3 of 176

WP 1
Page 3 of 19
Commonwealth Edison Company
Removal of Capitalized Costs Disallowed in ICC Dkt. No. 07-0566 - 2021 Actual
Line Total
No. Amount 2007 2008 2009 2010 2011 2012 2013 2014 2015 2016 2017 2018 2019 2020 2021 Amount
(B) (C) (D) (E) (F) (G) (H) (I) (J) (K) (L) (M) (N) (O) (P) (Q) (R)
1 Gross Plant (1,355)$ (1,355)$
2 Tax Rate 28.51% 28.51% 28.51% 28.51% 28.51% 28.51% 28.51% 28.51% 28.51% 28.51% 28.51% 28.51% 28.51% 28.51% 28.51%
3 Book Depreciation Rate 2.44% 2.44% 2.31% 2.31% 2.31% 2.31% 2.31% 2.45% 2.45% 2.45% 2.45% 2.45% 2.51% 2.51% 2.51%
4 Annual Book Depreciation 33$ 33$ 31$ 31$ 31$ 31$ 31$ 33$ 33$ 33$ 33$ 33$ 34$ 34$ 34$ 491
5 Net Book Value at 12-31-21 (864)$
6 Tax Depreciation Rate 3.75% 7.22% 6.68% 6.18% 5.71% 5.29% 4.89% 4.52% 4.46% 4.46% 4.46% 4.46% 4.46% 4.46% 4.46%
7 Annual Tax Depreciation (Ln 1 * Ln 6) 51$ 98$ 90$ 84$ 77$ 72$ 66$ 61$ 60$ 60$ 60$ 60$ 60$ 60$ 60$
8 Deferred Taxes ((Ln 7 - Ln 4)*Ln 2) 5$ 18$ 17$ 15$ 13$ 12$ 10$ 8$ 8$ 8$ 8$ 8$ 8$ 8$ 8$ 154$
9 Amount to be Excluded from Rate Base (710)$
(In Thousands)
Description
(A)
Docket No. 22-____ComEd Ex. 1.02
Page 4 of 176

WP 1
Page 4 of 19
Commonwealth Edison Company
Removal of Capitalized Costs Disallowed in ICC Dkt. No. 10-0467 - 2021 Actual
(In Thousands)
Line Total
No. Amount 2010 2011 2012 2013 2014 2015 2016 2017 2018 2019 2020 2021 Amount
(B) (C) (D) (E) (F) (G) (H) (I) (J) (K) (L) (M) (N) (O)
1 Gross Plant (1) (967)$ (967)$
2 Tax Rate 28.51% 28.51% 28.51% 28.51% 28.51% 28.51% 28.51% 28.51% 28.51% 28.51% 28.51% 28.51%
3 Book Depreciation Rate 2.31% 2.31% 2.31% 2.31% 2.45% 2.45% 2.45% 2.45% 2.45% 2.51% 2.51% 2.51%
4 Annual Book Depreciation 22$ 22$ 22$ 22$ 24$ 24$ 24$ 24$ 24$ 24$ 24$ 24$ 281$
5 Net Book Value at 12-31-21 (686)$
6 Tax Depreciation Rate 3.75% 7.22% 6.68% 6.18% 5.71% 5.29% 4.89% 4.52% 4.46% 4.46% 4.46% 4.46%
7 Annual Tax Depr (Ln 1 * Ln 6) 36$ 70$ 65$ 60$ 55$ 51$ 47$ 44$ 43$ 43$ 43$ 43$
8 Deferred Taxes ((Ln 7 - Ln 4)*Ln 2) 4$ 14$ 12$ 11$ 9$ 8$ 7$ 6$ 6$ 5$ 5$ 5$ 92$
9 Amount to be Excluded from Rate Base (594)$
Note:
(1) 10-0467 Incentive Comp Final Order Appendix A Page 8, Column K (896)$
10-0467 LTIP Perqs & Awards Final Order Appendix A Page 8, Column L (62)
10-0467 Sporting Activity Final Order Appendix A Page 8, Column M (9)
Total (967)$
Description
(A)
Docket No. 22-____ComEd Ex. 1.02
Page 5 of 176

WP 1
Page 5 of 19
Line Total
No. Amount 2011 2012 2013 2014 2015 2016 2017 2018 2019 2020 2021 Amount
(B) (C) (D) (E) (F) (G) (H) (I) (J) (K) (L) (M) (N)
1 Gross Plant (1) (1,305)$ (1,305)$
2 Tax Rate 28.51% 28.51% 28.51% 28.51% 28.51% 28.51% 28.51% 28.51% 28.51% 28.51% 28.51%
3 Book Depreciation Rate 2.31% 2.31% 2.31% 2.45% 2.45% 2.45% 2.45% 2.45% 2.51% 2.51% 2.51%
4 Annual Book Depreciation 30$ 30$ 30$ 32$ 32$ 32$ 32$ 32$ 33$ 33$ 33$ 349
5 Net Book Value at 12-31-21 (956)$
6 Tax Depreciation Rate 3.75% 7.22% 6.68% 6.18% 5.71% 5.29% 4.89% 4.52% 4.46% 4.46% 4.46%
7 Annual Tax Depr (Ln 1 * Ln 6) 49$ 94$ 87$ 81$ 75$ 69$ 64$ 59$ 58$ 58$ 58$
8 Deferred Taxes ((Ln 7 - Ln 4)*Ln 2) 5$ 18$ 16$ 14$ 12$ 11$ 9$ 8$ 7$ 7$ 7$ 114$
9 Amount to be Excluded from Rate Base (842)$
Note:
(1) 11-0721 LTIP Perqs & Awards Final Order Appendix A (477)$
11-0721 LTIP (ComEd Ex 4.5, Schedule B-2.7) (41)
11-0721 LTIP Restricted Stock Final Order Appendix A (787)
Total (1,305)$
Commonwealth Edison Company
Removal of Capitalized Costs Disallowed in ICC Dkt. No. 11-0721 - 2021 Actual
(In Thousands)
Description
(A)
Docket No. 22-____ComEd Ex. 1.02
Page 6 of 176

WP 1
Page 6 of 19
Line Total
No. Amount 2012 2013 2014 2015 2016 2017 2018 2019 2020 2021 Amount
(B) (C) (D) (E) (F) (G) (H) (I) (J) (K) (L) (M)
1 Gross Plant (1) (2,675)$ (2,675)$
2 Tax Rate 28.51% 28.51% 28.51% 28.51% 28.51% 28.51% 28.51% 28.51% 28.51% 28.51%
3 Book Depreciation Rate 2.31% 2.31% 2.45% 2.45% 2.45% 2.45% 2.45% 2.51% 2.51% 2.51%
4 Annual Book Depreciation 62$ 62$ 66$ 66$ 66$ 66$ 66$ 67$ 67$ 67$ 653
5 Net Book Value at 12-31-21 (2,022)$
6 Tax Depreciation Rate 3.75% 7.22% 6.68% 6.18% 5.71% 5.29% 4.89% 4.52% 4.46% 4.46%
7 Annual Tax Depr (Ln 1 * Ln 6) 100$ 193$ 179$ 165$ 153$ 142$ 131$ 121$ 119$ 119$
8 Deferred Taxes ((Ln 7 - Ln 4)*Ln 2) 11$ 37$ 32$ 28$ 25$ 22$ 19$ 15$ 15$ 15$ 219$
9 Amount to be Excluded from Rate Base (1,803)$
Note:
(1) 12-0321 BSC AIP (1,900)$
12-0321 Perqs (14)
12-0321 LTIP (86)
12-0321 Restricted Stock (675)
Total (2,675)$
Commonwealth Edison Company
Removal of Capitalized Costs Disallowed in ICC Dkt. No. 12-0321 - 2021 Actual
(In Thousands)
Description
(A)
Docket No. 22-____ComEd Ex. 1.02
Page 7 of 176

WP 1
Page 7 of 19
Line Total
No. Amount 2012 2013 2014 2015 2016 2017 2018 2019 2020 2021 Amount
(B) (C) (D) (E) (F) (G) (H) (I) (J) (K) (L) (M)
1 Gross Plant (1) (3,354)$ (3,354)$
2 Tax Rate 28.51% 28.51% 28.51% 28.51% 28.51% 28.51% 28.51% 28.51% 28.51% 28.51%
3 Book Depreciation Rate 2.31% 2.31% 2.45% 2.45% 2.45% 2.45% 2.45% 2.51% 2.51% 2.51%
4 Annual Book Depreciation 77$ 77$ 82$ 82$ 82$ 82$ 82$ 84$ 84$ 84$ 816
5 Net Book Value at 12-31-21 (2,538)$
6 Tax Depreciation Rate 3.75% 7.22% 6.68% 6.18% 5.71% 5.29% 4.89% 4.52% 4.46% 4.46%
7 Annual Tax Depr (Ln 1 * Ln 6) 126$ 242$ 224$ 207$ 192$ 177$ 164$ 152$ 150$ 150$
8 Deferred Taxes ((Ln 7 - Ln 4)*Ln 2) 14$ 47$ 40$ 36$ 31$ 27$ 23$ 19$ 19$ 19$ 275$
9 Amount to be Excluded from Rate Base (2,263)$
Note:
(1) BSC AIP Related to Net Income (1,343)$
ComEd AIP Related to Net Income (52)
Perqs and Awards 272
ComEd AIP Greater than 102.9% (1,972)
Pension Assoc with Disallowed Incentive Costs (2) (29)
Payroll Taxes Assoc with Disallowed Incentive Costs (2) (230)
Total (3,354)$
(2) Per Final Order in ICC Docket 13-0318, Appendix A
Commonwealth Edison Company
Removal of Capitalized Costs Disallowed in ICC Dkt. No. 13-0318 - 2021 Actual
(In Thousands)
Description
(A)
Docket No. 22-____ComEd Ex. 1.02
Page 8 of 176

WP 1
Page 8 of 19
Line Total
No. Amount 2013 2014 2015 2016 2017 2018 2019 2020 2021 Amount
(B) (C) (D) (E) (F) (G) (H) (I) (J) (K) (L)
1 Gross Plant (1) (4,505)$ (4,505)$
2 Tax Rate 28.51% 28.51% 28.51% 28.51% 28.51% 28.51% 28.51% 28.51% 28.51%
3 Book Depreciation Rate 2.31% 2.45% 2.45% 2.45% 2.45% 2.45% 2.51% 2.51% 2.51%
4 Annual Book Depreciation 104$ 110$ 110$ 110$ 110$ 110$ 113$ 113$ 113$ 993
5 Net Book Value at 12-31-21 (3,512)$
6 Tax Depreciation Rate 3.75% 7.22% 6.68% 6.18% 5.71% 5.29% 4.89% 4.52% 4.46%
7 Annual Tax Depr (Ln 1 * Ln 6) 169$ 325$ 301$ 278$ 257$ 238$ 220$ 204$ 201$
8 Deferred Taxes ((Ln 7 - Ln 4)*Ln 2) 19$ 61$ 54$ 48$ 42$ 37$ 31$ 26$ 25$ 343$
9 Amount to be Excluded from Rate Base (3,169)$
Note:
(1) BSC AIP Related to Net Income (131)$
Perqs and Awards (132)
ComEd AIP Greater than 102.9% (3,833)
Pension Assoc with Disallowed Incentive Costs (2) (97)
Payroll Taxes Assoc with Disallowed Incentive Costs (2) (312)
Total (4,505)$
(2) Per Final Order in 14-0312, Appendix A
Commonwealth Edison Company
Removal of Capitalized Costs Disallowed in ICC Dkt. No. 14-0312 2021 Actual
(In Thousands)
Description
(A)
Docket No. 22-____ComEd Ex. 1.02
Page 9 of 176

WP 1
Page 9 of 19
Line Total
No. Amount 2014 2015 2016 2017 2018 2019 2020 2021 Amount
(B) (C) (D) (E) (F) (G) (H) (I) (J) (K)
1 Gross Plant (1) (1,360)$ (1,360)$
2 Tax Rate 28.51% 28.51% 28.51% 28.51% 28.51% 28.51% 28.51% 28.51%
3 Book Depreciation Rate 2.45% 2.45% 2.45% 2.45% 2.45% 2.51% 2.51% 2.51%
4 Annual Book Depreciation 33$ 33$ 33$ 33$ 33$ 34$ 34$ 34$ 267
5 Net Book Value at 12-31-21 (1,093)$
6 Tax Depreciation Rate 3.75% 7.22% 6.68% 6.18% 5.71% 5.29% 4.89% 4.52%
7 Annual Tax Depr (Ln 1 * Ln 6) 51$ 98$ 91$ 84$ 78$ 72$ 67$ 61$
8 Deferred Taxes ((Ln 7 - Ln 4)*Ln 2) 5$ 19$ 16$ 15$ 13$ 11$ 9$ 8$ 96$
9 Amount to be Excluded from Rate Base (997)$
Note:
(1) Perqs and Awards (2) (361)
Payroll Taxes Assoc with Perqs and Awards (2) (28)
Pcard Adjustments (2) (14)
Pension Assoc with Previously Disallowed Incentive Costs (2) (178)
Credit Card Expenditures (ICC Staff Ex. 6.0, Sch 6.03, Pg.2) (23)
ComEd 401k Profit Sharing (See Final Order Appendix A) (756)
Total (1,360)$
(2) See Compliance Filing ICC Docket 15-0287, Work Paper 1
Commonwealth Edison Company
Removal of Capitalized Costs Disallowed in ICC Dkt. No. 15-0287 - 2021 Actual
(In Thousands)
Description
(A)
Docket No. 22-____ComEd Ex. 1.02 Page 10 of 176

WP 1
Page 10 of 19
Commonwealth Edison Company
Removal of Capitalized Costs Disallowed in ICC Dkt. No. 16-0259 - 2021 Actual
(In Thousands)
Line 2015 2016 2017 2018 2019 2020 2021 Total
No. Description Amount Amount Amount Amount Amount Amount Amount Amount Amount
(B) (C) (D) (E) (F) (G) (H) (I) (J)
1 Gross Plant (1) (8,645)$ (8,645)$
2 Tax Rate 28.51% 28.51% 28.51% 28.51% 28.51% 28.51% 28.51%
3 Book Depreciation Rate 2.45% 2.45% 2.45% 2.45% 2.51% 2.51% 2.51%
4 Annual Book Depreciation 212$ 212$ 212$ 212$ 217$ 217$ 217$ 1,499
5 Net Book Value at 12-31-21 (7,146)$
6 Tax Depreciation Rate 3.75% 7.22% 6.68% 6.18% 5.71% 5.29% 4.89%
7 Annual Tax Depr (Ln 1 * Ln 6) 324$ 624$ 577$ 534$ 494$ 457$ 423$
8 Deferred Taxes ((Ln 7 - Ln 4)*Ln 2) 32$ 117$ 104$ 92$ 79$ 69$ 59$ 552$
9 Amount to be Excluded from Rate Base (6,594)$
Note:
(1) Perqs and Awards 12
Payroll Taxes Assoc with Perqs and Awards (2) -
Pcard Adjustments (37)
Pension Assoc with Previously Disallowed Incentive Costs (2) (90)
OSHA AIP removal (4) (5,777)
Employee Recognition (3) (3)
Removal of 2016 401K Profit Sharing Match (3) (2,750)
Total (8,645)$
(2) Per Final Order in 13-0318, Appendix A.
(3) Per Final Order in 16-0259
(4) Per Final Order in 16-0259 on Rehearing
(A)
Docket No. 22-____ComEd Ex. 1.02 Page 11 of 176

WP 1
Page 11 of 19
Line Total
No. Amount 2016 2017 2018 2019 2020 2021 Amount
(B) (C) (D) (E) (F) (G) (H) (I)
1 Gross Plant (1) (209)$ (209)$
2 Tax Rate 28.51% 28.51% 28.51% 28.51% 28.51% 28.51%
3 Book Depreciation Rate 2.45% 2.45% 2.45% 2.51% 2.51% 2.51%
4 Annual Book Depreciation 5 5 5 5 5 5 30
5 Net Book Value at 12-31-21 (179)$
6 Tax Depreciation Rate 3.75% 7.22% 6.68% 6.18% 5.71% 5.29%
7 Annual Tax Depr (Ln 1 * Ln 6) 8$ 15$ 14$ 13$ 12$ 11$
8 Deferred Taxes ((Ln 7 - Ln 4)*Ln 2) 1$ 3$ 3$ 2$ 2$ 2$ 13
9 Amount to be Excluded from Rate Base (166)$
Note:
(1) Perqs and Awards (24)$
Payroll Taxes Assoc with Perqs and Awards (1)
Pcard Adjustments (67)
Pension Assoc with Previously Disallowed Incentive Costs (103)
Recognition Adjustments (14)
Total (209)$
Commonwealth Edison Company
Removal of Capitalized Costs Disallowed in ICC Dkt. No. 17-0196 - 2021 Actual
(In Thousands)
Description
(A)
Docket No. 22-____ComEd Ex. 1.02 Page 12 of 176

WP 1
Page 12 of 19
Line Total
No. Amount 2017 2018 2019 2020 2021 Amount
(B) (C) (D) (E) (F) (G) (H)
1 Gross Plant (1) (402)$ (402)$
2 Tax Rate 28.51% 28.51% 28.51% 28.51% 28.51%
3 Book Depreciation Rate 2.45% 2.45% 2.51% 2.51% 2.51%
4 Annual Book Depreciation 10 10 10 10 10 50
5 Net Book Value at 12-31-21 (352)$
6 Tax Depreciation Rate 3.75% 7.22% 6.68% 6.18% 5.71%
7 Annual Tax Depr (Ln 1 * Ln 6) 15$ 29$ 27$ 25$ 23$
8 Deferred Taxes ((Ln 7 - Ln 4)*Ln 2) 1$ 5$ 5$ 4$ 4$ 19
9 Amount to be Excluded from Rate Base (333)$
Note:
(1) Retention Awards (101)$
Performance Awards (181)
Payroll Taxes Associated with Retention and Performance Awards (20)
Pension Assoc with Previously Disallowed Incentive Costs (36)
P Card and Recognition Adjustments (64)
Total (402)$
Commonwealth Edison Company
Removal of Capitalized Costs Disallowed in ICC Dkt. No. 18-0808 - 2021 Actual
(In Thousands)
Description
(A)
Docket No. 22-____ComEd Ex. 1.02 Page 13 of 176

WP 1
Page 13 of 19
Line Total
No. Amount 2018 2019 2020 2021 Amount
(B) (C) (D) (E) (F) (G)
1 Gross Plant (1) (900)$ (900)$
2 Tax Rate 28.51% 28.51% 28.51% 28.51%
3 Book Depreciation Rate 2.45% 2.51% 2.51% 2.51%
4 Annual Book Depreciation 22 23 23 23 91
5 Net Book Value at 12-31-21 (809)$
6 Tax Depreciation Rate 3.75% 7.22% 6.68% 6.18%
7 Annual Tax Depr (Ln 1 * Ln 6) 34$ 65$ 60$ 56$
8 Deferred Taxes ((Ln 7 - Ln 4)*Ln 2) 3$ 12$ 11$ 9$ 35
9 Amount to be Excluded from Rate Base (774)$
Note:
(1) Retention Awards 47$
Performance Awards (659)
Payroll Taxes Associated with Retention and Performance Awards (44)
Pension Assoc with Previously Disallowed Incentive Costs (41)
P Card and Recognition Adjustments (117)
EE Long Term Incentive Compensation (86)
Total (900)$
Commonwealth Edison Company
Removal of Capitalized Costs Disallowed in ICC Dkt. No. 19-0387 - 2021 Actual
(In Thousands)
Description
(A)
Docket No. 22-____ComEd Ex. 1.02 Page 14 of 176

WP 1
Page 14 of 19
Line 2019 2020 2021 Total
No. Amount Amount Amount Amount Amount
(B) (C) (D) (E) (F)
1 Gross Plant (1) (495)$ (495)$
2 Tax Rate 28.51% 28.51% 28.51%
3 Book Depreciation Rate 2.51% 2.51% 2.51%
4 Annual Book Depreciation 12$ 12$ 12$ 36
5 Net Book Value at 12-31-21 (459)$
6 Tax Depreciation Rate 3.75% 7.22% 6.68%
7 Annual Tax Depr (Ln 1 * Ln 6) 19$ 36$ 33$
8 Deferred Taxes ((Ln 7 - Ln 4)*Ln 2) 2$ 7$ 6$ 15$
9 Amount to be Excluded from Rate Base (444)$
Note:
(1) Retention Awards 75$
Performance Awards (341)
Payroll Taxes Associated with Retention and Performance Awards (20)
Pension Assoc with Previously Disallowed Incentive Costs (65)
P Card and Recognition Adjustments (144)
Total (495)$
Commonwealth Edison Company
Removal of Capitalized Costs Disallowed in ICC Dkt. No. 20-0393 - 2021 Actual
(In Thousands)
Description
(A)
Docket No. 22-____ComEd Ex. 1.02 Page 15 of 176

WP 1
Page 15 of 19
Line 2020 2021 Total
No. Amount Amount Amount Amount
(B) (C) (D) (E)
1 Gross Plant (1) (485)$ (485)$
2 Tax Rate 28.51% 28.51%
3 Book Depreciation Rate 2.51% 2.51%
4 Annual Book Depreciation 12$ 12$ 24
5 Net Book Value at 12-31-21 (461)$
6 Tax Depreciation Rate 3.75% 7.22%
7 Annual Tax Depr (Ln 1 * Ln 6) 18$ 35$
8 Deferred Taxes ((Ln 7 - Ln 4)*Ln 2) 2$ 7$ 9$
9 Amount to be Excluded from Rate Base (452)$
Note:
(1) Retention Awards 56$
Performance Awards (415)
Payroll Taxes Associated with Retention and Performance Awards (26)
Pension Assoc with Previously Disallowed Incentive Costs (18)
P Card and Recognition Adjustments (82)
Total (485)$
Commonwealth Edison Company
Removal of Capitalized Costs Disallowed in ICC Dkt. No. 21-0367 - 2021 Actual
(In Thousands)
Description
(A)
Docket No. 22-____ComEd Ex. 1.02 Page 16 of 176

WP 1
Page 16 of 19
Commonwealth Edison Company
Rider EEPP Assets - 2021 Actual
(In Thousands)
Line Switches Street Light
No. Amount (1) Amount Total ICC Acct
(B) (C) (D) (E)
1 Rider EEPP Assets
2 Gross Cost (3,269)$ (35,277)$ (38,546)$ 101
3 Accumulated Reserve 940 1,711 2,651 108
4 Accumulated Deferred Income Taxes (ADIT) 765 4,416 5,181
5 Net Plant for Rider EEPP Assets at 12/31/21 (1,564)$ (29,150)$ (30,714)$
6 Annual Book Depreciation (82)$ (764)$ (846)$ 403
Note:
(1) Represents switches placed in service since June 2008 that were formally recovered through Rider EDA
and are now recovered through Rider EEPP.
Description
(A)
Docket No. 22-____ComEd Ex. 1.02 Page 17 of 176

WP 1
Page 17 of 19
Commonwealth Edison Company
Removal of Capitalized Purchase of Receivable Combined Billing Software (PORCB)
Line
No. Total ICC Acct
(B) (C)
1 Removal of PORCB
2 Gross Plant (16,505)$ 101
3 Accumulated Depreciation 16,505 108
4 Deferred Income Taxes - 283
5 Amount Included in Rate Base -$
6 Annual Book Depreciation -$
(In Thousands)
Description
(A)
Docket No. 22-____ComEd Ex. 1.02 Page 18 of 176

WP 1
Page 18 of 19
Commonwealth Edison Company
2021 Supply Administration Intangible Assets
(In Thousands)
Line
No. Amount ICC Acct
(B) (C)
1 Adjustment to Intangible Plant (1)
2 Plant in Service as of 12-31-2021 (3,769)$ 101
3 Accumulated Reserve as of 12-31-2021 3,769$ 108
4 Accumulated Deferred Income Taxes (ADIT) - 283
5 Net Plant Adjustment -$
6 2021 Depreciation Expense Adjustment -$
Note:
(1) Represents Supply Administration software assets recovered through Rider PE.
Description
(A)
Docket No. 22-____ComEd Ex. 1.02 Page 19 of 176

WP 1
Page 19 of 19
Line 2021 Total
No. Amount Amount Amount
(B) (C) (D)
1 Gross Plant (1) (821)$ (821)$
2 Tax Rate 28.51%
3 Book Depreciation Rate 2.51%
4 Annual Book Depreciation 21$ 21
5 Net Book Value at 12-31-21 (800)$
6 Tax Depreciation Rate 3.75%
7 Annual Tax Depr (Ln 1 * Ln 6) 31$
8 Deferred Taxes ((Ln 7 - Ln 4)*Ln 2) 3$ 3$
9 Amount to be Excluded from Rate Base (797)$
Note:
(1) Retention Awards (35)$
Performance Awards (624)
Payroll Taxes Associated with Retention and Performance Awards (49)
Pension Assoc with Previously Disallowed Incentive Costs (20)
P Card and Recognition Adjustments (93)
Total (821)$
Commonwealth Edison Company
Removal of Capitalized Items Disallowed and Adjusted for in 2021 Test Year
(In Thousands)
Description
(A)
Docket No. 22-____ComEd Ex. 1.02 Page 20 of 176

WP 2
Page 1 of 1
Commonwealth Edison CompanyCustomer Deposits (1)
Balance as of December 31, 2021
Line
No. Account ID
Account
Description Amount
(A) (B) (C)
1 235000 Customer Deposits (99,161,842)$
Note:
(1) ComEd 2021 FERC Form 1, Page 112, Line 41.
Docket No. 22-____ComEd Ex. 1.02 Page 21 of 176

WP 3
Page 1a of 8
Line
No. Description Amount Source
(A) (B) (C)
1 Total Operating Revenues 2,894,371$ Schedule FR A-1 REC Ln 21
2 Less: Uncollectible Accounts - No longer Collected in DST
3 Less: Depreciation & Amortization (785,281) Schedule FR A-1 REC Ln 5
4 Less: Regulatory Debits (68,206) Schedule FR A-1 REC Ln 8
5 Less: Pension Asset Cost Funding (27,220) Schedule FR A-1 REC Ln 9
6 Less Deferred Taxes and ITC (156,076) Page 5, Col B, Line10
7 Less: City of Chicago Dark Fiber Tax - N/A
8 Less: Return on Equity (496,386) From line 12 below * -19 Total Receipts for CWC calculation 1,361,202$ Calculation
10 Rate Base 12,893,152$ Schedule FR A-1 REC Ln 12
11 Equity Weighted Component 3.85% Schedule FR D-1, Column D, Line 1712 Return on Equity 496,386$ Calculation
13 Other O & M Expenses 2,016,216$ Schedule FR A-1 REC Ln 11
14 Payroll and Withholdings (290,644) Minus Line 31 below plus line 30 below
15 Inter Company Billings (230,916) WP3 p.7, line 16
16 Inter Company Billings - Pass throughs (70,117) WP3 p.7, line 34
17 Employee Benefits Expense - Pension and OPEB (49,332) WP3 p.3, line 15
18 Employee Benefits Expense - Other (55,290) From Line 33 below
19 Uncollectible Accounts - From line 2 above
20 Depreciation and Amortization (785,281) From line 3 above
21 Regulatory Debits (68,206) From line 4 above
22 Pension Asset Cost Funding (27,220) From line 5 above
23 Taxes Other than Income Taxes (161,308) Schedule FR A-1 REC Ln 7
24 Property Leases (28,620) WP3 p.6, line 7
25 Other Operations & Maintenance 249,282$ Calculation
26 Payroll and Withholdings - Total 340,450$ WP3 p.2 (Sch C-11.1), line 8
27 Less: Power Production (1,124) WP3 p.2 (Sch C-11.1), line 2
28 Less: Transmission (43,121) WP3 p.2 (Sch. C-11.1), line 3
28a Less: A&G Wages (5,472) WP3 p.2 (Sch. C-11.1), line 7*(1-W&S Allocator)
29 Less: Payroll Taxes on Supply (89) WP3 p.4, line 18
30 Less: Net Incentive Pay (35,182) From line 32 below
31
Payroll and Withholdings - Distribution, Customer Accts
and A&G 255,462$ Calculation
32 Net Incentive Pay 35,182$ WP3 p.8, line 20
33 Employee Benefits - Other 55,290$ WP3 p.3, line 20
34 Other Outlays - Jurisdictional Amount 878$ Page 4, Ln 15 & 16
35 Lead Time (45.63) Docket 20-0393, ComEd Ex. 2.0
36 CWC Factor (0.12501) Line 35 / 365 Days37 Rate Base Adjustment to ComEd Ex 1.0, App 3, Ln 36 (110)$ Line 34 * Ln 36
Commonwealth Edison Company
Cash Working Capital
Calendar Year 2021
(In Thousands)
Docket No. 22-____ComEd Ex. 1.02 Page 22 of 176

WP 3
Page 1b of 8
Line
No. Description Amount Source
(A) (B) (C)
1 Total Operating Revenues 3,020,600$ Schedule FR A-1 Ln 21
2 Less: Uncollectible Accounts - No longer Collected in DST
3 Less: Depreciation & Amortization (831,998) Schedule FR A-1 Ln 5 + Ln 6
4 Less: Regulatory Debits (68,206) Schedule FR A-1 Ln 8
5 Less: Pension Asset Cost Funding (27,220) Schedule FR A-1 Ln 9
6 Less Deferred Taxes and ITC (156,076) Page 5, Col C, Line10
7 Less: City of Chicago Dark Fiber Tax -
8 Less: Return on Equity (538,656) From line 12 below9 Total Receipts for CWC calculation 1,398,444$ Calculation
10 Rate Base 13,882,888$ Schedule FR A-1 Ln 12
11 Equity Weighted Component 3.88% Schedule FR D-1, Column C, Line 1712 Return on Equity 538,656$ Calculation
13 Other O & M Expenses 2,062,933$ Schedule FR A-1 Ln 11
14 Payroll and Withholdings (290,644) Minus Line 31 below plus line 30 below
15 Inter Company Billings (230,916) WP3 p.7, line 16
16 Inter Company Billings - Pass throughs (70,117) WP3 p.7, line 34
17 Employee Benefits Expense - Pension and OPEB (49,332) WP3 p.3, line 15
18 Employee Benefits Expense - Other (55,290) From Line 33 below
19 Uncollectible Accounts - From line 2 above
20 Depreciation and Amortization (831,998) From line 3 above
21 Regulatory Debits (68,206) From line 4 above
22 Pension Asset Cost Funding (27,220) From line 5 above
23 Taxes Other than Income Taxes (161,309) Schedule FR A-1 Ln 7
24 Property Leases (28,620) WP3 p.6, line 7
25 Other Operations & Maintenance 249,281$ Calculation
26 Payroll and Withholdings - Total 340,450$ WP3 p.2 (Sch C-11.1), line 8
27 Less: Power Production (1,124) WP3 p.2 (Sch C-11.1), line 2
28 Less: Transmission (43,121) WP3 p.2 (Sch. C-11.1), line 3
28a Less: A&G Wages (5,472) WP3 p.2 (Sch. C-11.1), line 7*(1-W&S Allocator)
29 Less: Payroll Taxes on Supply (89) WP3 p.4, line 18
30 Less: Net Incentive Pay (35,182) From line 32 below
31
Payroll and Withholdings - Distribution, Customer Accts
and A&G 255,462$ Calculation
32 Net Incentive Pay 35,182$ WP3 p.8, line 20
33 Employee Benefits - Other 55,290$ WP3 p.3, line 20
34 Other Outlays - Jurisdictional Amount 878$ Page 4, Ln 15 & 16
35 Lead Time (45.63) Docket 20-0393, ComEd Ex. 2.0
36 CWC Factor (0.12501) Line 35 / 365 Days37 Rate Base Adjustment to ComEd Ex 1.0, App 3, Ln 76 (110)$ Line 34 * Ln 36
Commonwealth Edison Company
Cash Working Capital
Filing Year 2022
(In Thousands)
Docket No. 22-____ComEd Ex. 1.02 Page 23 of 176

WP 3
Page 2 of 8
Line
No. Amounts Charged To: 2021
(A) (B)
1 Operation & Maintenance Expense:
2 Power Production 1,124$
3 Transmission 43,121
4 Distribution 160,786
5 Customer Accounts 92,726
6 Sales 5,213
7 Administrative & General 37,480
8 Total Charged To Expense 340,450$
Note:
(1) From FERC Form 1, Pages 354.
Commonwealth Edison Company
Direct Payroll By Function (1)
(In Thousands)
Docket No. 22-____ComEd Ex. 1.02 Page 24 of 176

WP 3
Page 3 of 8
Line Employee Total Amount Percentage Amount Percentage
No. Benefit Types Classification Benefit Cost Expensed Expensed Capitalized Capitalized
(A) (B) (C) (D) (E) (F) (G)
1 Pension Benefit Salaried, Union 115,291$ 51,004$ 44.20% 64,288$ 55.80%
2 Post-Retirement Benefits Salaried, Union 15,410 6,762 43.90% 8,648 56.10%
3 Medical Insurance Plan Salaried, Union 88,081 38,892 44.20% 49,189 55.80%
4 Dental Insurance Plan Salaried, Union 5,129 2,264 44.10% 2,864 55.80%
5 Vision Insurance Plan Salaried, Union 522 231 44.30% 292 55.90%
6 Other Benefit Plans Salaried, Union 11,086 5,488 49.50% 5,598 50.50%
7 401 K Benefit Plan Salaried, Union 35,193 15,505 44.10% 19,688 55.90%
8 Disability Benefit Plan Salaried, Union 875 386 44.10% 489 55.90%
9 Severance Salaried, Union 1,976 1,976 100.00% - 0.00%
10 Total 2021 273,563$ 122,508$ 44.80% 151,056$ 55.20%
11 Pension Benefit 51,004$
12 Post-Retirement Benefits 6,762
13 57,766
14 Wages and Salaries Allocator - Formula Sch FR A-2 85.40%15 Employee Benefits - Pension and OPEB 49,332$ To WP 3, Page 1, Line 17
16 Total 122,508$
17 Less Pension and OPEB (57,766)
18 Other 64,742
19 Wages and Salaries Allocator - Formula Sch FR A-2 85.40%20 Other 55,290$ To WP 3, Page 1, Line 33
Commonwealth Edison Company
Employee Benefits
2021 Actual
(In Thousands)
Docket No. 22-____ComEd Ex. 1.02 Page 25 of 176

WP 3
Page 4 of 8
Line Total Jurisdictional
No. Description Company Allocator Jurisdictional
(A) (B) (C ) (D)
1 Taxes Other Than Income Taxes - Account 236
2 Infrastructure Maintenance Fee 87,479$ 0% -$
3 Rider RCA - Low Income Assistance 44,195 0% -
4 Rider RCA - Renewable Energy 4,607 0% -
5 Property Taxes 37,911 61.11% 23,167
6 Illinois Electricity Distribution Tax 109,428 100% 109,428
7 Public Utilities Fund 4,391 100% 4,391
8 Federal Unemployment Insurance Tax (FUTA) 119 85.40% 102
9 Federal Insurance Contributions Tax (FICA) 25,347 85.40% 21,647
10 State Unemployment Insurance Tax (SUTA) 391 85.40% 334
11 State Use Tax on Purchases 42 77.71% 33
12 Chicago Sales and Use Taxes (20) 77.71% (16)
13 State Franchise Tax 2,925 77.71% 2,273
14 Heavy Vehicle Use tax 1 77.71% 1
15 Other Outlays 294 77.71% 228
16 Municipal Utility Tax 42 100.00% 42
17 Miscellaneous 783 77.71% 608
18 Evanston IMF 505 0.00% -
19 Total - Account 236 318,440$ 162,238$
20 Payroll Taxes Recovered Under Rider PE (89)
21 Other Payroll Tax Adjustments from App 7 (841)
22 Total Jurisdictional Taxes Other than Income 161,308$
23 Taxes Other Than Income Taxes - Account 241
24 Municipal Utility Tax 272,632$
25 Electricity Excise Tax 249,999
26 Total - Account 241 522,631$
Commonwealth Edison Company
Taxes Other Than Income Taxes
2021 Actual
(In Thousands)
Docket No. 22-____ComEd Ex. 1.02 Page 26 of 176

WP 3
Page 5 of 8
Commonwealth Edison Company
Jurisdictional Operating Statement
For the Year 2021
(In Thousands)
Line
No. Description Rate Year Filing Year
(A) (B) (C)
1 Rev Requirement: FR A-1 Rec Ln 23 / FR FR A-1 Ln 23 2,733,799$ 2,860,028$
2 Electric Operating Expenses FR A-1 Rec Ln 11 / FR A-1 Ln 11 (2,016,216) (2,062,933)
3
Int Sync: RY (Rate Base A-1 Rec Ln 12 * Wtd Cost of LT and ST Debt FR C-4 Ln 16 * -1)
Int Sync: FY (Rate Base A-1 Ln 12 * Wtd Cost of LT and ST Debt FR C-4 Ln 16 * -1) (265,599) (285,987)
4 Other Revenues FR A-1 Rec Ln 22 160,572 160,572
5 Total Electric Taxable Income (Sum Lines 1-4) 612,556$ 671,680$
6 Tax Rate - Sch C-4, Ln 4 28.505% 28.505%
7 Income Taxes Before Permanent Differences (Line 5 * Line 6) 174,609$ 191,462$
8 Permanent Tax Items Before Gross Up App 9 Ln 13 (58,439) (58,439)
9 Total Jurisdictional Current Income Taxes (Ln 7 + Ln 8) 116,170$ 133,023$
10 Jurisdictional Deferred Tax Expense and ITC Amort 156,076 156,076
11 Total Income Tax Expense (Ln 9 - Ln 10) (39,906)$ (23,053)$
12 Federal Portion of Ln 11 (26,606)$ (15,370)$
13 State Portion of Ln 11 (13,300)$ (7,683)$
Docket No. 22-____ComEd Ex. 1.02 Page 27 of 176
WP 3
Page 6 of 8
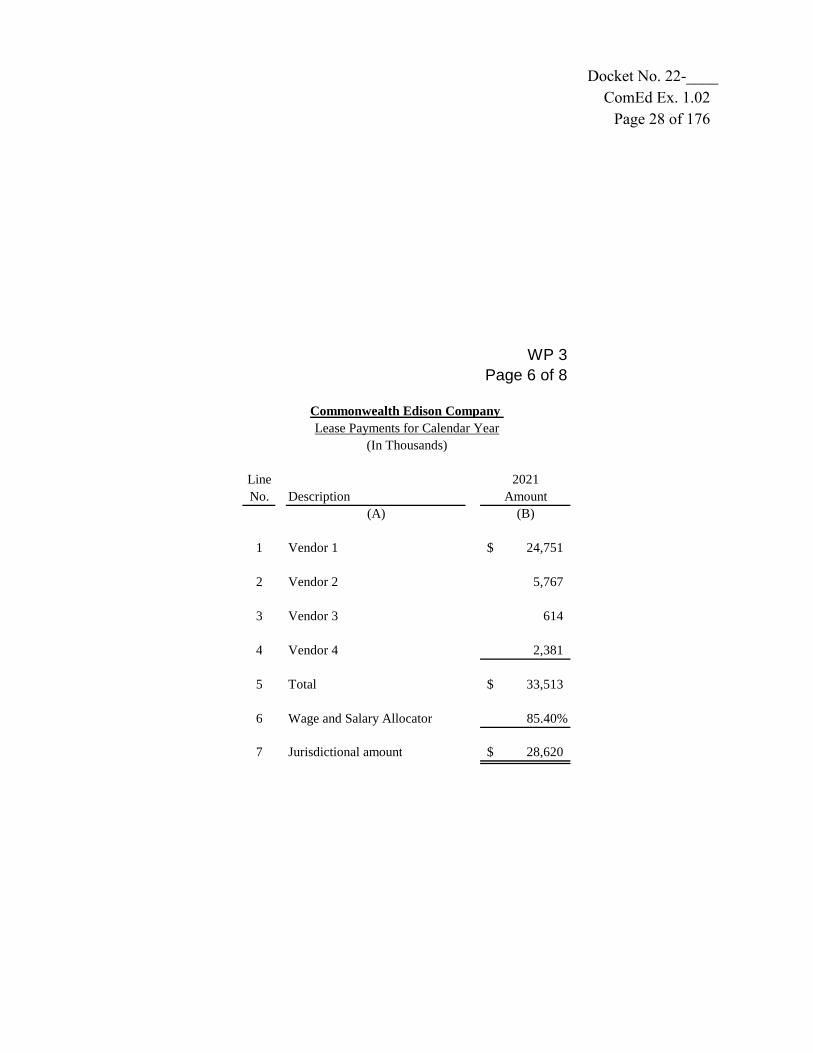
Line 2021
No. Description Amount
(A) (B)
1 Vendor 1 24,751$
2 Vendor 2 5,767
3 Vendor 3 614
4 Vendor 4 2,381
5 Total 33,513$
6 Wage and Salary Allocator 85.40%
7 Jurisdictional amount 28,620$
Commonwealth Edison Company
Lease Payments for Calendar Year
(In Thousands)
Docket No. 22-____ComEd Ex. 1.02 Page 28 of 176

WP 3
Page 7 of 8
Line
No. Affiliated Company Description of Service 2021 Amount Allocator Jurisdictional Comments
(A) (B) (C ) (D) (E) (F)
1
2 30.77% Capital
3 3.58% Other
4 65.65% O&M
5 44.80% Benefits Expense Allocator (from WP3 p.3)
6 85.40% Wage & Salaries (W & S) Allocator
7 ComEd is Recipient of Services
8 Exelon Business Services Company Direct Bill 149,957,064 65.65% 98,446,813 BSC O&M Direct Costs
9 Exelon Business Services Company Indirect Bill 360,531,675 65.65% 236,689,045 BSC O&M Indirect Costs
10 335,135,858 BSC O&M Costs
11 85.40% Wages and Salaries Allocator
12 286,206,023 Jurisdictional BSC O&M
13 (55,290,000) Benefits Other than Pensions and OPEB (from WP3 p.3)
14 230,916,023
15 - Other Adjustments
16 230,916,023 Inter Company Billings (Excluding Pass throughs)
17 ComEd is Recipient of Pass-Through Transactions
18 Exelon Business Services Company Cash Balancing 115,368 100.00% 115,368 Nature of Transaction
19 Exelon Business Services Company Compensation 12,749,988 38.26% 4,878,043 Benefits Allocator times W & S Allocator
20 Exelon Business Services Company Contracting 26,805,824 85.40% 22,892,174 Wage & Salaries Allocator
21 Exelon Business Services Company Pension 4,268,793 85.40% 3,645,550 Wage & Salaries Allocator
22 Exelon Business Services Company Escheatment Related 2,112,897 100.00% 2,112,897 Nature of Transaction
23 Exelon Business Services Company Information Technology 7,523,293 85.40% 6,424,892 Wage & Salaries Allocator
24 Exelon Business Services Company Materials 5,511,208 0.00% - Nature of Transaction
25 Exelon Business Services Company Office Supplies 977,733 85.40% 834,984 Wage & Salaries Allocator
26 Exelon Business Services Company Other 10,768,851 85.40% 9,196,599 Wage & Salaries Allocator
27 Exelon Business Services Company Purchase Cards 10,225,144 56.07% 5,732,737 BSC O&M Ratio times W & S Allocator
28 Exelon Business Services Company Human Resources 213,883 85.40% 182,656 Wage & Salaries Allocator
29 Exelon Business Services Company Telecommunication 13,382,642 85.40% 11,428,776 Wage & Salaries Allocator
30 Exelon Business Services Company Worker's Compensation 4,921,430 38.26% 1,882,900 Benefits Allocator times W & S Allocator
31 Exelon Business Services Company Real Estate - 77.71% - Net Plant Allocator
32 Exelon Business Services Company Equipment Rentals/Leases 923,997 85.40% 789,093 Wage & Salaries Allocator
33 Exelon Business Services Company Stock Compensation 4,614,149 0.00% - Nature of Transaction
34 70,116,669 Inter Company Billings - Pass throughs
2021 BSC Charges Distributed Ratios:
Commonwealth Edison Company
ICC Form No. 21 Supplemental Schedule
Summary of Service Transactions with Affiliates
Year 2021
Docket No. 22-____ComEd Ex. 1.02 Page 29 of 176

WP 3
Page 8 of 8
Line
No. Item Total Juris %
Juris O&M
Amount Note
(A) (B) (C) (D) (E)
1 ComEd Employee AIP included in Docket No. 22-XXXX:
2 Capital 46,524$
3 Handling/Clearing/Misc 1,197 77.71% 930
4 Non-Utility Expenses 933 0% -
5 Production O&M 130 0% -
6 Transmission O&M 4,022 0% -
7 Distribution/Customer O&M 22,854 100.00% 22,854
8 A&G O&M 8,475 85.40% 7,238
9 Grand Total 84,135$ 31,022$
2021 AIP Costs charged to DS O&M and
included in Docket No 22-XXXX
10 ComEd CEO AIP included in Docket No. 22-XXXX: -
2021 AIP Costs charged to DS O&M and
included in Docket No 22-XXXX (1)
11 LTPP included in Docket No. 22-XXXX:
12 Capital 2,625$
13 Handling/Clearing/Misc - 77.71% -
14 Non-Utility Expenses 64 0% -
15 Production O&M 20 0% -
16 Transmission O&M 613 0% -
17 Distribution/Customer O&M 3,449 100.00% 3,449
18 A&G O&M 832 85.40% 711
19 Grand Total 7,603$ 4,160$
2021 LTPP Costs charged to DS O&M and
included in Docket No 22-XXXX
20 Total Incentive Costs for CWC Analysis 35,182$ 2021 Incentive Pay for CWC
Note:
(1) ComEd CEO AIP is fully removed within the Executive Compensation exclusion on WP 7.
2021 Incentive Costs
For Cash Working Capital
(In Thousands)
Commonwealth Edison Company
Docket No. 22-____ComEd Ex. 1.02 Page 30 of 176

WP 4
Page 1 of 2Commonwealth Edison Company
Accumulated Deferred Income Taxes
Actual 2021
(In Thousands)
Line
No. Account / Item - Debit / (Credit) Balance Federal State Total Allocator Percentage
Total
= (D) * (F)
(A) (B) (C) (D) (E) (F) (G)
Summary
1 Total ADIT - Jurisdictional Excluding the Pension Asset (Page 3, Line 136) (4,962,516)$
2 ADIT Associated with Pension Asset (298,788)$
3 Account 190 - (EPS Accts. 283150 & 283250 & 283350 & 283450) --
4 Accrued Holiday (69)$ 23$ (46)$ Wages & Salaries 85.40% (39)$
5 Accrued Vacation 7,834 2,771 10,605 Wages & Salaries 85.40% 9,057$
6 Accrued Legal 13 2 15 Wages & Salaries 85.40% 13$
7 Charitable Contributions 1,975 - 1,975 Non-DST 0.00% -$
8 Obsolete Materials 1,518 627 2,146 Net Plant 77.71% 1,667$
9 Provision for Bad Debt 20,854 7,583 28,437 Revenue 50.98% 14,497$
10 Damage to Company Property 1,164 501 1,665 Net Plant 77.71% 1,294$
11 Taxes Other than Income Taxes 492 246 738 Net Plant 77.71% 573$
12 Incentive Compensation Plan 3,367 (1,124) 2,243 Wages & Salaries 85.40% 1,916$
13 Liability for Severance Plans 472 180 652 Wages & Salaries 85.40% 557$
14 CPS Energy Efficiency Fund 352 - 352 Non-DST 0.00% -$
15 Other Accrued Expenses 5,812 2,866 8,678 Non-DST 0.00% -$
16 Other Current 2,539 933 3,472 Wages & Salaries 85.40% 2,965$
17 Partnerships 804 241 1,045 Non-DST 0.00% -$
18 Deferred Rental Expense 58 (30) 29 Wages & Salaries 85.40% 24$
19 Environmental Cleanup Costs - Non-MGP (Mfg Gas Plants) 150 31 181 DST 100.00% 181$
20 Executive Uninsured Death Benefits after Retirement 492 176 669 Wages & Salaries 85.40% 571$
21 Deferred on Unamoritzed ITC (39,313) 1,522 (37,791) Non-DST 0.00% -$
22 Federal NOL-Depreciation - - - Net Plant 77.00% -$
23 Federal NOL DTA-Exclusion - - - Non-DST 0.00% -$
24 Incentive Compensation Deferred Stock Bonus Plan 105 (9) 96 Non-DST 0.00% -$
25 Stock Options; Other Equity Based Compensation 2,059 144 2,203 Non-DST 0.00% -$
26 Workers Compensation and Public Claims Reserve 18,705 7,697 26,402 Wages & Salaries 85.40% 22,548$
27 Long-Term Debt - Revaluation of Discount (53) 5 (47) Non-DST 0.00% -$
28 Management Deferred Compensation Plan 7,312 2,727 10,039 Wages & Salaries 85.40% 8,573$
29 Manufactured Gas Plants - Provision 88,960 26,061 115,021 Non-DST 0.00% -$
30 Merger Costs (266) 2 (264) Non-DST 0.00% -$
31 Post Retirement Health Care Liability 43,226 14,701 57,928 Wages & Salaries 85.40% 49,470$
32 Revenue Subject to Refund - - - Non-DST 0.00% -$
33 Supplemental Employee Retirement Plan 668 206 874 Non-DST 0.00% -$
34 Long-Term Incentive - Cash 19,883 9,994 29,876 Wages & Salaries 85.40% 25,514$
35 Midwest Generation Settlement Asset 680 - 680 Non-DST 0.00% -$
36 Interest on Projected Tax Settlements (391) 43 (348) Non-DST 0.00% -$
37 Use Tax Adjustment 595 307 902 Net Plant 77.71% 701$
38 Regulatory (Asset)/Liab: Docket No 07-0566 (1) 3 2 DST 100.00% 2$
39 Regulatory (Asset)/ Liab: Transmission 621 690 1,311 Non-DST 0.00% -$
40 Regulatory (Asset)/Liab: 2011 IL State Tax Rate Change 2,023 2,761 4,785 Non-DST 0.00% -$
41 Alt Fuels Tax Credit CF - - - Net Plant 77.71% -$
42 R&D Credit CF - - - Wages & Salaries 85.40% -$
43 Payroll Taxes Accrued 2,734 1,367 4,101 Non-DST 0.00% -$
44 Public Utility Fund 254 127 381 Non-DST 0.00% -$
45 2017 IL Rate Change - 190 (2,143) 4,393 2,250 Non-DST 0.00% -$
46 2017 IL Rate Change - 190 Gross Up - - - Non-DST 0.00% -$
47 2017 Fed Rate Change - 190 (51,794) - (51,794) Non-DST 0.00% -$
48 2017 Fed Rate Change - 190 Gross Up 15,813 6,664 22,477 Non-DST 0.00% -$
49 Total Account 190
(FERC Form 1, Page 111, Line 82) 157,508$ 94,431$ 251,939$ 140,086$
50 Account 282 - Liberalized Deprec. - Plant & Equip. Accts 282000 & 282200
51 Total Account 282 - Liberalized Depreciation (3,664,958) (791,336) (4,456,293)$ Net Plant 77.71% (3,462,986)$
52 Account 282 - Other Property (Accts. 282100 & 282300) --
53 Competitive Transition Charge (CTC) (9,112) (1,330) (10,443)$ Non-DST 0.00% -$
54 AFUDC Plant & Equip Borrowed (27,661) (7,933) (35,594)$ Net Plant 77.71% (27,660)$
55 Deferred Gain - Like Kind Exchange - - -$ Non-DST 0.00% -$
56 FIN 47 8,642 4,003 12,645$ Net Plant 77.71% 9,827$
57 Section 263A - Capitalized Interest 85,828 21,074 106,902$ Net Plant 77.71% 83,074$
58 Software Costs Capitalized - Rev Bk (30,503) (12,421) (42,924)$ Net Plant 77.71% (33,356)$
59 Capitalized Interest / Overhead Capitalized (213,497) (53,664) (267,161)$ Net Plant 77.71% (207,611)$
60 Pension Cost Capitalized on Books 69,044 11,765 80,809$ Net Plant 77.71% 62,796$
61 CIAC 98,667 21,160 119,826$ Net Plant 77.71% 93,117$
62 CIAC with Tax Gross Up 93,088 31,832 124,920$ Non-DST 0.00% -$
63 Revaluation of Property 1,237 (53) 1,184$ Non-DST 0.00% -$
64 Real Estate Taxes Capitalized - - -$ Net Plant 77.71% -$
65 Repair Allowance (95,601) (40,072) (135,672)$ Net Plant 77.71% (105,431)$
66 Repairs - Distribution (1,076,795) (318,969) (1,395,765)$ DST 100.00% (1,395,765)$
67 Repairs - Transmission (125,102) (39,288) (164,390)$ Non-DST 0.00% -$
68 R&D Deduction (29,127) (11,098) (40,226)$ Net Plant 77.71% (31,259)$
69 Transmission Upgrade - East/West 4,348 708 5,056$ Non-DST 0.00% -$
70 AFUDC - Equity (1,388) (694) (2,082)$ Non-DST 0.00% -$
71 FIN 48 DEF TAX LIAB NONCUR FED - - -$ Non-DST 0.00% -$
72 FIN 48 DEF TAX LIAB NONCUR IL - - -$ Non-DST 0.00% -$
73 Regulatory (Asset)/Liab: ASC 740 - Tax Rate Changes 2,104,176 (14,448) 2,089,728$ Non-DST 0.00% -$
74 TCJA EDIT - Distribution 35,451 - 35,451$ 100% to Jurisdictional 100.00% 35,451$
75 TCJA EDIT - Transmission (662) - (662)$ Non-DST 0.00% -$
76 Cost of Removal 17,836 9,848 27,685$ Net Plant 77.71% 21,514$
77 Other Basis Adjustment - - -$ Net Plant 77.71% -$
Witness: Diccion
Docket No. 22-____ComEd Ex. 1.02 Page 31 of 176

WP 4
Page 2 of 2Commonwealth Edison Company
Accumulated Deferred Income Taxes
Actual 2021
(In Thousands)
Line
No. Account / Item - Debit / (Credit) Balance Federal State Total Allocator Percentage
Total
= (D) * (F)
(A) (B) (C) (D) (E) (F) (G)
Witness: Diccion
78 Other Basis Adjustment - Distribution (494) (299) (794)$ 100% to Jurisdictional 100.00% (794)$
79 State Rate Change - 2011 - Distribution 734 (2,096) (1,362)$ 100% to Jurisdictional 100.00% (1,362)$
80 State Rate Change - 2011 - Transmission 70 (200) (130)$ Non-DST 0.00% -$
81 State Rate Change - 2017 - Distribution 2,807 (8,020) (5,213)$ 100% to Jurisdictional 100.00% (5,213)$
82 State Rate Change - 2017 - Transmission 1,029 (2,939) (1,910)$ Non-DST 0.00% -$
83 2017 IL Rate Change - 282 (56) 52 (4)$ Non-DST 0.00% -$
84 2017 IL Rate Change - 282 Gross Up (3,563) (1,800) (5,363)$ Non-DST 0.00% -$
85 2017 Fed Rate Change - 282 331 - 331$ Non-DST 0.00% -$
86 2017 Fed Rate Change - 282 Gross Up (120,328) 1,483 (118,845)$ Non-DST 0.00% -$
87 Total Account 282 - Other Property 789,397$ (413,400)$ 375,998$ (1,502,674)$
88 Total Account 282
(FERC Form 1, Page 113, Line 63) (2,875,560)$ (1,204,736)$ (4,080,296)$ (4,965,659)$
89
Account 283
- Other - (Accts. 283100 & 283200 & 283300 & 283400) --
90 Chicago Arbitration Settlement (1,311)$ -$ (1,311)$ Non-DST 0.00% -$
91 Cloud Computing Costs (5,066) (2,532) (7,598) Wages & Salaries 85.40% (6,489)$
92 Accrued Benefits 1,138 377 1,514 Wages & Salaries 85.40% 1,293$
93 Deferred Gain - Sale of Easement (2,651) (1,005) (3,656) Net Plant 77.71% (2,841)$
94 Incentive Compensation Capitalized (Global Settlement) (1,276) (461) (1,736) DST 100.00% (1,736)$
95 Loss on Reacquired Debt (5,278) (1,414) (6,693) Net Plant 77.71% (5,201)$
96 Mark to Market - - - Non-DST 0.00% -$
97 Midwest Generation Settlement Liab (1,399) - (1,399) Non-DST 0.00% -$
98 Other Comprehensive Income (EPS 284000 & 284100) 8 2 10 Net Plant 77.71% 8$
99 Pension Contribution - Net of Book Provision 9.5% (69,044) (11,765) (80,809) Wages & Salaries 85.40% (69,010)$
100 Prepaid Pension contribution (shareholder-funded) (208,123) (91,539) (299,662) Non-DST 0.00% -$
101 PJM Start-up Costs (2) 5 3 Non-DST 0.00% -$
102 Swap and Hedging Transactions (1,338) (449) (1,787) Net Plant 77.71% (1,389)$
103 State Income Taxes - Temporary 7,016 - 7,016 Non-DST 0.00% -$
104 COVID-19 Regulatory Asset (5,301) (2,650) (7,950) 100% to Jurisdictional 100.00% (7,950)$
105 Regulatory (Asset)/Liab: MGP-Environmental Remediation (85,193) (24,861) (110,053) Non-DST 0.00% -$
106 Regulatory (Asset)/Liab: Severance Cost (FAS 112) (20) 59 38 Wages & Salaries 85.40% 32$
107 Regulatory (Asset)/Liab: Rider UF (19,121) (5,669) (24,789) Non-DST 0.00% -$
108 Regulatory (Asset)/Liab: Distribution Rate Case Matters (3) 8 5 Non-DST 0.00% -$
109 Regulatory (Asset)/Liab: AMP - retired meters and AMI costs (39) 18 (21) DST 100.00% (21)$
110 Regulatory (Asset)/Liab: AMP - other costs (3) - (3) Non-DST 0.00% -$
111 Regulatory (Asset)/Liab: Distributed Generation (14,132) (7,064) (21,197) Non-DST 0.00% -$
112 Regulatory (Asset)/Liab: Distributed Generation - Reconciliation (572) (286) (858) Non-DST 0.00% -$
113 Regulatory (Asset)/Liab: Distribution Formula Rate (31,527) (5,203) (36,730) Non-DST 0.00% -$
114 Regulatory (Asset)/Liab: Distribution - Other Deferred (Merger) (309) 100 (210) DST 100.00% (210)$
115 Regulatory (Asset)/Liab: Distribution - Other Deferred (Storm) (14,237) (6,846) (21,083) DST 100.00% (21,083)$
116 Regulatory (Asset)/Liab: Distribution - Other Deferred (A-Base) (1,655) (51) (1,707) DST 100.00% (1,707)$
117 Regulatory (Asset)/Liab: Distribution - Other Deferred (Ash Borer) (5,302) (2,529) (7,830) DST 100.00% (7,830)$
118 Regulatory (Asset)/Liab: Energy Efficiency (231,456) (113,399) (344,855) Non-DST 0.00% -$
119 Regulatory (Asset)/Liab: Energy Efficiency - Reconciliation 2,708 1,354 4,062 Non-DST 0.00% -$
120 Regulatory (Asset)/Liab: PORCB (1,045) (522) (1,567) Non-DST 0.00% -$
121 Regulatory (Asset)/Liab: Solar Rebate 1 (6) (5) Non-DST 0.00% -$
122 Regulatory (Asset)/Liab: ASC 740_2011 IL State Tax Rate Change 1,212 (3,462) (2,251) Non-DST 0.00% -$
123 Accelerated Depr AMI - Related to Reg Assets (17,784) (5,028) (22,812) DST 100.00% (22,812)$
124 Equity In Earnings Uncon Sub 50 - 50 Non-DST 0.00% -$
125 Deferred Revenue - Fiber Optics Lease 2,292 825 3,117 Comm Equip 68.90% 2,148$
126 REG ASSET - CAPITAL LEASES (391) (143) (534) Non-DST 0.00% -$
127 2017 IL Rate Change - 283 6,897 (15,432) (8,535) Non-DST 0.00% -$
128 2017 IL Rate Change - 283 Gross Up (3,138) (1,569) (4,707) Non-DST 0.00% -$
129 2017 Fed Rate Change - 283 104,055 - 104,055 Non-DST 0.00% -$
130 2017 Fed Rate Change - 283 Gross Up 77,076 (21,970) 55,106 Non-DST 0.00% -$
131 Total Account 283
(FERC Form 1, Page 113, Line 64) (524,263)$ (323,107)$ (847,370)$ (144,798)$
132 Total ADIT (3,242,316)$ (1,433,411)$ (4,675,727)$ (4,970,372)$
133 Other ADIT Adjustments
134 Capitalized Costs Disallowed in Previous ICC Orders (WP 1, Page 1) 2,672$
134 Rider EEPP (WP 1, Page 1) 5,181
135 2021 Test Year Disallowances (WP 1, Page 1) 3
135 Total Adjustments 7,856$
136 Total ADIT (4,962,516)$
Docket No. 22-____ComEd Ex. 1.02 Page 32 of 176

WP 5
Page 1 of 8
Balance at
Line End Allocator Allocated
No. Description of 2021 Allocator to apply: Rate Balance
(A) (B) (C ) (D) (E)
1 Regulatory Assets (182.3)
2 Capitalized Employee Incentive Payments 5,647 Distribution Service (DS) 100.00% 5,647
3 Reg Asset - Rider UF - ICC Docket 09-0433 59,784 Non DS 0.00% -
4 Reg Asset - Rider EEPP 1,181,158 Non DS 0.00% -
5 Reg Asset - Rider DG 77,371 Non DS 0.00% -
6 Reg Asset - Capital Leases - ICC Docket 10-0143 1,502 Non DS 0.00% -
7 Conditional Asset Retirement Obligations 99,170 Non DS 0.00% -
8 Settled Cash Flow Swaps- Loss 5,758 Non DS 0.00% -
9 MGP Remediation Costs 265,767 Non DS 0.00% -
10 Financial Swap with Exelon Generation 218,992 Non DS 0.00% -
11 PORCB Regulatory Program 5,496 Non DS 0.00% -
12 Purchased Electricity Adjustment 19,784 Non DS 0.00% -
13 Under-recovered Distribution Services Costs:
14 2020 Annual Reconciliation (4,292) Non DS 0.00% -
15 2020 Annual Reconciliation Decoupling (10,000) Non DS 0.00% -
16 2021 Annual Reconciliation 58,000 Non DS 0.00% -
17 2018 Significant Storms 5,196 Included as Other Deferred Charges 0.00% -
18 2020 Significant Storms 51,898 Included as Other Deferred Charges 0.00% -
19 2021 Significant Storms 16,695 Included as Other Deferred Charges 0.00% -
20 A-Base Meter Costs 3,439 Included as Other Deferred Charges 0.00% -
21 Emerald Ash Borer 26,616 Included as Other Deferred Charges 0.00% -
22 COVID-19 27,892 Included as Other Deferred Charges 0.00% -
23 Accelerated Depreciation AMI 69,466 Distribution Service (DS) 100.00% 69,466
24 Total Regulatory Assets 2,185,339$ 75,113$
Commonwealth Edison Company
Regulatory Assets and Deferred Debits
2021 Actual
(In Thousands)
Docket No. 22-____ComEd Ex. 1.02 Page 33 of 176

WP 5
Page 2 of 8
Balance at
Line End Allocator Allocated
No. Description of 2021 Allocator to apply: Rate Balance
(A) (B) (C ) (D) (E)
1 Deferred Debits (186)
2 Pension Asset 1,085,782 Non DS 0.00% -
3 Cook/Dupage County Forest Preserve District Fees 3,983 Distribution Service (DS) 100.00% 3,983
4 LT Receivable from MBA Plan 2,203 Wages & Salaries 85.40% 1,881
5 Insurance Recoveries Related to Third-Party Claims 34,720 Wages & Salaries 85.40% 29,651
6 Long-Term Contracting Services 8,470 Non DS 0.00% -
7 Credit Facility Issue Costs 1,622 Non DS 0.00% -
8 LT Receivable from Exelon Generation 2,760,584 Non DS 0.00% -
9 Long Term Restricted Cash 43,461 Non DS 0.00% -
10 FERC Order 494 Settlement 15,836 Non DS 0.00% -
11 Adjustable Block Program 234,883 Non DS 0.00% -
12 Solar For All Program 1,277 Non DS 0.00% -
13 Rochelle Franchise Fee 1,440 Non DS 0.00% -
14 Prepaid Asset for Capacity Agreement 529 Distribution Service (DS) 100.00% 529
15 Vacation Pay and Pending Accounting Distribution 23,867 Wages & Salaries See Page 6 20,382
16 Miscellaneous Work in Progress (11) Non DS 0.00% -
17 Estimated Illinois Distribution Tax Refund 5,143 Non DS 0.00% -
18 ICC Fees for New Money Authority 5,022 Net Plant 77.71% 3,903
19 Total Deferred Debits 4,228,811$ 60,329$
Regulatory Assets and Deferred Debits
Commonwealth Edison Company
2021 Actual
(In Thousands)
Docket No. 22-____ComEd Ex. 1.02 Page 34 of 176

WP 5
Page 3 of 8
Balance at
Line End Allocator Allocated
No. Description of 2021 Allocator to apply: Rate Balance
(A) (B) (C ) (D) (E)
1 Operating Reserves (228.2, 228.3, 228.4)
2 Deferred Compensation Unit Plan (23,199) Wages & Salaries 85.40% (19,812)
3 Non-Pension Post Retirement Benefit Obligation (168,586) Wages & Salaries 85.40% (143,972)
4 Executive Death Benefits (523) Wages & Salaries 85.40% (447)
5 Executive Death Benefits - SERP (1,646) Wages & Salaries 85.40% (1,406)
6 Deferred Compensation Plan - Level 2 (9,149) Wages & Salaries 85.40% (7,813)
7 Management Retention Incentive Plan (131) Wages & Salaries 85.40% (112)
8 FASB 112 Liability (4,307) Wages & Salaries 85.40% (3,678)
9 Long-Term Incentive Plans (2,314) Wages & Salaries 85.40% (1,976)
10 Public Claims (74,177) Wages & Salaries 85.40% (63,347)
11 Workmen's Compensation - Long-Term (25,044) Wages & Salaries 85.40% (21,388)
12 Environmental Liability - MGP Liability (278,573) Non DS 0.00% -
13 Environmental Liability - Super Fund Site (541) Distribution Service (DS) 100.00% (541)
14 Total Operating Reserves (588,190)$ (264,492)$
Commonwealth Edison Company
Operating Reserves, Regulatory Liabilities, and Deferred Credits
2021 Actual
(In Thousands)
Docket No. 22-____ComEd Ex. 1.02 Page 35 of 176

WP 5
Page 4 of 8
Balance at
Line End Allocator Allocated
No. Description of 2021 Allocator to apply: Rate Balance
(A) (B) (C ) (D) (E)
1 Asset Retirement Obligation (230)
2 Asset Retirement Obligation (146,367)$ Specific Identification by Plant Acctg See Page 8 (17,061)$
3 Deferred Credits (253)
4 Deferred Rents Note - FAS 13 (366) Wages & Salaries 85.40% (313)
5 Rochelle Franchise Fee (1,410) Non DS 0.00% -
FIN 48 Int Pmt - FED - NonCurr -
6 Long-Term Contracting Services (2,793) Non DS 0.00% -
7 Advance Billings for IPP Construction Estimates (10) Non DS 0.00% -
8 Rider REA (10,000) Non DS 0.00% -
9 Renewable Energy and REC Swap Contracts (200,681) Non DS 0.00% -
10 Non-Pension Post Retirement Benefit Obligation (140) Wages & Salaries 85.40% (120)
11 Deferred Employer Social Security Taxes - Wages & Salaries 85.40% -
12 Long-Term Portion of Receivables from Deferred Payment Agreements (21,165) Non DS 0.00%
13 Accrued Vacation Pay (Acct 242) see note 1 - Wages & Salaries on Avg. Balance See Page 6 (34,750)
14 Accrued Incentive Pay (Acct 242) see note 2 - Wages & Salaries on Avg. Balance See Page 7 (59,559)
15 Total Deferred Credits (253) (236,565)$ (94,742)$
(1) Vacation Pay is included in the Deferred Credit section of App5, although the balance is included in Account 242 and
not as a Deferred Credit on FERC Form 1.
(2) In accordance with the Final Order in Docket 11-0721, ComEd is including Accrued Incentive Pay as a reduction from Rate Base.
Similar to Accrued Vacation Pay, Accrued Incentive Pay is included in the Deferred Credit section of App 5, although the balance is included in
Account 242 and not as a Deferred Credit on FERC Form 1. The amount included is adjusted for by subtracting the amount
of Incentive Pay used in the Cash Working Capital (App 3). See page 7, line 6.
(In Thousands)
Commonwealth Edison Company
Operating Reserves, Regulatory Liabilities, and Deferred Credits
2021 Actual
Docket No. 22-____ComEd Ex. 1.02 Page 36 of 176

WP 5
Page 5 of 8
Balance at Balance at Allocation
Line Beginning End Percentage
No. Description of 2021 Accruals Amort of 2021 2021 Jurisdictional
(A) (B) (C) (D) (E) (F) (G)
Adjustments - Other Regulatory Assets (182.3)
1 Capitalized Incentive Costs (Page 1, Line 2) 5,909$ -$ (262) 5,647$ 100% 5,647$
2 AMI Pilot- Retired Meters - - - - 100% -
3 Accelerated Depr. On Meters Retired for AMI (Page 1, Line 21) 91,390 - (21,924) 69,466 100% 69,466
4 Total 182.3 Adjustments 75,113$
Adjustments - Deferred Debits (186)
5 Cook/Dupage County Forest Preserve District Fees (Page 2, Line 3) 4,374$ -$ (391) 3,983$ 100% 3,983$
6 LT Receivable from MBA Plan (Page 2, Line 4) 859 1,344 - 2,203 85.40% 1,881
7 Deferred charges related to accrued vacation (Page 6, Line 5) 23,786 81 - 23,867 20,382
8 Expected Insurance Recoveries on Public Claims (Page 2, Line 5) 48,999 (14,279) - 34,720 85.40% 29,651
9 Prepaid Asset for Capacity Agreement (Page 2, Line 14) 611 - (82) 529 100% 529
10 ICC Fees for New Money Authority (Page 2, Line 18) 2,142 4,800 (1,920) 5,022 77.71% 3,903
11 Total 186 Adjustments 60,329$
Deferred Credits (253)
12 Adjustment to Operating Reserve for Accrued Vacation Pay (Page 6, Line 5) (34,750)$
13 Adjustment to Operating Reserve for Accrued Incentive Pay (Page 7, Line 7) (59,559)
14 Non-Pension Post Retirement Benefit Obligation (Page 4, Line 10) - (140) - (140) 85.40% (120)
15 Other Misc Adjustment (Deferred Rent) (Page 4, Line 4) (622) 256 - (366) 85.40% (313)
16 Total 253 Adjustments (94,742)$
Commonwealth Edison Company
Regulatory Assets and Deferred Debits
2021 Actual
(In Thousands)
2021 Activity
Docket No. 22-____ComEd Ex. 1.02 Page 37 of 176

WP 5
Page 6 of 8
Commonwealth Edison Company
Adjustment to Operating Reserve for Accrued Vacation Pay
2021 Actual
Line
No. Description
Deferred Credit
Amount
Deferred Debit
Amount
(B) (C)
1 2021 Year End Balance
2 December Balance (40,691)$ 23,867$
3 Year End (40,691)$ 23,867$
4 Wages & Salaries Allocator 85.40% 85.40%
5 DS Jurisdictional Reserve for Accrued Vacation (34,750)$ 20,382$
(A)
Docket No. 22-____ComEd Ex. 1.02 Page 38 of 176

WP 5
Page 7 of 8
Commonwealth Edison Company
Adjustment to Operating Reserve for Accrued Incentive Pay
2021 Actual
Line
No. Description Amount
(B)
1 2021 Year End Balance
2 December Balance (96,927)$
3 Year End (96,927)$
4 Wages & Salaries Allocator 85.40%
5 DS Jurisdictional Reserve for Accrued Incentive Pay (82,776)$
6 Less: Accrued Incentive in CWC Calculation (App 3) (23,217)
7 DS Jurisdictional Reserve for Accrued Incentive Pay - Adjustment (59,559)$
(A)
Docket No. 22-____ComEd Ex. 1.02 Page 39 of 176

WP 5
Page 8 of 8
Line
No.
1 From General Ledger Account 108000 to 182150
2 Functional Class
2021 Beginning
Balance
Reclass from
108000
2021 Ending
Balance
3 Transmission 1,255 (1) 1,254
4 Distribution 16,910 (647) 16,2635 General Plant 1,027 (168) 859
6 19,192 (816) 18,376
7 Allocation of General Plant ARO Reg Asset to T & D :
8 Total Transmission Distribution General Plant
9 17,517 1,254 16,263
10 859 859
11 - 61 798 (859)
12 18,376 1,315 17,061 -
13 App 5, Line 25 Amount, (Col F)
14 100.00% 7.16% 92.84%
Commonwealth Edison Company
Removal Reclassed to ARO Regulatory Asset
2021 Actual
Docket No. 22-____ComEd Ex. 1.02 Page 40 of 176

WP 6
Page 1 of 1
Commonwealth Edison Company
Property Held for Future Use Included in Rate Base - 2021 Actual
Line
No.
1 ComEd did not include any property held for future use
2 in the jurisdictional rate base reflected on Schedule B-1,
3 Jurisdictional Rate Base Summary.
Description
(A)
Docket No. 22-____ComEd Ex. 1.02 Page 41 of 176

WP 7
Page 1 of 17
Commonwealth Edison Company
Workpaper 7 - Expense Information Summary
Line Page
No. No. Description
(A) (B)
1 2 Expense Summary
2 3 Miscellaneous General Expenses
3 4 Charitable Contributions
4 5 Uncollectible Expense
5 6 Supply Administration Costs
6 7 Residential Real Time Pricing (RRTP) Program Expenses
7 8 Regulatory Commission Expenses Directly Assigned to Distribution - Acct 928
8 9 Executive Compensation Exclusion
9 10 Adjustments to Perquisites and Awards
10 11 Removal of Long Term Incentive Compensation
11 12 Customer Assistance EIMA Costs
12 13 Amortization of Regulatory Debits and Credits
13 14 Taxes Other Than Income Taxes
14 15 Removal of Pension Costs Derived from Disallowed AIP
15 16 Removal of Certain Consulting Services
16 17 Corporate Credit Card Voluntary Reductions
Docket No. 22-____ComEd Ex. 1.02 Page 42 of 176

WP 7
Page 2 of 17
Commonwealth Edison Company
Expense Summary
2021 Actual
(In Thousands)
Line
No. Distribution Customer Accts
Customer
Service and
Informational A&G Total Comments
(A) (B) (C) (D) (E) (F) (G) (H)
1 City of Chicago / Midwest Generation Settlement -$ -$ -$ -$ -$ ComEd 2021 ILCC Form 21, Page 13.1
2 Franchise Requirements - - - 39,140 39,140 ComEd 2021 FERC Form 1, Page 323, Line 188
3 Duplicate Charges (Credit) - - - (39,140) (39,140) ComEd 2021 FERC Form 1, Page 323, Line 190
4 Charitable Contributions - 2,693 - 5,345 8,038 See Page 4
5
General Advertising Expenses - Non Safety or
Informational- - - (4,887) (4,887) ComEd 2021 FERC Form 1, Page 323, Line 191
6
Bank Fees - Credit Facility Fees Included in the Cost of
Capital- - - (85) (85) Page 3, Line 8, Column C
7 Non DS Uncollectible Expenses - Outside Agency - (562) - - (562) See Page 5, Col D, Ln 2
8 Regulatory Commission Expenses - - - (1,263) (1,263) See Page 8, Line 1
9 Uncollectible Accounts - (17,969) - - (17,969) See Page 5, Line 1
10 Supply Administration Costs - - - (364) (364) See Page 6, Line 5
11 Residential Real Time Pricing - - - (2,934) (2,934) See Page 7
12Interest Accrued on Customer Deposits - 7 - - 7
Interest on Customer Deposits is recorded in Account
431, Other Interest Expense.
13 Customer Care Costs - 21,045 - - 21,045 See ComEd Ex. 3.0
14 Voluntary Exclusions If Any (4,684) (287) (554) (31,884) (37,409) See Line 31 below.
15 Total Adjustments to Operating Expenses (4,684)$ 4,927$ (554)$ (36,072)$ (36,383)$
16
Regulatory Commission Expenses Directly Assigned
to Distribution - Acct 9281,195$ See Page 8, Line 21
17 Executive Compensation -$ -$ -$ (18,936)$ (18,936)$ See Page 9, Line 11
1850% of Corporate Jet - - - (2,678) (2,678)
Represents 50% of Corporate Jet Costs Expensed in
2021.
19PORCB Adjustment - (112) - (584) (696)
PORCB on-going costs were recorded in accounts 903
and 920.
20 Perqs and Awards (123) - - (1,398) (1,521) See Page 10
21 LTPSA 2021 (1,508) - - (4,721) (6,229) See Page 11, Lines 6, 7
22 LTPSA 2020 (912) - - (220) (1,132) See Page 12, Lines 14,15
23 LTPSA 2019 (747) - - (180) (927) See Page 12, Lines 12, 23
24 LTPSA 2018 (82) - - (20) (102) See Page 12, Lines 30, 31
25 Restricted Stock Executives, Key Managers (1,023) - - (1,688) (2,711) See Page 12, Lines 38, 39, 46, 47
26 Contractor Review - - - (776) (776) See Page 16, Line 17
27 Customer Assistance EIMA Costs - - (554) - (554) See Page 12
28 Pension related to incentive compensation (11) - - (5) (16) See Page 15
29 Corporate Credit Card Voluntary Reductions (276) (175) - (678) (1,129) See Page 17
30
Employee Recognition - Safety and Service
Anniversary(2) - - - (2) See Page 17
31 Total (Lines 17-31) to Line 15 (4,684)$ (287)$ (554)$ (31,884)$ (37,409)$
32
Taxes Other Than Income Adjustments (App 7, Lines
60 and 61)
33 Adj For Payroll Taxes for Supply Administration (89)$ See Page 6
34 LTPSA, Stock Opts, Restricted Stock (744) See Page 11
35 Perqs and Awards (97) See Page 10
36 Total (Line 34 - 36) Other Tax Adjustments (930)$
Docket No. 22-____ComEd Ex. 1.02 Page 43 of 176

WP 7
Page 3 of 17
Line FERC Form 1 Adjusted
No. Description Amount (1) Adjustments Amount Jurisdictional (2)
(A) (B) (C) (D) (E)
1 Industry Association Dues 801$ -$ 801$ 684$
2 Accrued Vacation Pay (818) - (818) (699)$
3 Environmental Remediation Expenses 648 - 648 553$
4 Other Environmental Projects 464 - 464 396$
5 Illinois Energy Efficiency Program 760 - 760 649$
6 Directors' Fees and Expenses 316 - 316 270$
7 Write-down of Obsolete Materials 2,508 - 2,508 2,142$
8 Bank Fees 1,111 (85) (3) 1,026 876$
9 Undistributed Employee Expenses 28 - 28 24$
10 Informational Technology Upgrades 115 - 115 98$
11 Unclaimed Property Adjustment - - - -$
12 COVID-19 related expenses 7,853 - 7,853 6,706$
13 Residential Time of Use Pricing Pilot Development and Operation 745 - 745 636$
14 Smart meter network professional services and other costs 1,395 - 1,395 1,191$
15 Other 1,895 - 1,895 1,618$
16 Total Miscellaneous General Expenses 17,821$ (85)$ 17,736$ 15,147$
Notes:
(1) Reflects amounts charged to Account 930.2, Miscellaneous Gen. Expenses, per 2021 FERC Form 1, Page 335 excluding the
amortization of the deferred debits for the Chicago Arbitration Settlement and the Midwest Generation/Chicago settlement.
(2) Allocated using the Wages and Salaries allocator.
(3) Included in Credit Facility Fees. See Schedule D-1.
Commonwealth Edison Company
Miscellaneous General Expenses
2021
(In Thousands)
Docket No. 22-____ComEd Ex. 1.02 Page 44 of 176

WP 7Page 4 of 17
Subpage 1 of 35
Commonwealth Edison Company
Charitable Contributions of $1,000 and GreaterCharged To Account 426.1 Donations
2021 Actual(In Thousands)
Line
2021 Payments Of
$1,000 or More
Estimated
Value of
Benefits (b)
No. Organization Organization AddressOrganization Program
Area
Organization Tax
Exempt? Organization Mission and Purpose of 2021 Donation
Description of Why The Donation is Reasonable in
Amount Date of Contribution (In Thousands)
Description of
Benefits (In Thousands)
(A) (B) (C) (D) (E) (F) (G) (H) (I) (J)
1A FOUNDATION FOR WEST AURORA
SCHOOLS
1877 W. Downer Place
Aurora, IL 60506Education Yes
Investing in the future, this educational organization develops
and dedicates resources, supports innovation, and creates
partnerships to enhance student learning and well-being.
Funding supports the purchase of electric vehicles and
charging stations with the purpose of addressing air pollution
and introducing students to EV technology, providing them
with the opportunity to learn how to safely and efficiently
operate EVs and learn about environmentally friendly
vehicles.
Funding for the purchase of an electric vehicle. 4/26/2021 50 None 0
2ABUNDANT CHILDREN AND FAMILY
SERVICES AGENCY
PO BOX 2383, Glen Ellyn,
IL 60137
Energy Empowerment
in Our CommunitiesYes
Abundant Children & Family Services Agency's mission is to
provide food and daytime housing, resources, supportive
services, and activities to all of the homeless and non-
homeless children and families where "Everyone can have a
place to call home."
Funds will be used to assist clients with temp
housing, food, utilities assistance, cleaning supplies
and mask.
10/8/2021 2 None 0
3 ADLER PLANETARIUM & ASTRONOMY
1300 South Lake Shore
Drive
Chicago, IL 60605
Culture & Arts Yes
The mission of the Adler Planetarium is to inspire exploration
and understanding of our Universe. Funding was for the
Celestial Ball.
Sponsorship levels range between $5,000 and
$50,000, so ComEd support at a lower level.5/27/2021 40
Logo
placement on
the website and
virtual program
ad
1
4 AKARAMA FOUNDATION INC6220 S. Ingleside Avenue
Chicago, IL 60637Education Yes
AKArama Foundation promotes community service through
volunteerism, collaboration and programs designed to
strengthen the economic, educational, culture and health of
communities. ComEd has presented Energy Efficiency
workshops and hosted tables at their annual back to school
festival and community workshop.
This donation goes toward their annual fund raiser
that benefits colleges and college students
throughout the Chicago land area.
10/12/2021 1 None 0
5 ALBANY PARK THEATER PROJECTPO Box 25072
Chicago IL 60625Culture & Arts Yes
Albany Park Theater Project (APTP) is a multiethnic, youth
theater ensemble that inspires people to envision a more just
and beautiful world. Funding was for their Youth
Development Through Theater programming.
APTP’s teen ensemble creates original theater based
on the life experiences of marginalized people
whose stories might otherwise go untold: urban
teens, immigrants, and working-class Americans.
Corporate donations represent only 2% of the
theater's overall funding.
7/27/2021 5Logo
placement0.25
6 ALLIANCE OF POLISH CLUBS IN THE USA5835 W Diversey Ave
Chicago, IL 60639
Community &
Economic DevelopmentYes
The purpose of Alliance of Polish Clubs is to initiate and
coordinate the activities of individual clubs and organizations
affiliated within the infrastructure by encouraging their
interest in assisting the people of Poland and our surrounding
Polish-American community in the Chicago area. We uphold
and cherish all the fundamental values of our Polish Heritage
by consistently arranging and celebrating the national
holidays such as the harvest fest, the May 3rd Constitution
Day Parade, Wigilia (Christmas Eve), and folk festivals
throughout the year so that future generations can appreciate
and understand all that their Polish heritage has to offer. Plus
the ethnic events reinforce the sense of community.
Sponsorship was for the Polish Constitution Day Parade.
The donation is a set amount by the nonprofit to be a
part of the parade.4/7/2021 4 None 0
Docket No. 22-____ComEd Ex. 1.02 Page 45 of 176

WP 7Page 4 of 17
Subpage 2 of 35
7ALZHEIMER`S ASSOCIATION - GREATER
ILLINOIS CHAPTER
850 Essington Road, Suite
200
Joliet, IL 60435
Health & Social
ServicesYes
The Alzheimer's Association is the leading voluntary health
organization in Alzheimer's care, support and research.
Funding was for the annual Walk to Remember.
The amount allowed ComEd to have a team of
employees participate in and privately fundraise for
the annual walk.
4/30/2021 5
Logo
placement on
the website, ad
placement in
the virtual
program
0.25
8 AMERICAN BLUES THEATER
Administrative office: 1016
N. Dearborn St.
Chicago, IL 60610
Culture & Arts Yes
American Blues Theater is the premier American theater
producing visceral theatrical works while engaging its
audience in missions of local service agencies. American
Blues Theater illuminates the American ideas of freedom,
equality, and opportunity in the plays we produce and
communities we serve. Funding was for season general-
operating support.
ABT does extensive outreach to schools and
nonprofit organizations for free tickets.7/26/2021 20
Logo
placement0.25
9 AMERICAN CANCER SOCIETY
225 N. Michigan Avenue,
Suite 1200
Chicago, IL 60601
Health & Social
ServicesYes
For over 100 years, the American Cancer Society (ACS) has
worked relentlessly to save lives and create a world with less
cancer. Together with millions of our supporters worldwide,
we help people stay well and get well, find cures, and fight
back against cancer. ComEd supported the Making Strides
Against Breast Cancer Walk of Park Ridge.
The amount allowed ComEd to have a team of
employees participate in and privately fundraise for
the annual walk.
11/17/2021 3
Logo on t-
shirts; Tent at
walk
0.25
10 AMERICAN HEART ASSOC300 S. Riverside Plaza,
Chicago, IL 60606
Health & Social
ServicesYes
The American Heart Association fights heart disease by
weaving healthy practices into the community. The
organization ensures health environments by increasing
opportunities for people to incorporate activity and enacting
statewide and local policies for heart health. The purpose of
this donation was to support the annual heart walks.
The amount allowed ComEd to have a team of
employees participate in and privately fundraise for
the annual heart walks. ComEd participated onsite in
a livestreamed event to launch the Heart Walk
weekend.
8/28/2021 75Logo on flyers;
tent at walk2
11 AMERICAN LUNG ASSOC55 W Wacker Dr STE 1150,
Chicago, IL 60601
Health & Social
ServicesYes
The American Lung Association is the leading organization
working to save lives by improving lung health and
preventing lung disease through education, advocacy and
research. The purpose of this donation was for the Fight for
Air Climb in 2022.
Donation supported the ALA's education and
advocacy campaign. Documentary screening of
"Unbreathable" and Fight for Air Climbs
8/27/2021 15
Logo
placement and
registrations
1
12 AMERICAN RED CROSS OF CHICAGO2200 W. Harrison, Chicago,
IL 60612
Health & Social
ServicesYes
The American Red Cross of Greater Chicago serves 7.7
million people in 5 counties in Northern Illinois. This
donation focuses efforts on consumer education and storm
emergency preparedness.
The amount was determined based on the support
for the ongoing partnership related to emergency
preparedness.
5/28/2021 25 None 0
Docket No. 22-____ComEd Ex. 1.02 Page 46 of 176

WP 7Page 4 of 17
Subpage 3 of 35
13 ART INSTITUTE OF CHICAGO111 S. Michigan Ave
Chicago IL 60603Culture & Arts Yes
The Art Institute of Chicago collects, preserves, and
interprets works of art of the highest quality, representing
the world's diverse artistic traditions, for the inspiration and
education of the public and in accordance with the museum
profession's highest ethical standards and practices.
Recognized worldwide as one of America's leading art
museums, the Art Institute is enthusiastically supported by a
membership base of nearly 100,000 households and
welcomes approximately 1.5 million local, national, and
international visitors through its doors each year. To augment
its onsite offerings, the museum actively facilitates lifelong
learning and engagement in the visual arts through targeted
education and outreach initiatives that have been carefully
designed for students, teachers, adults, and families.
Donation supported annual event, although it was cancelled,
and corporate partner benefits, including early access to
exhibits and a corporate day.
This is a standard cost for corporate partners. 4/27/2021 25
Logo
recognition
online
0.5
14 ARTHUR LOCKHART RESOURCE INST4941 W. Chicago Ave
Chicago, IL 60651
Health & Social
ServicesYes
The Arthur Lockhart Resource Institute is a non for profit
human/social organization committed to improving the
economic, education, psychological, social experiences and
health of the Austin/West Garfield Community. For more
than 27 years, the Arthur Lockhart Resource Institute has
created partnerships with civic organizations, churches and
government agencies in order to provide support for
individuals and families in the Austin/West Garfield
Community. Started by its Founder, the late Dr. Arthur
Lockhart, the former Pastor of Healing Temple Church of
God In Christ, the Arthur Lockhart Resource Institute
continues to grow its programs and services to the
community. The purpose of this donation is to support the
food pantry that the institute has to provide food to the
seniors, veterans, and underserved residents of Austin/West
Garfield.
Food Pantry, Delivery of Food for residents in need
during the pandemic. 7/28/2021 1 None 0
15 AURORA CIVIC CENTER AUTHORITY8 East Galena Blvd, Suite
230, Aurora, IL Culture & Arts Yes
The Paramount Theatre is committed to being a defining
catalyst for personal and community transformation by:
making the performing arts accessible for every age and
socioeconomic background, introducing the magic of live
theater across generations to encourage expansive
imaginations and broad views of people and the world, and
contributing to the future stability and growth of Aurora's
downtown. Funding for Paramount supported accessible
programming for all ages.
The sponsorship supports arts programs in Aurora,
which have received critical acclaim and increasing
guests in the past three years.
5/27/2021 20
Logo
placement on
the website
0.5
16 AURORA ROTARY CLUB FOUNDATIONPO box 2652
Aurora, IL 60507
Health & Social
ServicesYes
Funding supports a holiday light display in Phillips Park open
each evening from Thanksgiving to Christmas with 1.1 miles
of roadway with light displays either side. Donations are
returned to local nonprofit organizations. Sponsor dollars
underwrite display purchase and maintenance and the hired
crane and electricians.
The funding was set to cover costs explained in the
Purpose of the Donation column.8/27/2021 2
Logo
placement on
the website
0.25
Docket No. 22-____ComEd Ex. 1.02 Page 47 of 176

WP 7Page 4 of 17
Subpage 4 of 35
17 BACK OF THE YARDS NEIGHBORHOOD
1751 West 47th Street
2nd Floor
Chicago, IL 60611
Health & Social
ServicesYes
The mission of the BYNC is to enhance the general welfare
of all residents, organizations, and businesses in our service
area by integrating social services and economic development
programs. By addressing community development,
education, and human services in our daily activities we are
"creating a better place." The BYNC offers a variety of
programs and services that meet the diverse needs of our
community. These programs include after school tutoring, a
computer lab with computer literacy training, a free senior
citizen shuttle bus, free home repairs for senior citizens,
youth summer employment programs, GED classes, ESL
classes, an internationally-renowned Ballet Folkloric dance
group, a variety of economic development programs, and
much more. By combining social and economic programs
into a single community-based organization, the BYNC
provides a holistic approach to strengthening the Back of the
Yards neighborhood and surrounding communities. Funding
is for annual support of programs and resources for residents
and families.
Back of the Yards Neighborhood Council provides
extensive services to families in need in one of the
lowest-income parts of the city. ComEd's support
reflects that BYNC is one of the largest program
providers in the area.
6/28/2021 20 None 0
18BETTER BUSINESS BUREAU OF CHICAGO
AND NORTHERN ILLINOIS
330 N Wabash Ave.
Suite 3120
Chicago, IL 60611
Civic & Public Affairs Yes
The BBB is committed to an ethical marketplace where
buyers and sellers trust each other. BBB's mission is to be the
leader in advancing marketplace trust. The BBB does this by
setting standards for marketplace trust and encouraging and
supporting best practices by engaging with and educating
consumers and businesses, celebrating marketplace role
models, calling out and addressing substandard marketplace
behavior, and creating a community of trustworthy
businesses and charities. Funding was for the annual
membership and dinner.
ComEd has been a member for 90 consecutive years,
working alongside the BBB to ensure customers are
treated in the best way possible. The membership
fee is set, and ComEd comes in at a lower level for
the dinner.
3/19/2021 25
Logo
placement on
the website; ad
placement in
the dinner
1.75
19 BIG SHOULDERS FUND
212 W Van Buren St, Suite
900
Chicago, IL 60607
Education Yes
Inspired by Joseph Cardinal Bernardin, a group of business
leaders founded Big Shoulders Fund in 1986 to provide
support to Catholic Chicago inner-city schools. Big
Shoulders serves nearly 21,000 students in 82 schools (67
elementary and 15 high schools) located throughout
Chicago. Since its inception, the Big Shoulders Fund has
raised more than $260 million and currently awards
approximately $20 million annually in grants and
scholarships. This includes over $3 million each year in
professional development and programmatic enhancements
including early childhood, extended day, professional
development for teachers and administrators, vision / hearing
screenings, and more. Studies have shown the longer a
student remains in a Big Shoulders Fund school, the greater
the improvement they will show on standardized test. Ninety-
six percent of Big Shoulders secondary school students
graduate from high school and 83 percent of Big Shoulders
scholars go on to higher education. Funding was a program
grant and scholarships for St. Margaret of Scotland School,
which has 100% low-income student body.
ComEd works with its partner school to identify
needs of the current year that supports STEM
curriculum and scholarships for in-need students. A
discussion takes place between Big Shoulders Fund,
the principal and ComEd to determine an appropriate
amount.
6/25/2021 15 None 0
Docket No. 22-____ComEd Ex. 1.02 Page 48 of 176

WP 7Page 4 of 17
Subpage 5 of 35
20 BLACK ENSEMBLE THEATER4450 North Clark Street
Chicago, IL 60640Culture & Arts Yes
The mission of the Black Ensemble Theater (BE) is to
eradicate racism and its devastating effects upon society
through the utilization of theater arts. BE was founded by
actress, playwright and producer Jackie Taylor in 1976. She
created a theater company that would transcend the concept
of race and color and tell the truth as it pertained to the
greatness of African-American people. The company began
producing plays that brought diverse audiences together to
recognize and appreciate their differences while ultimately
embracing their sameness as human beings. Funding was for
Black Ensemble Theater's Legacy Continues Gala.
Black Ensemble Theater is the largest theater in the
area with a focus on African American topics, so
ComEd gives an amount near the higher range to
reflect their important work in our community.
7/27/2021 20
Logo
placement and
virtual program
0.25
21 BLACK MEN UNITED FOUNDATION2425 W Congress Pkwy,
Chicago, IL 60612Misc Social Services Yes
Black Men United is a national Community Service
organization that focuses on the restoration and rebuilding of
Black communities across America. Under the leadership of
Pastor John Harrell, BMU provides fresh produce / food
boxes in communities across the State addressing food
insecurities, Work force developement, & violence reduction.
They provide mentorship & employ youth ages 16- 24 years
old. They train the unemployed and under-employed, along
with the re-entry population.
Our contribution provides ComEd with branding
opportunities and a presence at several community
events serving under-served communities. This is a
great forum to share information on ComEd
programs
11/4/2021 1 None 0
22 BOLINGBROOK STEM ASSOC440 Quadrangle Dr. Ste C
Bolingbrook, IL 60440Culture & Arts Yes
The Bolingbrook STEM Association aspires to provide a
community wide program that exposes students to an
innovative learning experience dedicated to Science,
Technology, Engineering, and Math. The objective is to
maximize individual potential and ensure students are well-
equipped for college, their future careers, and for life in a
competitive global economy. Funding was for their
community-wide, back-to-school STEM event.
The contribution directly supported the program for
students.5/21/2021 1 None 0
23BRIGHT STAR COMMUNITY OUTREACH
CORP
333 East 35th St
Chicago, IL 60616
Community &
Economic DevelopmentYes
Bright Star Community Outreach works to empower
residents to share in the responsibility of building community
through pooling resources and forming partnerships . They
accomplish their mission by developing innovative
performance-based projects and programs to address issues
of Community Engagement, Economic Development,
Education, Children/Youth and Family. Funding was for their
annual fundraising dinner to raise support for their programs.
The donation was maintained even though the event
was held virtually due to the pandemic. 9/22/2021 10 None 0
24BRUSHWOOD CENTER AT RYERSON
WOODS
21850 N Riverwoods Rd
Riverwoods, IL 60015Environment Yes
Brushwood Center at Ryerson Woods promotes the
importance of nature for nurturing personal and community
wellbeing, cultivating creativity, and inspiring learning.
Funding was for "At Ease" Veteran's Nature Photography
Program."
The funding level was determined via discussions
with Brushwood regarding costs to engage veterans
in the photography class. Support for this program
was maintained even though COVID affected the
ability for the class to meet in person.
7/22/2021 8
Logo
placement on
the website
0.25
25 BUILD INC5100 West Harrison,
Chicago, IL 60644
Community &
Economic DevelopmentYes
BUILD’s mission is to engage at-risk youth in the schools
and on the streets, so they can realize their educational and
career potential and contribute to the stability, safety and well
being of our communities. Funding was for the annual
dinner.
Levels for the dinner ranged between $2,500 and
$25,000, so ComEd was in the lower range.5/30/2021 5 None 0
Docket No. 22-____ComEd Ex. 1.02 Page 49 of 176

WP 7Page 4 of 17
Subpage 6 of 35
26BUILDING COMMUNITY FOUNDATION
INC
436 E 47th St.
Chicago, IL 60653
Health & Social
ServicesYes
Known in the community as the Firehouse Community Art
Center, this organization has served as a safe haven for
young people in the Chicago area for over a decade and has
been coordinating various events and art programs dedicated
to preventing and interrupting youth and young adults caught
in violence. Pastor Phil Jackson and several partners
incorporated The Firehouse Community Art Center as a
501(c)(3) in 2006, and in 2007 they purchased the 100 year
old Chicago Firehouse in North Lawndale.
The Firehouse now offers year-round, multi-
disciplinary cultural arts programming, mentorship,
leadership and workforce development centered
around the prevention and interruption of violence.
During the pandemic, they are conducting meal
preparation and delivery for residents in the North
Lawndale area. Their target audience are seniors,
single parents, families in need, and the re-entry
population. This donation supported the
organization's efforts for assistance to families
impacted by COVID.
7/19/2021 2 None 0
27 CALAHAN FOUNDATION INC7030 S Halsted
Chicago, IL 60621Multi Yes
The Calahan Foundation exists to inspire youth through
educational scholarships, college mentoring and meeting the
deep needs of humanity through community outreach.
Funding was for 10th Annual Celebration of Giving
Scholarship Benefit Gala.
This sponsorship was meant to include a table of 10
to attend the Calahan Foundation's Annual Benefit
Gala supporting college scholarships for
disadvantaged youth along with ComEd Ad in
program guide. The event funding was maintained
even though the event was held virtually.
9/28/2021 5 None 0
28CALUMET AREA INDUSTRIAL
COMMISSION
1000 E. 111th Street,
Chicago IL 60628
Community &
Economic DevelopmentYes
To lead industrial retention and expansion efforts in the
Calumet Area of Chicago in order to create an environment
in which industry will remain and grow. Our success is
accomplished through advocacy, industrial retention,
networks and workforce development. ComEd provided
membership services and economic development to Lake
Calumet Area.
This membership fee covers dues, golf outing, and
the Calumet Area Industrial Commission's (CAIC)
Annual business luncheon. CAIC represents the
business interest in the Calumet Industrial Area of
the south east side of Chicago.
4/1/2021 3 None 0
29 CASA CENTRAL1343 N. California Avenue
Chicago, IL 60622
Community &
Economic DevelopmentYes
Casa Central was founded in 1954 by a group of multi-
denominational churches in an effort to address the growing
needs of their community, largely Hispanic immigrants. With
a budget of $26,000 and a staff of three, Casa Central set out
to build strong communities, one family at a time. Since then
Casa Central has become a model agency with over 500
employees and a budget of approximately $17 million.
Though much has changed over the years, its mission and
passion have remained the same, as they continue to
transform lives and strengthen communities, with a special
focus on Hispanics. A network of social services propels a
diverse population of all ages toward self sufficiency and a
higher quality of life." Funding was for Casa Central Annual
Awards Dinner.
Sponsorship levels range between $5,000 and
$50,000 -- ComEd comes in at the higher level
because Casa Central is one of the largest social-
service agencies serving in-need people and families
in our service territory.
7/27/2021 25
Sponsor
recognition at
the event, logo
placement on
the entrance
sign. Five
vehicle tickets
for the event
0.5
30 CENTRO ROMERO6216 N Clark St, Chicago,
IL 60660
Health & Social
ServicesYes
For over 35 years, Centro Romero has been a community-
based organization that serves the refugee immigrant
population on the northeast side of Chicago.
This organization has been instrumental in providing
information and support to the refugee immigrant
community. They share our materials with their
clients to help us reach a demographic that has been
difficult to reach. During COVID, they provided
meals for families.
6/17/2021 2 None 0
31CHAMPS MALE MENTORING PROGRAM-
CHIRISE
PO Box 19584, Chicago IL
60619Education Yes
Organization is a group of men who want to make a
difference in the lives of young men in their communities.
They represent a diverse range of professions, backgrounds
and experiences, but they share a commitment to the belief
that our young men are Born 2 Win, and that mentorship is a
calling. This donation was for a back to school event in the
5th ward. The sponsorship supports costs associated with
distributing school supplies.
The sponsorship supports distributing school
supplies to 500 students. The event also provides a
speaking role to share information on Income
Eligible programs and initiatives.
1/7/2021 1 None 0
Docket No. 22-____ComEd Ex. 1.02 Page 50 of 176

WP 7Page 4 of 17
Subpage 7 of 35
32 CHESTERFIELD COMMUNITY COUNCIL501 E. 90th Place, Chicago,
IL 60619
Health & Social
ServicesYes
The Chesterfield Community Council purpose is to promote,
unify and assist in all endeavors pertaining to the Chesterfield
Community. The 15th Annual Home Expo is designed to
inform over 500 citizens of the Chesterfield/Chatham
communities and city-at-large about housing related
programs and services including foreclosure prevention
programs.
This is an opportunity for participants to learn about
ComEd Energy Efficiency, Solar Program, Powering
People Initiative, Income Eligible, and CARE
programs.
5/28/2021 1 None 0
33 CHICAGO ACADEMY OF SCIENCES 2430 N. Cannon Drive
CHICAGO, IL 60614
Culture & Arts Yes
The mission of the Chicago Academy of Sciences and its
Peggy Notebaert Nature Museum is to create a positive
relationship between people and nature through
collaborations, education, research and collections, exhibits
and public forums that foster urban connections to our
region's nature and science. The vision is to be the urban
connection to the world of nature and science. Funding is for
the Butterfly Ball.
Sponsorship levels between $6,000 and $50,000, so
ComEd comes in at mid-range.3/19/2021 20 None 0
34 CHICAGO ARCHITECTURE FOUNDATION111 E Wacker Drive
Chicago, IL 60601Culture & Arts Yes
The Chicago Architecture Center (CAC) inspires people to
discover why design matters. CAC is the leading
organization devoted to celebrating and promoting Chicago
as a center of architectural innovation. As Chicago's forum
for the exchange of ideas on urban design, CAC inspires
people to participate in the building of vibrant communities
and to demand the highest standard in urban design. CAC
awakens young people to achieve their potential through the
discovery of architecture, engineering and design.
Sponsorship supported Open House Chicago and the annual
gala.
Sponsorship level supported Open House Chicago, a
free program open to all audiences. ComEd's
Training Center participated in the event. Funding
also intended to support a table at the annual gala.,
and this support was maintained to support
organizations during the pandemic.
5/27/2021 30
Logo
recognition on
the website;
sponsorship
highlight for
Open House
Chicago
1
35 CHICAGO BOTANIC GARDEN1000 Lake Cook Road,
Glencoe, IL 60022Environment Yes
The Chicago Botanic Garden cultivates the power of plants
to sustain and enrich life. They opened more than 40 years
ago as a beautiful place to visit, and it has matured into one
of the world's great living museums and conservation science
centers. Millions of people have visited the Garden's 26
gardens and four natural areas, uniquely situated on 385 acres
on and around nine islands, with six miles of lake shoreline.
Funding is for the Lightscape event and the Garden's Bees &
Beyond education series.
The sponsorship level is a set amount for
Lightscape.4/30/2021 45
Logo
recognition
online and on-
site promotion;
discounted
ticket offers for
Lightscape
10
36 CHICAGO CHILDRENS ADVOCACY1240 S. Damen Chicago, IL,
60608
Health & Social
ServicesYes
ChicagoCAC is the city’s only nonprofit organization that
coordinates the efforts of child protection staff, law
enforcement professionals, family advocates, medical
experts, and mental health clinicians under one roof with the
goal of reducing trauma so that children and families can
start the healing process. Funding is for the annual dinner and
fall event.
Sponsorships for both events are set amounts. 4/30/2021 20
Tickets to event
and logo
placement
0.5
37 CHICAGO CHILDRENS CHOIR 78 E. Washington Culture & Arts Yes
The CCC ensures all students have access to choral music in-
school and after-school choral programs in Pilsen and Little
Village. Funding for this program supports serves 8 Chicago
Public Schools in Pilsen and Little Village, providing over
270 students, ages 8-14, with weekly choral music
instruction at their school for 30 weeks.
Support for this program funds the Pilsen/Little
Village Neighborhood Choir Program at the Arturo
Velasquez Institute, CCC serves over 60 students,
ages 8-14, through twice-weekly choral music
training during after-school hours for 36 weeks.
Support for this organization was maintained even
though programming was affected by the pandemic.
5/12/2021 10
Logo
recognition on
the website
0.5
Docket No. 22-____ComEd Ex. 1.02 Page 51 of 176

WP 7Page 4 of 17
Subpage 8 of 35
38 CHICAGO CHILDRENS THEATRE
1464 N. Milwaukee Avenue,
Second Floor
Chicago, IL 60622
Culture & Arts Yes
Chicago Children's Theatre (CCT) aspires to enrich our
community through diverse and significant theatrical and
educational programming that engages and inspires the child
in all of us. CCT achieves its mission through the creation of
awe-inducing theatrical productions and programs with an
emphasis on inclusion, accessibility and affordability;
inspiring young people and families to lead lives of
adventure, courage, and curiosity. The funding was for
season general-operating support.
CCT is a mid-sized theatre, but the only one of its
kind in the area, so ComEd determined that a mid-
level sponsorship of $20,000 was appropriate.
7/20/2021 15
Logo
recognition on
the website
0.25
39 CHICAGO COMMONS ASSOC515 E. 50th Street
CHICAGO, IL 60657Education Yes
Chicago Commons was founded as a settlement house in
1894. Since its founding they have operated with the mission
to partner with individuals, families and communities to
overcome poverty, discrimination and isolation. Chicago
Commons has centered our services in communities of the
highest need to provide our neighbors with the tools and
skills they need to reach their greatest potential. Commons is
a leading provider of high-quality early childhood education
and senior services, operating four early education schools in
West Humboldt Park, Pilsen and Back of the Yards. While
children are being educated and cared for, their
parents/families can also receive comprehensive services
through our Family Hub program. For seniors, they provide
in home care and adult day services, so they stay in their
homes to delay, and in some cases prevent, the need for
higher cost nursing home/institutional care. Funding
supported the Young Professionals' event and the anniversary
dinner.
Sponsorships ranged between $500 and $10,000, so
ComEd's level was high range in 2021.8/27/2021 10
Logo
recognition
online
0.75
40 CHICAGO DEFENDER CHARITIES INC
200 S. Michigan Ave
Suite 1700
Chicago, IL 60604
Community &
Economic DevelopmentYes
Founded April 2, 1945, the Chicago Defender Charities'
purpose then as now is to promote, hold, operate and
conduct exhibitions, meets, contests, parades, concerts,
shows, parties, seminars, festivals, picnics, dinners, forums
and meetings; to aid the infirm, poor, needy, unfortunate and
deserving individuals; to give to religious institutions,
churches, schools, religious and social clubs, hospitals and
sanitariums; to give away money and other property to
charity and other purposes as above set forth. The Chicago
Defender, for 100 years, has been the voice of the African-
American Community in Chicago and across the United
States. Funding supported the Bud Biliken Parade.
The donation is a set amount by the nonprofit to be a
part of the parade.6/25/2021 25
Logo
recognition
online and ad
placement in
the virtual
program
1
41 CHICAGO FOUNDATION FOR WOMEN
One East Wacker Dr Ste
1620
Chicago, IL 60601
Health & Social
ServicesYes
Chicago Foundation for Women (CFW) was established in
1985 by four Chicago- area women to increase opportunities
and resources targeted to women and girls. Throughout its
history, CFW has been the only organization in the region to
take a comprehensive approach to understanding and
addressing issues impacting Chicago-area women and girls
through every stage of their lives. Since its inception,
Chicago Foundation for Women has distributed nearly 3,000
grants totaling approximately $26 million to hundreds of
organizations serving women and girls in the metropolitan
Chicago area. Chicago Foundation for Women envisions a
community and world in which all women and girls have the
opportunity to achieve their full potential and live in safe,
just, and healthy communities. Funding was for CFW's
Luncheon and Symposium.
CFW is the largest organization of its kind in the
area. Sponsorship levels range between $5,000 and
$50,000, so ComEd selected mid-range.
7/28/2021 35
Logo
placement and
ticekts to
luncheon
0.5
Docket No. 22-____ComEd Ex. 1.02 Page 52 of 176
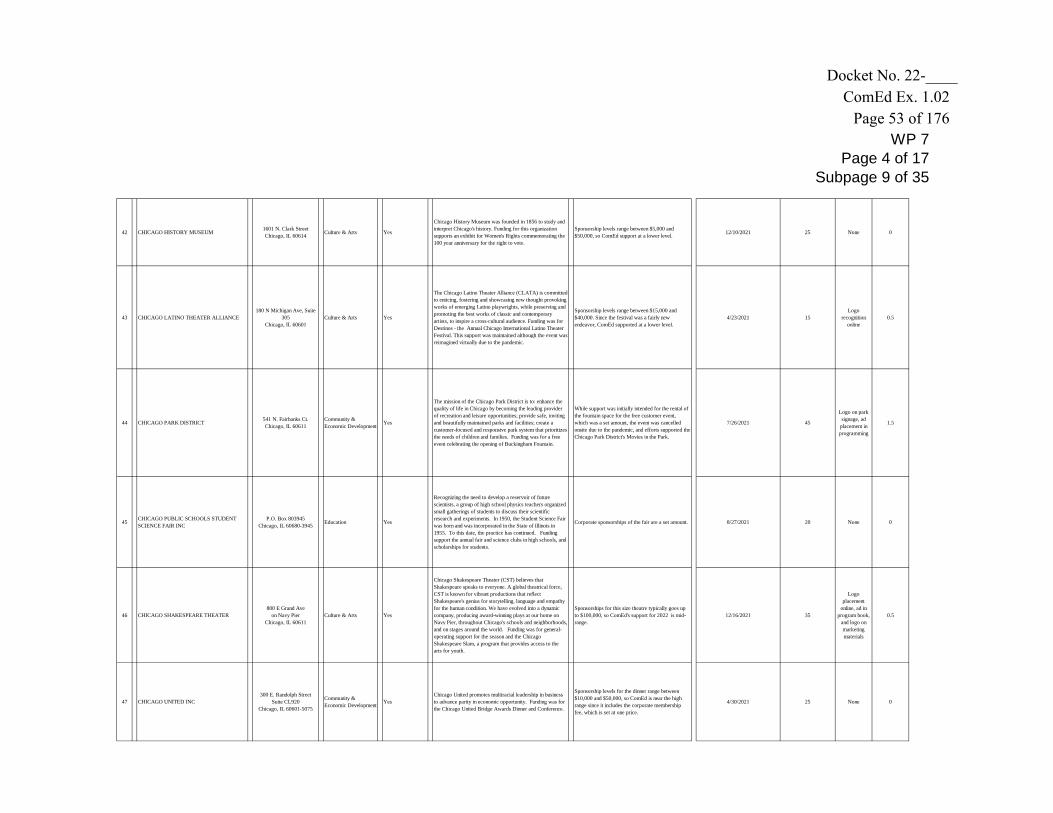
WP 7Page 4 of 17
Subpage 9 of 35
42 CHICAGO HISTORY MUSEUM1601 N. Clark Street
Chicago, IL 60614Culture & Arts Yes
Chicago History Museum was founded in 1856 to study and
interpret Chicago's history. Funding for this organization
supports an exhibit for Women's Rights commemorating the
100 year anniversary for the right to vote.
Sponsorship levels range between $5,000 and
$50,000, so ComEd support at a lower level.12/10/2021 25 None 0
43 CHICAGO LATINO THEATER ALLIANCE
180 N Michigan Ave, Suite
305
Chicago, IL 60601
Culture & Arts Yes
The Chicago Latino Theater Alliance (CLATA) is committed
to enticing, fostering and showcasing new thought provoking
works of emerging Latino playwrights, while preserving and
promoting the best works of classic and contemporary
artists, to inspire a cross-cultural audience. Funding was for
Destinos - the Annual Chicago International Latino Theater
Festival. This support was maintained although the event was
reimagined virtually due to the pandemic.
Sponsorship levels range between $15,000 and
$40,000. Since the festival was a fairly new
endeavor, ComEd supported at a lower level.
4/23/2021 15
Logo
recognition
online
0.5
44 CHICAGO PARK DISTRICT541 N. Fairbanks Ct.
Chicago, IL 60611
Community &
Economic DevelopmentYes
The mission of the Chicago Park District is to: enhance the
quality of life in Chicago by becoming the leading provider
of recreation and leisure opportunities; provide safe, inviting
and beautifully maintained parks and facilities; create a
customer-focused and responsive park system that prioritizes
the needs of children and families. Funding was for a free
event celebrating the opening of Buckingham Fountain.
While support was initially intended for the rental of
the fountain space for the free customer event,
which was a set amount, the event was cancelled
onsite due to the pandemic, and efforts supported the
Chicago Park District's Movies in the Park.
7/26/2021 45
Logo on park
signage, ad
placement in
programming
1.5
45CHICAGO PUBLIC SCHOOLS STUDENT
SCIENCE FAIR INC
P.O. Box 803945
Chicago, IL 60680-3945Education Yes
Recognizing the need to develop a reservoir of future
scientists, a group of high school physics teachers organized
small gatherings of students to discuss their scientific
research and experiments. In 1950, the Student Science Fair
was born and was incorporated in the State of Illinois in
1955. To this date, the practice has continued. Funding
support the annual fair and science clubs in high schools, and
scholarships for students.
Corporate sponsorships of the fair are a set amount. 8/27/2021 20 None 0
46 CHICAGO SHAKESPEARE THEATER
800 E Grand Ave
on Navy Pier
Chicago, IL 60611
Culture & Arts Yes
Chicago Shakespeare Theater (CST) believes that
Shakespeare speaks to everyone. A global theatrical force,
CST is known for vibrant productions that reflect
Shakespeare's genius for storytelling, language and empathy
for the human condition. We have evolved into a dynamic
company, producing award-winning plays at our home on
Navy Pier, throughout Chicago's schools and neighborhoods,
and on stages around the world. Funding was for general-
operating support for the season and the Chicago
Shakespeare Slam, a program that provides access to the
arts for youth.
Sponsorships for this size theatre typically goes up
to $100,000, so ComEd's support for 2022 is mid-
range.
12/16/2021 35
Logo
placement
online, ad in
program book,
and logo on
marketing
materials
0.5
47 CHICAGO UNITED INC
300 E. Randolph Street
Suite CL920
Chicago, IL 60601-5075
Community &
Economic DevelopmentYes
Chicago United promotes multiracial leadership in business
to advance parity in economic opportunity. Funding was for
the Chicago United Bridge Awards Dinner and Conference.
Sponsorship levels for the dinner range between
$10,000 and $50,000, so ComEd is near the high
range since it includes the corporate membership
fee, which is set at one price.
4/30/2021 25 None 0
Docket No. 22-____ComEd Ex. 1.02 Page 53 of 176

WP 7Page 4 of 17
Subpage 10 of 35
48 CHICAGO URBAN LEAGUE4510 S. Michigan Avenue
Chicago, IL 60653Culture & Arts Yes
The Chicago Urban League (CUL) works for economic,
educational and social progress for African Americans and
promotes strong, sustainable communities through advocacy,
collaboration and innovation. Funding supported a
scholarship program for local students and the Golden
Fellowship Dinner.
The amount for the scholarship program at $50,000
was determined based on discussions of needs of
low-income students, and ComEd supported the
annual dinner at a mid-range price $25,000, and
$5,000 was in support of the annual summit.
4/23/2021
7/24/202180
Logo
placement for
both events
1.5
49 CHICAGO ZOOLOGICAL SOCIETY3300 Golf Road
Brookfield, IL 60513Environment Yes
The mission of the Chicago Zoological Society/Brookfield
Zoo is to inspire conservation leadership by connecting
people with wildlife and nature. Funding was for the annual
Holiday Magic event and the annual dinner.
The amount was determined by the budget on what it
takes to put on Holiday Magic. 9/24/2021 90
ComEd logo on
website;
Discounted
offer for
customers
10
50CHICAGOLAND CHAMBER OF
COMMERCE410 N. Michigan Avenue
Community &
Economic DevelopmentYes
The Chicagoland Chamber of Commerce Foundation
coordinates the educational programs and key resources that
assist the Chamber as it collaborates with strategic partners
and community organizations to address the dominant
business issues confronting the region, to drive a dynamic
economy, and to make metropolitan Chicago a world-class
place to work and live. Funding supports the Chamber's
Leadership Academy.
Sponsorship for this program supports a year-long
development program for businesses and
entrepreneurs. ComEd branding is included in
program materials.
10/27/2021 35 None 0
51 CHILDS VOICE SCHOOL180 Hansen Ct #100, Wood
Dale, IL 60191
Energy Empowerment
in Our CommunitiesYes
Funds raised through their virtual golf outing are used to
support educational programs for children with difficulty
hearing. Tuition assistance for those in need books, class
materal and general support as needed Partnership enables
opportunites to introduce ComEd STEM to this population of
students, EE information, safety town and Customer
Assistance programs.
Non for profit organization that supports children
with hearing difficulties. Funds raised support the
program
10/25/2021 1 None 0
52 CHINESE AMERICAN SERV. LEAGUE2141 S. Tan Court
Chicago, IL 60616
Health & Social
ServicesYes
A nurturing hub within the heart of Chinatown, the Chinese
American Service League (CASL) connects families and
individuals of all ages with the vital support they need to
thrive and contribute to the greater Chicago community. In
the fall of 1978, ten dedicated Chinese Americans came
together to bridge the gap in services for Chinese American
immigrants in Chicago. Their passion and commitment
ignited the spark for the Chinese American Service League
(CASL), which has since burgeoned into a nurturing hub in
the heart of Chinatown. Funding was for the annual gala,
which was maintained despite the virtual reimagining due to
the pandemic, and a program to teach senior citizens about
DIY Weatherization.
Funding was split between the two programs.
Dinner funding goes up to $35,000, so ComEd's
support was at mid-range, and the program grant
amount was determined based on seniors served.
6/25/2021 15 None 0
Docket No. 22-____ComEd Ex. 1.02 Page 54 of 176

WP 7Page 4 of 17
Subpage 11 of 35
53 CLEAN ENERGY TRUST20 N. Upper Wacker Drive
#734 Chicago, IL 60606Environment Yes
Clean Energy Trust brings cleantech innovation to market by
finding, funding, and growing high-impact cleantech startups
from the Midwest. Structured as a nonprofit, Clean Energy
Trust makes seed investments and provides patient, hands-on
support to help entrepreneurs scale and succeed. To date,
Clean Energy Trust has invested in 31 companies across the
Midwest. Clean Energy Trust works to demonstrate that
investing in and supporting early-stage cleantech innovation
can yield financial returns and positive impact. We believe
entrepreneurship and innovation are powerful forces that can
be leveraged to address environmental challenges, create
jobs, and generate investment returns. The donation supports
a business plan competition and convening of thought
leaders.
Funding supports the production of a business plan
competition to encourage stakeholders and thought
leaders innovative ways to address climate change.
ComEd branding included in the program.
11/18/2021 20
Logo
placement on
the website
0.25
54 COOK COUNTY HEALTH FOUNDATION1603 Orrington Avenue
Evanston IL 60201African-American Yes
The Cook County Health Foundation is a non-profit founded
to advocate and raise funds for programs and services that
improve quality patient care and meet the health care needs
of the communities served by the Cook County Health &
Hospitals System (CCHHS). Funding supported a table at
the annual dinner.
Sponsorship levels for the dinner range between
$5,000 county $50,000, so ComEd is in the mid-
range.
8/27/2021 35Table and logo
placement1
55 DEKALB EDUCATION FOUNDATIONP.O. Box 412 Dekalb, Il
60115Education Yes
Investing in the future, this educational organization develops
and dedicates resources, supports innovation, and creates
partnerships to enhance student learning and well-being.
Funding supports the purchase of electric vehicles and
charging stations with the purpose of addressing air pollution
and introducing students to EV technology, providing them
with the opportunity to learn how to safely and efficiently
operate EVs and learn about environmentally friendly
vehicles.
Funding for the purchase of an electric vehicle. 8/20/2021 50 None 0
56 DEPAUL COLLEGE PREP3633 N. California Ave.
Chicago IL 60618Education Yes
DePaul College Prep provides a challenging Catholic,
college-prep education for young women and men. Funding
was for the ComEd Scholars Program, which encourages
high school students to pursue university studies an a career
in STEM fields.
Funding was determined based on the number of
scholarships awarded.10/27/2021 30 None 0
57 DEPAUL UNIVERSITY1 E Jackson Blvd, Chicago,
IL 60604Education Yes
As a university, DePaul pursues the preservation, enrichment,
and transmission of knowledge and culture across a broad
scope of academic disciplines. It treasures its deep roots in
the wisdom nourished in Catholic universities from medieval
times. The principal distinguishing marks of the university
are its Catholic, Vincentian, and urban character. Support for
this donation is to fund scholarships for eligible students
pursuing STEM and business degrees.
Funding was determined based on the number of
scholarships awarded12/16/2021 288 None 0
Docket No. 22-____ComEd Ex. 1.02 Page 55 of 176

WP 7Page 4 of 17
Subpage 12 of 35
58 DISCOVERY CENTER MUSEUM711 N. MAIN STREET
ROCKFORD IL 61103Culture & Arts Yes
Discovery Center's mission is to create opportunities for
joyful learning and discovery through hands-on experiences
in the sciences and arts. Discovery Center is a participatory
museum created to provide hands-on learning experiences for
visitors of all ages. The exhibits and programs provide an
enriching, challenging and fun environment designed to
stimulate curiosity and to promote interest in science,
technology, engineering, arts and mathematics. Funding was
to support an exhibit designed to teach visitors about energy
and energy efficiency.
Annual funding to support the exhibit was
determined as an appropriate amount based on the
size of the museum, which is the largest in the
Rockford area.
7/27/2021 20
Logo
placement on
the website
0.5
59 DIST NO 90 EDUCATION FOUNDATION1100 E Indiana Avenue
Pontiac, IL 61764Education Yes
Investing in the future, this educational organization develops
and dedicates resources, supports innovation, and creates
partnerships to enhance student learning and well-being.
Funding supports the purchase of electric vehicles and
charging stations with the purpose of addressing air pollution
and introducing students to EV technology, providing them
with the opportunity to learn how to safely and efficiently
operate EVs and learn about environmentally friendly
vehicles.
Funding for the purchase of an electric vehicle. 9/28/2021 50 None 0
60 DUPAGE HABITAT FOR HUMANITY1600 E Roosevelt
Wheaton, IL 60187
Community &
Economic DevelopmentYes
DuPage Habitat is a locally run affiliate of Habitat for
Humanity International®, a nonprofit, ecumenical Christian
housing organization. We work in partnership with families
and the community to build affordable housing at no profit.
Our vision is a world where everyone has a decent place to
live. Habitat is on the front end of energy efficiency,
partnering with emerging "green" technology within the
construction and building industry. Funding was continued
housing programs and for the DuPage Habitat for Humanity
Annual Golf Tournament, and support for Build Days in the
fall. Because of COVID-19, these events were cancelled.
ComEd supported the housing program with a
$14,000 grant and the foursome was a set amount of
$1,000. ComEd support was also directed to an
additional Build Day in the fall. Funding was
maintained even though the events were impacted by
the pandemic.
6/28/2021 11
Foursome at
golf outing;
Women's Build
volunteer event
3
61 EL VALOR CORPORATION1850 W. 21st Street,
Chicago, IL 60608
Health & Social
ServicesYes
El Valor is a non-profit community-based organization
founded in 1973 by the late Guadalupe A. Reyes. A visionary
leader and mother, Mrs. Reyes dreamed of a community in
which all members, including her son with special needs,
could live, learn and work. She and several others took out a
small bank loan and borrowed a church basement in Pilsen
where they started the first bilingual, bicultural rehabilitation
center in Illinois, and named it El Valor, meaning "courage."
From its roots in the Latino community, El Valor has grown
into a multicultural, multipurpose organization that reaches
thousands of families in the Chicagoland area, and millions
throughout the nation. Funding was for the annual Don
Quixote dinner.
Funding levels are between $5,000 and $50,000, so
ComEd came in at the mid-range.11/18/2021 25
Logo
placement on
the website
0.25
62 ELGIN SYMPHONY ORCHESTRA20 DuPage Court
Elgin, IL 60120Culture & Arts Yes
Founded in 1950 by Douglas Steensland of Elgin Community
College, the Elgin Symphony Orchestra's (ESO) mission is to
serve and engage a broad audience through the performance
of powerful symphonic music and dynamic educational
programs while developing strong community relationships.
The orchestra's guiding principle is to remain a recognized
model of artistic excellence and community engagement with
structural pillars including excellent musicians, innovative
educational and community-driven programs, strong
leadership, and actively involved board members and
volunteers. Funding is a general-operating grant.
The lower-range level was determined to be
appropriate based on the size of the symphony.7/27/2021 10
Logo
placement on
the website
0.25
Docket No. 22-____ComEd Ex. 1.02 Page 56 of 176

WP 7Page 4 of 17
Subpage 13 of 35
63 EMBARC INCPO Box 221450
Chicago, IL 60622Culture & Arts Yes
Embarc is a three-year program that provides
community-driven, experienced-based learning
opportunities to low-income High School
students to inspire and prepare them for college
and career success. Funding was for EMBARC's Variety
Spectacular.
Sponsorship levels go up to $25,000, so ComEd was
at the lower range.6/1/2021 5 None 0
64 ERIE NEIGHBORHOOD HOUSE1701 W. Superior St
Chicago IL 60622Education Yes
Since 1870, Erie Neighborhood House has been an agent of
hope and change to immigrant and low-income communities
in Chicago, enabling children to develop to their fullest
potential and families to meet the challenges of poverty and
build a brighter future. Erie House’s mission is to promote a
just and inclusive society by strengthening low-income,
primarily Latino families through skill building, access to
critical resources, advocacy, and collaborative action. With
two sites in West Town, a site in Humboldt Park, and a
community center in Little Village, Erie House provides
services to over 6,500 individuals annually that help
strengthen community, build leadership, and encourage civic
engagement. Funding was for Future of Promise Annual
Dinner, held virtually in 2021.
Sponsorship levels go up to $50,000, so ComEd's
funding is at a mid level. 11/18/2021 25 None 0
65 FAITH IN PLACE70 E Lake Street, Suite 920
Chicago, IL 60601Culture & Arts Yes
Faith in Place is a fifteen-year-old nonprofit with a long
history of inspiring positive environmental behavior change in
partnerships with religious communities across Illinois. Faith
in Place was founded in 1999 (incorporated in 2004) in
Chicago, IL, where the majority of our outreach continues to
happen. Faith in Place has partnered with more than 1,000
congregations of all faiths from every corner of Illinois --
Baha'i, Buddhist, Christian, Hindu, Jewish, Muslim, Sikh,
and Zoroastrian -- to educate, connect, and advocate around
the teachings of faith for living out practices of better Earth
care. Faith in Place's mission is to inspire people of diverse
faiths to care for the earth through connection, education,
and advocacy. Unity of purpose emerges from an astounding
diversity of beliefs and belief systems. This mission is
implemented through four program areas at partner
congregations: 1) energy and climate change, 2) water
preservation, 3) sustainable land and food, and 4)
environmental advocacy. Funding was for the Eco-
Ambassadors Summer Program, and COVID-19 relief
support.
Funding was determined to be appropriate based on
discussions between ComEd and the organization
regarding how many students are served and what
they needed to operate the program. $2,000 was
directed for the organization's effort for COVID-19
relief to support families.
4/27/2021 13
Logo
placement on
the website and
access to the
virtual Green
Team Summit
0.5
66 FEDERATION OF WOMEN216 W. Jackson Blvd., #625,
Chicago, IL 60606
Community &
Economic DevelopmentYes
The Federation of Women Contractors (FWC) has been in
existence since 1989 and is committed to the advancement of
entrepreneurial women in the construction industry. The 100-
plus members of FWC include general contractors, sub-
contractors, suppliers and service related firms representing
every facet and component of construction. The funding is
for the annual fundraiser.
Level are between $5,000 and $25,000, so ComEd
came in at a lower amount.6/25/2021 8
Tickets to event
and logo
placement
0.5
67 FOX VALLEY UNITED WAY44 East Galena Blvd
Aurora, IL 60505
Community &
Economic DevelopmentYes
The mission of Fox Valley United Way is to measurably
improve lives in the communities we serve. We accomplish
this by focusing support in in the following areas: Health,
Education and Income. Funding was Annual Campaign
Support.
ComEd supports numerous United Ways in the
service territory to help customers in the greatest
need. Amounts are determined by the people served
by each United Way and the level of need in the
areas.
4/7/2021 15 None 0
Docket No. 22-____ComEd Ex. 1.02 Page 57 of 176

WP 7Page 4 of 17
Subpage 14 of 35
68GARFIELD PARK CONSERVATORY
ALLIANCE300 N. Central Park Ave Environment Yes
The Garfield Park Conservatory Alliance changes lives
through the power of nature. We inspire, educate and
provoke exploration through innovative programs and
experiences in one of the nation’s largest and finest historic
conservatories. Funding for Fleurotica.
ComEd provided a mid-level contribution for the
events.6/25/2021 10
Logo
recognition
online, ad in the
virtual program
book
0.5
69 GILLOURY INSTITUTE6 E Monroe St #801
Chicago, IL 60603Culture & Arts Yes
Silk Road Rising's mission is to advance citizenship and
cultural understandings with theatre based work created
through Asian American and Middle Eastern American
lenses. Silk Road Rising recognizes that different cultures are
inherently linked. We seek to illuminate the intersections of
cultures without denying their specificity. We strive to foster
a world that values art over ideology and inquiry over
dogma. We provide a space for diverse voices to express
their own distinct stories and, through this shared experience,
facilitate much-needed cross-cultural dialogue and
awareness. Funding is for general-operating support for the
season.
Silk Road is a mid-sized theatre company -- and the
only of its size dedicated to diversity & tolerance --
so ComEd determined that $25,000 to fund their
efforts was an appropriate level of support.
4/30/2021 25
Logo
placement on
the website
0.25
70GIRL SCOUTS OF GREATER CHICAGO
AND NORTHWEST INDIANA
20 S Clark Street, Suite 200
Chicago, IL
Health & Human
ServicesYes
Girl Scouting builds girls of courage, confidence, and
character, who make the world a better place. Funding
supports the Tribute to Achievement Dinner.
Sponsorship levels ranged between $5,000 and
$25,000, so ComEd's support was lower-range. A
table is included for the dinner.
4/23/2021 10 Table of 10 0.75
71 GLENWOOD ACADEMY500 W. 187th St Glenwood
IL 60425Education Yes
Glenwood Academy is a 501(c)3 nonprofit, private
residential education community for children in grades 2 - 8
that are academically capable but come from challenging
circumstances. Glenwood educates more than 150 students
on a campus located in Glenwood, Ill., about 35 miles south
of Chicago. Nearly 100% of our children live below or at the
poverty line and 92% of our children are from single-parent
households. Glenwood Academy serves students by
providing individualized instruction with small class sizes
during the school day and a safe and supportive residential
community to call home Sunday evening through Friday
afternoon. Our students benefit from a structured and
nurturing environment enabling them to focus and take
advantage of academic and extracurricular opportunities to
better their futures. Funding for Thanksgiving Luncheon.
Sponsorships range between $2,500 and $25,000, so
ComEd's support is in the lower-range. The donation
was intended to cover a table, but the event was
cancelled.
10/27/2021 5 None 0
72 GOODMAN THEATRE170 N. Dearborn St.
Chicago, IL 60601Culture & Arts Yes
Goodman Theatre seeks to be the premier cultural institution
in Chicago through the unsurpassed quality, range and
diversity of its productions and programs, and through its
commitment to improving the quality of life in the
community. Funding was for youth program GoodWork.
Season support for the Goodman is directed to their
youth programming efforts. 7/26/2021 45
Logo
recognition
online
0.5
Docket No. 22-____ComEd Ex. 1.02 Page 58 of 176

WP 7Page 4 of 17
Subpage 15 of 35
73GOVERNORS STATE UNIVERSITY
FOUNDATION
1 University Parkway
University Park IL 60466-
0975
Education Yes
Governors State University is committed to offering an
exceptional and accessible education that prepares students
with the knowledge, skills and confidence to succeed in a
global society. Funding was for the institution's efforts to
help raise funds for scholarships.
Sponsorship levels ranged between $5,000 and
$25,000, so ComEd's support was at the higher-
range.
4/5/2021 20
Name
recognition on
the website
0.25
74 GRANT PARK ORCHESTRAL205 East Randolph Street
Chicago, IL 60601Culture & Arts Yes
The mission of the Grant Park Music Festival is to provide
the highest quality, free, classical music concerts in the
world. The Festival's core purpose is to enrich lives through
the power of music, with emphasis on the values of
openness, excellence, creativity, and service. Major goals
include being essential to the vitality of the city, connecting
people of all backgrounds to symphonic music; thrilling
audiences with outstanding musical experiences not found
anywhere else; and preserving the Festival as a unique
cultural asset. Funding was for season sponsorship.
Season support levels aren't publicly available due to
confidential meetings between the organization and
funders, but are believed to go up to $100,000 for
this group, so ComEd's supports is in the lower
range. All concerts are free to the public.
5/19/2021 20
Logo
placement on
the website
0.25
75GREEN ERA EDUCATIONAL NFP C/O
URBAN GROWERS COLLECTIVE1200 W 35th Street
Community &
Economic DevelopmentYes
Green Era Educational NFP's mission is rooted in growing
food, cultivating nourishing environments which support
health, economic development, healing and creativity
through urban agriculture. Funding was for the ComEd
Community Farm, and will allow their youth group to expand
work between learning of STEAM to careers in energy and
public service.
ComEd worked with Urban Growers Collective to
determine the cost of engaging students with full-
time staff and a stipend for the summer, as well as
supplies needed for the project. The project was
paused due to the pandemic , but the support
remained the same.
4/30/2021 40 Logo regonition 0.25
76 GSJ FAMILY LIFE CENTER1256 N. Waller Chicago, IL
60651Education Yes
This event is an annual community festival designed to
celebrate residents and raise funds for at-risk students in the
community. Students are provided school materials at this
event such as book-bags, notebooks, pens and other school
supplies. ComEd can also have a table at this event and
speak to attendees regarding Powering People Campaign.
Donation supported annual community festival. 10/28/2021 3 None 0
77 HANA CENTER4300 N. California Avenue
Chicago IL 60618
Health & Social
ServicesYes
HANA Center's mission is to empower Korean American,
immigrant, and multi-ethnic communities through social
services, education, culture, and community organizing to
advance human rights. Funding was for their Root to Fruit
fundraiser.
Sponsorship levels ranged between $5,000 and
$25,000, so ComEd's support was low range.4/23/2021 5 None 0
Docket No. 22-____ComEd Ex. 1.02 Page 59 of 176

WP 7Page 4 of 17
Subpage 16 of 35
78HISPANIC AMERICAN CONSTRUCTION
INDUSTRY ASSOCIATION
650 W. Lake Street
Ste. 415
Chicago, IL 60661
Community &
Economic DevelopmentYes
The Hispanic American Construction Industry Association
(HACIA) works to ensure the equitable participation of its
constituents in the construction industry, while also
promoting the growth, quality of work, professionalism and
integrity of these individuals and businesses. Funding
supports scholarships for students and the annual fundraising
reception.
Scholarship amount was $10,000 of the funding,
with the reception being mid-range at $10,000. 10/27/2021 20 None 0
79HOPE TECHNOLOGY AND EDUCATION
CENTER
1354 W 61st St, Chicago, IL
60636
Health & Social
ServicesYes
The Hope Technology and Education Center assists the
residents of the Austin Community to Excel through
Education, Affordable Housing, Technology Assistance and
Entrepreneurial Support.
They are conducting virtual classes for children
ranging from headstart to second grade four days per
week. They deliver homework packets weekly to
keep children engaged in learning. They also
provide care packages and food delivery for seniors
weekly.
7/21/2021 2 None 0
80HUNTLEY COMMUNITY SCHOOL
DISTRICT 158
650 Academic Drive
Algonquin, IL 60102Education Yes
To help the program achieve its goal to embed the nationally
recognized INCUbator curriculum in the Huntley School
District and leverage the power of partnership between
communities, school districts, economic development
organizations and businesses to build the next generation of
entrepreneurs who can identify and solve problems.
Sponsorship levels range based on levels 1 to 4 so
ComEd is at the low range.6/28/2021 1
Logo
placement
online
0.25
81IBEW LOCAL 134 HELPING HANDS
CHARITABLE TRUST
2722 S King Dr
Chicago, IL 60616
Health and Human
ServicesYes
Provides assistance to union members who are in need due to
lack of employment, financial emergencies, personnel
tragedies, and other issues that may occur in a member’s life
which shows support for those in need.
Sponsorship amounts vary from 5,000 to 50,000 and
support was at the lower end11/8/2021 5
Logo
placement on
the website
0.25
82 IGNITE ORG 180 N. Michigan Avenue Education Yes
Ignite offers a comprehensive continuum of services to young
people between the ages of 14 to 26 who are unstably
housed or experiencing homelessness. Beyond meeting
youth's immediate needs, our services provide youth with all
the tools and support they need to succeed: stable housing;
access to employment and education opportunities; primary
and mental health care; lasting connections with caring
adults, and the skills to live a healthy and independent life.
Sponsorship supports a workforce readiness program to
connect young people with the skills they need to be work
ready.
Sponsorship amounts vary from 5,000 to 50,000 and
support was at the lower end10/6/2021 5 None 0
83 ILLINOIS INSTITUTE OF TECHNOLOGY Chicago IL 60654 Education Yes
The Illinois Tech ComEd Scholarship Initiative focuses on
raising up deserving undergraduate students from the City of
Chicago and/or Northern Illinois (ComEd's service territory)
providing them with an extraordinary Illinois Tech education.
Eligible students will be second-year students majoring in the
fields of study identified below who (i) are members of
historically underrepresented populations and/or veterans,
and (ii) had demonstrated financial need at the time of
admission to Illinois Tech. First preference will be given to
students pursuing degrees in electrical engineering, with
second preference to students pursuing degrees in mechanical
engineering, and third preference to students pursuing
degrees in computer engineering.
Funding was determined based on the number of
scholarships awarded.12/16/2021 300 None 0
Docket No. 22-____ComEd Ex. 1.02 Page 60 of 176

WP 7Page 4 of 17
Subpage 17 of 35
84ILLINOIS SCIENCE AND ENERGY
INNOVATION FOUNDATION
18 South Michigan Avenue,
12th Floor, Chicago, IL
60603
Education Yes
The Illinois Science and Energy Innovation Foundation
(ISEIF) was created to inform and engage Illinois consumers
in the transformation to a digital electric grid. ISEIF
accomplishes this through funding innovative education,
outreach, and research projects in correspondence with smart
meter deployment timelines.
Per the Public Utilities Act (220 ILCS 5/), each
participating utility shall pay a pro rata share, based
on number of customers, of $5,000,000 per year to
the trust or foundation established pursuant to
Section 16-108.7 of this Act for each plan year of
the AMI Plan, which shall be used for purposes of
providing customer education regarding smart
meters and related consumer-facing technologies and
services and 70% of which shall be a recoverable
expense.
12/20/2021 2,693 None 0
85ILLINOIS STATE BLACK CHAMBER OF
COMMERCE
411 Hamilton Blvd. Peoria,
IL 61602Civic & Public Affairs Yes
The Illinois State Black Chamber of Commerce (ILBCC) is
the largest, most active voice for African American
businesses in the state of Illinois. As the largest Black Trade
organization in Illinois, the ILBCC is a strong advocate for
entrepreneurship serving local and regional businesses in
financial literacy, global entrepreneurship, and with various
business resources. The ILBCC's objective is to help
promote job creation and growth among African American
businesses. Funding was for ILBCC Annual Convention,
which was held virtually due to the pandemic.
The ILBCC is the largest organization of its kind in
Illinois and supported African American-owned
businesses throughout the State. For this reason,
ComEd supports the event at a higher level.
11/8/2021 20 None 0
86IMSA FUND FOR ADVANCEMENT OF
EDUCATION
1500 Sullivan Rd.
Aurora, IL 60506Education Yes
The IMSA Fund for Advancement of Education is a
501(c)(3) not-for-profit corporation organized under the Not-
For-Profit Corporation Act of the State of Illinois. The Fund
was established and is maintained as a separate corporate
entity for the purpose of benefiting, performing the functions
of, or carrying out certain charitable, educational, literary and
scientific purposes of the Illinois Mathematics and Science
Academy (IMSA), and to assist IMSA in achieving and
furthering its education, research and service goals. The
IMSA Fund receives and administers gifts and grants in
support of IMSA's work to develop talent and leadership in
math, science and technology.
The internationally recognized Illinois Mathematics and
Science Academy (IMSA) develops creative, ethical leaders
in science, technology, engineering and mathematics. As a
teaching and learning laboratory created by the State of
Illinois, IMSA enrolls academically talented Illinois students
(grades 10-12) in its advanced, residential college
preparatory program. It also serves thousands of educators
and students in Illinois and beyond through innovative
instructional programs that foster imagination and inquiry.
Funding was for the IMSA Energy Center
Funding was determined based on program budget to
run after-school energy programs for students.4/30/2021 25 None 0
87 INSTITUTO DEL PROGRESO LATINO2520 S Western Ave,
Chicago, IL 60608
Health & Social
ServicesYes
The mission is to contribute to the fullest development of
Latino immigrants and their families through education,
training, and employment that fosters full participation in the
changing US society while preserving cultural identity and
dignity. Support for this event was originally for the annual
event, Alta Cocina, which was cancelled due to the
pandemic.
Sponsorship amounts vary from 5,000 to 50,000 and
support was at the lower end.4/27/2021 10
Tickets to event
and logo
placement
0.3
Docket No. 22-____ComEd Ex. 1.02 Page 61 of 176

WP 7Page 4 of 17
Subpage 18 of 35
88 JOHN G SHEDD AQUARIUM1200 South Lake Shore Dr.
Chicago, IL 60605Culture & Arts Yes
Supporting its mission, "At Shedd Aquarium, animals
connect you to the living world, inspiring you to make a
difference," the museum offers world-class animal exhibits;
serves teens, school groups and teachers through a suite of
learning programs; provides aquatic shows, dive
presentations, animal encounters and tours for our guests; and
conducts global conservation research projects to protect
animals and their habitats. Shedd features two 15-minute 4-
D Experience movies. Combining the visual drama of a 3-D
film with a variety of sensory effects built into the seats and
theater environment, the 4-D Experience brings on-screen
images to life with added effects such as water mist, neck air
blasts, bubbles, leg ticklers, enhanced floor lighting, seat
vibrations and back pokes. Shedd offers assisted listening
devices and closed captioning upon request. The experience
is recommended for children ages four and older.
Shedd has the largest attendance of any arts &
culture venue in the city, so the amount to sponsor a
program there is higher than most partners.
9/24/2021 60
Logo at exhibit;
on website; on
screens; 100
passes for
charity auctions
10
89 JUNIOR ACHIEVEMENT OF CHICAGO651 W. Washington Blvd.,
Suite 404
Chicago, IL 60661
Education Yes
Junior Achievement of Chicago was founded locally in 1940
and sets the standard for other JA offices nationwide. JA of
Chicago is the largest area office in the nation and will reach
550,000 students during the 2015-2016 school year. In fact,
with such a strong presence throughout the franchise, one in
five students within the twelve JA of Chicago outreach
counties will receive JA programs this school year. Our
partnership with Chicago Public Schools is particularly
strong, as one in three students in CPS will receive JA
programs. JA of Chicago has also maintained exceptional
financial stability (on budget, steady cash flow, low cost per
student, and funded endowment), even during these difficult
economic times. ComEd's Support of JA's Educational
Outreach focusing on STEM programs.
The sponsorship is a set amount for STEM
programs, and ComEd determined it was an
appropriate amount for the number of students that
JA reaches with its programs.
8/27/2021 5 None 0
90JUVENILE DIABETES RESEARCH
FOUNDATION INTERNATIONAL
891 Elkridge Landing Road,
Suite 150
Linthicum MD 21090
Health & Social
ServicesYes
JDRF's mission is to accelerate life-changing breakthroughs
to cure, prevent and treat T1D and its complication Funding
was for the JDRF International One Walk.
ComEd supported the annual JDRF Walk and the
annual gala to support their research and outreach
efforts on Type 1. Sponsorship levels for the dinner
go up to $100,000, so ComEd’s $20,000 support
was lower compared to others, and the walk
sponsorship was mid-range. This donation was
maintained even though efforts for this event were
held virtually.
6/25/2021
8/27/202120
4 dinner for
virtual event;
online logo
placement and
recognition for
support of walk
0.25
91 KIDS ABOVE ALL ILLINOIS8765 W Higgins Rd Ste 450,
Chicago, IL 60631
Health & Social
ServicesYes
Formerly known as Childserv, this organization serves
families and the surrounding community by offering mental
health services to families in Lake County, so that they have
the resources to heal from trauma and improve their social,
emotional and family function.
The need for mental health services has increased
since COVID-19.11/8/2021 5 None 0
92 KISHWAUKEE UNITED WAY115 North First Street
DeKalb, IL 60115
Health & Social
ServicesYes
United Way of DeKalb and Sycamore merged and became
Kishwaukee. Kishwaukee United Way is a local
organization committed to unite people by making an impact
through community building, fundraising, and local advocacy
to address community needs, issues and concerns. Money
raised through local fundraising efforts is distributed by
volunteer allocation panels after assessing program and
service needs in the DeKalb and Sycamore areas. Funding
was for Annual Campaign Support.
ComEd supports numerous United Ways in the
service territory to help customers in the greatest
need. Amounts are determined by the people served
by each United Way and the level of need in the
areas.
4/8/2021 2 None 0
Docket No. 22-____ComEd Ex. 1.02 Page 62 of 176

WP 7Page 4 of 17
Subpage 19 of 35
93 LA RABIDA CHILDRENS HOSPITAL6501 S. Promontory Drive
Chicago, IL 60649
Health & Social
ServicesYes
La Rabida Children's Hospital provides specialized, family-
centered health care to children with medically complex
conditions, disabilities, and chronic illness. Through
expertise, compassion, and advocacy we help children and
their families reach their fullest potential, regardless of their
ability to pay. Funding was for the Friends of La Rabida
Gala/La Rabida Golf Classic and Awards Dinner.
La Rabida is critical to low-income customers, as it
helps children who are sick and need care regardless
of the ability to pay. ComEd purchases a foursome
for the golf outing at $2,500 and comes in at
$12,500 for dinner.
7/20/2021 15 None 0
94 LATINO POLICY FORUM180 N Michigan, Suite 1250
Chicago, IL 60601Civic & Public Affairs Yes
The mission and purpose of the Latino Policy Forum is to
build the power, influence, and leadership of the Latino
community through collective action to transform public
policies that ensure the well being of our community and
society as a whole. Funding was for the annual luncheon.
Sponsorship levels went up to $25,000, so ComEd's
support was in the mid-range.8/26/2021 15
Logo
placement
online
0.25
95 LATINOS PROGRESANDO3047 W. Cermak Rd
Chicago IL 60623
Community &
Economic DevelopmentYes
Latinos Progresando's mission is to deliver high-quality
information and resources for people to build secure, healthy,
and productive lives. Founded in 1998, today, Latinos
Progresando: has built the largest Latino-led, family-based
immigration legal services program in the State of Illinois,
including an initiative focused on immigrant victims of
domestic violence; runs Teatro Americano, a theater
ensemble and arts education program; provides tuition
assistance to deserving young students through the Dr.
Angela Perez Miller Scholarship Fund; convenes The
Marshall Square Resource Network, a 30-organization
coalition working to transform Chicago's southwest side.
Funding for One Community Breakfast.
ComEd's funding for the event was in the lower
range.7/12/2021 1
Logo
recognition0.25
96 LEADERSHIP GREATER CHICAGO111 East Wacker Drive
Chicago IL 60601Civic & Public Affairs Yes
Leadership Greater Chicago creates lifelong partnerships and
develops community awareness among leaders in the Greater
Chicago region. Funding was for their annual Celebrate
Leaders benefit.
Sponsorship levels went up to $50,000, so our
support was on the mid-range.4/23/2021 20
Logo
recognition
online
0.25
97 LEAGUE OF CHICAGO THEATRES17 N Wabash #520 Chicago
IL 60602Culture & Arts Yes
The League of Chicago Theatres supports, promotes and
advocates for Chicago theatre locally, nationally and
internationally. We are dedicated to enhancing the art of
theatre in the Chicagoland area through collaborative
audience development programs, professional development
events and support services for theatres and theatre
professionals. Funding is for a program the company
administers grants to arts organizations in our service
territory that are struggling and (2) for Hot Tix, a program
that provides discounted tickets to the general public.
The budget and grant amount for the creation of the
new arts programs were determined in partnership
with the League of Chicago Theatres based on the
needs in the community.
10/26/2021 225 None 0
98 LINCOLN PARK ZOO2001 N. Clark St. Chicago,
IL 60614Environment Yes
Lincoln Park Zoo is dedicated to connecting people with
nature by providing a free, family-oriented wildlife
experience in the heart of Chicago and by advancing the
highest quality of animal care, education, science and
conservation. Funding was for ZooLights and the annual
dinner.
Lincoln Park Zoo is ComEd's highest sponsorship,
which we determine is appropriate because it
supports the zoo's free admission and programs all
year.
9/30/2021 125
Logo on
signage, ads
and printed
materials for
Zoolights;
Open days of
attendance for
Customers
during
Zoolights
0.5
Docket No. 22-____ComEd Ex. 1.02 Page 63 of 176
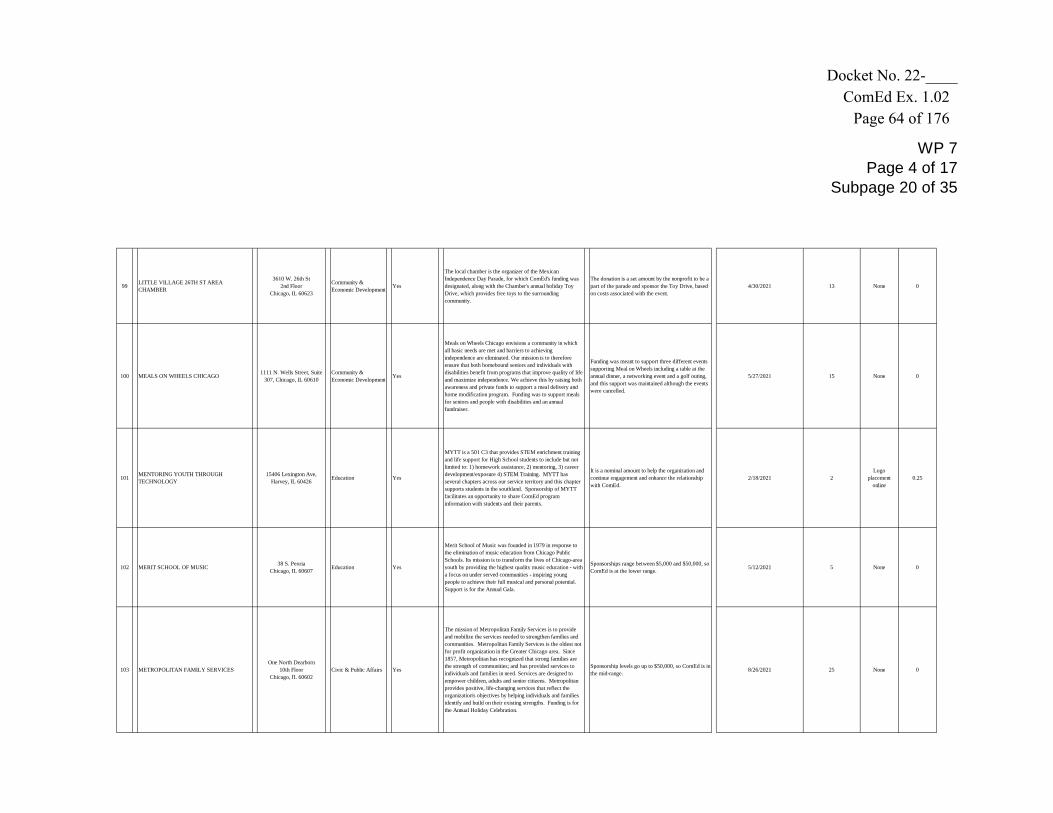
WP 7Page 4 of 17
Subpage 20 of 35
99LITTLE VILLAGE 26TH ST AREA
CHAMBER
3610 W. 26th St
2nd Floor
Chicago, IL 60623
Community &
Economic DevelopmentYes
The local chamber is the organizer of the Mexican
Independence Day Parade, for which ComEd's funding was
designated, along with the Chamber's annual holiday Toy
Drive, which provides free toys to the surrounding
community.
The donation is a set amount by the nonprofit to be a
part of the parade and sponsor the Toy Drive, based
on costs associated with the event.
4/30/2021 13 None 0
100 MEALS ON WHEELS CHICAGO1111 N. Wells Street, Suite
307, Chicago, IL 60610
Community &
Economic DevelopmentYes
Meals on Wheels Chicago envisions a community in which
all basic needs are met and barriers to achieving
independence are eliminated. Our mission is to therefore
ensure that both homebound seniors and individuals with
disabilities benefit from programs that improve quality of life
and maximize independence. We achieve this by raising both
awareness and private funds to support a meal delivery and
home modification program. Funding was to support meals
for seniors and people with disabilities and an annual
fundraiser.
Funding was meant to support three different events
supporting Meal on Wheels including a table at the
annual dinner, a networking event and a golf outing,
and this support was maintained although the events
were cancelled.
5/27/2021 15 None 0
101MENTORING YOUTH THROUGH
TECHNOLOGY
15406 Lexington Ave,
Harvey, IL 60426Education Yes
MYTT is a 501 C3 that provides STEM enrichment training
and life support for High School students to include but not
limited to: 1) homework assistance, 2) mentoring, 3) career
development/exposure 4) STEM Training. MYTT has
several chapters across our service territory and this chapter
supports students in the southland. Sponsorship of MYTT
facilitates an opportunity to share ComEd program
information with students and their parents.
It is a nominal amount to help the organization and
continue engagement and enhance the relationship
with ComEd.
2/18/2021 2
Logo
placement
online
0.25
102 MERIT SCHOOL OF MUSIC38 S. Peoria
Chicago, IL 60607Education Yes
Merit School of Music was founded in 1979 in response to
the elimination of music education from Chicago Public
Schools. Its mission is to transform the lives of Chicago-area
youth by providing the highest quality music education - with
a focus on under served communities - inspiring young
people to achieve their full musical and personal potential.
Support is for the Annual Gala.
Sponsorships range between $5,000 and $50,000, so
ComEd is at the lower range.5/12/2021 5 None 0
103 METROPOLITAN FAMILY SERVICES
One North Dearborn
10th Floor
Chicago, IL 60602
Civic & Public Affairs Yes
The mission of Metropolitan Family Services is to provide
and mobilize the services needed to strengthen families and
communities. Metropolitan Family Services is the oldest not
for profit organization in the Greater Chicago area. Since
1857, Metropolitan has recognized that strong families are
the strength of communities; and has provided services to
individuals and families in need. Services are designed to
empower children, adults and senior citizens. Metropolitan
provides positive, life-changing services that reflect the
organization's objectives by helping individuals and families
identify and build on their existing strengths. Funding is for
the Annual Holiday Celebration.
Sponsorship levels go up to $50,000, so ComEd is in
the mid-range.8/26/2021 25 None 0
Docket No. 22-____ComEd Ex. 1.02 Page 64 of 176

WP 7Page 4 of 17
Subpage 21 of 35
104 METROPOLITAN MAYORS CAUCUS
233 S. Wacker Drive, Suite
800
Chicago, IL 60606
Civic & Public Affairs Yes
The Metropolitan Mayors Caucus is a membership
organization of mayors from Northeastern Illinois' 273 cities,
towns, and villages. The Caucus pushes past geographical
boundaries and local interests to work on public policy
issues, providing a forum for metropolitan Chicago's chief
elected officials to collaborate on common problems and
work toward a common goal of improving the quality of life
for nearly 9 million people who call the region home.
ComEd's funding focused on the Powering Safe
Communities grant program, which will provide grants up to
$10,000 to municipalities for projects and initiatives that
increase safety in ComEd's service territory. Metropolitan
Mayors Caucus is overseeing the program and reviewing
applications via a competitive grant process.
The overall level of support of the program was
determined through discussions regarding the need in
the communities for safety-related funding.
6/25/2021
9/24/2021
12/17/2021
375Logo on the
website1
105 METROPOLITAN PLANNING COUNCIL
140 S. Dearborn St.
Ste. 1400
Chicago, IL 60603
Community &
Economic DevelopmentYes
Founded in 1934, the Metropolitan Planning Council (MPC)
is a nonprofit, nonpartisan group of business and civic leaders
committed to serving the public interest through the
promotion and implementation of sensible planning and
development policies necessary for a world-class Chicago
region. Funding was for the annual luncheon.
Sponsorship levels go up to $50,000, so ComEd is in
the mid-range.5/27/2021 25
Logo
recognition
online
0.5
106MEXICAN AMERICAN DEFENSE AND
EDUCATIONAL
634 S. Spring St.
Los Angeles CA 90014Civic & Public Affairs Yes
Founded in 1968, MALDEF (Mexican American Legal
Defense and Educational Fund) is the nation’s leading Latino
legal civil rights organization. Funding was for MALDEF's
2021 Chicago Awards Gala.
Sponsorship levels go up to $50,000, so ComEd’s
support was at a lower level.6/25/2021 10 Table of 10 1
107 MISERICORDIA HOME6300 Ridge Avenue
Chicago IL 60660
Health & Social
ServicesYes
The mission of Misericordia/Heart of Mercy is to support
children and adults with intellectual and developmental
disabilities who choose our community by providing the
highest quality residential, training, and employment services.
Funding was for Family Fest.
Sponsorships went up to $50,000, so ComEd came
in at a mid-range level for Family Fest.
4/30/2021
5/27/202120 None 0
108MORAINE VALLEY COMMUNITY
COLLEGE FOUNDATION
9000 West College Parkway
Palos Hills, IL 60465Education Yes
To promote and financially support college programs and
provide scholarships and financial assistance to students
while exercising prudent management and investment of
donor funds. Donation supports the Gala, Golf Outing,
STEM Expo and scholarship.
Sponsorship was set based on the scholarship and a
table at the gala, and the golf outing. The support
was maintained even though the events were
impacted by the pandemic.
2/25/2021 4 None 0
109 MORTON ARBORETUM4100 Illinois Route 53
Lisle, IL 60532Culture & Arts Yes
The Morton Arboretum's mission is to collect and study trees,
shrubs, and other plants from around the world, to display
them across naturally beautiful landscapes for people to
study and enjoy, and to learn how to grow them in ways that
enhance our environment. Our goal is to encourage the
planting and conservation of trees and other plants for a
greener, healthier, and more beautiful world. Funding was for
Illumination, their holiday lighting exhibit.
ComEd is a secondary sponsor of this event; the top
level is a six-figure donation. Customers benefit via
a buy-one, get-one free offer.
4/30/2021 45
Logo on
signage, ads
and printed
materials for
Illumination;
discounted
offer for
customers;
sponsor
preview night
tickets
5
Docket No. 22-____ComEd Ex. 1.02 Page 65 of 176
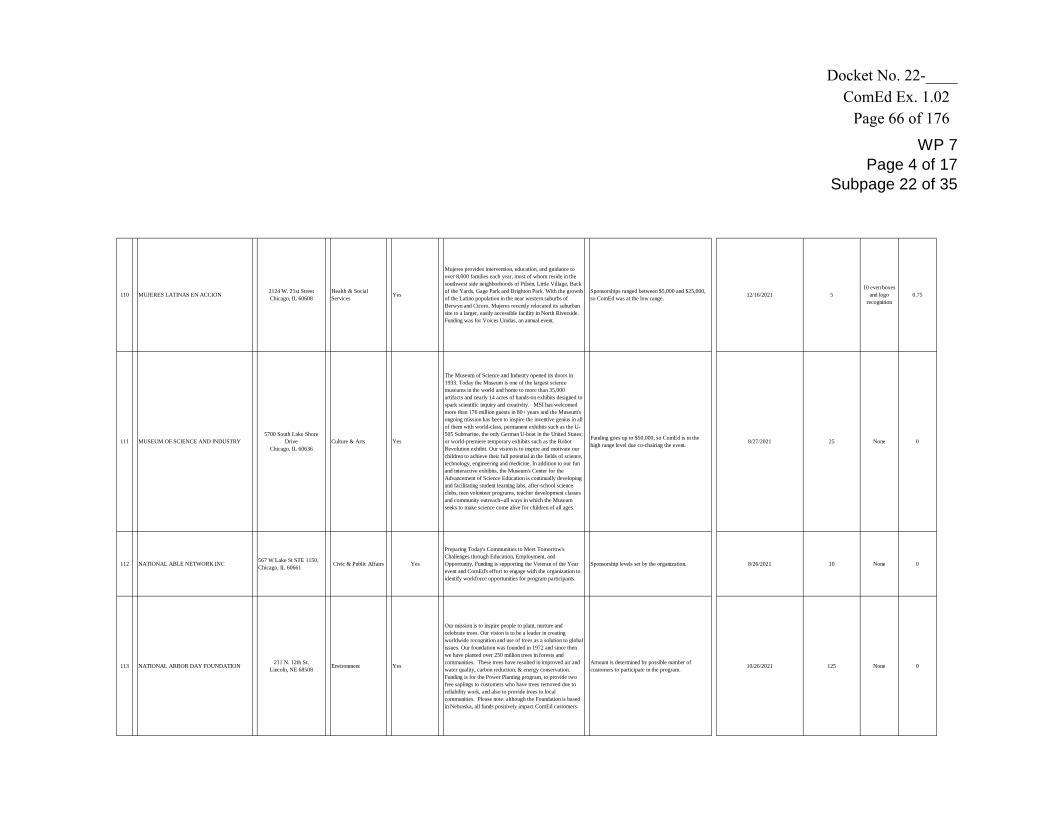
WP 7Page 4 of 17
Subpage 22 of 35
110 MUJERES LATINAS EN ACCION2124 W. 21st Street
Chicago, IL 60608
Health & Social
ServicesYes
Mujeres provides intervention, education, and guidance to
over 8,000 families each year, most of whom reside in the
southwest side neighborhoods of Pilsen, Little Village, Back
of the Yards, Gage Park and Brighton Park. With the growth
of the Latino population in the near western suburbs of
Berwyn and Cicero, Mujeres recently relocated its suburban
site to a larger, easily accessible facility in North Riverside.
Funding was for Voices Unidas, an annual event.
Sponsorships ranged between $5,000 and $25,000,
so ComEd was at the low range.12/16/2021 5
10 even boxes
and logo
recognition
0.75
111 MUSEUM OF SCIENCE AND INDUSTRY
5700 South Lake Shore
Drive
Chicago, IL 60636
Culture & Arts Yes
The Museum of Science and Industry opened its doors in
1933. Today the Museum is one of the largest science
museums in the world and home to more than 35,000
artifacts and nearly 14 acres of hands-on exhibits designed to
spark scientific inquiry and creativity. MSI has welcomed
more than 176 million guests in 80+ years and the Museum's
ongoing mission has been to inspire the inventive genius in all
of them with world-class, permanent exhibits such as the U-
505 Submarine, the only German U-boat in the United States;
or world-premiere temporary exhibits such as the Robot
Revolution exhibit. Our vision is to inspire and motivate our
children to achieve their full potential in the fields of science,
technology, engineering and medicine. In addition to our fun
and interactive exhibits, the Museum's Center for the
Advancement of Science Education is continually developing
and facilitating student learning labs, after-school science
clubs, teen volunteer programs, teacher development classes
and community outreach--all ways in which the Museum
seeks to make science come alive for children of all ages.
Funding goes up to $50,000, so ComEd is in the
high range level due co-chairing the event. 8/27/2021 25 None 0
112 NATIONAL ABLE NETWORK INC567 W Lake St STE 1150,
Chicago, IL 60661Civic & Public Affairs Yes
Preparing Today's Communities to Meet Tomorrow's
Challenges through Education, Employment, and
Opportunity. Funding is supporting the Veteran of the Year
event and ComEd's effort to engage with the organization to
identify workforce opportunities for program participants.
Sponsorship levels set by the organization. 8/26/2021 10 None 0
113 NATIONAL ARBOR DAY FOUNDATION211 N. 12th St.
Lincoln, NE 68508Environment Yes
Our mission is to inspire people to plant, nurture and
celebrate trees. Our vision is to be a leader in creating
worldwide recognition and use of trees as a solution to global
issues. Our foundation was founded in 1972 and since then
we have planted over 250 million trees in forests and
communities. These trees have resulted in improved air and
water quality, carbon reduction, & energy conservation.
Funding is for the Power Planting program, to provide two
free saplings to customers who have trees removed due to
reliability work, and also to provide trees to local
communities. Please note: although the Foundation is based
in Nebraska, all funds positively impact ComEd customers.
Amount is determined by possible number of
customers to participate in the program.10/26/2021 125 None 0
Docket No. 22-____ComEd Ex. 1.02 Page 66 of 176

WP 7Page 4 of 17
Subpage 23 of 35
114NATIONAL ENERGY EDUCATION
DEVELOPMENT PROJECT INC
8408 Kao Circle Manassas,
VA 20110Education Yes
The mission of the NEED Project is to promote an energy
conscious and educated society by creating effective
networks of students, educators, business, government and
community leaders to design and deliver objective, multi-
sided energy education programs. Funding for this
organization supports Energizing Student Potential in Illinois.
Amount is determined by possible number of schools
and students to participate in the program.
6/25/2021
10/28/2021130
Logo on
materials1
115 NATIONAL MUSEUM OF MEXICAN ART 1852 W. 19th Street Culture & Arts Yes
The National Museum of Mexican Art's annual Gala de Arte
is critical in generating funding that ensures Chicago
continues to boast a world-class museum where local and
global visitors gain a deeper understanding and appreciation
for Mexican heritage, art, and culture. Funding supported its
annual gala. Funding supports the annual Gala de Arte and
the Day of the dead celebration.
Sponsorship for the gala and a free cultural event.
Funding remain although the gala was cancelled and
the cultural event was held virtually.
4/27/2021 45 None 0
116NATIONAL MUSEUM OF PUERTO RICAN
ARTS & CULTURE
3015 W. Division
Chicago, IL 60622Culture & Arts Yes
The National Museum of Puerto Rican Arts and Culture
(NMPRAC) is devoted to the promotion, integration and
advancement of Puerto Rican arts and culture, presenting
exhibitions and programming created to enhance the visibility
and importance of the rich Puerto Rican arts tradition.
Sponsorships went up to $25,000, so ComEd
supported in at a middle range for the event.4/30/2021 15
Logo
placement
online
0.5
117 NAVY PIER600 E Grand Avenue
Chicago IL 60611Culture & Arts Yes
Located on Lake Michigan, Navy Pier is one of the top-
attended nonprofit cultural destinations in the Midwest,
stretching more than six city blocks and welcoming more
than nine million guests annually. Funding was for Global
Connections, the Pier's premier cultural events series.
Sponsorship level is a set amount for this series -
there is only one sponsor.8/27/2021 35 None 0
Docket No. 22-____ComEd Ex. 1.02 Page 67 of 176

WP 7Page 4 of 17
Subpage 24 of 35
118 NEW LIFE FAMILY CENTER CHURCH2910 N. Central Avenue
Chicago, IL 60634
Health & Social
ServicesYes
We provide Biblical teaching and Biblical orientation to
families. Our church exists to provide resources to our
community in various areas of human development: personal,
family, social, work, finance, and spiritual development. We
train children to live in healthy homes. We teach young
people to stay in school and continue their studies or seek
vocational skills to improve their future. We encourage single
mothers or fathers to educate themselves for a better future
for themselves and their families. We guide adults to seek
personal and family development. We assist seniors in the
areas of health, personal development, and how to improve
their relationship with their family. We provide weekly food
pantry to families in need. We help the Fire Department in
Latin America who works with people in rural areas where
the families don't have insurance or jobs to sustain their
families. We run a summer program every year for 6 weeks
free of charge. We run an after school program for 26 weeks
every year free of charge. We run a winter break and spring
break every year free of charge to all families with low or no
income.
This contribution supports Pastor Carrera's Annual
Holiday Meals and Coat Giveaways. This event
held at the New Life Family Center provides meals
and coats to community members in need. ComEd
provides additional support in the way of distributing
ComEd materials on Energy Efficiency and CARE
programs. This church is located in neighborhood
that benefits from ComEd programs and exposure to
promote.
10/27/2021 1 None 0
119 NIGHT MINISTRY4711 N Ravenswood
Avenue, Chicago, IL 60640
Health & Social
ServicesYes
The Night Ministry is a Chicago-based organization that
works to offer housing, health care and human connection to
members of the Chicago community struggling with poverty
or homelessness. With an open heart and an open mind, we
accept people as they are and work to address their
immediate needs while affirming their sense of humanity.
Funding was for the teen-homeless outreach program.
ComEd supports the dinner at the $10,000 level,
with the rest for programs to support an increasing
number of people in need.
11/18/2021 20 None 0
120 NORTHERN ILLINOIS UNIVERSITYAccounting Office, Lowden
Hall 204, DeKalb, IL 60115Education Yes
The Northern Illinois University Foundation provides
leadership to the university community and constituents in
building financial resources to support excellence at NIU.
Northern Illinois University promotes excellence and
engagement in teaching and learning, research and
scholarship, creativity and artistry, and outreach and service.
STEM Outreach is part of Northern Illinois University.
ComEd supports the STEM Fest at the $5,000 level. 7/28/2021 5
Logo
placement on
the website,
virtual presence
at the event
0.25
121 NORTHLIGHT THEATRE9501 Skokie Blvd.
Skokie, IL 60077Culture & Arts Yes
Northlight Theatre aspires to promote change of perspective
and encourage compassion by exploring the depth of our
humanity across a bold spectrum of theatrical experiences.
We seek to entertain, enlighten, and electrify our audiences
through contemporary dramas, intimate musicals and
refreshed classics. We are fearless in our commitment to
champion new work, and to provide a nurturing and creative
home for our artists. We are relentless in our pursuit of
excellence through our productions, our business practices,
our outreach, and our education. Northlight Theatre reflects
our community to the world and the world to our community.
Funding was for general-operating season support and the
annual gala.
Northlight is the largest theatre outside the city of
Chicago, so funding level was determined as
appropriate to be between mid-sized theatres and the
larger ones we support.
4/27/2021 30
Logo
placement
online
0.25
Docket No. 22-____ComEd Ex. 1.02 Page 68 of 176

WP 7Page 4 of 17
Subpage 25 of 35
122 NORTHWEST SIDE HOUSING CENTER5233 W Diversey Ave.
Chicago IL 60639
Community &
Economic DevelopmentYes
The Northwest Side Housing Center identifies and responds
to the needs of the community by leveraging resources to
improve the economic well-being and quality of life in
Belmont Cragin and the surrounding communities. Funding
was for the Celebrate Home annual fundraiser.
The Sponsorship was to sponsor their annual Gala
during the month of May and the sponsorship level
was determined to promote ComEd programs at the
annual Gala. The organization works with low
income families and provides information regarding
our CARE programs.
10/27/2021 2 None 0
123 OPENLANDS PROJECT
25 E. Washington Street
Suite 1650
Chicago, IL 60602
Environment Yes
Founded in 1963 as a program of the Welfare Council of
Metropolitan Chicago, Openlands is one of the oldest
metropolitan conservation organizations in the nation and the
only such group with a regional scope in the greater Chicago
region. Openlands has helped protect more than 55,000 acres
of land for public parks and forest preserves, wildlife
refuges, land and water corridors, urban farms, and
community gardens. Openlands protects the natural and open
spaces of northeastern Illinois and the surrounding region to
ensure cleaner air and water, protect natural habitats and
wildlife, and help balance and enrich our lives. Openlands'
vision for the region is a landscape that includes a vast
network of land and water trails, tree-lined streets, and
intimate public gardens within easy reach of every city
dweller. It also includes parks and preserves big enough to
provide natural habitat and to give visitors a sense of the vast
prairies, woodlands, and wetlands that were here before the
cities. In sum, Openlands believes that protected open space
is critical for the quality of life of our region. Funding is for
the annual Green Region grant program that provides funding
for open-space projects in ComEd's service territory and the
annual luncheon.
The overall level of support of the program at
$250,000 was determined through discussions
regarding the need in the communities for open-
space-related funding. Funding for the virtual
luncheon is at a lower level at $10,000, as
sponsorships go up to $50,000.
8/27/2021
9/24/2021260
Online sponsor
recognition0.75
124 OPERATION WARM INC
6 Dickinson Drive
Suite 314
Chadds Ford, PA 19317
Health & Social
ServicesYes
Operation Warm has a simple, direct, high-impact mission:
To provide brand new winter coats to children trapped in the
cycle of poverty. Our vision is that every child wearing a new
winter coat is warm, healthy, able to attend school regularly
in cold weather, and has strong self-esteem. We hope that
each child we reach believes, "I am of value." Operation
Warm is based in Pennsylvania, but all of ComEd's funding
benefits low-income children and families in CHA housing
who need a winter coat.
ComEd works with Operation Warm and the CHA
to determine the number of coats needed; funding is
used to support that effort.
5/28/2021 10 None 0
125 PAWS CHICAGO1933 N. Marcey Street
Chicago, IL 60614
Health & Social
ServicesYes
To build No Kill communities -- starting with a No Kill
Chicago -- that respect and value the life of every cat and
dog. Funding for this event supports the annual Paws Walk.
Sponsorship levels set by the organization. 4/23/2021 5Logo
placement 0.25
126 PENEDO CHARITABLE ORGANIZATION
737 North Michigan Avenue
Suite 1925
Chicago, IL 60611
Education Yes
PCO's mission is to educate girls to become women of
knowledge, faith and service. PCO offers sustained
intervention through academic, social emotional and
mentoring support to girls, beginning in 6th grade, through
middle school, high school and college. Girls who remain in
the program look to receiving scholarship support for
college. Funding was for the Penedo Cohort of local
students and the annual dinner.
ComEd provides a sponsorship -- one level is
provided -- for the breakfast, and the rest as a
program grant to support girls in need.
5/12/2021 20 None 0
Docket No. 22-____ComEd Ex. 1.02 Page 69 of 176

WP 7Page 4 of 17
Subpage 26 of 35
127PRESERVATION FOUNDATION OF THE
LAKE COUNTY FOREST PRESERVES
1899 W. Winchester Road
Libertyville, IL 60048Environment Yes
The Preservation Foundation of the Lake County Forest
Preserves was established in 2007 to allow concerned
citizens, companies, and foundations to expand the impact of
the Forest Preserves. A nonprofit 501(c)3 organization, the
Foundation raises support for projects and programs that
might otherwise go unfunded in a time of flat or shrinking
budgets. Over its history, the Preservation Foundation has
helped the Forest Preserves restore more than 1,000 acres of
native habitat, increased public access to the preserves,
supported cultural programs and exhibitions, and provided
free or reduced-cost education programs to thousands of
children. Funding from ComEd will enable the Forest
Preserves to expand educational capacity to deliver STEM-
based education programs in 2022.
ComEd and the Foundation determined the amount
needed to pay an educator to work for the program
and for materials needed.
8/27/2021 15 None 0
128PROJECT ONWARD STUDIO AND
GALLERY1200 W. 35th Street
Health & Human
ServicesYes
Project Onward is an independent 501(c)3 nonprofit
organization that seeks to promote art as a powerful tool for
understanding and valuing the real and potential contributions
of our national population with disabilities. Our mission is to
support the creative growth of adult visual artists with
developmental disabilities and mental disorders. We provide
our artists with the opportunity to create their work in a safe,
supportive studio environment, with access to work space,
materials and professional guidance free of charge to artists
who have exceptional talents but face challenges from autism
to mental illness. We believe that artists with special needs
deserve a voice in the world of art and ideas, and that their
extraordinary work has a universal audience. Funding
supports programming for people with disabilities.
Funding supports free art programming for people
with intellectual and developmental disabilities.6/28/2021 15 None 0
129 PROJECT SYNCERE9012 S. Stony Island Ave
Chicago, IL 60607Education Yes
Project SYNCERE (PS) was launched in 2009, with the
mission to prepare the minds and create pathways for
underrepresented and disadvantaged students to pursue
careers in Science, Technology, Engineering and
Mathematics (STEM). Funding is dedicated for Project
SYNCERE's new program to expand to 15 elementary
schools in diverse Chicago neighborhoods via an engineering-
focused program and having a culminating competition in
May for all participating schools and their families/friends.
Sponsorship levels range between $5,000 and
$50,000, so ComEd supported at a mid-range level.4/30/2021 25
Logo
placement0.25
130 PUERTO RICAN ARTS ALLIANCE 3000 N Elbridge Ave Culture & Arts Yes
The Puerto Rican Arts Alliance (PRAA) is dedicated to
preserving Puerto Rican culture by maintaining traditions,
promoting the arts, providing educational opportunities in
arts programming, and cultivating pride in Puerto Rican and
Latino heritage for future generations. The organization
works toward this mission through separate but
interconnected program areas and activities (including:
school-based programs, workshops, community outreach
events, exhibitions, and more), serving 20,000 area residents
each year. Funding was for the annual Cuatro Festival.
Sponsorship levels go up to $50,000, so ComEd is in
the mid-range.
4/30/2021
10/28/202122 None 0
131 PUERTO RICAN CULTURAL CENTER2739 W. Division Street
Chicago, IL 60622Culture & Arts Yes
The Juan Antonio Corretjer Puerto Rican Cultural Center is a
non-profit, community-based umbrella. Funding supported
the annual Boricua Fest in Humboldt Park.
Sponsorship levels set by the organization. 8/27/2021 5Online sponsor
recognition0.5
Docket No. 22-____ComEd Ex. 1.02 Page 70 of 176

WP 7Page 4 of 17
Subpage 27 of 35
132 RAINBOW PUSH COALITION930 East 50th Street,
Chicago, IL 60615
Community &
Economic DevelopmentYes
The Rainbow PUSH Coalition (RPC) is a multi-racial, multi-
issue, progressive, international membership organization
fighting for social change, with a mission is to protect,
defend, and gain civil rights by leveling the economic and
educational playing fields, and to promote peace and justice
around the world. Funding was for the annual Martin Luther
King breakfast.
Sponsorship levels for the two events go up to
$50,000 and $100,000 respectively (and draw
national sponsors), so ComEd is at the lower range
of support for the breakfast.
10/27/2021 25 None 0
133 RAUE CENTER FOR THE ARTS108 Minnie Street
Crystal Lake, IL 60014Culture & Arts Yes
Over the past 15 years, Raue Center has become a true arts
center that engages the community in collaborative
leadership to make the arts central to the lives of all citizens.
The 700-seat theatre is a gathering place for northern Illinois
residents and is an a central place for educational
opportunities for local students. ComEd's funding provides
general-operating support.
The Raue is a smaller theatre, but central to the area,
so ComEd came in at a mid-range level of support.5/6/2021 10
Recognition on
the website0.25
134 REFLECTIONS FOUNDATION10816 S. Parnell
Chicago, IL 60628Education Yes
The mission of the Polished Pebbles Girls Mentoring
Program is to provide girls (7-17 years old) with the
opportunity of learning the vital life skill of effective
communication. Our Polished Pebbles Girls Mentoring
program instills confidence in girls to face the challenges of
daily life by substituting aggressive forms of communicating
and problem solving with new strategies that allow them to
gain a solid reputation and respect without retaliating.
Funding supported the annual fundraiser.
ComEd's sponsorship was at the lower level.5/24/2021
10/5/20215 None 0
135 REFUGEEONE4753 N. Broadway Chicago,
IL 60640
Health & Social
ServicesYes
Creating opportunity for refugees fleeing war, terror, and
persecution to build new lives of safety, dignity, and self-
reliance. Funding supported a table at the annual event.
Funding for one table and ad placement. 4/30/2021 3 None 0
136 RESPIRATORY HEALTH ASSOC1440 W. Washington Blvd.
Chicago, IL 60607
Health & Social
ServicesYes
Respiratory Health Association's mission is to prevent lung
disease, promote clean air and help people live better
through education, research, and policy change. Funding
supports research and programs, and ComEd's participation
in the Hustle.
The amount supports ComEd's participation in the
Hustle, ad placement, and RHA mission.8/27/2021 25 None 0
137 RIALTO SQUARE THEATRE CORP15 E. Van Buren Street
Joliet, IL 60432Culture & Arts Yes
The Rialto Square Theatre Foundation's mission is to provide
leadership and financial resources to support the cultural and
educational programs of the Rialto Square Theatre. Through
the efforts of the Foundation, the Rialto can fulfill its role as
a cultural leader and to enrich the quality of life for the
communities it serves. ComEd's funding supports holiday
events open to the public at the theatre.
The Rialto is the largest theatre of its kind in Joliet,
so ComEd determined that a mid-range support was
an appropriate level.
8/26/2021 20
Logo
placement
online
0.25
138ROCKFORD AREA CONVENTION &
VISITORS BUREAU CHARITABLE FOUNDA
102 N. Main St.
Rockford, IL 61101
Community &
Economic DevelopmentYes
The mission is to promote tourism in the Rockford area.
Funding was for Stroll on State. There is a set amount to sponsor the event. 8/27/2021 2
Logo
placement0.25
Docket No. 22-____ComEd Ex. 1.02 Page 71 of 176

WP 7Page 4 of 17
Subpage 28 of 35
139 ROCKFORD SYMPHONY ORCHESTRA INC
Riverfront Museum Park
711 North Main Street
Rockford, IL 61103
Culture & Arts Yes
The Rockford Symphony Orchestra was founded in 1934
and incorporated in 1943. The RSO's first Music Director
and Manager, Arthur Zack, led the orchestra for the next 27
years, during which time the Rockford Area Youth
Symphony Orchestra and the Rockford Symphony Orchestra
Guild were established. Now in its 80th season, the Rockford
Symphony Orchestra continues to fulfill its mission: to lead in
the creation of vibrant musical experiences that enlighten,
educate, and entertain. Funding was for the Independence
Day Spectacular, Classics Series and gala.
Rockford Symphony Orchestra is the largest arts
organization in the area, so ComEd determined that
the level of support was appropriate.
8/27/2021 25
Logo
placement
online
0.25
140SCIENCE AND TECHNOLOGY
INTERACTIVE CENTER
18 W. Benton
Aurora IL 60506Education Yes
The mission of SciTech Hands On Museum, a Science and
Technology Center, is to inspire interested in STEM fields
through creative, interactive programs and activities. Funding
was for support to the ongoing programs at the museum.
The amount provided was the direct cost to provide
the program to one high schools in ComEd's service
territory.
8/27/2021 10 None 0
141 SERTOMA CENTRE INC4343 W. 123rd Street, Alsip,
IL 60803
Health & Social
ServicesYes
The mission of Sertoma Centre, Inc. is to provide
opportunities that empower individuals with disabilities to
achieve personal success. They are working to keep the
community informed on their status and the services still
available, as well as provide relevant resources that they
believe will be useful for consumers and families navigating
these stressful times. In addition, their hope is to compile a
directory so the community does not have to go searching for
information.
Face masks for clients, information on testing,
mental health podcasts, Emotional and Mental
Health support resources, Art of Life remote
program, and Sertoma CMHC virtual sessions
3/2/2021 1 None 0
142 SOMMER FOUNDATIONPO Box 491
Skokie IL 60076Education Yes
The Mission of the Sommer Foundation is to provide college
or university scholarships to deserving high school seniors
who have experienced the death of a parent and despite the
resulting emotional trauma, have performed in an exemplary
manner during his or her high school career. Sommer
Foundation is supported and run by many of the North
Region municipalities.
Sponsorships range from $1,000-$5,000 - ComEd's
support is in the mid-range.6/28/2021 3 None 0
143SOUTH SIDE IRISH ST PATRICKS DAY
PARADE & HERITAGE FOUNDATION
3400 W. 111th Street
Chicago, IL 60655Culture & Arts Yes
The South Side Irish St. Patrick's Day Parade is dedicated to
celebrating family, community and Irish heritage. Funding
will support ComEd's participation in the parade.
Sponsorship levels are set by the organization. 4/30/2021 2 None 0
144SOUTHLAND MINISTERIAL HEALTH
NETWORK
15406 S. Lexington Avenue
Harvey IL 60426Culture & Arts Yes
Mission is to provide information and resources to non profit
agencies regarding healthcare advocacy. Funding was for
their holiday gala.
The donation was a sponsorship for the
organization's annual holiday fundraiser. 10/27/2021 1 None 0
145 SPECIAL CHILDRENS CHARITIES541 N. Fairbanks Court
Chicago, IL 60611
Health & Social
ServicesYes
The mission is to provide year-round sports training and
athletic competition in a variety of Olympic-type sports for
children and adults with intellectual disabilities, giving them
continuing opportunities to develop physical fitness,
demonstrate courage, experience joy and participate in a
sharing of gifts, skills and friendship with their families,
other Special Olympics athletes and the community. Funding
was for the Polar Plunge.
ComEd's contribution to support activities
surrounding the 21st anniversary of the Polar Plunge,
and $30,000 was earmarked for Polar Plunge to
support hundreds of volunteers from ComEd who
raised more than $230,000 for Special Olympics.
8/27/2021 30 None 0
Docket No. 22-____ComEd Ex. 1.02 Page 72 of 176

WP 7Page 4 of 17
Subpage 29 of 35
146 ST SABINA CHURCH1210 W. 78th Place
Chicago, IL 60620Religious Yes
Coming from humble beginnings more than 100 years ago as
a storefront church, St. Sabina went from nearly closing its
doors in 1975 to developing into a dynamic church on the
Southside of Chicago that has helped to transform the
community, influence state laws, and change the lives of
countless people across the nation. Over the years, St.
Sabina's constant outreach has stretched far beyond the four
walls of the sanctuary to serve as a beacon of hope to those
in need, while fighting for peace and social justice across the
city of Chicago. Sponsorship was of the church's and
school's annual fundraising event.
Sponsorship levels went up to $25,000 so ComEd's
support was in the low-range.11/4/2021 5 None 0
147 STEPPENWOLF THEATRE COMPANY1700 N. Halsted St.
Chicago, IL 60614Culture & Arts Yes
Maintaining its tradition as an artist-driven theater,
Steppenwolf reaches 200,000 individuals annually and
produces a five-play Subscription Series devoted to the work
of its ensemble that is in the majority comprised of new plays-
-first as well as second or third productions of recently
premiered works. Steppenwolf for Young Adults produces
plays coupled with comprehensive educational outreach
programs for teens, teachers and families. Funding was for
general-operating season support and the annual gala.
Season support for this size theatre goes up to
$100,000 for this sized-theatre, so ComEd's
supports is mid-range.
8/27/2021 40
Logo
placement
online
0.25
148 STREATOR AREA UNITED WAY, INC
122 North Bloomington
Street
Streator, IL 61364
Community &
Economic DevelopmentYes
The United Way supports a variety of non-profit
organizations in the Streator area. ComEd's funding focuses
on the annual campaign.
ComEd supports numerous United Ways in the
service territory to help customers in the greatest
need. Amounts are determined by the people served
by each United Way and the level of need in the
areas.
4/8/2021 3 None 0
149 THE ANSWER INC7600 Roosevelt Road Forest
Park, IL 60130
Health and Human
ServicesYes
The Answer Inc. is a 501c3 a not for profit organization
dedicated to empowering families impacted by Autism &
Developmental Differences. We accomplish this through
support, resources, education, recreation and advocacy. The
Answer's purpose is to de-stigmatize societies' opinion of our
participants and provide awareness and education beginning
with the families and reaching out through the entire
community.
The Answer Inc. offers and encourages mentoring
opportunities. We provide effective, successfully tested
techniques that build and nourish vital health, life and
cohabitation skills. Support for programmatic efforts.
Funding was determined based on set amount by the
organization. 10/27/2021 1 None 0
150 THE ASME FOUNDATION INC
Two Park Avenue, New
York, New York 10016-
5675
Education Yes
American Society of Mechanical Engineers serves a wide-
ranging engineering community through quality learning, the
developmen tof codes and standards, certifications, research,
conferences and publications and other forms of outreach.
Support for this organization is directed to "Drop Me In"
sessions, in an effort to spark interest among middle school
students in the field of engineering. The pilot program was
established at a Chicago Public School and a Rockford
Public School.
Funding was determined based on set amount by the
organization to support programming at schools in
two educational districts.
5/12/2021 20 None 0
Docket No. 22-____ComEd Ex. 1.02 Page 73 of 176

WP 7Page 4 of 17
Subpage 30 of 35
151 THE BLACK STAR PROJECT3509 S King Drive Suite 2B
Chicago, IL 60653Education Yes
From its beginning, The Black Star Project has worked to
improve the lives of people in low-income Black and Latino
communities, particularly on the south and west sides of
Chicago. Often, these communities are plagued with
violence, unemployment, and low-academic achievement.
TBSP's work is motivated by its vision that all children, with
the support of their families, neighborhoods and
communities, will become 21st-century global citizens who
are globally competent, globally cooperative and globally
compassionate. Funding was for the Student Motivation and
Mentoring Program.
ComEd had discussions with Black Star Project
regarding the significant needs of youth in the
community and determined that a higher level of
support was appropriate.
4/30/2021 20 None 0
152 THE CHICAGO LIGHTHOUSE1850 W Roosevelt Rd,
Chicago, IL 60608
Health and Human
ServicesYes
The Chicago Lighthouse is a world-renowned social service
organization serving the blind, visually impaired, disabled and
Veteran communities. The Chicago Lighthouse provides
vision rehabilitation services, education, employment
opportunities and assistive technology for people of all ages.
Funding during the pandemic has supported programmatic
efforts.
Funding levels are set by the organization between
$5,000 - $50,000 and ComEd's support is low-range11/18/2021 15 None 0
153THE EZRA COMMUNITY DEVELOPMENT
CORP INC
3410 N Pacific Ave,
Chicago, Illinois, 60634-
2957
Health & Social
ServicesYes
Ezra Community Development has provided weekly food
giveaways to the community during the COVID-19
pandemic. Also, they have serviced the youth by providing
them with an outlet to engage via zoom calls, and have held a
youth conference dealing with issues they are facing daily
brought about by the COVID-19 pandemic. Ezra
Community Center has been able to link youth with
emotional and spiritual services since the pandemic forced
the shelter in place order. The center has assigned youth
with older your adults for mentorship and added emotional
support.
This donation is reasonable because it helps offset
the costs to provide weekly food give-aways.
Additionally, with our support, the organizations can
gather the needs resources to support the youth in
the community dealing with the challenges presented
by COVID-19.
8/27/2021 2 None 0
154 THE HOUSE THEATRE OF CHICAGOPO Box 180150, Chicago,
IL 60618Culture & Arts Yes
The House is Chicago's premier home for intimate, original
works of epic story and stagecraft. Founded and led by
Artistic Director Nathan Allen and driven by an
interdisciplinary ensemble of Chicago’s next generation of
great storytellers, The House aims to become a laboratory
and platform for the evolution of the American theatre as an
inclusive and popular artform. ComEd's lighting sponsorship
supports the House's productions.
Funding levels are set by the organization between
$5,000 - $50,000 and ComEd's support is mid-range. 7/26/2021 25
Logo
placement
online
0.25
155THE MISSION OF OUR LADY OF MERCY
INC
1140 W. Jackson Blvd
Chicago Il 60607Education Yes
Since 1887, Mercy Home for Boys & Girls has been a port in
the storm for over 30,000 abused, neglected and abandoned
children. Beginning as a place of refuge for homeless
children, we now serve youth in residential care at two
locations; our Boys Campus located in Chicago's West Loop
and our Walsh Girls Campus in the Beverly community. The
mission is to save young lives by providing: a safe, nurturing
residential treatment home, AfterCare support for former
residents and their families, community-based and site based
youth mentoring; promoting therapeutic, educational
vocational, spiritual and life skill development; and raising
public awareness of youth in need. Funding was for Annual
Graduates Luncheon.
Sponsorship levels ranged from $5,000 to $50,000
and support was allocated at a lower level. 4/27/2021 6
Logo
placement
online
0.25
156 THE RENAISSANCE COLLABORATIVE3757 S Wabash
Chicago IL 60653
Health & Social
ServicesYes
The Renaissance Collaborative, Inc. (TRC) is one of largest
social impact organizations operating on the City of
Chicago’s South Side. TRC serves over 1,000 low-income
individuals and families annually by delivering safe, quality
affordable housing and workforce development programs.
Executive Director Pat Abrahams serves on the ComEd CoF
Advisory Committee and has supported the Mobility Electric
Vehicle Pilot at the Senior Building. This contribution shall
support the Annual Benefit Gala.
Sponsorship levels are set by the organization. 6/8/2021 2 None 0
Docket No. 22-____ComEd Ex. 1.02 Page 74 of 176

WP 7Page 4 of 17
Subpage 31 of 35
157 THE ROSE FOUNDATIONPO Box 288195
Chicago IL 60628Civic & Public Affairs Yes
The Rose Foundation Mission is to address the underserved
community needs holistically, including but not limited to
youth services, education, housing, employment, etc.
ComEd provided a general-operating grant.
ComEd provided a small grant to support the
Foundation's programs.8/12/2021 1 None 0
158TOTAL RESOURCE COMMUNITY
DEVELOPMENT ORGANIZATION
1415 West 104th Street
Chicago, IL
Health & Social
ServicesYes
Total Resource Community Development Organization
(TRCDO) mission is to provide community outreach and
support services. Bishop Simon Gordon and Triedstone
Church of Chicago provide food baskets to the community
every other week to assist those families in need.
This donation supported the organization's ability to
provide free food for residents during the pandemic. 6/11/2021 3 None 0
159 TRAGEDY TO TRIUMPH FOUNDATION630 Kromray Rd
Lemont, IL 60439Education Yes
The mission is to provide emotional support to burn survivors
and their families, helping young burn survivors achieve a
social confidence and meet their education goals. The major
focus is to provide funds for those with financial need when
they are accepted into an accredited post-secondary
institution. Funding was for scholarships.
ComEd had discussions with the organization about
funding needed for scholarships and determined that
this was an appropriate amount.
12/2/2021 5 none 0
160 TRITON COLLEGE FOUNDATION
2000 Fifth Ave., Room J-
215
River Grove IL 60171
Education Yes
Triton College Foundation is a nonprofit corporation
established to extend the campus and programs of Triton
College to better serve its students, communities within
District 504, and alumni by raising and stewarding
investments for the institution. Funding was for the Annual
Triton College Foundation Golf outing and the Annual Triton
College Foundation President's Reception.
The sponsorship supports a ComEd table of 10 for
Triton College President's Reception, which provides
college scholarships for those in financial need. The
sponsorship also support Triton's Annual golf outing
and Annual Holiday Tree Lighting Ceremony.
1/14/2021 2 None 0
161 UNITED NEGRO COLLEGE FUND INC
105 West Adams St Suite
2400
Chicago, IL 60603
Education Yes
UNCF, United Negro College Fund, is the nation's largest
and most effective minority education organization. The
mission is to build a robust and nationally-recognized pipeline
of under-represented students who, because of UNCF
support, become highly-qualified college graduates and to
ensure that our network of member institutions is a respected
model of best practice in moving students to and through
college.
ComEd's sponsorship supports scholarships for local
students to attend local schools. The amount
determined is low-range for this event (sponsorships
go up to $100,000.)
4/30/2021 20
Logo
placement on
the website
0.25
162UNITED STATES HISPANIC LEADERSHIP
INSTITUTE
431 S. Dearborn St., Suite
1203
Chicago IL 60605
Culture & Arts Yes
The mission of the United States Hispanic Leadership
Institute (USHLI) is to fulfill the promises and principles of
democracy by promoting education and leadership
development, empowering Latinos and similarly
disenfranchised groups through civic engagement and
research, and by maximizing participation in the electoral
process. Funding was for the USHLI National Conference
and the Annual Fundraiser.
Sponsorship levels range between $5,000 and
$50,000, so ComEd support at a mid-range level.11/18/2021 25 None 0
163 UNITED WAY OF BOONE COUNTY220 West Locust Street
Belvidere, IL 61008
Community &
Economic DevelopmentYes
The United Way supports a variety of non-profit
organizations in the Booth County area. ComEd's funding
focuses on the annual campaign.
ComEd supports numerous United Ways in the
service territory to help customers in the greatest
need. Amounts are determined by the people served
by each United Way and the level of need in the
areas.
4/8/2021 4 None 0
Docket No. 22-____ComEd Ex. 1.02 Page 75 of 176

WP 7Page 4 of 17
Subpage 32 of 35
164 UNITED WAY OF EASTERN LASALLE601 State St
Ottawa, IL 61350
Community &
Economic DevelopmentYes
United Way of Eastern LaSalle County is a recognized leader
in helping solve community problems. As a volunteer-led
organization, UWELC is dedicated to helping Eastern
LaSalle County's most vulnerable citizens become and remain
self-sufficient. UWELC partners with a network of the most
effective health and human service non-profits serving
Dayton, Grand Ridge, Harding, Leland, Marseilles, Naplate,
Norway, Ottawa, Seneca, Serena, Sheridan, and Wedron. By
uniting service organizations, individuals, businesses, and
government, United Way of Eastern LaSalle County
addresses our community's most pressing needs. ComEd's
funding focused on the annual campaign.
ComEd supports numerous United Ways in the
service territory to help customers in the greatest
need. Amounts are determined by the people served
by each United Way and the level of need in the
areas.
4/5/2021 1 None 0
165UNITED WAY OF GREATER MCHENRY
COUNTY
4508 Prime Parkway,
McHenry, IL 60050
Health & Human
ServicesYes
Our mission at United Way of Greater Mchenry County is to
unite people and resources to build a stronger McHenry
County. Funding supports programming through the United
Way Operations Grant.
ComEd supports numerous United Ways in the
service territory to help customers in the greatest
need. Amounts are determined by the people served
by each United Way and the level of need in the
areas.
4/8/2021 10 None 0
166 UNITED WAY OF GRUNDY COUNTY
1802 N Division Street,
Suite 500
Morris, IL 60450
Community &
Economic DevelopmentYes
The United Way supports a variety of non-profit
organizations in the Grundy County area. ComEd's funding
focused on the annual campaign.
ComEd supports numerous United Ways in the
service territory to help customers in the greatest
need. Amounts are determined by the people served
by each United Way and the level of need in the
areas.
4/8/2021 3 None 0
167 UNITED WAY OF ILLINOIS VALLEY INC
2220 Marquette Road Ste.
102
Peru, IL 61354
Community &
Economic DevelopmentYes
The United Way supports a variety of non-profit
organizations in the Illinois Valley area. ComEd's funding
focused on the annual campaign.
ComEd supports numerous United Ways in the
service territory to help customers in the greatest
need. Amounts are determined by the people served
by each United Way and the level of need in the
areas.
3/26/2021 1 None 0
168 UNITED WAY OF KANKAKEE COUNTYP.O. Box 2248
Kankakee, IL 60901
Community &
Economic DevelopmentYes
For six decades, the United Way has helped Kankakee
County residents receive valuable health and human services
by providing funds to worthy organizations. The mission of
the United Way of Kankakee County is to improve,
consistently and measurably, the quality of life for all the
people of Kankakee County by raising and distributing funds,
mobilizing community resources, and encouraging innovative
solutions to the community's’ health and human service
needs. ComEd's funding focused on the annual campaign.
ComEd supports numerous United Ways in the
service territory to help customers in the greatest
need. Amounts are determined by the people served
by each United Way and the level of need in the
areas.
4/8/2021 7 None 0
169 UNITED WAY OF LAKE COUNTY330 South Greenleaf Street
Gurnee, IL 60031
Community &
Economic DevelopmentYes
United Way of Lake County is working to grow a stronger
Lake County community by focusing on preventive programs
and giving children a solid educational foundation. ComEd's
funding focused on the annual campaign.
ComEd supports numerous United Ways in the
service territory to help customers in the greatest
need. Amounts are determined by the people served
by each United Way and the level of need in the
areas.
4/8/2021 20 None 0
170 UNITED WAY OF LEE COUNTY INCP.O. Box 382
Dixon, IL 61021-0382
Community &
Economic DevelopmentYes
The United Way supports a variety of non-profit
organizations in the Lee County area. ComEd's funding
focuses on the annual campaign.
ComEd supports numerous United Ways in the
service territory to help customers in the greatest
need. Amounts are determined by the people served
by each United Way and the level of need in the
areas.
4/8/2021 3 None 0
171 UNITED WAY OF LIVINGSTON COUNTYP.O. Box 534
Pontiac, IL 60174
Community &
Economic DevelopmentYes
The Livingston County United Way is a convener and
collaborating partner with many nonprofit, for-profit,
governmental and faith-based organizations – all working to
address the most critical needs of Livingston County
residents.
ComEd supports numerous United Ways in the
service territory to help customers in the greatest
need. Amounts are determined by the people served
by each United Way and the level of need in the
areas.
4/8/2021 1 None 0
Docket No. 22-____ComEd Ex. 1.02 Page 76 of 176

WP 7Page 4 of 17
Subpage 33 of 35
172UNITED WAY OF METROPOLITAN
CHICAGO
333 South Wabash Avenue
30th Floor
Chicago, IL 60604
Community &
Economic DevelopmentYes
United Way of Metropolitan Chicago (UWMC) was born in
1932 out of the Chicago business community's concern for
their fellow citizens during the Depression. As part of the
largest non-profit network in the world, UWMC has invested
over $600 million in the Chicagoland community over the
last decade to fund a broad range of
Today, UWMC continues to adapt to the changing needs of
Chicagoland communities. Over the past several years,
UWMC has transformed from a traditional program-funding
model to a community impact model, which focuses on
creating social change through targeted investments in
education, income, and health. UWMC does what no single
organization alone can do, bringing together leaders from
corporations, human services, and the community to develop
innovative solutions to local issues. UWMC believes that, in
order to create lasting impact, a holistic approach is needed
to effect change. ComEd's funding focused on the annual
campaign, which supports the entire Chicagoland
metropolitan area.
ComEd supports numerous United Ways in the
service territory to help customers in the greatest
need. Amounts are determined by the people served
by each United Way and the level of need in the
areas.
11/18/2021 450 None 0
173 UNITED WAY OF NORTHWEST ILLINOIS524 West Stephenson Street
Freeport, IL 61032
Community &
Economic DevelopmentYes
The United Way supports a variety of non-profit
organizations in the northwest part of Illinois. ComEd's
funding focuses on the annual campaign.
ComEd supports numerous United Ways in the
service territory to help customers in the greatest
need. Amounts are determined by the people served
by each United Way and the level of need in the
areas.
3/26/2021 6 None 0
174 UNITED WAY OF ROCK RIVER VALLEY612 N Main St #300
Rockford, IL 61103
Community &
Economic DevelopmentYes
The United Way supports a variety of non-profit
organizations in the Rock River Valley area. ComEd's
funding focuses on the annual campaign.
ComEd supports numerous United Ways in the
service territory to help customers in the greatest
need. Amounts are determined by the people served
by each United Way and the level of need in the
areas.
4/8/2021 35 None 0
175 UNITED WAY OF THE QUAD CITIES3247 East 35 Street Court
Davenport, IA 52807
Community &
Economic DevelopmentYes
The United Way supports a variety of non-profit
organizations in the Quad Cities area. ComEd's funding
focuses on the annual campaign.
ComEd supports numerous United Ways in the
service territory to help customers in the greatest
need. Amounts are determined by the people served
by each United Way and the level of need in the
areas.
4/5/2021 4 None 0
176 UNITED WAY OF WHITESIDE COUNTY502 First Avenue
Sterling, IL 61081
Community &
Economic DevelopmentYes
The United Way supports a variety of non-profit
organizations in the Whiteside County area. ComEd's
funding focuses on the annual campaign.
ComEd supports numerous United Ways in the
service territory to help customers in the greatest
need. Amounts are determined by the people served
by each United Way and the level of need in the
areas.
3/30/2021 3 None 0
177 UNITED WAY OF WILL COUNTY54 N. Ottawa Street
Suite 300
Joliet, IL 60432
Community &
Economic DevelopmentYes
United Way of Will County unites communities and resources
to empower people and create positive, sustainable change.
Working alongside volunteers, local businesses and
community organizations, the United Way of Will County
identifies, reviews and financially supports local programs
that help Will County residents. The partnerships created
with local non-profits help us to face community issues head
on, and make real, lasting change in Will County. Our 4
impact goals are to 1. Help individuals and families become
economically self-sufficient and independent; 2. Help youth
prepare for success in school and life; 3. Help individuals
and families access quality healthcare and life a fulfilled life;
and 4. Ensure our community is a safe place for all.
ComEd's funding focused on the annual campaign.
ComEd supports numerous United Ways in the
service territory to help customers in the greatest
need. Amounts are determined by the people served
by each United Way and the level of need in the
areas.
4/5/2021 35 None 0
Docket No. 22-____ComEd Ex. 1.02 Page 77 of 176

WP 7Page 4 of 17
Subpage 34 of 35
178 UNIVERSITY OF ILLINOIS AT CHICAGO1200 West Harrison Street
Chicago, IL 60607
Community &
Economic DevelopmentYes
The mission of the UIC CHANCE Program is to recruit and
retain academically qualified, underrepresented candidates
from Chicago and suburban communities in need of
enrichment and learning skills, for admission to UIC, and
facilitate access to the necessary academic activities and
professional services that will enable them to persist and
graduate, as well-prepared professionals for the 21st
Century. Funding supports scholarships for diverse students
pursuing degrees in electrical and mechanical engineering.
Funding was determined based on the number of
scholarships awarded
4/30/2021
12/16/2021335 None 0
179 VISTA LEARNING NFP2705 McDonough Street
Joliet, IL 60436Education Yes
The office oversee public education for Will County.
Funding was for the annual Scripps Spelling Bee, which is
open to all schools in the area.
Funding is based on District's budget to hold local
bees and championship bee, along with travel to the
national bee.
11/3/2021 5 None 0
180WE WOMEN EMPOWERED INC OF
CHICAGO
436 E. 79th St
Chicago, IL 60619Education Yes
Organization that has been nurturing and supporting our
community’s youth since 1993. They provide youth with the
skills they need to thrive in society. They have a variety of
programs that are available to youth. Funding was a
breakfast held by the organization.
It is a nominal amount to help the organization and
continue engagement.9/28/2021 1 None 0
181 WESTSIDE CULTURAL FOUNDATION1250 South Albany Chicago,
IL 60623
Health & Social
ServicesYes
The WCF Coat and Toy Giveaway seeks to provide coats
and toys to children in need and children living in shelters in
under-served communities who are often overlooked during
the holiday season. The population served includes residents
from Lawndale, Austin and Garfield Park, all of which are
under-served communities on the West Side of Chicago.
Funding supports this effort.
It is a nominal amount to help the organization and
continue engagement.11/9/2021 5
Logo
recognition
online
0.25
182 WINGS PROGRAM INCP.O. Box 95615
Palatine, IL 60095
Health & Social
ServicesYes
The mission of WINGS Program, Inc. is to provide housing,
integrated services, education and advocacy to end domestic
violence. History: WINGS was started in 1985 as a
grassroots organization by members of a local church with
the desire to help homeless women and children in the
northwest suburbs of Chicago, an area with few resources
for these families. WINGS is committed to treating each
parent and child escaping domestic violence in a respectful
and compassionate manner while valuing the unique qualities
and needs of each family. ComEd's support was for the
annual gala.
Sponsorship levels ranged between $5,000 to
$25,000, so ComEd was at a lower level.10/27/2021 10
Logo
placement on
the website, ad
placement in
the virtual
program
0.5
Docket No. 22-____ComEd Ex. 1.02 Page 78 of 176

WP 7Page 4 of 17
Subpage 35 of 35
183 WOMEN EMPLOYED65 E. Wacker Place, Suite
1500, Chicago, IL 60601
Community &
Economic DevelopmentYes
The mission of Women Employed is to improve the
economic status of women and remove barriers to economic
equity. Women Employed has one passion: to make life
better for working women. We believe that all women
deserve full and fair economic opportunities. That means
better career options and higher pay, more opportunities for
training and education, and strict enforcement of fair
employment laws. Women Employed is a leading national
advocate for women's economic advancement. We analyze
workplace issues, educate policy makers, and build support
to improve opportunities and incomes. Since 1973, Women
Employed has fought to outlaw pay discrimination,
pregnancy discrimination and sexual harassment and to
strengthen federal equal opportunity policies and
work/family benefits. Funding supported the annual Working
Lunch.
Sponsorship levels range between $5,000 and
$50,000, so ComEd support at a mid-range level. It
included 2 tables, brand recognition and ad
placement in the program book.
4/30/2021 20
Logo
placement on
the website
0.25
184 WRITERS THEATRE INC321 Park Avenue
Glencoe, IL 60022Culture & Arts Yes
Writers Theatre exists to explore productions in which the
word on the page and the artists that bring the word to life
hold primary importance. Central to this mission are three
important core values: valuing text, both classic and
contemporary, as the fundamental source of inspiration;
creating deliberately intimate performances where audiences
are face-to-face with powerful stories; and honoring the time
and commitment of our artists by remaining at the forefront
of industry compensation. With a reputation for consistent
artistic excellence, innovative educational programming and
strong ties to our community, Writers Theatre has built an
award-winning repertoire and today serves as a vital and
highly-regarded company in the Chicago theatre community.
ComEd's funding was used for general-operating support for
Writers' Theatre has grown into a larger arts
organization serving fans outside Chicago, so
ComEd's funding is now middle-range for this group
of nonprofits.
7/26/2021 20Logo
placement0.25
185 YMCA OF METROPOLITAN CHICAGO1 N. LaSalle Street Suite
1150 Chicago IL 60602
Community &
Economic DevelopmentYes
The YMCA of Metro Chicago's 6th annual Recognition
Dinner, A Celebration of Our Champions, raises awareness
and funds for the Y's life-changing youth and family
development programs. The evening will showcase the Y's
determination to ensure each and every member of our
community has the opportunity to find success. Donation
supported the annual recognition dinner. This event supports
critical programming for YMCA families.
Sponsorship levels range between $5,000 and
$50,000, so ComEd supported at a lower level.
7/1/2021
7/28/202115 None 0
186Total of Donations to Organizations Receiving
Less Than $1,0002 0
187Less: FMV of consideration received (meals,
tickets, admissions)(74)
188 Total Charitable Contributions 8,038
189
Amount Applied to Customer Accounts for
ILLINOIS SCIENCE AND ENERGY
INNOVATION FOUNDATION (Line 84)
2,693
190Total Charitable Contributions Applied to
Administrative and General5,345
Notes: (a) ComEd does not have a measure of the value of signage or recognition that results from the placement of the Company name or logo in print materials produced by donation recipients. ComEd does not track the value of admission discounts that may be provided to employees by museums, theatres, etc.
(b) Unless specific information was provided, ComEd has estimated the value of the tickets or meals received from the organization. For example, most luncheon tickets are valued at $50 each and most dinner tickets are valued at $100 each.
(c) The value of a float at a parade or a booth at a festival is estimated based on the fee that a non-donor would pay to participate in the event.
Docket No. 22-____ComEd Ex. 1.02 Page 79 of 176

WP 7
Page 5 of 17
Line
No. Description Total Jurisdictional Non- Jurisdictional
(A) (B) (C) (D)
1 Uncollectible Accounts Expense (1) 17,969$ -$ (2) 17,969$
2 Outside Collection Agency Expenses (3) 1,354$ 792$ (4) 562$
Notes:
(1) As recorded in FERC Account 904, Uncollectible Accounts Expense.
(2) Uncollectible expense is recovered in Rider UF.
(3) See C-16 Page 4.
(4) Jurisdictional Outside Collection Agency Expense is calculated as a percentage of the total of Delivery Service
Revenue (A) plus the total of discounted receivables purchased in accordance with the provisions of Rider PORCB (B)
to Total Sales to Ultimate Consumers (C) plus the total of discounted receivables purchased during the year
in accordance with the provisions of Rider PORCB (B).
Delivery Service Revenues (See WP 15) (A) 2,781,089$
(B) 990,151$
(C) 5,455,603$
(B) + (C) (D) 6,445,754$
Total Outside Collection Agency Expenses (Line 2, Column B) (E) 1,354$
(F) 584$
(G) 208$
562$
Outside collection agency fees attributable to Supply Revenue
(E) - (F) - (G)
Outside collection agency fees attributable to Delivery Service Revenue
((A)/(D))*(E)
Outside collection agency fees attributable to PORCB Revenue ((B)/(D)*(E)
Sales to Ultimate Consumers (ComEd FERC Form 1, Page 300, Line 10,
col. (b)
Commonwealth Edison Company
Uncollectible Expense
2021
(In Thousands)
The Amount of the Discounted Receivables Purchased in Accordance with
the Provisions of Rider PORCB During the Year
Docket No. 22-____ComEd Ex. 1.02 Page 80 of 176

WP 7
Page 6 of 17
Commonwealth Edison Company
Adjustment to Operating Expenses to Exclude Supply Administration Expenses
Recovered Through Rider PE
Year 2021
(In Thousands)
Line
No. Description
FERC
Account
Supply Admin
Expense Total
(A) (B) (C) (D)
1 Production 557 3,949$ -$
2 Transmission 560 - -
3 Distribution 580 - -
4 Customer Accounts 903. 908 - -
5 Admin & General 920, 923, 926 364 364
6 Taxes Other Than Income 408.1 89 89
7 Other 419, 431 (4,108) -
8 Total Supply Administration Expenses 294$
9 Operating Expense Adjustment 453$
Docket No. 22-____ComEd Ex. 1.02 Page 81 of 176

WP 7
Page 7 of 17
Line FERC
No. Account Description Amount(A) (B) (C)
1 923 Outside Services Employed Expense (2,934)
2 Operating Expense Adjustment (2,934)$
(In Thousands)
Commonwealth Edison Company
Adjustment to Operating Expenses to Exclude
Residential Real Time Pricing (RRTP) Program Expenses
Recovered Through Rider RCA
2021
Docket No. 22-____ComEd Ex. 1.02 Page 82 of 176

WP 7
Page 8 of 17
LineNo. Docket Numbers Description Amount
(A) (B) (C)
1 Total Regulatory Expenses Charged to Account 928 (1) 1,262,793
2 Distribution Related Matters:
3 Numerous dockets Various Complaint and Petition Matters 118,400
412-0505, 13-0497, 14-0538, 17-
0369, 18-1456, 19-0857Rider UF Revenue Reconciliation 4,271
5
12-0059, 13-0052, 13-0547, 15-
0629, 18-0777, 19-0945, and 20-
0838
Application for Authority to Enter Into Loan Agreements
with Banks or Other Lending Institutions and to Incur
Loans, Borrowings or Extensions of Credit
27,065
612-0298, 13-0285, 13-0552,
14-0212, and 14-0555
Approval of Smart Grid Advanced Metering Infrastructure
Deployment Plan16,386
7 18-1503, 18-1583Section 466.120 Waiver Petition of Part 83 of the Illinois
Administrative Code5,346
8 19-0387Annual Formula Rate Update and Revenue Requirement
Reconciliation35,394
9 20-0393Annual Formula Rate Update and Revenue Requirement
Reconciliation(77,502)
10 20-0700Part 466 Amendment of 83 Ill. Adm. Code 466 and 83 Ill. Adm.
Code 467176,093
11 20-0832 Revenue-Neutral Tariff Changes Related to Rate Design. 137,040
12 21-0367Annual Formula Rate Update and Revenue Requirement
Reconciliation302,953
13 Contribution to Consumer Intervenor Compensation Fund 450,000
14 Various dockets Discovery Expenses 21,37315 Various dockets Various matters (22,099)1617 Total Delivery Service Related Matters
18 included in the Revenue Requirement 1,194,720 (2)
Notes:(1) FERC Form 1, Page 323, Line 189, Account 928.(2) See WPC-1a, Page 1, Line 33, Column J.
Commonwealth Edison CompanyAdjustment to Operating Expenses to Identify
Regulatory Commission Expenses (Account 928) Related to Delivery ServiceYear 2021(In Dollars)
Docket No. 22-____ComEd Ex. 1.02 Page 83 of 176

WP 7
Page 9 of 17
Line
No. Description BSC ComEd ComEd BSC BSC BSC BSC BSC BSC BSC BSC BSC BSC BSC BSC BSC BSC BSC BSC Total
(A) (B) (C) (D) (E) (F) (G) (H) (I) (J) (K) (L) (M) (N) (O) (P) (Q) (R) (S) (T) (U)
1 Salary 1,304$ 550$ 64$ 464$ -$ -$ -$ -$ -$ 605$ -$ -$ 48$ -$ -$ -$ -$ -$ -$ 3,035$
2 Annual Incentive for 2021 2,169 631 - 393 631 820 184 350 20 520 41 477 27 583 300 881 227 701 255 9,211
3 Perquisites 128 192 - 14 - - - - 1 27 3 - 1 - - - - - - 366
4 LTPSA/RstStk/StkOptions (3) 27,225 - - 789 3,124 3,695 465 590 35 1,497 128 1,651 81 777 471 7,227 499 3,267 4,616 56,137
5 Benefits and Payroll Taxes 462 347 40 164 - - - - - 214 - - 17 - - - - - - 1,244
6 All Other 85 141 - 223 - - - - - 16 - - 1 - - - - - - 466
7 Subtotal 31,373$ 1,861$ 105$ 2,046$ 3,755$ 4,515$ 650$ 940$ 56$ 2,879$ 172$ 2,127$ 175$ 1,360$ 771$ 8,108$ 726$ 3,968$ 4,871$ 70,458$
8 Payroll Taxes for LTPSA/RstStk/StkOptions (4) 2,703 - - 78 310 367 46 59 4 149 13 164 8 77 47 718 50 324 458 5,574$
9 ComEd Percentage (2) 21.43% 100.00% 100.00% 21.43% 22.77% 40.16% 21.43% 21.43% 40.16% 21.43% 21.43% 25.05% 40.16% 21.43% 21.43% 21.43% 21.43% 21.43% 21.43%
10 Sub Total 7,303$ 1,861$ 105$ 455$ 926$ 1,961$ 149$ 214$ 24$ 649$ 39$ 574$ 74$ 308$ 175$ 1,891$ 166$ 920$ 1,142$ 18,936$
11 Total 2021 Executive Compensation Exclusion 18,936$
12 Total Payroll Tax Adjustment in Line 10 (5) 579$ -$ -$ 17$ 71$ 147$ 10$ 13$ 1$ 32$ 3$ 41$ 3$ 17$ 10$ 154$ 11$ 70$ 98$ 1,276$
Notes:
(1) Represents Exelon Executive Committee compensation cost allocated to ComEd and the ComEd CEO.
(2) Excludes the portion of ComEd Executive LTPSAP already excluded in C-2.4.
(3) The exclusion for Exelon BSC Executives was based on amounts allocated to ComEd based primarily using the Modified Massachusetts Formula.
(4) Represents BSC Payroll Tax Rate of 9.93%
(5) The Total Payroll Tax Adjustment equals the amount in Line 8 multiplied by the ComEd Percentage in Line 9.
Commonwealth Edison Company
Executive Compensation Exclusion (1)
Year 2021
(In Thousands)
Docket No. 22-____ComEd Ex. 1.02 Page 84 of 176

WP 7
Page 10 of 17
Line
No. Description
FERC
Account Total Expense Capital Allocator Jurisdictional
(A) (B) (C) (D) (E) (F) (G)
1 Normalization of Retention Awards:
2 2018 Awards 1,157 927 230
3 2019 Awards 1,004 759 245
4 2020 Awards 1,042 820 222
5 2021 Awards 1,672 1,506 165
6 4 Year Average 1,219$
7 Total Increase/(Decrease) to 2020 Retention Awards (Col C, Line 6 - Line 5):
8Plant
(Col C, Line 10 * (Col E, Line 5 / Col C, Line 5)) 107/108 (45)$ 77.71% (1) See B-2.6
9Gen & Admin Expense
(Col C, Line 10 * (Col D, Line 5 / Col C, Line 5)) 920-935 (408)$ 85.40% (2) (348)
10 Total (453)$ (408)$ (45)$ (348)$
11 50% Reduction to Performance Awards (4): 2021
50%
Reduction
50%
Reduction
12 Plant 107/108 485$ (242)$ 77.71% (1) See B-2.6
13 Distribution/Customer 580-908 246 (123) 100% (123)$
14 Gen & Admin Expense 920-935 1,981 (990) 85.40% (2) (845)
15 Total 2,711$ (1,113)$ (242)$ (968)$
16 Total Jursidictional Perqs and Awards Expense Removed: (1,521)$ (287)$ (1,316)$
17 Payroll Expense associate with Disallowed Perqs and Awards: (111)$ (3) (97)$
18 Total Jurisdictional Expense Removed (1,413)$
19 Income Tax Effects of Above Adjustments:
20 State Income Taxes 134$
21 Federal Income Taxes 268
22 Deferred Income Taxes -23 402$
(1)
(2)
(3) In compliance with the ICC's final Order in Docket 13-0318, ComEd has excluded recovery of payroll tax related to removed
incentive compensation. Calculation takes total jurisdictional incentive removed (Line 16, Column G) multiplied by the payroll
tax rate of 7.36%. This amount is grossed up by the wages and salaries allocator and included on App 7.
(4) Performance rewards are reduced 50%. See Final Order in Docket 10-0467.
Notes:
Allocation to jurisdictional based on 2021 Net Plant allocation factor (see WPA-5, Page 2).
Allocation to jurisdictional based on 2021 Wages & Salaries allocation factor (see WPA-5, Page 1).
Commonwealth Edison Company
Adjustments to Perquisites and Awards
2021 Actuals
(In Thousands)
Docket No. 22-____ComEd Ex. 1.02 Page 85 of 176

WP 7
Page 11 of 17
Line
No. Description
FERC
Account
2021
Actuals
Removal
%
Non-
Recoverable
LTI $'s Allocator Jurisdictional(A) (B) (C) (D) (E) (F) (G)
1 2021 Performance Shares (1)2 Plant 107/108 422$ 100% (2) (422)$ 77.71% (6) See B-2.63 Non-Utility Expenses 416, 426 28 100% (2) (28) 0% -$ 4 Production 555-557 9 100% (2) (9) 0% -5 Transmission 560-573 268 100% (2) (268) 0% -6 Distribution/Customer 580-909 1,508 100% (2) (1,508) 100% (1,508)7 Gen & Admin Expense 920-935 4,721 100% (2) (4,721) 85.40% (3) (4,032)8 6,956$ (6,956)$ (5,540)$ 9 2020 Performance Shares (1)10 Plant 107/108 -$ 100% (2) -$ 77.71% (6) See B-2.611 Non-Utility Expenses 416, 426 17 100% (2) (17) 0% -$ 12 Production 555-557 5 100% (2) (5) 0% -13 Transmission 560-573 162 100% (2) (162) 0% -14 Distribution/Customer 580-909 912 100% (2) (912) 100% (912)15 Gen & Admin Expense 920-935 220 100% (2) (220) 85.40% (3) (188)16 1,317$ (1,317)$ (1,100)$ 17 2019 Performance Shares (1)18 Plant 107/108 -$ 100% (2) -$ 77.71% (6) See B-2.619 Non-Utility Expenses 416, 426 14 100% (2) (14) 0% -$ 20 Production 555-557 4 100% (2) (4) 0% -21 Transmission 560-573 133 100% (2) (133) 0% -22 Distribution/Customer 580-909 747 100% (2) (747) 100% (747)23 Gen & Admin Expense 920-935 180 100% (2) (180) 85.40% (3) (154)24 1,078$ (1,078)$ (901)$ 25 2018 Performance Shares (1)26 Plant 107/108 -$ 100% (2) -$ 77.71% (6) See B-2.627 Non-Utility Expenses 416, 426 2 100% (2) (2) 0% -$ 28 Production 555-557 0 100% (2) (0) 0% -29 Transmission 560-573 15 100% (2) (15) 0% -30 Distribution/Customer 580-909 82 100% (2) (82) 100% (82)31 Gen & Admin Expense 920-935 20 100% (2) (20) 85.40% (3) (17)32 118$ (118)$ (99)$ 33 RSU for VP's and Above (4):34 Plant 107/108 139$ 100% (139)$ 77.71% (6) See B-2.635 Non-Utility Expenses 416, 426 19 100% (19) 0% -$ 36 Production 555-557 6 100% (6) 0% -37 Transmission 560-573 182 100% (182) 0% -38 Distribution/Customer 580-909 1,023 100% (1,023) 100% (1,023)39 Gen & Admin Expense 920-935 1,688 100% (1,688) 85.40% (3) (1,441)40 3,057$ (3,057)$ (2,465)$ 41 RSU for Key Managers (4):42 Plant 107/108 -$ 100% -$ 77.71% (6) See B-2.643 Non-Utility Expenses 416, 426 - 100% - 0% -$ 44 Production 555-557 - 100% - 0% -45 Transmission 560-573 - 100% - 0% -46 Distribution/Customer 580-909 - 100% - 100% -47 Gen & Admin Expense 920-935 - 100% - 85.40% (3) -48 -$ -$ -$
49 Subtotals: 12,526$ (12,526)$
50 Total Long Term Incentive Compensation Expense Removed: (10,104)$
51 Payroll Tax Expense associated with Removed Long Term Incentive Compensation: (5) (744)$
52 Total Jurisdictional Expense Removed (10,848)$
53 Income Tax Effects of Above Adjustments:54 State Income Taxes 1,031$
55 Federal Income Taxes 2,06256 Deferred Income Taxes -57 3,093$
(1)
(2)
and 2021.(3)(4)
(5) In compliance with the ICC's final Order in Docket 13-0318, ComEd has excluded recovery of payroll tax related to removed incentive compensation. The ComEd payroll tax rate is 7.36%. This amount is grossed up by the wages and salaries allocator to include on App 7.
(6)
Allocation to jurisdictional based on 2021 Wages & Salaries allocation factor (see WPA-5, Page 1).100% of the Stock Options and Restricted Stock plans are now Exelon Plans and not ComEd specific. ComEd has removed 100% of those plans
from the revenue requirement. The RSU plan was not offered to ComEd Executives below SVP in 2021.
Allocation to jurisdictional based on 2021 Net Plant allocation factor (see WPA-5, Page 2).
Notes:
Long Term Performance Share Awards (LTPSA) were awarded in 2018 through 2021 and paid out 50% in stock and 50% in cash to Exelon
Executives.
Per Docket 14-0312, ComEd's weighted performance related to CAIDI and SAIFI are recoverable. In 2021 ComEd did not have any weighted performance for CAIDI and SAIFI related to LTPSAP. As such, there were no CAIDI and SAIFI performance goals for 2018, 2019, 2020,
Commonwealth Edison CompanyRemoval of Long Term Incentive Compensation
2021 Actuals(In Thousands)
Docket No. 22-____ComEd Ex. 1.02 Page 86 of 176

WP 7
Page 12 of 17
Commonwealth Edison Company
Adjustment to Operating Expenses to Exclude
Customer Assistance EIMA Costs
Year 2021
(In Thousands)
Line
No. Description Account
Total EIMA
Customer
Assistance
Programs
Expense
Adjustment
To Exclude
EIMA
Customer
Assistance
Program
Expenditures(A) (B) (C) (D)
1 Total Program Customer Credits (1) Revenue 8,949$ -$
2 Customer Assistance Expenses 908 554 (554)
3 General Advertising Expenses (2) 930.1 483 -
4 Total 9,986 (554)
Note:
(1) Total 2021 Program costs are the total bill credits and expenditures applied
for 2021 and are not recoverable through customer rates.
(2) Amount removed from expense in advertising. See WPC-1a, Line 11 and C-8.
Docket No. 22-____ComEd Ex. 1.02 Page 87 of 176

WP 7
Page 13 of 17
ICC Balance at Balance at Amortization Line Amortization Docket Beginning End (Expense) orNo. Description From To Period Number (if any) of Year of Year Credit Jurisdictional
(A) (B) (C) (D) (E) (F) (G) (H) (I)
1 Amortization Charged to account 407.3
2 Capitalized Incentive Costs (1) 1/1/2021 12/31/2021 42 Years 01-0423 5,909$ 5,647$ (2) (262)$ (262)$
3 AMI Pilot Program Costs 1/1/2021 12/31/2021 3 to 10 Years 09-0263 - - (3) - -
4 AMI Accelerated Depreciation 1/1/2021 12/31/2021 10 Years 12-0298 91,390 69,466 (4) (21,924) (21,924)
5 2018 Storm Costs Capitalized (5) 1/1/2021 12/31/2021 5 Years 19-0387 10,392 5,196 (5,196) (5,196)
6 2020 Storm Costs Capitalized (5) 1/1/2021 12/31/2021 5 Years 21-0367 69,197 51,898 (17,299) (17,299)
7 2021 Storm Costs Capitalized (5) 1/1/2021 12/31/2021 5 Years - 16,695 (4,174) (4,174)
8 2016 Merger Costs - Distribution (6) 1/1/2021 12/31/2021 5 Years 17-0196 - - - -
9 A-Base Meter Costs 1/1/2021 12/31/2021 5 Years 17-0196 11,167 3,439 (7,728) (7,728)
10 Emerald Ash Borer 1/1/2021 12/31/2021 5 Years 18-0808 26,505 26,616 (13,044) (13,044)
11 COVID-19 1/1/2021 12/31/2021 5 Years 21,558 27,892 (8,316) (8,316)
12 MGP Remediation Costs 1/1/2021 12/31/2021 9 Years 05-0597 270,809 265,767 (7) (23,054) -13 Conditional Asset Retirement Obligations Reg Asset Varies by asset (8) 91,751 99,170 - -14 Rider EEPP 1/1/2021 12/31/2021 Various 981,231 1,181,158 (130,259) -15 Rider DG 1/1/2021 12/31/2021 Various 29,186 77,371 (3,704) -16 PORCB Regulatory Asset 1/1/2021 12/31/2021 Various 13,494 19,784 (9) (248) -17 Rider UF 89,222 59,784 (12) (29,438) -
18 Total Amortization Charged to account 407.3 (10) (264,646)$ (77,943)$
19 Amortization Charged to account 407.4 (11)
20 Rider UF (12) -$ -$ 21 Establishment of Reg Asset for 2021 Significant Storms 20,869 -22 COVID-19 14,650 -23 Emerald Ash Borer 13,143 -
24 Total Amortization Charged to account 407.4 (13) 48,662$ -$
Notes:(1) The initial amount included in this account was $10,857,000, representing the capitalization of incentive costs as part of the March 2003 agreement.
See ICC Order No. 01-0423, dated March 28, 2003.(2) 12/31/21 Balance included in the calculation of the jurisdictional rate base (See Schedule B-10).(3) AMI Pilot Program Costs regulatory asset consists of deferred expenses and the cost of prematurely retired meters. The cost of the retired meters
and pre-2010 costs are included in rate base per docket 10-0467. See Schedule B-10.(4) AMI Accelerated Depreciation is the unrecovered undepreciated cost of meters retired prematurely as they are replaced by AMI 'Smart Meters'.
The unrecovered balance of this regulatory asset is included in rate base per docket 12-0298.(5) Significant Storm costs were credited to account 407400 and charged to account 182300. The regulatory asset is being amortized to account 407300.(6) The 2016 Merger of Exelon and Pepco Holdings resulted in ComEd incurring certain costs to achieve systems integration. These costs are being recovered over five years.(7) Recovered through Rider ECR.(8) In accordance with the guidelines of FERC Docket No. RM02-7-000, Order 631, issued April 9, 2003.(9) Recovered through Rider PORCB.
(10) Ties to FERC Form 1, Page 114, Line 12(11) Certain regulatory assets were established by charging account 182300 and crediting account 407400 rather than crediting O&M.
Were Accreted
Commonwealth Edison CompanyAmortization of Regulatory Debits and Credits
2021 Actual(In Thousands)
Time Period Costs
Docket No. 22-____ComEd Ex. 1.02 Page 88 of 176

WP 7
Page 14 of 17
Line
No. Description Type of Tax
Total
Company (1)
Operating
Expense (2)
Clearing
Accounts
(3)
Construction
(3) Other (3)
Category Applied to
Column (D) on WP 7
(A) (B) (C) (D) (E) (F) (G)
1 Taxes Other Than Income Taxes - Account 236
2 Infrastructure Maintenance Fee (4) kWh based 87,479$ 87,479$ -$ -$ -$ Non DST
3 Rider RCA - Low Income Assistance (5)
Charge per
customer 40,382 44,195 - - (3,813) Non DST
4 Rider RCA - Renewable Energy (5)
Charge per
customer 4,607 4,607 - - - Non DST
5 Illinois Electric Distribution Tax (6) Miscellaneous 109,428 109,428 - - - 100% DS
6 Public Utility Fund Miscellaneous 4,391 4,391 - - - 100% DS
7 Property Taxes Real Estate 38,222 37,911 - - 311 Property Taxes
8 Federal Unemployment Insurance Tax (FUTA) (7) Payroll 294 119 - 175 - Labor Related
9 Federal Insurance Contributions Tax (FICA) (7) Payroll 76,138 25,347 - 50,790 - Labor Related
10 State Unemployment Insurance Tax (SUTA) (7) Payroll 965 391 - 573 - Labor Related
11 Chicago Employers' Expense Tax (7) Payroll - - - - -
12 Federal Heavy Vehicle Use Tax Use Tax 1 1 - - - Plant Related
13 State Use Tax on Purchases Use Tax 10,160 42 - - 10,118 Plant Related
14 Chicago Sales and Use Taxes Use Tax 590 (20) - - 611 Plant Related
15 Chicago Transaction Tax Miscellaneous 675 294 - - 381 Plant Related
16 State Franchise Tax Miscellaneous 2,925 2,925 - - - Plant Related
17 Vehicle Licenses Miscellaneous 2,376 - - - 2,376
18 Municipal Utility Tax Miscellaneous 158 42 - - 116 100% DS
19 Cook County Parking Tax Miscellaneous 789 789 - - - Plant Related
20 Other Tax Miscellaneous (3) (6) - - 3 Plant Related
21 Evanston IMF kWh based 505 505 - - - Non DST
22 Total - Account 236 380,083$ 318,441$ -$ 51,539$ 10,103$
Notes:
(1) Totals for account 236 were taken from 2021 FERC Form 1, Page 262, Column "g" (Taxes Charged During Year),
less income taxes. Totals for account 241 were taken from ComEd's general ledger.
(2) Totals taken from 2021 FERC Form 1, Page 263, Column "(l)" (Electric) - Charged to account 408.1.
(3) Totals taken from 2021 FERC Form 1, Page 263, Column "(o)" (Other)
(4) Kilowatt hour based tax is collected under the provisions of Rider FCA (Franchise Cost Additions). Tax amounts
are to recover franchise costs imposed upon ComEd by municipalities.
(5) Flat charge per customer tax collected under Rider RCA (Renewable Energy Resources and Coal Technology
Development Assistance Charge and Energy Assistance Charge for the Supplemental Low-Income Energy
Assistance Fund).
(6) Tax is imposed upon utilities distributing electricity for consumption and not resale. The basis of the calculation
of the tax is MWH billed to Ultimate Consumers.
(7) See Page 1, note 5
(8) Kilowatt hour based tax collected under the provisions of Rider TAX (Municipal and State Tax Additions). This
pass-through tax is recorded as a balance sheet item only in account 241 - Tax collections Payable.
(9) Kilowatt hour based tax is imposed on electricity used by customers for consumption and not for resale. This
pass-through tax is recorded as a balance sheet item only in account 241 - Tax collections Payable.
Commonwealth Edison Company
Taxes Other Than Income Taxes
2021
(In Thousands)
Docket No. 22-____ComEd Ex. 1.02 Page 89 of 176

WP 7
Page 15 of 17
Line
No.
(B)
1 Cash Balance Pension Plan (CBPP)
2 -$ (1)
3 CBPP Service Cost 7.00% (2)
4 Discount Rate 2.58% (3)
5 Investment Credit Rating 4.00% (3)
6 Average Years of Expected Future Service 12.36 (3)
7 Cost of pension related to 2020 excluded AIP - Line 2 * Line 3 * ((1+Line 5)/(1 + Line 4)) ^ Line 6 * (1+Line 4)
8 41 (4)
9 Total 2021 Cost of Pension Removed 41 Line 7 + Line 8
FERC Acct Allocation (5) Removal Allocator Jurisdictional
(B) (C) (D) (E) (F)
10 Plant 107/108 55.30% 23$ See B-2.6
11 Handling/Clearing/Misc Various 1.42% 1$ 77.71% (6) -$
12 Non-Utility Expenses 416/426 1.11% 0$ 0% -$
13 Production 500-557 0.15% 0$ 0% -$
14 Transmission 560-573 4.78% 2$ 0% -$
15 Distribution/Customer 580-908 27.16% 11$ 100% 11$
16 Gen & Admin Expense 920-935 10.07% 4$ 85.40% (7) 4$
41$
17 2021 CBPP Pension Expense Related to Previously Excluded AIP 15$
18 Exelon Corporation Retirement Plan (ECRP - Service Annuity System)
19 3$ (8)
20
21 Plant 107/108 55.30% 2$ See B-2.6
22 Handling/Clearing/Misc Various 1.42% 0$ 77.71% (6) -$
23 Non-Utility Expenses 416/426 1.11% 0$ 0% -$
24 Production 500-557 0.15% 0$ 0% -$
25 Transmission 560-573 4.78% 0$ 0% -$
26 Distribution/Customer 580-908 27.16% 1$ 100% 1$
27 Gen & Admin Expense 920-935 10.07% 0$ 85.40% (7) -$
3$
28 2021 ECRP Pension Expense Related to Previously Excluded AIP 1$
29 Total Jurisdictional Expense Removed 16$
30 Income Tax Effects of Above Adjustments:31 State Income Taxes (2)$
32 Federal Income Taxes (3)
33 Deferred Income Taxes -(5)$
(1)
(2) Cash Balance Pension Plan service cost is equal to 7% of pensionable pay (base pay + incentive pay) per CBPP Summary document.
(3) Actuarial assumptions
(4) Carrying costs of previously excluded pension expense is equal to previously removed pension expense adjusted for discount rate
increase/decrease and gain/loss.
(5) Allocation percentages based on 2021 balances.
(6) Allocation to jurisdictional based on 2021 Net Plant allocation factor (see WPA-5, Page 2).
(7) Allocation to jurisdictional based on 2021 Wages & Salaries allocation factor (see WPA-5, Page 2).
(8) Balance based on actuarial analysis and assumptions.
Notes:
Balance includes 2020 excluded AIP for ComEd employees participating in the CBPP.
Description
(A)
Excluded 2020 AIP applicable to ComEd non-
Local 15 CBPP participants
Carrying costs of previously excluded pension
Commonwealth Edison Company
Removal of 2021 Pension Costs related to Previously Excluded Incentive Payments
2021 Actual
(In Thousands)
2021 ECRP Pension Expense Related to Previously
Excluded AIP
Docket No. 22-____ComEd Ex. 1.02 Page 90 of 176

WP 7
Page 16 of 17
Line
No.
FERC
Account Account Description Payee
2021 Payment
Amount Nature of Service Provided
1 923000 Outside services employed SFIO CONSULTING INC 180 CONSULTING SERVICES
2 923000 Outside services employed MARTIN ROTH COHEN & ASSOCIATES LLC 150 LEGAL SERVICES
3 923000 Outside services employed JENNER & BLOCK LLP 133 LEGAL SERVICES
4 923000 Outside services employed COZEN OCONNOR 120 CONSULTING SERVICES
5 923000 Outside services employed STEPHENSON SCHROEDER LTD 120 CONSULTING SERVICES
6 923000 Outside services employed HISPANICS IN ENERGY 25 COMMUNITY RELATIONS
7 923000 Outside services employed STRATALYS RESEARCH AND CONSULTING 16 CONSULTING SERVICES
8 923000 Outside services employed QUID LLC 15 CONSULTING SERVICES
9 923000 Outside services employed NP CONSULTING 10 CONSULTING SERVICES
10 923000 Outside services employed ESCALENT 7 CONSULTING SERVICES
11 Total 776$
Commonwealth Edison CompanySummary of Consulting Services and Professional Memberships To Be Removed From The Requested Revenue Requirement
(In Thousands)
Docket No. 22-____ComEd Ex. 1.02 Page 91 of 176

WP 7
Page 17 of 17
Commonwealth Edison Company
Adjustment to Operating Expenses to Reflect
Corporate Credit Card Expenditures Voluntary Reductions
Year 2021
(In Thousands)
Line
No. Description
Distribution
Expense
Customer
Expense
Administration
and General Capital (a)
(A) (B) (C) (D) (E)
1 2021
2 Corporate Credit Cards 276$ 175$ 678$ 120$
3 Employee Recognition 2$ -$ -$ -$
4 Total 278$ 175$ 678$ 120$
(a) The amount shown is total capital and will be adjusted on Schedule B-2.10 using the net plant allocator.
Docket No. 22-____ComEd Ex. 1.02 Page 92 of 176

WP 8
Page 1 of 1
Commonwealth Edison CompanyAdjustments to 2021 Unusual Operating Expenses Greater than $10M (1)
(In Thousands)
Line
No. Description Amount Total
(A) (B) (C)
Incremental Distribution Costs for Unusual Operating Costs Greater than $10 Million
1 2021 August Storm 20,869$ Various Distribution Accounts
2 2021 Ash Borer 13,155 Various Distribution Accounts
3 2021 COVID-19 14,661 Various Distribution Accounts
4 Total of 2021 Unusual Operating Costs Greater than $10M 48,685$ = Line 1 + Line 2 + Line 3
5 Number of Years of Amortization 5
6 Annual Amortization 9,737$ = Line 4 / Line 5
7 Expense adjustment (48,685)$ = Line 4 * -1
8 Amortization adjustment 9,737 = Line 6
9 Net expense adjustment (38,948)$ = Line 7 + Line 8
10 Deferred Debit - Asset (2)
11 2018 Storm 5,196$
12 2020 Storm 51,898
13 2021 Storm 16,695
14 Total Storms 73,789$
15 2018 ABase Meters 3,440$
16 2018 Ash Borer 2,581
17 2019 Ash Borer 5,569
18 2020 Ash Borer 7,942
19 2021 Ash Borer 10,524
20 2020 COVID-19 16,159
21 2021 COVID-19 11,729
22 Total Other 57,944$
23 Total Deferred Debits 131,733$
Notes:
(1) Schedule to reflect the deferral and test year amortization of unusual operating expense
2021
Docket No. 22-____ComEd Ex. 1.02 Page 93 of 176

WP 9
Page 1 of 3Commonwealth Edison Company
2021 Tax Provision Permanent Tax Differences
(In Thousands)
Line
No.
(A) (B) (C) (D) (E) (F) (G)
Gross Amount
Tax Effected at
28.51% Allocation Method Allocation % Tax Amount App 9 Reference
Permanent Tax Difference Items
1 Meals and Entertainment - 50% (126)$ (36)$ Wages & Salaries 85.40% (31)$ App 9 Line 1
2 Safe Harbor Credit -$ -$ Net Plant Allocator 77.71% -$ App 9 Line 2
3 Disposition of Stock 918 262 Net Plant Allocator 85.40% 223$ App 9 Line 3
4 Fuel Tax Credit 110 31 Wages & Salaries 77.71% 24$ App 9 Line 4
5 Corporate-Owned Life Insurance Premiums (4) (1) Net Plant Allocator 85.40% (1)$ App 9 Line 5
6 Other Income Tax Items (100) App 9 Line 6
7 Total Lines 1-6 117$ App 9 Line 7
Other Tax Adjs to Income Amount Allocation Method Allocation % Tax Amount App 9 Reference
8 ITC Amort (776)$ DS 100.00% (776)$ App 9 Line 8
9 Fuel Tax Credit (301) Net Plant 77.71% (234) App 9 Line 9
10 Regulatory Asset Flow Thru - Net Plant 77.71% - App 9 Line 10
11 Other Tax Adjs to Income Specific Identification (57,544) App 9 Line 11
12 Total Other Tax Adjs to Income (58,554)$
13 Total Other Adj to Income (total line 12) (58,554)$ App 9 Line 11
14 Overall Total (sum of lines 7, and 13) (58,437)$
Notes: 1 Represents the impact that the change in IL tax rates has on current year temporary and flow through items. The benefit is arrived at by taking the difference between the
temporary items measured at the tax rate currently in place and the tax rate enacted in the year these items are expected to be realized. This also includes a one
time tax adjustment to account for the impact of the IL rate change on our existing deferred balances at December 31, 2014.
Docket No. 22-____ComEd Ex. 1.02 Page 94 of 176

WP 9
Page 2 of 3
Balance at Deferred Adjustments Amortized Balance at
Line FERC Beginning during the during the during the End
No. Account Description of Year Year Year Year of Year
(A) (B) (C) (D) (E) (F) (G)
1 255020 Post - 1971 4% - Job Development (56)$ -$ -$ 5$ (51)$ 2 255030 Post - 1971 10% - Plant and Equipment (8,404) - - 1,237 (7,168)3 255000 Post - 2018 0.5% - Illinois Enterprise Zone (833) (475) - 30 (1,279)
4 Total Investment Tax Credits (1) (9,293)$ (475)$ -$ 1,271$ (8,497)$
Note:
(1) Accumulated Deferred Investment Tax Credits (Account 255) - 2021 FERC Form 1, Pages 266-267.
Commonwealth Edison Company
Investment Tax and Job Development Credits
2021
(In Thousands)
Docket No. 22-____ComEd Ex. 1.02 Page 95 of 176

WP 9
Page 3 of 3Commonwealth Edison Company
Allocation of Amortization and Accumulated Investment Tax Credits
2021 Actual
(In Thousands)
Post - 1971 4% Post - 1971 10% Post - 2018 0.5%
Line Account Allocation Account Allocation Account Allocation
No. Description 255020 Percentages 255030 Percentages 255000 Percentages Total
(A) (B) (C) (D) (E) (D) (E) (F)
1 Accumulated Investment Tax Credit
2 Transmission (27)$ 52.8% (2,716)$ 37.9% (120)$ 9.4% (2,863)$
3 Distribution (23) 46.1% (4,128) 57.6% (1,159) 90.6% (5,310)$
4 General (1) 1.1% (323) 4.5% - 0.0% (323)$ 5 Accum ITC Bal at 12-31-21 (1) (51)$ 100.0% (7,168)$ 100.0% (1,279)$ 100.0% (8,497)$
6 Functionalization after allocation of General Plant component: (2)
7 Transmission (27)$ 53.4% (2,844)$ 39.7% (120)$ 9.4% (2,992)
8 Distribution (24) 46.6% (4,323) 60.3% (1,159) 90.6% (5,505)9 Total (51)$ 100.0% (7,168)$ 100.0% (1,279)$ 100.0% (8,497)$
10 Amortization of Investment Tax Credit
11 Transmission 3$ 52.8% 469$ 37.9% 2$ 7.9% 474$
12 Distribution 2 46.1% 712 57.6% 27 92.1% 742$
13 General 0 1.1% 56 4.5% - 0.0% 56$ 14 Amortization of ITC - 2021 (3) 5$ 100.0% 1,237$ 100.0% 30$ 100.0% 1,271$
15 Functionalization after allocation of General Plant component: (4)
16 Transmission 3$ 53.4% 491$ 39.7% 2$ 7.9% 496$
17 Distribution 2 46.6% 746 60.3% 27 92.1% 776$ 18 Total 5$ 100.0% 1,237$ 100.0% 30$ 100.0% 1,271$
Notes:
(1) Accumulated Deferred Investment Tax Credits (Account 255) - 2021 FERC Form 1, Pages 266-267.
(2) General Plant component allocated based on relationship of transmission or distribution as identified historically (Lines 2 & 3).
(3) Includes amounts credited to FERC Account 411.4
(4) General Plant component allocated based on relationship of transmission or distribution as identified historically (Lines 11 & 12).
Docket No. 22-____ComEd Ex. 1.02 Page 96 of 176

WP 10Page 1 of 4
Line
No. Description
Total Company
($000's) Allocator Percentage
Jurisdictional
($000's)
(A) (B) (C) (D) (E)
FERC Acct 450 - Forfeited Discounts
1 Late Payment Fees - Electric Service 23,049$ DS 100.00% 23,049$
2 Late Payment Fees - Nonstandard Service 2 DS 100.00% 2
3 Earned Finance Charge on Deferred Payment Agreements - DS 100.00% -
4 Late Payment Fees - Past Due Amts Billed Under Rider RRS - DS 100.00% -
5 Other Forfeited Discounts 5,466 DS 100.00% 5,466
6Total FERC Acct 450 - FERC Fm 1 Pg 300 Col B Ln 16 Entered in Col
CB28,516$ 28,517$
7 FERC Acct 450 Revenues Applied to Transmission (2,824)
8 Total Forfeited Discounts 28,516$ 25,693$
FERC Acct 451 - Miscellaneous Service Revenues
9 Return Check Charges 1,067$ DS 100.00% 1,067$
10 Reconnection Fees 717 DS 100.00% 717
11 Other Revenues - Real Estate Lease Applications & Customer Studies 97 DS 100.00% 97
12 Other Revenues - Call Center Referrals 125 DS 100.00% 125
13 Utility Property Land Related - Net Plant 77.71% -
14 Temporary Services 1,999 DS 100.00% 1,999
15 Electric Choice Fees 27 DS 100.00% 27
16 Meter Tampering 79 DS 100.00% 79
17 Meter Services - DS 100.00% -
18 Interconnection Application Fee 2,365 DS 100.00% 2,365
19 Other Miscellaneous Service Revenues 5,002 5,002
20 Total FERC Acct 451 - FERC Fm 1 Pg 300 Col B Ln 17 Entered in Col 11,477$ 11,478$
21 FERC Acct 451 Revenues Applied to Transmission and Other (218)
22 Total Forfeited Discounts 11,477$ 11,260$
FERC Acct 454 - Rent From Electric Property
23 Distribution Equipment Rental - Special Contract 276$ DS 100.00% 276$
24Rent From Land PHFU Leases for Crop Farming, Pasture, Parking Lot,
and Other- Non DS 0.00% -
25 Distribution Equipment Rental - Rider NS 42,780 DS 100.00% 42,780
26 Meter Rental - Rider ML 10,800 DS 100.00% 10,800
27 Tower Attachments 2,666 Non DS 0.00% -
28 One-Time Easement Sales 370 Easement 21.08% 78
29Rent from Annual Easements/RoWs Leased to IDOT, Pipeline
Companies and Others- Easement
21.08% -
30 Real Estate Taxes - Included in Rent From Land Easements 699 Easement 21.08% 147
31 Sublease of Office Space - Wages &
Salaries 85.40%
-
32 Pole Attachments 17,433 DS 100.00% 17,433
33 Third Party Use of Fiber Optic Cable 18,925 Com 68.90% 13,039
34 One-Time Easement Sales - Easement 21.08% -
35 Rent From Annual Easements 1,440 Easement 21.08% 304
36 Rent From Affiliates 2,849 Wages &
Salaries 85.40%
2,433
37 Facility Costs Billed to Affiliates 3,169 Wages &
Salaries 85.40%
2,706
38 Other Rent From Electric Property 5,013 512
39Total FERC Acct 454 - FERC Fm 1 Pg 300 Col B Ln 19 Entered in
Col B106,421$ 90,508$
Commonwealth Edison Company
Other Revenues Information
2021
Docket No. 22-____ComEd Ex. 1.02 Page 97 of 176

WP 10Page 2 of 4
Line
No. Description
Total Company
($000's) Allocator Percentage
Jurisdictional
($000's)
(A) (B) (C) (D) (E)
Commonwealth Edison Company
Other Revenues Information
2021
FERC Acct 456 - Other Electric Revenues
40 IPP Elec Gen Study Reimbursement - A&G Accts -$ Wages &
Salaries 85.40%
-$
41 IPP Elec Gen Study Reimbursement - Transmission Accts - Non DS 0.00% -
42 Fees Earned From Phone/Credit Card Program - DS 100.00% -
43 Engineering Studies - DS 100.00% -
44 Rate Relief Payment - Non DS 0.00% -
45 Submeter Lease 375 DS 100.00% 375
46 Other Electric Revenues 14,130 3,632
47Total FERC Acct 456 - FERC Fm 1 Pg 300 Col B Ln 21 Entered in
Col B14,505$ 4,007$
FERC Acct 456.1 - Revenues from Transmission of Electricity to
Others
48 Network Transmission 756,628$ Non DS 0.00% -$
49 Wholesale Distribution Revenues From Municipalities 4,843
50Total FERC Acct 456.1 - FERC Fm 1 Pg 300 Col B Ln 22 Entered in
Col B756,628$ 4,843$
51Total Other Operating Revenues FERC Accts 450-457.2 - FERC Fm
1 Pg 300 Col B Ln 16 thru Ln 25 Entered in Col CB917,548$ 136,311$
Other Adjs
52 Single Bill Option Credit (208)$ DS 100.00% (208)$
53 Additional Lighting Facilities Charges 7,015 DS 100.00% 7,015
54 Estimated Cost of Franchise DS 39,140 8,677 (1)
55 Central Air Conditioning Cycling 571 DS 100.00% 571
56 Accounting Fees Collected Under Rider TAX 8,153 DS 100.00% 8,153
57 Other Adjs 53 53
58 Subtotal -Other Adjs 54,724 24,261
59 Total 972,271$ 160,571$
To Sch FR A-1 Line 22 and
To Sch FR A-1 - REC Line 22
(1) Total Company: FERC Form 1, Page 323, Line 188, Column B; DS Jurisdictional source App 11, Line 41, divided by 1,000
Notes:
Docket No. 22-____ComEd Ex. 1.02 Page 98 of 176

WP 10Page 3 of 4
Line
No. Delivery Classes
2021
Free Service
Billing Units
Current
Rate RDS
Charges filed
12/10/2021
Computed DS
Value
( B * C )
2021
Franchise Service
Billed kWh
Computed
DS Value
in $/kWh
( D / E )
(A) (B) (C) (D) (E) (F)
1 Watt-Hour Delivery Class
2 Customer Charge 8,405 $11.62 $97,666
3 Standard Metering Service Charge 8,405 $2.64 $22,189
4 DFC (kWh) 1,472,915 $0.01935 $28,501
5 IEDT (kWh) 1,472,915 $0.00121 $1,782
6 Total $150,138 1,472,915 $0.1019
7 Small Load Delivery Class
8 Customer Charge 23,757 $12.29 $291,974
9 Standard Metering Service Charge 23,757 $6.65 $157,984
10 Secondary Voltage DFC (kW) 349,320 $7.84 $2,738,669
11 Primary Voltage DFC (kW) 372 $2.84 $1,056
12 Primary Voltage Transformer Charge (kW) 0 $0.22 $0
13 IEDT (kWh) 130,981,214 $0.00121 $158,487
14 Total $3,348,170 130,981,214 $0.0256
15 Medium Load Delivery Class
16 Customer Charge 3,016 $20.95 $63,185
17 Standard Metering Service Charge 3,016 $11.42 $34,443
18 Secondary Voltage DFC (kW) 390,182 $7.58 $2,957,580
19 Primary Voltage DFC (kW) 0 $4.17 $0
20 Primary Voltage Transformer Charge (kW) 0 $0.20 $0
21 IEDT (kWh) 174,228,531 $0.00121 $210,817
22 Total $3,266,025 174,228,531 $0.0187
23 Large Load Delivery Class
24 Customer Charge 312 $95.61 $29,830
25 Standard Metering Service Charge 312 $11.90 $3,713
26 Secondary Voltage DFC (kW) 122,550 $7.45 $912,998
27 Primary Voltage DFC (kW) 0 $5.52 $0
28 Primary Voltage Transformer Charge (kW) 0 $0.27 $0
29 IEDT (kWh) 54,330,373 $0.00121 $65,740
30 Total $1,012,281 54,330,373 $0.0186
Commonwealth Edison Company
Computation of Delivery Service Value for Franchise Service Accounts
Based on Charges in Rate RDS - Retail Delivery Service (1)
2021
Docket No. 22-____ComEd Ex. 1.02 Page 99 of 176

WP 10Page 4 of 4
Line
No. Delivery Classes
2021
Free Service
Billing Units
Current
Rate RDS
Charges filed
12/10/2021
Computed DS
Value
( B * C )
2021
Franchise Service
Billed kWh
Computed
DS Value
in $/kWh
( D / E )
(A) (B) (C) (D) (E) (F)
31 Very Large Load Delivery Class
32 Customer Charge 12 $548.49 $6,582
33 Standard Metering Service Charge 12 $12.63 $152
34 Secondary Voltage DFC (kW) 1,921 $7.89 $15,157
35 Primary Voltage DFC (kW) 0 $6.60 $0
36 Primary Voltage Transformer Charge (kW) 0 $0.32 $0
37 IEDT (kWh) 660,207 $0.00121 $799
38 Total $22,690 660,207 $0.0344
39 General Lighting Delivery Class
40 Standard Metering Service Charge (kWh) 53,069,514 $0.00025 $13,267
41 DFC (kWh) 53,069,514 $0.01507 $799,758
42 IEDT (kWh) 53,069,514 $0.00121 $64,214
43 Total $877,239 53,069,514 $0.0165
44 Total Free Service Value $8,676,543 414,742,754 $0.0209
Note:
(1) Average revenue per kWh based on delivery service charges filed with the ICC in December 2021
in Docket No. 21-0367 applicable January 2022
Based on Charges in Rate RDS - Retail Delivery Service (1)
2021
Commonwealth Edison Company
Computation of Delivery Service Value for Franchise Service Accounts
Docket No. 22-____ComEd Ex. 1.02
Page 100 of 176

WP 11
Page 1 of 1
Line Total
No. Description ComEd Other Jurisdictional
(A) (B) (C) (D)
1 Line Extension Deposits (2) (91,156)$ -$ (91,156)$
2 Contributions in Aid of Construction
3 Facility Relocations (731) (196) (3) (535)
4 New Business (63,538) (7,693) (3) (55,845)
5 Other (21,332) (1,228) (3) (20,104)
6 Customer Advances - IPPs (4) (1,506) (1,506) -
7 Total Customer Advances for Construction (178,263)$ (10,623)$ (167,640)$
Notes:
(1) FERC Account 252.
(2) Refundable deposits for line extensions are collected under Rider DE, Distribution
System Extensions.
(3) Deposits relate to non-jurisdictional projects.
(4) Cash advances from IPPs primarily for engineering studies and transmission
construction projects.
Commonwealth Edison Company
Customer Advances For Construction (1)
(In Thousands)
As of December 31, 2021
Docket No. 22-____ComEd Ex. 1.02
Page 101 of 176

WP 12Page 1 of 2
Weighted
Balance of CWIP (E)=(B)-((B/C)*D) (F)=(B)-(D)-(E) Greater of (E) or (F) Short-Term Avg. Term
Line Short-term Accruing Net Amount Net Amount Net Amount Interest Cost of Short- Type of to Maturity
No. Month Debt (1) CWIP (1) AFUDC (1) Outstanding Outstanding Outstanding Expense term Debt (3) Borrowing (Days) (2)
(A) (B) (C) (D) (E) (F) (G) (H) (I) (J) (K)
Year Ending December 31, 2021 (4)
1 December - 919,256 858,751 - (858,751) - - 0.16% Commercial Paper 0.0
Notes:
(1) Represents end of year balance for line 1.
(2) In more than one type of borrowing, the maturity is a blended average of the two types of debt.
The balances provided in this column are the outstanding balance of short-term debt on the last day of the month.
(3) Represents the average interest rate calculated for 2021 which is the actual rate used by ComEd to borrow under its revolving credit
facilities in place as of December 31, 2021.
(4) As per PA98-0015, the use of year-end capital stucture is to be applied. As such only the December balance will be used to calculate the balance of short term debt.
Commonwealth Edison Company
Cost of Short-Term Borrowings
(In Thousands)
Docket No. 22-____ComEd Ex. 1.02
Page 102 of 176

WP 12
Page 2 of 2
Commonwealth Edison Company
Cost to Maintain Credit Facilities (1)
(In Thousands)
Line December One-Time Annualized
No. Accrual Accrual Amount
(B) (C) (D)
1 Primary Credit Facility
2 Annual amortization of upfront fees (2) 56 - 672
3 Facility commitment fees 108 - 1,296
4 Line of credit drawn fees 3 - 36
5 Subtotal - 2,004
6 Community- and Minority-Owned Bank Credit Facility
7 Annually incurred upfront fees (2) - 149 149
8 Facility commitment fees 3 - 36
9 Line of credit drawn fees 4 - 48
10 Subtotal 233
11 LESS LC fees associated with PJM collateral requirements - - -
12 Total 2,237
13 Total capital (3) 18,816,807
14 Credit facility cost of capital (Line 12 / Line 13) 0.01%
Notes:
(1) Does not include the cost of short term borrowings, which are shown
on Page 1.
(2) Upfront fees include legal and administrative costs associated with
establishing credit facilities. ComEd's policy is to amortize these fees for
the primary credit facility and to expense them once annually as incurred for the
community- and minority-owned bank credit facility.
(3) Equals the Balance of Long Term Debt WP 13, P2, Line 8 of $9,511,593 plus the Balance
of Common Equity of $9,305,214 as shown on WP 24 plus the Balance of Short Term
Debt on WP 12, Page 1, Col (G) of $0.
Description
(A)
Docket No. 22-____ComEd Ex. 1.02
Page 103 of 176

WP 13Page 1 of 4
Commonwealth Edison Company
Embedded Cost of Long-term Debt
Year Ending December 31, 2021
Annual Annual
Debt, Days Unamortized Carrying Coupon Annual Annual Interest
Line Issue Type Date Maturity Outstanding Principal Face Amount Discount or Unamortized Value Interest Amortization of Amortization of Expense
No. Coupon Rate Issued Date Factor Amount Outstanding (Premium) Debt Expense (H)=(E)-(F)-(G) (I) Discount (Prem) Debt Expense (L)=(I)+(J)+(K)
(A)1
(B)1
(C)1
(D)1
(E)1
(F)2
(G)2
(H) (I) (J)2
(K)2
(L)
First Mortgage Bonds
1 5.875% Series 100 01/22/03 02/01/33 350,000,000 253,600,000 404,889 957,590 252,237,521 14,899,000 36,508 86,344 15,021,852
2 5.900% Series 103 03/06/06 03/15/36 325,000,000 325,000,000 966,672 1,654,881 322,378,447 19,175,000 68,036 116,474 19,359,510
3 5.900% Series 103B 03/22/07 03/15/36 300,000,000 300,000,000 6,091,810 514,124 293,394,066 17,700,000 428,753 36,185 18,164,938
4 6.450% Series 107 01/16/08 01/15/38 450,000,000 450,000,000 726,446 2,390,933 446,882,621 29,025,000 45,271 149,000 29,219,271
5 3.800% Series 113 10/01/12 10/01/42 350,000,000 350,000,000 430,819 2,418,629 347,150,552 13,300,000 20,753 116,510 13,437,263
6 4.600% Series 114 08/19/13 08/15/43 350,000,000 350,000,000 570,229 3,047,474 346,382,297 16,100,000 26,359 140,872 16,267,231
7 4.700% Series 116 01/10/14 01/15/44 350,000,000 350,000,000 84,808 2,698,502 347,216,690 16,450,000 3,846 122,370 16,576,216
8 3.100% Series 117 11/10/14 11/01/24 250,000,000 250,000,000 60,355 762,243 249,177,402 7,750,000 21,285 268,810 8,040,095
9 3.700% Series 118 03/02/15 03/01/45 400,000,000 400,000,000 - 3,478,754 396,521,246 14,800,000 - 149,697 14,949,697
10 4.350% Series 119 11/19/15 11/15/45 450,000,000 450,000,000 2,786,673 4,532,016 442,681,311 19,575,000 116,657 189,722 19,881,379
11 2.550% Series 120 06/27/16 06/15/26 500,000,000 500,000,000 - 2,068,243 497,931,757 12,750,000 - 433,994 13,183,994
12 3.650% Series 121 06/27/16 06/15/46 700,000,000 700,000,000 4,036,732 6,777,488 689,185,780 25,550,000 99,580 166,959 25,816,539
13 2.950% Series 122 08/15/17 08/15/27 350,000,000 350,000,000 575,457 1,854,018 347,570,525 10,325,000 92,471 297,908 10,715,379
14 3.750% Series 123 08/15/17 08/15/47 650,000,000 650,000,000 1,486,697 6,577,878 641,935,425 24,375,000 33,750 149,230 24,557,980
15 4.000% Series 124 02/20/18 03/01/48 800,000,000 800,000,000 141,090 8,176,400 791,682,510 32,000,000 2,986 173,066 32,176,052
16 3.700% Series 125 08/14/18 08/15/28 550,000,000 550,000,000 873,498 3,776,055 545,350,447 20,350,000 131,856 570,663 21,052,519
17 4.000% Series 126 02/19/19 03/01/49 400,000,000 400,000,000 3,087,390 5,046,098 391,866,512 16,000,000 61,019 99,731 16,160,750
18 3.200% Series 127 11/12/19 11/15/49 300,000,000 300,000,000 2,181,628 3,657,787 294,160,585 9,600,000 78,221 131,159 9,809,380
19 2.200% Series 128 02/18/20 03/01/30 350,000,000 350,000,000 885,282 3,175,860 345,938,858 7,700,000 97,439 378,278 8,175,717
20 3.000% Series 129 02/18/20 03/01/50 650,000,000 650,000,000 862,101 8,140,934 640,996,965 19,500,000 19,086 234,017 19,753,103
21 3.125% Series 130 03/09/21 03/15/51 700,000,000 700,000,000 926,122 8,984,889 690,088,989 21,875,000 31,696 290,443 22,197,139
22 2.750% Series 131 08/12/21 09/01/51 450,000,000 450,000,000 93,278 4,882,903 445,023,819 12,375,000 2,993 145,064 12,523,057
23 9,975,000,000 9,878,600,000 27,271,976 85,573,699 9,765,754,325 381,174,000 1,418,565 4,446,496 387,039,061
24 Subordinated Deferrable Interest Debt
25 6.350% 03/17/03 03/15/33 206,186,000 206,186,000 69,428 841,945 205,274,627 13,092,811 6,195 75,137 13,174,143
26 10,181,186,000$ 10,084,786,000$ 27,341,404$ 86,415,644$ 9,971,028,952$ 394,266,811$ 1,424,760$ 4,521,633$ 400,213,204$
Notes:
(1) Long-term debt balances taken from Form 21 ILCC, Page 22a.
(2) Balances taken from Form 21 ILCC, Supplemental Pages 26a-27b.
Docket No. 22-____ComEd Ex. 1.02
Page 104 of 176

WP 13Page 2 of 4
Commonwealth Edison Company
Embedded Cost of Long-term Debt
Year Ending December 31, 2021
Line EMBEDDED COST OF
No. Amount Amount LONG TERM DEBT Amount
(B) (D) (E) (F)
1 Interest on long-term debt (1) 394,266,811$ Total long-term debt balance (5) 10,084,786,000$ Cost of long-term debt 402,317,086$
2 + Amortization of discount (premium) (2) 1,424,760 Less Unamortized discount (premium) (6) 27,341,4043 + Amortization of debt expense (3) 4,521,633 Less Unamortized debt expense (7) 86,415,644 Balance of long-term debt 9,945,678,327$
4 + Amortization of loss on reacquired debt (4) 2,103,882 Less Unamortized loss on reacquired debt (8) 25,350,625
5 + Amortization of gain on reacquired debt - Less Unamortized gain on reacquired debt -6 Cost of long-term debt 402,317,086$ Balance of long-term debt 9,945,678,327$ COST OF LONG-TERM DEBT 4.05%
7 CWIP Accruing AFUDC Debt (9) (434,085,000)
Balance of Long Term Debt8 Less CWIP 9,511,593,327$
Notes:
(1) WP 13, Page 1, Column (I).
(2) WP 13, Page 1, Column (J).
(3) WP 13, Page 1, Column (K).
(4) WP 13, Page 3, Line 14, Column (H)
(5) WP 13, Page 1, Column (E).
(6) WP 13, Page 1, Column (F).
(7) WP 13, Page 1, Column (G).
(8) WP 13, Page 3, Line 14, Column (G).
(9) WP 24, Line 8
Adjusted Cost of Long-term Debt Adjusted Long-term Debt Balance
(A) (C)
Docket No. 22-____ComEd Ex. 1.02
Page 105 of 176

WP 13
Page 3 of 4
Commonwealth Edison Company
Embedded Cost of Long-term Debt Work Papers
Year Ending December 31, 2021
Amortization Principal of
Line Debt, Issue Type Date Period Debt Call Net Gain or Balance as Annual
No. Coupon Rate1,2Reacquired End Date Reacquired Premium (Net Loss) 12/31/2021 Amortization
(A) (B) (C) (D) (E) (F) (G) (H)
1 Unamortized Loss on Reacquired Debt
2 First Mortgage Bonds
3 8.375% Series 86 09/16/02 02/01/33 3,425,000 1,305,852 (117,744)
4 5.875% Series 100 07/27/04 02/01/33 11,400,000 (185,592) (788,382) 306,840 (27,627)
5 5.875% Series 100 08/06/04 02/01/33 40,000,000 866,000 (4,283,438) 1,668,746 (150,246)
6 5.875% Series 100 08/25/04 02/01/33 45,000,000 2,611,350 (6,455,972) 2,519,742 (226,863)
7 Interest Rate Swap Settlement3 02/01/33 21,539,444 5,757,873 (519,507)
8
9
10 Subordinated Deferrable Interest Notes and Senior Notes
11 8.480% 03/20/03 03/15/33 206,190,000 - (20,228,911) 7,557,709 (674,297)
12 Subordinated Deferrable Interest Debentures
13 8.500% ComEd Financing II 03/07/08 01/15/38 154,640,000 - (11,579,481) 6,233,863 (387,598)
14 TOTAL (21,796,740)$ 25,350,625$ (2,103,882)$
Notes:
(1) Listing sourced from Form 21 ILCC, Pages 24a-24b.
(2) Refunded with the proceeds from issuance of long-term debt with the maturity dates on Page 2 of WPD-3.
(3) The unamortized losses and gains on interest rate swap settlements are reported in FERC accounts 182.3 (Other Regulatory Assets)
and 254 (Other Regulatory Liabilities), respectively.
Docket No. 22-____ComEd Ex. 1.02
Page 106 of 176

WP 13
Page 4 of 4Commonwealth Edison Company
Embedded Cost of Long-term Debt Work Papers
Year Ending December 31, 2021
Maturity Date(s)
Line Debt, Issue Type of New Debt
No. Coupon Rate1Issues
(A) (B) (C) (D) (E) (F)
REFUNDING ISSUES
1 First Mortgage Bonds
2 8.375% Series 86 Feb-2033 (2)
3 Subordinated Deferrable Interest Notes
4 8.480% Mar-2033
5 Subordinated Deferrable Interest Debentures
6 8.500% Jan-2038
7
8 The following debt items were not refinanced:
9 Original Maturity Date of Debt Issues
10 First Mortgage Bonds
11 5.875% Series 100 Feb-2033
Notes:
(1) Listing sourced from Form 21 ILCC, Pages 24c and 24d.
(2) The amortization period has changed due to the refunding of the long-term debt originally issued to refund this issue. Maturity date is that of the new long-term debt issue.
Docket No. 22-____ComEd Ex. 1.02
Page 107 of 176

WP 14Page 1 of 1
Commonwealth Edison CompanyJurisdictional Materials & Supplies Inventory Balance
and associated Accounts Payable as of December 31, 2021(In Thousands)
LineNo. Description Total Company
(A) (B)Calculation of Estimated Jurisdictional Accounts Payable Balance Related to Materials And Supplies Inventory
1 Year End Material and Supplies Inventory Balance - From 2021 FERC Form 1, page 2272 Transmission Plant (Estimated) 44,858$ 3 Distribution Plant (Estimated) 125,010
4 Total Account 154 169,868$
5 Distribution Plant Inventory as a Percent of Total Inventory 73.59%
6 Accounts Payable associated with materials and supplies at December 31 (1) (35,714)$
7 Jurisdictional Accounts Payable associated with materials and supplies8 at December 31 (Line 5 * Line 6) (26,283)$
Note:(1) Calculated by taking the O&M expense lead from CWC study, divided by 365, and multiplied by
the year end inventory balance. For 2021: (76.74/365) * $169,867 = $(35,714)
Docket No. 22-____ComEd Ex. 1.02
Page 108 of 176

WP 15
Page 1 of 1
Line
No. FERC Account Product 2021 Amount
(A) (B) (C)
1 [440000] Residental sales [249] Ill Distr Formula Rate True-up (33,097,000)$
2 [250] Customer Charge (385,979,034)
3 [251] Standard Metering Service (159,696,302)
4 [252] Distribution Fac Svc Chg (940,148,256)
5 [281] Retail Customer Assessments (19,943,287)
6 [309] Rider RCA - Supplemental (3,527,036)
7 [396] IL Elect Distribution Charge (34,319,650)
8 [440000] Residental sales Total (1,576,710,565)$
9 [442001] C&I sales-small [230] Primary Voltage DFC (6,991,041)$
10 [231] Primary Volt Trnsfrmer Charge (186,899)
11 [249] Ill Distr Formula Rate True-up (16,263,000)
12 [250] Customer Charge (61,311,049)
13 [251] Standard Metering Service (27,275,728)
14 [252] Distribution Fac Svc Chg (621,547,723)
15 [281] Retail Customer Assessments (20,836,872)
16 [309] Rider RCA - Supplemental (3,703,895)
17 [396] IL Elect Distribution Charge (35,981,133)
18 [442001] C&I sales-small Total (794,097,341)$
19 [442002] C&I sales-large [230] Primary Voltage DFC (94,924,123)$
20 [231] Primary Volt Trnsfrmer Charge (2,168,362)
21 [249] Ill Distr Formula Rate True-up (7,790,000)
22 [250] Customer Charge (12,299,911)
23 [251] Standard Metering Service (305,753)
24 [252] Distribution Fac Svc Chg (234,607,169)
25 [281] Retail Customer Assessments (434,343)
26 [309] Rider RCA - Supplemental (77,218)
27 [396] IL Elect Distribution Charge (31,972,194)
28 [442002] C&I sales-large Total (384,579,075)$
29 [444000] Public street/highway lighting [249] Ill Distr Formula Rate True-up (620,000)$
30 [250] Customer Charge 4,205
31 [251] Standard Metering Service (148,004)
32 [252] Distribution Fac Svc Chg (27,041,451)
33 [281] Retail Customer Assessments (214,309)
34 [309] Rider RCA - Supplemental (38,089)
35 [396] IL Elect Distribution Charge (606,796)
36 [444000] Public street/highway lighting Total (28,664,444)$
37 [446000] Sales-railroad/railway [249] Ill Distr Formula Rate True-up (98,000)$
38 [250] Customer Charge (11,656)
39 [251] Standard Metering Service 648
40 [252] Distribution Fac Svc Chg (3,405,641)
41 [281] Retail Customer Assessments (7,040)
42 [309] Rider RCA - Supplemental (1,252)
43 [396] IL Elect Distribution Charge (530,476)
44 [446000] Sales-railroad/railway Total (4,053,417)$
45 (2,788,104,841)$
46
47 Adjustment to remove revenue from additional lighting facilities (7,015,493)
48 Delivery Service Revenues recorded in 2021 (2,781,089,348)$
Note:
(1) The table above is an extract from ComEd's general ledger system and details distribution revenue
by product code and FERC account. This presentation is consistent with the ICC Form 21
Annual Report and represents delivery service revenues before any reductions for revenues
subject to refund.
Commonwealth Edison Company
2021 Annual Delivery Service Revenues (1)
Support for Revenue Allocator in Sch FR A-2
(In Dollars)
Docket No. 22-____ComEd Ex. 1.02
Page 109 of 176
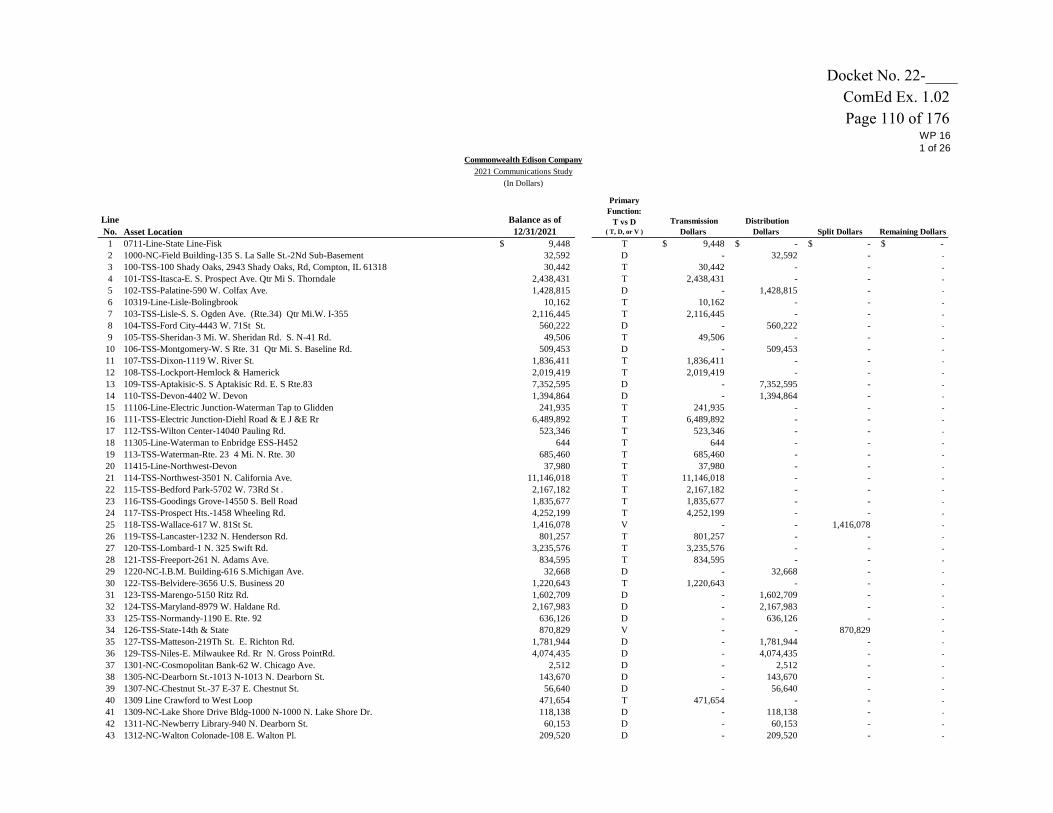
WP 161 of 26
Commonwealth Edison Company
2021 Communications Study
(In Dollars)
Line
No. Asset Location
Balance as of
12/31/2021
Primary
Function:
T vs D( T, D, or V )
Transmission
Dollars
Distribution
Dollars Split Dollars Remaining Dollars
1 0711-Line-State Line-Fisk 9,448$ T 9,448$ -$ -$ -$
2 1000-NC-Field Building-135 S. La Salle St.-2Nd Sub-Basement 32,592 D - 32,592 - -
3 100-TSS-100 Shady Oaks, 2943 Shady Oaks, Rd, Compton, IL 61318 30,442 T 30,442 - - -
4 101-TSS-Itasca-E. S. Prospect Ave. Qtr Mi S. Thorndale 2,438,431 T 2,438,431 - - -
5 102-TSS-Palatine-590 W. Colfax Ave. 1,428,815 D - 1,428,815 - -
6 10319-Line-Lisle-Bolingbrook 10,162 T 10,162 - - -
7 103-TSS-Lisle-S. S. Ogden Ave. (Rte.34) Qtr Mi.W. I-355 2,116,445 T 2,116,445 - - -
8 104-TSS-Ford City-4443 W. 71St St. 560,222 D - 560,222 - -
9 105-TSS-Sheridan-3 Mi. W. Sheridan Rd. S. N-41 Rd. 49,506 T 49,506 - - -
10 106-TSS-Montgomery-W. S Rte. 31 Qtr Mi. S. Baseline Rd. 509,453 D - 509,453 - -
11 107-TSS-Dixon-1119 W. River St. 1,836,411 T 1,836,411 - - -
12 108-TSS-Lockport-Hemlock & Hamerick 2,019,419 T 2,019,419 - - -
13 109-TSS-Aptakisic-S. S Aptakisic Rd. E. S Rte.83 7,352,595 D - 7,352,595 - -
14 110-TSS-Devon-4402 W. Devon 1,394,864 D - 1,394,864 - -
15 11106-Line-Electric Junction-Waterman Tap to Glidden 241,935 T 241,935 - - -
16 111-TSS-Electric Junction-Diehl Road & E J &E Rr 6,489,892 T 6,489,892 - - -
17 112-TSS-Wilton Center-14040 Pauling Rd. 523,346 T 523,346 - - -
18 11305-Line-Waterman to Enbridge ESS-H452 644 T 644 - - -
19 113-TSS-Waterman-Rte. 23 4 Mi. N. Rte. 30 685,460 T 685,460 - - -
20 11415-Line-Northwest-Devon 37,980 T 37,980 - - -
21 114-TSS-Northwest-3501 N. California Ave. 11,146,018 T 11,146,018 - - -
22 115-TSS-Bedford Park-5702 W. 73Rd St . 2,167,182 T 2,167,182 - - -
23 116-TSS-Goodings Grove-14550 S. Bell Road 1,835,677 T 1,835,677 - - -
24 117-TSS-Prospect Hts.-1458 Wheeling Rd. 4,252,199 T 4,252,199 - - -
25 118-TSS-Wallace-617 W. 81St St. 1,416,078 V - - 1,416,078 -
26 119-TSS-Lancaster-1232 N. Henderson Rd. 801,257 T 801,257 - - -
27 120-TSS-Lombard-1 N. 325 Swift Rd. 3,235,576 T 3,235,576 - - -
28 121-TSS-Freeport-261 N. Adams Ave. 834,595 T 834,595 - - -
29 1220-NC-I.B.M. Building-616 S.Michigan Ave. 32,668 D - 32,668 - -
30 122-TSS-Belvidere-3656 U.S. Business 20 1,220,643 T 1,220,643 - - -
31 123-TSS-Marengo-5150 Ritz Rd. 1,602,709 D - 1,602,709 - -
32 124-TSS-Maryland-8979 W. Haldane Rd. 2,167,983 D - 2,167,983 - -
33 125-TSS-Normandy-1190 E. Rte. 92 636,126 D - 636,126 - -
34 126-TSS-State-14th & State 870,829 V - - 870,829 -
35 127-TSS-Matteson-219Th St. E. Richton Rd. 1,781,944 D - 1,781,944 - -
36 129-TSS-Niles-E. Milwaukee Rd. Rr N. Gross PointRd. 4,074,435 D - 4,074,435 - -
37 1301-NC-Cosmopolitan Bank-62 W. Chicago Ave. 2,512 D - 2,512 - -
38 1305-NC-Dearborn St.-1013 N-1013 N. Dearborn St. 143,670 D - 143,670 - -
39 1307-NC-Chestnut St.-37 E-37 E. Chestnut St. 56,640 D - 56,640 - -
40 1309 Line Crawford to West Loop 471,654 T 471,654 - - -
41 1309-NC-Lake Shore Drive Bldg-1000 N-1000 N. Lake Shore Dr. 118,138 D - 118,138 - -
42 1311-NC-Newberry Library-940 N. Dearborn St. 60,153 D - 60,153 - -
43 1312-NC-Walton Colonade-108 E. Walton Pl. 209,520 D - 209,520 - -
Docket No. 22-____ComEd Ex. 1.02
Page 110 of 176

WP 162 of 26
Commonwealth Edison Company
2021 Communications Study
(In Dollars)
Line
No. Asset Location
Balance as of
12/31/2021
Primary
Function:
T vs D( T, D, or V )
Transmission
Dollars
Distribution
Dollars Split Dollars Remaining Dollars
44 1314-NC-Newberry House-1030 N. State St. 208,010 D - 208,010 - -
45 1317-NC-Oak St.-60 E-60 E. Oak St. 101,257 D - 101,257 - -
46 1319-NC-Walton Pl.-23 E-23 E. Walton Pl. 60,153 D - 60,153 - -
47 131-TSS-West Chicago-Qtr Mi. S. Hawthorne 1Bk E. Mcqueen 706,413 D - 706,413 - -
48 132-TSS-Garden Plain-14448 Frog Pond Rd. 919,716 D - 919,716 - -
49 1333-NC-Oak St.-15 E-15 E. Oak St. 101,257 D - 101,257 - -
50 1334-NC-Bellevue Pl.-4 E-4 E. Bellevue Pl. 183,463 D - 183,463 - -
51 133-TSS-Rock Falls-1703 Mc Niel Rd. 827,068 T 827,068 - - -
52 134-TSS-Lagrange Park-E. S Barnsdale Ave. Qtr Mi. N. 31St St. 1,514,422 D - 1,514,422 - -
53 1357-NC-Oak St.-4 E-4 E. Oak St. 265,670 D - 265,670 - -
54 135-TSS-Elmhurst-1Mi. S. Grand Ave. W. County LineRd. 1,347,809 T 1,347,809 - - -
55 1361-NC-Oak St.-45 W-45 W. Oak St. 101,257 D - 101,257 - -
56 1362-NC-Maple St.-35 W-35 W. Maple St. 159,423 D - 159,423 - -
57 136-TSS-Burr Ridge-Qtr Mi. E. Madison St.. On 71St St. 3,219,631 D - 3,219,631 - -
58 1375-NC-Walton Pl.-125 E-125 E. Walton Pl. 120,000 D - 120,000 - -
59 137-TSS-Washington Park-6220 S. Praire Ave. 1,927,403 T 1,927,403 - - -
60 138-TSS-Silver Lake-Valley View Rd. & North Park Dr. 3,296,174 T 3,296,174 - - -
61 1392-NC-Walton Pl.-44 E-44 E. Walton Pl. 183,463 D - 183,463 - -
62 139-TSS-Mendota-4334 E. 4Th St. 657,184 D - 657,184 - -
63 140-TSS-Frankfort-330 Rte. 45 700,935 D - 700,935 - -
64 141-TSS-Pleasant Valley-Rte 176 & Rte 47-Dorr Twp-Mchenry Co 859,628 T 859,628 - - -
65 142-TSS-Crete-Half Mi. W. Rte. 394 Qtr Mi. S. Faithhorn Rd. 36,369 T 36,369 - - -
66 143-TSS-Wolfs Crossing-N. Wolfs Crossing E. Car Rd. 1,006,379 T 1,006,379 - - -
67 144-TSS-Wayne-N. S Stearns Rd. 1 Mi. W. Rt 59 2,741,494 T 2,741,494 - - -
68 145-TSS-York Center-S. S Butterfield Rd. Qtr Mi. W. Meyer Rd. 2,756,908 D - 2,756,908 - -
69 146-TSS-Sandwich-Somonauk Rd. 2 Mi. Nw Sandwich 930,436 D - 930,436 - -
70 14818-Line-West-Loop-Substation-to-Diversey-Substation 216,509 T 216,509 - - -
71 148-TSS-GooseIsland-WestLoop 5,179,147 T 5,179,147 - - -
72 149-TSS-Wilmington-23600 Coal City Rd. 270,952 D - 270,952 - -
73 15003-Line-Calumet-Roseland 1,802,270 D - 1,802,270 - -
74 150-TSS-Barrington Hills-Spring Creek Rd & Ce Co Row 5,673 D - 5,673 - -
75 150-TSS-Calumet-3200 E. 100Th St 2,744,989 T 2,744,989 - - -
76 151-TSS-Woodstock-Drury Lane Rd. E. Dean St. & Rte.14 2,203,723 V - - 2,203,723 -
77 152-TSS-Busse-1650 Dempster St. 1,985,675 D - 1,985,675 - -
78 153-TSS-Taylor-309 W. Taylor 2,673,589 T 2,673,589 - - -
79 154-TSS-Libertyville-S. S Casey Rd. W. Rte.21 Milwaukee 2,506,359 T 2,506,359 - - -
80 155-TSS-Nelson-120 W.S. Rte. 30 1,831,063 T 1,831,063 - - -
81 156-TSS-Cherry Valley 138 Kv-4502 S.Perryville Rd. 1,027,759 T 1,027,759 - - -
82 156-TSS-Cherry Valley 345 Kv-4502 S.Perryville Rd. 962,637 T 962,637 - - -
83 157-TSS-Kankakee-W/Ic Rr S. Kennington Ave. Half Mi. S Rte. 115 9,133 D - 9,133 - -
84 158-TSS-Streator North-Grant St. & Vermillion River 98,650 D - 98,650 - -
85 159-TSS-Northbrook-1440 Skokie Blvd. 4,405,168 T 4,405,168 - - -
86 160-TSS-Alpine-988 Easton Pkwy. (Off Private Drive) 1,814,392 D - 1,814,392 - -
Docket No. 22-____ComEd Ex. 1.02
Page 111 of 176

WP 163 of 26
Commonwealth Edison Company
2021 Communications Study
(In Dollars)
Line
No. Asset Location
Balance as of
12/31/2021
Primary
Function:
T vs D( T, D, or V )
Transmission
Dollars
Distribution
Dollars Split Dollars Remaining Dollars
87 162-TSS-Pierpont-1037 Pierpont Ave. 980,210 D - 980,210 - -
88 163-TSS-Roscoe Bert-3708 Huffman Blvd. 650,594 D - 650,594 - -
89 164-TSS-Sand Park-5900 Material Ave. 412,462 D - 412,462 - -
90 165-TSS-Fordham-501 South First St. 1,448,651 D - 1,448,651 - -
91 166-TSS-Leighton-Qtr Mi. W. Butterfield Rd. Qtr Mi.N. Rte. 60 3,692,154 D - 3,692,154 - -
92 167-TSS-Plano-S. S Corneils Rd. 3Qtr Mi. W. Rte.47 2,597,367 T 2,597,367 - - -
93 169-TSS-1649 Steward Rd-Alto Township McGirr Rd Lee County 9,017 T 9,017 - - -
94 170-TSS-Harbor-9367 S. Harbor Ave. 257,107 T 257,107 - - -
95 171-TSS-Wempletown-7625 Trask Bridge Rd. 1,023,874 T 1,023,874 - - -
96 172-TSS-Golf Mill-Golf Rd. Qtr Mi. W. Washington St. 4,408,666 T 4,408,666 - - -
97 174-TSS-University-740 E. 50Th St. 894,045 T 894,045 - - -
98 176-TSS-Stillman Valley-6623 East Hales Corner Rd. 588,807 D - 588,807 - -
99 17723-Line-ILL-IND State Line-Taylor-Burnham-Garfield 495,300 T 495,300 - - -
100 17724-Line-Burnham-Calumet-RP5 Garfield 21,682 T 21,682 - - -
101 177-TSS-Burnham-W. Burnham Ave. N. B&O Rr 2,602,344 T 2,602,344 - - -
102 178 TSS Blue Mound Substation 24540 East 1300 North Rd. Ellsworth IL 61737 767,492 T 767,492 - - -
103 1803-Line-Will County Sta-Lisle 55,685 T 55,685 - - -
104 1809-Line-Will County Sta-Lisle 57,979 T 57,979 - - -
105 180-TSS-Lena-4190 Illinois Rte. 73 826,306 D - 826,306 - -
106 182-TSS-Minonk-2300 N. W. 139 691,028 D - 691,028 - -
107 184-TSS-1500 Midway Court (1,118) T (1,118) - - -
108 185-TSS-Tollway-West of Beverly Rd North of I-90 2,200,482 T 2,200,482 - - -
109 186-TSS-Steward-Alto Twp-Lee County Ill. 820,602 T 820,602 - - -
110 187-TSS-Schauff Road 235,491 T 235,491 - - -
111 188-TSS-Mt. Pulaski 161,690 T 161,690 - - -
112 192-TSS-Ridgeland-4300 S. Ridgeland Ave. 1,628,238 T 1,628,238 - - -
113 193-TSS-Mchenry-Lillian St. Qtr Mi. W. Rte. 31 1,198,283 D - 1,198,283 - -
114 194-TSS-Sabrooke-123 Energy Avenue 2,485,482 T 2,485,482 - - -
115 196A-TSS-Blackstone-30th Road 158,756 T 158,756 - - -
116 197-TSS-Grenshaw 472,765 T 472,765 - - -
117 198-TSS-Des Plaines-1705 Pratt Ave. 1,431,503 D - 1,431,503 - -
118 204-TDC-Old Elm-Old Mill Rd. & Skokie Hwy. 1,457,015 D - 1,457,015 - -
119 205-TDC-Wheeling-Mc Henry Rd. Qtr Mi. N. Dundee Rd. 1,508,482 D - 1,508,482 - -
120 206-TDC-Rolling Meadows-1901 Golf Rd. 1,571,002 D - 1,571,002 - -
121 207-TDC-Tonne-Tonne Rd. & North Parkway 3,262,086 D - 3,262,086 - -
122 212-TDC-Northbrook-1200 Skokie Blvd. 1,648,959 D - 1,648,959 - -
123 213-TDC-Deerfield-S. S County Line Rd. W. Waukegan Rd. 2,508,011 D - 2,508,011 - -
124 214-TDC-Hoffman Estates-2480 Pembroke 2,598,979 D - 2,598,979 - -
125 215-TDC-Howard 995,566 D - 995,566 - -
126 216-TDC-Mount Prospect-1780 E. Kensington Rd. 744,914 D - 744,914 - -
127 217-TDC-Prospect Hts-50 E. Palatine Rd. 834,095 D - 834,095 - -
128 220-TDC-South Schaumburg-Roselle & Schaumburg Rd. 852,728 D - 852,728 - -
129 221-TDC-North Huntley-North Huntley 273,807 D - 273,807 - -
Docket No. 22-____ComEd Ex. 1.02
Page 112 of 176
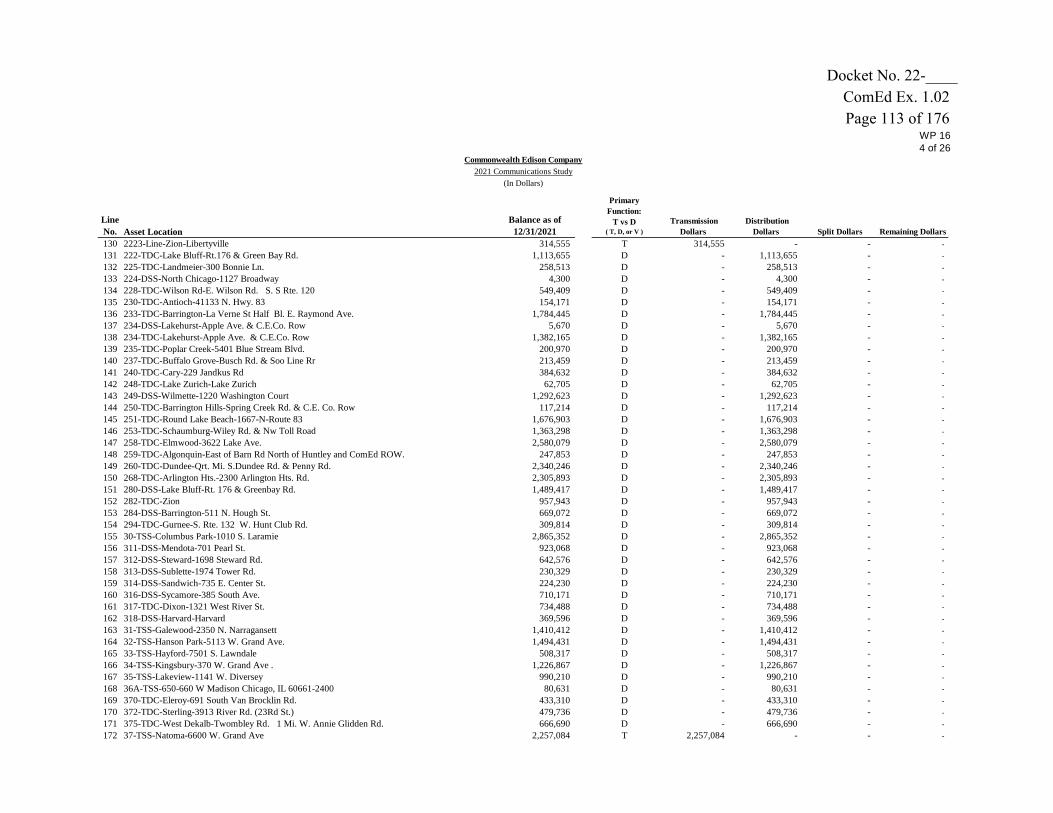
WP 164 of 26
Commonwealth Edison Company
2021 Communications Study
(In Dollars)
Line
No. Asset Location
Balance as of
12/31/2021
Primary
Function:
T vs D( T, D, or V )
Transmission
Dollars
Distribution
Dollars Split Dollars Remaining Dollars
130 2223-Line-Zion-Libertyville 314,555 T 314,555 - - -
131 222-TDC-Lake Bluff-Rt.176 & Green Bay Rd. 1,113,655 D - 1,113,655 - -
132 225-TDC-Landmeier-300 Bonnie Ln. 258,513 D - 258,513 - -
133 224-DSS-North Chicago-1127 Broadway 4,300 D - 4,300 - -
134 228-TDC-Wilson Rd-E. Wilson Rd. S. S Rte. 120 549,409 D - 549,409 - -
135 230-TDC-Antioch-41133 N. Hwy. 83 154,171 D - 154,171 - -
136 233-TDC-Barrington-La Verne St Half Bl. E. Raymond Ave. 1,784,445 D - 1,784,445 - -
137 234-DSS-Lakehurst-Apple Ave. & C.E.Co. Row 5,670 D - 5,670 - -
138 234-TDC-Lakehurst-Apple Ave. & C.E.Co. Row 1,382,165 D - 1,382,165 - -
139 235-TDC-Poplar Creek-5401 Blue Stream Blvd. 200,970 D - 200,970 - -
140 237-TDC-Buffalo Grove-Busch Rd. & Soo Line Rr 213,459 D - 213,459 - -
141 240-TDC-Cary-229 Jandkus Rd 384,632 D - 384,632 - -
142 248-TDC-Lake Zurich-Lake Zurich 62,705 D - 62,705 - -
143 249-DSS-Wilmette-1220 Washington Court 1,292,623 D - 1,292,623 - -
144 250-TDC-Barrington Hills-Spring Creek Rd. & C.E. Co. Row 117,214 D - 117,214 - -
145 251-TDC-Round Lake Beach-1667-N-Route 83 1,676,903 D - 1,676,903 - -
146 253-TDC-Schaumburg-Wiley Rd. & Nw Toll Road 1,363,298 D - 1,363,298 - -
147 258-TDC-Elmwood-3622 Lake Ave. 2,580,079 D - 2,580,079 - -
148 259-TDC-Algonquin-East of Barn Rd North of Huntley and ComEd ROW. 247,853 D - 247,853 - -
149 260-TDC-Dundee-Qrt. Mi. S.Dundee Rd. & Penny Rd. 2,340,246 D - 2,340,246 - -
150 268-TDC-Arlington Hts.-2300 Arlington Hts. Rd. 2,305,893 D - 2,305,893 - -
151 280-DSS-Lake Bluff-Rt. 176 & Greenbay Rd. 1,489,417 D - 1,489,417 - -
152 282-TDC-Zion 957,943 D - 957,943 - -
153 284-DSS-Barrington-511 N. Hough St. 669,072 D - 669,072 - -
154 294-TDC-Gurnee-S. Rte. 132 W. Hunt Club Rd. 309,814 D - 309,814 - -
155 30-TSS-Columbus Park-1010 S. Laramie 2,865,352 D - 2,865,352 - -
156 311-DSS-Mendota-701 Pearl St. 923,068 D - 923,068 - -
157 312-DSS-Steward-1698 Steward Rd. 642,576 D - 642,576 - -
158 313-DSS-Sublette-1974 Tower Rd. 230,329 D - 230,329 - -
159 314-DSS-Sandwich-735 E. Center St. 224,230 D - 224,230 - -
160 316-DSS-Sycamore-385 South Ave. 710,171 D - 710,171 - -
161 317-TDC-Dixon-1321 West River St. 734,488 D - 734,488 - -
162 318-DSS-Harvard-Harvard 369,596 D - 369,596 - -
163 31-TSS-Galewood-2350 N. Narragansett 1,410,412 D - 1,410,412 - -
164 32-TSS-Hanson Park-5113 W. Grand Ave. 1,494,431 D - 1,494,431 - -
165 33-TSS-Hayford-7501 S. Lawndale 508,317 D - 508,317 - -
166 34-TSS-Kingsbury-370 W. Grand Ave . 1,226,867 D - 1,226,867 - -
167 35-TSS-Lakeview-1141 W. Diversey 990,210 D - 990,210 - -
168 36A-TSS-650-660 W Madison Chicago, IL 60661-2400 80,631 D - 80,631 - -
169 370-TDC-Eleroy-691 South Van Brocklin Rd. 433,310 D - 433,310 - -
170 372-TDC-Sterling-3913 River Rd. (23Rd St.) 479,736 D - 479,736 - -
171 375-TDC-West Dekalb-Twombley Rd. 1 Mi. W. Annie Glidden Rd. 666,690 D - 666,690 - -
172 37-TSS-Natoma-6600 W. Grand Ave 2,257,084 T 2,257,084 - - -
Docket No. 22-____ComEd Ex. 1.02
Page 113 of 176

WP 165 of 26
Commonwealth Edison Company
2021 Communications Study
(In Dollars)
Line
No. Asset Location
Balance as of
12/31/2021
Primary
Function:
T vs D( T, D, or V )
Transmission
Dollars
Distribution
Dollars Split Dollars Remaining Dollars
173 380-TDC-Charles-2780 Charles St. 2,337,173 D - 2,337,173 - -
174 384-TDC-Harrison-3183 Forest View Rd. 384,439 D - 384,439 - -
175 385-TDC-Fifteenth Street-2235 15Th St. 531,943 D - 531,943 - -
176 386-TDC-Pecatonica-6003 N.Pecatonica Rd. 46,986 D - 46,986 - -
177 387-TDC-Blackhawk-2413 Blackhawk Rd. (New Milford) 1,094,602 D - 1,094,602 - -
178 388-TDC-Harlem-9530 N. Second St. (Machessney Park) 1,301,818 D - 1,301,818 - -
179 389-TDC-East Rockford-2093 Bell School Rd. 1,300,275 D - 1,300,275 - -
180 38-TSS-Humbolt Park-2413 W. Thomas St. 3,237,629 D - 3,237,629 - -
181 390-TDC-South Pecatonica-East side Conger Rd. 1/2 mile North Rt. 20-Pecatonica Twp.-Winnebago County 43,278 D - 43,278 - -
182 391-TDC-Argyle (Belvidere & IL 173) 145,633 D - 145,633 - -
183 39-TSS-Portage-4540 W.Waveland Ave. 1,721,809 D - 1,721,809 - -
184 406-TDC-New Lenox-E Schoolhouse Rd N EJ&E RR. 403,810 D - 403,810 - -
185 409-TDC-20141 Patterson-Joliet 594,802 D - 594,802 - -
186 40-TSS-Diversey-2739 N. Clybourn 1,746,225 T 1,746,225 - - -
187 40-TSS-Quarry-2501 S. Senour St 6,508 T 6,508 - - -
188 411-TDC-Romeoville-511 Romeo Rd. 1,554,296 D - 1,554,296 - -
189 414-TDC-Roberts Road-103Rd St . Qtr Mi. W. Harlem Ave. 1,953,913 D - 1,953,913 - -
190 416-TDC-Bell Road-13015 W.143Rd St. 994,310 D - 994,310 - -
191 419-TDC-Tinley Park-82Nd Ave. & 159Th St. 2,716,185 D - 2,716,185 - -
192 41-TSS-Roseland-10847 S. Michigan Ave. 962,281 D - 962,281 - -
193 422-DSS-Morris-516 W. Jefferson 426,604 D - 426,604 - -
194 42-TSS-Round Lake-S/Rte. 134 E/Fairfield Rd. 3,912,017 D - 3,912,017 - -
195 431-TDC-Shorewood 802,277 D - 802,277 - -
196 433-TDC-Morris-2555 E.US Route 6 209,064 D - 209,064 - -
197 435-TDC-Country Club Hills-S. S 183Rd St. Qtr Mi. W. Cicero 1,674,419 D - 1,674,419 - -
198 436-TDC-Hillcrest-2001 W. Theodore St. 1,743,682 D - 1,743,682 - -
199 439-TDC-Rockdale-1951 W. Moen Ave. 421,636 D - 421,636 - -
200 43-TSS-Wildwood-49 E. 127Th St . 1,575,131 D - 1,575,131 - -
201 43-TSS-Wildwood-49 E. 127Th St. 340,843 D - 340,843 - -
202 440-TDC-Palos Twp-78Th Ave. S. 127Th St. 966,389 D - 966,389 - -
203 443-TDC-Harvey-161St & Lathrop 327,669 D - 327,669 - -
204 444-TDC-Minooka-26759 W. EAMES ST. 603,650 D - 603,650 - -
205 446-TDC-Lansing-Thornton-Lansing Rd. Half Mi W. Torrence 571,545 D - 571,545 - -
206 447-TDC-Sandridge-16900 Exchange St. 186,428 D - 186,428 - -
207 450-DSS-Joliet-1021 E. Washington St. 623,471 D - 623,471 - -
208 451-TDC-Mokena-191St. & Lagrange Rd. 347,524 D - 347,524 - -
209 4522-Line-Jefferson-Fisk 140,793 T 140,793 - - -
210 452-TDC-Glenwood-195Th St. Half Mi. Eglenwood-Chicago Hts. Rd. 768,680 D - 768,680 - -
211 453-TDC-Woodhill-Rte. 50 Half Mi. S. Cicero Ave. 492,648 D - 492,648 - -
212 454-TDC-Plainfield-602 W. 143Rd St. (Half Mi. W. Rte.59) 1,013,514 D - 1,013,514 - -
213 456-TDC-Joliet Central-99 E.Jackson St. 304,164 D - 304,164 - -
214 457-TDC-Park Forest-Dogwood St. E. Western Ave. 708,291 D - 708,291 - -
215 458-TDC-Green Lake-159Th St. Half Mi. E. Torrence Ave 659,186 D - 659,186 - -
Docket No. 22-____ComEd Ex. 1.02
Page 114 of 176

WP 166 of 26
Commonwealth Edison Company
2021 Communications Study
(In Dollars)
Line
No. Asset Location
Balance as of
12/31/2021
Primary
Function:
T vs D( T, D, or V )
Transmission
Dollars
Distribution
Dollars Split Dollars Remaining Dollars
216 459-DSS-Vollmer Road-Vollmer Rd. 1 Mi. E Kedzie 399,033 D - 399,033 - -
217 45-TSS-Jefferson St-828 S. Jefferson St. 7,308,787 T 7,308,787 - - -
218 460-DSS-Harvey-15739 West Ave. 1,788,295 D - 1,788,295 - -
219 461-TDC-Crestwood-N. Midlothian Turnpike Qtr Mi. E.Cicero 2,511,585 D - 2,511,585 - -
220 462-DSS-Dwight-108 W. South St. 1,591,620 D - 1,591,620 - -
221 465-TDC-South Holland-Waterman Ave. S. Sibley Blvd. 280,920 D - 280,920 - -
222 469-TDC-Evergreen Park-S. 91St St. & Homan Ave. 2,481,792 D - 2,481,792 - -
223 46-TSS-Des Plaines-1101 Seegar Rd. 3,402,918 T 3,402,918 - - -
224 46-TSS-Des Plaines-1101 Seeger Rd. 24,115 T 24,115 - - -
225 470-TDC-Orland-East Rte 45 1/4 mile N Southwest Hwy ComEd ROW 651,477 D - 651,477 - -
226 471-DSS-Pontiac-Aurora Ave. & I C G Rr 396,865 D - 396,865 - -
227 474-TDC-Briggs-1921 S Briggs St. 523,910 D - 523,910 - -
228 475-DSS-Kankakee-147 W. Water St. 408,481 D - 408,481 - -
229 47-TSS-Evanston-1712 Emerson St.. 914,513 D - 914,513 - -
230 480-TDC-Veterans- South-of-167TH-ST.-West-of-I-355 SOUTH 375,408 D - 375,408 - -
231 487-TDC-Archer-Archer Ave. & State St. 2,166,735 D - 2,166,735 - -
232 48-TSS-Highland Park-Park Ave. & Rte. 41 1,507,099 V - - 1,507,099 -
233 492-DSS-Lemont-Main St. 1 Block S Lockport St. 57,656 D - 57,656 - -
234 49-TSS-Plymouth Court-521 S. Plymouth Ct. 1,444,020 D - 1,444,020 - -
235 5003-Line-Rockwell-Humboldt Park 265,063 T 265,063 - - -
236 501-DSS-Elmhurst-E Cherry N Vallette St. 1,368,977 D - 1,368,977 - -
237 505-TDC-Oak Park-E. S North Blvd. E. Euclid Ave. 2,771,120 D - 2,771,120 - -
238 50-TSS-Rockwell-560 N. Rockwell St. 772,647 T 772,647 - - -
239 510-TDC-West Rutland, 18N 177th Sandwald Rd 547,352 D - 547,352 - -
240 513-DSS-Aurora-60 Stone Ave. 123,378 D - 123,378 - -
241 514-DSS-Glen Ellyn-260 Pennsylvania Ave. 996,560 D - 996,560 - -
242 517-TDC-Burbank-Burbank 154,395 D - 154,395 - -
243 519-DSS-East Side-427 East Side Rd 48,746 D - 48,746 - -
244 51-TSS-Mc Cook-Se Corner Joliet Rd. & Lawndale Ave. 3,133,231 T 3,133,231 - - -
245 521-TDC-ComEd R.O.W. and Cannonball Trail 1,327,681 D - 1,327,681 - -
246 525-TDC-Normantown 782,932 T 782,932 - - -
247 527-TDC-Plano West 840,475 D - 840,475 - -
248 52-TSS-Hawthorne-4928 W. 28Th St. 1,041,116 D - 1,041,116 - -
249 530-DSS-La Grange-225 Tilden Ave 1,250,503 D - 1,250,503 - -
250 531-TDC-Bridgeview-Sw Corner 83Rd St. & Beloit 964,411 D - 964,411 - -
251 539-TDC-Warrenville-Weisbrook Rd. & Leabrook 389,999 D - 389,999 - -
252 549-TDC-Berkeley-Rear Of 5744 Mc Dermott Dr. 1,136,490 D - 1,136,490 - -
253 54-TSS-Clybourn-1135 W. Wisconsin St. 1,331,030 D - 1,331,030 - -
254 550-TDC-Clearing-66Th Pl. & Melvina 1,832,116 D - 1,832,116 - -
255 552-TDC-Addison-W. S Westgate Ave. S. Factory Rd.On Row 904,491 D - 904,491 - -
256 553-DSS-Hinsdale-Park Ave & N C B & Q Rr 584,064 D - 584,064 - -
257 555-TDC-Glen Ellyn-N. S Roosevelt Rd. W. S I-355 AtRow 888,665 D - 888,665 - -
258 556-TDC-Berwyn-6429 Stanley Ave. 1,714,165 D - 1,714,165 - -
Docket No. 22-____ComEd Ex. 1.02
Page 115 of 176

WP 167 of 26
Commonwealth Edison Company
2021 Communications Study
(In Dollars)
Line
No. Asset Location
Balance as of
12/31/2021
Primary
Function:
T vs D( T, D, or V )
Transmission
Dollars
Distribution
Dollars Split Dollars Remaining Dollars
259 557-TDC-Butterfield-E. Rte. 53 N. Butterfield Rd. On Row 1,173,013 D - 1,173,013 - -
260 558-DSS-Westmont-Cass & Melrose Avs. 1,141,055 D - 1,141,055 - -
261 559-TDC-Woodridge-E/ Rte 53 S/ 71St On Row 2,272,603 D - 2,272,603 - -
262 55-TSS-Hegewich-128Th St. & Carondolet Ave. 664,419 D - 664,419 - -
263 5601-NC-O'Hare Airport-O'Hare Airport-Building 2A Vault4A 92,684 D - 92,684 - -
264 5602-NC-O'Hare Airport-O'Hare Airport-Building 2B Vault4B 192,581 D - 192,581 - -
265 5603-NC-O'Hare Airport-O'Hare Airport-Building 5 Vault 5 114,806 D - 114,806 - -
266 5604-NC-O'Hare Airport-O'Hare Airport-Building 3B Vault8B 168,282 D - 168,282 - -
267 5605-NC-O'Hare Airport-O'Hare Airport-Terminal #3 171,383 D - 171,383 - -
268 5606-NC-O'Hare Airport-O'Hare Airport Amer. Airlines Term. 12,194 D - 12,194 - -
269 5606-NC-O'Hare Airport-O'Hare Airport-Terminal #3 164,089 D - 164,089 - -
270 5607-NC-O'Hare Airport-O'Hare Airport Amer. Airlines Term. 157,122 D - 157,122 - -
271 5608-NC-O'Hare Airport-O'Hare Airport Amer. Airlines Term. 69,648 D - 69,648 - -
272 5609-NC-O'Hare Airport-O'Hare Airport-Delta-Ozark-NorthCentral Air 69,648 D - 69,648 - -
273 560-TDC-Grace-W. S Grace St. S. Factory Rd. 1,421,127 D - 1,421,127 - -
274 5610-NC-O'Hare Airport-O'Hare Airport-Parking Garage 149,606 D - 149,606 - -
275 5611-NC-O'Hare Airport-O'Hare Airport-Parking Garage 131,275 D - 131,275 - -
276 5612-NC-O'Hare Airport-O'Hare Airport-Delta Term. Building 154,032 D - 154,032 - -
277 5614-NC-O'Hare Airport-O'Hare Airport-American AirlinesTerm. 198,389 D - 198,389 - -
278 5615-NC-O'Hare Airport-O'Hare Airport-American AirlinesTerm. 176,331 D - 176,331 - -
279 5616-NC-O'Hare Airport-O'Hare Airport-United Terminal #1 83,274 D - 83,274 - -
280 5617-NC-O'Hare Airport-O'Hare Airport-United Terminal #1 138,887 D - 138,887 - -
281 5618-NC-O'Hare Airport-O'Hare Airport-United Terminal #1 136,385 D - 136,385 - -
282 5619-NC-O'Hare Airport-O'Hare Airport-United Terminal #1 72,052 D - 72,052 - -
283 561-TDC-Bolingbrook-701 Boughton Rd. 2,042,484 D - 2,042,484 - -
284 5620-NC-O'Hare Airport-O'Hare Airport-United Terminal #1 224,570 D - 224,570 - -
285 5621-NC-O'Hare Airport-O'Hare Airport-United Terminal #1 73,119 D - 73,119 - -
286 5622-NC-O'Hare Airport-O'Hare Airport-United Terminal #1 91,391 D - 91,391 - -
287 5623-NC-O'Hare Airport-O'Hare Airport-United Terminal #1 87,772 D - 87,772 - -
288 5624-NC-O'Hare Airport-O'Hare Airport-United Terminal #1 71,302 D - 71,302 - -
289 5625-NC-O'Hare Airport-O'Hare Airport-United Terminal #1 91,255 D - 91,255 - -
290 5626-NC-O'Hare Airport-O'Hare Airport-United Terminal #1 48,871 D - 48,871 - -
291 5627-NC-O'Hare Airport-O'Hare Airport-United Terminal #1 68,239 D - 68,239 - -
292 5628-NC-O'Hare Airport-O'Hare Airport-United Terminal #1 83,409 D - 83,409 - -
293 5629-NC-O'Hare Airport-O'Hare Airport-United Terminal #1 53,247 D - 53,247 - -
294 562-TDC-Glendale Hts.-E. Bloomingdale Rd. N. I.C.Rr 2,980,959 D - 2,980,959 - -
295 5630-NC-O'Hare Airport-O'Hare Airport-United Terminal #1 148,939 D - 148,939 - -
296 5631-NC-O'Hare Airport-O'Hare Airport-United Terminal #1 58,697 D - 58,697 - -
297 5632-NC-O'Hare Airport-O'Hare Airport-New Internatl Terminal 66,041 D - 66,041 - -
298 5633-NC-O'Hare Airport-O'Hare Airport-New Internatl Terminal 52,893 D - 52,893 - -
299 5634-NC-O'Hare Airport-O'Hare Airport-New Internatl Terminal 48,693 D - 48,693 - -
300 5635-NC-O'Hare Airport-O'Hare Airport-New Internatl Terminal 46,741 D - 46,741 - -
301 5638-NC-O'Hare Airport-O'Hare Airport-Concourse G 14,211 D - 14,211 - -
Docket No. 22-____ComEd Ex. 1.02
Page 116 of 176

WP 168 of 26
Commonwealth Edison Company
2021 Communications Study
(In Dollars)
Line
No. Asset Location
Balance as of
12/31/2021
Primary
Function:
T vs D( T, D, or V )
Transmission
Dollars
Distribution
Dollars Split Dollars Remaining Dollars
302 5639-NC-O'hare Airport-Terminal 2-Concourse E/F 54,215 D - 54,215 - -
303 563-TDC-Hanover Twp.-E. S Lovell Rd. N. Rte. 20 On Row 2,295,060 D - 2,295,060 - -
304 565-TDC-Nordic-Lake St. & Rte.53 On Row 1,255,662 D - 1,255,662 - -
305 566-TDC-Oakbrook-N. 22Nd St. N. End Of Enterprise Dr. 1,868,858 D - 1,868,858 - -
306 568-TDC-Church Road-Half Mi. N. Lake St. W. S Chruch Rd. 1,431,020 D - 1,431,020 - -
307 569-TDC-Suger Grove-Bliss Rd. 2Mi. N. Us 30 521,623 D - 521,623 - -
308 56-TSS-North Aurora-N. S Indianian Trail Rd. 1 Bl. E.Rte. 25 1,576,626 D - 1,576,626 - -
309 570-TDC-Elgin-W. Fox River N. Standish Rd. 390,482 D - 390,482 - -
310 572-TDC-Gilberts-Mason Rd. 3 Qtr Mi. W. Randall Rd. 647,432 D - 647,432 - -
311 574-TDC-Bartlett-S. Lake W. Church Rd. 2,054,564 D - 2,054,564 - -
312 577-TDC-South Elgin-I.C. Railroad At Umdenstock Rd 637,319 D - 637,319 - -
313 57-TSS-Forest Park-769 Des Plaines Ave. 428,864 D - 428,864 - -
314 580-TDC-Downers Grove-Qtr Mi. S. 75Th St. W. S Manning Rd. 2,011,355 D - 2,011,355 - -
315 581-TDC-Frontenac-N. Rte.34 E. Eola Rd. On Row 1,785,193 D - 1,785,193 - -
316 58-TSS-Grand 1,960,609 T 1,960,609 - - -
317 592-TDC-Oswego-2050 Route 34 Oswego IL. 173,608 D - 173,608 - -
318 593-TDC-Willow Springs-83Rd St. & German Church Rds. 412,770 D - 412,770 - -
319 595-TDC-Pleasant Hill-E. S Pleasant Hill Rd. S. St. Charles Rd. 1,341,189 D - 1,341,189 - -
320 59-TSS-Cicero-5210 W. Cermak Rd. 1,344,885 D - 1,344,885 - -
321 603-DSS-Lawrence-4836 N. Pulaski 1,027,535 D - 1,027,535 - -
322 60-TSS-Alsip-112Th St. & Lamon 2,917,026 D - 2,917,026 - -
323 614-NC-Chicago Civic Center-Vault 1-66 W. Washington St. 1,403,920 D - 1,403,920 - -
324 61-TSS-Streator-300 W. Cedar 391,531 D - 391,531 - -
325 626-DSS-School-6405 W. School St. 766,779 D - 766,779 - -
326 62-TSS-Manville-Manville 229,098 T 229,098 - - -
327 63-TSS-Sawyer-4860 S. St. Louis St. 969,767 D - 969,767 - -
328 648-TDC-Norridge-8220 W. Montrose 1,671,701 D - 1,671,701 - -
329 64-TSS-Bellwood-Butterfield Road & Eastern Ave. 2,599,556 T 2,599,556 - - -
330 65-TSS-Ohio-369 W. Ohio St.. 287,909 D - 287,909 - -
331 666-DSS-Center-446 W. Armitage 699,907 D - 699,907 - -
332 66-TSS-East Frankfort-21851 S. Pfeifer Rd. 998,823 T 998,823 - - -
333 6701-Line-Congress-Medical Center 83,553 T 83,553 - - -
334 674-DSS-Irving Park-4664 W. Irving Park 584,345 D - 584,345 - -
335 679-DSS-Besley-1814 N. Elston 725,864 D - 725,864 - -
336 67-TSS-Congress-2557 W. Congress Pk. Wy. 1,414,743 T 1,414,743 - - -
337 687-DSS-Norwood Park-5837 N. Nagle Ave. 472,764 D - 472,764 - -
338 68-TSS-La Salle-707 S La Salle St. 1,472,395 V - - 1,472,395 -
339 691-DSS-Waveland-1838 W. Waveland 982,525 D - 982,525 - -
340 69-TSS-North Chicago-22Nd St. E/Rte.41 1,173,571 D - 1,173,571 - -
341 7073-NC-Standard Oil Building-200 E. Randolph St. 52,985 D - 52,985 - -
342 70-TSS-Bradley-Armour Rd. & I.C.G. Rr. 2,321,342 V - - 2,321,342 -
343 714-TDC-Medical Center-1943 W. Harrison St. 1,620,121 D - 1,620,121 - -
344 71-TSS-Higgins-5432 N. Harlem Ave. 1,036,750 V - - 1,036,750 -
Docket No. 22-____ComEd Ex. 1.02
Page 117 of 176

WP 169 of 26
Commonwealth Edison Company
2021 Communications Study
(In Dollars)
Line
No. Asset Location
Balance as of
12/31/2021
Primary
Function:
T vs D( T, D, or V )
Transmission
Dollars
Distribution
Dollars Split Dollars Remaining Dollars
345 72-TSS-Goose Lake-Half Mi. Ne Collins Rd. On DresdenRd. 337,381 D - 337,381 - -
346 73-TSS-Chicago Hts.-Joe Orr Rd. Half Mi. E. State St. 1,460,922 V - - 1,460,922 -
347 741-DSS-Pershing Road-3858 S. Lowe Ave. 950,978 D - 950,978 - -
348 745-TDC-I.C. Air Rights-304 E Lake St. 824,088 D - 824,088 - -
349 74-TSS-Kewanee-Us Rte. 34 2 Half Mi. Ne. Kewanee 195,939 T 195,939 - - -
350 750-DSS-Cragin-4243 W. Grand Ave. 785,426 D - 785,426 - -
351 757-DSS-Twenty-Seventh Street-2640 S. Wabash Ave. 48,105 D - 48,105 - -
352 75-TSS-Crystal Lake-N. S. Rte. 176 1Mi W. Rte.31 2,265,723 D - 2,265,723 - -
353 75-TSS-Crystal Lake-Walkup Ave & C&Nw Rr 8,472 D - 8,472 - -
354 761-DSS-Wendell-360 Wendell St. 922,896 D - 922,896 - -
355 76-TSS-Blue Island-Thornton Rd. & Wood St. 5,067,756 T 5,067,756 - - -
356 77-TSS-Mazon-960 N.Rte. 47 1,243,284 T 1,243,284 - - -
357 784-TDC-Sears Tower-233 S. Wacker 1,950,718 D - 1,950,718 - -
358 785-TDC-Ontario-56 W.Ontario St. 845,134 D - 845,134 - -
359 78-TSS-Franklin Park-Anderson Pl. 2 Bl. W. Manheim Rd. 3,428,234 T 3,428,234 - - -
360 793-DSS-Laramie-909 N. Laramie Ave. 978,287 D - 978,287 - -
361 798-DSS-Carroll-1708 W. Carroll 836,619 D - 836,619 - -
362 79-TSS-Spaulding-N Spaulding Rd. Qtr Mi. E GiffordRd. 1,685,469 T 1,685,469 - - -
363 8014-NC-MIDWAY PARKING TOWER SOUTH 29,319 D - 29,319 - -
364 802-DSS-Ford City-4601 W. 71St St. 459,145 D - 459,145 - -
365 80-TSS-Pontiac Midpoint-3 Mi. S. Pontiac At Wabash 1,146,637 T 1,146,637 - - -
366 814-TDC-Damen-2141 W. 79Th Pl. 2,046,199 D - 2,046,199 - -
367 8211-Line-Crosby-Ontario 229,959 D - 229,959 - -
368 8213-Line-Crosby-Ontario 228,340 D - 228,340 - -
369 821-DSS-Marquette Park-6541 S. Kedzie 504,060 D - 504,060 - -
370 8221-Line-Crosby-Rockwell 4,219 T 4,219 - - -
371 82-TSS-Crosby-1180 N. Crosby 2,670,734 T 2,670,734 - - -
372 834-DSS-Grand Crossing-7675 S. Chicago Ave. 633,349 D - 633,349 - -
373 83-TSS-Glidden-1827 Pleasant St. 1,163,781 T 1,163,781 - - -
374 840-TDC-Quarry-2501 S. Senour St. 2,775,886 D - 2,775,886 - -
375 84-TSS-Rosehill-5801 N. Ravenswood Ave 835,651 D - 835,651 - -
376 851-DSS-Washtenaw-4722 S. Washtenaw Ave. 1,304,644 D - 1,304,644 - -
377 853-DSS-Sixty-Second Street-810 E. 62Nd St. 1,158,499 D - 1,158,499 - -
378 855-DSS-Windsor Park-2709 E. 76Th Pl. 851,904 D - 851,904 - -
379 85-TSS-Skokie-Mc Cormick Blvd. & Oakton St. 3,696,803 D - 3,696,803 - -
380 860-DSS-Hyde Park-820 E. 50Th Pl. 856,018 D - 856,018 - -
381 86-TSS-Davis Creek-3Mi. N.Bourbonnais 1-Half Mi. W. 600N Rd. 1,843,497 T 1,843,497 - - -
382 871-DSS-Fifty-Sixth Street-5549 S. Lowe Ave. 405,813 D - 405,813 - -
383 872-TDC-Pullman-739 W 119th st 39,897 D - 39,897 - -
384 875-DSS-Throop-6909 S. Throop St. 759,773 D - 759,773 - -
385 87-TSS-Dearborn-121 N. Dearborn St. 2,084,593 D - 2,084,593 - -
386 884-DSS-Prairie-4716 S. Prairie Ave. 647,228 D - 647,228 - -
387 88-TSS-Skokie-5100 Church St 5,855,689 T 5,855,689 - - -
Docket No. 22-____ComEd Ex. 1.02
Page 118 of 176

WP 1610 of 26
Commonwealth Edison Company
2021 Communications Study
(In Dollars)
Line
No. Asset Location
Balance as of
12/31/2021
Primary
Function:
T vs D( T, D, or V )
Transmission
Dollars
Distribution
Dollars Split Dollars Remaining Dollars
388 894-DSS-Harper-5611 S. Harper Ave. 618,887 D - 618,887 - -
389 895-DSS-Marshfield-5125 S. Marshfield 445,437 D - 445,437 - -
390 896-DSS-One Hundred & Eleventh St.-2501 W. 111Th St. 794,562 D - 794,562 - -
391 89-TSS-Beverly-1236 W. 105Th St. 396,969 D - 396,969 - -
392 9000-NC-Prudential Ins Co-2Nd Basem-140 E. Randolph St. 30,547 D - 30,547 - -
393 9001-NC-Prudential Ins Co-1St Fl-140 E. Randolph St. 30,520 D - 30,520 - -
394 900-TSS-Elwood 24553 S. Patterson Rd. Elwood, Ill. 163,923 T 163,923 - - -
395 90-TSS-Dekoven 5,085,856 T 5,085,856 - - -
396 91-TSS-1400 Cargo Court Minooka, IL 293,966 T 293,966 - - -
397 92-TSS-McLean 20,935 T 20,935 - - -
398 932-TSS-Rocky Road Power Plant, 1221 Power Dr. East Dundee, Il. 386,985 T 386,985 - - -
399 935-TSS-Kendall Energy Center-1300 N County Line Rd-2 miles east Ridge Rd 187,176 T 187,176 - - -
400 937-TSS-Lee County Energy Ctr-1674 Red Brick rd 1M W/Nachusa S/Rt 38 14,031 T 14,031 - - -
401 93-TSS-Loretto 160,532 T 160,532 - - -
402 940-TSS-Cordova-24712 192nd Avenue North 2m S/E of Quad Cities Station 550,340 T 550,340 - - -
403 945-NC-Insurance Exchange Bldg-157-185 W. Jackson Blvd. 32,576 D - 32,576 - -
404 945-TSS-Crete Energy Center-25300 Hartmann Drive, Crete Illinois Burville Rd & Rt1 114,000 T 114,000 - - -
405 946-TSS-University Park Energy Center (IPP)-2635 Dralley rd 8,816 T 8,816 - - -
406 94-TSS-Haumesser Rd substation 9,178 T 9,178 - - -
407 951-TSS-Aurora Energy Center (IPP), 2833 Eola Rd.Aurora, ILL. 196,242 T 196,242 - - -
408 955-TSS-River Energy Center 11503 S. Torrence Ave, Chicago, Il 1,322,694 T 1,322,694 - - -
409 95-TSS-Chestnut 7 T 7 - - -
410 970-TSS-University Park North Energy Center 444,125 T 444,125 - - -
411 974-TSS-Zion Energy Center 5740 State Route 173 476,201 T 476,201 - - -
412 979-TSS-Mendota Hills, LLC 1,146,569 T 1,146,569 - - -
413 981-TSS-ComEd Switch Yard 8545 Wyanet-Walnut Road 3,384 T 3,384 - - -
414 A12-DSS-Libertyville-4Th St. & Park Ave. 177,771 D - 177,771 - -
415 A15-DSS-Zion-S Shiloh & E Deborah 519,317 D - 519,317 - -
416 A27-DSS-Wadsworth-N Wadsworth Rd. Mi. E Delaney Rd. 282,199 D - 282,199 - -
417 A31-DSS-Fox Lake-Washington Ave. S Grand Ave. (Rt.132) 626,302 D - 626,302 - -
418 A35-DSS-Mundelein-S W Corner Of Division St.& ArcherAve. 72,694 D - 72,694 - -
419 A37-DSS-Round Lake Beach-Cedar Lake Road Half Mi. S RollinsRd. 58,016 D - 58,016 - -
420 A41-DSS-Waukegan-Water & Duggan Sts. 796,928 D - 796,928 - -
421 A428-ESS-Veterns Administration-Ray St. S Rt. 137 461,723 D - 461,723 - -
422 A429-ESS-Abbvie-Abbott Labs-North Chicago-13500 W. New Ave. North Chicago Ill. 60439. 151,605 D - 151,605 - -
423 A431-ESS-Abbott Laboratories-Buckley & Rte.43 469,237 D - 469,237 - -
424 A43-DSS-Waukegan-Pine St. N Grand Ave. 248,027 D - 248,027 - -
425 A450-ESS-Great Lakes Training Center-1St. Gate E. Rt. 41 S Buckley Rd. 70,143 D - 70,143 - -
426 A47-DSS-Lake Villa-Grand Ave. & Soo Line Rr 1,167,388 D - 1,167,388 - -
427 A49-DSS-Waukegan-Grand Ave. Qtr Mi. E. Rt. 131 226,372 D - 226,372 - -
428 A50-DSS-Gages Lake-Rt. 45 & Gages Lake Rd. 33,876 D - 33,876 - -
429 A56-DSS-Waukegan-Gladstone Ave. W Jackson St. 215,866 D - 215,866 - -
430 A57-DSS-Beach-Wadsworth Rd. 1-2 Mi. E. Lewis 88,497 D - 88,497 - -
Docket No. 22-____ComEd Ex. 1.02
Page 119 of 176

WP 1611 of 26
Commonwealth Edison Company
2021 Communications Study
(In Dollars)
Line
No. Asset Location
Balance as of
12/31/2021
Primary
Function:
T vs D( T, D, or V )
Transmission
Dollars
Distribution
Dollars Split Dollars Remaining Dollars
431 A61-DSS-Waukegan-W Lewis Half Mi. N Glen Flora 251,598 D - 251,598 - -
432 A63-DSS-Waukegan-12Th St. & Greenfield Ave. 208,819 D - 208,819 - -
433 A64-DSS-Libertyville-Garfield St. & Park Ave. (S. Rt. 176) 78,848 D - 78,848 - -
434 A65-DSS-Waukegan-Sheridan Rd. S Greenwood 188,181 D - 188,181 - -
435 A67-DSS-Roundout-Rte. 176 W Mlwke Rr (Qtr Mi. E Bradley) 366,400 D - 366,400 - -
436 A68-DSS-Waukegan-E Butrick St. Qtr Mi S York Hse Rd. 312,841 D - 312,841 - -
437 A70-DSS-Waukegan-S Blanchard Rd. Qtr Mi. E DelaneyRd. 293,926 D - 293,926 - -
438 A71-DSS-Grass Lake-E Rte. 59 N Towline Rd. 266,276 D - 266,276 - -
439 A81-DSS-Great Lakes 190,708 D - 190,708 - -
440 A82-DSS-Zion-Lewis Ave. Qtr Mi. N Rt. 173 78,819 D - 78,819 - -
441 A87-DSS-Grayslake-Washington & Lake Ave. 117,945 D - 117,945 - -
442 A91-DSS-Zion-Rte.173 At C N S & M Row 254,518 D - 254,518 - -
443 A92-DSS-Warren Township-Belvidere & Melody Rd. (N. Lakehurst Mall) 183,488 D - 183,488 - -
444 A94-DSS-Druce Lake-Rte. 45 On Ceco Row Rte. 132 243,541 D - 243,541 - -
445 B10-DSS-Harvard-205 Airport Rd. 212,019 D - 212,019 - -
446 B11-DSS-Poplar Grove-14893 Rte. 76 198,279 D - 198,279 - -
447 B12-DSS-Capron-411 North St. 118,055 D - 118,055 - -
448 B14-DSS-Harvard-107 S. Hutchinson St. 338,313 D - 338,313 - -
449 B15-DSS-Kingston-Pleasant Hill Rd. & C M St.P Rr 211,706 D - 211,706 - -
450 B16-DSS-Hampshire-153 Prairie St. 73,115 D - 73,115 - -
451 B17-DSS-Genoa-Railroad St. & W Stott St. 180,019 D - 180,019 - -
452 B19-DSS-Belvidere-314 Whitney Blvd. 345,952 D - 345,952 - -
453 B200-ESS-15201 STORY RD JUNO, IL 60135 34,073 D - 34,073 - -
454 B20-DSS-Belvidere-5952 Genoa Rd. 223,031 D - 223,031 - -
455 B22-DSS-Garden Prairie-Rt. 20 129,684 D - 129,684 - -
456 B23-DSS-Herbert-443 Kingston Rd. 147,521 D - 147,521 - -
457 B25-DSS-Monroe Center-Rt. 72 E City Limits 154,262 D - 154,262 - -
458 B26-DSS-Davis Junction-6800 N. Junction Rd. 175,902 D - 175,902 - -
459 B27-DSS-Stillman Valley-7008 N. Stillman Valley Rd. 178,296 D - 178,296 - -
460 B28-DSS-Kirkland-4910 Scout Rd. 166,293 D - 166,293 - -
461 B29-DSS-Byron-520 N. Washington St. 263,816 D - 263,816 - -
462 B30-DSS-Mount Morris-219 N. Mc Kendrie Ave. 196,632 D - 196,632 - -
463 B31-DSS-Chemung-6649 Oak Grove Rd. 197,376 D - 197,376 - -
464 B32-ESS-American Oil Co.-Oregon 5,457 D - 5,457 - -
465 B35-DSS-Coleta-22245 Quinn Rd. 135,919 D - 135,919 - -
466 B36-DSS-Polo-302 S. Green Ave. 271,302 D - 271,302 - -
467 B37-DSS-Forreston-201 E. Green St. 101,215 D - 101,215 - -
468 B39-DSS-Baileyville-203 S. Commercial St. 286,339 D - 286,339 - -
469 B427-ESS-Kelly-Springfield Tire Co.-Rt. 20 E. Freeport 122,819 D - 122,819 - -
470 B42-DSS-Pearl City-100 W. Walgren Rd. 298,007 D - 298,007 - -
471 B43-DSS-Stockton-220 S. Stockton St. 321,576 D - 321,576 - -
472 B44-DSS-Warren-320 Railroad St. 240,922 D - 240,922 - -
473 B45-DSS-Lena-711 Maple St. 455,865 D - 455,865 - -
Docket No. 22-____ComEd Ex. 1.02
Page 120 of 176

WP 1612 of 26
Commonwealth Edison Company
2021 Communications Study
(In Dollars)
Line
No. Asset Location
Balance as of
12/31/2021
Primary
Function:
T vs D( T, D, or V )
Transmission
Dollars
Distribution
Dollars Split Dollars Remaining Dollars
474 B465-ESS-Chrysler Corp.-U.S Rt. 20 & Stone Quarry Rd. 390,476 T 390,476 - - -
475 B46-DSS-Milledgeville-400 Washington St. 138,545 D - 138,545 - -
476 B47-DSS-Cedarville-835 W. Angle Rd. 426,218 D - 426,218 - -
477 B48-DSS-Rink-5009 N. Rink Rd. 79,505 D - 79,505 - -
478 B50-DSS-Cherry Grove-3 Mi. N Lanark At Jct. Of 72 &73 103,532 D - 103,532 - -
479 B51-DSS-Marengo-311 E. Railroad St. 197,955 D - 197,955 - -
480 B52-DSS-Leaf River-119 S. East St. 279,273 D - 279,273 - -
481 B53-DSS-Oregon-120 N. Second St. 345,449 D - 345,449 - -
482 B54-DSS-Oregon-142 N. German Church Rd. 213,450 D - 213,450 - -
483 B55-DSS-Rock City-N. Rock City Rd. 213,201 D - 213,201 - -
484 B56-DSS-Freeport-315 E. South St. 142,554 D - 142,554 - -
485 B57-DSS-Union-6349 Olson Rd. 150,418 D - 150,418 - -
486 B63-DSS-Lanark-103 N. Rochester St. 81,792 D - 81,792 - -
487 B64-DSS-Franklin Grove-307 S. State St. 185,712 D - 185,712 - -
488 B86-DSS-Claire-6379 E. Claire Rd. 124,360 D - 124,360 - -
489 B89-DSS-Afton-15082 S. First St. 141,366 D - 141,366 - -
490 B90-DSS-Maple Park-19251 Pritchard Rd. 88,024 D - 88,024 - -
491 B95-DSS-South Dekalb-South Dekalb 106,526 D - 106,526 - -
492 B96-DSS-North Hampshire 881,357 D - 881,357 - -
493 C18-DSS-Des Plaines-1100 Seeger Rd. 375,961 D - 375,961 - -
494 C19-DSS-Niles-Waukegan Rd. S Howard St. 396,264 D - 396,264 - -
495 C20-DSS-Evanston-Isabella St. & Bryant Ave. 58,422 D - 58,422 - -
496 C22-DSS-Lincolnwood-C & N W Rr & Pratt Ave. 113,118 D - 113,118 - -
497 C23-DSS-Highland Park-Skokie Blvd. & Deerfield Rd. 44,328 D - 44,328 - -
498 C25-DSS-Glenview-Shermer Ave. S Glenview Rd. 89,189 D - 89,189 - -
499 C26-DSS-Mt. Prospect-Central & Pine Sts. 174,115 D - 174,115 - -
500 C28-DSS-Skokie-Jarvis & Ridgeway Ave. 144,774 D - 144,774 - -
501 C30-DSS-Lake Forest-Efner Ave. W Western Ave. 40,742 D - 40,742 - -
502 C31-DSS-Wilmette-3620 Lake Ave. 251,908 D - 251,908 - -
503 C32-DSS-Skokie-Ceco Cta Row (W Crawford & S Oakton) 359,408 D - 359,408 - -
504 C33-DSS-Niles-Waukegan Rd. S Howard St. 364,209 D - 364,209 - -
505 C34-DSS-Braeside-County Line Rd. W Green Bay Rd. 83,108 D - 83,108 - -
506 C36-DSS-Park Ridge-1213 S. Cumberland Rd. 111,878 D - 111,878 - -
507 C3-DSS-Highland Park-525 Elm Pl. 380,652 D - 380,652 - -
508 C41-DSS-Evanston-E Crawford Ave. & S Thayer St. 142,429 D - 142,429 - -
509 C433-ESS-Highland Park-PP1905-C&NW RY S of Deerfield Rd 5,457 D - 5,457 - -
510 C434-ESS-C Ns E & M Rr-Old Mill Rd 169,064 D - 169,064 - -
511 C43-DSS-Evanston-Oakton St. & Custer Ave. 151,178 D - 151,178 - -
512 C51-DSS-Des Plaines-30 E. Thatcher Ave. 231,367 D - 231,367 - -
513 C52-DSS-Morton Grove-Harlem Ave. S Gold Rd. 173,425 D - 173,425 - -
514 C53-DSS-Evanston-Chicago Ave. & Kedzie St. 11,642 D - 11,642 - -
515 C54-DSS-Evanston-Brown Ave. & Church St. 215,762 D - 215,762 - -
516 C55-DSS-Park Ridge-4 S. Fairview Ave. 492,159 D - 492,159 - -
Docket No. 22-____ComEd Ex. 1.02
Page 121 of 176

WP 1613 of 26
Commonwealth Edison Company
2021 Communications Study
(In Dollars)
Line
No. Asset Location
Balance as of
12/31/2021
Primary
Function:
T vs D( T, D, or V )
Transmission
Dollars
Distribution
Dollars Split Dollars Remaining Dollars
517 C56-DSS-Wilmette-823 Hibbard Rd. 71,655 D - 71,655 - -
518 C61-DSS-Garnett-Garnett Pl. & Cta 33,218 D - 33,218 - -
519 C62-DSS-Glencoe-Park Ave. W Vernon 462,297 D - 462,297 - -
520 C65-DSS-Evanston-Wesley & Mulford Sts. 206,172 D - 206,172 - -
521 C66-DSS-Evanston-Greenleaf St. & Brown Ave. 206,455 D - 206,455 - -
522 C69-DSS-Skokie-Oakton St. & 138Kv Row Half Mi.W Kostner 158,432 D - 158,432 - -
523 C6-DSS-Morton Grove-Dempster St. & Waukegan Rd. 107,292 D - 107,292 - -
524 C73-DSS-Techny-Techny Rd. E Shermer Rd. 396,645 D - 396,645 - -
525 C74-DSS-Skokie-Ceco Row N Howard St. W Kilpatrick 43,879 D - 43,879 - -
526 C75-DSS-Evanston-Ewing Ave. & Central St. 42,504 D - 42,504 - -
527 C76-DSS-Lake Forest-Westleigh Rd. W Mckinley 274,150 D - 274,150 - -
528 C77-DSS-Skokie-E Prairie Rd. & Dempster St. 202,701 D - 202,701 - -
529 C78-DSS-Morton Grove-Austin Ave. & Dempster St. 135,141 D - 135,141 - -
530 C79-DSS-Des Plaines-Lee & Walnut Sts. 159,922 D - 159,922 - -
531 C7-DSS-Glenview-C E Co Row At Glenview Rd. 137,517 D - 137,517 - -
532 C80-DSS-Glenview-Greenwood Ave & Central Rd. 17,363 D - 17,363 - -
533 C81-DSS-Lincolnwood-Central Park Ave. & Pratt Rd. 199,199 D - 199,199 - -
534 C82-DSS-Highland-Western Ave. N. Half Day Rd. 223,929 D - 223,929 - -
535 C83-DSS-Evanston-Lincoln St. & Green Bay Rd. 181,291 D - 181,291 - -
536 C85-DSS-Northbrook-Shermer & Walters Ave. 506,327 D - 506,327 - -
537 C86-DSS-Skokie-Lee & Niles Center Rd. 251,333 D - 251,333 - -
538 C87-DSS-Park Ridge-616 S. Hamlin Ave. 20,391 D - 20,391 - -
539 C89-DSS-Wilmette-2447 Lake St. 147,228 D - 147,228 - -
540 C90-DSS-Skokie-Simpson St. & Crawford Ave. 239,040 D - 239,040 - -
541 C91-DSS-Park Ridge-212 Higgins Rd. 137,926 D - 137,926 - -
542 C92-DSS-Glencoe-Woodlawn Ave. & Glencoe Rd. 310,417 D - 310,417 - -
543 C93-DSS-Highland Park-629 St. Johns Ave. 1,167,519 D - 1,167,519 - -
544 C94-DSS-Skokie-E Central Ave. N Pratt Ave. 152,023 D - 152,023 - -
545 C95-DSS-Glenview-Harrison St. & Waukegan Rd. 154,291 D - 154,291 - -
546 C96-DSS-Techny South 117,675 D - 117,675 - -
547 C97-DSS-Park Ridge-108 Busse Hwy. 62,755 D - 62,755 - -
548 CED-Communication Equipment Stock Location 50,375,159 V - - 50,375,159 -
549 CED-Misc. Eq Stock Location 1,243,670 V - - 1,243,670 -
550 ComEd COM-Trnsm. Terminal-Braidwood Station-R.R. No.1 Box 84 (Braceville) 1,185,311 T 1,185,311 - - -
551 ComEd COM-Trnsm. Terminal-Byron Station-6 Mi. S.Byron On German Church Rd. 510,089 T 510,089 - - -
552 ComEd COM-Trnsm. Terminal-Collins Station-R.R. No. 1 Pine Bluff Rd. 1,763,962 T 1,763,962 - - -
553 ComEd COM-Trnsm. Terminal-Crawford Station-3501 S. Pulaski 3,406,587 T 3,406,587 - - -
554 ComEd COM-Trnsm. Terminal-Dresden Station-R.R. No. 1 1,943,428 T 1,943,428 - - -
555 ComEd COM-Trnsm. Terminal-Fisk Station-1111 W. Cermak 4,729,994 T 4,729,994 - - -
556 ComEd COM-Trnsm. Terminal-Joliet Station #9--Rte.6 & Larkin Ave. 2,249,788 T 2,249,788 - - -
557 ComEd COM-Trnsm. Terminal-Kincaid Station-P.O. Box M 12,884,212 T 12,884,212 - - -
558 ComEd COM-Trnsm. Terminal-Lasalle County Station-R.R. No. 1 Box 220 366,552 T 366,552 - - -
559 ComEd COM-Trnsm. Terminal-Powerton Station-2 Mi. S.Pekin Off Rte.29 P.O. Box158 2,077,125 T 2,077,125 - - -
Docket No. 22-____ComEd Ex. 1.02
Page 122 of 176

WP 1614 of 26
Commonwealth Edison Company
2021 Communications Study
(In Dollars)
Line
No. Asset Location
Balance as of
12/31/2021
Primary
Function:
T vs D( T, D, or V )
Transmission
Dollars
Distribution
Dollars Split Dollars Remaining Dollars
560 ComEd COM-Trnsm. Terminal-Sta-103rd & Lake Michigan 135,265 T 135,265 - - -
561 ComEd COM-Trnsm. Terminal-Waukegan Station-1201 Pershing Road, Waukegan, IL 1,578,951 T 1,578,951 - - -
562 ComEd COM-Trnsm. Terminal-Waukegan Station-Greenwood & Lake Michigan 6,362,291 T 6,362,291 - - -
563 ComEd COM-Trnsm. Terminal-Will County Station-529 E. Romeo Rd. 3,767,033 T 3,767,033 - - -
564 ComEd COM-Trnsm. Terminal-Zion Station-Shiloh Blvd. & Lake Michigan 578,972 T 578,972 - - -
565 ComEd COM-Trnsm.Terminal-Quad Cities Station-22710 206Th Ave. 831,520 T 831,520 - - -
566 ComEd PEAKER-Trnsm. Terminal-Bloom Peaking Units-305 E. Sauk Trail 441,211 T 441,211 - - -
567 ComEd U6-Trnsm. Terminal-Joliet Station #29-Paterson Rd. 1 Mi. E.Brandon Rd. 1,247,500 T 1,247,500 - - -
568 Corp Ofc-Aurora Hdq-2001 Aucutt Rd. 126,469 D - 126,469 - -
569 Corp Ofc-Bank One Building-10 S. Dearborn St. 65,645 D - 65,645 - -
570 Corp Ofc-Belvidere Switchyard Belvidere-1 Mi. W. Belvidere On Rte.20 53,382 D - 53,382 - -
571 Corp Ofc-Bolingbrook Hdq-1040 N.Janes Ave. 46,941 D - 46,941 - -
572 Corp Ofc-Bulk Power Operations-1 N. 301 Swift Rd. 14,815,913 T 14,815,913 - - -
573 Corp Ofc-CED Operations Center 2-Leased-2 Lincoln Center Oak Brook Terrace Ill. 60181 1,699,993 V - - 1,699,993 -
574 Corp Ofc-CED Operations Center 3 Post 2012 LC Restack -Leased-3 Lincoln Center Oak Brook Terrace Ill. 60181479,730 V - - 479,730 -
575 Corp Ofc-CED Operations Center 3 Purchase-3 Lincoln Center Oak Brook Terrace IL 1,075,154 V - - 1,075,154 -
576 Corp Ofc-CED Operations Center 3-Leased-3 Lincoln Center Oak Brook Terrace Ill. 60181 2,558,981 V - - 2,558,981 -
577 Corp Ofc-CED Operations Center 3-OWNED-3 Lincoln Center Oak Brook Terrace Ill. 60181 252,323 V - - 252,323 -
578 Corp Ofc-Chicago Loop Tech.- 200 N Ogden Ave. 104,440 D - 104,440 - -
579 Corp Ofc-Chicago Region-North-3500 N.California Ave. 12,191,803 D - 12,191,803 - -
580 Corp Ofc-Chicago Region-South-7601 S. Lawndale Ave. 463,912 D - 463,912 - -
581 Corp Ofc-Chicago Training Center 95,782 D - 95,782 - -
582 Corp Ofc-Chicago West Tech.-3400 S Pulaski 104,724 V - - 104,724 -
583 Corp Ofc-Commercial Center 1919 Swift Dr. 951,025 D - 951,025 - -
584 Corp Ofc-Corporate Computer Center-1700 Spencer Rd. 125,236,763 V - - 125,236,763 -
585 Corp Ofc-Crestwood Region-4401 W. 135Th St. 323,259 D - 323,259 - -
586 Corp Ofc-Crystal Lake Region-5100 S. Rte.31 115,445 D - 115,445 - -
587 Corp Ofc-Dekalb Region-17028 Rte.23 537,976 D - 537,976 - -
588 Corp Ofc-Dixon-College Ave & River St 18,417 D - 18,417 - -
589 Corp Ofc-Dva Area Hdqtrs-1505 S First Ave 615,028 D - 615,028 - -
590 Corp Ofc-Edison Building (Leased)-72 W Adams St. 13,945 D - 13,945 - -
591 Corp Ofc-Elgin Region Hdq-350 E.Second St. 2,941 D - 2,941 - -
592 Corp Ofc-Freeport Region Hdq-2900 Rte.20 W. 4,513 D - 4,513 - -
593 Corp Ofc-Glenbard Region Hdq-1 N. 423 Swift Rd. 799,654 D - 799,654 - -
594 Corp Ofc-Highland Park 1785 Old Skokie Blvd 70,894 D - 70,894 - -
595 Corp Ofc-Joliet Region Hdq-1910 Briggs St. 325,730 D - 325,730 - -
596 Corp Ofc-Kankakee Region-477 S. Schuyler Ave. 1,069,667 D - 1,069,667 - -
597 Corp Ofc-Leased-1 Lincoln Center 107,820 D - 107,820 - -
598 Corp Ofc-Libertyville Region Hdq-1500 Franklin Blvd. 1,443,195 D - 1,443,195 - -
599 Corp Ofc-Marengo-309 Depot Street 156,679 D - 156,679 - -
600 Corp Ofc-Maywood Technical Center 759,076 D - 759,076 - -
601 Corp Ofc-Mt. Prospect-Nw Region Hdq-201 N. Arthur Ave. 648,581 D - 648,581 - -
602 Corp Ofc-O'Hare Airport Reporting Center-O'Hare Airport 82,791 D - 82,791 - -
Docket No. 22-____ComEd Ex. 1.02
Page 123 of 176

WP 1615 of 26
Commonwealth Edison Company
2021 Communications Study
(In Dollars)
Line
No. Asset Location
Balance as of
12/31/2021
Primary
Function:
T vs D( T, D, or V )
Transmission
Dollars
Distribution
Dollars Split Dollars Remaining Dollars
603 Corp Ofc-One Financial Place-440 s LaSalle St 151,007 T 151,007 - - -
604 Corp Ofc-Operations Control Center-1700 Spencer Rd 905,598 V - - 905,598 -
605 Corp Ofc-Pontiac-Aurora St & Ic Rr 115,795 D - 115,795 - -
606 Corp Ofc-Rock River Division PowerSupply Office-Sabrooke 391,169 D - 391,169 - -
607 Corp Ofc-Rockford Hdq-300 S. Avon St. 67,317 D - 67,317 - -
608 Corp Ofc-Rockford Office Building-303 N. Main St. 14,797 D - 14,797 - -
609 Corp Ofc-Rockford Region Hdq-123 Energy Ave. 2,613 D - 2,613 - -
610 Corp Ofc-Rockriver Hdq-919 First St.. 296,623 D - 296,623 - -
611 Corp Ofc-Skokie Reporting Center 251,622 D - 251,622 - -
612 Corp Ofc-Southern Div Hdq-Obsolete-51 W. Jackson St. 319,376 D - 319,376 - -
613 Corp Ofc-Springfield Office (Leased)-One West Old State Capital Plaza 2,138,167 V - - 2,138,167 -
614 Corp Ofc-Streator Region-700 W. French St. 72,400 D - 72,400 - -
615 Corp Ofc-Supervisory Control Center-8207 S. Halsted St. 87,877 D - 87,877 - -
616 Corp Ofc-Techny Reporting Center 37,235 D - 37,235 - -
617 Corp Ofc-University Park Region Hdq-25000 S. Governors Hwy. 630,302 D - 630,302 - -
618 Corp Ofc-Waukegan Region Hdq-2800 Northwestern Ave. 6,741 D - 6,741 - -
619 Corp Ofc-Wheaton-427 Childs St 9,237 V - - 9,237 -
620 Corp Ofc-Woodstock Customer Center-1950 Duncan Place 1,327,233 D - 1,327,233 - -
621 Corp-Ofc-Chicago Training Center-3535 S Iron St 1,326,322 D - 1,326,322 - -
622 CTL-Y-180-110 N. Wacker 71,461 D - 71,461 - -
623 CTL-Y-228-433 W Van Buren 105,597 D - 105,597 - -
624 CTL-Y-951-21 S. Clark St.-Bank One 172,092 D - 172,092 - -
625 D100-DSS-Cicero-S Roosevelt Rd. E Lombard Ave. 185,077 D - 185,077 - -
626 D103-DSS-Riverside-S 26Th St. W Harlem Ave. 162,942 D - 162,942 - -
627 D111-DSS-Elmwood Park-Marwood Ave. & E 76Th St. 713,404 D - 713,404 - -
628 D114-DSS-Stickney Twp.-78Th St. & Central Ave. 177,286 D - 177,286 - -
629 D115-DSS-Brookfield-W Woodside Ave. N C B & Q Rr 166,556 D - 166,556 - -
630 D125-DSS-La Grange Park-31St St. & I H B Rr 151,167 D - 151,167 - -
631 D12-DSS-Bellwood-Mannheim Rd. & C A & E Rr 159,545 D - 159,545 - -
632 D130-DSS-Oak Park-N Madison St. W Lombard Ave. 65,144 D - 65,144 - -
633 D133-DSS-River Grove-Budd St. & C M St. P Rr 479,938 D - 479,938 - -
634 D13-DSS-Forest View-49Th St. & Central Ave. 188,288 D - 188,288 - -
635 D140-DSS-Brookfield-S Ogden Ave. E Prairie Ave. 182,819 D - 182,819 - -
636 D143-DSS-River Forest-N Central Ave. E Lathrop Ave. 154,483 D - 154,483 - -
637 D149-DSS-Elmwood Park-76Th Ave. & Belmont Ave. 114,017 D - 114,017 - -
638 D151-DSS-Cicero-Laramie Ave. & 34Th St. 175,995 D - 175,995 - -
639 D15-DSS-Cicero-E. Lombard Ave. N. 22Nd St. 170,454 D - 170,454 - -
640 D16-DSS-La Grange Highlands-W Brainard Ave. S 55Th St. 89,662 D - 89,662 - -
641 D172-DSS-La Grange-N Hillgrove St. W Brainard Ave. 253,842 D - 253,842 - -
642 D173-DSS-Elmwood Park-N North Ave. W 75Th Ct. 343,861 D - 343,861 - -
643 D175-DSS-Schiller Park-Soo Line Rr & Seymour Ave. 295,244 D - 295,244 - -
644 D177-DSS-O'Hare Airport-N. I.B.T.Co. Bldg. 791,993 D - 791,993 - -
645 D179-DSS-O'Hare Airport-E Bessie Coleman Dr. S North Access Rd. 126,810 D - 126,810 - -
Docket No. 22-____ComEd Ex. 1.02
Page 124 of 176

WP 1616 of 26
Commonwealth Edison Company
2021 Communications Study
(In Dollars)
Line
No. Asset Location
Balance as of
12/31/2021
Primary
Function:
T vs D( T, D, or V )
Transmission
Dollars
Distribution
Dollars Split Dollars Remaining Dollars
646 D17-DSS-Melrose Park-W 9Th Ave. S North Ave. 122,212 D - 122,212 - -
647 D180-DSS-O'Hare Airport-S Irving Park Rd. E Taft 680,128 D - 680,128 - -
648 D187-DSS-Maywood-1505 S. 1St Ave. 173,768 D - 173,768 - -
649 D194-DSS-Stone Park-S North Ave. W Mannheim Rd. 184,579 D - 184,579 - -
650 D201-DSS-Melrose Park-E 25Th Ave. S North Ave. 138,510 D - 138,510 - -
651 D204-DSS-Oak Park-S Madison St. E Harlem Ave. 197,837 D - 197,837 - -
652 D20-DSS-Melrose Park-W 16Th St. S Main St. 174,173 D - 174,173 - -
653 D216-DSS-Maywood-W 17Th Ave. S Madison St. 215,406 D - 215,406 - -
654 D217-DSS-Cicero-E. Austin Blvd. S. 31St St. 280,490 D - 280,490 - -
655 D229-DSS-Lyons Twp.-Wolf Rd. S 55Th St. 320,369 D - 320,369 - -
656 D241-DSS-Riverside-Quincy St. W Harlem Ave. 178,684 D - 178,684 - -
657 D242-DSS-Bridgeview-79Th St. W Roberts Rd. 148,357 D - 148,357 - -
658 D244-DSS-Stickney Twp.-N 79Th St. W Cicero Ave. 167,561 D - 167,561 - -
659 D24-DSS-Western Springs-S Burlington E Wolf Rd. 338,137 D - 338,137 - -
660 D255-DSS-Forest View-S 47Th St. W Oak Park Ave. 188,746 D - 188,746 - -
661 D267-DSS-Leyden Twp.-W Scott St. N Addison 118,803 D - 118,803 - -
662 D292-DSS-Oak Park-E Harlem Ave. N Chicago Ave. 86,243 D - 86,243 - -
663 D34-DSS-Berwyn-N 22Nd St. W Euclid Ave. 268,285 D - 268,285 - -
664 D351-DSS-Hodgkins-E East Ave S 55Th St. On Ceco Row 263,700 D - 263,700 - -
665 D400-ESS-Tech Center-Maywood 96,792 D - 96,792 - -
666 D40-DSS-Summit-Archer Ave. & 67Th St. 256,669 D - 256,669 - -
667 D44-DSS-Countryside - Plainfield Road. 47,178 D - 47,178 - -
668 D451-ESS-O'Hare Airport-Hanger Area-United Airlines 95,616 D - 95,616 - -
669 D45-DSS-Leyden Twp.-Mannheim Rd. S Fullerton Ave. 197,841 D - 197,841 - -
670 D46-DSS-Northlake-North Ave & Wolf Rd. 279,894 D - 279,894 - -
671 D47-DSS-Broadview-N 22Nd St. W Ihb Rr 181,350 D - 181,350 - -
672 D51-DSS-Northlake-W Wolf Rd. S Fullerton Ave. 147,228 D - 147,228 - -
673 D528-ESS-O'Hare Airport-Hanger Area-American Airlines 107,862 D - 107,862 - -
674 D53-DSS-Maywood-E 1St Ave. S C N W Rr 355,852 D - 355,852 - -
675 D609-ESS-Ford Motor Co.-Melrose Park 120,346 D - 120,346 - -
676 D62-DSS-Hillside-Nw Harrison St. E Wolf Rd. 86,347 D - 86,347 - -
677 D63-DSS-Schiller Park-Soo Line Rr N Lawrence Ave. 116,790 D - 116,790 - -
678 D67-DSS-Leyden Twp.-W 15Th Ave. N Armitage Ave. 54,762 D - 54,762 - -
679 D698-ESS-United Airlines-S. Tank Farm On Tank Farm Rd. 95,610 D - 95,610 - -
680 D69-DSS-Broadview-9Th Ave & 16Th St. 212,140 D - 212,140 - -
681 D722-ESS-UNITED AIRLINES TANK FARM-O'HARE 8,763 D - 8,763 - -
682 D7271-ESS-Loyola University-W 1St Ave. S Roosevelt Rd. 359,337 D - 359,337 - -
683 D744-ESS-O'Hare Airport-City Of Chicago 109,092 D - 109,092 - -
684 D757-ESS-O'Hare Airport-City Of Chicago 43,668 D - 43,668 - -
685 D775-ESS-Metropolitan Sanitary District-6100 S. River Rd. 90,901 D - 90,901 - -
686 D785-ESS-600-E-BUTTERFILED RD 64,299 D - 64,299 - -
687 D787-ESS-601 NORTHWEST AVENUE UNIT A 209,438 D - 209,438 - -
688 D789-ESS-Ascent Data Center, 505 N. Railroad Ave., Northlake IL 152,474 D - 152,474 - -
Docket No. 22-____ComEd Ex. 1.02
Page 125 of 176

WP 1617 of 26
Commonwealth Edison Company
2021 Communications Study
(In Dollars)
Line
No. Asset Location
Balance as of
12/31/2021
Primary
Function:
T vs D( T, D, or V )
Transmission
Dollars
Distribution
Dollars Split Dollars Remaining Dollars
689 D799-ESS-Metropolitan Sanitary District-W 58Th Ave. N Canal 556,472 D - 556,472 - -
690 D80-DSS-Broadview-Puscheck Rd. & N I C Rr 123,910 D - 123,910 - -
691 D86-DSS-Berkeley-S St. Charles Rd. E Wolf Rd. 116,365 D - 116,365 - -
692 D87-DSS-Leyden Twp.-W 5Th Ave. N North Ave. 318,300 D - 318,300 - -
693 D89-DSS-Lyons-4320 Lawndale Ave. 36,379 D - 36,379 - -
694 D99-DSS-Franklin Park-Schiller Blvd. & Washington St. 500,071 D - 500,071 - -
695 E10-DSS-South Huntley-South Huntley 175,030 D - 175,030 - -
696 E11-DSS-Wauconda-Ivanhoe Rd. & E Rte. 59 46,164 D - 46,164 - -
697 E12-DSS-Palatine-1452 E. Northwest Hwy. W Wilke Rd. 167,425 D - 167,425 - -
698 E16-DSS-Mc Henry-N W Corner Chapel Rd. & Lincoln Rd. 241,799 D - 241,799 - -
699 E17-DSS-Wonder Lake-Howe Rd. Clearwater Dr. W Barnard Mill Rd. 448,609 D - 448,609 - -
700 E18-DSS-Honey Lake-Miller Rd. & Rte. 59 213,694 D - 213,694 - -
701 E19-DSS-Island Lake-Rt. 176 W Island Lake 88,289 D - 88,289 - -
702 E20-DSS-Spring Grove-N W Corner Winn Rd.&Westward Dr. 108,532 D - 108,532 - -
703 E21-DSS-Hartland-Murry Rd. & N Nelson Rd. 99,011 D - 99,011 - -
704 E22-DSS-Wauconda-Rt. 176 & Grand Ave. 41,896 D - 41,896 - -
705 E24-DSS-Cary-E Main St. & Northwest Hwy. 127,219 D - 127,219 - -
706 E26-DSS-Lake In The Hill-E Haligus S Albreicht 42,542 D - 42,542 - -
707 E27-DSS-Arlington Hts.-11 N. Hickory St. 194,061 D - 194,061 - -
708 E28-DSS-Algonquin-1-2 Mi. W Rte.31 On Huntly Algonquin Rd. 132,364 D - 132,364 - -
709 E29-DSS-Johnsburg-Spring Grove Rd & Ring Wood rd 216,231 D - 216,231 - -
710 E35-DSS-Huntley-Vine St. W Rt. 47 157,384 D - 157,384 - -
711 E38-DSS-Oakwood Hills-5018 Valley View Rd. 36,186 D - 36,186 - -
712 E39-DSS-Arlington Hts.-202 E. Central Rd. 235,574 D - 235,574 - -
713 E41-DSS-Wauconda-Rt. 59 S. Old Rand Rd. 126,983 D - 126,983 - -
714 E46-DSS-Burton Bridge-Nish Rd. 1-4 Mi. W Rt. 176 14,947 D - 14,947 - -
715 E59-DSS-Algonquin-Rt. 62 At Wlliams Rd. 18,180 D - 18,180 - -
716 E69-DSS-Palatine Twp.-Rohlwing & Kirchoff Rds. 359,804 D - 359,804 - -
717 E70-DSS-Arlington Hts.-1104 N. Arlington Hts. Rd. 87,510 D - 87,510 - -
718 E71-DSS-Door Twp.-Briarwood Rd. 1-4 Mi. S Rt.176 116,146 D - 116,146 - -
719 E72-DSS-Fox River Grove-Rt.14 & School St. 227,681 D - 227,681 - -
720 E77-DSS-Crystal Lake-Virginia St. & C & N W Rr 190,807 D - 190,807 - -
721 E79-DSS-South Wonder Lake-Hwy. 120 Half Mi. W Wonder Lake Rd. 164,958 D - 164,958 - -
722 E81-DSS-Arlington Hts.-Salem & St. James St. 103,070 D - 103,070 - -
723 E82-DSS-Richmond-Rt. 12 & Rt. 31 278,958 D - 278,958 - -
724 E8-DSS-Nerge-1775 Roslyn Rd. 90,519 D - 90,519 - -
725 ESSD460-6 Digital Realty 54,412 T 54,412 - - -
726 F100-DSS-Calumet City-154Th & Hirsch 154,865 D - 154,865 - -
727 F111-DSS-Park Forest-Monee Rd. & Western Ave. 140,391 D - 140,391 - -
728 F113-DSS-Harvey-147Th & Clinton St. 48,046 D - 48,046 - -
729 F115-DSS-Thornton Twp.-Halsted & I C Rr South Ridge Rd. 113,457 D - 113,457 - -
730 F121-DSS-Worth-111Th St. & Harlem Ave. 5,619 D - 5,619 - -
731 F122-DSS-Chicago Hts.-201St St. & Ashland Ave. 167,933 D - 167,933 - -
Docket No. 22-____ComEd Ex. 1.02
Page 126 of 176

WP 1618 of 26
Commonwealth Edison Company
2021 Communications Study
(In Dollars)
Line
No. Asset Location
Balance as of
12/31/2021
Primary
Function:
T vs D( T, D, or V )
Transmission
Dollars
Distribution
Dollars Split Dollars Remaining Dollars
732 F125-DSS-Oak Lawn-99Th St. & Cicero Ave. 134,404 D - 134,404 - -
733 F126-DSS-Dolton-146Th & Woodlawn Ave. 47,379 D - 47,379 - -
734 F12-DSS-Sauk Trail-Sauk Trail Rd.Half Mi.E State St. 159,674 D - 159,674 - -
735 F132-DSS-Steger-32Nd St. & Union 57,662 D - 57,662 - -
736 F149-DSS-Lynwood-Glenwood Dyer Rd. Half Mi. W Torrence Ave. 236,253 D - 236,253 - -
737 F16-DSS-Beecher-C M St. P Rr & Trim Creek 158,602 D - 158,602 - -
738 F24-DSS-Homewood-179Th St. & Park Ave. 181,674 D - 181,674 - -
739 F29-DSS-Park Forest-Monee Rd. & South Tampa St. 201,579 D - 201,579 - -
740 F30-DSS-Calumet City-435 State St. 136,702 D - 136,702 - -
741 F31-DSS-Riverdale-138Th & Stewart St. 34,319 D - 34,319 - -
742 F33-DSS-Dolton-144Th St. & C I & E Rr 193,338 D - 193,338 - -
743 F36-DSS-Goodenow-Goodenow Rd. & C M & St.P Rr 33,345 D - 33,345 - -
744 F375-ESS-Ford Motor Co.-U.S. Rt. 30 & Cottage Grove Ave. 325,359 D - 325,359 - -
745 F387-ESS-KTI Operations 1705 Cottage Grove Ave. Ford Heights Il 60411 Cook County USA 51,098 T 51,098 - - -
746 F41-DSS-Park Forest-Indiana Ave. & Rt. 30 37,766 D - 37,766 - -
747 F44-DSS-Burnham-State St. & Penn Rr 151,104 D - 151,104 - -
748 F45-DSS-Crete-4Th St. & Columbia St. 57,844 D - 57,844 - -
749 F54-DSS-Steger-Emerald St. Near Richton Rd. 92,118 D - 92,118 - -
750 F64-DSS-Blue Island-123Rd St. & California Ave. 36,244 D - 36,244 - -
751 F66-DSS-Oak Lawn-95Th St. & Central Ave. 19,760 D - 19,760 - -
752 F69-DSS-Evergreen Park-95Th St. At Kedzie Ave. 341,291 D - 341,291 - -
753 F73- DSS-Chicago Heights 97,567 D - 97,567 - -
754 F75-DSS-Homewood-186Th & Western Ave. 44,794 D - 44,794 - -
755 F79-DSS-Bloom 305 E Sauk Trail Rd, Chicago Heights, IL 132,427 D - 132,427 - -
756 F83-DSS-Harvey-148Th & Robey 302,850 D - 302,850 - -
757 F91-DSS-Chicago Hts.-Ashland Ave. & Michagan Central Rr 128,857 D - 128,857 - -
758 F96-DSS-Chicago Hts.-22Nd & East End Ave. 147,330 D - 147,330 - -
759 F98-DSS-Chicago Hts.-1205 Arnold St. 103,217 D - 103,217 - -
760 G128-DSS-Markham-160Th St. & Kedzie 337,805 D - 337,805 - -
761 G16-DSS-Blue Island-Hoyne Ave. & Fulton St. 146,525 D - 146,525 - -
762 G19-DSS-Tinley Park-171St St. & New England 26,450 D - 26,450 - -
763 G311-ESS-Robbins Resource-Robbins 11,743 V - - 11,743 -
764 G344-ESS-Ball Glass-13850 S. Cottage Grove Ave. Dolton Illinois 196,543 D - 196,543 - -
765 G3851-ESS-ACME STEEL 82,155 T 82,155 - - -
766 G3852-ESS-ACME STEEL 175,681 D - 175,681 - -
767 G394-ESS-F S C Paper Co.-131St St. & Crawford Ave. 173,365 D - 173,365 - -
768 G39-DSS-Oak Lawn-W 97Th St. S Komensky Ave. 55,413 D - 55,413 - -
769 G42-DSS-Worth Twp.-96Th & Avon 34,274 D - 34,274 - -
770 G78-DSS-Worth Twp.-87Th Pl. W Central Ave. 52,882 D - 52,882 - -
771 G81-DSS-Blue Island-Vermont & California Ave. 307,309 D - 307,309 - -
772 G82-DSS-Evergreen Park-96Th St. W. Maplewood 123,301 D - 123,301 - -
773 G88-DSS-Hometown-91St St. & Keating Ave. 23,110 D - 23,110 - -
774 G99-DSS-Palos Heights-123Rd St. W Harlem Ave. 44,010 D - 44,010 - -
Docket No. 22-____ComEd Ex. 1.02
Page 127 of 176

WP 1619 of 26
Commonwealth Edison Company
2021 Communications Study
(In Dollars)
Line
No. Asset Location
Balance as of
12/31/2021
Primary
Function:
T vs D( T, D, or V )
Transmission
Dollars
Distribution
Dollars Split Dollars Remaining Dollars
775 General-Miscellaneous-Fiber Opt-Inside Chicago 8,339,491 V 2,777,050 5,562,440 - (0)
776 General-Miscellaneous-Fiber Opt-Outside Chicago 70,681,757 V 45,165,643 25,516,114 - -
777 H10-DSS-Prairieville-1749 Mound Hill Rd. 191,687 D - 191,687 - -
778 H14-DSS-Sandwich-735 E. Center St 46,274 D - 46,274 - -
779 H18-DSS-Sterling-121 Wallace St. (Nw Steel & Wire Address) 212,480 D - 212,480 - -
780 H23-DSS-Fulton-619 17Th Ave. 184,493 D - 184,493 - -
781 H25-DSS-Sterling-Rt. 88 & St. Mary'S Rd. 280,731 D - 280,731 - -
782 H26-DSS-Morrison-1 Mi. S Morrison On Rte. 78 247,927 D - 247,927 - -
783 H27-DSS-Galt-13310 Galt Rd. 191,205 D - 191,205 - -
784 H28-DSS-Lyndon-8688 Bishop Rd. 165,416 D - 165,416 - -
785 H29-DSS-Morrison-211 Market St. 188,599 D - 188,599 - -
786 H36-DSS-Yorktown-300 E. Rt. 92 240,490 D - 240,490 - -
787 H38-DSS-Hooppole-25775 E. 2670 St. 190,694 D - 190,694 - -
788 H39-DSS-Mendota-4334 E. 4Th Rd. 182,016 D - 182,016 - -
789 H40-DSS-Walnut-211 Walnut St. 212,658 D - 212,658 - -
790 H41-DSS-Rock Falls-Mcneil Rd. 150,025 D - 150,025 - -
791 H426-ESS-STS HYDROPOWER (CO-GEN/Customer Owned) 34 V - - 34 -
792 H43-DSS-Amboy-1062 Corrigedor Rd. 221,598 D - 221,598 - -
793 H445-ESS-CITY OF ROCHELLE -2- Customer Owned 36,537 D - 36,537 - -
794 H44-DSS-Ohio-2030 E. Lon St. 317,375 D - 317,375 - -
795 H452-ESS-7831 McGirr Rd, Waterman IL 90,941 T 90,941 - - -
796 H471-ESS-Northwestern Steel & Wire Co.-Sterling 592,401 T 592,401 - - -
797 H47-DSS-Hinckley-One Mile South Of Hinckley 178,325 D - 178,325 - -
798 H49-DSS-Ashton-304 Brown Ave. 242,435 D - 242,435 - -
799 H50-DSS-Earlville-4517 E. 12Th Rd. 113,033 D - 113,033 - -
800 H52-DSS-Leland-330 Railroad Ave. 148,996 D - 148,996 - -
801 H53-DSS-Somonauk-Lafayette St. Near Green St. 162,739 D - 162,739 - -
802 H54-DSS-Waterman-Rte. 23 & Preserve Rd. 110,503 D - 110,503 - -
803 H55-DSS-Waterman-Second St. Near ' A' 185,803 D - 185,803 - -
804 H56-DSS-Shabbona-1-2 Mi. Se Of Shabbona 171,604 D - 171,604 - -
805 H57-DSS-Lee-11251 Tower Rd. 191,611 D - 191,611 - -
806 H59-DSS-Paw Paw-760 Moffett Rd. 152,344 D - 152,344 - -
807 H60-DSS-Sandwich-4750 Sandy Bluff Rd. 55,033 D - 55,033 - -
808 H62-DSS-Sterling-102 Broadway 796,565 D - 796,565 - -
809 H65-DSS-Plano-113 S. Lew Street 146,137 D - 146,137 - -
810 H66-DSS-Plano-CE ROW E/Little Rock Rd. 11,483 D - 11,483 - -
811 H67-DSS-Amboy-239 S. East Ave. 240,804 D - 240,804 - -
812 H70-DSS-Sublette-449 Inlet Rd. 208,513 D - 208,513 - -
813 H78-DSS-Dixon-324 East River St. 173,006 D - 173,006 - -
814 H91-DSS-Prophetstown-502 Woodlawn Dr. 177,973 D - 177,973 - -
815 Hennepin Station 1,640 T 1,640 - - -
816 J104-ESS-WM Renewable Energy, LLC 29,241 D - 29,241 - -
817 J13-DSS-Wauponsee Twp.-3401 Dwight Rd. 35,171 D - 35,171 - -
Docket No. 22-____ComEd Ex. 1.02
Page 128 of 176

WP 1620 of 26
Commonwealth Edison Company
2021 Communications Study
(In Dollars)
Line
No. Asset Location
Balance as of
12/31/2021
Primary
Function:
T vs D( T, D, or V )
Transmission
Dollars
Distribution
Dollars Split Dollars Remaining Dollars
818 J15-DSS-Elmwood-211 E. Spencer 330,179 D - 330,179 - -
819 J16-DSS-Eastern Ave.-516 S. Eastern Ave. 22,245 D - 22,245 - -
820 J17-DSS-Troy Twp.-Rte. 55 & C R I & P Rr 142,346 D - 142,346 - -
821 J18-DSS-Lockport-Clinton & 10Th Sts. 76,345 D - 76,345 - -
822 J19-DSS-Bruce Rd.-820 E. Bruce Rd. 98,839 D - 98,839 - -
823 J20A-DSS-Mississippi-Walter Strawn Dr-W/US53 (Elwood) 10,145 D - 10,145 - -
824 J21-DSS-Aux Sable-1-2 Mi. N Rt. 6 On Tabler Rd. 71,671 D - 71,671 - -
825 J23-DSS-Saratoga-S. Side of Nelson Rd-1/2 mile West of Rt 47 32,766 D - 32,766 - -
826 J24-DSS-Lisbon-Rt. 47 & Quarry Rd. 31,434 D - 31,434 - -
827 J25-1-DSS- JACKSON TOWNSHIP. 3,324 D - 3,324 - -
828 J28-DSS-Ridge Rd.-119 S. Ridge Rd. 52,888 D - 52,888 - -
829 J29-DSS-Route 47 & Gore Rd. 132,030 D - 132,030 - -
830 J310-ESS-Argonne National Laboratory-E Lemont Rd. & I 55 247,123 T 247,123 - - -
831 J31-DSS-Plainfield-Rt. 30 & Renwick Rd. 40,282 D - 40,282 - -
832 J326-ESS-Caterpilar Tractor Co.-S Rte. 6 1-2 Mi. Sw Joliet 129,006 D - 129,006 - -
833 J32-DSS-Kahler Rd.-Half Mi. S Kahler Rd. On W Side Rt.102 104,976 D - 104,976 - -
834 J3321-ESS-Uno-Ven Union Oil Co.-New Ave. Half Mi. N. 127Th St. 247,647 D - 247,647 - -
835 J3323-ESS-Uno-Ven Union Oil Co.-New Ave. Half Mi. N. 127Th St. 203,905 T 203,905 - - -
836 J339-ESS-AUX SABLE LIQUID PRODUCTS 79,794 D - 79,794 - -
837 J33-DSS-Washington St-1146 E. Washington St. 28,871 D - 28,871 - -
838 J367-ESS-CE STA9 AUX PWR 367,994 D - 367,994 - -
839 J3751-ESS-Quantum Chemical Co.-S. Rt. 6 W. Tabler Rd. 148,191 D - 148,191 - -
840 J38-DSS-Messenger Woods-13130 W. 174Th St. 11,148 D - 11,148 - -
841 J390-ESS-Mobil Oil-E I-55 S Desplaines River 529,268 D - 529,268 - -
842 J402-ESS-Airgas 1400 Cargo Ct., in Minooka 299,079 D - 299,079 - -
843 J49-DSS-Gougar Rd.-Rt. 7 & W Gougar Rd. 385,209 D - 385,209 - -
844 J53-DSS-Blodgett Rd.-Will-Grundy County Line Rd. N Kankakee River 92,897 D - 92,897 - -
845 J54-DSS-Lorenzo-County Line Rd. S Kankakee River 95,310 D - 95,310 - -
846 J55- DSS-Joliet-N Broadway 42,351 D - 42,351 - -
847 J58-DSS-Manhatten-170 Elwood Rd. 48,341 D - 48,341 - -
848 J60-DSS-New Lenox-321 E. Lincoln Hwy. 34,685 D - 34,685 - -
849 J62-DSS-Homer Twp.-17701 Gougar Rd. 37,166 D - 37,166 - -
850 J65-DSS-Seneca-Union St. & C R I & P Rr 112,891 D - 112,891 - -
851 J66-DSS-Gooselake-Half Mi. W Dresden Rd. On Pine Bluff Rd. 98,701 D - 98,701 - -
852 J67-DSS-Channahon Twp.-1-2 Mi. W I-55 On Durkee Rd. 29,510 D - 29,510 - -
853 J68-DSS-Coal City-700 S. Mazon St. 25,118 D - 25,118 - -
854 J69-DSS-Braidwood-460 S. Front St. 31,175 D - 31,175 - -
855 J76-DSS-Norman Twp.-Dupont Rd. 3 Half Mi. E Seneca 26,700 D - 26,700 - -
856 J81-DSS-Bell Ave.-950 N. Bell Ave. 39,988 D - 39,988 - -
857 J84-DSS-Cherry St.-Cherry St. & Jasper St. 51,842 D - 51,842 - -
858 J87-DSS-Lemont-Archer Ave. & Mccarthy 43,977 D - 43,977 - -
859 J88-DSS-Bluff St.-368 N. Bluff St. 46,900 D - 46,900 - -
860 J97-DSS-Joliet-50 W. Jackson St. 192,421 D - 192,421 - -
Docket No. 22-____ComEd Ex. 1.02
Page 129 of 176

WP 1621 of 26
Commonwealth Edison Company
2021 Communications Study
(In Dollars)
Line
No. Asset Location
Balance as of
12/31/2021
Primary
Function:
T vs D( T, D, or V )
Transmission
Dollars
Distribution
Dollars Split Dollars Remaining Dollars
861 K15-DSS-Warner Bridge-1 Mi. S. Rt. 113 43,190 D - 43,190 - -
862 K17-DSS-Peotone-4Th & Crawford 136,461 D - 136,461 - -
863 K18-DSS-Momence-Wilbur St. & Kankakee River 170,953 D - 170,953 - -
864 K19-DSS-Cemetary Rd-N S Redwood 1-4 Mi. E Boubreau St. 42,054 D - 42,054 - -
865 K20-DSS-Manteno-2Nd North St. & Near Locust 38,412 D - 38,412 - -
866 K23-DSS-Kankakee-5Th Ave. & N Y C Rr 97,590 D - 97,590 - -
867 K29-DSS-Bradley-South St. & I C Rr 72,517 D - 72,517 - -
868 K3192-ESS-BIRMINGHAM BOLT CO 257,809 D - 257,809 - -
869 K319-ESS-Birmingham Bolt Co.-S Rte. 50 At Mcknight Blvd. 64,299 D - 64,299 - -
870 K32-DSS-Aroma Park-Lowe Rd. & C C C & St. Louis Rr 33,537 D - 33,537 - -
871 K33-DSS-Kankakee-Locust & Hobbie St. 31,062 D - 31,062 - -
872 K34-DSS-Lehigh-Rt. 28 Near Leihigh Stone Company 39,045 D - 39,045 - -
873 K36-DSS-Herscher-4194 S.11000 W Road 32,692 D - 32,692 - -
874 K39-DSS-Exline Rd.-Bet. Exline Rd. & St. George 45,617 D - 45,617 - -
875 K40-DSS-1404-E-6000N-RD-Bourbonnais-Illinois 38,074 D - 38,074 - -
876 K42-DSS-East Kankakee-E I-57 & E Off Of Waldron Rd. 43,842 D - 43,842 - -
877 K44-DSS-Grant Park-E State Rte. 1 Ne Grant Park 35,856 D - 35,856 - -
878 K45-DSS-St. Anne-2 Mi. North & 1 Mi. East St. Ann 30,831 D - 30,831 - -
879 LAND-Corp-Ofc-Chicago Region-North-3500 N.California Ave. 18,128 D - 18,128 - -
880 LAND-Corp-Ofc-Joliet Region Hdq-1910 Briggs St. 10,424 V - - 10,424 -
881 LAND-Corp-Ofc-Northbrook Region Hdq-1000 Skokie Blvd. 7,039 D - 7,039 - -
882 LAND-TSS-Skokie-5100 Church Rd. 64,295 T 64,295 - - -
883 MASS-Commercial-Inside Chicago 41,629,358 D - 41,629,358 - -
884 MASS-Commercial-Outside Chicago 150,353,288 D - 150,353,288 - -
885 MWR01-MWR Eqp-Morrison -Microwave Site-Rte 78 1 Mi S Of Morrison 47,105 T 47,105 - - -
886 MWR02-MWR Eqp-Latham-Microwave Site-1 And A Half Mi W Of Latham 2,591,343 T 2,591,343 - - -
887 MWR05-MWR Eqp-Cooper-Microwave Site-Morton Twp-Tazewell Co 196,071 T 196,071 - - -
888 MWR08-MWR Eqp-Wasco -Microwave Site 81,545 T 81,545 - - -
889 MWR10-MWR Eqp-Seward-Microwave Site-Former German Valley-Steph. Co 136,162 T 136,162 - - -
890 MWR12-MWR Eqp-Campus-Microwave Site-Township Rd 2600 N & Township Rd 3500 E 1,569,167 T 1,569,167 - - -
891 MWR13-MWR Eqp-Compton-Microwave Site-Compton 300,635 T 300,635 - - -
892 MWR15-MWR Eqp-Kent -Microwave Site 127,028 T 127,028 - - -
893 MWR16-MWR Eqp-Loves Park 95,423 T 95,423 - - -
894 MWR17-MWR Eqp-Towanda-Microwave Site 1,232,316 T 1,232,316 - - -
895 MWR18-MWR Eqp-Wapella -Microwave Site 831,338 T 831,338 - - -
896 MWR20-MWR Eqp-17551 N.50 EAST RED DANVERS-Microwave Site 131,842 T 131,842 - - -
897 MWR21-MWR Eqp-2359 STATE ROUTE 116 BENSON-Microwave Site 129,422 T 129,422 - - -
898 NC 5636-ESS-O'Hare Airport-Terminal Area Rotunda 171,718 D - 171,718 - -
899 NC-DC-A24-North Chicago-1127 Broadway North Chicago 286,909 D - 286,909 - -
900 NC-DC-H76 South Dixon 2237 New Century Drive 151,519 D - 151,519 - -
901 R14-DSS-North-1007 Fulton Ave. 198,576 D - 198,576 - -
902 R16-DSS-Churchill-314 Churchill St. (Off Public Alley) 42,248 D - 42,248 - -
903 R18-DSS-Rockton-1688 N. Rockton Ave. 237,935 D - 237,935 - -
Docket No. 22-____ComEd Ex. 1.02
Page 130 of 176

WP 1622 of 26
Commonwealth Edison Company
2021 Communications Study
(In Dollars)
Line
No. Asset Location
Balance as of
12/31/2021
Primary
Function:
T vs D( T, D, or V )
Transmission
Dollars
Distribution
Dollars Split Dollars Remaining Dollars
904 R19-DSS-Acorn-708 N. Rockton Ave. 233,509 D - 233,509 - -
905 R21-DSS-Sunset-1988 School St. 224,311 D - 224,311 - -
906 R22-DSS-West-2229 Preston St. 202,893 D - 202,893 - -
907 R23-DSS-Beattie-531 N. 6Th St. 184,213 D - 184,213 - -
908 R24-DSS-Fourth Ave-811 4Th Ave. 281,207 D - 281,207 - -
909 R26-DSS-Eighteenth Ave-2224 18Th Ave. 229,521 D - 229,521 - -
910 R27-DSS-Michigan-763 Michigan Ave. 167,406 D - 167,406 - -
911 R35-DSS-Fourteenth St-1021 14Th St. 194,060 D - 194,060 - -
912 RP1-Tinley Woods-151 St & Harlem Ave 7,865 T 7,865 - - -
913 RP3-Pana Relay Pt Half Mi. N Of Pana-West Of I.C.R.R. 397,905 T 397,905 - - -
914 RP4-Brokaw-I.P. Co. Property-Brokaw-I.P. Co. Property 511,307 T 511,307 - - -
915 RP5-Garfield & Federal Terminal 298,587 T 298,587 - - -
916 S11-DSS-Rowe-N South St. W Wabash Rr 117,644 D - 117,644 - -
917 S12-DSS-Ransom-E. Campbell 74,761 D - 74,761 - -
918 S14-DSS-Kernan-1-2 Mi. S Kernan 159,564 D - 159,564 - -
919 S15-DSS-Toluca-50 W. Railroad St. 44,454 D - 44,454 - -
920 S16-DSS-Wenona-N. Center St. 173,697 D - 173,697 - -
921 S19-DSS-Tonica-Rt. 51 34,423 D - 34,423 - -
922 S20-DSS-Rutland-East Front St. 28,892 D - 28,892 - -
923 S21-DSS-Lostant-2 Mi. E & Half Mi. S Lostant 112,272 D - 112,272 - -
924 S25-DSS-Grand Rapids Twp.-6 Mi. E Grand Ridge On Grand RidgeRd. 93,691 D - 93,691 - -
925 S26-DSS-Blackstone-Rte. 170 1-2 Mi. S G M & O Rr 37,642 D - 37,642 - -
926 S27-DSS-Lowell-Center & Locust 40,887 D - 40,887 - -
927 S29-DSS-Grand Ridge-1-2 Mi. S Grand Ridge On Rt. 23 123,990 D - 123,990 - -
928 S35-DSS-Manville-S Rt 17 W Wabash Rr 187,265 D - 187,265 - -
929 S36-DSS-Verona-State Aid Rd. W Verona 128,704 D - 128,704 - -
930 S37-DSS-Bruce Twp.-2 Mi. N Streator Oakley Ave. & Cb& Q Rr 121,054 D - 121,054 - -
931 S38-DSS-Leonore-N. Gray St. 115,603 D - 115,603 - -
932 S39-DSS-Minonk-E Oak St. 1 Block N 8Th St. 46,901 D - 46,901 - -
933 S40-DSS-Lodemia-5 Mi. S & Half Mi. E Pontiac 151,884 D - 151,884 - -
934 S41-DSS-Eppards Point Twp.-3 Mi. S. & 1 Mi. E. Pontiac 120,178 D - 120,178 - -
935 S42-DSS-Cornell-2Nd & Prairie St. 171,210 D - 171,210 - -
936 S43-DSS-Odell-Front St. 49,570 D - 49,570 - -
937 S44-DSS-Streator-700 S. Illinois St. 231,744 D - 231,744 - -
938 S47-DSS-South Wilmington-Rice St. & Mazon River 24,982 D - 24,982 - -
939 S48-DSS-Streator-E First St. E North Otter Creek Rd. 157,235 D - 157,235 - -
940 S61-DSS-Streator 300 W. Cedar 298,403 D - 298,403 - -
941 S63-DSS-Gardner-105 E. Jefferson St. 102,430 D - 102,430 - -
942 S66-DSS-Pontiac-130 S. Chicago St. 301,425 D - 301,425 - -
943 S67-DSS-Mazon-Front St. 125,952 D - 125,952 - -
944 TDC499-13939-South-Weber-Road-Lockport 412,380 V - - 412,380 -
945 TSS-Arcadian-Wisconsin Electric Power Co 258 T 258 - - -
946 TSS-Benson-Illinios Power Co 493,863 T 493,863 - - -
Docket No. 22-____ComEd Ex. 1.02
Page 131 of 176

WP 1623 of 26
Commonwealth Edison Company
2021 Communications Study
(In Dollars)
Line
No. Asset Location
Balance as of
12/31/2021
Primary
Function:
T vs D( T, D, or V )
Transmission
Dollars
Distribution
Dollars Split Dollars Remaining Dollars
947 TSS-Decatur-Illinois Power Co 3,135 T 3,135 - - -
948 TSS-Dumont-Indiana-Michigan Power Co. 17,366 T 17,366 - - -
949 TSS-Oglesby-Illinios Power Co 1,757 T 1,757 - - -
950 TSS-Olive -Indiana-Michigan Power Co 205,012 T 205,012 - - -
951 TSS-St. John-Northern Indiana Public Service Co 203,541 T 203,541 - - -
952 TSS-Tazewell-Central Illinios Light Co 475,051 T 475,051 - - -
953 UNKNOWN-Miscellaneous-Obsolete-Unavailable 253,124 V - - 253,124 -
954 UNKNOWN-Unspecified ComEd 2,872,908 V - - 2,872,908 -
955 W102-DSS-Fabyan-Western Rd. & S C & N W Rr 115,782 D - 115,782 - -
956 W10-DSS-Fox River Heights-School & Fox River Rds. 222,409 D - 222,409 - -
957 W114-DSS-Aurora-Illinois Ave. & Lancaster Ave. 162,641 D - 162,641 - -
958 W115-DSS-Glenwood Park-Rt. 25 & C.A. & E. Rr 171,200 D - 171,200 - -
959 W118-DSS-Kendall Twp.-Rte. 71 Half Mi. E Rte. 47 300,007 D - 300,007 - -
960 W119-DSS-Bristol Twp.-E Rte. 47 N Faxton Rd. 149,755 D - 149,755 - -
961 W12-DSS-Yorkville-E Rt. 47 N Cb & Q Rr 187,456 D - 187,456 - -
962 W13-DSS-Little Rock-E Eldamain Rd. S North River Rd. 26,993 D - 26,993 - -
963 W148-DSS-Aurora Twp.-Liberty St. & Parkside Ave. 107,030 D - 107,030 - -
964 W152-DSS-Aurora-Kensington Pl. W. Highland Ave. 472,025 D - 472,025 - -
965 W16-DSS-Aurora Twp.-Indian Trial E. Randall Rd. 85,199 D - 85,199 - -
966 W17-DSS-West Sugar Grove-Rt. 71 S Oswego Rd. 27,636 D - 27,636 - -
967 W18-DSS-Sugar Grove Twp.-W Orchard Rd. S Jericho Rd. 85,761 D - 85,761 - -
968 W19-DSS-Blackberry Twp.-Nw Pouley Rd. & Keslinger Rd. 225,597 D - 225,597 - -
969 W202-DSS-St. Charles St.-Elgin St. & C M. St. Paul Rr 230,007 D - 230,007 - -
970 W209-DSS-Kimball St.-Kimball St. E Brook Ave. 31,872 D - 31,872 - -
971 W20-DSS-Lilly Lake-W Rte. 47 N Empire Rd. 165,604 D - 165,604 - -
972 W211-DSS-Plato Center-Plato Rd. & Muirhead Rd. 163,970 D - 163,970 - -
973 W216-DSS-Dundee Twp.-Lake Marion Rd. & Rte. 25 242,869 D - 242,869 - -
974 W218-DSS-Carpentersville-Riverlet & Washington Sts. 233,892 D - 233,892 - -
975 W233-DSS-Bartlett-Barlett Rd. & Onedia St. 28,606 D - 28,606 - -
976 W236-DSS-Roselle-E Roselle Rd. N Irving Pk. Rd. 48,360 D - 48,360 - -
977 W25-DSS-Pingree Grove-W Reinking Rd. S Highland 288,462 D - 288,462 - -
978 W26-DSS-Elgin-N Big Timber Rd. W Sleepyhollow Rd. 37,816 D - 37,816 - -
979 W28-DSS-Elgin Sunset Park-N Rt. 20 By-Pass Qtr Mi. E McleanBlvd. 24,605 D - 24,605 - -
980 W29-DSS-Winfield Twp.-S Butterfield Rd. E J & E Rr 136,371 D - 136,371 - -
981 W302-DSS-Warrenville-S Galusha Rd. On First Ave. 11,719 D - 11,719 - -
982 W304-DSS-Wheaton-E Naperville Rd. S C N W Rr 62,527 D - 62,527 - -
983 W30-DSS-Wheaton-Sunnyside Ave. Roosevelt Rd. 136,720 D - 136,720 - -
984 W31-DSS-Milton Twp.-N Harrison St. W Gary St. 77,746 D - 77,746 - -
985 W330-DSS-Glen Ellyn-Longfellow Ave. & Walnut St. 158,596 D - 158,596 - -
986 W331-DSS-Lombard-S Willow E Main St. 154,641 D - 154,641 - -
987 W332-DSS-York Twp.-W Grace St. N St. Charles Rd. 144,954 D - 144,954 - -
988 W333-DSS-Villa Park-N Central W Ardmore 145,879 D - 145,879 - -
989 W334-DSS-Villa Park-S Fairfield Ave. Half Mi. E Monterey Ave. 251,895 D - 251,895 - -
Docket No. 22-____ComEd Ex. 1.02
Page 132 of 176

WP 1624 of 26
Commonwealth Edison Company
2021 Communications Study
(In Dollars)
Line
No. Asset Location
Balance as of
12/31/2021
Primary
Function:
T vs D( T, D, or V )
Transmission
Dollars
Distribution
Dollars Split Dollars Remaining Dollars
990 W335-DSS-West Chicago-E Prince Crossing Rd. S Geneva Rd. 142,047 D - 142,047 - -
991 W336-DSS-Winfield-W County Farm Rd. S Jewell Rd. 58,798 D - 58,798 - -
992 W33-DSS-Wayne-S Army Trail Rd. E C A & E Rr 186,773 D - 186,773 - -
993 W340-DSS-Weisbrook-S Weisbrook Rd. & Leabrook Ln. 117,838 D - 117,838 - -
994 W342-DSS-Elmhurst-West Ave. & Second St. 102,759 D - 102,759 - -
995 W343-DSS-Elmhurst-N Butterfield Rd. E York Rd. 161,946 D - 161,946 - -
996 W345-DSS-Elmhurst-N First St. Alley E Larch Ave. 173,595 D - 173,595 - -
997 W346-DSS-Addison-W Addison Rd. N Lake St. 218,410 D - 218,410 - -
998 W348-DSS-Bensenville-Main St. Near Church Rd. 63,496 D - 63,496 - -
999 W349-DSS-Bensenville-Green St. 1-2 Mi. E. York Rd. 421,167 D - 421,167 - -
1000 W354-DSS-York Center-S Roosevelt Rd. E Meyers Rd. 112,903 D - 112,903 - -
1001 W35A-DSS-Udina-Plank Rd and US 20 26,858 D - 26,858 - -
1002 W38-DSS-Downers Grove Twp.-87Th St. Lemont Rd. 66,702 D - 66,702 - -
1003 W39-DSS-Wasco-N Rte. 64 S Burlington Rd. 370,584 D - 370,584 - -
1004 W407-ESS-Fermi-Fermi 710,872 D - 710,872 - -
1005 W41-DSS-Downers Grove-Ogden Rd. & Lacey Rd. 53,045 D - 53,045 - -
1006 W43-DSS-Downers Grove-S. Rodgers E. Prospect Ave. 188,814 D - 188,814 - -
1007 W44-DSS-Lisle-Yender & Ogden 30,717 D - 30,717 - -
1008 W468-ESS-MALLARD LAKE LANDFILL-TAD (RELAYS) ONLY 87,882 D - 87,882 - -
1009 W46-DSS-Lisle Twp.-Maple Rd. Half Mi. E Hoffman 185,702 D - 185,702 - -
1010 W48-DSS-Hinsdale-E Rt. 83 & S C B & Q Rr 150,301 D - 150,301 - -
1011 W499-ESS-Hoffer Plastics-500 Collins Ave. 115,196 D - 115,196 - -
1012 W50-DSS-Deerpath Rd.-Ceco Row Deerpath Rd. 238,511 D - 238,511 - -
1013 W51-DSS-Randall Rd.-W. Randall Rd. C.E.Co. Row 267,041 D - 267,041 - -
1014 W52-DSS-Lombard-E Highland Ave. S Maple 213,755 D - 213,755 - -
1015 W541-ESS-SW CORNER OF EOLA & DIEHL-2905 DIEHL 158,082 D - 158,082 - -
1016 W570-ESS-Ameritech-2600 Warrenville Rd. 64,299 D - 64,299 - -
1017 W600-ESS-Naperville-W Rte. 59 S Burlington NorthernRr 513,139 T 513,139 - - -
1018 W601-ESS-Naperville-Rte. 59 60,563 D - 60,563 - -
1019 W602-ESS-Naperville-Springbrook 63,809 D - 63,809 - -
1020 W603-ESS-Naperville-Royce 58,320 D - 58,320 - -
1021 W64-DSS-Downers Grove Twp.-Frontage Rd. (I-55) E Cass Ave. 251,679 D - 251,679 - -
1022 W71-DSS-Aurora-1449 N. Farnsworth Ave. 146,477 D - 146,477 - -
1023 W73-DSS-Blackberry Twsp.-DC at Bunker&Hughes, Kane County 88,231 D - 88,231 - -
1024 X300-DSS-Eastwood-2256 W. Eastwood 735,523 D - 735,523 - -
1025 X301-DSS-Belmont-5239 W. Belmont 667,562 D - 667,562 - -
1026 X304-DSS-Chase-7239 N. Western Av. 897,011 D - 897,011 - -
1027 X305-DSS-Seminary-3945 N. Seminary 374,789 D - 374,789 - -
1028 X307-DSS-Rosemont-6320 N. California 920,601 D - 920,601 - -
1029 X310-DSS-Albany Park-3145 W. Lawrence 856,118 D - 856,118 - -
1030 X311-DSS-Lehigh-7036 N. Lehigh 315,914 D - 315,914 - -
1031 X312-DSS-Newport-1044 W. Newport 867,282 D - 867,282 - -
1032 X313-DSS-Montrose-1058 W. Montrose 1,006,752 D - 1,006,752 - -
Docket No. 22-____ComEd Ex. 1.02
Page 133 of 176

WP 1625 of 26
Commonwealth Edison Company
2021 Communications Study
(In Dollars)
Line
No. Asset Location
Balance as of
12/31/2021
Primary
Function:
T vs D( T, D, or V )
Transmission
Dollars
Distribution
Dollars Split Dollars Remaining Dollars
1033 X315-DSS-Neva-6330 N. Northwest Hwy. 837,230 D - 837,230 - -
1034 X318-DSS-Merrimac-6254 W. North 807,211 D - 807,211 - -
1035 X319-DSS-Uptown-1124 W. Lawrence 914,670 D - 914,670 - -
1036 X368-DSS-Sauganash-6029 N. Pulaski 917,618 D - 917,618 - -
1037 X380-DSS-Wrightwood-2617 N. Pulaski 840,704 D - 840,704 - -
1038 X381-DSS-Cortland-2452 W. Homer 391,040 D - 391,040 - -
1039 X39 - DSS - Portgage 4540 W. Waveland Ave. 253,366 D - 253,366 - -
1040 X454-ESS-Chicago North Headquarters-3500 N. California Ave. 22,594 D - 22,594 - -
1041 X5305-ESS-RESURRECTION HOSPITAL 51,692 D - 51,692 - -
1042 Y062-ESS-CTA MILWAUKEE 848 D - 848 - -
1043 Y302-ESS-27th st vault 1,086,622 D - 1,086,622 - -
1044 Y308-DSS-Twenty-Eighth Street-2751 S. Pulaski Rd. 1,009,239 D - 1,009,239 - -
1045 Y310-DSS-Austin-5049 W. Madison 1,012,903 D - 1,012,903 - -
1046 Y314-DSS-Seventeenth Street-1701 W. Wabash 808,494 D - 808,494 - -
1047 Y323-ESS-Dupage Co. Water Commission-5555 W. Lexington 831 D - 831 - -
1048 Y365-DSS-Campbell-2543 W. Madison 1,232,103 D - 1,232,103 - -
1049 Y5181-ESS-Illinois-Public Aid-300 W. Pershing Rd. 19,691 D - 19,691 - -
1050 Y518B-ESS-Link Belt Co.-300 W. Pershing Rd. 13,447 D - 13,447 - -
1051 Y6424-ESS-Cook County-2600 S. California Ave. 4,430 D - 4,430 - -
1052 Y652-ESS-University Of Illinois-601 S. Morgan St. 178 D - 178 - -
1053 Y701-ESS-H Kramer & Co.-1347 W. 21St St. 6,756 D - 6,756 - -
1054 Y7642-ESS-QTS Data Center 4,253 D - 4,253 - -
1055 Y869-ESS-Boulevard Towers North-225 N. Michigan Ave. 52,840 D - 52,840 - -
1056 Y9511-ESS-First National Bank Plaza-33 S. Clark St. 193,720 D - 193,720 - -
1057 Y986-ESS-Board Of Trade-141 W. Jackson St. 187,604 D - 187,604 - -
1058 Z028-ESS-CTA ARCHER 36,276 D - 36,276 - -
1059 Z100-ESS-Tower Automotive Plant-12700 Crandolet-Chicago 406,902 V - - 406,902 -
1060 Z300-DSS-Archer-5161 S. Archer 478,429 D - 478,429 - -
1061 Z302-DSS-Ewing-10425 Ewing Ave 295,530 D - 295,530 - -
1062 Z305-DSS-Keating-4717 W. 63Rd St. 284,953 D - 284,953 - -
1063 Z306-DSS-Narragansett-5521 S. Narragansett 566,967 D - 566,967 - -
1064 Z307-DSS-Oak Park-60Th & Oak Park Ave. 209,222 D - 209,222 - -
1065 Z310-DSS-Drexel-912 E. 87Th St. 423,642 D - 423,642 - -
1066 Z312-DSS-Exchange-7323 S. Exchange Ave. 338,023 D - 338,023 - -
1067 Z314-DSS-Justine-79Th & Justine Sts. 479,813 D - 479,813 - -
1068 Z315-DSS-Burnside-9440 S. Cottage Grove Ave. 256,810 D - 256,810 - -
1069 Z335-DSS-South Chicago-9347 S. Chicago Ave. 602,790 D - 602,790 - -
1070 Z501-ESS-West Pullman-1201 W 120th St, Chicago, IL 60643 25,072 D - 25,072 - -
1071 Z50934-ESS-U OF C 1155 E 60TH ST 8,804 D - 8,804 - -
1072 Z5242-ESS-Calumet Treatment Plant-400 E. 130Th St. 36,170 T 36,170 - - -
1073 Z524-ESS-METRO SANITARY 359,368 D - 359,368 - -
1074 Z52-ESS-Ford Motor Co.-12100 S. Torrence Ave. 95,192 D - 95,192 - -
1075 Z550-ESS-CTA 55TH STREET 111,047 D - 111,047 - -
Docket No. 22-____ComEd Ex. 1.02
Page 134 of 176

WP 1626 of 26
Commonwealth Edison Company
2021 Communications Study
(In Dollars)
Line
No. Asset Location
Balance as of
12/31/2021
Primary
Function:
T vs D( T, D, or V )
Transmission
Dollars
Distribution
Dollars Split Dollars Remaining Dollars
1076 Z715-ESS-REPUBLIC STEEL 444,787 D - 444,787 - -
1077 Z725-ESS-FINKL STEEL 154,395 D - 154,395 - -
1078 Grand Total 1,106,126,006$ 281,110,459$ 622,679,395$ 202,336,152$ (0)$
2018 2019 2020 2021
1079 Total 912,014,044 957,458,028 1,041,637,029 1,106,126,006
1080 FERC Form 1 (FF1 p.207) 912,014,042 957,458,027 1,041,637,029 1,106,126,006
1081 Difference 2 1 0 0
1082 Total Transmission 245,333,503 244,074,605 265,909,264 281,110,459
1083 Total Distribution 476,975,957 523,962,835 576,356,812 622,679,395
1084 Total Blanks - - - (0)
1085 Total Various 189,704,584 189,420,587 199,370,952 202,336,152
1086 Total 912,014,044 957,458,028 1,041,637,029 1,106,126,006
1087 Total Cost At Locations With Primary Function of Transmission 245,333,503 244,074,605 265,909,264 281,110,459
1088 Total Cost At Locations With Primary Function of Distribution 476,975,957 523,962,835 576,356,812 622,679,395
1089 Total 722,309,460 768,037,440 842,266,077 903,789,854
1090 Percentage of Cost At Transmission Sites 33.97% 31.78% 31.57% 31.10%
1091 Percentage of Cost At Distribution Sites 66.03% 68.22% 68.43% 68.90%
Docket No. 22-____ComEd Ex. 1.02
Page 135 of 176

WP 18Page 1 of 16
Commonwealth Edison Company
Construction Work in Progress
As of December 31, 2021
(In Thousands)
Line Jurisdictional
No. CWIP Balance
(B)
1 Actual balance of Distribution Plant-Related
2 Construction Work in Progress (CWIP) upon3 which AFUDC has not been capitalized 42,206$
Description
(A)
Docket No. 22-____ComEd Ex. 1.02
Page 136 of 176

WP 18Page 2 of 16
LineNo.
DistributionProject ID Description
CWIP Amount as of 12/31/2021
(A) (B) (C)
1 10NBD001 Traditional Family Diaries 14
2 12NBD015 40 E Garfield - Data Center 24,527
3 14FRD232 Lynwood - Joe Orr Rd - Torrenc 7,1254 16CMD036 EM 212B UP Grade CP Sys 26,567
5 16CMD037 EM 298C UP Grade CP Sys 667
6 16FRD108 Kane County - Bunker Rd Extens 12,027
7 EOCNEWAS New Com OHService Outside Chgo (0)
8 EORNEWAS New Res OHService Outside Chgo 09 17CMD005 EM 794A Add CP system 133,730
10 17SPD268 L15003/04/05 Cable Replacement 268,315
11 17FRD123 Orland Park-159th St & 84th St 0
12 17FRD164 VILLAGE OF WESTMONT - E. BURLI 7,637
13 18CMS004 TSS123 REPLACE SWITCH (L12367) 1614 18CMS061 TSS60 REPLACE INSULATORS 34,866
15 18FRD038 EOWA N06 Relocation 8,309
16 BCMD017C Distribution C-Truss Chicago (6,359)
17 BCMD017S Distribution C-Truss Suburbs (19,077)
18 18SPD523 Underground Line Sensors 343,43919 17SPD263 DSM Line Clear X3941 G AM Bu2 18,085
20 17SPD266 DSM Line Clear Y84052 G AH Bu4 21,076
21 18CMS280 TSS60 REPLACE CB G6074 55,847
22 18CMS281 TSS60 REPLACE CB G6083 32,238
23 18CMS388 TSS162 REPLACE SWITCH 124,21224 19CED345 FEJA Solar Q18-00848 5,653
25 19CED352 FEJA Solar Q17-00284 Pretzel 1,270
26 19CED355 FEJA Solar Q17-00481 Prophet (2,156)
27 19CED357 FEJA Solar Q17-1889 Cattail 19,013
28 19CED372 FEJA Solar Q18-00528 BrushCree 15929 19CED383 FEJA Solar Q17-00541 Woodland (209,396)
30 19CED384 FEJA Solar Q18-00297 Kirkland 1,371
31 19CED389 FEJA Solar Q18-02394 Sycamore 1,440
32 19CED396 FEJA Solar Q17-00597 Segunda 2 (15,918)
33 19CMS004 DCW340 REPLACE FENCE 72,57434 19CMS01WC TDC570 Replace CB Vac 57,941
35 19CMS023 SS311 REPLACE DISCONNECT 95,311
36 19CMS025 DSS311 REPLACE ARRESTORS 2,384
37 19CMS026 DSS311 REPLACE ARRESTORS 3,884
38 19CMS044 TSS76 REPLACE POWER SWITCH 9,63139 19CMS091 ESSJ328-2 Apollo WD PL RPLC 16,097
40 19CMS093 ESSJ380 Filtration WD PL RPLC 290
41 19CMS100 SS462 Dwight WD PL RPLC 6,101
42 19CMS150 SS311 L31157 RPLC ARRESTOR 748
43 19FRD010 City of Naperville - Ogden Ave 144 19FRD011 City of Naperville 1
45 19FRD012 City of Naperville-CHARLES AVE 1
46 19FRD013 City of Naperville-CASE & VEST 3
47 19FRD031 FR - Miller Road Roadway 12,873
48 19FRD088 FR-ELMHURST YORK ST ALLEY BURI (0)49 19NBD026 167 N Green St - Relo Part II 656,686
50 19NBD211 Lincoln Yards - Relo Phase 4 244,695
51 19SPD031 ATO- Greenspoint 43301404S 680
52 19SPD102 2019 Mainline X8440 Cbl Repl 26,577
53 19SPD278 2019 Mainline Z17476 Cbl Repl 62,83754 19SPS115 IP^2 Line Breaker Prgm TDC440 2,628
Commonwealth Edison Company
Distribution CWIP Projects Not Accruing AFUDC
As of 12/31/2021
Docket No. 22-____ComEd Ex. 1.02
Page 137 of 176

WP 18Page 3 of 16
LineNo.
DistributionProject ID Description
CWIP Amount as of 12/31/2021
(A) (B) (C)
Commonwealth Edison Company
Distribution CWIP Projects Not Accruing AFUDC
As of 12/31/2021
55 19SPS141 IP^2 Line Breaker Prgm TDC452 2,184
56 19SPS142 IP^2 Line Breaker Prgm TSS182 3,665
57 19SPS146 IP^2 Line Breaker Prgm TSS162 2,93258 19SPS151 IP^2 Line Breaker Prgm TSS46 4,292
59 19CED405 FEJA Solar Q18-01013 Gala (7,656)
60 19NBD216 154 N Damen- 2nd Feed (52,082)
61 19CED417 FEJA Solar Q18-00710 Dodds (4,661)
62 17CMD036 EM-268A1A new Pos Header 60963 17NBD729 Oakbrook Center - Macy's Vault 14,859
64 17SPD250 DSM Line Clear C4718 Gr AC Bu2 284
65 17SPD278 DSM Line Clear A660 AQ B2 23,880
66 18CMS230 DCH29 REPLACE RECLOSER 16,845
67 18CMS231 DCH29 REPLACE RECLOSER 25,18168 18CMS232 DCH29 REPLACE RECLOSER 151,301
69 18CMS237 DCX310 Replace Entire HVAC 8,192
70 19CMS027 DSS311 REPLACE ARRESTORS 746
71 19CMS330 TSS37 Natoma Rplc Switch 53,325
72 19SPD396 IP^2 ML CBL REPL L8868 78,51973 19SPD397 IP^2 ML CBL REPL L8864 581,602
74 19TPA021 820 W Dickens Ave (1,669)
75 20CED001 FEJA Solar Q18-00324 Paw Paw (368)
76 20CED005 FEJA Q18-00118 Chicago Heights 15,747
77 20CED064 FEJA Q18-01552 Burlington 1,56478 20CED066 FEJA Solar Q18-00657 Briscoe1A 7,471
79 20CED067 FEJA Solar Q18-00656 Briscoe2A 6,784
80 20CED115 FEJA Solar Q18-00603 SunVest (4,991)
81 20CED125 FEJA Q19-08535 Magid Glove 17
82 20CED176 FEJA Solar Q19-05346 G&W Solar 18883 20CED193 FEJA Q18-01620 Sauger 2 Solar 1,314
84 20CED292 FEJA Q18-00339 Prophetstown 531
85 20CMD001 EM-455 MAG Install MAG Anodes 8,492
86 20CMD022 EM568A Install new Anodebed 321
87 20CMS073 TSS59 Rpl Aux Transformers 151,35688 20CMS090 ESSG314-1 REPLC POWER SWITCH 12,951
89 20CMS096 DCE17 REPLACE DISCONNECT 37,989
90 20CMS115 DCZ310 Rplc Disconnects 287,981
91 20CMS13SC ESSK320 REPLACE CIRCUIT SWITCH 31,936
92 20CMS149 TDC570 REPLACE DISCONNECT 26,98393 20CMS204 STA13 Rpl BT1-2 DS SW 30,175
94 20CMS209 DCZ314 Rpl Swcthgr Asbly 18,825
95 20CMS20CC TSS150 TR73 Cbl Rpl 16,985
96 20CMS20SC TSS72 REPLACE POWER SWITCH 10
97 20CMS450 DC E35 pole replacement 25,70398 20CMS451 DC E71 pole replacement 18,227
99 20CMS452 DC W336 pole replacement 41,437
100 20CMS453 ESS J373 pole replacement 14,444
101 20CMS454 ESS J391 pole replacement 16,445
102 20CMS455 ESS W496 pole replacement 17,592103 20CMS456 ESS W524 pole replacement 37,072
104 20CMS457 SS514 pole replacement 17,176
105 20CMS459 TDC 557 pole replacement 11,461
106 20CMS500 TDC387 pole replacement 512
107 20CMS501 ESS E43 pole replacement 19,712108 20CMS503 TDC416 pole replacement 22,369
Docket No. 22-____ComEd Ex. 1.02
Page 138 of 176

WP 18Page 4 of 16
LineNo.
DistributionProject ID Description
CWIP Amount as of 12/31/2021
(A) (B) (C)
Commonwealth Edison Company
Distribution CWIP Projects Not Accruing AFUDC
As of 12/31/2021
109 20CMS504 TDC595 pole replacement 26,405
110 20CMS505 ESS E403 pole replacement 280
111 20CMS55WC TSS194 REPLACE DISCONNECT 15,174112 20CMS79WC TDC581 Replace Relay 1,335
113 20FRD019 67353: MWRD LASMA Dock Overhe 3,877
114 20FRD028 EOWA Northwest Ave 4458 Sig 2
115 20FRD042 EOWA NO6 B&M OH to UG 13
116 20FRD051 EOWA 4712 Franklin OVHD to UG 6,775117 20NBD007 Oaktrace Retirement Phase 2 172,154
118 20NBD012 OPTIMA WILMETTE NEW SERVICE 12,496
119 20NBD117 1200 W Fulton Relo 274
120 20NBD135 FOX VALLEY MALL REVISION 256,975
121 20NBD600 Avenu O Relocation and Demo 23,480122 20NBD912 CTA Haymarket Station Perm 11,953
123 20NBS010 Winnetka ESS-C434 Relay Upgd 223,456
124 20SPD084 IP2 PCKT RELIAB L10643/L43357 16,530
125 20SPD098 2020 Mainline X1432 Cbl Repl 279,895
126 20SPD306 2020 Mainline Z80251 Cbl Repl 401,391127 20SPD312 2020 Mainline 300X043 Cbl Repl 16,196
128 20SPD557 12 kV DA Baseline A3425 9,850
129 20SPD560 12 kV DA Baseline A667 13,468
130 20SPD618 IP^2 L12967 D6789-MH 436352006 842,174
131 20SPD628 IP^2 2020 IP2 - C1318 (1280ft) 39,618132 20SPD629 IP^2 2020 IP2 - C1318 (360ft) 2,738
133 20SPD632 IP^2 2020 IP2 - C049 14,031
134 20SPS028 DCS21 Lostant TR1 Pad 602
135 20SPS068 DCW236 Roselle TR1 Oil Pit (78,848)
136 20SPS150 ESSA468 NORTHSH Switch Replace 17,836137 20SPS168 TSS 77 Mazon IP2 Brkr Replace 2,273
138 20SPS170 TSS77 Mazon 3 IP2 Brkr Replace 2,707
139 20SPS171 TSS77 Mazon 4 IP2 Brkr Replace 3,921
140 20SPS175 DCC18 DesPlaines TR1 Barrier 1,001
141 20SPS176 TDC446 Lansing TR71 Barrier 19,642142 20SPS239 IP^2 Bkr Repl Lena L18039 1,596
143 20SPS270 IP^2 Bkr Repl Skokie FDR C810 301
144 20SPS272 IP^2 Bkr Repl Skokie FDR C86 301
145 20SPS273 IP^2 Bkr Repl Skokie FDR C87 302
146 20SPS274 IP^2 Bkr Repl Forest Park D577 1,536,359147 20SPS275 IP^2 Bkr Repl Forest Park TR 3 171,111
148 20SPS276 IP^2 Bkr Repl Forest Park D578 147,482
149 20SPS277 IP^2 Bkr Repl ForestPark L5730 141,017
150 20SPS278 IP^2 Bkr Repl Forest Park D570 204,359
151 20SPS279 IP^2 Bkr Repl Forest Park D576 161,781152 20SPS361 ESS-C-480 ALLSTATE SWITCH REPL 54,394
153 20SPS362 ESS-C-480 ALLSTATE SWITCH REPL 55,037
154 20TPA036 2829 N MOZART ST 0
155 20CED297 FEJA Q18-01042 Speedway Solar (73,134)
156 20CED298 FEJA Q18-01776 Goodrich Solar2 13,792157 20CED333 FEJA Q18-02220 Kankakee Solar2 3,528
158 20CED342 FEJA Q17-00633 Mazon Solar 1,685
159 20CMS435 TSS131 Rpcl Aux TR24 135,856
160 20CMS859 TDC570 REPLACE RELAY 29
161 20FRD069 ISTHA I294@Hinsdale Pole Repla 8162 20FRD078 EOWA UP01 & S08/09 (OVHD&UG) 17
Docket No. 22-____ComEd Ex. 1.02
Page 139 of 176

WP 18Page 5 of 16
LineNo.
DistributionProject ID Description
CWIP Amount as of 12/31/2021
(A) (B) (C)
Commonwealth Edison Company
Distribution CWIP Projects Not Accruing AFUDC
As of 12/31/2021
163 20SPD553 12 kV DA Baseline C471 12,340
164 20SPS098L Norridge Security Lighting 298
165 20SPS298 ESS-D-535 BORG WAR SWITCH REPL 48,318166 20SPS580 TDC384 HARRISON AVE BITE#56206 128,452
167 DCAC1204B L10805 L10806 Dist Rerouting 4
168 17CMS240 DCW331 Replace Power Switch 20,583
169 20CES122 VO West TDC375 Relay/SCADA 145,977
170 20CMS822 TDC375 REPLACE CABLE 18,153171 20NBD168 HELEN RD RELO MAINLINE INSTALL 13,890
172 20NBD184 NBSW LINCOLN HWY MAINLIE INST 36,372
173 20NBD207 2306 S INDIANA AVE - HOTEL 171,620
174 20SPD566 12 kV DA IP2 B8307 85,919
175 20SPD649 IP^2 2020 IP2 Cbl - A425/A423 10,990176 20SPD743 12 kV DA IP2 A6614 84,282
177 20SPD744 12 kV DA IP2 W061 16,792
178 20SPS172 TDC 452 GLENWOOD RELAY UPGRADE 41,728
179 20SPS206 TDC581 FRONTENAC BITE 54175 3,613
180 20SPS467 Relay Upgrade 12kV TSS57-D570 20,983181 20SPS468 Relay Upgrade 12kV TSS57-D576 20,357
182 20SPS472 Relay Upgrade 12kV TSS57-TR 3 20,357
183 20SPS571 HDQTC MAYWOOD BITE #53477 2,299
184 20SPS590 DETECTION-TSS 52 Hawthorne 9,466
185 20SPS592 DETECTION-TSS 31 Galewood 6,849186 20SPS593 DETECTION-TSS 150 Calumet Nort 6,547
187 20SPS594 DETECTION-TSS 150 Calumet Sout 6,547
188 20SPS595 DETECTION-TSS 172 Golf Mill 6,547
189 20SPS596 DETECTION-DSS750 Cragin 9,568
190 20TPA108 9518 S PAXTON AVE 10,032191 19CMS136 TSS145 Replace Bus 40,261
192 19FRD115 Woodstock South /Madison/Lake 3,871
193 20CED336 FEJA Solar Q18-00045 BQ Energy 2,768
194 20CED349 FEJA Solar Q18-00672 Rich Dev. 5,849
195 20CED351 FEJA Solar Q18-03968 Winnebago 3,451196 20CES070 Sta21 Kin Opt Meter Unt Rplc 153,969
197 20CES072 Sta21 Kincaid Opt Mtr 2 64,115
198 20CMS629 TDC465 REPLACE RELAY 10,101
199 20CMS633 ESSG385-1 REPLACE ARRESTERS 2,433
200 20CMS829 DCW26 REPLACE DISCONNECT 8,115201 20CMS872 TDC563 REPLACE RECLOSER 39
202 20CMS880 TSS139 REPLACE CIRCUIT SWITCHR 171,320
203 20CMS881 TSS165 REPLACE POWER SWITCH 79,760
204 20FRD107 FR-EOWAS03 Franklin Ave/Green (0)
205 20NBD151 VERIZON WIRELESS HICKORY HILLS 14,688206 20NBS011 CITGO - 138kV ESS J332 Relocat 1,066
207 20SPD466 IP2 BF-TDC253 SCHAUMBURG 8,889
208 20SPD510 12 kV DA Baseline B7506 1,378
209 20SPD561 12 kV DA Baseline W192 9,372
210 20SPD562 12 kV DA Baseline C4614 1,375211 20SPD614 IP^2 ML CBL REPL C933 42,115
212 20SPD740 12 kV DA IP2 C123 1,484
213 20SPD745 12 kV DA IP2 J4971 32,085
214 20SPS198 TSS87 12kV X8737 Spot Vault 38,874
215 20SPS199 TSS87 12kV X8738 Spot Vault 30,871216 20SPS200 SS553 Hinsdale Bite 54302 42,629
Docket No. 22-____ComEd Ex. 1.02
Page 140 of 176

WP 18Page 6 of 16
LineNo.
DistributionProject ID Description
CWIP Amount as of 12/31/2021
(A) (B) (C)
Commonwealth Edison Company
Distribution CWIP Projects Not Accruing AFUDC
As of 12/31/2021
217 20SPS210 TDC439 ROCKDALE BITE 55227 6,685
218 20SPS269 IP^2 Bkr Repl Skokie FDR C80 301
219 20SPS271 IP^2 Bkr Repl Skokie FDR C82 301220 20SPS290 TSS87 12kV X8743 Spot Vault 37,213
221 20SPS291 TSS87 12kV X8749 Spot Vault 28,826
222 20SPS469 Relay Upgrade 12kV TSS57-D577 19,551
223 20SPS470 Relay Upgrade 12kV TSS57-D578 19,955
224 20SPS471 Relay Upgrade 12kV TSS57-L5730 19,955225 20SPS556 ESSK319-2 NUCOR STEEL BITE5572 70,397
226 20SPS558 DCX368 SAUGANASH BITE51159 71,477
227 20SPS560 SS679 BESLEY BITE 51253 82,198
228 20SPS564 ESSZ514 68TH ST PUMPING STN 44,059
229 20SPS568 SS895 MARSHFIELD BITE #52238 77,616230 20SPS569 SS851 WASHTENAW BITE #52157 121,269
231 20SPS700 Spare TR 40 MVA B n H #2 1,209,980
232 21CED009 6P220401-Upgrade UG cable 4,014
233 21CED015 FEJA Solar Q20-02532 159
234 21CED021 7P220645 - low voltage H661 97,807235 21CED024 7P220646 - low voltage B2302 93,149
236 21CED035 4P220403 - Reconductor 4,000' 109,457
237 21CED042 4P220400-Relieve A9421 w/A9423 1,062
238 21CED063 FEJA Solar Q17-00475 Miacomet 690
239 21CED064 FEJA Solar Q18-01268 Long CS1 762240 21CED070 FEJA Solar Q20-11479 Richardso (32,003)
241 21CED079 Q20-09223 Marengo Solar 1 690
242 21CED080 Q20-09229 Marengo Solar 2 692
243 21CED081 Q20-09165 Cherry Valley Solar 713
244 21CED250 FEJA Solar Q18-00657 Briscoe1A 36245 21CED271 FEJA Solar Q20-09034 Gar Creek 5,413
246 21CED272 FEJA Solar Q20-09036 GarCreek2 20,928
247 21CED302 1P220413-Relieve 7% OL Y71461 6,249
248 21CM100SC TDC436 REPLACE TR GAS ANALYZER 0
249 21CM101CC Emergent Sub-Sta Pre-set -Chic 1250 21CMD012 NEW CP 446292-14 A 18,659
251 21CMD017 Replace L1127 Termination 0
252 21CMD020 Replace L1125 Termination (0)
253 21CMD023 DCR26 REPLACE TR BANK 22,231
254 21CMD120 L69al1 Install CTRUSS 11,236255 21CMD128 L69sk1 Install CTRUSS 3,723
256 21CMD140 L69SK1 Insulators/Pole/Wire 3,092
257 21CMD141 L69AL1 Ins/Crossarm/Pole/Wire 21,386
258 21CMD142 L69AL4 Insl/Crossarm/Pole/Wire 16,477
259 21CMS010 DCZ302 Rpl Driveway 272260 21CMS016 TDC784 TR71 Rplc I&C cable 79,514
261 21CMS022 DCZ305 TR1 Cable Repl 22,849
262 21CMS028 TSS89 L7611&7612 Rpl Relay 6,215
263 21CMS105 TDC745 Bay 71-2 Fan Rpl 23,662
264 21CMS106 TDC784 Install Tank Structure 134,793265 21CMS117 SS691 TR1 Rplacement (14,568)
266 21CMS127 STA13 Rpl BT724 & 246 Disconne 8,534
267 21CMS141 TSS114 Rpl Disconnect Switch 49,546
268 21CMS143 TSS137 Rpl Insulators 1,551
269 21CMS154 TSS52 Rpl Indoor Lighting 39,593270 21CMS157 STA11 RPL CALISTO 14,848
Docket No. 22-____ComEd Ex. 1.02
Page 141 of 176

WP 18Page 7 of 16
LineNo.
DistributionProject ID Description
CWIP Amount as of 12/31/2021
(A) (B) (C)
Commonwealth Edison Company
Distribution CWIP Projects Not Accruing AFUDC
As of 12/31/2021
271 21CMS165 TDC784 Cable/Conduit Install 50,044
272 21CMS168 TDC648 Rpl Xfrmr Firewall 65,401
273 21CMS169 DCD133 Rpl Battery Charger 2,837274 21CMS170 TSS64 Rpl CCVTs 643
275 21CMS172 DCD175 Rpl Battery Charger 3,495
276 21CMS174 TSS49 Replace ATO 4,569
277 21CMS255 TSS131 BT3-4 RPLC PWR SWITCH 45,887
278 21CMS259 TDC207 TR71 REPLC CABLE 15,793279 21CMS261 TSS120 12kV RPLC CABLE 12,988
280 21CMS274 TDC566 BT 3-4 RPC PWR SWTCH 11,468
281 21CMS281 TDC237 RPLC Bldg Lights 3,732
282 21CMS284 TSS120 E BUS 4 REPLC PWR SWT 42,261
283 21CMS294 TSS135 REPLC BLDG LIGHTS 17,482284 21CMS296 DSS514 REPLACE SWITCHES 22,602
285 21CMS299 DCW236 RPLCE PWR SWITCH 3,887
286 21CMS300 TDC565 TR71 REPLC C/S 14,072
287 21CMS301 TSS120 L12015 RPLC DIS SWTCH 4,182
288 21CMS302 TDC565 TR72 RPLC CIR SWITCHER 14,496289 21CMS304 TDC562 L12016 REPLC CIRC SWITC 6,547
290 21CMS305 TDC206 L4605 REPLC CIRC SWITCH 17,987
291 21CMS306 TDC248 TR71 REPLC PWR SWITCH 577
292 21CMS310 TDC565 RPLC VAC CB 29,374
293 21CMS312 DCE69 INST FIREWALL/OIL PIT 32,061294 21CMS313 TDC562 TR71 REPLC RADIATOR 45,531
295 21CMS315 STA16 L1664 Replc Arrestors 6 1,124
296 21CMS320 TDC253 TR71 RPLC RELAY 17,657
297 21CMS328 TDC566 TR72 RPLC Cable 366,203
298 21CMS329 TSS145 12KV CAP 2 RPLC 32,856299 21CMS330 TSS145 CAP 1 REPLC CAP BANK 11,181
300 21CMS400 DCC79 TR1 REPLC 4 RADIATORs 40,501
301 21CMS44SC Emergent Sub-Sta Pre-set-SOUTH 0
302 21CMS45NC DSS501 REPLACE PWR SWTCH/VCB 0
303 21CMS47NC DSS501 L12065 TR52 INSTL CABLE 269,218304 21CMS501 STA1 REPLACE CIRCUIT SWITCHER 82,546
305 21CMS513 TDC469 REPLACE POWER SWITCH 4,397
306 21CMS526 ESSJ108-3 INSTALL FANS 1,854
307 21CMS532 DCG16 REPLACE RELAY 24,413
308 21CMS533 ESSK346 REPLACE BUSHINGS 15,500309 21CMS538 TDC431 REPLACE RELAY 106
310 21CMS539 TSS70 REPLACE CABLE 3,393
311 21CMS53SC TSS136 REPLACE LTC (TR 73) 6,135
312 21CMS540 TDC550 REPLACE CCVT (L5104) 19,476
313 21CMS554 TDC580 Rpl Indoor Lighting 14,286314 21CMS556 TDC593 Rpl Indoor Lighting 20,878
315 21CMS567 TSS93 REPLACE CTs (L97601) 2,257
316 21CMS574 DCF17 REPLACE POWER SWITCHES 1,793
317 21CMS575 TDC487 REPLACE CIRCUIT SWITCHE 12,121
318 21CMS579 DSS460 REPLACE TR 11,117319 21CMS61SC TSS76 REPLACE TR 4,081
320 21CMS756 ESSB427 Replace Disconnect 40,021
321 21CMS75SC TSS116 REPLACE TR MONITOR T83 14,215
322 21CMS781 TSS111 Replace Lights & Cable 12,291
323 21CMS787 TSS 121 Replace Disconnect 25,789324 21CMS792 DCB90 REPLACE DISCONNECT 23,703
Docket No. 22-____ComEd Ex. 1.02
Page 142 of 176

WP 18Page 8 of 16
LineNo.
DistributionProject ID Description
CWIP Amount as of 12/31/2021
(A) (B) (C)
Commonwealth Edison Company
Distribution CWIP Projects Not Accruing AFUDC
As of 12/31/2021
325 21CMS797 DCE19 Replace pole 1,023
326 21CMS806 DCB11 REPLACE RELAY 2,015
327 21CMS822 TDC570 REPLACE CABLE 29,616328 21CMS85SC TDC416 REPLACE FANS (TR71) 3,430
329 21CMS99SC DCK18 REPLACE POWER SWITCH 8,240
330 21FRD007 FR - River Valley Metro OH-UG (136)
331 21FRD009 FREEPORT - ADAMS AVENUE RECONS 37,283
332 21FRD023 76943 : COUNTY HIGHWAY 6 & CAN 4,367333 21FRD024 ISTHA CTS I294 (4498)-oh to ug 2,893
334 21FRD030 76865 - PN7348 @ Sacramento bt 2,176
335 21FRD032 68009: LENA-US 20 AND IL 73-RE 14,965
336 21FRD035 EOWA UP01-C Grand Ave OH to UG 6,424
337 21FRD038 FR - Lockport 9th St 190,789338 21FRD045 ISTHA I294 @ O'Hare Oasis UG (511)
339 21FRD046 ISTHA I294@Edgewater ped relo (24,937)
340 21FRD051 FR - Sansom Street Sewer 2,024
341 21FRD055 ISTHA CTS I294 S Cork A Relo (20,061)
342 21FRD061 78564 : FR - STR - E 2700 N RO 24,789343 21FRD065 install one 34kV Intellirupter 7,367
344 21FRD076 78696 : W North and N Washingt 12,911
345 21FRD078 J3970 & J3688 BORE ACROSS I80 38,622
346 21FRD081 78792 : Brookfield Phase 2 23,299
347 21FRD093 FR - Brisbin Rd 2021 17,778348 21NBD031 7100 LYNDON AVE 85,453
349 21NBD059 Steger Citgo - 3400 Chicago Rd 62,225
350 21NBD065 One Central Station (88,230)
351 21NBD074 77558: Wandalia Farm New Svc 14,410
352 21NBD108 310 W Taylor 16,529353 21NBD132 Smalley Steel Ring ATO 109,841
354 21NBD146 NU-South Campus Upgrade Ph. 2 835
355 21NBD150 1131-1135 W Winona - Perm 135,844
356 21NBD158 77426:NBSW 23810 AMOCO RD SVC 172,307
357 21NBD169 78674: NBEC 20168 N. Rand Rd. 23,467358 21NBD172 78698: 2045 Arlington Heights 9,373
359 21NBD181 78946:NBSW-1040 Renwick Rd 123,994
360 21NBD189 Ferrero - 3401 Mt Prospect 462,265
361 21NBD213 Tootsie Relocation of Vault 83,497
362 21NBD214 Northwest Gateway Development 4,791363 21NBD300 MICROSOFT CHI10 3RD LINE 378,623
364 21NBD301 Enbridge Energy 55,160
365 21NBD305 Dearborn Apts, 310 Schuyler 216,037
366 21NBD360 Kinder Morgan 34KV PM 103,041
367 21NBD601 10400 W North - Navistar Demo 1,172368 21NBD604 7435 W Talcott - AHRMC ED Feed 35,134
369 21NBD610 4730 W Irving Park Perm (32,158)
370 21NBD621 1131-1135 W Winona - Relo 76,298
371 21NBS913 CTA Damen - SSC Upgrades 113,857
372 21SPD093 2021 NSM Cable Replacement 348,538373 21SPD122 2021 NSM MH 367063 Cbl Rpl 42,087
374 21SPD130 2021 Mainline Y2564 Cbl Rpl 2,192,947
375 21SPD172 IP2 PCKT RELIABILITY-FDR B369 15,457
376 21SPD192 2021 NSM MH347132 900 GRP CBL 15,138
377 21SPD193 2021 NSM MH347132 1400 GRP CBL 374,726378 21SPD221 2021 NSM MH 367035 Cbl Rpl 741,352
Docket No. 22-____ComEd Ex. 1.02
Page 143 of 176

WP 18Page 9 of 16
LineNo.
DistributionProject ID Description
CWIP Amount as of 12/31/2021
(A) (B) (C)
Commonwealth Edison Company
Distribution CWIP Projects Not Accruing AFUDC
As of 12/31/2021
379 21SPD236 2021 NSM MH 387034 Cbl Rpl 651,877
380 21SPD286 2021 Mainline Z80250 Cable Rpl 198,448
381 21SPD290 2021 NSM MH 387153 Cbl Rpl 55,187382 21SPD291 2021 NSM MH 347132 Cbl Rpl 431,036
383 21SPD292 2021 NSM MH 367029 Cbl Rpl 255,733
384 21SPD294 2021 NSM MH 347132 Cbl Rpl 229,037
385 21SPD296 2021 NSM MH 387150 Cbl Rpl 371,633
386 21SPD302 L0903 Replace Grounds 22,414387 21SPD313 Mainline Z13755 Cable Repl 345,927
388 21SPD314 Mainline D20 Cable Replacement 129,138
389 21SPD316 Mainline SCHG154 - Ph 2 Cable 118,015
390 21SPD320 2021 Mainline Y3040 Cbl Rpl 115,736
391 21SPD326 2021 Mainline D5609 Cbl Rpl 186,867392 21SPD391 Switchgear Modernization Pilot 329,761
393 21SPD470 2021 ML Cable Replace Y2564 656,892
394 21SPD500 12 kV DA Program B395 15,834
395 21SPD501 12 kV DA Program WNPK41 21,501
396 21SPD502 12 kV DA Program W9231 18,496397 21SPD503 12 kV DA Program W3902 1,947
398 21SPD506 12 kV DA Program Y13063 2,055
399 21SPD509 12 kV DA Program 62ND44 7,257
400 21SPD510 12 kV DA Program E112 2,510
401 21SPD511 12 kV DA Program C793 1,947402 21SPD514 12 kV DA Program 365Y452 2,744
403 21SPD516 12 kV DA Program Z4341 12,858
404 21SPD517 12 kV DA Program A436 3,525
405 21SPD518 12 kV DA Program E257 4,702
406 21SPD519 12 kV DA Program 381X044 10,240407 21SPD520 12 kV DA Program X4856 5,263
408 21SPD522 12 kV DA Program C2214 12,925
409 21SPD526 12 kV DA Program X4035 11,083
410 21SPD528 12 kV DA Program GRDX30 7,159
411 21SPD531 12 kV DA Program W7019 115,919412 21SPD533 12 kV DA Program 038Y453 7,317
413 21SPD534 12 kV DA Program 310X142 23,024
414 21SPD536 12 kV DA Program Y84052 8,215
415 21SPD538 12 kV DA Program GRDX256 13,364
416 21SPD539 12 kV DA Program C83 10,865417 21SPD540 12 kV DA Program 310X352 6,283
418 21SPD541 12 kV DA Program WNPK350 12,654
419 21SPD542 12 kV DA Program W6132 1,947
420 21SPD545 12 kV DA Program G767 12,626
421 21SPD546 12 kV DA Program J1175 1,947422 21SPD547 12 kV DA Program R6202 167,269
423 21SPD561 IP2 PCKT RELIABILITY-FDR H385 179,468
424 21SPD609 IP^2 2021 Cbl (D123317-D54955) 775
425 21SPD610 IP^2 2021 E4806 D109741-D4167 591,376
426 21SPD613 IP^2 2021 Cbl Repl W576 923,345427 21SPD614 IP^2 2021 Cbl Repl W6216 61,415
428 21SPD617 IP^2 2021 Cbl Repl C201 45,177
429 21SPD627 IP^2 CABLE REPLACE PL 497 125,733
430 21SPD628 IP^2 CABLE REPLACE C046Y 318,349
431 21SPD633 IP^2 CABLE REPLACE F571 182,517432 21SPD711 IP2 PCKT RELIABILITY-FDR K5781 11,332
Docket No. 22-____ComEd Ex. 1.02
Page 144 of 176

WP 18Page 10 of 16
LineNo.
DistributionProject ID Description
CWIP Amount as of 12/31/2021
(A) (B) (C)
Commonwealth Edison Company
Distribution CWIP Projects Not Accruing AFUDC
As of 12/31/2021
433 21SPD718 IP2 PCKT RELIABILITY-FDR H285 1,004
434 21SPD723 IP2 PCKT RELIABILITY-FDR B905 9,014
435 21SPD733 IP2 PCKT RELIABILITY-FDR W2011 97,852436 21SPS015 TDC452 Glenwood F5273 Recloser 141,831
437 21SPS119 TSS106 Montgomery Lift Station 99,776
438 21SPS123 TDC294 12kV RLY Upgrd A9420 40,948
439 21SPS124 TDC294 12kV RLY Upgrd A9427 35,223
440 21SPS132 DCB57 UNION Switch Replace 8,736441 21SPS133 DCB55 ROCK CITY Switch Replace 8,988
442 21SPS134 DCB54 OREGON Switch Replace 7,329
443 21SPS135 DCB35 COLETA Switch Replace 11,756
444 21SPS136 DCB11 POPLARGRO Switch Replace 23,333
445 21SPS137 DCB10 HARVARD TR52 Switch Rplc 7,314446 21SPS138 DCB10 HARVARD TR51 Switch Rplc 3,377
447 21SPS139 DSS558 WESTMONT Switch Replace 29
448 21SPS140 ESSJ385 WOLRVIN PIPL Swtch Rpl 18,945
449 21SPS141 ESSJ376 WOLVERINEPIP Swtch Rpl 18,945
450 21SPS142 ESSJ335 WSTSHORE PIP Swtch Rpl 20,263451 21SPS143 ESSF358-1 INNOPHOS Switch Repl 46,958
452 21SPS144 ESSF358-1 INNOPHOS – TR 1 Swit 44,696
453 21SPS145 DCW64 DOWNERS GROV Switch Repl 8,981
454 21SPS146 DCS48 OTTER CREEK Switch Repl 12,287
455 21SPS147 DCS39 MINONK Switch Replace 18,904456 21SPS148 DCS37 BRUCE TWP Switch Replace 15,174
457 21SPS149 DCJ69-TR2 BRAIDWOOD Switch Rpl 18,945
458 21SPS150 DCJ69-TR1 BRAIDWOOD Switch Rpl 17,802
459 21SPS151 DCJ67 CHANNAHON TWP Switch Rpl 29
460 21SPS152 DCJ62 HOMER TWNSHP Switch Rpl 29461 21SPS153 DCJ33 WASHINGTON ST Switch Rpl 29
462 21SPS154 DCJ24 LISBON Switch Rpl 22,877
463 21SPS155 DCJ19 BRUCE ROAD Switch Rpl 9,987
464 21SPS156 DCJ18 LOCKPORT Switch Rpl 14,676
465 21SPS157 DCG88 HOMETOWN Switch Rpl 10,374466 21SPS158 DCG78 WORTH TWP Switch Rpl 10,201
467 21SPS159 DCF17 PEOTONE Switch Rpl 15,712
468 21SPS160 Spare TR 40 MVA Auto 1 301,744
469 21SPS162 Spare TR 40 MVA Auto 3 304,244
470 21SPS163 Spare TR 40 MVA Auto 4 304,279471 21SPS164 Spare TR 40 MVA Auto 5 371,112
472 21SPS165 Spare TR 50 MVA Auto 1 330,015
473 21SPS170 TDC205 Wheeling FDR C056 Disc 8,580
474 21SPS174 12kV Relay Upgrade TSS52 Bus 3 62,034
475 21SPS184 IP2Brkr TSS106 MNTGMRY BT 2-3 162,248476 21SPS185 IP2Brkr TSS106 MNTGMRY L10642 644
477 21SPS186 IP2Brkr TSS106 MNTGMRY L10643 221
478 21SPS187 IP2Brkr TSS106 MNTGMRY TR 78 144
479 21SPS188 IP2Brkr TSS115 BEDFORD TR 76 96,834
480 21SPS189 IP2Brkr TSS115 BEDFORD TR 79 2,140481 21SPS190 IP2Brkr TSS120 LOMBARD BT 2-3 475,554
482 21SPS192 IP2Brkr TSS120 LOMBARD L12063 1,427
483 21SPS195 IP2Brkr TSS120 LOMBARD L12067 414
484 21SPS198 IP2Brkr TSS120 LOMBARD TR 76 299
485 21SPS199 IP2Brkr TSS120 LOMBARD TR 79 582486 21SPS200 IP2Brkr TSS123 MARENGO BT 2-3 119,956
Docket No. 22-____ComEd Ex. 1.02
Page 145 of 176

WP 18Page 11 of 16
LineNo.
DistributionProject ID Description
CWIP Amount as of 12/31/2021
(A) (B) (C)
Commonwealth Edison Company
Distribution CWIP Projects Not Accruing AFUDC
As of 12/31/2021
487 21SPS201 IP2Brkr TSS123 MARENGO T BUS 2,683
488 21SPS204 IP2Brkr TSS129 NILES BT 2-3 217,674
489 21SPS207 IP2Brkr TSS129 NILES L12972 1,122490 21SPS208 IP2Brkr TSS129 NILES TR 77 1,052
491 21SPS210 IP2Brkr TSS131 WST-CHI BT 2-3 294,328
492 21SPS211 IP2Brkr TSS131 WST-CHI L13155 221
493 21SPS213 IP2Brkr TSS131 WST-CHI TR 79 323
494 21SPS214 IP2Brkr TSS132 GRDN PLAIN TR76 166,349495 21SPS215 IP2Brkr TSS139 MENDOTA L13931 68,812
496 21SPS216 IP2Brkr TSS139 MENDOTA L13934 3,808
497 21SPS217 IP2Brkr TSS139 MENDOTA TR 78 6,666
498 21SPS218 IP2Brkr TSS146 SANDWICH L14630 60,426
499 21SPS219 IP2Brkr TSS149 WILMINGT L14952 34,402500 21SPS220 IP2Brkr TSS149 WILMINGT L14964 4,650
501 21SPS221 IP2Brkr TSS149 WILMINGT TR 77 7,540
502 21SPS222 IP2Brkr TSS166 LEITHTON TR 77 22,102
503 21SPS223 IP2Brkr TSS176 STILLMAN TR 78 105,877
504 21SPS224 IP2Brkr TSS180 LENA L12165 37,582505 21SPS225 IP2Brkr TSS182 MINONK L18262 32,538
506 21SPS226 IP2Brkr TSS193 MCHENRY L19342 146,399
507 21SPS227 IP2Brkr TSS193 MCHENRY L4268 2,022
508 21SPS228 IP2Brkr TSS193 MCHENRY L7544 804
509 21SPS229 IP2Brkr TSS193 MCHENRY T BUS 4 1,052510 21SPS230 IP2Brkr TSS60 ALSIP BT 1-2 9,211
511 21SPS233 IP2Brkr TSS133 ROCKFALLS BT7-1 110,714
512 21SPS234 ESSJ303 DOW CHEMIC Switch Rpl 17,927
513 21SPS235 DCD63 SCHILLER PARK Switch Rpl 6,085
514 21SPS244 IP2Brkr TSS121 FREEPORT TR 77 13,047515 21SPS248 IP2Brkr TSS131 WESTCHIC L13153 519
516 21SPS249 IP2Brkr TSS131 WESTCHIC L13167 21
517 21SPS251 IP2Brkr TSS131 WESTCHIC TR 77 213
518 21SPS252 IP2Brkr TSS131 WESTCHIC TR 78 398
519 21SPS256 IP2Brkr TSS133 ROCFALLS BT6-7 619520 21SPS257 IP2Brkr TSS146 SANDWICH L52771 2,654
521 21SPS258 IP2Brkr TSS176 STILLMAN L17630 941
522 21SPS259 IP2Brkr TSS180 LENA TR 78 1,801
523 21SPS260 IP2Brkr TSS193 MCHENRY L19347 2,099
524 21SPS262 TDC385 FDR R8502 Disconnect 6,071525 21SPS264 TDC385 FDR R8509 Disconnect 8,105
526 21SPS265 ESSJ359-A LODERS CROKLAAN L126 77,784
527 21SPS281 TDC294 12kV RLY Upgrd Bus 4 16,509
528 21SPS288 SS501 Elmhurst Reconfiguration 45,600
529 21SPS298 RelayUpgd 34KV TSS166 LEITHTON 2,920530 21SPS299 RelayUpgd TSS129 NILES 1,589
531 21SPS337 RelayUpgrd TSS149 WILMINGTON 23,309
532 21SPS338 RelayUpgd TSS182 Minonk 26,953
533 21SPS339 RelayUpgd TSS60 ALSIP 4,413
534 21SPS340 RelayUpgd TSS106 MONTGOMERY 1,197535 21SPS343 RelayUpgd TSS132 GARDEN PLAIN 26,201
536 21SPS344 RelayUpgd TSS139 MENDOTA 32,494
537 21SPS463 TDC784 Sears Fire Alarm 38,013
538 21TPA009 5500 W 24TH PL 14,227
539 21TPA013 2417 N ROCKWELL 16,300540 21TPA016 3152 W Devon Ave - CAP (32,909)
Docket No. 22-____ComEd Ex. 1.02
Page 146 of 176
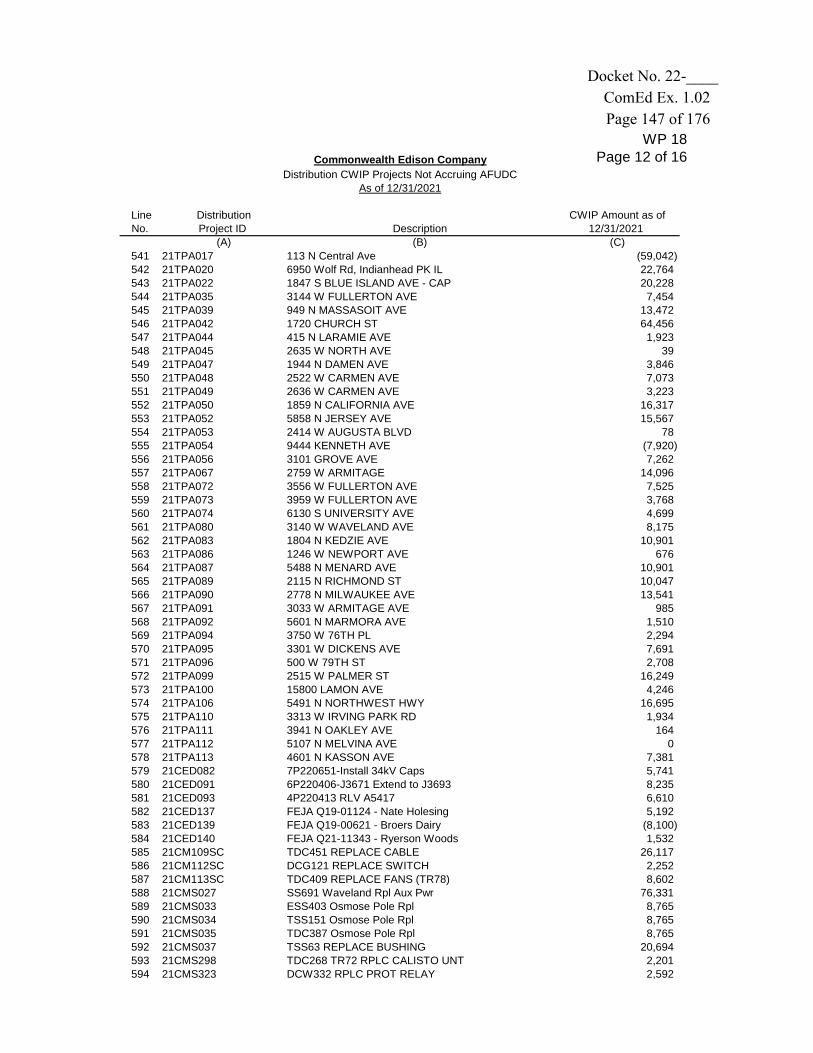
WP 18Page 12 of 16
LineNo.
DistributionProject ID Description
CWIP Amount as of 12/31/2021
(A) (B) (C)
Commonwealth Edison Company
Distribution CWIP Projects Not Accruing AFUDC
As of 12/31/2021
541 21TPA017 113 N Central Ave (59,042)
542 21TPA020 6950 Wolf Rd, Indianhead PK IL 22,764
543 21TPA022 1847 S BLUE ISLAND AVE - CAP 20,228544 21TPA035 3144 W FULLERTON AVE 7,454
545 21TPA039 949 N MASSASOIT AVE 13,472
546 21TPA042 1720 CHURCH ST 64,456
547 21TPA044 415 N LARAMIE AVE 1,923
548 21TPA045 2635 W NORTH AVE 39549 21TPA047 1944 N DAMEN AVE 3,846
550 21TPA048 2522 W CARMEN AVE 7,073
551 21TPA049 2636 W CARMEN AVE 3,223
552 21TPA050 1859 N CALIFORNIA AVE 16,317
553 21TPA052 5858 N JERSEY AVE 15,567554 21TPA053 2414 W AUGUSTA BLVD 78
555 21TPA054 9444 KENNETH AVE (7,920)
556 21TPA056 3101 GROVE AVE 7,262
557 21TPA067 2759 W ARMITAGE 14,096
558 21TPA072 3556 W FULLERTON AVE 7,525559 21TPA073 3959 W FULLERTON AVE 3,768
560 21TPA074 6130 S UNIVERSITY AVE 4,699
561 21TPA080 3140 W WAVELAND AVE 8,175
562 21TPA083 1804 N KEDZIE AVE 10,901
563 21TPA086 1246 W NEWPORT AVE 676564 21TPA087 5488 N MENARD AVE 10,901
565 21TPA089 2115 N RICHMOND ST 10,047
566 21TPA090 2778 N MILWAUKEE AVE 13,541
567 21TPA091 3033 W ARMITAGE AVE 985
568 21TPA092 5601 N MARMORA AVE 1,510569 21TPA094 3750 W 76TH PL 2,294
570 21TPA095 3301 W DICKENS AVE 7,691
571 21TPA096 500 W 79TH ST 2,708
572 21TPA099 2515 W PALMER ST 16,249
573 21TPA100 15800 LAMON AVE 4,246574 21TPA106 5491 N NORTHWEST HWY 16,695
575 21TPA110 3313 W IRVING PARK RD 1,934
576 21TPA111 3941 N OAKLEY AVE 164
577 21TPA112 5107 N MELVINA AVE 0
578 21TPA113 4601 N KASSON AVE 7,381579 21CED082 7P220651-Install 34kV Caps 5,741
580 21CED091 6P220406-J3671 Extend to J3693 8,235
581 21CED093 4P220413 RLV A5417 6,610
582 21CED137 FEJA Q19-01124 - Nate Holesing 5,192
583 21CED139 FEJA Q19-00621 - Broers Dairy (8,100)584 21CED140 FEJA Q21-11343 - Ryerson Woods 1,532
585 21CM109SC TDC451 REPLACE CABLE 26,117
586 21CM112SC DCG121 REPLACE SWITCH 2,252
587 21CM113SC TDC409 REPLACE FANS (TR78) 8,602
588 21CMS027 SS691 Waveland Rpl Aux Pwr 76,331589 21CMS033 ESS403 Osmose Pole Rpl 8,765
590 21CMS034 TSS151 Osmose Pole Rpl 8,765
591 21CMS035 TDC387 Osmose Pole Rpl 8,765
592 21CMS037 TSS63 REPLACE BUSHING 20,694
593 21CMS298 TDC268 TR72 RPLC CALISTO UNT 2,201594 21CMS323 DCW332 RPLC PROT RELAY 2,592
Docket No. 22-____ComEd Ex. 1.02
Page 147 of 176

WP 18Page 13 of 16
LineNo.
DistributionProject ID Description
CWIP Amount as of 12/31/2021
(A) (B) (C)
Commonwealth Edison Company
Distribution CWIP Projects Not Accruing AFUDC
As of 12/31/2021
595 21CMS340 ESSW451 RPLC STRUR 28
596 21CMS342 TSS120 L12067 Rplc Pwr Switch 1,091
597 21CMS345 TSS101 TR72 REPLC PROT RELAY 2,228598 21CMS583 TSS149 REPLACE CBs 2,957
599 21CMS584 TDC465 REPLACE FIREWALL (TR73) 372,719
600 21CMS784 TSS125 REPL CTS AND CABLE 1,142
601 21CMS825 ESSW600 REPLACE CABLE 19,302
602 21FRD075 78692 : 87th and Woodard 2,540603 21NBD187 79347 NBSW - 3835 S. Youngs Rd 122,599
604 21NBD345 RG/Cold Summit Relocation 35,482
605 21NBD480 Costco 34kv Relocation 3,150
606 21NBD620 1201 W. Lake St - Final Feed 8,699
607 21SPD209 2021 Mainline THRP35 Cbl Repl (3,646)608 21SPD317 Mainline Replace TSS137 Cable 139,810
609 21SPD327 2021 Mainline D5609 Cbl Rpl 338,489
610 21SPD349 2022 1% Cycle 1 feeder J656 19,388
611 21SPD473 2021 ML Cable Replace THRP35 652,259
612 21SPD475 2021 ML Cable Replace Y1932 5,466613 21SPD636 IP^2 CABLE REPLACE D9317 3,227
614 21SPD640 IP^2 IP2 Cbl - A544 TSS154 LIB 31,354
615 21SPD642 IP^2 IP2 Cable Replace - R6011 35,920
616 21SPS161 Spare TR 40 MVA Auto 2 303,538
617 21SPS205 IP2Brkr TSS129 NILES L12963 1,282618 21SPS206 IP2Brkr TSS129 NILES L12971 750
619 21SPS209 IP2Brkr TSS129 NILES TR 78 750
620 21SPS242 IP2Brkr TSS120 LOMBARD L12054 633
621 21SPS245 IP2Brkr TSS123 MARENGO TR 77 2,461
622 21SPS246 IP2Brkr TSS123 MARENGO TR 78 2,548623 21SPS263 TDC385 FDR R8504 Disconnect 7,969
624 21SPS266 DSS558 TR51 WSTMNT Switch Repl 4,722
625 21SPS267 IP2Brkr TSS129 NILES L12967 1,454
626 21SPS336 RelayUpgd TSS115 BEDFORD 9,024
627 21SPS341 RelayUpgd TSS120 LOMBARD 2,307628 21SPS342 RelayUpgd TSS123 MARENGO 25,405
629 21SPS345 RelayUpgd TSS131 WEST CHICAGO 6,896
630 21SPS355 TSS45 138kV RELAY UPGRD BUS 6 2,633
631 21SPS368 DCZ307 NEW CASTLE Switch Repl 14,526
632 21TPA001 2011 E 75TH ST (19,061)633 21TPA116 5803 N MULLIGAN AVE 3,085
634 21TPA121 6546 W DEVON AVE (58,196)
635 21TPA123 2732 N KIMBALL AVE 159
636 21TPA124 2015 W BERWYN AVE 9,874
637 21TPA125 5150 N CUMBERLAND AVE 9,835638 21TPA127 2007 W ADDISON ST 3,353
639 21TPA128 3615 N OAKLEY AVE (167,125)
640 21TPA129 5427 N NORTHWEST HWY 7,435
641 21TPA130 3730 W 38TH ST (64,646)
642 21TPA131 2742 N CENTRAL PARK AVE 2,074643 21TPA133 3359 N RAVENSWOOD AVE 5,990
644 20CED366 Joliet VO J686 7,177
645 20NBD165 LYS - G1 1675 N MAGNOLIA 115,432
646 20SPD550 34kv CIR RES- L7663 Sec 2 10,557
647 20SPD880 12 kV DA Baseline C1516 97,394648 20SPD882 12 kV DA Baseline R8485 14,668
Docket No. 22-____ComEd Ex. 1.02
Page 148 of 176

WP 18Page 14 of 16
LineNo.
DistributionProject ID Description
CWIP Amount as of 12/31/2021
(A) (B) (C)
Commonwealth Edison Company
Distribution CWIP Projects Not Accruing AFUDC
As of 12/31/2021
649 21CED044 4P221001-N-1 at DCA24 Term1&2 8,867
650 21CED062 5P220200 - H321 DA Devices 19,868
651 21CED075 4P220709-C129 VO Make-ready 20,924652 21CED090 8P220406-Relieve F3572 w F3581 6,662
653 21CED092 6P220407 Maintain VO J1670 3,825
654 21CED142 FEJA Solar Q20-01569-Christ Ev 6,435
655 21CED203 Chicago South VO Y1931 331
656 21CED296 LIB VO TDC230 Antioch A3026 6,506657 21CM105SC TSS127 Replace Relay 8,358
658 21CM116SC DSS471 REPLACE CABLE 2,192
659 21CM119SC TSS182 REPLACE CB 210,507
660 21CM122CC TDC556 TR61 Cable Replacement 53,260
661 21CM126CC TSS64 Repl 351 Relay 571662 21CMD010 Install Anode bed EM455022-23 15,529
663 21CMD031 L11407 Holiday Repair-Wolcott 50,946
664 21CMD032 L11407 Holiday Repair-Cuyler 50,262
665 21CMD033 L19201-2 Holiday Repair-Gunder 10,320
666 21CMD034 L19201-2 Holiday - Sinclair 1 43,584667 21CMD035 L19201-2 Holiday - Sinclair 2 34,123
668 21CMD036 L19201-2 Holiday Repair -Ogden 51,195
669 21CMD038 L11407 Holiday Repair MH 29IR 2,503
670 21CMD039 L11407 Holiday Repair MH 29 6,333
671 21CMS005 DCX312 Inductor Rpl 18672 21CMS017 TDC784 TR72 Rplc I&C cable 161
673 21CMS029 TSS37 L5354 Rpl Pwr Cable 1,278
674 21CMS032 DCD216 Cable Replace 1,520
675 21CMS039 TSS148-SPRINKLE HOUSING STRUCT 24,226
676 21CMS040 TSS150 Modular Bldg Project 413,496677 21CMS337 TDC204 TR73 RPLC FAN 1,341
678 21CMS346 TDC233 REPLACE CABLE 20,051
679 21CMS840 DSS311 REPLACE ARRESTORS 801
680 21CMS841 TSS79 REPLACE INS TR 1,619
681 21CMS842 ESSH452 REPLACE RELAY 11,370682 21CMS93SC DCG66 REPLACE RELAY 1,260
683 21FRD079 78788 : Skokie- Gross Point Rd 8,771
684 21FRD088 78955:US 14 at Mt. Prospect Rd 3,726
685 21FRD099 79614: IDOT - IL 78 OVER PLUM 113,431
686 21FRD102 68005 : PLEASANT VALLEY - IDO 23,878687 21FRD104 79527 : FR - LAKEVIEW PARKWAY 6,578
688 21FRD105 79510: ROCKFORD BUCKBEE DRAINA 1,267
689 21FRD108 79502 : LCDOT - DARRELL RD - C 20,403
690 21FRD110 65615 :IDOT IL RT 83 from IL 63,666
691 21FRD111 79905 : Hobbie Ave 70692 21FRD112 79907 : I-57 And Waldron Rd 4,496
693 21FRD114 79667:Highland Park- Roadway R 1,640
694 21FRD115 Duane St-Glenn Ellyn Rider LGC 16,090
695 21NBD162 1100 W Cermak Rd Perm Service 224
696 21NBD166 Project Pie Huntley 2,905697 21NBD200 79663: NBEC - 2301 Shermer Rd. 29,357
698 21NBD221 1257 W Roosevelt 9,074
699 21NBD225 400 N ABERDEEN ST- 2nd feeder 148,955
700 21NBD284 CAP BANKS WEST CHICAGO 206
701 21NBD347 717 S. WELLS PERM (35,292)702 21NBD361 15 N Elizabeth 214,342
Docket No. 22-____ComEd Ex. 1.02
Page 149 of 176

WP 18Page 15 of 16
LineNo.
DistributionProject ID Description
CWIP Amount as of 12/31/2021
(A) (B) (C)
Commonwealth Edison Company
Distribution CWIP Projects Not Accruing AFUDC
As of 12/31/2021
703 21NBD387 8331 S Stewart 270,485
704 21NBD400 Air Liquide New Feeder 1,010
705 21NBD404 79961: NBEC - 405 N. Ardmore (27,258)706 21NBD422 3649 N Central 17,315
707 21NBD520 Golden Grain New Service 45,670
708 21NBD521 Lion Electric Phase I 652
709 21SPD253 New Feeder Z17449 2,757
710 21SPD325 2021 Mainline EXCH046 Cbl Rpl 2,930711 21SPD346 D3414 RECONDUCTORING (SYSTEM P 45,608
712 21SPD347 Line Sensor Purchase - Suburba 1,007,468
713 21SPD357 CRY-E937 - 1% SAIFI, 2,900 FT 12,930
714 21SPD359 X7135Y - 1 PERCENT SAIFI 2021 1,070
715 21SPD472 2021 ML Cable Replace MFLD251 813,151716 21SPD641 IP^2 IP2 Cable Replace - G1992 28,506
717 21SPD759 Streetlight Pgrm-AURORA GRP B 170
718 21SPD761 Streetlight Pgrm-BEDFORD PARK 1,407
719 21SPD814 ATO Glenbrook Hospital (6,176)
720 21SPD815 Speedway Solar Related Work 493,870721 21SPD907 Advanced CVR 399,148
722 21SPD910 2022 ALRS PGM L4866 ALRS 19,687
723 21SPD911 2022 ALRS PGM L5635 ALRS 14,742
724 21SPD912 2022 ALRS PGM L14968 ALRS 14,062
725 21SPD913 2022 ALRS PGM L18262 ALRS 11,250726 21SPD914 2022 ALRS PGM L5131 ALRS 17,258
727 21SPD915 2022 ALRS PGM L6167 ALRS 18,281
728 21SPD916 2022 ALRS PGM L13347-7R220801 13,191
729 21SPD917 2022 ALRS PGM L13347-7R220802 18,281
730 21SPD918 2022 ALRS PGM L12541 ALRS 9,141731 21SPD919 2022 ALRS PGM L6031 ALRS 19,687
732 21SPD920 2022 ALRS PGM L6032 ALRS 14,785
733 21SPD923 TSS34 Kingsbury PMU Deployment 1,046
734 21SPD924 TSS61 Streator PMU Deployment 865
735 21SPD925 TSS47 Evanston PMU Deployment 865736 21SPD926 TSS114 Northwest PMU Deploymnt 1,046
737 21SPD927 TSS45 Jefferson PMU Deployment 855
738 21SPD928 TDC785 Ontario PMU Deployment 342
739 21SPD950 Christ Hosp Hardening L11567 246,864
740 21SPD951 Christ Hosp Hardening L6030 246,864741 21SPS193 IP2Brkr TSS120 LOMBARD L12065 1,403
742 21SPS236 DCD87 LEYDEN TWP Switch Rpl 4,804
743 21SPS237 DCW118 KENDALL TWP Switch Rpl 4,804
744 21SPS238 ESSD695 NESTLE TR1 Switch Rpl 4,804
745 21SPS239 ESSD695 NESTLE TR2 Switch Rpl 4,804746 21SPS253 IP2Brkr TSS132 GARDENPL L13230 4,848
747 21SPS301F Glendale Hts Security Fence 45
748 21SPS312 TDC451 Mokena INS POLE 498
749 21SPS351 TDC221 12kV REL UPGRD E2102 2,719
750 21SPS352 TDC221 12kV REL UPGRD E2107 388751 21SPS359 TDC205 12kV Relay Upgrade C054 1,407
752 21SPS360 TDC205 12kV Relay Upgrade C055 1,407
753 21SPS362 TDC205 12kV Relay Upgrade C053 1,407
754 21SPS389 TSS192 Ridgeland TR71 Replcmnt 9
755 21SPS400 Battery Replace Prog Waukegan 127756 21SPS403 Battery Replace Prog Lincolnwd 127
Docket No. 22-____ComEd Ex. 1.02
Page 150 of 176

WP 18Page 16 of 16
Line
No.
Distribution
Project ID Description
CWIP Amount as of
12/31/2021 (A) (B) (C)
Commonwealth Edison Company
Distribution CWIP Projects Not Accruing AFUDC
As of 12/31/2021
757 21SPS442 BatteryRepl-DCY310 Austin 271
758 21SPS527 TDC205 Wheeling C0510 1,871
759 21SPS528 TDC205 Wheeling C052 1,244760 21SPS529 TDC212 Northbrook C1212 108761 21SPS530 TDC212 Northbrook C1213 108
762 21SPS531 TDC217 Prospect Hgts C1710 475
763 21SPS532 TDC217 Prospect Hgts C1712 870
764 21SPS533 TDC436 Hillcrest J3679 11,947765 21SPS534 TDC436 Hillcrest J3680 10,502766 21SPS535 TDC439 Rockdale J3970 1,334
767 21SPS536 TDC439 Rockdale J3973 824
768 21SPS537 TDC440 Palos G4082 3,238
769 21SPS538 TDC563 Hanover Township W6310 2,560770 21SPS541 TSS106 Montgomery W608 406771 21SPS542 TSS106 Montgomery W064 135
772 21SPS553 DETECTION - TSS 43 Wildwood 471
773 21SPS566 Spare TR 40 MVA Auto 7 2 wind 376,154
774 21SPS567 Spare TR 40 MVA Auto 8 2 wind 376,154775 21SPS838F North Aurora Security Fence 1,242776 21SPS906 DCX304 TR1 Firewall 22,034
777 21SPS920 DCZ307 NewCastle Inst Strct 9,023
778 21SPS921 DCC3 Highland Park Inst Strct 29,663779 21SPS922 DCC33 Niles Inst Strct 26,984780 21TPA132 2955 W TOUHY AVE 7,179781 21TPA135 6007 N ELSTON AVE 13,162
782 21TPA136 1614 W CULLOM AVE 12,873
783 21TPA139 2654 W ARMITAGE AVE 164784 21TPA142 2726 W PRINDIVILLE 2,762785 21TPA148 3825 W DIVERSEY AVE 188786 21TPA150 2615 N SACRAMENTO AVE 12,468
787 Total Distribution CWIP at 12/31/21 Not Eligible for AFUDC 42,206,367$
Docket No. 22-____ComEd Ex. 1.02
Page 151 of 176

WP 19Page 1 of 11
Line
No. Category
January 2022 -
December 2022 Total
Plant Additions
January 2022 -
December 2022 Total
Removal Costs
January 2022 -
December 2022
Jurisdictional Plant
Additions
January 2022 -
December 2022
Jurisdictional Removal
Costs
(A) (B) (C) (D) (E)
1 Distribution Plant
2 Back office / Other (27,332,978)$ 169,302$ (27,332,978)$ 169,302$
3 Capacity Expansion 255,468,216$ 15,990,955$ 255,468,216$ 15,990,955$
4 Corrective Maintenance 296,912,769$ 42,775,245$ 296,912,769$ 42,775,245$
5 Customer Advances (1) 16,227,816$ -$ 16,227,816$ -$
6 Customer Operations 11,662,596$ 1,688,815$ 11,662,596$ 1,688,815$
7 Facility Relocation 39,082,812$ 5,212,682$ 39,082,812$ 5,212,682$
8 New Business 325,094,647$ 14,462,240$ 325,094,647$ 14,462,240$
9 System Performance 560,391,116$ 37,281,163$ 560,391,116$ 37,281,163$
10 Distribution Plant Total 1,477,506,994$ 117,580,401$ 1,477,506,994$ 117,580,401$
11 General Plant (2)
12 Administrative & General 4,253,873$ 16,006$ 3,507,509$ 11,056$
13 Customer Operations 6,030,491$ 648,873$ 5,150,039$ 554,138$
14 Functional/BSC 3,909,006$ 22,837$ 3,338,291$ 19,503$
15 IT Projects 37,366,867$ -$ 28,479,201$ -$
16 Real Estate 48,592,704$ 1,547,193$ 41,498,169$ 1,321,302$
17 System Performance/Other 92,520,525$ 2,977,186$ 69,707,571$ 2,172,327$
18 Tools 9,565,899$ 9,421$ 8,169,278$ 8,046$
19 Vehicles 39,352,755$ 6,717$ 33,607,252$ 5,736$
20 General Plant Total 241,592,120$ 5,228,234$ 193,457,311$ 4,092,108$
21 Intangible Plant
22 Functional/BSC 4,758,493$ -$ 4,063,753$ -$
23 IT Projects 69,215,643$ -$ 57,698,144$ -$
24 IT Projects - Customer Operations 30,553,411$ -$ 26,092,613$ -$
25 Intangible Plant Total 104,527,547$ -$ 87,854,509$ -$
26 Overall Total 1,823,626,662 122,808,634 1,758,818,814 121,672,509
27 ADIT Calculation
28 Total Additions 1,758,818,814
29 Bonus Depreciations (3) 0%
30 Tax Depreciation Expense - Bonus -
31 Tax Depreciation Expense on Projected Additions (4) 97,696,909
32 Less: Book Depreciation on Projected Additions (5) (46,717,000)
33 Tax over Book Depreciation Before Additional Tax Depreciation 50,979,909
34 Tax Rate 28.505%
35 ADIT Adjustment on Projected Additions 14,531,823
Notes:
(1) ComEd adds back Customer Advances related to projects forecasted to be in service in 2022 to avoid double counting the rate base reduction
created through the removal of customer advances on WP-11
(2) Of this amount, $86,511,369 in plant in service and $2,259,416 in removal costs relate to Plant Account 397
(3) Details of the rate base deduction for ADIT related to projected 2022 plant additions. There is no bonus depreciation in 2022 for tax purposes.
(4) Based on Tax MACRS rates
(5) See Sch C-2.1, Ln 6, col (C)
Commonwealth Edison Company
2022 Projected Plant Additions - 2022 Filing Year
(In Dollars)
Docket No. 22-____ComEd Ex. 1.02
Page 152 of 176

WP 19Page 2 of 11
Commonwealth Edison Company
2022 Projected Plant Additions - 2022 Filing Year
(In Dollars)
Functional
ClassInvestment Categoy
Blanket /
UniqueITN ITN Description
Total Additions Total Removal Costs
Jurisdic
ational
%
Jurisdictional
Additions
Jurisdictional
Removal Costs
Distribution Back Office/Other Unique 10104 10104: Back Office: ComEd: Electric (3,123,395) (360) 100% (3,123,395) (360)
Distribution Back Office/Other Unique 45336 45336: Back Office Forecast - OSVP Admin (6,935,916) (343) 100% (6,935,916) (343)
Distribution Back Office/Other Unique 48665 48665:ComEd Capital Management Challenge Distribution (37,027,487) (3,156) 100% (37,027,487) (3,156)
Distribution Back Office/Other Blanket 48738 48738: GCA Distribution Capital 5,440,650 310 100% 5,440,650 310
Distribution Back Office/Other Unique 49413 49413: Suburban Mapping 11,749 0 100% 11,749 0
Distribution Back Office/Other Unique 49585 49585: Substation Facilities Distribution 752,103 69,442 100% 752,103 69,442
Distribution Back Office/Other Unique 50985 50985: OCC Dispatcher Training 641,160 36 100% 641,160 36
Distribution Back Office/Other Unique 79836 79836: One-Time Illinois Clean Energy Law - ComEd 12,494,660 0 100% 12,494,660 0
Distribution Back Office/Other Unique 79998 79998: Replacement of modular 413,496 103,374 100% 413,496 103,374
Back Office/Other Total (27,332,978) 169,302 (27,332,978) 169,302
Distribution Capacity Expansion Unique 16542 16542 Projects between $100k & $5M 3,454,958 0 100% 3,454,958 0
Distribution Capacity Expansion Unique 24142 24142: CE Distrib Transformers-Capacity Expansion 2,521,377 45,178 100% 2,521,377 45,178
Distribution Capacity Expansion Blanket 29335 29335 Cap Exp Baseline Work 6,667,006 437,232 100% 6,667,006 437,232
Distribution Capacity Expansion Unique 32111 32111: Install Distribution Capacitors 633,778 23,506 100% 633,778 23,506
Distribution Capacity Expansion Unique 50578 50578: Install 3 new 12 kV Feeders from Devon 10,334,848 517,801 100% 10,334,848 517,801
Distribution Capacity Expansion Unique 52802 52802: Address 34 kV L10643 N-1 issues with new 34kV line 5,176,710 0 100% 5,176,710 0
Distribution Capacity Expansion Blanket 53076 53076: Voltage Optimization 30,004,293 1,799,235 100% 30,004,293 1,799,235
Distribution Capacity Expansion Unique 53076 53076: Voltage Optimization 61,508,917 4,239,589 100% 61,508,917 4,239,589
Distribution Capacity Expansion Unique 57257 57257: FEJA Solar Bucket 2,337,520 54,492 100% 2,337,520 54,492
Distribution Capacity Expansion Unique 57774 57774-3P190201-Reduce High customer count on Z11884 via new feeder Z15068 7,499,554 0 100% 7,499,554 0
Distribution Capacity Expansion Unique 58219 58219: 4P213701 Install new feeder for 4/12 conv at DCC41 Evanston 2,338,305 110,914 100% 2,338,305 110,914
Distribution Capacity Expansion Unique 59299 59299: IP2 Modernize Legacy "SS" Substations 66,404 0 100% 66,404 0
Distribution Capacity Expansion Unique 62277 62277 - 1P200003: Reconfiguration of the 69kV lines 4,749,242 1,510,058 100% 4,749,242 1,510,058
Distribution Capacity Expansion Unique 62503 62503: 6P210001 SS530 LaGrange - retire 34kV bus, 4 kV TR's and 4kV bus 7,369,040 403,390 100% 7,369,040 403,390
Distribution Capacity Expansion Unique 62507 62507: 6P210200 Retire all 4kV feeders in Downers Grove and Westmont 4,230,514 212,394 100% 4,230,514 212,394
Distribution Capacity Expansion Unique 62655 62655: 8P212600 Reduce Customer Count and Loading on L7342 2,713,251 126,486 100% 2,713,251 126,486
Distribution Capacity Expansion Unique 62706 62706: SC 6P210201 Relieve J7471, J7482 & J7474, new DCIAB for relief 2,013,039 101,594 100% 2,013,039 101,594
Distribution Capacity Expansion Unique 62727 62727: 4P210800 Install 34kV DA to protect DCC75 Evanston 1,162,262 278,384 100% 1,162,262 278,384
Distribution Capacity Expansion Unique 62737 62737: 6P210202 Reduce customer count on L1863 2,765,090 127,653 100% 2,765,090 127,653
Distribution Capacity Expansion Unique 62821 62821-3P211000 4kV to 12kV Conversion 4,789,889 259,031 100% 4,789,889 259,031
Distribution Capacity Expansion Unique 62830 62830: 4P210001 34kV bus Re-Config IP2 16,318,967 1,611,552 100% 16,318,967 1,611,552
Distribution Capacity Expansion Unique 64077 64077: 4P223700 DCE27 Arlington Hts DCIB & 4/12kV conversion 3,225,849 173,602 100% 3,225,849 173,602
Distribution Capacity Expansion Unique 64258 64258: FEJA Solar Q17-1889 Cattail 19,013 0 100% 19,013 0
Distribution Capacity Expansion Unique 65245 65245: Woodhill Dist Station and UG 312,203 0 100% 312,203 0
Distribution Capacity Expansion Unique 65499 65499: FEJA Solar 00541 (209,396) 0 100% (209,396) 0
Distribution Capacity Expansion Unique 65955 65955: FEJA Solar 00597 Segunda II Solar (15,918) 0 100% (15,918) 0
Distribution Capacity Expansion Unique 66221 66221: STA21 Kincaid Metering 242,782 0 100% 242,782 0
Distribution Capacity Expansion Unique 67052 67052: FEJA Solar Q18-00118 Chicago Heights 15,747 0 100% 15,747 0
Distribution Capacity Expansion Unique 67430 67430: 6P210800 Upgrade feeder exit for 12kV feeder D164 755,957 41,401 100% 755,957 41,401
Distribution Capacity Expansion Unique 67432 67432: 6P212701 Install DA on new 12kV feeder D5109 140,651 8,433 100% 140,651 8,433
Distribution Capacity Expansion Unique 67575 67575: 5P210200-NEW 12KV W6203 4,273,938 165,781 100% 4,273,938 165,781
Distribution Capacity Expansion Unique 67791 67791-1P220001 Install 5th 50 MVA transformer 16,506,760 752,853 100% 16,506,760 752,853
Distribution Capacity Expansion Unique 67815 67815: 6P220800 4:12 Conversions to Retire 4kV Feeders W405, W406, W438 2,694,865 136,203 100% 2,694,865 136,203
Distribution Capacity Expansion Unique 67926 67926-1P211000-Reduce customer count on X8444 and X8430 505,991 0 100% 505,991 0
Distribution Capacity Expansion Unique 67943 67943: 4P220001 DCE27 Arlington Hts 1,944,415 106,579 100% 1,944,415 106,579
Distribution Capacity Expansion Unique 68131 68131: 5P211001 4:12 conv on D516 due to Wetlands in Riverside 2,438,855 127,464 100% 2,438,855 127,464
Distribution Capacity Expansion Unique 68421 68421-3P211001-56TH142 2,186,785 123,972 100% 2,186,785 123,972
Distribution Capacity Expansion Unique 68423 68423-3P211002-56TH144 4,531,014 262,058 100% 4,531,014 262,058
Distribution Capacity Expansion Unique 68425 68425: 3P211003 4kV to 12kV conversion of 56th247 1,117,372 58,538 100% 1,117,372 58,538
Distribution Capacity Expansion Unique 68499 68499-4P220200- New34kV L18430 & L18442 Elk Grove 31,606 29,830 100% 31,606 29,830
Distribution Capacity Expansion Unique 68570 68570: SC Parent ITN for Engineering 484,126 0 100% 484,126 0
Distribution Capacity Expansion Unique 68634 68634-4P211003- DCA27 1,922,975 99,710 100% 1,922,975 99,710
Distribution Capacity Expansion Unique 68720 68720: 6P210004 SS462 4kV:12kV Conversion 1,966,496 184,528 100% 1,966,496 184,528
Distribution Capacity Expansion Unique 74954 74954: Bronzeville MICROGRID DER - Oakland 1,491,133 0 100% 1,491,133 0
Distribution Capacity Expansion Unique 74989 74989: FEJA 01042 Customer Solar (73,134) 0 100% (73,134) 0
Distribution Capacity Expansion Unique 74999 74999: FEJA 01776 Goodrich Solar 2 13,792 0 100% 13,792 0
Distribution Capacity Expansion Unique 75278 75278: FEJA Solar 00045 BQ Energy 66,044 3,794 100% 66,044 3,794
Distribution Capacity Expansion Unique 76186 76186: 6P220001-SC D248 1,853,689 148,023 100% 1,853,689 148,023
Distribution Capacity Expansion Unique 76189 76189: 6P220400- SC D163 & D249 297,598 97,247 100% 297,598 97,247
Distribution Capacity Expansion Unique 76217 76217-1P220405:Load relief to 310X245 497,182 54,740 100% 497,182 54,740
Distribution Capacity Expansion Unique 76221 76221-7P220644-SC H602 148,860 8,927 100% 148,860 8,927
Distribution Capacity Expansion Unique 76225 76225-7P220645-SC H661 483,430 23,124 100% 483,430 23,124
Distribution Capacity Expansion Unique 76227 76227: 5P220401-SC W9203 2,103,849 133,961 100% 2,103,849 133,961
Distribution Capacity Expansion Unique 76265 76265-7P220646-SC B2302 235,094 8,512 100% 235,094 8,512
Distribution Capacity Expansion Unique 76321 76321-8P220402-SC F175 390,787 37,707 100% 390,787 37,707
Distribution Capacity Expansion Unique 76325 76325-8P220403-SC F7901 1,577,521 82,444 100% 1,577,521 82,444
Distribution Capacity Expansion Unique 76335 76335-6P220402-SC S371 757,903 48,364 100% 757,903 48,364
Distribution Capacity Expansion Unique 76393 76393-6P223700- SC J685 1,895,621 120,257 100% 1,895,621 120,257
Distribution Capacity Expansion Unique 76413 76413-7P220402-SC B163 1,306,922 64,617 100% 1,306,922 64,617
Distribution Capacity Expansion Unique 76415 76415-1P220401:DCX415 4kV N-1 429,349 24,394 100% 429,349 24,394
Distribution Capacity Expansion Unique 76465 76465-4P220403: SC Reconductor 4000' Primary OH wires 838,188 90,607 100% 838,188 90,607
Distribution Capacity Expansion Unique 76471 76471-4P220402:SC Relieve high ph OL (A ph) on A615 249,616 20,122 100% 249,616 20,122
Distribution Capacity Expansion Unique 76473 76473: 6P220404-SC W3604 3,541,058 226,606 100% 3,541,058 226,606
Distribution Capacity Expansion Unique 76484 76484-6P223701-J325 1,115,389 65,155 100% 1,115,389 65,155
Distribution Capacity Expansion Unique 76488 76488- 1P220200: SC New feeder to relieve Y3854 and Y3857 314,314 3,102 100% 314,314 3,102
Distribution Capacity Expansion Unique 76510 76510-5P220402: Relieve 4% high-phase and 2% 3-phase overload on D3427 2,286,963 134,447 100% 2,286,963 134,447
Distribution Capacity Expansion Unique 76516 76516-1P220407:Relieve high phase overload on 038Y350 754,618 42,869 100% 754,618 42,869
Distribution Capacity Expansion Unique 76518 76518-1P220408: Resolve N-1 on 301X044 766,877 40,641 100% 766,877 40,641
Distribution Capacity Expansion Unique 76520 76520-4P221001:N-1 for DCA24Term1and2 179,740 10,247 100% 179,740 10,247
Distribution Capacity Expansion Unique 76708 76708-1P220403: - 1 4kV N-1 220,785 13,240 100% 220,785 13,240
Distribution Capacity Expansion Unique 76712 76712-5P220200 E6022 5,842,106 342,690 100% 5,842,106 342,690
Distribution Capacity Expansion Unique 77518 77518: FEJA Solar 09034 Gar Creek 11,361 357 100% 11,361 357
Distribution Capacity Expansion Unique 77520 77520: FEJA Solar 09036 Gar Creek 2 28,826 474 100% 28,826 474
Distribution Capacity Expansion Unique 78636 78636: 6P200653 J3126 4/12 Conversion 164,829 0 100% 164,829 0
Distribution Capacity Expansion Unique 79161 79161-6P220406-PSA J3693 8,235 2,745 100% 8,235 2,745
Distribution Capacity Expansion Unique 79696 79696: Install 3rd TR (40MVA) at ZION 1,922,625 12,102 100% 1,922,625 12,102
Capacity Expansion Total 255,468,216 15,990,955 255,468,216 15,990,955
Distribution Corrective Maintenance Blanket 5083 5083: CE-Reinforce Reject Dist Poles 1,693,387 221,141 100% 1,693,387 221,141
Distribution Corrective Maintenance Blanket 5084 5084: CE-Replace Reject Dist Poles 34,601,436 4,955,575 100% 34,601,436 4,955,575
Distribution Corrective Maintenance Unique 5084 5084: CE-Replace Reject Dist Poles 947,696 144,396 100% 947,696 144,396
Distribution Corrective Maintenance Unique 5223 5223: CE-Replace vault roofs 3,899,157 349,283 100% 3,899,157 349,283
Distribution Corrective Maintenance Blanket 5244 5244: CE-Repair/Replace Municipal Street Lights 3,943,335 550,687 100% 3,943,335 550,687
Distribution Corrective Maintenance Blanket 5346 5346: CE-Distrib Transformers-Corrective Maint 15,418,557 1,983,724 100% 15,418,557 1,983,724
Distribution Corrective Maintenance Unique 5780 5780: CE-Locate and mark underground facilities 430,628 11,227 100% 430,628 11,227
Distribution Corrective Maintenance Unique 5914 5914: Distr-Repair Relay,Comms & SCADA for Emergent CM items 73,774 187,175 100% 73,774 187,175
Distribution Corrective Maintenance Unique 6620 6620-CE-Dist Deployment - Temp Power 35,071 0 100% 35,071 0
Distribution Corrective Maintenance Unique 10137 10137: D-CE Replc Substa Batteries & Chgrs Emergnt 83,966 3,529 100% 83,966 3,529
Distribution Corrective Maintenance Blanket 10623 10623: CE-Dist Cable Fault Repair 8,928,095 1,183,934 100% 8,928,095 1,183,934
Distribution Corrective Maintenance Unique 16443 16443: COMED Substation CM (<$100k) - CAPITAL 22,849 5,712 100% 22,849 5,712
Distribution Corrective Maintenance Blanket 17182 17182:CE-Line Clearance Backlog Mitigation for LRP 529,569 71,875 100% 529,569 71,875
Distribution Corrective Maintenance Unique 19362 19362: Repair Dist CP (Capital) 712,010 11,365 100% 712,010 11,365
Distribution Corrective Maintenance Blanket 20543 20543: Emergent Replacement of Underground Equipment 39,296,902 5,252,793 100% 39,296,902 5,252,793
Distribution Corrective Maintenance Unique 29102 29102 - COMED Substation CM (<$100k) - CAPITAL-D 18,715,699 4,186,420 100% 18,715,699 4,186,420
Distribution Corrective Maintenance Unique 29202 29202 Repair of UGHVD Emergent CM's 602,561 37,345 100% 602,561 37,345
Docket No. 22-____ComEd Ex. 1.02
Page 153 of 176

WP 19Page 3 of 11
Commonwealth Edison Company
2022 Projected Plant Additions - 2022 Filing Year
(In Dollars)
Functional
ClassInvestment Categoy
Blanket /
UniqueITN ITN Description
Total Additions Total Removal Costs
Jurisdic
ational
%
Jurisdictional
Additions
Jurisdictional
Removal Costs
Distribution Corrective Maintenance Unique 29204 29204 Repair of UGHVD CM's 826,305 26,188 100% 826,305 26,188
Distribution Corrective Maintenance Unique 29250 29250:Repair OHHVD CM Items associated w/ FEG out 1,291,186 176,529 100% 1,291,186 176,529
Distribution Corrective Maintenance Unique 29254 29254:Repair OHVVD Emergent CM Defects 101,489 70,246 100% 101,489 70,246
Distribution Corrective Maintenance Blanket 30422 30422: CE-Overhead Non-Emergent CM's 27,762,113 4,955,122 100% 27,762,113 4,955,122
Distribution Corrective Maintenance Unique 30577 30577: ComEd SPCC Plan Deficiency Solutions (Dist) 209,691 7,043 100% 209,691 7,043
Distribution Corrective Maintenance Unique 41920 41920: HVD Repair Cathodic Protection (Capital) 462,830 63,378 100% 462,830 63,378
Distribution Corrective Maintenance Unique 42236 42236: HV-D Emergent Repair Corrosion (Capital) 49,283 2,323 100% 49,283 2,323
Distribution Corrective Maintenance Blanket 42336 42336: Grade B Construction 576,515 76,462 100% 576,515 76,462
Distribution Corrective Maintenance Blanket 46717 46717: Emergency Pole Replacement 12,945,509 1,844,057 100% 12,945,509 1,844,057
Distribution Corrective Maintenance Blanket 46718 46718: Emergency Transformer Repair and Replacement 13,737,329 1,819,355 100% 13,737,329 1,819,355
Distribution Corrective Maintenance Blanket 46720 46720: Repair Overhead Equipment-Capital 68,293,349 9,335,337 100% 68,293,349 9,335,337
Distribution Corrective Maintenance Blanket 46766 46766: CE - Underground Programmatic CMs 1,253,945 206,619 100% 1,253,945 206,619
Distribution Corrective Maintenance Unique 49252 49252: D-Emergent, TR Replacements 4,215,627 180,872 100% 4,215,627 180,872
Distribution Corrective Maintenance Unique 49390 49390: CM Subs Unique (>$100k) ITNs Budget - D 3,128,404 134,353 100% 3,128,404 134,353
Distribution Corrective Maintenance Unique 50539 50539: CE-Distrib Transformers-Corrective Maint Substation 2,662,792 114,357 100% 2,662,792 114,357
Distribution Corrective Maintenance Unique 50799 5066: ICC Customer Target Program 729,025 96,507 100% 729,025 96,507
Distribution Corrective Maintenance Unique 53047 53047-CE-Storm Restoration-Capital 26,473,124 3,846,131 100% 26,473,124 3,846,131
Distribution Corrective Maintenance Blanket 56375 56375-Voltage Optimization Distribution Corrective Maintenance 718,249 92,409 100% 718,249 92,409
Distribution Corrective Maintenance Unique 57309 57309: Corrective Maintenance Dist LRP Adjustment (143,342) (6,147) 100% (143,342) (6,147)
Distribution Corrective Maintenance Unique 64717 64717: Veg Mgmt - Emergency 344,747 3,569 100% 344,747 3,569
Distribution Corrective Maintenance Unique 68411 68411: Distr CM Capital Emergent Relay and SCADA Replacements 375,490 848 100% 375,490 848
Distribution Corrective Maintenance Unique 76381 76381: SS691 Waveland TR1 Replacement (14,568) 429,959 100% (14,568) 429,959
Distribution Corrective Maintenance Unique 76966 76966: Norridge TR72 Replacement 65,401 16,350 100% 65,401 16,350
Distribution Corrective Maintenance Unique 78813 78813: DCR26 18th Ave TR Bank, Capacitor, Disconnect 22,231 5,557 100% 22,231 5,557
Distribution Corrective Maintenance Unique 79471 79471:Oak Brook TR72 Cable Replacement 366,203 91,549 100% 366,203 91,549
Distribution Corrective Maintenance Unique 79473 79473: York Center 12kV Cap Bank 1 & 2 44,036 11,008 100% 44,036 11,008
Distribution Corrective Maintenance Unique 79476 79476: SS691 Waveland Aux Power 76,331 19,082 100% 76,331 19,082
Distribution Corrective Maintenance Unique 79858 79858:South Holland Firewall 372,719 0 100% 372,719 0
Distribution Corrective Maintenance Unique 79872 79872: DCE69 Rolling Meadows Firewall 32,061 0 100% 32,061 0
Corrective Maintenance Total 296,912,769 42,775,245 296,912,769 42,775,245
Distribution Customer Advances Unique 00000 00000: Customer Advance 16,227,816 0 100% 16,227,816 0
Customer Advances Total 16,227,816 0 16,227,816 0
Distribution Customer Operations Blanket 35803 35803:ComEd Cust Fld Ops F&MS Capital 174,604 23,020 100% 174,604 23,020
Distribution Customer Operations Blanket 35805 35805: ComEd Cust Fld Ops F&MS Capital 171,402 22,598 100% 171,402 22,598
Distribution Customer Operations Blanket 35809 35809: ComEd Cust Fld Ops F&MS Capital 37,649 123,466 100% 37,649 123,466
Distribution Customer Operations Blanket 35994 35994: ComEd Cust Fld Ops F&MS Capital 10,199,918 1,344,789 100% 10,199,918 1,344,789
Distribution Customer Operations Unique 36180 36180: ComEd Cust Fld Ops F&MS Capital 426,433 0 100% 426,433 0
Distribution Customer Operations Blanket 38136 38136: ComEd Customer Field Ops F&MS Capital 902,247 186,338 100% 902,247 186,338
Distribution Customer Operations Unique 49498 49498 - ComEd Cust Fld Ops F&MS Capital (327,345) (14,696) 100% (327,345) (14,696)
Distribution Customer Operations Unique 59859 59859: Removal of service drop from aged pole cut 77,688 3,299 100% 77,688 3,299
Customer Operations Total 11,662,596 1,688,815 11,662,596 1,688,815
Distribution Facility Relocation Unique 19742 19742: ComEd FR Projects >$100K Regionally Managed 12,011,486 0 100% 12,011,486 0
Distribution Facility Relocation Unique 33053 33053: Will Cty 135th St, Emily to Smith 129,880 27,742 100% 129,880 27,742
Distribution Facility Relocation Unique 46100 46100: Kane County - Bunker Rd Extension from Keslinger to LaFox 12,027 0 100% 12,027 0
Distribution Facility Relocation Unique 50356 50356: IDOT WIllow Rd Sanders to East of Des Plains River Rd 49,394 0 100% 49,394 0
Distribution Facility Relocation Unique 51671 51671: Will County - Bell Rd. 151st. to 159th 127,922 28,227 100% 127,922 28,227
Distribution Facility Relocation Unique 56899 56899: PI - Harvey - IDOT 60Y72 - Wood Street Reconstruction 2,763,552 0 100% 2,763,552 0
Distribution Facility Relocation Unique 58097 58097 EOWA N06 Relocation 113,680 25,133 100% 113,680 25,133
Distribution Facility Relocation Unique 59440 59440: Alsip-Cal-Sag Greenway Trl 46,899 10,867 100% 46,899 10,867
Distribution Facility Relocation Unique 59793 59793: IDOT - Alsip - IL 83 over Tinley Creek 885,852 205,897 100% 885,852 205,897
Distribution Facility Relocation Unique 62645 62645: FR - Miller Road Roadway Widening and Traffic Signal Improvements, Villa 12,873 3,218 100% 12,873 3,218
Distribution Facility Relocation Unique 64571 64571: Montrose Street Bridge Permanent Relocation 2,554,792 265,450 100% 2,554,792 265,450
Distribution Facility Relocation Unique 64837 64837: FR-ELGIN - SUMMIT AND DUNDEE INTERSECTION IMPROVEMEN 41,253 0 100% 41,253 0
Distribution Facility Relocation Unique 65215 65215: REIM ALGONQUIN - HARRISON ST - WASHINGTON ST -IL 62 - Streetscape 260,209 57,656 100% 260,209 57,656
Distribution Facility Relocation Unique 65615 65615: IDOT IL RT 83 from IL RT 120 to IL RT 137 & @ Atkinson Rd 663,444 158,929 100% 663,444 158,929
Distribution Facility Relocation Unique 65664 65664: FR - Woodstock South /Madison/Lake Roundabout 75,329 18,011 100% 75,329 18,011
Distribution Facility Relocation Unique 65786 65786: Oliphant & Pratt - PN7115 74,781 31,513 100% 74,781 31,513
Distribution Facility Relocation Unique 67232 67232: Joliet and 55th 381,193 88,963 100% 381,193 88,963
Distribution Facility Relocation Unique 67498 67498: REIMB EOWA 4712 (S29) I294 to Franklin Ave 55,218 13,236 100% 55,218 13,236
Distribution Facility Relocation Unique 67761 67761 : Customer - 75th Street Modifications 122,581 29,872 100% 122,581 29,872
Distribution Facility Relocation Unique 67902 67902: FR- AURORA - E NEW YORK RD; IDOT 61G58 766,797 187,140 100% 766,797 187,140
Distribution Facility Relocation Unique 67932 67932 : 60X94 - Adams & Jackson Bridges 664,075 75,697 100% 664,075 75,697
Distribution Facility Relocation Unique 68005 68005: PLEASANT VALLEY - IDOT IL 47 AND IL 176 23,878 0 100% 23,878 0
Distribution Facility Relocation Unique 68332 68332: Roberts Road, Valley Drive to 87th 194,931 47,082 100% 194,931 47,082
Distribution Facility Relocation Unique 68531 68531: 80th from 183rd to 191st 222,974 52,992 100% 222,974 52,992
Distribution Facility Relocation Unique 69106 69106: CDWM-Sewer: Hamilton & Morse - PN7155 257,721 61,513 100% 257,721 61,513
Distribution Facility Relocation Blanket 69164 69164: ComEd Facility Relocation Baseline Capital Work 5,926,436 1,413,536 100% 5,926,436 1,413,536
Distribution Facility Relocation Unique 69924 69924: Customer Improvements Essex Driv 280,173 0 100% 280,173 0
Distribution Facility Relocation Unique 74715 74715: Armour Rd Structure Replacement 60,391 14,414 100% 60,391 14,414
Distribution Facility Relocation Unique 74727 74727: 175th and Ridgeland 999,718 242,654 100% 999,718 242,654
Distribution Facility Relocation Unique 74729 74729: Glenwood Dyer Road 258,677 62,102 100% 258,677 62,102
Distribution Facility Relocation Unique 74790 74790: Cermak Rd Vertical Clearance 89,356 21,760 100% 89,356 21,760
Distribution Facility Relocation Unique 74807 74807: Homan btwn Monroe & Washington 7481 134,731 32,433 100% 134,731 32,433
Distribution Facility Relocation Unique 74831 74831:REIMB ISTHA CTS I294 @ Hinsdale Oasis Pole Relocation 12,115 2,884 100% 12,115 2,884
Distribution Facility Relocation Unique 74960 74960: IDOT Nish Rd and IL 176 205,745 49,007 100% 205,745 49,007
Distribution Facility Relocation Unique 75162 75162: Franklin Ave across Silver Creek @ Franklin Park – 61G76 (Advance) 805,764 196,102 100% 805,764 196,102
Distribution Facility Relocation Unique 75265 75265:REIMB EOWA UP01-S08/09 OVHD TO UG RELOCATION 63,389 15,115 100% 63,389 15,115
Distribution Facility Relocation Unique 75792 75792 - FR - 129 & Coal City Rd 1,052,982 259,777 100% 1,052,982 259,777
Distribution Facility Relocation Unique 75935 75935: Melrose btwn California & Sacramento 26,033 0 100% 26,033 0
Distribution Facility Relocation Unique 76110 76110 - FR Houbolt Rd at I-80 Interchange 77,535 19,108 100% 77,535 19,108
Distribution Facility Relocation Unique 76166 76166: FREEPORT - ADAMS AVENUE RECONSTRUCTION FLOAT TO ARCADE 37,283 0 100% 37,283 0
Distribution Facility Relocation Unique 76315 76315 Laraway Rd - Cedar to Stonebridge Dr 63,757 15,652 100% 63,757 15,652
Distribution Facility Relocation Unique 76550 76550 IDOT Shorewood IL 59 & I-55 406,415 97,309 100% 406,415 97,309
Distribution Facility Relocation Unique 76783 76783: Belvidere Logan Ave 35,491 8,644 100% 35,491 8,644
Distribution Facility Relocation Unique 76960 76960: IDOT IL 75 2 CULVERT-TOWER RD FREEPORT 576,821 139,838 100% 576,821 139,838
Distribution Facility Relocation Unique 76990 76990 - FR Will CO - Cedar Rd - Francis Rd to Lenox St 51,233 12,709 100% 51,233 12,709
Distribution Facility Relocation Unique 77289 77289 - PLAINFIELD - 143RD ST FROM RTE 59 TO RTE 126 35,716 8,764 100% 35,716 8,764
Distribution Facility Relocation Unique 77332 77332 - Lockport 9th Street 190,789 47,697 100% 190,789 47,697
Distribution Facility Relocation Unique 77361 77361 : Oakbrook; Windsor Dr over Tollway NON-REIMB 178,789 43,747 100% 178,789 43,747
Distribution Facility Relocation Unique 77381 77381:Sandwich - Latham Street Reconstruction 551,618 131,873 100% 551,618 131,873
Distribution Facility Relocation Unique 77383 77383: REIM Big Rock Dauberman Road Ext US 30 - Granart Rd - RR Grade Separation 127,603 13,310 100% 127,603 13,310
Distribution Facility Relocation Unique 77512 77512:Bliss Rd./Main St./Fabyan Pkwy. Intersection Realignment & Improvement 176,649 42,287 100% 176,649 42,287
Distribution Facility Relocation Unique 77529 77529 : Lake Cook Rd switchgear Relo NON-REIMB 140,634 34,915 100% 140,634 34,915
Distribution Facility Relocation Unique 77594 77594: REIMB - ISTHA CTS I294 @ Edgewood & Crescent Pedestal Relocation (24,937) 0 100% (24,937) 0
Distribution Facility Relocation Unique 77695 77695 : Halsted btwn 51st & Garfield - CDWM 155,961 0 100% 155,961 0
Distribution Facility Relocation Unique 77941 77941:IDOT IL RT 132 DRY LAND BRIDGE 395,237 95,150 100% 395,237 95,150
Distribution Facility Relocation Unique 78501 78501: REIM ISTHA CTS I294 South of Cork Ave (20,061) 0 100% (20,061) 0
Distribution Facility Relocation Unique 78537 78537:HANOVER PK - IL-19 @ BARRINGTON RD - INTER IMPR (62K02) 287,907 69,021 100% 287,907 69,021
Distribution Facility Relocation Unique 78539 78539:IRVING PK & BARTLETT RD ROADWAY IMPROV (IDOT 61H15) 239,220 57,368 100% 239,220 57,368
Distribution Facility Relocation Unique 78560 78560: I-57 over Grinnell Rd 197,453 48,617 100% 197,453 48,617
Distribution Facility Relocation Unique 78564 78564: FR - STR - E 2700 N ROAD & N 3500 E ROAD 24,789 6,197 100% 24,789 6,197
Distribution Facility Relocation Unique 78566 78566: Galena Rd. & Kennedy Rd. Intersection Improv. 14,691 3,584 100% 14,691 3,584
Distribution Facility Relocation Unique 78622 78622 : Division btwn Elston & Cleveland 406,996 97,610 100% 406,996 97,610
Distribution Facility Relocation Unique 78624 78624 : Franklin Ave OH Relocation - Main Contract - 61G76 479,931 99,644 100% 479,931 99,644
Docket No. 22-____ComEd Ex. 1.02
Page 154 of 176

WP 19Page 4 of 11
Commonwealth Edison Company
2022 Projected Plant Additions - 2022 Filing Year
(In Dollars)
Functional
ClassInvestment Categoy
Blanket /
UniqueITN ITN Description
Total Additions Total Removal Costs
Jurisdic
ational
%
Jurisdictional
Additions
Jurisdictional
Removal Costs
Distribution Facility Relocation Unique 78696 78696:W North and N Washington 98,755 23,703 100% 98,755 23,703
Distribution Facility Relocation Unique 78708 78708: 55th St, I-294 to Plainfield 250,890 61,808 100% 250,890 61,808
Distribution Facility Relocation Unique 78784 78784 : Canal btwn Madison & Taylor 84,476 0 100% 84,476 0
Distribution Facility Relocation Unique 78788 78788: FR-Skokie- Gross Point Rd; IL 58 to Old Orchard Rd NON-REIMB 8,771 2,187 100% 8,771 2,187
Distribution Facility Relocation Unique 78792 78792 : Brookfield Phase 2 23,299 5,825 100% 23,299 5,825
Distribution Facility Relocation Unique 78794 78794: J3970 & J3688 BORES ACROSS I-80 38,622 4,275 100% 38,622 4,275
Distribution Facility Relocation Unique 78827 78827:FR - Customer - ALLEY RELOCATION 175,882 42,679 100% 175,882 42,679
Distribution Facility Relocation Unique 78908 78908: FR - IDOT 60X57 - IL 60 AT WILSON RD 461,045 111,856 100% 461,045 111,856
Distribution Facility Relocation Unique 78920 78920 : FR - ROCKFORD E STATE ST & NEW TOWNE DR 96,460 23,817 100% 96,460 23,817
Distribution Facility Relocation Unique 78950 78950: RDWY RECONSTRUCTION BLOOMINGDALE RD-ROHLWING 15POLES 25,046 6,243 100% 25,046 6,243
Distribution Facility Relocation Unique 78953 78953: Rand Rd, Central Rd, Mt. Prospect Rd Improvements NON-REIMB 16,225 4,034 100% 16,225 4,034
Distribution Facility Relocation Unique 79197 79197: FR - Brisbin Rd 17,778 4,445 100% 17,778 4,445
Distribution Facility Relocation Unique 79498 79498 : Berwyn - East btwn Stanley & Windsor 399,867 97,551 100% 399,867 97,551
Distribution Facility Relocation Unique 79502 79502 : LCDOT - DARRELL RD - CASE RD TO FISHER RD 20,403 0 100% 20,403 0
Distribution Facility Relocation Unique 79614 79614 : IDOT - IL 78 OVER PLUM RIVER SOUTH OF STOCKTON 113,431 28,282 100% 113,431 28,282
Distribution Facility Relocation Unique 79673 79673 : Glen Ellyn, Duane St, Hillside Ave and Main Street Improvements REIM 16,090 4,012 100% 16,090 4,012
Facility Relocation Total 39,082,812 5,212,682 39,082,812 5,212,682
Distribution New Business Blanket 5968 5968: Inside Chicago Baseline 490,277 109,322 100% 490,277 109,322
Distribution New Business Blanket 5972 5972: Outside Chicago Baseline 2,189,375 355,615 100% 2,189,375 355,615
Distribution New Business Blanket 13507 13507: O'Hare Modernization Program 1,488,407 69,349 100% 1,488,407 69,349
Distribution New Business Unique 24143 24143: CE Distrib Transformers-New Business 12,681,163 199,139 100% 12,681,163 199,139
Distribution New Business Unique 42016 42016: Engineering Estimate Capital (735,115) (20,708) 100% (735,115) (20,708)
Distribution New Business Unique 45764 45764 - Preauthorized EPS Projects - NB 459,366 0 100% 459,366 0
Distribution New Business Unique 45806 45806-NBLP-Customer (PERM SERV) 121,728 0 100% 121,728 0
Distribution New Business Unique 46056 46056-NBLP-5847 N BROADWAY CTA SUBSTATION 299,129 31,631 100% 299,129 31,631
Distribution New Business Unique 46207 46207: New Business West Electric Unspecified projects - Chicago 5,911,398 0 100% 5,911,398 0
Distribution New Business Unique 46211 46211: New Business West Electric Unspecified projects - Suburban 6,993,070 0 100% 6,993,070 0
Distribution New Business Unique 46520 46520-NBLP 40 E. Garfield - Data Center 569,991 0 100% 569,991 0
Distribution New Business Unique 48977 48977: Winnetka Switchgear Replacement 337,392 6,424 100% 337,392 6,424
Distribution New Business Blanket 49460 49460: NB City RES 12,236,063 716,855 100% 12,236,063 716,855
Distribution New Business Blanket 49461 49461: NB City COM 14,035,665 948,454 100% 14,035,665 948,454
Distribution New Business Blanket 49462 49462: NB Sub RES 61,873,828 3,862,939 100% 61,873,828 3,862,939
Distribution New Business Blanket 49463 49463: NB Sub COM 41,169,680 2,520,737 100% 41,169,680 2,520,737
Distribution New Business Unique 49739 49739-NBLP-433 W Van Buren - New Vaults 2,019,622 3,859 100% 2,019,622 3,859
Distribution New Business Unique 50041 50041:NBLP- Customer Data center # 4 490,386 0 100% 490,386 0
Distribution New Business Unique 50153 50153:NBLP-IDOT PS# 4 897,569 29,839 100% 897,569 29,839
Distribution New Business Unique 50164 50164:NBLP-Customer 824,089 20,815 100% 824,089 20,815
Distribution New Business Unique 51686 51686-NBLP Customer 185,694 0 100% 185,694 0
Distribution New Business Unique 51701 51701 - NBLP 220 E Illinois 657,686 0 100% 657,686 0
Distribution New Business Unique 51967 51967 - NBLP - 727 W Madison - Perm Service 216,823 4,126 100% 216,823 4,126
Distribution New Business Unique 52712 52712 - NBLP - 451 E Grand - Streeterville 1,051,873 5,033 100% 1,051,873 5,033
Distribution New Business Unique 52969 52969-NBLP 1634 W DIVISION-RELOCATION 198,432 21,264 100% 198,432 21,264
Distribution New Business Unique 53525 53525-NBLP-156 N Jefferson Relocation 234,676 23,873 100% 234,676 23,873
Distribution New Business Unique 55503 55503: LPEC Project Tatooine 1,554,514 0 100% 1,554,514 0
Distribution New Business Unique 55660 55660: NBLP 1000 S Michigan Perm 412,857 0 100% 412,857 0
Distribution New Business Blanket 56167 56167: NB Third Party Attachment 12,538,655 707,011 100% 12,538,655 707,011
Distribution New Business Unique 56167 56167: NB Third Party Attachment 1,571,752 209,130 100% 1,571,752 209,130
Distribution New Business Unique 56667 56667 NBCN: 30 W Chicago 722,356 34,759 100% 722,356 34,759
Distribution New Business Unique 56682 56682-NBLP-1220 W VAN BUREN (PERM SERV) 166,013 0 100% 166,013 0
Distribution New Business Unique 56736 56736:NBLP second Northwestern Research 125,616 7,083 100% 125,616 7,083
Distribution New Business Unique 56822 56822 NBCS - 2500 S. Paulina St. 568,394 0 100% 568,394 0
Distribution New Business Unique 56893 56893-NBLP-Clark/Roosevelt Development 12,201,448 84,369 100% 12,201,448 84,369
Distribution New Business Unique 57250 57250: New Business LRP Adjustment (6,438,807) (121,160) 100% (6,438,807) (121,160)
Distribution New Business Unique 57377 57377-NBLP-333 N GREEN (PERM SERV) 789,785 0 100% 789,785 0
Distribution New Business Unique 57873 57873-NBLP-160 N Morgan Relocation 87,534 9,664 100% 87,534 9,664
Distribution New Business Unique 57964 57964 - NBLP - PERM 877,025 0 100% 877,025 0
Distribution New Business Unique 57995 57995 - NBLP - 51 E. 14TH ST. PERM SERVICE 1,275,069 28,986 100% 1,275,069 28,986
Distribution New Business Unique 58144 58144-NBLP-167 N GREEN ST-PERM SERVICE 617,333 0 100% 617,333 0
Distribution New Business Unique 58211 58211-NBLP 160 N Morgan Perm 845,045 46,232 100% 845,045 46,232
Distribution New Business Unique 58217 58217-NBLP 320 S Clinton Perm 290,621 0 100% 290,621 0
Distribution New Business Unique 58413 58413-NBLP-4849 N Lipps Perm 135,503 0 100% 135,503 0
Distribution New Business Unique 58426 58426 - NBLP - 167 N GREEN ST RELO PART II 656,686 0 100% 656,686 0
Distribution New Business Unique 58597 58597:NBLP Customer 338,366 0 100% 338,366 0
Distribution New Business Unique 58606 58606: NBCN 128 S Laflin-PERM 813,582 8,150 100% 813,582 8,150
Distribution New Business Unique 58719 58719: NBLP Customer New Garage 826,980 28,633 100% 826,980 28,633
Distribution New Business Unique 58887 58887: NBCN 652 N Morgan 285,832 7,965 100% 285,832 7,965
Distribution New Business Unique 59007 59007: NBCN 2020 S Clark - PERM 129,455 0 100% 129,455 0
Distribution New Business Unique 59011 59011: NBCN 163 E Walton 52,626 0 100% 52,626 0
Distribution New Business Unique 59424 59424: NBLP 5050 N Broadway 37,776 0 100% 37,776 0
Distribution New Business Unique 59484 59484: NBLP 2055 W Pershing 413,074 0 100% 413,074 0
Distribution New Business Unique 59595 59595: NBLP 520 S MAPLE AVE - Feeder Relief 652,832 0 100% 652,832 0
Distribution New Business Unique 62063 62063: NBCN 620 W Diversey 41,392 0 100% 41,392 0
Distribution New Business Unique 62734 62734 - NBLP - 210 N Stetson - Perm Service 166,032 0 100% 166,032 0
Distribution New Business Unique 62980 62980 - NBLP - Customer New Vaults 268,282 0 100% 268,282 0
Distribution New Business Unique 62993 62993-NBLP Customer RPM Stations 292,285 4,473 100% 292,285 4,473
Distribution New Business Unique 63025 63025: NBLP 732 W Randolph 564,700 22,826 100% 564,700 22,826
Distribution New Business Unique 63027 63027: NBCN 119 N Peoria 183,064 8,559 100% 183,064 8,559
Distribution New Business Unique 63029 63029: NBCN 19 N May 159,436 33,758 100% 159,436 33,758
Distribution New Business Unique 63052 63052: Install New J365 Bluff Road 121,225 0 100% 121,225 0
Distribution New Business Unique 63055 63055 - NBLP - Lincoln Yards - Phase 4 & 5 Relocation 362,652 0 100% 362,652 0
Distribution New Business Unique 63057 63057 - NBLP - 800 W Fulton Market - Perm Service 841,416 0 100% 841,416 0
Distribution New Business Unique 64438 64438 - NBLP - 2050 W Ogden - Customer Phase 2 1,277,151 0 100% 1,277,151 0
Distribution New Business Unique 64658 64658 - NBLP - 320 N SANGAMON 1,023,356 0 100% 1,023,356 0
Distribution New Business Unique 64954 64954 - NBLP - 2700 N SHEFFIELD 592,785 20,888 100% 592,785 20,888
Distribution New Business Unique 65045 65045: NBLP TOLLPLAZA 306 ATO 250,270 14,433 100% 250,270 14,433
Distribution New Business Unique 65190 65190-NBLP Customer PERM 2,095,505 0 100% 2,095,505 0
Distribution New Business Unique 65478 65478-NBLP-4104 Harlem Customer 756,944 0 100% 756,944 0
Distribution New Business Unique 65765 65765-NBLP Existing Customer Renovation 1,257,280 113,643 100% 1,257,280 113,643
Distribution New Business Unique 65769 65769: NBCN 1133 W Fulton Market 390,692 17,428 100% 390,692 17,428
Distribution New Business Unique 65776 65776: NBCN 1461 S Blue Island 1,630,106 20,460 100% 1,630,106 20,460
Distribution New Business Unique 65780 65780- NBLP 180 W Randolph 381,310 0 100% 381,310 0
Distribution New Business Unique 65795 65795: NBCN 1421-27 N Milwaukee 299,313 15,096 100% 299,313 15,096
Distribution New Business Unique 65823 65823: NBCN 154 N Damen 2nd Feed 127,311 10,115 100% 127,311 10,115
Distribution New Business Unique 65826 65826: NBCN 5440 N Sheridan 266,654 3,952 100% 266,654 3,952
Distribution New Business Unique 65841 65841-NBLP-Customer RELO 270,046 10,519 100% 270,046 10,519
Distribution New Business Unique 65843 65843-NBLP-2121 W. TAYLOR RELO 158,206 0 100% 158,206 0
Distribution New Business Unique 65850 65850 - NBLP - 410 S Wabash - Perm Service 102,292 0 100% 102,292 0
Distribution New Business Unique 65879 65879: NBCS 100-680 W North Ave 672,884 0 100% 672,884 0
Distribution New Business Unique 65895 65895: LPSW Customer Retirement Phase 2 172,154 43,038 100% 172,154 43,038
Distribution New Business Unique 66106 66106: LPSW Customer 112,404 1,703 100% 112,404 1,703
Distribution New Business Unique 66223 66223 - NBCS - 5451 W 64TH PL 709,029 34,640 100% 709,029 34,640
Distribution New Business Unique 66467 66467: LPSW 1 W Quincy Ave Westmont 202,916 45,088 100% 202,916 45,088
Distribution New Business Unique 66779 66779: LPNE Optima Line Extension 204,643 11,492 100% 204,643 11,492
Distribution New Business Unique 66849 66849: Customer 8,673,152 117,051 100% 8,673,152 117,051
Docket No. 22-____ComEd Ex. 1.02
Page 155 of 176

WP 19Page 5 of 11
Commonwealth Edison Company
2022 Projected Plant Additions - 2022 Filing Year
(In Dollars)
Functional
ClassInvestment Categoy
Blanket /
UniqueITN ITN Description
Total Additions Total Removal Costs
Jurisdic
ational
%
Jurisdictional
Additions
Jurisdictional
Removal Costs
Distribution New Business Unique 67011 67011: NBLP 345 N Morgan 307,027 0 100% 307,027 0
Distribution New Business Unique 67188 67188 - NBLP - 354 N Union Ave Perm 547,815 21,629 100% 547,815 21,629
Distribution New Business Unique 67315 67315-NBLP Customer Relocations 1,075,174 114,159 100% 1,075,174 114,159
Distribution New Business Unique 67399 67399-NBLP-164 N. Peoria St. Perm Service 1,098,450 33,912 100% 1,098,450 33,912
Distribution New Business Unique 67640 67640 - NBLP - 400 N ABERDEEN ST 148,955 0 100% 148,955 0
Distribution New Business Unique 67684 67684: LPSW CUSTOMER MATTESON OFFSITE 2,257,491 0 100% 2,257,491 0
Distribution New Business Unique 67704 67704-NBLP CUSTOMER 960,109 44,453 100% 960,109 44,453
Distribution New Business Unique 67918 67918-NBLP 749 N Franklin 224,186 0 100% 224,186 0
Distribution New Business Unique 67966 67966: NBLP 1100 W Randolph Perm Service 15,918 0 100% 15,918 0
Distribution New Business Unique 68197 68197 - NBLP - 234 W. Polk St Perm 660,886 12,125 100% 660,886 12,125
Distribution New Business Unique 68203 68203 - NBLP - Customer Perm 1,142,075 10,432 100% 1,142,075 10,432
Distribution New Business Unique 68205 68205 - NBLP - Customer Perm 608,230 6,086 100% 608,230 6,086
Distribution New Business Unique 68210 68210: NBLP 1041 W. FULTON 63,634 0 100% 63,634 0
Distribution New Business Unique 68277 68277: LPNE Customer 268,539 14,729 100% 268,539 14,729
Distribution New Business Unique 68361 68361: NBLP - 4611 N Broadway 930,534 29,728 100% 930,534 29,728
Distribution New Business Unique 68406 68406: NBLP Lincoln Yards Perm Services 1,163,416 7,992 100% 1,163,416 7,992
Distribution New Business Unique 68450 68450-NBLP CUSTOMER BUILDING 495,932 0 100% 495,932 0
Distribution New Business Unique 68456 68456-NBLP CUSTOMER REMOVALS 92,080 109,321 100% 92,080 109,321
Distribution New Business Unique 68463 68463: NBLP- 1140 W Erie Perm 333,480 13,076 100% 333,480 13,076
Distribution New Business Unique 68513 68513-NBLP-1401 S WABASH 232,044 0 100% 232,044 0
Distribution New Business Unique 68731 68731: NBCN 233 E Riverwalk 458,550 0 100% 458,550 0
Distribution New Business Unique 68841 68841 NBLP Avenue O Relo Phase 2 23,480 93,931 100% 23,480 93,931
Distribution New Business Unique 68909 68909 - NBLP - 333 W WOLF POINT PLAZA, SOUTH TWR (SALESFORCE TOWER) - PERM SERV 2,307,584 0 100% 2,307,584 0
Distribution New Business Unique 68944 68944: 69kV Manhole Relo - Customer Expansion 30,712 340 100% 30,712 340
Distribution New Business Unique 69011 69011 NBLP: 2159 W. PERSHING - Perm 194,456 10,965 100% 194,456 10,965
Distribution New Business Unique 69204 69204 - NBLP - 703 MADISON ST, OAK PARK (PERM SERV) 636,446 7,389 100% 636,446 7,389
Distribution New Business Unique 69209 69209 NBLP: 38 W. 64th Street - Perm 208,121 11,735 100% 208,121 11,735
Distribution New Business Unique 69226 69226 - NBLP - S EUCLID AVE & MADISON ST, OAK PARK - RELOCATION 1,190,221 129,612 100% 1,190,221 129,612
Distribution New Business Unique 69275 69275:LPSE CUSTOMER HICKORY HILLS 14,688 0 100% 14,688 0
Distribution New Business Unique 69304 69304: LPEC Project Post Hoffman Estates 2,716,500 147,218 100% 2,716,500 147,218
Distribution New Business Unique 69489 69489: LPFR CUSTOMER REVISION 256,975 28,549 100% 256,975 28,549
Distribution New Business Unique 69501 69501: NBLP 4715 W Irving Park Rd - Perm 86,942 4,902 100% 86,942 4,902
Distribution New Business Unique 69564 69564: LPSW CUSTOMER-OFFSITE 2,271,324 66,861 100% 2,271,324 66,861
Distribution New Business Unique 69586 69586: LPSW BRANDON RD CENTERPOINT FINAL RELOCATION (46,162) (11,881) 100% (46,162) (11,881)
Distribution New Business Unique 69640 69640 - NBLP - Ferrero 3401 Mount Prospect Rd Chiller Project 350,427 (6,306) 100% 350,427 (6,306)
Distribution New Business Unique 69645 69645:NBRR INTERSTATE Feeder Relief & Line Ext. 1,019,509 57,487 100% 1,019,509 57,487
Distribution New Business Unique 69659 69659-NB CS 2310 S State St. 234,270 0 100% 234,270 0
Distribution New Business Unique 69883 69883: NBCN 932 W Randolph 479,846 52,379 100% 479,846 52,379
Distribution New Business Unique 74924 74924 : NBEC HELEN RD RELOCATION 13,890 731 100% 13,890 731
Distribution New Business Unique 74979 74979: LPEC CUSTOMER ATO REMOVAL 357,554 19,323 100% 357,554 19,323
Distribution New Business Unique 75041 75041: LPSW Joliet CUSTOMER Phase I 2,979,473 148,217 100% 2,979,473 148,217
Distribution New Business Unique 75123 75123 : NBFR CUSTOMER RELOCATION 34,469 1,756 100% 34,469 1,756
Distribution New Business Unique 75325 75325: LPSW CUSTOMER Grasskamp 1,103,635 2,079 100% 1,103,635 2,079
Distribution New Business Unique 75563 75563: NBLP 224 N Ada Relo 99,157 57,258 100% 99,157 57,258
Distribution New Business Unique 75671 75671: NBCS 4830 S Western 334,180 0 100% 334,180 0
Distribution New Business Unique 75717 75717 NBCN: 315 S Racine 533,646 0 100% 533,646 0
Distribution New Business Unique 75733 75733: LPSW CUSTOMER NewService 96,648 0 100% 96,648 0
Distribution New Business Unique 75740 75740: NBCS 2941 S King Dr 208,611 0 100% 208,611 0
Distribution New Business Unique 75748 75748-NBLP 2306 S INDIANA AVE 171,620 0 100% 171,620 0
Distribution New Business Unique 75751 75751: NBCS 1427 OAK PARK AV BERWYN 336,635 0 100% 336,635 0
Distribution New Business Unique 75759 75759:NBEC 400 ROSELLE LLC 113,949 5,603 100% 113,949 5,603
Distribution New Business Unique 75773 75773:NBSW LINCOLN HWY RELO 30,900 3,731 100% 30,900 3,731
Distribution New Business Unique 75775 75775: NBLP-Project AAA 22,352,065 1,125,436 100% 22,352,065 1,125,436
Distribution New Business Unique 75806 75806 NBCN: 1400 W Randolph 1,182,979 10,017 100% 1,182,979 10,017
Distribution New Business Unique 75808 75808 NBCN: 1433 N Halsted 384,212 0 100% 384,212 0
Distribution New Business Unique 75810 75810 NBCN: 1454 W Randolph 591,879 0 100% 591,879 0
Distribution New Business Unique 75833 75833: LPSW CUSTOMER 875 Windham Off Prop 2,242,267 0 100% 2,242,267 0
Distribution New Business Unique 75904 75904 - NBLP - JPSTC 4301 W Chicago Perm Service 455,122 0 100% 455,122 0
Distribution New Business Unique 75958 75958: LPEC Data Center PD 3,130,273 140,772 100% 3,130,273 140,772
Distribution New Business Unique 75963 75963 LPSW CUSTOMER 207,420 15,437 100% 207,420 15,437
Distribution New Business Unique 76001 76001: NBLP 9355 W Grand - CUSTOMER 12,280 47,511 100% 12,280 47,511
Distribution New Business Unique 76037 76037 NBCN: 2501 N Keeler 774,969 0 100% 774,969 0
Distribution New Business Unique 76039 76039: NBCS-2500 W 38th St 593,129 0 100% 593,129 0
Distribution New Business Unique 76119 76119: NBLP 3179 N Clark 531,781 22,157 100% 531,781 22,157
Distribution New Business Unique 76133 76133: LPRR Rockford Library 91,241 15,809 100% 91,241 15,809
Distribution New Business Unique 76173 76173: Richie Road Interconnection 9,108,665 0 100% 9,108,665 0
Distribution New Business Unique 76182 76182 NBLP 160 N Elizabeth 783,710 38,365 100% 783,710 38,365
Distribution New Business Unique 76282 76282: NBLP 7100 LYNDON AVE ROSEMONT 293,724 11,744 100% 293,724 11,744
Distribution New Business Unique 76319 76319: NBCN 6450 N California 69,978 0 100% 69,978 0
Distribution New Business Unique 76323 76323 NBLP: 900 W FULTON MARKET (23,458) 0 100% (23,458) 0
Distribution New Business Unique 76354 76354: LPFR PROJECT PUMPKIN 716,653 0 100% 716,653 0
Distribution New Business Unique 76458 76458 LPSW PROJECT REDWOOD 1,380,751 76,733 100% 1,380,751 76,733
Distribution New Business Unique 76546 76546 NBCN: 555 W Drummond 18,487 0 100% 18,487 0
Distribution New Business Unique 76553 76553: NBCS 44th St & S. Laporte 22,121 2,440 100% 22,121 2,440
Distribution New Business Unique 76597 76597: NBSE- Steger 3400 Chicago Rd 62,225 15,554 100% 62,225 15,554
Distribution New Business Unique 76642 76642 NBCS: 5451 W 64th Pl 36,088 23,180 100% 36,088 23,180
Distribution New Business Unique 76647 76647: NBLP 1131-1135 W Winona Perm 490,928 10,518 100% 490,928 10,518
Distribution New Business Unique 76657 76657: LPRR CUSTOMER Malta 151,603 7,966 100% 151,603 7,966
Distribution New Business Unique 76736 76736 NBCN: 436 N Clark 112,641 0 100% 112,641 0
Distribution New Business Unique 76758 76758: NBCN 114 W Illinois 260,118 0 100% 260,118 0
Distribution New Business Unique 76773 76773: NBCN 920 W Cullerton 105,158 24,841 100% 105,158 24,841
Distribution New Business Unique 76816 76816: NBRD LANSDOWNE SUBD 86 116,397 0 100% 116,397 0
Distribution New Business Unique 76854 76854: NBCN 1050 W Wilson 228,511 0 100% 228,511 0
Distribution New Business Unique 76863 76863 NBLP: 1050 W. Van Buren Perm 732,690 30,255 100% 732,690 30,255
Distribution New Business Unique 76869 76869 NBLP: 168 N ABERDEEN PERM 75,446 0 100% 75,446 0
Distribution New Business Unique 76895 76895: NBCN 1357 W Roosevelt 135,748 3,520 100% 135,748 3,520
Distribution New Business Unique 76904 76904: NBCN 175 W Washington 106,002 0 100% 106,002 0
Distribution New Business Unique 76906 76906: NBCN 1201 W Taylor 119,197 13,451 100% 119,197 13,451
Distribution New Business Unique 76940 76940: LPFR YORKVILLE SANITARY OH TO UG 31,918 20,978 100% 31,918 20,978
Distribution New Business Unique 77015 77015: NBCN 2545 W Polk 901,947 51,422 100% 901,947 51,422
Distribution New Business Unique 77022 77022: NBCN 1710 W Augusta 45,601 11,167 100% 45,601 11,167
Distribution New Business Unique 77027 77027- NBLP- 808 N Cleveland Perm Serv 1,068,432 52,591 100% 1,068,432 52,591
Distribution New Business Unique 77072 77072 NBRD Willow Glens Apts 52,524 0 100% 52,524 0
Distribution New Business Unique 77102 77102: NBLP - 4441 W Irving Park 814,120 45,905 100% 814,120 45,905
Distribution New Business Unique 77105 77105: NBLP - 2540 S Wabash 45,949 2,591 100% 45,949 2,591
Distribution New Business Unique 77139 77139: NBCN 244 E Pershing Rd 119,090 0 100% 119,090 0
Distribution New Business Unique 77281 77281: Richie Road Interconnection - 672,106 37,898 100% 672,106 37,898
Distribution New Business Unique 77293 77293 - NBLP - 550 W RANDOLPH ST (PERM SERVICE) 711,797 37,640 100% 711,797 37,640
Distribution New Business Unique 77322 77322 - NBLP - 741 N WELLS ST (RELOCATION) 180,359 10,170 100% 180,359 10,170
Distribution New Business Unique 77389 77389: NBCN 1802 S State- Perm 202,067 0 100% 202,067 0
Distribution New Business Unique 77426 77426:NBSW CUSTOMER CHANNAHON 172,307 9,068 100% 172,307 9,068
Distribution New Business Unique 77459 77459: NBCN 2003 W Fulton 141,232 7,536 100% 141,232 7,536
Distribution New Business Unique 77526 77526: NBCN 1257 W Roosevelt 186,067 9,980 100% 186,067 9,980
Distribution New Business Unique 77532 77532: LPEC CUSTOMER 3rd Line 855,934 26,914 100% 855,934 26,914
Docket No. 22-____ComEd Ex. 1.02
Page 156 of 176

WP 19Page 6 of 11
Commonwealth Edison Company
2022 Projected Plant Additions - 2022 Filing Year
(In Dollars)
Functional
ClassInvestment Categoy
Blanket /
UniqueITN ITN Description
Total Additions Total Removal Costs
Jurisdic
ational
%
Jurisdictional
Additions
Jurisdictional
Removal Costs
Distribution New Business Unique 77540 77540: NBCN 1146 S Wood 119,684 6,749 100% 119,684 6,749
Distribution New Business Unique 77558 77558: NBEC CUSTOMER Barrington Hills 109,121 5,340 100% 109,121 5,340
Distribution New Business Unique 77598 77598: LPRR CUSTOMER 1,174,589 95,653 100% 1,174,589 95,653
Distribution New Business Unique 77600 77600: LPEC Customer 2nd Line 4,804,445 212,098 100% 4,804,445 212,098
Distribution New Business Unique 77641 77641: NBCS 3300 E 122nd St 48,888 0 100% 48,888 0
Distribution New Business Unique 77643 77643: LPEC Customer Infrastructure 2nd Line 1,272,332 67,730 100% 1,272,332 67,730
Distribution New Business Unique 77645 77645: LPEC Customer2nd Line 1,101,568 58,197 100% 1,101,568 58,197
Distribution New Business Unique 77647 77647: NBCN 862 N Orleans 197,072 11,112 100% 197,072 11,112
Distribution New Business Unique 77789 77789: NBCS 1001 E 103rd St 61,128 15,079 100% 61,128 15,079
Distribution New Business Unique 78243 78243:NBLP - 4441 W Irving Park 181,943 0 100% 181,943 0
Distribution New Business Unique 78246 78246: LPSW Customer Primary Meter 103,041 0 100% 103,041 0
Distribution New Business Unique 78260 78260: Customer Lockport 520,338 0 100% 520,338 0
Distribution New Business Unique 78314 78314 NBLP: 7435 W Talcott - 35,134 0 100% 35,134 0
Distribution New Business Unique 78357 78357: LPSE CUSTOMER COUNTRY CLUB HILLS 541,145 18,922 100% 541,145 18,922
Distribution New Business Unique 78463 78463: NBCN 145 N Damen 93,243 5,258 100% 93,243 5,258
Distribution New Business Unique 78467 78467: NBRD Sheldon Woods Ph1 241,138 0 100% 241,138 0
Distribution New Business Unique 78589 78589 NBLP: 4730 W Irving Park (32,158) 0 100% (32,158) 0
Distribution New Business Unique 78596 78596: NBNE - 437 N Chicago Ave, New Service 49,311 2,780 100% 49,311 2,780
Distribution New Business Unique 78599 78599 - NBLP 644 Madison St - Perm Service 200,061 0 100% 200,061 0
Distribution New Business Unique 78605 78605: NBCN 513 W Fulton 262,673 14,811 100% 262,673 14,811
Distribution New Business Unique 78649 78649: LPSE Dearborn Apt Relo 216,037 24,003 100% 216,037 24,003
Distribution New Business Unique 78674 78674:NBEC - 20168 Rand Rd 23,467 2,606 100% 23,467 2,606
Distribution New Business Unique 78698 78698: NBEC - 2045 S. Arlington Heights 55,681 4,265 100% 55,681 4,265
Distribution New Business Unique 78703 78703: NBLP 1131-1135 W Winona Relo 181,087 5,909 100% 181,087 5,909
Distribution New Business Unique 78750 78750: LPSW Customer 55,160 6,129 100% 55,160 6,129
Distribution New Business Unique 78858 78858: NBCN 513 W Fullerton 52,384 0 100% 52,384 0
Distribution New Business Unique 78946 78946:NBSW - 1040 W Renwick Rd 123,994 0 100% 123,994 0
Distribution New Business Unique 79047 79047: LPSW Customer New Service Morris 651,957 34,991 100% 651,957 34,991
Distribution New Business Unique 79049 79049 LPSW Customer 34kv Relocation 97,206 5,654 100% 97,206 5,654
Distribution New Business Unique 79127 79127: LPSWCustomer Phase I 221,385 12,446 100% 221,385 12,446
Distribution New Business Unique 79130 79130: LPSW Customer Summit 35,482 8,870 100% 35,482 8,870
Distribution New Business Unique 79132 79132: LPFR Project Pie 360,912 20,339 100% 360,912 20,339
Distribution New Business Unique 79156 79156 NBLP: 4441 W Irving Park 109,653 0 100% 109,653 0
Distribution New Business Unique 79159 79159: NBCN 1780 W Peterson 59,216 3,339 100% 59,216 3,339
Distribution New Business Unique 79347 79347: NBSW - 3835 S. Youngs Rd. 122,599 0 100% 122,599 0
Distribution New Business Unique 79360 79360: NBCN 15 N Elizabeth 214,342 0 100% 214,342 0
Distribution New Business Unique 79456 79456: LPEC WHEATON CUSTOMER RELOCATION 34,139 0 100% 34,139 0
Distribution New Business Unique 79516 79516: LPSW Customer Grain New Service 45,670 5,060 100% 45,670 5,060
Distribution New Business Unique 79522 79522: NBCS 8331 S Stewart 270,485 0 100% 270,485 0
Distribution New Business Unique 79529 79529: NBCS 4300 S Calumet 228,098 12,862 100% 228,098 12,862
Distribution New Business Unique 79537 79537 NBLP : 717 S. Wells (35,292) 0 100% (35,292) 0
Distribution New Business Unique 79570 79570: NBCN 513 S Damen 203,901 11,497 100% 203,901 11,497
Distribution New Business Unique 79590 79590: NBCN 1324 W Taylor 185,851 10,479 100% 185,851 10,479
Distribution New Business Unique 79592 79592: NBCN 6 N Carpenter 285,078 16,075 100% 285,078 16,075
Distribution New Business Unique 79599 79599: NBLP - 2159 W Pershing Relo 57,136 3,222 100% 57,136 3,222
Distribution New Business Unique 79653 79653: NBCN 720 S Michigan 275,355 15,526 100% 275,355 15,526
Distribution New Business Unique 79663 79663: NBEC - 2301 Shermer Rd., Northbrook 82,347 4,533 100% 82,347 4,533
Distribution New Business Unique 79708 79708: NBCS 3900 W 43rd 191,246 10,784 100% 191,246 10,784
Distribution New Business Unique 79711 79711: NBCS 317 E 63rd St 213,557 12,042 100% 213,557 12,042
Distribution New Business Unique 79931 79931: NBCN 3649 N Central 17,315 4,317 100% 17,315 4,317
Distribution New Business Unique 79961 79961: NBEC - 405 N. Ardmore, Villa Park (27,258) (4,073) 100% (27,258) (4,073)
New Business Total 325,094,647 14,462,240 325,094,647 14,462,240
Distribution System Performance Unique 4785 4785: Replace 9" Insulator Bells 22,414 23,339 100% 22,414 23,339
Distribution System Performance Unique 4812 4812: Install Substation Wildlife Protection Fence - D 543,998 8,389 100% 543,998 8,389
Distribution System Performance Blanket 4920 4920: Replace Distribution Poor Performing URD Ca 65,297,669 6,180,704 100% 65,297,669 6,180,704
Distribution System Performance Blanket 5066 5066: ICC Customer Target Program 19,383,717 2,035,134 100% 19,383,717 2,035,134
Distribution System Performance Unique 5066 5066: ICC Customer Target Program 4,966,159 324,155 100% 4,966,159 324,155
Distribution System Performance Unique 10136 10136: D-CE Replc Substa Batteries & Chgrs SysPerf 3,500,506 664,389 100% 3,500,506 664,389
Distribution System Performance Blanket 11161 11161: ICC 1% Worst Performing Circuit Program 8,602,591 802,121 100% 8,602,591 802,121
Distribution System Performance Unique 24144 24144: CE Distrib Transformers-System Performance 2,098,713 65,867 100% 2,098,713 65,867
Distribution System Performance Unique 29232 29232:OHHVD Wood Crossarm Replacement Program 518,753 70,879 100% 518,753 70,879
Distribution System Performance Blanket 29238 29238 : Regional Reliability Imprvmnts - West 1,604,315 166,479 100% 1,604,315 166,479
Distribution System Performance Unique 29259 29259 - Spare Transformers >10MVA (HVD Class) West 6,961,151 0 100% 6,961,151 0
Distribution System Performance Unique 29404 29404 - Capital for PCB Equipment 535,503 43,120 100% 535,503 43,120
Distribution System Performance Blanket 30752 30752 : Regional Reliability Imprvmnts - Chicago 2,902,616 312,920 100% 2,902,616 312,920
Distribution System Performance Blanket 30753 30753 : Regional Reliability Imprvmnts - North 2,054,212 196,325 100% 2,054,212 196,325
Distribution System Performance Blanket 30754 30754 : Regional Reliability Imprvmnts - South 1,631,124 164,565 100% 1,631,124 164,565
Distribution System Performance Unique 45708 45708: Hillcrest Security Lighting Child 119,956 29,291 100% 119,956 29,291
Distribution System Performance Unique 45711 45711: Mokena Security Lighting Child 291,040 31,804 100% 291,040 31,804
Distribution System Performance Unique 45714 45714: Des Plaines Security Lighting Child 349,652 0 100% 349,652 0
Distribution System Performance Blanket 45796 45796: Societal Resilience (High Impact/Key Venue/JOC) 303,954 28,771 100% 303,954 28,771
Distribution System Performance Unique 45842 45842: Cable Removal Program 591,267 7,190 100% 591,267 7,190
Distribution System Performance Blanket 46648 46648: Repl Dist Mainline Dir Bury & Conduit 2,686,700 288,770 100% 2,686,700 288,770
Distribution System Performance Unique 46648 46648: Repl Dist Mainline Dir Bury & Conduit 15,749,520 806,892 100% 15,749,520 806,892
Distribution System Performance Unique 46662 46662: Install Neutral Disconnects 173,106 16,385 100% 173,106 16,385
Distribution System Performance Unique 46681 46681: 1300 Network Monitoring 1,471,027 40,051 100% 1,471,027 40,051
Distribution System Performance Unique 46726 46726 Replacement of Obsolete (HVD) 55,005 0 100% 55,005 0
Distribution System Performance Unique 47412 47412: 34kV System Modernization 1,093,361 7,639 100% 1,093,361 7,639
Distribution System Performance Unique 47416 47416: Spot Vault 12kV Relay Upgrades 1,131,686 89,755 100% 1,131,686 89,755
Distribution System Performance Unique 47497 47497: ATO Modernization 2,329,076 27,687 100% 2,329,076 27,687
Distribution System Performance Blanket 47535 47535 Distribution PCB replacement equipment 288,866 103,475 100% 288,866 103,475
Distribution System Performance Blanket 50089 50089: Line Clearances 265,701 39,519 100% 265,701 39,519
Distribution System Performance Unique 50089 50089: Line Clearances 4,739,417 321,985 100% 4,739,417 321,985
Distribution System Performance Unique 50538 50538: CE Distrib Transformers-System Performance Substation 1,422,898 35,208 100% 1,422,898 35,208
Distribution System Performance Unique 50639 50639: GRID System Durability 734,494 94,174 100% 734,494 94,174
Distribution System Performance Unique 51053 51053: FEP Security Tech and Fence - D 19,716,369 0 100% 19,716,369 0
Distribution System Performance Blanket 51433 51433: Smart LED Streetlight Suburban 1,175,362 111,253 100% 1,175,362 111,253
Distribution System Performance Unique 51433 51433: Smart LED Streetlight Suburban 14,561,197 1,004,425 100% 14,561,197 1,004,425
Distribution System Performance Unique 51864 51864: Pothead Replacement 448,631 44,594 100% 448,631 44,594
Distribution System Performance Unique 52019 52019: Network Secondary Main Replacement 9,332,902 121,319 100% 9,332,902 121,319
Distribution System Performance Unique 52030 52030: Microgrid Controller Development Project (DOE Grant) 364,469 0 100% 364,469 0
Distribution System Performance Unique 52116 52116: Distribution Automation 34kV 2,252,720 82,709 100% 2,252,720 82,709
Distribution System Performance Unique 52614 52614: ATO Remote Monitoring 487,947 13,793 100% 487,947 13,793
Distribution System Performance Unique 52757 52757: Bronzeville MICROGRID 948,021 24,908 100% 948,021 24,908
Distribution System Performance Unique 52793 52793: L19211 & L19212 Cable & Conduit Installation 32,488,416 0 100% 32,488,416 0
Distribution System Performance Unique 52874 52874: Replace Small Power Transformers <10MVA 164,057 0 100% 164,057 0
Distribution System Performance Unique 53090 53090: Utility Of The Future Development 10,210,818 322,617 100% 10,210,818 322,617
Distribution System Performance Unique 53392 53392: Hillcrest Security Enhancement PARENT 248,129 61,050 100% 248,129 61,050
Distribution System Performance Unique 53393 53393: Mokena Security Enhancement PARENT 670,274 73,392 100% 670,274 73,392
Distribution System Performance Unique 53395 53395: Des Plaines Security Enhancement PARENT 346,537 0 100% 346,537 0
Distribution System Performance Unique 53677 53677: FEP Security Lighting - D 3,507,774 0 100% 3,507,774 0
Distribution System Performance Blanket 53791 53791: 4/ 12kV DA - Circuit Reclosers 2,184,332 327,206 100% 2,184,332 327,206
Distribution System Performance Unique 53791 53791: 4/ 12kV DA - Circuit Reclosers 31,954,731 1,527,919 100% 31,954,731 1,527,919
Distribution System Performance Unique 53849 53849: Small / Medium Proactive Transformer Replacements 114,518 0 100% 114,518 0
Docket No. 22-____ComEd Ex. 1.02
Page 157 of 176

WP 19Page 7 of 11
Commonwealth Edison Company
2022 Projected Plant Additions - 2022 Filing Year
(In Dollars)
Functional
ClassInvestment Categoy
Blanket /
UniqueITN ITN Description
Total Additions Total Removal Costs
Jurisdic
ational
%
Jurisdictional
Additions
Jurisdictional
Removal Costs
Distribution System Performance Unique 54106 54106: L15005 69kV Cable Replacement 268,315 0 100% 268,315 0
Distribution System Performance Unique 54119 54119: 12kV Bus Differential Upgrades 316,615 33,808 100% 316,615 33,808
Distribution System Performance Blanket 54430 54430: CEMI and Customer Outage Mitigation Program 6,003,946 850,191 100% 6,003,946 850,191
Distribution System Performance Unique 54430 54430: CEMI and Customer Outage Mitigation Program 102,072 2,612 100% 102,072 2,612
Distribution System Performance Unique 54790 54790: SS Relay Upgrade 766,221 36,030 100% 766,221 36,030
Distribution System Performance Unique 55226 55226: Alsip Security Technology 471,561 0 100% 471,561 0
Distribution System Performance Unique 55228 55228: Burr Ridge Security Enhancement 98,087 0 100% 98,087 0
Distribution System Performance Unique 55229 55229 Busse Security Enhancement 267,204 0 100% 267,204 0
Distribution System Performance Unique 55244 55244 Pontiac Midpoint Security Enhancement 1,284,273 140,999 100% 1,284,273 140,999
Distribution System Performance Unique 55255 55255: Customer Security Technology 871,106 212,658 100% 871,106 212,658
Distribution System Performance Unique 55256 55256 Tinley Park Security Enhancement 287,068 0 100% 287,068 0
Distribution System Performance Unique 55259 55259: Aptakisic Security Enhancement 54,410 0 100% 54,410 0
Distribution System Performance Unique 55272 55272 Bolingbrook Security Enhancement 298,466 73,638 100% 298,466 73,638
Distribution System Performance Unique 55278 55278: Deerfield Security Enhancement 57,581 0 100% 57,581 0
Distribution System Performance Unique 55279 55279: Downers Grove Security Enhancement 104,625 0 100% 104,625 0
Distribution System Performance Unique 55284 55284: Gurnee Security Enhancement 84,604 0 100% 84,604 0
Distribution System Performance Unique 55286 55286: Lake Zurich Security Enhancement 42,462 0 100% 42,462 0
Distribution System Performance Unique 55302 55302 Round Lake Security Enhancement 518,637 0 100% 518,637 0
Distribution System Performance Unique 55306 55306: York Center Security Technology 116,269 0 100% 116,269 0
Distribution System Performance Unique 55339 55339: Alsip Security Lighting 255,127 13,068 100% 255,127 13,068
Distribution System Performance Unique 55342 55342: Burr Ridge Security Lighting 244,448 19,908 100% 244,448 19,908
Distribution System Performance Unique 55344 55344 Busse Security Lighting 154,690 0 100% 154,690 0
Distribution System Performance Unique 55345 55345 Clearing Security Lighting 230,430 56,516 100% 230,430 56,516
Distribution System Performance Unique 55363 55363 Pontiac Midpoint Security Lighting 1,034,211 113,260 100% 1,034,211 113,260
Distribution System Performance Unique 55370 55370: Customer Security Lighting 448,642 109,883 100% 448,642 109,883
Distribution System Performance Unique 55371 55371: Tinley Park Security Lighting 229,621 10,856 100% 229,621 10,856
Distribution System Performance Unique 55374 55374: Aptakisic Security Lighting 60,202 0 100% 60,202 0
Distribution System Performance Unique 55377 55377 Bolingbrook Security Lighting 93,695 22,929 100% 93,695 22,929
Distribution System Performance Unique 55382 55382: Deerfield Security Lighting 62,769 0 100% 62,769 0
Distribution System Performance Unique 55383 55383: Downers Grove Security Lighting 35,214 0 100% 35,214 0
Distribution System Performance Unique 55401 55401: Gurnee Security Lighting 50,438 0 100% 50,438 0
Distribution System Performance Unique 55404 55404: Lake Zurich Security Lighting 59,151 0 100% 59,151 0
Distribution System Performance Unique 55418 55418 Round Lake Security Lighting 319,161 16,633 100% 319,161 16,633
Distribution System Performance Unique 55423 55423: York Center Securiy Lighting 30,512 0 100% 30,512 0
Distribution System Performance Unique 55959 55959: SP-RELAY Bucket 152,412 0 100% 152,412 0
Distribution System Performance Unique 56782 56782: FP-Detection System-Dist 1,013,975 22,862 100% 1,013,975 22,862
Distribution System Performance Blanket 56907 56907: Tap Fuse Program 2,703,444 358,763 100% 2,703,444 358,763
Distribution System Performance Blanket 56908 56908: Proactive Equipment Replacement 8,145,769 823,091 100% 8,145,769 823,091
Distribution System Performance Unique 56908 56908: Proactive Equipment Replacement 162,710 8 100% 162,710 8
Distribution System Performance Blanket 56909 56909: DA - Rel Prgms 3,907,771 353,347 100% 3,907,771 353,347
Distribution System Performance Unique 56909 56909: DA - Rel Prgms 1,314,232 80,868 100% 1,314,232 80,868
Distribution System Performance Unique 56953 56953: 4/12/34 kV Oil Circuit Breakers 185,817 816,620 100% 185,817 816,620
Distribution System Performance Unique 57251 57251: Sys Perf Dist LRP Adjustment (1,783,384) (56,263) 100% (1,783,384) (56,263)
Distribution System Performance Unique 58164 58164: Hillcrest Security Fence 126,102 30,619 100% 126,102 30,619
Distribution System Performance Unique 58165 58165: Mokena Security Fence 1,306,551 143,214 100% 1,306,551 143,214
Distribution System Performance Unique 58168 58168: Des Plaines Security Fence 212,782 0 100% 212,782 0
Distribution System Performance Unique 58181 58181: Pontiac Midpoint Security Fence 2,774,570 304,238 100% 2,774,570 304,238
Distribution System Performance Unique 58260 58260: Lake Zurich Security Fence 103,710 0 100% 103,710 0
Distribution System Performance Unique 58272 58272: Alsip Security Fence 307,726 0 100% 307,726 0
Distribution System Performance Unique 58276 58276: Burr Ridge Security Fence 62,526 0 100% 62,526 0
Distribution System Performance Unique 58277 58277: Busse Security Fence 276,163 0 100% 276,163 0
Distribution System Performance Unique 58283 58283: Round Lake Security Fence 708,036 0 100% 708,036 0
Distribution System Performance Unique 58289 58289: York Center Security Fence 95,084 0 100% 95,084 0
Distribution System Performance Unique 58293 58293: Sterling Steel Security Fence 2,239,117 550,039 100% 2,239,117 550,039
Distribution System Performance Unique 58294 58294: Tinley Park Security Fence 381,018 0 100% 381,018 0
Distribution System Performance Unique 58296 58296: Aptakisic Security Fence 100,376 0 100% 100,376 0
Distribution System Performance Unique 58297 58297: SS894 Harper TR1 Replacement 976,536 42,024 100% 976,536 42,024
Distribution System Performance Unique 58300 58300: Bolingbrook Security Fence 404,143 99,998 100% 404,143 99,998
Distribution System Performance Unique 58304 58304: Deerfield Security Fence 100,312 0 100% 100,312 0
Distribution System Performance Unique 58305 58305: Downers Grove Security Fence 100,138 0 100% 100,138 0
Distribution System Performance Unique 58310 58310: Gurnee Security Fence 81,736 0 100% 81,736 0
Distribution System Performance Unique 58311 58311: SPCC Deficiencies - Oil Retention Pits Program 121,430 0 100% 121,430 0
Distribution System Performance Unique 58312 58312: ESSY511 IIT Switchgear Hardening 2,356,225 564,421 100% 2,356,225 564,421
Distribution System Performance Unique 58809 58809: Crosby Hardening 8,793,945 476,924 100% 8,793,945 476,924
Distribution System Performance Blanket 59286 59286: IP2 Install DA Devices for Sectionalization 2,643,201 250,190 100% 2,643,201 250,190
Distribution System Performance Unique 59286 59286: IP2 Install DA Devices for Sectionalization 37,495,211 1,866,098 100% 37,495,211 1,866,098
Distribution System Performance Unique 59287 59287: IP2 VIF Overhead Enhancement 97,339 0 100% 97,339 0
Distribution System Performance Unique 59288 59288: IP2 Undergrounding/Pocket Reliability 20,523,818 1,082,679 100% 20,523,818 1,082,679
Distribution System Performance Blanket 59289 59289: IP2 Distribution Wood Pole Proactive Replacements 5,268,083 498,647 100% 5,268,083 498,647
Distribution System Performance Blanket 59290 59290: IP2 URD Cable Replacement 19,458,270 1,841,809 100% 19,458,270 1,841,809
Distribution System Performance Unique 59291 59291: IP2 Retire Bifurcated Feeders 4,611,620 1,140,379 100% 4,611,620 1,140,379
Distribution System Performance Blanket 59292 59292: IP2 Mainline Cable Replacement 2,780,247 270,637 100% 2,780,247 270,637
Distribution System Performance Unique 59292 59292: IP2 Mainline Cable Replacement 9,037,129 404,274 100% 9,037,129 404,274
Distribution System Performance Unique 59500 59500: IP2 Distribution System Performance Pre-Cap Transformers 486,307 15,365 100% 486,307 15,365
Distribution System Performance Blanket 59646 59646: IP2 Distribution Wood Pole Proactive Reinforcements 369,644 34,988 100% 369,644 34,988
Distribution System Performance Unique 59785 59785: Distribution PMU Deployment - Parent 4,067,529 0 100% 4,067,529 0
Distribution System Performance Unique 59848 59848: Replace Columbus Park TR65 & TR67 for new L19211 & L19212 cable 4,088,494 0 100% 4,088,494 0
Distribution System Performance Unique 61574 61574: Underground Line Sensor 343,439 0 100% 343,439 0
Distribution System Performance Unique 61659 61659: IP2 Substation Modernization - Circuit Breaker Replacements 144,312 0 100% 144,312 0
Distribution System Performance Unique 62472 62472: 34kV CR - L13349 - Sterling (Program ITN 59287) 3,673,099 0 100% 3,673,099 0
Distribution System Performance Unique 62704 62704: PQ Enhancement Pilot 718,778 0 100% 718,778 0
Distribution System Performance Unique 63689 63689: IP2 Substation Modernization- Circuit Breaker Replacments 1,517,994 0 100% 1,517,994 0
Distribution System Performance Unique 63701 63701: IP2 Substation Modernization- Circuit Breaker Replacments 12,811,999 0 100% 12,811,999 0
Distribution System Performance Unique 63706 63706: IP2 Substation Modernization- Circuit Breaker Replacments 2,479,387 1,232,761 100% 2,479,387 1,232,761
Distribution System Performance Unique 63719 63719: IP2 Substation Modernization - Circuit Breaker Replacements 196,002 50,766 100% 196,002 50,766
Distribution System Performance Unique 64315 64315 Relay Upgrade Bundle for IP^2 Breakers 325,595 241,533 100% 325,595 241,533
Distribution System Performance Unique 65366 65366: 34KV CR - L0952 - Sections 4 & 5 Laraway (Program ITN 59287) 1,620,713 0 100% 1,620,713 0
Distribution System Performance Unique 65368 65368: 34KV CR - L4881 - Sect 2 to Lake Cook in TROW (Program ITN 59287) 3,590,468 210,117 100% 3,590,468 210,117
Distribution System Performance Unique 65722 65722:Distribution PMU Deployment 256,587 25,584 100% 256,587 25,584
Distribution System Performance Unique 66215 66215:Northbrook TR71 7,380,135 396,380 100% 7,380,135 396,380
Distribution System Performance Unique 66217 66217:Montgomery TR77 4,729,334 480,601 100% 4,729,334 480,601
Distribution System Performance Unique 66235 66235: Substation Engineering Design Support 497,565 12,128 100% 497,565 12,128
Distribution System Performance Unique 66258 66258: IP2 Bellwood 12kV Intel Sub 15,677,412 1,418,998 100% 15,677,412 1,418,998
Distribution System Performance Unique 67199 67199: 1% Worst Performing Circuits Parent 14,000 3,288 100% 14,000 3,288
Distribution System Performance Unique 68120 68120: Powerdyne Switches 3,216,281 519,065 100% 3,216,281 519,065
Distribution System Performance Unique 68138 68138: Head End Radio Program- Poles 313,083 152,817 100% 313,083 152,817
Distribution System Performance Unique 68635 68635: DA Laterals (Parent 66964) 2,594,159 0 100% 2,594,159 0
Distribution System Performance Unique 68897 68897: SP- EVANSTON c479/C661 INSTALL SWITCHGEAR 79,915 0 100% 79,915 0
Distribution System Performance Unique 69499 69499: SS679 Besley TR2 Replacement 1,452,106 35,561 100% 1,452,106 35,561
Distribution System Performance Unique 69537 69537: 34kV CR - L19342 - DCE17 (Program ITN 59287) 1,280,604 0 100% 1,280,604 0
Distribution System Performance Unique 69549 69549 DPU Feeder Relay Upgrades 67,132 7,327 100% 67,132 7,327
Distribution System Performance Unique 69551 69551 DFP Feeder Relay Upgrades 159,343 17,207 100% 159,343 17,207
Distribution System Performance Unique 69579 69579: 34kV CR - L0952 - Sections 1-3 DCJ15 to Laraway (Program ITN 59287) 7,751,100 0 100% 7,751,100 0
Distribution System Performance Unique 69581 69581: 34kV CR - L4881 - Sections 4 to 7 Lake Cook to DCC96 (Program ITN 59287) 1,374,775 0 100% 1,374,775 0
Docket No. 22-____ComEd Ex. 1.02
Page 158 of 176

WP 19Page 8 of 11
Commonwealth Edison Company
2022 Projected Plant Additions - 2022 Filing Year
(In Dollars)
Functional
ClassInvestment Categoy
Blanket /
UniqueITN ITN Description
Total Additions Total Removal Costs
Jurisdic
ational
%
Jurisdictional
Additions
Jurisdictional
Removal Costs
Distribution System Performance Unique 69663 69663: Head End Radio Program 934,018 345,495 100% 934,018 345,495
Distribution System Performance Unique 69701 69701: STA11 Fisk Cap Bank Replacement 2,134,365 202,027 100% 2,134,365 202,027
Distribution System Performance Unique 69705 69705: Substation Cap and Pin Replacement 507,719 5,536 100% 507,719 5,536
Distribution System Performance Unique 69707 69707: Obsolete Circuit Switcher Replacement Program 16,015 0 100% 16,015 0
Distribution System Performance Unique 69711 69711: ESSG314 Christ Hospital Hardening 2,171,931 142,750 100% 2,171,931 142,750
Distribution System Performance Unique 69760 69760: REACTS HUTS- Systems Communications and Telemetry Program 3,901,871 0 100% 3,901,871 0
Distribution System Performance Unique 69886 69886: DCY365 Campbell TR3 324,750 0 100% 324,750 0
Distribution System Performance Unique 69892 69892:SS603 Lawrence TR2 2,665,260 252,278 100% 2,665,260 252,278
Distribution System Performance Unique 69908 69908: DCY310 Austin TR1 82,682 0 100% 82,682 0
Distribution System Performance Unique 74648 74648:Garden Plain 34kv BT 3-4 75,539 18,662 100% 75,539 18,662
Distribution System Performance Unique 74650 74650: SS471 Pontiac Hardening BT 1-7 95,856 23,323 100% 95,856 23,323
Distribution System Performance Unique 74842 74842:Palos Wildlife Fence 582,029 0 100% 582,029 0
Distribution System Performance Unique 74844 74844: Frankfort Wildlife Fence 445,824 0 100% 445,824 0
Distribution System Performance Unique 74902 74902:Hillcrest 12kV J3675 Recloser to Rmag 201,090 19,034 100% 201,090 19,034
Distribution System Performance Unique 74906 74906:Hillcrest J3676 12kV Recloser to Rmag 206,148 19,513 100% 206,148 19,513
Distribution System Performance Unique 74952 74952: EY-511-2 Swgr Replacement supporting BCM 1,348,584 145,463 100% 1,348,584 145,463
Distribution System Performance Unique 75152 75152: Switching Canopy Pilot 65,669 0 100% 65,669 0
Distribution System Performance Unique 75154 75154: G56 CEMI4 3PT, REPL POLES, X-ARM 185,179 0 100% 185,179 0
Distribution System Performance Unique 75532 75532: DERMS 2.0 Engineering/Software Development - Child 102,412 0 100% 102,412 0
Distribution System Performance Unique 76072 76072:Customer 475,982 24,074 100% 475,982 24,074
Distribution System Performance Unique 76269 76269: DA Programs 3,566,384 93,797 100% 3,566,384 93,797
Distribution System Performance Unique 76378 76378: REACTS 8C204301 - Crestwood 289,380 0 100% 289,380 0
Distribution System Performance Unique 76537 76537 Replace REL-301 Relays 129,278 1,635 100% 129,278 1,635
Distribution System Performance Unique 76653 76653: Regional Reliability L14964 62,613 10,767 100% 62,613 10,767
Distribution System Performance Unique 76803 76803: F.A.U.L.T. Fault Assisting Underground Locating Technology 852,029 0 100% 852,029 0
Distribution System Performance Unique 76929 76929: Battery Energy Storage System for Outage Management 3,098,903 293,324 100% 3,098,903 293,324
Distribution System Performance Unique 77064 77064: 12kv Hardening 257,773 0 100% 257,773 0
Distribution System Performance Unique 77074 77074: Form C Relay Upgrades 472,529 0 100% 472,529 0
Distribution System Performance Unique 77159 77159: Install new AUX Generator at Rockwell 104,660 0 100% 104,660 0
Distribution System Performance Unique 77622 77622 P544 77,173 8,529 100% 77,173 8,529
Distribution System Performance Unique 77628 77628: EV Managed Charging 295,869 28,005 100% 295,869 28,005
Distribution System Performance Unique 77806 77806: Grid-edge DER 143,322 0 100% 143,322 0
Distribution System Performance Unique 77808 77808: Switchgear Modernization Pilot 556,072 21,421 100% 556,072 21,421
Distribution System Performance Unique 77869 77869: New Emerging Technologies Demonstration Projects 331,998 0 100% 331,998 0
Distribution System Performance Unique 77871 77871: Monitoring, control and optimization of grid-edge DER 213,514 0 100% 213,514 0
Distribution System Performance Unique 77878 77878: DER AMPS 255,300 0 100% 255,300 0
Distribution System Performance Unique 78004 78004: Enhancing Situational Awareness During Ice Storms 46,962 0 100% 46,962 0
Distribution System Performance Unique 78510 78510: SS249 Willmette Reconfiguration 955,562 66,232 100% 955,562 66,232
Distribution System Performance Unique 78522 78522: REACTS UOF L4881 and L19342 287,211 0 100% 287,211 0
Distribution System Performance Unique 78571 78571: SS460 Harvey Reconfiguration 30,723 7,616 100% 30,723 7,616
Distribution System Performance Unique 78573 78573: SS501 Elmhurst Reconfiguration 45,600 11,399 100% 45,600 11,399
Distribution System Performance Unique 78753 78753: 34kV CR - L13349 - Rock Falls (Program ITN 59287) 1,331,883 0 100% 1,331,883 0
Distribution System Performance Unique 78756 78756: 34kV CR - L13349 - Bridge Crossing (Program ITN 59287) 379,021 0 100% 379,021 0
Distribution System Performance Unique 78854 78854: 34kV CR - L4881 - Clavey Rd (Program ITN 59287) 4,667,593 261,461 100% 4,667,593 261,461
Distribution System Performance Unique 79495 79495: Advanced CVR 399,148 0 100% 399,148 0
Distribution System Performance Unique 79733 79733:Round Lake Beach Neutral Disconnect Cabinet 400,679 0 100% 400,679 0
Distribution System Performance Unique 79804 79804: D3414 RECONDUCTORING 45,608 0 100% 45,608 0
Distribution System Performance Unique 79839 79839: 2022 1% Cycle 1 feeder J656 19,388 3,693 100% 19,388 3,693
Distribution System Performance Unique 79878 79878:DCX304 Chase TR1 22,034 0 100% 22,034 0
Distribution System Performance Unique 79929 79929: L11567 and L6030 Upgrades 493,729 0 100% 493,729 0
Distribution System Performance Unique 79956 79956:Solar Related Work 493,870 0 100% 493,870 0
System Performance Total 560,391,116 37,281,163 560,391,116 37,281,163
General Administrative & General Unique 14684 14684 - Training West - Capital Dept Costs 423,620 24 85.40% 361,771 20
General Administrative & General Blanket 35498 35498: Demand Response Switch Install (Dept 500) 759,388 15,838 68.90% 523,218 10,912
General Administrative & General Unique 45288 45288 - E&PM Back Office Capital 678,747 39 85.40% 579,650 34
General Administrative & General Unique 45940 45940: Security Services Capital 5,651,549 114 85.40% 4,826,423 98
General Administrative & General Unique 47678 47678: ONM Cost to Achieve (Separation) 0 0 85.40% 0 0
General Administrative & General Unique 51308 51308: IT Cyber Security Capital 416,166 24 85.40% 355,406 20
General Administrative & General Unique 52848 52848-GCA Stock Comp only 1,966,828 0 85.40% 1,679,671 0
General Administrative & General Unique 53961 53961: BO General LRP Adjustment (3,238,804) (185) 85.40% (2,765,938) (158)
General Administrative & General Unique 64997 64997: Placeholder for OneMDS Business Savings (3,798,082) 0 85.40% (3,243,562) 0
General Administrative & General Unique 66152 66152: General Expenses 191,549 0 85.40% 163,583 0
General Administrative & General Unique 67211 67211: Operations: Finance 2,186,507 0 85.40% 1,867,277 0
General Administrative & General Unique 67219 67219: Finance Non-Labor 20,028 209 85.40% 17,104 178
General Administrative & General Unique 78773 78773 GCA Placeholder for AIP/Fringe/Pyrl Tx (1,003,623) (57) 85.40% (857,094) (49)
Administrative & General Total 4,253,873 16,006 3,507,509 11,056
General Customer Operations Blanket 35802 35802: ComEd Cust Fld Ops F&MS Capital 1,623,171 214,004 85.40% 1,386,188 182,759
General Customer Operations Unique 35816 35816 - Customer Channels - minor Capital 156,166 3,423 85.40% 133,366 2,923
General Customer Operations Blanket 36074 36074: ComEd Cust Fld Ops F&MS Capital 3,106,196 409,530 85.40% 2,652,691 349,739
General Customer Operations Unique 36181 36181 - Regulatory Program Implementation Capital 765,634 15,056 85.40% 653,851 12,857
General Customer Operations Blanket 45830 45830 - Customer Field Operations minor Capital 13,892 1,832 85.40% 11,863 1,564
General Customer Operations Blanket 46713 46713 - Customer Field Operations minor Capital 30,893 4,073 85.40% 26,382 3,478
General Customer Operations Unique 51541 51541 - Customer Channels - minor Capital (17,569) 0 85.40% (15,004) 0
General Customer Operations Unique 66911 66911 - ComEd Customer Solutions Capital 19,046 956 85.40% 16,265 816
General Customer Operations Unique 75426 75426: Low-Income Energy Hub 93,222 0 85.40% 79,612 0
General Customer Operations Unique 78153 78153: AVAYA Call Center Upgrade 239,842 0 85.40% 204,825 0
Customer Operations Total 6,030,491 648,873 5,150,039 554,138
General Functional/BSC Unique 36266 36266 BSC Billed CAP 1,474,138 6,328 85.40% 1,258,914 5,404
General Functional/BSC Unique 36294 36294 BSC / Corp Center / Other (Capital) 2,406,571 16,315 85.40% 2,055,212 13,933
General Functional/BSC Unique 53980 53980:BSC CTO project 28,297 195 85.40% 24,166 167
Functional/BSC Total 3,909,006 22,837 3,338,291 19,503
General IT Projects Blanket 36275 36275: IT Capital Annual Passthroughs 11,629,373 0 85.40% 9,931,485 0
General IT Projects Unique 48799 48799: EMS Consolidation Implementation (38,286) 0 85.40% (32,696) 0
General IT Projects Unique 51547 51547: Project Portfolio: Electric Real Time (23,269) 0 85.40% (19,872) 0
General IT Projects Unique 51557 51557: Project Portfolio: Utility Communications (226,317) 0 85.40% (193,275) 0
General IT Projects Unique 51912 51912: Mobile Dispatch and Mobile Mapping Convergence (OneMDS) 430,121 0 85.40% 367,323 0
General IT Projects Blanket 54418 54418: GRIP DA Tier III Mesh Network 4,668,874 0 68.90% 3,216,854 0
General IT Projects Unique 54489 54489: Project Portfolio: Management and Compliance (4,353,431) 0 85.40% (3,717,830) 0
General IT Projects Blanket 56313 56313: Voltage Optimization Voltage Dig Grid Network (IT) 7,018,624 0 68.90% 4,835,832 0
General IT Projects Unique 58371 58371: Bronzeville MICROGRID IT 260,357 0 85.40% 222,345 0
General IT Projects Unique 59896 59896: PMU Project for Network Engineering 240,576 0 85.40% 205,452 0
General IT Projects Unique 59966 59966: EU Ratings Database Convergence Initiative Implementation 666,869 0 85.40% 569,506 0
General IT Projects Unique 64051 64051: ComEd AESCnT - Network Communications Scope 6,149,730 0 68.90% 4,237,164 0
General IT Projects Unique 64542 64542: Line Sensors Deployment FCI 1,696,137 0 85.40% 1,448,501 0
General IT Projects Unique 64760 64760: Securing EMS/SCADA Systems 2,963,398 0 68.90% 2,041,781 0
General IT Projects Unique 69329 69329:EU Land Mobile Radio (LMR) Implementation (ComEd) 1,924,796 0 85.40% 1,643,776 0
General IT Projects Unique 69341 69341: ComEd CYME GateWay Integrations 562,376 0 85.40% 480,269 0
General IT Projects Unique 69349 69349: ComEd PMU Analytics (IT) 117,064 0 85.40% 99,973 0
General IT Projects Unique 69353 69353: DER Load Forecasting Tool Integration and Evaluation 439,268 0 85.40% 375,135 0
General IT Projects Unique 69355 69355: Distributed Energy Resource Management - DERMS 2 Network Comms - ComEd 771,057 0 85.40% 658,482 0
General IT Projects Unique 75609 75609: UI Planner Implementation (ComEd) 226,075 0 85.40% 193,068 0
General IT Projects Unique 78092 78092: EU - EAM 2.0 - Asset Suite 8 Replacement Project 259,159 0 85.40% 221,322 0
General IT Projects Unique 78121 78121:CIP RPN Implementation 316,626 0 85.40% 270,399 0
General IT Projects Unique 78167 78167: Customer IT Restore 1,629,129 0 85.40% 1,391,276 0
Docket No. 22-____ComEd Ex. 1.02
Page 159 of 176

WP 19Page 9 of 11
Commonwealth Edison Company
2022 Projected Plant Additions - 2022 Filing Year
(In Dollars)
Functional
ClassInvestment Categoy
Blanket /
UniqueITN ITN Description
Total Additions Total Removal Costs
Jurisdic
ational
%
Jurisdictional
Additions
Jurisdictional
Removal Costs
General IT Projects Unique 79312 79312: DA Device Management Platform (ComEd) 38,563 0 85.40% 32,933 0
IT Projects Total 37,366,867 0 28,479,201 0
General Real Estate Unique 35158 35158: Lighting 241,824 1,049 85.40% 206,518 896
General Real Estate Unique 62604 62604 - Supply Maywood Oil House Operations 840,990 0 85.40% 718,206 0
General Real Estate Unique 64606 64606 Chicago South Paving 224,977 0 85.40% 192,130 0
General Real Estate Unique 66083 66083: Real Estate General Expenses 528,397 6,388 85.40% 451,251 5,455
General Real Estate Unique 67443 67443: Sugar Grove Civil 199,372 7,332 85.40% 170,264 6,262
General Real Estate Unique 67445 67445: Sugar Grove Training 2,750,368 0 85.40% 2,348,814 0
General Real Estate Unique 68219 68219 OCC/CCC Facility Feeder 3,968,221 206,253 85.40% 3,388,861 176,140
General Real Estate Unique 69402 69402 Ridgeland Supply 38,401 0 85.40% 32,794 0
General Real Estate Unique 69738 69738 Glenbard Training Paving 247,830 9,114 85.40% 211,647 7,783
General Real Estate Unique 69756 69756 Chicago South HQ Roofing 1,125,725 41,399 85.40% 961,369 35,355
General Real Estate Unique 69762 69762 Maywood DVA Roofing 262,693 9,661 85.40% 224,340 8,250
General Real Estate Unique 69764 69764 Channahon TOH Electrical 495,989 18,240 85.40% 423,574 15,577
General Real Estate Unique 69785 69785 ESC Electrical 594,429 21,861 85.40% 507,642 18,669
General Real Estate Unique 69795 69795 Joliet HQ Electrical 247,874 9,116 85.40% 211,684 7,785
General Real Estate Unique 69810 69810 Rockford Electrical 74,576 2,743 85.40% 63,688 2,342
General Real Estate Unique 69812 69812 Steator Ekectrical 118,954 4,375 85.40% 101,587 3,736
General Real Estate Unique 69814 69814 Tech Cntr Electrical 198,259 7,291 85.40% 169,313 6,227
General Real Estate Unique 69843 69843 Crystal Lake HVAC & Mech 49,691 1,827 85.40% 42,436 1,561
General Real Estate Unique 69940 69940 Chicago South High Dome 375,260 19,282 85.40% 320,472 16,467
General Real Estate Unique 69942 69942 Glendbard Train Rest Refresh 148,476 5,460 85.40% 126,799 4,663
General Real Estate Unique 69946 69946 Crystal Lake Rest Refresh 395,635 14,550 85.40% 337,872 12,426
General Real Estate Unique 69950 69950 Freeport Restroom Refresh 397,046 14,602 85.40% 339,078 12,470
General Real Estate Unique 74226 74226 Maywood DVA Office Rfrsh 793,708 29,189 85.40% 677,827 24,928
General Real Estate Unique 74325 74325 MaywoodVertical Transport 247,878 9,116 85.40% 211,688 7,785
General Real Estate Unique 74673 74673 Woodstock Office Rfrsh 396,849 14,594 85.40% 338,909 12,464
General Real Estate Unique 75215 75215 OCC Static Switch Repair 1,138,529 41,870 85.40% 972,304 35,757
General Real Estate Unique 75925 75925 UPS A2/B2 Replacement 5,134,329 220,747 85.40% 4,384,717 188,518
General Real Estate Unique 76346 76346 Dixon EV Charging Stations 573,788 0 85.40% 490,015 0
General Real Estate Unique 76360 76360 Chicago North Parking Expansion & Landscaping 4,517,749 121,987 85.40% 3,858,158 104,177
General Real Estate Unique 76441 76441 Rockford EV Charging Stations 232,200 0 85.40% 198,299 0
General Real Estate Unique 76443 76443 Skokie EV Charging Stations 49,931 0 85.40% 42,641 0
General Real Estate Unique 76445 76445 Chicago North EV Charging Stations 284,305 0 85.40% 242,797 0
General Real Estate Unique 76452 76452 Chicago South EV Charging Stations 268,887 0 85.40% 229,630 0
General Real Estate Unique 76504 76504 LC3 UPS Replacement 808,810 34,588 85.40% 690,723 29,538
General Real Estate Unique 77338 77338 Maywood EV Charging Station 149,694 0 85.40% 127,839 0
General Real Estate Unique 77340 77340 Bolingbrook EV Charging Stations 374,019 0 85.40% 319,413 0
General Real Estate Unique 77344 77344 Joliet EV Charging Stations 487,367 0 85.40% 416,212 0
General Real Estate Unique 77346 77346 DeKalb EV Charging Stations 370,818 0 85.40% 316,679 0
General Real Estate Unique 77349 77349 Elgin EV Charging Stations 75,083 0 85.40% 64,121 0
General Real Estate Unique 77353 77353 Aurora EV Charging Stations 225,533 0 85.40% 192,605 0
General Real Estate Unique 77355 77355 Streator EV Charging Stations 151,101 0 85.40% 129,041 0
General Real Estate Unique 77357 77357 Glenbrook EV Charging Stations 29,102 0 85.40% 24,853 0
General Real Estate Unique 77359 77359 Mount Prospect EV Charging Stations 25,186 0 85.40% 21,509 0
General Real Estate Unique 77817 77817 CS 7701 BAS 49,496 1,820 85.40% 42,270 1,555
General Real Estate Unique 77951 77951 Maywood Restroom and Lock 156,894 8,123 85.40% 133,987 6,937
General Real Estate Unique 77994 77994 OCC/CCC MSB3 2,394,796 76,593 85.40% 2,045,156 65,411
General Real Estate Unique 78068 78068 Freeport Concrete 168,760 8,858 85.40% 144,121 7,565
General Real Estate Unique 78143 78143 Highland Park Expansion 9,467,587 340,946 85.40% 8,085,319 291,168
General Real Estate Unique 78145 78145 Commercial Ctr Prioritization 594,836 7,284 85.40% 507,990 6,220
General Real Estate Unique 78876 78876 Skokie Fleet Garage Floor 192,025 10,072 85.40% 163,990 8,602
General Real Estate Unique 78926 78926 Uni Park's Fleet Restroom 435,277 22,909 85.40% 371,726 19,565
General Real Estate Unique 78982 78982 Dixon Fleet Lighting 257,014 13,480 85.40% 219,490 11,512
General Real Estate Unique 79282 79282 Tech Ctr. Atrium 946,851 34,821 85.40% 808,611 29,737
General Real Estate Unique 79284 79284 Cry Lake Office Refresh 991,403 36,460 85.40% 846,658 31,136
General Real Estate Unique 79330 79330 CCC Crac Units-2022 496,310 18,252 85.40% 423,848 15,587
General Real Estate Unique 79332 79332 LC3 Power Dist. Units 158,774 5,839 85.40% 135,593 4,987
General Real Estate Unique 79334 79334 Battery Monitoring System 217,653 8,004 85.40% 185,876 6,836
General Real Estate Unique 79336 79336 LC3 Redundant 1,187,886 43,685 85.40% 1,014,455 37,307
General Real Estate Unique 79349 79349 Mt. Prospect Office Rfrsh 1,017,286 37,411 85.40% 868,762 31,949
Real Estate Total 48,592,704 1,547,193 41,498,169 1,321,302
General System Performance/Other Unique 42418 42418: GCA General Capital (43,764) (2) 85.40% (37,375) (2)
General System Performance/Other Unique 46509 46509: Engineering Studies (Capital) 175,180 5,454 85.40% 149,604 4,657
General System Performance/Other Unique 47416 47416: Spot Vault 12kV Relay Upgrades 24,613 2,647 68.90% 16,958 1,824
General System Performance/Other Unique 52614 52614: ATO Remote Monitoring 781,055 0 68.90% 538,147 0
General System Performance/Other Unique 53076 53076: Voltage Optimization 5,094,866 2,096,574 68.90% 3,510,363 1,444,540
General System Performance/Other Unique 53597 53597:DOE SHINES-MISST 1,735,983 0 85.40% 1,482,529 0
General System Performance/Other Unique 54119 54119: 12kV Bus Differential Upgrades 109,696 12,140 85.40% 93,681 10,367
General System Performance/Other Unique 54121 54121: 12kV Partial Bus Differential Upgrades 741,824 77,372 85.40% 633,518 66,076
General System Performance/Other Unique 54123 54123 SCADA HMI 411,982 38,996 68.90% 283,855 26,868
General System Performance/Other Unique 54126 54126 SCADA ESS locations 428,184 0 68.90% 295,019 0
General System Performance/Other Unique 54790 54790: SS Relay Upgrade 483,323 53,062 85.40% 412,758 45,315
General System Performance/Other Unique 58056 58056: PMU Expansion 550,567 0 68.90% 379,341 0
General System Performance/Other Unique 58329 58329: PMU Expansion 1,371,745 0 68.90% 945,132 0
General System Performance/Other Unique 59934 59934: REACTS Program Links 6,314,266 0 68.90% 4,350,529 0
General System Performance/Other Unique 63538 63538 SEEDER 23,919 0 85.40% 20,427 0
General System Performance/Other Unique 64315 64315 Relay Upgrade Bundle for IP^2 Breakers 2,289,079 34,966 68.90% 1,577,175 24,092
General System Performance/Other Unique 64329 64329: Grounding Grid Lightning Mitigation 1,051,157 546 85.40% 897,688 466
General System Performance/Other Unique 64336 64336: Utility Advancement Quality & Analysis 24,132 761 85.40% 20,609 650
General System Performance/Other Unique 64338 64338: Cap Exp Trans Quality & Analysis 121,916 2,437 85.40% 104,116 2,081
General System Performance/Other Unique 64340 64340: Cap Exp Dist Quality & Analysis 155,940 3,012 85.40% 133,173 2,572
General System Performance/Other Unique 64342 64342: New Business Quality & Analysis 123,236 2,320 85.40% 105,244 1,981
General System Performance/Other Unique 64345 64345: Sys Perf Dist Quality & Analysis 260,396 8,216 85.40% 222,378 7,016
General System Performance/Other Unique 64347 64347: Sys Perf Substation Quality & Analysis 132,371 4,182 85.40% 113,045 3,572
General System Performance/Other Unique 65605 65605: O'Hare Network Monitoring 180,070 0 85.40% 153,780 0
General System Performance/Other Unique 66439 66439: DERMS Field Deployment 557,050 0 68.90% 383,807 0
General System Performance/Other Unique 66749 66749: OT Security 2,279,386 64,978 68.90% 1,570,497 44,770
General System Performance/Other Unique 67481 67481 Carrier Current System 48,956 5,417 68.90% 33,731 3,732
General System Performance/Other Unique 67962 67962: PMU Analytics 2,112,267 199,935 85.40% 1,803,876 170,745
General System Performance/Other Unique 68109 68109: Weather Station 3,075,059 0 85.40% 2,626,100 0
General System Performance/Other Unique 69544 69544: Battery Trailers Purchase 384,307 0 85.40% 328,198 0
General System Performance/Other Unique 69551 69551 DFP Feeder Relay Upgrades 72,546 0 85.40% 61,955 0
General System Performance/Other Unique 69760 69760: REACTS HUTS- Systems Communications and Telemetry Program 2,240,024 0 68.90% 1,543,376 0
General System Performance/Other Unique 69878 69878: Underground Storage Tank Replacement Program 513,551 0 85.40% 438,572 0
General System Performance/Other Unique 76217 76217-1P220405:Load relief to 310X245 2,045,219 122,643 85.40% 1,746,617 104,737
General System Performance/Other Unique 76219 76219:1300 Group Network Monitoring 1,444,813 0 68.90% 995,476 0
General System Performance/Other Unique 76371 76371: REACTS 8C204302 - University Park 11,044,817 0 68.90% 7,609,879 0
General System Performance/Other Unique 76374 76374: REACTS Program Links 393,261 0 85.40% 335,845 0
General System Performance/Other Unique 76376 76376: REACTS 7C204302 - L19342 - 34kV Resiliency 4,800,027 0 68.90% 3,307,219 0
General System Performance/Other Unique 76378 76378: REACTS 8C204301 - Crestwood 4,175,560 0 68.90% 2,876,961 0
General System Performance/Other Unique 76512 76512-4P220400:SC Relieve A9421 with A9423 230,337 13,812 85.40% 196,708 11,796
General System Performance/Other Unique 76749 76749: Customer Child Distribution 1,277,083 65,321 85.40% 1,090,629 55,784
General System Performance/Other Unique 76756 76756: Portable Substation Thermography Pilot 487,267 0 85.40% 416,126 0
Docket No. 22-____ComEd Ex. 1.02
Page 160 of 176

WP 19Page 10 of 11
Commonwealth Edison Company
2022 Projected Plant Additions - 2022 Filing Year
(In Dollars)
Functional
ClassInvestment Categoy
Blanket /
UniqueITN ITN Description
Total Additions Total Removal Costs
Jurisdic
ational
%
Jurisdictional
Additions
Jurisdictional
Removal Costs
General System Performance/Other Unique 76929 76929: Battery Energy Storage System for Outage Management 25,080 0 85.40% 21,418 0
General System Performance/Other Unique 77193 77193-4P220803-E1419Y-Enhance service to Customer 227,638 13,651 85.40% 194,403 11,658
General System Performance/Other Unique 77206 77206:4C204300 Libertyville 10,936,817 0 68.90% 7,535,467 0
General System Performance/Other Unique 77208 77206:4C204300 Libertyville Links 1,572,648 0 85.40% 1,343,041 0
General System Performance/Other Unique 77212 77212: REACTS 8C204304 ALSIP Links 6,174,368 0 85.40% 5,272,910 0
General System Performance/Other Unique 77228 77228: REACTS 6C224300 - DERMS2 Normantown 146,412 0 85.40% 125,036 0
General System Performance/Other Unique 77232 77232:6C204300 - BB L0952 34kv 538,484 32,884 85.40% 459,866 28,083
General System Performance/Other Unique 77236 77236:7C204301 Dixon (L13349) 5,612,657 0 85.40% 4,793,209 0
General System Performance/Other Unique 77281 77281: Richie Road Interconnection - 923,963 0 85.40% 789,064 0
General System Performance/Other Unique 77304 77304:4C204301 S Schaumburg 1,599,879 0 68.90% 1,102,317 0
General System Performance/Other Unique 77628 77628: EV Managed Charging 292,553 0 85.40% 249,841 0
General System Performance/Other Unique 78004 78004: Enhancing Situational Awareness During Ice Storms 22,830 0 85.40% 19,497 0
General System Performance/Other Unique 78522 78522: REACTS UOF L4881 and L19342 142,553 0 85.40% 121,740 0
General System Performance/Other Unique 78535 78535: REACTS / ComEd Training Tools/Equipment 612,515 0 85.40% 523,088 0
General System Performance/Other Unique 78554 78554 : FR-MEACHAM/ALGONQUIN 61G20 - RELOCATION SCHEDULE 355,143 87,083 85.40% 303,292 74,369
General System Performance/Other Unique 78652 78652: UPA Network Bandwidth Upgrade 28,627 0 85.40% 24,448 0
General System Performance/Other Unique 79130 79130: LPSW Customer Summit 510,395 28,779 85.40% 435,878 24,578
General System Performance/Other Unique 79730 79730: DER Rulemaking (Clean Energy Law) 2,929,971 0 85.40% 2,502,195 0
General System Performance/Other Unique 99999 99999: ComEd Other 144,728 0 85.40% 123,598 0
System Performance/Other Total 92,520,525 2,977,186 69,707,571 2,172,327
General Tools Blanket 5494 5494: ComEd Tools and Repair 9,387,387 1,603 85.40% 8,016,828 1,369
General Tools Unique 5494 5494: ComEd Tools and Repair 178,512 7,818 85.40% 152,450 6,677
Tools Total 9,565,899 9,421 8,169,278 8,046
General Vehicles Blanket 21402 21402: ComEd Fleet 39,352,755 6,717 85.40% 33,607,252 5,736
Vehicles Total 39,352,755 6,717 33,607,252 5,736
Intangible Functional/BSC Unique 36266 36266 BSC Billed CAP 2,516,765 0 85.40% 2,149,317 0
Intangible Functional/BSC Unique 36294 36294 BSC / Corp Center / Other (Capital) 528,272 0 85.40% 451,144 0
Intangible Functional/BSC Unique 47678 47678: ONM Cost to Achieve (Separation) 0 0 85.40% 0 0
Intangible Functional/BSC Unique 48739 48739: GCA Intangible Capital (11,000) 0 85.40% (9,394) 0
Intangible Functional/BSC Unique 49786 49786: ComEd Project & Portfolio Management Tool 933,122 0 85.40% 796,886 0
Intangible Functional/BSC Unique 53980 53980:BSC CTO project 189,347 0 85.40% 161,702 0
Intangible Functional/BSC Unique 56167 56167: NB Third Party Attachment 101,650 0 85.40% 86,809 0
Intangible Functional/BSC Unique 59239 59239: FEJA Solar Interconnection Bucket 362,327 0 85.40% 309,427 0
Intangible Functional/BSC Unique 99999 99999: ComEd Other 138,011 0 85.40% 117,861 0
Functional/BSC Total 4,758,493 0 4,063,753 0
Intangible IT Projects Blanket 36275 36275: IT Capital Annual Passthroughs 1,737,722 0 85.40% 1,484,015 0
Intangible IT Projects Unique 48799 48799: EMS Consolidation Implementation (114,857) 0 85.40% (98,088) 0
Intangible IT Projects Unique 51547 51547: Project Portfolio: Electric Real Time (93,078) 0 85.40% (79,488) 0
Intangible IT Projects Unique 51912 51912: Mobile Dispatch and Mobile Mapping Convergence (OneMDS) 21,728,872 0 85.40% 18,556,457 0
Intangible IT Projects Unique 52030 52030: Microgrid Controller Development Project (DOE Grant) 633,290 0 85.40% 540,829 0
Intangible IT Projects Unique 53193 53193:BIDA AMI Operations 165,377 0 85.40% 141,232 0
Intangible IT Projects Unique 54489 54489: Project Portfolio: Management and Compliance (17,413,725) 0 85.40% (14,871,321) 0
Intangible IT Projects Unique 55488 55488: Project Portfolio: BIDA (25,714) 0 85.40% (21,960) 0
Intangible IT Projects Unique 58371 58371: Bronzeville MICROGRID IT 1,975,723 0 85.40% 1,687,267 0
Intangible IT Projects Unique 58821 58821: DERMS Pre-Scale Deployment 1,099,652 0 85.40% 939,103 0
Intangible IT Projects Unique 59074 59074: Analytics Customer Functional Releases 681,072 0 85.40% 581,636 0
Intangible IT Projects Unique 59966 59966: Ratings Database Convergence Initiative Implementation 410,854 0 85.40% 350,869 0
Intangible IT Projects Unique 59997 59997: Analytics-Grid Functional Releases 1,792,723 0 85.40% 1,530,985 0
Intangible IT Projects Unique 63538 63538 SEEDER 419,811 0 85.40% 358,519 0
Intangible IT Projects Unique 64051 64051: ComEd AESCnT - Network Communications Scope 5,356,061 0 68.90% 3,690,326 0
Intangible IT Projects Unique 64747 64747: Analytics - SES 4 29,503,265 0 85.40% 25,195,789 0
Intangible IT Projects Unique 64760 64760: Securing EMS/SCADA Systems 2,360,802 0 68.90% 1,626,592 0
Intangible IT Projects Unique 64767 64767: Storm Critical Systems - IT Hardening and Remediation 1,616,190 0 85.40% 1,380,227 0
Intangible IT Projects Unique 65859 65859: Document Management System Upgrade 1,118,120 0 85.40% 954,875 0
Intangible IT Projects Blanket 66263 66263: Cloud Service Amortization and CapEx Credit (9,781,775) 0 85.40% (8,353,636) 0
Intangible IT Projects Unique 66749 66749: OT Security 668,275 0 68.90% 460,441 0
Intangible IT Projects Unique 67962 67962: PMU Analytics 1,090,624 0 85.40% 931,393 0
Intangible IT Projects Unique 69337 69337: ComEd Distributed Energy Resource Management System (DERMS) - 2 757,360 0 85.40% 646,785 0
Intangible IT Projects Unique 69341 69341: ComEd CYME GateWay Integrations 128,909 0 85.40% 110,088 0
Intangible IT Projects Unique 69343 69343: ComEd Distribution Line Fault Monitoring Upgrade 348,079 0 85.40% 297,260 0
Intangible IT Projects Unique 69345 69345: ComEd Distribution Linear State Estimator (DLSE) 302,534 0 85.40% 258,364 0
Intangible IT Projects Unique 69347 69347: ComEd Feeder Management System Implementation 255,451 0 85.40% 218,155 0
Intangible IT Projects Unique 69349 69349: ComEd PMU Analytics (IT) 334,796 0 85.40% 285,916 0
Intangible IT Projects Unique 69353 69353: DER Load Forecasting Tool Integration and Evaluation 1,024,958 0 85.40% 875,314 0
Intangible IT Projects Unique 69518 69518: Power Outage Economic Tool (POET) 857,531 0 85.40% 732,331 0
Intangible IT Projects Unique 74915 74915: TPA Workflow Tool 2,483,259 0 85.40% 2,120,703 0
Intangible IT Projects Unique 74927 74927: DLSE Field Deployment - PARENT 24,380 0 85.40% 20,820 0
Intangible IT Projects Unique 75289 75289: Geographic Information System (GIS) Implementation 172,535 0 68.90% 118,876 0
Intangible IT Projects Unique 75609 75609: UI Planner Implementation (ComEd) 3,818,674 0 85.40% 3,261,148 0
Intangible IT Projects Unique 76003 76003: GrIT Lab Remote Access 222,552 0 85.40% 190,059 0
Intangible IT Projects Unique 76269 76269: DA Programs 241,252 0 85.40% 206,029 0
Intangible IT Projects Unique 78092 78092: EAM 2.0 - Asset Suite 8 Replacement Project 604,704 0 85.40% 516,417 0
Intangible IT Projects Unique 78121 78121:CIP RPN Implementation 316,626 0 85.40% 270,399 0
Intangible IT Projects Unique 78167 78167: Customer IT Restore 1,086,086 0 85.40% 927,517 0
Intangible IT Projects Unique 78168 78168: HEALTH - Analytics Enterprise Reporting 1,245,926 0 85.40% 1,064,021 0
Intangible IT Projects Unique 78180 78180: Health – Analytics OBIEE Upgrade to OAS 560,759 0 85.40% 478,889 0
Intangible IT Projects Unique 78182 78182: Health - Customer Upgrade 14,554 0 85.40% 12,429 0
Intangible IT Projects Unique 78219 78219: ComEd Outage Management System (OMS) Refresh 8,263,723 0 85.40% 7,057,220 0
Intangible IT Projects Unique 79303 79303: Managed Charging for Fleet Electrification (ComEd) 682,780 0 85.40% 583,094 0
Intangible IT Projects Unique 79312 79312: DA Device Management Platform (ComEd) 347,067 0 85.40% 296,395 0
Intangible IT Projects Unique 79918 79918: BESS Monitoring 191,864 0 85.40% 163,852 0
IT Projects Total 69,215,643 0 57,698,144 0
Intangible IT Projects - Customer Unique 51539 51539: Project Portfolio: Billing & Payment Processing (136,999) 0 85.40% (116,997) 0
Intangible IT Projects - Customer Unique 51541 51541: Project Portfolio: Customer Care Center (158,122) 0 85.40% (135,036) 0
Intangible IT Projects - Customer Unique 51548 51548: Project Portfolio: Energy Procurement (18,432) 0 85.40% (15,741) 0
Intangible IT Projects - Customer Unique 53719 53719: IT eChannel Mobile App 39,933 0 85.40% 34,103 0
Intangible IT Projects - Customer Unique 57407 57407: Project Portfolio: Smart Meter Operations (15,827) 0 85.40% (13,516) 0
Intangible IT Projects - Customer Unique 63238 63238: Community Solar Market Enablement: Tool Kit & Calculator 667,295 0 85.40% 569,870 0
Intangible IT Projects - Customer Unique 64043 64043: Community Solar Subscription Billing 2,316,942 0 85.40% 1,978,668 0
Intangible IT Projects - Customer Unique 64839 64839: Digital System Hardening 2,269,555 0 85.40% 1,938,200 0
Intangible IT Projects - Customer Unique 65931 65931: Digital Program 4,967,961 0 85.40% 4,242,639 0
Intangible IT Projects - Customer Unique 74919 74919: CSSB Enhancement 155,643 0 85.40% 132,920 0
Intangible IT Projects - Customer Unique 75413 75413: Smart Assistance Manager 6,164,506 0 85.40% 5,264,488 0
Intangible IT Projects - Customer Unique 75420 75420: Authentication Platform Upgrade 1,542,368 0 85.40% 1,317,183 0
Intangible IT Projects - Customer Unique 75426 75426: Low-Income Energy Hub (Low-Income Display) 1,494,979 0 85.40% 1,276,712 0
Intangible IT Projects - Customer Unique 75662 75662: NICE WFM Call Center Upgrade 140,740 0 85.40% 120,192 0
Intangible IT Projects - Customer Unique 78135 78135: Chat Platform Upgrade 1,257,136 0 85.40% 1,073,594 0
Intangible IT Projects - Customer Unique 78137 78137: Next Digital Platform 2,491,924 0 85.40% 2,128,103 0
Intangible IT Projects - Customer Unique 78151 78151: CUSTOMER Saratoga Replacement 1,693,469 0 85.40% 1,446,222 0
Intangible IT Projects - Customer Unique 78153 78153: AVAYA Call Center Upgrade 559,631 0 85.40% 477,925 0
Intangible IT Projects - Customer Unique 78155 78155: ATMS / EDI Replacement (BGE,ComED, PECO, PHI) 602,129 0 85.40% 514,218 0
Intangible IT Projects - Customer Unique 78188 78188: HEALTH - AMI Head End Lifecycle Upgrade 2022 ComEd 305,408 0 85.40% 260,818 0
Intangible IT Projects - Customer Unique 79295 79295: Customer Automation 125,414 0 85.40% 107,104 0
Intangible IT Projects - Customer Unique 79305 79305: Reliability Monitoring & Self Healing 282,462 0 85.40% 241,223 0
Docket No. 22-____ComEd Ex. 1.02
Page 161 of 176

WP 19Page 11 of 11
Commonwealth Edison Company
2022 Projected Plant Additions - 2022 Filing Year
(In Dollars)
Functional
ClassInvestment Categoy
Blanket /
UniqueITN ITN Description
Total Additions Total Removal Costs
Jurisdic
ational
%
Jurisdictional
Additions
Jurisdictional
Removal Costs
Intangible IT Projects - Customer Unique 79313 79313: Voice of the Customer Program 1,181,455 0 85.40% 1,008,962 0
Intangible IT Projects - Customer Unique 79321 79321: Customer Flight Path: Outage 2,623,838 0 85.40% 2,240,758 0
IT Projects - Customer Total 30,553,411 0 26,092,613 0
Grand Total 1,823,626,662 122,808,634 1,758,818,814 121,672,509
Docket No. 22-____ComEd Ex. 1.02
Page 162 of 176

WP 20
Page 1 of 1
Commonwealth Edison Company
Depreciation Reserve
Asset Retirement Obligation - Accumulated Reserve
(In Thousands)
Line
No. Description Transmission Distribution General
(A) (B) (C) (D)
1 Balance - 12/31/2021 per FERC Form 1 (1) (1,511,758)$ (6,940,556)$ (1,148,866)$
2 Exclude Accumulated Amortization of Asset
3 Retirement Costs 863 18,644 5,857
4 Adjusted Balance - 12/31/2021 (1,510,895)$ (6,921,912)$ (1,143,009)$
Note:
(1) From 2021 FERC Form 1, Page 219.
Docket No. 22-____ComEd Ex. 1.02
Page 163 of 176

WP 21
Page 1 of 1
Commonwealth Edison Company
2021 Statutory Tax Rates (1)
Line
No. Description Percentage
(A) (B)
1 Federal Tax Rate 21.00%
2 State of Illinois Tax Rate 9.50%
Note:
(1) Represents the statutory tax rates in effect
for 2021. Source: Tax Department.
Docket No. 22-____ComEd Ex. 1.02
Page 164 of 176

WP 22
Page 1 of 2
Commonwealth Edison Company
2021 Revenue Requirement in effect during Reconciliation Year
(In Thousands)
Line ICC
No. Docket Amount
(A) (B)
1 Docket 20-0393, Compliance Filing, Exhibit B, Sch FR A-1, Line 23 $2,679,186
Docket No. 22-____ComEd Ex. 1.02
Page 165 of 176

WP 22
Page 2 of 2
Commonwealth Edison Company
Support for Sch FR A-3, Ln 13 - Other Adjustments to Delivery Service Revenues
(In Thousands)
Line
No. Amount
(B)
1 Other Adjustments to Delivery Service
2 LIHEAP Revenue - per FF1, Page 300 (1) 48,783$
3 To Sch FR A-3 Line 13 - Other Adj to Delivery Service Revenues 48,783$
Note:
(1) LIHEAP (Low Income Home Energy Assistance Program) Revenues are
reported by ComEd as Delivery Service Revenues but are recovered under
Rider RCA and are not recovered through Rate DSPP. No offsetting cost is
included in ComEd's revenue requirement.
Description
(A)
Docket No. 22-____ComEd Ex. 1.02
Page 166 of 176

WP 23
Page 1 of 1
Line
No. Description Source
Value
- Plan Year
(A) (B) (C)
1 System SAIFI Penalty Report under Rider DSPM 0.00%
2 System CAIDI Penalty Report under Rider DSPM 0.00%
3 Southern/Northeastern Region SAIFI
Penalty
Report under Rider DSPM 0.00%
4 Service Reliability Targets Penalty Report under Rider DSPM -0.07%
5 Estimated Electric Bills Penalty Report under Rider DSPM 0.00%
6 Consumption on Inactive Meters,
Unaccounted For Energy and
Uncollectible Expense Penalty
Report under Rider DSPM 0.00%
7 Performance Metrics Penalty (%) Sum of (Ln 1) thru (Ln 6) -0.07%
Note:
(1) On April 4, 2012 in Docket No. 11-0772, the Commission entered an
order approving ComEd's Multi-Year Performance Metrics Plan as
well as Rider DSPM - Delivery Service Performance Metrics.
Commonwealth Edison Company
Performance Metrics Penalty (%)
2021 Actual Data (1)
Docket No. 22-____ComEd Ex. 1.02
Page 167 of 176

WP 24
Page 1 of 1
Commonwealth Edison Company
Adjusted Common Equity Balance (1)
Line
No. Description: Amount:
(A) (B)
1 ComEd Year End 2021 Common Equity (1) 12,354,880$
2 Goodwill (2) (2,625,000)
3 ComEd Year End Equity Less Goodwill 9,729,880$
4 CWIP Accruing AFUDC 858,751$
5 Common Equity % of Capital Structure (3) 49.45%
6 CWIP Accruing AFUDC Equity - Line 4 * Line 5 424,666$
7 Adjusted Common Equity Balance (Line 3 - line 6) 9,305,214$
8 CWIP Accruing AFUDC Debt - Line 4 - Line 6 (4) 434,085$
Notes:
(1) 2021 FERC Form 1, Page 112, Line 16
(2) 2021 Form 10-K, Page 158
(3) Equals Line 3 $9,729,880 / (Long Term Debt
(WP13) $9,945,678 + Year End Equity Less
Goodwill of $9,729,880 (line 3))
(4) Applied as a reduction to long term debt in WP 13
Docket No. 22-____ComEd Ex. 1.02
Page 168 of 176

WP 25
Page 1 of 7
Total General &
Line Amortized Amortized Intangible Plant
No. Description General Plant (1) General Plant Intangible Plant Allocated
(A) (B) (C) (D) (E)
1 Gross Plant
2 Non-DST (2) 575,024,281$ 1,652,147$ 112,939,396$ 689,615,824$
3 DST (3) 2,209,790,835 8,586,910 903,550,877 3,121,928,622
4 Total Gross Plant 2,784,815,116 10,239,057 1,016,490,273 3,811,544,446$
5 Accumulated Depreciation/Amortization
6 Non-DST (2) (282,376,666)$ (1,630,909)$ (79,659,498)$ (4) (363,667,073)$
7 DST (3) (860,631,699) (8,465,227) (665,580,705) (1,534,677,631)
8 Total Accum. Depreciation/Amortization (1,143,008,365) (10,096,136) (745,240,203) (1,898,344,704)
9 Net Plant 1,641,806,751$ 142,921$ 271,250,070$ 1,913,199,742$
10 Depreciation Percentages Depreciation Amortization
11 DST Plant in Service (Less Acct 397) 1,447,670,016 912,137,787
12 Total Plant In Service (Less Acct 397) 1,678,689,109 1,026,729,330
13 Percentage 86.20% 88.80%
Note:
(1) Excludes Account 399.1, General Plant Asset Retirement Costs, and related Accumulated Depreciation.
(2) Non-DST represents General and Intangible Plant and Accumulated Depreciation/Amortization allocated to
Transmission functions on WP 25 Pages 2 - 9.
(3) DST represents General and Intangible Plant and Accumulated Depreciation/Amortization allocated to
Distribution and Customer functions on WP 25 Pages 2 - 9.
(4) Includes ($1,684,430) in Willis Tower Lease Amortization and ($797,417) in Transmission property held for future use
easements that are exluded from Delivery Services Rate Base.
Commonwealth Edison Company
Summary of General and Intangible Plant Allocated between DST and Non-DST Functions
As of December 31, 2021
(In Dollars)
Docket No. 22-____ComEd Ex. 1.02
Page 169 of 176

WP 25
Page 2 of 7
Line Accumulated
No. ComEd Depreciable General Plant (1) Account Gross Plant Depreciation Net Plant Allocation Basis Transmission Distribution Customer Transmission Distribution Customer Transmission Distribution Customer
(A) (B) (C) (D) (E) (F) (G) (H) (I) (C) (D) (E) (F) (G) (H)
1 General Plant Land in Fee 389.0 38,257,677$ -$ 38,257,677$ Property Usage 13.95% 69.19% 16.86% 5,336,946$ 26,470,487$ 6,450,244$ -$ -$ -$
2 General Plant Structures & Impr (1) 390.0 731,818,245 (88,680,349) 643,137,896 Property Usage 13.95% 69.19% 16.86% 102,088,645 506,345,044 123,384,556 (12,370,909) (61,357,933) (14,951,507)
3 General Plant Office Furniture & Equip 391.X 173,767,341 (59,809,980) 113,957,361 Wages and Salaries 14.60% 53.07% 32.33% 25,370,032 92,218,328 56,178,981 (8,732,257) (31,741,156) (19,336,567)
4 General Plant Transportation Equipment 392.0 435,227,216 (163,315,356) 271,911,860 Transportation 8.30% 83.00% 8.70% 36,123,859 361,238,589 37,864,768 (13,555,175) (135,551,745) (14,208,436)
5 General Plant Stores Equipment 393.0 7,730,779 (3,146,281) 4,584,498 Wages and Salaries 14.60% 53.07% 32.33% 1,128,694 4,102,724 2,499,361 (459,357) (1,669,731) (1,017,193)
6 General Plant Tools, Shop 394.0 247,311,638 (100,508,472) 146,803,166 Gross Plant 21.39% 78.61% 0.00% 52,899,959 194,411,679 - (21,498,762) (79,009,710) -
7 General Plant Lab Equipment 395.0 15,275,674 (3,353,230) 11,922,444 Gross Plant 21.39% 78.61% 0.00% 3,267,467 12,008,207 - (717,256) (2,635,974) -
8 General Plant Power Operated Equip 396.0 7,740,971 (3,970,863) 3,770,108 Gross Plant 21.39% 78.61% 0.00% 1,655,794 6,085,177 - (849,368) (3,121,495) -
9 General Plant Communications Equip 397.0 1,106,126,007 (726,391,443) 379,734,564 Location of Equipment 31.10% 68.90% 0.00% 344,005,188 762,120,819 - (225,907,739) (500,483,704) -
10 General Plant Miscellaneous Equipment 398.0 21,559,568 (5,815,986) 15,743,582 Wages and Salaries 14.60% 53.07% 32.33% 3,147,697 11,441,663 6,970,208 (849,134) (3,086,544) (1,880,308)
11 General Plant Other Tangible Equipment 399.0 - - - Wages and Salaries 14.60% 53.07% 32.33% - - - - - -
12 General Plant Asset Retirement (2) 399.1 9,739,426 (5,857,384) 3,882,042 Non DST 0.00% 0.00% 0.00% - - - - - -
13 Removal and Salvage Work In Progress - 11,983,595 11,983,595 Gross Plant 21.39% 78.61% 0.00% - - - 2,563,291 9,420,304 -
14 Total Depreciable General Plant 2,794,554,542$ (1,148,865,749)$ 1,645,688,793$ 575,024,281$ ############ 233,348,118$ ########### ########### (51,394,011)$
Notes: Notes:
(1) Excludes cost of leasehold improvements, which are amortized (see WP 25, Pages 4 - 5). (1) Excludes cost of leasehold improvements, which are amortized (see WP 25, Pages 4-5).
(2) Account 399.1 has been excluded from rate base because removal (2) Account 399.1 has been excluded from rate base because removal costs are recovered
costs are recovered through depreciation expense. through depreciation expense.
2021 - Actual2021 - Actual
Commonwealth Edison Company
Depreciable General Plant and
Related Accumulated Depreciation
Allocated to ComEd Functions
Commonwealth Edison Company
Depreciable General Plant and
Related Accumulated Depreciation
Allocated to ComEd Functions
(In Dollars)(In Dollars)
As of December 31, 2021
Allocation Of Accumulated DepreciationAllocation Of Gross PlantPercentage Allocation to Function
Docket No. 22-____ComEd Ex. 1.02
Page 170 of 176

WP 25
Page 3 of 7
Line Accumulated
No. ComEd Amortizable General Plant Gross Plant Amortization Net Plant Transmission Distribution Customer Transmission Distribution Customer Transmission Distribution Customer
(A) (B) (C) (D) (E) (F) (G) (B) (C) (D) (E) (F) (G)
1 Leasehold Improvements - Acct. 390:
2 One Lincoln Centre 4,705,757$ (4,705,757)$ -$ 19.11% 80.89% 0.00% 899,270$ 3,806,487$ -$ (899,270)$ (3,806,487)$ -$
3 One Financial Place 5,066,464 (4,923,544) 142,920 14.86% 74.50% 10.64% 752,877 3,774,516 539,072 (731,639) (3,668,040) (523,865)
4 Romeoville 466,835 (466,835) - 0.00% 0.00% 100.00% - - 466,835 - - (466,835)
5 Total Amortizable General Plant 10,239,056$ (10,096,136)$ 142,920$ 1,652,147$ 7,581,003$ 1,005,907$ (1,630,909)$ (7,474,527)$ (990,700)$
ComEd Functions
2021 - Actual
(In Dollars)
ComEd Functions
2021 - Actual
(In Dollars)
Commonwealth Edison Company
Allocation of Plant and Accumulated Amortization
Related to Amortizable General Plant to
Commonwealth Edison Company
Allocation of Plant and Accumulated Amortization
Related to Amortizable General Plant to
As of December 31, 2021
Allocation of Accumulated AmortizationAllocation of Gross Plant
Amortizable General Plant
Percentage Allocation to Function
Docket No. 22-____ComEd Ex. 1.02
Page 171 of 176

WP 25
Page 4 of 7
Line Accumulated
No. ComEd Intangible Plant Account Gross Plant Amortization Net Plant
(A) (B) (C) (D) (E)
1 Intangible-Non-Depreciable 301.000 80,375$ -$ 80,375$
2 Intangible - Software:
3 AMI NonBilling Software 303.000 28,298,052 (3,503,846) 24,794,206
4 CIMS Software 303.000 184,004,565 (181,507,505) 2,497,060
5 Meter Data Management 303.000 71,242,677 (71,242,677) -
6 Mobile Data Software 303.000 37,580,945 (37,580,945) -
7 Passport Software 303.000 49,744,958 (49,744,958) -
8 Cyber Security 303.000 27,702,543 (27,702,543) -9 Miscellaneous Software 303.000 617,836,157 (371,202,858) 246,633,299
10 Total ComEd Intangible Plant (1) 1,016,490,272$ (742,485,332)$ 274,004,940$
11 Limited Term Easements - Transmission 350.000 412,767$ (258,452)$ 154,315$
12 Limited Term Easements - Distribution 360.000 24,286$ (14,572)$ 9,714$
13 (amortization included in Account 111)
Note:
(1) Gross plant balance from FERC Form 1, Page 205, Line 5, Column G.
As of December 31, 2021
(In Dollars)
Commonwealth Edison Company
Allocation of Intangible Plant and Limited Term Easements
2021 - Actual
Docket No. 22-____ComEd Ex. 1.02
Page 172 of 176

WP 25
Page 5 of 7
Line
No. ComEd Intangible Plant Allocation Basis Transmission Distribution Customer
(A) (B) (C) (D) (E)
1 Intangible-Non-Depreciable (Organization Costs) Wages and Salaries 14.60% 53.07% 32.33%
2 Intangible - Software:
3 AMI NonBilling Software 100% Customer 0.00% 0.00% 100.00%
4 CIMS Software 100% Customer 0.00% 0.00% 100.00%
5 Meter Data Management 100% Distribution 0.00% 100.00% 0.00%
6 Mobile Data Software Gross Plant 21.39% 78.61% 0.00%
7 Passport Software Gross Plant 21.39% 78.61% 0.00%
8 Cyber Security Wages and Salaries 14.60% 53.07% 32.33%9 Miscellaneous Software Wages and Salaries 14.60% 53.07% 32.33%
10
11 Limited Term Easements - Transmission Transmission 100.00% 0.00% 0.00%
12 Limited Term Easements - Distribution Distribution 0.00% 100.00% 0.00%
13 (amortization included in Account 111)
Percentage Allocation to Function
(In Dollars)
Commonwealth Edison Company
Allocation of Intangible Plant and Limited Term Easements
2021 - Actual
Docket No. 22-____ComEd Ex. 1.02
Page 173 of 176

WP 25
Page 6 of 7
Line
No. ComEd Intangible Plant Transmission Distribution Customer
(A) (B) (C) (D)
1 Intangible-Non-Depreciable 11,735$ 42,655$ 25,985$
2 Intangible - Software:
3 AMI NonBilling Software - - 28,298,052
4 CIMS Software - - 184,004,565
5 Meter Data Management - 71,242,677 -
6 Mobile Data Software 8,038,564 29,542,381 -
7 Passport Software 10,640,447 39,104,511 -
8 Cyber Security 4,044,571 14,701,740 8,956,2329 Miscellaneous Software 90,204,079 327,885,649 199,746,430
10 Total ComEd Intangible Plant 112,939,396$ 482,519,613$ 421,031,264$
11 Limited Term Easements - Transmission 412,767$ -$ -$
12 Limited Term Easements - Distribution -$ 24,286$ -$
13 (amortization included in Account 111)
Note:
(1) Allocation Percentage on WP 25, Page 7 Columns (C), (D), and (E)
Allocation of Gross Plant (1)
Commonwealth Edison Company
Allocation of Intangible Plant and Limited Term Easements
2021 - Actual
(In Dollars)
Docket No. 22-____ComEd Ex. 1.02
Page 174 of 176

WP 25
Page 7 of 7
Line
No. ComEd Intangible Plant Transmission Distribution Customer
(A) (B) (C) (D)
1 Intangible-Non-Depreciable -$ -$ -$
2 Intangible - Software
3 AMI Non-Billing Software - - (3,503,846)
4 CIMS Software - - (181,507,505)
5 Meter Data Management - (71,242,677) -
6 Mobile Data Software (8,038,564) (29,542,381) -
7 Passport Software (10,640,447) (39,104,511) -
8 Cyber Security (4,044,571) (14,701,740) (8,956,232)
9 Miscellaneous Software (54,195,617) (196,997,357) (120,009,884)10 Total Intangible Plant Accumulated Amortization (76,919,199)$ (351,588,666)$ (313,977,467)$
11 Limited Term Easements - Transmission (258,452)$ -$ -$
12 Limited Term Easements - Distribution -$ (14,572)$ -$
13 (amortization included in Account 111)
Note:
(1) Allocation Percentages on WP 25, Page 7.
Allocation of Accumulated Amortization (1)
Commonwealth Edison Company
Allocation of Intangible Plant and Limited Term Easements
Related To Intangible Plant
2021 - Actual
(In Dollars)
Docket No. 22-____ComEd Ex. 1.02
Page 175 of 176

WP 26
Page 1of 1
Commonwealth Edison Company
Other Adjustments 2021
(In Thousands)
Line
No. Description
(A)
1 There are no other adjustments necessary for
2 Schedule FR A-4, Line 30a
Docket No. 22-____ComEd Ex. 1.02
Page 176 of 176
Related Documents


![DEPARTMENT OF COMMERCE [Docket No. 210702-0143] RIN …](https://static.cupdf.com/doc/110x72/61fe2a204d7bcf68240c95b5/department-of-commerce-docket-no-210702-0143-rin-.jpg)


