Do the spatial characteristics of myocardial scar tissue determine the risk of ventricular arrhythmias? Angel Arenal , Jesus Hernández , Esther Pérez-David , José L. Rubio-Guivernau , Maria J. Ledesma-Carbayo , and Francisco Fernández-Aviles Abstract Sudden cardiac death is one of the main causes of mortality in patients with structural heart disease. Although an implantable cardioverter defibrillator significantly reduces the mortality rate, many patients newer receive a shock. Identification of high-risk patients would reduce the costs associated with this therapy and prevent the deleterious effect of inappropriate discharges. As scar tissue is the substrate of ventricular arrhythmias in patients with structural heart disease, scar characterization could allow stratification of the risk. The objective of this article is to review the role of scar characteristics in the pathogenesis of ventricular arrhythmias in patients with structural heart disease. Keywords Myocardial scar • Ventricular tachycardia This article is part of the Spotlight Issue on: Reducing the Impact of Myocardial Ischaemia/Reperfiision Injury 1. Introduction Monomorphic ventricular tachycardia (MVT) in patients with structural heart disease can be caused by several mechanisms (e.g. bundle branch re-entry, fascicular re-entry, and automatism from cells located at the border of the scar or in the His-Purkinje system); however, most are caused by myocardial scar re-entry. Although myocardial scars can also appear during the evolution of right ventricular cardiomyopathy and congenital heart disease, this review examines the processes associated with left ventricular scars, namely ischaemic heart disease and non-ischaemic cardiomyopathy. In this article, in order to obtain accurate information on the scar dimension and heterogeneity of the scar, we will review the literature regarding the characteristics of the scar using three-dimensional (3D) navigation systems and contrast (gadoltnium)-enhanced magnetic resonance imaging (ceMRl). 2. Ventricular tachycardia substrate in patients with ischaemic heart disease 2.1 Slow conduction determinants 2.1.1 Gap junction changes The mechanism underlying sustained MVT in patients with chronic myocardial infarction is a re-entry in which the slow conduction pathways are composed of bundles of viable myocytes embedded in regional scars. These surviving myocytes join to create corridors that reach the border of the scar and connect to normal tissue. 1 The development of slow conduction pathways involves processes linked to cardiac remodelling, such as cardiac fibrosis, 2 which acts on surviving myocytes and leads to cell disconnection and zigzag con- duction. " Cell connection depends on the integrity of gap junctions, which permit the passage of intracellular ions between cells. Gap junc- tions are formed by two connexons, one from each connected cell, which migrate from the Golgi apparatus to the intercalated disks and bind end to end with connexons from apposing cells. The factors affecting gap junctions and contributing to cell disconnection and formation of the anatomical substrate of ventricular arrhythmias are reduced expression of connexin (Cx) 43, which is commonly observed after myocardial infarction, 5 and misallocation of connex- ons. The turnover of gap junctions is very fast, because the half-life of Cx43 is as short as 2—5 h,^ thus facilitating misallocation of a con- nexon in the membrane in patients with heart diseases such as myo- cardial infarction. The membrane signals that attract connexons to intercalated disks may be shifted to the lateral membrane, thus direct- ing them towards the lateral non-disc sarcolemmal membrane. Al- though these alterations in gap junction distribution may contribute to slow electrical conduction, their role is probably a minor one,

Welcome message from author
This document is posted to help you gain knowledge. Please leave a comment to let me know what you think about it! Share it to your friends and learn new things together.
Transcript

Do the spatial characteristics of myocardial scar tissue determine the risk of ventricular arrhythmias? Angel Arenal , Jesus Hernández , Esther Pérez-David , José L. Rubio-Guivernau , Maria J. Ledesma-Carbayo , and Francisco Fernández-Aviles
Abstract Sudden cardiac death is one of the main causes of mortal i ty in patients wi th structural heart disease. Al though an
implantable cardioverter defibri l lator significantly reduces the mortal i ty rate, many patients newer receive a shock.
Identification of high-risk patients wou ld reduce the costs associated w i th this therapy and prevent the deleterious
effect o f inappropriate discharges. As scar tissue is the substrate of ventricular arrhythmias in patients wi th structural
heart disease, scar characterization could al low stratification o f the risk. The objective of this article is t o review the
role o f scar characteristics in the pathogenesis o f ventricular arrhythmias in patients wi th structural heart disease.
Keywords Myocardial scar • Ventricular tachycardia
This ar t ic le is p a r t o f t h e Spot l ight Issue o n : Reducing the I m p a c t o f Myocard ia l I s c h a e m i a / R e p e r f i i s i o n Injury
1. Introduction
Monomorphic ventricular tachycardia (MVT) in patients wi th structural
heart disease can be caused by several mechanisms (e.g. bundle branch
re-entry, fascicular re-entry, and automatism f rom cells located at the
border o f the scar o r in the His-Purk in je system); however, most are
caused by myocardial scar re-entry. Although myocardial scars can
also appear during the evolution of right ventricular cardiomyopathy
and congenital heart disease, this review examines the processes
associated w i th left ventricular scars, namely ischaemic heart disease
and non-ischaemic cardiomyopathy. In this article, in o rder t o obtain
accurate information on the scar dimension and heterogeneity o f the
scar, we wi l l review the literature regarding the characteristics o f the
scar using three-dimensional (3D) navigation systems and contrast
(gadoltnium)-enhanced magnetic resonance imaging (ceMRl).
2. Ventricular tachycardia substrate in patients with ischaemic heart disease
2.1 Slow conduction determinants 2.1.1 G a p junct ion changes
The mechanism underlying sustained MVT in patients wi th chronic
myocardial infarction is a re-entry in which the slow conduct ion
pathways are composed o f bundles o f viable myocytes embedded in
regional scars. These surviving myocytes join t o create corr idors
that reach the border of the scar and connect to normal tissue.1
The development of slow conduction pathways involves processes
linked t o cardiac remodell ing, such as cardiac fibrosis,2 which acts
on surviving myocytes and leads to cell disconnection and zigzag con
duct ion. " Cell connection depends on the integrity o f gap junctions,
which permi t the passage of intracellular ions between cells. Gap junc
tions are formed by t w o connexons, one f rom each connected cell,
which migrate f rom the Golgi apparatus t o the intercalated disks
and bind end t o end w i th connexons f rom apposing cells. The
factors affecting gap junctions and contr ibut ing t o cell disconnection
and format ion of the anatomical substrate o f ventricular arrhythmias
are reduced expression of connexin (Cx) 43, which is commonly
observed after myocardial infarction,5 and misallocation o f connex
ons. The turnover o f gap junctions is very fast, because the half-life
of Cx43 is as short as 2—5 h,^ thus facilitating misallocation of a con-
nexon in the membrane in patients wi th heart diseases such as myo
cardial infarction. The membrane signals that attract connexons t o
intercalated disks may be shifted to the lateral membrane, thus direct
ing them towards the lateral non-disc sarcolemmal membrane. A l
though these alterations in gap junct ion distr ibution may contr ibute
t o slow electrical conduct ion, their role is probably a minor one,

Myocardial scar and ventricular arrhythmias
because conduction velocity slows only when Cx43 is reduced by
70 -95%, but not by 50%.B This observation suggests that the reduc
t ion of Cx43 expression in patients wi th heart disease is probably not
enough to reduce conduction velocity. In fact, deposit ion of collagen
between myocytes may be required t o slow conduction. A recent
study suggested that only the synergism between sodium current re
duct ion, along w i th increased fibrosis and impaired intercellular coup
ling, could lead to a marked decrease in conduct ion velocity.
Therefore, simply reducing gap junctions is not enough to slow con
duct ion, and interaction between surviving myocytes and cardiac f i
brosis seems t o be necessary for the development of ventricular
tachycardia (VT) substrate.
2.1.2 Fibroblasts and cardiac fibrosis
The heart is formed by different types o f cells, mainly myocytes and
fibroblasts. In some species, fibroblasts account f o r more than half
of all heart cells and produce the extracellular matrix (ECM), which
is composed o f several types of collagen, as wel l as f ibronectin. The
main role o f the ECM is t o create the scaffold for cardiomyocytes.11
Cardiac fibroblasts and the ECM form a network t o which the myo
cytes attach, and which helps t o maintain the structural integrity o f the
heart while, at the same t ime, enabling fibroblasts t o exert mechanical
forces on the myocytes.12 Cardiac fibroblasts are not isolated cells,
because they can connect t o o ther fibroblasts and myocytes by
Cx45 and Cx43, as observed at homocellular and hete roce Ilutar junc
tions. ' Mechanical stress and chemical signalling can activate
cardiac fibroblasts after a cardiac injury, thus starting the remodell ing
process. The cardiac fibroblasts that, up t o this point, have synthesized
and degraded the ECM in such away that they have maintained a f i rm
equil ibrium, begin t o increase the product ion o f ECM that surrounds
myocytes, thus disrupting cell connections, and generating electrical
barriers that give rise t o the discontinuous conduction that reduces
conduction velocity,
Remodelling not only implies an increase in ECM product ion, but
also important changes in f ibroblast phenotype. Af ter heart injury,
some fibroblasts express smooth muscle cell proteins that are not
normally expressed in fibroblasts, such as a-smooth muscle actin.
Fibroblasts w i th smooth muscle cell characteristics are called myofi
broblasts. This phenotype change has the fol lowing t w o importance
consequences: (i) the contracti le proteins that facilitate the healing
process can also transmit mechanical tension to the myocytes; and
(¡i) myofibroblasts have higher Cx43 levels than fibroblasts, w i th the
result that electrical coupling between isolated myocytes and myofi
broblasts increases.17 This observation is important, because contacts
between fibroblasts and cardiomyocytes in intact and healthy hearts
are weak.13 Consequently, myofibroblasts have a significantly
greater ability than fibroblasts t o modify the electrophysiological char
acteristics of myocytes.
2.1.3 Effects o f the in teract ion b e t w e e n myocytes and
myof ibroblasts
Myofibroblasts are present in post-infarction scars in humans. They
have been found as early as 4 - 6 days after infarction, and seem t o
persist for many years. As mentioned above, myofibroblasts can
express Cx43 and Cx45, both among themselves and w i th cardio
myocytes. Consequently, the presence of these connexins enables
electrical current t o pass between myocytes and myofibroblasts. A l
though myofibroblasts do not express sodium channels, membrane
resistance is so high that electrotonic current can f low between non-
connected myocytes through fibroblast bridges over extended dis
tances.20 The electrical current f lowing through connections
between myocytes and fibroblasts causes a gradual decline in
myocyte resting membrane potential, because fibroblasts are less
polarized. Therefore, fibroblasts can partly depolarize myocytes into
the range of sodium channel inactivation, thus producing slowing of
conduction. Myofibroblast contract ion, which plays a key role in
healing, may also cause slowing o f conduction in scar areas after a
myocardial infarction. Myofibroblasts can contract and transmit the
contracti le force to myocytes, thus activating mechanosensitive chan
nels. The activation of mechanosensitive channels depolarizes the car-
diomyocyte membrane and inactivates sodium channels.
The above findings suggest the electro-anatomical interaction
between surviving myocytes, fibrosis, and fibroblasts/myofibroblasts
wi th in the scar, which generates slow conduct ion pathways that
fo rm part o f the re-entrant circuit. Therefore, characterization of
the scar and the surviving myocytes could enable us t o stratify the
risk of arrhythmia after myocardial infarction.
2.2 Voltage mapping scar characteristics in patients with ventricular arrhythmias As VT substrate is intimately related t o surviving myocytes inside the
scar, characterization of the VT substrate relies on identif ication o f
the scar. Scars are areas w i th few myocytes where f ibrous tissue pre
vails; consequently, local electrograms recorded at these sites are
characterized by lower voltage amplitude than electrograms recorded
in normal tissue. Scar areas can be identified according to the elec
t rogram amplitude measured during catheter mapping and delimited
using navigation systems that permit the 3D reconstruction of the
endocardial o r epicardial surface o f the cardiac chambers and
project the voltage o f the electrograms at the corresponding site
on the surface. The resulting voltage maps can be visualized and ana
lysed on a computer display. The voltage o f the local electrogram is
colour coded and can be adjusted according to different definitions
o f scar tissue (figure i A). Animal and human studies have identified
the voltage cut-off that differentiates the electrograms recorded in
norma! and scar tissues. ' A voltage > 1.5 mV distinguishes
normal myocardium f rom scar, and the scar itself can be differentiated
into dense scar (<0 .5 mV) and scar border ( > 0 . 5 and <1.5 mV).
These voltage limits have been used t o establish a direct correlat ion
between the extension o f the scar in voltage maps and anatomical
preparations.2 '1 Slow conduct ion areas within the scar are easily
recognized during endocardial mapping by recording the electrograms
w i th isolated components o r late potentials (E-OLP) . 2 É IC and LP are
components o f the electrogram that are recorded beyond the end o f
the QRS and separated f r o m the main component o f the electrogram
by an isoelectric line. Several studies have established the relationship
between E-IC/LP and VT isthmuses. ' IC/LP are not homogeneous
ly dispersed around the scar, but located in specific areas. Around
70% o f E-IC/LP fo rm slow conduct ion channels (CC), • which are
areas inside the scar that are differentiated f r o m the surrounding
scar by a higher voltage. These structures are easily identified in
voltage maps by carefully adjusting the voltage threshold that
defines the scar (figure i B). ' This observation emphasizes a deter
minant characteristic o f the scar, namely, the scar is not a homoge
neous structure, but clearly a heterogeneous structure whose
heterogeneity is related t o surviving fibres. Therefore, heterogeneity
is intimately related to arrhythmogenesis, as illustrated by ultrahigh-
Á. Arenal et al
Stags. Bawftna
Display Map 1 Bipolar Vottage
B
Slag* Baa*ttn*
>=0 5 r ^ V Display Map 1 Bipolar VotLage
>=Q2ltfíV
1
2
J I li 3ml/
i? r";i ::ri- 0.79 cm
5 -V—
T—'Wlv \lh,V
]
7
F i g u r e I (A) Voltage map showing a scar in a patient with previous inferior myocardial infarction. The colour range represents the electrogram
voltage amplitude. Dense scar is shown in red (electrogram amplitude <0.5 mV). (S) Voltage map showing the heterogeneity of the scar and con
duction channels. This view of the inferior wall of the left ventricle shows a voltage map during right ventricular apical pacing, when the voltage that
defined the scar was set at 0.2 mV. At this voltage, a channel spans from the septum to the lateral wall. The electrogram recorded at sites identified by
white numbers is shown on the left of the paneL This figure shows the heterogeneous nature of the scar. Electrograms with a higher amplitude are
inside the scar (electrograms 2 -6 ) ; the / usually present isolated components or late potentials (IC/LP), and are associated with the formation of
conduction channels. Reproduced with permission from reference 28.
density mapping w i th mult ipolar catheters, showing that E-IC/LP that
are critical t o re-entry are adjacent t o heterogeneous islets.30 C C and
E - O L P are sensitive and specific markers o f VT substrate in ischaemic
patients. Recent studies show that E-iC/LPs are found in more than
90% of V T isthmuses.26 '27,31 In addit ion, Haqqani et of.32 reported
that C C within dense scar tissue and adjacent t o the mitral annulus
and E-IOLP were more frequently observed in sustained MVT
patients than in con t ro l patients, despite similar left ventricle (LV)
parameters, such as ejection fraction (EF).
These studies highlight an important finding, namely, that scar is not
a homogeneous tissue, because some areas have a higher voltage
owing to the presence of surviving fibres. These areas are corr idors
o f slow conduct ion that can f o r m part of re-entrant circuits. There
fore, ventricular arrhythmias are mainly due to scar heterogeneity.
2.3 Characterization of the scar by MRI Contrast (gadolinium)-enhanced magnetic resonance imaging (ceMRI)
can accurately identify and delimit myocardial infarction in both
animals and humans. Gadolinium is trapped by f ibrous tissue,
thus generating the higher signal intensity (SI) observed in MR
images. In humans, an SI above 2 SD of the mean remote normal myo
cardium SI can be used to identify the infarct. Signal intensity differ
entiates t w o areas wi th in the scan (i) the core area, defined by an SI
> 3 SD above the remote normal myocardium SI; and (ii) the
heterogeneous tissue (HT) o r grey zone that contains the surviving
myocytes mixed w i th f ibrous tissue and that is defined by an SI of
between 2 and 3 SDs35 (Figure 2). The presence o f viable myocytes
causes the lower SI of the HT.
2.3.1 Scar characterist ics and V T inducibil ity
Several studies have shown the association between non-invasively
detected scar size and architecture and bo th inducible and spontan
eous MVT. Bello et of.3'1 reported that the Infarct size and morphology
detected by ceMRI is a better predictor of VT inducibility than LVEF.
The authors studied 48 patients w i th known coronary artery disease
w h o were referred for electrophysiological study using ceMRI. Scar
characteristics we re determined and compared between patients
wi th no inducible VT, those wi th inducible MVT, and those w i th indu
cible ventricular fibri l lation. Patients wi th MVT had larger infarcts than
patients w h o did not have inducible arrhythmias. Patients w i th poly
morphic VT/fibri l lat ion had intermediate values. Logistic regression
demonstrated that infarct mass and surface area were better predic
tors of inducibility o f MVT than LVEF. Both size and characteristics of
the scar are related t o inducibility o f MVT. Schmidt et al. reported
that H T mass detected by MRI was the best predictor of VT induci
bility. VT inducibility was tested before implantation of an implantable
cardioverter defibri l lator (!CD) for primary prevention in 47 patients
w h o underwent ceMRI. W h e n inducible and non-inducible patients

Myocardial scar and ventricular arrhythmias
F i g u r e 2 Identifcation of scar, dense scar, and heterogeneous tissue based on measurement of signal intensity (SI) using contrast
(gadolinium)-enhanced magnetic resonance imaging (ceMRI). This ceMRI long axis view shows the anteroseptal infarct as high SI (area inside the con
tinuous line) and the normal myocardium as dark SI. Heterogeneous tissue was defined using the following process: (i) the endocardial and epicardial
borders were drawn: and (ii) a region of interest in the remote non-infarcted myocardium and the normal SI was defined (site 2). The myocardial
segment with an SI > 2 SD of the infarcted region was loosely outlined. Heterogeneous tissue (sites 3 and 4) can be differentiated inside the infarcted
area (SI > 2 SD < 3 SD) and dense scar (Sl>3 SD; site 5).
were compared, no differences were observed between LVEF, LV
end-diastolic volume, and infarct size. Nevertheless, H T mass was sig
nificantly higher in inducible patients, and was the only significant pre
dictor in stepwise logistic regression analysis.
2.3.2 Scar characteristics and prognosis af ter myocard ia l
infarct ion
N o t only is scar characterization useful f o r differentiating patients wi th
inducible VT, it can also establish outcome after myocardial infarction.
Yan et of.35 studied 144 patients wi th documented coronary artery
disease and abnormal myocardial delayed enhancement consistent
w i th post-infarction scar. Based on the SI, the authors measured the
to ta l infarct size and divided it between the scar core and HT. After
a median fol low-up o f 2.4 years, 29 (20%) patients died. Patients
w i th an above-median HT/infarct size quot ient were at higher risk
f o r death than those wi th a below-median HT/infarct size. Left ven
tr icular systolic volume index and HT/infarct size were the strongest
predictors of all-cause mortal i ty and cardiovascular mortal i ty in a
multivariate analysis. Moreover, HT/infarct size maintained the inde
pendent associations "with all-cause and cardiovascular mortal i ty
after adjusting fo r age and LVEF.
These studies demonstrated that tissue heterogeneity is present
and quantifiable in human infarcts. More extensive tissue heterogen
eity correlates w i th increased ventricular irritabil ity by programmed
electrical stimulation and w i th an increment in cardiac mortality.
These findings are consistent w i th data obtained during voltage
mapping, and show the heterogeneity o f the scar in patients wi th
M V T . 2 " 0
2.4 3D structure of HT: basis for the differentiation of patients with and without M V T Recent data obtained f rom animal and human studies in which scars
detected by MRl were imported into navigation systems and
merged wi th electro-anatomical maps have revealed that the MVT
substrate is undoubtedly located inside the MRJ-detected scar and
associated wi th HT. Ashikaga et d.?7 registered V T activation
sequences 10—12 days after infarction wi th the 3D scar anatomy
derived f rom high-resolution ceMR!. The authors used a porcine
model of chronic myocardial infarction based on epicardial sock elec
trodes or endocardial basket catheters, which are in direct contact
w i th the part o f the myocardium where the electrical signal is
recorded. MRl revealed a scar w i th spatially complex structures, par
ticularly at the VT isthmuses. The re-entry isthmus was characterized
by a relatively small volume of viable myocardium bound by the scar
tissue. Codreanu et at. and Desjardins et a!, showed that critical
sites o f post-infarction MVT arrhythmias were confined to scars
detected by voltage mapping that overlapped w i th areas o f high SL
Nevertheless, the MVT substrate inside the scar was not completely
characterized in these studies.

Á. Arenal et at.
In order t o gain fur ther insight into the MVT substrate. Perez-David
et al?0 compared the architecture o f the scar and H T in a group of
patients w i th MVT and in a matched contro l group. The scar, scar
core, and H T were defined as the tissues showing an SI > 2 SD, > 3
SD, and between 2 and 3 SD of remote normal tissue SI, respective
ly.3 To determine the architecture of the HT, the authors examined
consecutive short-axis slices, in which the H T was automatically col
oured based on SI (Figure 3). These slices were evaluated t o deter
mine the continuity of the H T and its connections t o normal
myocardium. The H T usually surrounded the core o f the scar, but
also formed corrí dor-l ike structures, through which HT passed
f rom one side to the next by crossing the core of the scar and con
necting t o normal tissue. These structures are known as H T channels
(Figure 4). Al though no differences were observed regarding LVEF or
necrotic mass, HT channels were more common in the MVT group
than in the con t ro l group (88 vs. 33% of patients; P < 0.005). Most
HT channels were located partly o r totally in the subendocardium.
2.4.1 SI mapp ing
A n SI map is a 3D map in which the average subendocardial or sub
epicardial SI is projected on a shell that represents either the endocar
dial or the epicardial surface of the left ventricle. The SI was colour
F i g u r e 3 ceMRI characterization of the structure of heterogeneous tissue. Two short-axis slices of an anteroseptat myocardial infarction in a patient
from the sustained monomorphic ventricular tachycardia group, showing the following features: (A) the unprocessed infarct zone (arrows indicate
heterogeneous tissue); (6) an area with SI >2 SD: (C) an area with signal intensity > 3 SD (the core of the scarred area); and (D) the differences
between (B and C) (SI >2 SD and < 3 SD). Heterogeneous tissue is shown in blue. Reproduced with permission f rom reference 40.
F i g u r e 4 Identification of HT channels. Short-axis slices of a posterolateral myocardial infarction in a patient from the sustained MVT group. Notice
the continuity of the HT in the successive short-axis slices, creating a corridor/channel that extends from the base to the apex. Whi te arrows show
the HT channel (in blue). Reproduced with permission from reference 40.
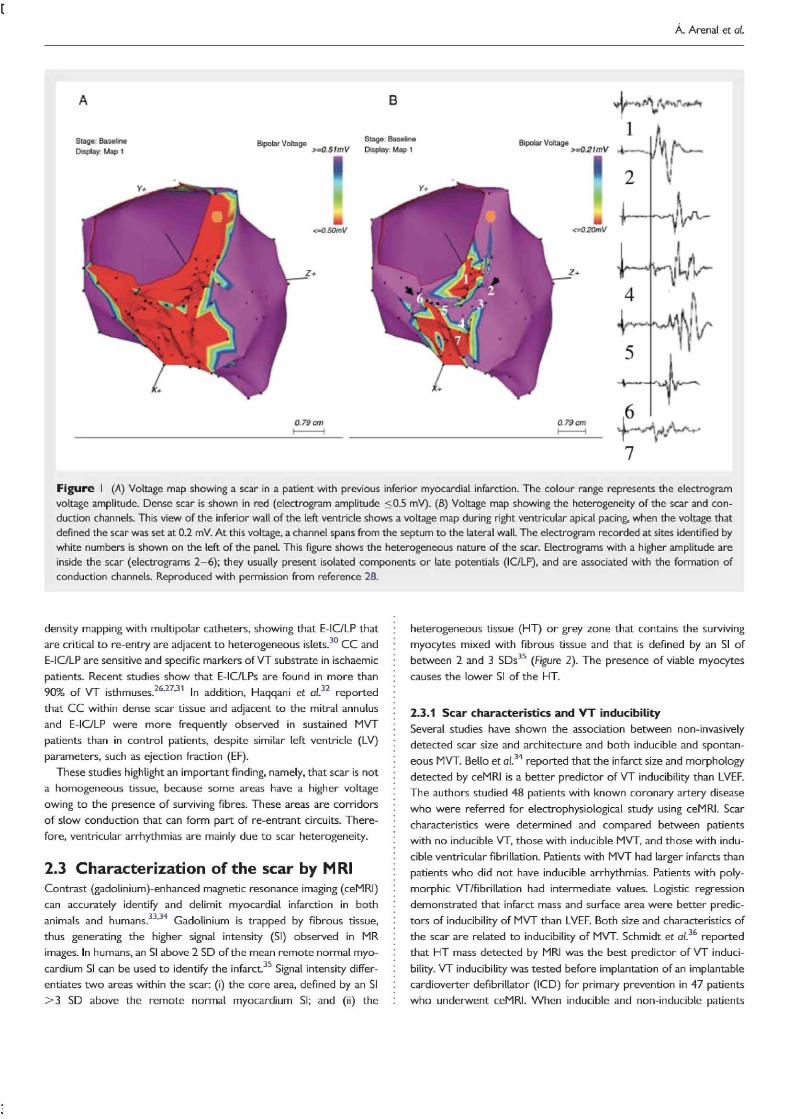
F i g u r e 5 Endocardial SI mapping from a patient with sustained
monomorphic ventricular tachycardia (MVT) and an anteroseptal
scar. For this process, the left ventricular endocardial/epicardial con
tours were manually defined on contiguous short-axis slices, which
were imported into a custom-developed tooL The average SI of
the subendocardial tissue is projected onto the endocardial
surface. The colour range provides information on subendocardial
SI. as follows: the red area represents an SI > the minimal SI in
the core of the scar; the magenta area represents normal myocar
dium (SI < SI peak in normal myocardium); and the area between
these extremes is the heterogeneous tissue.
coded t o provide information on the distr ibution o f HT, and to deter
mine the presence of SI channels that were defined as corr idors of
continuous tissue differentiated by a lower SI f rom the surrounding
scar tissue and connected to normal myocardium via at least one
point (Figure 5, white arrowheads).
2.4.2 C o m p a r i s o n of vo l tage and SI mapp ing in V T pat ients
The comparison of voltage and SI maps showed a significant relation
ship between infarct mass (SI > 2 SD) and scar extension defined by
< 1.5 mV (R1, 0.4; P < 0.009). SI mapping showed the presence of 26
channels In 17 o f 18 patients; these channels coincided In location and
orientat ion wi th a corresponding C C in the voltage maps (Figure 6).
Electrograms wi th IC/LP were recorded In the inner part of all chan
nels. Similar results were recently reported by Andreu et ai., w h o
compared SI and electro-anatomical mapping. O f the 16 C C observed
w i th voltage mapping, 13 (81%) were identified on the 3D ceMRI-
derived scar reconstruction when only half of the subendocardial
wal l was considered. These observations proved the association
between IC/LP and HT and, consequently, the association between
H T and VT substrate.
2.4.3 Role o f SI mapp ing in t h e di f ferent iat ion o f pat ients
w i t h and w i t h o u t V T
The information afforded by SI mapping could prove useful for iden
tifying patients at low risk o f ventricular arrhythmias.40 W h e n patients
w i th and wi thout VT were compared, SI channels were more fre
quently observed in patients w i th VT. Endocardial SI mapping
detected channels in 94% o f patients in the sustained MVT group
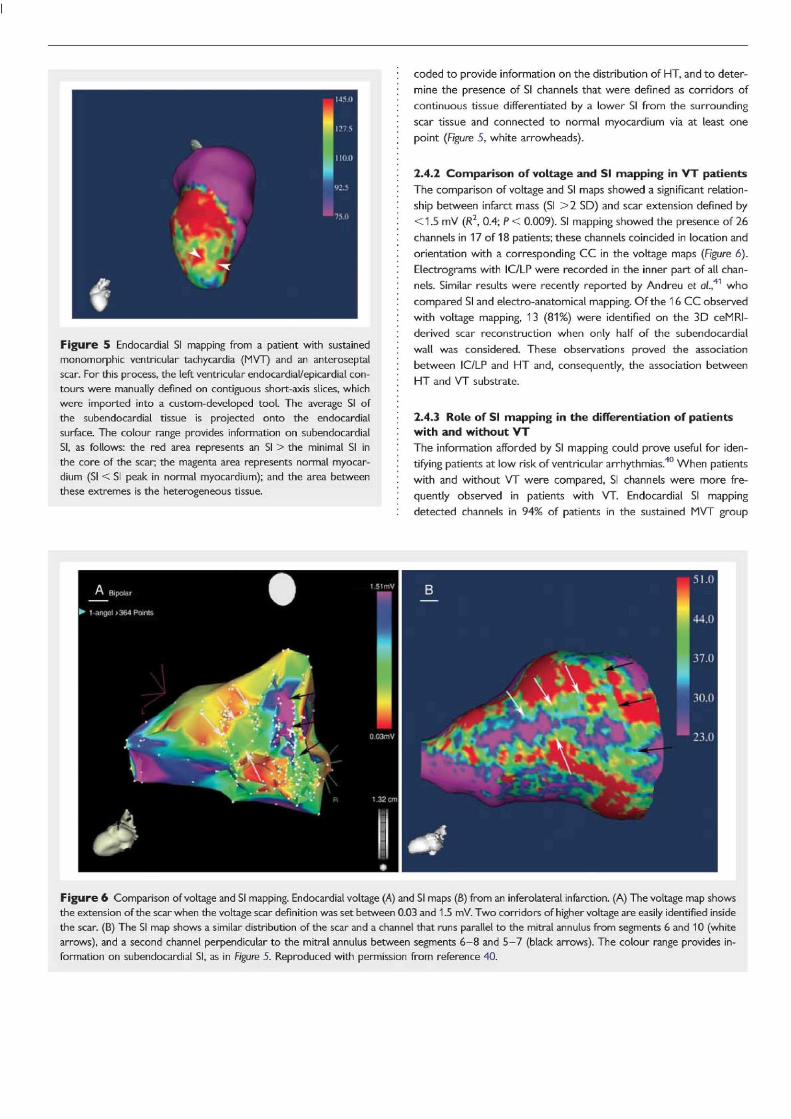
F i g u r e 6 Comparison of voltage and SI mapping. Endocardial voltage (A) and SI maps (8) from an inferolateral infarction. (A) The voltage map shows
the extension of the scar when the voltage scar definition was set between 0.03 and 1.5 mV. Two corridors of higher voltage are easily identified inside
the scar. (B) The SI map shows a similar distribution of the scar and a channel that runs parallel to the mitral annulus from segments 6 and 10 (white
arrows), and a second channel perpendicular to the mitral annulus between segments 6 - 8 and 5 - 7 (black arrows). The colour range provides in
formation on subendocardial SI, as in Figure 5. Reproduced with permission from reference 40.
Á. Arenal et Q\.
and in only 55% of patients in the cont ro l group (Figure 7). In addit ion,
complete SI channels, namely, those connected to normal tissue by
t w o sites, were observed in 17 o f 18 patients in the VT group, but
in only five in the cont ro l group. Therefore, the absence of SI channels
could enable us t o identify low-risk patients, because almost all
patients w i th MVT had SI channels.
2.4.4 Future applications of SI mapping
The ability t o quantify H T mass and to determine its structure
non-invasively wi l l make it possible t o explore and compare new
therapeutic strategies that could act on the progression of H T or
H T components, such as fibroblasts/myofibroblasts or myocytes.
Myocyte division is more intense at the border o f the scar, and,
when combined w i th fibroblast proli feration, could influence progres
sion of the V T substrate.
A n integrated 3D scar reconstruction f rom ceMRI may facilitate VT
ablations. SI mapping is free f rom the limitations o f voltage mapping,
such as poor wal l -ca theter contact, far-field influences f rom normal
myocardium, or, in the case of epicardial mapping, the presence of
epicardial f a t A l l these limitations could lead to us t o underestimate
scar dimensions. As SI mapping is free of these limitations, it provides
an accurate delimitation of the scar. Although most VT circuits are
located in the endocardium, some VTs are only approachable f rom
the epicardium. SI mapping could contr ibute t o the identification of
epicardial VT substrate before the electrophysiological study, thus en
abling the ablation strategy to be planned before the procedure. A l
though most patients requiring V T ablations have ICDs,
defibril lators are still considered a contraindication for MRI. A l
though early reports demonstrated potential software and hardware
failure, w i th clinical complications, more recent studies show that
ceMRI can be performed safely in selected 1CD patients. N o t
only can MRI be performed safely in patients wi th ICD, but 3 D MRI
scar maps can be extracted and registered successfully, and provide
important information on complex scar anatomy.
3. V T substrate In non-ischaemic cardiomyopathy
3.1 Scar characteristics in patients with sustained MVT during electro-anatomical mapping VT in non-ischaemic cardiomyopathy is most commonly the result of
myocardial re-entry associated wi th scar tissue. Soejima et at.
demonstrated the presence o f this mechanism in 22 of 26 patients
wi th monomorph ic VT. Al l patients w i th myocardial re-entry had
endocardial scar tissue (20 o f 20 patients) and/or epicardial scar
tissue (seven of seven patients mapped). Most scars were adjacent
t o a valve annulus, and may be greater in extent on the epicardium
than on the endocardium. O f the 19 V T circuit isthmuses identified,
12 were associated w i th an endocardial scar and seven w i th an epicar
dial scar.
The results reported by Hsia ei at. are consistent w i th the findings
presented above.50 The authors performed left ventricular endocar
dial electro-anatomical mapping in 19 patients wi th non-ischaemic
cardiomyopathy and MVT. A l l patients had abnormal low-voltage
endocardial areas located near the base o f the ventricle in the per i -
valvular region. Most (88%) o f the 57 mapped VTs originated f rom
the base of the ventricle, at sites corresponding to regional scars.
These catheter mapping studies of patients w i th non-ischaemic
cardiomyopathy show the underlying mechanism o f VT t o be
206.0
170.0
134.0
96.0
62.0
E 1 •
WM \ V
117.0
112.8
108.5
104.3
100.0
<•
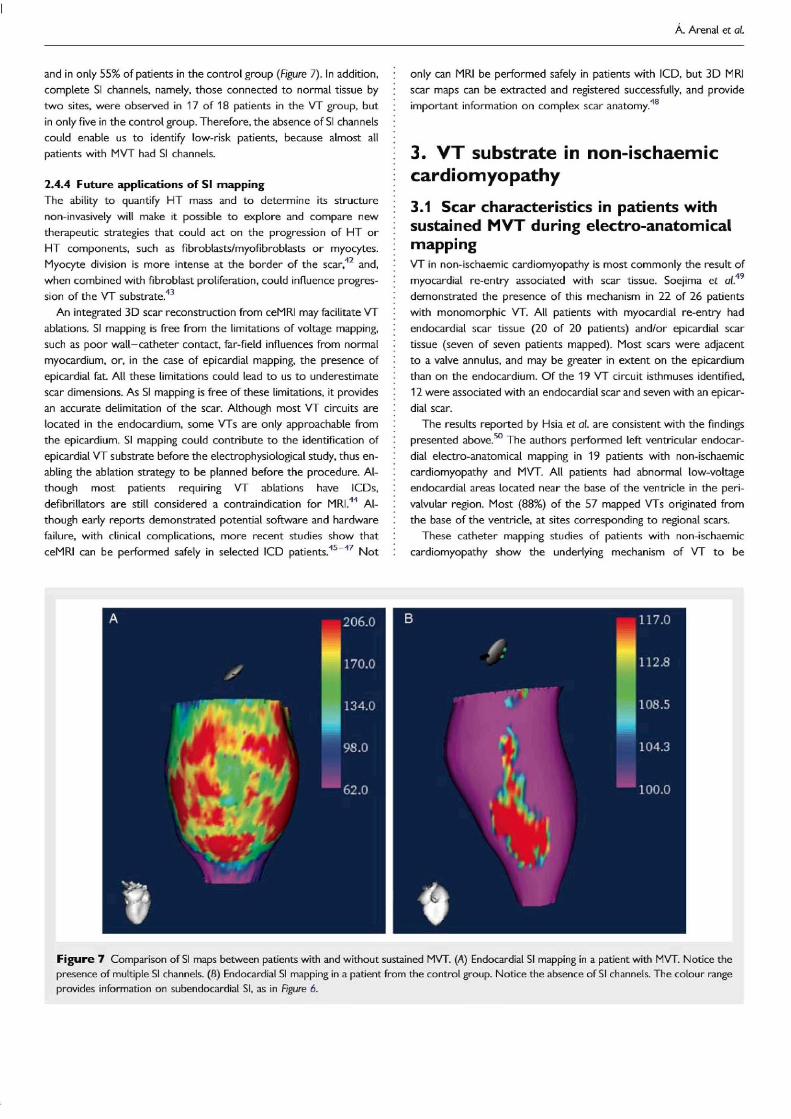
F i g u r e 7 Comparison of SI maps between patients with and without sustained MVT. (A) Endocardial SI mapping in a patient with MVT. Notice the
presence of multiple SI channels, (fi) Endocardial SI mapping in a patient from the control group. Notice the absence o f SI channels. The colour range
provides information on subendocardial SI, as in Figure 6.
Myocardial scar and ventricular arrhythmias
re-entry around scar tissue deep in the myocardium near the base o f
the ventricle and in the perivaivular region.
3.2 Character izat ion of the scar by MRI Data obtained using ceMRI in patients w i th an I C D provided similar
information to that of voltage mapping in MVT patients. In 26 patients
w i th non-ischaemic cardiomyopathy, the transmural extent of scar
tissue as a percentage of wall thickness was calculated in myocardial
slices. The predominance of scar tissue involving 26—75% o f wall
thickness was significantly predictive o f inducible VT, and remained in
dependently predictive in the multivariate model after adjustment for
LVEF. This study suggested that mid-wall myocardial enhancement in
volving > 2 5 % of wal l thickness is the substrate for sustained VT in
non-ischaemic cardiomyopathy.
3.2.1 ceMRI and spontaneous V T
Approximately 30% of patients wi th dilated cardiomyopathy have
mid-wall fibrosis, as detected by ceMRI. Regional fibrosis can increase
susceptibility t o arrhythmia and progression o f heart failure. The prog
nostic implications of mid-wall fibrosis in patients wi th dilated cardio
myopathy were analysed in a prospective study that included 101
consecutive patients. The fibrosis present in 35% o f patients was asso
ciated w i th a higher rate o f hospitalization for a cardiovascular condi
t ion and tota l mortali ty. Multivariate analysis identified mid-wall
fibrosis as the sole independent predictor of death or hospitalization.
Mid-wall fibrosis was also an independent predictor of sudden cardiac
death or VT after correct ion for baseline differences in LVEF.52
Similar results were recently repor ted by lies et atj3 w h o p ro
spectively enrolled 103 patients wi th criteria f o r primary prevention
of sudden cardiac death. ceMRI was performed before placement o f
the ICD, and identified regional fibrosis in 5 1 % of patients wi th
non-ischaemic cardiomyopathy and in all 42 patients wi th ischaemic
cardiomyopathy. There was a 14% discharge rate in the ¡schaemic car
diomyopathy group {six o f 42). Although no ICD discharges were
observed in the non-ischaemic cardiomyopathy group w i thou t region
al fibrosis, 29% of patients wi th regional fibrosis received ICD shocks.
The LVEF was similar in patients wi th and w i thou t device therapy
(24 + 12 vs. 26 +• 8%, P NS) and those wi th or w i thout regional f i
brosis (25 + 9 vs. 26 + 9%, P NS).
4. Conclusions H T is a consequence o f the remodell ing process, in which surviving
myocytes, fibroblasts/myofibroblasts, and the extracellular matr ix
interact mechanically and electrically t o fo rm the V T substrate.
ceMRI makes it possible t o determine the size and 3D structure o f
the scar and HT. This information could be useful when evaluating
new therapies focused on the cont ro l o f remodell ing processes and
risk stratification in patients wi th structural heart disease.
5. Clinical implication Non-invasive identification and characterization o f VT substrate could
facilitate the identif ication of patients at risk of ventricular arrhyth
mias. This information should be assessed in large mult icentre
studies and compared w i th other predictors of cardiac mortal i ty,
such as functional and volume parameters o f the left ventricle. Screen
ing o f patients for primary prevention of sudden cardiac death could
be improved by the analysis of the scar characteritics. In addit ion, non
invasive identification o f VT substrate could improve the ablation
procedure.
Acknowl edgements
The authors thank Thomas O'Boyle fo r language revision.
Conf l ic t of interest : none declared.
Funding This study was supported by research projects of the Cooperative Car
diovascular Disease Research Network (RECAVA), Instituto de Salud
Carlos III, Ministry of Health.
References t . De Bakker JM. van Capelle FJ, Janse Mj, Wilde A A Coronel R, Becker AE et ¡A.
Reentry as a cause of VT in patients with chronic ischemic heart disease: electrophy
siologic and anatomic correlation. Qrzjjíaúon 19fi8;77:!>89— 606.
2. Yousef ZR, Redwood SR, Marber MS. Postinfarction left ventricular remodelling:
where are the theories and trials leading us? Heart 2000;ITJ:76-80.
3. De Bakker J, Coronet R, Tassenon 5, Wilde AA, Opthof T, Janse MJ ei of. Ventricular
tachycardia in the infancted Langendorff-perfused human heart role of the arrange
ment of surviving cardiac fibres. J Am Cofi Cardiol 1990:1 5:1594-1607.
4. De Bakker Jr Van Capelle F. Janse M, Tasseron 5r Venneuien JT, de Jonge N et ai. Stow
conduction in the infarcted human heart zigzag course of activation. Gncuíotion 1993;
BBS 15-926.
5. Saffitz ]F_, Schuessler RB, Yamada KA. Mechanisms of remodeling of gap junction dis
tributions and trie development of anatomic substrates of arrhythmias. Caritiovasc fíes
1999:41:309-317.
6. Beardslee MA, Laing JG, Beyer EC, Saffitz JE. Rapid turnover of connexin43 in the
adult rat heart tjrc Res 1998:83:629-635.
7. Kieken F, Mutsaers N, Dolmatova E, Virgil K, W i t AL, Kellezi A et at Structural and
molecular mechanisms of gap junction remodeling in epicardial border zone
myocytes following myocardial infarction. Ore Res 2009:104:1103-1112.
B. Van Rijen HVM, Eckardt D, Degen j , Theis M, Ott T, Willecke K et at. Slow conduc
tion and enhanced anisotropy increase the propensity for ventricular tachyarrhyth
mias in adult mice with induced deletion of connexin43. Crrrrjfation 2004:109:
104S-1055.
9. Van Veen TAB, Stein M, Royer A, Quang KL, Oiarpentier F, Colledge W H et d .
Impaired impulse propagation in 5cn.5cr-knockout mice: combined contribution of ex
citability, connexin expression, and tissue architecture in relation to aging. Circulation
2005;112:1927-1935.
10. Cameltiti P. Borg TK, Kohl P. Structural and functional characterization of cardiac
fibroblasts Cordromsc Res 2005;65:40-51.
11. Kanekar S, Hirozanne T, Terracio L, Borg TK. Cardiac fibroblasts: form and function.
Cordfovóse Pathol 199B;7:127-133.
12. Souders C A Bowers 5LK, Baudino TA. Cardiac fibroblast the renaissance celt Gm
fies 2009; i 05:1164-1176.
13. Louault C Benamer N, FafvreJF, Potreau D, Bescond J. Implication of connexins 40
and 43 in functional coupling between mouse cardiac fibroblasts in primary culture.
Bmchim Giophys Acto 200B;1778:2097-2104.
14. Kohl P. Heterogeneous cell coupling in the heart an electrophysiological role for
fibroblasts, dire Res 2003;93:381 -3B3.
15. Spach MS, Boineau JP. Microfibrosis produces electrical load variations due to loss of
side-to-side celt connections: a major mechanism of structural heart disease arrhyth
mias. Pacing Clin Electraprrysiol 1997;20:397^t13.
16. Gabbiani G. The cellular derivation and the life span of the myofibroblast Pathat Res
Proel 199é;192:708-711.
17. Vasquez C. Mohandas P. Louie KL, Benamer N, Bapat AC, Morley GE. Enhanced
fibroblast-myocyte interactions in response to cardiac injury. Crrc Res 2010;107:
1011-1020.
18. DeMaziere AMGL VanGinneken ACG, Wilders ft, Jongsma HJ, Bouman LfM. Spatial
and functional relationship between myocytes and fibroblasts in the rabbit sinoatrial
node. J Mat Cell Cuntid 1992;24:5&7-Í7a
19. Willem5 IE, Havenith MG, De MeyJG, Daemen MJ. The atpha-smooth muscle actin-
positive cells in healing human myocardial scars. Am J PothoJ 1994;145:S68-B75.
20. Gaudesius G. Miragoli M. Thomas SP, Rohr S. Coupling of cardiac electrical activity
over extended distances by fibroblasts of cardiac origin. Cite Res 2O03;93:421 -428.
21. Miragoli M, Gaudesius G, Rohr S. Electrotonic modulation of cardiac impulse conduc
tion by myofibroblasts. Ore Res 2006:98:801 -810.
22. Thompson 5A, Copeland CRr Reich DH, Tung L. Mechanical coupling between myo
fibroblasts and cardiomyocytes slows electric conduction in fibrotic cell monolayers.
Circulation 2011;123:2083-2093.
23. Josephson ME Clinical Cardiac EJecfrophysiology. 3rd ed. Philadelphia Lippincott Wi l
liams & Wilkins; 200Z

Á. Arenal et ai
24. Gallons DJ, Ren JF, Michele J, Marchlinsici FE, Dillon 5ML Electroanatomic left ventricu
lar mapping in the porcine model of healed anterior myocardial infarction: correlation
with intracardiac echocardiography and pathological analysis. Circulation 1999:100:
1744-1750.
25. Marchlinsici FE, Callans Dj, Gottlieb CD, ¿ado E. Linear ablation lesions for control of
unmappable ventricular tachycardia in patients with ischemic and nonischemic cardio
myopathy. Circulation 2000;101:1288-1296.
26. Arenal A, Glez-Torrecilla E, Ortiz M, Villacastin J, Fdez-Portales J, Sousa E et al. Ab
lation of electrograms with an isolated;, delayed component as treatment of unmap
pable monomorphic ventricular tachycardias in patients with structural heart disease.
j Am Coll Cardial 2003;41:31 -92.
27. Bogun F, Good E. Reich S, Elmouchi D t Igfc: P, Lemola K et at. Isolated potentials during
sinus rhythm and pace-mapping within scars as guides for ablation of post-infarction
ventricular tachycardia. ] Am Coll Cardiol 2006;47:2013-2019.
2B. Arenal A, del Castillo S, Gonzalez-Torrecilla E, Atienza F, Ortiz M. Jimenez J et al.
Tachycardia-related channel in the scar tissue in patients with sustained monomorph
ic ventricular tachycardias: influence of the voltage scar definition. Circulation 2004;
110:2563-2574.
29. Hsia HH. Lin D, Sauer W H , Callans Dj, Marchlinski FE. Anatomic characterization of
endocardial substrate for hemodynamically stable reentrant ventricular tachycardia:
identification of endocardial conducting channels. Heart Rhythm 2006;3:503-512.
30. Nakahara 5, Tung R, Ramirez RJ, Gima J, Wiener I, Mahajan A et al. Distribution of late
potentials within infarct scars assessed by ultra high-densÉty mapping. Haon Fhythm
2010;7:1817-1824.
31. Crawford T, CowgerJ, Desjardins B, Kim HM, Good E, Jongnarangsin K et al. Deter
minants of postinfarction ventricular tachycardia. Circ Arrhythm Bectrophysicil 2010;3:
624-631.
32. Haqqani HM, Kalman jM r Roberts-Thomson ICC Fundamental differences in electro
physiologic and electroanatomic substrate between ischemic cardiomyopathy
patients with and without clinical ventricular tachycardia, j Am Cot! Cardial 2009^54:
166-173.
33. Amado LC, Gerber BL, Gupta SNn ftettmann DW, Szarf G r Schock R et at. Accurate
and objective infarct sizing by contrast-enhanced magnetic resonance imaging in a
canine myocardial infarction model J Am Coif Cardiol 2004¡44:2353-2389.
34. Bello D, Fieno D5, Kim RJ, Péneles F5, Passman R. Song G et al. Infarct morphology
identifies patients with substrate for sustained ventricular tachycardia. J" Am Call
Cardtal 2005 ;45:1104-1108.
35. Yan AT, Shayne AJ, Brown KA, Gupta 5N, Chan CW, Luu TM ei oil. Characterization
of the pnri-infarct 7onn by contrast-enhanced cardiac magnetic resonance imaging is a
powerful predictor of past-myocardial infarction mortality. Circulation 2006;114:
32-39.
36. Schmidt A, Azevedo CF, Cheng A, Gupta SN, Bluemke DAr Foo TK et oL Infarct tissue
heterogeneity by magnetic resonance imaging identifies enhanced cardiac arrhythmia
susceptibility in patients with left ventricular dysfunction. Gradation 2007;11S:
2006-2014.
37. Ashikaga H, Sasano T, Dong J, Zviman MM, Evers R, Hopenfeld 6 et oí Magnetic
resonance-based anatomical analysts oí scar-related ventricular tachycardia: implica
tions for catheter ablation. Grc RES 2Q07;1O1339-947.
3G. Codreanu A, OdiUe Fr Aliot É, Marie PY. Magnin-PoulE I, Andronache M et at. Electro-
anatomic characterization of post-infarct scars: comparison with 3-dimensional myo
cardial scar reconstruction based on magnetic resonance imaging. J Am Call Cardial
2008;52:839-342.
39. Desjardins B, Crawford T, Good E, Oral H, Chugh A^ Pelosi F et ai. Infarct architec
ture and characteristics on delayed enhanced magnetic resonance imaging and elec
troanatomic mapping in patients with postinfarction ventricular arrhythmia. Heart
Rhytnm 2009 ¡6:644-651.
40. Perez-David E, Arenal A, Rubio-Guivernau JL. del Castillo R, Atea L, Arbelo E et of.
Noninvasive identification of ventricular tachycardia-related conducting channels
using contrast-enhanced magnetic resonance imaging in patients with chronic myo
cardial infarction: comparison of signal intensity scar mapping and endocardial
voltage mapping.; Am Call Cardial 2011;57:184-194.
41. Andneu D, Berruezo A, Ortiz-Pérez JTr Silva E, Mont L, Borras R et oí. Integration of
3D electroanatomic maps and magnetic resonance scar characterization into the navi
gation system to guide ventricular tachycardia ablation. Grc Arrhythm Efectrophysioi
2011;4:674-683.
4Z Beltrami AP, Urbanek K, KajsturaJ, Yan 5M, Finato N, Bussani R et oí. Evidence that
human cardiac myocytes divide after myocardial infarction. N Eng\ J Med 2001:344:
1750-1757.
43. Bogun F, Krishnan 5, Siddiqui M, Good E, Marine JEr 5chuger C etof. Electrogram char
acteristics in postinfarction ventricular tachycardia. Effect of infarct age. ] Am Co\l
Cardiol 2005,46:667-674.
44. Fans OP, Shein M. Food and Drug Administration perspective: magnetic resonance
imaging of pacemaker and implantable cardioverter-defibrillator patients. Circulation
2006;114:1232-1233.
45. Gimbel ]FL Kanal E. Schwartz KM, Wilkoff BL. Outcome of magnetic resonance
imaging (MRI) in selected patients with implantable cardioverter defibrillators
(ICDs). PocfnE Oin Bectrophysiat 2005;28:270-273.
46. Naehle CP, Strach K, Thomas D, Meyer C, Linhart M, Bitaraf S et a!. Magnetic reson*
anee imaging at 1.5-T in patients with implantable cardioverter-defibrillators. J Am Coll
Cardial 2009;54:549-555.
47. Nazarian 5, Roguin A, Zviman MM r Lardo AC, Dickfeld TL, Calkins H et al Clinical
utility and safety of a protocol for noncardiac and cardiac magnetic resonance
imaging of patients with permanent pacemakers and implantable cardioverter defibril
lators at 1.5 Tesla. Circulation 2006;114:1277-12B4.
48. Dickfeld T, Tian J, Ahmad G, Jimenez A, Turgeman A, Kuk R et of. MRI-guided ven
tricular tachycardia ablation: integration of late gadolinium-enhanced 3D scar in
patients with ICD. Circ Arrhythm Efectrophysicii 2011;4:172-134.
49. Soejima Kt Stevenson WG, Sapp JLh Selwyn AP, Couper Gh Epstein l_M. Endocardial
and epicardial radiofrequency ablation of ventricular tachycardia associated with
dilated! cardiomyopathy: the importance of tow-vortage scars. J Am Coif Cardiol
2004:^3:1834-1342.
50. Hsia HH, Callans DJ, Marchlinski FE Characterization of endocardial electrophysio
logical substrate in patients with nonischemic cardiomyopathy and monomorphic
ventricular tachycardia. Crrculotion 2003;108:704-710.
51. Nazarian 5, Bluemke DA. Lardo AC. Zviman MM, Watktns 5P, Dickfeld TLeto i . Mag*
netic resonance assessment of the substrate for inducible ventricular tachycardia in
nonischemic cardiomyopathy. Circulation 2005:112:2821 -28-25.
52. Assomull RG, Prasad 5K, Lyne j , Smith G, Burman ED, Khan M et oL Cardiovascular
magnetic resonance, fibrosis, and prognosis in dilated cardiomyopathy. / Am Coll
Cardial 2006;48:1977-1985.
53. lies l_, Pfluger Hp Lefkovits L, Butler MJ, Kistler PMr Kaye DM et al. Myocardial fibrosis
predicts appropriate device therapy in patients with implantable cardioverter-
defibrillators for primary prevention of sudden cardiac death. J Am Coll Cardial
2011;57:821-323.
Related Documents