Do Small States Get More Federal Monies? Congressional Overrepresentation Revisited Valentino Larcinese ∗ , Leonzio Rizzo † and Cecilia Testa ‡ May 2006 very preliminary and incomplete Abstract We analyze the relationship between Congressional overrepresentation and fed- eral budget allocation to the states during the period 1978-2002. Using different spending categories, we investigate whether small states, which are typically over- represented in both the senate and the house, receive significantly more spending than the underepresented large states. Contrary to existing studies, we find that defense and procurement spending are not influenced by overrepresentation, while less manipulable spending categories, such as entitlment grants and salaries, seem to be affected. However, once state specific trends - largely due to population trends - are taken into account, we do not find any evidence of overrepresentation bias on federal spending. Hence overall our results run against the hypothesis of small state advantage in the federal budget allocation. ∗ London School of Economics and Political Science, Department of Government and STICERD † Universita’ di Ferrara, Department of Economics ‡ Royal Holloway College, London, Department of Economics 1

Welcome message from author
This document is posted to help you gain knowledge. Please leave a comment to let me know what you think about it! Share it to your friends and learn new things together.
Transcript
Do Small States Get More Federal Monies?
Congressional Overrepresentation Revisited
Valentino Larcinese∗, Leonzio Rizzo†and Cecilia Testa‡
May 2006
very preliminary and incomplete
Abstract
We analyze the relationship between Congressional overrepresentation and fed-
eral budget allocation to the states during the period 1978-2002. Using different
spending categories, we investigate whether small states, which are typically over-
represented in both the senate and the house, receive significantly more spending
than the underepresented large states. Contrary to existing studies, we find that
defense and procurement spending are not influenced by overrepresentation, while
less manipulable spending categories, such as entitlment grants and salaries, seem
to be affected. However, once state specific trends - largely due to population trends
- are taken into account, we do not find any evidence of overrepresentation bias on
federal spending. Hence overall our results run against the hypothesis of small state
advantage in the federal budget allocation.
∗London School of Economics and Political Science, Department of Government and STICERD†Universita’ di Ferrara, Department of Economics‡Royal Holloway College, London, Department of Economics
1
“The equality of representation in the Senate is another point, which, being evidently
the result of compromise between the opposite pretensions of the large and the small States,
does not call for much discussion. (. . . )”Madison, The Federalist Paper 62, February 27,
1778.
1 Introduction
Federal states are represented differently in the two branches of the US Congress. Members
of the House are assigned proportionally to population and regularly reapportioned in
response to demographic changes. As for the Senate, the principle of equal representation
of the states mandates a fixed number of senators, i.e. two senators per state. The
double representation principle should guarantee a “fair” representation of the small as
well as the big states. In relation to the objection that reapportionment might not work
appropriately leaving big states with a substantial disadvantage when their population
grows, Madison writes:
”The large States, therefore, who will prevail in the House of Representatives, will have
nothing to do but to make reapportionments and augmentations mutually conditions of
each other; and the senators from all the most growing States will be bound to contend for
the latter, by the interest which their States will feel in the former. These considerations
seem to afford ample security on this subject (...) Admitting, however, that they should
all be insufficient to subdue the unjust policy of the smaller States, or their predominant
influence in the councils of the Senate, a constitutional and infallible resource still remains
with the larger States, by which they will be able at all times to accomplish their just
purposes. The House of Representatives cannot only refuse, but they alone can propose,
the supplies requisite for the support of government. They, in a word, hold the purse (...)”
(The Federalist paper 52).
2
In other words, if the mechanism of reapportionment would fail to provide the big
states with the appropriate representation, the House of representatives maintains pro-
posal power over the budget to counter-balance the preponderance of the small states in
the Senate. Hence, according to the founding fathers of the US constitution the combina-
tion of proportional and equal representation, together with proposal power on budgetary
matters, should balance the interests of big and small states. Ansolabehere et al (2003)
provide a formal model showing how the attribution of proposal power to the lower house
might indeed counterbalance the malapportionement in the upper house leading to an
equal distribution of government’ expenditure. Despite the theoretical appeal of those
arguments, the current empirical literature provides large support for the existence of a
small state advantage in the US federal budget allocation1. In particular, Atlas et al.
(1995), analyzing per-capita federal spending between 1972 and 1990, find a significant
relationship between per-capita representation in the US House and Senate and federal
spending. Since senators seeking re-election want to please their constituents they will
try to build winning coalitions and minimize the cost of it. This is done by asking small
states to enter the coalition: increasing per-capita expenditure to them costs less than
doing the same to large states (Lee, 1998, Knight, 2004).
Lee (1998) uses the Bickers and Stein (1991) data on domestic outlay from 1983-1990,
including 56% of federal outlay, but not including procurement or defense expenditure.
He divided spending into three categories: redistributive, discretionary distributive and
nondiscretionary distributive. Only for this last category, including formulas produced
by the political process, Lee finds a significant positive effect of senate representation
on per capita state level spending. Hoover and Pecorino (2004) look at a different time
1At district level, Ansolabehere et al. (2002) analyze the effect of unequal representation prior to the
1960’s and the equalizing impact on state transfers to counties following the court-ordered redistricting
in the 1960s.
3
period (1983-1999) and a broad range of federal expenditure. In contrast with Atlas et
al. (1995), they find a negative relationship between House representation per-capita
and spending per-capita. Consistently with Atlas et al. (1995), however, they find that
representation in the senate is positively related with per-capita spending. Moreover, this
result is also confirmed by regressions for procurement, grants, and wages and salaries.
They acknowledge that it is somehow surprising to find a strong overrepresentation effect
on spending categories that should not be subject to political pressures. Finally, Knight
(2006) does not find strong evidence of senate overrepresentation at aggregate level of
expenditure, but on earmarked projects: the effect is particularly strong if the earmark
comes from the senate.
In this paper we revisit the literature on overrepresentation to provide new evidence
that runs against the hypothesis of small state advantage in the US budget allocation
process. Two important aspects of the current literature deserve in our view particular
attention. First, spending categories such as entitlements, salaries and retirement that
should be less prone to political manipulation, are indeed affected by over-representation
as shown by Atlas et al. (1995) and Hoover and Pecorino (2005). Second, the evidence of
big differences in federal spending in cross section regression is weak (Lee, 1998; Knight,
2006) and studies finding a strong effect of overrepresentation (Atlas et al.1995, Hoover
and Pecorino 2005, Larcinese et al. 2006) rely on within state variation to identify over-
representation in fixed effect regressions. When both the dependend and independen
variables may be subject to state specific trends, fixed effects regressions that do not ac-
count for state specific trends may be affected by omitted variable bias. We address these
two issues by examining the behavior of spending within states for the period 1978-2002,
finding some novel and intriguing results. First, by replicating the regressions of previous
studies on our data we find that, differently from previous findings, spending categories
such as procurement and defense are not affected by over-representation. However, con-
4
sistently with previous findings, we find that the impact of over-representation is strong
for total federal expenditure, direct payment to individuals, salaries and grants. In other
words, overrepresentation seems not relevant for spending categories that should be sub-
ject to political pressures, while it is important in determining the allocation of spending
categories that a priori should be less manipulable. However, if both expenditure and
senators per-capita display state specific trends, these apparently contradictory results
might be due to an omitted variable bias. A careful investigation of those variables shows
indeed the existence of different trends across states, largely due to population trends,
suggesting that state-specific trends should be introduced in the fixed effect regressions.
Once state specific trends are introduced in the regressions, we find the allocation of fed-
eral outlays to the states is not affected by the number of senators per capita. The same
holds when we consider more disaggregated spending categories such as direct payments
to individuals, grants, and salaries. Importantly, we also show that while the coefficient
of senators per capita may suffer from a considerable upward bias when state trends are
omitted, the results on other political variables commonly used in the literature, such as
the partizan alignment between the president and the state governor (Hoover and Pecorino
2005, Larcinese et al. 2006) are robust to the introduction of state trends. Overall our re-
sults show that small and big states do not get significantly different shares of the federal
pie.
2 Overrepresentation and federal budget allocation
Population size varies considerably across US states and so does per-capita senate rep-
resentation. Table 1 reports and index of Senate and House overrepresentation by state
during the period 1978-2002. Under or overrepresentation is determined by comparison
with a fair representation given by the ratio between the total members of the House (or
5
Senate) and the total US population in a given year2. Table 1 orders the states by popu-
lation (starting with the smallest) and shows that, in fact, small states are substantially
overrepresented in the Senate. In the House, however, this phenomenon is negligible and
not clearly correlated with the population size of a state. Also, Table 1 reports average
federal spending per capita by state in the period considered, showing that there is no clear
patterns linking Senate overrepresentation and spending. In Table 2 we focus on Senate
overrepresentation, the one that appears to be relevant, and present summary statistics
for federal spending and real income. The most populous states, which are underrep-
resented (index below 1), have substantially higher income per capita with an average
difference of $1,529 (in real 1982-83 terms), while differences in outlays per capita are
quite small ($ 76 per capita).3 While these observations are coherent with the argument
of the founding fathers of the US constitution, they appear at odds with the findings of
most empirical studies which, across different spending categories and for various periods,
find a strong small state advantage due to senate overrepresentation. A well established
procedure (Atlas et al., 1995) to estimate the effect of overrepresentation is to regress
federal outlays on the ratio of the House or Senate members on population per state. In
2More specifically, define popst as the population of state s in year t and USpopt as the total US
population (in the 48 states considered) in year t. Then the overrepresentation index in year t for the
senate is given by 2popst
/ 96USpopt
= USpopt48∗popst , while for the House is
hmst
popst/ #USpopst
, where hmst is the
number of House representatives of state s in year t. A value of 1 means that the state representation
is perfectly equal to the national average, while an index above (below) 1 means overrepresentation
(underrepresentation). Table 1 reports state-level averages of this index for the period 1978-2002.3If outlays net of taxes are considered as in Atlas, the difference between under and overrepresented
states become larger. This is not surprising given that under-represented states are substantially richer.
However, according to Atlas et al. (1995), overrepresentation should be expected not to have any impact
on taxation. Hence, if there is a small state advantage, we should see substantial differences in federal
spending between under and overrepresented states.The same pattern of Table 1 is obtained if we consider
federal spending net of the entitlements which include less targetable spending programs.
6

our case, this amounts to estimating the following equation:
FEDEXPst = αs + βt + γ ∗ SPst−1 + θ1Zst + st, (1)
s = 1, ...48; t = 1978, ...2002;
where FEDEXPst is real per-capita federal expenditure (outlays) in state s at time t,
SP stands for "senators per capita", and Zst is a vector of socioeconomic and political
control variables.4
In Table 3 we report the results of Atlas et al. (1995) and Knight (2006), as well as our
results obtained estimating equation 1 over the period 1978-2002 using aggregate federal
outlays as a dependent variable. Similarly to Atlas et al. (1995) we find that impact of
senators per capita is big and very significant. However, without state fixed effects we do
not find any significant impact of overrepresentation (see column 4 in table 3). This result
is consistent with Knight (2006) who finds a very modest impact of overrepresentation
in cross-section regressions. In Table 4, we report estimates of equation 1 (including
state fixed effects) using as dependent variable, respectively, total federal spending, direct
payments to individuals, salaries, grants, defense, and procurement spending. We find
that while direct payments, salaries, and grants are all affected by over-representation,
the number of senators per capita does not have a significant impact neither on defense5
nor on procurement spending6.4It is important to point out that there is a lag between the appropriation of federal funds and
the moment when funds are actually spent. This is relevant when estimating the effect of particular
institutional and political variables, since current federal outlays have normally been appropriated in past
budgetary years (Larcinese et al. 2006). Delays should therefore be taken into account by introducing
lagged values for SenatorsPercapita as well as for any other political variable, since past policy makers
are responsible for current outlays.5Our results are different from Atlas et al. (1995) who find a significant impact of senators percapita
on defense. If we run our regression only for the period 1978-1990, we also find a significant effect.
However, the significance disappears in the larger sample.6Similarly to Hoover and Pecorino we find that the coefficient of overrepresentation in the procurement
7
Hence, on the one hand, overspending is not associated with variables that are more
subject to political pressures; on the other hand, our data do not show any noticeable
cross section pattern. Given that the fixed effects regressions rely on within state vari-
ation as a source of identification, time variation deserves a more careful consideration.
Federal outlays show a positive trend over the entire period considered (see figure 1).
However, per capita expenditure grows at different rates in the different states because
many spending aggregates adjust slowly to population movements. As a consequence,
federal expenditure per capita displays very different patterns within states. In table
6 we report the estimated trends over the period 1978-2002. The main variable of our
investigation, outlays per-capita, shows a very different pattern across states. In most
states total federal outlays grow over time and this trend is significant at 5% or 1% levels.
In three states (California, Nevada and Utah) the estimated trend is negative and not
significant while New Hampshire and Missouri do not show strong statistically significant
trends. Moreover, even for states where a positive trend is observed, the implied growth
rate of federal outlays varies considerably, with estimated coefficient values in the range
173.18 - 25.91 (with a standard deviation of 45.38). Finally, the correlation coefficient
between SP and the trend variable, computed by state, is almost always bigger than 0.95,
while the overall coefficient is 0.0057 (Table 5)7.
In table 6 we present the results of our regressions with state trends. When we re-
estimate eq. (1) introducing state-specific trends, the results change substantially. The
coefficient of senators percapita that was significant at 1% level in the regressions of to-
tal federal spending, direct payments to individuals and grants, and significant at 5% in
the regression of salaries, becomes now insignificant. However, the political alignment
equation is positive and significant: this result, however, is not robust to clustering the standard errors
at the state level.7Disaggregated spending categories (direct payments to individuals, grants, defense, procurements,
salaries) similarly display significant trends. Tables are available from the authors upon request.
8
between president and governor, which was the only other political control with a pos-
itive and significant impact, maintains its positive sign and is significant even when we
introduce state specific trends. Hence, while federal expenditure might be affected by
political factors, such as the political alignment between the president and the governors,
our regressions do not show any significant small state advantage due to Congressional
overrepresentation.
3 Conclusions
A well established empirical literature (Atlas et al. 1995; Lee, 1998; Lee, 2000; Hoover
& Pecorino, 2004) establishes that Congress overrepresentation induces more per capita
funds to be directed towards small states. For obvious reasons, this phenomenon is claimed
to be particularly strong for the Senate. Senators will try to bringing pork back in the
state as a way to please their constituents and, therefore, increase their chances of re-
election. This requires forming coalitions and, since small states are easier to satisfy than
large states, senators who want to realize their programs will prefer to have small states
in their coalition (Lee, 2000; Knight, 2004).
On the other hand, the founding fathers’ toughts, inspiring the current constitutional
rules, suggested that equal representation in the Senate, rather than favoring the small
states, should simply provide an instrument to counterbalance the power of big states in
the House. Theoretically, the proposal power of the lower house could indeed generate
an equal distribution of federal expenditure even with a malapportioned upper house
(Ansolabehere et al. 2003).
In this paper we have reconsidered senate overrepresentation by focussing on the econo-
metric specifications used in the existing literature. An advantage of small states is usually
found only in regressions that include state fixed effects. This identification strategy may
9
be problematic. On one side the dynamic of malapportionement crucially depends on
variations in the population size of the various states. On the other, the existence of
state specific trends simultaneouly affecting the dependent variable (federal expenditure)
and the independent variable (senators per capita) leaves open the possibility that the
effects found in the current literature only constitute spurious correlations. When we
introduce state specific trends in the regressions, we do not find any evidence of small
state advantage due to overrepresentation. This result is rather robust since it applies to
both the aggregate federal expenditure (per-capita) and other disaggregated categories
such as grants, entitlements, and salaries. These findings help to provide an explanation
of some contradictory findings of the current literature, such as the strong impact of over-
representation on non-manipulable budget categories like salaries, several types of grants
and direct payments to individuals. The population dynamics is, in fact, likely to have a
major effect on these forms of spending. Most importantly, our results provide empirical
evidence in favor of the founding fathers’ intuition about the equalizing impact of the
House proposal power.
10
References
[1] Ansolabehere, S., Gerber J. Snyder . 2002. Equal votes, equal money: court-ordered
redistricting and public expenditure in American states, American Political Science
Review, 96: 767-777.
[2] Ansolabehere, S., J. Snyder and M. M. Ting. 2003. Bargaining in Bicameral Legis-
latures: when and why does mallaportionment matters? American Political Science
Review, 97:471-481.
[3] Atlas, C. M., T. W. Gilligan, R. J. Hendershott and M. A. Zupan 1995, Slicing the
Federal Government Net Pie: Who wins, Who Looses and Why, American Economic
Review 85, 624-629.
[4] Bickers, K. and R. Stein 1991, Federal Domestic Outlays, 1983-1990: A Data Book,
M. E. Sharpe.
[5] Hoover G. A. and P. Pecorino 2004, The Political Determinants of Federal Expenditure
at the State Level, forthcoming Public Choice.
[6] Knight B. 2004, Legislative Representation, Bargaining Power, and the Distribution
of Federal Funds: Evidence from the US Senate, NBER working paper n.10385.
[7] Larcinese, Valentino, Leonzio Rizzo, and Cecilia Testa. 2006. “Allocating the US Fed-
eral Budget to the States: the Impact of the President.”, Journal of Politics, 68 (May):
447-456.
[8] Lee, F. E. 1998, Representation and Public Policy: The Consequences of Senate Ap-
portionment for the Geographic Distribution of Federal Funds, Journal of Politics 60,
34-62.
11
[9] Lee, F. E. 2000, Senate Representation and Coalition Building in Distributive Politics,
The American Political Science Review 94, 59-72.
12
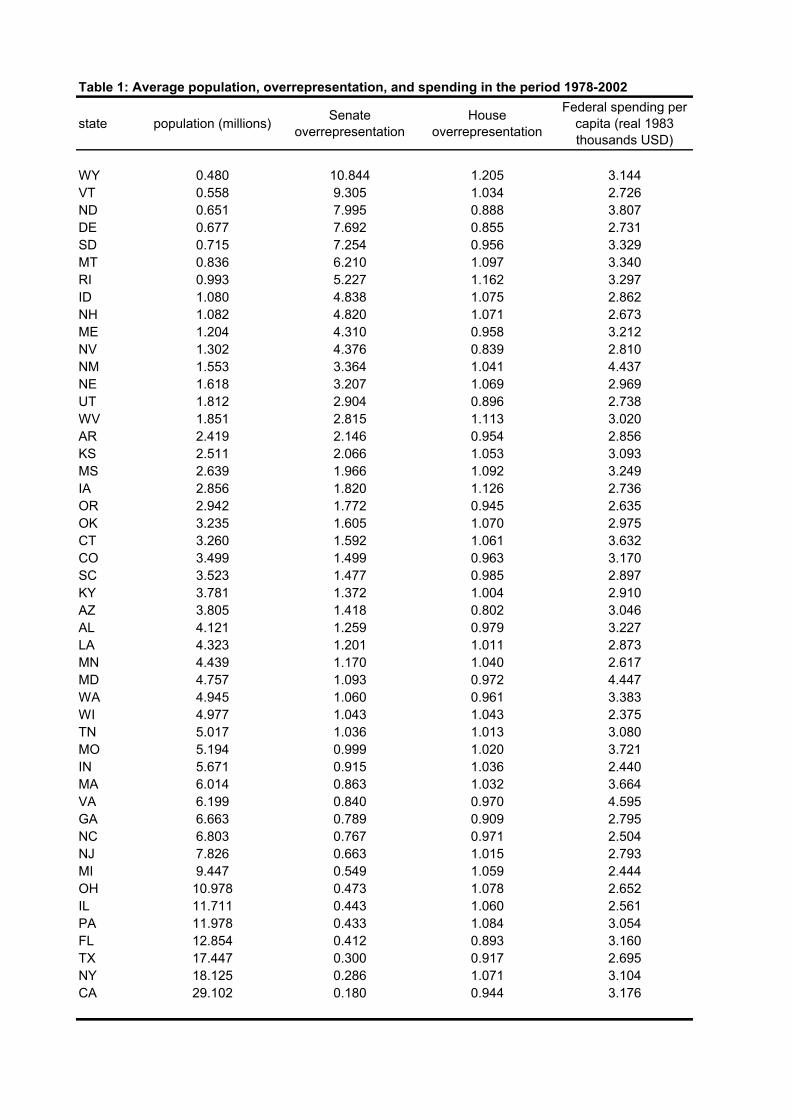
Table 1: Average population, overrepresentation, and spending in the period 1978-2002
state population (millions) Senate overrepresentation
House overrepresentation
Federal spending per capita (real 1983 thousands USD)
WY 0.480 10.844 1.205 3.144VT 0.558 9.305 1.034 2.726ND 0.651 7.995 0.888 3.807DE 0.677 7.692 0.855 2.731SD 0.715 7.254 0.956 3.329MT 0.836 6.210 1.097 3.340RI 0.993 5.227 1.162 3.297ID 1.080 4.838 1.075 2.862NH 1.082 4.820 1.071 2.673ME 1.204 4.310 0.958 3.212NV 1.302 4.376 0.839 2.810NM 1.553 3.364 1.041 4.437NE 1.618 3.207 1.069 2.969UT 1.812 2.904 0.896 2.738WV 1.851 2.815 1.113 3.020AR 2.419 2.146 0.954 2.856KS 2.511 2.066 1.053 3.093MS 2.639 1.966 1.092 3.249IA 2.856 1.820 1.126 2.736OR 2.942 1.772 0.945 2.635OK 3.235 1.605 1.070 2.975CT 3.260 1.592 1.061 3.632CO 3.499 1.499 0.963 3.170SC 3.523 1.477 0.985 2.897KY 3.781 1.372 1.004 2.910AZ 3.805 1.418 0.802 3.046AL 4.121 1.259 0.979 3.227LA 4.323 1.201 1.011 2.873MN 4.439 1.170 1.040 2.617MD 4.757 1.093 0.972 4.447WA 4.945 1.060 0.961 3.383WI 4.977 1.043 1.043 2.375TN 5.017 1.036 1.013 3.080MO 5.194 0.999 1.020 3.721IN 5.671 0.915 1.036 2.440MA 6.014 0.863 1.032 3.664VA 6.199 0.840 0.970 4.595GA 6.663 0.789 0.909 2.795NC 6.803 0.767 0.971 2.504NJ 7.826 0.663 1.015 2.793MI 9.447 0.549 1.059 2.444OH 10.978 0.473 1.078 2.652IL 11.711 0.443 1.060 2.561PA 11.978 0.433 1.084 3.054FL 12.854 0.412 0.893 3.160TX 17.447 0.300 0.917 2.695NY 18.125 0.286 1.071 3.104CA 29.102 0.180 0.944 3.176
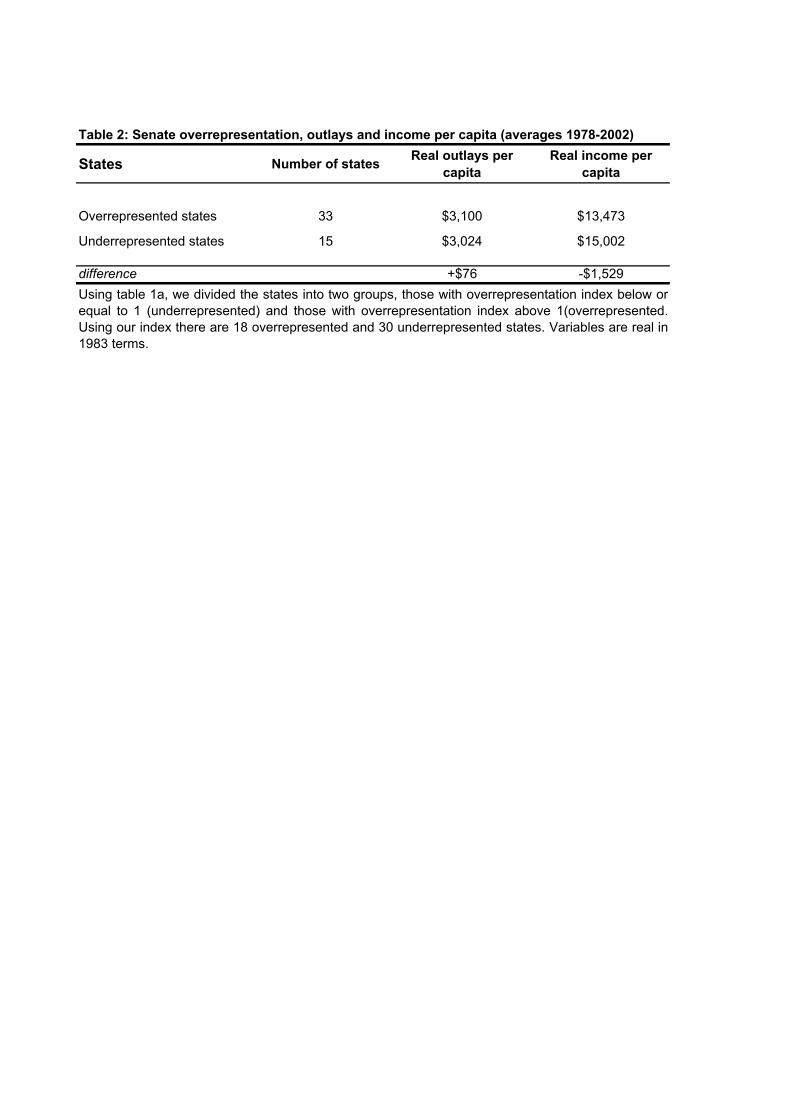
Table 2: Senate overrepresentation, outlays and income per capita (averages 1978-2002)
States Number of states Real outlays per capita
Real income per capita
Overrepresented states 33 $3,100 $13,473
Underrepresented states 15 $3,024 $15,002
difference +$76 -$1,529Using table 1a, we divided the states into two groups, those with overrepresentation index below orequal to 1 (underrepresented) and those with overrepresentation index above 1(overrepresented.Using our index there are 18 overrepresented and 30 underrepresented states. Variables are real in1983 terms.
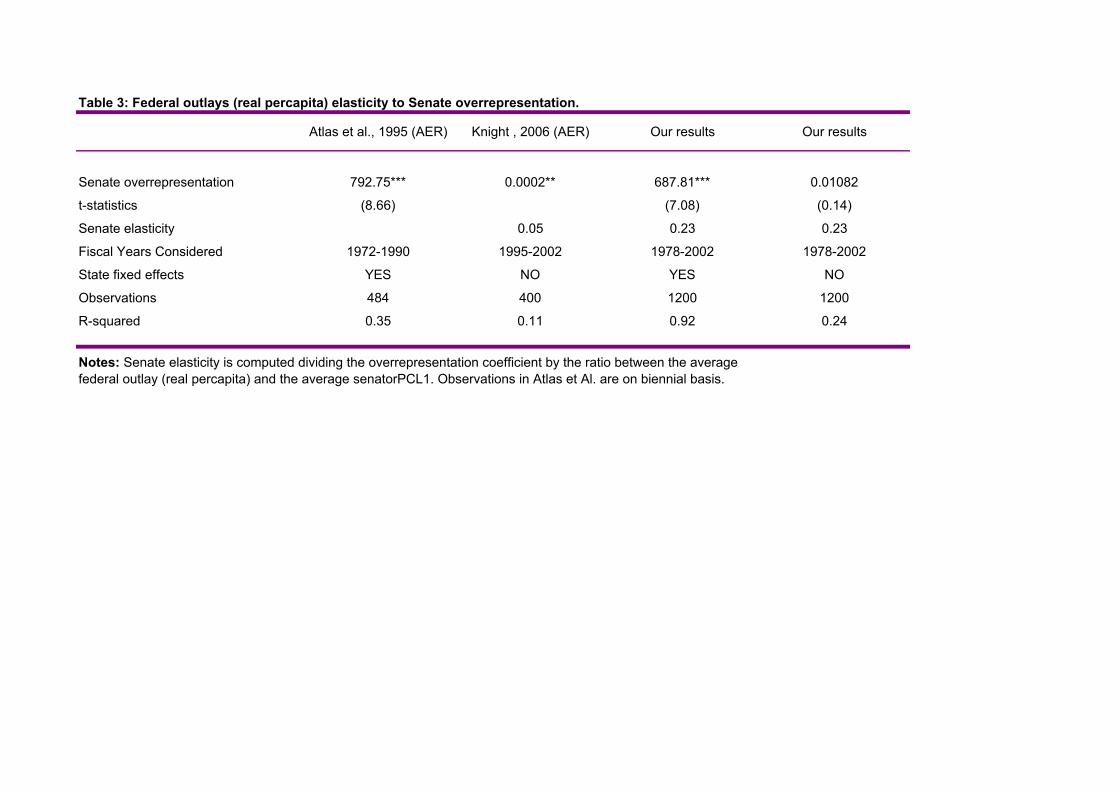
Table 3: Federal outlays (real percapita) elasticity to Senate overrepresentation.
Atlas et al., 1995 (AER) Knight , 2006 (AER) Our results Our results
Senate overrepresentation 792.75*** 0.0002** 687.81*** 0.01082
t-statistics (8.66) (7.08) (0.14)
Senate elasticity 0.05 0.23 0.23
Fiscal Years Considered 1972-1990 1995-2002 1978-2002 1978-2002
State fixed effects YES NO YES NO
Observations 484 400 1200 1200
R-squared 0.35 0.11 0.92 0.24
Notes: Senate elasticity is computed dividing the overrepresentation coefficient by the ratio between the average federal outlay (real percapita) and the average senatorPCL1. Observations in Atlas et Al. are on biennial basis.
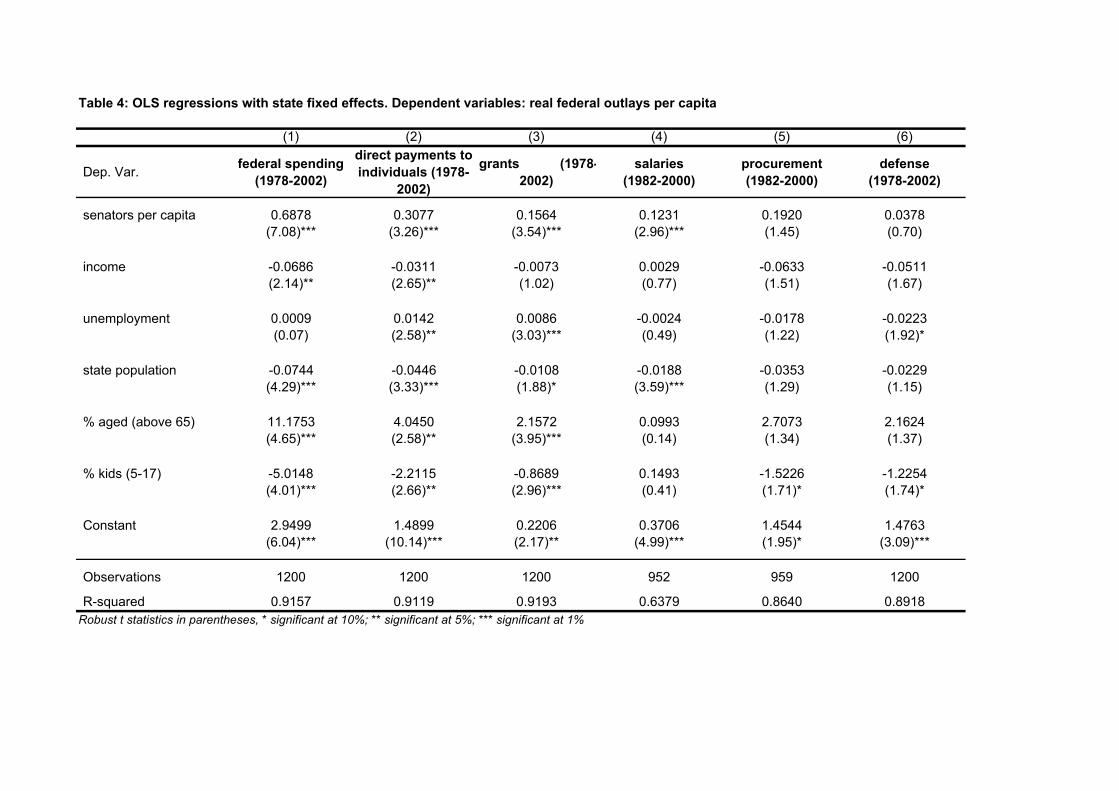
Table 4: OLS regressions with state fixed effects. Dependent variables: real federal outlays per capita
(1) (2) (3) (4) (5) (6)
Dep. Var. federal spending (1978-2002)
direct payments to individuals (1978-
2002)
grants (1978-2002)
salaries (1982-2000)
procurement (1982-2000)
defense (1978-2002)
senators per capita 0.6878 0.3077 0.1564 0.1231 0.1920 0.0378(7.08)*** (3.26)*** (3.54)*** (2.96)*** (1.45) (0.70)
income -0.0686 -0.0311 -0.0073 0.0029 -0.0633 -0.0511(2.14)** (2.65)** (1.02) (0.77) (1.51) (1.67)
unemployment 0.0009 0.0142 0.0086 -0.0024 -0.0178 -0.0223(0.07) (2.58)** (3.03)*** (0.49) (1.22) (1.92)*
state population -0.0744 -0.0446 -0.0108 -0.0188 -0.0353 -0.0229(4.29)*** (3.33)*** (1.88)* (3.59)*** (1.29) (1.15)
% aged (above 65) 11.1753 4.0450 2.1572 0.0993 2.7073 2.1624(4.65)*** (2.58)** (3.95)*** (0.14) (1.34) (1.37)
% kids (5-17) -5.0148 -2.2115 -0.8689 0.1493 -1.5226 -1.2254(4.01)*** (2.66)** (2.96)*** (0.41) (1.71)* (1.74)*
Constant 2.9499 1.4899 0.2206 0.3706 1.4544 1.4763(6.04)*** (10.14)*** (2.17)** (4.99)*** (1.95)* (3.09)***
Observations 1200 1200 1200 952 959 1200
R-squared 0.9157 0.9119 0.9193 0.6379 0.8640 0.8918Robust t statistics in parentheses, * significant at 10%; ** significant at 5%; *** significant at 1%
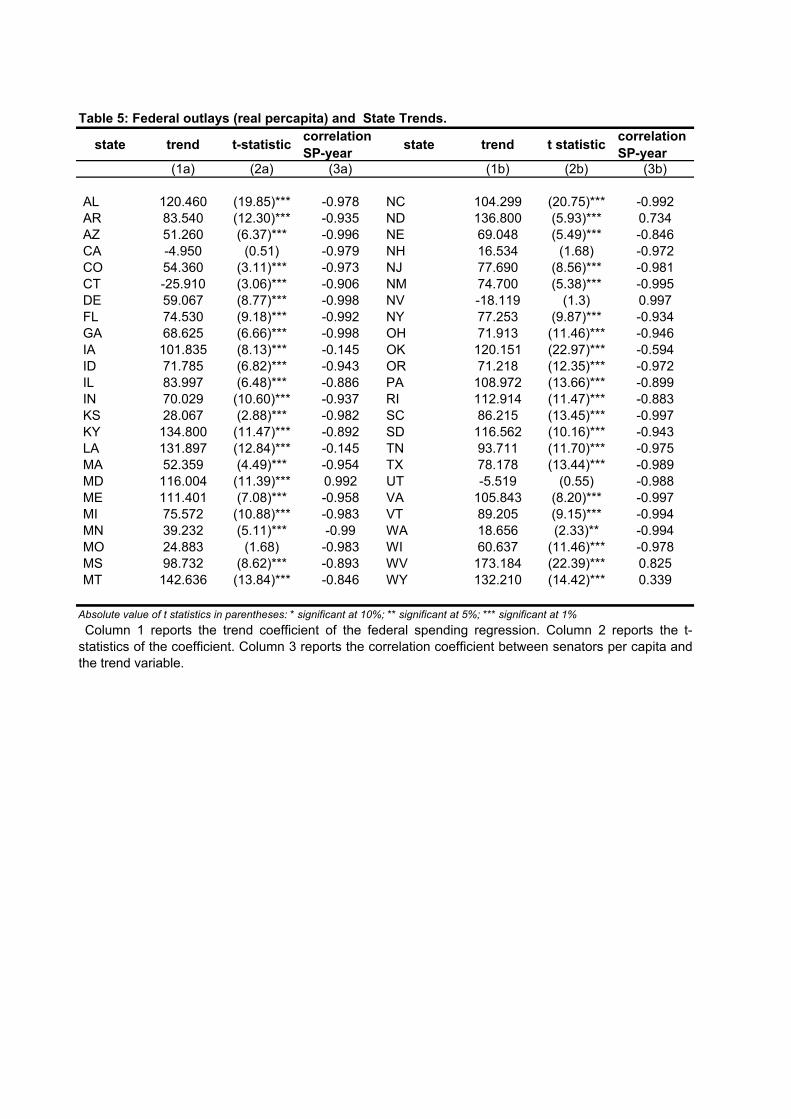
Table 5: Federal outlays (real percapita) and State Trends.
state trend t-statistic correlation SP-year state trend t statistic correlation
SP-year(1a) (2a) (3a) (1b) (2b) (3b)
AL 120.460 (19.85)*** -0.978 NC 104.299 (20.75)*** -0.992AR 83.540 (12.30)*** -0.935 ND 136.800 (5.93)*** 0.734AZ 51.260 (6.37)*** -0.996 NE 69.048 (5.49)*** -0.846CA -4.950 (0.51) -0.979 NH 16.534 (1.68) -0.972CO 54.360 (3.11)*** -0.973 NJ 77.690 (8.56)*** -0.981CT -25.910 (3.06)*** -0.906 NM 74.700 (5.38)*** -0.995DE 59.067 (8.77)*** -0.998 NV -18.119 (1.3) 0.997FL 74.530 (9.18)*** -0.992 NY 77.253 (9.87)*** -0.934GA 68.625 (6.66)*** -0.998 OH 71.913 (11.46)*** -0.946IA 101.835 (8.13)*** -0.145 OK 120.151 (22.97)*** -0.594ID 71.785 (6.82)*** -0.943 OR 71.218 (12.35)*** -0.972IL 83.997 (6.48)*** -0.886 PA 108.972 (13.66)*** -0.899IN 70.029 (10.60)*** -0.937 RI 112.914 (11.47)*** -0.883KS 28.067 (2.88)*** -0.982 SC 86.215 (13.45)*** -0.997KY 134.800 (11.47)*** -0.892 SD 116.562 (10.16)*** -0.943LA 131.897 (12.84)*** -0.145 TN 93.711 (11.70)*** -0.975MA 52.359 (4.49)*** -0.954 TX 78.178 (13.44)*** -0.989MD 116.004 (11.39)*** 0.992 UT -5.519 (0.55) -0.988ME 111.401 (7.08)*** -0.958 VA 105.843 (8.20)*** -0.997MI 75.572 (10.88)*** -0.983 VT 89.205 (9.15)*** -0.994MN 39.232 (5.11)*** -0.99 WA 18.656 (2.33)** -0.994MO 24.883 (1.68) -0.983 WI 60.637 (11.46)*** -0.978MS 98.732 (8.62)*** -0.893 WV 173.184 (22.39)*** 0.825MT 142.636 (13.84)*** -0.846 WY 132.210 (14.42)*** 0.339
Absolute value of t statistics in parentheses: * significant at 10%; ** significant at 5%; *** significant at 1%Column 1 reports the trend coefficient of the federal spending regression. Column 2 reports the t-
statistics of the coefficient. Column 3 reports the correlation coefficient between senators per capita andthe trend variable.
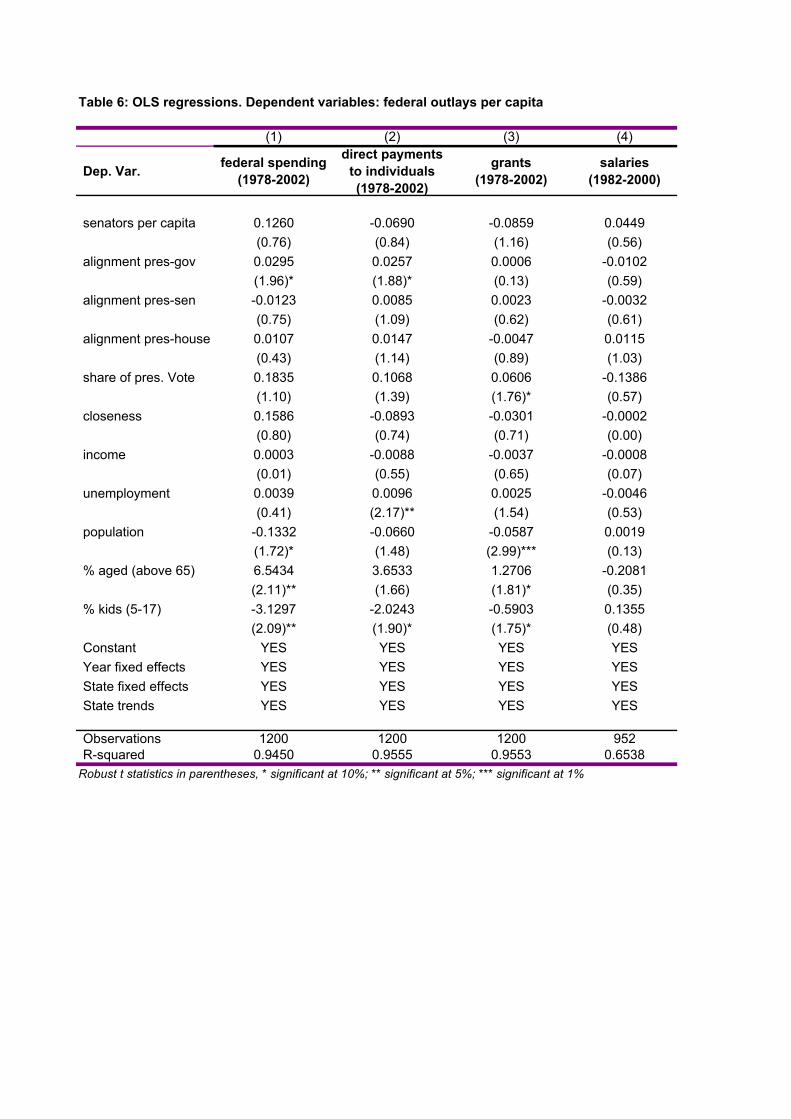
Table 6: OLS regressions. Dependent variables: federal outlays per capita
(1) (2) (3) (4)
Dep. Var. federal spending (1978-2002)
direct payments to individuals (1978-2002)
grants (1978-2002)
salaries (1982-2000)
senators per capita 0.1260 -0.0690 -0.0859 0.0449(0.76) (0.84) (1.16) (0.56)
alignment pres-gov 0.0295 0.0257 0.0006 -0.0102(1.96)* (1.88)* (0.13) (0.59)
alignment pres-sen -0.0123 0.0085 0.0023 -0.0032(0.75) (1.09) (0.62) (0.61)
alignment pres-house 0.0107 0.0147 -0.0047 0.0115(0.43) (1.14) (0.89) (1.03)
share of pres. Vote 0.1835 0.1068 0.0606 -0.1386(1.10) (1.39) (1.76)* (0.57)
closeness 0.1586 -0.0893 -0.0301 -0.0002(0.80) (0.74) (0.71) (0.00)
income 0.0003 -0.0088 -0.0037 -0.0008(0.01) (0.55) (0.65) (0.07)
unemployment 0.0039 0.0096 0.0025 -0.0046(0.41) (2.17)** (1.54) (0.53)
population -0.1332 -0.0660 -0.0587 0.0019(1.72)* (1.48) (2.99)*** (0.13)
% aged (above 65) 6.5434 3.6533 1.2706 -0.2081(2.11)** (1.66) (1.81)* (0.35)
% kids (5-17) -3.1297 -2.0243 -0.5903 0.1355(2.09)** (1.90)* (1.75)* (0.48)
Constant YES YES YES YESYear fixed effects YES YES YES YESState fixed effects YES YES YES YESState trends YES YES YES YES
Observations 1200 1200 1200 952R-squared 0.9450 0.9555 0.9553 0.6538
Robust t statistics in parentheses, * significant at 10%; ** significant at 5%; *** significant at 1%
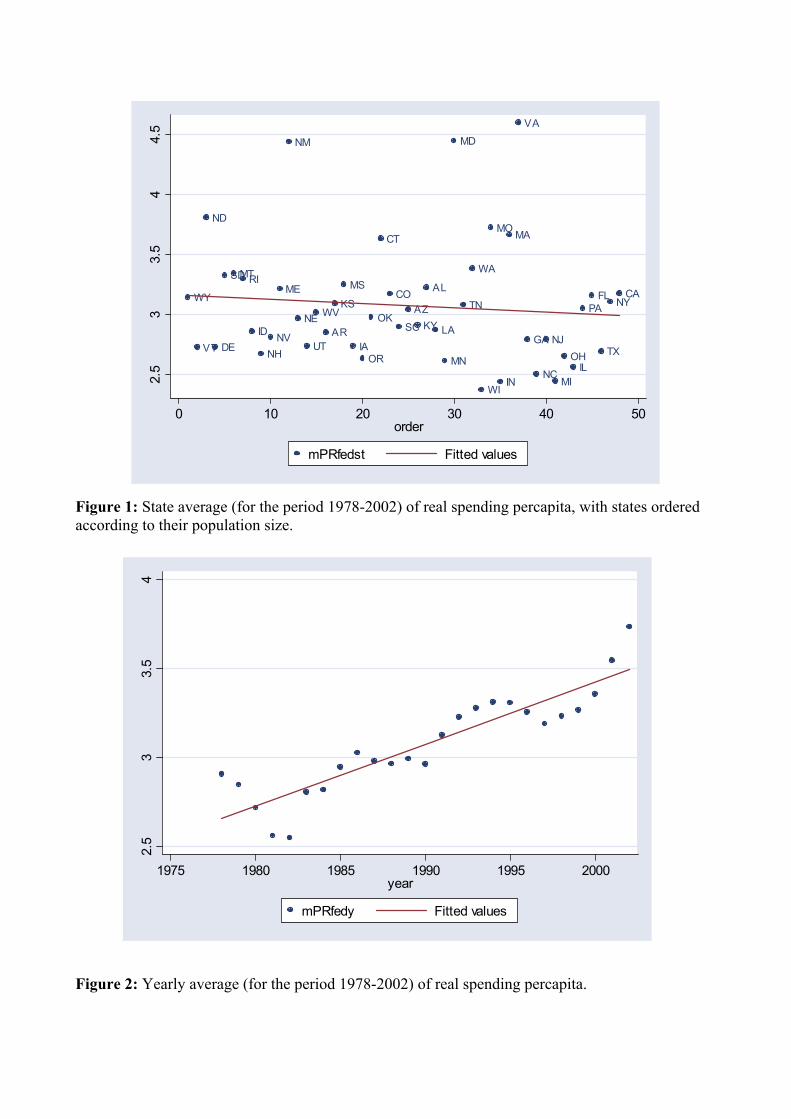
Figure 1: State average (for the period 1978-2002) of real spending percapita, with states ordered according to their population size. Figure 2: Yearly average (for the period 1978-2002) of real spending percapita.
��������������������������������������������������������������������������������������������������������������������������������������������������������������������������������������������������������������������������������������������������������������������������������������������������������������������������������������������������������������������������������������������������������������������������������������������������������������������������������������������������������������������������������������������������������������������������������������������������������������������������������������������������������������������������������������������������������������������������������������������������������������������������������������������������������������������������������������������������������������������������������������������������������������������������������������������������������������������������������������������������������������������������������������������������������������������������������������������������������������������������������������������������������������������������������������������������������������������������������������������������������������������������������������������������������������������������������������������������������������������������������������������������������������������������������������������������������������������������������������������������������������������������������������������������������������������������������������������������������������������������������������������������������������������������������������������������������������������������������������������������������������������������������������������������������������������������������������������������������������������������������������������������������������������������������������������������������������������������������������������������������������������������������������������������������������������������������������������������������������������������������������������������������������������������������������������������������������������������������������������������������������������������������������������������������������������������������������������������������������������������������������������������������������������������������������������������������������������������������������������������������������������������������������������������������������������������������������������������������������������������������������������������������������������������������������������������������������������������������������������������������������������������������������������������������������������������������������������������������������������������������������������������������������������������������������������������������������������������������������������������������������������������������������������������������������������������������������������������������������������������������������������������������������������������������������������������������������������������������������������������������������������������������������������������������������������������������������������������������������������������������������������������������������������������������������������������������������������������������������������������������������������������������������������������������������������������������������������������������������������������������������������������������������������������������������������������������������������������������������������������������������������������������������������������������������������������������������������������������������������������������������������������������������������������������������������������������������������������������������������������������������������������������������������������������������������������������������������������������������������������������������������������������������������������������������������������������������������������������������������������������������������������������������������������������������������������������������������������������������������������������������������������������������������������������������������������������������������������������������������������������������������������������������������������������������������������������������������������������������������������������������������������������������������������������������������������������������������������������������������������������������������������������������������������������������������������������������������������������������������������������������������������������������������������������������������������������������������������������������������������������������������������������������������������������������������������������������������������������������������������������������������������������������������������������������������������������������������������������������������������������������������������������������������������������������������������������������������������������������������������������������������������������������������������������������������������������������������������������������������������������������������������������������������������������������������������������������������������������������������������������
�������������������������������������������������������������������������������������������������������������������������������������������������������������������������������������������������������������������������������������������������������������������������������������������������������������������������������������������������������������������������������������������������������������������������������������������������������������������������������������������������������������������������������������������������������������������������������������������������������������������������������������������������������������������������������������������������������������������������������������������������������������������������������������������������������������������������������������������������������������������������������������������������������������������������������������������������������������������������������������������������������������������������������������������������������������������������������������������������������������������������������������������������������������������������������������������������������������������������������������������������������������������������������������������������������������������������������������������������������������������������������������������������������������������������������������������������������������������������������������������������������������������������������������������������������������������������������������������������������������������������������������������������������������������������������������������������������������������������������������������������������������������������������������������������������������������������������������������������������������������������������������������������������������������������������������������������������������������������������������������������������������������������������������������������������������������������������������������������������������������������������������������������������������������������������������������������������������������������������������������������������������������������������������������������������������������������������������������������������������������������������������������������������������������������������������������������������������������������������������������������������������������������������������������������������������������������������������������������������������������������������������������������������������������������������������������������������������������������������������������������������������������������������������������������������������������������������������������������������������������������������������������������������������������������������������������������������������������������������������������������������������������������������������������������������������������������������������������������������������������������������������������������������������������������������������������������������������������������������������������������������������������������������������������������������������������������������������������������������������������������������������������������������������������������������������������������������������������������������������������������������������������������������������������������������������������������������������������������������������������������������������������������������������������������������������������������
���WY
���VT
������ ND
���DE
���� SD
���MT���RI
���ID������ NH
���� NV
���ME
���NM
���NE���
UT
���WV���
AR
��KS
���MS
���IA��
OR
���OK
���CT
��� CO
���SC
������ AZ
��� KY
��AL
���LA
���MN
������ MD
���TN
���WA
���WI
��MO
��IN
���MA
���� VA
������ GA
��NC
������ NJ
���MI
���OH������ IL
���� PA
���FL
������ TX
���NY
������ CA
2.5
33.
54
4.5
0 10 20 30 40 50order�����������������������������������������������������������������������������������������������
����������������������������������������������������������������������������������������������������������������������������������������������������������������������������������������������
���mPRfedst Fitted values
������������������������������������������������������������������������������������������������������������������������������������������������������������������������������������������������������������������������������������������������������������������������������������������������������������������������������������������������������������������������������������������������������������������������������������������������������������������������������������������������������������������������������������������������������������������������������������������������������������������������������������������������������������������������������������������������������������������������������������������������������������������������������������������������������������������������������������������������������������������������������������������������������������������������������������������������������������������������������������������������������������������������������������������������������������������������������������������������������������������������������������������������������������������������������������������������������������������������������������������������������������������������������������������������������������������������������������������������������������������������������������������������������������������������������������������������������������������������������������������������������������������������������������������������������������������������������������������������������������������������������������������������������������������������������������������������������������������������������������������������������������������������������������������������������������������������������������������������������������������������������������������������������������������������������������������������������������������������������������������������������������������������������������������������������������������������������������������������������������������������������������������������������������������������������������������������������������������������������������������������������������������������������������������������������������������������������������������������������������������������������������������������������������������������������������������������������������������������������������������������������������������������������������������������������������������������������������������������������������������������������������������������������������������������������������������������������������������������������������������������������������������������������������������������������������������������������������������������������������������������������������������������������������������������������������������������������������������������������������������������������������������������������������������������������������������������������������������������������������������������������������������������������������������������������������������������������������������������������������������������������������������������������������������������������������������������������������������������������������������������������������������������������������������������������������������������������������������������������������������������������������������������������������������������������������������������������������������������������������������������������������������������������������������������������������������������������������������������������������������������������������������������������������������������������������������������������������������������������������������������������������������������������������������������������������������������������������������������������������������������������������������������������������������������������������������������������������������������������������������������������������������������������������������������������������������������������������������������������������������������������������������������������������������������������������������������������������������������������������������������������������������������������������������������������������������������������������������������������������������������������������������������������������������������������������������������������������������������������������������������������������������������������������������������������������������������������������������������������������������������������������������������������������������������������������������������������������������������������������������������������������������������������������������������������������������������������������������������������������������������������������������������������������������������������������������������������������������������������������������������������������������������������������������������������������������������������������������������������������������������������������������������������������������������������������������������������������������������������������������������������������������������������������������������������������������������������������������������������������������������������������������������������������������������������������������������������������������������������
�������������������������������������������������������������������������������������������������������������������������������������������������������������������������������������������������������������������������������������������������������������������������������������������������������������������������������������������������������������������������������������������������������������������������������������������������������������������������������������������������������������������������������������������������������������������������������������������������������������������������������������������������������������������������������������������������������������������������������������������������������������������������������������������������������������������������������������������������������������������������������������������������������������������������������������������������������������������������������������������������������������������������������������������������������������������������������������������������������������������������������������������������������������������������������������������������������������������������������������������������������������������������������������������������������������������������������������������������������������������������������������������������������������������������������������������������������������������������������������������������������������������������������������������������������������������������������������������������������������������������������������������������������������������������������������������������������������������������������������������������������������������������������������������������������������������������������������������������������������������������������������������������������������������������������������������������������������������������������������������������������������������������������������������������������������������������������������������������������������������������������������������������������������������������������������������������������������������������������������������������������������������������������������������������������������������������������������������������������������������������������������������������������������������������������������������������������������������������������������������������������������������������������������������������������������������������������������������������������������������������������������������������������������������������������������������������������������������������������������������������������������������������������������������������������������������������������������������������������������������������������������������������������������������������������������������������������������������������������������������������������������������������������������������������������������������������������������������������������������������������������������������������������������������������������������������������������������������������������������������������������������������������������������������������������������������������������������������������������������������������������������������������������������������������������������������������������������������������������������������������������������������������������������������������������������������������������������������������������������������������������������������������������������������������������������������������
������
��
��� ���
��� ���
������
������ ��� ��� ��� ���
����
��� ����� ���
�����
��� �����
������
���
2.5
33.
54
1975 1980 1985 1990 1995 2000year���������������������������������������������������������������������������������������������
���������������������������������������������������������������������������������������������������������������������������������������������������������������������������������������������
mPRfedy Fitted values
Related Documents