Full Terms & Conditions of access and use can be found at http://www.tandfonline.com/action/journalInformation?journalCode=pqje20 Download by: [UQ Library] Date: 10 April 2016, At: 16:47 The Quarterly Journal of Experimental Psychology ISSN: 1747-0218 (Print) 1747-0226 (Online) Journal homepage: http://www.tandfonline.com/loi/pqje20 Do people have insight into their face recognition abilities? Romina Palermo, Bruno Rossion, Gillian Rhodes, Renaud Laguesse, Tolga Tez, Bronwyn Hall, Andrea Albonico, Manuela Malaspina, Roberta Daini, Jessica Irons, Shahd Al-Janabi, Libby C. Taylor, Davide Rivolta & Elinor McKone To cite this article: Romina Palermo, Bruno Rossion, Gillian Rhodes, Renaud Laguesse, Tolga Tez, Bronwyn Hall, Andrea Albonico, Manuela Malaspina, Roberta Daini, Jessica Irons, Shahd Al-Janabi, Libby C. Taylor, Davide Rivolta & Elinor McKone (2016): Do people have insight into their face recognition abilities?, The Quarterly Journal of Experimental Psychology, DOI: 10.1080/17470218.2016.1161058 To link to this article: http://dx.doi.org/10.1080/17470218.2016.1161058 View supplementary material Accepted author version posted online: 03 Mar 2016. Published online: 23 Mar 2016. Submit your article to this journal Article views: 76 View related articles View Crossmark data

Welcome message from author
This document is posted to help you gain knowledge. Please leave a comment to let me know what you think about it! Share it to your friends and learn new things together.
Transcript
Full Terms & Conditions of access and use can be found athttp://www.tandfonline.com/action/journalInformation?journalCode=pqje20
Download by: [UQ Library] Date: 10 April 2016, At: 16:47
The Quarterly Journal of Experimental Psychology
ISSN: 1747-0218 (Print) 1747-0226 (Online) Journal homepage: http://www.tandfonline.com/loi/pqje20
Do people have insight into their face recognitionabilities?
Romina Palermo, Bruno Rossion, Gillian Rhodes, Renaud Laguesse, TolgaTez, Bronwyn Hall, Andrea Albonico, Manuela Malaspina, Roberta Daini,Jessica Irons, Shahd Al-Janabi, Libby C. Taylor, Davide Rivolta & ElinorMcKone
To cite this article: Romina Palermo, Bruno Rossion, Gillian Rhodes, Renaud Laguesse, TolgaTez, Bronwyn Hall, Andrea Albonico, Manuela Malaspina, Roberta Daini, Jessica Irons, ShahdAl-Janabi, Libby C. Taylor, Davide Rivolta & Elinor McKone (2016): Do people have insightinto their face recognition abilities?, The Quarterly Journal of Experimental Psychology, DOI:10.1080/17470218.2016.1161058
To link to this article: http://dx.doi.org/10.1080/17470218.2016.1161058
View supplementary material
Accepted author version posted online: 03Mar 2016.Published online: 23 Mar 2016.
Submit your article to this journal
Article views: 76
View related articles
View Crossmark data
Do people have insight into their face recognition abilities?Romina Palermoa,b,c , Bruno Rossiond,e, Gillian Rhodesa,b, Renaud Laguessed,e, Tolga Tezc,Bronwyn Hallc, Andrea Albonicof,g, Manuela Malaspinaf,g, Roberta Dainif,g, Jessica Ironsc†,Shahd Al-Janabih, Libby C. Taylora,b, Davide Rivoltah and Elinor McKonea,c
aARC Centre of Excellence in Cognition and its Disorders; bSchool of Psychology, University of Western Australia, Perth, WA,Australia; cResearch School of Psychology, The Australian National University, Canberra, ACT, Australia; dInstitute of Psychology(IPSY), Université Catholique de Louvain, Louvain-la-Neuve, Belgium; eInstitute of Neuroscience (IoNS), Université Catholique deLouvain, Louvain-la-Neuve, Belgium; fPsychology Department, Università degli Studi di Milano-Bicocca, Milan, Italy; gNeuroMI–Milan Center for Neuroscience, Università degli Studi di Milano-Bicocca, Milan, Italy; hDepartment of Cognitive Psychology,Macquarie University, Sydney, NSW, Australia
ABSTRACTDiagnosis of developmental or congenital prosopagnosia (CP) involves self-report ofeveryday face recognition difficulties, which are corroborated with poorperformance on behavioural tests. This approach requires accurate self-evaluation.We examine the extent to which typical adults have insight into their facerecognition abilities across four experiments involving nearly 300 participants. Theexperiments used five tests of face recognition ability: two that tap into the abilityto learn and recognize previously unfamiliar faces [the Cambridge Face MemoryTest, CFMT; Duchaine, B., & Nakayama, K. (2006). The Cambridge Face Memory Test:Results for neurologically intact individuals and an investigation of its validity usinginverted face stimuli and prosopagnosic participants. Neuropsychologia, 44(4), 576–585. doi:10.1016/j.neuropsychologia.2005.07.001 and a newly devised test based onthe CFMT but where the study phases involve watching short movies rather thanviewing static faces—the CFMT-Films] and three that tap face matching [BentonFacial Recognition Test, BFRT; Benton, A., Sivan, A., Hamsher, K., Varney, N., &Spreen, O. (1983). Contribution to neuropsychological assessment. New York: OxfordUniversity Press; and two recently devised sequential face matching tests]. Self-reported ability was measured with the 15-item Kennerknecht et al. questionnaire[Kennerknecht, I., Ho, N. Y., & Wong, V. C. (2008). Prevalence of hereditaryprosopagnosia (HPA) in Hong Kong Chinese population. American Journal of MedicalGenetics Part A, 146A(22), 2863–2870. doi:10.1002/ajmg.a.32552]; two single-itemquestions assessing face recognition ability; and a new 77-item meta-cognitionquestionnaire. Overall, we find that adults with typical face recognition abilitieshave only modest insight into their ability to recognize faces on behavioural tests.In a fifth experiment, we assess self-reported face recognition ability in people withCP and find that some people who expect to perform poorly on behavioural testsof face recognition do indeed perform poorly. However, it is not yet clear whetherindividuals within this group of poor performers have greater levels of insight (i.e.,into their degree of impairment) than those with more typical levels of performance.
KEYWORDSFace perception; Self-evaluation; Prosopagnosia;Individual differences;Metacognition; Accuracy
Recognizing other people from their faces is extremelychallenging because individual faces form a highlyvisually homogenous category. Moreover, a person’s
face changes all the time (e.g., viewpoint, lighting con-ditions, expression, ageing), making the task of indi-vidual face recognition very difficult. Despite this
© 2016 The Experimental Psychology Society
†Jessica Irons is now at the Department of Psychology, The Ohio State University; Shahd Al-Janabi is at Department of Psychology, University ofWisconsin-Milwaukee; Davide Rivolta is at the School of Psychology, University of East London.
CONTACT Romina Palermo [email protected] ARC Centre of Excellence in Cognition and its Disorders, and School ofPsychology, University of Western Australia, 35 Stirling Highway, Crawley, WA, 6009, Australia.
Supplemental content is available via the “Supplemental” tab on the article’s online page (http://dx.doi.org/10.1080/17470218.2016.1161058).
THE QUARTERLY JOURNAL OF EXPERIMENTAL PSYCHOLOGY, 2016http://dx.doi.org/10.1080/17470218.2016.1161058
Dow
nloa
ded
by [
UQ
Lib
rary
] at
16:
47 1
0 A
pril
2016
difficulty, for a long time it was considered that humanadults were all experts at face recognition (Carey,1992). However, recent studies have shown large indi-vidual differences in face identity recognition ability(e.g., Bowles et al., 2009; Herzmann, Danthiir,Schacht, Sommer, & Wilhelm, 2008; McKone &Palermo, 2010; Wilmer, Germine, Chabris, Chatterjee,Gerbasi, et al., 2012; Wilmer, Germine, Chabris, Chat-terjee, Williams, et al., 2010). Although some people,so-called super-recognizers, appear to be very goodat face recognition (Russell, Duchaine, & Nakayama,2009), there has been much more interest devotedto people who are apparently poor at recognizingothers by their face. By analogy to the neurologicalcondition of prosopagnosia (face recognition impair-ment following brain damage, after Bodamer, 1947;see Ellis & Florence, 1990), these people have beendefined as cases of developmental or congenital pro-sopagnosia (CP). People with CP report face recog-nition difficulties, often for as long as they canremember, without known and detectable braininjury and with typical visual acuity and intelligence(Bate, 2014; Behrmann & Avidan, 2005; Dalrymple &Palermo, 2016; Palermo & Duchaine, 2012; Rivolta,Palermo, & Schmalzl, 2013; Susilo & Duchaine, 2013).
Cases of CP are typically identified following theirself-reports of poor face recognition abilities. Then,in many studies, their face recognition abilities aretested behaviourally, using face recognition tests, tosupport (or dismiss) their initial self-reports (e.g., Bateet al., 2014; Dalrymple & Palermo, 2016; Duchaine &Nakayama, 2006; Palermo, Rivolta, Wilson, & Jeffery,2011). Common tests include tests of famous face rec-ognition (e.g., the Macquarie Famous Face Test, MFFT,Palermo, Rivolta, et al., 2011), the Cambridge FaceMemory Test (CFMT, Duchaine & Nakayama, 2006), astandardized episodic memory test that involvesstudying six male faces, followed by three-alternativeforced-choice test trials that increase in difficulty,and the Cambridge Face Perception Test (CFPT, Duch-aine, Germine, & Nakayama, 2007), in which faces areordered for similarity to a target. However, in somestudies, people have been defined as cases of CPbased on self-report or semi-structured interviewsonly (e.g., Kennerknecht et al., 2006; Kennerknecht,Ho, & Wong, 2008). This latter way of proceedingmight be problematic because there is limited evi-dence that self-reports of face recognition difficultytruly reflect difficulties in face recognition.
De Haan (1999) advises caution on relying on self-reports of face recognition difficulty, after finding that
a member of a family in which three members showvery poor recognition of familiar faces on a testshowed typical face recognition performance despitenoting everyday problems. De Haan states:
It is probable that he incorrectly equated his own inciden-tal recognition failures (which happen to all of us fromtime to time) with the severe recognition problems ofhis sisters . . . stresses the need for objective testing. Itis hazardous to rely on subjective reports concerningface recognition difficulties of family members of devel-opmental prosopagnosics. (p. 314)
We also have experience of people reporting poorface recognition abilities yet performing at typicallevels on a battery of behavioural tests (Palermo, per-sonal communication, 2015). The opposite is also thecase, with some people who would be classified asprosopagnosic on the basis of test scores unawarethat their face recognition was poorer than that ofothers (e.g., Bowles et al., 2009). Similarly, Grueteret al. (2007, p. 746) state that:
One of the most striking aspects of hereditary prosopag-nosia is that, despite poor recognition abilities, mostpeople are able to navigate daily life with relatively littleimpairment, and may even be unaware of any impair-ment until quite late in life.
Kennerknecht and colleagues developed a short self-report screening measure for the presence of CP (pub-lished in Kennerknecht et al., 2008). The questionnairecontains 15 questions, which can be answered on a 5-point rating scale, resulting in scores between 15 and75 points, with higher scores indicating more difficultyrecognizing faces. Questions include: “I can easilyfollow actors in a movie” and “I recognize famouspeople immediately”. Eight people deemed prosopag-nosic on the basis of another more detailed question-naire and semi-structured interview reported a meanof 41.6 (SD = 4.6), whereas 186 non-prosopagnosicpeople (age range 18–25 years) reported a mean of30.8 (SD = 6.9; Kennerknecht et al., 2008). In a follow-up study, a significant correlation was foundbetween scores on the questionnaire for 15 peoplewith CP and face recognition performance (z-scoreof performance combined over multiple tests), r(13)=−.55, p = .03 (Stollhoff, Jost, Elze, & Kennerknecht,2011). However, it was not reported whether therewas a similar relationship for people who did notreport long-life difficulties in face recognition.
The Kennerknecht et al. (2008) questionnaireincludes questions that are not related to face identityrecognition (e.g., “I can easily form a mental picture of
2 R. PALERMO ET AL.
Dow
nloa
ded
by [
UQ
Lib
rary
] at
16:
47 1
0 A
pril
2016
a red rose”), in an attempt to exclude individuals whohave other difficulties in addition to CP. In contrast,Shah, Gaule, Sowden, Bird, and Cook (2015) recentlydeveloped a questionnaire (Prosopagnosia Index,PI20) in which all 20 items are focused on face identityrecognition ability. A group of people who suspectedthat they had CP (and some for whom this was con-firmed by poor performance on behavioural tests)scored significantly higher on the PI20 than controls,indicating that this self-report measure may tap intothe everyday face recognition difficulties that arepart of CP.
People with CP are not the only group poor atrecognizing facial identity. Adults who were deprivedof early visual input for a time as children due to bilat-eral congenital cataracts are also slower and less accu-rate on tests of face recognition memory (i.e., famousface memory tests; CFMT), and their deficit has beendescribed as “prosopagnosic-like”, although they typi-cally do not report face recognition difficulties (deHeering & Maurer, 2012). De Heering and Maurer(2012) recently developed a 10-item 7-point Likertscale “prosopagnosic questionnaire” and assessedthe subjective impressions of a group of 12 peoplewho had cataracts removed in childhood. On 8 ofthe 10 items, their responses were indistinguishablefrom those of visually normal controls. Responses onthe other two items differed from those of controlsbut inconsistently. The group reported poorer facememory on one question: “In general, do you havethe impression of being less accurate than otherpeople in recognizing familiar faces (family, friends,celebrities . . . ) yet better face memory on another?Do you think you are very good at recognizing faces?”
These studies suggest that groups of people withvery poor face recognition ability (e.g., CPs) mayhave insight into their deficit, while those with lesssevere difficulties (e.g., bilateral congenital cataracts)may not. Insight into face recognition abilities maybe even more difficult for those within the typical“average” range of performance. There are a numberof reasons why it might be quite difficult for an indi-vidual to evaluate his/her own ability to learn andrecognize faces. For instance, while other abilities,such as language competence, are often the subjectof clear and consistent feedback in educational set-tings (which might be why they show one of thelargest associations between self-perceptions and per-formance, e.g., .63; Zell & Krizan, 2014), face recog-nition abilities are not typically measured. Moreover,feedback in real life may often confound face
recognition ability with the ability to remember aperson’s name after they have been recognized and/or may confound face recognition with person recog-nition (which can involve the voice, gait, etc.).
Most studies have typically only used a single ques-tion to assess self-reported face recognition ability.Bowles et al. (2009) asked typical participants in theirstudy to rate their ability to recognize faces in every-day life as “compared to the average person“ on a10-point scale where 0 was much worse thanaverage, and 10 was much better than average. Itwas clarified that the question related to the recog-nition of faces as familiar, not how well the participantremembered names. For young adults, the meanrating was 6.8 (SD = 1.6), and there was a significantbut small correlation between self-report and overallscore on the CFMT, r(113) = .22, p < .05. Although inthe expected direction (negative, as CFPT scores areerrors so higher scores indicate poorer performance),there was no significant association between ratingand performance on the CFPT, r(27) =−.12, ns.
Bindemann, Attard, and Johnston (2014) asked par-ticipants four questions (note that their responseswere not combined but were examined separatelyas single questions)—to rate their ability to recognizefamous faces, family faces, unfamiliar faces seen once,and unfamiliar faces seen several times on a 7-pointscale from “very bad” to “very good”. Self-reportratings of ability to recognize unfamiliar faces andfamily faces did not correlate with the later ability torecognize famous faces, rs(28) < .22, ps > .25, or cor-rectly identify unfamiliar faces from line-ups, rs(38)< .15, ps > .10. However, self-reported ability to recog-nize famous faces was moderately related to laterability to recognize famous faces on two tests [rs(28)= .39 and .47, ps = .03 and .0009] but not correctlyidentify unfamiliar faces from line-ups, rs(38) = .04,p = .82.
Rotshtein, Geng, Driver, and Dolan (2007) askedparticipants to rate their ability to recognize faces ona scale from 1 to 10 at the beginning of the testsession, with 1 being “I cannot remember faces atall” and 10 being “I never forget a person’s face onceI met him or her”. Once again, it was clarified thatthis was not assessing their naming skills or theirability to retrieve semantic information. Using one-tailed Spearman’s rho (ρ), they found that self-reported ability did not correlate with behaviouralmeasures of face memory performance [famous facerecognition and incidental learning, ρs(17) < .03, ns].In a similar vein, McGugin, Richler, Herzmann,
THE QUARTERLY JOURNAL OF EXPERIMENTAL PSYCHOLOGY 3
Dow
nloa
ded
by [
UQ
Lib
rary
] at
16:
47 1
0 A
pril
2016
Speegle, and Gauthier (2012; also see Gauthier et al.,2014) measured participant’s self-reported experience(defined as “interest in, years exposure to, knowledgeof, and familiarity” with faces and other object cat-egories, such as cars and owls) on a 9-point scalewhere 1 was the lowest expertise. Better performanceon the CFMT was weakly associated with greaterexperience with faces, r(221) = .17 (p-value notreported).
Converging evidence from these studies using asingle question is that typical adults have onlyminimal insight into their face recognition ability(with the possible exception of their ability to recog-nize famous faces, cf. Bindemann et al., 2014). In con-trast, the study using the recently developed PI20questionnaire (Shah et al., 2015) suggests thatpeople do have a great deal of insight into their facerecognition abilities: Scores on the PI20 correlatedhighly (and, as expected, negatively) with scores ona famous face task, r(171) =−.81, p < .001, and theCFMT, r(108) =−.68, p < .001. This level of insight ismuch higher than that reported for most other abil-ities. For instance, a recent metasynthesis of 22meta-analyses suggests that the correspondencebetween self-evaluations and ability (in this case, aca-demic ability, intelligence, language competence,medical skills, sports ability, and vocational skills)average at .29 (SD = .11; Zell & Krizan, 2014). ThePI20 is a reliable measure (Cronbach’s α = .96 acrossa sample of typical and CP participants), and it is poss-ible that people really do have insight into their abil-ities when asked a large number of very specificquestions, such as “Without hearing people’s voices,I struggle to recognize them”, “I am better than mostpeople at putting a ‘name to a face’”.
However, it is important to note that the reportedcorrelations include both typical individuals andthose who suspect that they have CP, and theinclusion of the latter group appears to contributegreatly to the strength of the association (see Shahet al., 2015, Figure 2). Including different groups in cor-relational analyses sometimes occurs in the literature(e.g., Russell et al., 2009, show a correlation betweenthe CFMT and the “Before They Were Famous Test”but include both typical people and people withexceptionally good face recognition skills—“superrecognizers”). However, the correlation could bepurely driven by mean differences between groups(e.g., Thomas et al., 2009, showed a correlationbetween errors in face recognition and a reductionin mean fractional anisotropy in the ventral visual
stream, which essentially reflected a differencebetween CPs and typical subjects) and thus does notadd any information to a statistically different variablebetween groups.
Other than the recent study by Shah et al. (2015),most studies suggest that there is minimal, if any,relationship between one’s self-evaluation of face rec-ognition ability and behavioural measures of face rec-ognition performance. Here, in a collective effort toaddress this important issue, we report the outcomeof four experiments, performed in different insti-tutions, in which face recognition performance wasassessed in large cohorts of typical participants, in par-allel with self-reports of their face recognition abilities.A novel feature of this study is that we administeredfive tests of face recognition ability. Two of the testsare well established: The CFMT (Duchaine &Nakayama, 2006) is a valid and reliable test of facelearning and memory that is sensitive to variation intypical adults (e.g., Bowles et al., 2009; Wilmer et al.,2012), and the BFRT (Benton, Sivan, Hamsher,Varney, & Spreen, 1983) involves simultaneous facematching. Three other tests were newly developed:the CFMT-Films, which is based on the CFMT formatbut differs in that the study stage involves watchingshort film clips of people interacting (see Supplemen-tal Material) and two sequential face-matching tests,one in which front view faces are matched andanother in which the faces vary in viewpoint fromtarget to test. All of the tests used faces that were pre-viously unfamiliar to participants. This is importantsince the tests involve matching (with or withoutdelay) and old/new recognition, which could be per-formed using nonvisual codes (e.g., semantic infor-mation or labels) if using familiar faces (see reviewsby Burton & Jenkins, 2011; Johnston & Edmonds,2009; for differences in processing of unfamiliar andfamiliar faces). We also included the Cambridge CarMemory Test (CCMT; Dennett et al., 2012) as a test ofnon-face recognition memory, to examine whetherrelationships were specific to faces or to visualmemory in general.
Another novel feature of this study was that weused a variety of self-report measures of face recog-nition ability: the 15-item Kennerknecht et al. (2008)questionnaire; two single-item questions assessingoverall face recognition ability with a 9-point Likertscale (“How well do you think you will perform onstudying and recognizing faces from your own‘race’?” and “Overall, how would you describe yourgeneral ability to recognize faces?”); and a new
4 R. PALERMO ET AL.
Dow
nloa
ded
by [
UQ
Lib
rary
] at
16:
47 1
0 A
pril
2016
77-item questionnaire of face recognition metacogni-tion (knowledge about mental processes). We alsoincluded measures of social anxiety (Social InteractionAnxiety Scale, SIAS, Mattick & Clarke, 1998) and autistictraits (Autism-Spectrum Quotient, AQ, Baron-Cohen,Wheelwright, Skinner, Martin, & Clubley, 2001) toinvestigate whether test scores and/or self-reported face recognition ability are associated withother traits.
Finally, we also report a separate experiment withpeople diagnosed with CP on the basis of behaviouraltests and anecdotal self-report of everyday face recog-nition difficulties and examine whether very poor per-formance is linked with increased insight (ascompared to those with typical range face recognitionability). This combination of measures and participantgroups will provide a comprehensive analysis ofpeople’s insight into their face recognition abilities.
Experimental study
Method
TestsIn the upright version of the Cambridge Face MemoryTest (CFMT; Duchaine & Nakayama, 2006), participantsstudy six greyscale male target faces that have beencropped to remove non-face cues and then selectthe studied face from two distractors. The testsection consists of three stages that increase in diffi-culty, for a total score out of 72. In the first “learn”stage the faces are the same as those studied (scoreout of 18), in the second “novel” stage the faces areseen under novel lighting and viewpoints (score outof 30), and in the third “noise” stage, visual noise isoverlaid on all the faces (score out of 24). The CFMThas been validated on the basis of its ability to diag-nose people with acquired prosopagnosia (Liu-Shuang, Torfs, & Rossion, in press; Susilo, Yovel,Barton, & Duchaine, 2013) and the much lowerscores observed for inverted than for upright faces(Duchaine & Nakayama, 2006). Also, performance onthe CFMT correlates with performance on a facematching test without any learning component (i.e.,CFPT; Bowles et al., 2009; Duchaine et al., 2007) butthe test displays only modest correlations withmeasures of non-face visual memory (Dennett et al.,2012; Wilmer et al., 2010) and even weaker corre-lations with measures of verbal memory (Wilmeret al., 2012). The CFMT is also reliable, as measuredwith Cronbach’s alpha, a measure of internal
consistency (α = .89; Bowles et al., 2009; α = .83; Herz-mann et al., 2008; α = .90; Wilmer et al., 2010).
The CFMT-Films is a newly devised test (see Sup-plemental Material for details of the test developmentand psychometric data). This test is based on theCFMT format but the study stage involves watchingshort film clips of people interacting. The testsection contains two stages (38 trials each) in whichparticipants select previously seen faces from a line-up of three faces: a “novel” stage and a “noise” stagein which Gaussian noise was overlaid on the faces(76 trials in total). Analyses conducted with a sampleof 89 participants indicate that the CFMT-Films dis-plays excellent reliability (α = .89) and validity (corre-lates highly with the CFMT but only weakly withnon-face visual memory), that average performanceis at the psychometric “sweet spot” mid-waybetween chance and ceiling (M = 68.57%), and thatindividual performance displays sufficient range tomeasure individual differences (SD = 14.64).
The Benton Facial Recognition Test (BFRT, Bentonet al., 1983) is a classical test to assess face recognitionimpairments in brain-damaged patients. It involvesthe matching of a target face to either one faceunder the same viewpoint and lighting (6 items) orthree of six faces that vary in viewpoint and lighting(16 items). All faces are presented simultaneously.The maximum score is 54, with a score between 41and 39 considered as mildly impaired, and below 39as severely impaired. Note that despite the difficultyof this test, cases of patients with acquired prosopag-nosia (e.g., Busigny & Rossion, 2010; Delvenne, Seron,Coyette, & Rossion, 2004) or CP (Duchaine &Nakayama, 2004) can sometimes reach almostnormal performance at simultaneous matching byusing unusual strategies and taking abnormally longresponse times (see Busigny & Rossion, 2010; Delv-enne et al., 2004; for discussion of this issue and theconsideration of reaction time, RT, measures in theBFRT).
Experiment 4 also included two matching tests. Inthese tests, participants first see a target face pre-sented for 200 ms followed by a brief mask (250 ms)and then four faces arranged in a square around thecentre of the screen, which remain visible until theparticipant’s response. In the first task (4AFC-FF), allthe faces are seen from front-on (exact same imageat encoding and test). In the second task (4AFC-DR),the target face is rotated 30° to the left or right, andthe test faces all face the opposite direction. Allfaces are presented in colour, and external features
THE QUARTERLY JOURNAL OF EXPERIMENTAL PSYCHOLOGY 5
Dow
nloa
ded
by [
UQ
Lib
rary
] at
16:
47 1
0 A
pril
2016
are cropped. Each test contains 56 face identities (28males and 28 females). The faces are about 7 cmhigh and 5 cm wide on the screen at a distance of70 cm from the screen. Each face is repeated fourtimes, appearing once at each possible location onthe screen. Participants are asked to answer asquickly and as accurately as possible, using bothhands to press the keys numbered 1, 3, 4, or 6. Thesplit-half reliability of these two delayed face match-ing tests is very high (.93 and .94, respectively, Table1), and three well-described patients with acquiredprosopagnosia (G.G., Busigny, Joubert, Felician, Cec-caldi, & Rossion, 2010; L.R., Busigny et al., 2014; P.S.,Rossion et al., 2003) perform very poorly on bothtests (Laguesse & Rossion, unpublished data). P.S.’s(scores of 46, 54, respectively) and G.G.’s (47.3, 42.4)scores are well below 2 standard deviations of themean (limits: 65.1, 61), while L.R.’s low score for thefirst test was only was slightly above 2 standard devi-ations below normal range (69.6, 55.8). However, L.R.’s(as P.S.’s) correct RTs were more than 5 standard devi-ations below normal range. The Cambridge CarMemory Test (CCMT; Dennett et al., 2012) was alsoincluded as a test of non-face recognition memory.This test is modelled on the CFMT, except thatimages of cars instead of faces are used. The reliabilityof the test is .84 (Dennett et al., 2012).
QuestionnairesThe questionnaire developed by Kennerknecht et al.(2008) is used as a screening measure for the presenceof CP, with higher scores indicating more difficultyrecognizing faces. Thus, a relationship between self-report ratings of face recognition ability and behav-ioural face recognition performance in this studywould be seen via significant negative correlations.
We also included single questions assessing howwell participants thought that they would perform atrecognizing faces of their own race: “How well doyou think you will perform on studying and recogniz-ing faces from your own ‘race’?” and their overall facerecognition ability: “Overall, how would you describeyour general ability to recognize faces?” Participantsresponded using a 9-point Likert scale ranging from1 (“very poor”) to 9 (“very good”). Thus, a relationshipbetween ratings of face recognition ability and behav-ioural face recognition performance in this studywould be seen via significant positive correlations.
A new questionnaire of metacognition about facerecognition was also included. The questionnaire con-tains a total of 77 questions organized into various
subcategories, with many questions worded in bothpositive and negative forms to be able to check forconsistency (see Supplemental Material for theFrench to English translation of the questionnaire).
The Social Interaction Anxiety Scale (SIAS; Mattick &Clarke, 1998), which measures self-reported levels ofsocial anxiety, and the Autism-Spectrum Quotient (AQ;Baron-Cohen et al., 2001), which measures self-reported levels of autistic traits, were also included.These questionnaires allow us to investigate whethertest scores and/or self-reported face recognitionability are also associated with social anxiety and/orautistic traits.
Participants and procedure for each experimentExperiment 1. The Kennerknecht et al. (2008) ques-tionnaire (translated into Italian) was administered to490 psychology students at the University of Milan-Bicocca. Ninety-six of these (16 males), agedbetween 19 and 28 years (M = 21.69, SD = 1.98), volun-teered to return at a later time and complete compu-terized tests for course credit. All had normal orcorrected-to-normal vision and no evidence of neuro-logical deficit. These 96 participants completed theCFMT, both upright and inverted, and the BFRT(Benton et al., 1983). The order of test administrationwas counterbalanced.
Experiment 2. Eighty-nine adults of European descent(28 males), aged between 17 and 46 years (M = 21.44,SD = 5.64), with normal or corrected-to-normal vision,were tested in an individual session. Most participantswere students at the Australian National University,recruited via flyers, and received course credit or $30for participating in a 2-hour session.
Participants completed four computerized tests ona 24-inch iMac with a resolution of 1920 × 1200 pixelswith brightness and contrast set to maximum. Thetests were completed in the following order: thenewly developed CFMT-Films (Supplemental Material),a composite face test (not discussed here), the CFMT(Duchaine & Nakayama, 2006), and the CCMT(Dennett et al., 2012). The CFMT and CCMT were admi-nistered following the standard instructions. Ten par-ticipants who had already completed the CFMT and/or CCMT as part of another study did not re-takethese tests, and we used their score from this previousstudy. At the end of the session participants com-pleted a pencil and paper demographic questionnaire,the face recognition questionnaire of Kennerknechtet al. (2008), and the SIAS (Mattick & Clarke, 1998).
6 R. PALERMO ET AL.
Dow
nloa
ded
by [
UQ
Lib
rary
] at
16:
47 1
0 A
pril
2016
Experiment 3. Fifty-seven adults of European descent(17 males), aged between 17 and 32 years (M = 18.77,SD = 2.57) were tested in an individual session. Mostparticipants were students at the University ofWestern Australia recruited via an online sign-upsystem, and they received course credit or $20 for par-ticipating in a 2-hour session. For reasons not relatedto this study, some of the students were specificallyinvited to participate on the basis of their Autism-Spectrum Quotient (AQ) scores (Baron-Cohen et al.,2001), a questionnaire that was administered to thefirst-year psychology student pool in the weeks priorto testing. Nine students were selected for lowscores (11 or less) and 10 for high scores (23 andover). No participant scored 32 or above, which isthe cut-off indicative of a possible autism spectrumdisorder (Baron-Cohen et al., 2001).
Participants completed two test sessions. In thefirst, they completed four computerized tasks on a20-inch iMac with a resolution of 1680 × 1050 pixels.The tasks were completed in the following order: anidentity after-effect task (not discussed here), theCFMT, the CCMT, and a Car Makes and Modelscheck. In this experiment, the CFMT was re-pro-grammed into SuperLab, and the stimuli in theNovel and Noise phases were randomly presented,
rather than in the fixed order used in Experiments 1and 2 (note that due to a coding error, one of thetrials in the Noise condition was repeated, and thetrial that should have been included was omitted).In the second session, exactly one week after thefirst session, participants completed two computer-ized tasks not discussed here—a face after-effectstask and a cross-race face recognition task. Prior tobeginning the cross-race face recognition task, partici-pants were asked to rate how they thought theywould perform at recognizing faces of their ownrace (“How well do you think you will perform onstudying and recognizing faces from your ownrace?”), and a different race (“How well do you thinkyou will perform on studying and recognizing facesfrom a different race?”, not discussed here as ourinterest is not with other-race face recognition), aswell as to rate their general ability to recognizefaces (“Overall, how would you describe yourgeneral ability to recognize faces?”). Participantsresponded using the keyboard with a 9-point Likertscale ranging from 1 (“very poor”) to 9 (“verygood”). After completing the computer tasks, the par-ticipants completed paper and pencil versions of theAQ, a demographic questionnaire, the SIAS, and thenthe Kennerknecht et al. (2008) questionnaire.
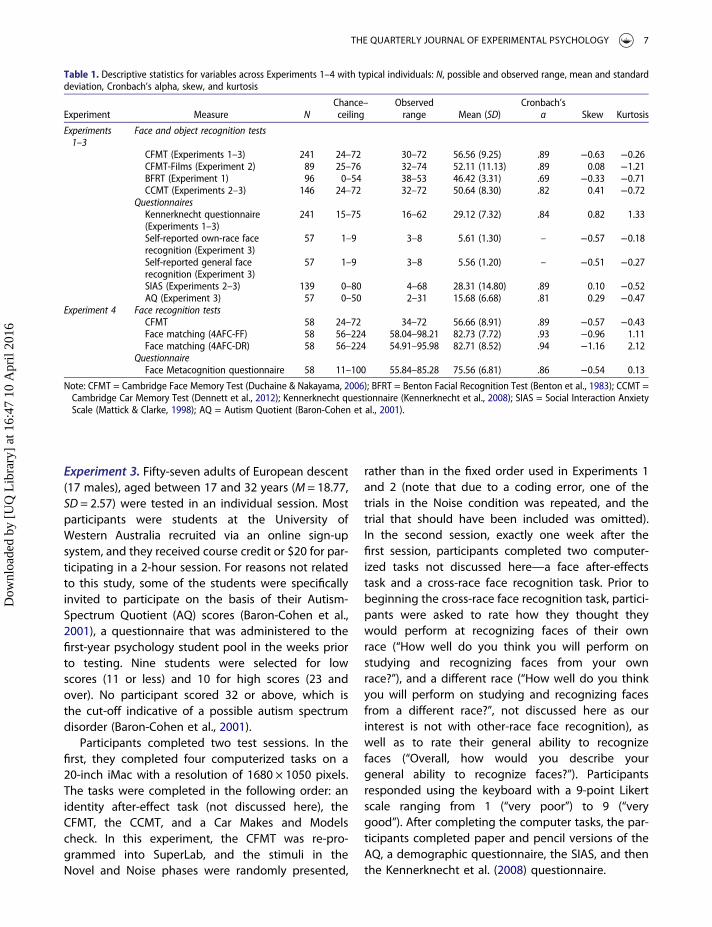
Table 1. Descriptive statistics for variables across Experiments 1–4 with typical individuals: N, possible and observed range, mean and standarddeviation, Cronbach’s alpha, skew, and kurtosis
Experiment Measure NChance–ceiling
Observedrange Mean (SD)
Cronbach’sα Skew Kurtosis
Experiments1–3
Face and object recognition tests
CFMT (Experiments 1–3) 241 24–72 30–72 56.56 (9.25) .89 −0.63 −0.26CFMT-Films (Experiment 2) 89 25–76 32–74 52.11 (11.13) .89 0.08 −1.21BFRT (Experiment 1) 96 0–54 38–53 46.42 (3.31) .69 −0.33 −0.71CCMT (Experiments 2–3) 146 24–72 32–72 50.64 (8.30) .82 0.41 −0.72
QuestionnairesKennerknecht questionnaire(Experiments 1–3)
241 15–75 16–62 29.12 (7.32) .84 0.82 1.33
Self-reported own-race facerecognition (Experiment 3)
57 1–9 3–8 5.61 (1.30) – −0.57 −0.18
Self-reported general facerecognition (Experiment 3)
57 1–9 3–8 5.56 (1.20) – −0.51 −0.27
SIAS (Experiments 2–3) 139 0–80 4–68 28.31 (14.80) .89 0.10 −0.52AQ (Experiment 3) 57 0–50 2–31 15.68 (6.68) .81 0.29 −0.47
Experiment 4 Face recognition testsCFMT 58 24–72 34–72 56.66 (8.91) .89 −0.57 −0.43Face matching (4AFC-FF) 58 56–224 58.04–98.21 82.73 (7.72) .93 −0.96 1.11Face matching (4AFC-DR) 58 56–224 54.91–95.98 82.71 (8.52) .94 −1.16 2.12
QuestionnaireFace Metacognition questionnaire 58 11–100 55.84–85.28 75.56 (6.81) .86 −0.54 0.13
Note: CFMT = Cambridge Face Memory Test (Duchaine & Nakayama, 2006); BFRT = Benton Facial Recognition Test (Benton et al., 1983); CCMT =Cambridge Car Memory Test (Dennett et al., 2012); Kennerknecht questionnaire (Kennerknecht et al., 2008); SIAS = Social Interaction AnxietyScale (Mattick & Clarke, 1998); AQ = Autism Quotient (Baron-Cohen et al., 2001).
THE QUARTERLY JOURNAL OF EXPERIMENTAL PSYCHOLOGY 7
Dow
nloa
ded
by [
UQ
Lib
rary
] at
16:
47 1
0 A
pril
2016
Experiment 4. Fifty-eight adults of European descent(9 males), aged between 18 and 25 years (M = 19,SD = 1.47) were tested in an individual session. Mostparticipants were undergraduate students at the Uni-versity of Louvain and received credit courses inexchange to their participation. Participants wereasked to complete the Metacognition questionnaire,and then the CFMT and the two 4AFC tasks (FF andDR). The tasks were run on a PC with a 19′′ screen of1680 × 1050 pixels of resolution.
Experiment 5. In this experiment we tested 13 people(4 males), aged between 23 and 60 years (M = 43.46,SD = 12.08) who registered with the online AustralianProsopagnosia Register (https://www.cogsci.mq.edu.au/research/projects/prosopagnosia/register/)because they experience significant everyday face rec-ognition difficulties. Each individual completed severaltests of face recognition: a test of famous face recog-nition (the MFFT 2008; Palermo, Rivolta et al., 2011),the CFMT (Duchaine & Nakayama, 2006), a version ofthe CFMT using faces well matched to those typicallyseen in Australia (the CFMT-Australian, McKone et al.,2011), and the CFPT (Duchaine et al., 2007). Individualswere impaired across multiple tests, displaying per-formance at least 1.7 standard deviations below thatof typical face recognizers on at least two tests (withthe exception of F23 who was below this limit onlyone test; however, she was close to the limit on anadditional two tests and as such was included as aCP due to general overall pattern of poor perform-ance). Most of the individuals displayed deficits thatwere relatively face-specific (i.e., not impaired on theCCMT, Dennett et al., 2012), with the exception ofM57 who was also impaired at recognizing cars.Given that his performance on the Raven’s ProgressiveMatrices (Raven, 2008) did not indicate substantialgeneral cognitive deficits, we opted to keep him inour sample (see Bate, Haslam, Tree, & Hodgson,2008; Dalrymple & Palermo, 2016 for discussion ofdiagnosis of CP).
Participants were provided with feedback on theirpoor face recognition performance at differentpoints of the experiment. The first five people inTable 2 were given feedback prior to completing theKennerknecht et al. (2008) questionnaire, whereasthe other eight participants completed the face recog-nition tests and the questionnaires in the same testsession, prior to receiving feedback on theirperformance.
Results
Table 1 displays descriptive statistics for the fourexperiments with typical individuals. These includetests of face identity recognition (CFMT, CFMT-Films,BFRT, 4AFC-FF, and 4AFC-DR Matching) and, in twoexperiments, a test of object recognition (CCMT).Importantly, average performance was neither atfloor nor at ceiling, and all show sufficient range.Descriptive statistics are also shown for the face recog-nition ability questionnaires (Kennerknecht et al.,2008; own-race and general single item questionnaire,metacognition questionnaire) and those thatmeasured levels of social anxiety (SIAS) and autistictraits (AQ). Cronbach’s alpha, a measure of internalconsistency, was average to high for all of themeasures. Cronbach’s alpha values were also used tocalculate the theoretical upper bound (UB) of a corre-lation that could be obtained between two tests, cal-culated as the geometric mean of the tworeliabilities (Kaplan & Saccuzzo, 2001).
When more than one face test was included in anexperiment, we first examine the relationshipsbetween the tests to determine whether they weremeasuring similar aspects of face recognition. If so,we would expect that self-report measures should cor-relate with both tests similarly. We then turn to ourprimary question: the relationship between testscore and questionnaire self-report. We report bothPearson’s r and Spearman’s rho (ρ, and in the caseof partial correlations Kendall’s tau, pτ), as in somecases the distributions were not normal, or sufferedfrom significant skew or kurtosis (Table 1).
1. Are scores on the Kennerknecht et al. (2008)questionnaire related to performance on thetests of face recognition ability?
Higher scores on the Kennerknecht et al. (2008) ques-tionnaire indicate more difficulties with face recog-nition. Thus, a negative correlation indicates arelationship between self-report scores and ability. Alarge sample of participants completed both theCFMT and the Kennerknecht et al. questionnaire (N= 240, Experiments 1–3), and there was a significant,yet small, relationship between the measures [r(238)=−.14, p = .03, UB = .86, ρ =−.12, p = .08]. Given thelarge sample, we also examined whether there wereany sex differences (180 females; 60 males). Thecorrelation was numerically smaller for females[r(178) =−.08, p = .27; ρ =−.11, p = .16] than for
8 R. PALERMO ET AL.
Dow
nloa
ded
by [
UQ
Lib
rary
] at
16:
47 1
0 A
pril
2016
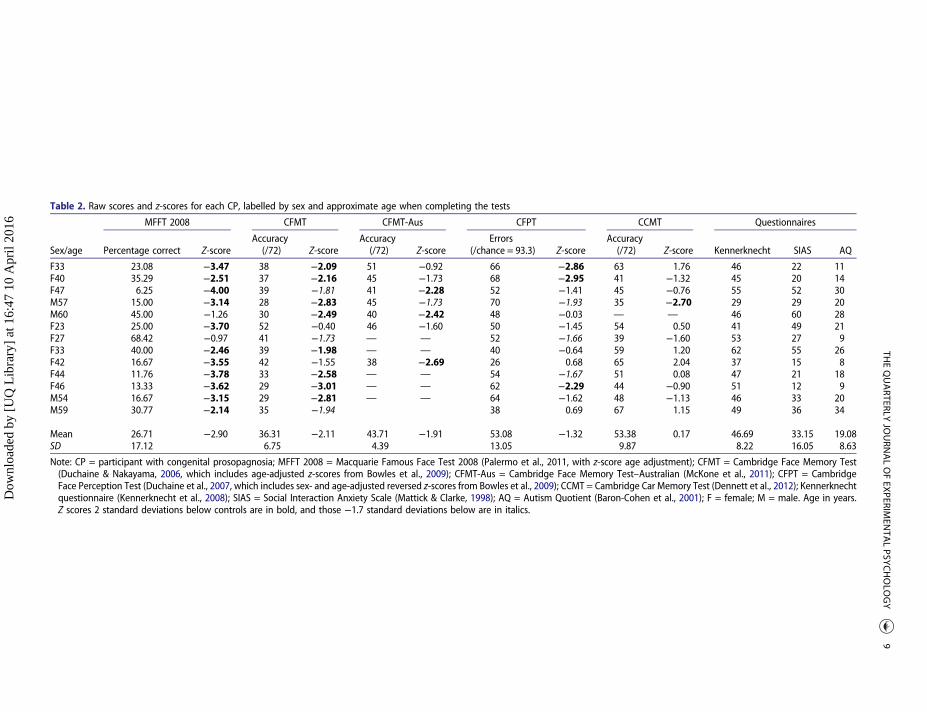
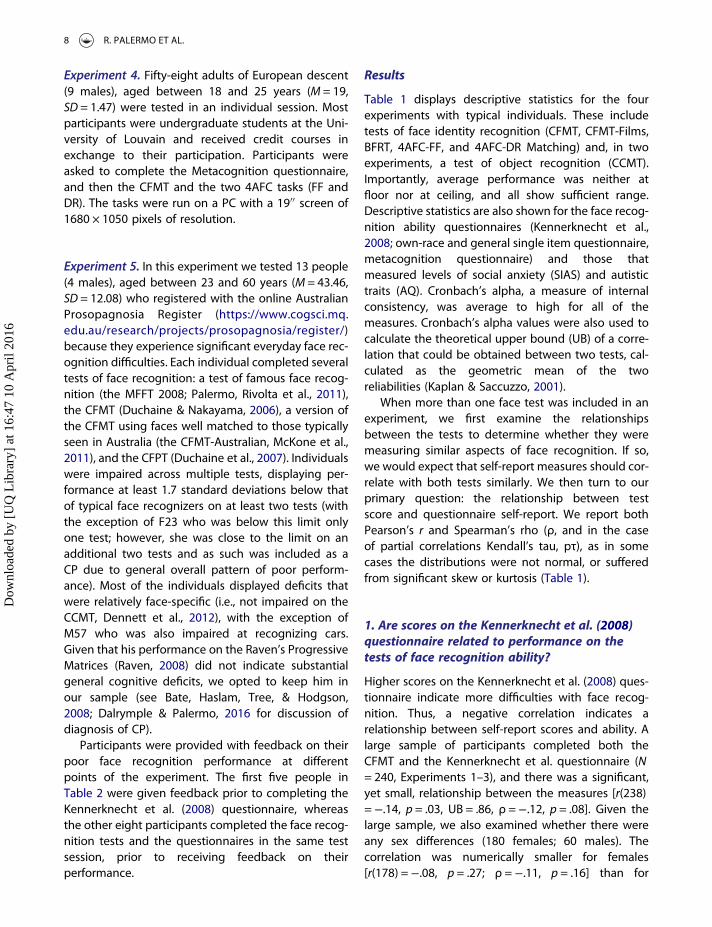
Table 2. Raw scores and z-scores for each CP, labelled by sex and approximate age when completing the tests
Sex/age
MFFT 2008 CFMT CFMT-Aus CFPT CCMT Questionnaires
Percentage correct Z-scoreAccuracy(/72) Z-score
Accuracy(/72) Z-score
Errors(/chance = 93.3) Z-score
Accuracy(/72) Z-score Kennerknecht SIAS AQ
F33 23.08 −3.47 38 −2.09 51 −0.92 66 −2.86 63 1.76 46 22 11F40 35.29 −2.51 37 −2.16 45 −1.73 68 −2.95 41 −1.32 45 20 14F47 6.25 −4.00 39 −1.81 41 −2.28 52 −1.41 45 −0.76 55 52 30M57 15.00 −3.14 28 −2.83 45 −1.73 70 −1.93 35 −2.70 29 29 20M60 45.00 −1.26 30 −2.49 40 −2.42 48 −0.03 — — 46 60 28F23 25.00 −3.70 52 −0.40 46 −1.60 50 −1.45 54 0.50 41 49 21F27 68.42 −0.97 41 −1.73 — — 52 −1.66 39 −1.60 53 27 9F33 40.00 −2.46 39 −1.98 — — 40 −0.64 59 1.20 62 55 26F42 16.67 −3.55 42 −1.55 38 −2.69 26 0.68 65 2.04 37 15 8F44 11.76 −3.78 33 −2.58 — — 54 −1.67 51 0.08 47 21 18F46 13.33 −3.62 29 −3.01 — — 62 −2.29 44 −0.90 51 12 9M54 16.67 −3.15 29 −2.81 — — 64 −1.62 48 −1.13 46 33 20M59 30.77 −2.14 35 −1.94 38 0.69 67 1.15 49 36 34
Mean 26.71 −2.90 36.31 −2.11 43.71 −1.91 53.08 −1.32 53.38 0.17 46.69 33.15 19.08SD 17.12 6.75 4.39 13.05 9.87 8.22 16.05 8.63
Note: CP = participant with congenital prosopagnosia; MFFT 2008 = Macquarie Famous Face Test 2008 (Palermo et al., 2011, with z-score age adjustment); CFMT = Cambridge Face Memory Test(Duchaine & Nakayama, 2006, which includes age-adjusted z-scores from Bowles et al., 2009); CFMT-Aus = Cambridge Face Memory Test–Australian (McKone et al., 2011); CFPT = CambridgeFace Perception Test (Duchaine et al., 2007, which includes sex- and age-adjusted reversed z-scores from Bowles et al., 2009); CCMT = Cambridge Car Memory Test (Dennett et al., 2012); Kennerknechtquestionnaire (Kennerknecht et al., 2008); SIAS = Social Interaction Anxiety Scale (Mattick & Clarke, 1998); AQ = Autism Quotient (Baron-Cohen et al., 2001); F = female; M = male. Age in years.Z scores 2 standard deviations below controls are in bold, and those −1.7 standard deviations below are in italics.
THEQUARTERLY
JOURN
ALOFEX
PERIMEN
TALPSYC
HOLO
GY
9
Dow
nloa
ded
by [
UQ
Lib
rary
] at
16:
47 1
0 A
pril
2016
males [r(58) =−.28, p = .03; ρ =−.17, p = .21)], but thedifference was not significant (z = 1.36, p = .17).
These experiments all tested unselected universitystudents. Given estimates that 2.5% of the generalpopulation perform at prosopagnosic levels (seeBowles et al., 2009; Kennerknecht et al., 2006), wealso examined correlations between the Kenner-knecht et al. (2008) questionnaire and the CFMT,excluding those who could “potentially” be prosopag-nosic. Excluding the poorest 2% of participants (n = 5)did not change the strength of the correlation [r(233)=−.14, p = .03; ρ =−11, p = .10].
Some of these participants also completed theCCMT (Experiments 2 and 3), as a measure of non-face visual memory well matched in format to theCFMT (Dennett et al., 2012). The Kennerknecht ques-tionnaire did not correlate with non-face visualmemory [r(143) =−.08, p = .31; ρ =−.05, p = .55, UB= .83], and controlling for CCMT strengthened the cor-relation between the CFMT and the questionnaire [pr(141) =−.25, p = .003, pτ(141) =−.15, p = .009]. Thus,the relationship with the Kennerknecht questionnaireappears to be specific to face recognition ability ratherthan general visual memory.
Davis et al. (2011) reported a small significant nega-tive relationship between social anxiety (measuredwith the SIAS) and CFMT performance. Similarly, inthis study we found a small but significant relationshipbetween SIAS and CFMT [r(136) =−.22, p = .008, ρ =−.18, p = .03] (Experiments 2 and 3). Additionally,here we show that scores on the Kennerknecht ques-tionnaire also correlate with social anxiety, in thatpeople with higher self-reported levels of socialanxiety tended to report that they had more difficultyrecognizing faces [r(137) = .30, p = .001, UB = .86, ρ= .28, p = .001]. Note that the association betweenthe CFMT and the Kennerknecht questionnaire is stillapparent when the SIAS was controlled for [pr(135)=−.18, p = .04; pτ(135) =−.11, p = .05].
The Kennerknecht questionnaire also correlatedwith self-reported autistic traits (Experiment 3), inthat people who scored more highly on the AQtended to report that they had more difficulty recog-nizing faces [r(55) = .41, p = .002, UB = .80; ρ = .39, p= .003]; this was reflected in performance, with a nega-tive correlation between the CFMT and AQ [r(55) =−.46, p = .001; ρ =−.38, p = .003]. These correlationsare of a similar magnitude to the correlationsbetween the CFMT and Kennerknecht questionnaire(i.e., AQ is as good as a predictor as the Kennerknechtquestionnaire). The correlation between the
Kennerknecht questionnaire and the CFMT is weakerafter controlling for AQ [pr(54) =−.25, p = .07; pτ(54)=−.23, p = .01].
Participants in Experiment 2 completed both theCFMT and the CFMT-Films. Performance on thesetests was highly correlated [r(86) = .64, p < .001, UB= .89; ρ = .65, p < .001] (see Supplemental Materialfor more details). However, scores on the CFMT-Filmswere not associated with the Kennerknecht et al.(2008) questionnaire [r(86) =−.08, p = .46, UB = .86; ρ=−.01, p = .93].
The CFMT was also moderately correlated with theBFRT (Experiment 1) [r(94) = .49, p < .001; UB = .76; ρ= .50, p < .001]. However, once again, scores on theBFRT were not associated with the Kennerknechtet al. (2008) questionnaire [r(94) =−.00, p = .99, UB= .77; ρ = .00, p = .97].
2. Are scores on the single-item questionsrelated to performance on the tests of facerecognition ability?
In Experiment 3, participants also completed twosingle-item questions assessing the self-reportedability to recognize own-race faces and faces ingeneral. A positive relationship would indicate someinsight into performance. However, the ability torecognize faces on the CFMT was not significantly cor-related with either single-item self-reported own-race[r(55) = .13, p = .35; ρ = .07, p = .61] or general face rec-ognition ability [r(55) = .26, p = .05; ρ = .22, p = .10].
Interestingly, responses on the Kennerknecht ques-tionnaire were not significantly associated with thesingle-item self-report measure of own-race face rec-ognition (r =−.07, p = .63; ρ =−.08, p = .57) and wereonly marginally associated with the single-item self-report measure of general face recognition (r =−.23,p = .09; ρ =−.26, p = .053).
3. Are scores on the meta-cognitionquestionnaire related to performance on thetests of face recognition ability?
The CFMT and the 4AFC-FF and 4AFC-DR matchingtasks were highly positively correlated (FF: r = .68,UB = .91, ρ = .68; DR: r = .77, UB = .91, ρ = .78, all ps= .001). Moreover, the two 4AFC tests were highly cor-related despite the change in viewpoint in the lattertask, both for accuracy (r = .85, p = .001, ρ = .79,p = .001) and for correct RTs (r = .73, p = .001, ρ = .77,p = .001).
10 R. PALERMO ET AL.
Dow
nloa
ded
by [
UQ
Lib
rary
] at
16:
47 1
0 A
pril
2016
A positive relationship between the face recog-nition tests and the metacognition questionnaire isexpected if the self-report measure is related to per-formance. A significant positive (small) relationshipwas observed for both the CFMT [r(56) = .32, p < .05,UB = .87; ρ = .37, p < .01] and the matching tests[4AFC-FF: r(56) = .29, p < .05, UB = .89, ρ = .35; 4AFC-DR: r(56) = .32, p < .05, UB = .90; ρ = .40, p < .01].
4. Do people with developmental/congenitalprosopagnosia (CP) self-report facerecognition difficulties?
Here, we examine how people who report everydayface recognition difficulties and perform poorly ontests of face recognition ability respond on self-report questionnaires. Note that comparing CPs andtypical face recognizers is valuable, regardless ofwhether CP reflects the low end of continuous vari-ation in face recognition ability or a distinct group(see Bowles et al., 2009, for discussion).
The average age of the 13 CPs (M = 43.5, SD = 12.1)was greater than that of the people in Experiments 1–3. Bowles et al. (2009) recommend using age-adjustedz-scores for the CFMT and age- and sex-adjusted z-scores for the CFPT for those aged middle-aged orolder. Thus, Table 2 includes both raw scores andadjusted z scores. As is evident, the CPs performedpoorly on the face recognition tests—the MFFT2008, the CFMT, and the CFPT.
We have no reason to expect that responses on theKennerknecht questionnaire would vary within thatage range and so compared the ratings for the CPs(M = 46.7, SD = 8.2) with those of the undergraduates(M = 29.1, SD = 7.3) and found that those of the CPswere significantly higher, t(252) = 8.38, p < .0001.
AQ scores did not differ between the CPs (M = 19.1,SD = 8.6) and undergraduates (M = 15.7, SD = 6.7), t(68) = 1.57, p = .12. This replicates previous researchwith age-matched samples, which has not found anyevidence of elevated AQ scores in groups of peoplewith CP (Duchaine, Murray, Turner, White, & Garrido,2009; Palermo, Willis, et al., 2011).
Social anxiety is more likely to be diagnosed in ado-lescence or young adults than in older adults (Kessleret al., 2005). However, given other evidence that age isnot related to SIAS scores (Brown et al., 1997), we alsocompared the scores made by the group of CPs to theundergraduates. We expected to find a significantdifference in light of the study by Yardley, McDermott,Pisarski, Duchaine, and Nakayama et al. (2008), where
interviews suggested that many people with CPreported psychosocial difficulties, including socialanxiety. However, while the SIAS scores were numeri-cally higher for CPs (M = 33.15, SD = 16.05) than forundergraduates (M = 28.31, SD = 14.80), they did notdiffer significantly, t(150) = 1.12, p = .26. Scores onthe SIAS above 36 are indicative of social phobia(Peters, 2000), and four of the 13 CPs had scoresabove 36. This rate of 31% is higher than that of theAustralian population reporting any anxiety disorder(14.4%; The Mental Health of Australians 2: Reporton the 2007 National Survey of Mental Health andWellbeing). However, we note here that the mean ofthe undergraduate sample is also relatively high (cf.M = 19.0, SD = 10.1 for undergraduates in Mattick &Clarke, 1998; M = 22.61; SD = 12.69 in Davis et al.,2011), and 29% of the group had scores above 36,which suggests that our CPs could show significantlyhigher levels of social anxiety than those for thetypical population.
Finally, to test our assumption that the magnitudeof the correlation in the study by Shah et al. (2015) wasinflated by mixing CPs and those with typical face rec-ognition skills, we added the 13 CPs to the data col-lected in Experiments 1–3. The strength of thecorrelation between the CFMT and Kennerknechtet al. (2008) questionnaire significantly increased,r(253) =−.31, p = .001, ρ =−.22, p = .001 (z = 1.98,p = .03).
Discussion
To investigate how much insight typical individualshave in their ability to recognize faces, we collecteddata from nearly 300 participants, who completedfive face recognition tests and three questionnairesOverall, our results suggest that individuals in thegeneral population have only minimal to moderateinsight into their face recognition abilities. We alsofound that longer questionnaires seem better ableto tap into insight than shorter questionnaires, par-ticularly single-item questions.
Across a general undergraduate sample unselectedfor face recognition ability, we observed only a small,albeit significant, relationship between the 15-itemKennerknecht et al. (2008) questionnaire and theCFMT (r =−.14) yet no significant relationshipsbetween this questionnaire and either the CFMT-Films or the BFRT. The observed small relationshipwith the CFMT appears selective to faces rather thangeneral visual memory, as there was no relationship
THE QUARTERLY JOURNAL OF EXPERIMENTAL PSYCHOLOGY 11
Dow
nloa
ded
by [
UQ
Lib
rary
] at
16:
47 1
0 A
pril
2016
between this questionnaire and a non-face version ofthe CFMT, the CCMT. In sum, results from the Kenner-knecht et al. (2008) questionnaire reveal only minimalinsight into face recognition ability in the typicalpopulation.
The group of people with CP scored more highlyon the Kennerknecht et al. (2008) questionnairethan our undergraduate comparison group. Thisdifference supports the recent finding that peoplewith very poor face recognition have insight intotheir (in)abilities (Shah et al., 2015) and/or that thequestionnaire may tap into their specific deficits(which would not be surprising given that is what itwas designed for). However, it is important to notethat our data only indicate that this group knowthey are poorer relative to others, not that thosewithin this group of people are aware of the relativeseverity of their impairment within the group of CPs.In our sample of 13 CPs there was no evidence of anycorrelation between their score on tests and theirself-report score on the Kennerknecht et al. question-naire. However, a correlation may be evident with alarger sample size (cf., Shah et al., 2015, Figure 2;Stollhoff et al., 2011). It would be of interest forfuture studies to examine whether insight differsbetween those who are very poor (and very good)as compared to those who perform with normallimits. An additional question of interest would beto examine self-reported face recognition abilitywith that for other categories of objects in peoplewith CP. On the one hand, it has been suggestedthat the relationship between self-report and recog-nition may be higher for faces than for other non-face objects (Gauthier et al., 2014; McGugin et al.,2012; Van Gulick, McGugin, & Gauthier, in press).On the other hand, self-reported experts at non-face object recognition, car experts for instance,score much higher than self-reported novices at inde-pendent tasks only for the category of self-reportedexpertise (Rossion, Collins, Goffaux, & Curran, 2007;Rossion & Curran, 2010), thus rather showing agood insight at their non-face object recognitionability. Assessing verbal semantic knowledge mayalso be valuable, given that that verbal semanticknowledge of car makes was a better predictor ofvisual recognition of cars than self-reported carexpertise in typical individuals and that mostpeople with acquired prosopagnosia did not showtypical levels of car recognition once verbal semanticscores were adjusted for (Barton, Hanif, & Ashraf,2009; see also Barton & Corrow, 2016).
The validity of the Kennerknecht et al. (2008) ques-tionnaire to tap insight into face recognition abilityhas been previously criticized (e.g., Shah et al., 2015),because it includes some items that are unrelated tothe core face recognition impairment in CP. Whenwe used a newly devised 77-item novel questionnairethat includes questions from everyday life situationswhere impairments in face recognition shouldappear, we found much larger correlations with theCFMT and face-matching test (∼.30). In contrast,ratings on the single-items asking about own-raceand general face recognition ability were poor predic-tors of face recognition ability and were not related toCFMT performance. These results suggest that thenew, longer questionnaire is better at tapping intothe kinds of face recognition difficulties that peopleare aware of.
In general, we found that the size of relationshipbetween self-report ratings and tests of face recog-nition ability is commensurate with that seen forother types of memory. For instance, a meta-analysishas shown a small (r = .15), yet significant, relationshipbetween memory self-efficacy and performanceacross 107 studies (Beaudoin & Desrichard, 2011).Our conclusions contrast with those of Shah et al.(2015), who have argued that people have a greatdeal of insight into their own face recognition abilities,based on correlations using their 20-item scale withthe CFMT (r =−.68, N = 173) and a famous face test(r =−.81, N = 110). As noted earlier, their sampleincludes both people who suspect that they have CP(n = 23) and those who do not (n = 87). We suggestthat combining the groups in this way is likely tohave increased the strength of their correlation. Insupport of this argument, when we added the datafrom 13 people with CP to the data from the 240typical individuals, the strength of the correlationbetween the Kennerknecht et al. (2008) questionnaireand the CFMT doubled in magnitude.
Some participants also completed the AQ, a self-report measure of autistic traits. Performance on theCFMT was negatively correlated with the AQ, whichhas been previously reported (Halliday, MacDonald,Sherf, & Tanaka, 2014; but less clearly in Rhodes,Jeffery, Taylor, & Ewing, 2013). Interestingly, thestrength of the relationship between the CFMT andAQ (r =−.46, upper bound = .84) is of a similar magni-tude to that between the CFMT and Kennerknechtet al. (2008) questionnaire (r =−.39, upper bound= .83). There was also a moderate correlationbetween the Kennerknecht et al. questionnaire and
12 R. PALERMO ET AL.
Dow
nloa
ded
by [
UQ
Lib
rary
] at
16:
47 1
0 A
pril
2016
the AQ, with more self-rated autistic traits correlatedwith poorer self-reported face recognition ability.
Some participants also completed the SIAS, a self-report measure of social anxiety. Once again, perform-ance on the CFMT was negatively correlated with SIASscores (as in Davis et al., 2011), and the strength of thisrelationship (r =−.22, upper bound = .89) is similar tothat between the CFMT and Kennerknecht et al.(2008) questionnaire (r =−.24, upper bound = .86).There was also a moderate correlation between theKennerknecht et al. questionnaire and the SIAS, withhigher levels of social anxiety associated with poorerself-reported face recognition ability. These patternsof results suggest that self-reported autistic traits/social anxiety are as predictive of performance onface recognition tests as self-reported face recognitionability, at least across those without levels of AQindicative of autism (none of the participants scoredabove the cut-off indicative of autism as specified byBaron-Cohen et al., 2001). Note that we do not wishto argue that the AQ is a good proxy for face recog-nition self-evaluation, given that people with proso-pagnosia do not typically score highly on the AQ—that is, AQ scores in Experiment 5 did not differbetween CPs and controls (also see Duchaine et al.,2009; Palermo, Willis, et al., 2011). Similarly, whilepeople with prosopagnosia often report socialanxiety (Yardley et al., 2008), the group of CPs in Exper-iment 5 did not report significantly higher levels ofsocial anxiety on the SIAS. For the CPs, the Kenner-knecht et al. questionnaire was more useful thaneither the AQ or the SIAS.
We note that the first four experiments were con-ducted with young adults. Face recognition ability asmeasured behaviourally peaks at around age 30 andthen slowly declines (Susilo, Germine, & Duchaine,2013). Bowles et al. (2009) reported a small (r = .22)but significant relationship between self-reportedface recognition and CFMT score for young adultsaged 18–35 years but there was no association forthose aged 55–88 years (r =−.05). An interestingavenue for future research will be to examinewhether age affects insight into face recognitionability.
In summary, the ability of self-report questionnairesto measure insight into face recognition ability, evenwhen the items concentrate on face recognition (e.g., Experiment 4), appears limited. However, this con-clusion is only valid if the behavioural tests usedtruly reflect daily-life face recognition abilities. Regard-ing this point, many of the tests used have been
shown to measure individual differences in ability (e.g., the CFMT, Wilmer et al., 2012) and are used to diag-nose CP (e.g., the CFMT, Duchaine & Nakayama, 2006).Importantly, these tests also appear to identify casesof acquired prosopagnosia (e.g., CFMT, Liu-Shuanget al., in press; Susilo et al., 2013; 4AFC tests used inExperiment 4; Busigny et al., 2010, 2014; Rossionet al., 2003). People with very poor face recognitionskills may be more aware of their difficulties thanthe typical population, but such insight is clearly notuniversal. The experiments reported here have impor-tant implications for the diagnosis of CP, which reliesupon poor performance on behavioural tests andaccounts of everyday face recognition difficulties. Italso goes some way to explaining why not all individ-uals with poor face recognition test scores wouldexpect that they would perform poorly.
Acknowledgement
Thank you to Ainsley Read for testing some of the participants inExperiment 3 and C. Ellie Wilson and Eleni Avard for testing someof the participants in Experiment 5.
Funding
This research was supported by the Australian Research Council(ARC) Centre of Excellence for Cognition and its Disorders [grantnumber CE110001021] (http://www.ccd.edu.au); an ARC Dis-covery Project grant to R.P. and E.M. [grant numberDP110100850]; an ARC Queen Elizabeth II Fellowship to E.M.[grant number DP0984558]; an ARC Professorial Fellowship toG.R. [grant number DP0877379]; an ARC Discovery OutstandingResearcher Award to G.R. [grant number DP130102300]; and aEuropean Research Council (ERC) grant to B.R. [grant numberfacessvep 284025].
ORCID
Romina Palermo http://orcid.org/0000-0002-8678-4592
References
Baron-Cohen, S., Wheelwright, S., Skinner, R., Martin, J., & Clubley,E. (2001). The autism-spectrum quotient (AQ): Evidence fromAsperger syndrome/high-functioning autism, malesandfemales, scientists and mathematicians. Journal of Autismand Developmental Disorders, 31(1), 5–17.
Barton, J. J. S., & Corrow, S. L. (2016). Selectivity in acquired pro-sopagnosia: The segregation of divergent and convergentoperations. Neuropsychologia. doi:http://dx.doi.org/10.1016/j.neuropsychologia.2015.09.015
THE QUARTERLY JOURNAL OF EXPERIMENTAL PSYCHOLOGY 13
Dow
nloa
ded
by [
UQ
Lib
rary
] at
16:
47 1
0 A
pril
2016
Barton, J. J. S., Hanif, H., & Ashraf, S. (2009). Relating visual toverbal semantic knowledge: The evaluation of object recog-nition in prosopagnosia. Brain, 132, 3456–3466. doi:10.1093/brain/awp252
Bate, S. (2014). Face facts: Understanding prosopagnosia.Psychology Review, 19, 18–21.
Bate, S., Cook, S. J., Duchaine, B., Tree, J. J., Burns, E. J., & Hodgson,T. L. (2014). Intranasal inhalation of oxytocin improves faceprocessing in developmental prosopagnosia. Cortex, 50, 55–63. doi:10.1016/j.cortex.2013.08.006
Bate, S., Haslam, C., Tree, J. J., & Hodgson, T. L. (2008). Evidence ofan eye movement-based memory effect in congenital proso-pagnosia. Cortex, 44(7), 806–819.
Beaudoin, M., & Desrichard, O. (2011). Are memory self-efficacyand memory performance related? A meta-analysis.Psychological Bulletin, 137(2), 211–241. doi:10.1037/a0022106
Behrmann, M., & Avidan, G. (2005). Congenital prosopagnosia:Face-blind from birth. Trends in Cognitive Sciences, 9(4), 180–187. doi:10.1016/j.tics.2005.02.011
Benton, A., Sivan, A., Hamsher, K., Varney, N., & Spreen, O. (1983).Contribution to neuropsychological assessment. New York:Oxford University Press.
Bindemann, M., Attard, J., & Johnston, R. A. (2014). Perceivedability and actual recognition accuracy for unfamiliar andfamous faces. Cogent Psychology, 1(1), 986903. doi:10.1080/23311908.2014.986903
Bowles, D. C., McKone, E., Dawel, A., Duchaine, B., Palermo, R.,Schmalzl, L.,… Yovel, G. (2009). Diagnosing prosopagnosia:effects of ageing, sex, and participant-stimulus ethnic matchon the Cambridge face memory test and Cambridge face per-ception test. Cognitive Neuropsychology, 26(5), 423–455.doi:10.1080/02643290903343149
Brown, E. J., Turovsky, J., Heimberg, R. G., Juster, H. R., Brown, T. A.,& Barlow, D. H. (1997). Validation of the social interactionanxiety scale and the social phobia scale across the anxietydisorders. Psychological Assessment, 9, 21–27. doi:10.1037/1040-3590.9.1.21
Burton, A. M., & Jenkins, R. (2011). Unfamiliar face perception. InA. J. Calder, G. Rhodes, M. H. Johnson, & J. Haxby (Eds.), TheOxford handbook of face perception (pp. 287–306). OxfordUniversity Press.
Busigny, T., Joubert, S., Felician, O., Ceccaldi, M., & Rossion, B.(2010). Holistic perception of the individual face is specificand necessary: Evidence from an extensive case study ofacquired prosopagnosia. Neuropsychologia, 48(14), 4057–4092. doi:10.1016/j.neuropsychologia.2010.09.017
Busigny, T., & Rossion, B. (2010). Acquired prosopagnosiaabolishes the face inversion effect. Cortex, 46, 965–981.doi:10.1016/j.cortex.2009.07.004
Busigny, T., Van Belle, G., Jemel, B., Hosein, A., Joubert, S., &Rossion, B. (2014). Face-specific impairment in holistic percep-tion following focal lesion of the right anterior temporal lobe.Neuropsychologia, 56, 312–333. doi:http://dx.doi.org/10.1016/j.neuropsychologia.2014.01.018
Carey, S. (1992). Becoming a face expert [and Discussion].Philosophical Transactions of the Royal Society B: BiologicalSciences, 335(1273), 95–103; discussion 102–103. doi:10.1098/rstb.1992.0012
Dalrymple, K. A., & Palermo, R. (2016). Guidelines for studyingdevelopmental prosopagnosia in adults and children. Wiley
Interdisciplinary Reviews: Cognitive Science, 7, 73–87. doi:10.1002/wcs.1374
Davis, J. M., McKone, E., Dennett, H., O’Connor, K. L., O’Kearney, R.,& Palermo, R. (2011). Individual differences in the ability torecognise facial identity are associated with social anxiety.PLoS ONE, 6, e28800. doi:10.1371/journal.pone.0028800
De Haan, E. H. (1999). A familial factor in the development of facerecognition deficits. Journal of Clinical and ExperimentalNeuropsychology, 21(3), 312–315. doi:10.1076/jcen.21.3.312.917
de Heering, A., & Maurer, D. (2012). Face memory deficits inpatients deprived of early visual input by bilateral congenitalcataracts. Developmental Psychobiology, 21(3), 312–315.doi:10.1076/jcen.21.3.312.917
Delvenne, J.-F., Seron, X., Coyette, F., Rossion, B. (2004). Evidencefor perceptual deficits in associative visual (prosop)agnosia: Asingle-case study. Neuropsychologia, 42, 597–612. doi:http://dx.doi.org/10.1016/j.neuropsychologia.2003.10.008
Dennett, H. W., McKone, E., Tavashmi, R., Hall, A., Pidcock, M.,Edwards, M., & Duchaine, B. (2012). The Cambridge carmemory test: A task matched in format to the Cambridgeface memory test, with norms, reliability, sex differences, dis-sociations from face memory, and expertise effects. BehaviorResearch Methods, 44(2), 587–605. doi:10.3758/s13428-011-0160-2
Duchaine, B., Germine, L., & Nakayama, K. (2007). Family resem-blance: Ten family members with prosopagnosia andwithin-class object agnosia. Cognitive Neuropsychology, 24(4),419–430. doi:10.1080/02643290701380491
Duchaine, B., Murray, H., Turner, M., White, S., & Garrido, L. (2009).Normal social cognition in developmental prosopagnosia.Cognitive Neuropsychology, 26(7), 620–634. doi:10.1080/02643291003616145
Duchaine, B., & Nakayama, K. (2006). The Cambridge facememory test: Results for neurologically intact individualsand an investigation of its validity using inverted facestimuli and prosopagnosic participants. Neuropsychologia, 44(4), 576–585. doi:10.1016/j.neuropsychologia.2005.07.001
Duchaine, B. C., & Nakayama, K. (2004). Developmental prosopag-nosia and the Benton facial recognition test. Neurology, 62(7),1219–1220. doi:http://dx.doi.org/10.1212/01.WNL.0000118297.03161.B3
Ellis, H. D., & Florence, M. (1990). Bodamer’s (1947) paper on pro-sopagnosia. Cognitive Neuropsychology, 7(2), 81–105. doi:10.1080/02643299008253437
Gauthier, I., McGugin, R. W., Richler, J. J., Herzmann, G., Speegle,M. & VanGulick, A. E. (2014). Experience moderates overlapbetween object and face recognition, suggesting a commonability. Journal of Vision, 14, 7. doi: 10.1167/14.8.7
Grueter, M., Grueter, T., Bell, V., Horst, J., Laskowski, W., Sperling,K.,… Kennerknecht, I. (2007). Hereditary prosopagnosia: Thefirst case series. Cortex, 43(6), 734–749.
Halliday, D. W. R., MacDonald, S. W. S., Sherf, S. K., & Tanaka, J. W.(2014). A reciprocal model of face recognition and autistictraits: Evidence from an individual differences perspective.PLoS ONE, 9(5), e94013. doi:10.1371/journal.pone.0094013
Herzmann, G., Danthiir, V., Schacht, A., Sommer, W., & Wilhelm, O.(2008). Toward a comprehensive test battery for face cogni-tion: Assessment of the tasks. Behavior Research Methods, 40(3), 840–857. doi:10.3758/BRM.40.3.840
14 R. PALERMO ET AL.
Dow
nloa
ded
by [
UQ
Lib
rary
] at
16:
47 1
0 A
pril
2016
Johnston, R. A., & Edmonds, A. J. (2009). Familiar and unfamiliarface recognition: A review. Memory, 17(5), 577–596. doi:10.1080/09658210902976969
Kaplan, R. M., & Saccuzzo, D. P. (2001). Psychological testing:Principles, applications and issues (3rd ed.). California: Brooks/Cole Publishing Company.
Kennerknecht, I., Grueter, T., Welling, B., Wentzek, S., Horst, J.,Edwards, S., & Grueter, M. (2006). First report of prevalenceof non-syndromic hereditary prosopagnosia (HPA). AmericanJournal of Medical Genetics Part A, 140A(15), 1617–1622.doi:10.1002/ajmg.a.31343
Kennerknecht, I., Ho, N. Y., & Wong, V. C. (2008). Prevalence ofhereditary prosopagnosia (HPA) in Hong Kong Chinese popu-lation. American Journal of Medical Genetics Part A, 146A(22),2863–2870. doi:10.1002/ajmg.a.32552
Kessler, R. C., Berglund, P., Demler, O., Jin, R., Merikangas, K. R., &Walters, E. E. (2005). LIfetime prevalence and age-of-onset dis-tributions of dsm-iv disorders in the national comorbiditysurvey replication. Archives of General Psychiatry, 62(6), 593–602. doi:10.1001/archpsyc.62.6.593
Liu-Shuang, J., Torfs, K., & Rossion, B. (in press). An objective elec-trophysiological marker of face individualisation impairmentin acquired prosopagnosia with fast periodic visual stimu-lation. Neuropsychologia.
Mattick, R. P., & Clarke, J. C. (1998). Development and validationof measures of social phobia scrutiny fear and social inter-action anxiety. Behaviour Research and Therapy, 36(4), 455–470.
McGugin, R. W., Richler, J. J., Herzmann, G., Speegle, M., &Gauthier, I. (2012). The Vanderbilt expertise test revealsdomain-general and domain-specific sex effects in object rec-ognition. Vision Research, 69, 10–22. doi:http://dx.doi.org/10.1016/j.visres.2012.07.014
McKone, E., Hall, A., Pidcock, M., Palermo, R., Wilkinson, R. B.,Rivolta, D.,…O’Connor, K. B. (2011). Face ethnicity andmeasurement reliability affect face recognition performancein developmental prosopagnosia: Evidence from theCambridge face memory test-Australian. CognitiveNeuropsychology, 28(2), 109–146. doi:10.1080/02643294.2011.616880
McKone, E., & Palermo, R. (2010). A strong role for nature in facerecognition. Proceedings of the National Academy of SciencesUSA. doi:10.1073/pnas.1000567107
Palermo, R., & Duchaine, B. (2012). Introduction to this specialissue on developmental prosopagnosia. CognitiveNeuropsychology, 29(5–6), 349–353. doi:10.1080/02643294.2012.744740
Palermo, R., Rivolta, D., Wilson, C. E., & Jeffery, L. (2011). Adaptiveface space coding in congenital prosopagnosia: Typical figuralaftereffects but abnormal identity aftereffects.Neuropsychologia, 49(14), 3801–3812. doi:10.1016/j.neuropsychologia.2011.09.039
Palermo, R., Willis, M. L., Rivolta, D., McKone, E., Wilson, C. E., &Calder, A. J. (2011). Impaired holistic coding of facialexpression and facial identity in congenital prosopagnosia.Neuropsychologia, 49(5), 1226–1235. doi:10.1016/j.neuropsychologia.2011.02.021
Peters, L. (2000). Discriminant validity of the Social Phobia andAnxiety Inventory (SPAI), the Social Phobia Scale (SPS) andthe Social Interaction Anxiety Scale (SIAS). Behaviour
Research and Therapy, 38(9), 943–950. doi:http://dx.doi.org/10.1016/S0005-7967(99)00131-X
Raven, J.C. (2008) Standard progressive matrices: Plus version andmill hill vocabulary scale. San Antonio, TX: Pearson.
Rhodes, G., Jeffery, L., Taylor, L., & Ewing, L. (2013). Autistic traitsare linked to reduced adaptive coding of face identity andselectively poorer face recognition in men but not women.Neuropsychologia, 51(13), 2702–2708. doi:10.1016/j.neuropsychologia.2013.08.016
Rivolta, D., Palermo, R., & Schmalzl, L. (2013). What is overt andwhat is covert in congenital prosopagnosia?Neuropsychology Review, 23(2), 111–116. doi:10.1007/s11065-012-9223-0
Rossion, B., Caldara, R., Seghier, M., Schuller, A.-M., Lazeyras, F., &Mayer, E. (2003). A network of occipito-temporal face-sensi-tive areas besides the right middle fusiform gyrus is necessaryfor normal face processing. Brain Journal of Neurology, 126,2381–2395.
Rossion, B., Collins, D., Goffaux, V., & Curran, T. (2007). Long-term expertise with artificial objects increases visual compe-tition with early face categorization processes. Journal ofCognitive Neuroscience, 19(3), 543–555. doi:10.1162/jocn.2007.19.3.543
Rossion, B., & Curran, T. (2010). Visual expertise with pictures ofcars correlates with RT magnitude of the car inversioneffect. Perception, 39(2), 173–183. doi:10.1068/p6270
Rotshtein, P., Geng, J. J., Driver, J., & Dolan, R. J. (2007). Role of fea-tures and second-order spatial relations in face discrimination,face recognition, and individual face skills: behavioral andfunctional magnetic resonance imaging data. Journal ofCognitive Neuroscience, 19(9), 1435–1452. doi:10.1162/jocn.2007.19.9.1435
Russell, R., Duchaine, B. C., & Nakayama, K. (2009). Super-recogni-zers: People with extraordinary face recognition ability.Psychonomic Bulletin & Review, 16(2), 252–257. doi:10.3758/PBR.16.2.252
Shah, P., Gaule, A., Sowden, S., Bird, G., & Cook, R. (2015). The 20-item prosopagnosia index (PI20): A self-report instrument foridentifying developmental prosopagnosia. Royal Society OpenScience, 2(140343), 1–11.
Stollhoff, R., Jost, J., Elze, T., & Kennerknecht, I. (2011). Deficits inlong-term recognition memory reveal dissociated subtypes incongenital prosopagnosia. PLoS ONE, 6(1), e15702. doi:10.1371/journal.pone.0015702.g005
Susilo, T., & Duchaine, B. (2013). Advances in developmental pro-sopagnosia research. Current Opinion in Neurobiology, 1–7.doi:10.1016/j.conb.2012.12.011
Susilo, T., Germine, L., & Duchaine, B. (2013). Face recognitionability matures late: Evidence from individual differences inyoung adults. Journal of Experimental Psychology: HumanPerception and Performance, 39(5), 1212–1217. doi:10.1037/a0033469
Susilo, T., Yovel, G., Barton, J. J. S., & Duchaine, B. (2013). Face per-ception is category-specific: Evidence from normal body per-ception in acquired prosopagnosia. Cogniiton, 129(1), 88–94.doi:10.1016/j.cognition.2013.06.004
Thomas, C., Avidan, G., Humphreys, K., Jung, K.-j., Gao, F., &Behrmann, M. (2009). Reduced structural connectivity inventral visual cortex in congenital prosopagnosia. NatureNeuroscience, 12(1), 29–31. doi:10.1038/nn.2224
THE QUARTERLY JOURNAL OF EXPERIMENTAL PSYCHOLOGY 15
Dow
nloa
ded
by [
UQ
Lib
rary
] at
16:
47 1
0 A
pril
2016
Van Gulick, A. E., McGugin, R. W., & Gauthier, I. (in press).Measuring non-visual knowledge about object categories:The semantic Vanderbilt expertise test. Behavioral ResearchMethods.
Wilmer, J. B., Germine, L., Chabris, C. F., Chatterjee, G., Gerbasi, M.,& Nakayama, K. (2012). Capturing specific abilities as awindow into human individuality: The example of face recog-nition. Cognitive Neuropsychology, 29(5–6), 360–392. doi:10.1080/02643294.2012.753433
Wilmer, J. B., Germine, L., Chabris, C. F., Chatterjee, G., Williams,M., Loken, E.,… Duchaine, B. (2010). Human face recognition
ability is specific and highly heritable. Proceedings of theNational Academy of Sciences USA, 107(11), 5238–5241.doi:10.1073/pnas.0913053107
Yardley, L., McDermott, L., Pisarski, S., Duchaine, B., & Nakayama,K. (2008). Psychosocial consequences of developmental pro-sopagnosia: A problem of recognition. Journal ofPsychosomatic Research, 65(5), 445–451. doi:10.1016/j.jpsychores.2008.03.013
Zell, E., & Krizan, Z. (2014). Do people have insight into their abil-ities? A metasynthesis. Perspectives on Psychological Science, 9,111–125.
16 R. PALERMO ET AL.
Dow
nloa
ded
by [
UQ
Lib
rary
] at
16:
47 1
0 A
pril
2016
Related Documents