Astronomy & Astrophysics manuscript no. erwin-gadotti˙nsc-smbh˙nobibtex c ESO 2011 December 14, 2011 Do Nuclear Star Clusters and Supermassive Black Holes Follow the Same Host-Galaxy Correlations? ? Peter Erwin 1,2 and Dimitri Alexei Gadotti 3 1 Max-Planck-Institut f ¨ ur extraterrestrische Physik, Giessenbachstrasse, D-85748 Garching, Germany 2 Universit¨ ats-Sternwarte M¨ unchen, Scheinerstrasse 1, D-81679 M ¨ unchen, Germany 3 European Southern Observatory, Alonso de Cordova 3107, Vitacura, Casilla 19001, Santiago 19, Chile Received ¡date¿ / Accepted ¡date¿ ABSTRACT Studies have suggested that there is a strong correlation between the masses of nuclear star clusters (NSCs) and their host galaxies, a correlation which said to be an extension of the well-known correlations between supermassive black holes (SMBHs) and their host galaxies. But careful analysis of disk galaxies – including 2D bulge/disk/bar decompositions – shows that while SMBHs correlate with the stellar mass of the bulge component of galaxies, the masses of NSCs correlate much better with the total galaxy stellar mass. In addition, the mass ratio M NSC /M ?, tot for NSCs in spirals (at least those with Hubble types Sc and later) is typically an order of magnitude smaller than the mass ratio M BH /M ?, bul of SMBHs. The absence of a universal “central massive object” correlation argues against common formation and growth mechanisms for both SMBHs and NSCs. We also discuss evidence for a break in the NSC–host galaxy correlation: galaxies with Hubble types earlier than Sbc appear to host systematically more massive NSCs than do types Sc and later. Key words. galaxies: structure – galaxies: elliptical and lenticular, cD – galaxies: spiral – galaxies: kinematics and dynamics 1. Introduction As far as we can tell, all massive galaxies in the local universe harbor supermassive black holes (SMBHs, with masses M BH ∼ 10 6 – 10 9 M ). The masses of these SMBHs correlate strongly with several global properties of the host galaxies, particularly with the central velocity dispersion σ 0 [1, 2] and with the bulge luminosity or mass [e.g., 3, 4]. These correlations imply that the processes which drive galaxy growth and the processes which drive black hole growth are intimately linked – perhaps even the same processes. It is now also clear that many galaxies, particularly later-type spirals, host luminous nuclear star clusters [NSCs; e.g., 5, 6], with masses in the range 10 5 –10 8 M ; see the review by B¨ oker [7] for more details. Recently, several authors have argued that NSCs and central SMBHs have the same host-galaxy correlations: in particular, that SMBHs and NSCs have the same correlation with bulge luminosity and mass [8, 9, 10, 11] (but see Balcells et al. [12]). The suggestion, then, is that NSCs and SMBHs are in a sense members of the same family of “Central Massive Objects” (CMOs), and thus that they may have grown via the same mechanisms [e.g., 13, 14, 15, 16]. We argue, however, that one should be cautious about assuming that NSCs and SMBHs are really part of the same family, with the same host-galaxy relationships. To begin with, the samples of Wehner and Harris [8] and Ferrarese et al. [9], which were used to make the CMO argument, were almost entirely early-type galaxies – mostly ellipticals and dwarf ellipticals. These are galaxies which are, in essence, “pure bulge” systems, so one could just as easily argue for a correlation with total galaxy mass. But we know that SMBHs in disk galaxies correlate better with just the bulge, and not with the total galaxy mass or light [e.g., 17, 18]. Given that there have been previous claims that NSCs in spiral galaxies correlate with the total galaxy light [e.g., 19], we are prompted the ask the question: do nuclear clusters in disk galaxies correlate with the bulge (like SMBHs), or with the whole galaxy? 2. Samples, Methodology, and Data Sources Although current studies suggest that the M BH -σ 0 relation is tighter and has less intrinsic scatter than the M BH - M ?, bul relation [e.g., 20], velocity dispersion is not the ideal host-galaxy measure to use here, for three reasons. First, most of the best-determined NSC masses are based directly on the measured velocity dispersion of the NSC [e.g., 21], which is often indistinguishable from that of the surrounding bulge; this means a (spurious) correlation between NSC mass and central velocity dispersion is only to be expected. Second, some NSCs are found in galaxies with no detectable bulge at all (see discussion in Section 3). Finally, it is difficult to see how one should discriminate between a velocity dispersion due to the bulge versus one due to the whole galaxy. But discriminating between bulge and whole-galaxy luminosities and masses is much simpler. So we choose instead to compare NSCs and their host galaxies with the M BH - M ?, bul relation, which means comparing NSC masses with the stellar masses of host galaxies and their bulges. ? To appear in Advances in Astronomy special issue: “Seeking for the Leading Actor on the Cosmic Stage: Galaxies versus Supermassive Black Holes” 1 arXiv:1112.2740v1 [astro-ph.CO] 12 Dec 2011

Welcome message from author
This document is posted to help you gain knowledge. Please leave a comment to let me know what you think about it! Share it to your friends and learn new things together.
Transcript

Astronomy & Astrophysics manuscript no. erwin-gadotti˙nsc-smbh˙nobibtex c© ESO 2011December 14, 2011
Do Nuclear Star Clusters and Supermassive Black Holes Followthe Same Host-Galaxy Correlations??
Peter Erwin1,2 and Dimitri Alexei Gadotti3
1 Max-Planck-Institut fur extraterrestrische Physik, Giessenbachstrasse, D-85748 Garching, Germany2 Universitats-Sternwarte Munchen, Scheinerstrasse 1, D-81679 Munchen, Germany3 European Southern Observatory, Alonso de Cordova 3107, Vitacura, Casilla 19001, Santiago 19, Chile
Received ¡date¿ / Accepted ¡date¿
ABSTRACT
Studies have suggested that there is a strong correlation between the masses of nuclear star clusters (NSCs) and their host galaxies, acorrelation which said to be an extension of the well-known correlations between supermassive black holes (SMBHs) and their hostgalaxies. But careful analysis of disk galaxies – including 2D bulge/disk/bar decompositions – shows that while SMBHs correlatewith the stellar mass of the bulge component of galaxies, the masses of NSCs correlate much better with the total galaxy stellar mass.In addition, the mass ratio MNSC/M?, tot for NSCs in spirals (at least those with Hubble types Sc and later) is typically an order ofmagnitude smaller than the mass ratio MBH/M?, bul of SMBHs. The absence of a universal “central massive object” correlation arguesagainst common formation and growth mechanisms for both SMBHs and NSCs. We also discuss evidence for a break in the NSC–hostgalaxy correlation: galaxies with Hubble types earlier than Sbc appear to host systematically more massive NSCs than do types Scand later.
Key words. galaxies: structure – galaxies: elliptical and lenticular, cD – galaxies: spiral – galaxies: kinematics and dynamics
1. Introduction
As far as we can tell, all massive galaxies in the local universe harbor supermassive black holes (SMBHs, with masses MBH ∼ 106–109M�). The masses of these SMBHs correlate strongly with several global properties of the host galaxies, particularly with thecentral velocity dispersion σ0 [1, 2] and with the bulge luminosity or mass [e.g., 3, 4]. These correlations imply that the processeswhich drive galaxy growth and the processes which drive black hole growth are intimately linked – perhaps even the same processes.
It is now also clear that many galaxies, particularly later-type spirals, host luminous nuclear star clusters [NSCs; e.g., 5, 6], withmasses in the range 105–108M�; see the review by Boker [7] for more details. Recently, several authors have argued that NSCsand central SMBHs have the same host-galaxy correlations: in particular, that SMBHs and NSCs have the same correlation withbulge luminosity and mass [8, 9, 10, 11] (but see Balcells et al. [12]). The suggestion, then, is that NSCs and SMBHs are in a sensemembers of the same family of “Central Massive Objects” (CMOs), and thus that they may have grown via the same mechanisms[e.g., 13, 14, 15, 16].
We argue, however, that one should be cautious about assuming that NSCs and SMBHs are really part of the same family, withthe same host-galaxy relationships. To begin with, the samples of Wehner and Harris [8] and Ferrarese et al. [9], which were usedto make the CMO argument, were almost entirely early-type galaxies – mostly ellipticals and dwarf ellipticals. These are galaxieswhich are, in essence, “pure bulge” systems, so one could just as easily argue for a correlation with total galaxy mass. But we knowthat SMBHs in disk galaxies correlate better with just the bulge, and not with the total galaxy mass or light [e.g., 17, 18]. Given thatthere have been previous claims that NSCs in spiral galaxies correlate with the total galaxy light [e.g., 19], we are prompted the askthe question: do nuclear clusters in disk galaxies correlate with the bulge (like SMBHs), or with the whole galaxy?
2. Samples, Methodology, and Data Sources
Although current studies suggest that the MBH-σ0 relation is tighter and has less intrinsic scatter than the MBH-M?, bul relation [e.g.,20], velocity dispersion is not the ideal host-galaxy measure to use here, for three reasons. First, most of the best-determined NSCmasses are based directly on the measured velocity dispersion of the NSC [e.g., 21], which is often indistinguishable from that ofthe surrounding bulge; this means a (spurious) correlation between NSC mass and central velocity dispersion is only to be expected.Second, some NSCs are found in galaxies with no detectable bulge at all (see discussion in Section 3). Finally, it is difficult to seehow one should discriminate between a velocity dispersion due to the bulge versus one due to the whole galaxy. But discriminatingbetween bulge and whole-galaxy luminosities and masses is much simpler. So we choose instead to compare NSCs and their hostgalaxies with the MBH-M?, bul relation, which means comparing NSC masses with the stellar masses of host galaxies and theirbulges.
? To appear in Advances in Astronomy special issue: “Seeking for the Leading Actor on the Cosmic Stage: Galaxies versus Supermassive BlackHoles”
1
arX
iv:1
112.
2740
v1 [
astr
o-ph
.CO
] 1
2 D
ec 2
011

Peter Erwin and Dimitri Alexei Gadotti: NSCs and SMBHs: Galaxy Correlations
For NSCs, we emphasize galaxies where the NSC masses have been dynamically measured, since this is the most direct analogto well-determined SMBH masses (i.e., those with direct dynamical mass measurements from stellar, gas, or maser kinematics,where the SMBH sphere of influence is resolved). In addition, dynamical measurements avoid possible problems with multiplestellar populations; the latter can potentially bias stellar masses estimated from broad band colors. Spectroscopic studies [22, 11]have shown that NSCs often contain multiple stellar populations; this renders mass estimates based on Single Stellar Population(SSP) models [e.g., those used by 9] somewhat uncertain. The NSCs we focus on are taken primarily from the sample of Walcheret al. [21], with additional data from Ho and Filippenko [23], Boker et al. [24], Kormendy and Bender [25], Matthews et al. [26]and Gebhardt et al. [27], Barth et al. [28], Seth et al. [29], and Kormendy et al. [30]; we use the estimate of Launhardt et al. [31]for the Milky Way’s NSC. This gives us a total of 18 galaxies with dynamically determined NSC masses. These cover Hubbletypes S0–Sm, but the sample is in fact heavily biased towards later types: over three-quarters are Hubble types Scd or later. As anadditional, secondary sample, we include 15 galaxies from Rossa et al. [11], where the masses are estimated by fits of multipleSSP models to high-resolution spectroscopy. Most of these galaxies are Sc and later, but a few earlier-type spirals (Sa–Sb) are alsoincluded.
Total stellar masses are based on K-band total magnitudes from 2MASS [32] or from Malhotra et al. [33] for M31 and M33(which are too large for accurate sky subtraction of 2MASS images), combined with color-based mass-to-light (M/L) ratios fromBell et al. [34]. For the latter we use optical colors from the literature (primarily from HyperLeda1) or from direct measurementson Sloan Digital Sky Survey [SDSS, 35] images. The bulge masses are derived using bulge-to-total (B/T ) values determinedindividually for each galaxy by 2D image decomposition, using the BUDDA software package [36, 37], which incorporates bulgeand disk components and optional bars and central point sources (the latter can be used for both nuclear star clusters and AGN).Note that we explicitly define “bulge” to be the “photometric bulge” – that is, the excess light (and stellar mass) which is not part ofthe disk, bar, or nuclear star cluster. We defer questions of how SMBH (or nuclear cluster) mass relates to so-called “pseudobulges”versus “classical bulges” [e.g., 38, 39] to a later analysis.
Full 2D decompositions, as described above, were used for all S0 and spiral SMBH host galaxies. For the NSC host galaxies,we follow the same approach, with one simplification. Since we have found that B/T ratios for unbarred galaxies do not changedramatically if we use 1-D surface-brightness profile decompositions instead of 2D image decompositions, we use the former forgenuinely unbarred galaxies; we are careful to exclude (or separately model) the NSC contribution to the surface-brightness profilein these cases. Galaxies which do possess bars are subjected to full 2D decompositions; see the following section for details.
2.1. Bulge-Disk Decompositions
As noted previously, we use 2D image decompositions via the BUDDA software package to determine the B/T ratios, and thusthe bulge stellar masses, for SMBH host galaxies and for barred NSC host galaxies. For the NSC galaxies, we use HST datawherever possible, to enable the NSC itself to be properly modeled as a separate source. However, we have found that when theNSC is sufficiently luminous, and when the bulge is sufficiently low-contrast, we can achieve reasonable decompositions withground-based images; these are sometimes preferable if they are near-IR (to minimize the effects of dust extinction and recent starformation) and/or large enough to include the entire galaxy (to allow better recovery of the disk component).
We have completed decompositions for the galaxies with dynamically determined NSC masses (we use the published 2D decom-position of [28] for NGC 3621); in the special case of the Milky Way, we assume a bulge mass of ∼ 1.0× 10¹⁰M� and a total stellarmass of 5.5×10¹⁰M�, based on arguments in Dehnen and Binney [40], Klypin et al. [41], and Flynn et al. [42]. Decompositions forthe spectroscopic sample are still in progress, but are mostly complete; since our primary analysis (e.g., computing the MNSC-M?, bulrelation) is based on the dynamical masses, the incompleteness of the spectroscopic sample does not affect our results.
Full details of the individual decompositions will be published elsewhere (Erwin & Gadotti 2012a, in prep.). An example ofone of the 2D decompositions is given in Figure 1 for the galaxy NGC 7418, where we fit an H-band image from the Ohio StateUniversity Bright Spiral Galaxy Survey [43, OSU BSGS] using an exponential disk (95.6% of the light), a Sersic bulge (1.6% ofthe light), a bar (2.4% of the light), and a point source for the NSC (0.5% of the light).2 This illustrates the importance of includinga separate bar component in the decomposition when the galaxy is barred: the bar has almost twice the luminosity of the bulge, andwithout it, the bulge luminosity (and stellar mass) would certainly be overestimated. In fact, a 1-D decomposition for this galaxygives a B/T value almost twice as large (0.030); similar results were found for four other barred galaxies in the sample, with meanB/T values a factor of 2.1 times larger when the bar was omitted [see also 37].
3. Comparing Black Holes and Nuclear Star Clusters
Although black-hole–bulge correlations are sometimes described as correlations between the black hole mass and the host galaxymass (or luminosity as a proxy for mass), this is really only true for elliptical galaxies, where the entire galaxy is the “bulge”.Kormendy and Gebhardt [17] explicitly compared B-band total and bulge luminosities for SMBH hosts and showed that the latterprovided a much better correlation. Most recently, Kormendy et al. [18] showed for a larger, updated sample that SMBH masses indisk galaxies correlated much better with (classical) bulge K-band luminosity than with the luminosity of the disk component; thisnaturally suggests that total-galaxy luminosity is unlikely to correlate well with SMBH mass when the galaxy is disk-dominated.
In Figure 2, we compare SMBH masses with total galaxy stellar mass (left panel) and with bulge stellar mass (right panel), basedon our careful bulge/disk/bar decompositions (see Table A.1). Error bars include the effects of uncertainties in the distance and in the
1 http://leda.univ-lyon1.fr2 In this particular galaxy, the disk appears to be truncated, but this has little effect on the decomposition; including a broken-exponential profile
for the disk changes the B/T ratio from 0.016 to 0.017.
2

Peter Erwin and Dimitri Alexei Gadotti: NSCs and SMBHs: Galaxy Correlations
0 20 40 60 80 100 120 140r (arcsec)
-8
-6
-4
-2
0
µ (
mag
arc
sec-2
)
databulge
bardiskNSCmodel
1 10 100r (arcsec)
-8
-6
-4
-2
0
µ (
mag
arc
sec-2
)
databulge
bardiskNSCmodel
Fig. 1. An example of one of our 2D decompositions of NSC host galaxies – in this instance, the decomposition of the OSU BSGSH-band image of NGC 7418, using an exponential disk, a Sersic bulge (n = 1.5), a bar, and a point source for the NSC. Upperleft: Original H-band image, with masking of bright stars (logarithmic brightness scaling). Upper right: Residual image aftersubtracting best-fitting model image. Lower left: Major-axis profile (black) along with the components of the model and their sum(purple). Lower right: Same, but plotted with logarithmic major-axis scaling.
M/L and B/T ratios. As expected, the correlation between SMBH mass and bulge mass is much stronger than any correlation withtotal galaxy mass: the Spearman correlation coefficients are rS = 0.71 for the MBH-M?, bul relation, versus 0.29 for the MBH-M?, totrelation, with the latter correlation not being statistically significant.
We also plot linear fits of log MBH as a function of log M?, bul; these fits are made using galaxies with well-determined distances(filled points) to minimize distance-based uncertainties, using the Bayesian-based approach of D’Agostini [44], which explicitlyincorporates errors in both variables and intrinsic scatter in the black hole mass [see also 45, 46]. By “well-determined distances” wemean those determined using direct methods such as surface-brightness fluctuations and Cepheid stars, or redshift-based distanceswhere z > 0.01 (to avoid large relative uncertainties due to peculiar motions.) The best-fitting relation for the whole sample (blackline; the fit to just the elliptical galaxies, shown by the red line, is almost identical) is:
log MBH = 8.46 ± 0.08 + (1.04 ± 0.12) log(M?, bul/1011M�), (1)
with intrinsic scatter in SMBH mass of 0.39 ± 0.05 dex; the best-fitting relation for the bulges of disk galaxies only (blue line) is
log MBH = 8.68 ± 0.20 + (1.27 ± 0.26) log(M?, bul/1011M�), (2)
with instrinsic scatter = 0.41 ± 0.07. (The errors are based on bootstrap resampling.)We apply exactly the same methodology to NSC-host galaxies in Figure 3, plotting NSC mass versus total galaxy stellar mass in
the left panel and versus bulge stellar mass in the right panel. Since several of the NSC host galaxies are genuinely bulgeless systems(without even a distinct “pseudobulge”), we plot their bulge masses as upper limits (B/T < 0.001M?, tot). As the figure shows, NSCmass clearly correlates better with total stellar mass than it does with bulge mass. (The respective correlation coefficients are
3

Peter Erwin and Dimitri Alexei Gadotti: NSCs and SMBHs: Galaxy Correlations
Fig. 2. Left: SMBH mass (red = elliptical galaxies, blue = disk galaxies) versus total galaxy stellar mass. Right: SMBH mass versusbulge stellar mass. (Data and sources in Table A.1.) The diagonal dashed lines are the best fits to the MBH-M?, bul relation for thewhole sample (black), for the elliptical galaxies (red), and for bulges of the disk galaxies (blue). Open symbols are galaxies withoutprecise distances, which are not used in the fits. It is clear that the SMBH masses of S0 and spiral galaxies (blue) correlate betterwith the bulge stellar mass than with total galaxy mass.
rS = 0.76 versus 0.38; the bulge-mass correlation is not statistically significant.) Fitting NSC mass versus total stellar mass, usingthe same methodology as for the SMBH fits, gives the following relation:
log MNSC = 7.65 ± 0.23 + (0.90 ± 0.21) log(M?, tot/1011M�), (3)
with intrinsic scatter = 0.43± 0.10 dex. Note that the slope is formally indistinguishable from unity: i.e., the MNSC/M?, tot ratio doesnot appear to depend on M?, tot itself.
It is important to note that the difference in correlation coefficients actually underestimates the true difference between thetwo relations, because the MNSC-M?, bul correlation was computed assuming that bulgeless spirals still have nominal bulges (usingB/T = 0.001). In the combined sample of dynamical and spectroscopic NSC masses, we can identify at least three galaxies whichhave no detectable bulge. In two of these (NGC 1493 and NGC 2139), our 2D decomposition assigned stellar light to a bar inaddition to a pure exponential disk; in 1D decompositions (or simple bulge+disk 2D decompositions), light from the bar might be(wrongly, we would argue) interpreted as “bulge” light. For the other galaxy (NGC 300), however, there is no ambiguity: this is anunbarred spiral galaxy with a surface brightness profile consisting of only an exponential disk and the NSC [see, e.g., Figure 8 of47].
The existence of nuclear star clusters in genuinely bulgeless spirals is simply an additional, direct confirmation of our basicconclusion: nuclear star cluster masses scale with the total stellar mass of their host galaxies, not with the bulge mass. This meansthat NSCs and SMBHs do not follow a common host-galaxy correlation.
We have also investigated whether other galaxy parameters might correlate with NSC mass, or even with residuals from theMNSC-M?, tot relation. In particular, we have compared NSC mass with rotation velocity and with total baryonic mass (stellar massplus atomic gas from H i measurements). In both cases, correlations exist, but they are not as strong as the correlation with totalstellar mass. No particular correlations with residuals of the MNSC-M?, tot relation are seen.
4. Trends with Hubble Type
Closer inspection of the left-hand panel of Figure 3 suggests that the spectroscopic masses (black diamonds) tend to be offset fromthe NSC-M?, tot relation, in the sense that they have larger NSC masses for the same total stellar mass. This could, in principle, beevidence of a systematic overestimation of NSC masses in the spectroscopic sample, but of the four galaxies in common betweenWalcher et al. [21] and Rossa et al. [11] only one has a (slightly) higher spectroscopic mass, while the other three have spectroscopicmasses slightly lower than the dynamical masses. There is, however, another difference to consider: the spectroscopic sample tendsto have earlier Hubble types.
This brings us to something which Seth et al. [48] pointed out several years ago, using a larger dataset of NSCs and host galaxies,with NSC masses based (mostly) on colors or assumed M/L ratios. They noted that NSCs in late-type spirals tended to have lowerrelative masses (MNSC/M?, tot) than early-type spirals and ellipticals.3 Figure 4 makes this explicit by plotting MNSC/M?, tot versusHubble type for the galaxies in Seth et al.’s compilation, plus seven galaxies from our updated dynamical-mass sample which werenot in their sample. We have also added galaxy stellar-mass estimates for 16 galaxies that did not have masses in Seth et al., using
3 Rossa et al. [11] pointed out a similar trend in absolute NSC mass for their smaller sample of NSCs in early- and late-type spirals.
4

Peter Erwin and Dimitri Alexei Gadotti: NSCs and SMBHs: Galaxy Correlations
Fig. 3. As for Figure 2, but now plotting NSC mass versus total stellar mass (left) and bulge stellar mass (right). (Data and sourcesin Table A.2.) Green circles are galaxies with dynamical mass estimates for their NSCs; black diamonds are the spectroscopicallyestimated masses of Rossa et al. [11] (bulge mass estimates are not complete for these galaxies). Filled symbols indicate galaxieswith direct distance measurements (e.g., from Cepheid stars). Arrows show nominal upper limits for three bulgeless spirals (assum-ing B/T ≤ 0.001). The diagonal black line is a fit of NSC mass to total stellar mass for the dynamical-mass sample (green circles);for comparison, the diagonal dashed red and blue lines are the MBH-M?, bul fits for ellipticals (red) and disk galaxies (blue) fromFigure 2. The situation is now the reverse of that for SMBHs: NSC masses clearly correlate better with total galaxy mass than theydo with bulge mass.
total K-band magnitudes from 2MASS and either B − V colors from HyperLeda or measured g − r colors from SDSS images toderive the K-band M/L via Bell et al. [34].
What is curious about Figure 4 is not just that the MNSC/M?, tot ratio depends on Hubble type, but that it actually appears do so ina bimodal fashion: Hubble types Sb and earlier have relatively large NSC masses, while Sc and later-type galaxies have significantlysmaller relative NSC masses. Plotted on top of the figure are simple fits of a function where the the MNSC/M?, tot ratio can take twoconstant values, one for Hubble types T < T1 and the other for T > T2, with a simple linear transition between T1 and T2. Fitsto just the dynamical + spectroscopic masses (red dashed line) and to the entire sample (gray dashed line) are similar, indicatingthat Sb and earlier Hubble types form one class, with < MNSC/M?, tot >∼ 0.002, and Sc and later types form a different group, with< MNSC/M?, tot > almost an order of magnitude smaller (∼ 0.0003). The corresponding best-fit values of (T1,T2) are (3.51,4.05) forthe dynamical + spectroscopic masses and (3.10,5.01) for the complete sample. As a crude check on whether this split is statisticallysignificant, we performed Kolmogorov-Smirnov tests on the values of MNSC/M?, tot for galaxies with T ≤ 3 and galaxies with T ≥ 5.The K-S test gives a probability PKS = 0.0038 for the two sets of ratios coming from the same parent population if we use only thedynamical + spectroscopic masses, or PKS = 3.1 × 10⁻¹⁰ if we use the entire set of NSC masses.
Do NSCs in late-type spirals differ from those in early-type spirals, S0s, and ellipticals in any sense other than average mass?The available evidence is ambiguous. Boker [7] notes that NSC sizes appear to be independent of Hubble type. On the other hand,Rossa et al. [11] compared stellar populations of NSCs in early- and late-type spirals using fits to their spectroscopy and noted thatthe NSCs in late-type spirals did tend to have younger stellar populations and (slightly) lower metallicities. (They also argued againstany observational effects that might produce systematic overestimates of NSC mass in early spirals.) This does at least suggest thatdifferent star-formation histories may lie behind the mass differences in NSCs.
We also plot the MBH/M?, bul ratio for SMBH host galaxies (thick gray dotted line in Figure 4, based on Equation 1). What thisindicates is that the NSC–host galaxy relationship for Sb and earlier types is consistent with the SMBH relation, if all of the galaxymass is in the bulge. Since most of the galaxies used for the original CMO studies [8, 9] were dwarf and giant ellipticals (or S0galaxies with high B/T ratios), it is easy to see why the “NSC = SMBH” connection could be made. But this is clearly true only forvery bulge-dominated systems.
Acknowledgements. We would like to thank Eva Noyola and Anil Seth for useful and interesting conversations, along with comments from two referees whichimproved the manuscript. We would also like to thank the organizers of the 2008 “Nuclear Star Clusters across the Hubble Sequence” workshop in Heidelberg andthe 2010 “ESO Workshop on Central Massive Objects” in Garching for helping motivate and inspire this research. This work was supported by Priority Programme1177 (“Witnesses of Cosmic History: Formation and evolution of black holes, galaxies and their environment”) of the Deutsche Forschungsgemeinschaft.
This work made use of data from the Ohio State University Bright Spiral Galaxy Survey, which was funded by grants AST-9217716 and AST-9617006 fromthe United States National Science Foundation, with additional support from Ohio State University. It is also based on observations made with the NASA/ESAHubble Space Telescope, obtained from the data archive at the Space Telescope Science Institute. STScI is operated by the Association of Universities for Researchin Astronomy, Inc. under NASA contract NAS 5-26555.
Funding for the creation and distribution of the SDSS Archive has been provided by the Alfred P. Sloan Foundation, the Participating Institutions, the NationalAeronautics and Space Administration, the National Science Foundation, the U.S. Department of Energy, the Japanese Monbukagakusho, and the Max PlanckSociety. The SDSS Web site is http://www.sdss.org/.
5

Peter Erwin and Dimitri Alexei Gadotti: NSCs and SMBHs: Galaxy Correlations
6 4 2 0 2 4 6 8 10Hubble Type T
5.0
4.5
4.0
3.5
3.0
2.5
2.0
1.5
1.0
log
(MN
SC/M
,tot)
Fig. 4. Relative masses of NSCs versus Hubble type of host galaxy, based on the compilation of Seth et al. [48]. Filled graycircles are NSC masses estimated from broadband colors or assumed M/L ratios by Seth et al. [48]; red stars indicate NSC massesfrom spectroscopic (hollow) or dynamical (filled) measurements (see Table A.2 for references). Also shown are simple fits to thedynamical+spectroscopic masses (dashed red line) and to the entire sample (dashed gray line), along with the mean mass ratio ofSMBHs relative to their host bulges (dotted gray line).
The SDSS is managed by the Astrophysical Research Consortium (ARC) for the Participating Institutions. The Participating Institutions are The Universityof Chicago, Fermilab, the Institute for Advanced Study, the Japan Participation Group, The Johns Hopkins University, the Korean Scientist Group, Los AlamosNational Laboratory, the Max-Planck-Institute for Astronomy (MPIA), the Max-Planck-Institute for Astrophysics (MPA), New Mexico State University, Universityof Pittsburgh, University of Portsmouth, Princeton University, the United States Naval Observatory, and the University of Washington.
Finally, this research made use of the Lyon-Meudon Extragalactic Database (LEDA; part of HyperLeda at http://leda.univ-lyon1.fr/), and the NASA/IPACExtragalactic Database (NED), which is operated by the Jet Propulsion Laboratory, California Institute of Technology, under contract with the National Aeronauticsand Space Administration.
References[1] L. Ferrarese and D. Merritt. A Fundamental Relation between Supermassive Black Holes and Their Host Galaxies. ApJ, 539:L9–L12, August 2000.[2] K. Gebhardt, R. Bender, G. Bower, A. Dressler, S. M. Faber, A. V. Filippenko, R. Green, C. Grillmair, L. C. Ho, J. Kormendy, T. R. Lauer, J. Magorrian,J. Pinkney, D. Richstone, and S. Tremaine. A Relationship between Nuclear Black Hole Mass and Galaxy Velocity Dispersion. ApJ, 539:L13–L16, August 2000.[3] A. Marconi and L. K. Hunt. The Relation between Black Hole Mass, Bulge Mass, and Near-Infrared Luminosity. ApJ, 589:L21–L24, May 2003.[4] N. Haring and H.-W. Rix. On the Black Hole Mass-Bulge Mass Relation. ApJ, 604:L89–L92, April 2004.[5] C. M. Carollo, M. Stiavelli, P. T. de Zeeuw, and J. Mack. Spiral Galaxies with WFPC2.I.Nuclear Morphology, Bulges, Star Clusters, and Surface BrightnessProfiles. AJ, 114:2366–+, December 1997.[6] T. Boker, S. Laine, R. P. van der Marel, M. Sarzi, H.-W. Rix, L. C. Ho, and J. C. Shields. A Hubble Space Telescope Census of Nuclear Star Clusters inLate-Type Spiral Galaxies. I. Observations and Image Analysis. AJ, 123:1389–1410, March 2002.[7] T. Boker. Properties of nuclear star clusters. Journal of Physics Conference Series, 131(1):012043–+, October 2008.[8] E. H. Wehner and W. E. Harris. From Supermassive Black Holes to Dwarf Elliptical Nuclei: A Mass Continuum. ApJ, 644:L17–L20, June 2006.[9] L. Ferrarese, P. Cote, E. Dalla Bonta, E. W. Peng, D. Merritt, A. Jordan, J. P. Blakeslee, M. Hasegan, S. Mei, S. Piatek, J. L. Tonry, and M. J. West. AFundamental Relation between Compact Stellar Nuclei, Supermassive Black Holes, and Their Host Galaxies. ApJL, 644:L21–L24, June 2006.[10] P. Cote, S. Piatek, L. Ferrarese, A. Jordan, D. Merritt, E. W. Peng, M. Hasegan, J. P. Blakeslee, S. Mei, M. J. West, M. Milosavljevic, and J. L. Tonry. TheACS Virgo Cluster Survey. VIII. The Nuclei of Early-Type Galaxies. ApJS, 165:57–94, July 2006.
6

Peter Erwin and Dimitri Alexei Gadotti: NSCs and SMBHs: Galaxy Correlations
[11] J. Rossa, R. P. van der Marel, T. Boker, J. Gerssen, L. C. Ho, H.-W. Rix, J. C. Shields, and C.-J. Walcher. Hubble Space Telescope STIS Spectra of NuclearStar Clusters in Spiral Galaxies: Dependence of Age and Mass on Hubble Type. AJ, 132:1074–1099, September 2006.[12] M. Balcells, A. W. Graham, and R. F. Peletier. Galactic Bulges from Hubble Space Telescope NICMOS Observations: Central Galaxian Objects, and NuclearProfile Slopes. ApJ, 665:1084–1103, August 2007.[13] D. E. McLaughlin, A. R. King, and S. Nayakshin. The M-σ Relation for Nucleated Galaxies. ApJ, 650:L37–L40, October 2006.[14] Y. Li, Z. Haiman, and M.-M. Mac Low. Correlations between Central Massive Objects and Their Host Galaxies: From Bulgeless Spirals to Ellipticals. ApJ,663:61–70, July 2007.[15] S. Nayakshin, M. I. Wilkinson, and A. King. Competitive feedback in galaxy formation. MNRAS, 398:L54–L57, September 2009.[16] B. Devecchi, M. Volonteri, M. Colpi, and F. Haardt. High-redshift formation and evolution of central massive objects - I. Model description. MNRAS, 409:1057–1067, December 2010.[17] J. Kormendy and K. Gebhardt. Supermassive black holes in galactic nuclei. In J. C. Wheeler & H. Martel, editor, 20th Texas Symposium on relativisticastrophysics, volume 586 of American Institute of Physics Conference Series, pages 363–381, October 2001.[18] J. Kormendy, R. Bender, and M. E. Cornell. Supermassive black holes do not correlate with galaxy disks or pseudobulges. Nature, 469:374–376, January2011.[19] C. M. Carollo, M. Stiavelli, and J. Mack. Spiral Galaxies with WFPC2. II. The Nuclear Properties of 40 Objects. AJ, 116:68–84, July 1998.[20] K. Gultekin, D. O. Richstone, K. Gebhardt, T. R. Lauer, S. Tremaine, M. C. Aller, R. Bender, A. Dressler, S. M. Faber, A. V. Filippenko, R. Green, L. C. Ho,J. Kormendy, J. Magorrian, J. Pinkney, and C. Siopis. The M-σ and M-L Relations in Galactic Bulges, and Determinations of Their Intrinsic Scatter. ApJ, 698:198–221, June 2009.[21] C. J. Walcher, R. P. van der Marel, D. McLaughlin, H.-W. Rix, T. Boker, N. Haring, L. C. Ho, M. Sarzi, and J. C. Shields. Masses of Star Clusters in theNuclei of Bulgeless Spiral Galaxies. ApJ, 618:237–246, January 2005.[22] A. C. Seth, J. J. Dalcanton, P. W. Hodge, and V. P. Debattista. Clues to Nuclear Star Cluster Formation from Edge-on Spirals. AJ, 132:2539–2555, December2006.[23] L. C. Ho and A. V. Filippenko. High-Dispersion Spectroscopy of a Luminous, Young Star Cluster in NGC 1705: Further Evidence for Present-Day Formationof Globular Clusters. ApJ, 472:600–610, December 1996.[24] T. Boker, R. P. van der Marel, and W. D. Vacca. CO Band Head Spectroscopy of IC 342: Mass and Age of the Nuclear Star Cluster. AJ, 118:831–842, August1999.[25] J. Kormendy and R. Bender. The Double Nucleus and Central Black Hole of M31. ApJ, 522:772–792, September 1999.[26] L. D. Matthews, J. S. Gallagher, III, J. E. Krist, A. M. Watson, C. J. Burrows, R. E. Griffiths, J. J. Hester, J. T. Trauger, G. E. Ballester, J. T. Clarke, D. Crisp,R. W. Evans, J. G. Hoessel, J. A. Holtzman, J. R. Mould, P. A. Scowen, K. R. Stapelfeldt, and J. A. Westphal. WFPC2 Observations of Compact Star ClusterNuclei in Low-Luminosity Spiral Galaxies. AJ, 118:208–235, July 1999.[27] K. Gebhardt, T. R. Lauer, J. Kormendy, J. Pinkney, G. A. Bower, R. Green, T. Gull, J. B. Hutchings, M. E. Kaiser, C. H. Nelson, D. Richstone, and D. Weistrop.M33: A Galaxy with No Supermassive Black Hole. AJ, 122:2469–2476, November 2001.[28] A. J. Barth, L. E. Strigari, M. C. Bentz, J. E. Greene, and L. C. Ho. Dynamical Constraints on the Masses of the Nuclear Star Cluster and Black Hole in theLate-Type Spiral Galaxy NGC 3621. ApJ, 690:1031–1044, January 2009.[29] A. C. Seth, M. Cappellari, N. Neumayer, N. Caldwell, N. Bastian, K. Olsen, R. D. Blum, V. P. Debattista, R. McDermid, T. Puzia, and A. Stephens. The NGC404 Nucleus: Star Cluster and Possible Intermediate-mass Black Hole. ApJ, 714:713–731, May 2010.[30] J. Kormendy, N. Drory, R. Bender, and M. E. Cornell. Bulgeless Giant Galaxies Challenge Our Picture of Galaxy Formation by Hierarchical Clustering. ApJ,723:54–80, November 2010.[31] R. Launhardt, R. Zylka, and P. G. Mezger. The nuclear bulge of the Galaxy. III. Large-scale physical characteristics of stars and interstellar matter. A&A, 384:112–139, March 2002.[32] T. H. Jarrett, T. Chester, R. Cutri, S. Schneider, M. Skrutskie, and J. P. Huchra. 2MASS Extended Source Catalog: Overview and Algorithms. AJ, 119:2498–2531, May 2000.[33] S. Malhotra, D. N. Spergel, J. E. Rhoads, and J. Li. The Milky Way, Local Galaxies, and the Infrared Tully-Fisher Relation. ApJ, 473:687–+, December 1996.[34] E. F. Bell, D. H. McIntosh, N. Katz, and M. D. Weinberg. The Optical and Near-Infrared Properties of Galaxies. I. Luminosity and Stellar Mass Functions.ApJS, 149:289–312, December 2003.[35] D. G. York et al. The Sloan Digital Sky Survey: Technical Summary. AJ, 120:1579–1587, September 2000.[36] R. E. de Souza, D. A. Gadotti, and S. dos Anjos. BUDDA: A New Two-dimensional Bulge/Disk Decomposition Code for Detailed Structural Analysis ofGalaxies. ApJS, 153:411–427, August 2004.[37] D. A. Gadotti. Image decomposition of barred galaxies and AGN hosts. MNRAS, 384:420–439, February 2008.[38] J. Hu. The black hole mass-stellar velocity dispersion correlation: bulges versus pseudo-bulges. MNRAS, 386:2242–2252, June 2008.[39] N. Nowak, J. Thomas, P. Erwin, R. P. Saglia, R. Bender, and R. I. Davies. Do black hole masses scale with classical bulge luminosities only? The case of thetwo composite pseudo-bulge galaxies NGC 3368 and NGC 3489. MNRAS, 403:646–672, April 2010.[40] W. Dehnen and J. Binney. Mass models of the Milky Way. MNRAS, 294:429–+, March 1998.[41] A. Klypin, H. Zhao, and R. S. Somerville. ΛCDM-based Models for the Milky Way and M31. I. Dynamical Models. ApJ, 573:597–613, July 2002.[42] C. Flynn, J. Holmberg, L. Portinari, B. Fuchs, and H. Jahreiß. On the mass-to-light ratio of the local Galactic disc and the optical luminosity of the Galaxy.MNRAS, 372:1149–1160, November 2006.[43] P. B. Eskridge, J. A. Frogel, R. W. Pogge, A. C. Quillen, A. A. Berlind, R. L. Davies, D. L. DePoy, K. M. Gilbert, M. L. Houdashelt, L. E. Kuchinski, S. V.Ramırez, K. Sellgren, A. Stutz, D. M. Terndrup, and G. P. Tiede. Near-Infrared and Optical Morphology of Spiral Galaxies. ApJS, 143:73–111, November 2002.[44] G. D’Agostini. Fits, and especially linear fits, with errors on both axes, extra variance of the data points and other complications. ArXiv Physics e-prints,November 2005.[45] C. Guidorzi, F. Frontera, E. Montanari, F. Rossi, L. Amati, A. Gomboc, and C. G. Mundell. The slope of the gamma-ray burst variability/peak luminositycorrelation. MNRAS, 371:843–851, September 2006.[46] O. Y. Gnedin, D. H. Weinberg, J. Pizagno, F. Prada, and H.-W. Rix. Dark Matter Halos of Disk Galaxies: Constraints from the Tully-Fisher Relation. ApJ,671:1115–1134, December 2007.[47] J. Bland-Hawthorn, M. Vlajic, K. C. Freeman, and B. T. Draine. NGC 300: An Extremely Faint, Outer Stellar Disk Observed to 10 Scale Lengths. ApJ, 629:239–249, August 2005.[48] A. Seth, M. Agueros, D. Lee, and A. Basu-Zych. The Coincidence of Nuclear Star Clusters and Active Galactic Nuclei. ApJ, 678:116–130, May 2008.[49] S. Gillessen, F. Eisenhauer, S. Trippe, T. Alexander, R. Genzel, F. Martins, and T. Ott. Monitoring Stellar Orbits Around the Massive Black Hole in theGalactic Center. ApJ, 692:1075–1109, February 2009.[50] R. Bender, J. Kormendy, G. Bower, R. Green, J. Thomas, A. C. Danks, T. Gull, J. B. Hutchings, C. L. Joseph, M. E. Kaiser, T. R. Lauer, C. H. Nelson,D. Richstone, D. Weistrop, and B. Woodgate. HST STIS Spectroscopy of the Triple Nucleus of M31: Two Nested Disks in Keplerian Rotation around aSupermassive Black Hole. ApJ, 631:280–300, September 2005.[51] E. K. Verolme, M. Cappellari, Y. Copin, R. P. van der Marel, R. Bacon, M. Bureau, R. L. Davies, B. M. Miller, and P. T. de Zeeuw. A SAURON study ofM32: measuring the intrinsic flattening and the central black hole mass. MNRAS, 335:517–525, September 2002. .[52] D. Krajnovic, R. M. McDermid, M. Cappellari, and R. L. Davies. Determination of masses of the central black holes in NGC 524 and 2549 using laser guidestar adaptive optics. MNRAS, 399:1839–1857, November 2009. .[53] K. Gebhardt, D. Richstone, S. Tremaine, T. R. Lauer, R. Bender, G. Bower, A. Dressler, S. M. Faber, A. V. Filippenko, R. Green, C. Grillmair, L. C. Ho,J. Kormendy, J. Magorrian, and J. Pinkney. Axisymmetric Dynamical Models of the Central Regions of Galaxies. ApJ, 583:92–115, January 2003. .
7

Peter Erwin and Dimitri Alexei Gadotti: NSCs and SMBHs: Galaxy Correlations
[54] G. A. Bower, R. F. Green, R. Bender, K. Gebhardt, T. R. Lauer, J. Magorrian, D. O. Richstone, A. Danks, T. Gull, J. Hutchings, C. Joseph, M. E. Kaiser,D. Weistrop, B. Woodgate, C. Nelson, and E. M. Malumuth. Evidence of a Supermassive Black Hole in the Galaxy NGC 1023 from the Nuclear Stellar Dynamics.ApJ, 550:75–86, March 2001.[55] G. Lodato and G. Bertin. Non-Keplerian rotation in the nucleus of NGC 1068: Evidence for a massive accretion disk? A&A, 398:517–524, February 2003. .[56] J. W. Atkinson, J. L. Collett, A. Marconi, D. J. Axon, A. Alonso-Herrero, D. Batcheldor, J. J. Binney, A. Capetti, C. M. Carollo, L. Dressel, H. Ford, J. Gerssen,M. A. Hughes, D. Macchetto, W. Maciejewski, M. R. Merrifield, C. Scarlata, W. Sparks, M. Stiavelli, Z. Tsvetanov, and R. P. van der Marel. Supermassive blackhole mass measurements for NGC 1300 and 2748 based on Hubble Space Telescope emission-line gas kinematics. MNRAS, 359:504–520, May 2005.[57] S. P. Rusli, J. Thomas, P. Erwin, R. P. Saglia, N. Nowak, and R. Bender. The central black hole mass of the high-σ but low-bulge-luminosity lenticular galaxyNGC 1332. MNRAS, 410:1223–1236, January 2011.[58] N. Nowak, R. P. Saglia, J. Thomas, R. Bender, R. I. Davies, and K. Gebhardt. The supermassive black hole of FornaxA. MNRAS, 391:1629–1649, December2008.[59] R. C. W. Houghton, J. Magorrian, M. Sarzi, N. Thatte, R. L. Davies, and D. Krajnovic. The central kinematics of NGC 1399 measured with 14 pc resolution.MNRAS, 367:2–18, March 2006. .[60] M. Sarzi, H.-W. Rix, J. C. Shields, G. Rudnick, L. C. Ho, D. H. McIntosh, A. V. Filippenko, and W. L. W. Sargent. Supermassive Black Holes in Bulges. ApJ,550:65–74, March 2001. .[61] N. Devereux, H. Ford, Z. Tsvetanov, and G. Jacoby. STIS Spectroscopy of the Central 10 Parsecs of M81: Evidence for a Massive Black Hole. AJ, 125:1226–1235, March 2003.[62] R. I. Davies, J. Thomas, R. Genzel, F. Muller Sanchez, L. J. Tacconi, A. Sternberg, F. Eisenhauer, R. Abuter, R. Saglia, and R. Bender. The Star-formingTorus and Stellar Dynamical Black Hole Mass in the Seyfert 1 Nucleus of NGC 3227. ApJ, 646:754–773, August 2006.[63] A. J. Barth, M. Sarzi, H.-W. Rix, L. C. Ho, A. V. Filippenko, and W. L. W. Sargent. Evidence for a Supermassive Black Hole in the S0 Galaxy NGC 3245.ApJ, 555:685–708, July 2001.[64] P. T. Kondratko, L. J. Greenhill, and J. M. Moran. The Parsec-Scale Accretion Disk in NGC 3393. ApJ, 678:87–95, May 2008.[65] K. Gultekin, D. O. Richstone, K. Gebhardt, T. R. Lauer, J. Pinkney, M. C. Aller, R. Bender, A. Dressler, S. M. Faber, A. V. Filippenko, R. Green, L. C. Ho,J. Kormendy, and C. Siopis. A Quintet of Black Hole Mass Determinations. ApJ, 695:1577–1590, April 2009. .[66] G. de Francesco, A. Capetti, and A. Marconi. Measuring supermassive black holes with gas kinematics: the active S0 galaxy NGC 3998. A&A, 460:439–448,December 2006.[67] E. K. S. Hicks and M. A. Malkan. Circumnuclear Gas in Seyfert 1 Galaxies: Morphology, Kinematics, and Direct Measurement of Black Hole Masses. ApJS,174:31–73, January 2008. .[68] M. Miyoshi, J. Moran, J. Herrnstein, L. Greenhill, N. Nakai, P. Diamond, and M. Inoue. Evidence for a black hole from high rotation velocities in a sub-parsecregion of NGC4258. Nature, 373:127–129, January 1995.[69] L. Ferrarese, H. C. Ford, and W. Jaffe. Evidence for a Massive Black Hole in the Active Galaxy NGC 4261 from Hubble Space Telescope Images and Spectra.ApJ, 470:444, October 1996.[70] N. Cretton and F. C. van den Bosch. Evidence for a Massive Black Hole in the S0 Galaxy NGC 4342. ApJ, 514:704–724, April 1999. .[71] J. L. Walsh, A. J. Barth, and M. Sarzi. The Supermassive Black Hole in M84 Revisited. ApJ, 721:762–776, September 2010.[72] F. Macchetto, A. Marconi, D. J. Axon, A. Capetti, W. Sparks, and P. Crane. The Supermassive Black Hole of M87 and the Kinematics of Its AssociatedGaseous Disk. ApJ, 489:579, November 1997.[73] N. Nowak, R. P. Saglia, J. Thomas, R. Bender, M. Pannella, K. Gebhardt, and R. I. Davies. The supermassive black hole in NGC4486a detected with SINFONIat the Very Large Telescope. MNRAS, 379:909–914, August 2007.[74] J. Shen and K. Gebhardt. The Supermassive Black Hole and Dark Matter Halo of NGC 4649 (M60). ApJ, 711:484–494, March 2010. .[75] G. de Francesco, A. Capetti, and A. Marconi. Measuring supermassive black holes with gas kinematics. II. The LINERs IC 989, NGC 5077, and NGC 6500.A&A, 479:355–363, February 2008.[76] N. Neumayer, M. Cappellari, J. Reunanen, H.-W. Rix, P. P. van der Werf, P. T. de Zeeuw, and R. I. Davies. The Central Parsecs of Centaurus A: High-excitationGas, a Molecular Disk, and the Mass of the Black Hole. ApJ, 671:1329–1344, December 2007.[77] A. Capetti, A. Marconi, D. Macchetto, and D. Axon. The supermassive black hole in the Seyfert 2 galaxy NGC 5252. A&A, 431:465–475, February 2005.[78] L. Ferrarese and H. C. Ford. Nuclear Disks of Gas and Dust in Early-Type Galaxies and the Hunt for Massive Black Holes: Hubble Space TelescopeObservations of NGC 6251. ApJ, 515:583–602, April 1999. .[79] R. P. van der Marel and F. C. van den Bosch. Evidence for a 3 × 10⁸ M� Black Hole in NGC 7052 from Hubble Space Telescope Observations of the NuclearGas Disk. AJ, 116:2220–2236, November 1998. .[80] M. Cappellari, E. K. Verolme, R. P. van der Marel, G. A. V. Kleijn, G. D. Illingworth, M. Franx, C. M. Carollo, and P. T. de Zeeuw. The Counterrotating Coreand the Black Hole Mass of IC 1459. ApJ, 578:787–805, October 2002. .[81] E. Dalla Bonta, L. Ferrarese, E. M. Corsini, J. Miralda-Escude, L. Coccato, M. Sarzi, A. Pizzella, and A. Beifiori. The High-Mass End of the Black Hole MassFunction: Mass Estimates in Brightest Cluster Galaxies. ApJ, 690:537–559, January 2009. .
Appendix A: Data Tables
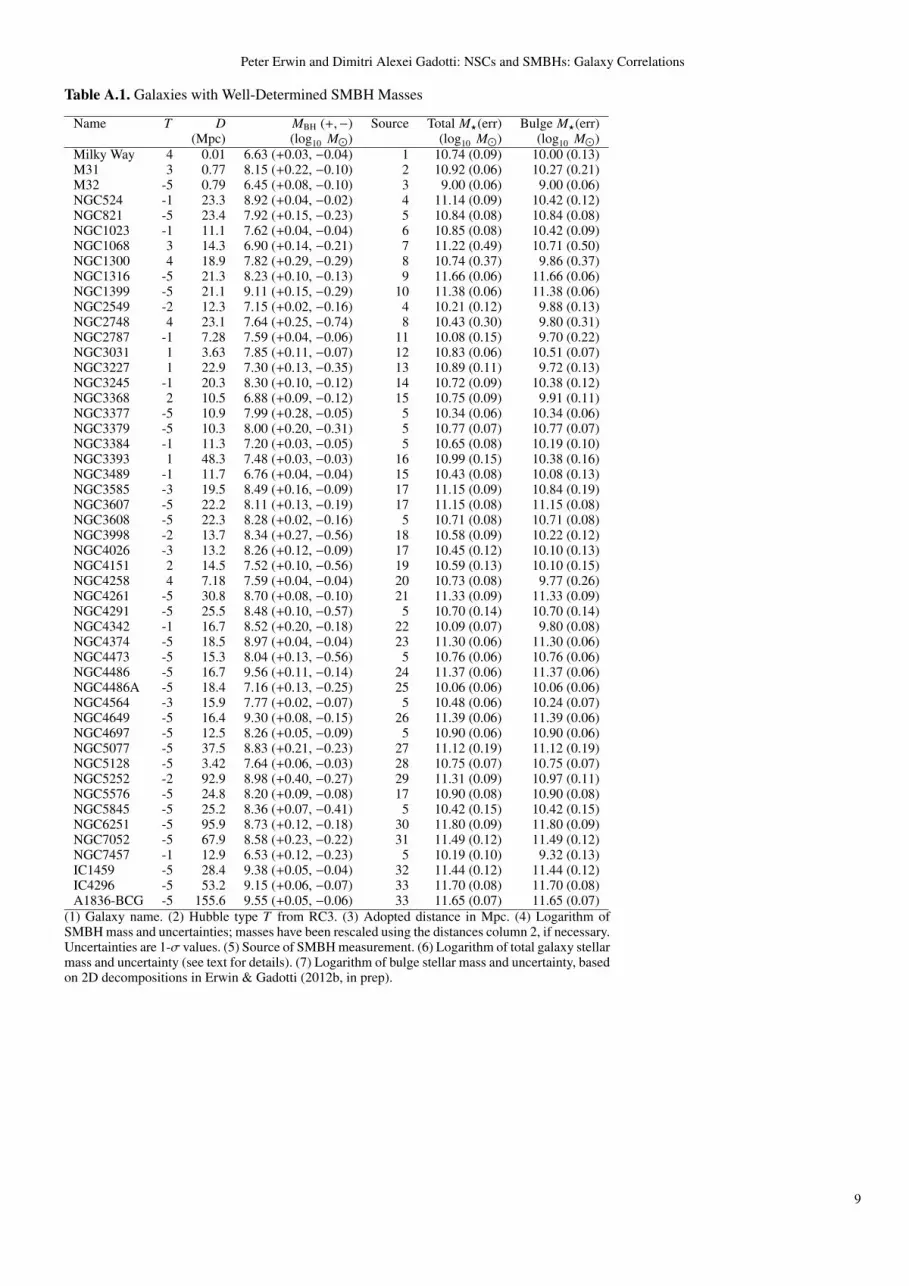
In Tables A.1 and A.2, we list the basic data parameters for SMBH and NSC hosts. References for the NSC masses are in thecaptions for Table A.2. For the SMBH masses, the numbers in column 5 of Table A.1 translate into the following references: 1 =Gillessen et al. [49]; 2 = Bender et al. [50]; 3 = Verolme et al. [51]; 4 = Krajnovic et al. [52]; 5 = Gebhardt et al. [53]; 6 = Boweret al. [54]; 7 = Lodato and Bertin [55]; 8 = Atkinson et al. [56]; 9 = Rusli et al. [57]; 10 = Nowak et al. [58]; 11 = Houghton et al.[59]; 12 = Sarzi et al. [60]; 13 = Devereux et al. [61]; 14 = Davies et al. [62]; 15 = Barth et al. [63]; 16 = Nowak et al. [39]; 17 =Kondratko et al. [64]; 18 = Gultekin et al. [65]; 19 = de Francesco et al. [66]; 20 = Hicks and Malkan [67]; 21 = Miyoshi et al. [68];22 = Ferrarese et al. [69]; 23 = Cretton and van den Bosch [70]; 24 = Walsh et al. [71]; 25 = Macchetto et al. [72]; 26 = Nowaket al. [73]; 27 = Shen and Gebhardt [74]; 28 = de Francesco et al. [75]; 29 = Neumayer et al. [76]; 30 = Capetti et al. [77]; 31 =Ferrarese and Ford [78]; 32 = van der Marel and van den Bosch [79]; 33 = Cappellari et al. [80]; 34 = Dalla Bonta et al. [81].
8
Peter Erwin and Dimitri Alexei Gadotti: NSCs and SMBHs: Galaxy Correlations
Table A.1. Galaxies with Well-Determined SMBH Masses
Name T D MBH (+,−) Source Total M?(err) Bulge M?(err)(Mpc) (log10 M�) (log10 M�) (log10 M�)
Milky Way 4 0.01 6.63 (+0.03, −0.04) 1 10.74 (0.09) 10.00 (0.13)M31 3 0.77 8.15 (+0.22, −0.10) 2 10.92 (0.06) 10.27 (0.21)M32 -5 0.79 6.45 (+0.08, −0.10) 3 9.00 (0.06) 9.00 (0.06)NGC524 -1 23.3 8.92 (+0.04, −0.02) 4 11.14 (0.09) 10.42 (0.12)NGC821 -5 23.4 7.92 (+0.15, −0.23) 5 10.84 (0.08) 10.84 (0.08)NGC1023 -1 11.1 7.62 (+0.04, −0.04) 6 10.85 (0.08) 10.42 (0.09)NGC1068 3 14.3 6.90 (+0.14, −0.21) 7 11.22 (0.49) 10.71 (0.50)NGC1300 4 18.9 7.82 (+0.29, −0.29) 8 10.74 (0.37) 9.86 (0.37)NGC1316 -5 21.3 8.23 (+0.10, −0.13) 9 11.66 (0.06) 11.66 (0.06)NGC1399 -5 21.1 9.11 (+0.15, −0.29) 10 11.38 (0.06) 11.38 (0.06)NGC2549 -2 12.3 7.15 (+0.02, −0.16) 4 10.21 (0.12) 9.88 (0.13)NGC2748 4 23.1 7.64 (+0.25, −0.74) 8 10.43 (0.30) 9.80 (0.31)NGC2787 -1 7.28 7.59 (+0.04, −0.06) 11 10.08 (0.15) 9.70 (0.22)NGC3031 1 3.63 7.85 (+0.11, −0.07) 12 10.83 (0.06) 10.51 (0.07)NGC3227 1 22.9 7.30 (+0.13, −0.35) 13 10.89 (0.11) 9.72 (0.13)NGC3245 -1 20.3 8.30 (+0.10, −0.12) 14 10.72 (0.09) 10.38 (0.12)NGC3368 2 10.5 6.88 (+0.09, −0.12) 15 10.75 (0.09) 9.91 (0.11)NGC3377 -5 10.9 7.99 (+0.28, −0.05) 5 10.34 (0.06) 10.34 (0.06)NGC3379 -5 10.3 8.00 (+0.20, −0.31) 5 10.77 (0.07) 10.77 (0.07)NGC3384 -1 11.3 7.20 (+0.03, −0.05) 5 10.65 (0.08) 10.19 (0.10)NGC3393 1 48.3 7.48 (+0.03, −0.03) 16 10.99 (0.15) 10.38 (0.16)NGC3489 -1 11.7 6.76 (+0.04, −0.04) 15 10.43 (0.08) 10.08 (0.13)NGC3585 -3 19.5 8.49 (+0.16, −0.09) 17 11.15 (0.09) 10.84 (0.19)NGC3607 -5 22.2 8.11 (+0.13, −0.19) 17 11.15 (0.08) 11.15 (0.08)NGC3608 -5 22.3 8.28 (+0.02, −0.16) 5 10.71 (0.08) 10.71 (0.08)NGC3998 -2 13.7 8.34 (+0.27, −0.56) 18 10.58 (0.09) 10.22 (0.12)NGC4026 -3 13.2 8.26 (+0.12, −0.09) 17 10.45 (0.12) 10.10 (0.13)NGC4151 2 14.5 7.52 (+0.10, −0.56) 19 10.59 (0.13) 10.10 (0.15)NGC4258 4 7.18 7.59 (+0.04, −0.04) 20 10.73 (0.08) 9.77 (0.26)NGC4261 -5 30.8 8.70 (+0.08, −0.10) 21 11.33 (0.09) 11.33 (0.09)NGC4291 -5 25.5 8.48 (+0.10, −0.57) 5 10.70 (0.14) 10.70 (0.14)NGC4342 -1 16.7 8.52 (+0.20, −0.18) 22 10.09 (0.07) 9.80 (0.08)NGC4374 -5 18.5 8.97 (+0.04, −0.04) 23 11.30 (0.06) 11.30 (0.06)NGC4473 -5 15.3 8.04 (+0.13, −0.56) 5 10.76 (0.06) 10.76 (0.06)NGC4486 -5 16.7 9.56 (+0.11, −0.14) 24 11.37 (0.06) 11.37 (0.06)NGC4486A -5 18.4 7.16 (+0.13, −0.25) 25 10.06 (0.06) 10.06 (0.06)NGC4564 -3 15.9 7.77 (+0.02, −0.07) 5 10.48 (0.06) 10.24 (0.07)NGC4649 -5 16.4 9.30 (+0.08, −0.15) 26 11.39 (0.06) 11.39 (0.06)NGC4697 -5 12.5 8.26 (+0.05, −0.09) 5 10.90 (0.06) 10.90 (0.06)NGC5077 -5 37.5 8.83 (+0.21, −0.23) 27 11.12 (0.19) 11.12 (0.19)NGC5128 -5 3.42 7.64 (+0.06, −0.03) 28 10.75 (0.07) 10.75 (0.07)NGC5252 -2 92.9 8.98 (+0.40, −0.27) 29 11.31 (0.09) 10.97 (0.11)NGC5576 -5 24.8 8.20 (+0.09, −0.08) 17 10.90 (0.08) 10.90 (0.08)NGC5845 -5 25.2 8.36 (+0.07, −0.41) 5 10.42 (0.15) 10.42 (0.15)NGC6251 -5 95.9 8.73 (+0.12, −0.18) 30 11.80 (0.09) 11.80 (0.09)NGC7052 -5 67.9 8.58 (+0.23, −0.22) 31 11.49 (0.12) 11.49 (0.12)NGC7457 -1 12.9 6.53 (+0.12, −0.23) 5 10.19 (0.10) 9.32 (0.13)IC1459 -5 28.4 9.38 (+0.05, −0.04) 32 11.44 (0.12) 11.44 (0.12)IC4296 -5 53.2 9.15 (+0.06, −0.07) 33 11.70 (0.08) 11.70 (0.08)A1836-BCG -5 155.6 9.55 (+0.05, −0.06) 33 11.65 (0.07) 11.65 (0.07)
(1) Galaxy name. (2) Hubble type T from RC3. (3) Adopted distance in Mpc. (4) Logarithm ofSMBH mass and uncertainties; masses have been rescaled using the distances column 2, if necessary.Uncertainties are 1-σ values. (5) Source of SMBH measurement. (6) Logarithm of total galaxy stellarmass and uncertainty (see text for details). (7) Logarithm of bulge stellar mass and uncertainty, basedon 2D decompositions in Erwin & Gadotti (2012b, in prep).
9

Peter Erwin and Dimitri Alexei Gadotti: NSCs and SMBHs: Galaxy Correlations
Table A.2. Galaxies with Well-Determined NSC Masses
Name T D MNSC (err) Type Source Total M?(err) Bulge M?(err)(Mpc) (log10 M�) (log10 M�) (log10 M�)
Milky Way 4 0.01 7.48 (0.09) D 1 10.74 (0.09) 10.00 (0.13)M31 3 0.77 7.54 (0.06) D 2 10.92 (0.06) 10.27 (0.11)M33 6 0.81 6.24 (0.08) D 3 9.74 (0.08) 8.44 (0.12)IC342 6 3.37 7.05 (0.07) D 4 10.23 (0.07) 8.82 (0.23)NGC300 7 2.02 5.98 (0.06) D 5 9.26 (0.06) < 6.26NGC404 -3 3.18 7.04 (0.06) D 6 9.24 (0.06) 9.06 (0.11)NGC428 9 15.5 6.51 (0.18) D 5 9.81 (0.18) 7.76 (0.29)NGC1042 6 17.5 6.51 (0.18) D 5 10.14 (0.18) 7.98 (0.21)NGC1493 6 11.0 6.38 (0.19) D 5 9.75 (0.19) < 6.75NGC1705 -3 5.11 4.91 (0.12) D 7 8.38 (0.12) 7.87 (0.15)NGC2139 6 22.9 5.92 (0.18) D 5 10.15 (0.18) < 7.15NGC3423 6 14.4 6.53 (0.19) D 5 10.08 (0.19) 8.91 (0.21)NGC3621 7 6.64 7.00 (0.08) D 8 10.20 (0.08) 8.25 (0.14)NGC5457 6 7.05 6.91 (0.09) D 9 10.68 (0.09) 8.76 (0.24)NGC6946 6 5.89 7.88 (0.10) D 9 10.62 (0.10) 9.36 (0.13)NGC7418 6 17.8 7.78 (0.18) D 5 10.29 (0.18) 8.50 (0.19)NGC7424 6 10.5 6.09 (0.18) D 5 9.53 (0.18) 8.29 (0.19)NGC7793 7 3.91 6.96 (0.11) D 5 9.65 (0.11) 8.01 (0.14)NGC1325 4 19.6 7.08 (0.18) S 10 10.34 (0.18) 7.91 (0.20)NGC1385 6 18.1 6.39 (0.18) S 10 10.28 (0.18) 8.69 (0.20)NGC2552 9 9.68 5.77 (0.18) S 10 9.00 (0.18) 6.30 (0.28)NGC3177 3 19.6 8.15 (0.18) S 10 10.10 (0.18) 8.71 (0.20)NGC3277 2 21.4 8.34 (0.18) S 10 10.32 (0.18) . . .NGC3455 3 16.4 6.75 (0.18) S 10 9.46 (0.18) . . .NGC4030 4 20.5 7.99 (0.18) S 10 10.92 (0.18) 10.28 (0.20)NGC4411B 6 18.6 6.53 (0.19) S 10 9.46 (0.19) . . .NGC4701 6 10.8 6.53 (0.18) S 10 9.34 (0.18) . . .NGC4775 7 21.9 7.60 (0.19) S 10 10.19 (0.19) 8.76 (0.20)NGC5377 1 28.4 8.63 (0.18) S 10 10.80 (0.18) . . .NGC5585 7 8.71 5.87 (0.19) S 10 9.26 (0.19) 8.58 (0.21)NGC5806 3 20.0 8.11 (0.18) S 10 10.43 (0.18) . . .NGC7421 4 23.1 6.87 (0.18) S 10 10.24 (0.18) . . .NGC7690 3 17.7 7.98 (0.18) S 10 9.90 (0.18) 9.28 (0.20)
(1) Galaxy name. (2) Hubble type T from RC3. (3) Adopted distance in Mpc. (4) Logarithm ofNSC mass and uncertainty; masses have been rescaled using the distances column 2, if necessary.Errors are 1-σ values. (5) Type of NSC mass measurement: “D” = dynamical, “S” = spectroscopic.(6) Source of NSC measurement: 1 = Launhardt et al. [31]; 2 = Kormendy and Bender [25]; 3 =Matthews et al. [26] + Gebhardt et al. [27]; 4 = Boker et al. [24]; 5 = Walcher et al. [21]; 6 =Seth et al. [29]; 7 = Ho and Filippenko [23]; 8 = Barth et al. [28]; 9 = Kormendy et al. [30]; 10 =Rossa et al. [11]. (7) Logarithm of total galaxy stellar mass and uncertainty (see text for details). (8)Logarithm of bulge stellar mass and uncertainty (or upper limit for bulgeless galaxies), based on de-compositions in Erwin & Gadotti (2012a, in prep); galaxies currently missing proper decompositionsare indicated by “. . . ”.
10
Related Documents