IZA DP No. 3183 Do Interest Groups Affect Immigration? Giovanni Facchini Anna Maria Mayda Prachi Mishra DISCUSSION PAPER SERIES Forschungsinstitut zur Zukunft der Arbeit Institute for the Study of Labor November 2007

Welcome message from author
This document is posted to help you gain knowledge. Please leave a comment to let me know what you think about it! Share it to your friends and learn new things together.
Transcript

IZA DP No. 3183
Do Interest Groups Affect Immigration?
Giovanni FacchiniAnna Maria MaydaPrachi Mishra
DI
SC
US
SI
ON
PA
PE
R S
ER
IE
S
Forschungsinstitutzur Zukunft der ArbeitInstitute for the Studyof Labor
November 2007

Do Interest Groups Affect Immigration?
Giovanni Facchini University of Essex, University of Milan,
CEPR, LdA and CESifo
Anna Maria Mayda Georgetown University,
CEPR, LdA and IZA
Prachi Mishra International Monetary Fund
Discussion Paper No. 3183 November 2007
IZA
P.O. Box 7240 53072 Bonn
Germany
Phone: +49-228-3894-0 Fax: +49-228-3894-180
E-mail: [email protected]
Any opinions expressed here are those of the author(s) and not those of the institute. Research disseminated by IZA may include views on policy, but the institute itself takes no institutional policy positions. The Institute for the Study of Labor (IZA) in Bonn is a local and virtual international research center and a place of communication between science, politics and business. IZA is an independent nonprofit company supported by Deutsche Post World Net. The center is associated with the University of Bonn and offers a stimulating research environment through its research networks, research support, and visitors and doctoral programs. IZA engages in (i) original and internationally competitive research in all fields of labor economics, (ii) development of policy concepts, and (iii) dissemination of research results and concepts to the interested public. IZA Discussion Papers often represent preliminary work and are circulated to encourage discussion. Citation of such a paper should account for its provisional character. A revised version may be available directly from the author.

IZA Discussion Paper No. 3183 November 2007
ABSTRACT
Do Interest Groups Affect Immigration?*
While anecdotal evidence suggests that interest groups play a key role in shaping immigration, there is no systematic empirical evidence on this issue. To motivate our analysis, we develop a simple theoretical model where migration policy is the result of the interaction between organized groups with conflicting interests towards labor flows. We evaluate the key predictions of the model using a new, industry-level dataset from the United States that we construct by combining information on the total number of immigrants and H1B visas with data on lobbying expenditures associated with immigration. We find robust evidence that both pro- and anti-immigration interest groups play a statistically significant and economically relevant role in shaping migration across sectors. Barriers to migration are lower in sectors in which business lobbies incur larger lobbying expenditures and higher in sectors where labor unions are more important. JEL Classification: F22, J61 Keywords: immigration, immigration policy, interest groups, political economy Corresponding author: Anna Maria Mayda Economics Department and SFS Georgetown University Washington, DC 20057 USA E-mail: [email protected]
* The authors would like to thank seminar participants at the AEA Meetings in Chicago, Georgetown University, IMF, Midwest Political Science Meetings for useful comments. Jose Manuel Romero provided excellent research assistance.

“Immigration policy today is driven by businesses that need more workers — skilled and
unskilled, legal and illegal [...] During the annual debate on H1B visas two years ago, Silicon
Valley executives trooped before Congress, warning of a Y2K computer disaster unless the
number of H1B visas was increased.” Goldsborough (2000)
1 Introduction
On May 1, 2006, over a million demonstrators filled US TV screens. They were mainly
Latinos, who marched peacefully through America’s cities in the hope that Congress would
finally introduce legislations to overhaul the country’s immigration policy. A year later, an
innovative, bipartisan legislation was proposed by Senators Ted Kennedy and John Kyl, but
since it was unveiled, “it has been stoned from all sides ”(The Economist, May 24, 2007).
President Bush, referring to this proposal, has proclaimed that “I view this as an historic
opportunity for Congress to act, for Congress to replace a system that is not working with
one that we believe will work a lot better,”(White House, June 26, 2007). Even though many
observers have deemed the status quo unacceptable, no measures have been voted yet.
What determines US immigration policy today? In particular, are political-economy fac-
tors important in shaping immigration to the United States? Do these drivers work along
sector (industry) lines, that is do sector-specific factors with greater political influence suc-
ceed in changing migration policy towards their benefit? In particular, what is the role played
by industry-specific interest groups? In this paper, we address these issues by analyzing the
impact of political organization by business lobbies and workers’ associations on the struc-
ture of migration to the U.S. across sectors between 1998 and 2005. This paper represents,
to the best of our knowledge, the first study to provide systematic empirical evidence on the
political-economy determinants of immigration to the U.S. and, in particular, on the role
played by interest groups.
A vast theoretical and empirical literature considers the political-economy determinants
of trade policy trying to explain the political constraints that work against free trade. In
contrast, the literature on the political economy of migration policy and outcomes is very thin
and mainly theoretical. So far, in analyzing the determinants of international labor flows,
the migration literature has mostly focused on supply factors, i.e. factors which affect the
willingness of workers to move across borders. On the other hand, the analysis of the drivers
of the demand side of international migration, the most important being migration policies
2
in developed countries, has not received as much attention.1 This is in spite of the fact
that, as trade restrictions have been drastically reduced, the benefits from the elimination
of existing trade barriers are much smaller than the gains that could be achieved by freeing
international migration.2 This gap in the literature is very surprising and can be partly
explained by the unavailability of data. The purpose of this paper is to offer a contribution
towards filling this gap.
There exists abundant anecdotal evidence which suggests that political-economy factors
and, in particular, interest groups play a key role in shaping U.S. immigration. Starting from
the very birth of organized labor and for most of their history, unions have been actively
engaged in efforts to limit inflows of foreign workers. The enactment of the first legislative
measure to systematically limit immigration from a specific country — the Chinese Exclusion
Act of 1882 — was the result of the efforts of the newly founded Federation of Organized
Trade and Labor Unions. Similarly, the American Federation of Labor (AFL) played an
important role in the introduction of the Literacy Test provision in the 1917 Immigration
Act, with the explicit intent to “screen and reduce the inflow of unskilled workers in the U.S
labor force” (Briggs (1998), page 125). More recently, the AFL-CIO supported measures to
reduce illegal immigration, that culminated in the 1986 Immigration Reform and Control
Act.
At the same time, complementarities among production factors are fundamental in un-
derstanding the behavior of pressure groups. In the past, active subsidization of immigration
has been demanded and obtained by business associations in many labor–scarce countries,
as has been extensively documented by Timmer and Williamson (1996). The importance of
business lobbies is also consistent with more recent anecdotal evidence. For instance, in the
aftermath of the 2006 midterm elections, the vice- president of Technet, a lobbying group
for technology companies, stressed once again that the main goal of the reforms proposed
by her group is the relaxation of migration policy constraints.3
1For example, Borjas (1994) points out that “the literature does not yet provide a systematic analysis ofthe factors that generate the host country demand function for immigrants.” (page 1693). See section 2 fora discussion of the related literature.
2A recent World Bank study estimates that the benefits to poor countries of rich countries allowing onlya 3 percent rise in their labor force by relaxing migration restrictions is US$300 billion per year (Pritchett2006). For similar results see also Hamilton and Whalley (1984).
3In particular, the proposed reforms are aimed at “...increasing the number of H1B visas granted annuallyto foreign workers employed temporarily at U.S. companies; granting employment-based visas to workerswhose H1B visas are about to expire but whose application for lawful permanent residency (commonlyknown as a ”green card”) is backlogged; and allowing foreign workers who earn advanced degrees at U.S.colleges and universities to stay and work in the United States once they graduate.” CIO, December 19 2006.Available at http://www.cio.com/article/27581/.
3

The paper starts by developing a simple theoretical model that motivates our empirical
analysis. We consider a multi–sector, small open economy in which migration policy is the
result of the interaction between organized groups with conflicting interests over international
labor movements. In particular, in each sector, there are two complementary factors - labor
(which is internationally mobile), and capital (which is fixed). The owners of each factor
are modeled as investing resources to influence the determination of policy towards labor
mobility. We show that in equilibrium, in a given sector, the amount of protection afforded to
labor – i.e., the restrictiveness of the migration policy adopted by the government – depends
on both the lobbying expenditures made by organized labor, as well as on the expenditures
made by capital (which is its complement). In particular, if labor in a sector spends larger
amounts, this will ceteris paribus imply higher levels of protection from foreign inflows of
workers and, hence, lower the equilibrium number of immigrants. At the same time, if
organized business owners spend higher amounts, this will ceteris paribus make migration
policy in that sector less restrictive and, therefore, increase the number of immigrants.
Next, we evaluate the predictions of the model using a new, U.S. industry–level dataset
that we create by combining information on the total number of immigrants and H1B visas
with data on the political activities of organized groups, both in favor and against an increase
in migration. We take advantage of a novel dataset developed by the Center for Responsive
Politics, that allows us to identify lobbying expenditures, by targeted policy area, for the
period between 1998 and 2005. We are thus able to use information on business lobby-
ing expenditures that are specifically channeled towards shaping immigration policy. This
represents a substantial improvement in the quality of the data relative to the existing in-
ternational economics literature which has used, instead, political action committees (PAC)
contributions. First, PAC contributions represent only a small fraction (10%) of targeted
political activity, the remainder being made up by lobbying expenditures. Second, PAC con-
tributions cannot be disaggregated by issue and thus, cannot be easily linked to a particular
policy. Finally, in order to proxy for the political organization of anti-migration lobbying
groups, we use data on workers’ union membership rates across sectors, from the Current
Population Survey.
Our findings are consistent with the predictions of the theoretical model. In particular,
we show that both pro– and anti–migration interest groups play a statistically significant
and economically relevant role in shaping migration across sectors. We find that barriers to
migration are – ceteris paribus – higher in sectors where labor unions are more important,
and lower in those sectors in which business lobbies are more active. Our preferred esti-
4

mates suggest that a 10% increase in the size of lobbying expenditures by business groups is
associated with a 1.8% larger number of immigrants, while a one-percentage-point increase
in union density – for example, moving from 10 to 11 percentage points, which amounts to
a 10% increase in union membership rate – reduces it by 1.3%. The results are robust to
the introduction, in the estimating equation, of a number of industry-level control variables
(e.g. output, prices, origin country effects, etc.) and to addressing endogeneity issues with
an instrumental-variable estimation strategy.
The remainder of the paper is organized as follows. Section 2 reviews the relevant litera-
ture. Section 3 presents the theoretical model, while section 4 describes the data on lobbying
expenditure, in particular in relation to PAC contributions data. Section 5 provides a de-
scription of the other data used in the empirical analysis, while the results of our empirical
analysis are reported in section 6. Section 7 concludes the paper.
2 Literature
While a large body of theoretical and empirical literature is devoted to understanding the
political economy of protection in international trade, there are only few studies that analyze
the politics of distortions in international factor movements. Furthermore, while in inter-
national trade the protection for sale model of Grossman and Helpman (1994) has emerged
as the leading framework to understand the commercial policy formation process, a unified
framework to understand migration policy has yet to emerge.4 In what follows, we first re-
view the existing theoretical literature on the political economy of migration policy, starting
with direct democracy models and turning next to settings in which the lobbying activities
of organized groups play a key role. Second, we discuss the (scarce) empirical evidence on
these issues.
In a seminal contribution, Benhabib (1996) considers the human capital requirements that
would be imposed on potential immigrants by an income-maximizing polity under majority
voting. Output is modeled using a constant returns to scale production function combining
labor with human (or physical) capital. The median voter chooses to admit individuals
who supply a set of factors that are complementary to her own endowment. As a result,
if the median voter is unskilled, he will choose a policy that sets a lower bound on the
skill level of the immigrants, that is only skilled foreigners will be admitted. On the other
4For an overview of this literature, see the surveys by Rodrik (1995), Helpman (1997), and Gawande andKrishna (2003). Facchini (2004) surveys instead the literature on political economy models of trade andfactor mobility.
5

hand, if the median voter is highly educated, he will set an upper bound on the skill level
of the immigrants, and thus will be in favor of admitting only individuals with low levels of
education. The main shortcoming of this analysis is that the optimal policy does not identify
the actual size of the inflows. This is clearly at odds with the policies followed by countries
all around the world. In our model the presence of a fixed factor will instead allow us to
determine the politically optimal number of immigrants to be admitted.
A different solution to this problem has been proposed by Ortega (2005), who extends
Benhabib’s model to a dynamic setting to explore the trade off between the short run eco-
nomic impact of immigration and its medium to long run political effect. In particular,
while immigration affects only the labor market in the current period, in the future it also
influences the political balance of the destination country, as the descendants of migrants
gain the right to vote. As a result, on the one hand, skilled natives prefer an immigration
policy that admits unskilled foreign workers since, due to complementarities in production,
this policy will increase the skilled wage. On the other, the arrival of unskilled immigrants
and the persistency of skill levels across generations can give rise to a situation in which
unskilled workers gain the political majority and, therefore, vote for policies that benefit
them as a group. Thus, through the political channel, skilled natives prefer an immigration
policy that admits skilled foreign workers. The interplay between these two forces allows
Ortega to characterize under which conditions an equilibrium migration quota might arise,
i.e. to derive a prediction in terms of the size of the migration inflows.5
The paper in the migration literature that is most closely related to our work is Facchini
and Willmann (2005). Using the menu auction framework pioneered by Bernheim and
Whinston (1986), the authors model the determination of policies towards international
factor mobility as the result of the interaction between organized groups and an elected
politician. Using a one–good multiple factors framework, Facchini and Willmann (2005)
find that policies depend on both whether a production factor is represented or not by a
lobby and on the degree of substitutability/complementarity between factors. Our model
differs from their work in two ways. On the one hand, we explicitly link equilibrium policies
to actual lobbying expenditures. Secondly, we consider a multi–sector environment, which
enables us to exploit the newly available data by industry on lobbying expenditures.6
5The median voter approach has also been used in the large literature analyzing the impact of immigrationon the recipient country’s welfare system. Among the many papers see Mazza and van Winden (1996), Razin,Sadka, and Swagel (2002), Scholten and Thum (1996), Razin and Sadka (1999) and the literature surveyedin the recent volume by Krieger (2005).
6Recently, a small theoretical literature has emerged explicitly modeling the role played by organizedgroups in shaping migration policy in a setting with imperfectly competitive factor markets. Amegashie
6
The economics literature lacks a systematic empirical analysis of the political-economy
factors that affect contemporary migration.7 While the empirical literature on individual
attitudes towards immigrants is closely related to the topic,8 it does not examine how at-
titudes translate into migration (policy) outcomes. The only empirical work we could find
that indirectly looks at the political-economy determinants of migration policy/outcomes is
Hanson and Spilimbergo (2001). This paper focuses on U.S. border enforcement and shows
that enforcement softens when sectors using illegal immigrants expand. The authors suggest
that “sectors that benefit greatly from lower border enforcement lobby politicians on the
issue, while sectors that benefit modestly are less politically active.” The main purpose of
this paper is to evaluate this conjecture – that lobbying affects immigration policy – though
in the broader context of overall immigration to the United States.
3 Theoretical model
Consider a small open economy consisting of n + 1 sectors, populated by a unit mass of
individuals. The output of sector zero is the numeraire and is produced using labor according
to an identity production function, i.e. X0 = L0. The output of all other sectors is produced
using sector specific labor, which we assume to be internationally mobile.9 The production
technology in each sector exhibits diminishing returns to labor, and we denote by ωi the
domestic return to labor in sector i. As usual, diminishing returns can be attributed to the
presence of a fixed factor in each sector (Dixit and Norman 1980). We will call this factor
capital and denote the aggregate reward to the specific factor employed in sector i by πi.
For simplicity, we assume that free trade in goods prevails and we normalize the inter-
national price for each commodity, setting it equal to one. Similarly, we assume that the
return in the international market to each type of labor is also equal to one. Any difference
between the domestic factor return ωi and the international return will be explained by the
policies implemented by the domestic government.
(2004) and Bellettini and Berti Ceroni (2006) are examples of this approach. Our analysis will instead bebased on competitive factor markets, where no unemployment occurs in equilibrium.
7The literature offers historical accounts of the political economy of immigration restrictions between theend of the XIX century and the beginning of the XX century (Goldin 1994, Timmer and Williamson 1996).
8See, for example, Scheve and Slaughter (2001), Mayda (2006), O’Rourke and Sinnott (2004), Hanson,Scheve, and Slaughter (2007), Facchini and Mayda (2006).
9There is substantial evidence supporting this view. For instance Friedberg (2001), among others, findsa significant positive relationship between source and destination country sector employment for Russianimmigrants to Israel in the nineties.
7
Consumers are characterized by a separable, quasi–linear utility function that takes the
following form:
u(x) = x0 +n∑
i=1
ui(xi) (1)
An individual maximizing this utility given an income I will have a demand di(pi) for
each non-numeraire good, while the demand for the numeraire good is given by d0 = I −∑ni=1 pidi(pi). The indirect utility of our representative consumer is thus given by V =
I +∑
i si(pi), where∑
i si(pi) =∑
i ui(di(pi)) − pidi(pi) is the consumer surplus. Notice
that, by assuming a small open economy that trades freely in final goods, the consumer
surplus of each agent is not going to be affected by changes in factor returns brought about
by government policies (i.e., changes in factor returns do not affect goods’ prices).
Let `i denote the total domestic supply of labor of type i, i ∈ 0, 1, ...n available in the
economy, while Li(ωi) is the demand for this factor. Restrictions10 to the physical relocation
of people across countries often take the form of a (binding) quota, accompanied by a tax (i.e.,
a differential fiscal treatment for immigrants vis a vis natives11), resulting in the immigrant
retaining part of the surplus associated with the relocation (i.e., the difference between the
wage prevailing in the country of destination and the country of origin). As a result, the
fiscal revenues associated with the presence of binding quotas qi in sectors i ∈ 1, ..., n are
equal to
T (q) =∑
i
γi(ωi(qi)− 1)(Li(ωi(qi))− `i) (2)
where ωi(qi) is the wage that prevails in the Host country as a result of the introduction
of a binding quota, and Li(ω(qi)) is the corresponding employment level. The parameter
γi ∈ [0, 1] represents instead the share of the rent associated with the immigration quota
that is captured by the government of the receiving country, while (1− γi) is the fraction of
the wage premium (ωi(qi)− 1) associated with migration that is retained by the relocating
migrant.
The fiscal revenues associated with the quota cum tax introduced by the government
10Of course, policies could also be used to promote immigration. This has been for instance the case inmany labor–scarce economies in the nineteenth century like Brazil and Argentina, as Timmer and Williamson(1996) have pointed out. Within the framework of the model, policies of this type would take the form ofimmigration subsidies. For simplicity we will not model this type of instruments explicitly as in the recentU.S. experience they have hardly been used.
11The US tax code for instance configures a differential treatment between residents and non residents.
8

are lump sum rebated to all citizens of the country we are considering. Each domestic
citizen supplies one unit of labor specific to the numeraire sector and at most one unit of a
factor (capital or labor) specific to any non-numeraire sector. Since the size of the domestic
population is normalized to one, the welfare of the agents supplying labor in sector i is equal
to
ViL = ωi(qi)`i + αiL[1 + T (q) +∑
i
si(pi)], (3)
where the first term is the return to sector i specific labor, αiL is the share of the population
that owns labor used in the production of output i and, finally, 1 is the return to labor in
the numeraire sector. The welfare of agents supplying the fixed factor (capital) is instead
given by
ViK = πi(qi) + αiK [1 + T (q) +∑
i
si(pi)], (4)
where πi(qi) is the return to capital in sector i and αiK is the share of the population that
owns sector i specific capital. The first best policy in this model is obtained by maximizing
the welfare of all natives, i.e.
W (q) =∑
i
(ViK + ViL) (5)
and, as can be easily shown, this involves free labor mobility. Intuitively, starting from
a scenario with less than free labor mobility, immigration reduces wages, but the loss to
domestic workers is less than the gains to domestic capital owners (see Borjas 1995 for a
graphical exposition). Hence, it is optimal to admit all foreign workers willing to relocate to
the country. In other words, the first-best quota q∗i set by the government is such that
q∗i ≥ mi(1, pi) = Li(1, pi)− `i (6)
If we bring in directly the quantities of the specific factors in the production structure and
let ki be the amount of specific factor employed in sector i, the first best number of migrants
mi(1, ki, pi) is ceteris paribus an increasing function of the stock of capital ki available in
sector i. Similarly, an increase in the relative price of the good produced in sector i leads to
an increase in the first best number of migrants in the sector. In both cases, the increase in
the number of migrants is brought about by an outward shift in the labor demand curve in
the sector.
9

Recent rational choice analyses have pointed out how interest groups can directly partici-
pate in the political process in at least two ways. On the one hand, they provide substantive
information to policy makers; on the other, at least in the United States, they offer financial
incentives: this setting postulates a simple “quid pro quo” view of the relationship between
an elected politician and the interest group. In the international economics literature the
most influential approach, pioneered by Grossman and Helpman (1994), has emphasized the
second view and in particular the role of direct campaign contributions in shaping policies.12
Formally, Grossman and Helpman (1994) have proposed an analytical foundation for a po-
litical support function that is based on the politician including pressure groups’ campaign
contributions directly in its objective function. While this approach has been very successful
and can be thought of as the current paradigm in the endogenous trade literature, an impor-
tant feature of this model is that “the existence of a lobby matters in equilibrium, and not
its actual contribution level...”(Eicher and Osang 2002).13 Furthermore, the Grossman and
Helpman (1994) model ignores the important informational channel through which lobbies
can also influence policy and the data shows that, if anything, businesses might perceive
“informational” lobbying to be at least as important as campaign contributions.14 To char-
acterize the link between equilibrium policy outcomes and contributions and to allow for a
more general role of lobbies, we have decided to use a “protection formation function” ap-
proach. According to this view, government policy is simply a function of the expenditures
undertaken by pro and anti–immigration groups, and we refrain from spelling out more in
detail how interest groups actually affect the political process. Inspired by the pioneering
contributions of Findlay and Wellisz (1982), we model measures towards labor mobility in
12More generally, our view is that the reward to a politician for a political favor might take much morecomplicated forms than direct campaign contributions. For instance, politicians at the end of their careerbecome themselves active lobbyists and, in some cases, are able to earn substantial rewards for carrying outtheir activities in this role. According to the CRP website, http://www.opensecrets.org/, “Lobbying firmswere still able to find 129 former members of Congress willing to lobby on everything from postal ratesto defense appropriations. Former Rep. Bob Livingston (R-La.), who was once days away from becomingSpeaker of the House, drummed up $1.14 million in business in his first year as an independent lobbyist.”
13Technically, one can show that the equilibrium contributions paid by the lobbies to the government area function of the bargaining power of the agents vis a vis the principal. As Grossman and Helpman (1994)point out, if there is only one lobby interacting with the elected politician, the lobby will capture all thesurplus from the relationship, keeping the policy maker at the same welfare level as in a world with freetrade and no payments carried out by the lobby. On the other hand, if all sectors are organized, the policyimplemented will be free trade - thus no favor will be received by any lobby in the political equilibrium -and the government will capture all the surplus from the relationship (page 845–847). For more on thisimportant issue, see also Goldberg and Maggi (1999) and Dixit, Grossman, and Helpman (1997).
14See Milyo, Primo, and Groseclose (2000) and the discussion contained in section 4. For recent contribu-tions theoretical models of informational lobbying, see Bennedsen and Feldman (2006), Dahm and Porteiro(2004) and Lohmann (1995).
10
each sector as the result of expenditures by a pro–migration lobby (made up by capital
owners) and by an anti–migration lobby (made up by workers). In particular, we will carry
out our analysis assuming that ωi(qi) − 1 = λ(EiL)2 − (1 − λ)(EiK)2, where λ represents
the weight of labor in the protection function and (1− λ) the weight of capital. Notice that
the protection function is increasing in the expenditures of organized workers and decreasing
with the expenditures undertaken by the owners of capital. Furthermore, we assume increas-
ing returns to lobbying, to reflect the real world observation that larger donors command
disproportionately greater influence (Eicher and Osang 2002). The two lobby then play a
non-cooperative game where they choose the amount to pay in order to maximize their net
welfare, given by
ΩiK(qi) = ViK(qi)− EiK
ΩiL(qi) = ViL(qi)− EiL
Assuming for simplicity that γi = 1 for all i,15 the two first–order conditions are given by
[−Li + αiK
∂T (ω(q))
∂ωi
]∂ωi
∂qi
∂qi
∂EiK
= 1 (7)
[`i + αiL
∂T (ω(q))
∂ωi
]∂ωi
∂qi
∂qi
∂EiL
= 1 (8)
To interpret equations (7) and (8), notice that the first term on the left hand side – in
brackets – represents the impact of a change in the return to labor on the welfare of the
lobby, and the product of the second and third terms represents the marginal effect of one
dollar of expenditure on the return to labor. Thus, the left hand side equals the marginal
benefit brought about to the lobby by a dollar of expenditure, and that has to be equal to
the marginal cost 1 in the right hand side. Assume that the domestic labor demand is linear,
i.e. that it takes the form
Li = L− bωi (9)
and that, for simplicity, the ownership of capital in the population is highly concentrated
(αiK = 0 for all i).16 Solving simultaneously the system of equations given by (7) and (8),
15Assuming impartial rent capturing, i.e. γi < 1, complicates the algebra without changing the mainresult. For an analysis that includes imperfect capturing, see Facchini and Willmann (2005) and Facchiniand Testa (2006).
16Formally, we are assuming that the production function in each sector takes the form yi = Lb Li − 1
2bL2i ,
where L, b > 0. The corresponding profit function (return to the specific factor) is then given by π =L2
2b + b2ω2
i − Lωi.
11

the quota chosen by the domestic government is equal to
qi =L− b
2− `i
2
[αiL + 1
αiL
]+
1
2αiL
[1− λ
λ
EiK
EiL
](10)
Thus, ceteris paribus, sectors in which unions are more active and spend larger amounts
have higher protection (i.e., smaller quotas) granted to domestic labor, while sectors where
capital’s expenditures are higher will have less restrictive migration policies, i.e. larger
quotas.
How likely is it that the observed number of migrants is the result of the working of the
political-economy forces we have modeled? In other words, could it be the case that the
actual number of migrants is the result of shocks occurring on the supply side of migration,
rather than of the policy actually implemented by the Host country? To answer this question,
consider the possibility that, after a restrictive quota has been introduced, a supply shock
occurs in the international market, that increases the wage prevailing in the rest of the world
from 1 to w′ (Figure 1). This could be, for example, the result of a technological improvement
in the source country that lifts the average wage individuals can earn by staying put. Better
opportunities in the rest of the world imply that the potential migrant will need to re–
evaluate his decision to relocate. In particular, in our simple model he will be moving only
if the wage he can earn in the destination country is higher than the wage he can fetch in
the rest of the world. Thus, as a result of the upward shift in the international labor supply
(from LSw to LS′
w ) two possible scenarios can arise. They are illustrated in panel (a) and (b) of
Figure 1 where Ld and lS are, respectively, the labor demand and the domestic labor supply
in the destination country, and q is the quota set by the government.
Panel (a) describes the case in which the original quota set by the Host country continues
to be binding after the shock. In this situation, the wage wq determined by the quota is
still above the wage prevailing in the rest of the world after the shock, and the number of
migrants effectively admitted to the Host country continues to be determined by the Host
country’s restrictive policy. In panel (b) instead, the shock to the international factor price
is substantial and the wage prevailing in the international market is above wq, the quota
determined wage. As a result, the quota is no longer binding, and the number of migrants
actually willing to relocate to the Host country is lower than the one set by the quota and
equal to Ld(ω′)−`S, while the equilibrium wage prevailing in the destination country is given
by ω′. In this case, the political economy forces no longer play a role is shaping the volume
of migrants, which is instead purely determined by market forces, i.e. by the intersection
between domestic labor demand and international labor supply. Therefore, it is important
12
to point out that, for the supply side considerations to play a role in shaping the equilibrium
outcome in this simple model, a very large shock must occur, that makes the policy choice
of the host government irrelevant. Whether supply side considerations play a role is thus an
empirical matter, which will be addressed in section 6.
4 Lobbying expenditures
In the United States, special interest groups can legally influence the policy formation process
through two main channels. On the one hand, they can offer campaign finance contributions,
while on the other they can carry out lobbying activities. Campaign finance contributions
and, in particular, contributions by political action committees (PAC) have been the focus
of the literature (see for example Snyder 1990, Goldberg and Maggi 1999, Gawande and
Bandyopadhyay 2000). Yet PAC contributions are not the only route by which interest
groups’ money might be able to influence policy makers and, given the existing limits on the
size of PAC contributions (see Milyo, Primo and Groseclose, 2000 for details), it is likely that
they are not the most important one. It has been pointed out that lobbying expenditures
are of “... an order of magnitude greater than total PAC expenditure” (Milyo, Primo, and
Groseclose 2000). Hence, it is surprising that so few empirical papers have looked at the
effectiveness of lobbying activities in shaping policy outcomes. To the best of our knowledge,
only a recent article by de Figueiredo and Silverman (2006) has taken a close look at this
issue.17
One important reason for this relative lack of interest is that, while PAC contributions
data has been readily available and PACs can be linked to a corporate or industry sponsor,
only with the introduction of the Lobbying Disclosure Act of 1995, individuals and organi-
zations have been required to provide a substantial amount of information on their lobbying
activities. Starting from 1996, all lobbyists must now file semi–annual reports to the Secre-
tary of the Senate’s Office of Public Records (SOPR), listing the name of each client (firm)
and the total income they have received from each of them. At the same time, all firms with
in-house lobbying departments or hired lobbyists are required to file similar reports stating
the dollar amount they have spent.18 Importantly, legislation requires the disclosure not only
17In particular, the authors find that for a university with representation in the House or Senate appro-priations committees, a 10% increase in lobbying yields a 3 to 4% increase in earmark grants obtained bythe university.
18A firm could be a subsidiary of a parent firm or the parent firm itself if there are no subsidiaries. In theformer (latter) case, CRP provides lobbying expenditures data at the subsidiary (parent-firm) level. Notice
13

of the dollar amounts actually received/spent, but also of the issues for which lobbying is
carried out (Table A1 shows a list of 76 issues at least one of which has to be entered by the
filer). Finally, the reports must also state which chamber of Congress and which executive
departments or agencies were contacted. A sample lobbying report filed by Microsoft for
its lobbying activities between January - June, 2005 is shown in Table A2. Thus, the new
legislation provides access to a wealth of new information, and the purpose of this paper is
to use this information to assess how lobbying influences migration policy and outcomes.
The data on lobbying expenditures is compiled by the Center for Responsive Politics
(CRP) in Washington D.C., using the semi-annual lobbying disclosure reports, which are
posted in its website. The reports analyzed by CRP cover lobbying activity that took place
from 1998 through 2006 (due to unavailability of data on other variables, we restrict the
empirical analysis in this paper to the period 1998-2005). Annual lobbying expenditures and
incomes (of lobbying firms) are calculated by adding mid-year totals and year-end totals.
Whenever there is a discrepancy between data on income and expenditures, CRP uses infor-
mation from lobbying reports on expenditure. CRP also matches each firm to an industry
(Table A3 shows the list of about 90 industries used by CRP). Further details about the
data on lobbying expenditures are discussed in the Data Appendix.
We define “overall” or “total” lobbying expenditures in an industry as the sum of lobbying
expenditures by all firms in that industry on any issue. The lobbying expenditures for
immigration-related issues in an industry are calculated using a three-step procedure. First,
only those firms are considered which list “immigration” as an issue in their lobbying report.
The lobbying dataset comprises an unbalanced panel of a total of about 15,000 firms, out
of which about 700 list immigration as an issue in at least one year. Second, the total
expenditure of these firms is split equally between the issues they lobbied for. Finally, these
firm-level expenditures on immigration are aggregated for all firms within that industry.
As shown in Table 1, between 1999 and 2004, interest groups have spent on average about
3.8 billion U.S. dollars per political cycle on targeted political activity, which includes PAC
campaign contributions and lobbying expenditures.19 Lobbying expenditures represent by
far the bulk of all interest groups money (close to ninety percent). Therefore, the focus of the
that different subsidiaries of the same parent firm can be associated with different industries. Finally, thelist of firms includes associations of firms.
19We follow here the literature that excludes from targeted-political-activity figures “soft money” contribu-tions, which went to parties for general party–building activities not directly related to Federal campaigns;in addition, soft money contributions were not subject to any limits and cannot be associated with anyparticular interest or issue (see Milyo, Primo and Groseclose, 2000 and Tripathi, Ansolabehere, and Snyder2002). Soft money contributions have been banned by the 2002 Bipartisan Campaign Reform Act.
14
international economics literature on the role of PAC contributions in shaping policies might
be limiting for at least two reasons. On the one hand, PAC contributions represent only
a tiny fraction of interest groups’ targeted political activity (10 percent), and any analysis
of the role of lobbies in shaping policy based on only these figures could be misleading.
Second, linking campaign contributions to particular policy issues is very difficult and often
requires some ad-hoc assumption. For instance, in their pioneering work on the estimation of
Grossman and Helpman (1994) protection for sale model, Goldberg and Maggi (1999) have
used minimum PAC expenditure thresholds to identify whether a sector was organized or not
from the point of view of trade policy determination. The availability of direct information
on the main purposes of the lobbying activity provides a clear advantage in linking lobbying
expenditures to actual outcomes.
The importance of doing so is shown in Figure 2 (on average over three election cycles),
where on the top panel we have scatter plots of overall lobbying expenditures and PAC
contributions, while on the bottom panel we have a plot of lobbying expenditures associated
with immigration policy and PAC contributions. We find a very high correlation between
total lobbying expenditures and PAC contributions across sectors. The correlations (not
shown) are qualitatively similar when we look year-by-year. This result is consistent with
the political science literature and may suggest that PAC contributions are integral to groups’
lobbying efforts and even buy access.(Tripathi, Ansolabehere, and Snyder 2002). In contrast,
the very low correlation between PAC contributions and lobbying expenses for migration
policy is striking. It suggests that, if we were to use the data on PAC contributions –
assuming they are associated with immigration – we might obtain misleading results; hence
the use of our new dataset is fundamental in order to clearly identify how lobbying affects
migration policy.
5 Other Data
The information on lobbying expenditures is merged with data from the Integrated Public
Use Microdata Series - Current Population Survey (IPUMS-CPS) for the years between 1998
and 2005. The IPUMS-CPS data set is based on the March Annual Demographic File and
Income Supplement to the Current Population Survey (CPS). It contains individual-level
information on a range of socio-economic characteristics, such as: education level; industry;
employment status; birthplace; year of immigration; nativity (foreign-born vs. native-born);
union membership; wages and salary income.
15

The analysis is restricted to individuals aged 18-64 who participate in the civilian labor
force. Natives are defined as native-born respondents, regardless of whether their parents
are native-born or foreign-born. Immigrants are defined as foreign-born individuals, either
naturalized or non-citizens. Respondents born abroad who are citizens only by virtue of being
born to U.S. parents are excluded from both groups. Following the theoretical model, the
workers are differentiated according to their industry of employment. The variable ind1950 in
the IPUMS-CPS is used to obtain information on the industry in which the worker performs
or performed – in his most recent job, if unemployed at the time of the survey – his or
her primary occupation. This variable uses the 1950 Census Bureau industrial classification
system consistently across the years. The list of CPS industries is shown in Table A4.20
The IPUMS-CPS data set contains information at the individual level. The following
variables are constructed by aggregating the individual-level data to the industry level –
total number of immigrants, total number of natives, fraction of union members, fraction
of unemployed, and mean weekly earnings. To construct the latter three variables, we
restrict the sample to natives. The fraction of natives who are union members in each
industry represents our measure of political organization of labor in that industry. The
weekly earnings are deflated using the U.S. GDP deflator from the IMF. All the variables
are constructed using sampling weights as recommended by the IPUMS-CPS.
We also gather data on other control variables at the industry level. The data on output,
price and (inward) foreign direct investment (FDI) at the industry level is from the Bureau
of Economic Analysis. Gross output represents the market value of an industry’s production
in current dollars, and the price index is based on year 2000 = 100. The data on domestic
capital (in millions of current dollars) by industry is from the Annual Capital Expenditures
Survey (ACES) carried out by the U.S. Census Bureau. Gross output, prices and FDI are
available for all years between 1998 and 2005, but the capital data is not yet available for
2005. The data on output, price, FDI and domestic capital is defined for industries according
to the 1997 North American Industrial Classification System (NAICS).
Finally, we collect data on two additional variables to measure push factors for migrants
in source countries. First, we construct a measure of shocks in source countries, which is
industry specific. We use information on developing country-years in which there was a
shock as captured by a war, earthquake, wind storm or drought. The data on wars is from
a database compiled by the Heidelberg Institute for International Conflict Research and the
20In the census bureau classification, non-profit membership organizations (or unions) are treated as aseparate industry (CPS code = 897). We drop these, since unions are assumed to be anti-migration in themodel and are analyzed separately from pro-business lobbies.
16
World Bank; the data on other shocks is from Ramcharan (2007). In particular, the industry-
specific measure of shocks is equal to a weighted average of the shocks in each origin country,
with weights equal to the share of immigrants in that industry from each origin country.
The second measure of push factors in source countries is the average (monthly) earnings in
Mexico which, in the period considered in our sample, is by far the most important country
of origin of U.S. immigrants.21 The data on Mexican earnings is taken from the monthly
industrial surveys for 205 manufacturing industries (Encuesta Industrial Mensual 2).
As for the dependent variable of our analysis, in addition to using information on the
number of immigrants, we also use data on the number of visas at the industry level, which
is a more direct measure of immigration policy. The only type of visas for which information
is available at the industry level is the employment-based H1B visas. The data is obtained
from the United States Citizenship and Immigration Services (USCIS), which is part of the
Department of Homeland Security (DHS). Under the H1B program, “specialty” workers
are permitted to be employed for up to three years with the possibility of an extension not
exceeding three more years. In order to sponsor a foreign worker under the H1B program, an
employer must first file an application with the Department of Labor. Once the Department
of Labor certifies the application, U.S. employers file a petition with the USCIS to sponsor
the foreign worker for an H1B visa. The data from the USCIS is, thus, based on the total
number of petitions which have been approved. The petition may be filed to sponsor the
foreign worker for an initial period of H1B employment or to extend the authorized stay.
The data on H1B petitions approved at the firm level is aggregated by the USCIS at the
industry level according to the NAICS classification.
In order to match the CPS data with that on lobbying expenditures and on the other
variables and create an industry-level dataset, we construct separate concordances of (i)
CRP, (ii) NAICS and (iii) Encuesta Industrial Mensual 2 classifications to the 1950 Census
Bureau industrial classification. Concordances are complicated by the fact that there is
not always a one-to-one correspondence between two sectors in any two classifications. In
the case where there are, for example, multiple CPS industries corresponding to a given
CRP industry, the lobbying expenditures are divided among CPS industries according to
the share of natives in each CPS industry. Next, in order to take into account the cases
where one CPS industry is matched to many CRP industries (which is often the case), the
data is summed and collapsed at the CPS industry level. Similar procedures are adopted for
21In 2004, the 10.5 million Mexican immigrants living in the United States were 31 percent of the U.S.foreign-born population (Hanson 2006).
17
matching the data on output, price, FDI, domestic capital and the number of H1B visas to
the CPS dataset. Using the number of immigrants as the dependent variable, our dataset
covers about 130 3-digit industries. The sample with the number of visas is slightly smaller
and includes approximately 120 observations.
5.1 Summary statistics
Figure 3 presents the evolution of real lobbying expenditures over time. The nominal ex-
penditures are deflated using the U.S. GDP deflator constructed by the IMF. The left scale
shows the overall expenditures and the right scale shows the expenditures for issues related to
immigration. While the overall real lobbying expenditure has grown by over 40 percent from
US$1.4 bn to US$2.1 bn between 1998 and 2005, the expenditure for immigration-related
issues has grown by only about 10 percent from US$19 to 21 mn over the same period. The
share of immigration in overall lobbying expenditures has been roughly constant at about
1%. In comparison, expenditures on trade comprise 4-5% of overall lobbying expenditures.
On average, an industry spent US$16 mn in 1998 on lobbying activities, an amount which
increased to US$23 mn in 2005. For immigration, the average expenditure by an industry
was approximately constant at US$0.3 mn throughout the period (Table 2).
Figure 4 shows the top 10 industries according to expenditures on lobbying for immi-
gration in 2005, according to the CRP industry classification. Hospital & Nursing Homes
and Computers/Internet are the top spenders on lobbying for immigration. Among the top
10 spenders we also find Agricultural Services/Products and Education. Figure 5 shows
instead the top 10 sectors (by the Census Bureau classification) with the highest number of
immigrants in 2005. Construction, Eating and Drinking Places and Business Services are,
not surprisingly, at the top of the list, with a stock of 2.5, 1.7 and 1.2 million immigrants
respectively in 2005. Medical and Other Health Services, Hospitals and Agriculture also
appear at the top of the list. It is interesting to note that at least four industries with very
high expenditures on immigration (agriculture, education, business services and hospitals)
are also among those with the highest number of immigrants.
Before proceeding to the regression analysis, it is instructive to document bivariate re-
lationships between key variables using simple scatter plots. Figure 6 suggests a positive
correlation between lobbying expenditures for immigration and the number of immigrants
(both variables are, in this graph, averaged across the years 1998-2005). We find very similar
evidence year by year, between 1998 and 2005 (not shown). Thus, these basic scatter plots
suggest that sectors with larger lobbying expenditures on immigration are characterized by a
18
higher number of immigrants. The relationship between union membership rates and num-
ber of immigrants is instead negative, that is sectors with higher union densities have fewer
immigrants, both on average over the period (Figure 7) and year by year, between 1998 and
2005 (not shown).
Finally, the cross-sectional relationship between the lobbying expenditures / union mem-
bership rates and the number of H1B visas approved by the Department of Homeland Se-
curity (DHS) are shown in Figures 8 and 9. The simple correlations indicate that industries
with higher lobbying expenditures on immigration have a larger number of visas approved by
the DHS. In addition, industries with lower union membership rates have a larger number of
visas approved by the DHS. Of course, the scatter plots are only suggestive, and the purpose
of the remainder of the paper is to examine the robustness of the simple correlations.
6 Empirical analysis
The model in Section 3 shows that barriers to migration are a function of the lobbying
expenditures of the two factors of production in each industry – labor and capital. Ceteris
paribus, in sectors where labor is more politically organized and therefore spends more in
lobbying activity, native workers receive higher protection, that is the number of immigrants
is lower. However, ceteris paribus, in sectors where capital is more politically active and
therefore invests more in lobbying expenditures, native workers receive lower protection,
that is the number of immigrants is higher. We bring the theoretical predictions of the
model to the data using a reduced-form approach. In particular, we make use of the rich
dataset on business lobbying expenditures and union membership rates to ask the following
question: are sectors with a higher degree of organization of labor (capital) associated with
lower (higher) immigration?
The theoretical model is based on a short-run view of the economy in which factors are
sector-specific or, in other words, labor markets are segmented by industry. Therefore, in
order to evaluate the predictions of the model, we investigate the variation in the number
of immigrants across industries. In addition, the theoretical model assumes that migration
policy is set at the sectoral level. While we recognize that U.S. policy is not characterized
by explicit migration quotas by industry,22 we hypothesize that implicitly policymakers set
22By quotas we mean the number of immigrants (or visas) that policymakers set ex ante. Quotas arepublished at an aggregate level. For example, the US Immigration Act of 1990 set a flexible cap for US legaladmissions at 675,000 individuals of which 480,000 are to be family based, 140,000 are to be employmentbased, and 55,000 are to be diversity immigrants. (Hanson, 2006). There are also ex-ante caps for some of
19

migration policy along sectoral lines. This is consistent with anecdotal evidence. For ex-
ample, visas for highly skilled workers – i.e. those following for example in the H1B or L1
cathegories – are allocated to specific firms and, therefore, are industry-specific. Whether
the above two assumptions are true or not is what we test in the empirical analysis. Finally,
since the theoretical model – which is static – focuses on cross-industry differences in protec-
tion rates of workers, we use data which is averaged over the eight years between 1998 and
2005, that is we only exploit the cross-sector variation in the data. This empirical strategy is
consistent with the fact that most of the variation in lobbying expenditures is across sectors
rather than over time.
The predictions of the theoretical model pertain to migration restrictions. However, as
the dependent variable of our empirical analysis, we use the (log) number of immigrants to
the U.S. by industry, i.e. an equilibrium outcome. Obviously, this is not the most direct
measure of migration restrictions. Ideally, we should use a policy measure – such as migration
quotas – which is independent of supply-side factors. There are three key reasons why we
use the number of immigrants rather than a direct measure of immigration restrictions.
First, there is substantial anecdotal evidence that quotas are binding in the United States
and this implies that changes in the number of migrants coincide with policy changes. For
instance, it is well known that the H1B visa quotas are regularly filled within the first few
months of each calendar year. Similarly, to obtain a permanent resident permit, the standard
waiting time is more than 3 years even if the candidate fulfills all the necessary requirements.
The second important advantage of using the (log) number of immigrants as our dependent
variable is that this is a comprehensive measure of the number of immigrants who enter
the U.S., either legally or illegally, temporarily or permanently. Thus, the total number of
immigrants to the U.S. is a reasonable proxy for a broader migration-policy variable. Finally,
as mentioned above, migration quotas which are publicly announced by policy makers are
not at a disaggregate level, hence we do not have data on a direct policy measure at the
industry level.
The two key explanatory variables of our empirical analysis are the log(lobbying exp),
which measures the extent of political organization of capital and the union membership
rate, which measures the extent of political organization of labor. Thus, while we have
direct information on the lobbying expenditures by capital owners (identified by firms in
the lobbying dataset), our measure of lobbying expenditures by workers is only indirect. In
the visa letters. The annual ceiling on H1B petitions valid for initial employment was increased from 65,000to 115,000 in fiscal years 1999 and 2000, and to 195,000 in 2001, 2002 and 2003. Since 2004, the ceiling hasbeen reduced to 65,000.
20
particular, we assume that in sectors where the union membership rate is higher, the free-
rider problem associated with lobbying is less pronounced. That is, in those sectors there
exist fewer non-union members (free-riders) who benefit from policies brought about by the
lobbying activity and, therefore, the contributions by labor associations and worker unions
tend to be higher. The remainder of the section presents our results.
6.1 Main results
Table 3 presents the main results of the empirical analysis and provides evidence which is
consistent with the theoretical predictions. In Table 3, as well as in all the other tables,
standard errors are robust to account for heteroscedasticity. In regressions (1)-(2), we find
a positive and significant (at the 1% level) coefficient on log(lobbying exp), and a nega-
tive and significant (at the 1% level) coefficient on union membership rate. These results
suggest that barriers to migration are lower in those sectors in which business lobbies are
more active, and higher in sectors where labor unions are more important. The two key
variables of the empirical analysis explain 35% of the variation in the number of immigrants
across sectors (regression (2)). In fact, log(lobbying exp) alone explains 30% of the varia-
tion. The magnitude of the coefficients (0.428 for log(lobbying exp) and −3.207 for union
membership rate in regression (2)) implies that a 10% increase in the size of the industry’s
lobbying expenditures raises the number of immigrants to that industry by 4.3%, while a
one-percentage-point increase in union density – for example, moving from 10 to 11 percent-
age points, which amounts to a 10% increase in union membership rate – reduces it by 3.2%.
We test the robustness of these results in columns (3)-(10) where we introduce a number of
industry-level control variables.
Our first concern is that our estimates might be driven by differences in sizes of sectors:
bigger sectors both employ a higher number of workers – both native and immigrant ones
– and can spend larger sums on lobbying activity, which would create an upward bias in
our estimate of the coefficient on log(lobbying exp). Therefore, in regression (3), we control
for the value of output produced in each industry, which positively and significantly affects
the number of immigrants. The lower estimated coefficient on log(lobbying exp), after intro-
ducing the control variable log(output), is indeed consistent with the hypothesized positive
omitted variable bias.23
23In addition, we obtain very similar results when we control for the number of natives (see Table A5).We do not control for the number of natives in the basic specification due to multicollinearity issues (thecorrelation between output and number of natives is about 0.8 in the data).
21

In column (4), we introduce the industry-specific unemployment rate, which is likely to
be correlated with both the demand for foreign workers in that sector and the union mem-
bership rate. The sign of the correlation between union density and the industry-specific
unemployment rate is a priori ambiguous. On the one hand, in sectors with higher unem-
ployment rates, workers feel a bigger threat of being fired, which increases their incentive
to join unions. On the other, in sectors with higher unemployment rates, the bargaining
power of unions is lower, which implies that union densities are lower as well. A possible
interpretation of the positive coefficient on unemployment rate is that in sectors where la-
bor market regulations play a bigger role and, therefore, unemployment rates are higher
(Scarpetta (1996) and Elmeskov, Martin, and Scarpetta (2005)), firms may prefer to hire
immigrants - who can be more easily fired, have lower reservation wages, do not need to be
paid the minimum wage, etc.
Regression (5) controls for the price of the good produced in a sector. We expect a
positive price shock in an industry to increase the marginal revenue product of labor, i.e. to
raise the overall demand for workers in that sector (and hence the number of immigrants). In
addition, in regressions (6) and (7) we control for the value of capital (domestic and foreign)
used in each industry: since capital and labor are complements, sectors which use more
capital should also be characterized by higher overall demand for workers and, hence, a larger
number of immigrants. The results suggest that, output prices have an insignificant effect on
immigration in most of the specifications. Furthermore, we find that while domestic capital
and immigrant labor are complements, the same is not true for foreign capital. Sectors with
higher FDI are associated with a lower number of immigrants. Our main findings survive all
these robustness checks in columns (3) to (7). The magnitude of the estimated coefficients
on lobbying expenditure and union membership rates are only marginally affected by the
introduction of the control variables: they remain of the same sign and significance levels.
As mentioned above, we use the number of immigrants as a proxy for migration restric-
tions. This is justified by the fact that migration quotas are likely to be binding, for the most
part, in the United States. However, to address the possibility that this assumption does not
hold, we test the robustness of our results by including variables that affect the willingness
of migrants to move and, therefore, the number of immigrants if migration quotas are not
binding. First, in regression (8), we control for negative shocks – such as wars, earthquakes,
windstorms or droughts – taking place in the origin countries of immigrants working in any
given industry (shocks). The positive coefficient on shocks is as expected. Shocks create a
push factor and increase the willingness of migrants to leave their origin countries. Sectors
22
with larger shocks supply a greater number of immigrants. In column (9), we account for
pull factors by including the (log) U.S. lagged wages. Finally, in regression (10), we also
control for push factors in the form of (log) Mexican wages.24 Due to data unavailability,
the inclusion of (log) Mexican wages reduces substantially the number of observations. Once
again, we find that our results are robust to the introduction of these additional control
variables. Regression (9) represents our preferred specification.
Although we have checked the robustness of our results to the introduction of a number of
control variables, we are still concerned that our estimates might be driven by endogeneity
and reverse causality. It is especially important to address endogeneity of our two key
variables, as lobbying expenditures by capital and labor are endogenous in the theoretical
model itself. It is not clear ex ante how reverse causality might affect the estimates. On
the one hand, sectors with higher numbers of immigrants may already be close to their
optimal levels, which would decrease their incentive to invest in lobbying expenditures. In
this case, our estimates would be biased towards zero. On the other, sectors with higher
numbers of immigrants might find it necessary to increase their lobbying activity in order
to solve problems related to the large pool of immigrants they hire (such problems might
include access of immigrant workers and their children to education, health, etc.). In this
case, the estimate on lobbying expenditures would be biased upwards, i.e the true effect
would be lower than the estimated effect. Similarly, it is possible that sectors with higher
number of immigrants have either higher or lower union densities. The first case is possible
if higher number of immigrants in a sector increase the threat felt by native workers in labor
markets and, therefore, their incentive to join unions. On the other hand, in sectors with
larger pools of immigrants, the bargaining power of unions might be lower, which means
that union densities will be lower as well.
We address reverse causality and other sources of endogeneity by using an instrumental-
variable estimation strategy. We use two instruments for log(lobbying exp). First, we con-
struct an industry-level measure of lobbying expenditures by firms in each sector which do
not list migration as an issue in their lobbying reports. Out of a total of about 15,000
firms in the lobbying dataset, the majority (95 percent) does not list immigration as an
issue. We assume that these firms’ lobbying expenditures on issues other than immigration
24Both US and Mexican wages also affect the (economic) demand for workers in the destination and origincountries, which is relevant for the interpretation of their coefficients. The negative coefficient on the log(lagUS wages) is consistent with a demand-side interpretation rather than a supply-side one. In other words,industries in the U.S. where wages are higher (lower) demand fewer (more) immigrants. On the other hand,the estimated positive coefficient on Mexican wages (although insignificant) could mean that sectors withhigher Mexican wages have lower demand for Mexican workers, and hence supply more immigrants.
23

do not affect migration directly (exclusion restriction). At the same time, it is likely that
industry-level factors affect lobbying expenditures of all firms in a given sector, no matter
what issues firms are interested in. For example, lobbying activity is in general determined
by factors like the number of firms, the size distribution of firms within a sector, geographic
concentration, etc. Therefore, we expect this instrument to be correlated with the lobbying
expenditures of firms who lobby for migration (first stage).
As an additional instrument for lobbying expenditures on migration, we use a variable
that measures the concentration of firms in a sector. In doing so, we follow the trade literature
which uses traditional political economy variables to instrument for campaign contributions
(Goldberg and Maggi 1999 and Gawande and Bandyopadhyay 2000). In particular, our
measure of concentration is the variance of firm size (proxied by annual payroll) within a
sector. The idea is that the more concentrated a sector is (the higher the variance in firms
size), the easier it is for firms in that industry to overcome the collective action problem
in forming a lobby, therefore the larger the lobbying expenditures (Olson 1965, Bombardini
2005). The data on annual payroll of firms is obtained from the US Census, County Business
Patterns (http//www.census.gov/csd/susb/defterm.html).
Next, our instrument for the union membership rate uses data from the United Kingdom
on union densities across industries. According to the literature, union membership rates
are positively correlated across a wide set of industrialized countries (see Riley 1997, Blanch-
flower 2007) (first stage). Industries which exhibit a level of work standardization, and a
clear distinction between managerial and operative tasks facilitate unionization, in that these
working conditions lead to inter-group homogeneity as well as distinct group boundaries. His-
torical roots of collective bargaining in sectors such as manufacturing further strengthen the
recruitment position of unions. The characteristics of union members show many similarities
across countries, which are unlikely to be explained by country-specific institutional features.
In addition, it is plausible to assume that UK union membership rates do not directly affect
the number of immigrants in the U.S. (exclusion restriction).
The very high values of the two first-stage F statistics for the excluded instruments at
the end of Table 4a suggest that the instruments are strong. In regression (1), Table 4a,
in the first stage of log(lobbying exp), the F value of the excluded instruments is approxi-
mately equal to 133; in the first stage of union membership rate, the F value of the excluded
instruments is approximately equal to 28. In Table 4b, the first stage regressions suggest
that lobbying expenditures on immigration are positively and significantly correlated with
expenditures on other issues and with the degree of concentration in the sector. In addi-
24

tion, union membership rates in the US are positively and significantly correlated with the
corresponding rates in the UK. The Hansen’s test for overidentifying restrictions is satisfied
at the 1 percent significance level (i.e., we cannot reject the null hypothesis of zero correla-
tion between the estimated residuals and the excluded instruments). In addition, and most
importantly, the results in Table 4a from the IV regressions, with and without controls,
confirm that the number of immigrants is higher in sectors where business lobbies are more
active, and lower in sectors where labor unions are more important. The magnitude of the
coefficients on both lobbying expenditures and union membership rates increase relative to
Table 3 (columns (2) and (9)). The difference in the magnitudes possibly provide evidence
for a negative correlation between lobbying expenditures and the unobserved component of
immigration (i.e., sectors with a higher number of immigrants contribute less possibly be-
cause they are closer to their ideal number of immigrants); and also a positive correlation
between union membership rates and the unobserved component of immigration (i.e., in
sectors with a higher number of immigrants, natives feel a stronger threat, which increases
their incentives to join unions). However, the difference between the magnitudes of the IV
and OLS could also be explained by measurement error in the key explanatory variables
leading to attenuation bias in the estimates.
To the extent that we do not have a clean natural experiment to identify the effects
of lobbying on immigration, the instrumental variables’ estimates should be interpreted
with appropriate caution. For example, it might be the case that lobbying expenditures on
policy issues other than immigration draw resources and policymakers’ attention away from
migration and, thus, directly influence (reduce) the number of immigrants. However, in that
case, the IV estimate would be biased towards zero and, hence, represent a lower bound on
the true effect.
To summarize, our estimates suggest that a 10% increase in the size of lobbying expen-
ditures by business groups is associated with a 1 – 5 percent larger number of immigrants,
while a one-percentage point increase in the union membership rate is associated with a
1 - 7 percent lower number of immigrants. The results are robust to the introduction, in
the estimating equation, of a number of industry-level control variables and to using an in-
strumental variable strategy to address the endogeneity of lobbying expenditures and union
membership rates.
25

6.2 Additional results
We next investigate how our previous results change when we consider alternative measures
of migration. In Table 5, as the dependent variable, we use the (log) number of approved
H1B petitions in the United States, averaged between 2001 and 2005. This is an important
extension, as it can be argued that the number of H1B visas is more closely under the control
of the policy maker than the actual number of migrants. In addition, while our theoretical
model makes predictions in terms of the stock of immigrants – which is how we measure
migration in Table 3 – it is important to verify the robustness of our results to using a flow
measure of the number of immigrants, which is what the H1B measure is. For this same
reason, in Table 6 we restrict the attention to recent immigrants who came to the United
States only after 1990. Our estimates in Tables 5 and 6 are indeed remarkably similar to
what we previously found in Table 3, and show that the results are robust to using stock or
flow measures of immigration. The estimates in Table 5 (regression 2) suggest that sectors
with 10 percent higher lobbying expenditures by business groups is associated with a 2.4
percent larger number of H1B visas approved by the DHS; while a one percentage point
increase in the union membership rate is associated with 4 percent lower number of visas.
In Table 7, we explore whether we would have obtained similar results using an alternative
measure of political organization of capital, namely campaign contributions from Political
Action Committees (PAC). Data on PAC campaign contributions has been used extensively
in the international economics literature, but does not allow us to disentangle the different
purposes for which a contribution is made (see for example, Goldberg and Maggi 1999, and
Gawande and Bandyopadhyay 2000). When we use this proxy for the political organization
of capital, we find the estimates of the coefficient on log(campaign contributions) to be
either marginally or not significant at conventional levels (see first two columns in Table 7).
In addition, campaign contributions explain a very small fraction of the variation in number
of immigrants across sectors (about 3 percent). The data on campaign contributions by
PACs is compiled by two-year election cycles. For comparison, we also look at the impact
of log(lobbying exp) using data on lobbying expenditures which is aggregated over two-year
periods, covering the three election cycles 1999-2000, 2001-02 and 2003-04. The coefficient
on log(lobbying exp) is very similar to what we found in Table 3. In addition, the last
two columns in Table 7 – where we introduce both measures of political organization of
capital – clearly show that it is lobbying expenditures on migration, rather than campaign
contributions, that positively affect the number of immigrants. The results are striking and
cast doubt on the use of PAC campaign contributions data as an appropriate indicator to
26
examine the effect on policy outcomes.
In Table 8 we investigate whether the estimated effects of political organization of labor
and capital differ depending on the skill-intensity of the sectors. Is it the case that lobby-
ing is a more relevant channel to attract immigrants in sectors which are intensive in skilled
workers? In addition, is it true that lobbying is a more relevant channel to attract skilled im-
migrants? In order to answer these questions, first we divide sectors into unskilled-intensive
and skilled-intensive ones, based on whether the share of skilled workers is lower or higher
than the median across sectors (skilled workers are defined as having a college graduate
degree or higher), and run the regressions separately for the two groups. We do not find
significant differences in terms of the impact of log(lobbying exp). On the other hand, our
estimates show that unions have a more negative impact on the number of immigrants in
skilled-intensive sectors. This could possibly be due to the fact that unions are very pow-
erful in skill-intensive sectors (lawyers, doctors, etc.25).26 Finally, instead of splitting the
sectors into skilled and unskilled-intensive ones, we divide the dependent variable, i.e. the
total number of immigrants, into skilled and unskilled (skilled defined as having at least a
college graduate degree) (Table A8). Again, although the impact of lobbying expenditures
is similar for unskilled and skilled migration, the magnitude of the effect of unionization on
immigration is higher for skilled migrants. In other words, unions are relatively more effec-
tive in deterring skilled immigration. In fact, the difference in the effectiveness of unions in
deterring immigration is more prominent across unskilled vs. skilled intensive sectors, rather
than across different types of migrants within the same sector (Table A9).
Our last set of results appears in Table 9. In all previous tables, we have used union
membership rates as an indirect measure of lobbying expenditures by workers. However, this
measure does not allow us to compare the magnitude of the coefficients on the two types of
lobbying expenditures (labor vs. capital). To get around this problem, in Table 9 we use
total lobbying expenditures by unions in the economy (which are available in the CRP data
set)27 and divide them by the number of sectors. Next, we scale up or down this average
using the union membership rate in each sector relative to the average in the economy. The
underlying assumption is that the higher the union membership rate in a sector, the less
25See Glied and Sarkar (2005). For a discussion of the determinants of a union’s bargaining power, seeBoeri, Brugiavini, and Calmfors (2001).
26We find similar results when we use an alternative definition of skilled-intensive sectors based on averageyears of schooling (Table A6). The results (not shown) are similar when we use the mean, rather than themedian, to create the cut-off for skilled-intensive sectors. In addition, the results of Table 3 survive when wedrop one of the most unskilled sectors, the agricultural sector (see Table A7).
27CRP does not provide information on lobbying expenditures by unions at the sectoral level.
27
pronounced is the free-riding problem associated with lobbying and, therefore, the larger
are the lobbying expenditures by unions. We find that both log(capital lobbying exp) and
log(labor lobbying exp) are of the expected sign and significant at conventional levels. In ad-
dition, the magnitude of the estimates on the two key variables are not statistically different
(p-value = 0.89 in regression (2)), which suggests capital and labor lobbying expenditures
have opposite effects on immigration which are of similar magnitudes.
6.3 Robustness checks
We confirm the findings in Table 3 in a series of robustness checks in the Appendix tables. We
estimate the same specifications as in Table 3: using pooled – as opposed to averaged – data
(including year fixed effects) (see Table A10)28; constraining the sample of observations to be
the same across regressions (see Table A11); including observations corresponding to sectors
with zero lobbying expenditures (see Table A12)29; using data on the number of immigrants
from the 2000 U.S. Census (Table A13). We find broadly similar evidence when we run the
regressions year by year in Table A14 (though the coefficient on union membership rate is
not always significant, possibly due to fewer observations and to the fact that some unions
in the U.S. reversed their position towards immigration around 2000).30
Finally, we also use alternative measures of lobbying expenditures on immigration. As
discussed above, in Table 3 log(lobbying exp) is calculated by dividing the total expenditure
of a firm – that lists migration as an issue – by the total number of issues listed in the
lobbying report (firm expenditures are then summed for each sector). In Table A15, instead,
we consider firms which list “immigration” as an issue in their reports and take their total
(as opposed to split) lobbying expenditure. Thus, this alternative measure represents an
upper bound of the true lobbying expenditures on immigration. The estimated coefficient on
lobbying expenditures is very similar and not statistically different from the basic estimates
in Table 3.
28We also estimate the pooled regressions including industry (and year) fixed effects. The coefficient onlog(lobbying expenditure) remains positive and significant while the coefficient on union membership rateis not significant. This is not surprising given that, in the fixed-effects specification, we are only exploitingthe within industry time variation and, over time, some unions in the U.S. reversed their position towardsimmigration (Briggs 2001).
29The log specification in Table 3 drops the sectors with zero contributions. However, this is not a seriousissue as there are only 5 such sectors. In Table A12, the zero lobbying expenditures are replaced by theminimum value of lobbying expenditures in the sample.
30In addition, the data best fits a log specification (as opposed to one in levels). Also, there is not muchevidence of non-linear effects in lg(lobbying exp) and union membership rate (results not shown).
28

7 Conclusions
To the best of our knowledge, this paper represents the first study that attempts to provide
systematic empirical evidence on the political-economy determinants of US immigration,
focusing in particular on the role played by interest groups. To this end, we have started
our analysis developing a simple model that links migration policy outcomes to the intensity
of the lobbying activities carried out by pro and anti–immigration pressure groups. We
have then evaluated the predictions of the model using a new, industry-level dataset on
lobbying expenditures by organized groups, combining it with information on the number
of immigrants and visas and on union membership rates. The analysis provides strong
evidence that both pro- and anti-immigration interest groups play a statistically significant
and economically relevant role in shaping migration across sectors. Barriers to migration are
higher in sectors where labor unions are more important, and lower in those sectors in which
business lobbies are more active. The estimates suggest that a 10% increase in the size of
lobbying expenditures by business groups is associated with a 1 – 5 percent larger number of
immigrants, while a one-percentage point increase in the union membership rate (assumed
to be a proxy for lobbying expenditures by labor groups) is associated with a 1 - 7 percent
lower number of immigrants. The results are robust to the introduction, in the estimating
equation, of a number of industry-level control variables and to using an instrumental variable
strategy to address the endogeneity of lobbying expenditures and union membership rates.
The empirical results suggest that, although the US government does not explicitly set
migration quotas at a sectoral level, there does exist an implicit allocation of immigrants
across sectors. Moreover, political-economy forces play a quantitatively important role in
determining the cross-sectoral allocation of immigrants.
This paper focuses largely on the determinants of overall immigration (or skilled vs
unskilled immigration) across sectors. The analysis is based mainly on data from the CPS
(or the US Census), which defines an immigrant only by the country of birth. Further
empirical work could explore other sources of data to analyze the variation in alternative
measures of immigration – legal vs illegal, temporary vs permanent, etc. In addition, the
paper could also be extended to examine the variation in immigration policy and outcomes
along occupation and geographical dimensions (for example, across U.S. states).
Finally, firm-level data on lobbying expenditures can be exploited to study the importance
of political-economy forces in the determination of policies other than immigration – e.g.
trade, environment, taxes etc.
29

References
Amegashie, J. A. (2004). A political economy model of immigration quotas. Economics of
Governance 5, 255–267.
Bellettini, G. and C. Berti Ceroni (2006). Can unions hurt workers? A positive analysis
of immigration policy. Mimeo, University of Bologna.
Benhabib, J. (1996). On the political economy of immigration. European Economic Re-
view 40, 1737–1743.
Bennedsen, M. and S. E. Feldman (2006). Informational lobbying and political contribu-
tions. Journal of Public Economics 90, 631–656.
Bernheim, B. D. and M. D. Whinston (1986). Menu auctions, resource allocation, and
economic influence. Quarterly Journal of Economics 101, 1–31.
Blanchflower, D. G. (2007). International patterns of union membership. British Journal
of Industrial Relations 45, 1–28.
Boeri, T., A. Brugiavini, and L. Calmfors (Eds.) (2001). The role of Unions in the twenty
first century. Oxford and New York: Oxford University Press.
Bombardini, M. (2005). Firm heterogeneity and lobby participation. Mimeo, University
of British Columbia.
Borjas, G. J. (1994). The economics of immigration. Journal of Economic Literature,
1667–1717.
Borjas, G. J. (1995). The economic benefits from immigration. Journal of Economic Per-
spectives 9 (2), 3–22.
Briggs, V. J. (1998). Income disparity and unionism: The workplace influences of post-
1995 immigration policy. In J. A. Auerbach and R. S. Belous (Eds.), The Inequality
Paradox: Growth of Income Disparity, pp. 112–132. National Policy Association.
Briggs, V. L. (2001). Immigration and American Unionism. Ithaca, NY: Cornell University
Press.
Dahm, M. and N. Porteiro (2004). The carrot and the stick: Which is the lobbys’ optimal
choice? Mimeo, Northwestern University.
de Figueiredo, J. M. and B. S. Silverman (2006). The returns to lobbying: University
lobbying efforts and the allocation of ’earmarked’ academic grants. Journal of Law
and Economics 49, 597–626.
30
Dixit, A., G. Grossman, and E. Helpman (1997). Common agency and coordination:
General theory and application to goevrnment policy making. Journal of Political
Economy 105, 752–769.
Dixit, A. and V. Norman (1980). Theory of international trade. Cambridge, UK: Cam-
bridge University Press.
Eicher, T. and T. Osang (2002). Protection for sale: An empirical investingation. American
Economic Review 92, 1702–1710.
Elmeskov, J., J. Martin, and S. Scarpetta (2005). Key lessons for labor market reforms:
Evidence from oecd countries experiences. Swedish Economic Policy Review forthcom-
ing.
Facchini, G. (2004). The political economy of international trade and factor mobility: A
survey. Journal of Economic Surveys 18, 1–31.
Facchini, G. and A. M. Mayda (2006). Individual attitudes towards immigrants: Welfare
state determinants across countries. CEPR WP 5702.
Facchini, G. and C. Testa (2006). Who is agains a common market? Mimeo, Univeristy
of Illinois at Urbana Champaign.
Facchini, G. and G. Willmann (2005). The political economy of international factor mo-
bility. Journal of International Economics 67, 201–219.
Findlay, R. and S. Wellisz (1982). Endogenous tariffs, the political economy of trade
restricitions and welfare. In J. Bhagwati (Ed.), Import competition and response, pp.
158–187. Chicago: University of Chicago Press.
Friedberg, R. M. (2001). The impact of mass migration on the Israel labor market. Quar-
terly Journal of Economics 116, 1373–1408.
Gawande, K. and U. Bandyopadhyay (2000). Is protection for sale? Evidence on the
Grossman–Helpman theory of endogenous protection. Review of Economics and Statis-
tics 82, 139–152.
Gawande, K. and P. Krishna (2003). The political economy of trade policy: Empirical
approaches. In E. Choi and J. Harrigan (Eds.), Handbook of International Trade, pp.
213–250. Blackwell Publishing.
Glied, S. and D. Sarkar (2005). The role of professional societies in regulating entry
of skilled migrants: The american medical association. Mimeo, Columbia University
School of Public Policy.
31

Goldberg, P. K. and G. Maggi (1999). Protection for sale: An empirical investigation.
American Economic Review 89 (5), 1135–55.
Goldin, C. (1994). The political economy of immigration restriction in the United States,
1890 to 1921. In C. Goldin and G. Libecap (Eds.), The Regulated Economy: A Histor-
ical Approach to Political Economy, pp. 223–257. Chicago, IL: University of Chicago
Press.
Goldsborough, J. (2000). Out–of–control immigration. Foreign Affairs 79, 89–101.
Grossman, G. M. and E. Helpman (1994). Protection for sale. American Economic Re-
view 84, 833–850.
Hamilton, R. and J. Whalley (1984). Efficiency and distributional implications of global
restrictions on labour mobility. Journal of Development Economics 14, 61–75.
Hanson, G. (2006). Illegal migration from Mexico to the United States. Journal of Eco-
nomic Literature forthcoming.
Hanson, G. H., K. Scheve, and M. Slaughter (2007). Public finance and individual prefer-
ences over globalization strategies. Economics and Politics 19, 1–33.
Hanson, G. H. and A. Spilimbergo (2001). Political economy, sectoral shocks and border
enforcement. Canadian Journal of Economics 34, 612–638.
Helpman, E. (1997). Politics and trade policy. In D. M. Kreps and K. F. Wallis (Eds.),
Advances in Economics and Econometrics: Theory and Aplpications, Volume 1, pp.
19–45. Cambridge.
Krieger, T. (2005). Public Pensions and Immigration: A public policy approach. Chel-
tenham, UK: Edward Elgar.
Lohmann, S. (1995). Information, access and contributions: A signalling model of lobby-
ing. Public Choice 85, 267–284.
Mayda, A. M. (2006). Who is against immigration? A cross-country investigation of
individual attitudes toward immigrants. Review of Economics and Statistics 88, 510–
530.
Mazza, I. and F. van Winden (1996). A political economic analysis of labor migration and
income redistribution. Public Choice 88, 333–363.
Milyo, J., D. Primo, and T. Groseclose (2000). Corporate PAC campaign contributions in
perspective. Business and Politics 2, 75–88.
32

Olson, M. (1965). The Logic of Collective Action. Harvard University Press.
O’Rourke, K. H. and R. Sinnott (2004). The determinants of individual attitudes towards
immigration. European Journal of Political Economy 22, 838–861.
Ortega, F. (2005). Immigration policy and skill upgrading. Journal of Public Eco-
nomics 89, 1841–1863.
Pritchett, L. (2006). The future of migration: Accomodating irresistible forces and im-
movable ideas. mimeo.
Razin, A. and E. Sadka (1999). Migration and pension with international capital mobility.
Journal of Public Economics 74, 141–150.
Razin, A., E. Sadka, and P. Swagel (2002). Tax burden and migration: A political economy
theory and evidence. Journal of Public Economics 85, 167–190.
Riley, N. (1997). Determinants of union membership: A review. Labour 11, 265–301.
Rodrik, D. (1995). Political economy of trade policy. In G. Grossman and K. Rogoff
(Eds.), Handbook of International Economics, Vol.3, Chapter 28, pp. 1457–1494. The
Netherlands: North-Holland Elsevier Science.
Scarpetta, S. (1996). Assessing the role of labor market policies and institutional settings
on unemployment: A cross-country study. OECD Economic Studies 26 (1).
Scheve, K. F. and M. J. Slaughter (2001). Labor market competition and individual pref-
erences over immigration policy. Review of Economics and Statistics 83, 133–145.
Scholten, U. and M. Thum (1996). Public pension and immigration policy in a democracy.
Public Choice 66, 347–361.
Snyder, J. M. (1990). Campaign contributions as investments: The US house of represen-
tatives 1908–1986. Journal of Political Economy 61, 195–206.
Timmer, A. and J. Williamson (1996). Racism, xenophobia or markets? The political
economy of immigration policy prior to the Thirties. NBER WP 5867.
Tripathi, M., S. Ansolabehere, and J. Snyder (2002). Are PAC contributions and lobbying
linked? New evidence from the 1995 lobby disclosure act. Business and Politics 4,
131–155.
33

Election cycle 1999-2000 2001-02 2003-04
Contributions from PACs 326 348 461
Overall lobbying exp 2949 3330 4048Of which exp for immigration 32 24 33
Total targeted political activity 3275 3678 4509
Source. Center for Responsive Politics
Overall Immigration Issue
1998 16.0 0.31999 16.1 0.32000 17.1 0.32001 17.1 0.22002 18.7 0.22003 20.5 0.22004 21.2 0.32005 22.8 0.3
Source. Center for Responsive Politics
Table 1. Targeted Political Activity(in millions of US dollars)
Table 2. Average (per industry) Real Lobbying Expenditures Over Time
(in millions of US dollars)

Dependent variable
[1] [2] [3] [4] [5] [6] [7] [8] [9] [10]
log (lobbying exp) 0.399*** 0.428*** 0.192*** 0.194*** 0.188*** 0.132** 0.154*** 0.138** 0.175*** 0.231**[0.047] [0.049] [0.063] [0.059] [0.060] [0.059] [0.058] [0.058] [0.051] [0.108]
union membership rate -3.207*** -3.058*** -2.579*** -2.312*** -2.582*** -2.259*** -2.497*** -1.294** -2.034**[0.794] [0.754] [0.771] [0.703] [0.710] [0.706] [0.726] [0.631] [0.941]
lg (output) 0.589*** 0.653*** 0.667*** 0.492*** 0.536*** 0.510*** 0.441*** 0.126[0.094] [0.091] [0.091] [0.118] [0.112] [0.107] [0.096] [0.130]
unemployment rate 11.758*** 12.030*** 12.337*** 12.962*** 10.346*** 5.018 10.982**[4.346] [4.285] [3.861] [3.851] [3.819] [3.996] [4.262]
log (price) -3.029 -3.933 -3.639 -3.617 -3.643* -7.391***[2.856] [2.580] [2.525] [2.332] [1.978] [1.403]
log (capital) 0.273** 0.323*** 0.343*** 0.305*** 0.719***[0.107] [0.107] [0.103] [0.092] [0.182]
log (FDI) -0.130*** -0.138*** -0.030 -0.173**[0.045] [0.044] [0.042] [0.073]
shocks 3.993** 3.322* -0.116[1.963] [1.716] [1.679]
log (lag US wages) -10.119*** -13.003***[2.465] [3.949]
log (lag Mexican wages) 0.151[0.120]
N 137 136 136 136 136 132 130 130 130 53R-squared 0.297 0.350 0.517 0.550 0.556 0.602 0.626 0.642 0.702 0.761
log (number of immigrants)
Table 3. Estimated Effect of Politics on Migration, OLS
All data are averaged over 1998-2005. Standard errors are corrected for heteroskedasticity, and denoted in parentheses. ***, ** and * denote significance at 1, 5 and 10 percent respectively.
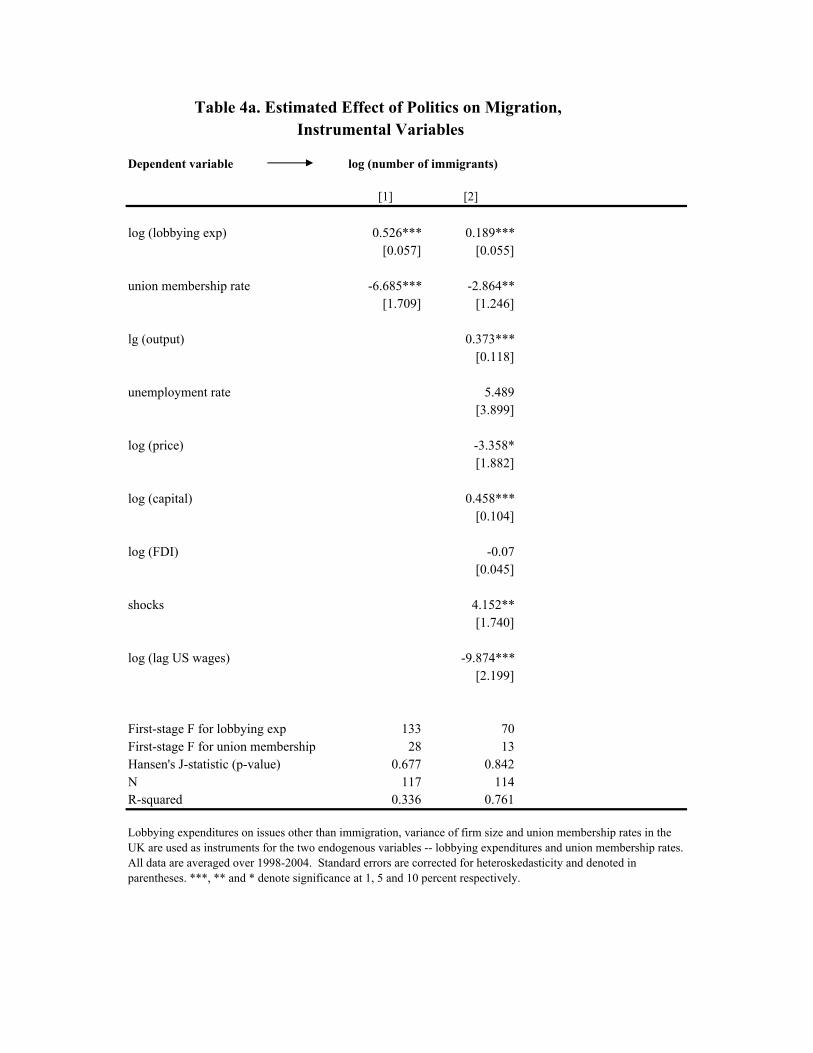
Dependent variable log (number of immigrants)
[1] [2]
log (lobbying exp) 0.526*** 0.189***[0.057] [0.055]
union membership rate -6.685*** -2.864**[1.709] [1.246]
lg (output) 0.373***[0.118]
unemployment rate 5.489[3.899]
log (price) -3.358*[1.882]
log (capital) 0.458***[0.104]
log (FDI) -0.07[0.045]
shocks 4.152**[1.740]
log (lag US wages) -9.874***[2.199]
First-stage F for lobbying exp 133 70First-stage F for union membership 28 13Hansen's J-statistic (p-value) 0.677 0.842N 117 114R-squared 0.336 0.761
Table 4a. Estimated Effect of Politics on Migration, Instrumental Variables
Lobbying expenditures on issues other than immigration, variance of firm size and union membership rates in the UK are used as instruments for the two endogenous variables -- lobbying expenditures and union membership rates. All data are averaged over 1998-2004. Standard errors are corrected for heteroskedasticity and denoted in parentheses. ***, ** and * denote significance at 1, 5 and 10 percent respectively.

Dependent variable
[1] [2] [3] [4]log (lobbying exp on other issues) 0.956*** 0.897*** -0.001 0.001
[0.049] [0.063] [0.004] [0.005]
log (variance of firm size) 0.08* 0.01 0.009* 0.003[0.049] [0.056] [0.005] [0.006]
union membership rate in the UK -1.425** -0.595 0.495*** 0.461***[0.697] [0.725] [0.096] [0.103]
lg (output) 0.149 -0.017*[0.136] [0.010]
unemployment rate -3.856 -0.29[4.353] [0.314]
log (price) -3.483** -0.059[1.632] [0.243]
log (capital) -0.08 0.012[0.110] [0.009]
log (FDI) -0.002 0.002[0.056] [0.005]
shocks 3.792** 0.386**[1.768] [0.158]
log (lag US wages) 2.674 0.26[2.275] [0.179]
N 117 114 122 118R-squared 0.806 0.825 0.544 0.587
Table 4b. Estimated Effect of Politics on Migration, Instrumental Variables -- First Stage
log (lobbying exp on immigration) union membership rate in the US
This table shows the first stage regression corresponding to Table 4a. All data are averaged over 1998-2004. Standard errors are corrected for heteroskedasticity and denoted in parentheses. ***, ** and * denote significance at 1, 5 and 10 percent respectively.

Table 5. Estimated Effect of Politics on Migration,
Dependent variable log (number of H1B visas)
[1] [2]
log (lobbying exp) 0.458*** 0.242***[0.057] [0.069]
union membership rate -2.903** -4.034***[1.269] [1.486]
lg (output) 0.143[0.164]
unemployment rate 1.535[3.692]
log (price) -0.155[2.266]
log (capital) 0.306**[0.131]
log (FDI) 0.098[0.075]
shocks -3.59[2.774]
log (lag US wages) 6.752*[3.426]
N 126 120R-squared 0.317 0.497
H1B Visas
All data are averaged over 2001-2005. Standard errors are are corrected for heteroskedasticity and denoted in parentheses. ***, ** and * denote significance at 1, 5 and 10 percent respectively.
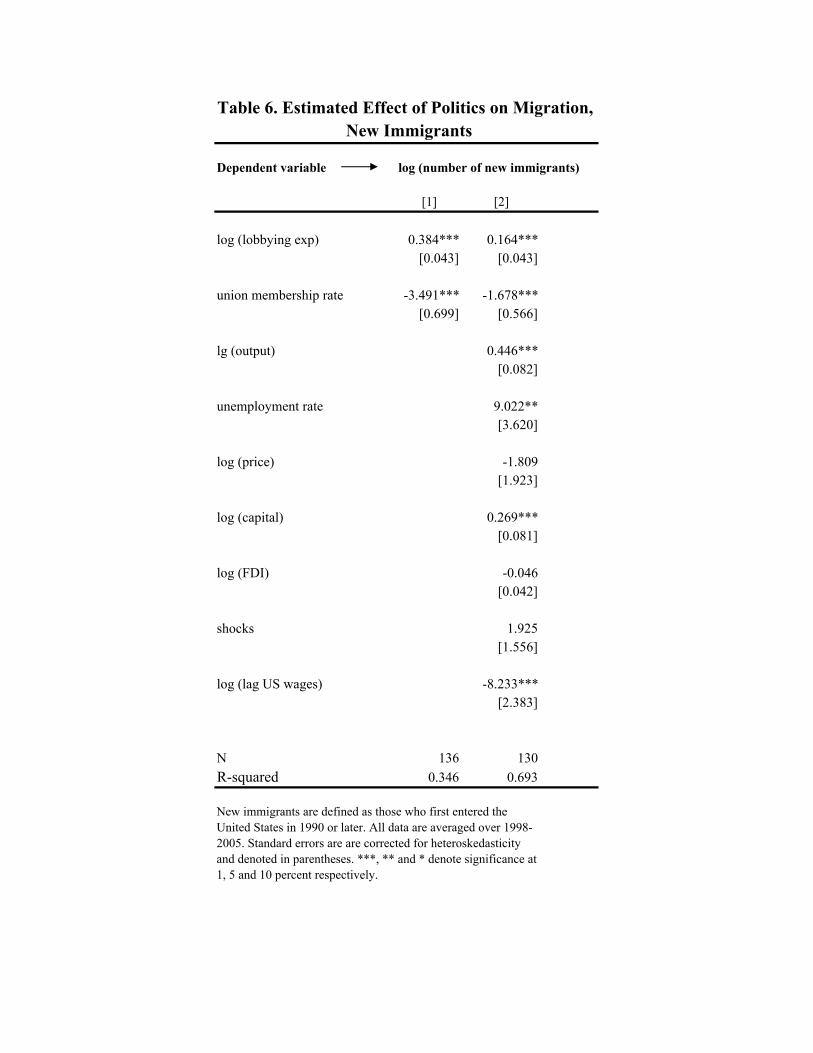
Table 6. Estimated Effect of Politics on Migration,
Dependent variable log (number of new immigrants)
[1] [2]
log (lobbying exp) 0.384*** 0.164***[0.043] [0.043]
union membership rate -3.491*** -1.678***[0.699] [0.566]
lg (output) 0.446***[0.082]
unemployment rate 9.022**[3.620]
log (price) -1.809[1.923]
log (capital) 0.269***[0.081]
log (FDI) -0.046[0.042]
shocks 1.925[1.556]
log (lag US wages) -8.233***[2.383]
N 136 130R-squared 0.346 0.693
New Immigrants
New immigrants are defined as those who first entered the United States in 1990 or later. All data are averaged over 1998-2005. Standard errors are are corrected for heteroskedasticity and denoted in parentheses. ***, ** and * denote significance at 1, 5 and 10 percent respectively.

Dependent variable
[1] [2] [3] [4] [5] [6]
log (PAC contribution) 0.230* -0.014 0.006 0.029[0.131] [0.132] [0.174] [0.222]
log (lobbying exp) 0.323*** 0.142*** 0.322*** 0.141***[0.047] [0.045] [0.050] [0.047]
union membership rate -1.365 -0.633 -3.245*** -0.911 -3.182*** -0.884[1.010] [0.716] [1.023] [0.829] [1.086] [0.853]
lg (output) 0.601*** 0.563*** 0.567***[0.115] [0.124] [0.128]
unemployment rate 1.278 2.055 2.068[3.106] [3.282] [3.403]
log (price) 0.369 0.691 0.758[2.611] [2.573] [2.676]
log (capital) 0.264** 0.206** 0.203*[0.116] [0.095] [0.113]
log (FDI) -0.031 -0.063 -0.067[0.046] [0.041] [0.043]
shocks 3.771** 3.518* 3.479**[1.766] [1.809] [1.739]
log (lag US wages) -8.764*** -9.656*** -9.635***[2.728] [2.890] [2.929]
_cons 7.827*** 16.601 8.425*** 16.252 8.327*** 15.476[2.004] [14.660] [0.472] [13.914] [2.607] [16.391]
N 134 128 124 118 123 117R-squared 0.035 0.618 0.246 0.648 0.246 0.645
Table 7. Estimated Effect of Politics on Migration,Campaign Contributions from PAC vs Lobbying Expenditures
Standard errors are are corrected for heteroskedasticity and denoted in parentheses. ***, ** and * denote significance at 1, 5 and 10 percent respectively. PACs stand for political action committees. The contirbutions by PACs is averaged over election cycles 1999-2000, 2001-02 and 2003-04For comparison, data on lobbying expenditures is averaged over the same period.
log (number of immigrants)
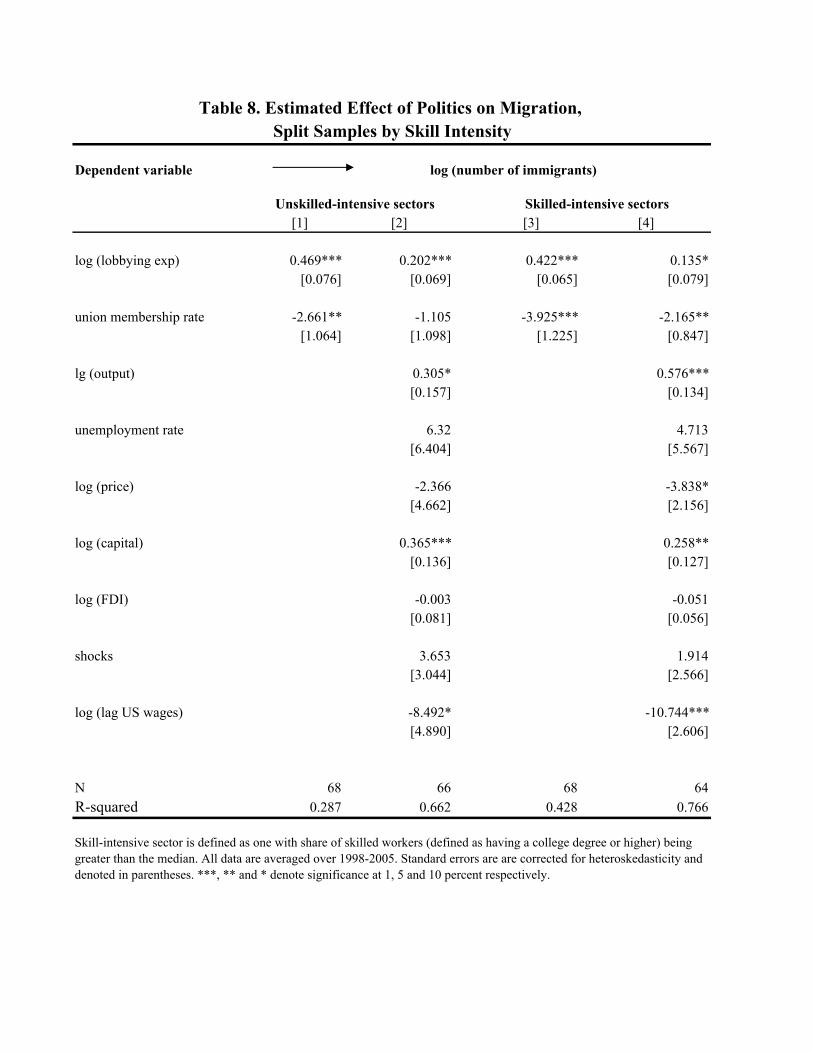
Dependent variable
[1] [2] [3] [4]
log (lobbying exp) 0.469*** 0.202*** 0.422*** 0.135*[0.076] [0.069] [0.065] [0.079]
union membership rate -2.661** -1.105 -3.925*** -2.165**[1.064] [1.098] [1.225] [0.847]
lg (output) 0.305* 0.576***[0.157] [0.134]
unemployment rate 6.32 4.713[6.404] [5.567]
log (price) -2.366 -3.838*[4.662] [2.156]
log (capital) 0.365*** 0.258**[0.136] [0.127]
log (FDI) -0.003 -0.051[0.081] [0.056]
shocks 3.653 1.914[3.044] [2.566]
log (lag US wages) -8.492* -10.744***[4.890] [2.606]
N 68 66 68 64R-squared 0.287 0.662 0.428 0.766
Table 8. Estimated Effect of Politics on Migration, Split Samples by Skill Intensity
Skill-intensive sector is defined as one with share of skilled workers (defined as having a college degree or higher) being greater than the median. All data are averaged over 1998-2005. Standard errors are are corrected for heteroskedasticity and denoted in parentheses. ***, ** and * denote significance at 1, 5 and 10 percent respectively.
Unskilled-intensive sectors Skilled-intensive sectors
log (number of immigrants)

Dependent variable
[1] [2] [3] [4] [5] [6] [7] [8] [9] [10]
log (capital lobbying exp) 0.399*** 0.411*** 0.205*** 0.215*** 0.209*** 0.150** 0.168*** 0.161*** 0.189*** 0.235**[0.047] [0.052] [0.064] [0.060] [0.061] [0.060] [0.059] [0.057] [0.050] [0.103]
log (labor lobbying exp) -0.430*** -0.379*** -0.337*** -0.307*** -0.296*** -0.258*** -0.284*** -0.112 -0.135[0.108] [0.094] [0.090] [0.085] [0.082] [0.081] [0.082] [0.076] [0.101]
lg (output) 0.591*** 0.671*** 0.684*** 0.491*** 0.550*** 0.549*** 0.478*** 0.13[0.105] [0.100] [0.101] [0.128] [0.132] [0.128] [0.116] [0.135]
unemployment rate 14.348*** 14.720*** 16.300*** 16.291*** 13.001*** 8.009* 13.119**[4.595] [4.561] [4.185] [4.269] [4.316] [4.282] [4.938]
log (price) -2.686 -3.895 -3.69 -3.347 -3.726* -8.000***[2.980] [2.752] [2.704] [2.484] [2.079] [1.552]
log (capital) 0.298** 0.316** 0.321*** 0.303*** 0.757***[0.120] [0.122] [0.119] [0.105] [0.181]
log (FDI) -0.113** -0.126*** -0.014 -0.151*[0.047] [0.046] [0.041] [0.076]
shocks 4.365** 3.610** -0.224[2.036] [1.795] [1.823]
log (lag US wages) -10.487*** -13.668***[2.425] [4.250]
log (lag Mexican wages) 0.059[0.108]
N 137 130 130 130 130 126 124 124 124 51R-squared 0.297 0.330 0.493 0.540 0.545 0.591 0.609 0.627 0.693 0.739
Table 9. Estimated Effect of Politics on Migration, Labor Contributions
log (number of immigrants)
Lobbying expenditures by labor groups is measured by taking the total contributions by unions from CRP and splitting them across sectors using union membership rates. All data are averaged over 1998-2005. Standard errors are corrected for heteroskedasticity, and denoted in parentheses. ***, ** and * denote significance at 1, 5 and 10 percent respectively.

Code Issue ACC Accounting ADV Advertising AER Aerospace AGR Agriculture ALC Alcohol & Drug Abuse ANI Animals APP Apparel/Clothing Industry/Textiles ART Arts/Entertainment AUT Automotive Industry AVI Aviation/Aircraft/ Airlines BAN Banking BNK Bankruptcy BEV Beverage Industry BUD Budget/Appropriations CHM Chemicals/Chemical Industry CIV Civil Rights/Civil Liberties CAW Clean Air & Water (Quality) CDT Commodities (Big Ticket) COM Communications/ Broadcasting/ Radio/TV CPI Computer Industry CSP Consumer Issues/Safety/ Protection CON Constitution CPT Copyright/Patent/ Trademark DEF Defense DOC District of Columbia DIS Disaster Planning/Emergencies ECN Economics/Economic Development EDU Education ENG Energy/Nuclear ENV Environmental/Superfund FAM Family Issues/Abortion/ Adoption FIR Firearms/Guns/ Ammunition FIN Financial Institutions/Investments/ Securities FOO Food Industry (Safety, Labeling, etc.) FOR Foreign Relations FUE Fuel/Gas/Oil GAM Gaming/Gambling/ Casino GOV Government Issues HCR Health Issues HOU Housing IMM Immigration IND Indian/Native American Affairs INS Insurance LBR Labor Issues/Antitrust/ Workplace LAW Law Enforcement/Crime/ Criminal Justice MAN Manufacturing MAR Marine/Maritime/ Boating/Fisheries MIA Media (Information/ Publishing) MED Medical/Disease Research/ Clinical Labs MMM Medicare/Medicaid MON Minting/Money/ Gold Standard NAT Natural Resources PHA Pharmacy POS Postal RRR Railroads RES Real Estate/Land Use/Conservation REL Religion RET Retirement ROD Roads/Highway SCI Science/Technology SMB Small Business SPO Sports/Athletics TAX Taxation/Internal Revenue Code TEC Telecommunications TOB Tobacco TOR Torts TRD Trade (Domestic & Foreign) TRA Transportation TOU Travel/Tourism TRU Trucking/Shipping URB Urban Development/ Municipalities UNM Unemployment UTI Utilities VET Veterans WAS Waste (hazardous/ solid/ interstate/ nuclear) WEL Welfare
Source: Senate’s Office of Public Records (SOPR)
Table A1. List of Issues
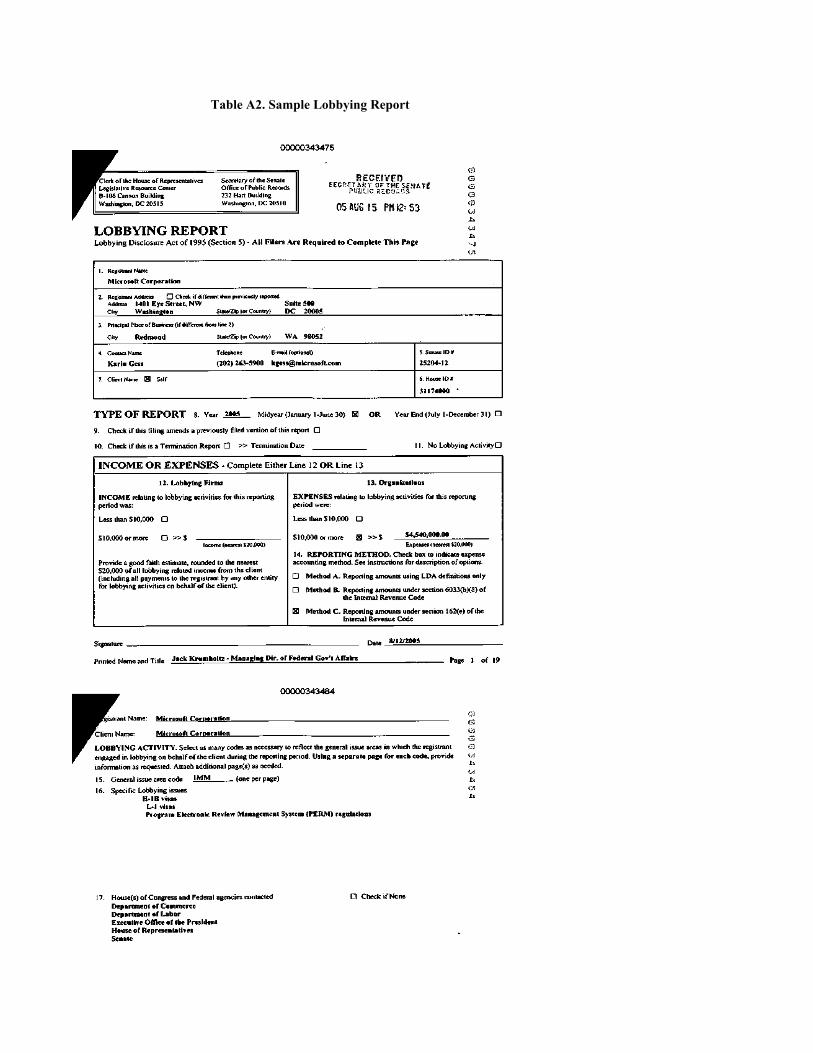
Table A2. Sample Lobbying Report

Source. Senate’s Office of Public Records (SOPR)
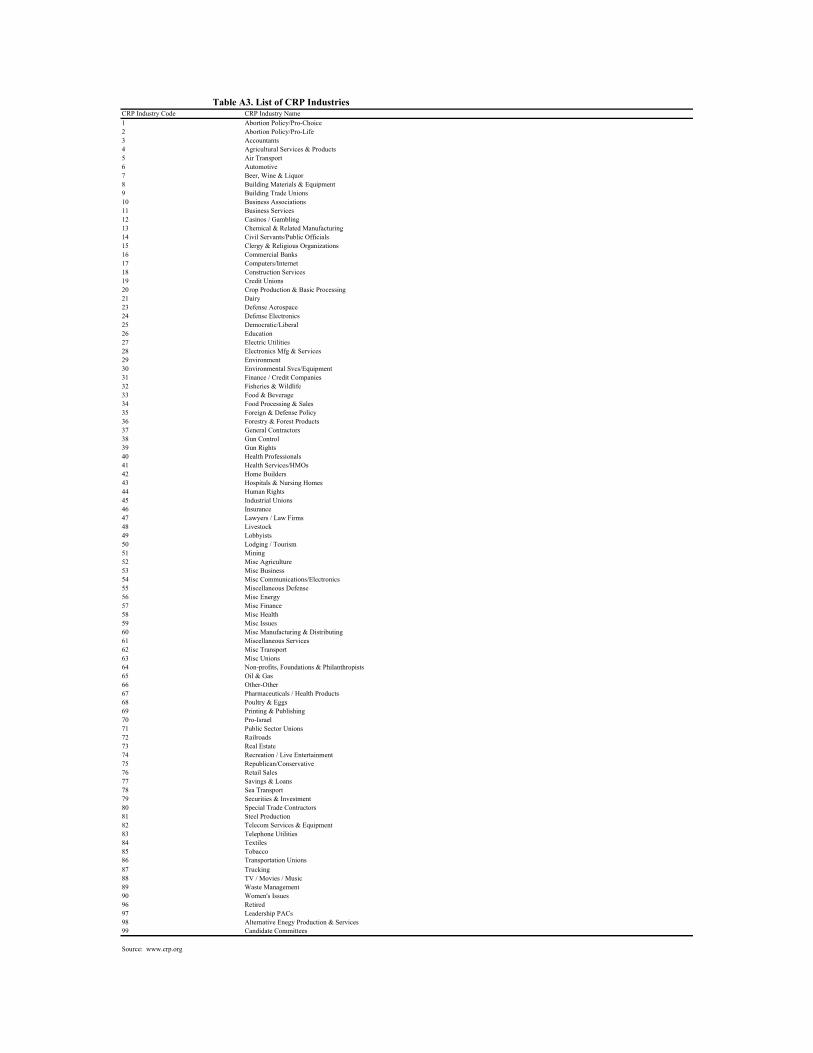
CRP Industry Code CRP Industry Name1 Abortion Policy/Pro-Choice2 Abortion Policy/Pro-Life3 Accountants4 Agricultural Services & Products5 Air Transport6 Automotive7 Beer, Wine & Liquor8 Building Materials & Equipment9 Building Trade Unions10 Business Associations11 Business Services12 Casinos / Gambling13 Chemical & Related Manufacturing14 Civil Servants/Public Officials15 Clergy & Religious Organizations16 Commercial Banks17 Computers/Internet18 Construction Services19 Credit Unions20 Crop Production & Basic Processing21 Dairy23 Defense Aerospace24 Defense Electronics25 Democratic/Liberal26 Education27 Electric Utilities28 Electronics Mfg & Services29 Environment30 Environmental Svcs/Equipment31 Finance / Credit Companies32 Fisheries & Wildlife33 Food & Beverage34 Food Processing & Sales35 Foreign & Defense Policy36 Forestry & Forest Products37 General Contractors38 Gun Control39 Gun Rights40 Health Professionals41 Health Services/HMOs42 Home Builders43 Hospitals & Nursing Homes44 Human Rights45 Industrial Unions46 Insurance47 Lawyers / Law Firms48 Livestock49 Lobbyists50 Lodging / Tourism51 Mining52 Misc Agriculture53 Misc Business54 Misc Communications/Electronics55 Miscellaneous Defense56 Misc Energy57 Misc Finance58 Misc Health59 Misc Issues60 Misc Manufacturing & Distributing61 Miscellaneous Services62 Misc Transport63 Misc Unions64 Non-profits, Foundations & Philanthropists65 Oil & Gas66 Other-Other67 Pharmaceuticals / Health Products68 Poultry & Eggs69 Printing & Publishing70 Pro-Israel71 Public Sector Unions72 Railroads73 Real Estate74 Recreation / Live Entertainment75 Republican/Conservative76 Retail Sales77 Savings & Loans78 Sea Transport79 Securities & Investment80 Special Trade Contractors81 Steel Production82 Telecom Services & Equipment83 Telephone Utilities84 Textiles85 Tobacco86 Transportation Unions87 Trucking88 TV / Movies / Music89 Waste Management90 Women's Issues96 Retired97 Leadership PACs98 Alternative Enegy Production & Services99 Candidate Committees
Source: www.crp.org
Table A3. List of CRP Industries

CPS Industry Code CPS Industry Name CPS Industry Code CPS Industry Name105 Agriculture 567 Petroleum and gasoline pipe lines116 Forestry 568 Services incidental to transportation126 Fisheries 578 Telephone206 Metal mining 579 Telegraph216 Coal mining 586 Electric light and power226 Crude petroleum and natural gas extraction 587 Gas and steam supply systems
236 Nonmetallic mining and quarrying, except fuel 588 Electric-gas utilities246 Construction 596 Water supply306 Logging 597 Sanitary services307 Sawmills, planing mills, and millwork 598 Other and not specified utilities308 Misc wood products 606 Motor vehicles and equipment309 Furniture and fixtures 607 Drugs, chemicals, and allied products316 Glass and glass products 608 Dry goods apparel317 Cement, concrete, gypsum and plaster products 609 Food and related products318 Structural clay products 616 Electrical goods, hardware, and plumbing equipment319 Pottery and related products 617 Machinery, equipment, and supplies326 Miscellaneous nonmetallic mineral and stone products 618 Petroleum products336 Blast furnaces, steel works, & rolling mills 619 Farm products--raw materials337 Other primary iron and steel industries 626 Miscellaneous wholesale trade338 Primary nonferrous industries 627 Not specified wholesale trade346 Fabricated steel products 636 Food stores, except dairy products347 Fabricated nonferrous metal products 637 Dairy products stores and milk retailing348 Not specified metal industries 646 General merchandise stores356 Agricultural machinery and tractors 647 Five and ten cent stores357 Office and store machines and devices 656 Apparel and accessories stores, except shoe358 Miscellaneous machinery 657 Shoe stores367 Electrical machinery, equipment, and supplies 658 Furniture and house furnishing stores376 Motor vehicles and motor vehicle equipment 659 Household appliance and radio stores377 Aircraft and parts 667 Motor vehicles and accessories retailing378 Ship and boat building and repairing 668 Gasoline service stations379 Railroad and miscellaneous transportation equipmen 669 Drug stores386 Professional equipment and supplies 679 Eating and drinking places387 Photographic equipment and supplies 686 Hardware and farm implement stores388 Watches, clocks, and clockwork-operated devices 687 Lumber and building material retailing399 Miscellaneous manufacturing industries 688 Liquor stores406 Meat products 689 Retail florists407 Dairy products 696 Jewelry stores408 Canning and preserving fruits, vegetables, and seafoods 697 Fuel and ice retailing409 Grain-mill products 698 Miscellaneous retail stores416 Bakery products 699 Not specified retail trade417 Confectionery and related products 716 Banking and credit agencies418 Beverage industries 726 Security and commodity brokerage and investment companies419 Miscellaneous food preparations and kindred products 736 Insurance426 Not specified food industries 746 Real estate429 Tobacco manufactures 806 Advertising436 Knitting mills 807 Accounting, auditing, and bookkeeping services437 Dyeing and finishing textiles, except knit goods 808 Miscellaneous business services438 Carpets, rugs, and other floor coverings 816 Auto repair services and garages439 Yarn, thread, and fabric mills 817 Miscellaneous repair services446 Miscellaneous textile mill products 826 Private households448 Apparel and accessories 836 Hotels and lodging places449 Miscellaneous fabricated textile products 846 Laundering, cleaning, and dyeing services456 Pulp, paper, and paperboard mills 847 Dressmaking shops457 Paperboard containers and boxes 848 Shoe repair shops458 Miscellaneous paper and pulp products 849 Miscellaneous personal services459 Printing, publishing, and allied industries 856 Radio broadcasting and television466 Synthetic fibers 857 Theaters and motion pictures467 Drugs and medicines 858 Bowling alleys, and billiard and pool parlors468 Paints, varnishes, and related products 859 Miscellaneous entertainment and recreation services469 Miscellaneous chemicals and allied products 868 Medical and other health services, except hospitals476 Petroleum refining 869 Hospitals477 Miscellaneous petroleum and coal products 879 Legal services478 Rubber products 888 Educational services487 Leather: tanned, curried, and finished 896 Welfare and religious services488 Footwear, except rubber 897 Nonprofit membership organizations489 Leather products, except footwear 898 Engineering and architectural services499 Not specified manufacturing industries 899 Miscellaneous professional and related services506 Railroads and railway express service 906 Postal service516 Street railways and bus lines 916 Federal public administration526 Trucking service 926 State public administration527 Warehousing and storage 936 Local public administration536 Taxicab service546 Water transportation556 Air transportation
Table A4. List of CPS Industries
Source. Cenus Population Survey (www.ipums.org)

Dependent variable log(Total number of immigrants) log(H1B visas)
log (lobbying exp) 0.118** 0.181***[0.046] [0.059]
union membership rate -1.344** -4.291***[0.593] [1.352]
Number of natives 0.000*** 0.000***[0.000] [0.000]
N 130 120R-squared
Table A5. Estimated Effect of Politics on Migration,
The regressions control for output, unemployment, price, capital, FDI, shocks and US wages. All data are averaged over 1998-2005. Standard errors are corrected for heteroskedasticity, and denoted in parentheses. ***, ** and * denote significance at 1, 5 and 10 percent respectively.
Controlling for Number of Natives

Dependent variable
[1] [2] [3] [4]
log (lobbying exp) 0.560*** 0.251*** 0.349*** 0.122*[0.077] [0.080] [0.060] [0.064]
union membership rate -2.669** -0.512 -3.854*** -1.978**[1.154] [0.942] [1.099] [0.779]
lg (output) 0.337** 0.622***[0.129] [0.156]
log (unemployment) 5.629 4.517[5.249] [8.066]
log (price) -4.745 -3.361[2.960] [2.832]
log (capital) 0.325** 0.255*[0.130] [0.137]
log (FDI) -0.041 -0.043[0.074] [0.061]
shocks 3.878 1.723[2.585] [2.913]
log (lag US wages) -8.938* -10.998***[5.304] [2.951]
_cons 5.499*** 39.410*** 7.648*** 36.200**[0.674] [12.958] [0.561] [15.122]
N 68 66 68 64R-squared 0.368 0.693 0.348 0.737 Skill-intensive sector is defined as one with average years of schooling of workers in the sector being greater than the median. All data are averaged over 1998-2005. Standard errors are corrected for heteroskedasticity, and denoted in parentheses. ***, ** and * denote significance at 1, 5 and 10 percent respectively.
Table A6. Estimated Effect of Politics on Migration,
Unskilled-intensive sectors Skilled-intensive sectors
Alternative Definition of Skill Intensity Based on Years of Schooling
log (number of immigrants)

Dependent variable
[1] [2]
log (lobbying exp) 0.421*** 0.171***[0.049] [0.052]
union membership rate -3.115*** -1.269**[0.796] [0.632]
lg (output) 0.437***[0.096]
log (unemployment) 5.096[3.989]
log (price) -3.734*[1.977]
log (capital) 0.313***[0.093]
log (FDI) -0.031[0.042]
shocks 3.183*[1.735]
log (lag US wages) -9.945***[2.505]
_cons 6.812*** 36.576***[0.454] [9.526]
N 135 129R-squared 0.338 0.695 CPS industry code 105 is dropped from the regressions. All data are averaged over 1998-2005. Standard errors are corrected for heteroskedasticity, and denoted in parentheses. ***, ** and * denote significance at 1, 5 and 10 percent respectively.
Table A7. Estimated Effect of Politics on Migration, Drop Agriculture
log (number of immigrants)
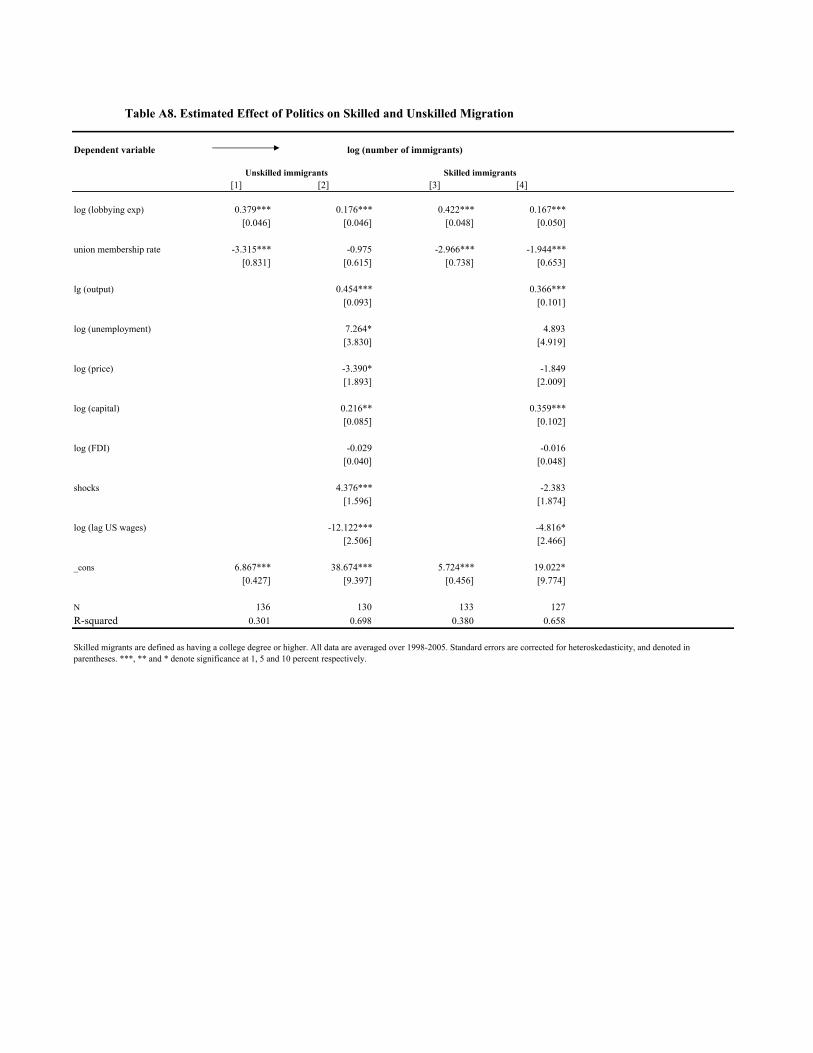
Dependent variable
[1] [2] [3] [4]
log (lobbying exp) 0.379*** 0.176*** 0.422*** 0.167***[0.046] [0.046] [0.048] [0.050]
union membership rate -3.315*** -0.975 -2.966*** -1.944***[0.831] [0.615] [0.738] [0.653]
lg (output) 0.454*** 0.366***[0.093] [0.101]
log (unemployment) 7.264* 4.893[3.830] [4.919]
log (price) -3.390* -1.849[1.893] [2.009]
log (capital) 0.216** 0.359***[0.085] [0.102]
log (FDI) -0.029 -0.016[0.040] [0.048]
shocks 4.376*** -2.383[1.596] [1.874]
log (lag US wages) -12.122*** -4.816*[2.506] [2.466]
_cons 6.867*** 38.674*** 5.724*** 19.022*[0.427] [9.397] [0.456] [9.774]
N 136 130 133 127R-squared 0.301 0.698 0.380 0.658
Table A8. Estimated Effect of Politics on Skilled and Unskilled Migration
Unskilled immigrants Skilled immigrants
Skilled migrants are defined as having a college degree or higher. All data are averaged over 1998-2005. Standard errors are corrected for heteroskedasticity, and denoted in parentheses. ***, ** and * denote significance at 1, 5 and 10 percent respectively.
log (number of immigrants)
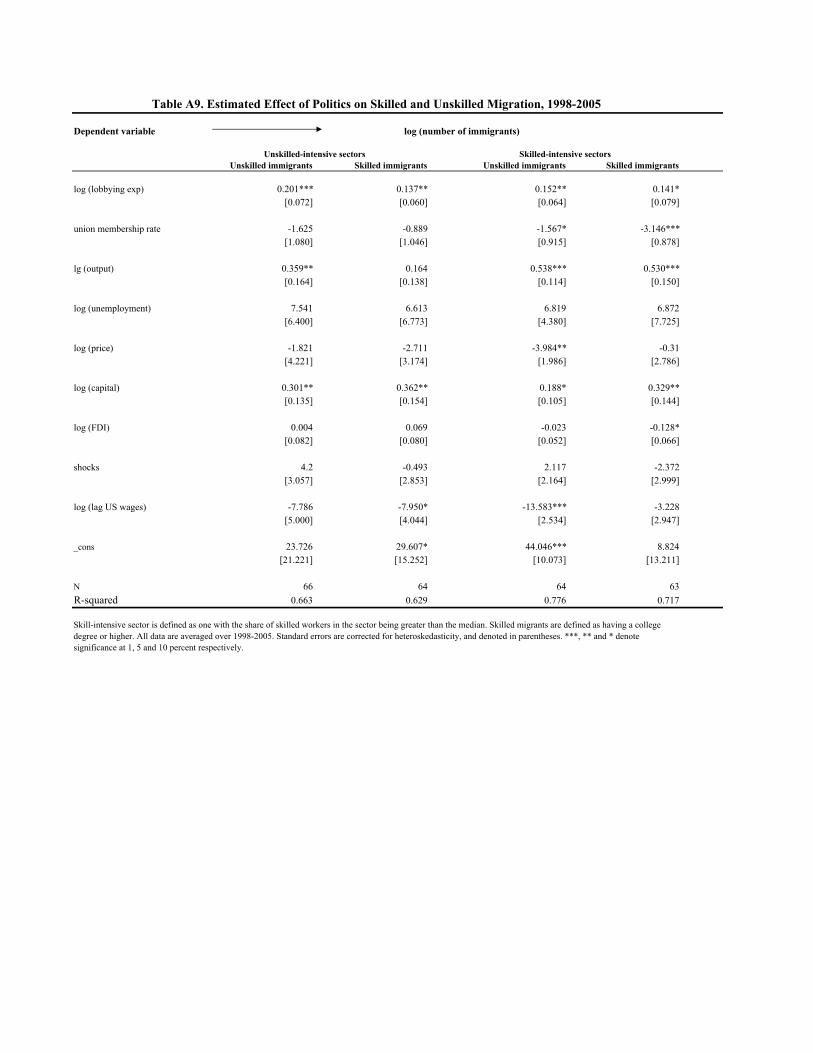
Dependent variable
Unskilled immigrants Skilled immigrants Unskilled immigrants Skilled immigrants
log (lobbying exp) 0.201*** 0.137** 0.152** 0.141*[0.072] [0.060] [0.064] [0.079]
union membership rate -1.625 -0.889 -1.567* -3.146***[1.080] [1.046] [0.915] [0.878]
lg (output) 0.359** 0.164 0.538*** 0.530***[0.164] [0.138] [0.114] [0.150]
log (unemployment) 7.541 6.613 6.819 6.872[6.400] [6.773] [4.380] [7.725]
log (price) -1.821 -2.711 -3.984** -0.31[4.221] [3.174] [1.986] [2.786]
log (capital) 0.301** 0.362** 0.188* 0.329**[0.135] [0.154] [0.105] [0.144]
log (FDI) 0.004 0.069 -0.023 -0.128*[0.082] [0.080] [0.052] [0.066]
shocks 4.2 -0.493 2.117 -2.372[3.057] [2.853] [2.164] [2.999]
log (lag US wages) -7.786 -7.950* -13.583*** -3.228[5.000] [4.044] [2.534] [2.947]
_cons 23.726 29.607* 44.046*** 8.824[21.221] [15.252] [10.073] [13.211]
N 66 64 64 63R-squared 0.663 0.629 0.776 0.717 Skill-intensive sector is defined as one with the share of skilled workers in the sector being greater than the median. Skilled migrants are defined as having a college degree or higher. All data are averaged over 1998-2005. Standard errors are corrected for heteroskedasticity, and denoted in parentheses. ***, ** and * denote significance at 1, 5 and 10 percent respectively.
Table A9. Estimated Effect of Politics on Skilled and Unskilled Migration, 1998-2005
Unskilled-intensive sectors Skilled-intensive sectors
log (number of immigrants)

Dependent variable[1] [2] [3] [4] [5] [6] [7] [8] [9] [10]
log (lobbying exp) 0.388*** 0.403*** 0.176*** 0.181*** 0.180*** 0.133*** 0.150*** 0.150*** 0.170*** 0.215**[0.023] [0.024] [0.029] [0.028] [0.029] [0.029] [0.029] [0.029] [0.027] [0.086]
union membership rate -1.795*** -1.532*** -1.340*** -1.300*** -1.245*** -1.051*** -1.047*** -0.728* -2.095***[0.326] [0.323] [0.329] [0.327] [0.352] [0.357] [0.361] [0.380] [0.618]
lg (output) 0.612*** 0.637*** 0.640*** 0.504*** 0.564*** 0.564*** 0.511*** 0.108[0.048] [0.047] [0.047] [0.071] [0.071] [0.071] [0.071] [0.133]
unemployment rate 5.545*** 5.530*** 5.440*** 5.932*** 5.947*** 4.044** 9.930**[1.515] [1.497] [1.497] [1.480] [1.527] [1.594] [4.075]
log (price) -0.754 -0.379 -0.221 -0.221 -0.328 -2.107[0.664] [0.716] [0.715] [0.714] [0.647] [1.322]
log (capital) 0.207*** 0.240*** 0.240*** 0.258*** 0.441***[0.061] [0.062] [0.062] [0.061] [0.138]
log (FDI) -0.121*** -0.121*** -0.063** -0.086[0.025] [0.025] [0.026] [0.085]
shocks -0.069 -0.36 -3.522***[1.069] [1.043] [1.215]
log (lag US wages) -6.218*** -4.981**[1.276] [2.405]
log (lag Mexican wages) 0.218**[0.106]
N 762 748 748 748 748 622 598 598 591 105R-squared 0.273 0.282 0.446 0.461 0.462 0.476 0.495 0.495 0.538 0.601
log (number of immigrants)
Table A10. Estimated Effect of Politics on Migration, Pooled OLS, 1998-2005
This table uses pooled data from 1998-2005. Year dummies are included in all the regressions. Standard errors are corrected for heteroskedasticity, and denoted in parentheses. ***, ** and * denote significance at 1, 5 and 10 percent respectively.

Dependent variable
[1] [2] [3] [4] [5] [6] [7] [8] [9]
log (lobbying exp) 0.394*** 0.424*** 0.180*** 0.179*** 0.169*** 0.130** 0.154*** 0.138** 0.175***[0.049] [0.050] [0.064] [0.060] [0.062] [0.060] [0.058] [0.058] [0.051]
union membership rate -3.307*** -3.115*** -2.654*** -2.289*** -2.515*** -2.259*** -2.497*** -1.294**[0.819] [0.782] [0.801] [0.725] [0.711] [0.706] [0.726] [0.631]
lg (output) 0.608*** 0.671*** 0.692*** 0.494*** 0.536*** 0.510*** 0.441***[0.095] [0.091] [0.093] [0.118] [0.112] [0.107] [0.096]
unemployment rate 11.870*** 12.370*** 12.616*** 12.962*** 10.346*** 5.018[4.372] [4.326] [3.894] [3.851] [3.819] [3.996]
log (price) -4.099 -4.015 -3.639 -3.617 -3.643*[2.732] [2.583] [2.525] [2.332] [1.978]
log (capital) 0.272** 0.323*** 0.343*** 0.305***[0.107] [0.107] [0.103] [0.092]
log (FDI) -0.130*** -0.138*** -0.03[0.045] [0.044] [0.042]
shocks 3.993** 3.322*[1.963] [1.716]
log (lag US wages) -10.119***[2.465]
_cons 6.653*** 6.789*** 2.575*** 1.21 19.984 20.012* 18.072 17.617 36.415***[0.464] [0.461] [0.676] [0.809] [12.587] [11.910] [11.602] [10.716] [9.558]
N 130 130 130 130 130 130 130 130 130R-squared 0.290 0.348 0.530 0.564 0.575 0.603 0.626 0.642 0.702
log (number of immigrants)
Table A11. Estimated Effect of Politics on Migration OLS, Balanced Number of Observations
This table restricts the number of observations to be the same across all regressions. All data are averaged over 1998-2005. Standard errors are corrected for heteroskedasticity, and denoted in parentheses. ***, ** and * denote significance at 1, 5 and 10 percent respectively.

Dependent variable[1] [2] [3] [4] [5] [6] [7] [8] [9] [10]
log (lobbying exp) 0.289*** 0.292*** 0.092* 0.091* 0.090* 0.077* 0.080* 0.062 0.088** 0.075[0.055] [0.059] [0.052] [0.052] [0.052] [0.044] [0.045] [0.045] [0.044] [0.078]
union membership rate -1.852* -2.156*** -1.667** -1.358* -2.376*** -2.049*** -2.284*** -1.125* -2.414**[1.074] [0.811] [0.828] [0.784] [0.705] [0.701] [0.718] [0.642] [0.929]
lg (output) 0.674*** 0.733*** 0.745*** 0.498*** 0.545*** 0.525*** 0.475*** 0.174[0.082] [0.080] [0.080] [0.112] [0.110] [0.102] [0.093] [0.161]
unemployment rate 10.746** 11.115** 12.055*** 12.643*** 10.144*** 5.282 12.272**[4.495] [4.386] [3.807] [3.797] [3.752] [3.997] [4.923]
log (price) -3.777 -4.419* -4.322* -4.307* -4.410** -7.702***[2.930] [2.550] [2.500] [2.324] [1.980] [1.404]
log (capital) 0.320*** 0.367*** 0.381*** 0.339*** 0.800***[0.100] [0.102] [0.097] [0.089] [0.181]
log (FDI) -0.107** -0.114** -0.007 -0.162**[0.045] [0.044] [0.043] [0.064]
shocks 3.942** 3.154* -2.091[1.950] [1.751] [1.660]
log (lag US wages) -9.622***-11.846***[2.468] [4.166]
log (lag Mexican wages) 0.230*[0.119]
_cons 7.759*** 7.980*** 2.663*** 1.406* 18.714 22.025* 21.365* 20.927* 39.127*** 58.142***[0.535] [0.547] [0.673] [0.795] [13.522] [11.758] [11.500] [10.678] [9.615] [9.841]
N 142 141 141 141 141 136 134 134 134 55R-squared 0.200 0.219 0.484 0.511 0.520 0.596 0.613 0.629 0.684 0.727
log (number of immigrants)
Table A12. Estimated Effect of Politics on Migration OLS, Include Sectors with Zero Lobbying Expenditures
This table includes 5 industries with zero lobbying expenditures by replacing log (0) with logs of the minimum values. Standard errors are corrected for heteroskedasticity, and denoted in parentheses. ***, ** and * denote significance at 1, 5 and 10 percent respectively.

Dependent variable[1] [2] [3] [4] [5] [6] [7] [8] [9] [10]
log (lobbying exp) 0.359*** 0.400*** 0.178*** 0.185*** 0.184*** 0.149** 0.166*** 0.170*** 0.164*** 0.312***[0.053] [0.052] [0.068] [0.068] [0.068] [0.060] [0.060] [0.061] [0.051] [0.071]
union membership rate -3.389*** -2.801*** -2.605*** -2.551*** -2.896*** -2.649*** -2.850*** -1.572** -0.99[0.786] [0.752] [0.764] [0.694] [0.708] [0.702] [0.765] [0.670] [0.913]
lg (output) 0.535*** 0.548*** 0.551*** 0.335** 0.384** 0.365** 0.215* 0.118[0.104] [0.100] [0.100] [0.145] [0.148] [0.146] [0.120] [0.117]
unemployment rate 5.619 5.617 7.979 7.306 6.566 -3.032 -7.542[5.215] [5.257] [5.132] [5.254] [5.280] [5.142] [5.709]
log (price) -0.712 -2.643 -2.462 -2.651 -2.014 -2.795[3.154] [2.924] [2.863] [2.821] [2.168] [1.893]
log (capital) 0.278* 0.299** 0.322** 0.477*** 0.387**[0.143] [0.149] [0.146] [0.116] [0.179]
log (FDI) -0.097* -0.114** -0.057 -0.155*[0.052] [0.050] [0.049] [0.081]
shocks 3.113 4.329* -0.267[2.642] [2.344] [1.755]
log (lag US wages) -3.582*** -5.395***[0.859] [1.048]
log (lag Mexican wages) 0.062[0.141]
_cons 7.153*** 7.172*** 3.522*** 2.998*** 6.264 15.586 14.586 14.92 19.551* 28.614***[0.540] [0.521] [0.769] [0.808] [14.528] [13.481] [13.195] [12.858] [10.237] [9.202]
N 120 120 120 120 120 116 114 114 114 46R-squared 0.264 0.339 0.497 0.504 0.504 0.543 0.559 0.569 0.673 0.780
log (number of immigrants)
Table A13. Estimated Effect of Politics on Migration, Census Data
Lobbying expenditures are averaged over 1999 and 2000. The data on the number of immigrants, unemployment rate and US wages are from the 2000 US Census (all other tables are based on data from the CPS). Standard errors are corrected for heteroskedasticity, and denoted in parentheses. ***, ** and * denote significance at 1, 5 and 10 percent respectively.

Dep
ende
nt v
aria
ble
2002
2003
2004
2005
log
(lobb
ying
exp
)0.
387*
**0.
212*
**0.
659*
**0.
434*
**0.
334*
**0.
168*
**0.
573*
**0.
227
0.22
5***
0.07
5*0.
572*
**0.
336*
**0.
391*
**0.
174*
*0.
531*
**0.
274*
**[0
.057
][0
.080
][0
.068
][0
.104
][0
.050
][0
.061
][0
.085
][0
.136
][0
.054
][0
.040
][0
.084
][0
.125
][0
.067
][0
.075
][0
.060
][0
.088
]
unio
n m
embe
rshi
p ra
te-1
.489
*-0
.696
-1.5
80**
-0.6
76-2
.718
***
-0.8
72-1
.136
-1.8
29**
-0.8
480.
162
-0.9
140.
202
-1.2
06-0
.602
-2.9
21**
-2.3
97**
[0.8
12]
[0.9
79]
[0.7
38]
[0.7
93]
[0.8
48]
[0.7
54]
[0.9
16]
[0.8
93]
[1.1
68]
[0.8
97]
[0.7
36]
[0.9
80]
[1.0
02]
[0.8
06]
[1.2
25]
[0.9
79]
lg (o
utpu
t)0.
596*
**0.
324
0.57
3***
0.29
60.
726*
**0.
352
0.40
5**
0.72
1***
[0.1
90]
[0.2
00]
[0.2
02]
[0.2
16]
[0.1
56]
[0.2
22]
[0.1
58]
[0.1
70]
log
(une
mpl
oym
ent)
6.67
78.
616.
313
7.78
64.
614*
3.00
2-2
.467
4.39
4[4
.786
][5
.805
][4
.600
][6
.443
][2
.507
][4
.395
][3
.282
][4
.625
]
log
(pric
e)-0
.501
0.23
9-1
.426
-2.3
54-0
.553
0.03
5-0
.371
-4.8
02**
*[1
.516
][0
.835
][1
.485
][2
.515
][1
.154
][1
.573
][3
.109
][1
.301
]
log
(cap
ital)
0.33
3**
0.16
30.
249
0.28
60.
219*
0.05
30.
297*
*[0
.160
][0
.178
][0
.166
][0
.172
][0
.127
][0
.238
][0
.128
]
log
(FD
I)-0
.175
**-0
.065
0.02
2-0
.013
-0.0
86**
0.02
7-0
.02
-0.0
73[0
.084
][0
.078
][0
.074
][0
.095
][0
.042
][0
.080
][0
.065
][0
.068
]
shoc
ks-0
.003
-2.1
02-0
.278
-4.4
073.
074
-0.7
212.
167
2.84
2[2
.676
][2
.608
][3
.279
][2
.684
][2
.647
][2
.819
][2
.401
][2
.010
]
log
(lag
US
wag
es)
-3.9
23**
-2.4
44-7
.358
***
-9.4
29**
-11.
470*
**-8
.435
**-9
.200
***
-7.7
69**
*[1
.625
][3
.280
][2
.348
][3
.962
][1
.887
][3
.386
][1
.948
][2
.607
]
_con
s6.
844*
**9.
799
4.17
6***
5.49
57.
790*
**20
.493
**4.
824*
**32
.191
**8.
751*
**23
.625
***
4.88
7***
18.1
35*
6.97
1***
20.6
835.
526*
**36
.329
***
[0.6
20]
[7.7
98]
[0.7
20]
[6.4
59]
[0.5
34]
[8.8
86]
[0.8
96]
[13.
479]
[0.5
24]
[6.8
59]
[0.9
28]
[9.7
63]
[0.6
97]
[13.
847]
[0.6
39]
[7.0
05]
N10
910
285
7595
9077
6710
498
7164
104
9510
397
R-s
quar
ed0.
244
0.53
60.
518
0.62
10.
267
0.56
40.
376
0.60
30.
128
0.63
50.
448
0.55
80.
237
0.60
40.
415
0.66
4
Stan
dard
err
ors a
re c
orre
cted
for h
eter
oske
dast
icity
, and
den
oted
in p
aren
thes
es. *
**, *
* an
d *
deno
te si
gnifi
canc
e at
1, 5
and
10
perc
ent r
espe
ctiv
ely.
Tab
le A
14. E
stim
ated
Eff
ect o
f Pol
itics
on
Mig
ratio
n, 1
998-
2005
1998
1999
2000
2001
log
(num
ber
of im
mig
rant
s)

[1] [2]
log (lobbying exp_upper bound) 0.367*** 0.143***[0.047] [0.048]
union membership rate -2.999*** -1.245*[0.814] [0.636]
lg (output) 0.464***[0.094]
unemployment rate 5.395[4.066]
log (price) -3.553*[2.019]
log (capital) 0.318***[0.091]
log (FDI) -0.037[0.043]
shocks 3.463**[1.711]
log (lag US wages) -9.917***[2.482]
_cons 6.513*** 35.277***[0.535] [9.690]
N 136 130R-squared 0.300 0.696
Table A15. Estimated Effect of Politics on MigrationAlternative Measure of Lobbying Expenditures
lobbying exp_upper bound represents the total lobbying expenditures by firms within a sector which list immigration as an issue. All data are averaged over 1998-2005. Standard errors are corrected for heteroskedasticity, and denoted in parentheses. ***, ** and * denote significance at 1, 5 and 10 percent respectively.

Figure 1. The Effects of a Migration Quota

Notes. The data on campaign contributions and lobbying expenditures are averaged over three election cycles -- 1999-2000, 2001-02 and 2003-04. The correlation between (log) contributions from PACs and (log) overall lobbying expenditures (top panel) is 0.328 (robust standard error=0.099; p-value=0.000); the correlation between (log) contributions from PACs and (log) lobbying expenditures for immigration is 0.074 (robust standard error=0.132; p-value=0.580).
(in millions of US$)
Figure 2. Scatter Plots between Lobbying Expenditures and Campaign Contributions from Political Action Committees (PACs)
(in millions of US$)Campaign contributions from PACs and overall lobbying expenditures
Campaign contributions from PACs and lobbying expenditures on immigration
-4-2
02
4C
ampa
ign
cont
ribut
ions
from
PAC
s (in
logs
)
-2 0 2 4 6Overall lobbying expenditures (in logs)
(mean) lgcontributionsfrompacs Fitted values
-4-2
02
4C
ampa
ign
cont
ribut
ions
from
PAC
s (in
logs
)
-4 -3 -2 -1 0 1Lobbying expenditures for immigration (in logs)
(mean) lgcontributionsfrompacs Fitted values

Figure 3. Real lobbying Expenditures (in million USD)
0
500
1000
1500
2000
2500
1998 1999 2000 2001 2002 2003 2004 20050
5
10
15
20
25
overall_lobbying_explobbying_exp_immig
right axis
Figure 4. Top 10 Spenders for Immigration, 2005
0.0
0.5
1.0
1.5
2.0
2.5
3.0
Aut
omot
ive
Agr
icul
tura
lSe
rvic
es &
Prod
ucts
Def
ense
Aer
ospa
ce
Tele
com
Ser
vice
s&
Equ
ipm
ent
Educ
atio
n
Bus
ines
s Ser
vice
s
Oil
& G
as
Mis
c Is
sues
Com
pute
rs/In
tern
et
Hos
pita
ls &
Nur
sing
Hom
es
In m
n of
US$
Figure 5. Top 10 Sectors with the Highest Number of Immigrants, 2005
0.0
0.5
1.0
1.5
2.0
2.5
3.0
Hot
els a
ndlo
dgin
gpl
aces
Food
stor
es
Mis
cpr
ofes
sion
alse
rvic
es
Hos
pita
ls
Med
ical
and
othe
r hea
lthse
rvic
es
Agr
icul
ture
Educ
atio
nal
serv
ices
Mis
cbu
sine
ssse
rvic
es
Eatin
g an
ddr
inki
ngpl
aces
Con
stru
ctio
n
In m
illio
ns
left axis
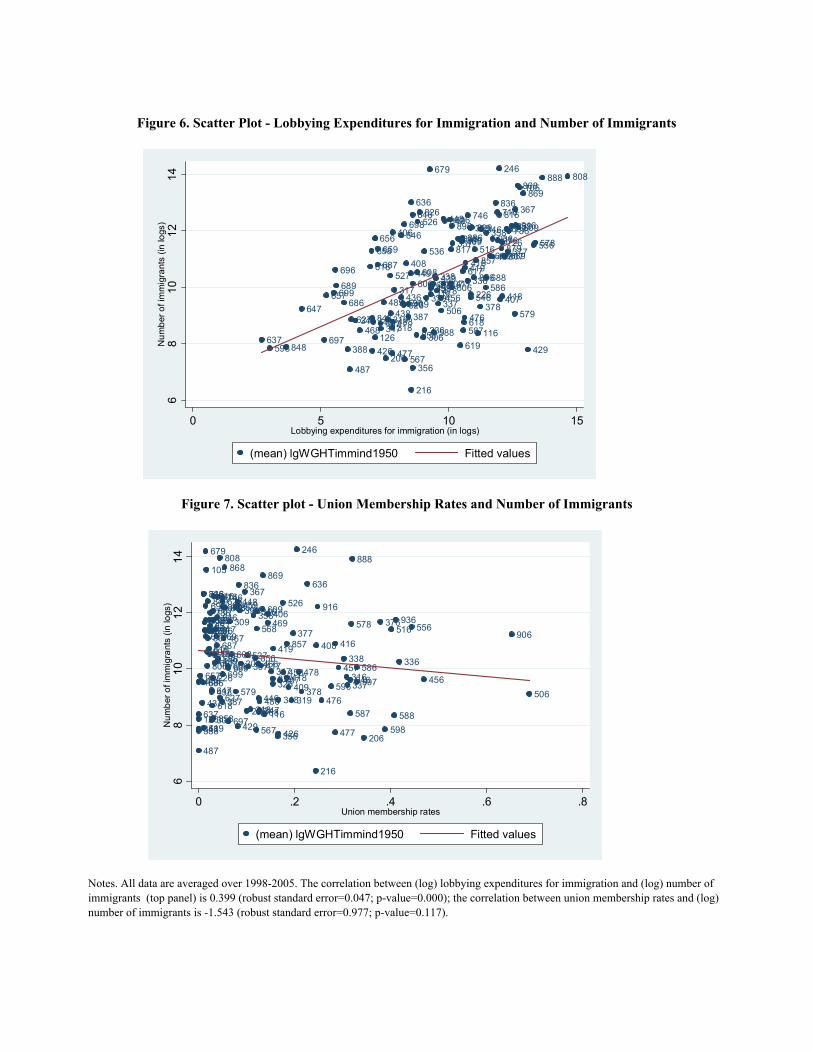
Figure 6. Scatter Plot - Lobbying Expenditures for Immigration and Number of Immigrants
Figure 7. Scatter plot - Union Membership Rates and Number of Immigrants
Notes. All data are averaged over 1998-2005. The correlation between (log) lobbying expenditures for immigration and (log) number of immigrants (top panel) is 0.399 (robust standard error=0.047; p-value=0.000); the correlation between union membership rates and (log) number of immigrants is -1.543 (robust standard error=0.977; p-value=0.117).
105
116126
206
216
226
236
246
306
307308
309
316317
318319
326
336
337
338
346
347348
356
357358
367
376377
378379
386
387
388
399406
407
408
409
416
417418
419
426 429
436
437438
439
446
448
449
456457458
467
468
469
476
477
478
487
488
489506
516
526
527
536
546
556
567
578
579
586
587588
596
598
606607608
609
616 617
618
619
626
627
636
637
646
647
656
657
658659
667
668669
679
686
687688
689
696
697
698
699
716
726736
746
806
807
808
816
817
826836
846
847
848
849
856
857
858
859
868869
879
888
896898
899 916936
68
1012
14N
umbe
r of i
mm
igra
nts
(in lo
gs)
0 5 10 15Lobbying expenditures for immigration (in logs)
(mean) lgWGHTimmind1950 Fitted values
105
116126
206
216
226
236
246
306
307308
309
316317
318319
326
336
337
338
346
347348
356
357358
367
376377
378379
386
387
388
399 406
407
408
409
416
417418
419
426429
436
437438
439
446
448
449
456457458
459
466
467
468
469
476
477
478
487
488
489506
516
526
527
536
546
556
567
568 578
579
586
587 588
596 597
598
606607608
609
616617
618
619
626
627
636
637
646
647
656
657
658659
667
668669
679
686
687688
689
696
697
698
699
716
726736
746
806
807
808
816
817
826836
846
848
849
856857
858
859
868869
879
888
896898
899
906
916936
68
1012
14N
umbe
r of i
mm
igra
nts
(in lo
gs)
0 .2 .4 .6 .8Union membership rates
(mean) lgWGHTimmind1950 Fitted values
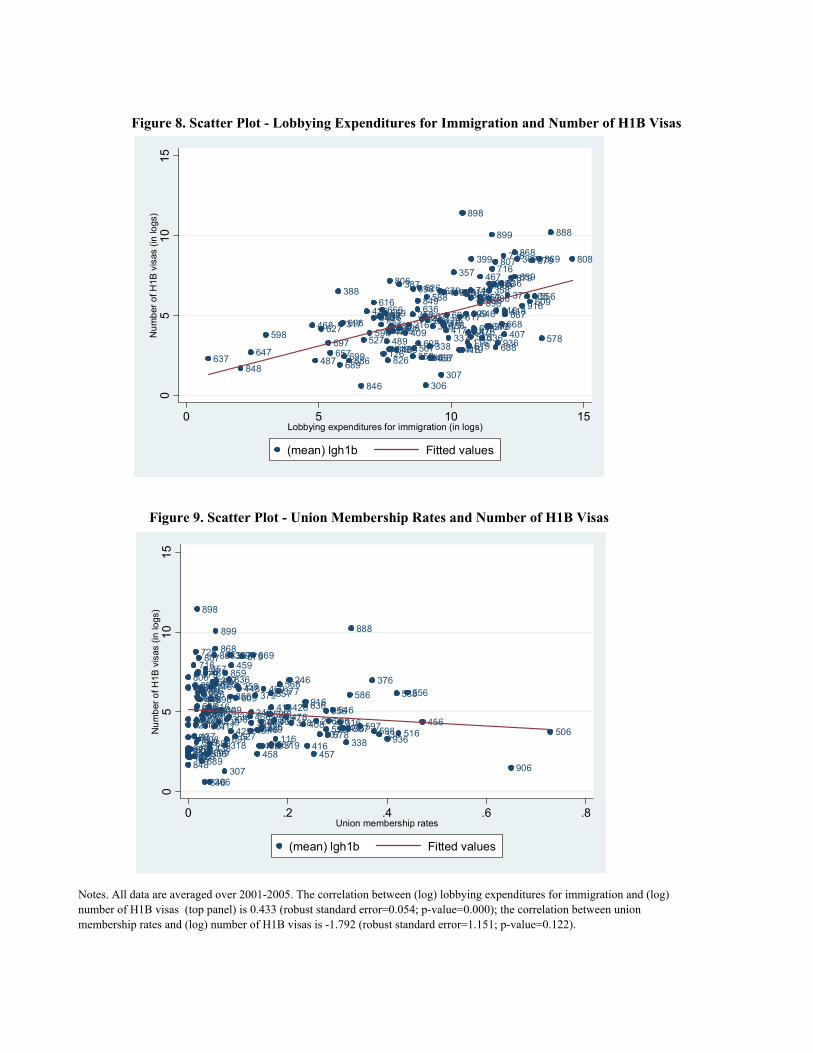
Notes. All data are averaged over 2001-2005. The correlation between (log) lobbying expenditures for immigration and (log) number of H1B visas (top panel) is 0.433 (robust standard error=0.054; p-value=0.000); the correlation between union membership rates and (log) number of H1B visas is -1.792 (robust standard error=1.151; p-value=0.122).
Figure 8. Scatter Plot - Lobbying Expenditures for Immigration and Number of H1B Visas
Figure 9. Scatter Plot - Union Membership Rates and Number of H1B Visas
105
116126
206 216
226
236
246
306307
308309
316317
318319
326336337
338
346347348 356
357
358
367
376377
378
386387
388
399
406407408409
416
417
418
419
426
448
456
457458
467
468
469
476477478
487
488489 516
526
527
536
546
556
567578
579
586
587
588
596598
606607
608
609616617
618
619
626
627
636
637
646
647
656
657
658659 667668
669679
686
687
688
689
696
697
698
699
716726
746806
807 808
816817
826
836
846
848
849 856857
858
859
868869
879
888
896
898
899
916
936
05
1015
Num
ber o
f H1B
vis
as (i
n lo
gs)
0 5 10 15Lobbying expenditures for immigration (in logs)
(mean) lgh1b Fitted values
105
116126
206216
226
236
246
306307
308309
316317
318 319
326336337
338
346347 348 356
357
358
367
376377
378
379386387
388
399
406407 408409
416
417
418
419
426
429436
437438
439446
448449
456
457458
459
466
467
468
469
476477478
487
488489 506516
526
527
536
546
556
567
568
578
579
586
587
588
596 597598
606607
608
609616617
618
619
626
627
636
637
646
647
656
657
658659667668
669679
686
687
688
689
696
697
698
699
716726
736746
806
807808
816817
826
836
846
848
849 856 857
858
859
868869
879
888
896
898
899
906
916
936
05
1015
Num
ber o
f H1B
vis
as (i
n lo
gs)
0 .2 .4 .6 .8Union membership rates
(mean) lgh1b Fitted values
Related Documents


