1 Do Immigrants Bring Crime? A Lesson from a Natural Experiment Murat Anıl MERCAN 1 Nazire BEGEN 2 1 [email protected], (+90 0537 762 10 13 ) Department of Economics, Gebze Technical University 2 [email protected], (+90 0545 686 16 78) Department of Economics, Gebze Technical University Correspondence concerning this article should be addressed to Murat Anil Mercan, Gebze Technical University Isletme Fakultesi #145 Gebze, Kocaeli TURKEY 41400

Welcome message from author
This document is posted to help you gain knowledge. Please leave a comment to let me know what you think about it! Share it to your friends and learn new things together.
Transcript
1
Do Immigrants Bring Crime? A Lesson from a Natural Experiment
Murat Anıl MERCAN1 Nazire BEGEN
2
1 [email protected], (+90 0537 762 10 13 ) Department of Economics, Gebze Technical University
[email protected], (+90 0545 686 16 78) Department of Economics, Gebze Technical University
Correspondence concerning this article should be addressed to Murat Anil Mercan, Gebze Technical
University Isletme Fakultesi #145 Gebze, Kocaeli TURKEY 41400

2
Abstract
Objective: Most of recent Syrian refugees are hosted in Turkey, which has more than 3.6
million people. In this study, we investigated the impact of refugees on the host
country’s crime rate in the context of the Syrian refugee flow into Turkey.
Method: Using statistics from Turkish Penal Institutions for the time period from 2010
to 2014, we applied the difference-in-difference estimation method. In addition, we
implemented a synthetic control group for the analysis, additional to commonly used
control regions in the previous literature. We also conducted various different robustness
exercises to examine the relevance of the results.
Results: Our results suggest that the refugee influx into our sampled cities in Turkey
does not have a statistically significant impact on the crime rate when compared with the
control locations. All of the regression results in the robustness exercises were similar to
our main result.
Conclusions: Our findings suggest that the Syrian refugees did not statistically increase
the crime rates in Turkey. Given the ongoing debate about the relationship between
immigrants and crime rates, there is not enough evidence for the common belief that
immigrants who raise the crime rates in the host country.
Keywords: Refugees, Immigrants, Crime Rates, Natural Experiment

3
1. INTRODUCTION
According to the United Nations High Commissioner for Refugees (UNHCR),
approximately 68.5 million people all over the world were forced to flee their home
country by the end of 2017 because of persecution, conflict, or generalized violence, and
25.4 million of those are refugees (UNHCR, 2018). Although the conflicts in Burundi,
the Central African Republic, the Democratic Republic of the Congo, Iraq, Myanmar,
South Sudan, Ukraine, and Yemen have caused a displacement crisis, the major
dislocation of people occurred because of the Syrian civil war that led approximately 6.3
million individuals to flee Syria by the end of 2017. The majority of Syrian refugees are
hosted by Turkey (3,424,200), Lebanon (992,100), Jordan (653,000), Germany
(496,700), Iraq (247,100), Egypt (126,700), Sweden (103,600), Austria (43,900), and the
Netherlands (30,900) (UNHCR, 2018).
Refugees may pose enormous moral, political, and economic challenges for host
countries; thus, they may not be welcome in some countries. An impressive example of
a country that has welcomed refugees despite the challenges is Turkey, which hosted the
largest number of global refugees, totaling approximately 3.5 million, by the end of
2017 (UNHCR, 2018). According to the Migrant Acceptance Index, which determines a
country’s attitude toward immigrants, Turkey ranks 117th
out of 140 countries (Fleming
et al., 2018), which may suggest that Turkish people are prejudiced against immigrants.
The underlying reason for this sentiment could be the threat of crime and terrorism
brought by these immigrants from their countries, which could endanger public safety.
This concern is true not only in Turkey but also in Europe and the US. For example, a
recent nationwide survey reveals that Americans think that immigration is the second
most important issue in the US (Newport, 2018). In addition, in Europe, former Italian
president Berlusconi declared that “… migrants are a social bomb that risks exploding”
(Jebreal, 2018), and Italy’s far-right Northern League leader Matteo Salvini announced
that “unchecked immigration brings chaos, anger” and “drug dealing, thefts, rapes and
violence” (Horowitz, 2018). Furthermore, US President Donald Trump famously said
The US has become a dumping ground for everybody else's problems. Thank
you. It's true, and these are the best and the finest. When Mexico sends its
people, they're not sending their best. They're not sending you. They're not
4
sending you. They're sending people that have lots of problems, and they're
bringing those problems with us. They're bringing drugs. They're bringing crime.
They're rapists. And some, I assume, are good people. (Wolf, 2018)
Therefore, scientific investigation of the effect of immigrants on the crime rate of their
host countries is essential to creating better policies.
Although we have stressed the importance of studying this effect, we must also
note that the task is a difficult one because of several econometric challenges. For
example, the problem of selection is one of the most important issues encountered when
nonexperimental immigration data are used (Borjas, 1987, Borjas, Bronars and Trejo,
1992). One way to tackle this problem is by conducting a natural experiment in which
immigrants do not self-select themselves into a host country. Previous studies have
established that the Syrian refugee inflow to Turkey presents a great quasi-experimental
estimation opportunity (Balkan and Tumen, 2016). Therefore, in this paper, we
investigate the effect of Syrian refugees on crime rates in Turkey using a difference-in-
difference (DiD) approach.
According to statistics from Turkish penal institutions, the number of inmates in
prisons has increased between 2009 and 2015 in Turkey. Our estimates are based on a
sampling of those cities that have the highest Syrian refugee populations in Turkey. The
pre-treatment period we used is from 2010 to 2011, while the post-treatment period is
from 2012 to 2014 for our main analysis.
Even though we have crime data at the city level, in order to be compatible with
previous studies, we chose the same treatment and control groups (e.g., Ceritoglu et al.,
2015), focusing on regions that include several cities (up to four cities). It is called as
NUTS2 by Eurostat. Moreover, we also had the advantage of having a dataset at the city
level, which corresponds to the NUTS3 subdivision level and focused on the Turkish
cities that had the highest immigration in proportion to the city’s population as the
treatment perform a robustness check. According to our estimates, the refugee influx
into the treatment area in Turkey has no statistically significant effect on the crime rate
compared with the influx to the control area. We also performed various robustness
exercises to check the relevance of the results. First, we investigated the refugee−crime

5
relationship in the five cities that had the highest immigrant to population ratio. Then,
based on the refugee density, we established new post-immigration periods of 2012,
2013, 2014 and 2015. Finally, we considered two alternative control areas instead of our
original control area to ensure the accuracy of the control group. The control groups are
entire provinces that exclude the treatment area and entire provinces that exclude both
the treatment and original control areas. Almost, all of the regression results in the
robustness exercises support our baseline findings.
This paper is divided into six main sections. The second section briefly discusses
the history of the Syrian refugee inflow into Turkey and provides a review of the
existing empirical literature on the relationship between immigration/refugees and
crime. The third section introduces the data, estimating methods, and the model. The
fourth section presents the applied results of the model estimated using the DiD method.
The fifth section documents our robustness exercises for the same regression analyses
using the DiD method and the Synthetic Control Method. Finally, the sixth section
contains the conclusion and final remarks.
2. THE HISTORY OF SYRIAN REFUGEES IN TURKEY
Following the outbreak of civil war in Syria in March 2011, numerous refugees
fled from northern Syria to the southeastern areas of Turkey. Initially, only 252 refugees
were reported on April 29, 2011, but by March 2015 the number of refugees had reached
1,858,000 (Erdogan, 2014). As of October 26, 2015, 10−12% of these Syrian refugees
lived in camps, while 88−90% lived outside the camps (Erdogan and Unver, 2015). A
total of 25 camps, each described as a “center for peace,” are found in the following 10
provinces (with the number of refugees in camps indicated in parentheses): Sanliurfa
(104,890), Gaziantep (52,277), Kilis (33,651), Hatay (14,803), Kahramanmaras,
(17,853), Mardin (15,740), Adana (10,598), Adiyaman (9,599), Osmaniye (9,160), and
Malatya (7,813). The cities with the highest Syrian refugee population are Sanliurfa
(356,390), Hatay (341,174), Istanbul (305,067), Gaziantep (277,905), Adana (121,851),
Kilis (114,567), Mersin (114,148), Mardin (88,139), Izmir (73,314), and
Kahramanmaras (72,653). Most of the local managers claim that the official Figures do
not reflect the actual numbers, which could be much higher.

6
The Figure-1 below illustrates the number of registered Syrian refugees in
Turkey from 2012 to 2018 as of August 2018. The data sources are the UNHCR and the
Government of Turkey.
[Figure- 1]
The impact of Syrian refugees has been a prominent theme in many studies, such
as in studies of labor markets (Akgunduz, van der Berg and Hassink, 2015, Ceritoglu et
al., 2015, Del Carpio and Wagner, 2015, Tumen, 2016), consumer prices (Balkan and
Tumen, 2016), and perceptions of Turkish university students of their Syrian classmates
(Ergin, 2016). More recently, a working paper by Balkan et al. (2018) investigated the
effect of Syrian refugees on housing rents and perceived crime in areas hosting these
refugees in Turkey.
3. LITERATURE REVIEW
Although a growing body of literature has investigated the labor market effects
of immigration (e.g., Altonji and Card, 1991, Aydemir and Borjas, 2011, Borjas, 2005,
2003, 2006, 1987, Card, 2005, Friedberg and Hunt, 1995), few studies have delved into
the effect of immigration on crime. More specifically, studies have reviewed either the
role of legal status on a migrant’s criminal activity (e.g., Freedman, Owens and Bohn,
2018, Mastrobuoni and Pinotti, 2015, Pinotti, 2017) or the relation between migration
influx and criminal activity, of which the latter topic is our interest in the present study.
The considerable literature on this topic has been published for the US but with
contradictory findings. A growing body of literature that exploits a variety of data and
methods found that immigrants commit crime at lower rates than natives. Previous
studies on this issue have demonstrated that in US cities where immigrants are
concentrated, crime rates between 1980 and 1990 were relatively higher than those in
other cities. Even though I after controlling for the demographic characteristics of cities,
immigrants, and natives, recent immigrants were shown to have a lower propensity to
commit crimes than natives or to have no influence on crime rates at all (Butcher, 1998).
Another empirical demonstration of this effect is that Hispanic immigrants were less
likely to be complicit in crime than US citizens (Hagan and Palloni, 1999). In contrast to
earlier findings, no evidence of a relationship was detected by a study (Lee, Martinez
7
and Rosenfeld, 2001) that specifically investigated whether there was a relationship
between the homicide rate of Latinos and African Americans and immigration. The
results of that study indicate that recent immigration does not increase the rate of
homicide trends in the US. Although many studies have found either a negative or no
relationship between immigration and crime, several studies have found a positive link
between these variables. For instance, a study based on prison censuses has
demonstrated that the involvement of foreign-born people in minor crimes is more
prevalent than that of natives, whereas the rate of major crime involvement for the two
groups is quite similar (Moehling and Piehl, 2009). A longitudinal study of crime and
immigration has reported a positive, statistically significant relationship between
immigrants and the property crime rate; however, no significant link was reported
between immigrants and violent crime rates in US counties for the period from 1980 to
2000 (Spenkuch, 2013). In addition, the previous literature suggests that the
contradictory findings may be explained by the type of crime. One article asserts that
there is no link between violent and property crimes and Mexican immigration (Chalfin,
2013). However, a subsequent study found that aggravated assault is one crime that
increases as a result of Mexican immigrants, while other crimes, such as rape and
molestation, larceny, and motor vehicle theft, have an associated decrease (Chalfin,
2015).
More recently, researchers have shown an increased interest in European data.
A longitudinal study assessed the significance of the relationship between crime and
immigration across Italian provinces during the period from 1990 to 2003 (Bianchi,
Buonanno and Pinotti, 2012). The researchers explored the link between the total
number of migrants and total crime by utilizing the fixed-effect (FE) estimation method,
which yielded a positive coefficient. In contrast with the FE estimation, the results
obtained from the instrumental variable estimation show that there is no significant
effect of immigrants on total crime, especially on property crimes. Another study used
cross-sectional data that were collected in four waves between 2002 and 2008 for 16
Western European countries (Nunziata, 2015). This study used both FE and instrumental
variable methods and concluded that an increase in immigration does not have an impact
on crime victimization. Another important study explored the connection between

8
immigration and crime rates in West Germany between 1996 and 2002 (Piopiunik and
Ruhose, 2017). The researchers focused on the impact on crime of the descendants of
German immigrants who had migrated from Russia and other East European countries
after the collapse of the Soviet Union. They found that the areas with higher preexisting
crime levels and overpopulation after immigration experienced higher crime rates.
Much of the existing research has focused on the link between crime and
immigration; however, far too little attention has been paid to the criminal behavior of
refugees. Bell et al. (2013) examined local violent and property crime patterns in
England and Wales in the period from 2002 to 2009. They considered two immigrant
flows, namely, an asylum wave and an A8 wave.3 In their paper, they highlight that the
natives and immigrants from EU accession countries (the A8 wave) have better labor
market opportunities than those in the asylum wave, thereby suggesting that crime rates
would be much higher in the second group. The results of this study show that although
there was no significant increase in violent crime for either wave, the asylum and A8
waves have a statistically significant positive and negative effect on property crime,
respectively. These results are consistent with those from a spatial econometric analysis
in a previous study of immigrant flow to London (Jaitman and Machin, 2013). By
contrast, a study that evaluated the short-run effects of the refugee influx into 16 German
states in 2014 and 2015 indicated an increase in nonviolent crime rates, especially drug
offenses and fare-dodging, due to lack of economic opportunities (Gehrsitz and Ungerer,
2017). In another important study, refugees exposed to civil conflict or mass killings at
the age of 1−12 years old are documented to be 40% more prone to commit violent
crimes than the average cohort in Switzerland during the period from 2009 to 2012
(Couttenier et al., 2016). Recent preliminary work on the relation between refugee
settlements and local crime rates in the US indicates that refugees may not have had a
significant effect on local crime rates during the period from 2006 to 2014 (Amuedo-
Dorantes, Bansak and Pozo, 2018). Even when the researchers restricted the sample to
refugees who came from the seven countries on which a travel ban was imposed on
3An asylum wave refers to the influx of people from Iraq, Afghanistan, Somalia, and the former Yugoslavia in the late
1990s and early 2000s. An A8 wave refers to the inflow of workers from the European Union (EU) accession
countries, including Poland, Hungary, the Czech Republic, Slovakia, Slovenia, Estonia, Latvia, and Lithuania, after
the EU expansion in 2004.

9
January 27, 2017, by executive order, they did not find any statistically significant
evidence of a relationship between refugee inflows and an increase in crime rates.
A recent systematic literature review for the US that focuses on studies published
between 1994 and 2014 attributes the different findings across studies that examined the
relationship between crime and immigration to variability in the measurement of
immigration and crime, study units of analysis, temporal design, and destination context
(Ousey and Kubrin, 2018). The reviewers suggest that a common view among studies is
null or has no significant association and note that 62% of the studies reviewed indicate
no statistical significance at a 5% confidence level. Furthermore, the majority of the
statistically significant regression coefficients are negative, and the number of studies
with significant negative effects is 2.5 times higher than those with positive effects.
To the best of our knowledge, two related studies that mention the effect of
Syrian refugees on crime in Turkey have been conducted. A recent working paper
reports that crimes do not significantly increase in neighborhoods that take in refugees
(Balkan et al., 2018). However, our study is implicitly different because the researchers’
analysis in that study was based on the perceptions of the natives rather than the official
crime rates. Moreover, the previous study assessed the respondents’ perceptions of
whether crimes in the neighborhood changed relative to the previous year, which
perceptions are unlikely to represent actual crime in the region, especially if we consider
the aforementioned prejudice against immigrants. In addition, the previous study used
the highest classification level of Turkey’s geographic subdivisions based on Eurostat’s
Nomenclature of Territorial Units for Statistics (NUTS), namely, NUTS1, which
corresponds to 12 geographic regions in Turkey. However, our dataset contained
information at the city level, which corresponds to the NUTS3 subdivision level. Finally,
the previous study did not separate the impact of refugees by different types of crimes,
which is essential because the previous literature suggests that the relationship between
immigrants and crime varies by type of crime. For instance, another related study
deduced that the influx of refugees from Syria resulted in an increased number of illicit
drug seizures between 2008 and 2013 in Hatay, a Turkish city (Arslan et al., 2015).

10
4. METHODOLOGY
4.1. Data
The previous literature uses the incarceration rate as a proxy for involvement in
criminal activity (Bell, Fasani and Machin, 2013, Borjas, Grogger and Hanson, 2010,
Butcher and Piehl, 1998, 2000, 2007, Chalfin, 2013, Moehling and Piehl, 2009).
Therefore, the crime datasets used in this study were based on Turkish penal institution
statistics for the period 2009 to 20154. The crime data on 25 criminal activities are
annually published by the Turkish Statistical Institute (TurkStat) and formulated as
cross-sectional data at a given point in the year for all Turkish cities. In the dataset, the
city indicated is where the crime occurred, not the penitentiary’s location. As the data
covered only the civilian population, crimes against the military criminal law are
excluded because these are not related to Syrian refugees. Moreover, opposition to the
Bankruptcy and Enforcement Law was not included because those are not related to
immigrants and the incarceration rates were heavily affected by legal changes during the
sample period. Similar to the previous literature, crime types are classified into two
groups: nonincome-generating which includes 13 crime types and income-generating
crimes which include 9 crime types (e.g., Freedman, Owens and Bohn, 2018)5. The
nonincome- generating crimes consisted of homicide, assault, sexual crimes, kidnapping,
defamation, bad treatment, prevention of performance, traffic crimes, forestry crimes,
crimes related to firearms and knives, criminal threats, damage to property, and contrary
to the measures for family protection. The income-generating crimes consisted of theft,
smuggling, opposition to cheque laws, swindling, the use and purchase of drugs, the
production, and sale of drugs, forgery, embezzlement, and bribery. In this study, we
assessed six different crime categories as follows: nonincome-generating crimes,
income-generating crimes, theft, assault, homicide, and total crime. Total crime was
generated by aggregating all available crime types, except for crimes against military
criminal law and under bankruptcy laws. The dependent variable is the logarithm of the
proportion of these crime types per thousand residents (e.g., Freedman, Owens and
4 We did not use data after 2014, because in Turkey from 2015 incarceration rates were rise steeply because of the
investigations about the religious sect who is responsible for the military coup attempt on 15th July 2016. 5 The number of theft and robbery crime types are summed up due to small figures and named as theft.

11
Bohn, 2018). Only homicide crime rates are taken in one out of a million residents of
census tracts.
Selection problems are one of the most important issues encountered when non-
experimental immigration data are used (Borjas, 1987, Borjas, Bronars and Trejo, 1992).
One way to address this problem is to identify circumstances where immigrants do not
self-select into a certain country. The displacement of Syrian refugees to Turkey
presents an appropriate context for deploying a quasi-experimental estimation strategy
(Balkan and Tumen, 2016). Therefore, we use the DiD methodological approach to
estimate the effect of Syrian refugees on crime rates in Turkey.
In 2002, the TurkStat has implemented the Nomenclature of Territorial Units for
Statistics (NUTS) within the framework of the EU accession period. There are three
classifications for Turkey; NUTS1 (12 Regions), NUTS2 (26 Subregions), NUTS3 (81
Provinces). The previous literature that focuses on the influx of Syrian refugees to
Turkey utilizes NUTS2 classification (e.g., Balkan and Tumen, 2016, Tumen, 2016).
Our dataset contained crime data based on province, but in order to be compatible with
previous studies, we used the same treatment and control groups as they did (Ceritoglu
et al., 2015). Treatment area included 14 cities6 from the southeastern part of Turkey
where the proportion of refugees to the population is above 2% (AFAD, 2013) and the
control area included 15 cities7 with similar cultural properties, socio-demographic
aspects, and economic development level to the treatment area. In these cities, the ratio
of refugees to the population is close to zero. Moreover, we used the advantage of
having a dataset at the province level. For additional robustness check, we focus on the
Turkish cities that received the highest immigration in proportion to the city’s
population as the treatment area. In that analysis, we define areas that received large
influxes of refugees and small influxes of refugees as the treatment and control areas,
respectively. In addition, Figure-3 shows a map of Turkey on which we have highlighted
the ratio of immigrants to natives for treatment and control areas in 2015.
6 At the NUTS2-level regional division, the treatment group includes TR62 (Adana, Mersin), TR63
(Hatay, Kahramanmaras, Osmaniye), TRC1 (Gaziantep, Adiyaman, Kilis), TRC2 (Sanliurfa, Diyarbakir),
and TRC3 (Mardin, Batman, Sirnak, Siirt). 7 The control group includes TRA1 (Erzurum, Erzincan, Bayburt), TRA2 (Agri, Kars, Igdir, Ardahan),
TRB1 (Malatya, Elazig, Bingol, Tunceli), and TRB2 (Van, Mus, Bitlis, Hakkari).

12
We focused on the period between 2010 and 2014 for our main analysis. Since
Syrian refugees started to arrive in Turkey at the beginning of 2012, a year interval is
constituted around this cutoff date: the pre-immigration period is defined as 2010−2011,
and the post-immigration period as 2012−2014. Moreover, we conduct the same analysis
for robustness check using two different year intervals; 2010-2013 and 2009-2015 (we
define them as short-term and long-term, respectively).
In this study, the control variables used in the analyses are based on the previous
literature (e.g., Amuedo-Dorantes, Bansak and Pozo, 2018, Spenkuch, 2013). Total
employment, real GDP per capita, education variables are obtained from the TurkStat at
province-level. Total employment is employment rate at province level. Real GDP per
capita is calculated as deflating per capita by using consumer price index (CPI). With
regard to the education level of individuals, we created two groups: those with high
school degree or lower and those who have higher degree than high school diploma per
thousand residents. To proxy for the likelihood of getting caught by law enforcement,
we control for the proportion of lawyers registered with the Bar Association per
thousand residents (Republic of Turkey Ministry of Justice, 2019). Housing costs are
considered as a prominent determinant of refugee placements, so we include house price
index that varies yearly for NUTS2-level regional division (Central Bank of the Turkish
Republic, 2019). Religiosity is another important factor in the explanation of crime,
thus, the proportion of participants in Quran courses are controlled analysis (e.g.,
Brettfeld and Wetzels, 2006). The data is attained from the Presidency of Religious
Affairs. Moreover, year and city dummies are included, models.
Table-1 presents the summary statistics for both the treatment group and control
group. It suggests that the means of theft, homicide, income-generating crimes and total
crimes are higher in the treatment group than in the control group. In addition, the
number of inmates who committed income-generating crimes is higher than those who
committed non-income generating crimes in the treatment group and vice versa in the
control group. Moreover, theft is the highest crime committed in the treatment and
control groups among three crime types, namely theft, assault, and homicide. In
addition, on average treatment cities have slightly higher GDP per capita and house

13
prices. However, total employment, in the control group both formal education and
religious education numbers are higher.
Table-2 shows the number of crimes during the periods before and after 2012.
On the other hand, Figure-2 shows the total crime rates per thousand residents for both
treatment cities and control cities from 2009 to 2015. As shown, the crime rates after
2012 increased in both the treatment and control groups. Moreover, it is seen that for
both treatment group and control group, there is an increasing trend for crime rates
between post-immigration and pre-immigration periods.
4.2. Model
Our quasi-experimental estimation strategy aims at estimating the effect of
refugees on the crime rates in the host countries by comparing the number of crimes
during pre-immigration and post-immigration periods in the treatment versus control
cities. To achieve this purpose, we created two dummy variables: (i) T = 1, if the city is
in the treatment area; otherwise, T = 0; and (ii) P = 1 for the post-immigration period
(2012, 2013 and 2014) and P = 0 for the pre-immigration period (2010 and 2011). This
framework led to the following DiD formula:
ln(𝑦𝑖,𝑗,𝑡) = 𝛽1 + 𝛽2(𝑇𝑖. 𝑃𝑖) + 𝛽3𝑋𝑖,𝑗,𝑡 + 𝑓𝑗 + 𝑓𝑡 + 𝜀𝑖,𝑗,𝑡,
where i, j, and t are the index provinces, areas, and years, respectively. The dependent
variable is the logarithm of the proportion of total crime per thousand residents, 𝑋 is a
vector of province-level socioeconomic variables, and 𝜀 is an error term. The elements 𝑓𝑖 and 𝑓𝑗 are the region-level and year-level FEs, respectively. The main coefficient of
interest is 𝛽2, which renders the average change in the crime rates in the treatment area
as a result of the refugee influx.8
5. RESULTS
This section presents baseline estimates considering between the year 2010 and
2014. Table-3 shows the refugee influx impact on crime rates in the treatment area in
comparison with the control area for between the years 2010 and 2014. The analysis is
8See Tumen (2016), Balkan and Tumen (2016), and Ceritoglu, Gurcihan Yunculer, Torun, and Tumen
(2017) for details of a similar empirical setup.

14
performed using the DiD method. Our dependent variable is the logarithm of the
proportion of total crime per thousand residents. In addition, all columns include the
following control variables: employment rate, the rate of per capita GDP, the number of
lawyers and counselors registered with the Bar Association per thousand residents,
house price, the rate of college or higher degree graduates, year and city dummies are
included.
[Table-3]
Throughout the paper, we applied two different estimation approaches for DiD,
according to weighting the regression. Firstly, the Model 1 is constructed without survey
weights and with robust standard errors. The findings show that the refugee influx into
the treatment area in Turkey does not have a statistically significant effect on the crime
rates compared with the control area but the assault that has a negative coefficient. All of
six crime types that are used in our analysis have low t-values (the highest is 1.82 for the
assault.)
Furthermore, survey weighting is useful when estimating causal effects. If the
sample is exogenous and the model is correctly defined, ordinary least squares (OLS)
and weighted least squares (WLS) are used to estimate the consistent regression
coefficients (Solon, Haider and Wooldridge, 2015). Thus, we conducted WLS, and we
used the total population of each city as our weighting tool. Model 2 reports those
estimates with robust standard errors. This framework supported the findings that are
estimated with OLS, which is that the refugee influx into the treatment area did not
significantly reduce the rate of criminal activity in that area compared with the control
area. We also executed cluster models with and without the weight and found consistent
results, shown in Table-3. In those calculations, standard errors are clustered with
respect to the city and the total population of each city is used as a weight. These
different weighting approaches yield similar results and the t-value of assaults become
smaller.
The DiD method that we utilized our analysis up to now provides comparison
between the treated and control areas across time and space. In some situations such as

15
having small number of clusters (e.g., regions, municipalities or individuals) induce
inconsistent standard errors (Angrist and Pischke, 2008) or creating comparison group
may not represent as much as desired. Therefore, a growing literature suggests the
Synthetic Control Method (SCM) might be used as an alternative. Moreover, it is stated
that provinces using treatment and control regions are selected in the light of previous
studies which are conducted NUTS2 that may lead to have cities different that treatment
cities. Thus, we are carried on the SCM exploiting the advantages of crime data based on
province to verify accuracy of treatment region.
The Synthetic Control Method
The SCM first is introduced by Abadie and Gardeazabal (2003) and then further
improved in Abadie, Diamond, and Hainmuller (2010, 2015). The main goal of this
econometric technique is to evaluate whether the intervention/treatment have an effect
on some consequences in the treated unit, pertaining to when it would not have occurred
and describe a control group called the Synthetic Control unit. The SCM is explained by
non-intervention outcome for unit i at time t: 𝑌𝑖𝑡𝑁 = 𝛼𝑡 + 𝛽𝑡𝑋𝑖 + µ𝑡𝑍𝑖 + 𝜀𝑖𝑡 (1)
where 𝛼𝑡 is a common time-dependent factor, 𝛽𝑡 is a vector of unknown parameters, 𝑋𝑖 is a vector of observed covariates not affected by the intervention, µ𝑡𝑍𝑖 is a vector of
unobserved time-specific common factors multiplied by a vector of unobserved unit-
specific factor loadings, and 𝜀𝑖𝑡 is an unobserved temporary shock. µ𝑡𝑍𝑖 enables the
impact of unobserved unit-specific confounders to vary over time. The unit of interest is
identified as unit i=1 and a vector of weights are defined as 𝑆 = (𝑠2, … , 𝑠𝑘+1)′ in which
k represents non-treated units, 𝑠𝑘 ≥ 0, and 𝑠2 +⋯+ 𝑠𝑘 = 1. A linear combination of
non-treated units for any time ∑ 𝑠𝑘𝑌𝑘𝑡𝑘+1𝑘=2 is created with the help of S which also
denotes synthetic control. This term is used as counterfactual for the intervention unit. A
significant analysis and discussion conducted within the scope of this framework
indicate that a 𝑆∗ which have similar characteristics with S can ensure an unbiased
estimator of outcome in the absence of intervention𝑌1𝑡𝑁. In that case, vector of observed
covariates and linear combination of pre-intervention outcomes are shown to be 𝑋1 = ∑ 𝑠𝑘∗𝑋𝑘𝑘+1𝑘=2 and 𝑌1̅ = ∑ 𝑠𝑘∗𝑌�̅�𝑘+1𝑘=2 , respectively (Abadie et al., 2010). This method
16
aims to minimize the distance between estimated variables of the treated unit and the
synthetic control unit with respect to S*. Moreover, the weights put on the estimated
variables are selected to minimize the mean square predictor error of the outcome
variable for the pre-intervention periods.
This method has several advantages. First, it constructs a synthetic city, which
substitutes the control group and decreases the temporary nature of choosing the control
group. Second, we confirm its quality by controlling the pre-treatment differences of the
dependent variable between the treated and the Synthetic Control units. Finally, by
creating a synthetic control for every unit (e.g., city) we can obtain a distribution of
observed effects. Then we can calculate a p-value for how significant the post-treatment
difference is compared to the pre-treatment relative to the whole distribution, thus
conducting inference with idiosyncratic city-specific shocks.
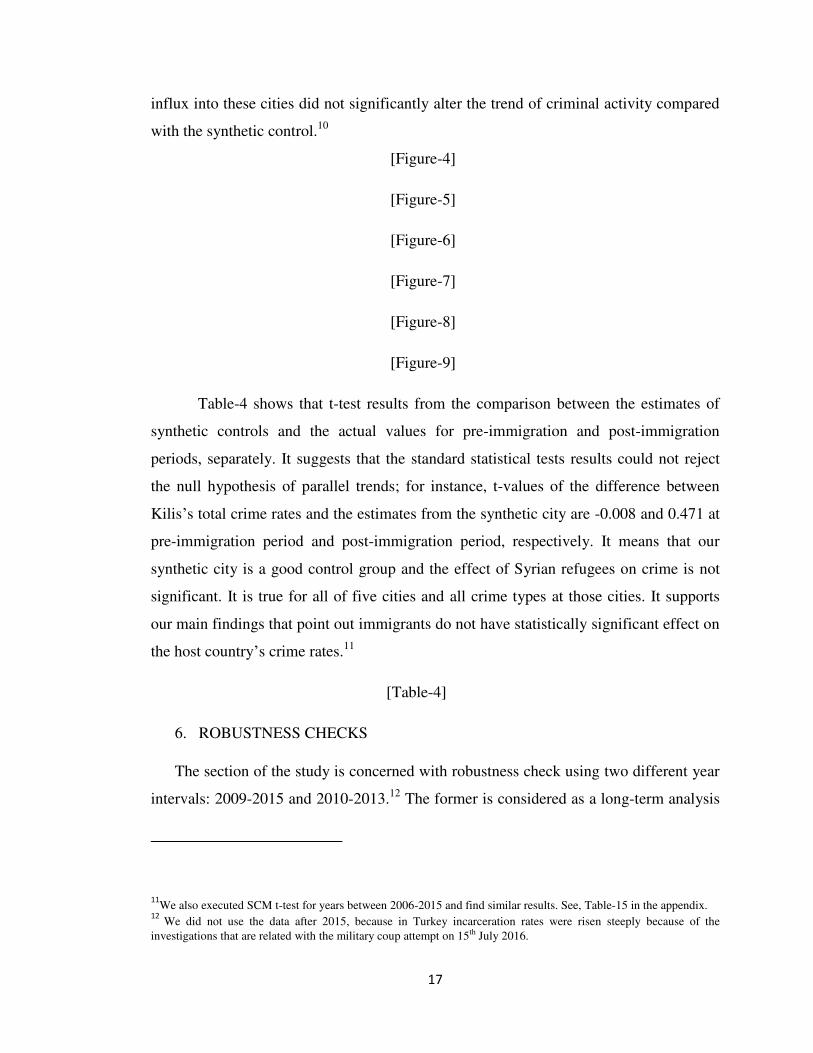
The Synthetic Control Method Analysis Results
This part of the study discusses the findings obtained from the SCM between years 2006
and 2014. We have utilized these years because SCM gives better results when keeping
the year longer.9 As a far as we know, our study is the first attempt to use the SCM for
any analysis of Turkey. The SCM is conducted for five cities which have the highest
immigrant to native population ratio; Kilis (39%), Hatay (13%), Gaziantep (13%),
Sanliurfa (10%), and Mardin (9%). We can reassign the treatment to the regions that did
not affected by the migration wave from Syria. Thus, we construct synthetic
counterfactuals creating donor pool from up to 67 cities. Subsequently, we compute the
difference between each actual city and their synthetic counterparts and plot all these
difference-time series together to see whether these cities stand out. If this often
introduces estimated effects of a similar magnitude with DiD estimation, we will gain
confidence that the estimated effect for five cities are not due to the influx of Syrian
refugees. Figure-4 shows the trends in crime rates for five cities separately and their
synthetic counterparts. It is seen that the synthetic control regions follow these five cities
after the first Syrian refugee influx in Turkey in 2012. This implies that the refugee
9 We also executed SCM for years between 2006-2015 and find similar results. See, Figure 10 to Figure 15 in the
appendix.
17
influx into these cities did not significantly alter the trend of criminal activity compared
with the synthetic control.10
[Figure-4]
[Figure-5]
[Figure-6]
[Figure-7]
[Figure-8]
[Figure-9]
Table-4 shows that t-test results from the comparison between the estimates of
synthetic controls and the actual values for pre-immigration and post-immigration
periods, separately. It suggests that the standard statistical tests results could not reject
the null hypothesis of parallel trends; for instance, t-values of the difference between
Kilis’s total crime rates and the estimates from the synthetic city are -0.008 and 0.471 at
pre-immigration period and post-immigration period, respectively. It means that our
synthetic city is a good control group and the effect of Syrian refugees on crime is not
significant. It is true for all of five cities and all crime types at those cities. It supports
our main findings that point out immigrants do not have statistically significant effect on
the host country’s crime rates.11
[Table-4]
6. ROBUSTNESS CHECKS
The section of the study is concerned with robustness check using two different year
intervals: 2009-2015 and 2010-2013.12
The former is considered as a long-term analysis
11
We also executed SCM t-test for years between 2006-2015 and find similar results. See, Table-15 in the appendix. 12
We did not use the data after 2015, because in Turkey incarceration rates were risen steeply because of the
investigations that are related with the military coup attempt on 15th July 2016.

18
and the latter is considered as short-term analysis, compare to the main analysis that
depend on years between 2010 and 2014. There are number of robustness exercises that
carried out for each year interval to ensure the relevance of the results. We should
remind that most of these robustness exercises are implemented by previous studies.
i. Changing control regions
The aim of our first and second robustness exercise are confirming the accuracy
of the control group. For this reason, we create two additional control groups: all cities
in Turkey except for our main treatment cities and all cities in Turkey except for our
main treatment and control cities. We expect that the influx of refugees would have no
impact on the crime rate, although the number of refugees has increased over time.
Table-5 shows the first and second robustness check results obtained the Model 1
regression for main analysis.13
We report results from the control area that includes all
cities in Turkey except for our main treatment cities at Table-5A and the estimates from
the control area that includes and all cities in Turkey except for our main treatment cities
and control cities at Table-5B. Table-5A and Table-5B show that our results are robust.
It means that the treatment area has not witnessed different trends in crime levels as
compared with the control group. We should note that income generating crimes are
significant and homicide in two panels and theft in panel B are statistically significantly
at usual levels. For instance, for homicide the influx of refugees into the treatment area
reduced criminal activity by 22.1 percentage points compared with the control area.14
The evidence presented in this section suggests that robustness exercises consistent with
baseline analysis results.
[TABLE-5]
In the Table-6, we report the analyses are conducted for the long-term, which
extends years of DiD into 2009 and 2015. It illustrates that the results are in line with
those of previous findings. 15
Note that only theft and homicide are significant in two
13
We also executed same analysis for the Model 2 and find similar results. See, Table-11 in the appendix. 14
When we us bootstrapping for estimations of standard errors, most of significant results lose the significance
through out our analyses. 15
We also executed same analysis for the Model 2 and find similar results. See, Table-12 in the appendix.

19
panels. It means that the influx of refugees into the treatment area reduced people’s
criminal activity in these types compared with the control area in the long term. In
addition, the long-term regressions yield similar coefficients with our main analysis that
includes years between 2010 and 2014.
[TABLE-6]
Besides, we rerun regression for the short-term that includes years between 2010
and 2013. It can be seen from the findings for short-term in Table-7 that there is no link
between immigration influx and the trends of criminal rates except for homicide, which
has a negative coefficient at both of new control groups and income generating crimes
that has a positive coefficient whose t-value is 1.79.16
[TABLE-7]
ii. Using one post-immigration year
As the influx of refugees has increased, especially after 2012, we anticipated that
our findings would show different effects than in each year are regarded separately as
post-immigration periods. Thus, the other three exercises concern with reanalyzing the
same regressions, setting 2012, 2013, 2014 and 2015 as separate post-immigration
periods.
Table-8 exhibits robustness check results obtained the Model 1 regression for
four years separately.17
The results supported the findings that are estimated with OLS,
which is that the refugee influx into the treatment area did not significantly reduce the
rate of criminal activity in that area compared with the control area.
[Table-8]
iii. Long term vs. Short term
In this part, we used same treatment and control regions with previous literature i.e.
the treatment area included 14 cities and the control area included 15 cities. With those
cities, we used two different analyses: a long term, which is years between 2009 and
16
We also executed same analysis for the Model 2 and find similar results. See, Table-13 in the appendix. 17
We also executed same analysis for the Model 2 and find similar results. See, Table-15 in the appendix.
20
2015, and a short term, namely between 2010 and 2013 (some previous studies use these
years for their analysis (e.g., Tumen, 2016)). Table-9 shows that the refugee influx into
our sampled cities in Turkey does not have a statistically significant impact on the crime
rate when compared with the control locations in the long term. One interesting finding
is that only assault crime type is significant negative.
[TABLE-9]
Our short term i.e. years between 2010 and 2013 results are similar to our long-
term findings. It means that when we focus on the short term, we find that the impact of
refugees on the host country’s crime rate are statistically insignificant in all regressions,
but assault. Table-10 reports those estimates.
[TABLE-10]
CONCLUSION AND DISCUSSION
This study is the first attempt to investigate the relationship between crime rates
and immigrants from the Syrian refugee influx. We apply the DiD approach that
depends on a natural experiment, using the Syrian refugee influx into Turkey since 2012.
Our results are based on statistics from Turkish penal institutions for the period 2009 to
2015. Our estimates suggest that the Syrian refugees did not statistically increase the
crime rates in Turkey. Throughout the paper, we applied various robustness exercises
and those are similar with our main findings. We should highlight that our estimates for
homicide either have very low t-values or negative coefficients with high t-values. It is
important because anti-immigrant sentiments usually depend on immigrants commit
heinous crimes like murder or rape rather than small misdemeanors; for instance,
President Trump once said "Over the years, thousands of Americans have been brutally
killed by those who illegally entered our country and thousands more lives will be lost if
we don't act right now".
Although we strongly believe that our findings might be helpful in clarifying the
contradictory results in the literature about the effects of immigrants on crime rates
thanks to the econometric advantages of the natural experiment, our study still has some
shortcomings. For example, the misreporting of crimes may cause estimation problems,

21
that is, failure of individuals to report crimes they experienced to the police may lead to
lower incarceration rates. The Life Satisfaction Survey (LSS) of TurkStat, which is the
micro dataset, contains one question regarding the reporting of crimes. Based on the
responses to this question, in 2012, 29.4% of individuals did not report assaults they
experienced that year. When respondents were asked why they did not report the crime
to the security forces, 40% of them said that they did not think it would lead to any
results, which is the most common answer among the respondents. In 2016-LSS, 57% of
respondents did not report assaults, and 70.2% of them thought that they did not have
any results. Thus, this failure to report crime may lead to the underestimation of the
impact of the Syrian refugee influx on crime rates in Turkey. However, the homicide
rate, which is consistent with our main conclusion, is very unlikely to suffer from the
underreporting problem, which supports our conclusion.
It is worth noting that almost 3.7 million Syrian refugees live in Turkey whose
population is around 82 million. We believe that our results strongly suggest the crime
trends of Turkey did not change by Syrian refugees. It demonstrates how unfounded the
concerns about immigrants on the crime issue. Even though our results are robust and
several previous studies found similar findings; for example, the natives have higher
rates of institutionalization compared with immigrants (e.g., Butcher and Piehl, 2007),
given the contentiousness of the debate, more research on the long-term effects of
immigration on crime rates might still be necessary.

22
REFERENCES
AFAD. 2013. "Syrian Refugees in Turkey, 2013," R. o. T. P. M. D. a. E. M. Presidency,
Akgunduz, Y. E.; M. van der Berg and W. Hassink. 2015. "The Impact of Refugee Crisis on Host
Labor Markets: The Case of the Syrian Refugee Crisis in Turkey," IZA Discussion Paper.
Altonji, Joseph G and David Card. 1991. "The Effects of Immigration on the Labor Market
Outcomes of Less-Skilled Natives," Immigration, Trade, and the Labor Market. University of
Chicago Press, 201-34.
Amuedo-Dorantes, Catalina; Cynthia Bansak and Susan Pozo. 2018. "Refugee Admissions and
Public Safety: Are Refugee Settlement Areas More Prone to Crime?," Institute for the Study of
Labor (IZA),
Angrist, Joshua D and Jörn-Steffen Pischke. 2008. Mostly Harmless Econometrics: An
Empiricist's Companion. Princeton university press.
Arslan, M. M.; C. Zeren; A. Celikel; I. Ortanca and S. Demirkiran. 2015. "Increased Drug
Seizures in Hatay, Turkey Related to Civil War in Syria." International Journal of Drug Policy,
26(1), 116-18.
Aydemir, Abdurrahman and George J Borjas. 2011. "Attenuation Bias in Measuring the Wage
Impact of Immigration." Journal of Labor Economics, 29(1), 69-112.
Balkan, B. and S. Tumen. 2016. "Immigration and Prices: Quasi-Experimental Evidence from
Syrian Refugees in Turkey." Journal of Population Economics, 29(3), 657-86.
Balkan, Binnur; Elif Tok; Huzeyfe Torun and Semih Tumen. 2018. "Immigration, Housing Rents,
and Residential Segregation: Evidence from Syrian Refugees in Turkey."
Bell, Brian; Francesco Fasani and Stephen Machin. 2013. "Crime and Immigration: Evidence
from Large Immigrant Waves." Review of Economics and statistics, 21(3), 1278-90.
Bianchi, Milo; Paolo Buonanno and Paolo Pinotti. 2012. "Do Immigrants Cause Crime?" Journal
of the European Economic Association, 10(6), 1318-47.
Borjas, George J. 2005. "Foreign-Born Domestic Supply of Science and Engineering Workforce."
American Economic Review, 95, 56-60.
____. 2003. "The Labor Demand Curve Is Downward Sloping: Reexamining the Impact of
Immigration on the Labor Market." The Quarterly journal of economics, 118(4), 1335-74.
____. 2006. "Native Internal Migration and the Labor Market Impact of Immigration." Journal
of Human resources, 41(2), 221-58.
____. 1987. "Self-Selection and the Earnings of Immigrants," National Bureau of Economic
Research Cambridge, Mass., USA,
Borjas, George J; Stephen G Bronars and Stephen J Trejo. 1992. "Self-Selection and Internal
Migration in the United States." Journal of urban Economics, 32(2), 159-85.
Borjas, George J; Jeffrey Grogger and Gordon H Hanson. 2010. "Immigration and the Economic
Status of African‐American Men." Economica, 77(306), 255-82.
Brettfeld, Katrin and Peter Wetzels. 2006. "Religiosity and Crime: Attitudes Towards Violence
and Delinquent Behavior among Young Christians and Muslims in Germany," J. D. F. a. R. T.
Guerette, Migration, Culture Confilict, Crime and Terrorism. England: Ashgate Publishing
Limited,
Butcher, Kristin F and Anne Morrison Piehl. 1998. "Cross‐City Evidence on the Relationship between Immigration and Crime." Journal of Policy Analysis and Management: The Journal of
the Association for Public Policy Analysis and Management, 17(3), 457-93.
Butcher, Kristin F Piehl, Anne Morrison. 1998. "Recent Immigrants: Unexpected Implications
for Crime and Incarceration." ILR Review, 51(4), 654-79.

23
Butcher, Kristin F and Anne Morrison Piehl. 2000. "The Role of Deportation in the
Incarceration of Immigrants," Issues in the Economics of Immigration. University of Chicago
Press, 351-86.
____. 2007. "Why Are Immigrants' Incarceration Rates So Low? Evidence on Selective
Immigration, Deterrence, and Deportation," National Bureau of Economic Research,
Card, David. 2005. "Is the New Immigration Really So Bad?" the economic Journal, 115(507),
F300-F23.
Central Bank of the Turkish Republic. 2019. "Housing and Construction Statistics,"
Ceritoglu, E.; H. B. G. Yunculer; H. Torun and S. Tumen. 2015. "The Impact of Syrian Refugees
on Natives' Labor Market Outcomes in Turkey: Evidence from a Quasi-Experimental Design,"
MPRA Paper.
Chalfin, Aaron. 2015. "The Long-Run Effect of Mexican Immigration on Crime in Us Cities:
Evidence from Variation in Mexican Fertility Rates." American Economic Review, 105(5), 220-
25.
____. 2013. "What Is the Contribution of Mexican Immigration to Us Crime Rates? Evidence
from Rainfall Shocks in Mexico." American law and economics review, 16(1), 220-68.
Couttenier, Mathieu; Veronica Preotu; Dominic Rohner and Mathias Thoenig. 2016. "The
Violent Legacy of Victimization: Post-Conflict Evidence on Asylum Seekers, Crimes and Public
Policy in Switzerland."
Del Carpio, Ximena V. and Mathis Wagner. 2015. "The Impact of Syrians Refugees on the
Turkish Labor Market," Policy Research Working Paper 7402. World Bank Group,
Erdogan, M. Murat. 2014. "Perceptions of Syrians in Turkey," T. Küçükcan, Turkey’s Guests
Refugees and Migrants. SETA Foundation for Political, Economic and Social Research,
Erdogan, M. Murat and Can Unver. 2015. "Türk Iş Dünyasının Türkiye'deki Suriyeliler Konusundaki Görüş, Beklenti Ve Önerileri," Ergin, H. 2016. "Turkish University Students' Perceptions Towards Their Syrian Classmates."
Egitim Ve Bilim-Education and Science, 41(184), 399-415.
2018.
"Migrant Acceptance Index: A Global Examination of the Relationship between Interpersonal
Contact and Attitudes toward Migrants." BORDER CROSSING.
Freedman, Matthew; Emily Owens and Sarah Bohn. 2018. "Immigration, Employment
Opportunities, and Criminal Behavior." American Economic Journal: Economic Policy, 10(2),
117-51.
Friedberg, Rachel M and Jennifer Hunt. 1995. "The Impact of Immigrants on Host Country
Wages, Employment and Growth." Journal of Economic Perspectives, 9(2), 23-44.
Gehrsitz, Markus and Martin Ungerer. 2017. "Jobs, Crime, and Votes: A Short-Run Evaluation
of the Refugee Crisis in Germany."
Hagan, John and Alberto Palloni. 1999. "Sociological Criminology and the Mythology of
Hispanic Immigration and Crime." Social problems, 46(4), 617-32.
Horowitz, Jason. 2018. "Italy’s Populists Turn up the Heat as Anti-Migrant Anger Boils," The
New York Times.
Jaitman, Laura and Stephen Machin. 2013. "Crime and Immigration: New Evidence from
England and Wales." IZA Journal of Migration, 2(1), 19.
Jebreal, Rula 2018. "Italy Is Being Driven into the Arms of Fascists," The Guardian.
Lee, Matthew T; Ramiro Martinez and Richard Rosenfeld. 2001. "Does Immigration Increase
Homicide? Negative Evidence from Three Border Cities." The Sociological Quarterly, 42(4), 559-
80.

24
Mastrobuoni, Giovanni and Paolo Pinotti. 2015. "Legal Status and the Criminal Activity of
Immigrants." American Economic Journal: Applied Economics, 7(2), 175-206.
Moehling, Carolyn and Anne Morrison Piehl. 2009. "Immigration, Crime, and Incarceration in
Early Twentieth-Century America." Demography, 46(4), 739-63.
Newport, Frank. 2018. "Record-Low 12% Cite Economic Issues as Top U.S. Problem," GALLUP,
Nunziata, Luca. 2015. "Immigration and Crime: Evidence from Victimization Data." Journal of
Population Economics, 28(3), 697-736.
Ousey, Graham C and Charis E Kubrin. 2018. "Immigration and Crime: Assessing a Contentious
Issue." Annual Review of Criminology, 1, 63-84.
Pinotti, Paolo. 2017. "Clicking on Heaven's Door: The Effect of Immigrant Legalization on
Crime." American Economic Review, 107(1), 138-68.
Piopiunik, Marc and Jens Ruhose. 2017. "Immigration, Regional Conditions, and Crime:
Evidence from an Allocation Policy in Germany." European Economic Review, 92, 258-82.
Republic of Turkey Ministry of Justice. 2019. "Justice Statistics Archive,"
Solon, Gary; Steven J Haider and Jeffrey M Wooldridge. 2015. "What Are We Weighting For?"
Journal of Human resources, 50(2), 301-16.
Spenkuch, Jörg L. 2013. "Understanding the Impact of Immigration on Crime." American law
and economics review, 16(1), 177-219.
Tumen, Semih. 2016. "The Economic Impact of Syrian Refugees on Host Countries: Quasi-
Experimental Evidence from Turkey." American Economic Review, 106(5), 456-60-60.
UNHCR. 2018. "Global Trends - Forced Displacement in 2017," The UN Refugee Agency,
Wolf, Z. Byron 2018. "Trump Basically Called Mexicans Rapists Again," CNN.

Fig. 1: Number of Registered Syrian Refugees
Source: “https://data2.unhcr.org/en/situations/syria/location/113.”
0,0
0,5
1,0
1,5
2,0
2,5
3,0
3,5
4,0
2012 2013 2014 2015 2016 2017 2018
Mil
lio
ns


Figure 4: Synthetic Control Event Study Estimates for Total Crime
(2006-2014)
(a) SCM estimates for KILIS (b) SCM estimates for HATAY
(c) SCM estimates for GAZIANTEP (d) SCM estimates for SANLIURFA
(e) SCM estimates for MARDIN
-2-1
01
2006 2008 2010 2012 2014year
KILIS synthetic KILIS
-1-.
50
.5
2006 2008 2010 2012 2014year
HATAY synthetic HATAY
-.5
0.5
1
2006 2008 2010 2012 2014year
GAZIANTEP synthetic GAZIANTEP
-1.5
-1-.
50
.5
2006 2008 2010 2012 2014year
SANLIURFA synthetic SANLIURFA
-2-1
.5-1
-.5
0
2006 2008 2010 2012 2014year
MARDIN synthetic MARDIN


Figure 5: Synthetic Control Event Study Estimates for Income Generating Crimes
(2006-2014)
(a) SCM estimates for KILIS (b) SCM estimates for HATAY
(c) SCM estimates for GAZIANTEP (d) SCM estimates for SANLIURFA
(e) SCM estimates for MARDIN
-3-2
-10
1
2006 2008 2010 2012 2014year
KILIS synthetic KILIS-1
.5-1
-.5
0
2006 2008 2010 2012 2014year
HATAY synthetic HATAY
-1-.
8-.
6-.
4-.
20
2006 2008 2010 2012 2014year
GAZIANTEP synthetic GAZIANTEP
-2.5
-2-1
.5-1
-.5
0
2006 2008 2010 2012 2014year
SANLIURFA synthetic SANLIURFA
-2.5
-2-1
.5-1
-.5
2006 2008 2010 2012 2014year
MARDIN synthetic MARDIN

Figure 6: Synthetic Control Event Study Estimates for Non-Income Generating Crimes
(2006-2014)
(a) SCM estimates for KILIS (b) SCM estimates for HATAY
(c) SCM estimates for GAZIANTEP (d) SCM estimates for SANLIURFA
(e) SCM estimates for MARDIN
-3-2
-10
1
2006 2008 2010 2012 2014year
KILIS synthetic KILIS
-2-1
.5-1
-.5
0
2006 2008 2010 2012 2014year
HATAY synthetic HATAY
-1.5
-1-.
50
.5
2006 2008 2010 2012 2014year
GAZIANTEP synthetic GAZIANTEP
-2.5
-2-1
.5-1
-.5
2006 2008 2010 2012 2014year
SANLIURFA synthetic SANLIURFA
-3-2
.5-2
-1.5
-1
2006 2008 2010 2012 2014year
MARDIN synthetic MARDIN

Figure 8: Synthetic Control Event Study Estimates for Assault
(2006-2014)
(a) SCM estimates for KILIS (b) SCM estimates for HATAY
(c) SCM estimates for GAZIANTEP (d) SCM estimates for SANLIURFA
(e) SCM estimates for MARDIN
-4-3
-2-1
0
2006 2008 2010 2012 2014year
KILIS synthetic KILIS
-3-2
.5-2
-1.5
-1
2006 2008 2010 2012 2014year
HATAY synthetic HATAY
-2.5
-2-1
.5-1
-.5
2006 2008 2010 2012 2014year
GAZIANTEP synthetic GAZIANTEP
-3.5
-3-2
.5-2
-1.5
2006 2008 2010 2012 2014year
SANLIURFA synthetic SANLIURFA
-4-3
.5-3
-2.5
-2
2006 2008 2010 2012 2014year
MARDIN synthetic MARDIN

Figure 8: Synthetic Control Event Study Estimates for Homicide
(2006-2014)
(a) SCM estimates for KILIS (b) SCM estimates for HATAY
(c) SCM estimates for GAZIANTEP (d) SCM estimates for SANLIURFA
(e) SCM estimates for MARDIN
-4-3
.5-3
-2.5
-2
2006 2008 2010 2012 2014year
KILIS synthetic KILIS-4
-3.5
-3-2
.5-2
2006 2008 2010 2012 2014year
HATAY synthetic HATAY
-4.5
-4-3
.5-3
-2.5
-2
2006 2008 2010 2012 2014year
GAZIANTEP synthetic GAZIANTEP
-4-3
.5-3
-2.5
-2
2006 2008 2010 2012 2014year
SANLIURFA synthetic SANLIURFA
-4.5
-4-3
.5-3
-2.5
2006 2008 2010 2012 2014year
MARDIN synthetic MARDIN

Figure-9: Synthetic Control Event Study Estimates for Theft
(2006-2014)
(a) SCM estimates for KILIS (b) SCM estimates for HATAY
(c) SCM estimates for GAZIANTEP (d) SCM estimates for SANLIURFA
(e) SCM estimates for MARDIN
-4-3
-2-1
2006 2008 2010 2012 2014year
KILIS synthetic KILIS-3
-2.5
-2-1
.5-1
2006 2008 2010 2012 2014year
HATAY synthetic HATAY
-2-1
.5-1
-.5
0
2006 2008 2010 2012 2014year
GAZIANTEP synthetic GAZIANTEP
-3.5
-3-2
.5-2
-1.5
-1
2006 2008 2010 2012 2014year
SANLIURFA synthetic SANLIURFA
-4-3
.5-3
-2.5
-2-1
.5
2006 2008 2010 2012 2014year
MARDIN synthetic MARDIN

Figure-10: Synthetic Control Event Study Estimates for Total Crime
(2006-2015)
(a) SCM estimates for KILIS (b) SCM estimates for HATAY
(c) SCM estimates for GAZIANTEP (d) SCM estimates for SANLIURFA
(e) SCM estimates for MARDIN
-2-1
01
2006 2008 2010 2012 2014 2016year
KILIS synthetic KILIS-1
-.5
0.5
2006 2008 2010 2012 2014 2016year
HATAY synthetic HATAY
-.5
0.5
1
2006 2008 2010 2012 2014 2016year
GAZIANTEP synthetic GAZIANTEP
-1.5
-1-.
50
.5
2006 2008 2010 2012 2014 2016year
SANLIURFA synthetic SANLIURFA
-2-1
.5-1
-.5
0
2006 2008 2010 2012 2014 2016year
MARDIN synthetic MARDIN

Figure-11: Synthetic Control Event Study Estimates for Income Generating Crimes
(2006-2015)
(a) SCM estimates for KILIS (b) SCM estimates for HATAY
(c) SCM estimates for GAZIANTEP (d) SCM estimates for SANLIURFA
(e) SCM estimates for MARDIN
-3-2
-10
1
2006 2008 2010 2012 2014 2016year
KILIS synthetic KILIS-1
.5-1
-.5
0
2006 2008 2010 2012 2014 2016year
HATAY synthetic HATAY
-1-.
8-.
6-.
4-.
20
2006 2008 2010 2012 2014 2016year
GAZIANTEP synthetic GAZIANTEP
-2.5
-2-1
.5-1
-.5
0
2006 2008 2010 2012 2014 2016year
SANLIURFA synthetic SANLIURFA
-2.5
-2-1
.5-1
-.5
2006 2008 2010 2012 2014 2016year
MARDIN synthetic MARDIN
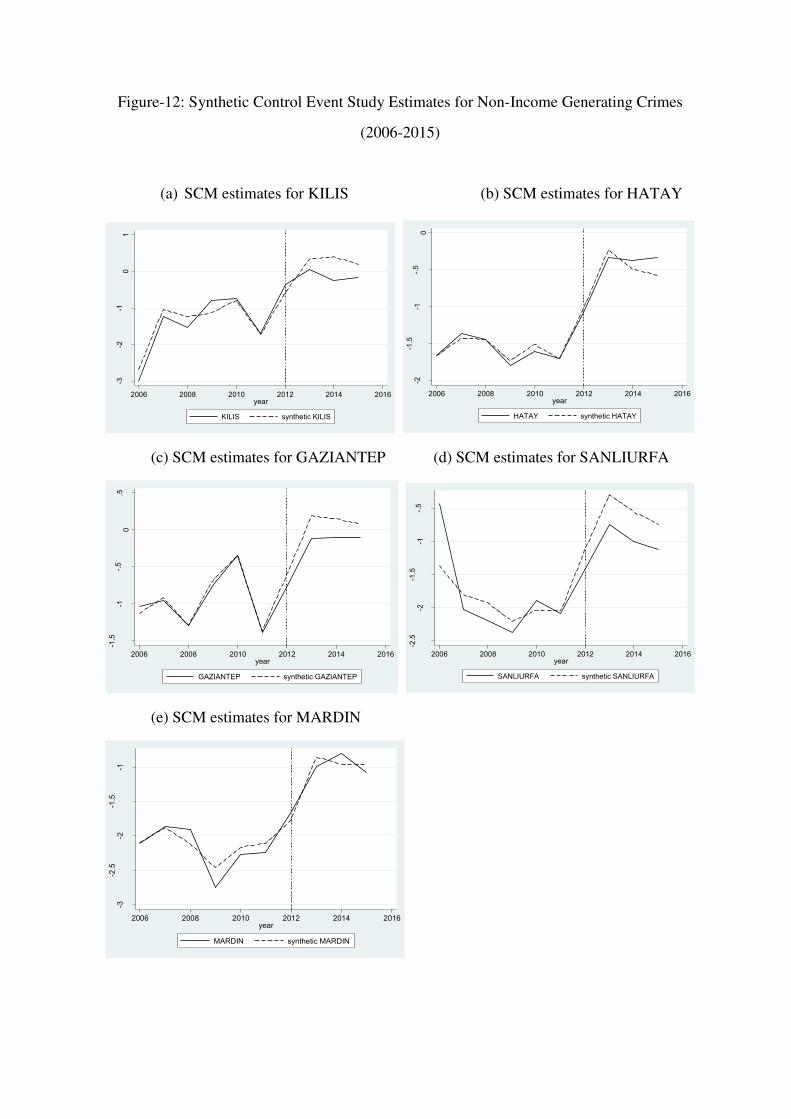
Figure-12: Synthetic Control Event Study Estimates for Non-Income Generating Crimes
(2006-2015)
(a) SCM estimates for KILIS (b) SCM estimates for HATAY
(c) SCM estimates for GAZIANTEP (d) SCM estimates for SANLIURFA
(e) SCM estimates for MARDIN
-3-2
-10
1
2006 2008 2010 2012 2014 2016year
KILIS synthetic KILIS-2
-1.5
-1-.
50
2006 2008 2010 2012 2014 2016year
HATAY synthetic HATAY
-1.5
-1-.
50
.5
2006 2008 2010 2012 2014 2016year
GAZIANTEP synthetic GAZIANTEP
-2.5
-2-1
.5-1
-.5
2006 2008 2010 2012 2014 2016year
SANLIURFA synthetic SANLIURFA
-3-2
.5-2
-1.5
-1
2006 2008 2010 2012 2014 2016year
MARDIN synthetic MARDIN

Figure-13: Synthetic Control Event Study Estimates for Assault
(2009-2015)
(a) SCM estimates for KILIS (b) SCM estimates for HATAY
(c) SCM estimates for GAZIANTEP (d) SCM estimates for SANLIURFA
(e) SCM estimates for MARDIN
-4-3
-2-1
0
2006 2008 2010 2012 2014 2016year
KILIS synthetic KILIS
-3-2
.5-2
-1.5
-1
2006 2008 2010 2012 2014 2016year
HATAY synthetic HATAY
-2.5
-2-1
.5-1
-.5
2006 2008 2010 2012 2014 2016year
GAZIANTEP synthetic GAZIANTEP
-3.5
-3-2
.5-2
-1.5
2006 2008 2010 2012 2014 2016year
SANLIURFA synthetic SANLIURFA
-4-3
.5-3
-2.5
-2
2006 2008 2010 2012 2014 2016year
MARDIN synthetic MARDIN


Figure-14: Synthetic Control Event Study Estimates for Homicide
(2006-2015)
(a) SCM estimates for KILIS (b) SCM estimates for HATAY
(c) SCM estimates for GAZIANTEP (d) SCM estimates for SANLIURFA
(e) SCM estimates for MARDIN
-4-3
.5-3
-2.5
-2
2006 2008 2010 2012 2014 2016year
KILIS synthetic KILIS-4
-3.5
-3-2
.5-2
2006 2008 2010 2012 2014 2016year
HATAY synthetic HATAY
-4.5
-4-3
.5-3
-2.5
-2
2006 2008 2010 2012 2014 2016year
GAZIANTEP synthetic GAZIANTEP
-4-3
.5-3
-2.5
-2
2006 2008 2010 2012 2014 2016year
SANLIURFA synthetic SANLIURFA
-4.5
-4-3
.5-3
-2.5
2006 2008 2010 2012 2014 2016year
MARDIN synthetic MARDIN

Figure-15: Synthetic Control Event Study Estimates for Theft
(2006-2015)
(a) SCM estimates for KILIS (b) SCM estimates for HATAY
(c) SCM estimates for GAZIANTEP (d) SCM estimates for SANLIURFA
(e) SCM estimates for MARDIN
-4-3
-2-1
0
2006 2008 2010 2012 2014 2016year
KILIS synthetic KILIS
-3-2
.5-2
-1.5
-1
2006 2008 2010 2012 2014 2016year
HATAY synthetic HATAY
-2-1
.5-1
-.5
0
2006 2008 2010 2012 2014 2016year
GAZIANTEP synthetic GAZIANTEP
-3.5
-3-2
.5-2
-1.5
-1
2006 2008 2010 2012 2014 2016year
SANLIURFA synthetic SANLIURFA
-4-3
.5-3
-2.5
-2-1
.5
2006 2008 2010 2012 2014 2016year
MARDIN synthetic MARDIN

Table-1: Summary statistics of variables for the treatment and control groups between 2010 and
2014.
Treatment Group
Variable Names Obs Mean Std. Dev. Min Max
Theft 70 0.20 0.16 0.02 0.75
Assault 70 0.17 0.13 0.01 0.50
Homicide 70 0.06 0.03 0.01 0.16
Nonincome-generating crimes 70 0.46 0.33 0.07 1.29
Income-generating crimes 70 0.48 0.34 0.10 1.58
Total crime 70 1.10 0.72 0.20 3.12
Lawyers/counselors 70 0.48 0.23 0.11 1.06
Having less then higher degree 70 586.77 44.28 492.03 651.91
Having higher degree 70 53.50 18.39 20.18 99.15
Per capita GDP 70 5621.72 1256.91 3629.52 8792.06
Total employment 70 0.01 0.00 0.00 0.01
Housing price 70 139.11 30.63 102.92 221.06
Participants in Quran courses 70 6.08 6.07 0.15 23.56
Control Group
Variable Names Obs Mean Std. Dev. Min Max
Theft 75 0.14 0.12 0 0.56
Assault 75 0.20 0.20 0.00 1.11
Homicide 75 0.06 0.03 0 0.18
Nonincome-generating crimes 75 0.49 0.43 0.03 2.15
Income-generating crimes 75 0.33 0.22 0.02 1.20
Total crime 75 1.00 0.69 0.06 3.15
Lawyers/counselors 75 0.42 0.23 0.10 0.95
Having less then higher degree 75 611.84 55.63 495.24 730.55
Having higher degree 75 59.03 24.81 18.25 133.73

Per capita GDP 75 5569.40 1614.51 3189.17 9750.98
Total employment 75 0.03 0.01 0.01 0.04
Housing price 75 129.20 20.77 103.54 179.54
Participants in Quran courses 75 8.06 8.11 0.23 29.02
Notes 1: The crime dataset used in this study came from statistics of Turkish penal institutions
for the time period 2010 to 2014.
All variables’ summary statistics are expressed considering their definitions in the study.
Notes 2: Nonincome-generating crimes are a homicide, assault, sexual crimes, kidnapping,
defamation, bad treatment, prevention of performance, traffic crimes, forestry crimes, crimes
related to firearms and knives, criminal threats, damage to property, and contrary to the
measures for family protection. The income-generating crimes consisted of theft, smuggling,
opposition to cheque laws, swindling, the use and purchase of drugs, the production, and sale of
drugs, forgery, embezzlement, and bribery. Total crime is generated by aggregating all crimes
types in two groups; nonincome-generating crimes and income-generating crimes.
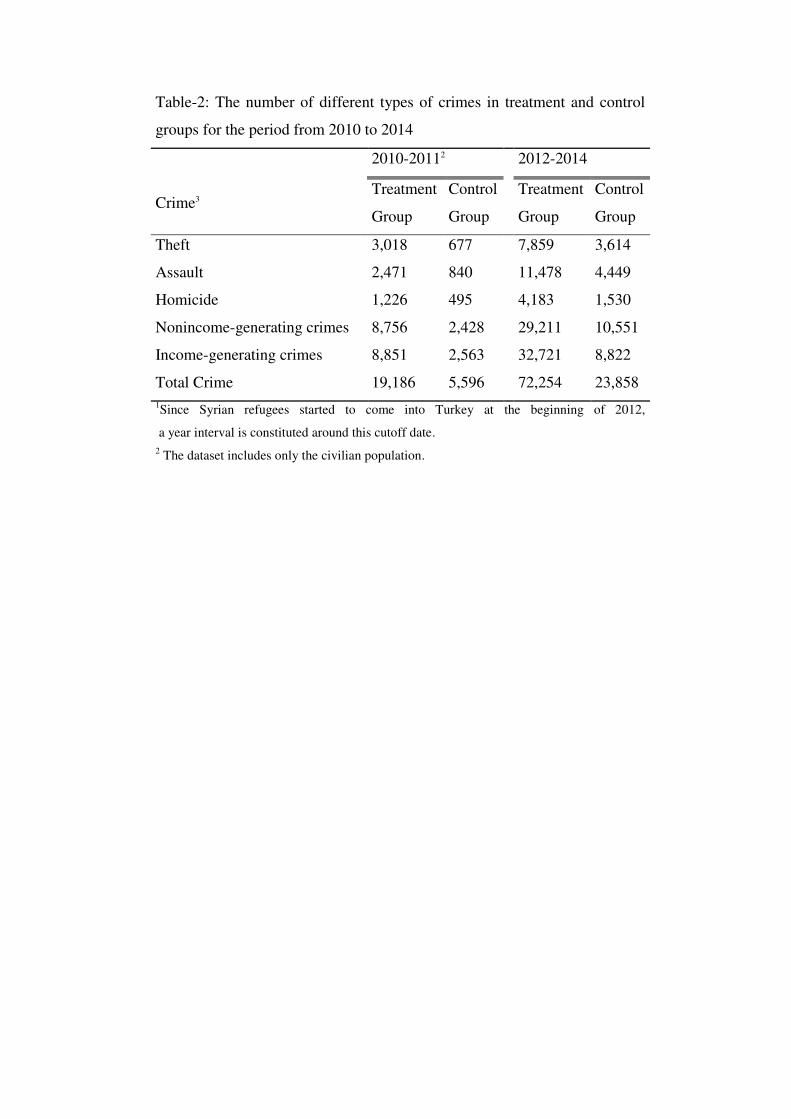
Table-2: The number of different types of crimes in treatment and control
groups for the period from 2010 to 2014
2010-20112 2012-2014
Crime3 Treatment
Group
Control
Group
Treatment
Group
Control
Group
Theft 3,018 677
7,859 3,614
Assault 2,471 840
11,478 4,449
Homicide 1,226 495
4,183 1,530
Nonincome-generating crimes 8,756 2,428
29,211 10,551
Income-generating crimes 8,851 2,563
32,721 8,822
Total Crime 19,186 5,596 72,254 23,858
1Since Syrian refugees started to come into Turkey at the beginning of 2012,
a year interval is constituted around this cutoff date.
2 The dataset includes only the civilian population.

Table-3: Results of the impact of the refugee influx on crime rates.
Crimes Model 1 R2 Observation Model 2 R
2 Observation
Assault -0.225* 0.95 145
-0.138 0.97 145
(0.124) (0.084)
Theft 0.024 0.94 144
-0.025 0.97 144
(0.127) (0.084)
Homicide -0.125 0.80 143
0.003 0.88 143
(0.153) (0.112)
Non-income generating
crimes -0.088 0.93 145 -0.040 0.95 145
(0.145) (0.118)
Income generating
crimes -0.067 0.93 145 0.041 0.96 145
(0.111) (0.092)
Total crime -0.091 0.92 145 0.003 0.96 145 (0.117) (0.086)
***ρ<0.01, ** ρ <0.05 and *ρ<0.01.
Notes: All models include control variables: employment rate, house price, the proportion of
lawyer, the proportion of participants in Quran courses, real GDP per capita, high school degree
or lower, higher degree than high school diploma per thousand residents, year and city dummies.
Model 1 is conducted without survey weights but with robust standard errors. Model 2 is
conducted with robust standard errors and survey weights. We also performed cluster models
with and without the weight and obtained similar results in Table-3. Although standard errors are
clustered with respect to the city, crimes are weighted by the total population of each city.
Nonincome-generating crimes are Nonincome-generating crimes are a homicide, assault,
sexual crimes, kidnapping, defamation, bad treatment, prevention of performance, traffic crimes,
forestry crimes, crimes related to firearms and knives, criminal threats, damage to property, and
contrary to the measures for family protection. The income-generating crimes consisted of theft,
smuggling, opposition to cheque laws, swindling, the use and purchase of drugs, the production,
and sale of drugs, forgery, embezzlement, and bribery.

Table-4: Synthetic Control Method t-test Results
Crime Type Pre-immigrant Post-immigrant
Total Crime t statistic t statistic
Kilis -0.008 0.471
Hatay 0.005 0.303
Gaziantep 0.031 -0.505
Sanlıurfa 0.092 -0.061
Mardin -0.272 0.094
Homicide
Kilis 0.360 -0.041
Hatay -0.134 0.200
Gaziantep 0.222 0.406
Sanlıurfa -0.011 -1.957
Mardin -0.128 -1.895
Assault
Kilis -0.069 0.373
Hatay -0.040 0.130
Gaziantep 0.002 -0.702
Sanlıurfa -0.017 -0.498
Mardin -0.305 0.170
Theft
Kilis 0.145 1.007
Hatay -0.388 0.260
Gaziantep 0.793 -0.607
Sanlıurfa 0.061 -1.506
Mardin -0.350 0.640
Non-income generating crimes
Kilis -0.141 -0.713
Hatay -0.193 -0.047
Gaziantep -0.024 -0.708
Sanlıurfa 0.210 -1.269
Mardin -0.333 0.125
Income generating crimes
crimes
Kilis 0.116 1.730
Hatay -0.121 0.657
Gaziantep 0.239 -0.096
Sanlıurfa -0.023 0.135
Mardin -0.432 -0.102

Table-5: Results of robustness exercises for model 1 (2010-2014)
Assault Theft Homicide
Non-income
generating
crimes
Income
generating
crimes
Total crime
A. All Turkey except the treatment region
Refugee effect (T = 1 and P = 1) -0.080 -0.023 -0.187** 0.038 0.068 0.045
(0.059) (0.059) (0.082) (0.092) (0.053) (0.070)
Year fixed effects yes yes yes yes yes yes
Region fixed effects yes yes yes yes yes yes
R2 0.95 0.94 0.83 0.91 0.93 0.91
Observations 405 404 403 405 405 405
B. All Turkey except the treatment and original control regions
Refugee effect (T = 1 and P = 1) -0.018 -0.089 -0.221*** 0.093 0.090* 0.093
(0.056) (0.061) (0.082) (0.095) (0.053) (0.072)
Year fixed effects yes yes yes yes yes yes
Region fixed effects yes yes yes yes yes yes
R2 0.96 0.95 0.85 0.91 0.94 0.92
Observations 330 330 330 330 330 330
***ρ<0.01, ** ρ <0.05 and *ρ<0.01.
Notes: All models include control variables: employment rate, house price, the proportion of lawyer, the proportion of participants in Quran
courses, real GDP per capita, high school degree or lower, higher degree than high school diploma per thousand residents, year and city dummies.
Model 1 is conducted without survey weights but with robust standard errors. We also performed cluster models with and without the weight and
obtained similar results in Table-5. Although standard errors are clustered with respect to the city, crimes are weighted by the total population of
each city.
Nonincome-generating crimes are Nonincome-generating crimes are a homicide, assault, sexual crimes, kidnapping, defamation, bad
treatment, prevention of performance, traffic crimes, forestry crimes, crimes related to firearms and knives, criminal threats, damage to property,
and contrary to the measures for family protection. The income-generating crimes consisted of theft, smuggling, opposition to cheque laws,
swindling, the use and purchase of drugs, the production, and sale of drugs, forgery, embezzlement, and bribery.

Table-6: Results of robustness exercises -time variation in refugee intensity for model 1 (2009-2015)
Assault Theft Homicide
Non-income
generating crimes
Income
generating crimes Total crime
A. All Turkey except the treatment region
Refugee effect (T= 1 and P = 1) -0.097* -0.052 -0.182** 0.016 0.039 0.027
(0.056) (0.055) (0.077) (0.089) (0.051) (0.068)
Year fixed effects yes yes yes yes yes yes
Region fixed effects yes yes yes yes yes yes
R2 0.95 0.95 0.82 0.92 0.93 0.91
Observations 486 485 484 486 486 486
B. All Turkey except the treatment and original control regions
Refugee effect (T= 1 and P = 1) -0.011 -0.105* -0.222*** 0.092 0.056 0.089
(0.053) (0.057) (0.080) (0.094) (0.051) (0.071)
Year fixed effects yes yes yes yes yes yes
Region fixed effects yes yes yes yes yes yes
R2 0.96 0.95 0.85 0.92 0.95 0.92
Observations 396 396 396 396 396 396
***ρ<0.01, ** ρ <0.05 and *ρ<0.01.
Notes: : All models include control variables: employment rate, house price, the proportion of lawyer, the proportion of participants in Quran courses,
real GDP per capita, high school degree or lower, higher degree than high school diploma per thousand residents,year and city dummies. Model
1 is conducted with robust standard errors and survey weights. We also performed cluster models with and without the weight and obtained
similar results in Table-6. Although standard errors are clustered with respect to the city, crimes are weighted by the total population of each
city.
Nonincome-generating crimes are Nonincome-generating crimes are a homicide, assault, sexual crimes, kidnapping, defamation, bad
treatment, prevention of performance, traffic crimes, forestry crimes, crimes related to firearms and knives, criminal threats, damage to property,
and contrary to the measures for family protection. The income-generating crimes consisted of theft, smuggling, opposition to cheque laws, swindling, the
use and purchase of drugs, the production, and sale of drugs, forgery, embezzlement, and bribery.
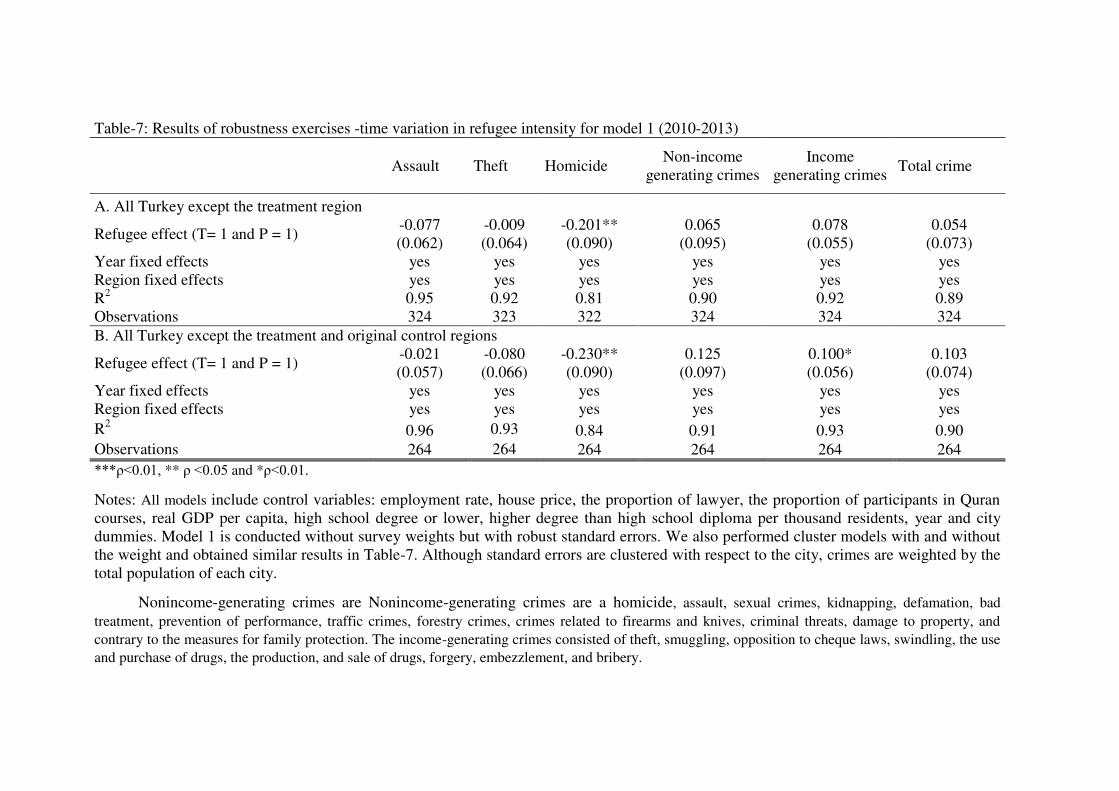
Table-7: Results of robustness exercises -time variation in refugee intensity for model 1 (2010-2013)
Assault Theft Homicide Non-income
generating crimes
Income
generating crimes Total crime
A. All Turkey except the treatment region
Refugee effect (T= 1 and P = 1) -0.077 -0.009 -0.201** 0.065 0.078 0.054
(0.062) (0.064) (0.090) (0.095) (0.055) (0.073)
Year fixed effects yes yes yes yes yes yes
Region fixed effects yes yes yes yes yes yes
R2 0.95 0.92 0.81 0.90 0.92 0.89
Observations 324 323 322 324 324 324
B. All Turkey except the treatment and original control regions
Refugee effect (T= 1 and P = 1) -0.021 -0.080 -0.230** 0.125 0.100* 0.103
(0.057) (0.066) (0.090) (0.097) (0.056) (0.074)
Year fixed effects yes yes yes yes yes yes
Region fixed effects yes yes yes yes yes yes
R2 0.96 0.93 0.84 0.91 0.93 0.90
Observations 264 264 264 264 264 264
***ρ<0.01, ** ρ <0.05 and *ρ<0.01.
Notes: All models include control variables: employment rate, house price, the proportion of lawyer, the proportion of participants in Quran
courses, real GDP per capita, high school degree or lower, higher degree than high school diploma per thousand residents, year and city
dummies. Model 1 is conducted without survey weights but with robust standard errors. We also performed cluster models with and without
the weight and obtained similar results in Table-7. Although standard errors are clustered with respect to the city, crimes are weighted by the
total population of each city.
Nonincome-generating crimes are Nonincome-generating crimes are a homicide, assault, sexual crimes, kidnapping, defamation, bad
treatment, prevention of performance, traffic crimes, forestry crimes, crimes related to firearms and knives, criminal threats, damage to property, and
contrary to the measures for family protection. The income-generating crimes consisted of theft, smuggling, opposition to cheque laws, swindling, the use
and purchase of drugs, the production, and sale of drugs, forgery, embezzlement, and bribery.

Table-8: Results of robustness exercises -time variation in refugee intensity for model 1 (2009-2015)
Assault Theft Homicide
Non-income
generating crimes
Income
generating crimes Total crime
A. Post-immigration period: 2012
Refugee effect (T= 1 and P = 1) -0.065 0.041 -0.057 0.047 -0.001 0.027
(0.175) (0.162) (0.191) (0.198) (0.124) (0.154)
Year fixed effects yes yes yes yes yes yes
Region fixed effects yes yes yes yes yes yes
R2 0.95 0.9 0.80 0.87 0.94 0.88
Observations 87 86 85 87 87 87
B. Post-immigration period: 2013
Refugee effect (T= 1 and P = 1) -0.380** 0.137 -0.190 0.036 -0.032 0.012
(0.168) (0.196) (0.249) (0.188) (0.146) (0.162)
Year fixed effects yes yes yes yes yes yes
Region fixed effects yes yes yes yes yes yes
R2 0.97 0.94 0.78 0.94 0.96 0.93
Observations 87 86 86 87 87 87
C. Post-immigration period: 2014
Refugee effect (T= 1 and P = 1) -0.376** -0.148 -0.115 -0.010 -0.140 -0.016
(0.151) (0.165) (0.231) (0.189) (0.184) (0.152)
Year fixed effects yes yes yes yes yes yes
Region fixed effects yes yes yes yes yes yes
R2 0.96 0.96 0.85 0.93 0.94 0.94
Observations 87 86 86 87 87 87
D. Post-immigration period: 2015
Refugee effect (T= 1 and P = 1) -0.402** -0.209 -0.069 0.001 -0.221 -0.063
(0.177) (0.162) (0.250) (0.207) (0.195) (0.168)
Year fixed effects yes yes yes yes yes yes
Region fixed effects yes yes yes yes yes yes
R2 0.96 0.96 0.85 0.93 0.95 0.94
Observations 87 86 86 87 87 87 ***ρ<0.01, ** ρ <0.05 and *ρ<0.01.


Table-9: Results of the impact of the refugee influx on crime rates (2009-2015).
Crime Model 1 R2 Observation Model 2 R
2 Observation
Assault -0.240** 0.95 174
-0.164** 0.97 174
(0.116) (0.077)
Theft -0.020 0.95 173
-0.068 0.97 173
(0.121) (0.081)
Homicide -0.126 0.79 172
-0.035 0.88 172
(0.139) (0.112)
Nonincome-
generating crimes -0.124
0.93 174 -0.117
0.95 174
(0.138) (0.112)
Income-generating
crimes -0.079
0.94 174 0.037
0.96 174
(0.113) (0.099)
Total crime -0.123 0.93 174
-0.039 0.96 174
(0.114) (0.084)
***ρ<0.01, ** ρ <0.05 and *ρ<0.01.
Notes: All models include control variables: employment rate, house price, the proportion of
lawyer, the proportion of participants in Quran courses, real GDP per capita, high school degree or
lower, higher degree than high school diploma per thousand residents, year and city dummies.
Model 1 is conducted without survey weights but with robust standard errors. Model 2 is conducted
with robust standard errors and survey weights. We also performed cluster models with and without
the weight and obtained similar results in Tabl-9. Although standard errors are clustered with
respect to the city, crimes are weighted by the total population of each city.
Nonincome-generating crimes are Nonincome-generating crimes are a homicide, assault,
sexual crimes, kidnapping, defamation, bad treatment, prevention of performance, traffic crimes,
forestry crimes, crimes related to firearms and knives, criminal threats, damage to property, and
contrary to the measures for family protection. The income-generating crimes consisted of theft,
smuggling, opposition to cheque laws, swindling, the use and purchase of drugs, the production,
and sale of drugs, forgery, embezzlement, and bribery.
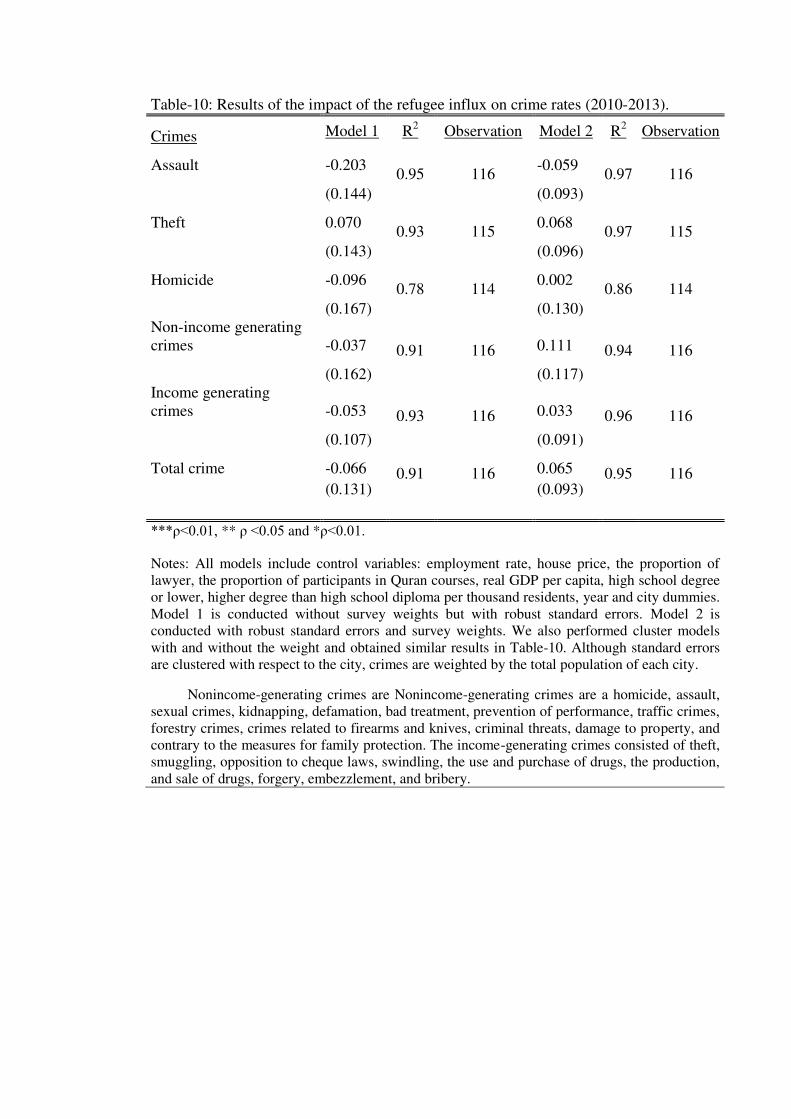
Table-10: Results of the impact of the refugee influx on crime rates (2010-2013).
Crimes Model 1 R2 Observation Model 2 R
2 Observation
Assault -0.203 0.95 116
-0.059 0.97 116
(0.144) (0.093)
Theft 0.070 0.93 115
0.068 0.97 115
(0.143) (0.096)
Homicide -0.096 0.78 114
0.002 0.86 114
(0.167) (0.130)
Non-income generating
crimes -0.037 0.91 116 0.111 0.94 116
(0.162) (0.117)
Income generating
crimes -0.053 0.93 116 0.033 0.96 116
(0.107) (0.091)
Total crime -0.066 0.91 116 0.065 0.95 116 (0.131) (0.093)
***ρ<0.01, ** ρ <0.05 and *ρ<0.01.
Notes: All models include control variables: employment rate, house price, the proportion of
lawyer, the proportion of participants in Quran courses, real GDP per capita, high school degree
or lower, higher degree than high school diploma per thousand residents, year and city dummies.
Model 1 is conducted without survey weights but with robust standard errors. Model 2 is
conducted with robust standard errors and survey weights. We also performed cluster models
with and without the weight and obtained similar results in Table-10. Although standard errors
are clustered with respect to the city, crimes are weighted by the total population of each city.
Nonincome-generating crimes are Nonincome-generating crimes are a homicide, assault,
sexual crimes, kidnapping, defamation, bad treatment, prevention of performance, traffic crimes,
forestry crimes, crimes related to firearms and knives, criminal threats, damage to property, and
contrary to the measures for family protection. The income-generating crimes consisted of theft,
smuggling, opposition to cheque laws, swindling, the use and purchase of drugs, the production,
and sale of drugs, forgery, embezzlement, and bribery.

Table11: Results of robustness exercises for model 2 (2010-2014)
Assault Theft Homicide
Non-income
generating
crimes
Income
generating crimes Total crime
A. All Turkey except the treatment region
Refugee effect (T= 1 and P = 1) 0.012 -0.001 -0.051 0.152 0.233*** 0. 032***
(0.047) (0.048) (0.063) (0.083) (0.055) (0.065)
Year fixed effects yes yes yes yes yes yes
Region fixed effects yes yes yes yes yes yes
R2 0.96 0.96 0.90 0.93 0.95 0.92
Observations 405 404 403 405 405 405
B. All Turkey except the treatment and original control regions
Refugee effect (T= 1 and P = 1) 0.015 -0.027 -0.087 0.192 0.222*** 0.226***
(0.048) (0.052) (0.066) (0.086) (0.055) (0.067)
Year fixed effects yes yes yes yes yes yes
Region fixed effects yes yes yes yes yes yes
R2 0.97 0.97 0.91 0.93 0.94 0.93
Observations 330 330 330 330 330 330
***ρ<0.01, ** ρ <0.05 and *ρ<0.01.
Notes: All models include control variables: employment rate, house price, the proportion of lawyer, the proportion of participants in Quran
courses, real GDP per capita, high school degree or lower, higher degree than high school diploma per thousand residents, year and city
dummies. Model 2 is conducted with robust standard errors and survey weights. We also performed cluster models with and without the
weight and obtained similar results in Table-11. Although standard errors are clustered with respect to the city, crimes are weighted by
the total population of each city. Nonincome-generating crimes are Nonincome-generating crimes are a homicide, assault, sexual crimes, kidnapping, defamation, bad
treatment, prevention of performance, traffic crimes, forestry crimes, crimes related to firearms and knives, criminal threats, damage to property, and
contrary to the measures for family protection. The income-generating crimes consisted of theft, smuggling, opposition to cheque laws, swindling,
the use and purchase of drugs, the production, and sale of drugs, forgery, embezzlement, and bribery.


Table-12: Results of robustness exercises -time variation in refugee intensity for model 2
Assault Theft Homicide
Non-income
generating
crimes
Income
generating crimes Total crime
A. All Turkey except the treatment region
Refugee effect (T= 1 and P = 1) 0.006 -0.028 -0.059 0.141* 0.190*** 0.187***
(0.047) (0.049) (0.061) (0.082) (0.056) (0.065)
Year fixed effects yes yes yes yes yes yes
Region fixed effects yes yes yes yes yes yes
R2 0.96 0.97 0.89 0.93 0.93 0.93
Observations 486 485 484 486 486 486
B. All Turkey except the treatment and original control regions
Refugee effect (T= 1 and P = 1) 0.039 -0.032 -0.083 0.205** 0.187*** 0.229***
(0.047) (0.054) (0.065) (0.085) (0.058) (0.067)
Year fixed effects yes yes yes yes yes yes
Region fixed effects yes yes yes yes yes yes
R2 0.96 0.97 0.90 0.94 0.94 0.93
Observations 396 396 396 396 396 396
***ρ<0.01, ** ρ <0.05 and *ρ<0.01.
Notes: All models include control variables: employment rate, house price, the proportion of lawyer, the proportion of participants in Quran
courses, real GDP per capita, high school degree or lower, higher degree than high school diploma per thousand residents, year and city dummies.
Model 2 is conducted with robust standard errors and survey weights. We also performed cluster models with and without the weight and obtained
similar results in Table-12. Although standard errors are clustered with respect to the city, crimes are weighted by the total population of each city.
Nonincome-generating crimes are Nonincome-generating crimes are a homicide, assault, sexual crimes, kidnapping, defamation, bad
treatment, prevention of performance, traffic crimes, forestry crimes, crimes related to firearms and knives, criminal threats, damage to property,
and contrary to the measures for family protection. The income-generating crimes consisted of theft, smuggling, opposition to cheque laws,
swindling, the use and purchase of drugs, the production, and sale of drugs, forgery, embezzlement, and bribery.

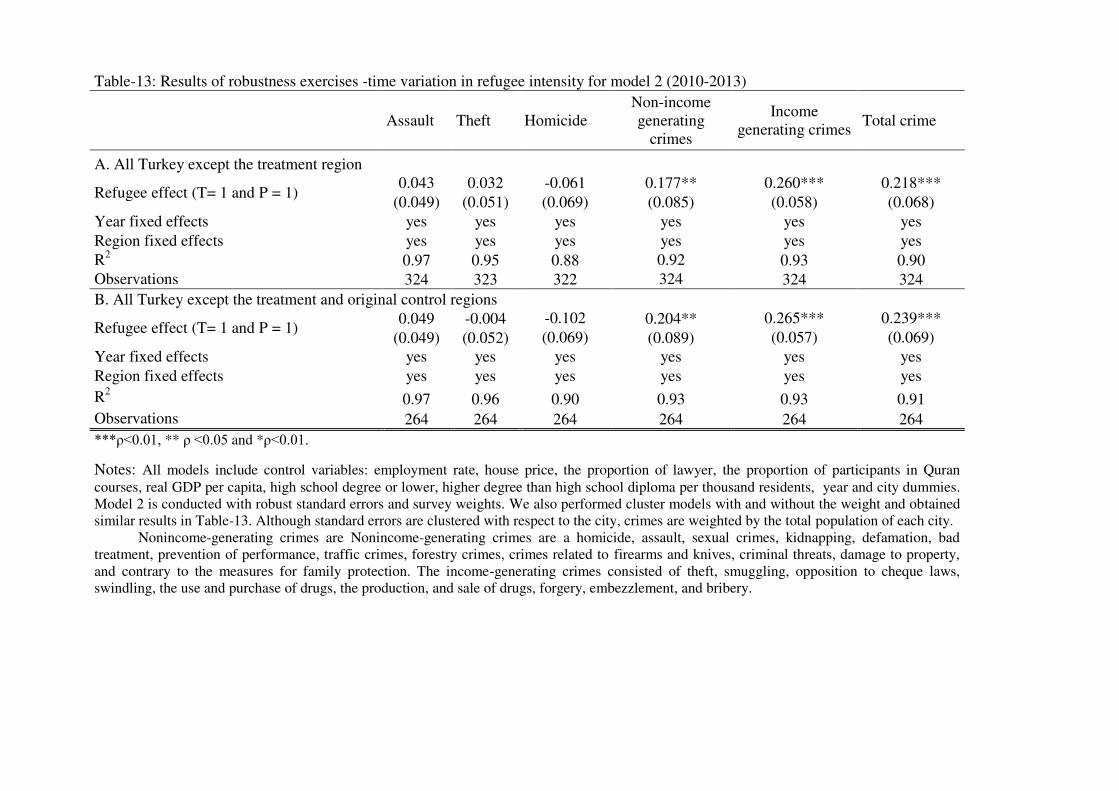
Table-13: Results of robustness exercises -time variation in refugee intensity for model 2 (2010-2013)
Assault Theft Homicide
Non-income
generating
crimes
Income
generating crimes Total crime
A. All Turkey except the treatment region
Refugee effect (T= 1 and P = 1) 0.043 0.032 -0.061 0.177** 0.260*** 0.218***
(0.049) (0.051) (0.069) (0.085) (0.058) (0.068)
Year fixed effects yes yes yes yes yes yes
Region fixed effects yes yes yes yes yes yes
R2 0.97 0.95 0.88 0.92 0.93 0.90
Observations 324 323 322 324 324 324
B. All Turkey except the treatment and original control regions
Refugee effect (T= 1 and P = 1) 0.049 -0.004 -0.102 0.204** 0.265*** 0.239***
(0.049) (0.052) (0.069) (0.089) (0.057) (0.069)
Year fixed effects yes yes yes yes yes yes
Region fixed effects yes yes yes yes yes yes
R2 0.97 0.96 0.90 0.93 0.93 0.91
Observations 264 264 264 264 264 264
***ρ<0.01, ** ρ <0.05 and *ρ<0.01.
Notes: All models include control variables: employment rate, house price, the proportion of lawyer, the proportion of participants in Quran
courses, real GDP per capita, high school degree or lower, higher degree than high school diploma per thousand residents, year and city dummies.
Model 2 is conducted with robust standard errors and survey weights. We also performed cluster models with and without the weight and obtained
similar results in Table-13. Although standard errors are clustered with respect to the city, crimes are weighted by the total population of each city.
Nonincome-generating crimes are Nonincome-generating crimes are a homicide, assault, sexual crimes, kidnapping, defamation, bad
treatment, prevention of performance, traffic crimes, forestry crimes, crimes related to firearms and knives, criminal threats, damage to property,
and contrary to the measures for family protection. The income-generating crimes consisted of theft, smuggling, opposition to cheque laws,
swindling, the use and purchase of drugs, the production, and sale of drugs, forgery, embezzlement, and bribery.

Table-14: Results of robustness exercises-time variation in refugee intensity for model 2 (2010-2015)
Assault Theft Homicide
Non-income
generating crimes
Income
generating crimes Total crime
A. Post-immigration period: 2012
Refugee effect (T= 1 and P = 1) -0.047 0.080 0.004 0.109 -0.007 0.046
(0.104) (0.121) (0.161) (0.137) (0.103) (0.106)
Year fixed effects yes yes yes yes yes yes
Region fixed effects yes yes yes yes yes yes
R2 0.97 0.96 0.86 0.91 0.96 0.93
Observations 87 86 85 87 87 87
B. Post-immigration period: 2013
Refugee effect (T= 1 and P = 1) -0.210 0.094 -0.058 0.157 0.053 0.092
(0.136) (0.136) (0.214) (0.160) (0.131) (0.137)
Year fixed effects yes yes yes yes yes yes
Region fixed effects yes yes yes yes yes yes
R2 0.98 0.98 0.87 0.95 0.97 0.96
Observations 87 86 86 87 87 87
C. Post-immigration period: 2014
Refugee effect (T= 1 and P = 1) -0.292 -0.140 0.096 -0.003 0.053 0.068
(0.116) (0.111) (0.169) (0.182) (0.154) (0.132)
Year fixed effects yes yes yes yes yes yes
Region fixed effects yes yes yes yes yes yes
R2 0.98 0.98 0.92 0.94 0.97 0.96
Observation 87 86 86 87 87 87
D. Post-immigration period: 2015
Refugee effect (I = 1 and D = 1) -0.343*** -0.234* -0.001 -0.073 -0.039 -0.022
(0.124) (0.126) (0.192) (0.214) (0.183) (0.145)
Year fixed effects yes yes yes yes yes yes
Region fixed effects yes yes yes yes yes yes
R2 0.97 0.98 0.91 0.94 0.97 0.96
Observations 87 86 86 87 87 87 ***ρ<0.01, ** ρ <0.05 and *ρ<0.01.
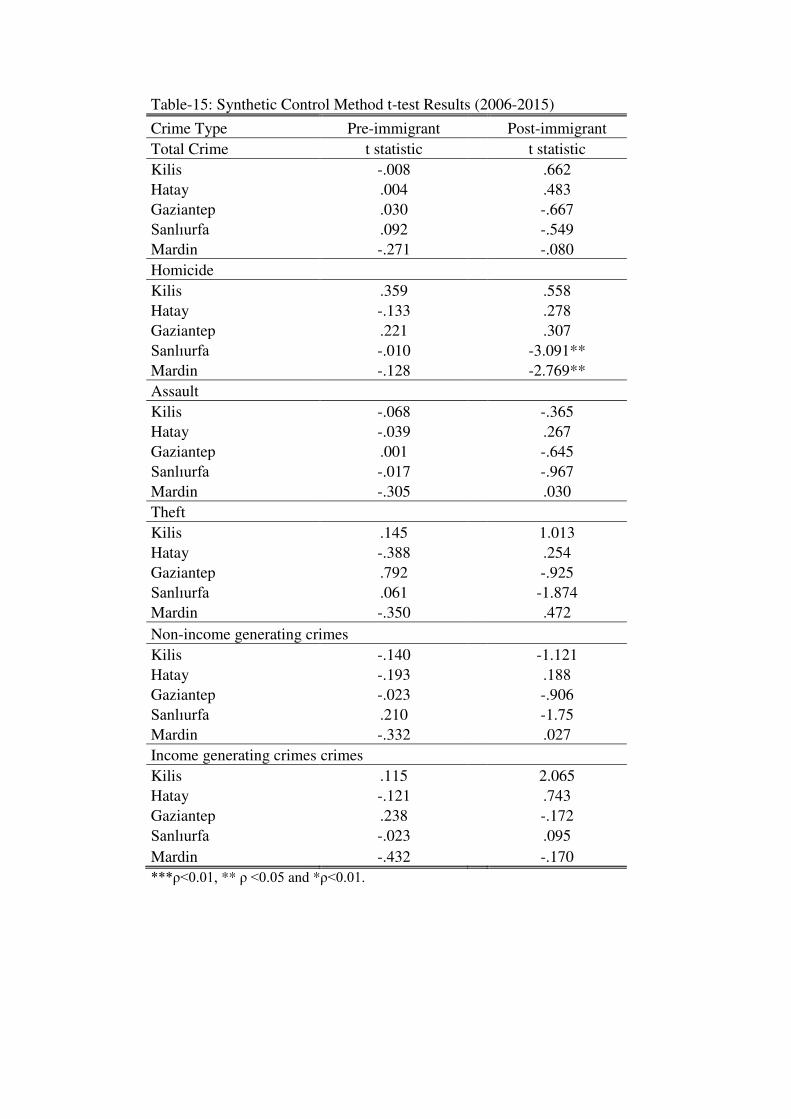
Table-15: Synthetic Control Method t-test Results (2006-2015)
Crime Type Pre-immigrant Post-immigrant
Total Crime t statistic t statistic
Kilis -.008 .662
Hatay .004 .483
Gaziantep .030 -.667
Sanlıurfa .092 -.549
Mardin -.271 -.080
Homicide
Kilis .359 .558
Hatay -.133 .278
Gaziantep .221 .307
Sanlıurfa -.010 -3.091**
Mardin -.128 -2.769**
Assault
Kilis -.068 -.365
Hatay -.039 .267
Gaziantep .001 -.645
Sanlıurfa -.017 -.967
Mardin -.305 .030
Theft
Kilis .145 1.013
Hatay -.388 .254
Gaziantep .792 -.925
Sanlıurfa .061 -1.874
Mardin -.350 .472
Non-income generating crimes
Kilis -.140 -1.121
Hatay -.193 .188
Gaziantep -.023 -.906
Sanlıurfa .210 -1.75
Mardin -.332 .027
Income generating crimes crimes
Kilis .115 2.065
Hatay -.121 .743
Gaziantep .238 -.172
Sanlıurfa -.023 .095
Mardin -.432 -.170
***ρ<0.01, ** ρ <0.05 and *ρ<0.01.
Related Documents