University of Wollongong Economics Working Paper Series 2008 http://www.uow.edu.au/commerce/econ/wpapers.html Do Government Benefits for High Income Retirees Encourage Saving? Peter Siminski School of Economics University of Wollongong Wollongong, NSW 2522 WP 08-15 November 2008

Welcome message from author
This document is posted to help you gain knowledge. Please leave a comment to let me know what you think about it! Share it to your friends and learn new things together.
Transcript

University of Wollongong Economics Working Paper Series 2008 http://www.uow.edu.au/commerce/econ/wpapers.html
Do Government Benefits for High Income Retirees Encourage Saving?
Peter Siminski School of Economics
University of Wollongong Wollongong, NSW 2522
WP 08-15 November 2008
Do Government Benefits for High Income Retirees Encourage Saving?
Abstract
The Australian Commonwealth government provides a set of
benefits to high income older people, which are intended to
promote saving for retirement. It has not been established whether
this unusual policy is effective. Using illustrative models, it is shown
that these benefits may induce some people to save and work more,
but they may have the opposite effect on other, more affluent,
people. It is unclear which effect dominates. These benefits are likely
to have increased Commonwealth government expenditure on
affluent older people, accompanied by a reduction in state
government expenditure on people with slightly lower incomes.
Keywords: retirement, saving, incentives, Australia
JEL classification numbers: D91; H31
I Introduction
Faced with the fiscal pressures of ageing populations, most OECD countries have sought to
reduce reliance on publicly funded retirement income schemes. Such reforms include lifting
the eligibility age for public pensions, introduction of mandatory private pension schemes
and favourable taxation treatment of voluntary private saving for retirement (Whiteford
and Whitehouse, 2006). Australia has implemented reforms in each of these areas.
Beginning in 1999, however, it has progressively introduced a set of new government
benefits for high income retirees. The Commonwealth Seniors Health Card (CSHC) is the key
component of this system. Eligibility for other (cash and non‐cash) benefits is tied to the
CSHC. The CSHC is intended to ‘encourage people to save for their own retirement’
1

(Costello, 1998: 5). The purpose of this paper is to evaluate the likely effectiveness of this
strategy.
In assessing the welfare effects of the CSHC, Siminski (forthcoming) highlights equity
concerns and possible efficiency loss associated with increased pharmaceutical
consumption. However, it remains to be established whether the CSHC has achieved its goal
of promoting saving for retirement. The budgetary implications of any such induced saving
have not been evaluated either. The incentives provided have the potential to influence the
earning and consumption decisions of people throughout their adult lives. An empirical
evaluation would be difficult as there is no obvious comparison group from which to infer
counterfactual behaviour. The aims of this paper are more modest. I present a series of
illustrative models of the incentives for saving and earning behaviour both before and
during the age of eligibility for retirement benefits. These models all stem from the effect of
the CSHC and related benefits on the interaction between private income and benefit
income for people of retirement age. This relationship is discussed in Section III.
Saving for retirement may be affected by at least three behavioural responses. People may
be induced to change the balance between consumption and saving in the pre‐retirement
age period. The majority of the paper is devoted to this issue (Section IV). People may also
be influenced to change the quantity of labour supplied in the pre‐retirement age period.
Finally, the CSHC may affect the optimal quantity of labour supplied by those old enough to
be eligible for retirement benefits. It is shown in Section V that the budget constraint in such
labour supply models is analogous to that of the inter‐temporal consumption model. The
key result in all of the models considered is that the CSHC has created a new discontinuity in
the budget constraint. As a result, it may provide an incentive for some people to save for
retirement, but it may have the opposite effect on other, more affluent people. Section VI
considers the budgetary implications of the CSHC incentives and Section VII concludes.
II The Changing Role of the Commonwealth Seniors Health Card The role of the CSHC in Australia’s system of retirement benefits has evolved considerably
since its introduction in 1994 by the Keating Labor government. It was originally provided to
low income older people who did not receive the age pension, primarily due to the
2

pension’s assets test or residency requirements (Dawkins, 1993). Its main benefit was
eligibility for the Pharmaceutical Benefits Scheme concession. In 1999, under the Howard
coalition government, the income eligibility threshold for the CSHC was almost doubled and
it was increased again in 2001. As a result, the number of CSHC recipients increased by
around 600% (Department of Family and Community Services, various years; Standing
Committee on Family and Community Affairs, 1997). From 1999, its primary role ceased to
be that of a safety net for low income retirees. Most of its beneficiaries are wealthy,
relatively high income retirees (Siminski, forthcoming). It is estimated that in 2007 the total
cost to government of the CSHC was in the order of $271 million.1
Importantly, the CSHC income eligibility threshold is not indexed to inflation. It has
remained at $50,000 per annum for singles and $80,000 for couples since 2001. It has thus
decreased considerably in relation to the threshold for a part‐rate age pension. At August
2008, the CSHC threshold is 27% higher than the age pension threshold for singles, while it
was 87% higher in 1999. For couples, the CSHC threshold is 21% higher than the pension
threshold, compared to 86% in 1999.2 By default, the CSHC is reverting back to its original
role. In the absence of further policy changes, it will soon again be a benefit for people
whose income is low enough to qualify for an age pension. Despite this, the number of CSHC
holders increased in each year up to 2007 (Department of Family and Community Services,
various years) due to population ageing and the fact that Australians are (slowly) becoming
more affluent in retirement (Australian Government, 2007: Chart C6). However, this trend
has recently reversed, as the number of CSHC holders fell by 13% in the year to June 2008
(Macklin, 2008). The new Rudd Labor government will shortly be forced to reform the CSHC
again. The apparent options are to link CSHC eligibility back to the age pension income test,
or to increase the CSHC threshold again. While total expenditure on the CSHC is relatively
1 Authors calculations from Siminski (forthcoming: Tables 1, 2, 5). The proportion of CSHC holders who are
single was estimated using the Household Expenditure Survey 2003‐04 Expanded Confidentialised Unit Record
File. The estimate of $271m includes the cost of the Telephone Allowance and Seniors Concession Allowance
to CSHC holders. It does not include the costs of the 2007 one‐off payment to seniors, the Medicare Safety Net
Concessional threshold or the incentives provided to doctors to bulk‐bill CSHC holders. 2 A second factor in this convergence is the decrease in the age pension taper rate from 50% to 40% in July
2000, which substantially increased the income eligibility threshold for a part pension.
3

small, the number of high income retirees will increase as the population ages and becomes
more affluent.
III Benefits for People of Retirement Age The CSHC affects the interaction between private income and benefit income for people of
retirement age. This section considers this interaction in detail for single people. It serves as
an input into the analyses in the following sections. The results for coupled people are not
shown in detail, but are similar in substance as will be shown in Section IV. Benefits are
defined broadly to include cash benefits, rebates and concessions provided by the
Commonwealth and state governments and private providers. Many of these benefits vary
by state and by utilisation of the goods and services in question, so it is emphasised that the
exercise is illustrative.
Age pensioners and CSHC holders are entitled to the Pharmaceutical Benefits Scheme
concession, estimated to be worth an average of $547 p.a. for single CSHC holders (Siminski,
2008). Both groups also receive the Telephone Allowance ($88 p.a.).3 CSHC holders receive
the Seniors Concession Allowance, which for singles is of equal value to the Utilities
Allowance for pensioners ($500 p.a.).4 Both groups might benefit from higher rates of bulk‐
billing5 for GP services due to Commonwealth government financial incentives for GPs, and
concessional coverage under the extended Medicare Safety Net, but their value is difficult
to quantify. ‘One‐off’ payments to seniors (such as those provided in 2006 and 2007) are
also excluded here.
Age Pensioners receive a range of benefits to which CSHC holders are not entitled. This
includes the pension itself (a maximum of $14,216.80 p.a. for singles), the Pharmaceutical
Allowance ($150.80 p.a.) and Rent Allowance from the Commonwealth government. The
pension (including the Pharmaceutical Allowance) is reduced by 40 cents for each dollar of
3 The Telephone Allowance is $44 p.a. higher for those with a home internet connection. This is not included in
the analysis. 4 For couples, however, the Seniors Concession Allowance is more generous ($1000) than the Utilities
Allowance ($500). 5 Bulk‐billing is a billing system which includes no charge for the patient.
4
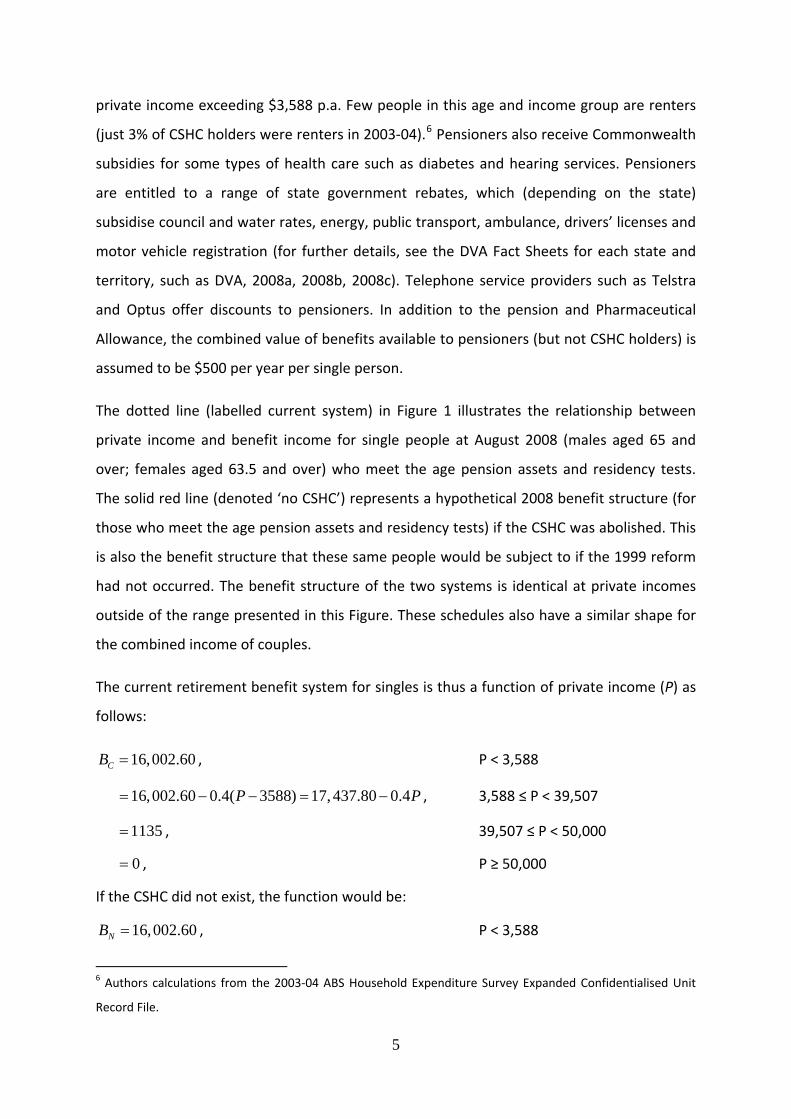
private income exceeding $3,588 p.a. Few people in this age and income group are renters
(just 3% of CSHC holders were renters in 2003‐04).6 Pensioners also receive Commonwealth
subsidies for some types of health care such as diabetes and hearing services. Pensioners
are entitled to a range of state government rebates, which (depending on the state)
subsidise council and water rates, energy, public transport, ambulance, drivers’ licenses and
motor vehicle registration (for further details, see the DVA Fact Sheets for each state and
territory, such as DVA, 2008a, 2008b, 2008c). Telephone service providers such as Telstra
and Optus offer discounts to pensioners. In addition to the pension and Pharmaceutical
Allowance, the combined value of benefits available to pensioners (but not CSHC holders) is
assumed to be $500 per year per single person.
The dotted line (labelled current system) in Figure 1 illustrates the relationship between
private income and benefit income for single people at August 2008 (males aged 65 and
over; females aged 63.5 and over) who meet the age pension assets and residency tests.
The solid red line (denoted ‘no CSHC’) represents a hypothetical 2008 benefit structure (for
those who meet the age pension assets and residency tests) if the CSHC was abolished. This
is also the benefit structure that these same people would be subject to if the 1999 reform
had not occurred. The benefit structure of the two systems is identical at private incomes
outside of the range presented in this Figure. These schedules also have a similar shape for
the combined income of couples.
The current retirement benefit system for singles is thus a function of private income (P) as
follows:
16,002.60CB = , P < 3,588
, 3 P < 39,507 16,002.60 0.4( 3588) 17,437.80 0.4P= − − = − P ,588 ≤
, 39,507 ≤ P < 50,000 1135=
, P ≥ 50,000 0=
If the CSHC did not exist, the function would be:
16,002.60NB = , P < 3,588
6 Authors calculations from the 2003‐04 ABS Household Expenditure Survey Expanded Confidentialised Unit
Record File.
5

, 3588 ≤ P < 39,507 17,437.80 0.4P= −
, P ≥ 39,507 0=
IV Intertemporal Substitution of Consumption Consider a two‐period model (pre‐retirement: t = 0 and retirement: t = 1), where a
consumer maximises utility by choosing consumption in each period. The consumer’s
private income in period 0 (I0) is assumed exogenous. Assume also that the consumer’s
utility function is additively separable over the periods. The consumer may exhibit a
preference for current consumption (δ ≥ 0). The consumer’s problem is to maximise total
utility as follows:
10
( )max ( )(1 )U CU U C
δ= +
+, (1)
where C represents consumption in each period. The budget constraint for this consumer
represents the possible combinations of C0 and C1, where
1 0 0(1 )( )C r I C= + − + 1B
This equation states that consumption in retirement is a function of saving in period 0 (I0 ‐
C0), the real interest rate (r), and government benefits in retirement (B1). Government
benefits are a function of private income in period 1, as discussed in the previous section.
Private income in period 1 is equal to 0 0(1 )( )r I C+ − . Thus the budget constraint for the
current system is:
1 0 0(1 )( ) 16,002.60C r I C= + − + , 0 0(1 )( )r I C+ − < 3588
, 3588 ≤ 0 00.6(1 )( ) 17,437.80r I C= + − + 0 0(1 )( )r I C+ − < 39,507
, 39,507 ≤ 0 0(1 )( ) 1135r I C= + − + 0 0(1 )( )r I C+ − < 50,000
, 0 0(1 )( )r I C= + − 0 0(1 )( )r I C+ − ≥ 50,000
If the CSHC did not exist, the budget constraint would be:
1 0 0(1 )( ) 16,002.60C r I C= + − + , 0 0(1 )( )r I C+ − < 3588
6
, 3588 ≤ 0 00.6(1 )( ) 17,437.80r I C= + − + 0 0(1 )( )r I C+ − < 39,507
, 0 0(1 )( )r I C= + − 0 0(1 )( )r I C+ − ≥ 39,507
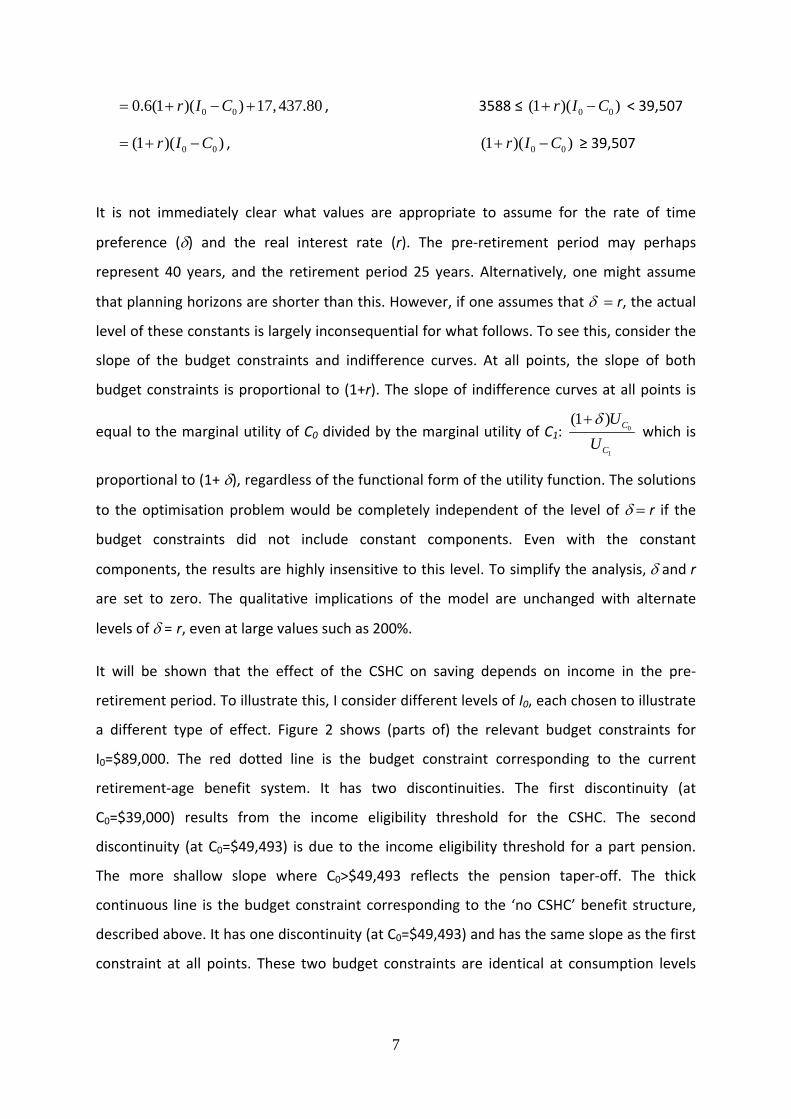
It is not immediately clear what values are appropriate to assume for the rate of time
preference (δ) and the real interest rate (r). The pre‐retirement period may perhaps
represent 40 years, and the retirement period 25 years. Alternatively, one might assume
that planning horizons are shorter than this. However, if one assumes that δ = r, the actual
level of these constants is largely inconsequential for what follows. To see this, consider the
slope of the budget constraints and indifference curves. At all points, the slope of both
budget constraints is proportional to (1+r). The slope of indifference curves at all points is
equal to the marginal utility of C0 divided by the marginal utility of C1: 0
1
(1 ) C
C
UUδ+
which is
proportional to (1+ δ), regardless of the functional form of the utility function. The solutions
to the optimisation problem would be completely independent of the level of δ = r if the
budget constraints did not include constant components. Even with the constant
components, the results are highly insensitive to this level. To simplify the analysis, δ and r
are set to zero. The qualitative implications of the model are unchanged with alternate
levels of δ = r, even at large values such as 200%.
It will be shown that the effect of the CSHC on saving depends on income in the pre‐
retirement period. To illustrate this, I consider different levels of I0, each chosen to illustrate
a different type of effect. Figure 2 shows (parts of) the relevant budget constraints for
I0=$89,000. The red dotted line is the budget constraint corresponding to the current
retirement‐age benefit system. It has two discontinuities. The first discontinuity (at
C0=$39,000) results from the income eligibility threshold for the CSHC. The second
discontinuity (at C0=$49,493) is due to the income eligibility threshold for a part pension.
The more shallow slope where C0>$49,493 reflects the pension taper‐off. The thick
continuous line is the budget constraint corresponding to the ‘no CSHC’ benefit structure,
described above. It has one discontinuity (at C0=$49,493) and has the same slope as the first
constraint at all points. These two budget constraints are identical at consumption levels
7
outside the domain of the graph. A thin continuous line is the budget constraint in a
hypothetical case of no benefit income.
Assume that the utility function for each period is a constant relative risk aversion (CRRA)
function, so that:
(1 ) (1 )0 0 0 1(
(1 ) (1 )C I C BU )ρ ρ
ρ ρ
− −− += +
− − (2)
Where ρ is the Arrow‐Pratt parameter or relative risk aversion, which determines the
concavity of the function (Pratt, 1964). The sensitivity of the results to the assumed
concavity of the utility function can be tested by varying ρ. Initially, the analysis follows
Siminski (forthcoming) by setting ρ to 3. It will be shown that the results are not sensitive to
alternate assumptions on the extent of concavity. The utility function is thus:
2 20 0 0 1(2 2
C I C BU− −− +
= +− −
) (3)
Consider the optimal C0 which maximizes utility, as specified in equation (3). The
indifference curves representing the optimal level of utility under the ‘current system’ and
‘no CSHC’ are shown in Figure 3, which is otherwise based on Figure 2. Under the ‘current
system’, utility is maximized with C0 equal to $45,068. With ‘no CSHC’, utility is highest when
C0 is equal to approximately $49,493. Therefore, the CSHC increases saving by $4,425 when
I0 = $89,000. Similar results are found when $86,400 < I0 < $90,600.
However, the current system can have the opposite effect at higher levels of I0 due to the
additional budget constraint discontinuity caused by CSHC eligibility. This discontinuity leads
some rational decision makers to corner‐solutions in the utility maximisation problem. This
is shown in Figure 4 for I0 = $106,000. Under the ‘current system’, utility is maximised at C0 =
$56,000. In the ‘no CSHC’ system, the optimal C0 is $53,000. Thus the current system
discourages saving at this level of private income. More generally, corner solutions (which
all correspond to decreased savings as a result of the current system) are found for
$101,200 < I0 < $110,300. The effect on saving is greatest at I0 = $110,300, with the current
system reducing optimal saving by around $5,150 as compared to the no CSHC system.
8
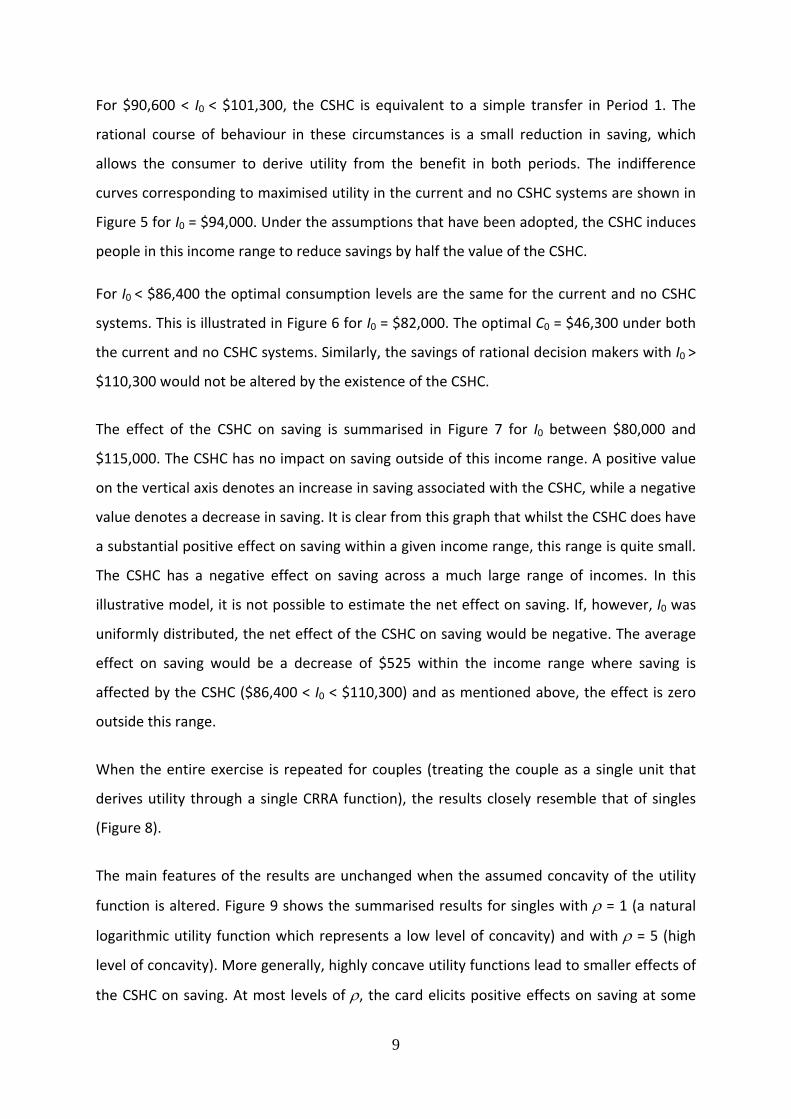
For $90,600 < I0 < $101,300, the CSHC is equivalent to a simple transfer in Period 1. The
rational course of behaviour in these circumstances is a small reduction in saving, which
allows the consumer to derive utility from the benefit in both periods. The indifference
curves corresponding to maximised utility in the current and no CSHC systems are shown in
Figure 5 for I0 = $94,000. Under the assumptions that have been adopted, the CSHC induces
people in this income range to reduce savings by half the value of the CSHC.
For I0 < $86,400 the optimal consumption levels are the same for the current and no CSHC
systems. This is illustrated in Figure 6 for I0 = $82,000. The optimal C0 = $46,300 under both
the current and no CSHC systems. Similarly, the savings of rational decision makers with I0 >
$110,300 would not be altered by the existence of the CSHC.
The effect of the CSHC on saving is summarised in Figure 7 for I0 between $80,000 and
$115,000. The CSHC has no impact on saving outside of this income range. A positive value
on the vertical axis denotes an increase in saving associated with the CSHC, while a negative
value denotes a decrease in saving. It is clear from this graph that whilst the CSHC does have
a substantial positive effect on saving within a given income range, this range is quite small.
The CSHC has a negative effect on saving across a much large range of incomes. In this
illustrative model, it is not possible to estimate the net effect on saving. If, however, I0 was
uniformly distributed, the net effect of the CSHC on saving would be negative. The average
effect on saving would be a decrease of $525 within the income range where saving is
affected by the CSHC ($86,400 < I0 < $110,300) and as mentioned above, the effect is zero
outside this range.
When the entire exercise is repeated for couples (treating the couple as a single unit that
derives utility through a single CRRA function), the results closely resemble that of singles
(Figure 8).
The main features of the results are unchanged when the assumed concavity of the utility
function is altered. Figure 9 shows the summarised results for singles with ρ = 1 (a natural
logarithmic utility function which represents a low level of concavity) and with ρ = 5 (high
level of concavity). More generally, highly concave utility functions lead to smaller effects of
the CSHC on saving. At most levels of ρ, the card elicits positive effects on saving at some
9

(relatively low) levels of I0 and negative effects on saving at some higher levels of I0. At low
levels of ρ (below approximately 0.7), the CSHC does not elicit a positive saving response at
any income level.
The income levels identified above may not correspond to the income levels which induce a
given effect on saving in continuous time. In principle, this model could be extended to a
multi‐period model. Such a model would consider the effect of the CSHC on saving
throughout the life course. This has not been pursued. The reason for this is the level of
uncertainty around the effect of the CSHC on the actual retirement benefits of people in the
future. As mentioned above, the income eligibility threshold is not indexed to inflation and
it is subject to ad hoc change. Age pension policy also affects the income range of people
who would benefit from the CSHC. For example, the age pension taper rate was decreased
from 50% to 40% in July 2000, substantially increasing the income eligibility threshold for a
part pension. Furthermore, PBS copayments for both general and concessional patients are
subject to change in every year and superannuation policies are regularly adjusted, adding
to uncertainty over the future value of the CSHC.
Models which incorporate uncertainty can of course be developed. However, such a model
would require assumptions on the probability distribution over future scenarios. Such an
exercise would not seem to be useful. For the same reasons regarding uncertainty, the
material change brought about by the CSHC is unlikely to have influenced the savings
decisions of people whose retirement is distant. On the other hand, the CSHC may have
been more effective as a symbol of the likely direction of future retirement income policy.
The Howard government made it clear that it intended to increase support for ‘self‐funded’
retirees. To the extent that the CSHC reforms contributed to a general expectation that the
government will increasingly support affluent retirees, it may have indeed induced saving.
This is a complex issue that has not been accounted for here and may warrant further
research.
10

V Labour Supply I briefly consider possible labour supply responses by people of pre‐retirement age and
people of retirement age (those who meet age eligibility rules for retirement benefits),
respectively.
In the inter‐temporal model presented above, the consumer maximises utility by choosing
consumption in period 0. It treats income in period 0 (and hence labour supply) as
exogenous. A complementary model might make the opposite assumptions. In this model, a
consumer maximises utility by choosing the quantity of hours supplied to the labour market
in period 0. Consumption in period 0 is treated as fixed. Labour supply in period 1 is
assumed to be zero, as in the previous model. The budget constraint in such a model can be
expressed in terms of leisure in period 0 and consumption in period 1. Figure 10 shows two
such budget constraints for C0 = $40,000 and a wage of $30 per hour. The model abstracts
from the taxation system for the purpose of the illustration. It is clear that the shapes of
these constraints are the same as those in the original inter‐temporal model above.
Assuming that the marginal utility of leisure is positive but diminishing (UL > 0, ULL < 0), this
model has similar implications for saving as the original model.
Finally, the CSHC may affect labour supplied by people of retirement age. Consider a single
period model where utility is derived from consumption and leisure by people of retirement
age. Assume that saving in previous periods is exogenous. Figure 11 shows two such budget
constraints for a single person with no savings and a wage of $30 per hour. Once again, the
budget constraint has the same shape as in previous models, implying that the effect on the
labour supply of older people may be positive for some and negative for others.
VI Fiscal Implications Implicit in the desire to encourage saving for retirement is a concern for the fiscal
sustainability of the public system of retirement benefits. It was shown above that the CSHC
may encourage saving for retirement amongst people within a given income range.
However, it does not automatically follow that such an incentive leads to a reduction in
government expenditure, even with respect to people who are influenced to increase
saving. As demonstrated above, the people who would rationally increase saving in
11

response to the CSHC are those whose incomes would only marginally qualify for a partial
rate of the age pension if there was no CSHC. These are people who are on or close to a
corner solution in the absence of the CSHC, as depicted in Figure 3. Although they would
qualify for the age pension, they would receive very little pension income. They would,
however, receive other benefits which are tied to pension eligibility. As discussed in Section
III, CSHC holders are also entitled to many of these benefits. Of the benefits that only
pensioners receive, most are provided by state governments. Therefore, inducing marginal
part pensioners onto the CSHC is approximately budget neutral for the Commonwealth
government.7 It may, however, reduce expenditure by state governments.
On the other hand, expenditure on (richer) people who would not be age pensioners even in
the absence of the CSHC (as discussed above and depicted in Figure 4 and Figure 5) is a new
cost to the Commonwealth government. Therefore, even if the CSHC does induce some
people to save for retirement, its net effect is likely to increase Commonwealth government
spending on retirement benefits. Given that most beneficiaries are particularly wealthy
(Siminski, forthcoming), this may not be the optimal use of scarce government resources.
VII Conclusions
An Illustrative model has been developed to demonstrate the effect of government benefits
for high income retirees on incentives to save for retirement. Whilst such benefits may
induce some people to save, they may have the opposite effect on others. It is unclear
which effect dominates and so no evidence was found that the CSHC achieves its stated aim.
Similarly, these benefits may have a positive effect on the labour supply of some people
both before and during the age of retirement benefit eligibility, but a negative effect on
others. It was shown that the net effect of these benefits is a likely increase in
Commonwealth government expenditure on affluent older people, accompanied by a
decrease in expenditure by state governments on people with slightly lower incomes.
7 There may be some fiscal benefit from taxation on the interest earned on the induced saving. But this may be
offset by the consumption tax revenue lost due to the corresponding decrease in consumption.
12

The issue is complicated by rapidly changing retirement income policies. For people whose
retirement is distant, policies such as the CSHC may affect long term retirement plans to the
extent that they signal the likely nature of future retirement income policies. This should be
taken into account by the government when it considers the next round of CSHC reforms,
and it may be an issue worthy of further research.
It has been assumed that people know the value of the PBS concession. It is possible that
people overestimate the expected value of the concession, particularly its insurance value. If
so, behaviour may reflect this perceived value of the concession rather than its actual value
(see Chan and Stevens, 2008; Thaler, 1994). But this would not change the implications of
the model. The budget constraints would retain their main features, including their
discontinuities, regardless of the perceived value of the PBS concession.
References
Australian Government (2007), Intergenerational Report 2007, Commonwealth of Australia,
Canberra.
Chan, S. and Stevens, A.H. (2008), 'What You Don't Know Can't Help You: Pension
Knowledge and Retirement Decision‐Making', The Review of Economics and
Statistics, 90 (2), 253‐66.
Costello, P. (1998), Budget Speech 1998‐99, Commonwealth of Australia.
Dawkins, J.S. (1993), Appropriation Bill (No. 1) 1993‐94, Australian Government House of
Representatives.
Department of Family and Community Services (various years), Annual Report, Australian
Government.
DVA (2008a), Concessions for Pensioner Concession Card Holders New South Wales, DVA
Facts SOI01, Australian Government Department of Veterans' Affairs.
‐‐‐ (2008b), Concessions for Pensioner Concession Card Holders Queensland, DVA Facts
SOI21, Australian Government Department of Veterans' Affairs.
‐‐‐ (2008c), Concessions for Pensioner Concession Card Holders Victoria, DVA Facts SOI11,
Australian Government Department of Veterans' Affairs.
13
Macklin, J. (2008), 'Commonwealth Seniors Health Care Card (Question No. 116)', Australian
Parliament House of Representatives Official Hansard No. 8, 2008, Thursday, 19 June
2008, p5526.
Pratt, J.W. (1964), 'Risk Aversion in the Small and in the Large', Econometrica, 32 (1/2), 122‐
36.
Siminski, P. (forthcoming), 'A Welfare Analysis of the Commonwealth Seniors Health Card',
Economic Record.
Standing Committee on Family and Community Affairs (1997), Concessions ‐ Who benefits?:
A report on concession card availability and eligibility for concessions, Australian
Parliament House of Representatives.
Thaler, R.H. (1994), 'Psychology and Savings Policy', American Economic Review, 84 (2
Papers and Proceedings of the Hundred and Sixth Annual Meeting of the American
Economic Association), 186‐92.
Whiteford, P. and Whitehouse, E. (2006), 'Pension Challenges and Pension Reforms in OECD
Countries', Oxford Review of Economic Policy, 22 (1), 78‐94.
14
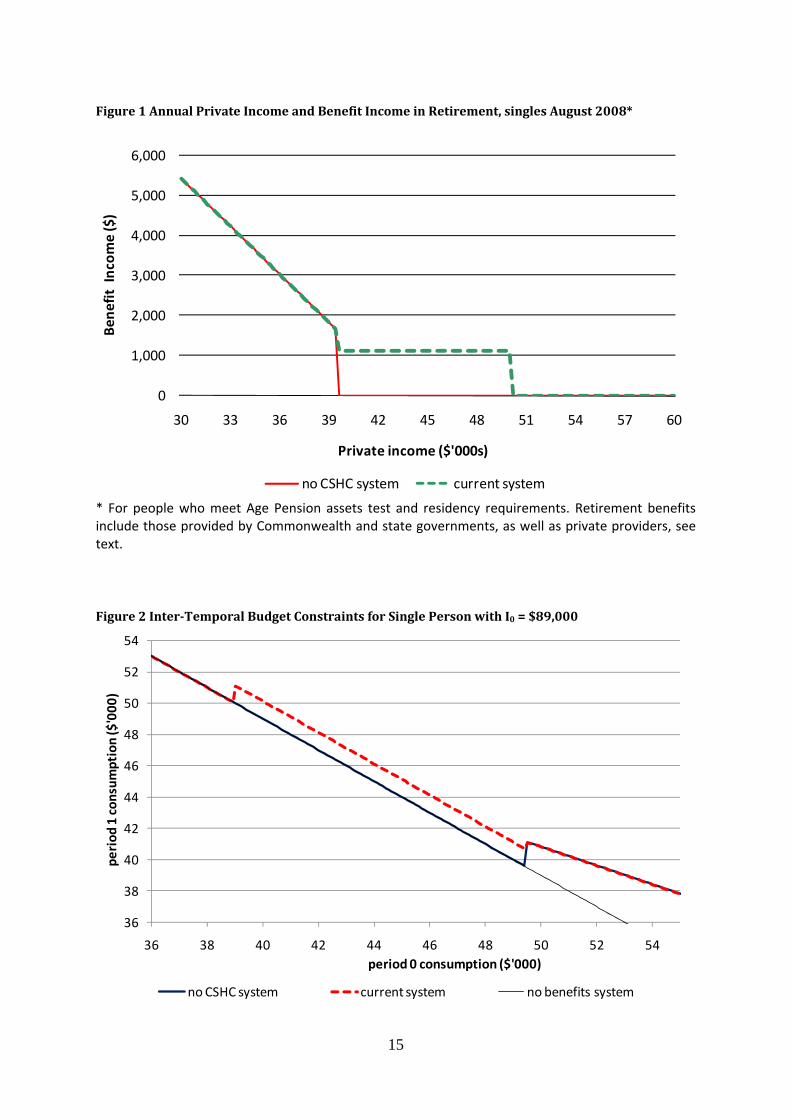
Figure 1 Annual Private Income and Benefit Income in Retirement, singles August 2008*
0
1,000
2,000
3,000
4,000
5,000
6,000
30 33 36 39 42 45 48 51 54 57 60
Bene
fit Incom
e ($)
Private income ($'000s)
no CSHC system current system
* For people who meet Age Pension assets test and residency requirements. Retirement benefits include those provided by Commonwealth and state governments, as well as private providers, see text.
Figure 2 InterTemporal Budget Constraints for Single Person with I0 = $89,000
36
38
40
42
44
46
48
50
52
54
36 38 40 42 44 46 48 50 52 54
period
1 con
sumption ($'000
)
period 0 consumption ($'000)
no CSHC system current system no benefits system
15

Figure 3 InterTemporal Budget Constraints and Indifference Curves for Single Person with I0 = $89,000, CRRA utility ρ = 3
38
40
42
44
46
48
50
40 42 44 46 48 50 52 54
period
1 con
sumption ($'000
)
period 0 consumption ($'000)
no CSHC system current system indifference (no CSHC) indifference (current)
Figure 4 InterTemporal Budget Constraints and Indifference Curves for Single Person with I0 = $106,000, CRRA utility ρ = 3
16
47
49
51
53
55
57
49 51 53 55 57 59 61
period
1 con
sumption ($'000
)
period 0 consumption ($'000)
no CSHC system current system indifference (no CSHC) indifference (current)

Figure 5 InterTemporal Budget Constraints and Indifference Curves for Single Person with I0 = $94,000, CRRA utility ρ = 3
38
40
42
44
46
48
50
52
54
42 44 46 48 50 52 54 56
period
1 con
sumption ($'000
)
period 0 consumption ($'000)
no CSHC system current system indifference (no CSHC) indifference (current)
Figure 6 InterTemporal Budget Constraints and Indifference Curves for Single Person with I0 = $82,000, CRRA utility ρ = 3
36
38
40
42
44
46
48
35 37 39 41 43 45 47 49 51
period
1 con
sumption ($ '000
)
period 0 consumption ($ '000)
no CSHC system current system indifference (both)
17

Figure 7 Effect of CSHC and related benefits on Saving by Period 0 Income, Singles, CRRA utility ρ = 3
‐6,000
‐4,000
‐2,000
0
2,000
4,000
6,000
$80,000 $85,000 $90,000 $95,000 $100,000 $105,000 $110,000 $115,000
Effect on Saving
Private Income in Period 0
Figure 8 Effect of CSHC and related benefits on Saving by Period 0 Income, Couples, CRRA utility ρ = 3
‐10,000
‐8,000
‐6,000
‐4,000
‐2,000
0
2,000
4,000
6,000
8,000
$130,000 $140,000 $150,000 $160,000 $170,000 $180,000
Effect on Saving
Private Income in Period 0
18

Figure 9 Effect of CSHC and related benefits on Saving by Period 0 Income, Singles, CRRA utility ρ = 1, 5
‐10,000
‐5,000
0
5,000
10,000
15,000
20,000
$80,000 $88,000 $96,000 $104,000 $112,000 $120,000
Effect on Saving
Private Income in Period 0
ρ = 1 ρ = 5
Figure 10 Intertemporal Budget Constraints for Single Person with C0 = $40,000 and wage = $30 per hour
37
39
41
43
45
47
49
51
53
109 111 113 115 117 119
period
1 con
sumption ($'000
)
weekly hours of leisure in period 0
no CSHC system current system no benefits system
19

Figure 11 Budget Constraints for Single Person of Retirement Age with wage = $30 per hour and no savings
38
40
42
44
46
48
50
52
135 136 137 138 139 140 141 142 143 144 145
annu
al con
sumption ($'000
)
weekly hours of leisure
no CSHC system current system no benefits system
20
Related Documents