Do foreign subsidiaries innovate and perform better in a cluster? A spatial analysis of Japanese subsidiaries in the US Jessie P.H. Poon a, * , Peter Kedron b , Sharmistha Bagchi-Sen a a University at Buffalo e State University of New York, Geography Department,105 Wilkeson Quad, Buffalo, NY 14261, USA b Ryerson University, Geography Department, 380 Victoria St (6th Floor), Toronto, ON M5B 2K3, Canada Keywords: Cluster Innovation Kuldorff’s scan Spatial autoregressive models Japanese subsidiary abstract The interrelationship between clustering, innovation, and performance of Japanese subsidiaries in the US is examined in this paper. First, we apply Kulldorff’s spatial scan statistic to identify process innovation clustering among Japanese subsidiaries. The scale at which clustering occurs is regional rather than local, and cluster location captures the geographical environment of home-transplants from Japan. Second, we apply spatial autoregressive models to test the relationship between cluster location and innovation among Japanese subsidiaries. The results indicate that cluster location strengthens the relationship be- tween subsidiary innovation and firm performance. Negative spatial autocorrelation shows that clus- tering contributes to innovation by facilitating proximate learning between less innovative laggards, and, leading innovative Japanese subsidiaries. Published by Elsevier Ltd. Introduction Cluster scholarship celebrates localized geographical concentra- tion and suggests that location within a center of interrelated firms is key to firm innovation and performance (Baptista & Swann, 1998; Maskell, 2001; Porter, 1998). However, Martin and Sunley (2003: 9) observed not too long ago that “the cluster idea has . become accepted by faith” and has not been rigorously tested. Clearly, some progress has been made since their publication for example, Corrado, Martin, and Weeks (2005) identification of cluster convergence, and Rodriguez-Pose and Comptour’s (2011) study showing limited sup- port for the relationship between cluster and regional growth. However, verification of the relationship between firm’s location in a cluster and its innovation performance remains limited despite the emergence of new cluster detection techniques. Clusters are typically identified based on relatively simple location quotient statistics that are applied to city (MSA) or county level economic data (e.g. Porter, 2003). Others study clusters at the continental level (e.g. Corrado et al., 2005). Most of the studies use secondary data and geographical scale is pre-determined through political or administrative boundaries established by government agencies. Perhaps for this reason, evidence of firm cluster benefits remains ambivalent with mixed evidence (e.g. compare Baptistic & Swann, 1998 to Rodriguez-Pose & Comptour, 2011). In contrast to this work, we draw upon Kuldorff’s spatial scan statistic to identify firm clusters based on primary data that includes geocoded loca- tions. Next, much of the work on innovation clusters is associated with local or host clusters which are home to a large number of native firms. While such clusters are rich in social capital, foreign subsidiaries that are relatively un-embedded in the cluster may not be able to access the social capital. Multinational (MNE) sub- sidiaries suffer from what Zaheer (1995) has called the “liability of foreignness”. This refers to the high transaction costs that are faced by a foreign firm in a new host environment. It is not clear that location in a cluster in the host country will lead to increased innovative capability and performance. A second objective of the paper is to apply spatial autoregressive models to examine if location in a cluster increases foreign subsidiary innovation and performance. The rest of the paper is structured as follows. In the next two sections, we detail the theories surrounding the relationship be- tween spatial clustering and subsidiary innovation. This is followed by a description of methodology and data. The results of Kuldorff’s Scan and spatial econometric models are then presented. The final section discusses and concludes the findings. Spatial clustering and foreign subsidiary innovation Why firms cluster in space has long preoccupied economic ge- ographers, and more recently, economists and business scholars (Maskell, 2001; Parr, 2002; Porter, 1998, 2000). The convergence in * Corresponding author. Tel.: þ1 416 913 5000. E-mail address: [email protected] (J.P.H. Poon). Contents lists available at ScienceDirect Applied Geography journal homepage: www.elsevier.com/locate/apgeog 0143-6228/$ e see front matter Published by Elsevier Ltd. http://dx.doi.org/10.1016/j.apgeog.2013.07.007 Applied Geography 44 (2013) 33e42

Welcome message from author
This document is posted to help you gain knowledge. Please leave a comment to let me know what you think about it! Share it to your friends and learn new things together.
Transcript
lable at ScienceDirect
Applied Geography 44 (2013) 33e42
Contents lists avai
Applied Geography
journal homepage: www.elsevier .com/locate/apgeog
Do foreign subsidiaries innovate and perform better in a cluster?A spatial analysis of Japanese subsidiaries in the US
Jessie P.H. Poon a,*, Peter Kedron b, Sharmistha Bagchi-Sen a
aUniversity at Buffalo e State University of New York, Geography Department, 105 Wilkeson Quad, Buffalo, NY 14261, USAbRyerson University, Geography Department, 380 Victoria St (6th Floor), Toronto, ON M5B 2K3, Canada
Keywords:ClusterInnovationKuldorff’s scanSpatial autoregressive modelsJapanese subsidiary
* Corresponding author. Tel.: þ1 416 913 5000.E-mail address: [email protected] (J.P.H. Poon
0143-6228/$ e see front matter Published by Elseviehttp://dx.doi.org/10.1016/j.apgeog.2013.07.007
a b s t r a c t
The interrelationship between clustering, innovation, and performance of Japanese subsidiaries in the USis examined in this paper. First, we apply Kulldorff’s spatial scan statistic to identify process innovationclustering among Japanese subsidiaries. The scale at which clustering occurs is regional rather than local,and cluster location captures the geographical environment of home-transplants from Japan. Second, weapply spatial autoregressive models to test the relationship between cluster location and innovationamong Japanese subsidiaries. The results indicate that cluster location strengthens the relationship be-tween subsidiary innovation and firm performance. Negative spatial autocorrelation shows that clus-tering contributes to innovation by facilitating proximate learning between less innovative laggards, and,leading innovative Japanese subsidiaries.
Published by Elsevier Ltd.
Introduction
Cluster scholarship celebrates localized geographical concentra-tion and suggests that locationwithin a center of interrelatedfirms iskey to firm innovation and performance (Baptista & Swann, 1998;Maskell, 2001; Porter, 1998). However, Martin and Sunley (2003: 9)observed not too long ago that “the cluster idea has . becomeaccepted by faith” and has not been rigorously tested. Clearly, someprogress hasbeenmade since their publication for example, Corrado,Martin, andWeeks (2005) identification of cluster convergence, andRodriguez-Pose and Comptour’s (2011) study showing limited sup-port for the relationship between cluster and regional growth.However, verification of the relationship between firm’s location in acluster and its innovation performance remains limited despite theemergence of new cluster detection techniques.
Clusters are typically identified based on relatively simplelocation quotient statistics that are applied to city (MSA) or countylevel economic data (e.g. Porter, 2003). Others study clusters at thecontinental level (e.g. Corrado et al., 2005). Most of the studies usesecondary data and geographical scale is pre-determined throughpolitical or administrative boundaries established by governmentagencies. Perhaps for this reason, evidence of firm cluster benefitsremains ambivalent with mixed evidence (e.g. compare Baptistic &Swann, 1998 to Rodriguez-Pose & Comptour, 2011). In contrast to
).
r Ltd.
this work, we draw upon Kuldorff’s spatial scan statistic to identifyfirm clusters based on primary data that includes geocoded loca-tions. Next, much of the work on innovation clusters is associatedwith local or host clusters which are home to a large number ofnative firms. While such clusters are rich in social capital, foreignsubsidiaries that are relatively un-embedded in the cluster may notbe able to access the social capital. Multinational (MNE) sub-sidiaries suffer from what Zaheer (1995) has called the “liability offoreignness”. This refers to the high transaction costs that are facedby a foreign firm in a new host environment. It is not clear thatlocation in a cluster in the host country will lead to increasedinnovative capability and performance. A second objective of thepaper is to apply spatial autoregressive models to examine iflocation in a cluster increases foreign subsidiary innovation andperformance.
The rest of the paper is structured as follows. In the next twosections, we detail the theories surrounding the relationship be-tween spatial clustering and subsidiary innovation. This is followedby a description of methodology and data. The results of Kuldorff’sScan and spatial econometric models are then presented. The finalsection discusses and concludes the findings.
Spatial clustering and foreign subsidiary innovation
Why firms cluster in space has long preoccupied economic ge-ographers, and more recently, economists and business scholars(Maskell, 2001; Parr, 2002; Porter, 1998, 2000). The convergence in
J.P.H. Poon et al. / Applied Geography 44 (2013) 33e4234
inter-disciplinary interest is driven by two intersecting sets ofliterature.
First, in attempting to unpack the linkages between firms inregional agglomerations, scholars agree that firm clusters manifestconstellations of relational exchanges between suppliers, cus-tomers, competitors and institutions (Gordon & McCann, 2005;Mudambi & Swift, 2012). Such a relational perspective has beenparticularly popular in descriptions of the Japanese keiretsu (Dyer& Singh, 1998). Japanese relational networks are embedded in anorganizational structure that encourages knowledge flows withinand between related corporations. This in turn influences thespatial logic of Japanese firms’ internationalization by encouragingthe international transplant of supply networks across spacecreating geographical clusters in host regions, for example, theautomobile cluster in the US south and the Midwest (Klier &Rubenstein, 2010). Glocalization enables Japanese firms to bal-ance between their international operations and response to localenvironments (Edgington & Haytor, 2013).
Second, according to Porter (1998: 78): “ . enduring competi-tive advantages in a global economy lie increasingly in local thingse knowledge, relationships and motivations e that distant rivalscannot replicate”. Here, there is some consensus that knowledge ismore effectively acquired and transmitted when firms and theircustomers or suppliers are in close proximity to one another in acluster (Maskell, 2001; Wei, Zhou, Sun, & Lin, 2012; Zhang, Wong,So, & Hui, 2012). In part, knowledge is partly tacit and embodiedin skilled individuals. Information sharing increases when in-dividuals responsible for transferring spatially sticky tacit knowl-edge interact or collaborate. The latter is important becauseinformation that is proprietary tends to be more willinglycommunicated between two parties who are in frequent contactwith one another. Consequently, innovation may be seen to be asocial enterprise based on communities of practice (Rutherford &Holmes, 2007), and Kurosawa, Iwata, and Roberts (2007) suggestthat Japanese R&D practices are highly embedded in such com-munities. The social nature of knowledge in turn focuses attentionon spatial clusters as a beneficial geographic environment fortransmitting information and knowledge since the latter is effec-tively learned through shared meanings that is adversely influ-enced by distance. Spatial clustering lowers transaction cost whenfirms’ R&D activities are relatively densely concentrated: Eriksson’s(2011) study of Swedish firms for example shows that knowledgespillovers are optimum within a distance of 50 km. Others showthat spillovers span longer distances depending on the type ofexternalities (Autant-Bernard & LeSage, 2011). The issue of scale isthus relevant in understanding the role of geography. Howeverscalar dimensions of clusters have hitherto been determined bypolitical or administrative boundaries that facilitate data collectionamong government agencies. Callois (2008) argues that cluster sizeand therefore scale needs to be problematized. He maintains thattoo much proximity and geographical concentration can be nega-tive because of redundant information arising from limited in-teractions with external firms. Overly proximate relations createfirm cooperation that decreases incentives for competitivebehavior.
If locational (as opposed to the firm) attributes are strategic forinnovation, then scholars have become interested in how MNEsexploit and access cluster-generated knowledge through theirsubsidiaries. This involves decentralizing power and giving sub-sidiaries the independence to pursue foreign clustering. In assign-ing a more agentic role to the subsidiary abroad, scholars havefocused on the following dimensions. The first is associated withMNE subsidiaries’ ability to source for knowledge and developcompetency in technological innovation. The second dimension isconcerned with the rise of a flatter parent-subsidiary control
structure that increases the subsidiary’s autonomy to innovate(Birkinshaw & Hood, 2000; Phene & Almeida, 2003). Both di-mensions are enhanced when foreign subsidiaries locate in clus-ters. Geography matters here since subsidiary capability may bedeveloped through sourcing of knowledge in clusters that arerelatively well-endowed in technological resources (Frost,Birkinshaw, & Prescott, 2002). However a growing literature alsoargues that subsidiary competency overemphasizes the role of hostcluster and subsidiary autonomy in knowledge sourcing. Yamin &Andersson (2011) contend that subsidiary competency includesmanufacturing or marketing activities that may not depend on thehost cluster’s technological endowment. Moreover, Japanese firmsare not motivated to develop local linkages with firms(Christopherson & Clark, 2007), hence location in a cluster maycarry few innovation advantages.
Hypotheses
Spatial clustering of innovation
The term innovation covers a continuum of technological ac-tivities including product and process innovation. Bhoovaraghavan,Vasudevan, and Chandran (1996) note that a larger share ofAmerican firms’ innovation is driven by product innovationwhile alarger share of Japanese innovations is associated with processinnovation. Rosenkranz (2003) suggests that at least 60 percent ofJapanese innovation is associated with process innovation.Furthermore, contemporary dominance of the Japanese in con-sumer electronics and automobile industries is linked to theirprocess innovations. Consequently, the paper will focus on Japa-nese subsidiaries’ process innovation.
This focus is also consistent with Utterback and Abernathy’s(1975) technology cycle model that demonstrates that productinnovation is associated with early growth in an industry. As theindustry matures, it is underscored by process innovation. Suchmaturity describes the industrial profile of many of the firms wesurveyed including the automobile, machinery and electronics in-dustries (see “Data” below). Process innovation is not necessarilyassociated with incremental innovation. Pisano (1997) for instancehas shown that highly innovative industries such as the biotech-nology industry are driven predominantly by process innovationwith radical outcomes. If process innovation dominates Japanesesubsidiary innovations in the US, we expect that such innovation islikely to benefit from geographical proximity because of external-ities from strategic clusters that facilitate deep and closely coordi-nated adjustments between engineers and industrial designersduring product design. Integration of design and manufacturing isimportant for process innovation (Milgrom & Roberts, 1990). Itexplains why Japanese R&D units and transplants tend to clusteraround their manufacturing facilities and suppliers in the US (Klier& Rubenstein, 2010). Hence our first hypothesis proposes that:
H1: Japanese subsidiary process innovation exhibits spatialclustering.
To identify clusters, we apply the Kuldorff’s Spatial Scan statistic.While location quotient methods remain popular in the businessdiscipline (Porter, 2003), geographers have begun to extend de-velopments in spatial statistics to firm pattern analysis. Feser,Sweeny, and Renski (2005) for instance used the G statistic toidentify local spatial autocorrelation of manufacturing linkageswhile Brachert, Titze, & Kubis (2011) combined the G statistic and acluster index to find horizontal and vertical industrial clusters. Incontrast, the advantage of the Kuldorff’s Spatial Scan statistic is thatit allows us to identify a cluster based on geocoded locations ofindividual firms. This paper thus distinguishes itself from othereconomic geographic applications through use of primary data that
J.P.H. Poon et al. / Applied Geography 44 (2013) 33e42 35
avoids the biases of pre-selection as the Scan searches for clusterswithout specifying cluster size or scale.
Cluster and locational factorsA central question of this paper is if location in a cluster favor-
ably influences a subsidiary’s innovation? The benefit of spatialclustering is explained by the efficacy of proximate exchanges inknowledge transmission among various agents. However, with theexception of Baptista and Swann (1998), there are few papers thatdirectly test the effect of spatial clustering on subsidiary innovation.Birkinshaw and Hood’s (2000) cluster analysis, for example, isconcerned with the role of the cluster on subsidiary embeddednessand autonomy. Pouder and St. John (1996) theorize that spatialclustering drives innovation only at initial phases of cluster evo-lution, but do not empirically test this proposition. Owen-Smith,Riccaboni, Pammolli, and Powell (2002) show that upstreamresearch in the biomedical field may be traced to local centers ofexcellence (Frost et al., 2002) in certain US regions. Their workfocuses on the spatial configuration of the biomedical industry,universities and pharmaceutical MNEs’ networks rather than per-formance. In this paper, we explicitly test if location in a spatialcluster raises subsidiary innovation, that is:
H2: Location in a spatial cluster contributes positively to sub-sidiary process innovation.
Subsidiary innovation is also influenced by other locationalfactors. They are:
(i) Market. To establish dynamic capability, subsidiaries willestablish its own routines for learning and innovating. Rou-tines developed by the subsidiary may be associated withefficiency-generating goals, including the creation or integra-tion of engineering and design capability in process innova-tion. But routines are embedded in the market because theyinvolve the development of technology from design phase tothe market. Building subsidiary-specific capability requiressuccessful market exploitation and the collection of marketknowledge reflecting the importance of user-driven innova-tion (von Hippel, 1986). And Japanese overseas innovation hasbeen found to be rather user-driven (Kurosawa et al., 2007).Market exploitation is distinguished from market intelligencebecause it reflects both Teece, Pisano, and Shuen (1997) andYamin and Andersson’s (2011) point that subsidiary compe-tency can also involve exploiting a dynamic capability likemarketing skills. On the other hand, market intelligence moreappropriately captures Cantwell and Mudambi’s (2005) com-petency creating mandate because it requires that the sub-sidiary not only pursue independent initiatives that enable itto spot market trends, but to transform such knowledge tomore technologically complex functions.
(ii) Skilled workers. Industrial clusters emphasize the advantagesof labor pooling. Most tacit knowledge largely resides in sci-entists and engineers, and the distribution of skilled workerstends to be rather concentrated in space, in cities or arounduniversities (Breschi & Malerba, 2001; Florida, 2002). Themobility of skilled labor and the nature of social networksamong skilled workers are important mechanisms by whichknowledge is transmitted and acquired.
(iii) Applied research and new technology. We expect that Japa-nese subsidiary innovation is predominantly oriented towardapplied research given firms’ preponderance in downstreaminnovations (Song, Asakawa, & Chu, 2011). Organizationalsearch becomes a necessity to alter organizational routines inorder to respond to markets and competition in a systematicmanner (Teece et al., 1997). As contemporary manufacturingprocess becomes more and more driven by electronic and
production data - the modern automobile for instance consistsof several microelectronic components that direct cruisecontrol or adjusts temperature in the car’s interior e this re-quires engineering analysis of production and electronic datathat improves understanding of process parameters and con-trol. Given applied research is heavily engaged in engineeringsolutions, it is associated with lower prohibitive costscompared to the more uncertain nature of basic research. Asproduct cycles have shortened, rapid development of newtechnology and engineering process of mature industries be-comes even more important to the subsidiary’s developmentof competency. Developing capability in these activitiesshould favorably influence subsidiary innovation.
Subsidiary performance in clusterTeece et al. (1997) maintains that differences in performance
among firms depend on their internal resources and competencies.This includes differences in how they develop routines and tech-nological capability. He argues that minor technological changessuch as adjusting process parameters and controls could have amajor impact on firms’ ability to perform. Japanese leanmanufacturing, for instance, is underscored by distinctive techno-logical processes that are not readily imitated. If Japanese sub-sidiaries are acquiring technological capability and competency inprocess innovation, then we expect a beneficial relationship be-tween process innovation and subsidiary performance. In addition,spatial clustering facilitates inter-organizational costs related to thereduction of transactions costs in the search for inputs, informationandmarkets. Since routines require the gathering and processing ofinformation that links customer needs with engineering designchoices, location in a cluster should strengthen the relationshipbetween process innovation and performance. However Kukalis(2010) contends that the benefits of clusters on firm performancehave not been demonstrated. In particular, he found that firms in acluster only perform better at early stages of the industry cycle. It ispossible that the effect of cluster is not direct but operates throughits moderation on innovation and firm performance for firms inmature manufacturing industries. Hence it is hypothesized that:
H3: The relationship between subsidiary performance andprocess innovation is stronger when the subsidiary is located in aspatial cluster.
Methodology and data
Variable measurementDependent variables. Subsidiary innovation is measured by two
questions in the survey instrument (see “Data” below for details).The first asked Japanese subsidiaries if they had introduced newproducts since relocation to the US and the second, on new tech-nology and engineering process. For performance, firms were alsoasked to provide information on their sales growth in the past 10years. The appropriate units of measurement are provided inTable 1.
Independent locational variables: The survey asked subsidiariesto indicate the level of importance in the following locational fac-tors for their innovation in technology and engineering process:
1. Exploitation of US market2. Collection of market intelligence3. Conduction of applied research4. Share of R&D personnel5. Develop and design new technology
The Cronbach alpha’s score was 0.75 for locational variablesindicating internal consistency.
Table 1Study variables and measurement.
Variables Survey question Survey measurementa
Dependent Variables:(1) New Process Innovations(2) New Product Innovations
Since locating in the US, has the number of (i) new products,(ii) new technology & engineering processes increased for yourUS company
1 ¼ did not increase at all7 ¼ increased significantly
(3) Cluster Firmb e 1 ¼ Subsidiary process innovation in cluster0 ¼ Subsidiary process innovation outside cluster
(4) Total Sales Over the last 10 years, what has been your US company’s annual salesgrowth (%)?
Categorical
Independent Variables:Control Variables(1) Hi-Techc Which of the following best describes your industry group in the US? 1 ¼ Hi-Tech
0 ¼ Not Hi-Tech(2) Aged e e
(3) Size What percentage of your worldwide sales currently occurs in the US? Categorical(4) Keiretsu Is this US company part of a Japanese keiretsu 1 ¼ Yes
0 ¼ No(5) Autonomy Has your US company’s autonomy from HQ increased since it was
established?1 ¼ did not increase at all7 ¼ increased significantly
Location Variables:(1) R&D personnel Share of R&D personnel in total employment Categorical(2) Exploit US market(3) Collect market intelligence(4) Develop and design new technology(5) Pursue applied research
How important are the following reasons for locating this companyin the US?
1 ¼ not significant at all7 ¼ highly significant
a Ordinal data collected using a Likert scale 1 to 7.b Variable developed using Kulldorff Spatial Scan Statistic.c The authors categorized survey response into high and low technology industry segments.d Obtained from 2002 Directory of Japanese Affiliated Companies in the US and Canada.
J.P.H. Poon et al. / Applied Geography 44 (2013) 33e4236
Control variables: In addition to the above locational factors,subsidiary innovation varies depending on the sector, firm size,length of cluster embeddedness or age, industrial organization, andfreedom from headquarter to pursue new technology. These willserve as control variables.
1. Sector.Given the focus of our study, we expect that subsidiariesin relatively technology-intensive industries such as automo-bile, electronics, pharmaceutical, semiconductor, machineryand information technology are more likely to undertake pro-cess innovation.
2. Age and size. Huergo and Jaumandreu (2004) show that theprobability of innovation decreases when firm size is smallerbut younger new entrants exhibit the highest probability ofinnovation. On the other hand, Frost (2001) shows that largerand older firms are more likely to be part of a technologicalcenter of excellence. Size is measured in terms of the share ofUS sales in worldwide sales1 and age is calculated from thefirm’s year of establishment in the US.
3. Subsidiary autonomy. The nature of parent-subsidiary controllies at the heart of the international business literature’sattention on geography. Location away from parent companiesand the ability to embed into host clusters increase the sub-sidiary’s ability to build competency through external sourcingof knowledge. Here, firms were asked if their autonomy fromHQ had increased since they relocated to the US.
4. Keiretsu. This organizational factor is included as a controlvariable because keiretsus are among Japan’s most internation-alized and technologically progressive firms. They are also saidto out-perform their smaller counterparts (Branstetter, 2000). Inthe survey, we asked the subsidiaries to indicate if they werepart of a keiretsu.
1 Firm sales instead of employment are used as studies have shown that employ-ment measures of firm size are sensitive to firm age (Segarra & Teruel, 2012).
Spatial statisticsKulldorff’s spatial scan statistic. To test H1, we used the spatial
scan statistic (Kulldorff, Gherman, Williams, & Defrancesco, 1998)to locate clusters of firms with higher than expected increases innew product or process innovations. The spatial scan statisticcenters a circular moving window of varying size on subsidiarylocations geocoded at the zip-code level as well as urban centers. Ateach centroid the circular window varies in size from a radius ofzero up to a containment limit of one-half the study area’s totalpopulation. For all window sizes at all centroids, the method tests anull hypothesis of no difference between the observed and ex-pected counts inside and outside the window by calculating alikelihood ratio using those counts. Under the assumption thatinnovations adhere to a Bernoulli model, the likelihood ratio for aspecific window is proportional to:
�cn
�n�n� cn
�n�c�C� cN� n
�C�c�ðN� nÞ � ðC� cÞN� n
�ðN�nÞ�ðC�cÞ(1)
where C is the total number of cases, c is the observed number ofcases in a given study window, N is the total number of in-novations in the study area, and n is the observed number of in-novations contained in a given scanning window. The likelihoodfunctions for the ordinal and normal models also used in thispaper are more complicated due to the complex nature of theirdata. Jung, Kulldorff, and Klassen (2007) and Kuldorff et al. (2009)provide likelihood functions for these models. Further discussionis provided in the results section.
The method then selects the maximum calculated likelihoodacross all windows tested. The firms contained within that scan-ning window are the identified most likely cluster of innovators.P-values to assess the significance of each likelihood ratio are thengenerated using a Monte Carlo simulation procedure. Likelihoodratios calculated from the survey sample are compared to thoseidentified during 999 simulations of a true null hypothesis.
J.P.H. Poon et al. / Applied Geography 44 (2013) 33e42 37
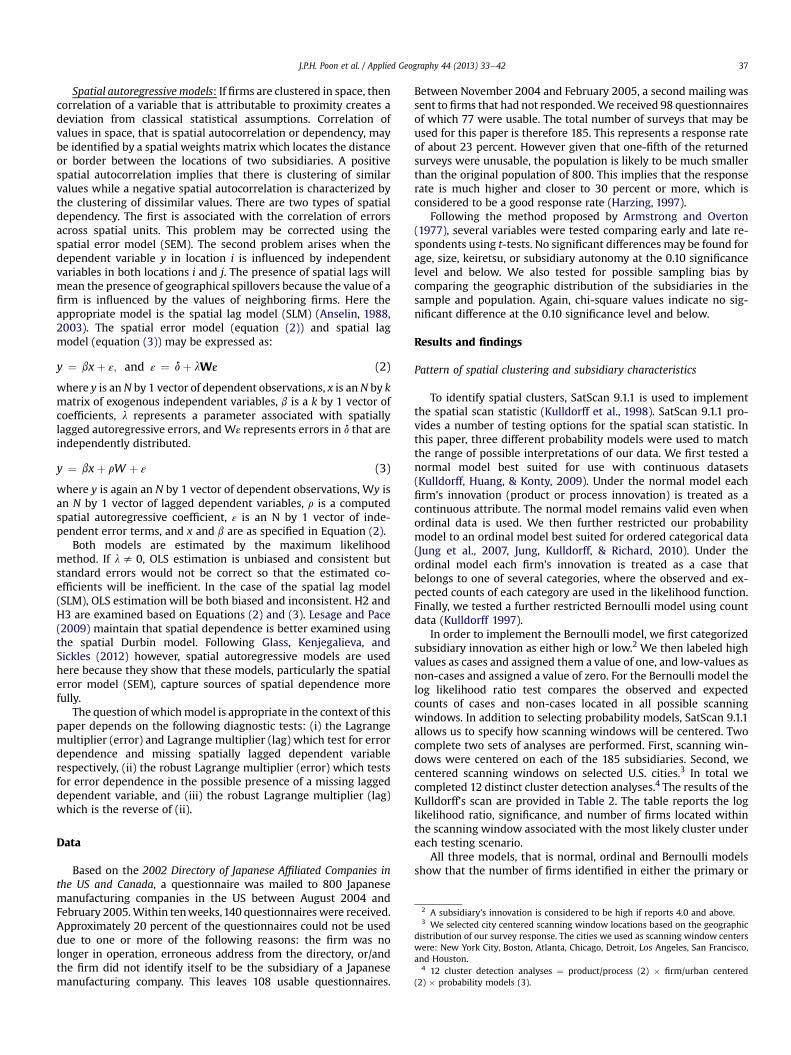
Spatial autoregressive models: If firms are clustered in space, thencorrelation of a variable that is attributable to proximity creates adeviation from classical statistical assumptions. Correlation ofvalues in space, that is spatial autocorrelation or dependency, maybe identified by a spatial weights matrix which locates the distanceor border between the locations of two subsidiaries. A positivespatial autocorrelation implies that there is clustering of similarvalues while a negative spatial autocorrelation is characterized bythe clustering of dissimilar values. There are two types of spatialdependency. The first is associated with the correlation of errorsacross spatial units. This problem may be corrected using thespatial error model (SEM). The second problem arises when thedependent variable y in location i is influenced by independentvariables in both locations i and j. The presence of spatial lags willmean the presence of geographical spillovers because the value of afirm is influenced by the values of neighboring firms. Here theappropriate model is the spatial lag model (SLM) (Anselin, 1988,2003). The spatial error model (equation (2)) and spatial lagmodel (equation (3)) may be expressed as:
y ¼ bxþ ε; and ε ¼ dþ lWε (2)
where y is an N by 1 vector of dependent observations, x is an N by kmatrix of exogenous independent variables, b is a k by 1 vector ofcoefficients, l represents a parameter associated with spatiallylagged autoregressive errors, and Wε represents errors in d that areindependently distributed.
y ¼ bxþ rW þ ε (3)
where y is again an N by 1 vector of dependent observations, Wy isan N by 1 vector of lagged dependent variables, r is a computedspatial autoregressive coefficient, ε is an N by 1 vector of inde-pendent error terms, and x and b are as specified in Equation (2).
Both models are estimated by the maximum likelihoodmethod. If ls 0, OLS estimation is unbiased and consistent butstandard errors would not be correct so that the estimated co-efficients will be inefficient. In the case of the spatial lag model(SLM), OLS estimation will be both biased and inconsistent. H2 andH3 are examined based on Equations (2) and (3). Lesage and Pace(2009) maintain that spatial dependence is better examined usingthe spatial Durbin model. Following Glass, Kenjegalieva, andSickles (2012) however, spatial autoregressive models are usedhere because they show that these models, particularly the spatialerror model (SEM), capture sources of spatial dependence morefully.
The question of whichmodel is appropriate in the context of thispaper depends on the following diagnostic tests: (i) the Lagrangemultiplier (error) and Lagrange multiplier (lag) which test for errordependence and missing spatially lagged dependent variablerespectively, (ii) the robust Lagrange multiplier (error) which testsfor error dependence in the possible presence of a missing laggeddependent variable, and (iii) the robust Lagrange multiplier (lag)which is the reverse of (ii).
2 A subsidiary’s innovation is considered to be high if reports 4.0 and above.3 We selected city centered scanning window locations based on the geographic
distribution of our survey response. The cities we used as scanning window centerswere: New York City, Boston, Atlanta, Chicago, Detroit, Los Angeles, San Francisco,and Houston.
4 12 cluster detection analyses ¼ product/process (2) � firm/urban centered(2) � probability models (3).
Data
Based on the 2002 Directory of Japanese Affiliated Companies inthe US and Canada, a questionnaire was mailed to 800 Japanesemanufacturing companies in the US between August 2004 andFebruary 2005.Within tenweeks,140 questionnaireswere received.Approximately 20 percent of the questionnaires could not be useddue to one or more of the following reasons: the firm was nolonger in operation, erroneous address from the directory, or/andthe firm did not identify itself to be the subsidiary of a Japanesemanufacturing company. This leaves 108 usable questionnaires.
Between November 2004 and February 2005, a second mailing wassent to firms that had not responded.We received 98 questionnairesof which 77 were usable. The total number of surveys that may beused for this paper is therefore 185. This represents a response rateof about 23 percent. However given that one-fifth of the returnedsurveys were unusable, the population is likely to be much smallerthan the original population of 800. This implies that the responserate is much higher and closer to 30 percent or more, which isconsidered to be a good response rate (Harzing, 1997).
Following the method proposed by Armstrong and Overton(1977), several variables were tested comparing early and late re-spondents using t-tests. No significant differences may be found forage, size, keiretsu, or subsidiary autonomy at the 0.10 significancelevel and below. We also tested for possible sampling bias bycomparing the geographic distribution of the subsidiaries in thesample and population. Again, chi-square values indicate no sig-nificant difference at the 0.10 significance level and below.
Results and findings
Pattern of spatial clustering and subsidiary characteristics
To identify spatial clusters, SatScan 9.1.1 is used to implementthe spatial scan statistic (Kulldorff et al., 1998). SatScan 9.1.1 pro-vides a number of testing options for the spatial scan statistic. Inthis paper, three different probability models were used to matchthe range of possible interpretations of our data. We first tested anormal model best suited for use with continuous datasets(Kulldorff, Huang, & Konty, 2009). Under the normal model eachfirm’s innovation (product or process innovation) is treated as acontinuous attribute. The normal model remains valid even whenordinal data is used. We then further restricted our probabilitymodel to an ordinal model best suited for ordered categorical data(Jung et al., 2007, Jung, Kulldorff, & Richard, 2010). Under theordinal model each firm’s innovation is treated as a case thatbelongs to one of several categories, where the observed and ex-pected counts of each category are used in the likelihood function.Finally, we tested a further restricted Bernoulli model using countdata (Kulldorff 1997).
In order to implement the Bernoulli model, we first categorizedsubsidiary innovation as either high or low.2 We then labeled highvalues as cases and assigned them a value of one, and low-values asnon-cases and assigned a value of zero. For the Bernoulli model thelog likelihood ratio test compares the observed and expectedcounts of cases and non-cases located in all possible scanningwindows. In addition to selecting probability models, SatScan 9.1.1allows us to specify how scanning windows will be centered. Twocomplete two sets of analyses are performed. First, scanning win-dows were centered on each of the 185 subsidiaries. Second, wecentered scanning windows on selected U.S. cities.3 In total wecompleted 12 distinct cluster detection analyses.4 The results of theKulldorff’s scan are provided in Table 2. The table reports the loglikelihood ratio, significance, and number of firms located withinthe scanning window associated with the most likely cluster undereach testing scenario.
All three models, that is normal, ordinal and Bernoulli modelsshow that the number of firms identified in either the primary or
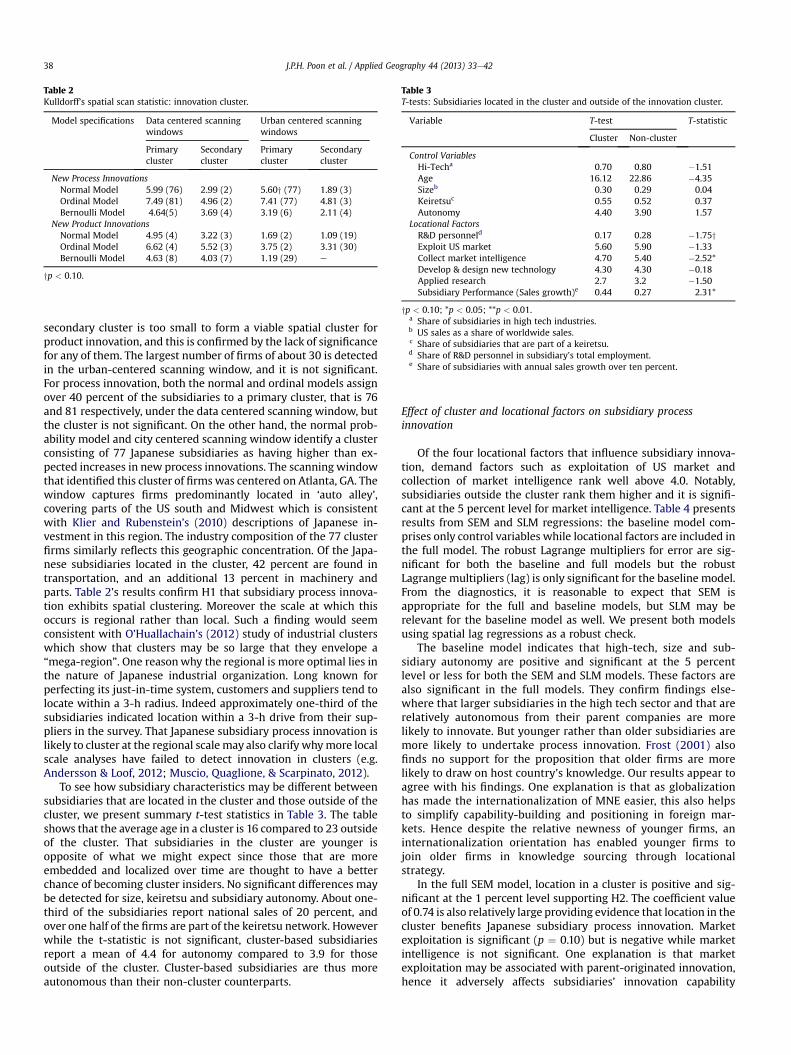
Table 3T-tests: Subsidiaries located in the cluster and outside of the innovation cluster.
Variable T-test T-statistic
Cluster Non-cluster
Control VariablesHi-Techa 0.70 0.80 �1.51Age 16.12 22.86 �4.35Sizeb 0.30 0.29 0.04Keiretsuc 0.55 0.52 0.37Autonomy 4.40 3.90 1.57
Locational FactorsR&D personneld 0.17 0.28 �1.75yExploit US market 5.60 5.90 �1.33Collect market intelligence 4.70 5.40 �2.52*Develop & design new technology 4.30 4.30 �0.18Applied research 2.7 3.2 �1.50Subsidiary Performance (Sales growth)e 0.44 0.27 2.31*
yp < 0.10; *p < 0.05; **p < 0.01.a Share of subsidiaries in high tech industries.b US sales as a share of worldwide sales.c Share of subsidiaries that are part of a keiretsu.d Share of R&D personnel in subsidiary’s total employment.e Share of subsidiaries with annual sales growth over ten percent.
Table 2Kulldorff’s spatial scan statistic: innovation cluster.
Model specifications Data centered scanningwindows
Urban centered scanningwindows
Primarycluster
Secondarycluster
Primarycluster
Secondarycluster
New Process InnovationsNormal Model 5.99 (76) 2.99 (2) 5.60y (77) 1.89 (3)Ordinal Model 7.49 (81) 4.96 (2) 7.41 (77) 4.81 (3)Bernoulli Model 4.64(5) 3.69 (4) 3.19 (6) 2.11 (4)
New Product InnovationsNormal Model 4.95 (4) 3.22 (3) 1.69 (2) 1.09 (19)Ordinal Model 6.62 (4) 5.52 (3) 3.75 (2) 3.31 (30)Bernoulli Model 4.63 (8) 4.03 (7) 1.19 (29) e
yp < 0.10.
J.P.H. Poon et al. / Applied Geography 44 (2013) 33e4238
secondary cluster is too small to form a viable spatial cluster forproduct innovation, and this is confirmed by the lack of significancefor any of them. The largest number of firms of about 30 is detectedin the urban-centered scanning window, and it is not significant.For process innovation, both the normal and ordinal models assignover 40 percent of the subsidiaries to a primary cluster, that is 76and 81 respectively, under the data centered scanning window, butthe cluster is not significant. On the other hand, the normal prob-ability model and city centered scanning window identify a clusterconsisting of 77 Japanese subsidiaries as having higher than ex-pected increases in new process innovations. The scanning windowthat identified this cluster of firms was centered on Atlanta, GA. Thewindow captures firms predominantly located in ‘auto alley’,covering parts of the US south and Midwest which is consistentwith Klier and Rubenstein’s (2010) descriptions of Japanese in-vestment in this region. The industry composition of the 77 clusterfirms similarly reflects this geographic concentration. Of the Japa-nese subsidiaries located in the cluster, 42 percent are found intransportation, and an additional 13 percent in machinery andparts. Table 2’s results confirm H1 that subsidiary process innova-tion exhibits spatial clustering. Moreover the scale at which thisoccurs is regional rather than local. Such a finding would seemconsistent with O’Huallachain’s (2012) study of industrial clusterswhich show that clusters may be so large that they envelope a“mega-region”. One reasonwhy the regional is more optimal lies inthe nature of Japanese industrial organization. Long known forperfecting its just-in-time system, customers and suppliers tend tolocate within a 3-h radius. Indeed approximately one-third of thesubsidiaries indicated location within a 3-h drive from their sup-pliers in the survey. That Japanese subsidiary process innovation islikely to cluster at the regional scale may also clarify whymore localscale analyses have failed to detect innovation in clusters (e.g.Andersson & Loof, 2012; Muscio, Quaglione, & Scarpinato, 2012).
To see how subsidiary characteristics may be different betweensubsidiaries that are located in the cluster and those outside of thecluster, we present summary t-test statistics in Table 3. The tableshows that the average age in a cluster is 16 compared to 23 outsideof the cluster. That subsidiaries in the cluster are younger isopposite of what we might expect since those that are moreembedded and localized over time are thought to have a betterchance of becoming cluster insiders. No significant differences maybe detected for size, keiretsu and subsidiary autonomy. About one-third of the subsidiaries report national sales of 20 percent, andover one half of the firms are part of the keiretsu network. Howeverwhile the t-statistic is not significant, cluster-based subsidiariesreport a mean of 4.4 for autonomy compared to 3.9 for thoseoutside of the cluster. Cluster-based subsidiaries are thus moreautonomous than their non-cluster counterparts.
Effect of cluster and locational factors on subsidiary processinnovation
Of the four locational factors that influence subsidiary innova-tion, demand factors such as exploitation of US market andcollection of market intelligence rank well above 4.0. Notably,subsidiaries outside the cluster rank them higher and it is signifi-cant at the 5 percent level for market intelligence. Table 4 presentsresults from SEM and SLM regressions: the baseline model com-prises only control variables while locational factors are included inthe full model. The robust Lagrange multipliers for error are sig-nificant for both the baseline and full models but the robustLagrange multipliers (lag) is only significant for the baseline model.From the diagnostics, it is reasonable to expect that SEM isappropriate for the full and baseline models, but SLM may berelevant for the baseline model as well. We present both modelsusing spatial lag regressions as a robust check.
The baseline model indicates that high-tech, size and sub-sidiary autonomy are positive and significant at the 5 percentlevel or less for both the SEM and SLM models. These factors arealso significant in the full models. They confirm findings else-where that larger subsidiaries in the high tech sector and that arerelatively autonomous from their parent companies are morelikely to innovate. But younger rather than older subsidiaries aremore likely to undertake process innovation. Frost (2001) alsofinds no support for the proposition that older firms are morelikely to draw on host country’s knowledge. Our results appear toagree with his findings. One explanation is that as globalizationhas made the internationalization of MNE easier, this also helpsto simplify capability-building and positioning in foreign mar-kets. Hence despite the relative newness of younger firms, aninternationalization orientation has enabled younger firms tojoin older firms in knowledge sourcing through locationalstrategy.
In the full SEM model, location in a cluster is positive and sig-nificant at the 1 percent level supporting H2. The coefficient valueof 0.74 is also relatively large providing evidence that location in thecluster benefits Japanese subsidiary process innovation. Marketexploitation is significant (p ¼ 0.10) but is negative while marketintelligence is not significant. One explanation is that marketexploitation may be associated with parent-originated innovation,hence it adversely affects subsidiaries’ innovation capability
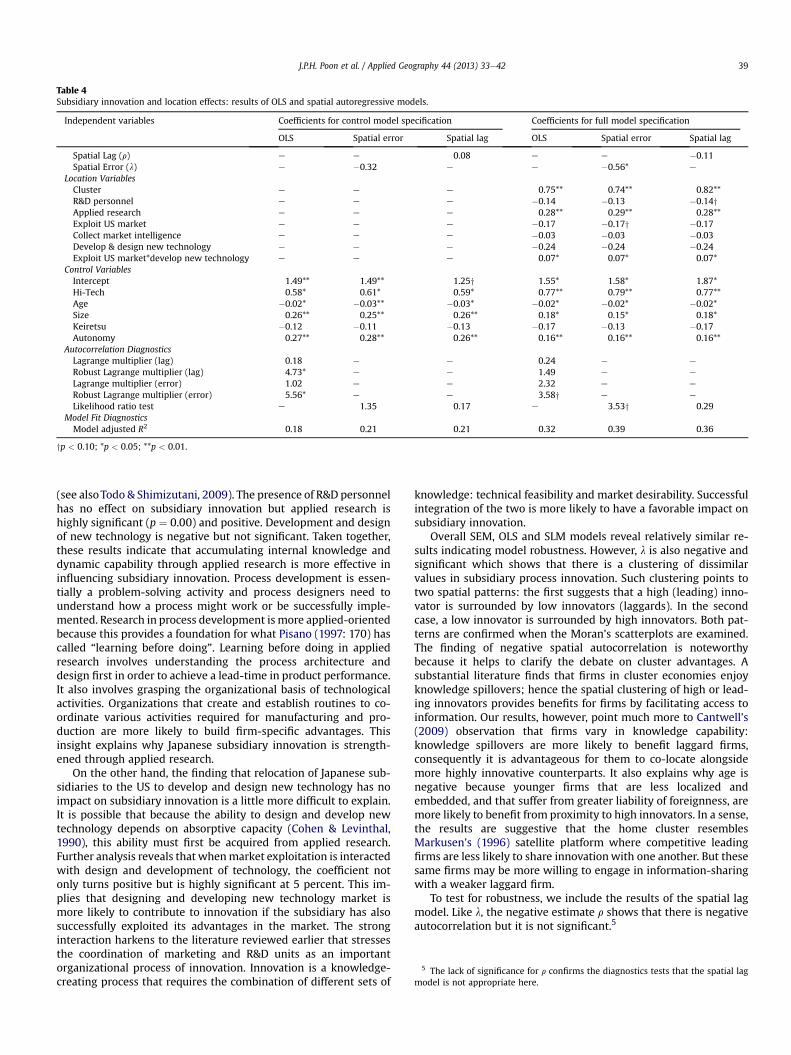
Table 4Subsidiary innovation and location effects: results of OLS and spatial autoregressive models.
Independent variables Coefficients for control model specification Coefficients for full model specification
OLS Spatial error Spatial lag OLS Spatial error Spatial lag
Spatial Lag (r) e e 0.08 e e �0.11Spatial Error (l) e �0.32 e e �0.56* e
Location VariablesCluster e e e 0.75** 0.74** 0.82**R&D personnel e e e �0.14 �0.13 �0.14yApplied research e e e 0.28** 0.29** 0.28**Exploit US market e e e �0.17 �0.17y �0.17Collect market intelligence e e e �0.03 �0.03 �0.03Develop & design new technology e e e �0.24 �0.24 �0.24Exploit US market*develop new technology e e e 0.07* 0.07* 0.07*
Control VariablesIntercept 1.49** 1.49** 1.25y 1.55* 1.58* 1.87*Hi-Tech 0.58* 0.61* 0.59* 0.77** 0.79** 0.77**Age �0.02* �0.03** �0.03* �0.02* �0.02* �0.02*Size 0.26** 0.25** 0.26** 0.18* 0.15* 0.18*Keiretsu �0.12 �0.11 �0.13 �0.17 �0.13 �0.17Autonomy 0.27** 0.28** 0.26** 0.16** 0.16** 0.16**
Autocorrelation DiagnosticsLagrange multiplier (lag) 0.18 e e 0.24 e e
Robust Lagrange multiplier (lag) 4.73* e e 1.49 e e
Lagrange multiplier (error) 1.02 e e 2.32 e e
Robust Lagrange multiplier (error) 5.56* e e 3.58y e e
Likelihood ratio test e 1.35 0.17 e 3.53y 0.29Model Fit DiagnosticsModel adjusted R2 0.18 0.21 0.21 0.32 0.39 0.36
yp < 0.10; *p < 0.05; **p < 0.01.
5 The lack of significance for r confirms the diagnostics tests that the spatial lagmodel is not appropriate here.
J.P.H. Poon et al. / Applied Geography 44 (2013) 33e42 39
(see alsoTodo & Shimizutani, 2009). The presence of R&D personnelhas no effect on subsidiary innovation but applied research ishighly significant (p ¼ 0.00) and positive. Development and designof new technology is negative but not significant. Taken together,these results indicate that accumulating internal knowledge anddynamic capability through applied research is more effective ininfluencing subsidiary innovation. Process development is essen-tially a problem-solving activity and process designers need tounderstand how a process might work or be successfully imple-mented. Research in process development is more applied-orientedbecause this provides a foundation for what Pisano (1997: 170) hascalled “learning before doing”. Learning before doing in appliedresearch involves understanding the process architecture anddesign first in order to achieve a lead-time in product performance.It also involves grasping the organizational basis of technologicalactivities. Organizations that create and establish routines to co-ordinate various activities required for manufacturing and pro-duction are more likely to build firm-specific advantages. Thisinsight explains why Japanese subsidiary innovation is strength-ened through applied research.
On the other hand, the finding that relocation of Japanese sub-sidiaries to the US to develop and design new technology has noimpact on subsidiary innovation is a little more difficult to explain.It is possible that because the ability to design and develop newtechnology depends on absorptive capacity (Cohen & Levinthal,1990), this ability must first be acquired from applied research.Further analysis reveals that whenmarket exploitation is interactedwith design and development of technology, the coefficient notonly turns positive but is highly significant at 5 percent. This im-plies that designing and developing new technology market ismore likely to contribute to innovation if the subsidiary has alsosuccessfully exploited its advantages in the market. The stronginteraction harkens to the literature reviewed earlier that stressesthe coordination of marketing and R&D units as an importantorganizational process of innovation. Innovation is a knowledge-creating process that requires the combination of different sets of
knowledge: technical feasibility and market desirability. Successfulintegration of the two is more likely to have a favorable impact onsubsidiary innovation.
Overall SEM, OLS and SLM models reveal relatively similar re-sults indicating model robustness. However, l is also negative andsignificant which shows that there is a clustering of dissimilarvalues in subsidiary process innovation. Such clustering points totwo spatial patterns: the first suggests that a high (leading) inno-vator is surrounded by low innovators (laggards). In the secondcase, a low innovator is surrounded by high innovators. Both pat-terns are confirmed when the Moran’s scatterplots are examined.The finding of negative spatial autocorrelation is noteworthybecause it helps to clarify the debate on cluster advantages. Asubstantial literature finds that firms in cluster economies enjoyknowledge spillovers; hence the spatial clustering of high or lead-ing innovators provides benefits for firms by facilitating access toinformation. Our results, however, point much more to Cantwell’s(2009) observation that firms vary in knowledge capability:knowledge spillovers are more likely to benefit laggard firms,consequently it is advantageous for them to co-locate alongsidemore highly innovative counterparts. It also explains why age isnegative because younger firms that are less localized andembedded, and that suffer from greater liability of foreignness, aremore likely to benefit from proximity to high innovators. In a sense,the results are suggestive that the home cluster resemblesMarkusen’s (1996) satellite platform where competitive leadingfirms are less likely to share innovationwith one another. But thesesame firms may be more willing to engage in information-sharingwith a weaker laggard firm.
To test for robustness, we include the results of the spatial lagmodel. Like l, the negative estimate r shows that there is negativeautocorrelation but it is not significant.5
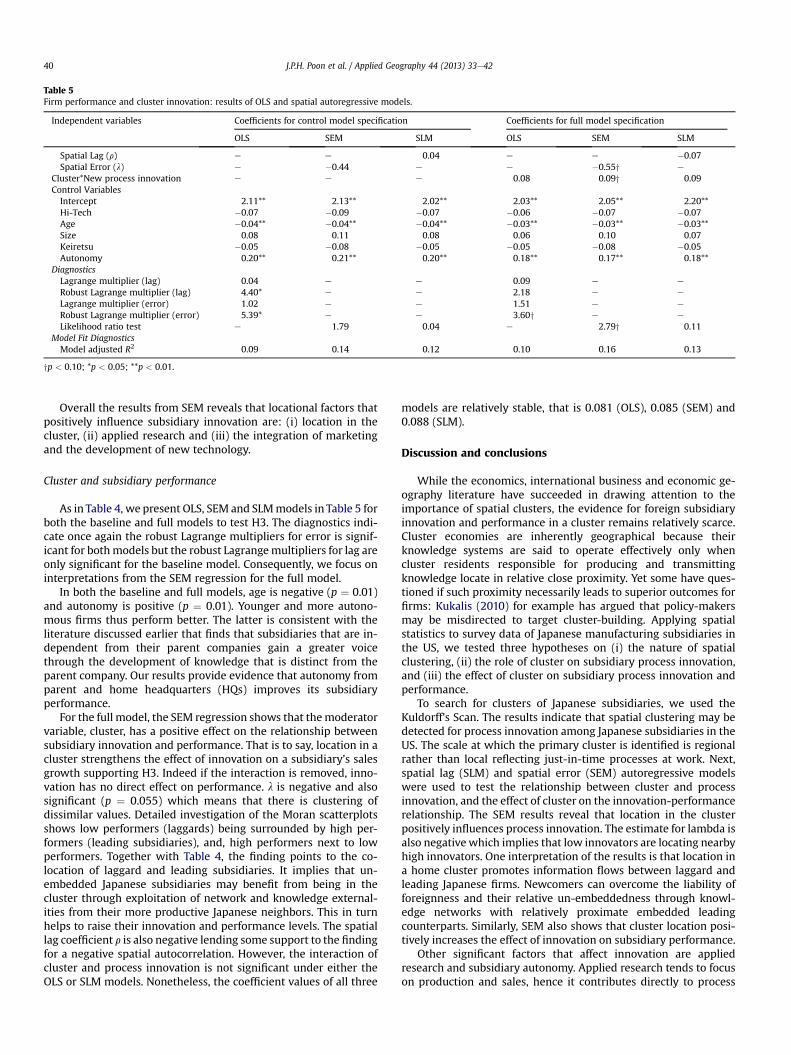
Table 5Firm performance and cluster innovation: results of OLS and spatial autoregressive models.
Independent variables Coefficients for control model specification Coefficients for full model specification
OLS SEM SLM OLS SEM SLM
Spatial Lag (r) e e 0.04 e e �0.07Spatial Error (l) e �0.44 e e �0.55y e
Cluster*New process innovation e e e 0.08 0.09y 0.09Control VariablesIntercept 2.11** 2.13** 2.02** 2.03** 2.05** 2.20**Hi-Tech �0.07 �0.09 �0.07 �0.06 �0.07 �0.07Age �0.04** �0.04** �0.04** �0.03** �0.03** �0.03**Size 0.08 0.11 0.08 0.06 0.10 0.07Keiretsu �0.05 �0.08 �0.05 �0.05 �0.08 �0.05Autonomy 0.20** 0.21** 0.20** 0.18** 0.17** 0.18**
DiagnosticsLagrange multiplier (lag) 0.04 e e 0.09 e e
Robust Lagrange multiplier (lag) 4.40* e e 2.18 e e
Lagrange multiplier (error) 1.02 e e 1.51 e e
Robust Lagrange multiplier (error) 5.39* e e 3.60y e e
Likelihood ratio test e 1.79 0.04 e 2.79y 0.11Model Fit DiagnosticsModel adjusted R2 0.09 0.14 0.12 0.10 0.16 0.13
yp < 0.10; *p < 0.05; **p < 0.01.
J.P.H. Poon et al. / Applied Geography 44 (2013) 33e4240
Overall the results from SEM reveals that locational factors thatpositively influence subsidiary innovation are: (i) location in thecluster, (ii) applied research and (iii) the integration of marketingand the development of new technology.
Cluster and subsidiary performance
As in Table 4, we present OLS, SEM and SLMmodels in Table 5 forboth the baseline and full models to test H3. The diagnostics indi-cate once again the robust Lagrange multipliers for error is signif-icant for bothmodels but the robust Lagrangemultipliers for lag areonly significant for the baseline model. Consequently, we focus oninterpretations from the SEM regression for the full model.
In both the baseline and full models, age is negative (p ¼ 0.01)and autonomy is positive (p ¼ 0.01). Younger and more autono-mous firms thus perform better. The latter is consistent with theliterature discussed earlier that finds that subsidiaries that are in-dependent from their parent companies gain a greater voicethrough the development of knowledge that is distinct from theparent company. Our results provide evidence that autonomy fromparent and home headquarters (HQs) improves its subsidiaryperformance.
For the full model, the SEM regression shows that themoderatorvariable, cluster, has a positive effect on the relationship betweensubsidiary innovation and performance. That is to say, location in acluster strengthens the effect of innovation on a subsidiary’s salesgrowth supporting H3. Indeed if the interaction is removed, inno-vation has no direct effect on performance. l is negative and alsosignificant (p ¼ 0.055) which means that there is clustering ofdissimilar values. Detailed investigation of the Moran scatterplotsshows low performers (laggards) being surrounded by high per-formers (leading subsidiaries), and, high performers next to lowperformers. Together with Table 4, the finding points to the co-location of laggard and leading subsidiaries. It implies that un-embedded Japanese subsidiaries may benefit from being in thecluster through exploitation of network and knowledge external-ities from their more productive Japanese neighbors. This in turnhelps to raise their innovation and performance levels. The spatiallag coefficient r is also negative lending some support to the findingfor a negative spatial autocorrelation. However, the interaction ofcluster and process innovation is not significant under either theOLS or SLM models. Nonetheless, the coefficient values of all three
models are relatively stable, that is 0.081 (OLS), 0.085 (SEM) and0.088 (SLM).
Discussion and conclusions
While the economics, international business and economic ge-ography literature have succeeded in drawing attention to theimportance of spatial clusters, the evidence for foreign subsidiaryinnovation and performance in a cluster remains relatively scarce.Cluster economies are inherently geographical because theirknowledge systems are said to operate effectively only whencluster residents responsible for producing and transmittingknowledge locate in relative close proximity. Yet some have ques-tioned if such proximity necessarily leads to superior outcomes forfirms: Kukalis (2010) for example has argued that policy-makersmay be misdirected to target cluster-building. Applying spatialstatistics to survey data of Japanese manufacturing subsidiaries inthe US, we tested three hypotheses on (i) the nature of spatialclustering, (ii) the role of cluster on subsidiary process innovation,and (iii) the effect of cluster on subsidiary process innovation andperformance.
To search for clusters of Japanese subsidiaries, we used theKuldorff’s Scan. The results indicate that spatial clustering may bedetected for process innovation among Japanese subsidiaries in theUS. The scale at which the primary cluster is identified is regionalrather than local reflecting just-in-time processes at work. Next,spatial lag (SLM) and spatial error (SEM) autoregressive modelswere used to test the relationship between cluster and processinnovation, and the effect of cluster on the innovation-performancerelationship. The SEM results reveal that location in the clusterpositively influences process innovation. The estimate for lambda isalso negative which implies that low innovators are locating nearbyhigh innovators. One interpretation of the results is that location ina home cluster promotes information flows between laggard andleading Japanese firms. Newcomers can overcome the liability offoreignness and their relative un-embeddedness through knowl-edge networks with relatively proximate embedded leadingcounterparts. Similarly, SEM also shows that cluster location posi-tively increases the effect of innovation on subsidiary performance.
Other significant factors that affect innovation are appliedresearch and subsidiary autonomy. Applied research tends to focuson production and sales, hence it contributes directly to process
J.P.H. Poon et al. / Applied Geography 44 (2013) 33e42 41
innovation. Independence from parent firms or HQs facilitates thebuilding of local dynamic capability and therefore increases asubsidiary’s ability to pursue innovation. Market exploitation isnegative and development of new technology has no effect. Butinteraction between the two variables suggests that developingnew technology will contribute to innovation if the subsidiary hasalso successfully exploited the market.
Overall, applications of Kuldorff’s Scan and spatial autore-gressive models shed light in the following ways. First cluster ad-vantages of foreign subsidiaries are manifested at the regionalscale. Location in a home cluster enhances both innovation andperformance levels. Second, cluster environment is heterogenous:it is not only home to innovative and high performing subsidiaries,but also hosts subsidiaries that operate more standardized inno-vation processes. Co-location of both types of firms may encouragetechnological catch-up in the latter.
Acknowledgements
This paper has benefited from funding from the National ScienceFoundation (award BCS-0137045). We thank two referees and theeditor for their insightful comments on an earlier draft.
References
Andersson, M., & Loof, H. (2012). Small business innovation: firm level evidencefrom Sweden. Journal of Technology Transfer, 37(5), 732e754.
Anselin, L. (1988). Spatial econometrics: Methods and models. Dordrecht: KluwerAcademic Publishers.
Anselin, L. (2003). Spatial externalities, spatial multuipliers, and spatial econo-metrics. International Regional Science Review, 26(2), 155e166.
Armstrong, T., & Overton, J. (1977). Estimating nonresponse bias in mail surveys.Journal of Marketing Research, 14(3), 396e402.
Autant-Bernard, C., & LeSage, J. (2011). Quantifying knowledge spillovers usingspatial econometric models. Journal of Regional Science, 51(3), 471e496.
Baptista, R., & Swann, P. (1998). Do firms in clusters innovate more? Research Policy,27(5), 525e540.
Bhoovaraghavan, S., Vasudevan, A., & Chandran, R. (1996). Resolving the process vs.product innovation dilemma: a consumer choice theoretic approach. Manage-ment Science, 42(2), 232e246.
Birkinshaw, J., & Hood, N. (2000). Characteristics of foreign subsidiaries in industryclusters. Journal of International Business Studies, 31(1), 141e154.
Brachert, M., Titze, M., & Kubis, A. (2011). Identifying clusters from a multidimen-sional perspective: methodological aspects with an application to Germany.Papers in Regional Science, 90(2), 419e440.
Branstetter, L. (2000). Vertical Keiretsu and knowledge spillovers in Japanesemanufacturing: an empirical assessment. Journal of the Japanese and Interna-tional Economics, 14, 73e104.
Breschi, S., & Malerba, F. (2001). The geography of innovation and economic clus-tering. Industrial and Corporate Change, 10(4), 817e833.
Callois, J. M. (2008). The two sides of proximity in industrial clusters: the trade-off between process and product innovation. Journal of Urban Economics, 63,146e162.
Cantwell, J. (2009). Location and the multinational enterprise. Journal of Interna-tional Business Studies, 40(1), 35e41.
Cantwell, J., & Mudambi, R. (2005). MNE competence-creating subsidiary mandates.Strategic Management Journal, 26(12), 1109e1128.
Christopherson, S., & Clark, J. (2007). Power in firm networks: what it means forregional innovation systems. Regional Studies, 41(9), 1223e1236.
Cohen, W., & Levinthal, D. (1990). Absorptive capacity: a new perspective onlearning and innovation. Administrative Science Quarterly, 35(1), 128e152.
Corrado, L., Martin, R., & Weeks, M. (2005). Identifying and interpreting regionalconvergence across Europe. The Economic Journal, 115, C133eC160.
Dyer, J., & Singh, H. (1998). The relational view: cooperative strategy and interor-ganizational competitive advantage. Academy of Management Review, 23(4),660e679.
Edgington, D., & Hayer, R. (2013). ‘Glocalization’ and regional headquarters: Japa-nese electronics firms in the ASEASN region. Annals of the Association ofAmerican Geographers, 103(3), 647e668.
Eriksson, R. (2011). Localized spillovers and knowledge flows: how does proximityinfluence the performance of plants? Economic Geography, 87(2), 127e152.
Feser, E., Sweeny, S., & Renski, H. (2005). A descriptive analysis of discrete U.S. industrialcomplexes. Journal of Regional Science, 45(2), 395e419.
Florida, R. (2002). The rise of the creative class. New York: Basic Books.Frost, T. (2001). The geographic sources of foreign subsidiaries’ innovations. Strategic
Management Journal, 22, 101e123.
Frost, T., Birkinshaw, J., & Prescott, C. (2002). Centers of excellence in multinationalcorporations. Strategic Management Journal, 23, 997e1018.
Glass, A., Kenjegalieva, K., & Sickles, R. (2012). The economic case for the spatial errormodel with an application to state vehicle usage in the U.S. Department of Economics.Rice University.
Gordon, I. R., & McCann, P. (2005). Innovation, agglomeration, and regional devel-opment. Journal of Economic Geography, 5, 523e545.
Harzing, A. (1997). Response rates in internationalmail surveys: results of a 22-countrystudy. International Business Review, 6(6), 641e665.
Huergo, E., & Jaumandreu, J. (2004). How does probability of innovation changewith firm age? Small Business Economics, 22(3e4), 193e207.
Jung, I., Kulldorff, M., & Klassen, A. (2007). A spatial scan statistic for ordinal data.Statistics in Medicine, 26(7), 1594e1607.
Jung, I., Kulldorff, M., & Richard, O. (2010). A spatial scan statistic for multinomialdata. Statistics in Medicine, 29(18), 1910e1918.
Klier, T., & Rubenstein, J. (2010). The changing geography of North American motorvehicle production. Cambridge Journal of Regions, Economy, and Society, 3(3),335e347.
Kukalis, S. (2010). Agglomeration economies and firm performance: the case ofindustry clusters. Journal of Management, 36(2), 453e481.
Kulldorff, M. (1997). A spatial scan statistic. Communications in Statistics: Theory andMethods, 26(6), 1481e1496.
Kulldorff, M., Gherman, G., Williams, G., & Defrancesco, D. (1998). SatScan v2.1:Software for the spatial and space-time scan statistics. Bethesda MD: NationalCancer Institute.
Kulldorff, M., Huang, L., & Konty, K. (2009). A scan statistic for continuous databased on the normal probability model. International Journal of Health Geo-graphics, 8(58).
Kurosawa, S., Iwata, S., & Roberts, E. (2007). Global R&D activities of Japanese MNCsin the US: a triangulation approach. Research Policy, 36(1), 3e36.
LeSage, J., & Pace, R. (2009). Introduction to spatial econometrics. Boca Raton:Chapman and Hall/CRC.
Markusen, A. (1996). Sticky places in slippery space: a typology of industrial dis-tricts. Economic Geography, 72(3), 293e313.
Martin, R., & Sunley, P. (2003). Deconstructing clusters: chaotic concept or policypanacea? Journal of Economic Geography, 3, 5e35.
Maskell, P. (2001). Towards a knowledge based theory of the geographical cluster.Industrial and Corporate Change, 10(4), 921e943.
Milgrom, P., & Roberts, J. (1990). The economics of modern manufacturing:technology, strategy, and organization. The American Economic Review, 80(3),511e528.
Mudambi, R., & Swift, T. (2012). Multinational enterprises and the geographicclustering of innovation. Industry and Innovation, 19(1), 1e21.
Muscio, A., Quaglione, D., & Scarpinato, M. (2012). The effects of universities’proximity to industrial districts on university-industry collaboration. ChinaEconomic Review, 23(3), 639e650.
Owen-Smith, J., Riccaboni, M., Pammolli, F., & Powell, W. (2002). A comparison of USand European university-industry relations in the life sciences. ManagementScience, 48(1), 24e43.
O’Huallachain, B. (2012). Inventive megaregions of the United States: technologycomposition and location. Economic Geography, 88(2), 165e195.
Parr, J. (2002). Missing elements in the analysis of agglomeration economies. In-ternational Regional Science Review, 25(2), 151e168.
Phene, A., & Almedia, P. (2003). How do firms evolve? The patterns of technologyevolution of semiconductor subsidiaries. International Business Review, 12(3),349e367.
Pisano, G. (1997). The development factory: Unlocking the potential of process innovation.Cambridge (USA): Harvard Business School.
Porter, M. (1998). Clusters and the new economics of competition. Harvard BusinessReview, 76(6), 77e90.
Porter, M. (2000). Location, competition and economic development: local clustersin a global economy. Economic Development Quarterly, 14(1), 15e34.
Porter, M. (2003). The economic performance of regions. Regional Studies, 37(6e7),545e546.
Pouder, J., & St. John, C. (1996). Hotspots and blind spots: geographical clusters offirms and innovation. Academy of Management Review, 21(4), 1192e1225.
Rodriguez-Pose, A., & Comptour, F. (2011). Do clusters generate greater innovation andgrowth? An analysis of European regions. Professional Geographer, 64, 211e231.
Rosenkranz, S. (2003). Simultaneous choices of process and product innovationwhen consumers have a preference for product variety. Journal of EconomicBehavior and Organization, 50(2), 183e201.
Rutherford, T., & Holmes, J. (2007). Entrepreneurship, knowledge, and learning incluster formation and evolution: the Windsor Ontario tool, die, and mouldcluster. International Journal of Entrepreneurship and Innovation Management, 7,320e344.
Segarra, A., & Teruel, M. (2012). An appraisal of firm size distribution: does samplesize matter? Journal of Economic Behavior & Organization, 82(1), 314e328.
Song, J., Asakawa, K., & Chu, Y. (2011). What determines knowledge sourcing fromhost locations of overseas R&D operations? A study of R&D activities of Japa-nese multinationals. Research Policy, 40, 380e390.
Teece, D., Pisano, G., & Shuen, A. (1997). Dynamic capabilities and strategic man-agement. Strategic Management Journal, 18(7), 509e533.
Todo, Y., & Shimizutani, S. (2009). R&D intensity for innovative and adaptive pur-poses in overseas subsidiaries: evidence from Japanese multinational enter-prises. Research in International Business and Finance, 23(5), 31e45.

J.P.H. Poon et al. / Applied Geography 44 (2013) 33e4242
Utterback, J., & Abernathy, W. (1975). A dynamic model of process and productinnovation. Omega, 3(6), 639e656.
Von Hippel, E. (1986). Lead users: a source of novel product concepts. ManagementScience, 32(7), 791e806.
Wei, D., Zhou, Y., Sun, Y., & Lin, G. (2012). Production and R&D networks of foreignventures in China: implications for technological dynamism and regionaldevelopment. Applied Geography, 32(1), 106e118.
Yamin, M., & Andersson, U. (2011). Subsidiary importance in the MNC: what rolesdoes internal embeddedness play? International Business Review, 20(2), 151e162.
Zaheer, S. (1995). Overcoming the liability of foreignness. Academy of ManagementJournal, 38(2), 341e363.
Zhang, P., Wong, D. W., So, B. K. L., & Hui, L. (2012). An exploratory spatial analysisof western medical services in republican Beijing. Applied Geography, 32(2),556e565.
Related Documents