Do ferrets perceive relative pitch? Pingbo Yin, Jonathan B. Fritz, and Shihab A. Shamma Neural Systems Laboratory, Institute for Systems Research, University of Maryland, College Park, Maryland 20742 Received 18 March 2009; revised 13 November 2009; accepted 13 December 2009 The existence of relative pitch perception in animals is difficult to demonstrate, since unlike humans, animals often attend to absolute rather than relative properties of sound elements. However, the results of the present study show that ferrets can be trained using relative pitch to discriminate two-tone sequences rising vs. falling. Three ferrets were trained using a positive-reinforcement paradigm in which sequences of reference one to five repeats and target stimuli were presented, and animals were rewarded only when responding correctly to the target. The training procedure consisted of three training phases that successively shaped the ferrets to attend to relative pitch. In Phase-1 training, animals learned the basic task with sequences of invariant tone-pairs and could use absolute pitch information. During Phase-2 training, in order to emphasize relative cues, absolute pitch was varied each trial within a two-octave frequency range. In Phase-3 training, absolute pitch cues were removed, and only relative cue information was available to solve the task. Two ferrets successfully completed training on all three phases and achieved significant discriminative performance over the trained four-octave frequency range. These results suggest that ferrets can be trained to discern the relative pitch relationship of a sequence of tone-pairs independent of frequency. © 2010 Acoustical Society of America. DOI: 10.1121/1.3290988 PACS numbers: 43.80.Lb, 43.66.Gf MJO Pages: 1673–1680 I. INTRODUCTION A significant amount of information is encoded in the contour patterns rises and falls of the pitch of acoustic sig- nals, such as in speech and music. For example, human sub- jects can easily recognize sentence type on the basis of pitch contour alone in the absence of other information Lade- foged, 1982. The frequency transpositions of a melody are readily recognized by most adult, and even infant, human listeners as the “same” and are perceived as structural equivalents of the original melody Dowling and Fujitani, 1971; Demany and Armand, 1984; Trehub et al., 1984; Tre- hub and Hannon, 2006. Although human listeners can re- member the exact musical intervals of familiar melodies, they appear to remember only the frequency contour of less familiar or novel stimuli Dowling and Fujitani, 1971; Dowl- ing, 1978; Bartlett and Dowling, 1980. Unlike humans, who attend chiefly to the relationships between sound elements, animals more heavily weight the absolute frequency of sound elements in their perceptual decisions and appear to be less attentive to relative pitch changes. Consequently, it has been difficult to train animals to attend to the relative pitch between sound elements, as D’Amato 1988 concluded after extensive behavioral research on monkeys and rats. Most studies conducted with nonhuman species, includ- ing several species of birds Hulse and Cynx, 1985, 1986; Ratcliffe and Weisman, 1986; Dooling et al., 1987; Page et al., 1989; Cynx, 1993; Weisman et al., 2004 and monkeys D’Amato and Salmon, 1984; D’Amato, 1988; Izumi, 2001, 2003; Brosch et al., 2004, 2006, suggest that animals gen- erally encode absolute pitch and have rather limited abilities to recognize the relative pitch contours of tonal stimuli. Songbirds have been shown to learn a relative pitch strategy, recognizing an ordinal rule for tone sequences that rise or fall in frequency regardless of the absolute frequency compo- nents. However, when the sequences were shifted out of the trained frequency range, they lost the discrimination. It then required as many trials to acquire a new discrimination as they needed to learn in the original discrimination Hulse and Cynx, 1985; Cynx, 1993. Furthermore, songbirds failed to learn relative pitch discrimination when the absolute pitch cues were removed from the training Page et al., 1989, indicating the primacy of absolute pitch perception in these species. Although a frequency range constraint was also noted in nonhuman mammals Izumi, 2001, 2003, there are now two studies indicating that some nonhuman mammalian species are capable of relative pitch as measured by octave generalizations—rhesus monkeys Wright et al., 2000 and dolphins Ralston and Herman, 1995. In a recent behavioral study, Walker et al. 2009 suc- cessfully trained ferrets on a two-alternative forced choice task to discriminate sounds that were higher or lower in pitch than a reference sound. Since the reference sound remained constant throughout a given session, the animal could use absolute strategies to solve the task. However, the result might also suggest that ferrets can be trained to utilize rela- tive pitch cues in sequential sounds. The goal of the present study was to develop a new animal model to study the neural mechanisms underlying auditory pattern categorization based on direction of pitch changes pitch contours of tone se- quences, and more generally to understand the neural basis and correlates of recognition and discrimination of spec- trotemporally complex sounds. A training procedure which gradually directed animals to attend to the relative pitch change of two-tone sequences rising vs falling has been successfully developed, and the present report provides evi- J. Acoust. Soc. Am. 127 3, March 2010 © 2010 Acoustical Society of America 1673 0001-4966/2010/1273/1673/8/$25.00

Welcome message from author
This document is posted to help you gain knowledge. Please leave a comment to let me know what you think about it! Share it to your friends and learn new things together.
Transcript
Do ferrets perceive relative pitch?Pingbo Yin, Jonathan B. Fritz, and Shihab A. ShammaNeural Systems Laboratory, Institute for Systems Research, University of Maryland, College Park,Maryland 20742
�Received 18 March 2009; revised 13 November 2009; accepted 13 December 2009�
The existence of relative pitch perception in animals is difficult to demonstrate, since unlikehumans, animals often attend to absolute rather than relative properties of sound elements. However,the results of the present study show that ferrets can be trained using relative pitch to discriminatetwo-tone sequences �rising vs. falling�. Three ferrets were trained using a positive-reinforcementparadigm in which sequences of reference �one to five repeats� and target stimuli were presented,and animals were rewarded only when responding correctly to the target. The training procedureconsisted of three training phases that successively shaped the ferrets to attend to relative pitch. InPhase-1 training, animals learned the basic task with sequences of invariant tone-pairs and could useabsolute pitch information. During Phase-2 training, in order to emphasize relative cues, absolutepitch was varied each trial within a two-octave frequency range. In Phase-3 training, absolute pitchcues were removed, and only relative cue information was available to solve the task. Two ferretssuccessfully completed training on all three phases and achieved significant discriminativeperformance over the trained four-octave frequency range. These results suggest that ferrets can betrained to discern the relative pitch relationship of a sequence of tone-pairs independent offrequency. © 2010 Acoustical Society of America. �DOI: 10.1121/1.3290988�
PACS number�s�: 43.80.Lb, 43.66.Gf �MJO� Pages: 1673–1680
I. INTRODUCTION
A significant amount of information is encoded in thecontour patterns �rises and falls� of the pitch of acoustic sig-nals, such as in speech and music. For example, human sub-jects can easily recognize sentence type on the basis of pitchcontour alone in the absence of other information �Lade-foged, 1982�. The frequency transpositions of a melody arereadily recognized by most adult, and even infant, humanlisteners as the “same” and are perceived as structuralequivalents of the original melody �Dowling and Fujitani,1971; Demany and Armand, 1984; Trehub et al., 1984; Tre-hub and Hannon, 2006�. Although human listeners can re-member the exact musical intervals of familiar melodies,they appear to remember only the frequency contour of lessfamiliar or novel stimuli �Dowling and Fujitani, 1971; Dowl-ing, 1978; Bartlett and Dowling, 1980�. Unlike humans, whoattend chiefly to the relationships between sound elements,animals more heavily weight the absolute frequency ofsound elements in their perceptual decisions and appear to beless attentive to relative pitch changes. Consequently, it hasbeen difficult to train animals to attend to the relative pitchbetween sound elements, as D’Amato �1988� concluded afterextensive behavioral research on monkeys and rats.
Most studies conducted with nonhuman species, includ-ing several species of birds �Hulse and Cynx, 1985, 1986;Ratcliffe and Weisman, 1986; Dooling et al., 1987; Pageet al., 1989; Cynx, 1993; Weisman et al., 2004� and monkeys�D’Amato and Salmon, 1984; D’Amato, 1988; Izumi, 2001,2003; Brosch et al., 2004, 2006�, suggest that animals gen-erally encode absolute pitch and have rather limited abilitiesto recognize the relative pitch contours of tonal stimuli.Songbirds have been shown to learn a relative pitch strategy,
recognizing an ordinal rule for tone sequences that rise or fallJ. Acoust. Soc. Am. 127 �3�, March 2010 0001-4966/2010/127�3
in frequency regardless of the absolute frequency compo-nents. However, when the sequences were shifted out of thetrained frequency range, they lost the discrimination. It thenrequired as many trials to acquire a new discrimination asthey needed to learn in the original discrimination �Hulse andCynx, 1985; Cynx, 1993�. Furthermore, songbirds failed tolearn relative pitch discrimination when the absolute pitchcues were removed from the training �Page et al., 1989�,indicating the primacy of absolute pitch perception in thesespecies. Although a frequency range constraint was alsonoted in nonhuman mammals �Izumi, 2001, 2003�, there arenow two studies indicating that some nonhuman mammalianspecies are capable of relative pitch as measured by octavegeneralizations—rhesus monkeys �Wright et al., 2000� anddolphins �Ralston and Herman, 1995�.
In a recent behavioral study, Walker et al. �2009� suc-cessfully trained ferrets on a two-alternative forced choicetask to discriminate sounds that were higher or lower in pitchthan a reference sound. Since the reference sound remainedconstant throughout a given session, the animal could useabsolute strategies to solve the task. However, the resultmight also suggest that ferrets can be trained to utilize rela-tive pitch cues in sequential sounds. The goal of the presentstudy was to develop a new animal model to study the neuralmechanisms underlying auditory pattern categorization basedon direction of pitch changes �pitch contours� of tone se-quences, and more generally to understand the neural basisand correlates of recognition and discrimination of spec-trotemporally complex sounds. A training procedure whichgradually directed animals to attend to the relative pitchchange of two-tone sequences �rising vs falling� has been
successfully developed, and the present report provides evi-© 2010 Acoustical Society of America 1673�/1673/8/$25.00
dence of ferrets’ capability to categorize tonal patterns solelyon the basis of these two-tone step changes over the trainedfrequency range.
II. METHODS
A. Subjects
Three naïve female adult ferrets, weighing 600–900 g,were used in this behavioral study. The animals were trainedon a positive-reinforcement operant paradigm with water asreward. The ferrets were placed on a water-control protocolon which they were typically trained 5 days per week andobtained ad libitum water over the weekend. On trainingdays, animals received one or two training sessions ��100trials in each session to satiation�. All procedures conformedto the NIH policy on experimental animal care and use andwere approved by the IACUC of the University of Maryland.
B. Experimental apparatus
Ferrets were tested in a customized-design wire meshtraining cage �8 in. width�15 in. depth�9 in. height�which was placed within a single-walled, sound attenuatedchamber �IAC�. A lick sensitive waterspout �1 in.�1.5 in.� stood 5 in. above the floor of the training cage.The waterspout was connected to a computer controlled wa-ter dispenser �Crist Instrument Co., Inc., Maryland, USA�. Aloudspeaker �Manger MSW, Germany� was positioned 10 cmin front of the cage, and the animal’s behavior was monitoredby video camera.
C. Basic behavioral paradigm
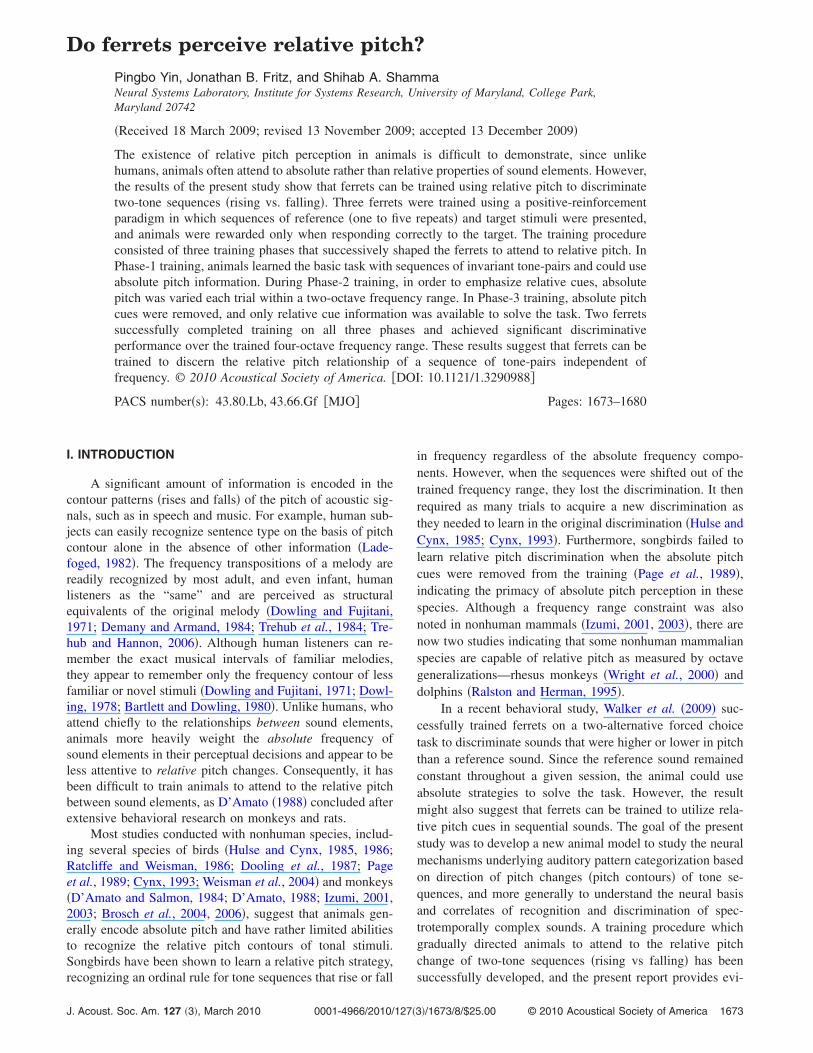
The positive-reinforcement operant paradigm used inthese experiments differed substantially from previous be-havioral studies in the laboratory that used a conditioningavoidance paradigm �Fritz et al., 2003�. In the current study,ferrets were trained to lick a waterspout as the behavioralresponse to a target sound �unlike the conditioned avoidanceparadigm, in which ferrets learned to refrain from ongoinglicking when the target sound was presented�. Each trainingsession started with delivery of a drop of water ��0.5 ml� toinitiate licking of the waterspout. The first trial, and subse-quent trials, began after the animal had consumed the waterand then refrained from licking the spout for a minimum of0.5 s, as illustrated in Fig. 1. A trial consisted of a sequenceof one to five similar reference �non-target� sounds, followedby a different �target� sound. The inter-stimulus-interval be-tween all references and target sound was 1.25 s. The animalwas rewarded with a small drop of water when it licked thespout within a given time window after the target sound �lastshaded area in Fig. 1�. It received a 3–6 s timeout penalty ifit did not lick during the target sound. The target reward dropvolume �0.1–0.3 ml� was adjusted for each trial according tothe licking pattern during the preceding reference stimuli.Specifically, the reward drop volume was inversely propor-tional to false-alarm rate of the trial in order to discouragelicking during the reference stimuli. An additional clicksound was played as a secondary “reinforcer” following wa-
ter delivery during the early stages of training. The total1674 J. Acoust. Soc. Am., Vol. 127, No. 3, March 2010
number of reference stimuli presented in given trial variedfrom trial to trial and was selected from a pseudo-randomsequence, in which there was an equiprobable likelihood thatthe target sound would be presented at each position in thesequence �from second to fifth position�. A training sessionended when the animal did not lick the spout in two consecu-tive trials.
D. Training procedure and stimuli
Training began with a 1–2 day habituation period duringwhich animals were allowed to explore the training cage andlearned to obtain water by licking the waterspout. Trainingwas continued by a pre-training phase of approximately 2weeks in which water delivery was associated with sounds.
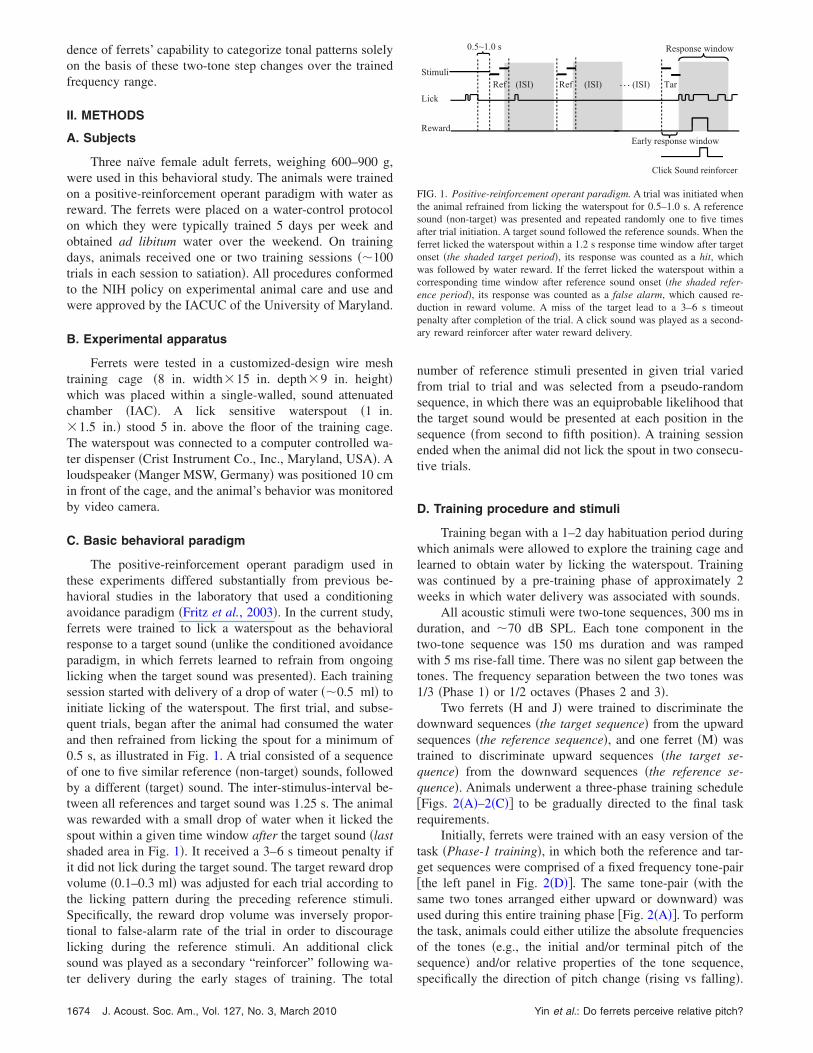
All acoustic stimuli were two-tone sequences, 300 ms induration, and �70 dB SPL. Each tone component in thetwo-tone sequence was 150 ms duration and was rampedwith 5 ms rise-fall time. There was no silent gap between thetones. The frequency separation between the two tones was1/3 �Phase 1� or 1/2 octaves �Phases 2 and 3�.
Two ferrets �H and J� were trained to discriminate thedownward sequences �the target sequence� from the upwardsequences �the reference sequence�, and one ferret �M� wastrained to discriminate upward sequences �the target se-quence� from the downward sequences �the reference se-quence�. Animals underwent a three-phase training schedule�Figs. 2�A�–2�C�� to be gradually directed to the final taskrequirements.
Initially, ferrets were trained with an easy version of thetask �Phase-1 training�, in which both the reference and tar-get sequences were comprised of a fixed frequency tone-pair�the left panel in Fig. 2�D��. The same tone-pair �with thesame two tones arranged either upward or downward� wasused during this entire training phase �Fig. 2�A��. To performthe task, animals could either utilize the absolute frequenciesof the tones �e.g., the initial and/or terminal pitch of thesequence� and/or relative properties of the tone sequence,
Ref (ISI) Ref (ISI) (ISI) Tar…
Click Sound reinforcer
Response window0.5~1.0 s
Early response window
Stimuli
Lick
Reward
FIG. 1. Positive-reinforcement operant paradigm. A trial was initiated whenthe animal refrained from licking the waterspout for 0.5–1.0 s. A referencesound �non-target� was presented and repeated randomly one to five timesafter trial initiation. A target sound followed the reference sounds. When theferret licked the waterspout within a 1.2 s response time window after targetonset �the shaded target period�, its response was counted as a hit, whichwas followed by water reward. If the ferret licked the waterspout within acorresponding time window after reference sound onset �the shaded refer-ence period�, its response was counted as a false alarm, which caused re-duction in reward volume. A miss of the target lead to a 3–6 s timeoutpenalty after completion of the trial. A click sound was played as a second-ary reward reinforcer after water reward delivery.
specifically the direction of pitch change �rising vs falling�.
Yin et al.: Do ferrets perceive relative pitch?
Once the behavioral criterion was achieved �see Sec. II E�,two animals received one or more additional tone-pairs inPhase-1 training. All animals then began Phase-2 training, inwhich the two-tone sequence for each trial consisted of arandomly picked tone-pair within a limited frequency range�Fig. 2�B��. The frequency of the tone-pair was varied be-tween trials over a frequency range that was gradually ex-panded up to two octaves around the initial frequency with 1
4
Trial−1 Trial−2
-1
0
1Frequency(octaves)
A. Training Phase 1: Fixed frequency tone-pair acro
...
Trial-1 Trial-2
-1
0
1
C. Training Phase 3: Variable frequency tone-pairs
Frequency(octaves)
...
Trial-1 Trial-2
-1
0
1
Frequency(octaves)
B. Training Phase 2: Fixed frequency tone-pair with
...
-2 -1 0 1 2
-2
-1
0
1
2
FirstToneFrequency(octaves)
-2 -1 0 1 2
Second Tone Frequence (octaves)
D. Tone-pairs used in different training phases
-2 -1Phase 1 Phase 2
FIG. 2. Two-tone sequence discrimination task: Training procedures andcomprised of one tone-pair with fixed frequency across all training sessioncomprised of one tone-pair with fixed frequency, while the frequency of theEach of the reference or target sequences in a given trial was comprised of dfrom a set of 17 possible pairs. �D� Tone-pairs in different training phases:1 �the left panel�, 9 tone-pairs in Phase 2 �the middle panel�, and up to 17sequence were 1
2 octave apart in frequency, and the frequency contours of thstep-size testing: The stimulus set varied the frequency separation between�A�–�C� indicate the beginning of the trials. The vertical dashed lines indiciso-frequency line. The up and down arrows indicate directions of the refer
octave increments, forming nine different rising or falling
J. Acoust. Soc. Am., Vol. 127, No. 3, March 2010
sequences at the end of this phase �the middle panel in Fig.2�D��. In the final stage, training Phase 3, all reference andtarget sequences within each trial were randomly chosen�Fig. 2�C�� so that the absolute frequency of the sequencesvaried, and the only fixed parameter was the direction ofpitch change �rising or falling�. The frequency range of thetone-pairs at this training stage was expanded to four octavesfor a total of 17 rising or falling sequences �the right panel in
... Trial−n
essions
.. ...
... Trial-n
hin trial
. ...
... Trial-n
rial
....
0 1 2 -1 -0.5 0 0.5 1-1
-0.5
0
0.5
1
Second Tone Frequency (octaves)
FirstToneFrequency(octaves)
E. Tone-pairs for step-size Testing
ase 3
1.5 oct.
0.5 oct.
0.5 oct.
1.5 oct.
uli sets. �A� Phase-1 training: The reference and target sequences were� Phase-2 training: The reference and target sequences for each trial werepair was changed randomly between successive trials. �C� Phase-3 training:nt tone-pairs for which the frequency of the tone-pair was chosen randomlyising and falling two-tone sequences were made from 1 tone-pair in Phase-pairs in Phase 3 �the right panel�. The tone components of the two-tone
uences were roved up or down with 14 octave increments. �E� Tone-pairs for
onent tones, ranging from 0.5 up to 1.5 octaves. The solid vertical lines inhe target onset of each trial. The diagonal lines in �D� and �E� denote theand target sequence in �A�–�C� and of the quadrants in �D� and �E�.
ss s
.
wit
..
in t
..
Ph
stims. �Btone-iffereThe r
tonee seqcompate t
ence
Fig. 2�D��.
Yin et al.: Do ferrets perceive relative pitch? 1675

A different stimulus set was used to test the effect of thestep-size of tone-pairs on the discriminative performance af-ter completion of Phase-3 training. This stimulus set in-cluded six upward and six downward sequences, which werecompromised of six tone-pairs whose frequencies were�1200 1697�, �1120 1819�, �1045 1949�, �975 2089�, �9092239�, and �849 2400� Hz, respectively. Therefore, the fre-quency separation �or interval� between component tones inthose sequences varied from 0.5 to 1.5 octaves �see Fig.2�E��.
E. Data analysis
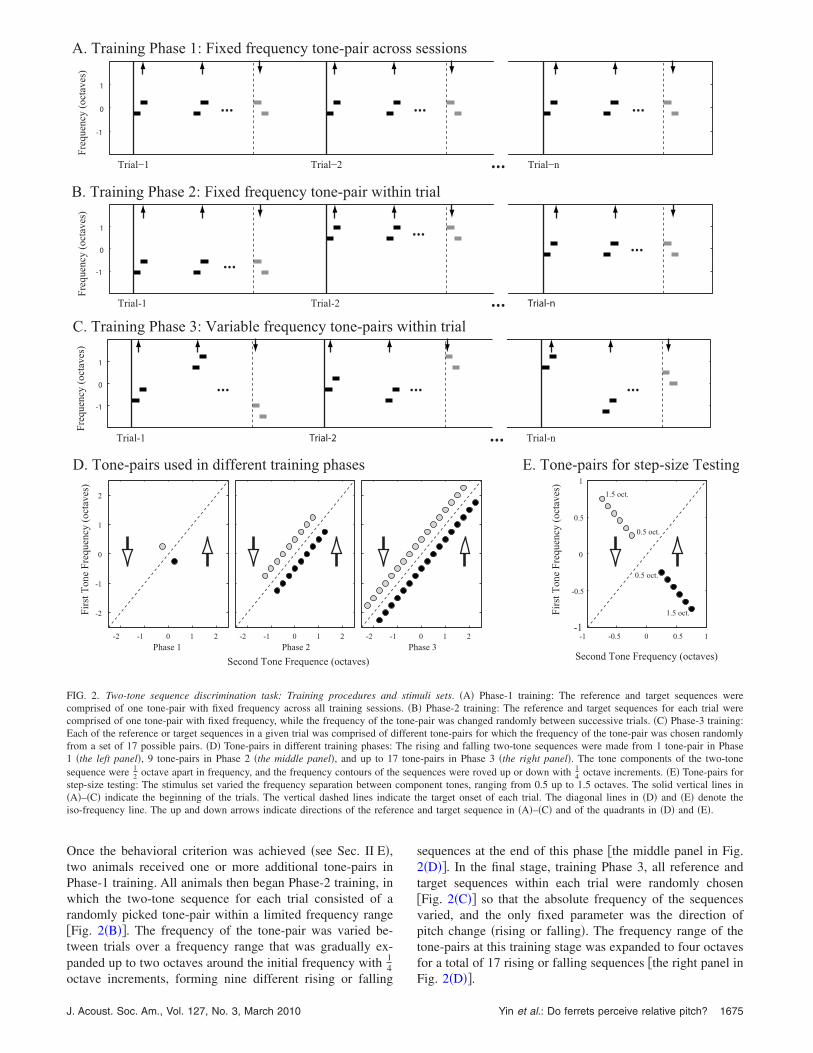
The timing of the first-lick after each of the referencesand target stimuli was recorded as the behavioral response tothe stimulus on each trial. The task performance level wasassessed by an analysis based on signal detection theory, inwhich both behavioral response accuracy and the behavioralresponse latency were exploited. The use of latency informa-tion in the analysis was useful in case of a difficult discrimi-nation �Carterette et al., 1965; Emmerich et al., 1972� andalso in obtaining a sufficient number of probability values foraccurate determination of a receiver operating characteristic�ROC�. A “first-lick” was defined as a hit or a false alarmdepending on whether it was fallen in the response windowfollowing a target or non-target �the reference� sound �theshading zones after each sequence in Fig. 1�. The probabili-ties of the hit �response after a target sound� and the falsealarm �response after a non-target sound� were independentlycomputed as function of the time intervals �from 0.0 to 1.2 swith an increment of 0.2 s� following the onset of the re-sponse window �Fig. 3�A��. The ROC was then formed bythe obtained probability functions �i.e., hit rate vs false-alarmrate function� �Fig. 3�B��. The area under the ROC was takenas a measure of the task performance and was defined as thediscriminative index �DI�. This index yields a value of 0.5for random performance, greater than 0.5 but less than 1.0for nonrandom performance, and 1.0 for perfect perfor-mance. In each training session, the DI value was calculated
0 0.2 0.4 0.6 0.8 1.00
0.2
0.4
0.6
0.8
1.0
B: ROC curve
Cumulative false alarm rate
Cumulativehitrate
ROC area=0.76
0 0.2 0.4 0.6 0.8 1 1.20
0.2
0.4
0.6
0.8
1.0
A: Task performance
Time interval (sec)
Probability
HitFalse alarm
FIG. 3. Construction of ROC curve. �A� The probabilities for hit �solid line�and false alarm �dashed line� were independently computed at each of thetime intervals from 0.0 to 1.2 s with 0.2 s increments following the onset ofthe response window after the target and reference. The vertical dashed linesindicate the start and the end of the response window. �B� The false-alarmprobability function was plotted against hit probability function to constructthe ROC curve �solid line�. The area under the ROC curve �shaded area�was a measure of discriminative performance of the task.
from the original data and also from bootstrapped trials. In
1676 J. Acoust. Soc. Am., Vol. 127, No. 3, March 2010
bootstrapped trials, the relationship between the behavioralresponses �the First-lick time� and the stimulus tags �refer-ence and target� was shuffled, and a shuffled-DI value wascalculated. This process was repeated 50 times, and the meanvalue and the standard deviation of these shuffled-DI valueswere determined. A training session was considered to showsignificant discriminative performance if the obtained DIvalue was more than two standard deviations above theshuffled-DI mean. The behavioral criterion for achievingsuccessful performance was defined as significant discrimi-native performance for a minimum of five consecutive train-ing sessions. Animals could receive additional training on agiven training phase after reaching criterion. Sessions withless than 40 trials were excluded from further analysis.
III. RESULTS AND DISCUSSIONS
Three ferrets were trained on the two-tone discrimina-tion task. Two of them completed all three phases of training.The third ferret was suspended from further training aftercompletion of two phases �it was withdrawn from the studybecause it was suffering weight loss due to a severe anddebilitating gastrointestinal infection�. Figure 4 shows themean performance of the ferrets across ten consecutive ses-sions after reaching behavioral criterion at each of the threetraining phases. All three animals reached behavioral crite-rion in the first two training phases and yielded mean DIvalues between 0.68–0.76 �M =0.71,s.d.=0.05� for Phase 1and 0.72–0.77 �M =0.75,s.d.=0.03� for Phase 2. The perfor-mance of the two animals completing the final training phase�Phase 3� yielded DI values of 0.71 and 0.82, respectively�M =0.76,s.d.=0.08�.
A. Phase-1 training and frequency transposition
Training in Phase 1 took about 30–60 sessions beforeanimals reached behavioral criterion. Since animals in Phase1 could use either absolute or relative pitch to discriminatethe target from reference sequences, if relative was beingemployed, then animals would easily generalize their train-
Ferret J Ferret H Ferret M0.5
0.6
0.7
0.8
0.9
1.0
DiscriminativeIndex(DI)
Discriminative PerformancesPhase 1Phase 2Phase 3
FIG. 4. Discriminative performances for all training phases. The bar plotsshow the average DI values, each of which was computed from ten consecu-tive sessions of Phase 1 �black�, Phase 2 �dark gray�, and Phase 3 �lightgray� performances after reaching training criterion. The error bar indicatesstandard deviation.
ing on the first tone-pair to a new tone-pair with different
Yin et al.: Do ferrets perceive relative pitch?

absolute frequencies. In order to test this conjecture, twoferrets were tested with a second tone-pair after learning thefirst tone-pair in Phase 1. The ferrets’ behavioral discrimina-tion initially plummeted with the new tone-pair, and the ani-mals performed at chance level. The example shown in Fig.5�A� is from ferret J. In Phase 1, ferret J was trained on itsfirst tone-pair �1000 and 1260 Hz� for 34 sessions until itreached behavioral criterion �the first vertical dashed line�.Performance initially declined to a random level �the shadedarea in Fig. 5�A�� when a new tone-pair �2000 and 2520 Hz�was introduced in Training Session 50. It took another 21training sessions �the second vertical dashed line� to reachbehavioral criterion for consistent performance for the sec-
1 5 10.5
0.6
0.7
0.8
0.9
1
Phase
Discriminationindex(DI)
B. Transition from Phase 2 to Ph[1200 1697] Hz(−1 1) octave
10 20 300.5
0.6
0.7
0.8
0.9
1
TrDiscriminativeindex(DI)
A. Training Phase 1: Ferret J[1000 1260] Hz
1 5 10.5
0.6
0.7
0.8
0.9
1
C. Transition from Phase 2 to Ph
Phas
Discriminationindex(DI) [1273 1800] Hz
(−1 1) ocatve
FIG. 5. The frequency transposition in Phase-1 training and the transition fPhase-1 training was started �Training session=0� with a tone-pair at frequ�Training session=50� with the second tone-pair at frequencies �2000 252performance level when moved from Phase 2 �open circles� into Phase 3 �filhorizontal line on the top of each figure�. In �B� the starting frequency range1697� Hz. Performance deteriorated when the frequency range of possibletone-pair �indicated by the thick horizontal line in �B�� and regained after adthe transition from Phase 2 to Phase 3. The shaded area in �A�–�C� indicateA DI value above those dashed lines indicates a significant discriminative p
ond tone-pair, though ferret J learned this discrimination
J. Acoust. Soc. Am., Vol. 127, No. 3, March 2010
faster than for the first tone-pair. This behavioral pattern wastested and replicated in ferret M. These behavioral results,showing that the animals did not generalize to new tone-pairin Phase 1, indicate that the animals’ performance probablyrelied upon absolute pitch rather than relative pitch cues dur-ing Phase-1 training.
B. Transitioning from Phase 1 to Phase 2 and Phase3: Learning relative pitch
Training in Phase 2 started after animals reached behav-ioral criterion on one �ferret H� or more tone-pairs �ferrets Mand J� during Phase 1. In Phase-2 sessions, the reference and
15 20 25 30 35
aining sessions
: Ferret H
octave
50 60 70 80g Sessions
[2000 2520] Hz
15 20 25 30 35
: Ferret M
raining sessions
hase 2 to Phase 3. �A� The figure shows Phase-1 training data for ferret J.s �1000 1260� Hz, and after learning the first pair, training was continuedz �the vertical solid line�. ��B� and �C�� The animals maintained a highrcles� when training within the same frequency range �indicated by the thined one octave above and below the initial frequency of the tone-pair �1200,-pairs was extended an additional octave to two octaves above the initialnal Phase-3 training. In �C� there was no change in frequency range duringseline performance �mean plus two standard deviation of the shuffled-DIs�.
mance.
0
3 Tr
ase 3
(−1 2)
40ainin
0
ase 3
e 3 T
rom Pencie0� H
led civaritoneditio
the baerfor
target stimuli in each trial consisted of upward and down-
Yin et al.: Do ferrets perceive relative pitch? 1677

ward versions of the same tone-pair �randomly chosen foreach trial from a small set of tone-pairs� that remained con-stant throughout a given trial �see Fig. 2�B��. The trainingbegan with a set of three tone-pairs near the frequencies ofthe last tone-pair in Phase-1 training. The number of tone-pairs used in Phase-2 training sessions was gradually ex-panded up to nine tone-pairs, spanning a two-octave fre-quency range �see the middle panel in Fig. 2�D��. All threeferrets reached significant discriminative performance withinthe two-octave frequency range after 24 �ferret H�, 68 �ferretM�, or 77 �ferret J� training sessions. Since the absolute fre-quencies of tone-pairs in the reference and target sequence ofa given trial changed on a trial-by-trial basis, using absolutecues �as in Phase 1� was no longer an efficient strategy fortask performance. It is more likely that animals used relativepitch to solve the task than the alternative that the animalsmemorized the absolute cues and responses for each of thenine possible tone-pairs.
Two ferrets �H and M� progressed to Phase-3 training, inwhich each reference and target sequence in a trial was ran-domly chosen from a set of up to 17 tone-pairs whichspanned four octaves �see Fig. 2�C� and the right panel inFig. 2�D��. Both animals maintained a significant discrimina-tive performance when transitioning from Phase-2 to Phase-3training, as shown in Figs. 5�B� and 5�C�. These results in-dicate that the ferrets probably used the relative frequencycontours of the sequence to solve the task in training Phase2. However, even at this stage of training, animals did notgeneralize across all frequencies, and behavioral perfor-mance deteriorated when the frequency range of the tone-pairs expanded to a new frequency region, as indicated inFig. 5�B�. Apparently, the animals had generalized their per-formance only in a two-octave frequency range which hadbeen achieved during Phase-2 training, and hence additionaltraining was necessary to extend the discriminative perfor-mance to a larger frequency range.
Both ferrets �H and M� achieved significant discrimina-tive performance with a four-octave frequency range afteradditional Phase-3 training, as illustrated in Fig. 4 �the lightgray bars show Phase-3 performance for each ferret� and Fig.6�A� �the two curves show performance over the frequencyrange for each ferret�. Figure 6�A� shows the ferrets’ dis-criminative performance for each of the tone-pairs after theanimals reached performance criterion in Phase 3. In order tohave sufficient behavioral data to compute the DI for each ofthe tone-pairs, the data in Fig. 6�A� were pooled from all tensessions �the same data set as in Fig. 4�. The significantdiscriminative performances were confirmed for all of thetone-pairs within the trained frequency range. The DIs fromall tone-pairs within the four-octave frequency range �thelines with filled circle in Fig. 6�A�� were more than twostandard deviations above the mean for shuffled-DIs �thedashed line in Fig. 6�A��. The best performance was found atthe tone-pairs in the middle frequency range for both ferrets.This result indicates that even though the ferrets could “par-tially” generalize the frequency contour categories within awide frequency range after additional Phase-3 training, theywere still subject to a frequency range constraint as in other
nonhuman species �Hulse and Cynx, 1985; Izumi, 2001�.1678 J. Acoust. Soc. Am., Vol. 127, No. 3, March 2010
Those profiles of behavioral performance across the fre-quency range might be explained by the training history ofthe animals, which showed a similar profile of experiencedfrequencies.
C. The effect of frequency separation on taskperformance
In a separate set of experiments, the effects on task per-formance of the size of the frequency separation between thetwo component tones in the sequence were probed by a com-pletely new set of two-tone sequences. As illustrated in Fig.2�E�, this stimulus set had novel two-tone sequences withvariable frequency separation �0.5–1.5 octaves�. Each refer-ence and target was randomly picked from the stimulus list.One ferret was tested with this stimulus set alternately withthe fixed standard frequency separation of 1/2 octave. Therewas no significant difference in behavioral performanceacross the different frequency separations �one-way ANOVA,p=0.687, Fig. 6�B��. This result suggests that the animals did
0.5 0.7 0.9 1.1 1.3 1.50.5
0.6
0.7
0.8
0.9
1
Step-size in octaveDiscriminativeIndex(DI)
B. Discriminative performance across step-size
300 505 849 1427 2400 4036 67880.5
0.6
0.7
0.8
0.9
1
Low frequency of the tone-pairs (Hz)
DiscriminativeIndex(DI)
A. Disriminative performance across frequencies
Ferret HFerret M
One-way anova: p=0.687
FIG. 6. Discriminative performance across frequencies and step-sizes of thetone-pairs. �A� Phase-3 data sets were the same as used in Fig. 4 for bothferrets M and H. The trials from all of those ten sessions were pooledtogether to compute the discriminative index for each of the tone-pairs. Thesignificant discriminative performances were confirmed at all the tone-pairswithin four-octave training frequency range. �B� Discriminative index ateach frequency separation is represented as mean�standard deviation �N=6�. There is no significant difference in discriminative performance acrossthe frequency separations between the component tones of the sequence.The horizontal dashed lines in �A� and �B� indicate the baseline performance�mean plus two standard deviation of the shuffled-DIs�. A DI value abovethose dashed lines indicates a significant discriminative performance.
not attend to the interval size between the component tones
Yin et al.: Do ferrets perceive relative pitch?

in the sequence, but simply to the direction of pitch changeof the two-tone sequence. This result was also seen in humansubjects in melody recognitions. The recognition of ran-domly generated melodies �novel melodies� was dominatedby contours, while for familiar melodies both the contoursand intervals were critical for recognition �Dowling and Fuji-tani, 1971; Dowling, 1978�.
IV. GENERAL DISCUSSION
This study successfully demonstrated that ferrets are ca-pable of relative pitch perception within a trained frequencyrange. With a three-phase training strategy, ferrets couldlearn to extract the relative pitch cue �the frequency contour�to discriminate between rising and falling two-tone se-quences, independent of the absolute frequency of the tonesequence, over a four-octave range of frequencies.
During Phase-1 training, ferrets apparently used absolutepitch cues and discriminated target sequences from the ref-erence sequences based on the initial or terminal pitch of thetone sequence. Transposition of the learned tone-pair to adifferent frequency caused a significant deterioration of per-formance, and animals needed to be retrained in order tomaster the new tone-pair. This result suggests that ferrets,like other nonhuman species, do not use relative pitch tosolve contour discrimination tasks as a primary strategy, butare likely to use the absolute pitch of the tones in the se-quence �particularly when the tone-pair frequencies arefixed�.
However, ferrets were able to discriminate contour formultiple tone-pairs during Phase-2 training and appear tohave learned to extract and utilize relative pitch cues in orderto solve the task. Although the tone-pair frequencies re-mained constant within a given trial, and hence changes ofthe initial or ending pitch of the sequences could be used,ferrets appear to attend to the frequency contour within thesequence �relative cue� to solve the task. The behavioral evi-dence shown in Figs. 5�B� and 5�C� clearly indicates thatperformance on Phase 2 was very easily transferred to Phase3, where the relative frequency contours were the only avail-able cue. However, additional training was needed in Phase 3in order to expand the frequency range over which the taskwas performed �indicated in Fig. 5�B��.
Sinnott et al. �1987� observed asymmetrical frequencydiscrimination in human subjects and some nonhuman pri-mates and suggested that this asymmetrical sensitivity mightrelate to aspects of the species’ vocal communication signal.However, in D’Amato’s behavioral studies �reviewed inD’Amato, 1988�, cebus monkeys and rats failed octave-generalization tests and also failed to demonstrate extractionof pitch contours. D’Amato concluded that perception ofpitch contours requires specialized mechanisms that mostanimals lack and that “monkeys can’t hum a tune … becausethey don’t hear them” �D’Amato, 1988�. This result wassomewhat puzzling since birds and nonhuman primates areknown to be capable of utilizing pitch cues and contours invocal communication and recognition �Morton, 1977; Ratc-liffe and Weisman, 1986; Weisman and Ratcliffe, 2004�. In
subsequent behavioral studies, rhesus monkeys were shownJ. Acoust. Soc. Am., Vol. 127, No. 3, March 2010
to generalize tonal melodies to whole one- and two-octavetranspositions, but could not generalize over fractional trans-positions, e.g., 0.5 octave or 1.5 octaves �Wright et al.,2000�. These observations are very intriguing, but also raiseadditional questions since adult human subjects can general-ize for both tonal and atonal melodies over both octave andnon-octave transpositions �McDermott and Hauser, 2005�,suggesting that there may be limitations in relative pitch innonhuman primates. There is also some behavioral evidencefor perception and generalization of frequency contours tooctave transpositions in one bottlenose dolphin �Ralston andHerman, 1995�, but these claims need replication and furtherstudy.
The failure of ferrets to fully generalize to untrainedfrequency ranges in the present study suggests that ferretswere also subject to a frequency range constraint as de-scribed in other nonhuman species, including songbirds, rats,and monkeys �D’Amato and Salmon, 1984; Hulse and Cynx,1985, 1986; Dooling et al., 1987; Cynx, 1993; Wright et al.,2000; Izumi, 2001�. These nonhuman species have beenfound to have difficulty generalizing contour categories tonovel frequency ranges and contours. Ferrets, however, didacquire good discriminative performance in the new fre-quency range in just a few training sessions �Fig. 5�B��. Thisacquisition was much faster than the case with songbirds thatrequired as many trials as they had in learning the originaldiscrimination �Hulse and Cynx, 1985; Cynx, 1993�. Thefrequency range constraint revealed the extent of absolutepitch perception in relative pitch perception. Although therelationship between the relative and absolute pitch percep-tion remains unclear, the failure to acquire relative discrimi-nation when eliminating the absolute cues suggests that rela-tive pitch in songbirds may depend on first identifying thepatterns on the basis of their absolute pitches �Page et al.,1989�. By contrast, in the present study, absolute pitch cueswere available during only Phase-1 training, but not duringthe generalization training phases �Phases 2 and 3�. Thus,animals learned the task with relative cues over a four-octavefrequency range. These results indicate that ferrets, while notas good as humans, are somewhat better than songbirds inlearning to utilize relative pitch cues.
Studies by Weisman et al. �1998� demonstrated thatsongbirds �even individuals reared in isolation� and parrotshave highly accurate absolute pitch perception. In compari-son, nonhuman mammals �such as rats� and humans exhib-ited only weak absolute pitch perception when classifyingfrequencies into ranges �Njegovan et al., 1995; Weismanet al., 1998, 2004�. These findings lead Weisman to proposethat there is a general difference in auditory processing inabsolute and relative pitch perception between mammals �in-cluding humans� and songbirds �Weisman et al., 2004�. Theresults in ferrets are consistent with this hypothesis. Alongwith other recent behavioral studies on birds and monkeys�Page et al., 1989; Wright et al., 2000; Izumi, 2001; Broschet al., 2004�, the present results provide evidence that ani-mals can be trained to extract relative pitch when needed to
perform a tonal pattern discrimination task.Yin et al.: Do ferrets perceive relative pitch? 1679

V. CONCLUSIONS
The present study provides the evidence that ferrets canextract the tonal contour, independent of frequencies �Fig.6�A�� and frequency separations �Fig. 6�B�� of the two-tonesequences. Appropriate task design and behavioral trainingprocedures, such as the generalization training in Phase 2 incurrent study, are necessary to direct animal’s attention to therelational features of the sequences and to develop a rela-tional solution of the task. Similarly, an early study on birds�Page et al., 1989� found that starlings extracted relativepitch from the pitch patterns only after acquiring a discrimi-nation that permitted both absolute and relative pitch solu-tions. Although the natural tendency for animals may be toattend to the absolute properties of sound, the results of thepresent study suggest that they can still be trained to attendto relative pitch information.
ACKNOWLEDGMENT
This work was supported by R01DC005779 fromNIDCD.
Bartlett, J. C., and Dowling, W. J. �1980�. “Recognition of transposed melo-dies: A key distance effect in development perspective,” J. Exp. Psychol.Hum. Percept. Perform. 6, 501–515.
Brosch, M., Oshurkova, E., Bucks, C., and Scheich, H. �2006�. “Influence oftone duration and intertone interval on the discrimination of frequencycontours in a macaque monkey,” Neurosci. Lett. 406, 97–101.
Brosch, M., Selezneva, E., Bucks, C., and Scheich, H. �2004�. “Macaquemonkeys discriminate pitch relationships,” Cognition 91, 259–272.
Carterette, E. C., Friedman, M. P., and Cosmides, R. �1965�. “Reaction timedistributions in the detection of weak signal in noise,” J. Acoust. Soc. Am.38, 531–542.
Cynx, J. �1993�. “Auditory frequency generalization and a failure to findoctave generalization in a songbird, The European starling �Sturnus vul-garis�,” J. Comp. Psychol. 107, 140–146.
D’Amato, M. R. �1988�. “A search for tonal pattern perception in cebusmonkeys: Why monkeys can’t hum a tune,” Music Percept. 5, 453–480.
D’Amato, M. R., and Salmon, D. P. �1984�. “Processing of complex audi-tory stimuli �tunes� by rats and monkeys �Cebus apella�,” Anim. LearnBehav. 10, 126–134.
Demany, L., and Armand, F. �1984�. “The perceptual reality of tone chromain early infancy,” J. Acoust. Soc. Am. 76, 57–66.
Dooling, R. J., Brown, S. D., Park, T. J., Okanoya, D., and Soli, S. D.�1987�. “Perceptual organization of acoustic stimuli by budgerigars�Melopsittacus undulatus�,” J. Comp. Psychol. 101, 139–149.
Dowling, W. J. �1978�. “Scale and contour: Two components of a theory ofmemory for melodies,” Psychol. Rev. 85, 341–354.
Dowling, W. J., and Fujitani, D. A. �1971�. “Contour, interval, and pitchrecognition in memory for melodies,” J. Acoust. Soc. Am. 49, 524–531.
Emmerich, D. J., Gray, J., Watson, C., and Tanis, D. �1972�. “Response
1680 J. Acoust. Soc. Am., Vol. 127, No. 3, March 2010
latency confidence and ROCs in auditory signal detection,” Percept. Psy-chophys. 11, 65–72.
Fritz, J. B., Shamma, S., Elhilali, M., and Klein, D. �2003�. “Rapid task-related plasticity of spectrotemporal receptive fields in primary auditorycortex,” Nat. Neurosci. 6, 1216–1223.
Hulse, S. H., and Cynx, J. �1985�. “Relative pitch perception is constrainedby absolute pitch in songbirds �Mimus, Molothrus and Sturnus�,” J. Comp.Psychol. 99, 176–196.
Hulse, S. H., and Cynx, J. �1986�. “Interval and contour in serial pitchperception by a passerine bird, The European starling �Sturnus vulgaris�,”J. Comp. Psychol. 100, 215–228.
Izumi, A. �2003�. “Effect of temporal separation on tone-sequence discrimi-nation in monkeys,” Hear. Res. 175, 75–81.
Izumi, A. �2001�. “Relative perception in Japanese monkeys �Macaca fus-cata�,” J. Comp. Psychol. 115, 127–131.
Ladefoged, P. �1982�. A Course in Phonetics �Harcourt Brace Jovanovich,San Diego, CA�.
McDermott, J. H., and Hauser, M. �2005�. “The origins of music: Innate-ness, uniqueness, and evolution,” Music Percept. 23, 29–59.
Morton, E. S. �1977�. “On the occurrence and significance of motivation-structural rules in some bird and mammal sounds,” Am. Nat. 111, 855–869.
Njegovan, M., Ito, S., Mewhort, D., and Weisman, R. �1995�. “Classificationof frequencies into ranges by songbirds and humans,” J. Exp. Psychol.Anim. Behav. Process 21, 33–42.
Page, S. H., Hulse, S. H., and Cynx, J. �1989�. “Relative pitch perception inthe starling �Sturnus vulgaris�: Further evidence for an elusive phenom-enon,” J. Exp. Psychol. Anim. Behav. Process 15, 137–146.
Ralston, J. V., and Herman, L. M. �1995�. “Perception and generalization offrequency contours by a bottlenose dolphin �Tursiops truncatus�,” J.Comp. Psychol. 109, 268–277.
Ratcliffe, L., and Weisman, R. G. �1986�. “Song sequence discrimination inthe black-capped chickadee �Parus atricapillus�,” J. Comp. Psychol. 100,361–367.
Sinnott, J. M., Owren, M. J., and Peterson, M. R. �1987�. “Auditory fre-quency discrimination in primates: Species difference �cercopithecus,macaca, homo�,” J. Comp. Psychol. 101, 126–131.
Trehub, S. E., Bull, D., and Thorpe, L. A. �1984�. “Infant’s perception ofmelodies: The role of melodic contour,” Child Dev. 55, 821–830.
Trehub, S. E., and Hannon, E. E. �2006�. “Infant music perception: Domain-general or domain-specific mechanisms?,” Cognition 100, 73–99.
Walker, K. M. M., Schnupp, J. W. H., Hart-Schnupp, S. M. B., King, A. J.,and Bizley, J. K. �2009�. “Pitch discrimination by ferrets for simple andcomplex sounds,” J. Acoust. Soc. Am. 126, 1321–1335.
Weisman, R., Njegovan, M., Sturdy, C., Phillmore, L., Cotle, J., and Me-whort, D. �1998�. “Frequency-range discriminations: Special and generalabilities in zebra finches �Taeniopygia guttata� and humans �Homo sapi-ens�,” J. Comp. Psychol. 112, 244–258.
Weisman, R. G., Njegovan, M. G., Williams, M. T., Cohen, J. S., andSturdy, C. B. �2004�. “A behavior analysis of absolute pitch: Sex, experi-ence, and species,” Behav. Processes 66, 289–307.
Weisman, R. G., and Ratcliffe, L. �2004�. “Relative pitch and the song ofblack-capped chickadees,” Am. Sci. 92, 532–539.
Wright, A. A., Rivera, J. J., Hulse, S. H., Shyan, M., and Neiworth, J. J.�2000�. “Music perception and octave generalization in rhesus monkeys,”J. Exp. Psychol. Gen. 129, 291–307.
Yin et al.: Do ferrets perceive relative pitch?
Related Documents