Singapore Management University Institutional Knowledge at Singapore Management University Research Collection School Of Accountancy School of Accountancy 3-2019 Do corporate site visits impact stock prices? Qiang CHENG Singapore Management University, [email protected] Fei DU University of Illinois at Urbana-Champaign Brian Yutao WANG Central University of Finance and Economics Xin WANG University of Hong Kong DOI: hps://doi.org/10.1111/1911-3846.12417 Follow this and additional works at: hps://ink.library.smu.edu.sg/soa_research Part of the Accounting Commons , and the Corporate Finance Commons is Journal Article is brought to you for free and open access by the School of Accountancy at Institutional Knowledge at Singapore Management University. It has been accepted for inclusion in Research Collection School Of Accountancy by an authorized administrator of Institutional Knowledge at Singapore Management University. For more information, please email [email protected]. Citation CHENG, Qiang; DU, Fei; WANG, Brian Yutao; and WANG, Xin. Do corporate site visits impact stock prices?. (2019). Contemporary Accounting Research. 36, (1), 359-388. Research Collection School Of Accountancy. Available at: hps://ink.library.smu.edu.sg/soa_research/1632 brought to you by CORE View metadata, citation and similar papers at core.ac.uk provided by Institutional Knowledge at Singapore Management University

Welcome message from author
This document is posted to help you gain knowledge. Please leave a comment to let me know what you think about it! Share it to your friends and learn new things together.
Transcript

Singapore Management UniversityInstitutional Knowledge at Singapore Management University
Research Collection School Of Accountancy School of Accountancy
3-2019
Do corporate site visits impact stock prices?Qiang CHENGSingapore Management University, [email protected]
Fei DUUniversity of Illinois at Urbana-Champaign
Brian Yutao WANGCentral University of Finance and Economics
Xin WANGUniversity of Hong Kong
DOI: https://doi.org/10.1111/1911-3846.12417
Follow this and additional works at: https://ink.library.smu.edu.sg/soa_research
Part of the Accounting Commons, and the Corporate Finance Commons
This Journal Article is brought to you for free and open access by the School of Accountancy at Institutional Knowledge at Singapore ManagementUniversity. It has been accepted for inclusion in Research Collection School Of Accountancy by an authorized administrator of InstitutionalKnowledge at Singapore Management University. For more information, please email [email protected].
CitationCHENG, Qiang; DU, Fei; WANG, Brian Yutao; and WANG, Xin. Do corporate site visits impact stock prices?. (2019). ContemporaryAccounting Research. 36, (1), 359-388. Research Collection School Of Accountancy.Available at: https://ink.library.smu.edu.sg/soa_research/1632
brought to you by COREView metadata, citation and similar papers at core.ac.uk
provided by Institutional Knowledge at Singapore Management University

Electronic copy available at: https://ssrn.com/abstract=3044130
Do Corporate Site Visits Impact Stock Prices?*
Qiang Cheng Singapore Management University
Fei Du
University of Illinois at Urbana-Champaign
Brian Yutao Wang Central University of Finance and Economics
Xin Wang
The University of Hong Kong
September 2017
Contemporary Accounting Research, Forthcoming
Abstract We examine the stock price impact of corporate site visits using a unique dataset of site visits to listed firms in China. Our main findings are as follows. First, the market reaction around corporate site visits is statistically and economically significant and is stronger for group visits, visits conducted by mutual fund managers, visits covering accounting and finance topics, visits to firms with poor information environments, and visits to manufacturing firms. Second, the stock returns around site visits are positively associated with firms’ future performance. Third, the changes in visiting funds’ holdings are more predictive of firms’ future performance than those of non-visiting funds. Overall, this study contributes to the literature by providing evidence that site visits are important venues for investors to collect information about firms and make informed trades. Keywords: Corporate site visits; stock price impact; information acquisition
* Previously titled with “Are Investors’ Corporate Site Visits Informative?” We greatly appreciate the helpful comments and suggestions from Neil Bhattacharya, Brian Bushee, Andrew Call, Shuping Chen, Xia Chen, Xiao Chen, Agnes Cheng, Mark DeFond, Zhaoyang Gu, Ole-Kristian Hope, Marcus Kirk, Lian Fen Lee, Stan Markov, Eugene Soltes, Mark Young, and conference and workshop participants at the Chinese University of Hong Kong, the Hong Kong Polytechnic University, Singapore Management University, Tsinghua University, University of Cambridge, Xiamen University, the 2013 AAA meeting, the 2013 CAPANA conference, and the 2014 FARS mid-year conference. Please contact the authors at [email protected] (Qiang Cheng), [email protected] (Fei Du), [email protected] (Xin Wang), and [email protected] (Yutao Wang).
https://doi.org/10.1111/1911-3846.12417

Electronic copy available at: https://ssrn.com/abstract=3044130
1
1. Introduction
In this study, we examine the stock price impact of corporate site visits. Site visits refer to
investors’ field trips to corporate headquarters and production facilities. During these trips
investors observe firms’ operations and talk to employees. Corporate site visits are an
increasingly important type of information acquisition activities for institutional investors and
financial analysts (Abramowitz 2006; Jackson 2009; Institutional Investor’s All-Europe
Research Team Survey 2012).1 Anecdotal evidence suggests that fund managers rely on site
visits to obtain information and trade on the discrepancy between a firm’s public disclosure and
the private information obtained from their site visits (e.g., Muddy Waters ONP Report 2010).
Surveys show that financial analysts rank corporate site visits as the second-most useful way to
obtain information about a company (Brown, Call, Clement, and Sharp 2015). Corporate site
visits remain important in the period after Regulation Fair Disclosure (Reg. FD).2 For example,
in an SEC round table discussion, the former SEC Chairman Harvey Pitt stated that “…
companies should allow investors to visit corporate headquarters or plants and question the
operating managers (SEC 2001).”
Investigating the stock price impact of site visits can help us understand whether site visits
are useful information acquisition activities and whether investors’ site visits can make the
capital markets more efficient in reflecting the fundamental values of the visited firms. However,
despite the importance and prevalence of site visits, there is little empirical research on these
issues, mainly due to the lack of site visit data. A couple of recent studies examine the change in
analysts’ forecast accuracy after site visits. Soltes (2014) focuses on analysts’ site visits to one
1 The 2012 Institutional Investor’s All-Europe Research Team survey shows that institutional investors rank corporate site visits to be more important than one-on-one meetings with the management and analysts’ research reports in terms of acquiring information about firms. 2 Reg. FD prohibits corporate executives from disclosing material non-public information to select investors.

2
large company and fails to find any significant change in visiting analysts’ forecast accuracy.
Using a larger sample, Cheng, Du, Wang and Wang (2016) document a significant improvement
on visiting analysts’ forecast accuracy. However, these results cannot be used to extrapolate the
stock price impact of site visits. Analysts’ forecast revisions only reflect the changes in analysts’
beliefs of future earnings. Analysts might update their stale forecasts with more recent
information obtained from site visits, but such information might be stale from a market
perspective. In contrast, the stock price impact reflects the changes in all market participants’
beliefs of future earnings, cash flows, and cost of equity, and only new information from site
visits can have a stock price impact.
In addition, the site visit sample used in Cheng et al. (2016) is not representative of the full
sample. In our sample, only 16% of site visits are followed by visiting analysts’ earnings
forecasts in the month after site visits. It is questionable whether the results from such a small
sample can be generalized to the population of site visits. This issue is exacerbated by the
potential bias in the sampling of site visits used to test the forecast accuracy improvement after
site visits because visiting analysts might choose to issue forecasts only when the information
obtained from site visits is significant enough, potentially biasing for finding results of improved
forecast accuracy. This potential bias can further reduce the generalizability of the analyst
forecast accuracy results to the site visits not followed by analysts’ earnings forecasts, the
majority of the sample. Thus, in order to understand the information role of site visits, it is
important to investigate whether site visits have a significant stock price impact.
In this paper, we take advantage of a recent regulatory requirement on site visit disclosure
in China. Since 2009, the firms listed on the Shenzhen Stock Exchange (SZSE) have been
required to disclose information on site visits in their annual reports. From the annual reports of

3
all SZSE-listed firms, we hand-collect the information on site visits, including the date, location,
and the number and type of visiting institutions. Our final sample consists of 21,189 site visits to
1,040 firms in 2,859 firm-years between 2009 and 2013. These site visits involve a wide range of
visitor types, including mutual funds, securities brokerage companies, banks, consulting firms
and individual investors.
Not all firms have site visits. Investors conduct site visits to some firms, but not others. To
better understand investors’ site-visit decision and to address the potential sample truncation
issue for the later analyses, we develop a determinant model of corporate site visits. We expect
that investors are more likely to conduct site visits when doing so is more beneficial. Consistent
with this expectation, we find that the likelihood of site visits is higher for manufacturing firms,
firms with a higher market share, larger firms, firms with higher analyst coverage, profitable
firms, firms with more business segments, older firms, and firms with higher book-to-market
ratios. Consistent with the notion that firms with a higher level of disclosure and transparency are
more likely to grant investors site visit opportunities, we document a higher likelihood of site
visits for firms with higher disclosure ratings. Moreover, we document that investors are more
likely to visit firms in cities with higher GDP growth and more listed firms. Besides shedding
light on the determinants of site visits, this analysis also helps us address the potential sample
selection bias for the analysis of the stock price impact of site visits, which is based on the
sample of firms with site visits. We adopt the Heckman approach and include the inverse Mills
ratio in all of our main analyses.3
The univariate analysis shows significant market reactions in the 2-day window ([0, +1])
around site visits. Specifically, the absolute size-adjusted abnormal return is on average 9.04%
3 We obtain the same inferences when not using the Heckman approach.

4
higher than that in the normal period. We also predict and find that the stock price impact of site
visits varies with firm and site-visit characteristics. In particular, we expect site visits to be more
informative for firms with poor information environment because the marginal benefit of
information acquisition activities is higher for these firms. In addition, compared with the site
visits to firms without major manufacturing facilities or operations (e.g., Internet firms), visits to
manufacturing firms can provide investors with more contextual information and as such are
expected to be more informative than other site visits. Consistent with these predictions, we find
that the market reactions around site visits are stronger for firms covered by fewer analysts, for
firms with lower mandatory disclosure quality, and for manufacturing firms. Furthermore, we
find that the stock price impact is more pronounced for the site visits conducted by a larger group
of visitors, those conducted by mutual funds, and those covering accounting and finance topics.
After controlling for other firm characteristics and the potential sample selection bias, our
multivariate analyses of the stock price impact provide similar results as the univariate analyses.
Our additional analysis suggests that the timing choice of site visits is unlikely to drive our
results. Moreover, we find that the inferences hold for both the site visits followed by visiting
analysts’ earnings forecasts and those that are not. Furthermore, when we use the abnormal
trading volume over the 2-day event window around site visits as an alternative measure of the
market reaction to site visits, the inferences remain the same.
We next conduct analyses to rule out the possibility that the documented stock price impact
of site visits is due to visitors’ noise trading or their misinterpretation of the information obtained
from site visits. Inconsistent with this conjecture, we find that the signed stock returns around
site visits are positively associated with firms’ future performance, indicating that the
information obtained from site visits is predictive of future performance.
5
Lastly, to shed light on how site visits lead to the stock price movement, we examine the
changes in visiting funds’ holdings of the visited firms’ stocks around site visits. We find that the
positive association between the changes in funds’ stock holdings and firms’ future performance
is more pronounced for visiting funds than for non-visiting funds, and that this difference is
greater for more informative site visits, namely, the visits to firms with lower disclosure ratings,
larger group visits, and visits covering accounting and finance topics. These results are consistent
with the notion that visiting funds’ trading, at least partly, contributes to the stock price impact of
site visits.
Our study contributes to the literature in several important ways. This is the first
comprehensive study that examines the stock price impact of a large sample of corporate site
visits. Site visits are a unique type of information acquisition activities because they provide
investors with an opportunity to observe firms’ operations and production facilities and because
top executives such as CEOs and CFOs are usually not involved.4 The prevalence and the unique
features of site visits indicate the importance of examining the stock price impact of site visits.
This paper greatly extends the two recent studies on financial analysts’ corporate site visits.
Soltes (2014) examines 75 cases of analysts’ private interactions with management for one large
NYSE-listed firm, but only 15% of these interactions occur at office meetings and can be
considered as site visits. Cheng et al. (2016) use a larger sample of site visits, but they only
examine the site visits conducted by sell-side analysts. First, these two studies provide mixed
evidence on the impact of site visits on analysts’ forecast accuracy. Soltes (2014) does not find
any change in analysts’ forecast accuracy after the private interactions between the company and
analysts, but Cheng et al. (2016) find that financial analysts who conduct site visits experience an
4 Based on the meeting agenda of site visits in 2013, the first year when such data are available, we find that top executives are involved in only 15.21% of site visits (see Appendix A for more details).

6
improvement in the accuracy of their earnings forecasts. That is, prior studies do not provide
conclusive evidence on whether site visits are informative. Second, analysts’ earnings forecast
revision only captures the change in visiting analysts’ belief of one-year-ahead earnings and is
just a fraction of the information set that might lead to price changes. In contrast, the stock price
impact of site visits reflects the change in all visitors’ expectation of future earnings, cash flows,
other performance metrics, and cost of equity.
Third, unlike analysts’ forecast accuracy, the event-specific stock returns are less likely to
be confounded by corporate news around site visits. The results from an event study, such as the
2-day market reaction around site visits, are also easier to interpret and can help researchers to
better pin down the effect of the event. Lastly, analysts do not always issue forecasts after
corporate events, even if they have updated their beliefs (Li, Ramesh, Shen, and Wu 2015;
Yezegel 2015; Berger, Ham, and Kaplan 2016; Bernhardt, Wan, and Xiao 2016).5 As shown
later, only 16% of the site visits in our sample are followed by earnings forecasts issued by
visiting analysts in the month after site visits. This can potentially bias for finding results
consistent with visiting analysts’ forecast accuracy improvement. In contrast, our study examines
a more comprehensive sample of site visits conducted by all investors. Due to these potential
concerns with prior studies of site visits, it is thus important to investigate the stock price impact
of corporate site visits in order to depict a more comprehensive picture of the unique information
role of corporate site visits.
This study is also related to the emerging literature examining the informativeness of
private meetings between managers and institutional investors, including private phone calls,
5 For example, Bernhardt et al. (2016) suggest that analysts might not revise their forecasts if these revisions impose processing costs on clients and/or expose analysts to reputation loss. Berger et al (2016) further present the evidence that analysts might not revise earnings forecasts if such a revision makes it more difficult for firm’s management to beat the benchmark.

7
broker-hosted conferences, and non-deal road shows (Bushee, Jung, and Miller 2017; Green,
James, Markov, and Subasi 2014; Soltes 2014; Solomon and Soltes 2015; Bushee, Gerakos, and
Lee 2016; Kirk and Markov 2016). Unlike these private meetings studied in prior studies, site
visits provide investors with an opportunity to observe firms’ operation and production facilities.
In addition, CEOs and CFOs are usually not involved in corporate site visits. Thus, the findings
based on other private interactions do not necessarily generalize to corporate site visits.6 Our
results suggest that site visits are important venues for market participants to acquire information
about firms, particularly in the post-Regulation FD era. The finding that the changes in visiting
funds’ holdings are in the same direction as firms’ future performance suggests that investors
benefit from site visits by making informed trades.
Lastly, our findings are helpful for researchers to understand the capital market of China,
the second largest economy in the world. Given that fund managers all around the world have
started to invest in China, our findings should be of interest to the practitioners who attempt to
understand how to value Chinese listed companies, especially when the quality of alternative
information channels, such as mandatory disclosure, is low. Likewise, while the SZSE requires
the disclosure of site visits, the Shanghai Stock Exchange (SHSE) has no such requirement.7 Our
findings should be of interest to the SHSE regarding the important information role played by
site visits. We expect our findings to be applicable to other emerging markets that are
characterized by opaque information environments and weak legal protection like China.
6 For example, Solomon and Soltes (2015) find that institutional investors’ trading is more predictive of future earnings in the quarters when they meet privately with managers than in the quarters when they do not. However, their sample includes one mid-cap NYSE-listed firm’s 935 private meetings between its executives and institutional investors over a six-year period, 64% of which occur at public conference presentations, 21% at road shows and 15% at corporate headquarters. As such, their conclusions might not be generalizable to site visits, during which top executives usually do not meet with visitors. 7 There are two stock exchanges in China: The Shanghai Stock Exchange (SHSE) and the Shenzhen Stock Exchange (SZSE). The China Securities Regulatory Commission (CSRC) oversees capital market activities in China and delegates authority for disclosure regulations to the stock exchanges.

8
Although China and the U.S. differ in many aspects, the similarities in the nature of site visits
and investors’ desire to obtain information suggest that our results can bear reference values for
the U.S. market participants. Nevertheless, we acknowledge that due to the differences in the
information environment and legal enforcement between China and the U.S., our findings might
not be generalizable to the U.S.
The remainder of this paper proceeds as follows. Section 2 provides the institutional
background and outlines the research questions. Section 3 describes the sample and data. Section
4 develops the determinant model of site visits. Section 5 presents the test of the stock price
impact of site visits, Section 6 the analysis of whether the stock price changes around site visits
are predictive of firms’ future performance, and Section 7 the analysis of fund holding changes
around site visits. Section 8 concludes.
2. Institutional background and research questions
2.1 Institutional background and the practice of corporate site visits in China
Cheng et al. (2016) provide detailed discussions about corporate site visits. Corporate site
visits refer to investors’ trips to a firm’s headquarters and its production facilities. During site
visits, investors have the chance to talk to corporate employees.
Corporate site visits can be requested by institutional investors or sell-side analysts. As
mandated by the typical corporate site visit policies, investors must file an application form to
request a site visit and sign an agreement to comply with the visited firm’s corporate policies on
site visits.8 As discussed in Cheng et al. (2016), investors’ requests for site visits are usually
8 In the “Guidelines of Investor Relations Management” issued by the SZSE, the SZSE states that “Listed companies should try to accommodate the request from investors, analysts, and fund managers to visit company headquarters and project sites to the greatest extent.” The SZSE also emphasizes that “Listed companies should arrange the site visits properly so that visitors may better understand the companies’ business and operational situations.”
9
accommodated by firms as long as the requested visit dates are not in a sensitive period (i.e., the
blackout periods before earnings announcements or other significant corporate event
announcements). If the requested time is inconvenient, firms might advise a better time for
investors to visit. Firms occasionally invite institutional investors and sell-side analysts to visit,
typically in the short period after announcing earnings or significant corporate events such as
mergers and acquisitions, seasoned equity offerings, and rights offerings.
A typical site visit involves a briefing and a presentation given by the managers (usually
not top executives), a Q&A session, and a field tour of the operation facilities. During most site
visits, board secretaries, who are the de facto investor relations (IR) managers in Chinese firms,
accompany the visitors. Top executives usually do not meet with investors during site visits. To
confirm this point, we examine meeting agendas of the 4,425 site visits in 2013 and hand-collect
the information about company employees’ attendance.9 In Appendix A, we present the detailed
descriptive statistics on the types of employees involved in site visits. The involvement of a
specific type of top executives (i.e., Chairman, Vice Chairman, CEO, and CFO) ranges from
1.03% to 7.93%. As a group, these top executives are involved in 15.21% of site visits. In
contrast, IR managers attend most site visits (52.41% for board secretaries and 34.76% for the
representatives of securities affairs).
The other unique feature of site visits is that visitors can have the opportunities to observe
the firms’ operations and production facilities (Brown et al. 2015). Observing firms’
operations/assets is especially important in the site visits to manufacturing firms, as it allows
visitors to obtain first-hand, up-to-date information about the firm’s operations and
9 Since 2013, the SZSE has required listed firms to submit a detailed site visit meeting agenda, which discloses the firm’s managers involved in the site visit. For our sample period, year 2013 is the only year for which such data are available. We obtain the archives of site visit agendas from the SZSE.

10
manufacturing activities.
These unique features set apart our study from other studies on the private interactions
between investors and firms’ executives, such as Soltes (2014) on phone calls between corporate
executives and investors, Bushee et al. (2017) and Green et al. (2014) on investor conferences,
Bushee et al. (2016) on non-deal road shows, and Kirk and Markov (2016) on analyst/investor
open days. Note that the site visits studied in this paper occur in China and might differ from
those in the U.S. Also note that the other forms of private interaction events studied in prior
studies occur in the U.S.
Site visits are costly for investors because they must pay the related expenses, spend time
visiting the firm, and exert effort to collect information. Without the expected benefit of
obtaining useful information, investors would be unlikely to undertake such costly activities.
Investors can combine the information obtained from site visits with their own private
information to make better trading decisions. In addition, site visits allow visitors to confirm
some of the information cues that they previously knew but were still uncertain about. Such
confirmation is valuable because it increases the precision of visitors’ private information, and
the increased precision helps the visitors to update their forecasts of firm performance.10
Despite the importance of site visits, there are very few studies in this area. The lack of data
is the main challenge. We overcome this challenge by using the site visit data available in China.
In addition, given the opaque information environments of listed firms in China (Morck, Yeung,
and Yu 2000), site visits are an important way for investors to acquire information, and thus the
use of the China setting also increases the test power of our analysis.
10 This idea is similar to the discussion in the Conceptual Framework for Financial Reporting that “financial information is capable of making a difference in decisions if it has predictive value, confirmatory value, or both (FASB, Statement of Financial Accounting Concepts No. 8, QC7, emphasis added).”

11
We note that, as with the U.S., China prohibits managers from disclosing material non-
public information to select investors.11 As a caveat, we acknowledge that Reg. FD might not be
strictly enforced in China, although the regulators and the stock exchanges do investigate and
punish the firms that violate disclosure rules.12, 13
2.2 Research questions
We explore the following questions related to site visits.
1. Not all firms have site visits during the sample period. We first investigate why investors
visit some firms but not others. This determinant analysis will also help us address the
potential sample selection bias for the analysis of the stock price impact of site visits,
which is based on the sample of firms with site visits.
2. Do site visits impact stock prices and how does the impact vary with firm and site visit
characteristics? As discussed above, investors spend valuable resources and time on site
visits. Given their rationality, they should obtain some benefit from such visits. In addition,
the type of the collected information might vary across investors. As such, whether site
visits can impact stock prices and how such an impact varies with firm and site-visit
characteristics are empirical questions. Moreover, it is important to investigate whether our
inferences hold for the sub-sample of site visits not followed by visiting analysts' earnings
forecast issuances, the sample of site visits not studied in Cheng et al. (2016).
3. If site visits are associated with significant stock price movements, are such movements
due to investors’ false beliefs about the possibility of obtaining useful information, or are
they due to the acquisition of information related to the firm’s operations? To answer this
11 In addition, on January 30, 2007, the CSRC issued a disclosure regulation that explicitly prohibits the leakage of material non-public information in private meetings or during conference calls, road shows, investors’ site visits, and other events. 12 Violation of disclosure rules leads to enforcement actions ranging from criticism and warning to more severe outcomes such as fines or even the revocation of licenses. For example, the SZSE publicly denounces companies that selectively disclose non-public material information to select institutional investors. Note that denouncement is a typical form of regulatory sanction in China and it is not taken lightly by companies and investors. Research documents that denouncements result in negative market reactions, restricted access to bank loans, higher loan spreads, increased likelihood of receiving qualified audit opinions, and increased audit fees (Yang and Xie 2008; Zhu and Wu 2009; Chen, Zhu, and Wang 2011). 13 It is possible that investors obtain information during site visits through executives’ selective disclosure. Given that selective disclosure cannot be directly observed, it is extremely difficult, if possible at all, to provide convincing evidence that selective disclosure does or does not occur during site visits. We leave this to future research.

12
question, we investigate the association between the stock price movements around site
visits and the visited firms’ future performance.
4. Lastly, if site visits are associated with significant stock price movements, we would like to
explore the mechanism through which site visits affect stock price movements. For this
purpose, we examine whether the holding changes of visiting funds are more predictive of
the visited firms’ future performance than those of non-visiting funds. Consistent evidence
would suggest that visiting funds obtain valuable information from site visits and adjust
their portfolios accordingly.
3. Sample and data
In August 2006, the SZSE Information Fair Disclosure Guidelines became effective and
required that firms listed on the SZSE must report to the CSRC two working days before site
visits. In addition, after the site visits, all SZSE listed firms must file a report to the CSRC and
the SZSE summarizing the activities occurring during the site visits. However, the information
about site visits was not publicly available until 2008 when the SZSE issued a rule requiring the
disclosure of site visits in annual reports. The disclosure requirement became effective from
2009 and has been strictly enforced.14 Appendix B provides an example of such disclosure. As
shown in the 2012 annual report of the Guangzhou TAPAI Co., investors conducted nine site
visits to this firm during the year.15
We hand-collect information on site visits for the 2009–2013 period from the annual
reports of SZSE-listed firms. Our data include the names of visiting institutions or individuals,
the event dates and locations, and the main topics of discussion during site visits. We obtain data
14 A few companies have been publicly denounced by the SZSE for the violation of site visit disclosure requirements. As noted above, denouncements from stock exchanges have severe adverse consequences. 15 Based on our conversations with some companies and investors participating in site visits, we find that although the majority of site visits are reported as field trips to corporate headquarters, investors might also visit the manufacturing facilities, especially those located in the same city as the headquarters.

13
on stock returns, financial performance, firm characteristics, and analyst forecasts from the
CSMAR database. To calculate the market reactions around site visits, we further require the
availability of site visit dates and the stock return data over a period before the event dates and
then combine site visits on adjacent dates.16 We exclude firms in the financial industry, firms
with B-shares, firms in the China Growth Enterprise Market (GEM) section, and firms with
missing values for the variables used in the multivariate analyses. Finally, we exclude the site
visits held in hotels, those involving the press, and those occurring around earnings
announcements (on the day before, of, and after the earnings announcement date).17 Our final
sample comprises 21,189 site visits to 1,040 unique firms during the 2009–2013 period. Panel A
of Table 1 summarizes the sample selection procedure.
For firm-years with at least one site visit, the mean number of site visits per year is 7.41
(untabulated). As shown in Panel B of Table 1, the total number of site visits increased gradually
from 2,820 in 2009 to 4,425 in 2013, with the exception of 2012 when there were 5,823 site
visits. This growth is due to the increased number of firms with site visits each year. An
untabulated analysis shows that the number of visited firms increased gradually from 314 firms
in 2009 to 766 in 2013 (with the highest number of 841 in 2012), and the average frequency of
site visits per firm fluctuates over the period, ranging from 5.78 in 2013 to 9.77 in 2010.
Panel B of Table 1 also presents the timing of these site visits over calendar months. There
is no obvious clustering of site visits, except that there are slightly more in May (13.37% of all
site visits) and November (12.56%). We further investigate the visitors’ identities and find that in
16 As described below, we need stock return data for the 146 trading days before the site visit date to estimate the average 2-day absolute abnormal stock returns in the normal period. For the adjacent site visits, the event window spans over the adjacent site visit dates and we require stock return data for the 146 trading days before the first site visit date. 17 In an untabulated analysis, we further exclude site visits occurring in the three-day window [-1, +1] around the announcement of other corporate events, including mergers and acquisitions, seasoned equity offerings, right offerings, related party transactions, law suits, regulatory violations, and dividends. The inferences remain the same.

14
general, visitors do not visit the same company more than once a year. Specifically, only 12.5%
of the site visits are conducted by visitors who have visited the same firm in the same year
(untabulated). Also, when investors visit the firm in other years, they do not come in the same
month; only 5.6% of the investors who visit the same firm more than once during the sample
period conduct site visits in the same calendar month (untabulated).
Panel C of Table 1 reports the industry distribution. Due to the structure of the Chinese
economy, the majority of the firms are in the manufacturing industry. For comparison purposes,
Panel C also reports the industry distribution at the firm-year level for all of the firms listed on
the SZSE (excluding firms in the GEM section, in the financial industry, or with B shares). We
note that there is little difference in industry distribution between the sample firms and the
population of Shenzhen-listed firms.
4. Determinants of corporate site visits
Not all firms have site visits from investors. It thus begs the question why investors visit
some firms but not others. In this section, we examine the determinants of investors’ site visit
decisions. Such an analysis is also important for the later analysis on the stock price impact of
site visits. The price impact analysis is restricted to the sample of firms with site visits and is thus
potentially subject to the sample selection bias. For this purpose, we include in all following
analyses the inverse Mills ratio to control for the potential sample selection bias.18
The determinant model is built on prior research on private interactions between firms and
investors, especially Cheng et al. (2016). First, we expect a higher likelihood of corporate site
18 Note that including the inverse Mills ratio estimated from this determinant model in the later analysis cannot address the selection issue related to the timing of site visits given that investors are going to visit a firm in a particular year. As shown in Section 5.3, we conduct an additional analysis to address the impact of the potential endogeneity of the timing of site visits.

15
visits when site visits are more beneficial to investors. Specifically, site visits provide investors
with opportunities to observe operation assets and production facilities. The observation element
of corporate site visits is more effective for manufacturing firms, which have more observable
assets and production activities, than for firms in other industries. Thus, we include an indicator,
Manufacture, for manufacturing firms in the determinant model. In addition, site visits enable
investors to gain insights not only into this firm but also into its competitors in the same industry.
Investors are more likely to obtain such insights from site visits to the leading firms in the
industry. As such, we expect that the leading firms in the industry have more site visits than
other firms. We use the market share (MSHARE) and firm size (Size) to capture a specific firm’s
relative importance in its industry.
Second, we expect that investors are more likely to conduct site visits to firms for which
market participants have a higher information need, including firms followed by more analysts
and owned by more institutional investors. Thus, we include analyst coverage (ANA) and
institutional ownership (INST) in the determinant model. Moreover, prior studies suggest that
investors pay more attention to firms with better firm performance (Bushee and Miller 2012).
Therefore, we add to the model an indicator for profitable firms (Profit), firm’s stock
performance (BHAR), and the book-to-market ratio (BM).
Third, prior research argues that complex firms’ information is more difficult to interpret
(Tasker 1998; Bushee, Matsumoto, and Miller 2003). Accordingly, we argue that corporate site
visits are more important and beneficial for firms with a more complex information environment,
implying a higher likelihood of site visits for these firms. We use the natural logarithm of the
number of business segments (SEG) and firm age (Age) to capture the information complexity
(Lang 1991; Botosan 1997; Barth, Kasznik, and McNichols 2001).

16
Fourth, China’s economy is subject to strong government intervention and is dominated by
state-owned enterprises. As a result, investors might gain insights into government regulations or
policy changes by visiting state-owned enterprises. We thus include an indicator for state-owned
enterprises (SOE).19
Fifth, we expect that investors are more likely to be granted site visit opportunities when a
firm’s managers commit to a high level of disclosure and transparency (Bushee and Miller
2012). We measure managers’ commitment by using the firm’s general information quality rated
by the SZSE, with an expectation of higher likelihood of site visits for firms with high disclosure
ratings. Since 2001, the SZSE has conducted an annual evaluation of listed firms’ information
disclosure quality, classifying them into four categories, A, B, C, and D.20 We then construct an
indicator variable (High_rating) for firms with high ratings (A and B). In a similar vein, firms
have stronger incentives to improve transparency when the demand for financing is higher (Leuz
and Oberholzer-Gee 2006). Accordingly, we add leverage (LEV) to the determinant model.
Lastly, we include two city-level variables, the city level GDP growth (ΔGDP) and the
number of listed firms (NUM_Firms) in the city in which the firm is located. These two variables
capture the general economic development and information demand at the city level. Investors
are likely to visit firms in the cities that experience economic growth to better understand the
growth potential of the firms and to visit firms in cities with more listed firms so that they can
visit several firms in one trip. Other than the effect through the corporate site visits, we do not
19 Bushee et al. (2003) argue that firms with a higher level of intangibility (RD/Sales) are more likely to engage in selective disclosure in the form of closed conference calls. In an untabulated analysis, we find that RD/Sales is not significantly correlated with the likelihood of site visits. 20 Each year, after the April 30 deadline for filing annual reports, the SZSE evaluates the information disclosure quality of all listed firms. The evaluations are based on six criteria: the credibility, precision, comprehensiveness, timeliness, compliance, and fairness of information disclosure, with clear definitions and detailed rules for each criterion. The SZSE also enumerates the circumstances under which a firm receives a C or D rating. The guidelines on the information disclosure ratings are available at http://www.szse.cn/main/chinext/cybdt/39746715.shtml.

17
expect these two city-year level variables to have a direct impact on firm-level event-specific
stock returns.
Panel A of Appendix C presents the measurements of these variables. The sample for the
determinant analysis consists of all SZSE-listed firms during 2009–2013 with required data:
4,207 firm-year observations from 1,136 individual firms in the period 2009–2013.
As shown in Panel A of Table 2, 68.1% of the firm-years have at least one site visit
(D_visiti,t =1). In addition, 69.1% of these firm-years are from manufacturing firms, 92.2% from
profitable firms, 40.4% from SOEs, and 83.4% from firms with high disclosure quality. These
firms have an average market share of 7.4%, market value of 5.71 billion RMB (around 0.88
billion USD), analyst coverage of 7.64, institutional ownership of 32.9%, prior year buy-and-
hold abnormal return of 7.0%, and book-to-market ratio of 0.380. Moreover, the average number
of segments is 2.21 for these firms, with the average listing history of 7.7 years. As for the two
city-level variables, the average city-level GDP growth is 16.7%, and the average number of
listed firms at the city level is 14.2.
Panel B of Table 2 reports the results of the determinant analysis. Consistent with our
expectations, the likelihood of site visits is higher for manufacturing firms, firms with a higher
market share, larger and profitable firms, firms with higher analyst coverage, firms with higher
book-to-market ratios, firms with more business segments, firms with a longer listing history,
and firms with higher disclosure ratings.
Furthermore, investors are more likely to visit firms located in a city with a higher GDP
growth and with more listed firms in the city.
In sum, we find that site visits are more likely to occur when the benefit of conducting site
visits is expected to be higher, the demand for information is greater, and investors’ site visit

18
requests are more likely to be accommodated.
5. The stock price impact of site visits
In this section, we examine the stock price impact of site visits, based on absolute abnormal
stock returns. We first present the univariate analysis for the full sample and then the sub-
samples partitioned according to the characteristics of firms’ information environments and site
visits. We then report the multivariate regression results. We proceed to present the additional
analyses controlling for the timing of site visits and the analyses of the subsample without
visiting analysts’ issuance of earnings forecasts in the post-site visit period. Lastly, we use the
abnormal trading volume as an alternative measure of the market reaction and investigate
whether the inferences are the same.
5.1 Univariate analysis
5.1.1 Univariate analysis for the full sample
Following previous studies (Cready and Hurtt 2002; Bushee, Jung, and Miller 2011), we
measure the stock price impact of site visits using the standardized absolute value of abnormal
returns (ABN_ABSAR) in the 2-day window around site visits, i.e., the [0, +1] window.
Specifically, it is calculated as the difference between the 2-day absolute abnormal returns
around the event and the mean value of the 2-day absolute abnormal returns in the normal
period, [-146, -7] (i.e., the mean over 70 2-day windows in the normal period), divided by the
standard deviation of the 2-day absolute abnormal returns in the normal period:21
_ , , , , _ ,
_ , ,
where:
21 The inferences remain the same if we use the unscaled measure or if we use MEAN_ABSAR as the deflator.

19
ABSARi,[0,+1] = |ARi,[0,+1]|, where ARi, [0,+1] is the cumulative size-adjusted abnormal returns over the 2-day window [0, +1] around the site visit event date for firm i and the site visit date is day 0;
MEAN_ ABSARi,s = the mean of the absolute value of the 2-day cumulative size-adjusted abnormal returns over the 70 2-day windows in the normal period, [-146, -7];
STD_ ABSARi,s = the standard deviation of the absolute value of the 2-day cumulative size-adjusted abnormal returns in the normal period.
We use a 2-day event window because if the site visit occurs after trading hours, the
information will be reflected on day +1, not day 0. We exclude day -1 in the event window to
control for the potential confounding effect of any information event occurring before site visits.
The inferences are the same when we replicate all the analyses after including day -1 in the event
window (untabulated).
As shown in Table 3, the mean of ABN_ABSAR is 0.107, significant at the 0.01 level. The
standardization procedure, as explained above, can facilitate cross-sectional comparisons, but it
is difficult to showcase the economic magnitude. Thus, we also present the difference in the
absolute abnormal returns between the event window and the mean value over the normal period,
i.e., ABSARi,[0,+1] ˗ MEAN_ABSARi,s, as the percentage of the mean value of ABSAR over the
normal period. As shown in Table 3, the difference represents 9.04% of the mean value over the
normal period. Note that this is not the cumulative abnormal returns around site visits. In
comparison, we find that the average difference in the absolute abnormal returns between the
earnings announcement window and the normal period is 28.78% of the mean value over the
normal period (untabulated). That is, the stock price impact of site visits is about one-third of that
of the earnings announcements.22
22 Prior studies show an increase of 9% above the normal period for investor conference presentations (Bushee et al. 2011).

20
To shed light on whether the 2-day window around site visits is unique, we depict in Figure
1 the ABN_ABSAR for each of the seven 2-day windows around site visits in the [-6, +7] period.
The mean value increases from 0.045 for the [-6, -5] window to 0.107 for the [0, +1] window and
then decreases to 0.036 for the [+6, +7] window. Figure 1 shows a spike for the 2-day window
around site visits.
In sum, our results suggest that investors’ corporate site visits are informative events that
have a significant impact on stock prices.23 Next, we investigate how the impact varies with
firms’ information environment quality and site visits’ characteristics.
5.1.2 Firms’ information environments
Information economics theory predicts that an information event’s effect is negatively
associated with the quality of a firm’s information environment (Verrecchia 2001). It thus
follows that site visits are expected to trigger a stronger market reaction for firms with a poor
information environment due to the higher marginal effect of new information. Following
previous studies, we capture the quality of the information environment using proxies for
information dissemination, corporate reporting, and private information acquisition (Bushman,
Piotroski, and Smith 2004). Based on the data availability, we use analyst coverage (AC) to
capture the information dissemination and private information acquisition activities and an
indicator for high public disclosure quality as rated by the SZSE (High_rating) to proxy for the
corporate reporting quality.
Analyst coverage is calculated as the natural logarithm of one plus the number of unique
analysts issuing earnings forecasts during the calendar quarter before the site visit. We then
23 This result is also consistent with the possible leakage of private information and insider trading around site visits. However, this is unlikely because all visitors’ and participating managers’ names are recorded and submitted to the exchange. A detailed exploration of the possibility of insider trading is beyond the scope of the paper.

21
partition the sample into two groups based on the median analyst coverage in our sample. As
shown in Table 3, there are fewer site visits to firms with low analyst coverage than to those with
high analyst coverage (8,947 vs. 12,242) because there are many site visits with exactly the
median analyst coverage, which are included in the subsample with high analyst coverage. The
mean ABN_ABSAR is 0.153 for site visits with low analyst coverage but only 0.073 for those
with high analyst coverage. The difference between these two groups is statistically significant at
the 0.01 level.
We then partition the sample into two groups based on the ratings of public information
disclosure quality assessed by the SZSE. As shown in Table 3, there are 2,453 site visits to firms
rated as C or D, representing low disclosure quality, and 18,736 site visits to firms rated as A or
B, representing high disclosure quality.24 The mean ABN_ABSAR is 0.191 for site visits to firms
rated as C or D, and only 0.096 for site visits to firms rated as A or B, and the difference is
statistically significant at the 0.01 level.
Overall, the stock price impact is stronger for the site visits to firms with poor information
environments than for other site visits.25, 26
5.1.3 Characteristics of site visits
We first examine whether the stock price impact is stronger for group visits. The advantage
24 The distribution of the ratings in our sample is generally consistent with the population distribution. There are very few site visits to firms with a D rating, and as a result we combine them with site visits to firms with a C rating. In an untabulated analysis, we separate the site visits to firms with an A disclosure rating from those to firms with a B rating and find that while the stock price impact of site visits to the latter is slightly higher than that of visits to the former, the difference is statistically insignificant. 25 The inferences remain the same if we use the median ABN_ABSAR for the comparison of subsamples. 26 The finding that the stock price impact of site visits is weaker for firms with higher analyst coverage and higher quality disclosure might appear to be inconsistent with the finding in Table 2 that investors are more likely to visit these firms. The results in Table 2 suggest a greater aggregate benefit of visiting firms with higher analyst coverage and higher quality disclosure. Given that these firms attract a lot more site visits, the individual site visits might not trigger a larger market reaction than the site visits to other firms. Alternatively, the seemly inconsistent results might be due to the possibility that investors invest more in larger firms, which tend to have higher analyst coverage and higher disclosure quality, and they are thus more likely to visit these firms for due diligence. As such, the more frequent site visits to these firms imply that the market price impact of these site visits is smaller on average.

22
of visiting a firm with others is that visitors can obtain more information from observing and
participating in others’ discussions with the firm’s employees. In addition, group site visits can
facilitate better dissemination of the obtained information (Blankespoor, Miller, and White
2014). To test whether the effect is more pronounced for group visits, we partition the sample of
site visits into those involving only one visitor (i.e., one-on-one visits) and those involving
multiple visitors (group visits). As shown in Table 3, there are 10,454 group visits and 10,735
one-on-one visits. The average ABN_ABSAR is 0.134 for group visits but only 0.081 for one-on-
one visits, and the difference is significant at the 0.01 level.
Next, we investigate the stock price impact of site visits conducted by different types of
visitors to shed light on which types are better at gathering information from site visits and
incorporating such information into the stock prices. The literature suggests that fund managers
are usually more informed investors (Kosowski, Maik, and Teo 2007; Fama and French 2010;
Solomon and Soltes 2015). In addition, they can trade on the information they discover through
site visits. As such, we expect site visits conducted by fund managers to be associated with
stronger market reactions than other site visits (e.g., those conducted by financial analysts,
consulting firms, private equity firms, and banks). If mutual fund visitors dominate a site visit
(i.e., the visitor is a mutual fund manager for one-on-one visits, or the number of mutual fund
visitors is more than half of the total number of visitors for group visits), it is classified as a fund
visit. As Table 3 shows, there are 6,430 fund visits. The average ABN_ABSAR is larger for fund
visits than for non-fund visits (0.142 vs. 0.092) and the difference is significant at the 0.01 level.
To further examine the type of information that investors obtain through site visits, we
perform a content analysis of the topics discussed during the site visit. We manually go through
these topics and compile a list of keywords related to firm strategy, financing activities,

23
accounting information, and sales.27 We then construct an indicator variable, AF_news, coded as
1 for discussion covering accounting and finance topics. We expect that the visits in which
accounting and finance topics are discussed contain more in-depth and contextual discussions
than other site visits, which are usually related to the macro-economic situation, industry, and
market trends.28 As shown in Table 3, there are 14,580 visits during which accounting and
finance topics are discussed. The mean ABN_ABSAR is 0.124 for the site visits involving
accounting and finance topics but only 0.069 for other site visits, and the difference is
statistically significant at the 0.01 level.
In sum, we find that group visits, visits conducted by mutual fund managers, and visits
covering accounting and finance topics have a larger stock price impact than other site visits.
5.1.4 Manufacturing firms
During site visits, investors can observe firms’ operation activities and production facilities.
Compared with the site visits to firms without major manufacturing facilities or operations (e.g.,
Internet firms), those to manufacturing firms provide investors with more contextual information
and are thus likely to be more informative. To test whether this is the case, we construct an
indicator variable for the site visits to manufacturing firms and examine whether it explains the
variation in the stock price impact of site visits.
As reported in Table 3, 14,757 site visits are to manufacturing firms. The mean
ABN_ABSAR is 0.119 for site visits to manufacturing firms and only 0.081 for other site visits.
27 Words related to firm strategy include strategy, development, prospect, vision, and positioning; words related to financing include seasoned offering, bond issuance, bank loan, convertible debt, private issuance, and dividend; words related to accounting include performance, gross margin, forecast, quarterly disclosure, and annual disclosure; words related to sales include price, sales, order, product, distribution, operations, marketing, clientele, chain, and store. 28 In an untabulated robustness check, we confirm that our measure of covering accounting and finance topics is not a manifestation of how detailed a firm reports the agenda of its site visits. There is a large variation regarding whether such topics are discussed during site visits within the same firm over time.

24
The difference is significant at the 0.05 level.
5.2 Multivariate analysis of the stock price impact
In this section, we conduct multivariate analyses to ensure that the results from univariate
analyses are robust. For this purpose, we control for the variables that might affect the market
reactions around site visits and the potential sample selection bias. To control for the potential
sample selection bias, we adopt the Heckman approach (Heckman 1979). We first calculate the
inverse Mills ratio (IMR) based on the determinant model presented in Table 2 and then add
IMR to the multivariate regressions throughout the study.
We identify three sets of variables that might affect the stock price impact of site visits.
First, we include three variables to alleviate the concern that the market reaction is confounded
by the information events occurring right before site visits: the buy-and-hold market-adjusted
return in the previous year (RET), the absolute value of the buy-and-hold market-adjusted return
in the month ending 7 days before the site visit (ABSAR_pre_visit), and the average monthly
share turnover in the previous year (Turnover). Second, as pointed out in Bushee et al. (2011),
some firm characteristics may be associated with managers’ incentives to meet with investors
privately, including firms’ profitability and risk. As such, we include the book-to-market ratio
(BM), the change in net income (ΔNI), and sales growth (Growth) to capture firm profitability,
and firm size (Size), firm leverage (Leverage), stock beta (Beta), and firm age (Age) to capture
firm risk. Third, as suggested by Bushee et al. (2017), there might be a positive association
between the general market activity and the market reaction in the site-visit event window. To
control for contemporaneous market activity, we include two variables: (1) absolute market
returns, calculated as the absolute value of cumulative daily market returns over the event
window [0, +1]; and (2) contemporaneous market trading volume, calculated as the market value

25
of all shares traded in the market over the event window [0, +1], divided by the total market cap
at the end of the previous week. Panel B of Appendix C presents the variable definitions, and
Panel A of Table 4 presents the descriptive statistics. We also control for industry and year fixed
effects in the regressions.
Panel B of Table 4 presents the regression results. All of the t-statistics are calculated based
on the standard errors adjusted for firm-level clustering. We first report the regression results for
the two measures of firm information environment, including analyst coverage (AC) and the
rating of disclosure quality (High_rating). As reported in Column (1), ABN_ABSAR is negatively
correlated with both analyst coverage (t = -3.30) and disclosure rating (t = -3.02). The results for
the control variables suggest that the stock price impact of site visits is smaller for firms with
better stock performance (RET), higher share turnover (Turnover), higher sales growth (Growth),
larger size (Size), and greater firm risk (Beta), and that the stock price impact is stronger for
firms experiencing a larger stock price change before the site visits (ABSAR_pre_visit), those
with higher book-to-market ratio (BM), and those with an improvement in profitability (∆NI).
The ABN_ABSAR is also higher when the market experiences a large price movement
(Market_return_[0,+1]) and more intensive trading (Market_trading_[0,+1]).
We then examine how the stock price impact of site visits varies with site visits
characteristics, including the number of visitors (Num_visitor), the fund visit indicator
(Funds_visitor), and the indicator for site visits covering accounting and finance topics
(AF_news). As reported in Column (2), ABN_ABSAR is positively correlated with the number of
visitors (t = 5.80), the indicator for fund visits (t = 2.26), and the indicator AF_news (t = 1.99).29
We further examine whether the stock price impact of site visits is stronger for
29 Alternatively, we use an indicator variable for group visits and find that, as in the univariate analysis, group visits are associated with stronger market reactions.

26
manufacturing firms. The coefficient on the indicator for site visits to manufacturing firms is
significantly positive (t = 2.46), as reported in Column (3), indicating that the stock price impact
of site visits to manufacturing firms is greater than that of other site visits.
When we include all of the above variables simultaneously in Column (4), the inferences
remain the same.
Overall, the results from the multivariate regressions are consistent with those from the
univariate analyses. The stock price impact is stronger for the site visits to firms with poor
information environments, for site visits conducted by a larger group of visitors or by mutual
fund managers, for site visits covering accounting and finance topics, and for site visits to
manufacturing firms.
5.3 Endogeneity of the timing of site visits
As discussed above, whether a firm has a site visit is potentially endogeneous. We control
for this potential endogeneity by including the inverse Mills ratio in the regression analyses.
However, given a firm has a site visit, its timing can be endogenous as well. It is possible that
investors visit a firm when it has recently had, or will soon have, an important announcement.
We control for this confounding effect by excluding site visits around corporate earnings
announcements in the sample selection procedure and further exclude those around other
corporate announcements in a sensitivity test. To further address this concern, we follow
Hirshleifer, Myers, Myers, and Toeh (2008) in identifying some variables that can potentially
affect the timing of site visits and then add these variables to the main regression. If the
coefficients on the variables of interest do not become smaller in magnitude or less significant,
then the timing of site visits is unlikely to have a significant impact on our inferences.30
30 We thank one of the reviewers for this suggestion.

27
Table 5 presents these regression results. For brevity, we present only the coefficients on
the variables of interest (i.e., the information environment variables, site visit characteristics and
manufacturing firm indicator) and the coefficients on the additional control variables for the
timing of site visits. As shown in the table, adding these additional control variables related to
the timing choices of site visits does not materially affect the coefficients on our variables of
interest. More specifically, Column (1) reproduces the main results in Column (4) of Table 4 for
comparison. Column (2) reports the results after adding the absolute abnormal returns on day -1
(ABSAR(-1)). If investors tend to conduct site visits after important corporate announcements, its
effect should be captured by the absolute abnormal returns on day -1. As shown in Column (2),
the coefficients on all variables of interest are largely the same as those reported in Column (1),
with the exception of Fund_Visitor; its coefficient changes from 0.0427 to 0.0364, or a 15%
decrease, not a large change.
Column (3) reports the results after adding the indicator for site visits that occur in the
event window of major corporate events such as mergers and acquisitions, seasoned equity
offerings, right offerings, related party transactions, law suits, regulatory violations, and
dividends (Bigevent). The regression results show that the coefficients on all variables of interest
are largely the same as those reported in Column (1).
Column (4) reports the results after adding the indicator for adjacent site visits (Adjacent).
Note that in the sample selection, we combined the adjacent site visits into one event, but the
existence of adjacent site visits might suggest that some unidentified corporate events drive site
visit behavior. As reported in Column (4), the coefficients on all variables of interest are largely
the same as those reported in Column (1), with the exception of Num_Visitor; its coefficient
changes from 0.2032 to 0.1601, or a 21% decrease. However, this change might be mechanical

28
because the number of visitors is naturally larger when adjacent visits are combined together.
Column (5) reports the results after adding the indicators for three calendar quarters, Q1,
Q2, and Q3, to capture the potential site visit preference for specific quarters. As reported in the
table, these three indicators are not significant and the coefficients on all variables of interest are
almost the same as those reported in Column (1).
Column (6) reports the results after including all the additional variables in the regression.
The coefficients on the variables of interest are similar to those in Column (1) except for
Num_Visitor (changing from 0.2032 to 0.1499). As discussed above, this drop in magnitude is
likely due to the mechanical correlation between Num_Visitor and Adjacent.
In sum, these tests suggest that our main inferences are unlikely to be driven by the timing
of site visits, at least based on the observed and selected timing variables.31 As such, the
selection of site visit timing based on (time-variant) unobservables would have to be very large
(and unrelated to the observables that we control for) if it were to explain our results. However,
we acknowledge that we cannot completely rule out this alternative explanation.
5.4 Sample partition based on visiting analysts’ issuance of earnings forecasts
In this section, we examine whether our inferences hold when site visits are not followed
by visiting analysts’ earnings forecasts. The motivation for this analysis is to further distinguish
our study from prior studies of analysts’ forecast accuracy around site visits. As discussed above,
Cheng et al. (2016) document an improvement in analyst forecast accuracy after their site visits.
However, such evidence might not imply that site visits in general are informative for two
31 In an alternative test, we use these timing variables to explain the market reaction around site visits and then use the predicted value as the dependent variable to replicate the test in Table 4. We find that the coefficients on the variables of interest are insignificant. These results suggest that timing of site visits is not driving our results. Christensen, Hail, and Leuz (2016) use this approach to address the event timing issue in their context.

29
reasons. First, the proportion of site visits followed by visiting analysts’ forecasts is small.
Within our sample of 21,189 site visits, only 3,404 site visits, i.e., 16% of the full sample, are
followed by earnings forecasts issued by the visiting analysts in the month after their site visits.32
As such, the results on analysts’ forecast accuracy improvement might not be generalizable to
the full sample and do not capture the overall information content of site visits for all market
participants. Second, visiting analysts might choose to issue forecasts only when the information
obtained from site visits is significant enough, potentially biasing for finding results of improved
forecast accuracy. Thus, it is unclear whether site visits are informative when they are not
followed by visiting analysts’ forecasts.
To investigate this issue, we separate the site visits followed by visiting analysts’ earnings
forecasts from other site visits. As reported in Panel A of Table 6, the mean ABN_ABSAR is
0.172 for the sample of site visits followed by visiting analysts’ earnings forecast issuances
within one month (i.e., 3,404 site visits); the mean ABN_ABSAR is 0.095 for the other site visits.
Both statistics and the difference are significant at the 0.01 level. These statistics suggest that the
stock price impact of site visits not followed by visiting analysts’ earnings forecast issuances is
significant, although the magnitude is smaller than that of other site visits.
To ensure that the results in Table 4 hold for both the subsamples, we replicate the analyses
separately for these two subsamples, and Columns (1) and (2) of Table 6, Panel B report the
regression results, respectively. For brevity, we present only the coefficients on the variables of
interest. We find that our inferences continue to hold for both subsamples, except that AF_news
is not significant for the sample of site visits not followed by visiting analysts’ earnings forecast
and that the indicator for manufacturing firms (Manufacture) is not significant for the sample of
32 While about 72.16% of our sample visits have at least one analyst involved, the majority of them are not followed by earnings forecast issuance of the visiting analysts.

30
site visits followed by visiting analysts’ forecasts. In Column (3) we present the regression
results for the full sample after adding to the regression model the indicator for the site visits
followed by visiting analysts’ earnings forecasts (Visiting_forecast). All the variables of interest
remain statistically significant, and the coefficient on Visiting_forecast is significantly positive.
In sum, these results suggest that our results on the stock price impact of site visits hold for
both subsamples and that the stock price impact is larger for site visits followed by analysts
forecasts issued by visiting analysts, highlighting the incremental contribution of this study over
prior research on analysts’ site visits.
5.5 Analysis of abnormal trading volume
In this section, we examine whether our inferences hold when we use the abnormal trading
volume around the event windows as an alternative measure to capture the market reaction.
Following Cready and Hurtt (2002), we calculate standardized abnormal trading volumes
(ABN_TURN) as follows:
_ , , , , _ ,
_ , ,
where:
TURNi, [0, +1] = the trading volumes in shares in the 2-day window [0,+1] around the site visit event day, divided by the total outstanding shares of firm i;
MEAN_TURNi,s = the mean value of 2-day trading volume over the 70 2-day windows in the normal period [-146, -7], divided by the total outstanding shares of firm i;
STD_TURNi,s = the standard deviation of the 2-day trading volumes divided by the total outstanding shares in the normal period.
The mean value of ABN_TURN is 0.314 (untabulated). The untabulated regression results
show that the two information environment variables (AC and High_rating) are significantly
negatively correlated with ABN_TURN; two features of the site visits, the number of visitors and
the indicator for mutual fund visitors (Num_visitor and Fund_visitor), are positively correlated

31
with ABN_TURN, but the indicator for accounting and finance topics (AF_news) is not
significant. The manufacturing firm indicator is also positively correlated with ABN_TURN.
Overall, the results based on trading volumes are similar to those based on stock returns except
that the indicator for site visits covering accounting and finance topics (AF_news) is not
significantly correlated with the abnormal trading volume around site visits.
6. The stock price impact of site visits and firms’ future performance
In the previous section, we document significant market reactions around site visits. It
could be argued that the documented stock price movement in the short event window is due to
investors’ biased behavior or noise trading, not to the information related to firms’ fundamental
values. To test the validity of this alternative explanation, we examine whether the stock returns
around site visits are correlated with firms’ forthcoming earnings news. For this purpose, we
measure the signed abnormal stock returns around site visits by the cumulative size-adjusted
abnormal returns (CAR) in the 2-day event window around site visits.33 As reported in Panel A of
Table 7, the average CAR is 0.1% with a negative median of -0.2%, indicating that investors
discover both good and bad news during site visits.34
For each of the site visits that occur between the earnings announcement dates for year t-1
and year t, we use two alternative measures to capture the forthcoming earnings news. The first
measure is the change in ROA from year t-1 to year t (ΔROAi,t), where ROAi,t is calculated as the
earnings before extraordinary items divided by total assets for firm i in year t. The second
33 In a robustness check, we examine alternative event windows: [-1, +1], [-2, +2], [-3, +3], and [-4, +4], and obtain the same inferences. 34 The close-to-zero mean and median of CAR suggest that the likelihood of acquiring good news from site visits is similar to that of acquiring bad news from site visits. As such, investors can only benefit from the information obtained from site visits, and one cannot trade profitably from the knowledge of the occurrence of site visits.

32
measure is the earnings surprise for the current year (UEi,t), defined as the difference between
actual EPS for year t and analysts’ consensus forecast of year t’s EPS before the site visit,
divided by the closing stock price on the second trading day after year t-1’s earnings
announcement.35 Analysts’ consensus EPS forecast is calculated based on the most recent
forecasts of year t’s EPS issued by each analyst in the six-month period before the site visit, or in
the period between year t-1’s earnings announcement date and the site visit date, whichever is
shorter. Please see the notes to Table 7 for the timeline of variable measurements. As reported in
Panel A of Table 7, the mean values of ΔROA and UE are -0.2% and -0.7%, respectively.36
Panel B of Table 7 presents the regression results of signed abnormal returns around site
visits on firms’ future performance. In the regressions, we control for the same firm
characteristics as in the above analyses, the inverse Mills ratio, and industry and year fixed
effects. All t-statistics are based on the standard errors adjusted for firm clustering. For both
regression specifications, the coefficients on the earnings news measures are significantly
positive (t = 2.54 and 5.39, respectively). These results suggest that the documented stock price
impact of site visits is unlikely to be driven by investors’ behavior bias or noise trading.
A falsification test
An alternative explanation for the above results is that they reflect a mechanical
relationship between stock returns in any 2-day window and forthcoming earnings news. In other
words, one might argue that stock returns around any 2-day window before earnings
announcements could be positively associated with forthcoming earnings news. To address this
35 The results are similar if ROA is calculated as operating income divided by total assets. Also, the results are similar when we calculate the earnings surprise using the most recent analyst EPS forecast before the site visit for the current year or when we use analysts’ consensus EPS forecast in the three months before the site visit. 36 The proportion of positive values is 47.24% for CAR, 47.21% for ΔROA, and 45.48% for UE.

33
concern, we conduct a falsification test. Specifically, for each site visit, we select the 2-day
window 30 trading days before the site visit as the pseudo site visit event and then replicate the
analysis.37 If a pseudo-event falls in the event window of an earnings announcement or a site
visit, we exclude it from the analysis. The untabulated regression results show that the
coefficients on ∆ROA and UE are not statistically significant (t = 0.87 and -0.48, respectively).
This is not surprising because there are many other reasons for stock price movements. Thus, the
results in Table 7 are not driven by the potential mechanical relationship between the stock
returns in a 2-day window and forthcoming earnings news.
In summary, we find that the stock price movements around site visits are positively
correlated with upcoming earnings news. This positive correlation is not driven by the
mechanical relationship between short-window stock returns and future earnings news or by
investors’ noise trading.38
7. Site visits and visiting funds’ holding changes
So far we have examined the stock price impact of corporate site visits at the company
level. In this section we conduct analyses to shed light on how corporate site visits affect
investors’ investment decisions and thus visited firms’ stock prices. For this purpose, we focus
on the group of visitors that can trade on the information obtained from site visits – mutual
funds. We cannot examine their trading around site visits because, as in the U.S., mutual funds’
37 As an alternative approach, we randomly select a 2-day window from the same firm-year over the non-event trading days as the pseudo site visit event. We find that the coefficient on earnings surprises is not statistically significant either (untabulated). 38 In an additional analysis, we examine the price movement in the period after site visits. If the market reaction around site visits is due to investors’ misunderstanding of the information obtained from site visits or due to their noise trading, then we would observe a reversal in stock returns after the short window of site visits. However, we do not find any evidence of stock price reversal.

34
trading data are not publicly available in China. Instead, we examine the changes in visiting
funds’ holdings of the firms that they visit in the half-year period during which the visit occurs.39
If visiting funds obtained information from site visits that is predictive of future firm
performance, then we expect the changes in these funds’ holdings of the visited firm’s stock to
be more positively correlated with upcoming earnings news than the changes in other funds’
holdings (Chen, Harford, and Li 2007).
In our sample, there are 9,990 site visit events involving at least one fund. The unit of
analysis is firm-fund-half year combinations. To better identify the effect of funds’ visits on their
holding changes, we only include the observations for funds with non-zero holdings of a specific
stock either at the beginning or the end of the half year period. To further increase the power of
our test, we restrict the sample to firm and semi-annual period combinations with at least one
visiting fund and one non-visiting fund. To facilitate the comparison between a fund’s holding of
a specific firm when the fund conducts a site visit to the firm and when it does not, we include
the firm-fund pair fixed effects in the regression model. To increase the power of the test and to
reduce an inflation of t-statistics, we further restrict the sample to firm-fund pairs with more than
three observations in the sample period. These requirements lead to a final sample of 43,868
firm-fund-half year observations.
To test our prediction, we regress the changes in fund holdings on future firm performance,
the site visit indicator for the visiting fund observations (D_Visit), and the interaction term of
these two. Our prediction implies a positive coefficient on the interaction term. Changes in fund
holdings, ΔHoldingi,j,t, is defined as the change in fund j’s holding of firm i’s stock from the
beginning to the end of the semi-annual period t, divided by firm i’s outstanding shares. We use
39 The fund holding change is based on semi-annual data because Chinese funds report their detailed holdings only in semi-annual and annual fund reports. The reporting period is based on the calendar year.

35
two alternative performance measures for the analyses, the change in ROA (ΔROAi,t+1) and future
buy-and-hold abnormal stock returns (BHARi,t+1), which are measured after the end of the semi-
annual period t. Specifically, ΔROAi,t+1 is the change in ROA based on the earnings announced
in the annual earnings announcement right after the current semi-annual period t. BHARi,t+1 is the
buy-and-hold size-adjusted abnormal return measured over the one-year period after the end of
the current semi-annual period t. Following Chen et al. (2007), we control for the firm size
(Size), book-to-market ratio (BM), lagged stock returns (BHAR), contemporaneous and lagged
share turnover (Turnover), and an end-of-year (EOY) indicator.
Table 8 reports the results, with the change in ROA as the performance measure in Column
(1) and future buy-and-hold abnormal stock returns as the performance measure in Column (2).
Consistent with our prediction, the coefficient on the interaction term is significantly positive (t =
2.09 and 1.97 in Columns (1) and (2), respectively). These results suggest that the changes in
visiting funds’ holdings of the visited firm’s stock are more predictive of the firm’s future
performance than those of non-visiting funds, consistent with the notion that visiting funds
benefit from the information obtained from site visits.
As discussed above, the stock price impact of site visits is stronger for visits to firms with
poor information environments, group visits, visits covering accounting and finance topics, and
visits to manufacturing firms. If visiting funds benefit from site visits in a similar way, then we
expect the results reported in Table 8 to be more pronounced for the above-mentioned site visits.
To empirically examine this conjecture, we regress the changes in fund holdings on future firm
performance, the site visit indicator, the above-mentioned firm or site visit characteristics
(Firm_Visit_Char), and the three-way interaction of these three variables. Specifically, we define
Firm_Visit_Char as one of the following indicator variables: the indicator for high analyst

36
coverage (High_AC), the indicator for high disclosure rating (High_rating), the indicator for
large group size (High_Num_Visitor), the indicator for site visits covering accounting and
finance topics (AF_news), and the indicator for manufacturing firms (Manufacture). Please see
notes to Table 9 for detailed variable definitions.40 Note that based on results presented in Table
4, we expect a negative coefficient on the three-way interaction term when Firm_Visit_Char is
High_AC, or High_Rating, and a positive coefficient on the three-way interaction term when
Firm_Visit_Char is High_Num_Visitor, AF_News, or Manufacture.
Table 9 reports the regression results, with Panel A using the change in ROA and Panel B
using the buy-and-hold abnormal returns as firms’ future performance measures. The empirical
results are largely consistent with our expectation. We find that the coefficients on the three-way
interaction terms are statistically significant in the expected direction, except for the
specifications with the manufacturing firm indicator. These results suggest that the information
advantage of visiting funds over non-visiting funds is more pronounced for visits to firms with
low analyst coverage, low disclosure ratings, group visits, and visits covering accounting and
finance topics.
As a caveat, fund holding changes over a semi-annual period are a coarse measure of the
fund’s investment decisions because this measure is also affected by other information events
occurring in the same period. However, such information events should affect visiting funds and
non-visiting funds in similar ways. That is, the concern about the coarseness of this measure is
largely addressed by the research design that controls for the changes in non-visiting funds’
holdings of the same firm in the same period.
40 For visiting fund observations, the site visit characteristics (i.e., AF_News, High_Num_Visitor) are based on the characteristics of their own site visits. For non-visiting fund observations, we set the value of Firm_Visit_Char based on the site visits occurring in the semi-annual period; if there are multiple site visits in the semi-annual period, we set Firm_Visit_Char based on the site visit that gives Firm_Visit_Char a higher value.

37
8. Conclusion
Corporate site visits are one important type of information acquisition activities. Using a
unique dataset of site visits in China, we find that they are associated with economically
significant market reactions. We further document that the market reactions are stronger for
firms with poor information environments, site visits conducted by larger groups of visitors, site
visits by mutual fund managers, site visits covering accounting and finance topics, and site visits
to manufacturing firms where the role of observation is more important. These findings are
robust to the correction of potential sample selection bias through the determinant analysis of site
visits. The results of the determinant model suggest that investors are more likely to visit a firm
when the expected benefits and investors’ need for information are higher. Our inferences are
robust to controlling for site visit timing and hold for the site visits that are or are not followed
by visiting analysts’ earnings forecasts.
The market reactions around site visits are not due to investors’ behavioral bias or noise
trading. We find that the abnormal stock returns around site visits are positively correlated with
firms’ forthcoming earnings news. These results are consistent with market participants
obtaining information related to firms’ fundamental values from site visits.
Finally, we show that the change in visiting funds’ holdings of the visited firm’s stock is
more predictive of the firm’s future performance than that of non-visiting funds, and the result is
more pronounced for more informative site visits. These results are consistent with the notion
that visiting funds benefit from their site visits, shedding light on how site visits have a stock
price impact.
Overall, our paper contributes to the literature by presenting the first systematic, large-

38
sample analysis of the stock price impact of site visits. The collective findings of the paper
indicate that site visits are important venues for market participants to acquire information about
firms, particularly in an emerging market and in the post-Regulation FD era. The results also
suggest that investors benefit from site visits by making informed trades, as evidenced by the
finding that the changes in visiting funds’ holdings are in the same direction as firms’ future
performance.

39
References
Abramowitz, P. 2006. The best of the buy side. Institutional Investor 40 (11): 42-50.
Barth, M. E., R. Kasznik, and M. F. McNichols. 2001. Analyst coverage and intangible assets. Journal of Accounting Research 39 (1): 1–34.
Berger, P. G., C. G. Ham, and Z. R. Kaplan. 2016. Do analysts say anything about earnings without revising their earnings forecasts? Working paper, University of Chicago.
Bernhardt, D., C. Wan, and Z. Xiao. 2016. The reluctant analyst. Journal of Accounting Research 54 (4): 987-1040.
Blankespoor, E., G. S. Miller, and H. D. White. 2014. The role of dissemination in market liquidity: Evidence from firms’ use of Twitter. The Accounting Review 89 (1): 79-112.
Botosan, C.A. 1997. Disclosure level and the cost of equity capital. The Accounting Review 72(3): 323-349.
Brown, L. D., A. C. Call, M. B. Clement, and N. Y. Sharp. 2015. Inside the ‘Black Box’ of sell-side financial analysts. Journal of Accounting Research 53(1): 1-47.
Bushee, B. J., and G. S. Miller. 2012. Investor relations, firm visibility, and investor following. The Accounting Review 87 (3): 867–897.
Bushee, B. J., D. A. Matsumoto, and G. S. Miller. 2003. Open versus closed conference calls: The determinants and effects of broadening access to disclosure. Journal of Accounting and Economics 34 (1–3): 149–180.
Bushee, B. J., J. J. Gerakos, and L. F. Lee. 2016. Corporate jets and private meetings with investors. Working paper, University of Pennsylvania, Dartmouth College, and Boston College.
Bushee, B. J., M. J. Jung, and G. S. Miller. 2011. Conference presentations and the disclosure milieu. Journal of Accounting Research 49 (5): 1163–1192.
Bushee, B. J., M. J. Jung, and G. S. Miller. 2017. Do investors benefit from selective access to management? Journal of Financial Reporting, Forthcoming.
Bushman, R. M., J. D. Piotroski, and A. J. Smith. 2004. What determines corporate transparency? Journal of Accounting Research 42 (2): 207-252.
Chen, X., J. Harford, and K. Li. 2007. Monitoring: Which institutions matter? Journal of Financial Economics 86 (2): 279-305.
Chen, Y., S. Zhu, and Y. Wang. 2011. Corporate fraud and bank loans: Evidence from China. China Journal of Accounting Research 4 (3): 155-165.
Cheng, Q., F. Du, X. Wang, and Y. Wang. 2016. Seeing is believing: Analysts’ corporate site visits. Review of Accounting Studies 21 (4): 1245-1286.
Christensen, H. B., L. Hail, and C. Leuz. 2016. Capital-market effect of securities regulation: Prior conditions, implementation, and enforcement. Review of Financial Studies 29 (11): 2885-2924.
Cready, W. M., and D. N. Hurtt. 2002. Assessing investor response to information events using return and volume metrics. The Accounting Review 77 (4): 891-909.
Fama, E. F., and K. R. French. 1992. The cross-section of expected stock returns. Journal of Finance 47 (2): 427-465.
Fama, E. F., and K. R. French. 2010. Luck versus skill in the cross-section of mutual fund returns.

40
Journal of Finance 65 (5): 1915-1947.
Green, T. C., R. Jame, S. Markov, and M. Subasi. 2014. Access to management and the informativeness of analyst research. Journal of Financial Economics 114: 239-255.
Heckman, J.J. 1979. Sample selection bias as a specification error. Econometrica 47(1): 153-161.
Hirshleifer, D. A., J. N. Myers, L. A. Myers, and S. H. Teoh. 2008. Do individual investors cause post-earnings announcement drift? Direct evidence from personal trades. The Accounting Review 83: 1521-1550.
Institutional Investor’s 2012 All-Europe Research Team Survey. 2012. www.institutionalinvestor.com.
Jackson, H. 2009. America’s most shareholder friendly companies. Institutional Investor 43 (2): 57-61.
Kirk, M., and S. Markov. 2016. Come on over: Analyst/investor days as a disclosure medium. The Accounting Review 91 (6): 1725-1750.
Kosowski, R., N. Y. Naik, and M. Teo. 2007. Do hedge funds deliver alpha? A bayesian and bootstrap analysis. Journal of Financial Economics, 84 (1): 229-264.
Lang, M. 1991. Time-varying stock price response to earnings induced by uncertainty about the time-series process of earnings. Journal of Accounting Research 29 (2): 229–257.
Leuz, C., and Oberholzer-Gee, F. 2006. Political relationships, global financing, and corporate transparency: Evidence from Indonesia. Journal of Financial Economics 81 (2), 411-439.
Li, E. X., K. Ramesh, M. Shen, and J. S. Wu. 2015. Do analysts stock recommendations piggyback on recent corporate news? An analysis of regular-hour and after-hours revisions. Journal of Accounting Research 53 (4): 821-861.
Morck, R., B. Yeung, and W. Yu. 2000. The information content of stock markets: Why do emerging markets have synchronous stock price movements? Journal of Financial Economics 58 (1-2): 215-260.
Muddy Waters. 2010. Research report on Orient Paper Inc. Available at: http://www.muddywatersresearch.com/research/orient-paper-inc/initiating-coverage-onp/.
Securities and Exchange Commission (SEC). 2001. Special study: Regulation fair disclosure revisited. Available at: http://www.sec.gov/news/studies/regfdstudy.htm.
Shenzhen Stock Exchange (SZSE). 2011. Guidelines on evaluation of disclosure quality of Shenzhen-listed companies. Available at: http://www.szse.cn/main/chinext/cybdt/39746715.shtml.
Solomon, D. H., and E. F. Soltes. 2015. What are we meeting for? The consequences of private meetings with investors. Journal of Law and Economics 58 (2): 325-355.
Soltes, E. 2014. Private interaction between firm management and sell-side analysts. Journal of Accounting Research 52 (1): 245-272.
Tasker, S. C. 1998. Bridging the information gap: Quarterly conference calls as a medium for voluntary disclosure. Review of Accounting Studies 3 (1): 137-167.
Verrecchia, R. E. 2001. Essays on disclosure. Journal of Accounting and Economics 32 (1-3): 97-180.
Yang, Z., and X. Xie. 2008. Economic consequence of fraudulent financial reporting of China’s listed companies: Market reaction on publicity of penalty by CSRC and Ministry of Finance. Audit Research (In Chinese) 4 (1): 67-74.
Yezegel, A. 2015. Why do analysts revise their stock recommendations after earnings announcements? Journal of Accounting and Economics 59: 163-181.

41
Zhu, C., and L. Wu. 2009. The auditors’ reaction to the companies’ accounting and financial irregularities: Analysis of the punishment bulletins of the CSRC, SSE, and SZSE. Audit Research (In Chinese) 4 (4): 42-51.

42
APPENDIX A Type of employees involved in corporate site visits
Appendix A presents the statistics on the presence of top executives (Chairman, Vice Chairman, CEO, and CFO) and other employees in the 4,425 corporate site visits to 766 individual firms in 2013 for which companies submitted meeting agendas to the SZSE. Note that multiple executives and employees might be involved in the same site visit. The meeting agendas, which are archived by the SZSE, provide the information about the participating managers. Note that the meeting agendas are not publicly available for the 2009–2012 period.
# of site visits %
Chairman of the Board 351 7.93% Vice Chairman of the Board 46 1.03% CEO 260 5.88% CFO 283 6.40% Unique site visits involving any top executive as listed above 673 15.21% Board Secretary 2,319 52.41% Representatives for Securities Affairs 1,538 34.76% Other middle-level managers and other employees 2,965 67.01%
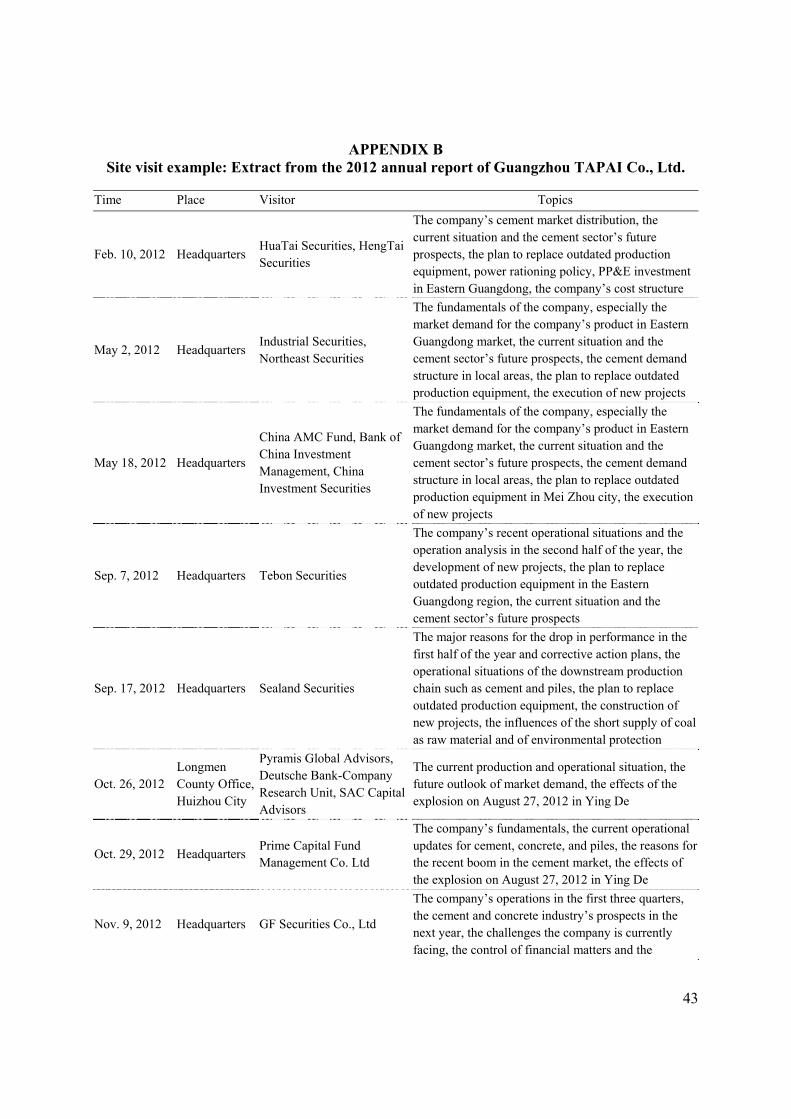
43
APPENDIX B Site visit example: Extract from the 2012 annual report of Guangzhou TAPAI Co., Ltd.
Time Place Visitor Topics
Feb. 10, 2012 Headquarters HuaTai Securities, HengTai Securities
The company’s cement market distribution, the current situation and the cement sector’s future prospects, the plan to replace outdated production equipment, power rationing policy, PP&E investment in Eastern Guangdong, the company’s cost structure
May 2, 2012 Headquarters Industrial Securities, Northeast Securities
The fundamentals of the company, especially the market demand for the company’s product in Eastern Guangdong market, the current situation and the cement sector’s future prospects, the cement demand structure in local areas, the plan to replace outdated production equipment, the execution of new projects
May 18, 2012 Headquarters
China AMC Fund, Bank of China Investment Management, China Investment Securities
The fundamentals of the company, especially the market demand for the company’s product in Eastern Guangdong market, the current situation and the cement sector’s future prospects, the cement demand structure in local areas, the plan to replace outdated production equipment in Mei Zhou city, the execution of new projects
Sep. 7, 2012 Headquarters Tebon Securities
The company’s recent operational situations and the operation analysis in the second half of the year, the development of new projects, the plan to replace outdated production equipment in the Eastern Guangdong region, the current situation and the cement sector’s future prospects
Sep. 17, 2012 Headquarters Sealand Securities
The major reasons for the drop in performance in the first half of the year and corrective action plans, the operational situations of the downstream production chain such as cement and piles, the plan to replace outdated production equipment, the construction of new projects, the influences of the short supply of coal as raw material and of environmental protection
Oct. 26, 2012 Longmen County Office, Huizhou City
Pyramis Global Advisors, Deutsche Bank-Company Research Unit, SAC Capital Advisors
The current production and operational situation, the future outlook of market demand, the effects of the explosion on August 27, 2012 in Ying De
Oct. 29, 2012 Headquarters Prime Capital Fund Management Co. Ltd
The company’s fundamentals, the current operational updates for cement, concrete, and piles, the reasons for the recent boom in the cement market, the effects of the explosion on August 27, 2012 in Ying De
Nov. 9, 2012 Headquarters GF Securities Co., Ltd
The company’s operations in the first three quarters, the cement and concrete industry’s prospects in the next year, the challenges the company is currently facing, the control of financial matters and the

44
collection of account receivables for the concrete mixing company that was recently acquired
Dec. 20, 2012 Headquarters Guotai Junan Securities The company’s fundamentals, the production and operation situation in the fourth quarter, industry trend analysis of the cement and concrete sector

45
APPENDIX C Variable definitions
Panel A: Variable definitions for the determinant model
Dependent Variable
D_visiti,t = An indicator variable for site visit at the firm-year level, coded as 1 if firm i receives at least one site visit in year t, and 0 otherwise.
Independent Variables Manufaturei,t-1 = Indicator variable for manufacturing firms; it equals 1 if the firm is a
manufacturing firm, 0 otherwise. Manufacturing firms refer to firms with industry code in the Manufacturing division (C13-C42) based on the CSRC 2012 industry classification.
MSHAREi,t-1 = Sales of firm i divided by the sum of sales of all listed firms that belong to the same 2-digit CSRC industry code in year t-1.
Sizei,t-1 = The natural logarithm of the market value of firm i in year t-1. ANAi,t-1 = Analyst coverage, measured as the natural logarithm of 1 plus the total number of
analysts issuing earnings forecasts for firm i in year t-1. INSTi,t-1 = The ownership of institutional investors in year t-1. Profiti,t-1 = An indicator variable for profitable firms, coded as 1 if firm i has an operating
profit in year t-1. BHARi,t-1 = The buy-and-hold market adjusted abnormal return of firm i in year t-1. BM i,t-1 = The book-to-market ratio of firm i in year t-1. SEGi,t-1 = The natural logarithm of the total number of business segments of firm i in year t-1. Agei,t-1 = Firm age, measured as the natural logarithm of 1 plus the number of years since
firm i obtained listing status until year t-1. SOEi,t-1 = An indicator for state-owned enterprises; it is coded as 1 if firm i is a state-owned
enterprise, and 0 otherwise. High_ratingi,t-1 = An indicator variable that equals 1 for A or B disclosure ratings, and 0 for C or D
disclosure ratings. The information disclosure quality rating assigned by the Shenzhen Stock Exchange to the listed firms are classified into A, B, C, and D.
LEVi,t-1 = Leverage of firm i in year t-1, defined as the ratio of total debt to total assets. ∆GDPi,t-1 = The growth of GDP of the city, in which the firm’s headquarters are, calculated as
the city’s GDP in year t-1 divided by the GDP in year t-2, minus 1. Num_Firmsi,t-1 = The natural logarithm of the number of listed firms in the city, in which the firm’s
headquarters are, in year t-1,

46
Panel B: Variable definitions for the market reaction analysis
Dependent Variables
ABN_ABSAR = The difference between the absolute value of 2-day cumulative size-adjusted abnormal returns in the event period and the mean of the absolute value of 2-day cumulative size-adjusted abnormal returns in the normal period, [-146, -7] before the site visits, divided by the standard deviation of the absolute 2-day cumulative size-adjusted abnormal returns in the normal period. We follow Fama and French’s (1992) method in constructing the size portfolios of listed companies based on firms’ market values at the end of the previous year.
Information Environment Variables
AC = Analyst coverage, measured as the natural logarithm of 1 plus the total number of analysts issuing earnings forecasts in the most recent calendar quarter before the site visit date.
High_rating = An indicator variable that equals 1 for A or B disclosure ratings, and 0 for C or D disclosure ratings. The information disclosure quality rating assigned by the Shenzhen Stock Exchange to the listed companies are classified into A, B, C, and D.
Visit Characteristic Variables
Num_visitor = Natural logarithm of the number of visitors in a site visit. Fund_visitor = An indicator variable for mutual fund visits. Coded as 1 if the number of mutual
fund visitors accounts for more than 50% of the total number of visitors in a site visit, and 0 otherwise.
AF_news = An indicator variable for site visits covering accounting and finance topics, including strategy, financing, accounting, and sales. Words related to firm strategy include strategy, development, prospect, vision, and positioning; words related to financing include seasoned offering, bond issuance, bank loan, convertible debt, private issuance, and dividend; words related to accounting include performance, gross margin, forecast, quarterly disclosure, and annual disclosure; words related to sales include price, sales, order, product, distribution, operations, marketing, clientele, chain, and store.
Manufacture = An indicator variable for site visits to manufacturing firms; it equals 1 for site visits to manufacturing firms and 0 otherwise. Manufacturing firms refer to firms with industry code in the Manufacturing division (C13-C42) based on the CSRC 2012 industry classification.
Control Variables RET = The buy-and-hold market-adjusted abnormal return in the year ending 30 days before
the site visit. ABSAR_pre_visit = The absolute value of the buy-and-hold market-adjusted abnormal return in the
month ending 7 days before the site visit. Turnover = The average monthly share turnover, computed as the number of shares traded
divided by the number of shares outstanding, for the year ending 30 days before the site visit.
BM = The book-to-market ratio for the fiscal year before the site visit. ΔNI = The change in net income in year t-1, divided by total assets in year t-2. Growth = Sales growth for the fiscal year before the site visit, calculated as the ratio of total
sales in the previous year divided by total sales in year t-2. Size = The natural logarithm of the market value of the firm in year t-1. LEV = The leverage ratio in the fiscal year before the site visit, defined as the ratio of total
debt divided by total assets. Beta = Stock beta, calculated over the period from day -220 to day -11 before the site visit. Age = Firm age, measured as the natural logarithm of 1 plus the number of years the firm
has been listed on the exchange up to the fiscal year before the site visit.

47
Market_return_[0,+1] = The absolute value of cumulative daily market returns on the day of and after a site visit.
Market_trading_[0,+1] = The market value of all shares traded on the market on the day of and after a site visit, divided by the total market cap at the end of previous week.
Panel C: Variable definitions for the analysis of funds’ holding changes Dependent Variables
ΔHoldingi,j,t = The change in fund j’s holding of firm i’s stock from the beginning to the end of the semi-annual period t, divided by firm i’s outstanding shares.
Independent Variables
D_Visit i,j,t = An indicator variable for site visit; it equals 1 if fund j visits firm i at least once during the semi-annual period t, and zero otherwise.
ΔROAi,t+1 = The change in ROA in the forthcoming annual earnings announcements (i.e., the earnings announcement right after semi-annual period t).
BHARi,t+1 = The buy-and-hold size-adjusted abnormal return in the one-year period after the end of semi-annual period t.
Control Variables Sizei,t = The logarithm of the total market value at the end of the semi-annual period t. BM i,t = The book-to-market ratio at the end of semi-annual period t. BHAR i,t-1 = The buy-and-hold abnormal return in semi-annual period t-1. Turnover i,t = The total trading volume divided by outstanding shares in semi-annual period t. Turnover i,t-1 = The total trading volume divided by outstanding shares in semi-annual period t-1. EOYi,t = An indicator that equals 1 for the firm-fund-half year observations pertaining to
the second semi-annual period of a calendar year.

48
FIGURE 1 Standardized Absolute Size-adjusted Abnormal Returns around Site Visits
This figure depicts the mean 2-day ABN_ABSAR during the [-6, +7] period around corporate site visits. ABN_ABSAR is calculated as the difference between the absolute value of 2-day cumulative size-adjusted abnormal returns and the mean value of absolute 2-day cumulative size-adjusted abnormal returns over the normal period, [-146, -7], divided by the standard deviation of absolute 2-day cumulative size-adjusted abnormal returns over the normal period.
0
0.02
0.04
0.06
0.08
0.1
0.12
(‐6,‐5) (‐4,‐3) (‐2,‐1) (0,1) (2,3) (4,5) (6,7)
ABN_ABSAR

49
TABLE 1 Sample selection and distribution of site visits
This table reports the sample selection and distribution of site visits. Panel A presents the sample selection for our sample of 21,189 site visit events and 2,859 firm-years for Shenzhen-listed firms during the 2009-2013 period. Panel B reports the distribution of site visits by calendar year and month and Panel C by industry. Panel A: Sample selection
# of site visits
# firms # firm-years
All site visits 34,589 1,432 3,991 After deleting firms with B-shares and firms in the GEM sector 29,508 1,082 3,249 After deleting firms in the financial industries 29,274 1,076 3,229 After deleting site visits without specific event dates 28,949 1,068 3,174 After deleting site visits held in hotels 28,766 1,066 3,160 After deleting site visits involving the press 28,272 1,061 3,128 After combining site visits on adjacent dates 24,988 1,061 3,128 After deleting site visits around earnings announcements 23,772 1,060 3,113 After deleting site visits with missing control variables for regressions 21,189 1,040 2,859

50
TABLE 1 (Cont’d) Panel B: Sample distribution by calendar year and month Total 2009 2010 2011 2012 2013
Month # of visits % of total
visits # of visits
% of total visits
# of visits% of total
visits # of visits
% of total visits
# of visits% of total
visits # of visits
% of total visits
1 1,256 5.93% 78 2.77% 307 8.10% 250 5.77% 227 3.90% 394 8.90%
2 1,253 5.91% 250 8.87% 132 3.48% 180 4.16% 523 8.98% 168 3.80%
3 1,742 8.22% 260 9.22% 420 11.08% 334 7.71% 450 7.73% 278 6.28%
4 1,203 5.68% 189 6.70% 284 7.50% 250 5.77% 290 4.98% 190 4.29%
5 2,833 13.37% 290 10.28% 402 10.61% 583 13.46% 911 15.64% 647 14.62%
6 2,095 9.89% 248 8.79% 308 8.13% 473 10.92% 695 11.94% 371 8.38%
7 1,724 8.14% 268 9.50% 313 8.26% 341 7.87% 433 7.44% 369 8.34%
8 1,551 7.32% 221 7.84% 269 7.10% 352 8.13% 387 6.65% 322 7.28%
9 2,067 9.76% 242 8.58% 363 9.58% 476 10.99% 581 9.98% 405 9.15%
10 843 3.98% 154 5.46% 169 4.46% 160 3.69% 190 3.26% 170 3.84%
11 2,661 12.56% 339 12.02% 447 11.80% 508 11.73% 724 12.43% 643 14.53%
12 1,961 9.25% 281 9.96% 375 9.90% 425 9.81% 412 7.08% 468 10.58%
Total 21,189 100.00% 2,820 100% 3,789 100% 4,332 100% 5,823 100% 4,425 100%

51
TABLE 1 (Cont’d) Panel C: Sample distribution by industry
This table reports the sample distribution by industry at the firm and firm-year levels. It also reports the distribution of the firm-years of all the firms listed on the Shenzhen Stock Exchange in the 2009-2013 period (excluding the firms in the GEM section, with B shares, or in the financial industry).
Industry categories
Sample firms Sample firm-years Firm-years of all
Shenzhen listed firms
# % # % # %
A Agriculture, forestry, livestock farming, fishery 19 1.83 52 1.82 85 1.65
B Mining 21 2.02 51 1.78 104 2.02
C Manufacturing 741 71.25 1990 69.60 3,585 69.72
D Utilities 27 2.60 86 3.01 155 3.01
E Construction 25 2.40 62 2.17 118 2.29
F Wholesale and retail 52 5.00 171 5.98 272 5.29
G Transportation 20 1.92 62 2.17 93 1.81
H Hotel and catering industry 8 0.77 22 0.77 50 0.97
I Information transmission, software, and IT service 36 3.46 94 3.29 173 3.36
K Real estate 50 4.81 161 5.63 304 5.91
L Leasing and commerce service 9 0.87 27 0.94 48 0.93
M Scientific research and technology service 6 0.58 14 0.49 18 0.35
N Water conservancy, environment, and public facilities 15 1.44 40 1.40 70 1.36
R Culture, sports, and entertainment 4 0.38 7 0.24 32 0.62
S Comprehensive 7 0.67 20 0.70 35 0.68
Total 1,040 100% 2,859 100% 5,142 100%

52
TABLE 2 Determinant analysis of site visits
Panel A of the table presents the descriptive statistics for all firm-year level variables included in the regression. Panel B of the table presents the regression results of the likelihood of site visits on the potential determinants based on the following regression:
_ , , , , , ,
, , , , , , _ , , ∆ , _ , ,
D_visiti,t equals one if the firm-year has at least one site visit and zero otherwise. The definitions of the independent variables are shown in Panel A of Appendix C. The sample consists of 4,207 firm-years from 1,136 Shenzhen-listed firms in the 2009-2013 period with the required data for the regressions. The statistics of ∆GDP and NUM_Firms are reported at the city-year level. Z-statistics reported in parentheses. ***, **, * indicate the coefficients that are significant at the 0.01, 0.05, and 0.10 levels, respectively, based on two-tailed statistical tests. Panel A: Descriptive statistics N Mean Std P25 Median P75
D_visiti,t 4,207 0.681 0.466 0.000 1.000 1.000
Manufacturei,t-1 4,207 0.691 0.462 0.000 1.000 1.000
MSHAREi,t-1 4,207 0.074 0.197 0.003 0.008 0.034
Sizei,t-1 (raw, in millions) 4,207 5,712 9,379 1,882 3,120 5,714
ANAi,t-1 4,207 7.636 8.607 1.000 5.000 12.000
INSTi,t-1 4,207 32.870 23.571 11.814 29.472 50.947
Profiti,t-1 4,207 0.922 0.269 1.000 1.000 1.000
BHARi,t-1 4,207 0.070 0.531 -0.183 -0.022 0.204
BMi,t-1 4,207 0.380 0.255 0.213 0.333 0.495
SEGi,t-1 (raw) 4,207 2.213 1.606 1.000 2.000 3.000
Agei,t-1 (raw, in years) 4,207 7.680 5.981 2.000 5.000 13.000
SOEi,t-1 4,207 0.404 0.491 0.000 0.000 1.000
High_ratingi,t-1 4,207 0.834 0.372 1.000 1.000 1.000
Levi,t-1 4,207 0.120 0.338 0.007 0.042 0.193
∆GDPi,t-1 839 0.167 0.066 0.123 0.169 0.213
NUM_Firmsi,t-1 (raw) 839 14.226 30.094 3.000 5.000 16.000

53
TABLE 2 (Cont’d)
Panel B: Regression results D_visiti,t
Manufacturei,t-1 0.1322** (2.08) MSHAREi,t-1 0.0253* (1.65) Sizei,t-1 0.2534*** (6.07) ANAi,t-1 0.2078*** (7.38) INSTi,t-1 -0.0012 (-0.94) Profiti,t-1 0.2308*** (2.69) BHARi,t-1 -0.0631 (-1.46) BMi,t-1 0.8948*** (6.81) SEGi,t-1 0.1401** (2.14) Agei,t-1 0.1943*** (4.83) SOEi,t-1 -0.1059 (-1.61) High_ratingi,t-1 0.2584*** (4.19) Levi,t-1 0.0155 (0.20) ∆GDPi,t-1 1.6294*** (4.55) NUM_Firmsi,t-1 0.0462** (2.38) Constant -6.9378*** (-7.54) Observations 4,207 Pseudo R2 0.106

54
TABLE 3 Univariate analysis of the stock price impact of corporate site visits
This table reports the standardized absolute abnormal returns (ABN_ABSAR) in the 2-day event windows around site visits, and the proportional difference in absolute abnormal return (ABSAR) between the event window and the normal period. The full sample consists of 21,189 site visits to 1,040 Shenzhen-listed firms in the 2009-2013 period. This table also reports the univariate analysis of sub-samples based on six sample partition criteria, including the number of analysts following the firm before the site visit (AC), the disclosure rating assigned by the Shenzhen Stock Exchange (High_rating), the number of visitors for each site visit (Num_visitor), the indicator for mutual fund visitors (Fund_visitor), whether accounting and finance topics are discussed during site visits (AF_news), and whether the visited firm is a manufacturing firm (Manufacture). ***, **, and * indicate significance at the 0.01, 0.05, and 0.10 levels, respectively, based on two-tailed tests.
Partition criteria
Samples Obs.
ABN_ABSARi,[0,+1] Difference in ABSAR
between the event window and the normal period
Mean T-value (% of normal ABSAR)
Full Sample 21,189 0.107*** 13.68 9.04%
Analyst coverage
Low coverage 8,947 0.153*** 12.37 14.16%
High coverage 12,242 0.073*** 7.28 5.36%
Low – High 0.080*** 5.01
Disclosure rating
Low rating (C or D) 2,453 0.191*** 7.66 13.69%
High rating (A or B) 18,736 0.096*** 11.68 6.39%
Low – High 0.095*** 3.62
Number of visitors
Group 10,454 0.134*** 12.00 10.71%
One-on-one 10,735 0.081*** 7.37 7.27%
Group – One-on-one 0.053*** 3.40
Visitor type
Funds 6,430 0.142*** 9.65 11.50%
Non-Funds 14,759 0.092*** 9.96 7.73%
Funds – Non-Funds 0.050*** 2.87
Discussion topics
Accounting and finance 14,580 0.124*** 13.00 10.86%
Others 6,609 0.069*** 5.08 5.38%
Accounting and finance – Others 0.055*** 3.34
Manufacturing Firms
Manufacturing Firms 14,757 0.119*** 12.66 10.00%
Others 6,432 0.081*** 5.66 7.05%
Manufacturing Firms– Others 0.038** 2.23

55
TABLE 4 Regression of the market reactions around site visits on firm and site visit characteristics
This table presents the results of the regression of market reactions around site visits on information environment variables, site visit characteristics, manufacturing firm indicator, and control variables. Panel A presents the descriptive statistics on all of the variables. Variable definitions are presented in Panel B of Appendix C. Panel B presents the regression results based on the following regression model:
_ , , _ , _ , _ , _ ,
, , _ _ , , ,
, , , , , ,
_ _ 0, 1 , _ _ 0, 1 , ,
, The dependent variable is the standardized absolute abnormal return (ABN_ABSAR). Inverse Mills ratio is calculated based on the determinant model presented in Table 2. The full sample consists of 21,189 site visit events with data on the required variables in the 2009-2013 period. The t-values in parentheses are based on standard errors adjusted for firm-level clustering. ***, **, and * indicate significance at the 0.01, 0.05, and 0.10 levels, respectively, based on two-tailed tests. Panel A: Descriptive statistics N Mean Std. P25 Median P75
ABN_ABSAR 21,189 0.107 1.140 -0.671 -0.205 0.518
AC (raw) 21,189 5.122 5.308 1.000 3.000 8.000
High_rating 21,189 0.884 0.320 1.000 1.000 1.000
Num_visitor (raw) 21,189 3.355 7.158 1.000 2.000 3.000
Fund_visitor 21,189 0.304 0.460 0.000 0.000 1.000
AF_news 21,189 0.688 0.463 0.000 1.000 1.000
Manufacture 21,189 0.696 0.460 0.000 1.000 1.000
RET 21,189 0.096 0.417 -0.180 -0.001 0.270
ABSAR_pre_visit 21,189 0.014 0.100 -0.052 0.001 0.066
Turnover 21,189 0.243 0.172 0.115 0.194 0.329
BM 21,189 0.381 0.248 0.203 0.316 0.486
ΔNI 21,189 0.017 0.051 -0.006 0.011 0.032
Growth 21,189 1.246 0.377 1.040 1.197 1.366
Size (raw, in millions) 21,189 9,630 14,429 2,762 4,866 9,961
Lev 21,189 0.433 0.213 0.260 0.439 0.608
Beta 21,189 0.962 0.226 0.795 0.978 1.130
Age (raw, in years) 21,189 9.219 5.653 4.000 9.000 14.000
Market_return_[0,+1] 21,189 0.019 0.015 0.007 0.015 0.026
Market_trading_[0,+1] 21,189 0.039 0.020 0.025 0.034 0.047

56
TABLE 4 (Cont’d)
Panel B: Regression results
Column (1) Column (2) Column (3) Column (4)
AC -0.0395*** -0.0480***
(-3.30) (-4.22) High_rating -0.0884*** -0.0927***
(-3.02) (-3.18) Num_visitor 0.1932*** 0.2032***
(5.80) (6.04) Fund_visitor 0.0388** 0.0427** (2.26) (2.50) AF_news 0.0386** 0.0346* (1.99) (1.80) Manufacture 0.0625** 0.0758*** (2.46) (2.88) RET -0.1023*** -0.1283*** -0.1059*** -0.0997***
(-4.67) (-6.01) (-4.91) (-4.54) ABSAR_pre_visit 0.7936*** 0.7790*** 0.8225*** 0.7855*** (6.36) (6.22) (6.55) (6.27) Turnover -0.1568** -0.1413** -0.0947 -0.1172*
(-2.28) (-2.00) (-1.37) (-1.74) BM 0.0972* 0.1563*** 0.0679 0.0373
(1.87) (3.10) (1.37) (0.75) ΔNI 0.5307*** 0.5126*** 0.4914*** 0.5302***
(2.87) (2.73) (2.61) (2.86) Growth -0.0865*** -0.0927*** -0.0962*** -0.0953*** (-3.72) (-3.97) (-4.23) (-4.23) Size -0.0380** -0.0435*** -0.0474*** -0.0451***
(-2.45) (-2.78) (-2.98) (-2.89) Lev 0.0602 0.0833 0.1029* 0.1044**
(1.10) (1.51) (1.94) (2.02) Beta -0.1852*** -0.1735*** -0.1782*** -0.1745***
(-4.17) (-3.93) (-4.06) (-4.06) Age -0.0156 0.0042 0.0050 -0.0031
(-1.00) (0.26) (0.31) (-0.20) Market_return_[0,+1] 3.9953*** 3.9411*** 3.9599*** 3.9579*** (6.87) (6.78) (6.83) (6.81) Market_trading_[0,+1] 6.4083*** 5.8213*** 6.3844*** 5.7771*** (10.52) (9.38) (10.45) (9.31) Inverse Mills ratio -0.0921 0.0947 0.0082 -0.1296* (-1.16) (1.39) (0.12) (-1.67) Industry Fixed Effects Yes Yes Yes Yes Year Fixed Effects Yes Yes Yes Yes Observations 21,189 21,189 21,189 21,189 Adj. R2 0.019 0.021 0.016 0.020

57
TABLE 5 Regression of the market reactions around site visits on firm and site visit characteristics
– Controlling for potential timing of site visits This table presents the results of the regression of market reactions around site visits on our main variables of interest and the variables that can potentially affect the timing of site visits:
_ , , _ , _ , _ , _ ,
, 1 , , , 1 ,
2 , 3 , , _ _ , , ,
, , , , , ,
_ _ 0, 1 , _ _ 0, 1 , ,
, The dependent variable is the standardized absolute abnormal return (ABN_ABSAR). ABSAR(-1) is the absolute value of the size-adjusted abnormal returns on the day before the site visit. Bigevent equals one if the current site visit is within the three-day event window [-1, +1] centered on any of the following corporate event: mergers and acquisitions, seasoned equity offerings, right offerings, related party transactions, law suits, regulatory violations, and dividends. Adjacent equals one for the site visit events that are combined with site visits with adjacent dates. Q1, Q2, and Q3 are indicator variables for site visits in the first, second, and third quarter of a calendar year, respectively. The mean is 0.0156 for ABSAR(-1), 0.0317 for Bigevent, 0.1034 for Adjacent, 0.2006 for Q1, 0.2893 for Q2, and 0.2521 for Q3. Please see Panel B of Appendix C for details of the definitions of other variables. Inverse Mills ratio is calculated based on the determinant model presented in Table 2. The full sample consists of 21,189 site visit events with data on the required variables in the 2009-2013 period. The t-values in parentheses are based on standard errors adjusted for firm-level clustering. ***, **, and * indicate significance at the 0.01, 0.05, and 0.10 levels, respectively, based on two-tailed tests.

58
TABLE 5 (Cont’d)
Column (1) [Column (4) of Table 4]
Column (2) Column (3) Column (4) Column (5) Column (6)
AC -0.0480*** -0.0463*** -0.0471*** -0.0487*** -0.0474*** -0.0459*** (-4.22) (-4.17) (-4.16) (-4.30) (-4.15) (-4.13)
High_rating -0.0927*** -0.0901*** -0.0903*** -0.0910*** -0.0920*** -0.0854*** (-3.18) (-3.14) (-3.11) (-3.10) (-3.15) (-2.97)
Num_visitor 0.2032*** 0.1924*** 0.2012*** 0.1601*** 0.2057*** 0.1499*** (6.04) (5.76) (5.99) (4.67) (6.14) (4.43)
Fund_visitor 0.0427** 0.0364** 0.0429** 0.0441** 0.0431** 0.0384** (2.50) (2.17) (2.52) (2.57) (2.52) (2.29)
AF_news 0.0346* 0.0334* 0.0342* 0.0347* 0.0360* 0.0348* (1.80) (1.74) (1.77) (1.81) (1.88) (1.82)
Manufacture 0.0758*** 0.0762*** 0.0772*** 0.0741*** 0.0754*** 0.0753*** (2.88) (2.81) (2.95) (2.81) (2.86) (2.79)
ABSAR(-1) 8.2953*** 8.1545*** (12.22) (12.11)
Bigevent 0.3256*** 0.2993*** (6.03) (5.65)
Adjacent 0.1631*** 0.1660*** (4.72) (4.76)
Q1 -0.0138 -0.0202 (-0.53) (-0.79)
Q2 0.0327 0.0327 (1.38) (1.41)
Q3 0.0064 0.0012 (0.27) (0.05)
Control variables YES YES YES YES YES YES
Inverse Mills ratio YES YES YES YES YES YES Industry Fixed Effects YES YES YES YES YES YES Year Fixed Effects YES YES YES YES YES YES
Observations 21,189 21,189 21,189 21,189 21,189 21,189
Adjusted R-squared 0.020 0.031 0.022 0.021 0.020 0.035

59
TABLE 6 The market reactions around site visits with and without earnings forecasts issued by
visiting analysts in the month after site visits This table reports the results on the market reaction separately for site visits followed by visiting analysts’ forecast issuance and other site visits. Panel A reports the univariate analysis of the market reactions for the site visit subsamples partitioned based on the issuance of earnings forecasts by visiting analysts within one month after site visits. Panel B presents the regression of market reactions around site visits on information environment variables, visit characteristics, manufacturing firm indicator, an indicator for site visits followed by visiting analysts’ earnings forecasts (Visiting_forecast), and control variables. Visiting_forecast is coded as one for site visits with at least one visiting analyst issuing earnings forecasts for the visited firm in the month after site visits, and zero otherwise. This table presents the regression results based on the following regression model:
_ , , _ , _ , _ , _ ,
, _ , , _ _ ,
, , , , , ,
, , _ _ 0, 1 , _ _ 0, 1 ,
, , The dependent variable is the standardized absolute abnormal return (ABN_ABSAR). Inverse Mills ratio is calculated based on the determinant model presented in Table 2. Column (1) of Panel B presents the regression results for the subsample of site visits without visiting analysts issuing forecasts within one month after the site visit. Column (2) of Panel B presents the regression results for the subsample of site visits with at least one visiting analyst issuing forecasts within one month after the site visit. Column (3) of Panel B presents the full sample which consists of 21,189 site visit events with data on the required variables in the 2009-2013 period. The t-values in parentheses are based on standard errors adjusted for firm-level clustering. ***, **, and * indicate significance at the 0.01, 0.05, and 0.10 levels, respectively, based on two-tailed tests. Panel A: Univariate analysis of the market reactions around site visits
Partition criteria Samples Obs.
ABN_ABSARi,[0,+1] Difference in ABSAR
between the event window and the normal period
Mean T-value (% of normal ABSAR)
Earnings forecasts issued by visiting analysts in the month after site visits
With earnings forecasts (1)
3,404 0.172*** 8.41 12.67%
Without earnings forecasts (2) 17,785 0.095*** 11.19 6.31%
(1) – (2) 0.077*** 3.47

60
TABLE 6 (Cont’d)
Panel B: Multivariate analysis of market reactions around site visits
Column (1)
Sample without visiting analysts’ forecasts after site visit
Column (2) Sample with visiting analysts’
forecasts after site visit
Column (3) Full sample
AC -0.0435*** -0.0902*** -0.0504***
(-3.47) (-3.13) (-4.41) High_rating -0.0866*** -0.1255 -0.0930***
(-2.73) (-1.52) (-3.18) Num_visitor 0.1748*** 0.1892*** 0.1817***
(4.54) (2.67) (5.30) Fund_visitor 0.0414** 0.0947* 0.0476*** (2.33) (1.75) (2.78) AF_news 0.0262 0.0887** 0.0349* (1.29) (1.98) (1.81) Manufacture 0.0799*** 0.0728 0.0765*** (2.80) (0.92) (2.91) Visiting_forecast 0.0661*** (3.11) Control variables Yes Yes Yes Inverse Mills ratio Yes Yes Yes Industry Fixed Effects Yes Yes Yes Year Fixed Effects Yes Yes Yes Observations 17,785 3,404 21,189 Adj. R2 0.020 0.019 0.020

61
TABLE 7 Site visits and forthcoming earnings news
This table presents the regression result of cumulative abnormal returns (CAR) on forthcoming earnings news. Panel A reports the descriptive statistics on the additional variables used in following model, and Panel B reports results of the following regression:
, , , _ , , ,
_ _ , , , , ,
, , , , _ _ 0, 1 ,
_ _ 0, 1 , , ,
CARi,t and EarningsNewsi,t are calculated for each of the site visits occurring between the earnings announcement dates for year t-1 and year t, CARi,t is calculated as the cumulative size-adjusted abnormal returns in the 2-day event window (i.e., [0, +1]) for the site visit. Column (1) of Panel B reports the regression results when the forthcoming earnings news (EarningsNewsi,t) is proxied for by the change in ROA from year t-1 to year t (ΔROAi,t), where ROAi,t is calculated as earnings before extraordinary items divided by total assets for firm i in year t. In Column (2) of Panel B, the forthcoming earnings news is proxied for by the unexpected earnings (UEi,t), which is measured as the difference between actual earnings per share (EPS) for year t minus analysts’ consensus forecast of year t’s EPS before the site visit, divided by the closing stock price on the second trading day after year t-1’s earnings announcement. Analysts’ consensus EPS forecast is calculated based on the most recent forecast of year t’s EPS issued by each analyst in the six-month period before the site visit (as in the case of SV1 in the figure below), or in the period between year t-1’s earnings announcement date and the site visit date (as in the case of SV2 in the figure below), whichever is shorter.
All continuous variables are winsorized at the1% and 99% level. Panel B of Appendix C presents the definitions of the control variables. Inverse Mills ratio is calculated based on the determinant model presented in Table 2. The sample consists of 21,189 site visit events with the required data for Shenzhen-listed firms in the 2009-2013 period. The sample size is smaller for the analysis based on the UE measure due to the additional data requirements. The t-values in parentheses are based on standard errors adjusted for firm-level clustering. ***, **, and * indicate significance at the 0.01, 0.05, and 0.10 levels, respectively, based on two-tailed tests. Panel A: Descriptive statistics N Mean Std. P25 Median P75
CAR 21,189 0.001 0.032 -0.018 -0.002 0.017
ΔROA 21,189 -0.002 0.028 -0.015 -0.001 0.011
UE 17,280 -0.007 0.035 -0.015 -0.002 0.009
EAt-1 EAt SV1
EAt: Earnings announcement for fiscal year t SV: Site visit AF: Analyst forecasts
SV1 - 6 months
The six-month period used to calculate
consensus AF of year t’s EPS
SV2
The less than six-month period used to calculate
consensus AF of year t’s EPS
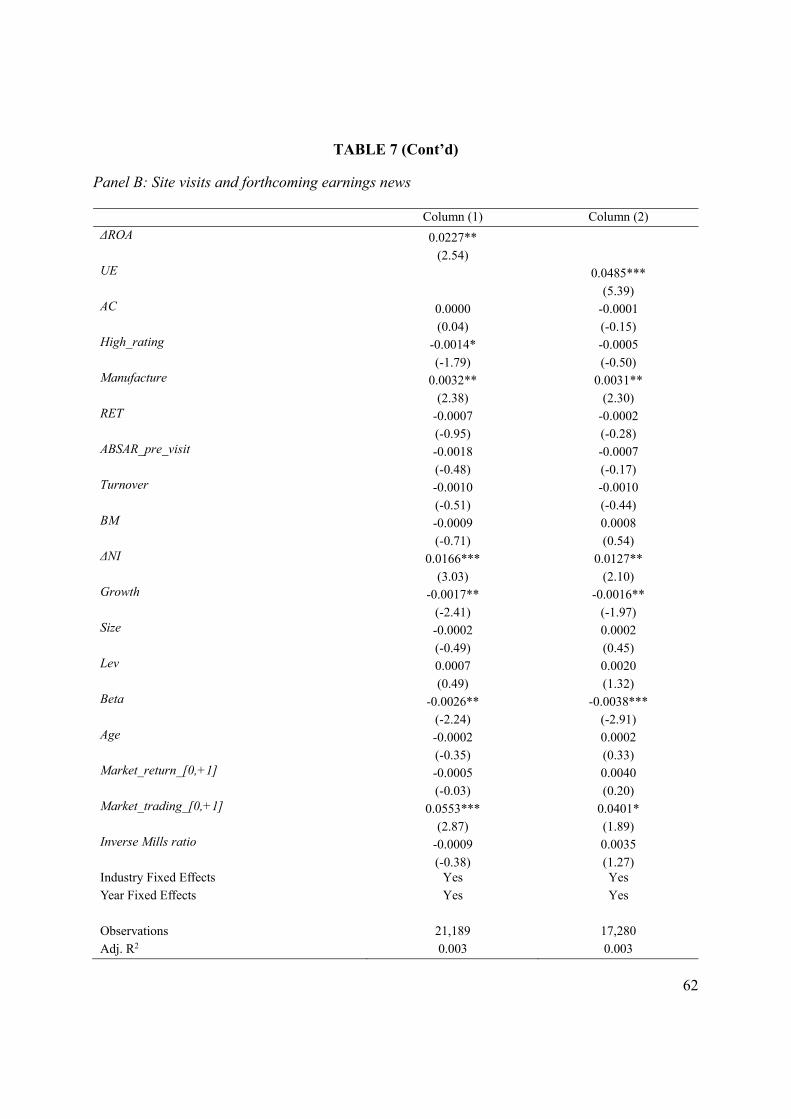
62
TABLE 7 (Cont’d) Panel B: Site visits and forthcoming earnings news
Column (1) Column (2)
ΔROA 0.0227** (2.54) UE 0.0485*** (5.39) AC 0.0000 -0.0001 (0.04) (-0.15) High_rating -0.0014* -0.0005 (-1.79) (-0.50) Manufacture 0.0032** 0.0031** (2.38) (2.30) RET -0.0007 -0.0002 (-0.95) (-0.28) ABSAR_pre_visit -0.0018 -0.0007 (-0.48) (-0.17) Turnover -0.0010 -0.0010 (-0.51) (-0.44) BM -0.0009 0.0008 (-0.71) (0.54) ΔNI 0.0166*** 0.0127** (3.03) (2.10) Growth -0.0017** -0.0016** (-2.41) (-1.97) Size -0.0002 0.0002 (-0.49) (0.45) Lev 0.0007 0.0020 (0.49) (1.32) Beta -0.0026** -0.0038*** (-2.24) (-2.91) Age -0.0002 0.0002 (-0.35) (0.33) Market_return_[0,+1] -0.0005 0.0040 (-0.03) (0.20) Market_trading_[0,+1] 0.0553*** 0.0401* (2.87) (1.89) Inverse Mills ratio -0.0009 0.0035 (-0.38) (1.27) Industry Fixed Effects Yes Yes Year Fixed Effects Yes Yes Observations 21,189 17,280 Adj. R2 0.003 0.003

63
TABLE 8 Site visits and visiting funds’ holding changes
This table reports the relationship between the change in the visiting funds’ holding of the visited firms and future accounting or stock performance. We restrict the sample to firm and semi-annual period combinations with at least one visiting fund and one non-visiting fund. Due to the control for firm-fund pair fixed effects, we further restrict the sample to firm-fund pairs that have more than three observations to increase the power of the test and to avoid an inflation of t-statistics. The regression model is as follows:
, , 1 , 1 2 _ , , , 1 3 _ , , 1 ,
2 , 3 , 1 4 , 5 , 1 6 ,
7 , , The dependent variable is the change in fund j’s holding of firm i’s stock from the beginning to the end of the semi-annual period t, divided by firm i’s outstanding shares (ΔHoldingi,j,t). D_Visiti,j,t equals 1 if fund j visits firm i at least once during the semi-annual period t, and zero otherwise. Performance is measured as firms’ future accounting performance (ΔROAi,t+1) or future abnormal stock return performance (BHARi,t+1). ΔROAi,t+1 is the change in ROA in the forthcoming annual earnings announcements (i.e., the earnings announcement right after the current semi-annual period t). BHARi,t+1 is the buy-and-hold size-adjusted abnormal return in the one-year period after the end of the current semi-annual period t. Please see Panel C of Appendix C for other variable definitions. Inverse Mills ratio is calculated based on the determinant model presented in Table 2. The t-values in parentheses are based on standard errors adjusted for firm-level clustering. ***, **, and * indicate significance at the 0.01, 0.05, and 0.10 levels, respectively, based on two-tailed tests.

64
TABLE 8 (Cont’d)
Performance = ΔROA i,t+1 (1)
Performance = BHAR i,t+1 (2)
ΔROA i,t+1 0.6622***
(2.80)
D_Visit i,j,t × ΔROA i,t+1 0.9311**
(2.09)
BHAR i,t+1 -0.0164 (-0.67) D_Visit i,j,t × BHAR i,t+1 0.0848** (1.97) D_Visiti,j,t 0.2010*** 0.1930*** (12.36) (11.85) Size i,t 0.1983*** 0.2110***
(6.31) (6.22)
BM i,t -0.0181 -0.0031
(-0.22) (-0.04)
BHAR i,t-1 -0.3283*** -0.3195***
(-13.46) (-13.13) Turnover i,t -0.0510*** -0.0521*** (-4.67) (-4.76) Turnover i,t-1 0.0747*** 0.0710*** (7.19) (6.85) EOY i,t -0.0445*** -0.0464*** (-3.73) (-3.88)
Inverse Mills Ratio 0.9716*** 1.0672***
(9.21) (10.32)
Firm-fund Pair Fixed Effects Yes Yes
Year Fixed Effects Yes Yes
Observations 43,868 43,868
Adj. R2 0.017 0.016

65
TABLE 9 Site visits and visiting funds’ holdings – Cross-sectional analyses
This table reports the regression results on how the relationship between the change in the visiting funds’ holding of the visited firms and future accounting or stock performance varies with firm and site visit characteristics (Firm_Visit_Char). We restrict the sample to firm and semi-annual period combinations with at least one visiting fund and one non-visiting fund. Due to the control for firm-fund pair fixed effects, we further restrict the sample to firm-fund pairs that have more than three observations to increase the power of the test and to avoid an inflation of t-statistics. The regression model is as follows:
, , 1 , 1 2 _ , , 3 _ , , , 1
4 _ _ , , 5 _ , , _ _ , , 6 _ _ , ,
, 1 7 _ , , _ _ , , , 1 1 ,
2 , 3 , 1 4 , 5 , 1 6 ,
7 , , The dependent variable is the change in fund j’s holding of firm i’s stock from the beginning to the end of the semi-annual period t, divided by firm i’s outstanding shares (ΔHoldingi,j,t). D_Visiti,j,t equals 1 if fund j visits firm i at least once during the semi-annual period t, and zero otherwise. Performance is measured as firms’ future accounting performance (ΔROAi,t+1) in Panel A or future abnormal stock return performance (BHARi,t+1) in Panel B. ΔROAi,t+1 is the change in ROA in the forthcoming annual earnings announcements (i.e., the earnings announcement right after the current semi-annual period t). BHARi,t+1 is the buy-and-hold size-adjusted abnormal return in the one-year period after the end of the current semi-annual period t. Firm_Visit_Char is one of the following indicator variables: the indicator for high analyst coverage (High_AC), the indicator for high disclosure rating (High_rating), the indicator for large group size (High_Num_visitor), the indicator for site visits covering accounting and finance topics (AF_news), and the indicator for manufacturing firms (Manufacture). High_rating, AF_news, and Manufacture are defined in Panel B of Appendix C. The indicator for high analyst coverage (High_AC) is coded as one if analyst coverage is above the sample median; the indicator for large group size (High_Num_visitor) is coded as one if the number of visitors of the site visit is above than the sample median. For visiting fund observations, the site visit characteristics (i.e., AF_News, High_Num_Visitor) are coded based on the characteristics of their own site visits. For non-visiting fund observations, we set the value of Firm_Visit_Char based on the site visits occurring in the semi-annual period; if there are multiple site visits in the semi-annual period, we set Firm_Visit_Char based on the site visit that gives Firm_Visit_Char a higher value. Please see Panel C of Appendix C for other variable definitions. Inverse Mills ratio is calculated based on the determinant model presented in Table 2. The t-values in parentheses are based on standard errors adjusted for firm-level clustering. ***, **, and * indicate significance at the 0.01, 0.05, and 0.10 levels, respectively, based on two-tailed tests.
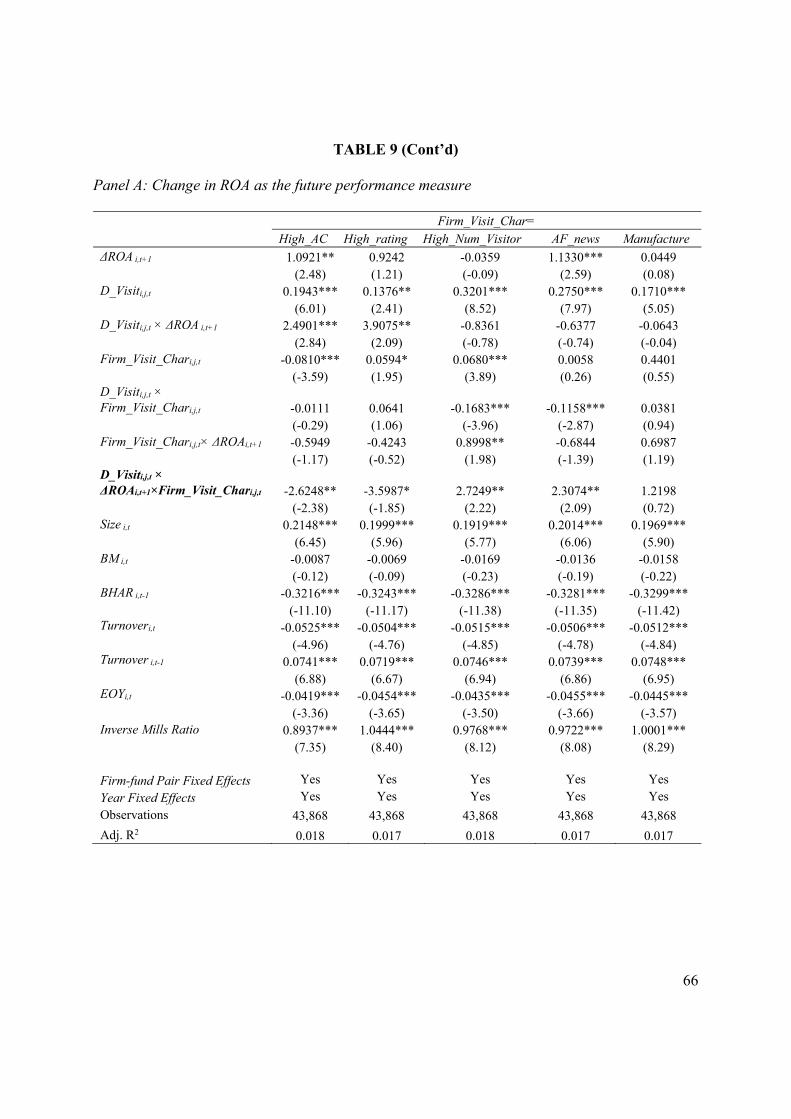
66
TABLE 9 (Cont’d) Panel A: Change in ROA as the future performance measure Firm_Visit_Char=
High_AC High_rating High_Num_Visitor AF_news Manufacture ΔROA i,t+1 1.0921** 0.9242 -0.0359 1.1330*** 0.0449
(2.48) (1.21) (-0.09) (2.59) (0.08) D_Visiti,j,t 0.1943*** 0.1376** 0.3201*** 0.2750*** 0.1710*** (6.01) (2.41) (8.52) (7.97) (5.05) D_Visiti,j,t × ΔROA i,t+1 2.4901*** 3.9075** -0.8361 -0.6377 -0.0643
(2.84) (2.09) (-0.78) (-0.74) (-0.04) Firm_Visit_Chari,j,t -0.0810*** 0.0594* 0.0680*** 0.0058 0.4401 (-3.59) (1.95) (3.89) (0.26) (0.55) D_Visiti,j,t × Firm_Visit_Chari,j,t -0.0111 0.0641 -0.1683*** -0.1158*** 0.0381 (-0.29) (1.06) (-3.96) (-2.87) (0.94) Firm_Visit_Chari,j,t× ΔROAi,t+1 -0.5949 -0.4243 0.8998** -0.6844 0.6987 (-1.17) (-0.52) (1.98) (-1.39) (1.19) D_Visiti,j,t × ΔROAi,t+1×Firm_Visit_Chari,j,t -2.6248** -3.5987* 2.7249** 2.3074** 1.2198 (-2.38) (-1.85) (2.22) (2.09) (0.72) Size i,t 0.2148*** 0.1999*** 0.1919*** 0.2014*** 0.1969***
(6.45) (5.96) (5.77) (6.06) (5.90) BM i,t -0.0087 -0.0069 -0.0169 -0.0136 -0.0158
(-0.12) (-0.09) (-0.23) (-0.19) (-0.22) BHAR i,t-1 -0.3216*** -0.3243*** -0.3286*** -0.3281*** -0.3299***
(-11.10) (-11.17) (-11.38) (-11.35) (-11.42) Turnoveri,t -0.0525*** -0.0504*** -0.0515*** -0.0506*** -0.0512*** (-4.96) (-4.76) (-4.85) (-4.78) (-4.84) Turnover i,t-1 0.0741*** 0.0719*** 0.0746*** 0.0739*** 0.0748*** (6.88) (6.67) (6.94) (6.86) (6.95)EOYi,t -0.0419*** -0.0454*** -0.0435*** -0.0455*** -0.0445*** (-3.36) (-3.65) (-3.50) (-3.66) (-3.57) Inverse Mills Ratio 0.8937*** 1.0444*** 0.9768*** 0.9722*** 1.0001*** (7.35) (8.40) (8.12) (8.08) (8.29)
Firm-fund Pair Fixed Effects Yes Yes Yes Yes Yes
Year Fixed Effects Yes Yes Yes Yes Yes
Observations 43,868 43,868 43,868 43,868 43,868
Adj. R2 0.018 0.017 0.018 0.017 0.017
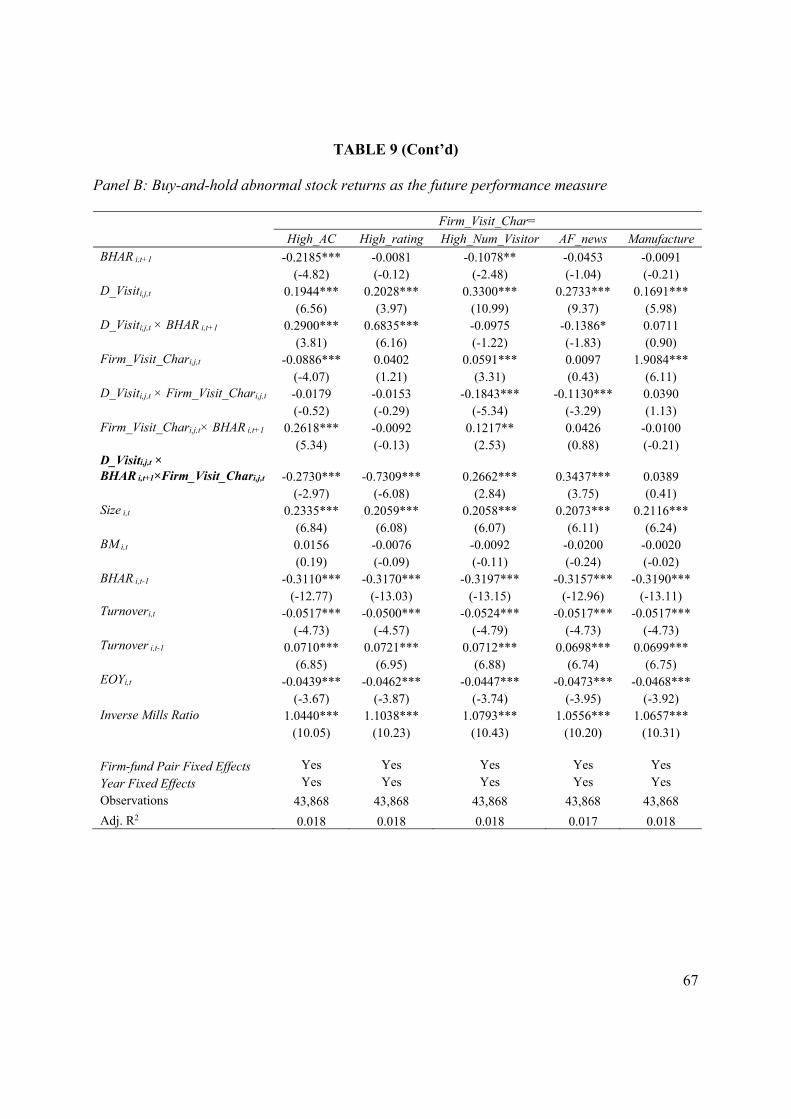
67
TABLE 9 (Cont’d) Panel B: Buy-and-hold abnormal stock returns as the future performance measure Firm_Visit_Char=
High_AC High_rating High_Num_Visitor AF_news Manufacture BHAR i,t+1 -0.2185*** -0.0081 -0.1078** -0.0453 -0.0091
(-4.82) (-0.12) (-2.48) (-1.04) (-0.21) D_Visiti,j,t 0.1944*** 0.2028*** 0.3300*** 0.2733*** 0.1691*** (6.56) (3.97) (10.99) (9.37) (5.98) D_Visiti,j,t × BHAR i,t+1 0.2900*** 0.6835*** -0.0975 -0.1386* 0.0711
(3.81) (6.16) (-1.22) (-1.83) (0.90) Firm_Visit_Chari,j,t -0.0886*** 0.0402 0.0591*** 0.0097 1.9084*** (-4.07) (1.21) (3.31) (0.43) (6.11) D_Visiti,j,t × Firm_Visit_Chari,j,t -0.0179 -0.0153 -0.1843*** -0.1130*** 0.0390 (-0.52) (-0.29) (-5.34) (-3.29) (1.13) Firm_Visit_Chari,j,t× BHAR i,t+1 0.2618*** -0.0092 0.1217** 0.0426 -0.0100 (5.34) (-0.13) (2.53) (0.88) (-0.21) D_Visiti,j,t × BHAR i,t+1×Firm_Visit_Chari,j,t -0.2730*** -0.7309*** 0.2662*** 0.3437*** 0.0389 (-2.97) (-6.08) (2.84) (3.75) (0.41) Size i,t 0.2335*** 0.2059*** 0.2058*** 0.2073*** 0.2116***
(6.84) (6.08) (6.07) (6.11) (6.24) BM i,t 0.0156 -0.0076 -0.0092 -0.0200 -0.0020
(0.19) (-0.09) (-0.11) (-0.24) (-0.02) BHAR i,t-1 -0.3110*** -0.3170*** -0.3197*** -0.3157*** -0.3190***
(-12.77) (-13.03) (-13.15) (-12.96) (-13.11) Turnoveri,t -0.0517*** -0.0500*** -0.0524*** -0.0517*** -0.0517*** (-4.73) (-4.57) (-4.79) (-4.73) (-4.73) Turnover i,t-1 0.0710*** 0.0721*** 0.0712*** 0.0698*** 0.0699*** (6.85) (6.95) (6.88) (6.74) (6.75) EOYi,t -0.0439*** -0.0462*** -0.0447*** -0.0473*** -0.0468*** (-3.67) (-3.87) (-3.74) (-3.95) (-3.92)Inverse Mills Ratio 1.0440*** 1.1038*** 1.0793*** 1.0556*** 1.0657*** (10.05) (10.23) (10.43) (10.20) (10.31)
Firm-fund Pair Fixed Effects Yes Yes Yes Yes Yes
Year Fixed Effects Yes Yes Yes Yes Yes
Observations 43,868 43,868 43,868 43,868 43,868
Adj. R2 0.018 0.018 0.018 0.017 0.018
Related Documents