August 2009 Do Buyouts (Still) Create Value? Shourun Guo, Edith S. Hotchkiss, and Weihong Song ∗ Abstract We examine whether, and how, leveraged buyouts from the most recent wave of public to private transactions created value. For a sample of 192 buyouts completed between 1990 and 2006, we show that these deals are somewhat more conservatively priced and less levered than their predecessors from the 1980s. For the subsample of deals with post-buyout data available, median market and risk adjust ed returns to pre- (post-) buyout capital invested are 72.5% (40.9%). In contrast, gains in operating performance are either comparable to or slightly exceed those observed for benchmark fir ms. Increases in industry valuation multiples and realized tax benefits from increasing leverage while private are each economically as important as operating gains in explaining realized returns. Forthcoming, Journal of Finance ∗ Guo is at Duke Energy Corporatio n. Hotchkiss is at the Carrol l School of Management, Boston College. Song is at the College of Business, University of Cinc innati. The authors thank Francesca Cornell i, Ken Doyle, Mike Ferguson, John Graham (the co-editor), Campbell Harvey (the editor), Steve Kaplan, Darren Kisgen, Kai Li, John Morris, Jun Qian, Laura Resnikoff, Steve Slezak, Jeremy Stein, Per Strömberg, Wei Wang, an anonymous referee, and seminar participants at Babson College, Boston College, the 7 th China International Conference in Finance (Guangzhou), University of Connecticut, Drexel University, the NBER New World of Private Equity conference, the Swedish Institute for Financial Research, and Università Ca'Foscari di Venezia for helpful comments and suggestions.

Welcome message from author
This document is posted to help you gain knowledge. Please leave a comment to let me know what you think about it! Share it to your friends and learn new things together.
Transcript
8/7/2019 Do Buyouts Create Value
http://slidepdf.com/reader/full/do-buyouts-create-value 1/59
August 2009
Do Buyouts (Still) Create Value?
Shourun Guo, Edith S. Hotchkiss, and Weihong Song∗
Abstract
We examine whether, and how, leveraged buyouts from the most recent wave of public toprivate transactions created value. For a sample of 192 buyouts completed between 1990 and 2006,we show that these deals are somewhat more conservatively priced and less levered than their predecessors from the 1980s. For the subsample of deals with post-buyout data available, medianmarket and risk adjusted returns to pre- (post-) buyout capital invested are 72.5% (40.9%). Incontrast, gains in operating performance are either comparable to or slightly exceed those observedfor benchmark firms. Increases in industry valuation multiples and realized tax benefits fromincreasing leverage while private are each economically as important as operating gains inexplaining realized returns.
Forthcoming, Journal of Finance
∗ Guo is at Duke Energy Corporation. Hotchkiss is at the Carroll School of Management, Boston College. Song is atthe College of Business, University of Cincinnati. The authors thank Francesca Cornelli, Ken Doyle, Mike Ferguson,John Graham (the co-editor), Campbell Harvey (the editor), Steve Kaplan, Darren Kisgen, Kai Li, John Morris, JunQian, Laura Resnikoff, Steve Slezak, Jeremy Stein, Per Strömberg, Wei Wang, an anonymous referee, and seminar participants at Babson College, Boston College, the 7th China International Conference in Finance (Guangzhou),University of Connecticut, Drexel University, the NBER New World of Private Equity conference, the SwedishInstitute for Financial Research, and Università Ca'Foscari di Venezia for helpful comments and suggestions.
8/7/2019 Do Buyouts Create Value
http://slidepdf.com/reader/full/do-buyouts-create-value 2/59
1
The leveraged buyout (LBO) wave of the 1980s was an important phenomenon well studied by
academics and practitioners. The recession of the early 1990s, however, brought most of that
activity to an end, as many of the deals from later in that period defaulted. Nearly fifteen years
later, however, the pace of LBO activity reached new record levels, renewing questions about
whether and how these deals create value.1
A substantial body of empirical work based on leveraged buyout transactions from the 1980s
supports the notion that leveraged transactions create value. Several studies show large gains in
operating performance following the buyout; theories attribute these gains to reduced agency costs
through the disciplining effects of leverage and better governance (monitoring by the financial
sponsor, concentrated ownership, etc).2
Other studies show that firm values increase from the time
of the buyout to a subsequent change in ownership or restructuring, producing large returns to
invested capital.3
Given the rise of the private equity industry, changes in the characteristics of firms targeted
for buyouts, and changes in the structure of the transactions themselves, the mechanisms through
which buyouts can create value have likely changed. Notably, there is little (or no) evidence from
the more recent wave of buyouts which documents whether and how these transactions create
value.4
This paper attempts to fill this gap, studying a sample of 192 LBOs completed between
1990 and 2006.
1 Dealogic reports that global financial sponsor M&A buyouts reached record highs of $352.3 billion in 2005, $737.4billion in 2006, and $796.1 billion in 2007 despite the abrupt fall off in the second half of that year, and representedapproximately 17% of total announced M&A volume in those years.2 These papers largely study management buyouts (MBOs). See Kaplan (1989a), Lichtenberg and Siegel (1990), Smith(1990), Cotter and Peck (2001), and papers summarized in Renneboog and Simons (2005).3 Kaplan (1989c), Kaplan (1994), and Andrade and Kaplan (1998).4 Axelson, Jenkinson, Strömberg, and Weisbach (2009), and a series of papers written for the World Economic Forum(2008), provide analysis of the pricing and structure of recent buyouts. Kaplan and Strömberg (2008) describe recenttrends in the leveraged buyout / private equity industry.
8/7/2019 Do Buyouts Create Value
http://slidepdf.com/reader/full/do-buyouts-create-value 3/59
2
We first show that the firms in our sample on average experience large increases in total
value from the time of the buyout to their subsequent exit from a private equity firm’s portfolio,
producing large returns to invested debt and equity capital. We use the methodology of Andrade
and Kaplan (1998) to estimate returns to total capital for a subsample of 94 leveraged buyouts
completed by 2005 for which post-buyout financial data are available. Returns are calculated either
from just prior to the buyout (pre-buyout) to a subsequent IPO, sale of the firm, or bankruptcy, or
from the execution of the buyout (post-buyout) to the subsequent outcome. We find that returns to
either pre- or post-buyout capital are positive and significant for all outcome groups except deals
ending in a distressed restructuring. Median market and risk adjusted returns to pre- (post-) buyout
capital are estimated at 72.5% (40.9%), even including the cases of distress.
There are three potential explanations for the realized returns we document. First, firm
value will increase if there are firm specific improvements in operating performance. Sample firms
may improve profitability, eliminate unproductive assets, use remaining assets (including working
capital) more efficiently, or make value increasing acquisitions. Second, even if there are no
changes in the cash flows of the firm subsequent to the buyout, firm values may benefit from rising
market or industry sector valuation multiples while the firm is private. Third, substantial increases
in leverage produce larger tax shields, boosting returns by increasing the cash flows available to the
providers of capital.
When we examine gains in operating performance, we find they are substantially smaller
than documented for deals of the 1980s; depending on the measure, median performance is not
always significantly different from the performance of benchmark firms matched on industry and
pre-buyout characteristics. At first glance, it is puzzling that deals produce large positive returns on
average when many firms produce modest or no cash flow gains. We find that gains in operating
cash flows are greater for firms where the private equity firm has replaced the CEO at or soon after

8/7/2019 Do Buyouts Create Value
http://slidepdf.com/reader/full/do-buyouts-create-value 4/59
3
the time of the buyout. We also find that improvements in cash flows, net of tax benefits, are
greater for sample firms with larger increases in debt as a result of the buyout. This evidence is
consistent with theories suggesting the benefits of debt in reducing agency costs.5
Although
operating gains are small on average, the substantial variation within our sample suggests that
operating performance may still be an important factor in explaining returns.
To examine the relative importance of the three potential determinants of realized returns,
we directly quantify the impact on returns of changes in operating cash flows, changes in valuation
multiples, and realized tax benefits from increasing debt while private. Comparing the realized
returns to what they hypothetically would have been if profitability (relative to firms matched on
industry and pre-buyout characteristics) had remained at its pre-buyout level, for the full sample we
show that improvements in performance account for 23% (18.5%) of the pre- (post-) buyout return.
Changes in industry valuations also have a large effect on returns; changes in the industry total
capital/EBITDA ratio account for 18% of the return to pre-buyout capital for the full sample, and
26% of the return for firms exiting through an IPO. The magnitude of the impact of increasing tax
shields depends on our assumptions as to whether leverage will be maintained after the exit from
the private equity firm’s portfolio; for firms sold in a secondary LBO, the increased tax benefits
account for 29% of the return to pre-buyout capital.6
We also use cross sectional regressions to provide further evidence on the relative
importance of the factors explaining returns. These regressions account for the fact that there may
be some overlap in the sources of these gains; for example, an increase in leverage may affect the
firm both through increasing cash flows as a result of the discipline of debt, as well as through the
cash flow benefits of reducing taxes. Consistent with our prior results, the regressions show that the
5 Jensen (1986), Jensen (1989b), Wruck (1990).6 A summary of the return results for classroom use as teaching slides is provided in the Internet Appendix as TablesIA.TS1 and IA.TS2.
8/7/2019 Do Buyouts Create Value
http://slidepdf.com/reader/full/do-buyouts-create-value 5/59
4
impact of changes in industry valuation multiples and realized tax benefits from increased leverage
are each as important as operating gains in explaining returns. The regressions also show that in
addition to our cash flow measures of operating changes, firms which restructure via asset sales
while private are associated with significantly lower returns.
Our regressions explaining returns also allow us to consider the impact of deal pricing on
post-buyout returns. Holding constant the pre-buyout announcement firm value, a lower price paid
at the time of the buyout will leave the total return to pre-buyout capital unaffected, but will lower
the premium to pre-buyout shareholders and therefore increase the return to post-buyout capital.
However, the regressions show that neither returns to pre- or post-buyout capital are significantly
related to either the premium paid or the industry adjusted EBITDA/capital ratio at the time of the
buyout. Our paper also provides evidence useful in the debate over potential collusive bidding in
“club” deals involving more than one private equity firm.7 Both pre- and post-buyout returns are
higher for club deals, and returns are not significantly related to measures of the competition in
bidding. A likely explanation for our findings is that deals with better ex-ante prospects attract
participation by multiple private equity firms.
An additional contribution of our paper is to document the pricing and other characteristics
of the most recent wave of buyouts. These statistics provide a comparison to earlier research that
aids our understanding of how deals have recently changed, and also enables us to address concerns
about the potential impact of sample selection on our interpretation of the post-buyout performance
results (specifically, the availability of post-buyout financial data). Relative to the buyouts of the
1980s, deals are somewhat less highly levered (median total debt/capital of approximately 70%),
but still impose very high default risk on the firms. Premiums paid to pre-buyout shareholders, as
7 Officer et. al. (2009); Boone and Mulherin (2009). See also: “Private Equity Slugfest; Investors and regulators fear there isn't enough competition among private equity firms for deals. Business Week , 13 February 2007.
8/7/2019 Do Buyouts Create Value
http://slidepdf.com/reader/full/do-buyouts-create-value 6/59
5
well as the price paid relative to fundamental firm characteristics (EBITDA/capital) also indicate
somewhat more conservative transactions, particularly in comparison to deals of the late 1980s.
Deals completed in 2005 and later, however, show a trend toward riskier capital structures with
lower interest coverage, second lien debt, and higher priced transactions.
The buyout wave of the 1980s was followed by a peak in default rates of highly levered
companies in the economic downturn of the early 1990s. By showing how value is created in deals
of the more recent buyout wave, and providing an understanding of the structure of these deals, our
results may provide insights as to how companies still owned by private equity firms will fare over
the course of the downturn that started in 2007.
The remainder of this paper is structured as follows. In Section I, we describe the pricing
and structure of the 192 buyouts in our sample and compare them to the subsample of 94 buyouts
completed by 2005 for which post-buyout financial data are available. Section II documents the
returns to pre- and post-buyout providers of capital. Section III examines changes in post-buyout
operating cash flows, and relates this performance to proxies for the sources of these gains. Section
IV brings these results together, examining the relative contribution of the factors expected to
explain returns to capital. Section V concludes.
I. Sample description.
We use SDC and Dealogic to identify leveraged public to private buyouts of U.S. firms,
with deals values of at least $100 million and announcement dates between January 1990 and July
2006. Our initial screening identifies 270 possible buyouts. We eliminate 10 cases where the firm
is purchased in a Chapter 11 restructuring, 26 transactions where detailed information on the deal
structure is not available from SEC filings, Dealogic, and/or news reports, and 42 transactions with
8/7/2019 Do Buyouts Create Value
http://slidepdf.com/reader/full/do-buyouts-create-value 7/59
6
atypical characteristics.8 This produces a final sample of 192 LBOs from 1990 to 2006. In contrast
to deals from the 1980s, relatively more firms come from service industries (28% of our sample)
and fewer from manufacturing (36% of our sample). A total of 120 different private equity (PE)
firms are involved in the buyouts, but no single PE firm invests in more than 14 sample companies. 9
In order to study the performance of buyouts, as well as events that occur after the firm is
private, we further restrict the sample to buyouts completed by December 2005 which have some
amount of post-buyout data available from 10Ks or other SEC filings. The 94 firms in this
subsample either have widely held public debt outstanding, or provide historical financial
statements at the time of a subsequent IPO, acquisition, or public debt financing. Comparing the
subsample of 94 firms to the full sample of 192 buyouts allows us to address the impact of sample
selection on observed post-buyout performance. Our description of the evolution of buyout pricing
and financial structure for our sample period (1990-2006) also provides a useful comparison to the
results of Kaplan and Stein (1993) for deals of the 1980s.
Table I describes the buyout sample and deal pricing. The buyout price, referred to as “post-
buyout total capital” or simply “capital”, is measured as the sum of the market value paid for the
firm’s equity, the value of outstanding debt, and the fees paid in the transaction, minus cash
removed to finance the buyout. For the full sample of 192 buyouts, the median deal size (capital) is
$463.7 million, but there is a trend towards larger deals in later years. For the period 1990 to 2005,
the median deal size for the 94 buyouts with post-buyout data is significantly larger ($509.3
million) than for the 72 remaining buyouts (median $336.9 million). This is due to the fact firms
with public debt financing, therefore reporting 10Ks post-buyout, are typically larger.
(INSERT TABLE I ABOUT HERE)
8 These include cases where the target firm is intended to be merged with another operating company, or where a privateequity firm acquires the target using the stock of another portfolio company.9 The largest concentrations of PE firms are Blackstone (14 deals), Texas Pacific Group (13 deals) and KKR (11 deals).
8/7/2019 Do Buyouts Create Value
http://slidepdf.com/reader/full/do-buyouts-create-value 8/59
7
We describe the price paid relative to fundamentals using the firms’ earnings before interest,
taxes, depreciation, and amortization (EBITDA) in the last full year prior to the buyout completion,
as a percentage of capital. This measure is not significantly different between firms with and
without post-buyout data completed by 2005. We also report a market adjusted measure which
subtracts the same ratio for firms in the S&P 500 at the time of the buyout. The market adjusted
measure is greater for the deals with post-buyout data available, suggesting they are less
aggressively priced, but the difference is not economically or statistically significant. The ratio
declines in recent years, reaching a low of 0.86 for the full sample in 2006.10
As an additional measure of deal pricing, Table I reports the premium paid, calculated as the
percentage difference between the price paid for a firm’s equity and the price one month before the
buyout announcement. The median premium does not increase over our sample period, and for the
full time period is relatively low (median of 29.2% for 1990 to 2006) compared to Kaplan and
Stein’s median of 43% for the 1980s.11
Although the premium paid for deals completed in 2006
does not indicate these deals are more aggressively priced, the decline in EBITDA/capital for the
2006 deals suggests that the cash flow characteristics of 2006 buyout targets may be different from
those completed in earlier years. Overall, the sample deals do not appear highly priced relative to
the transactions of the 1980s, and importantly for our study, do not appear substantially different for
firms depending on whether post-buyout data are available.
Tables II and III describe the financing structure of the deals. Table II reports the aggregate
debt levels and coverage ratios, based on data from SEC filings, Dealscan, and Dealogic. Overall
leverage is measured by the ratio of pre- or post-buyout debt to capital or to EBITDA. Post-buyout
10 To provide a more direct comparison to Kaplan and Stein (1993), a market adjusted ratio based on the S&P 500 P/Eratio reaches a low of 3.23 in 2006, which is lower than for any year reported for their sample.11 There are two cases of negative premiums in 2003 where 1) the stock price of the target firm declined significantlyfrom one month prior to the day before the buyout announcement, and 2) the purchase price was lower than the marketprice, but agreement with shareholders was reached (following shareholder lawsuits).

8/7/2019 Do Buyouts Create Value
http://slidepdf.com/reader/full/do-buyouts-create-value 9/59
8
debt is equal to the sum of new debt issued to finance the buyout and pre-buyout debt retained. We
use book values of debt, as most new debt is issued at a price close to its face value, and relatively
little long term pre-buyout debt is retained. Prior to the buyout, firms have a leverage ratio of
approximately 23.7% (pre-buyout debt/capital) for the full sample. However, leverage is
significantly increased with these transactions, to a sample median of nearly 70% post-buyout
debt/capital (and a median percentage increase in leverage of 45.7%). Thus, a potentially large
source of value for the sample firms is an increase in interest tax shields. The high level of post-
buyout debt may also serve as a disciplining mechanism, as firms take on substantial default risk in
these transactions. Similarly, debt as a multiple of EBITDA increases from 1.8 to 6.0 (full sample,
total). This leverage corresponds to a ratio of total equity to capital of approximately 30% (versus a
sample average of 6.52% from Kaplan and Stein). Although they are very highly levered, the deals
in our sample are more conservatively financed than deals of the late 1980s, where leverage ratios
approached 90%.
(INSERT TABLE II ABOUT HERE)
Interest coverage ratios (EBITDA/interest ) have a median of 1.87 for the full sample. These
coverage ratios are based on expected interest payments at the time of the buyout, using EBITDA
for the last full fiscal year prior to the buyout.12 Where data are available, we also report the
coverage of interest plus required principal repayments. Using the average projected principal
payments for the first two post-buyout years, this coverage ratio also well exceeds 1.0. One reason
for the strong coverage ratios at the time of the buyouts is that few transactions rely on expected
asset sales subsequent to the buyout (see Section III), and so rely only on the firm’s operating cash
flows to repay debt.
12 Expected interest payments are based on stated interest rates or on stated spreads over LIBOR. We use the 3-monthLIBOR rate at the end of the announcement month for this calculation.
8/7/2019 Do Buyouts Create Value
http://slidepdf.com/reader/full/do-buyouts-create-value 10/59
9
Despite the fact that firms with publicly traded debt are more likely to have post-buyout data
available, none of the median leverage statistics in Table II are significantly different between the
groups of deals with and without post-buyout data available. The characteristics of the debt
financing are provided in Table III. Using data from Dealscan, Dealogic, and SEC filings, we
categorize the types of debt financing as bank debt, other private debt, or public debt. Bank debt is
frequently syndicated and can be traded in the secondary loan market. Similar to other forms of
dispersedly held debt, widely held bank debt may be difficult to restructure in the event of financial
distress. Deals with post-buyout data available have lower levels of bank debt to capital (median of
31.2% versus 47.5% through 2005), as public debt financing likely replaces some bank debt for
these deals.
(INSERT TABLE III ABOUT HERE)
Public debt financing is used in approximately 45% of all deals, similar to what is found by
Kaplan and Stein (1993) for deals in the late 1980s. In all but 3 cases, high yield bonds are issued
in the 144A market.13 The level of public debt to capital is the most significant difference between
firms that do or do not have post-buyout data available. This is also related to the finding that the
post-buyout data firms tend to be somewhat larger (Table I). 70.2% of firms with post-buyout data
available have public debt financing, versus 16.7% for those without (through 2005), with a mean
level of public debt/capital of 25.3% vs. 5.6%, respectively.
Other debt characteristics shown in Table III can be useful indicators of lenders’ views of
the risk of these financings. Debt sold with pay-in-kind (PIK) features or discount debt can indicate
that the firm is not expected to have sufficient cash flow to pay current interest on all its
indebtedness. PIK or discount bonds are used relatively frequently, and are observed for 23.4% of
the sample deals, more than one half of the incidence of public debt financing. The mean amount
13 This is consistent with Goldstein & Hotchkiss (2009) who report that since 2002, 85% of high yield bonds are sold asRule 144A issues.
8/7/2019 Do Buyouts Create Value
http://slidepdf.com/reader/full/do-buyouts-create-value 11/59
10
issued, as a percentage of capital, is not statistically different for deals through 2005 with versus
without post-buyout data. Strip financing, where the provider of debt financing also holds an equity
stake, has been suggested to reduce conflicts in the event of financial distress (Jensen (1989a)).
13.5% of deals use this type of financing, very similar to what was observed for deals from the
1980s.
An alternative way to measure the riskiness of the debt is its credit rating. Although not all
sample firms have publicly traded debt, a large proportion have their bank debt rated. Of the firms
with information available from Dealscan or Dealogic, post-buyout credit ratings range as low as
CCC+, indicative of their high level of risk. Further, 14 out of 192 deals in our sample (all
completed in 2005 or 2006) have a second lien term loan. The margin on the 2nd
lien term loan is
on average 366 basis points higher than the margin on the first lien loan for the same deal,
indicative of their junior position and riskiness.
II. Returns to pre- and post-buyout capital.
For each firm with post-buyout data available, we estimate the return to capital invested
from the time of the buyout to a final resolution or “outcome” for the transaction using a
methodology based on that of Kaplan (1989a, 1989c, 1994) and Andrade and Kaplan (1998). The
nominal return to capital is calculated as follows:
= -1
Interim payments are the post-buyout cash payments to providers of debt and equity capital
while the firm is private, and are calculated as the sum of cash interest, net debt principal paid,
dividends, and net equity repurchased. The terminal value is the total dollar value received by
capital at the outcome date (see below). Capital is defined as the market value of equity plus debt
NominalReturn to
Capital
∑ Interim Payments to Capital + Terminal Value
Capital

8/7/2019 Do Buyouts Create Value
http://slidepdf.com/reader/full/do-buyouts-create-value 12/59
11
at the fiscal quarter end prior to the buyout (for computing returns to pre-buyout capital), or as the
buyout price (for computing returns to post-buyout capital). We also report “market and risk
adjusted” returns by discounting the interim payments and terminal value by an unlevered return.14
This is equivalent to the realized net present value of the transaction, scaled by the pre- or post-
buyout capital invested. The return measures the gain over the entire period the firm is private.
Calculating the terminal value requires that we identify the “outcome” for the transaction
(for firms with financial sponsors, this is sometimes referred to as the “exit” date from the private
equity firm’s portfolio). We search SEC filings, news sources, Lexis/Nexis, and Dealogic to
identify outcomes which include a subsequent IPO, acquisition by another company, acquisition by
another private equity firm (known as a secondary LBO), or Chapter 11 or distressed restructuring.
Remaining firms are still private or the outcome is unknown. A summary of these outcomes is
provided in Table IV, both for the initial sample of 192 buyouts and the 94 deals completed by 2005
which have post-buyout data available (90 of these have sufficient data for our return calculations).
(INSERT TABLE IV ABOUT HERE)
Table IV shows that 23 firms enter Chapter 11 or a distressed restructuring, which is 12% of
the full sample of 192 firms, but 22.5% of firms which have reached an outcome (groups 1 through
4 in Table IV). For comparison, Andrade and Kaplan (1998) report that 29% of their initial sample
of 136 MBOs and leveraged recaps fail by 1995, most of which are deals completed between 1985
14 Since the cash flows include payments to all providers of capital (both debt and equity), we use a discount rate based
on an unlevered return. From the CAPM, our discount rate is equal to r f *(1-βu) + βu*r m, where r f is the one month T-billreturn (Ibbotson) and r m is the realized return on the S&P 500 from the pre- or post-buyout date to the date of the cash
flow. βu is the asset beta calculated using stock returns for up to 60 months prior to the buyout and the pre-buyoutdebt/equity ratio (see Gilson, Hotchkiss and Ruback (2000) and references therein for detailed explanation of the assetbeta calculation). Our return calculations differ from the “market adjusted” returns calculated by Andrade and Kaplan(1998) who discount cash flows by the value weighted S&P 500 equity return, which is equivalent to assuming the assetbeta of the buyout firm is equal to one. Since the median asset beta of firms in our sample is 0.67, this would producean overly conservative estimate of returns for our sample. See also Groh and Gottschalg (2009) for discussion of risk adjusted discount rates for buyouts.

8/7/2019 Do Buyouts Create Value
http://slidepdf.com/reader/full/do-buyouts-create-value 13/59
12
and 1989.15 In the Chapter 11 cases in our sample, there is typically almost no recovery to equity
holders, and control of the firm is given to senior lenders. Interestingly, we identify only two out of
court distressed restructurings, and a large portion of the Chapter 11 restructurings are
“prepackaged” bankruptcies. This is consistent with the idea that the resolution of distress via
Chapter 11 may not be costly for these firms. Table IV also shows the proportion of firms for
which there is no observed outcome – for all but 5 of these firms (all of which are deals prior to
2000), we are able to verify from Lexis/Nexis that the firm is still private.
Using this information, the terminal value at the outcome date is determined from the
observed value at exit from Chapter 11, sale of the firm, the time of an IPO, or the last available
year if still private. When a terminal value cannot be directly observed (cases where information on
final distributions is not available, or the firm is still private), we estimate it as a multiple of
EBITDA. EBITDA multiples are calculated as the industry median ratio of market value of debt
plus equity to EBITDA of all firms on Compustat with the same four-digit SIC code.16
Similar
results are obtained using multiples of revenues rather than EBITDA.
The realized returns to pre- and post-buyout capital are reported in Table V. As expected,
the nominal and the market and risk adjusted returns are negative for the Chapter 11 group. Four
Chapter 11 firms still produce positive nominal returns to pre-buyout capital, a lower proportion
than reported by Andrade and Kaplan (1998) (whose study largely includes financially but not
economically distressed firms). Overall, Table V demonstrates the mean and median returns are
positive. For example, the median market and risk adjusted return to pre-buyout capital for the full
15 Given our shorter post-buyout horizon relative to Andrade and Kaplan (1998), some of our sample deals which are“still private” may ultimately fail, particularly given the economic downturn starting at the end of our sample period.The 6% failure rate reported by Strömberg (2008) for financial sponsor buyouts from 1970 to 2007 may also ultimatelybe higher.16 When the buyout firm is still private, industry multiples are measured at fiscal year end 2007.
8/7/2019 Do Buyouts Create Value
http://slidepdf.com/reader/full/do-buyouts-create-value 14/59
13
sample of 90 firms in the analysis is 72.5%. If we exclude firms in outcome group 5 (still private or
unknown), the median return is still positive and significant (68.7%).
(INSERT TABLE V ABOUT HERE)
The return calculations depend substantially on the terminal value realized. For firms that
are still private, and for some firms in other outcome groups where the final payoff to providers of
the buyout capital could not be determined, the terminal value is estimated. We examine the
sensitivity of our return calculations to the estimation methodology in two ways. First, excluding
cases in Table V where the return uses an estimated terminal value, the overall sample returns are
still positive and significant. Second, we examine a subsample of 59 cases that use an observable
terminal value, but for which we can also apply a multiple of EBITDA to produce an estimate of the
terminal value; comparing the means or medians across methods demonstrates the magnitude of the
impact of the estimated terminal value on the return (see Internet Appendix Table IA.V.1). Mean
and median returns using terminal values estimated from multiples rather than the observed values
are somewhat lower (93.3% versus 99% for the median nominal return to pre-buyout capital), but
differences in the mean and median returns are not statistically significant.
It is also important to consider the potential impact of sample selection issues (due to the
availability of post-buyout data) in interpreting our results. Within the 90 firms used to calculate
the returns, 65 firms used public debt to finance the buyout and therefore report subsequent
financial statements regardless of the ultimate reason for exit. The remaining 25 firms present a
more obvious selection bias, perhaps reflecting better performance, as they subsequently report
historical financial data for a post-buyout IPO (12 firms), acquisition (9 firms), or financing (4
firms). We therefore rerun our results in Table V eliminating these 25 firms (see Internet Appendix
Table IA.V.2); the median returns are very similar to those in Table V.

8/7/2019 Do Buyouts Create Value
http://slidepdf.com/reader/full/do-buyouts-create-value 15/59
14
III. Sources of value creation: changes in operating performance
The large positive returns to invested capital suggest that, at least on average, value is
created for those investors. We expect a primary determinant of the returns to be the changes in
operating performance of the firm after it is taken private. In this section, we first document the
post-buyout operating performance for the 94 deals completed by 2005 with post-buyout financial
data. We then relate observed operating performance gains to variables which proxy for sources of
these gains, such as improved management incentives, discipline of higher debt levels, better
monitoring by buyout sponsors, and other pre-buyout characteristics.
III.A. Changes in operating cash flows.
In order to evaluate the economic and statistical significance of pre- to post-buyout changes
in operating performance, cash flow changes must be adjusted by some benchmark. Empirical
literature suggests several approaches for determining the matching firms used for this benchmark.
We report results for three measures: 1) unadjusted changes, 2) using the industry median as the
benchmark, 3) matching on industry, pre-buyout level of performance, change in performance pre-
buyout, and market to book ratio of assets. The industry median adjusted performance provides the
most direct comparison to prior research (Kaplan (1989a)), using firms in the same four-digit SIC
code. Our alternative performance-adjusted benchmark is based on Lie (2001), who shows that this
benchmark yields more powerful test statistics, especially for samples with extreme pre-event
performance. We select up to 5 matching firms that have the smallest sum of absolute differences
from the sample firm in the year -1 level of performance, change in performance, and market-to-
book ratio of assets, and use the median as our benchmark.17
17 We follow Lie (2001) and Grullon and Michaely (2004) with some small modifications. The comparison groupincludes firms that have the following characteristics: (1) the same two-digit SIC code as the buyout firm, (2) a level of
operating performance between 80%-120% or within ±0.01 of the level of the sample firm’s performance in year –1, (3)
a change in operating performance between 80%-120% or within ±0.01 of the sample firm’s change in operating
8/7/2019 Do Buyouts Create Value
http://slidepdf.com/reader/full/do-buyouts-create-value 16/59
15
Table VI reports the percentage changes in operating performance for the last full year prior
to completion of the buyout (year -2 to -1), from year -1 to up to three years after the year in which
the buyout is completed (year 0), and from the last full pre-buyout year to the year prior to the deal
outcome or the last available year if still private (year -1 to last year). We also report this last
measure for the subset of deals with outcomes as of July 2008 (an IPO, sale, secondary buyout, or
bankruptcy of the firm).
(INSERT TABLE VI ABOUT HERE)
Panel A.1 of Table VI reports measures of firm profitability (return on sales, calculated as
the ratio of EBITDA or net cash flow to sales). Other than the change in net cash flow/sales for year
-1 to +1, the unadjusted changes in EBITDA/sales and net cash flow/sales are negative for the
changes to each post-buyout year. The industry adjusted changes are most comparable to prior
research for buyouts, but do not show any significant gains. However, using the industry-
performance-market/book adjusted change, there is a significant increase from year -1 to year +1 or
+2 for both EBITDA/sales and net cash flow/sales. Still, even in these cases, the magnitudes are
substantially smaller than reported by Kaplan (1989a). For example, Kaplan reports percentage
gains in industry adjusted net cash flow/sales (relative to year -1) of 45.5%, 72.5%, and 28.3%, for
the first three years following the buyout, respectively. At best, we find a median percentage gain
in net cash flow of 14.3% using the performance adjusted benchmark. The smaller magnitude of
the cash flow gains in comparison to buyouts of the early 1980s may be due to the fact that many of
the buyouts from the earlier period involved firms with relatively poor pre-buyout performance.18
performance in year –1, (4) a market-to-book ratio between 80%-120% or within ±0.1 of the sample firm’s market-to-book ratio in year –1, and (5) financial data available in the first full year after the buyout.18 Bharath and Dittmar (2009) and Mehran and Peristiani (2008) show that factors driving firms to go private havechanged since the 1980s. Our results are consistent with Kang et al. (2007) who show that the probability of an LBOoccurring increases with the total funds raised by the private equity industry, and with Ljungqvist et al. (2008) whoshow that buyout funds accelerate their investments when credit market conditions loosen.
8/7/2019 Do Buyouts Create Value
http://slidepdf.com/reader/full/do-buyouts-create-value 17/59
16
Table VI shows that firms in our sample perform above or similarly to their industries, based on
changes from years -2 to -1.
Even if profitability has not significantly improved by the time of exit, firms may still
increase in value (producing high returns to capital) if they have increased the productivity of their
assets. For example, a firm may sell non-productive assets, leaving EBITDA/sales unchanged but
decreasing assets and so increasing the return on assets. Returns to capital also increase when
proceeds from sales of less productive assets are paid out to providers of capital. Panel A.2 of
Table VI reports results for the return on assets, measured as EBITDA/average total assets. One
difficulty in normalizing by total assets is that some firms write up assets for accounting purposes at
the time of the buyout. Based on information from 10K reports, we add back the write-up amount
to the pre-buyout assets so that the accounting change does not distort our measure of the
performance change. Performance on an industry adjusted basis, in contrast to the studies of earlier
buyouts, is not significant. The benchmark adjusted performance, however, shows improvement by
the last year prior to exit of approximately 11% for EBITDA/total assets, and 22% for net cash
flow/total assets.
Important to interpreting these results is the potential impact of survivorship bias. If the
most successful firms leave the sample prior to year +3 due to an IPO, this will downward bias our
results. On the other hand, if firms exit prior to year +3 due to Chapter 11 or a distressed
restructuring, the remaining sample will look relatively better. Therefore, returns from year -1 to
the last year may be most informative. Panel B of Table VI demonstrates the variability in
performance from year -1 to last, depending on the outcome. The gains for the IPO and secondary
buyout samples are substantially greater, though the industry adjusted measures even for these
groups are still smaller than reported in prior studies. Management and “monitoring” fees paid to
8/7/2019 Do Buyouts Create Value
http://slidepdf.com/reader/full/do-buyouts-create-value 18/59
17
private equity sponsors, which are typically expensed within the firms’ operating cash flows, are
generally not large enough to have a significant impact on measured operating performance.
To address concerns of sample selection bias, we also rerun our analysis including only
firms that use public debt to finance the buyout. These firms report post-buyout financial data
regardless of the ultimate reason for exit. The mean and median percentage gains for these firms
(reported in Internet Appendix Table IA.VI.1) are also generally not significantly different from
zero, except for net cash flow/total assets from year -1 to last year (a gain of 16%).19
In view of the large positive returns to capital documented in the previous section, the
smaller magnitude of average operating gains may be surprising. We also examine sales growth of
the firms while private (from year -1 to last); the mean and median industry adjusted gains are not
significantly positive (Internet Appendix Table IA.VI.2). While our empirical methodologies differ,
our evidence that operating gains are not large for U.S. public to private buyouts is qualitatively
similar to some recent studies of buyouts in Europe and the U.K., suggesting this behavior may not
be unique to the U.S. market.20
III.B. Explanations for post-buyout operating performance.
While operating performance gains are small on average, the variation in performance (as
seen across deal outcomes in Table VI.B) is quite large. We examine the relationship between
operating performance and factors expected to be related to operating gains, using the proxy
variables summarized in Table VII for the 94 firms with post-buyout data:
(INSERT TABLE VII ABOUT HERE)
19 We also consider that PE firms may exit in favorable market conditions before the benefits of operational changesappear in realized cash flows. For the subsample of firms exiting via an IPO, the cash flow improvements from pre-buyout to the first or second year post -IPO are not substantially greater than those reported in Table VI.20 For example, Weir et al. (2008) and Vinten (2007) show declines in profitability following buyouts in the U.K. andDenmark. However, studies that include many smaller divisional buyouts and buyouts of private firms in Europe showthat profitability increases more than benchmark firms (Cressy et al. (2007), Acharya et al. (2009), Boucly et al (2009)).
8/7/2019 Do Buyouts Create Value
http://slidepdf.com/reader/full/do-buyouts-create-value 19/59
18
1) Management incentives. The alignment of management incentives with shareholders is expected
to be greater when management contributes a greater proportion of equity financing for the buyout.
Management contributes some fraction of the equity in 58 of the 94 deals (62%, Panel A of Table
VII); for 44 of these cases with sufficient information in SEC filings, management contributes on
average 12.8% of the equity (Panel B).
2) Benefits of increased debt. Higher debt may reduce agency costs by disciplining management
(as well as increasing tax shields; see Section IV below). We measure debt relative to pre-buyout
cash flow (EBITDA) rather than as a percentage of capital, since capital also reflects deal pricing.
The median pre-buyout leverage is not high (1.9 in Panel B), but leverage increases are large,
increasing by 4 times EBITDA on average.
3) Improved governance and monitoring. We use several variables to represent potential
monitoring by a private equity (PE) firm. We include a variable for “club” deals, in which more
than one PE firm participates, perhaps reducing incentives to monitor. 26 deals in our sample
(27.7%) have more than one PE firm involved.21
PE firms are also active in governance on the
board of the portfolio firm, holding one half of the board seats on average (“ sponsor director
ratio”). Lastly, PE firms are active in the selection of management for the portfolio firm; 35 firms
(37.2%) replace the CEO at the time of the buyout or within the first year.22
We also control for
whether the post-buyout CEO also holds the position of Chairman; if management is not replaced
and the CEO is also Chairman, he or she retains substantial control, perhaps reflecting the PE firm’s
belief that reducing the influence of pre-buyout management would not lead to improved
performance. Greater monitoring by bank lenders (bank loans/total debt ) may also substitute for
monitoring by financial sponsors.
21 One deal (an MBO) has no PE firm involved in the purchase.22 Kaplan, Klebanov and Sorensen (2008) discuss the CEO selection processes for PE firms.

8/7/2019 Do Buyouts Create Value
http://slidepdf.com/reader/full/do-buyouts-create-value 20/59
19
4) Other pre-buyout characteristics and activities while private. The ability to improve operating
performance may be greatest for firms which are underperforming pre-buyout, which we measure
by return on sales (EBITDA/sales) in year -1. The firms in our sample are also active in buying
and/or selling assets while private, even when these activities are not described at the time of the
buyout. Financial sponsors of the buyout may serve as advisors for these transactions (often
collecting a transactions fee), perhaps reducing the likelihood of poorly devised acquisition
strategies or helping firms to restructure by divesting certain divisions. We use information from
the statement of cash flows to identify acquisitions and asset sales. Over half of the sample firms
are involved in asset purchases or sales of at least $10 million in any of the first three years
following the buyout. Subsequent acquisitions can be large relative to capital at the time of the
buyout, with a mean of 40.2% of capital for the 47 (out of 94) firms reporting acquisitions.23
The cross sectional regressions for post-buyout operating performance are reported in Table
VIII, first for deals which have reached an outcome (regressions 1-3) and then for the full sample
(regressions 4-6). The dependent variables are the level of post-buyout cash flows in the final year
prior to the deal outcome (ROS at last year) or the change in cash flows from the year prior to the
buyout to the last post-buyout year (change in ROS or ROA adjusted for performance of firms
matched on industry, pre-buyout performance and market to book ratio). All regressions control for
the deal size (ln (capital)). Each regression also controls for performance at year -1 (ROS or ROA
relative to the matching firm), and for regressions (1) and (4), the matching firm’s level of ROS at
the last year. Results are similar for regressions explaining the level of ROA, and for the subset of
deals with post-buyout public debt which continue to file 10Ks regardless of the deal outcome (see
Internet Appendix Table IA.VIII). Year dummies are not significant.
23 Some sample firms make a substantial number of large acquisitions once private. For example, SunGard DataSystems, which was taken private in 2005, has so far disclosed 19 acquisitions of firms in related businesses whileprivate.

8/7/2019 Do Buyouts Create Value
http://slidepdf.com/reader/full/do-buyouts-create-value 21/59
20
(INSERT TABLE VIII ABOUT HERE)
The regressions in Table VIII do not show that deals with higher management equity
contributions (management equity/total equity) perform better. Firms with greater increases in
leverage as a result of the buyout consistently show better cash flow performance. These results are
consistent with the disciplining effect of higher debt for the post-buyout firm.24 The coefficients for
the fraction of debt from senior bank lenders or the change in net working capital/sales are not
significant (Internet Appendix Table IA.VIII).
For the variables related to monitoring by the PE firm, we find that the management change
variable is positively related to cash flow performance. We control for whether the CEO is also
Chairman (positive and significant), and find that the positive effect of a management change on
profitability (ROS) is reduced when the CEO is also Chairman. Controlling for board size, the
fraction of board seats held by the PE firm (sponsor director ratio) is negative. This does not
necessarily imply a negative role for the PE firm in the governance process; an alternative
explanation is that firms with more problematic operations require more direct intervention by the
PE firm.25 Lastly, the regressions show that only the change in adjusted return on assets (ROA) is
significantly greater for “club” deals involving more than one PE firm (further discussion of club
deals is provided in Section IV below). Cash flow performance appears unrelated to the asset sale
and acquisition behavior of companies while private.
Overall, the leverage changes and governance activities appear important in explaining
operating gains. Differences across sample firms in their ability to improve operating performance
are likely to explain some of the variation in the value created by these deals, i.e. the returns to
24 It is also possible that PE firms use greater leverage for firms with better prospects. Consistent with Axelson et al(2009), the post-buyout leverage ratios for our sample firms are strongly related to current lending rates. However,current lending rates are not expected to be related to firm prospects. We therefore use the inflation adjusted leveraged-loan interest rate at the time of the buyout as an instrument for leverage, and find results similar to those reported inTable VIII. This suggests our result is not driven by the use of higher leverage for deals with ex ante better prospects.25 See also Cornelli and Karakas (2008) for discussion of PE firm involvement in firm governance.
8/7/2019 Do Buyouts Create Value
http://slidepdf.com/reader/full/do-buyouts-create-value 22/59
21
invested capital. In the next section, we examine this relationship directly, as well as other potential
sources of value changes.
IV. Explaining returns to pre- and post-buyout capital.
Given the large average returns to capital documented in Table V, it may be puzzling that
the improvements in operating cash flows, at least on average, are not consistently greater than
observed for benchmark firms. In this section, we examine the three potential determinants of
returns to pre- and post-buyout capital. We first quantify the proportion of the return that can be
explained by changes in operating performance, changes in industry or market valuations during the
time the firm is private, or realized tax benefits from increasing debt. We then use cross sectional
regressions to provide further evidence on the relative importance of these factors, as well as to
examine the impact of asset restructuring and deal pricing on returns.
IV.A. The impact of operating performance changes on returns.
We first quantify the impact of changes in operating performance on the measured returns.
The realized returns shown are the market and risk adjusted returns to pre- or post-buyout capital as
reported in Table V. For each firm, we calculate a hypothetical return that would have been
realized if the firm’s profitability, adjusted for the profitability of firms matched on industry, size,
book to market, and pre-buyout performance, had remained at its pre-buyout level. Specifically, for
each post-buyout year, we calculate a hypothetical after tax cash flow such that adjusted
EBITDA/Sales is equal to the pre-buyout level, and calculate a hypothetical return using this
adjusted cash flow. We calculate the impact of this change in cash flow separately for the interim
cash flows and for the terminal value (equal to the final year’s cash flow times the industry
valuation multiple at exit), since the effect of the terminal value on the total return can be quite
large. These calculations are shown in Internet Appendix Table IA.IX.1.

8/7/2019 Do Buyouts Create Value
http://slidepdf.com/reader/full/do-buyouts-create-value 23/59
22
The proportion of the realized return due to the firm specific change in operating
performance is equal to the difference between the realized and hypothetical returns, divided by the
realized return. Results are summarized in Panel A of Table IX. For the full sample, the adjusted
change in operating performance accounts for 22.9% of the return to pre-buyout capital, and 18.5%
of the return to post-buyout capital. Much of this effect is due to the impact of the terminal value.
We find qualitatively similar results when we calculate hypothetical returns assuming adjusted ROA
remains at its pre-buyout level.
(INSERT TABLE IX ABOUT HERE)
IV.B. The impact of changes in valuation multiples on returns.
Even with no changes in operating performance or gains from restructuring assets, positive
returns to pre- or post-buyout capital could result from increases in industry or overall market
valuation multiples while the firm is private. Specifically, holding the firm’s cash flows constant,
the terminal value realized would be higher, reflecting increases in these multiples.
Table X summarizes the median capital/EBITDA valuation multiples for the buyout sample
firms, as well as changes in the buyout firm, industry, and market multiples while the buyout firm is
private. The dates (pre-buyout, post-buyout, and terminal value or “TV”) correspond to the starting
and ending dates used to calculate pre- or post-buyout returns. The buyout firm multiples are the
total firm value at the quarter end prior to the buyout, the buyout price, or the TV realized,
respectively, divided by the last reported EBITDA at that date.
(INSERT TABLE X ABOUT HERE)
Consistent with the realized returns (Table V), firms in all groups except the Chapter 11
cases experience valuation increases. Comparing the changes in the buyout firm multiples from the
pre- versus post-buyout dates shows that much of the valuation gain is captured in the premium paid
to pre-buyout shareholders. For the sample overall, the changes in industry multiples and market
8/7/2019 Do Buyouts Create Value
http://slidepdf.com/reader/full/do-buyouts-create-value 24/59
23
(S&P) multiples are significantly positive (note that the industry multiples do not include the buyout
firm itself). For example, the median increase in the industry multiple from before the buyout to the
TV date is 1.08 times EBITDA. Therefore, a significant portion of the positive average returns are
likely due to these changes in market conditions rather than to firm specific changes while private.
We then quantify the impact of changes in industry or market valuation multiples on the
measured returns. For each firm, we calculate a hypothetical return that would have been realized if
the industry or market valuation multiple had remained at its pre- or post-buyout level. For
example, if the industry multiple had remained at its pre-buyout level, the terminal value would
change by EBITDA(at TV date) * [industry multiple(at TV date) minus industry multiple(at pre-buyout date)].
We subtract this amount from the actual terminal value, and recalculate the return to produce a
hypothetical return assuming a constant industry multiple (shown in Internet Appendix Table
IA.IX.2). We perform similar calculations of hypothetical returns holding the market valuation
multiple constant, and holding the difference between the industry and market valuation multiples
constant (allowing the market multiple to change).
The results summarized in Table IX (Panel B) show that changes in the industry multiples
have the largest impact on realized returns. For example, using medians for the IPO group, 26.2%
of the return to pre-buyout capital and 8.9% of the return to post-buyout capital can be attributed to
the industry valuation change. For the overall sample, 17.7% (12.0%) of the return to pre- (post-)
buyout capital is due to the industry valuation changes. The negative effect of the market multiple
on returns for the still private group partially reflects poor market performance in 2007. Overall,
the change in industry and market valuation multiples have an economically important effect on
realized returns.
IV.C. The impact of realized tax benefits on returns.

8/7/2019 Do Buyouts Create Value
http://slidepdf.com/reader/full/do-buyouts-create-value 25/59
24
We perform a similar analysis to quantify the impact of realized tax benefits on returns. For
each year the firm is private, we perform a hypothetical tax calculation, estimating the taxes that
would have been paid if the firm had not increased its leverage. We assume the firm has interest
payments such that it maintains its pre-buyout interest coverage ratio, or pays interest at the pre-
buyout level in unprofitable years.26
Hypothetical taxes are calculated each year using the actual
EBIT and tax loss carryforwards, and the hypothetical interest payments. We then calculate the
difference between these tax payments and those based on the actual interest deductions realized by
the firm. The sum of these differences, discounted back to the pre- or post-buyout date, provides an
estimate of the realized tax benefits of increasing leverage while private. The results summarized in
Table IX (Panel C) show that for the overall sample, the realized annual tax benefits account for a
median of 3.4% (4.8%) of the returns to pre- (post-) buyout capital (details of the calculations are
shown in Internet Appendix Table IA.IX.3).
If the firm maintains its increase in leverage beyond the time when the firm is private, the
terminal value used to calculate realized returns will also reflect an ongoing tax benefit. For firms
undergoing a secondary LBO, this is a reasonable assumption. Firms undergoing an IPO typically
reduce leverage with some portion of the proceeds from going public, so that a smaller amount of
ongoing tax benefits is likely. In contrast, firms undergoing a Chapter 11 restructuring must
substantially delever. Therefore, we calculate the impact of ongoing tax benefits on the terminal
value separately from those realized while the firm is private, and report this component of tax
benefits separately depending on the outcome. The “TV tax benefit ” in Table IX assumes the final
year’s tax benefit (calculated as above) continues in perpetuity. The potential impact on returns
from the terminal value of tax benefits is large; for firms sold in a secondary LBO, this component
26 These assumptions are similar to those used by Graham (2000) and Graham (2001). We use each firm’s marginalstate and federal tax rate, and discount estimated tax benefits at the sample median interest rate on debt.
8/7/2019 Do Buyouts Create Value
http://slidepdf.com/reader/full/do-buyouts-create-value 26/59
25
of the tax benefit explains 24.2% (29.4%) of returns to pre- (post-) buyout capital. The “total tax
benefit ” in Panel C is the median of the sum of each firm’s annual and TV tax benefit .
Comparing the magnitude of the impact of each factor on returns in Table IX, for the full
sample returns to pre-buyout capital, we can attribute 22.9% of the return to changes in operating
performance, 17.7% to changes in industry valuation multiples, and 33.8% to tax benefits from
increasing leverage. However, as noted above, the magnitude of the tax benefits is likely overstated
for certain outcome groups, such as distressed restructurings, where it is not likely the firm remains
as highly levered after exit from the PE firm’s portfolio.
IV.D. Cross-sectional analysis of determinants of returns.
Table XI reports cross sectional regressions explaining returns to capital, which provide
further comparison of the relative importance of the determinants of returns. The dependent
variable is the market and risk adjusted return to pre- or post-buyout capital. The independent
variables include measures of the changes in operating performance, industry valuation multiple,
and tax benefits from increased leverage. We also include variables that measure the extent of asset
restructuring, since increased distributions to capital from the sale of non-productive assets will
impact returns but may not be reflected in our measures of changes in operating performance. 27 We
report results both for the subsample of deals which have reached an outcome and for the full
sample of firms where returns could be estimated.
(INSERT TABLE XI ABOUT HERE)
In order to compare magnitudes of effects across coefficients, we report [in brackets]
standardized regression coefficients. As expected, operating performance changes, measured as the
change in adjusted return on sales from year -1 to the last year available, or as the change in ROA,
are strongly related to the returns to either pre- or post-buyout capital. For example, from
27 Regression coefficients are unaffected when we include a variable for the change in the sales to working capital ratioof the buyout firm, which is not significant.
8/7/2019 Do Buyouts Create Value
http://slidepdf.com/reader/full/do-buyouts-create-value 27/59
26
regression (1), a one standard deviation increase in the change in operating performance is
associated with a 0.340 standard deviation increase in the return to pre-buyout capital. The
magnitudes of the effects of changes in industry multiples or tax benefits are not dissimilar to that of
the operating performance changes, which helps us to understand why operating gains alone are not
sufficient to explain the positive average returns. The regressions also show that firms engaging in
more asset sales while private have lower returns to pre- or post-buyout capital.
We also report regressions in Panel B of Table XI that further allow us to consider the
impact of deal pricing on returns. A lower price paid in the buyout is expected to be associated with
a higher return to post-buyout capital, but not to pre-buyout capital. Our measure of deal pricing,
industry adjusted EBITDA/capital is not significant for any regressions (similar results are obtained
using an unadjusted pricing measure or the premium paid).
The variable indicating “club” deals is positive and consistently significant for the
specifications using ROS as the measure of operating performance. One possible explanation for
this result is that there is less competitive bidding for club deals.28
If the impact of the club PE
variable is simply to lower the price paid to selling shareholders, this would increase the return to
post-buyout capital but should be unrelated to pre-buyout capital’s return. However, the club PE
variable is significant in regressions for returns to both pre- and post-buyout capital. Our results for
the club PE variable are robust to other non-linear specifications of our control variable for deal
size.
We address this issue further by directly measuring whether there is competition in bidding
for the firm, using a measure of competition based on Boone and Mulherin (2007).29 To
28 Officer et al. (2009) find that target shareholders receive less in club deals than in sole-sponsored LBOs. Using adifferent sample, Boone and Mulherin (2009) fail to find any negative effect of club deals on either takeover competition or target returns.29 We obtain information from the background section of 14A and S-4 filings (for mergers) and 14D filings (for tender offers).
8/7/2019 Do Buyouts Create Value
http://slidepdf.com/reader/full/do-buyouts-create-value 28/59
27
characterize the bidding process, we identify the number of potential buyers making written private
bids before the merger announcement, and the number of potential buyers making public bids. We
define the variable “competition” as a dummy variable that equals 1 if there are multiple bidders
making either private or public bids. This measure of competition, however, is insignificant in all
regressions, as is the interaction of club PE and competition. Our evidence appears more consistent
with an alternative explanation; deals which are particularly attractive ex-ante based on their
prospects at the time of the buyout are more likely to be shared by more than one PE firms.30
Overall, the regressions show that the changes in valuation multiples and tax benefits of
increasing debt are economically as important as firm specific changes such as gains in operating
performance in explaining the realized returns to capital.31
Returns are also higher for deals with
multiple PE firms.
The ability of private equity firms to purchase firms and later exit at a higher valuation
multiple, producing substantial returns, also may be explained in part by credit market conditions
during our sample period. By taking on large amounts of cheaply priced debt, firms can lower their
WACC and therefore increase their valuation multiple.32 While growth in the junk bond market
may have fueled the buyout boom of the 1980s, the impact of collateralized debt obligation (CDO)
packaging of senior bank debt on credit spreads may have served that role more recently. We do
not find that Year Dummies (either for the year of the buyout or the year of exit) are helpful in
explaining returns, however.
30 If certain firm characteristics determine whether there are multiple PEs, the error term of the model that gives rise tothis choice may be correlated with the error term in the return regression. If so, the OLS estimate is not a consistentestimate of the marginal effect of club PE on the return. To account for the bias, we fit a two-step treatment effectmodel (see Inter Appendix Table IA.XI). These results support our interpretation of the OLS regressions.31 Besides comparing the standardized regression coefficients, we can also compare the marginal effects of our keyvariables on returns. Using regression specification (1), a one standard deviation increase in the adjusted change in ROS increases the return by 57%, a one standard deviation increase in the industry multiple increases the return by 51%, anda one standard deviation increase in the tax benefits/pre-buyout capital increases the return by 65%.32 Demiroglu and James (2009) also discuss the relationship between credit spreads and LBO valuations.

8/7/2019 Do Buyouts Create Value
http://slidepdf.com/reader/full/do-buyouts-create-value 29/59
28
V. Conclusions.
This paper examines whether, and how, leveraged buyouts from the most recent wave of
public to private transactions create value. While earlier literature focuses almost entirely on
buyouts from 1980-1989, largely consisting of management buyouts, we show that the deals
completed in the most recent peak of activity differ in a number of important respects. For a sample
of 192 buyouts of over $100 million completed between 1990 and 2006, we show that these deals
are somewhat more conservatively priced and less highly levered than their predecessors from the
1980s, but that the deals still impose substantial default risk on the firms. The deals we examine
frequently involve more than one private equity sponsor, and frequently involve significant asset
restructuring (asset sales and/or acquisitions) while private.
For LBOs with post-buyout data available, the returns to either pre- or post-buyout capital
invested on average are large and positive, and are positive for all outcome groups except those
ending in a distressed restructuring. However, gains in operating performance are either
comparable to or slightly exceed those observed for benchmark firms matched on industry and pre-
buyout characteristics, depending on the measure of performance and the post-buyout period
considered. The magnitude of cash flow gains does not approach that documented for deals from
the 1980s buyout wave, and may appear small relative to the returns we document. Consistent with
the benefits of higher debt, cash flow gains are greater for firms with greater increases in leverage
as a result of the buyout. Cash flow performance is also greater when the private equity firm has
replaced the CEO at or soon after the time of the buyout.
We then show that changes in operating performance, industry and market valuation
multiples, and tax benefits of debt each explain economically large and not dissimilar proportions of
the realized returns to capital. Changes in operating performance and in industry valuation
8/7/2019 Do Buyouts Create Value
http://slidepdf.com/reader/full/do-buyouts-create-value 30/59
29
multiples each account for approximately 20% of returns to pre-buyout capital for the full sample.
The effects of tax benefits from increasing debt can be very large, but depend on our assumptions as
to whether the increased leverage will be maintained after the firm has exited the PE firm’s
portfolio. Cross sectional regressions confirm our interpretation of the relative importance of these
effects.
Without consistent operating gains, it is unlikely that the returns we document can persist
under less favorable credit and general market conditions. Understanding the structure of these
deals, and how they created value during our sample period, provides useful information on the
prospects for these highly levered firms going forward. Although buyouts through the first half of
2007 are not as highly levered as their counterparts from the late 1980s, dramatic declines in cash
flows and valuation multiples are likely to impact the ability of PE firms to exit from public to
private buyout transactions at significantly positive returns to their investments.

8/7/2019 Do Buyouts Create Value
http://slidepdf.com/reader/full/do-buyouts-create-value 31/59
30
References
Acharya, Viral V., Hahn, Moritz and Kehoe, Conor, 2009, Corporate Governance and ValueCreation: Evidence from Private Equity, working paper, NYU Stern School of Business.
Andrade, Gregor, and Steven N. Kaplan, 1998, How costly is financial (not economic) distress?Evidence from highly leveraged transactions that became distressed, Journal of Finance 53,1443-1493.
Axelson, Ulf, Tim Jenkinson, Per Strömberg, and Michael Weisbach, 2009, Leverage and Pricing inBuyouts: An Empirical Analysis, Working paper.
Bharath, Sreedhar and Amy Dittmar, 2009, Why do firms use private equity to opt out of publicmarkets?, Review of Financial Studies, forthcoming.
Boone, Audra, and Harold Mulherin, 2007, How firms are sold?, Journal of Finance, 62, 2, 847-875.
Boone, Audra L. and Mulherin, J. Harold, 2009, Do Private Equity Consortiums Impede Takeover Competition? Working paper.
Boucly, Quentin, Sraer, David and Thesmar, David, 2009, Job Creating LBOs, Working paper,University of California, Berkeley, and HEC Paris.
Cornelli, Francesca, and O. Karakas, 2008, “Private Equity and Corporate Governance: Do LBOsHave More Effective Boards?” World Economic Forum: The Global Economic Impact of Private Equity Report 2008.
Cotter, James F. and Peck, Sarah W., 2001, The Structure of Debt and Active Equity Investors: TheCase of The Buyout Specialist. Journal of Financial Economics, Vol. 59, No. 1, 101-147.
Cressy, Robert Clive, Munari, Federico and Malipiero, Alessandro, 2007, Playing to their Strengths? Evidence that Specialization in the Private Equity Industry Confers CompetitiveAdvantage, working paper, University of Birmingham.
Demiroglu, Cem and James, Christopher M., 2009, The Role of Private Equity Group Reputation inLBO Financing, University of Florida, Working paper.
Gilson, Stuart C., Hotchkiss, Edith S. and Ruback, Richard S., 2000, Valuation of Bankrupt Firms,Review of Financial Studies, 13, 1, 43-74.
Goldstein, Michael A. and Hotchkiss, Edith S., 2009a, Dealer Behavior and the Trading of NewlyIssued Corporate Bonds, working paper, Babson College & Boston College.
Graham, John R., 2000, How Big Are the Tax Benefits of Debt?, Journal of Finance 55, 1901-1941.
8/7/2019 Do Buyouts Create Value
http://slidepdf.com/reader/full/do-buyouts-create-value 32/59
31
Graham, John R., 2001, Estimating the Tax Benefits of Debt, Journal of Applied Corporate Finance
14, 42-54.
Greene, William, 1999, Econometrics Analysis, 4th
Edition, Prentice Hall.
Groh, Alexander Peter and Gottschalg, Oliver, 2009, The Opportunity Cost of Capital of U.S.Buyouts, University of Navarra and HEC School of Management working paper
Grullon, Gustavo, and Roni Michaely, 2004, The information content of share repurchase programs,Journal of Finance 59, 651-680.
Jensen, Michael C., 1986, Agency Costs of Free Cash Flow, Corporate Finance and Takeovers,American Economic Review, 76, 323-329.
Jensen, Michael C., 1989a, Active Investors, LBOs, and the Privatization of Bankruptcy, Journal of
Applied Corporate Finance 2, 35-44.
Jensen, Michael C., 1989b, The eclipse of the public corporation, Harvard Business Review, 89, 61-74.
Kang, Hyoung Goo, Jinyong Kim, and Hui Ou-Yang, 2007, LBO risk and expected stock/bondreturns, working paper, Lehman Brothers Japan.
Kaplan, Steven, 1989a, The effects of management buyouts on operating performance and value,Journal of Financial Economics 24, 217-254.
Kaplan, Steven, 1989b, Management buyouts: Evidence on taxes as a source of value, Journal of
Finance 44, 611-632.
Kaplan, Steven, 1989c, Campeau's acquisition of Federated: Value destroyed or value added,Journal of Financial Economics 25, 191-212.
Kaplan, Steven, 1994, Campeau's acquisition of Federated: Post-bankruptcy results, Journal of
Financial Economics 35, 123-136.
Kaplan, Steven, 1997, The Evolution of U.S. Corporate Governance: We are All Henry KravisNow, Journal of Private Equity, Fall, 7-14.
Kaplan, Steven, Mark Klebanov and Morten Sorensen, 2008, “Which CEO Characteristics andAbilities Matter?” University of Chicago Working Paper.
Kaplan, Steven, and Jeremy Stein, 1993, The evolution of buyout pricing and financial structure inthe 1980s, The Quarterly Journal of Economics 108, 313-357.
Kaplan, Steven, and Per Strömberg, 2008, Leveraged Buyouts and Private Equity, University of Chicago and Stockholm School of Economics, Working Paper.
8/7/2019 Do Buyouts Create Value
http://slidepdf.com/reader/full/do-buyouts-create-value 33/59
32
Lehn, Kenneth, and Annette Poulsen, 1989, Free cash flow and stockholder gains in going private
transactions, Journal of Finance 44, 771-787.
Lichtenberg, F., and D. Siegel, 1990, The effects of leveraged buyouts on productivity and related
aspects of firm behavior, Journal of Financial Economics, 27, 165-194.
Lie, Erik, 2001, Detecting abnormal operating performance: Revisited, Financial Management 30,77-91.
Ljungqvist, Alexander, Matthew Richardson and Daniel Wolfenzon, 2007, The InvestmentBehavior of Buyout Funds: Theory and Evidence, New York University, Working paper.
Maddala, G.S., 1983, Limited-dependent and qualitative variables in econometrics, CambridgeUniversity Press.
Mehran, Hamid and Stavros Peristiani, 2008, Financial visibility and the decision to go private,Federal Reserve Bank of New York, Working Paper.
Officer, Micah S., Ozbas, Oguzhan and Sensoy, Berk A., 2009, Club Deals in Leveraged Buyouts,Marshall School of Business Working Paper No. MKT 10-08.
Simons, Tomas and Renneboog, Luc, 2005, Public-to-Private Transactions: LBOs, MBOs, MBIsand IBOs, CentER Discussion Paper No. 2005-98.
Smith, Abbie J., 1990, Corporate ownership structure and performance: The case of managementbuyouts, Journal of Financial Economics 27, 143-164.
Sorensen, Morten, Strömberg, Per Johan and Lerner, Josh,Private Equity and Long-Run Investment:The Case of Innovation(February 1, 2008). Working paper, NBER & SIFR
Strömberg, Per, 2008, “The New Demography of Private Equity,” World Economic Forum: TheGlobal Economic Impact of Private Equity Report 2008.
Vinten, Frederik, 2007, The Performance of Private Equity Buyout Fund Owned Firms, workingpaper, Copenhagen Business School.
Weir, Charlie, Peter Jones and Mike Wright, 2008, Public to private transactions, private equity andperformance in the UK: An empirical analysis of the impact of going private, workingpaper.
World Economic Forum, 2008, The Global Economic Impact of Private Equity Report 2008,Working Papers available at http://www.weforum.org.
Wruck, Karen H., 1990, Financial distress, reorganization, and organizational efficiency, Journal of
Financial Economics, 27, 419-444.
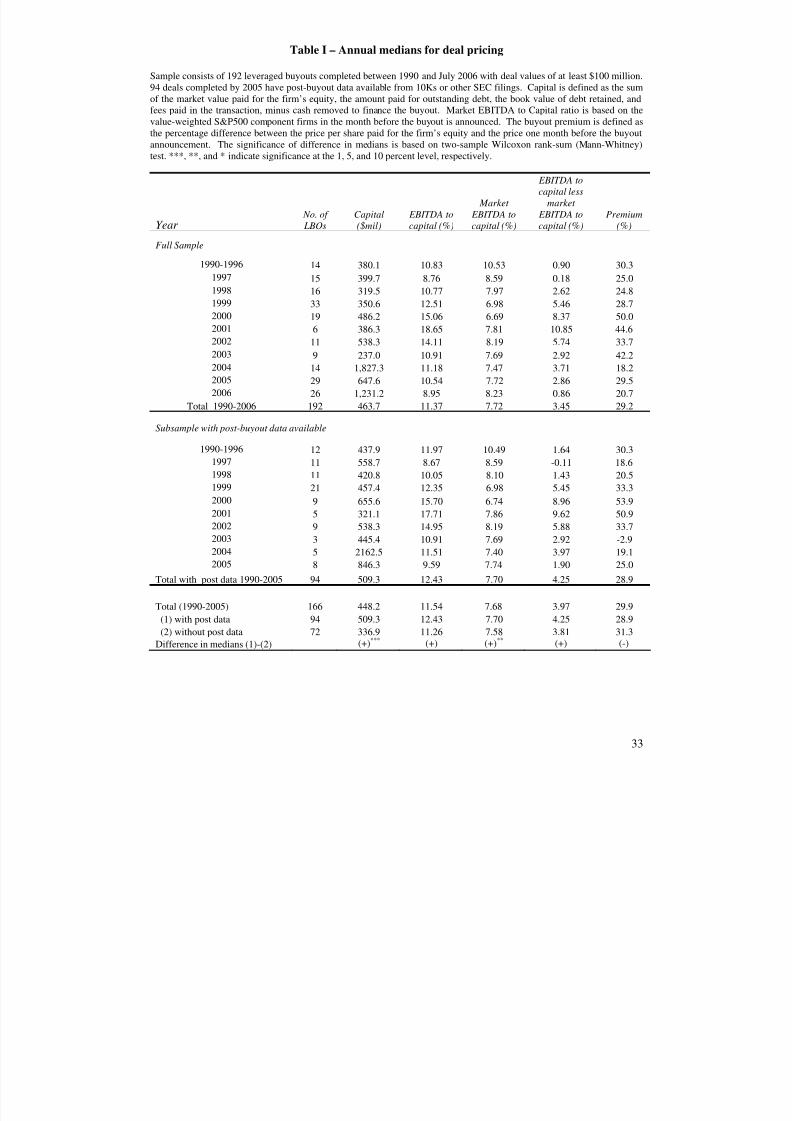
8/7/2019 Do Buyouts Create Value
http://slidepdf.com/reader/full/do-buyouts-create-value 34/59
33
Table I – Annual medians for deal pricing
Sample consists of 192 leveraged buyouts completed between 1990 and July 2006 with deal values of at least $100 million.94 deals completed by 2005 have post-buyout data available from 10Ks or other SEC filings. Capital is defined as the sumof the market value paid for the firm’s equity, the amount paid for outstanding debt, the book value of debt retained, andfees paid in the transaction, minus cash removed to finance the buyout. Market EBITDA to Capital ratio is based on thevalue-weighted S&P500 component firms in the month before the buyout is announced. The buyout premium is defined asthe percentage difference between the price per share paid for the firm’s equity and the price one month before the buyoutannouncement. The significance of difference in medians is based on two-sample Wilcoxon rank-sum (Mann-Whitney)test. ***, **, and * indicate significance at the 1, 5, and 10 percent level, respectively.
Year No. of LBOs
Capital($mil)
EBITDA tocapital (%)
Market EBITDA tocapital (%)
EBITDA tocapital less
market EBITDA tocapital (%)
Premium(%)
Full Sample
1990-1996 14 380.1 10.83 10.53 0.90 30.3
1997 15 399.7 8.76 8.59 0.18 25.0
1998 16 319.5 10.77 7.97 2.62 24.8
1999 33 350.6 12.51 6.98 5.46 28.72000 19 486.2 15.06 6.69 8.37 50.0
2001 6 386.3 18.65 7.81 10.85 44.6
2002 11 538.3 14.11 8.19 5.74 33.7
2003 9 237.0 10.91 7.69 2.92 42.2
2004 14 1,827.3 11.18 7.47 3.71 18.2
2005 29 647.6 10.54 7.72 2.86 29.5
2006 26 1,231.2 8.95 8.23 0.86 20.7
Total 1990-2006 192 463.7 11.37 7.72 3.45 29.2
Subsample with post-buyout data available
1990-199612 437.9 11.97 10.49 1.64 30.31997 11 558.7 8.67 8.59 -0.11 18.6
1998 11 420.8 10.05 8.10 1.43 20.5
1999 21 457.4 12.35 6.98 5.45 33.3
2000 9 655.6 15.70 6.74 8.96 53.9
2001 5 321.1 17.71 7.86 9.62 50.9
2002 9 538.3 14.95 8.19 5.88 33.7
2003 3 445.4 10.91 7.69 2.92 -2.9
2004 5 2162.5 11.51 7.40 3.97 19.1
2005 8 846.3 9.59 7.74 1.90 25.0
Total with post data 1990-2005 94 509.3 12.43 7.70 4.25 28.9
Total (1990-2005) 166 448.2 11.54 7.68 3.97 29.9(1) with post data 94 509.3 12.43 7.70 4.25 28.9
(2) without post data 72 336.9 11.26 7.58 3.81 31.3
Difference in medians (1)-(2) (+)*** (+) (+)** (+) (-)
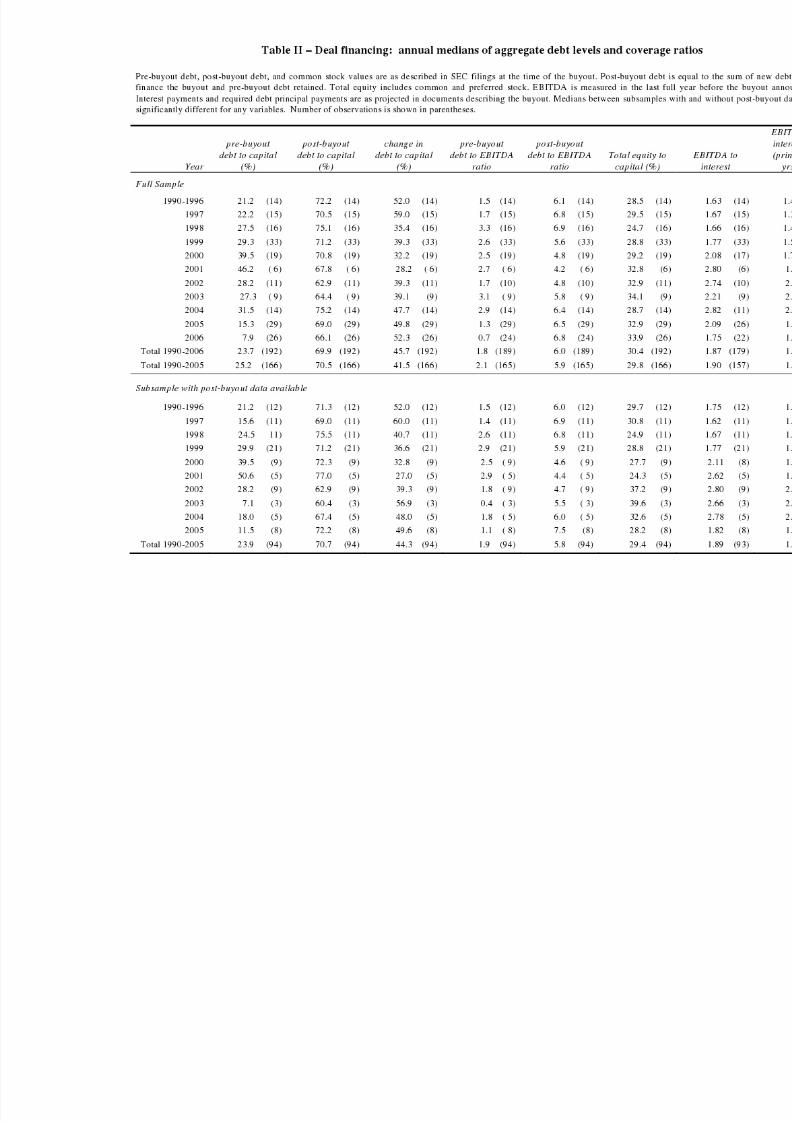
8/7/2019 Do Buyouts Create Value
http://slidepdf.com/reader/full/do-buyouts-create-value 35/59
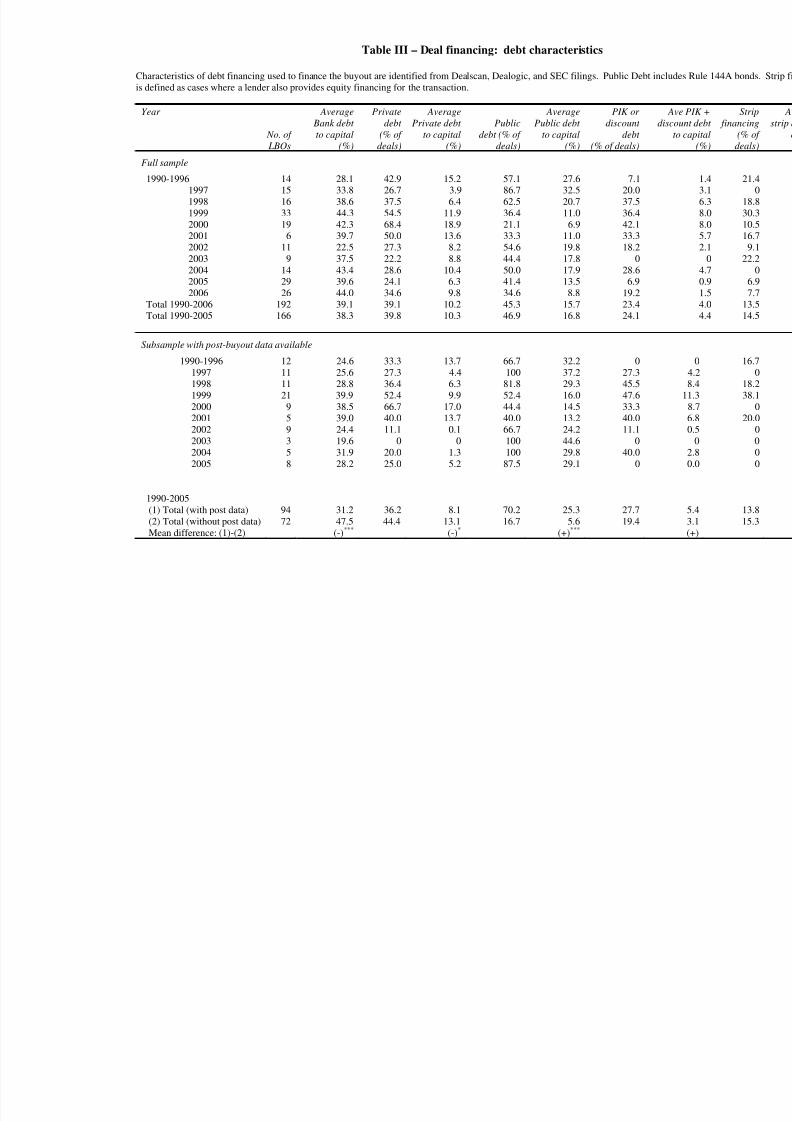
8/7/2019 Do Buyouts Create Value
http://slidepdf.com/reader/full/do-buyouts-create-value 36/59
Table III – Deal financing: debt characteristics
Characteristics of debt financing used to finance the buyout are identified from Dealscan, Dealogic, and SEC filings. Public Debt inis defined as cases where a lender also provides equity financing for the transaction.
Year
No. of
LBOs
AverageBank debt to capital
(%)
Privatedebt
(% of
deals)
AveragePrivate debt
to capital
(%)
Publicdebt (% of
deals)
AveragePublic debt
to capital
(%)
PIK or discount
debt
(% of deals)
d
Full sample
1990-1996 14 28.1 42.9 15.2 57.1 27.6 7.1 1997 15 33.8 26.7 3.9 86.7 32.5 20.0 1998 16 38.6 37.5 6.4 62.5 20.7 37.5 1999 33 44.3 54.5 11.9 36.4 11.0 36.4 2000 19 42.3 68.4 18.9 21.1 6.9 42.1 2001 6 39.7 50.0 13.6 33.3 11.0 33.3 2002 11 22.5 27.3 8.2 54.6 19.8 18.2 2003 9 37.5 22.2 8.8 44.4 17.8 0 2004 14 43.4 28.6 10.4 50.0 17.9 28.6 2005 29 39.6 24.1 6.3 41.4 13.5 6.9 2006 26 44.0 34.6 9.8 34.6 8.8 19.2
Total 1990-2006 192 39.1 39.1 10.2 45.3 15.7 23.4 Total 1990-2005 166 38.3 39.8 10.3 46.9 16.8 24.1
Subsample with post-buyout data available
1990-1996 12 24.6 33.3 13.7 66.7 32.2 0 1997 11 25.6 27.3 4.4 100 37.2 27.3 1998 11 28.8 36.4 6.3 81.8 29.3 45.5 1999 21 39.9 52.4 9.9 52.4 16.0 47.6 2000 9 38.5 66.7 17.0 44.4 14.5 33.3 2001 5 39.0 40.0 13.7 40.0 13.2 40.0 2002 9 24.4 11.1 0.1 66.7 24.2 11.1 2003 3 19.6 0 0 100 44.6 0
2004 5 31.9 20.0 1.3 100 29.8 40.0 2005 8 28.2 25.0 5.2 87.5 29.1 0
1990-2005(1) Total (with post data) 94 31.2 36.2 8.1 70.2 25.3 27.7 (2) Total (without post data) 72 47.5 44.4 13.1 16.7 5.6 19.4 Mean difference: (1)-(2) (-)*** (-)* (+)***
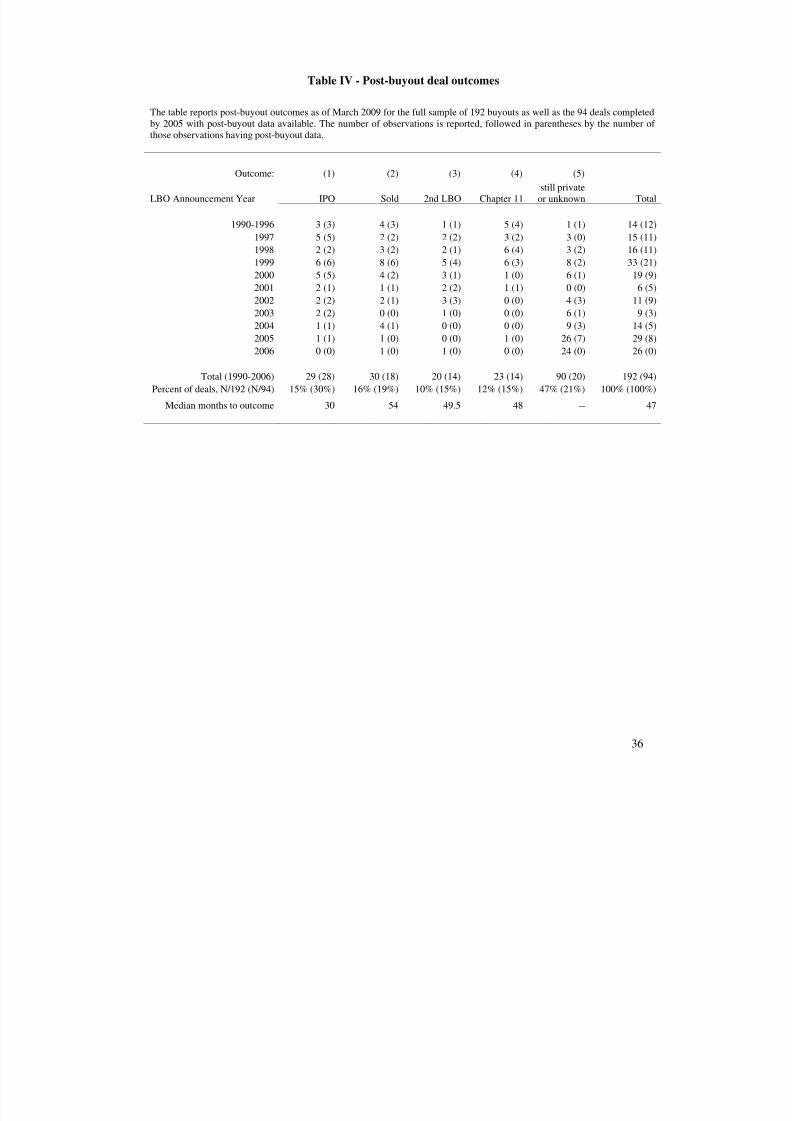
8/7/2019 Do Buyouts Create Value
http://slidepdf.com/reader/full/do-buyouts-create-value 37/59
36
Table IV - Post-buyout deal outcomes
The table reports post-buyout outcomes as of March 2009 for the full sample of 192 buyouts as well as the 94 deals completedby 2005 with post-buyout data available. The number of observations is reported, followed in parentheses by the number of those observations having post-buyout data.
Outcome: (1) (2) (3) (4) (5)
LBO Announcement Year IPO Sold 2nd LBO Chapter 11still private
or unknown Total
1990-1996 3 (3) 4 (3) 1 (1) 5 (4) 1 (1) 14 (12)
1997 5 (5) 2 (2) 2 (2) 3 (2) 3 (0) 15 (11)
1998 2 (2) 3 (2) 2 (1) 6 (4) 3 (2) 16 (11)
1999 6 (6) 8 (6) 5 (4) 6 (3) 8 (2) 33 (21)
2000 5 (5) 4 (2) 3 (1) 1 (0) 6 (1) 19 (9)
2001 2 (1) 1 (1) 2 (2) 1 (1) 0 (0) 6 (5)
2002 2 (2) 2 (1) 3 (3) 0 (0) 4 (3) 11 (9)2003 2 (2) 0 (0) 1 (0) 0 (0) 6 (1) 9 (3)
2004 1 (1) 4 (1) 0 (0) 0 (0) 9 (3) 14 (5)
2005 1 (1) 1 (0) 0 (0) 1 (0) 26 (7) 29 (8)
2006 0 (0) 1 (0) 1 (0) 0 (0) 24 (0) 26 (0)
Total (1990-2006) 29 (28) 30 (18) 20 (14) 23 (14) 90 (20) 192 (94)
Percent of deals, N/192 (N/94) 15% (30%) 16% (19%) 10% (15%) 12% (15%) 47% (21%) 100% (100%)
Median months to outcome 30 54 49.5 48 -- 47
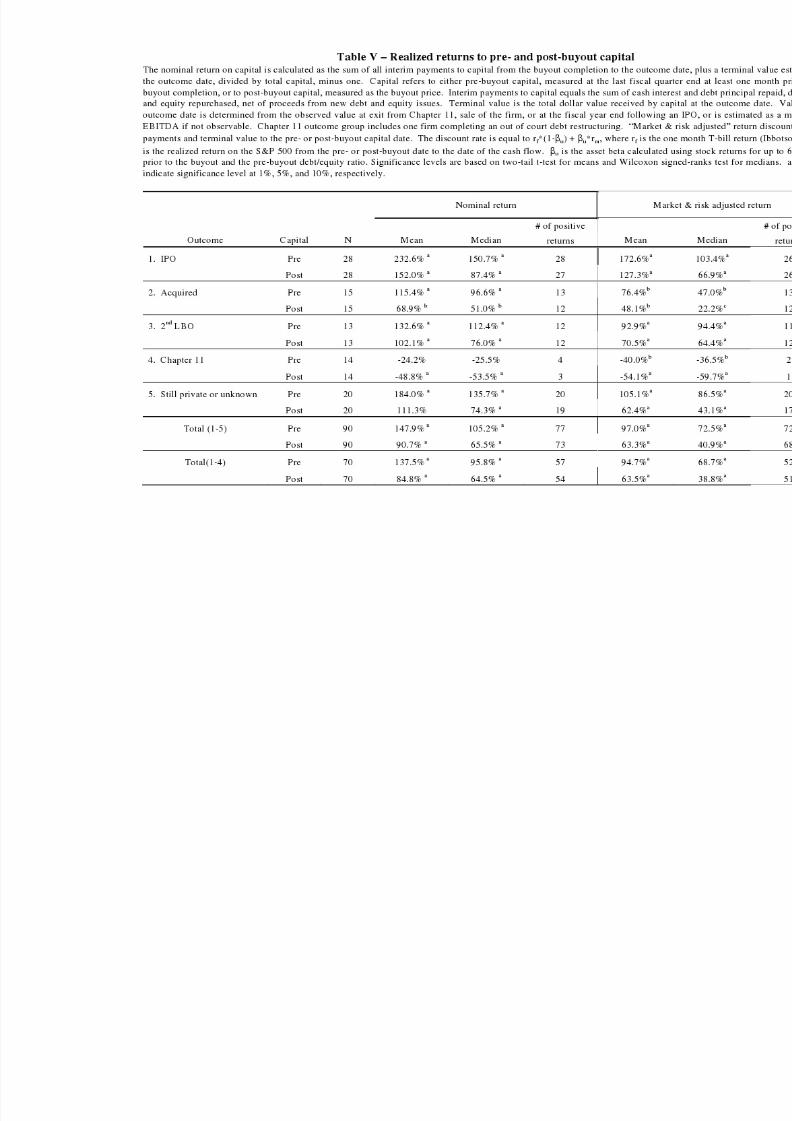
8/7/2019 Do Buyouts Create Value
http://slidepdf.com/reader/full/do-buyouts-create-value 38/59
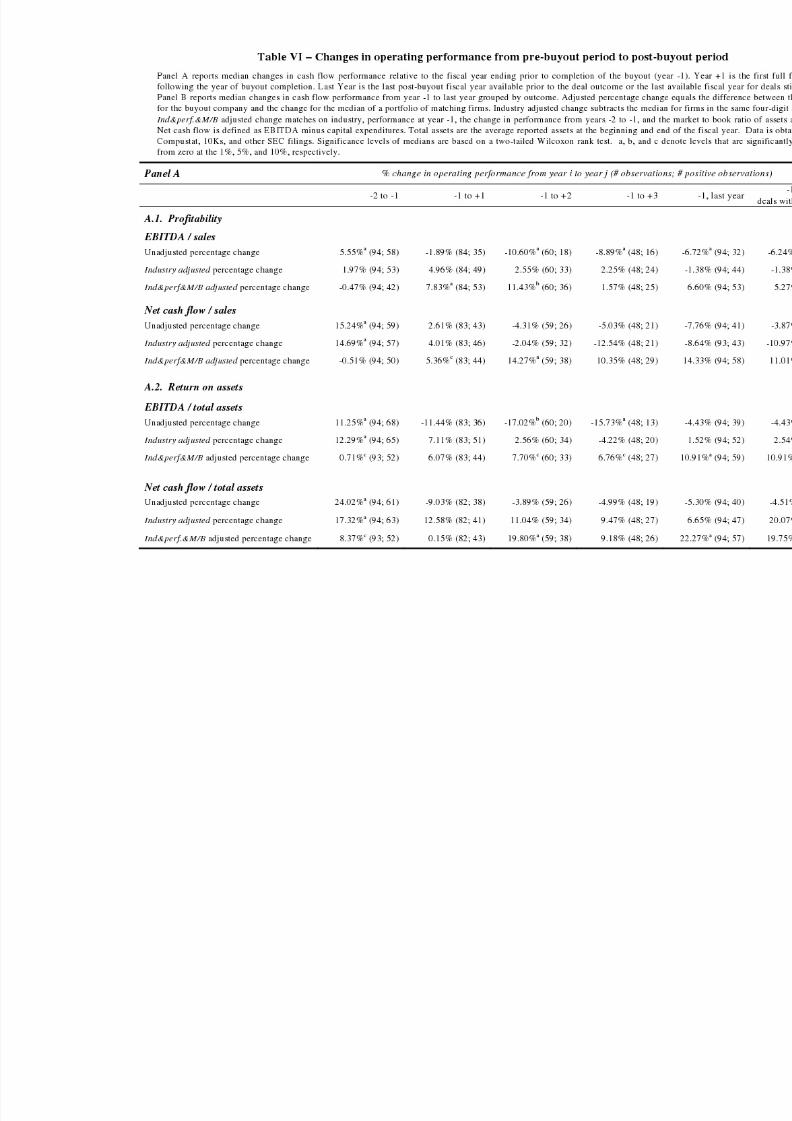
8/7/2019 Do Buyouts Create Value
http://slidepdf.com/reader/full/do-buyouts-create-value 39/59
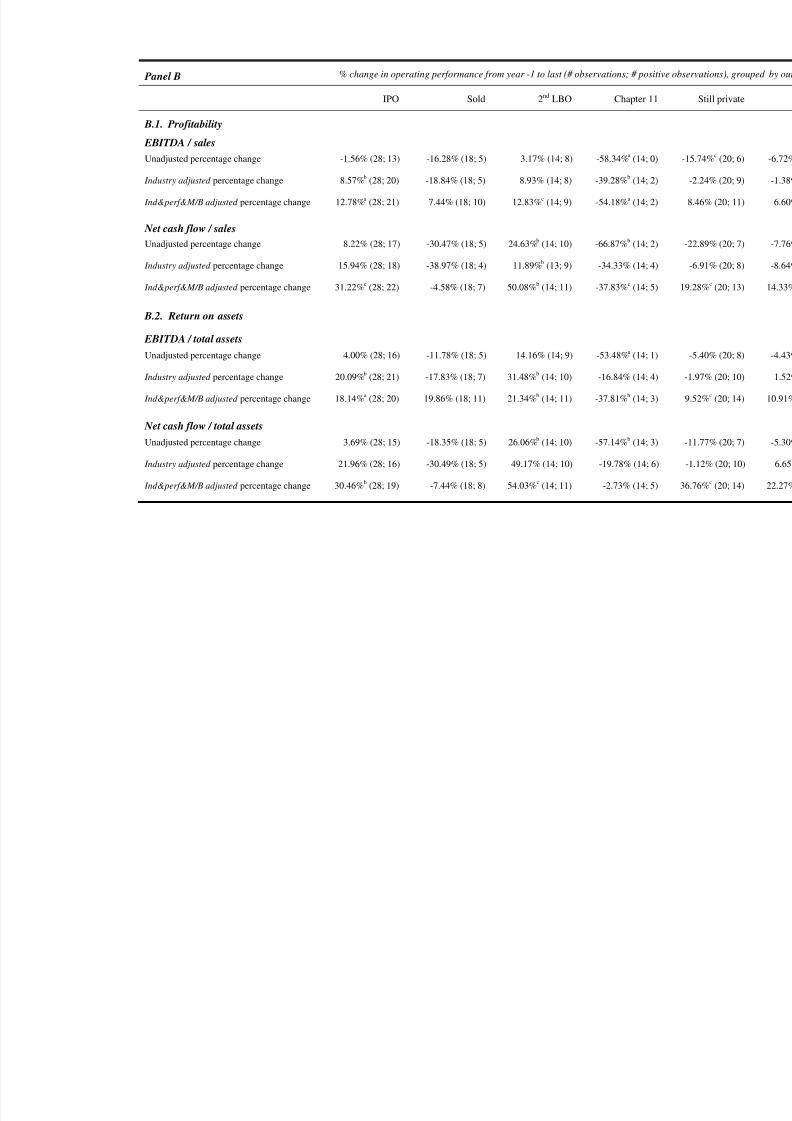
8/7/2019 Do Buyouts Create Value
http://slidepdf.com/reader/full/do-buyouts-create-value 40/59
Panel B % change in operating performance from year -1 to last (# observations; # positi
IPO Sold 2nd LBO Chapter 11
B.1. Profitability
EBITDA / sales
Unadjusted percentage change -1.56% (28; 13) -16.28% (18; 5) 3.17% (14; 8) -58.34%a
(14; 0)
Industry adjusted percentage change 8.57%b
(28; 20) -18.84% (18; 5) 8.93% (14; 8) -39.28%b
(14; 2)
Ind&perf&M/B adjusted percentage change 12.78%a (28; 21) 7.44% (18; 10) 12.83%c (14; 9) -54.18%a (14; 2)
Net cash flow / sales
Unadjusted percentage change 8.22% (28; 17) -30.47% (18; 5) 24.63%b (14; 10) -66.87%b (14; 2)
Industry adjusted percentage change 15.94% (28; 18) -38.97% (18; 4) 11.89%b (13; 9) -34.33% (14; 4)
Ind&perf&M/B adjusted percentage change 31.22%c (28; 22) -4.58% (18; 7) 50.08%b (14; 11) -37.83%c (14; 5)
B.2. Return on assets
EBITDA / total assets
Unadjusted percentage change 4.00% (28; 16) -11.78% (18; 5) 14.16% (14; 9) -53.48%a (14; 1)
Industry adjusted percentage change 20.09%b (28; 21) -17.83% (18; 7) 31.48%b (14; 10) -16.84% (14; 4)
Ind&perf&M/B adjusted percentage change 18.14%a (28; 20) 19.86% (18; 11) 21.34%b (14; 11) -37.81%b (14; 3)
Net cash flow / total assets
Unadjusted percentage change 3.69% (28; 15) -18.35% (18; 5) 26.06%b (14; 10) -57.14%b (14; 3)
Industry adjusted percentage change 21.96% (28; 16) -30.49% (18; 5) 49.17% (14; 10) -19.78% (14; 6)
Ind&perf&M/B adjusted percentage change 30.46%b
(28; 19) -7.44% (18; 8) 54.03%c
(14; 11) -2.73% (14; 5)
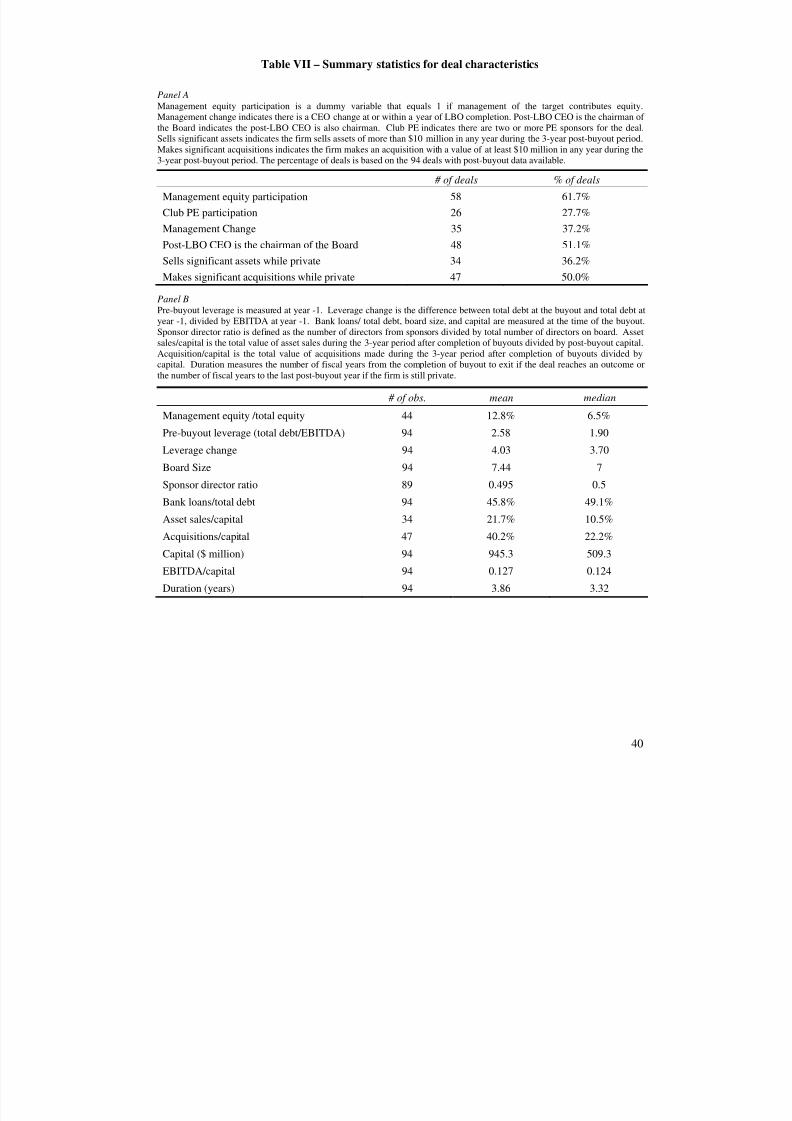
8/7/2019 Do Buyouts Create Value
http://slidepdf.com/reader/full/do-buyouts-create-value 41/59
40
Table VII – Summary statistics for deal characteristics
Panel AManagement equity participation is a dummy variable that equals 1 if management of the target contributes equity.Management change indicates there is a CEO change at or within a year of LBO completion. Post-LBO CEO is the chairman of the Board indicates the post-LBO CEO is also chairman. Club PE indicates there are two or more PE sponsors for the deal.Sells significant assets indicates the firm sells assets of more than $10 million in any year during the 3-year post-buyout period.
Makes significant acquisitions indicates the firm makes an acquisition with a value of at least $10 million in any year during the3-year post-buyout period. The percentage of deals is based on the 94 deals with post-buyout data available.
# of deals % of deals
Management equity participation 58 61.7%
Club PE participation 26 27.7%
Management Change 35 37.2%
Post-LBO CEO is the chairman of the Board 48 51.1%
Sells significant assets while private 34 36.2%
Makes significant acquisitions while private 47 50.0%
Panel BPre-buyout leverage is measured at year -1. Leverage change is the difference between total debt at the buyout and total debt atyear -1, divided by EBITDA at year -1. Bank loans/ total debt, board size, and capital are measured at the time of the buyout.Sponsor director ratio is defined as the number of directors from sponsors divided by total number of directors on board. Assetsales/capital is the total value of asset sales during the 3-year period after completion of buyouts divided by post-buyout capital.Acquisition/capital is the total value of acquisitions made during the 3-year period after completion of buyouts divided bycapital. Duration measures the number of fiscal years from the completion of buyout to exit if the deal reaches an outcome orthe number of fiscal years to the last post-buyout year if the firm is still private.
# of obs. mean median
Management equity /total equity 44 12.8% 6.5%
Pre-buyout leverage (total debt/EBITDA) 94 2.58 1.90
Leverage change 94 4.03 3.70Board Size 94 7.44 7
Sponsor director ratio 89 0.495 0.5
Bank loans/total debt 94 45.8% 49.1%
Asset sales/capital 34 21.7% 10.5%
Acquisitions/capital 47 40.2% 22.2%
Capital ($ million) 94 945.3 509.3
EBITDA/capital 94 0.127 0.124
Duration (years) 94 3.86 3.32
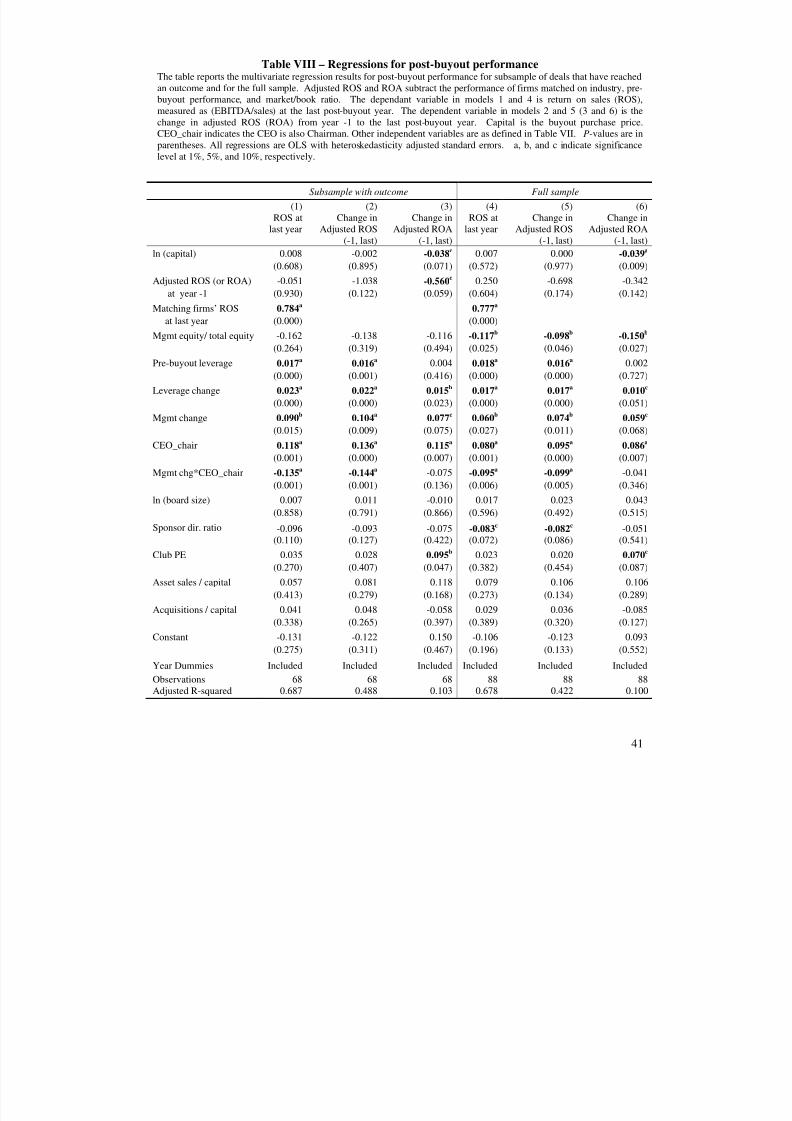
8/7/2019 Do Buyouts Create Value
http://slidepdf.com/reader/full/do-buyouts-create-value 42/59
41
Table VIII – Regressions for post-buyout performanceThe table reports the multivariate regression results for post-buyout performance for subsample of deals that have reachedan outcome and for the full sample. Adjusted ROS and ROA subtract the performance of firms matched on industry, pre-buyout performance, and market/book ratio. The dependant variable in models 1 and 4 is return on sales (ROS),measured as (EBITDA/sales) at the last post-buyout year. The dependent variable in models 2 and 5 (3 and 6) is thechange in adjusted ROS (ROA) from year -1 to the last post-buyout year. Capital is the buyout purchase price.CEO_chair indicates the CEO is also Chairman. Other independent variables are as defined in Table VII. P-values are inparentheses. All regressions are OLS with heteroskedasticity adjusted standard errors. a, b, and c indicate significancelevel at 1%, 5%, and 10%, respectively.
Subsample with outcome Full sample
(1) (2) (3) (4) (5) (6)ROS at
last yearChange in
Adjusted ROS(-1, last)
Change inAdjusted ROA
(-1, last)
ROS atlast year
Change inAdjusted ROS
(-1, last)
Change inAdjusted ROA
(-1, last)
ln (capital) 0.008 -0.002 -0.038c 0.007 0.000 -0.039
a
(0.608) (0.895) (0.071) (0.572) (0.977) (0.009)
Adjusted ROS (or ROA) -0.051 -1.038 -0.560c 0.250 -0.698 -0.342
at year -1 (0.930) (0.122) (0.059) (0.604) (0.174) (0.142)
Matching firms’ ROS 0.784a 0.777a
at last year (0.000) (0.000)
Mgmt equity/ total equity -0.162 -0.138 -0.116 -0.117b
-0.098b
-0.150b
(0.264) (0.319) (0.494) (0.025) (0.046) (0.027)
Pre-buyout leverage 0.017a
0.016a 0.004 0.018
a0.016
a 0.002
(0.000) (0.001) (0.416) (0.000) (0.000) (0.727)
Leverage change 0.023a
0.022a
0.015b
0.017a
0.017a
0.010c
(0.000) (0.000) (0.023) (0.000) (0.000) (0.051)
Mgmt change 0.090b
0.104a
0.077c
0.060b
0.074b
0.059c
(0.015) (0.009) (0.075) (0.027) (0.011) (0.068)
CEO_chair 0.118a
0.136a
0.115a
0.080a
0.095a
0.086a
(0.001) (0.000) (0.007) (0.001) (0.000) (0.007)
Mgmt chg*CEO_chair -0.135a
-0.144a -0.075 -0.095
a-0.099
a -0.041
(0.001) (0.001) (0.136) (0.006) (0.005) (0.346)
ln (board size) 0.007 0.011 -0.010 0.017 0.023 0.043
(0.858) (0.791) (0.866) (0.596) (0.492) (0.515)
Sponsor dir. ratio -0.096 -0.093 -0.075 -0.083c
-0.082c -0.051
(0.110) (0.127) (0.422) (0.072) (0.086) (0.541)
Club PE 0.035 0.028 0.095b 0.023 0.020 0.070
c
(0.270) (0.407) (0.047) (0.382) (0.454) (0.087)
Asset sales / capital 0.057 0.081 0.118 0.079 0.106 0.106
(0.413) (0.279) (0.168) (0.273) (0.134) (0.289)
Acquisitions / capital 0.041 0.048 -0.058 0.029 0.036 -0.085(0.338) (0.265) (0.397) (0.389) (0.320) (0.127)
Constant -0.131 -0.122 0.150 -0.106 -0.123 0.093
(0.275) (0.311) (0.467) (0.196) (0.133) (0.552)
Year Dummies Included Included Included Included Included Included
Observations 68 68 68 88 88 88Adjusted R-squared 0.687 0.488 0.103 0.678 0.422 0.100

8/7/2019 Do Buyouts Create Value
http://slidepdf.com/reader/full/do-buyouts-create-value 43/59

8/7/2019 Do Buyouts Create Value
http://slidepdf.com/reader/full/do-buyouts-create-value 44/59
Table IX - continued
A. Proportionof return due to: B. Proportion of return due to:
Outcome N
Realizedreturn to
pre- or post-
buyoutcapital
Change in
operatingperformance
Change in
industrymultiple
Change in
marketmultiple
Change in
(industry minusmarket) multiple
anb
in
Return to pre-buyout capital
1: IPO 28 103.4% 31.9% 26.2% 8.0% 17.9%
2: Sold 15 47.0% 8.4% 18.1% 12.5% 4.7%
3: 2nd LBO 13 94.4% 34.3% 19.7% 6.9% 10.5%
4: Chapter 11 14 -36.5% -134.5% 2.2% 10.6% -18.9%
5: Still private 20 86.5% 24.0% 31.7% -6.1% 24.7%
Total (1-5) 90 72.5% 22.9% 17.7% 5.1% 8.9%
Total (1-4) 70 68.7% 17.6% 17.2% 8.0% 5.2%
Return to post-buyout capital
1: IPO 28 66.9% 43.1% 8.9% 6.0% 7.3%
2: Sold 15 22.2% 13.8% 8.7% 9.6% 5.6%
3: 2nd LBO 13 64.4% 35.4% 32.1% 21.5% 18.0%
4: Chapter 11 14 -59.7% -118.3% 0.9% 5.2% -6.7%
5: Still private 20 43.1% 32.8% 32.3% -9.2% 38.8%
Total (1-5) 90 40.9% 18.5% 12.0% 6.6% 5.8%
Total (1-4) 70 38.8% 14.6% 9.1% 8.5% 3.5%
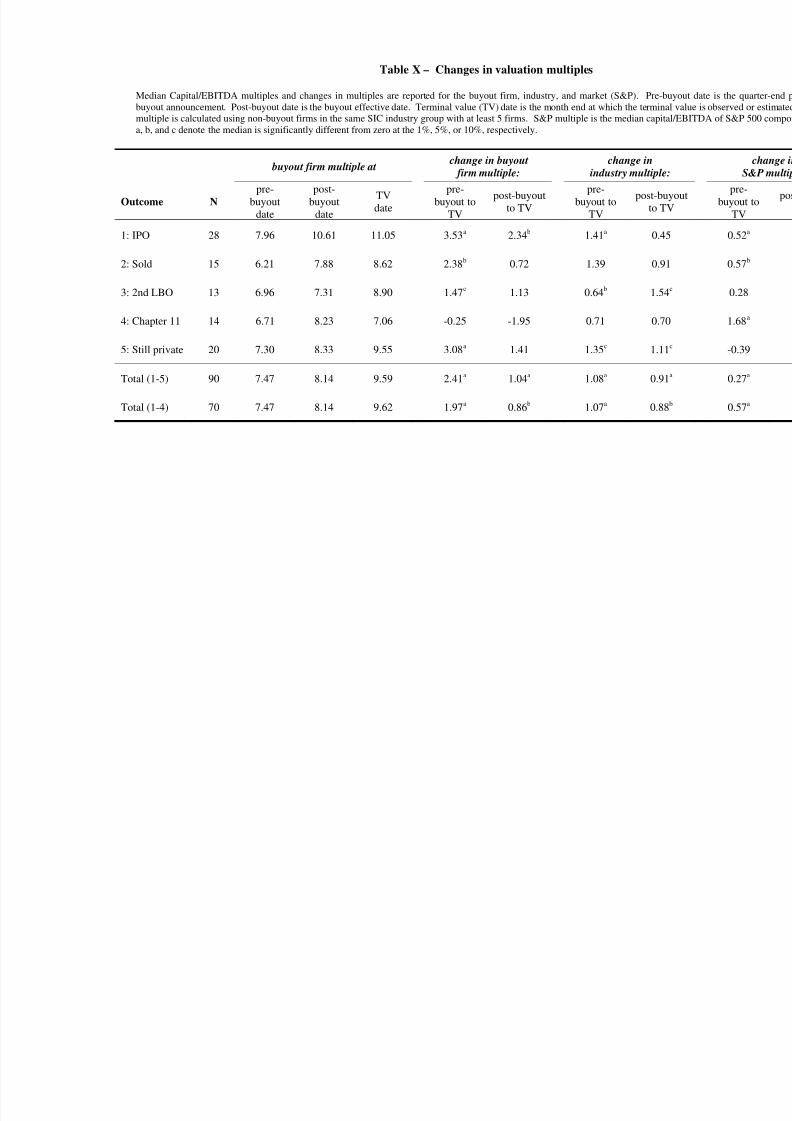
8/7/2019 Do Buyouts Create Value
http://slidepdf.com/reader/full/do-buyouts-create-value 45/59
Table X – Changes in valuation multiples
Median Capital/EBITDA multiples and changes in multiples are reported for the buyout firm, industry, and market (S&P). Pre-buyout announcement. Post-buyout date is the buyout effective date. Terminal value (TV) date is the month end at which the terminmultiple is calculated using non-buyout firms in the same SIC industry group with at least 5 firms. S&P multiple is the median capa, b, and c denote the median is significantly different from zero at the 1%, 5%, or 10%, respectively.
buyout firm multiple atchange in buyout
firm multiple:
change in
industry multipl
Outcome N pre-
buyoutdate
post-buyout
date
TVdate
pre-buyout to
TV
post-buyoutto TV
pre-buyout to
TV
post-bto T
1: IPO 28 7.96 10.61 11.05 3.53a 2.34b 1.41a 0.4
2: Sold 15 6.21 7.88 8.62 2.38b 0.72 1.39 0.9
3: 2nd LBO 13 6.96 7.31 8.90 1.47c 1.13 0.64b 1.5
4: Chapter 11 14 6.71 8.23 7.06 -0.25 -1.95 0.71 0.7
5: Still private 20 7.30 8.33 9.55 3.08a 1.41 1.35c 1.1
Total (1-5) 90 7.47 8.14 9.59 2.41a 1.04a 1.08a 0.9
Total (1-4) 70 7.47 8.14 9.62 1.97a 0.86b 1.07a 0.8
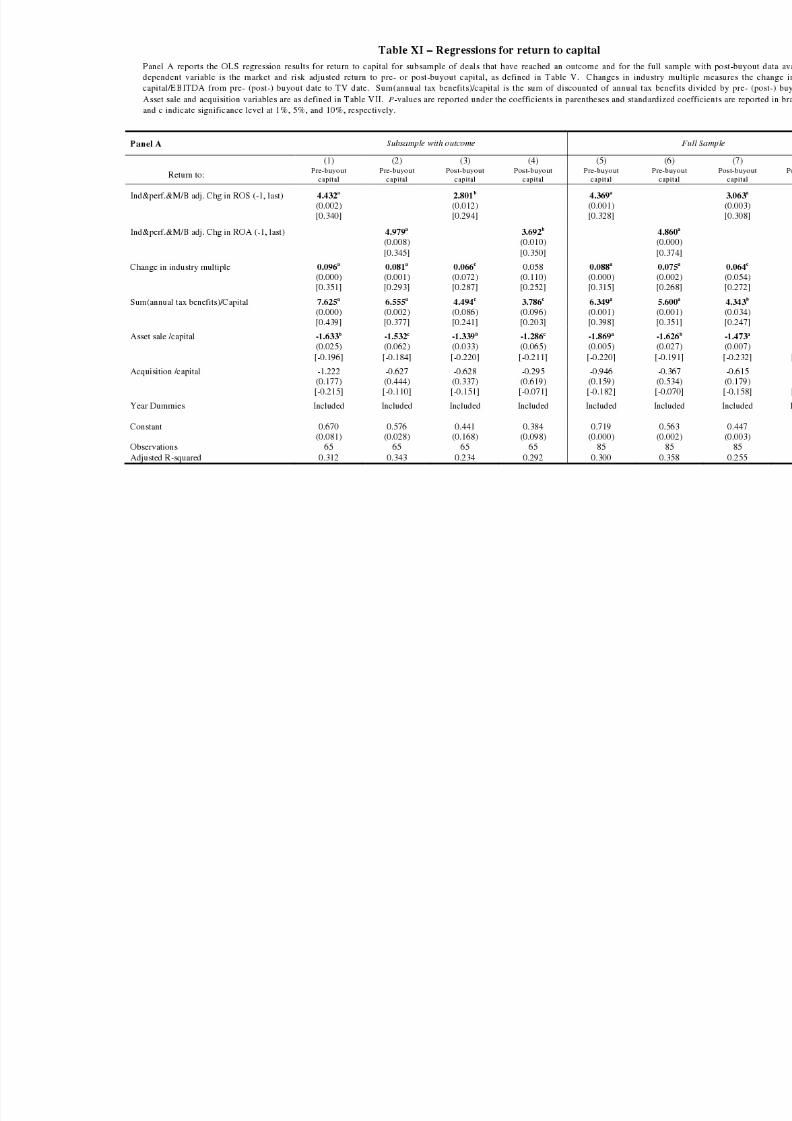
8/7/2019 Do Buyouts Create Value
http://slidepdf.com/reader/full/do-buyouts-create-value 46/59
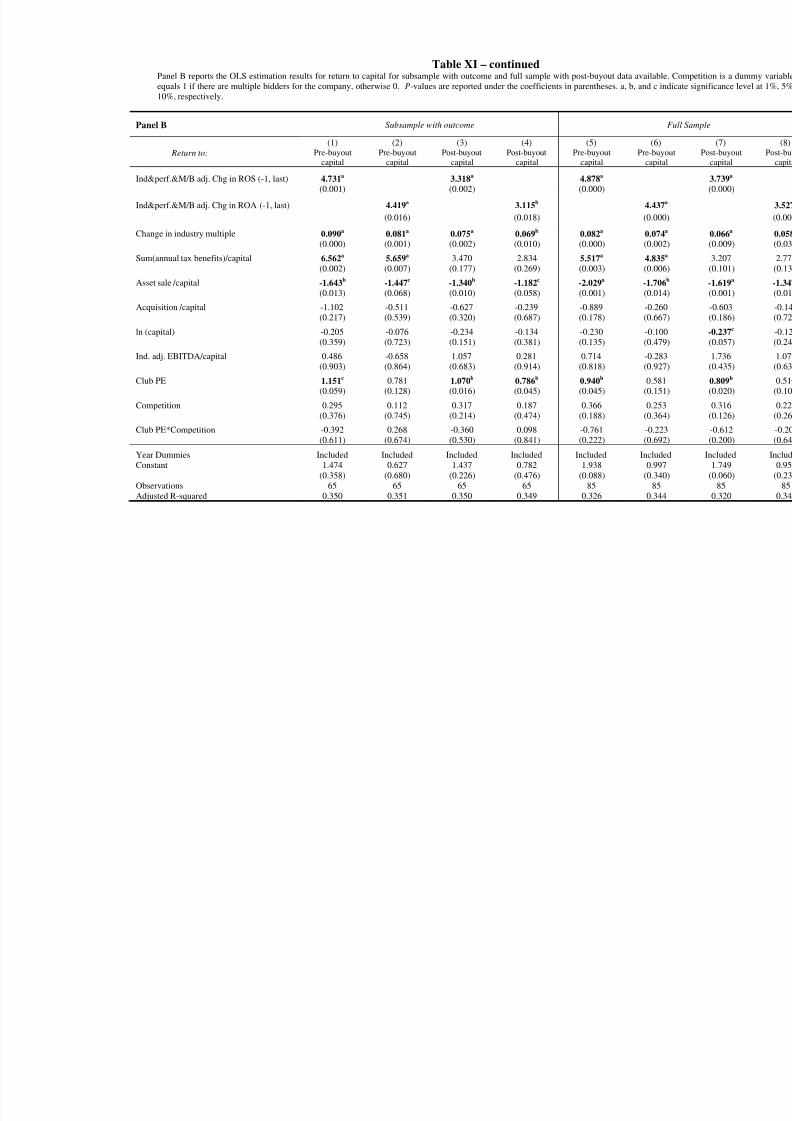
8/7/2019 Do Buyouts Create Value
http://slidepdf.com/reader/full/do-buyouts-create-value 47/59
Table XI – continuedPanel B reports the OLS estimation results for return to capital for subsample with outcome and full sample with post-buyout data availabequals 1 if there are multiple bidders for the company, otherwise 0. P-values are reported under the coefficients in parentheses. a, b, and c i10%, respectively.
Panel B Subsample with outcome
(1) (2) (3) (4) (5) (6)
Return to: Pre-buyoutcapital
Pre-buyoutcapital
Post-buyoutcapital
Post-buyoutcapital
Pre-buyoutcapital
Pre-buycapit
Ind&perf.&M/B adj. Chg in ROS (-1, last) 4.731a 3.318a 4.878a
(0.001) (0.002) (0.000)
Ind&perf.&M/B adj. Chg in ROA (-1, last) 4.419a 3.115b 4.437
(0.016) (0.018) (0.00
Change in industry multiple 0.090a 0.081a 0.075a 0.069b 0.082a 0.074(0.000) (0.001) (0.002) (0.010) (0.000) (0.00
Sum(annual tax benefits)/capital 6.562a 5.659a 3.470 2.834 5.517a 4.835
(0.002) (0.007) (0.177) (0.269) (0.003) (0.00
Asset sale /capital -1.643b
-1.447c
-1.340b
-1.182c
-2.029a
-1.70
(0.013) (0.068) (0.010) (0.058) (0.001) (0.01
Acquisition /capital -1.102 -0.511 -0.627 -0.239 -0.889 -0.26(0.217) (0.539) (0.320) (0.687) (0.178) (0.66
ln (capital) -0.205 -0.076 -0.234 -0.134 -0.230 -0.10(0.359) (0.723) (0.151) (0.381) (0.135) (0.47
Ind. adj. EBITDA/capital 0.486 -0.658 1.057 0.281 0.714 -0.28(0.903) (0.864) (0.683) (0.914) (0.818) (0.92
Club PE 1.151c 0.781 1.070b 0.786b 0.940b 0.58(0.059) (0.128) (0.016) (0.045) (0.045) (0.15
Competition 0.295 0.112 0.317 0.187 0.366 0.25(0.376) (0.745) (0.214) (0.474) (0.188) (0.36
Club PE*Competition -0.392 0.268 -0.360 0.098 -0.761 -0.22(0.611) (0.674) (0.530) (0.841) (0.222) (0.69
Year Dummies Included Included Included Included Included IncludConstant 1.474 0.627 1.437 0.782 1.938 0.99
(0.358) (0.680) (0.226) (0.476) (0.088) (0.34Observations 65 65 65 65 85 85 Adjusted R-squared 0.350 0.351 0.350 0.349 0.326 0.34
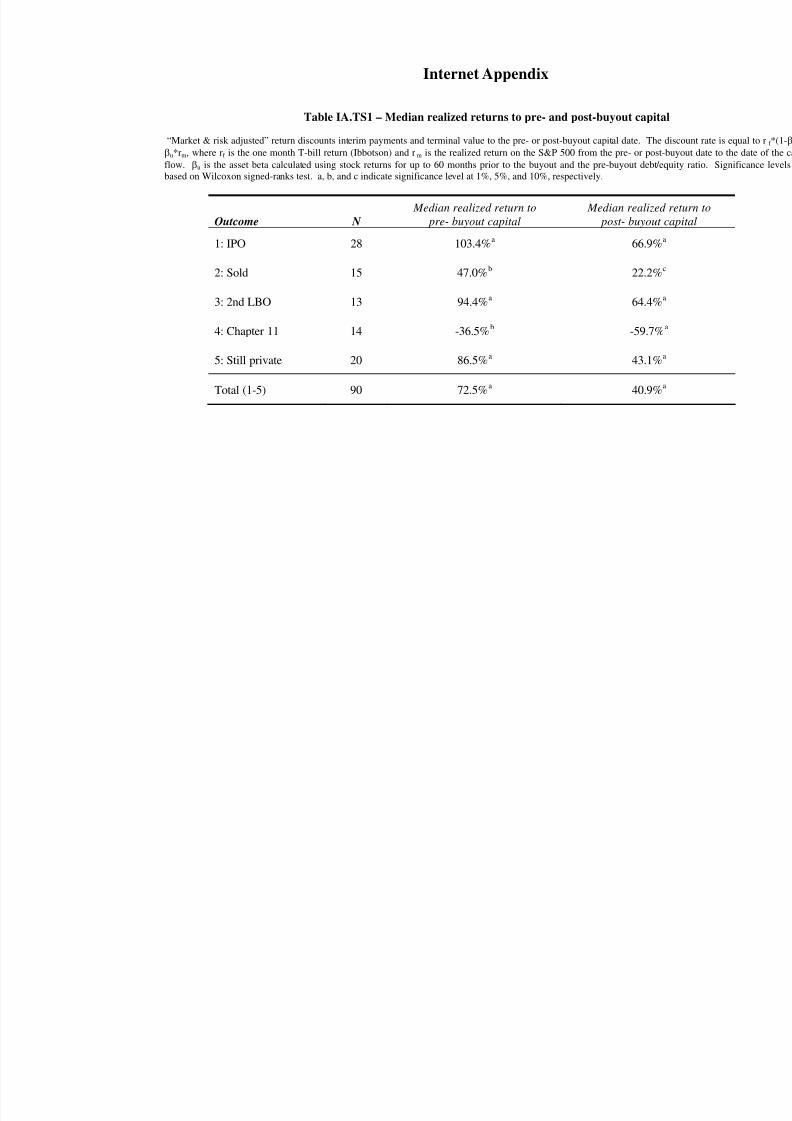
8/7/2019 Do Buyouts Create Value
http://slidepdf.com/reader/full/do-buyouts-create-value 48/59
Internet Appendix
Table IA.TS1 – Median realized returns to pre- and post-buyout capita
“Market & risk adjusted” return discounts interim payments and terminal value to the pre- or post-buyout capital date. The
βu*rm, where rf is the one month T-bill return (Ibbotson) and rm is the realized return on the S&P 500 from the pre- or postflow. βu is the asset beta calculated using stock returns for up to 60 months prior to the buyout and the pre-buyout debt/e
based on Wilcoxon signed-ranks test. a, b, and c indicate significance level at 1%, 5%, and 10%, respectively.
Outcome N
Median realized return to
pre- buyout capital
Median realized
post- buyout
1: IPO 28 103.4%a
66.9%
2: Sold 15 47.0%b 22.2%
3: 2nd LBO 13 94.4%a
64.4%
4: Chapter 11 14 -36.5%b
-59.7%
5: Still private 20 86.5%a 43.1%
Total (1-5) 90 72.5%a
40.9%

8/7/2019 Do Buyouts Create Value
http://slidepdf.com/reader/full/do-buyouts-create-value 49/59
Table IA.TS2 – Impact of changes in operating performance, valuation multiples and tax benefi
buyout capital
The proportion of return due to the change in each factor is defined as the ratio of the difference between the realized and “
value of the realized return. Hypothetical returns are calculated as follows:
Panel A, Operating performance: we calculate a hypothetical return that would have been realized if the firm’s profitability,
matched on industry, size, book to market, and pre-buyout performance, had remained at its pre-buyout level.
Panel B, Industry valuation multiples: a hypothetical terminal value is calculated by assuming the industry, market, or
multiple remains constant at the pre- or post-buyout level.
Panel C, Tax benefits of increased debt: For each year the firm is private, hypothetical tax payments are calculated assumin
interest coverage level, or pays interest at the pre-buyout level in unprofitable years. The present value of annual tax benefits w
the differences between the hypothetical tax payments and those based on the actual interest deductions realized by the firm. Th
calculated as (IActual*t/r – Ihypothetical*t/r) using the final year’s hypothetical interest payments.
A. Proportion of return
due to:
B. Proportion of return
due to:
C. P
Outcome N
Change in operating
performance
Change in industry
multiple
annual tax bene
increased de1: IPO 28 31.9% 26.2% 2.4%
2: Sold 15 8.4% 18.1% 11.0%
3: 2nd LBO 13 34.3% 19.7% 4.2%
4: Chapter 11 14 -134.5% 2.2% 4.6%
5: Still private 20 24.0% 31.7% 3.4%
Total (1-5) 90 22.9% 17.7% 3.4%
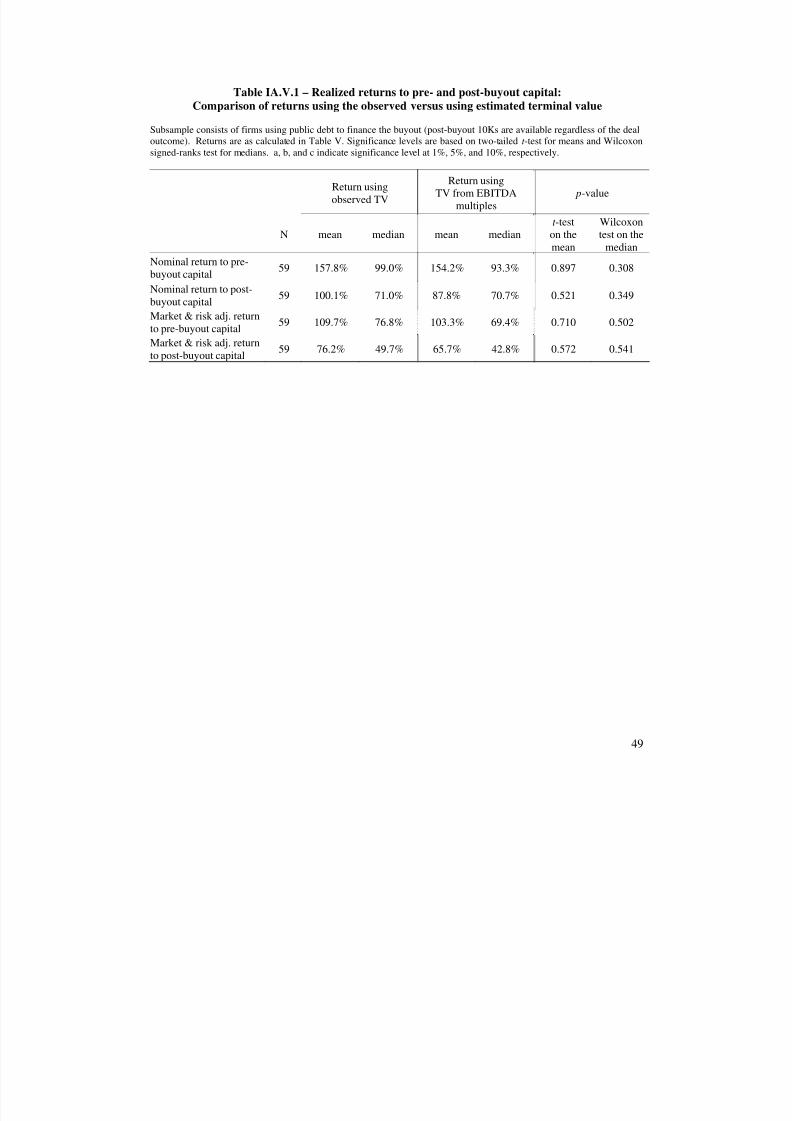
8/7/2019 Do Buyouts Create Value
http://slidepdf.com/reader/full/do-buyouts-create-value 50/59
49
Table IA.V.1 – Realized returns to pre- and post-buyout capital:
Comparison of returns using the observed versus using estimated terminal value
Subsample consists of firms using public debt to finance the buyout (post-buyout 10Ks are available regardless of the deal
outcome). Returns are as calculated in Table V. Significance levels are based on two-tailed t -test for means and Wilcoxon
signed-ranks test for medians. a, b, and c indicate significance level at 1%, 5%, and 10%, respectively.
Return using
observed TV
Return using
TV from EBITDA
multiplesp-value
N mean median mean mediant -test
on the
mean
Wilcoxon
test on the
median
Nominal return to pre-
buyout capital59 157.8% 99.0% 154.2% 93.3% 0.897 0.308
Nominal return to post-
buyout capital59 100.1% 71.0% 87.8% 70.7% 0.521 0.349
Market & risk adj. return
to pre-buyout capital59 109.7% 76.8% 103.3% 69.4% 0.710 0.502
Market & risk adj. return
to post-buyout capital59 76.2% 49.7% 65.7% 42.8% 0.572 0.541

8/7/2019 Do Buyouts Create Value
http://slidepdf.com/reader/full/do-buyouts-create-value 51/59
Table IA.V.2 – Realized returns to pre- and post-buyout capital – public debt
Subsample consists of firms using public debt to finance the buyout (post-buyout 10Ks are available regardless of the deal
Table V. Significance levels are based on two-tailed t -test for means and Wilcoxon signed-ranks test for medians. a, b, and
and 10%, respectively.
Nominal return Mar
Outcome Capital N Mean Median
# of positive
returns Mean
1. IPO Pre 16 262.9%a 178.6%a 16 162.0%a
Post 16 159.1%a
109.1%a
15 115.1%a
2. Acquired Pre 12 129.3%a 130.6%b 10 84.4%b
Post 12 81.6%a 61.7%b 10 57.5%b
3. 2nd LBO Pre 7 167.4%b 92.9%b 7 113.3%b
Post 7 132.9%c 76.0%b 7 93.3%b
4. Chapter 11 Pre 13 -25.8% -34.0% 4 -40.5%b
Post 13 -51.2%a
-54.6%a
3 -55.5%a
5. Still private Pre 17 202.3%a 141.7%a 17 112.7%a
or unknown Post 17 122.8%a 75.7%a 16 68.2%a
Total (1-5) Pre 65 154.3%a 103.6%a 54 89.1%a
Post 65 90.4%a 63.6%a 51 55.7%a
Total(1-4) Pre 48 137.4%a
86.5%a
37 80.7%a
Post 48 79.0%a 56.1%a 35 51.3%a

8/7/2019 Do Buyouts Create Value
http://slidepdf.com/reader/full/do-buyouts-create-value 52/59
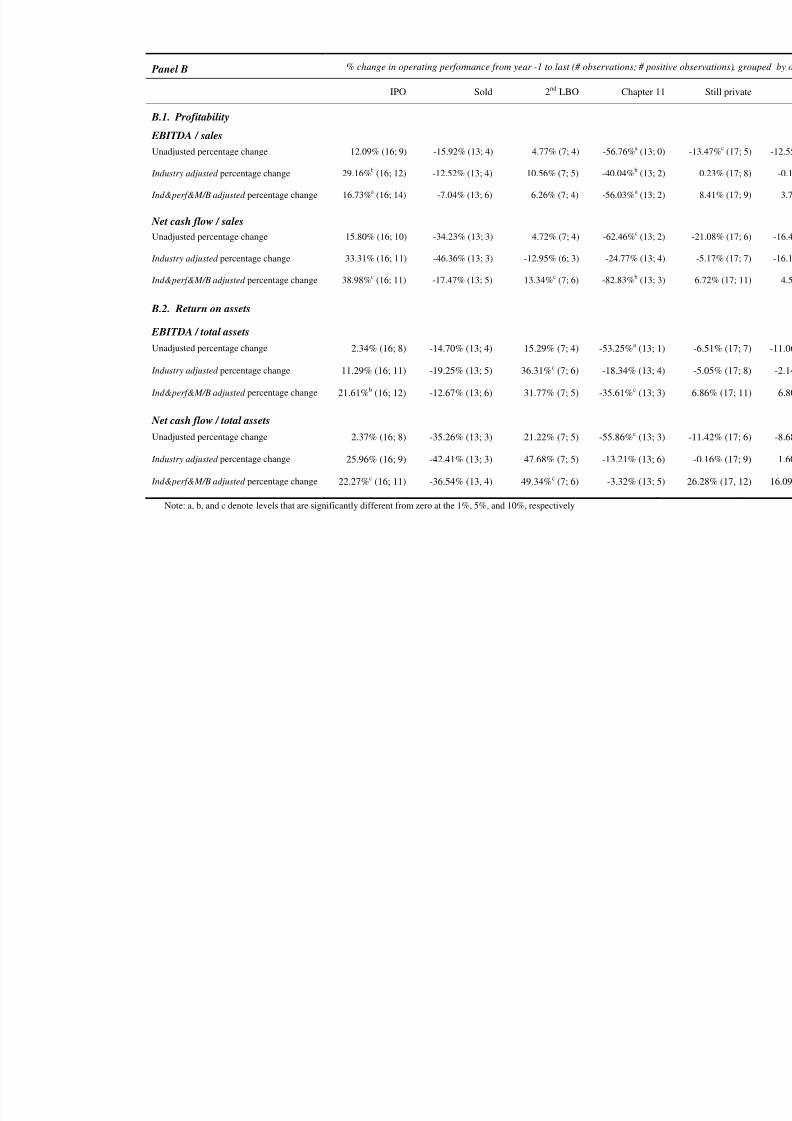
8/7/2019 Do Buyouts Create Value
http://slidepdf.com/reader/full/do-buyouts-create-value 53/59
Panel B % change in operating performance from year -1 to last (# observations; # pos
IPO Sold 2nd
LBO Chapter 11
B.1. Profitability
EBITDA / sales
Unadjusted percentage change 12.09% (16; 9) -15.92% (13; 4) 4.77% (7; 4) -56.76%a (13; 0
Industry adjusted percentage change 29.16%b
(16; 12) -12.52% (13; 4) 10.56% (7; 5) -40.04%b
(13; 2
Ind&perf&M/B adjusted percentage change 16.73%a
(16; 14) -7.04% (13; 6) 6.26% (7; 4) -56.03%a
(13; 2
Net cash flow / sales
Unadjusted percentage change 15.80% (16; 10) -34.23% (13; 3) 4.72% (7; 4) -62.46%c
(13; 2
Industry adjusted percentage change 33.31% (16; 11) -46.36% (13; 3) -12.95% (6; 3) -24.77% (13; 4
Ind&perf&M/B adjusted percentage change 38.98%c
(16; 11) -17.47% (13; 5) 13.34%c
(7; 6) -82.83%b
(13; 3
B.2. Return on assets
EBITDA / total assets
Unadjusted percentage change 2.34% (16; 8) -14.70% (13; 4) 15.29% (7; 4) -53.25%a
(13; 1
Industry adjusted percentage change 11.29% (16; 11) -19.25% (13; 5) 36.31%c (7; 6) -18.34% (13; 4
Ind&perf&M/B adjusted percentage change 21.61%b (16; 12) -12.67% (13; 6) 31.77% (7; 5) -35.61%c (13; 3
Net cash flow / total assets
Unadjusted percentage change 2.37% (16; 8) -35.26% (13; 3) 21.22% (7; 5) -55.86%c (13; 3
Industry adjusted percentage change 25.96% (16; 9) -42.41% (13; 3) 47.68% (7; 5) -13.21% (13; 6
Ind&perf&M/B adjusted percentage change 22.27%c (16; 11) -36.54% (13, 4) 49.34%c (7; 6) -3.32% (13; 5
Note: a, b, and c denote levels that are significantly different from zero at the 1%, 5%, and 10%, respectively

8/7/2019 Do Buyouts Create Value
http://slidepdf.com/reader/full/do-buyouts-create-value 54/59
.
Table IA.VI.2 - Cumulative sales growth rate (medians)
IPO Sold 2nd
LBO Chapter 11 Still
sales growth rate over (-1, 0) 10.65% 5.63% 5.15% 6.68%
ind. adj. sales growth rate over (-1, 0) -1.51% -3.25% -2.42% -8.92%
# observations 27 16 12 13
sales growth rate over (-1, 1) 22.33% 8.13% 13.48% 5.01%
ind. adj. sales growth rate over (-1, 1) 0.59% -4.95% -2.60% -15.05%
# observations 22 17 13 14
sales growth rate over (-1, 2) 23.59% 6.77% 38.67% 14.75%
ind. adj. sales growth rate over (-1, 2) -9.26% -12.33% 14.64% -2.77%
# observations 13 11 8 12
sales growth rate over (-1, 3) 26.81% 19.74% 68.94% 23.03%
ind. adj. sales growth rate over (-1, 3) -7.95% -8.08% 36.88% -13.23%
# observations 11 12 5 9
sales growth rate over (-1, last) 27.42% 22.56% 20.62% 23.53%
ind. adj. sales growth rate over (-1, last) 2.99% -1.07% 15.71% -35.65%
# observations 28 18 14 14

8/7/2019 Do Buyouts Create Value
http://slidepdf.com/reader/full/do-buyouts-create-value 55/59
54
Table IA.VIII
Regressions for operating performance – robustness checks
Change in sales/NWC is defined as change in sales-to-working capital ratio from pre-buyout year tolast post-buyout year prior to deal outcome. All other variables are as defined in Tables VII and VIII.
Public Debt
Subsample
ROA at last yr
Lie adj. Change
in ROS
(-1, last)
Lie adj. Change
in ROS
(-1, last)
Lie adj. Change
in ROS
(-1, last)
Change in Sales/NWC 0.000 0.000
(0.777) (0.994)
ln (capital) -0.028 -0.002 0.005 0.005
(0.105) (0.901) (0.804) (0.844)
Adjusted ROS -1 0.356 -0.988 -1.368 -1.619(0.076) (0.190) (0.119) (0.071)
Matching firms’ ROA (ROS) at last yr 0.271
(0.275)
Mgmt equity pct -0.125 -0.161 -0.172 -0.334(0.471) (0.261) (0.241) (0.125)
Pre-buyout leverage -0.004 0.016 0.011
(0.579) (0.005) (0.234)
Leverage change 0.010 0.022 0.028
(0.103) (0.001) (0.002)
Bank/Debt 0.038
(0.505)
Mgmt change 0.049 0.106 0.106 0.113(0.254) (0.024) (0.030) (0.072)
CEO_chair 0.090 0.142 0.124 0.127(0.016) (0.001) (0.023) (0.023)
Mgmtchg*CEO_chair -0.082 -0.159 -0.121 -0.148
(0.094) (0.003) (0.074) (0.043)ln (boardsize) -0.068 0.010 -0.006 0.045
(0.199) (0.821) (0.914) (0.552)
Sponsor dir. ratio -0.095 -0.101 -0.085 -0.089
(0.242) (0.136) (0.232) (0.443)
Club PE 0.093 0.030 0.009 0.044
(0.021) (0.403) (0.820) (0.440)
Asset sale / capital 0.010 0.078 0.144 0.231
(0.890) (0.326) (0.239) (0.190)
Acquisition / capital -0.044 0.043 0.102 0.061
(0.437) (0.329) (0.130) (0.352)
Year Dummies Included Included Included Included
Constant 0.360 -0.146 -0.052 -0.247
(0.050) (0.294) (0.721) (0.201)
Observations 68 65 65 46
Adjusted R-squared 0.047 0.463 0.223 0.295
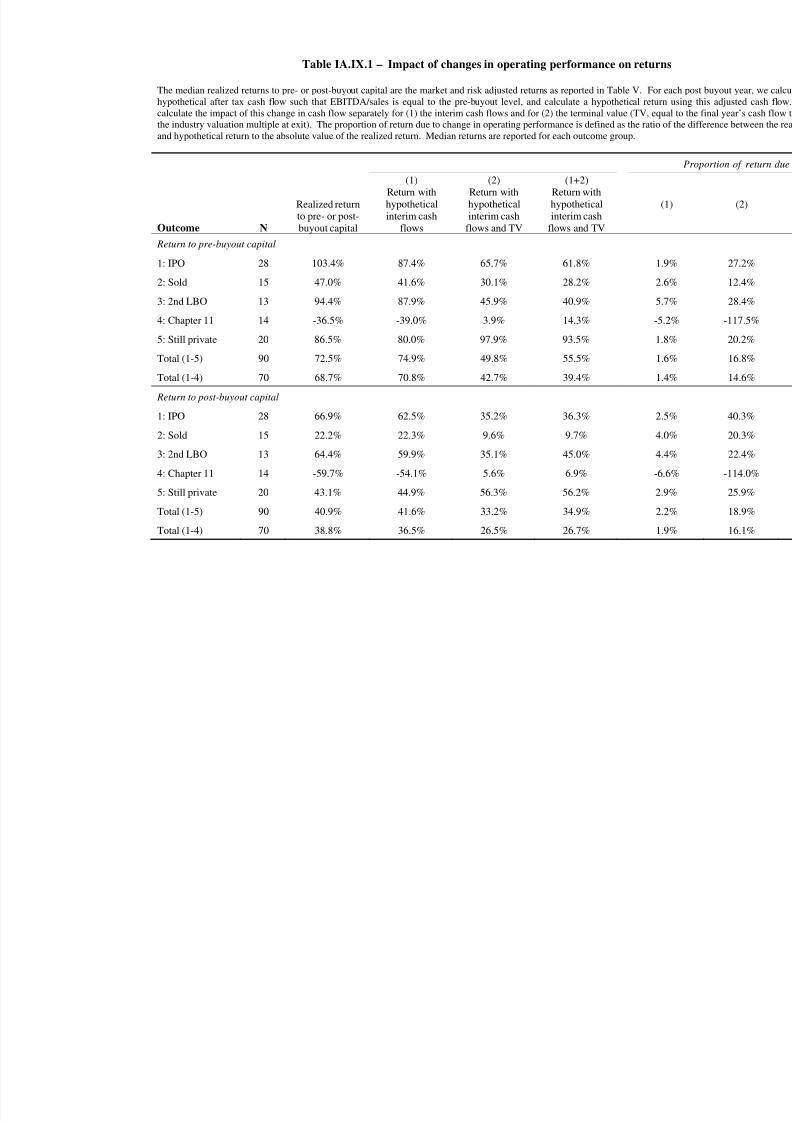
8/7/2019 Do Buyouts Create Value
http://slidepdf.com/reader/full/do-buyouts-create-value 56/59
Table IA.IX.1 – Impact of changes in operating performance on return
The median realized returns to pre- or post-buyout capital are the market and risk adjusted returns as reported in Table V. For
hypothetical after tax cash flow such that EBITDA/sales is equal to the pre-buyout level, and calculate a hypothetical retur
calculate the impact of this change in cash flow separately for (1) the interim cash flows and for (2) the terminal value (TV, eq
the industry valuation multiple at exit). The proportion of return due to change in operating performance is defined as the ratio
and hypothetical return to the absolute value of the realized return. Median returns are reported for each outcome group.
Outcome N
Realized returnto pre- or post-
buyout capital
(1)
Return with
hypothetical
interim cash
flows
(2)
Return with
hypothetical
interim cash
flows and TV
(1+2)
Return with
hypothetical
interim cash
flows and TV
(
Return to pre-buyout capital
1: IPO 28 103.4% 87.4% 65.7% 61.8% 1
2: Sold 15 47.0% 41.6% 30.1% 28.2% 2
3: 2nd LBO 13 94.4% 87.9% 45.9% 40.9% 5
4: Chapter 11 14 -36.5% -39.0% 3.9% 14.3% -5
5: Still private 20 86.5% 80.0% 97.9% 93.5% 1
Total (1-5) 90 72.5% 74.9% 49.8% 55.5% 1
Total (1-4) 70 68.7% 70.8% 42.7% 39.4% 1
Return to post-buyout capital
1: IPO 28 66.9% 62.5% 35.2% 36.3% 2
2: Sold 15 22.2% 22.3% 9.6% 9.7% 4
3: 2nd LBO 13 64.4% 59.9% 35.1% 45.0% 4
4: Chapter 11 14 -59.7% -54.1% 5.6% 6.9% -6
5: Still private 20 43.1% 44.9% 56.3% 56.2% 2
Total (1-5) 90 40.9% 41.6% 33.2% 34.9% 2
Total (1-4) 70 38.8% 36.5% 26.5% 26.7% 1

8/7/2019 Do Buyouts Create Value
http://slidepdf.com/reader/full/do-buyouts-create-value 57/59
Table IA.IX.2 – Impact of valuation multiples on returns
The median adjusted returns to pre- or post-buyout capital based on firm beta and firm leverage are as reported in Table
hypothetical terminal value is calculated by assuming the industry, market, or (industry minus market) valuation multiple rema
level. The proportion of return due to change in multiple is defined as the ratio of the difference between the realized and hypo
the realized return of the buyout firm.
Median hypothetical return with: Median propo
Outcome N
Realized
return to
pre- or post-
buyout
capital
constant
industry
multiple
constant
market
multiple
constant(industry
minus market)
multiple
industry
multiple
Return to pre-buyout capital
1: IPO 28 103.4% 86.0% 97.2% 85.8% 26.2%
2: Sold 15 47.0% 52.3% 20.2% 73.9% 18.1%
3: 2nd LBO 13 94.4% 60.5% 94.0% 62.4% 19.7%
4: Chapter 11 14 -36.5% -36.5% -47.5% -31.7% 2.2%
5: Still private 20 86.5% 60.2% 91.8% 53.8% 31.7%
Total (1-5) 90 72.5% 53.5% 68.7% 58.0% 17.7%
Total (1-4) 70 68.7% 50.1% 61.9% 60.4% 17.2%
Return to post-buyout capital
1: IPO 28 66.9% 62.2% 65.3% 68.3% 8.9%
2: Sold 15 22.2% 19.6% 7.5% 34.2% 8.7%
3: 2nd LBO 13 64.4% 48.9% 54.7% 45.6% 32.1%
4: Chapter 11 14 -59.7% -47.7% -62.0% -42.0% 0.9%
5: Still private 20 43.1% 29.9% 47.9% 33.9% 32.3%
Total (1-5) 90 40.9% 34.7% 43.9% 35.6% 12.0%
Total (1-4) 70 38.8% 39.3% 38.6% 37.6% 9.1%

8/7/2019 Do Buyouts Create Value
http://slidepdf.com/reader/full/do-buyouts-create-value 58/59
Table IA.IX.3 – Impact of realized tax benefits on returns
The table reports the effect of realized tax benefits from increasing debt on the return to pre- or post-buyout capital. For each y
payments are calculated assuming the firm maintains its pre-buyout interest coverage level, or pays interest at the pre-buyout level in
each year using the actual EBIT, tax loss carryforwards, and the hypothetical interest payments, and the firm’s actual marginal feder
of tax benefits while private is calculated as the sum of the differences between the tax hypothetical payments and those based on th
the firm, discounted to the pre-or post-buyout capital date at sample median interest rate (LIBOR plus spread) of 8.35%. Hypothetic
the present value of tax benefits while private (divided by pre- or post-buyout capital) from the realized return. The terminal value (T
– Ihypothetical*t/r) using the final year’s hypothetical interest payments. The proportion of return due to tax benefits is defined as thewithout the tax benefits, divided by the absolute value of the return.
hypothetical return: propo
Outcome N
Return to pre-
or post-buyoutcapital
without annual
tax benefit
without TV
tax benefit
annual tax
benefit
Return to pre-buyout capital
1: IPO 27 110.1% 95.0% 91.8% 2.4%
2: Sold 15 47.0% 39.7% 35.1% 11.0%
3: 2nd LBO 11 94.4% 94.4% 76.8% 4.2%
4: Chapter 11 13 -34.6% -39.8% -83.2% 4.6%
5: Still private 20 86.5% 77.1% 65.4% 3.4%
Total (1-5) 86 73.8% 69.3% 48.7% 3.4%
Total (1-4) 66 72.5% 63.9% 46.4% 3.7%
Return to post-buyout capital
1: IPO 27 66.9% 66.9% 52.2% 2.8%
2: Sold 15 22.2% 17.6% 3.9% 10.0%
3: 2nd LBO 11 64.4% 61.0% 53.3% 4.9% 4: Chapter 11 13 -59.5% -59.5% -82.9% 5.4%
5: Still private 20 43.1% 40.8% 24.0% 5.4%
Total (1-5) 86 43.1% 40.8% 24.6% 4.8%
Total (1-4) 66 44.5% 41.1% 25.0% 4.8%
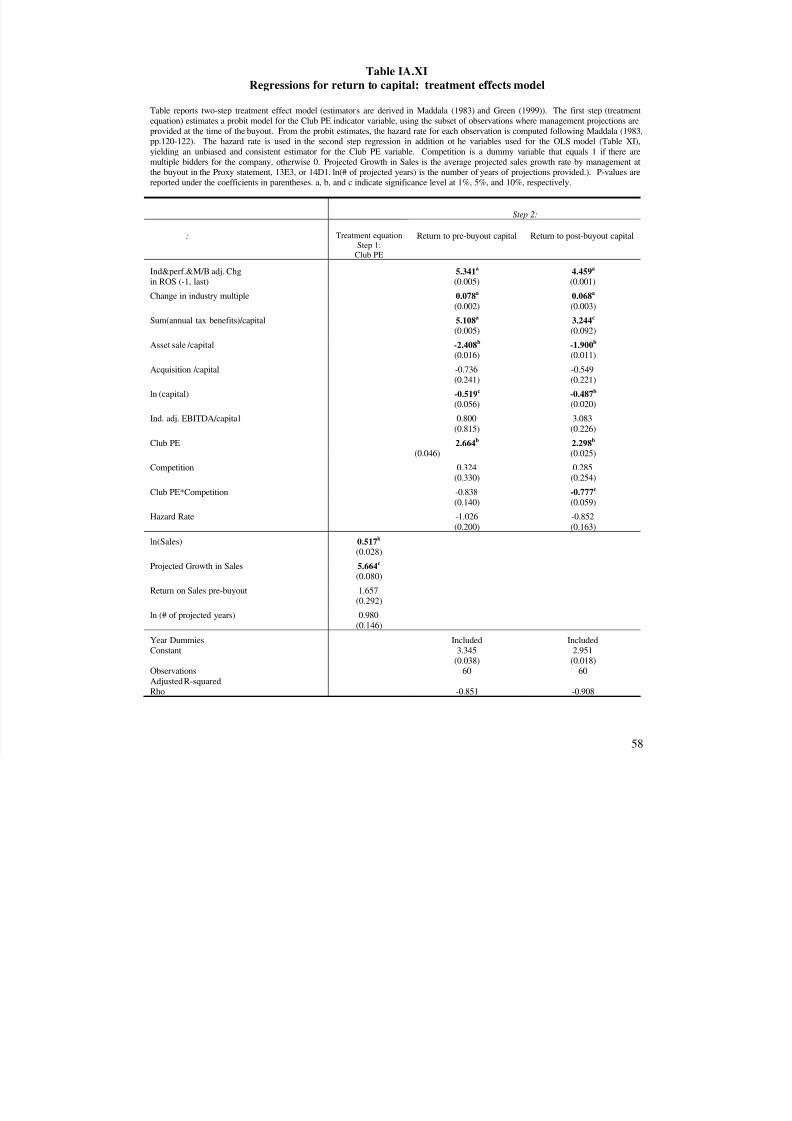
8/7/2019 Do Buyouts Create Value
http://slidepdf.com/reader/full/do-buyouts-create-value 59/59
Table IA.XI
Regressions for return to capital: treatment effects model
Table reports two-step treatment effect model (estimators are derived in Maddala (1983) and Green (1999)). The first step (treatmentequation) estimates a probit model for the Club PE indicator variable, using the subset of observations where management projections areprovided at the time of the buyout. From the probit estimates, the hazard rate for each observation is computed following Maddala (1983,pp.120-122). The hazard rate is used in the second step regression in addition ot he variables used for the OLS model (Table XI),
yielding an unbiased and consistent estimator for the Club PE variable. Competition is a dummy variable that equals 1 if there aremultiple bidders for the company, otherwise 0. Projected Growth in Sales is the average projected sales growth rate by management atthe buyout in the Proxy statement, 13E3, or 14D1. ln(# of projected years) is the number of years of projections provided.). P-values arereported under the coefficients in parentheses. a, b, and c indicate significance level at 1%, 5%, and 10%, respectively.
Step 2:
: Treatment equation
Step 1:
Club PE
Return to pre-buyout capital Return to post-buyout capital
Ind&perf.&M/B adj. Chg 5.341a 4.459a
in ROS (-1, last) (0.005) (0.001)
Change in industry multiple 0.078a 0.068a
(0.002) (0.003)
Sum(annual tax benefits)/capital 5.108a 3.244c
(0.005) (0.092)
Asset sale /capital -2.408b -1.900b
(0.016) (0.011)
Acquisition /capital -0.736 -0.549(0.241) (0.221)
ln (capital) -0.519c -0.487b
(0.056) (0.020)
Ind. adj. EBITDA/capital 0.800 3.083
(0.815) (0.226)
Club PE 2.664b
2.298b
(0.046) (0.025)Competition 0.324 0.285
(0.330) (0.254)
Club PE*Competition -0.838 -0.777c
(0.140) (0.059)
Hazard Rate -1.026 -0.852
(0.200) (0.163)
ln(Sales) 0.517b
(0.028)
Projected Growth in Sales 5.664c
(0.080)
Return on Sales pre-buyout 1.657(0.292)
ln (# of projected years) 0.980(0.146)
Year Dummies Included Included
Related Documents