1 Do asymmetric information and ownership structure matter for dividend payout decisions? Evidence from European banks Laetitia Lepetit a , Celine Meslier a and Leo Indra Wardhana a a Université de Limoges, LAPE, 5 rue Félix Eboué, 87031 Limoges Cedex, France August 13, 2015 Abstract: We empirically examine whether banks’ dividend decisions are influenced by their degree of opacity and ownership structure. We find that banks with concentrated or dispersed ownership structure pay lower dividends when they have high degrees of opacity. These results would be consistent with the entrenchment behavior hypothesis, with insiders (managers or majority shareholders) paying lower dividends to extract higher levels of private benefits when banks’ opacity is high. Higher levels of shareholder protection and stronger supervisory regimes help to constrain entrenchment behavior of majority shareholders. Our findings have critical policy implications for the Basel 3 implementation of restrictions on dividend payouts. JEL Classification: G21, G28, G35 Keywords: Bank, dividend, ownership concentration, asymmetric information _____ E-mail addresses: [email protected] (L. Lepetit), [email protected] (C. Meslier) and leo- [email protected] (L. Wardhana).

Welcome message from author
This document is posted to help you gain knowledge. Please leave a comment to let me know what you think about it! Share it to your friends and learn new things together.
Transcript
1
Do asymmetric information and ownership structure matter for
dividend payout decisions? Evidence from European banks
Laetitia Lepetita, Celine Mesliera and Leo Indra Wardhanaa
a Université de Limoges, LAPE, 5 rue Félix Eboué, 87031 Limoges Cedex, France
August 13, 2015
Abstract: We empirically examine whether banks’ dividend decisions are influenced
by their degree of opacity and ownership structure. We find that banks with
concentrated or dispersed ownership structure pay lower dividends when they have high
degrees of opacity. These results would be consistent with the entrenchment behavior
hypothesis, with insiders (managers or majority shareholders) paying lower dividends
to extract higher levels of private benefits when banks’ opacity is high. Higher levels
of shareholder protection and stronger supervisory regimes help to constrain
entrenchment behavior of majority shareholders. Our findings have critical policy
implications for the Basel 3 implementation of restrictions on dividend payouts.
JEL Classification: G21, G28, G35
Keywords: Bank, dividend, ownership concentration, asymmetric information
_____
E-mail addresses: [email protected] (L. Lepetit), [email protected] (C. Meslier) and leo-
[email protected] (L. Wardhana).
2
1. Introduction
Dividend policy has been an area of intense research in corporate finance, with
theoretical and empirical analysis showing that firms follow well considered payout
strategies (e.g. Fama and French 2001, Banerjee et al. 2007). Within this literature, the
role of dividend policy dealing with asymmetric information and agency conflicts
between corporate insiders and outsiders has received a great deal of attention. The
payment of dividends decreases the level of funds available for perquisite consumption
and investment opportunities and requires insiders to seek financing in capital markets.
Dividend payouts can therefore be used as a control mechanism by outside shareholders
to prevent entrenchment or empire-building (e.g. Easterbrook 1984, Jensen and
Meckling 1976, and Zwiebel 1996).
While there is an extensive literature analyzing whether dividend policy is used as a
corporate mechanism to reduce agency conflict in the case of non-financial firms, few
empirical papers analyze this issue for financial firms, despite its regulatory relevance.
This issue is of particular interest because the distribution of earnings as dividends
obviously reduces banks’ ability to generate capital internally, and then transfers default
risk to their creditors and deposit insurer (Acharya et al. 2009, 2013). Moreover, banks
distributed large scale dividend payouts during the 2007-2008 financial crisis despite
widely unanticipated losses, shedding light on the severe malfunctioning of banks
corporate governance mechanisms. In this context, the objective of this paper is to
empirically examine whether dividend payments are used by banks’ insiders as a
corporate mechanism, allowing for different agency conflicts and different levels of
asymmetric information.
As pointed out in La Porta et al. (1998), the level of ownership concentration is a key
determinant of the nature of agency conflicts between the different firm stakeholders.
In the U.S., the United-Kingdom, Canada and Australia where the ownership is
dispersed, the main corporate governance problem is the misalignment of shareholders’
and managers’ interests. When the ownership is concentrated, as is prevalent in
continental Europe and Asia, the conflict of interest shifts away from manager vs.
shareholders to majority vs. minority shareholders, as large shareholders have
incentives to maximize their own benefits at the cost of other shareholders (Shleifer and
Vishny 1997). In both cases, dividend payouts can be used to create shareholder value
by reducing free cash flow that can be spent by insiders (managers or majority

3
shareholders) on value-decreasing projects (Lang and Litzenberger 1989, Chae et al
2009). Higher dividend payouts can then signal that insiders will refrain from
expropriation (signaling behavior). Such signaling behavior can be of importance as the
potential expropriation of outside investors can be costly to insiders in terms of higher
equity financing costs (e.g. Chen et al. 2009, Chu et al. 2014) and lower firm valuation
and returns (e.g. Claessens et al. 2002, Lins 2003, Lemmon and Lins 2003). On the
other hand, insiders might have incentives to only pay small dividends in order to
increase the amount of free cash flow they can divert for their private consumption
(entrenchment behavior) (Gomes 2000). The intensity of the agency conflict between
insiders and outsiders may be stronger in the presence of concentrated ownership
(Davies 2000, Sáez and Riaño 2013). Indeed, in dispersed ownership, different
corporate governance mechanisms can be put into place to give top managers strong
incentives to discourage entrenchment behaviors, such as, compensation mechanism,
dismissal threats or the threat of a hostile takeover. These different corporate
mechanisms aiming to rein in managers’ behavior are much less relevant when the
ownership structure is concentrated, as large investors can elect their representative(s)
to the board of directors who will appoint a manager that will act in the interest of these
controlling shareholders.
The empirical literature analysing the effectiveness of dividend policy to reduce agency
conflicts when there is dispersed ownership structure provides mixed results. Some
studies on non-financial firms find that dividends are used by managers to communicate
information to shareholders when there is a conflict of interest (e.g. Healy and Palepu
1988, Denis et al. 1994, and Yoon and Starks 1995), whereas other studies do not
observe evidence that dividends are used as a signaling device (e.g. Benartzi et al. 1997,
and Li and Zhao 2008). Empirical studies dedicated to the banking industry, mostly on
U.S. bank holding companies, find evidence that dividends are used as a signaling
mechanism (Filbeck and Mullineaux 1993, Bessler and Nohel 1996, Filbeck and
Mullineaux 1999, Dickens et al. 2002, Theis and Dutta 2009, and Abreu and
Gulamhussen 2013). In contrast, Galiakhmetova et al. (2015) find, for a sample a
European listed banks, a negative relationship between CEO power and dividend
payments, indicating that entrenched CEOs do not have incentives to increase payout
ratios to discourage monitoring from minority shareholders.

4
Even if the intensity of the agency conflict may be stronger when insiders are
controlling shareholders (instead of managers), the empirical literature analyzing the
impact of a concentrated ownership on dividend policy is scarcer and provides mixed
results. Bøhren et al. (2012) and De Cesari (2012) find that higher dividends are paid
in non-financial firms when the agency conflict between large and small owners is
stronger, consistent with signaling behavior. However, Faccio et al. (2001) and Gugler
and Yurtoglu (2003) find that dividends are higher in non-financial firms with the
presence of multiple large shareholders; the other large shareholders impede the
controlling shareholder's expropriation of minority shareholders. La Porta et al. (2000)
further find that this happens only to firms located in countries with better protection
of minority shareholders, as asset diversion is legally riskier and more expensive in
such countries, thereby raising the relative incentives of large shareholders to grant
dividends to minority shareholders.
Despite the importance of the degree of asymmetric information faced by outsiders to
explain the intensity of the agency conflict with either managers or majority
shareholders, only few studies examine the relationship between the level of
asymmetric information and dividend policy. The empirical results on the effects of
asymmetric information on dividends are mixed, focusing only on listed non-financial
firms which have generally a dispersed ownership structure. While Li and Zhao (2008)
and Leary and Michaely (2011) find that U.S. firms with higher levels of asymmetric
information distribute lower dividends, Von Eije and Meggison (2008) find in contrast
that European firms with higher asymmetric information pay higher dividends.
Brockman and Unlu (2011) further find a U-shaped relationship between dividend
payments and disclosure quality.
Our paper complement the existing literature by exploring further the linkages between
asymmetry of information, corporate governance and dividend payout decisions for the
banking industry. We examine if agency conflicts between stakeholders influence
banks’ dividend policy differently depending on the level of asymmetric information
faced by stakeholders and the ownership structure (dispersed vs. concentrated). We use
for that a panel of listed and non-listed European commercial banks over the 2004-2012
period, with heterogeneity in term of agency conflicts. While the influence of
asymmetric information on dividend payouts is of particular importance for banks as
their financial structure combined with high leverage makes them inherently more
5
opaque than other firms (Morgan 2002), this aspect has not been explicitly taken into
account in existing studies. Whether the dividend policy can help to alleviate agency
problems between insiders and outsiders is not a clear cut issue when outsiders are
confronted with a high level of asymmetric information. One could argue that in the
presence of high opacity, it might be much easier for insiders, both managers and
majority shareholders, to extract private benefits of their control. In the presence of
such entrenchment behavior, we could then expect a stronger contraction of dividends
as the level of opacity increases. However, if insiders want to signal to outsiders that
they will not be expropriated, we expect banks to distribute higher dividends with
dividends increasing with the level of opacity faced by investors. We test if these two
alternative hypotheses of entrenchment or signaling behavior depend on who is
involved in managerial decisions, i.e. managers in a dispersed ownership structure and
majority shareholders in a more concentrated ownership. We further examine if the
institutional and regulatory environment, more specifically the level of shareholder
protection and supervisory actions, can constrain any opportunistic entrenchment
behavior. Our period of investigation also allows us to determine whether banks’ payout
behavior is different in normal times and during the financial crisis period.
We find that European banks with either a concentrated or a dispersed ownership
structure pay lower dividends when they present high degrees of opacity. These results
would be consistent with the entrenchment behavior for banks, with insiders (either
managers or majority shareholders) paying lower dividends to extract higher levels of
private benefits when outsiders face higher degrees of asymmetric information as it
might be more difficult to detect such opportunistic behavior. We find that this
entrenchment behavior is observed before and during the crisis period; higher levels of
shareholder protection help to constrain it but only when insiders are majority
shareholders, whereas stronger supervisory regimes contribute to moderate the
entrenchment behavior of both managers and majority shareholders.
Our paper makes several contributions to the existing literature. We contribute to the
literature exploring the determinants of dividend policy by analyzing if the levels of
asymmetric information combined with different ownership structures influence the
dividend payout policy. We also add to the literature investigating the dividend payout
decisions of banks. Few empirical papers analyze the determinants of dividend policy
of banks, while the Federal Reserve Board (FRB 2011) and the Basel Committee on

6
Banking Supervision (BCBS 2011) have been emphasizing the necessity to increase
oversight of banks’ dividend payouts. Indeed, as pointed out by Abreu and
Gulamhussen (2013), while imposing constraints on bank dividend payments may
reduce equity-debt agency conflicts and avoid wealth transfer from debt to equity-
holders, it may also reduce the ability of banks to signal their future growth perspectives
to investors. We also highlight that such constraints on dividend payments might
facilitate insiders’ entrenchment behavior when stakeholders face high levels of
asymmetric information. By analyzing the relationship between the degree of opacity
and dividend payouts for different levels of ownership concentration, using detailed
bank level data especially on their ownership structure, and examining a wider dataset
containing both listed and unlisted banks, we further aim to obtain a better
understanding of the underlying mechanisms at work. For this we focus on a European
dataset which provides a substantial amount of variability between individual levels of
ownership concentration given the lack of regulatory limitations on the percentage of
bank capital owned by a single entity in Europe.
Section 2 describes our sample, the ownership characterization and the measures of
opacity used. Section 3 presents our methodology. Section 4 discusses our main results.
Section 5 tests the robustness of those results and Section 6 concludes the paper.
2. Data and variable construction
2.1. Sample
Our sample covers listed and non-listed commercial banks from 15 European countries
(Austria, Belgium, Denmark, Finland, France, Germany, Greece, Ireland, Italy,
Luxembourg, the Netherlands, Portugal, Spain, Sweden and the United Kingdom). Our
data set covers the period 2004–2012. We extracted bank financial statement data from
BvD Bankscope. We consider consolidated data but also use unconsolidated data when
consolidated balance sheets are not available. All the banks in our sample publish their
annual financial statements at the end of the calendar year. As for the ownership
structure of banks, we compute time-varying variables by combining data from several
sources, i.e. BvD Bankscope, Thomson Reuters Advanced Analytics and hand-
collected annual reports, in order to obtain information as complete as possible.
BvD Bankscope provides financial statement data for 1,062 active European
commercial banks for at least some of the period considered. We limit our sample to
7
European commercial banks which provide information on our variables of interest and
we clean the data by dropping the lowest and highest 1% observations. We further apply
specific cleaning criteria for the variable measuring the dividend payout ratio, defined
as total dividends paid related to the period divided by net income.1 We check if there
are banks that have non-positive earnings but still pay dividends. We find 96
observations for which banks have negative earnings, with 42 among them that pay
dividends.2 We also have 16 observations for which banks have zero earnings, with 4
that still pay dividends. We drop the 46 observations in our data cleaning corresponding
to banks with non-positive earnings which pay dividends, to avoid negative dividends
and infinite numbers.
We end up with a final sample of 1,150 annual observations corresponding to 330
European commercial banks (see Table 1 for a breakdown by country). Table 2 presents
some general descriptive statistics for both our data set and the corresponding full
sample of banks available under BvD Bankscope. The median data coverage of our
sample, as measured in percent of total assets in the wider BvD Bankscope one, lies at
almost 54%, with very similar bank activity characteristics between the two (see Table
1).
[Insert Tables 1 and 2 here]
2.2. Ownership measures
To classify banks according to the level of concentration of their ownership structure,
we follow Bouvatier et al. (2014) and use a hierarchical agglomerative clustering
(HAC) approach to account more accurately for several dimensions of banks’
ownership characteristics. Three ownership measures are considered to identify banks
which have similar characteristics in the construction of different clusters: the
1 We do not include preferred dividends because we argue that unlike common dividends, payouts for
preferred stocks are hardly similar to common dividend payout decisions where the payout is fixed. Thus,
the controlling shareholder cannot influence the decision of preferred dividend payments. The only
decision that could be influenced is whether to issue preferred stocks or not in the first place.
Consequently, for example, assuming that most of preferred stocks are cumulative, the controlling
shareholder may be able to expropriate the other shareholders by not paying dividends, but they cannot
do it to preferred shareholders. There are only 21 observations in our sample that have share repurchase.
Including share repurchase do not change our results. 2 We have 21 banks that paid dividends while having negative earnings during the financial crisis of
2007-2008 (among them Royal Bank of Scotland, Loyds Bank and Credit Agricole), while only 3 banks
paid dividends with negative earnings before 2007.
8
percentage of shares held by the largest shareholder (Share1ij,t), the percentage of shares
held by the second-largest shareholder (Share2ij,t),3 and the Herfindahl-Hirschman
index (Concentrationij).4 The first two measures give information on the presence of
one or two large shareholders, and the Herfindahl index captures the concentration of
the ownership. The HAC uses Euclidean distance to compute similarity between two
banks. The Ward method is used to determine the distance between clusters consisting
of several banks (see Appendix A in Bouvatier et al. 2014 for more details). We obtain
three distinct bank clusters, labelled Cluster 1, 2 and 3. Banks can change cluster over
time if their ownership structure changes accordingly. 89 banks belong to Cluster 1,
119 banks to Cluster 2 and 187 to Cluster 3 at some point in time amongst the 330 banks
in our sample, with 65 banks that change between clusters during the sample period.
General descriptive statistics for banks in these clusters are provided in Table 2, and
Table 3 provides statistics for the ownership measures for each of the three clusters.
With the largest and the second largest shareholder holding on average respectively
15.71% and 10.45% of the shares, banks in Cluster 1 (dispersed ownership) are
characterized by a dispersed ownership structure with a large number of shareholders
that do not hold controlling shares (see Table 3). We assume that the conflict of interest
between managers and shareholders is highest in this cluster as there is a separation
between ownership and control. Banks in Cluster 2 (concentrated ownership) have a
concentrated ownership structure with either one shareholder or two shareholders that
hold a controlling stake (for a control threshold of 50%), and some smaller
shareholders. Banks in Cluster 3 (highly concentrated ownership) display a very strong
level of ownership concentration. The controlling shareholder holds on average around
98.5% of the shares, with other shareholders holding a corresponding small percentage.
Hence, in Clusters 2 and 3, the conflict of interest is between majority and minority
owners.
3 We alternatively use the ratio of the shares held by the second largest shareholder to those held by the
largest shareholder (Share2ij,t/Share1ij,t) instead of Share2ij,t to construct our clusters. This ratio measures
the relative power of the second largest shareholder compared to the largest shareholder, with the highest
value implying comparable size between the controlling stakes of the two largest shareholders. The
classification of banks are very similar when we use either (Share2/Share1) or Share2. 4 We compute for each bank i the variable OSi, defined by the ratio of the percentage of equity held by
each shareholder n to the total percentage of equity held by all shareholders; we then compute
Concentration as ∑ 𝑂𝑆𝑛2𝑁
𝑛=1 with N the total number of shareholders. The higher the Herfindahl index,
the higher the concentration of bank ownership.

9
We build on this classification to construct our ownership structure variables. We
compute the dummy variables Cki,t that takes the value of one if the bank i is in Cluster
k for the year t and zero otherwise, with k={1,2,3}.
[Insert Table 3 here]
2.3. Opacity measures
We define opacity as information asymmetry between more or less informed
stakeholders. We build on the existing literature to compute a composite index based
on proxies that capture four components of opacity.
Our first information asymmetry component (EFij,t) measures the disconnection
between insiders’ and outsiders’ information about firms’ financial condition. A firm’s
information opacity is expected to affect the properties of financial analysts’ forecasts,
with higher analyst earnings forecast error and dispersion in analyst forecasts (e.g.,
Krishnaswani and Subramaniam 1999, Diether et al. 2002). We build an earnings
prediction model based on publicly available information and use the residual of the
regression as a measure of insiders’ private information, following Park (1999) and
Crouzille et al. (2004) (see Appendix 2 for more details). The higher the forecast error
EFij,t, the higher is the opacity.
Our second information asymmetry component (EMij,t) is related to the opacity of
financial statements. A decrease in the quality of financial statements is likely to widen
the asymmetric information about firm financial position between insiders and
outsiders. Since Dechow and Dichev (2002), the accepted view is that insiders’
discretion influences accrual quality and reduces the information that outside investors
can collect from financial statements. Moreover, insiders can hide their self-serving
behaviors through earnings management (e.g. Leuz et al. 2003, Cornett et al. 2009,
Bouvatier et al. 2014). Accounting numbers no longer reflect the economic reality of
underlying risk conditions in this case and it is difficult for outsiders to accurately assess
the fundamental value of the bank. We follow Hutton et al. (2009) and Lang and Maffett
(2011) and use the degree of earnings management as a measure of accounting opacity.
Previous studies regarding earnings management at banks measure it via loan loss
provisions because these are relatively large accruals and therefore have a significant
10
impact on banks’ earnings (Ahmed et al. 1999).5 We use a similar approach to
Bouvatier and Lepetit (2008) to measure the discretionary element of loan loss
provisions that are used for earnings management (see Appendix 2 for more details).
The higher the earnings management EMij,t, the higher is the opacity.
Our third information asymmetry component is the negative of the ratio of short term
and long term market funding to total assets (MFij,t), which shows the degree of banks’
exposure to the market. When banks have greater exposure to the market, there will be
more market participants to assess the fair value of the bank, thus reducing asymmetric
information. The proportion of market funding on the liability side of the balance-sheet
is considered as a signal for outsiders of lower opacity (Crouzille et al. 2004). The
higher MFij,t (lower market funding), the higher is the opacity.
Our last information asymmetry component is the proportion of loans in total assets
(Loanij,t). Theoretical analyses all lead to the same conclusion that bank loans are
opaque (e.g., Campbell and Kracaw 1980, Berlin and Loeys 1988, Diamond 1991).
These theories show that bank loans are unusually difficult for outside investors to value
as insiders have privileged information about the characteristics of the loan contracts
and the creditworthiness of the borrowers.6 The higher the loan proportion, the higher
is the opacity.
We use the four variables EFij,t, EMij,t, MFij,t, and Loanij,t to construct our opacity
composite index (Opacityij,t). We check that the four components of our composite
index capture different dimensions of information asymmetry. The low correlations
among the variables EFij,t, EMij,t, MFij,t and Loanij,t show that this is the case (see Table
A1 in Appendix 1). We associate the four components EFij,t, EMij,t, MFij,t and Loanij,t,
with the value of one for the first decile, the value of two for the second decile and so
on. We then sum these four proxies and we divide it by four to scale our composite
index Opacityij,t. It ranges in principle from one to ten, with the highest value
representing the highest level of opacity that outsiders can face. This index provides a
5 Earnings management could also be measured by discretionary realizations of security gain or losses
(Cornett et al. 2009). However, the net gain on securities only represents around 4% of the total operating
income in our sample for European commercial banks, leaving little scope for earnings management. 6 Trading assets also represent an important source of opacity for banks (Morgan 2002). However, in our
sample, trading assets are concentrated primarily at the largest banks. On average, less than 1.14 percent
of assets are held as trading assets, whereas loans represent on average around 56 percent of the total
assets and are therefore the primary assets for most banks.

11
robust measure of opacity because it averages across several measures of asymmetric
information. For our sample of European commercial banks, the index has a mean of
5.62 and ranges from 2.25 to 9.25 (see Table 4). The opacity composite index is
significantly higher in Cluster 2 compared to Cluster 3, but not compared to Cluster 1.7
We compute the dummy variable High Opacityij,t, that takes the value of one if the
index Opacityij,t of a bank is greater than the sample median value and zero otherwise,
to differentiate banks which have a relatively high and low degree of opacity.
[Insert Table 4 here]
3. Specifications and hypotheses tested
3.1. Baseline specification
We first investigate whether the decision of insiders to pay dividends depends on the
interconnection between the degree of opacity faced by outsiders and the level of
ownership concentration. For that, we estimate the following equation
𝐷𝑃𝑖𝑗,𝑡 = ∑ 𝛾𝑘𝐶𝑘𝑖𝑗,𝑡
3
k=1
+ ∑ 𝛿𝑘𝐶𝑘𝑖𝑗,𝑡 ∗ 𝐻𝑖𝑔ℎ 𝑂𝑝𝑎𝑐𝑖𝑡𝑦𝑖𝑗,𝑡
3
𝑘=1
+ ∑ 𝛽𝑘𝐶𝑜𝑛𝑡𝑟𝑜𝑙𝑠𝑖𝑗,𝑡
10
k=1
+ 𝛼𝑡 + 휀𝑖𝑗,𝑡 (1)
where i, j, t stand respectively for bank, country and time.
The dividend payout (DPij,t) is defined as total dividends paid related to the period
divided by net income. The dividend to earnings ratio is the most commonly used
measure of dividend payouts as it captures the key element of the payout policy (La
Porta et al. 2000, Fidrmuc and Jacob 2010). We include the three cluster dummy
variables altogether instead of considering a reference category (we then drop the
constant). We also include interaction terms between the Cluster dummy variables Ckij,t
and the dummy variable High Opacityij,t. The dividend payouts of banks in Cluster k
with a low degree of opacity is given by (𝛾𝑘), while those of banks with a relatively
high degree of opacity is given by (𝛾𝑘 + 𝛿𝑘).
We test two alternative hypotheses. If insiders signal their unwillingness to extract
private benefits when the opacity is relatively high by granting dividends to outsiders
7 Mean tests are available on request.
12
(signaling hypothesis), we expect 𝛿𝑘 to be significantly positive. If alternatively
insiders decide to decrease dividends as it increases the funds at their discretion when
the opacity is relatively high (entrenchment hypothesis), we expect 𝛿𝑘 to be
significantly negative. We further test if, for the same degree of opacity, the dividend
payout ratio is increasing or decreasing with the level of ownership concentration. If
we follow Davies (2000) and Sáez and Riaño (2013), we would expect that agency
conflicts are stronger in concentrated ownership than in dispersed ownership. We
would then observe either an increase of dividends between clusters if insiders in a
more concentrated ownership want to signal their unwillingness to expropriate
outsiders, or on the contrary, a decrease of dividends if they use their controlling power
to increase funds they have at their discretion.
We build on the existing literature and include control variables that might have an
impact on the dividend policy of firms. Size, profitability and growth opportunities are
important determinants of dividend payout ratios of non-financial firms (e.g. La Porta
et al. 2000, Fama and French 2001, and Von Eije and Megginson 2008). We measure
bank size (Sizeij,t) through the natural logarithm of total assets and use the return on
asset (ROAij,t) to measure the profitability. We expect large and more profitable banks
to pay higher dividends. In order to measure investment opportunities, we use the
growth rate of total assets (Assets Growthij,t) to measure investment opportunities of
banks. Banks with high growth opportunities are expected to plowback their earnings
to avoid costly equity and debt financing. We further include the dummy variable
M&Aij,t that identifies banks which were involved in operations of acquisition during
our period of analysis, as the dividend policy should be reviewed to reflect the dividend
policy of the combined entity and satisfy both acquirer and target firm shareholders.8
We also control for macroeconomic condition differences across countries by including
the GDP growth rate (GDP growthj,t).
The banking literature suggests that other variables might have an impact on banks’
dividend payouts. Onali (2014) finds that banks having higher default risk have higher
payout ratios. We use a time-varying Z-score based on 3-year rolling windows to proxy
8 We use the database Thomson Reuters Advanced Analytics to identify mergers and acquisitions
involving European commercial banks.
13
bank default risk.9 We follow Lepetit and Strobel (2015) and use its natural logarithm
in our specifications (Ln Zscoreij,t). Acharya et al. (2011) show that the optimal dividend
policy also depends on the bank's franchise value. In line with this theoretical finding,
Onali (2014) shows that the bank charter value has a negative impact on dividend
payouts. Banks with higher charter have an incentive to pay lower dividends in order
to preserve the charter. We use the ratio customer deposits to total assets (Depositij,t) to
proxy the charter value based on the banking literature showing that customer deposits
contribute to a bank’s charter value (e.g. James 1991, Goyal 2005). We compute the
dummy variable High Charterij,t that takes the value one if the ratio customer deposits
to total assets is larger than the sample median, and zero otherwise. We further control
for the level of capitalization by introducing the dummy variable High Capitalizedij,t
that takes the value of one if the previous year’s risk-weighted capital ratio is larger
than the sample median, and zero otherwise. Banks with lower regulatory capital ratios
are expected to have lower dividend payouts than well-capitalized banks, as dividends
paid affect the ability of banks to build a solid capital buffer (Acharya et al. 2011, Onali
2014). As our period of analysis includes the financial crisis period of 2007-2008, we
also control for banks that were in distress during this period by including the dummy
variable Distressij,t equal to one if a bank was in distress, and zero otherwise.10 We
expect these banks to distribute fewer dividends due to financial constraints.
Finally, we consider an index measuring the level of minority shareholder protection
for each country (Protectj). We follow Rossi and Volpi (2004) and Hagendorff et al.
(2008) and compute an index of shareholder protection that combines an index
measuring the level of shareholder rights (revised anti-director index of Djankov et al.
(2008)) and an index measuring the quality of law enforcement (the rule of law index
from the Worldwide Governance Indicators (World Bank)). The anti-director index
measures how strongly the legal system favors minority shareholders against managers
or majority shareholders in the corporate decision making process, including the voting
process; it ranges from from 0 to 5. The rule of law index reflects perceptions of the
9 The Zscore is defined as: (MROA(3) ijt + ETAij,t)/ SDROA(3)ij,t, where MROA(3)ij,t and SDROA(3)ij,t are
the moving average and standard deviation of return on assets (with a window width of 3), and ETAij,t is
the equity to total assets ratio at the date t. Higher Z-score means lower probability of default. 10 A bank is classified as in “distress” over the period 2008-2012 if it bankrupted, received financial
support from the government, or was absorbed by another bank due to financial difficulties. We have 19
banks in distress in our sample (out of 65 distress banks identified in the largest sample of BvD
Bankscope). Only one of these 19 distress banks distributed dividends when having negative earnings.

14
extent to which agents have confidence in and abide by the rules of society, and in
particular the quality of contract enforcement, property rights, the police, and the courts;
it ranges from -2.5 to 2.5.11 The index Protectj is defined as the revised anti-director
rights index multiplied by the rule of law index, and ranges from 0.7 to 8.84, with a
higher index indicating a higher level of shareholder protection. We compute the
dummy variable High Protectj that takes the value of one if the level of shareholder
protection for the country j is larger than the sample median, and zero otherwise. A
positive relationship between High Protectj and dividend payouts is expected if
minority shareholders having higher power force insiders to pay more dividends, in line
with the outcome model proposed by La Porta et al. (2000). On the contrary, a negative
relationship will support the substitute model of La Porta et al. (2000), where dividends
are considered as a substitute for legal protection. It means that dividend payouts should
be higher in countries with lower levels of minority shareholder protection than in
countries with stronger levels of protection.
We ensure the absence of multicollinearity problems by computing the correlation
matrix (see Table A2 in Appendix 1). We test for the presence of endogeneity between
dividend payouts and the default risk variable Ln Zscoreij,t.. We use the lags of Zscore
and rule of law as instruments to perform the Durbin-Wu-Hausman test; the results
show that Ln Zscoreij,t is not endogenous.12 We also test for the presence of endogeneity
between dividend payouts and our cluster dummy variables. Indeed, one could argue
that investors could have incentives to buy shares of banks which pay higher dividends.
We use as instruments the lagged values of the ownership variable. The results show
that none of these variables are endogenous. Finally, we also test the potential
endogeneity of our opacity index by using the lagged values of the opacity index as
instruments, and we find that there is no endogeneity problem. 13
3.2. Augmented specifications
We further analyze whether external factors (FACT) might influence the relationship
between dividend policy, opacity and ownership structure. More specifically, we
11 We compute the average value of the rule of law index over the period 2004-2012 for each country. It
is almost time-invariant for our panel of European countries. 12 The test is available from the authors. 13 Tests are available from the authors.
15
examine if the institutional and regulatory environment, through the level of
shareholder protection and the strength of the supervisory regime, is effective in
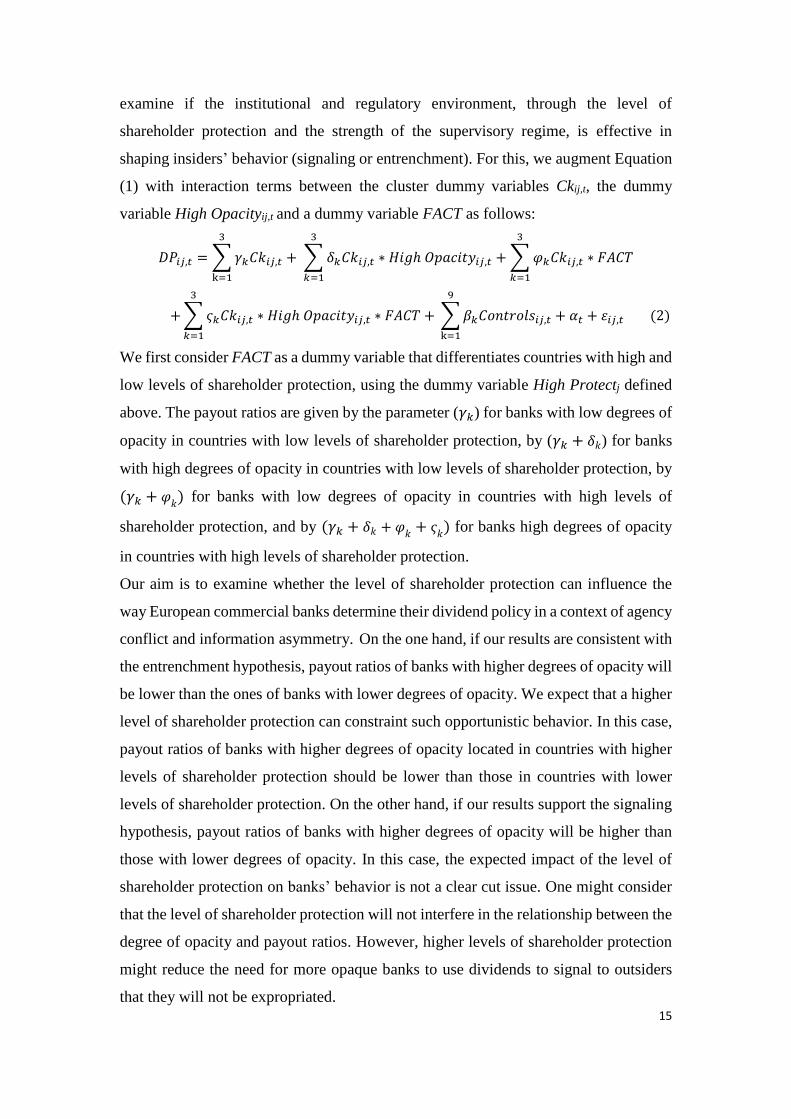
shaping insiders’ behavior (signaling or entrenchment). For this, we augment Equation
(1) with interaction terms between the cluster dummy variables Ckij,t, the dummy
variable High Opacityij,t and a dummy variable FACT as follows:
𝐷𝑃𝑖𝑗,𝑡 = ∑ 𝛾𝑘𝐶𝑘𝑖𝑗,𝑡
3
k=1
+ ∑ 𝛿𝑘𝐶𝑘𝑖𝑗,𝑡 ∗ 𝐻𝑖𝑔ℎ 𝑂𝑝𝑎𝑐𝑖𝑡𝑦𝑖𝑗,𝑡 + ∑ 𝜑𝑘𝐶𝑘𝑖𝑗,𝑡 ∗ 𝐹𝐴𝐶𝑇
3
𝑘=1
3
𝑘=1
+ ∑ 𝜍𝑘𝐶𝑘𝑖𝑗,𝑡 ∗ 𝐻𝑖𝑔ℎ 𝑂𝑝𝑎𝑐𝑖𝑡𝑦𝑖𝑗,𝑡 ∗ 𝐹𝐴𝐶𝑇 +
3
𝑘=1
∑ 𝛽𝑘𝐶𝑜𝑛𝑡𝑟𝑜𝑙𝑠𝑖𝑗,𝑡
9
k=1
+ 𝛼𝑡 + 휀𝑖𝑗,𝑡 (2)
We first consider FACT as a dummy variable that differentiates countries with high and
low levels of shareholder protection, using the dummy variable High Protectj defined
above. The payout ratios are given by the parameter (𝛾𝑘) for banks with low degrees of
opacity in countries with low levels of shareholder protection, by (𝛾𝑘 + 𝛿𝑘) for banks
with high degrees of opacity in countries with low levels of shareholder protection, by
(𝛾𝑘 + 𝜑𝑘) for banks with low degrees of opacity in countries with high levels of
shareholder protection, and by (𝛾𝑘 + 𝛿𝑘 + 𝜑𝑘
+ 𝜍𝑘) for banks high degrees of opacity
in countries with high levels of shareholder protection.
Our aim is to examine whether the level of shareholder protection can influence the
way European commercial banks determine their dividend policy in a context of agency
conflict and information asymmetry. On the one hand, if our results are consistent with
the entrenchment hypothesis, payout ratios of banks with higher degrees of opacity will
be lower than the ones of banks with lower degrees of opacity. We expect that a higher
level of shareholder protection can constraint such opportunistic behavior. In this case,
payout ratios of banks with higher degrees of opacity located in countries with higher
levels of shareholder protection should be lower than those in countries with lower
levels of shareholder protection. On the other hand, if our results support the signaling
hypothesis, payout ratios of banks with higher degrees of opacity will be higher than
those with lower degrees of opacity. In this case, the expected impact of the level of
shareholder protection on banks’ behavior is not a clear cut issue. One might consider
that the level of shareholder protection will not interfere in the relationship between the
degree of opacity and payout ratios. However, higher levels of shareholder protection
might reduce the need for more opaque banks to use dividends to signal to outsiders
that they will not be expropriated.
16
We alternatively examine whether the strength of supervisory regime has an influence
on banks’ dividend payouts when outsiders are under asymmetry of information. We
use the index of supervisory power computed by Bart et al. (2004) to measure
propensities of regulatory authorities to do on-site examinations in order to make an
overall assessment of banks to determine their economic condition, and their ability to
remove and replace managers and directors or to force a bank to change its internal
organizational structure when problems are detected. The index Supervisoryj ranges in
principle from 0 to 10, with a higher index indicating stronger supervisory strength. In
our sample, the index has a median of 5 and ranges from 4 to 9. We compute the dummy
variable Strong Supervisoryj that takes the value of one if the index of supervisory
regime for the country j is larger than the sample median, and zero otherwise. We expect
that stronger supervisory regimes limit the entrenchment behavior of insiders. In this
case, we should observe no significant differences between payout ratios for banks with
high and low degrees of opacity in countries with stronger supervisory regimes,
whereas these differences should be significant in countries with weaker supervisory
regimes.
4. Results
4.1 Opacity, ownership concentration and dividend policy
The estimation results are given in Table 5. We use panel data regression with random
effects to estimate Equation (1) as the variable High Protectj is time invariant (column
1).14 We also run an Equation (1) without the interaction terms between the Cluster
dummy variables Ckij,t and the dummy variable High Opacityij,t (column 2). We conduct
Wald tests to determine whether payout ratios significantly differ across Clusters C1,
C2 and C3 depending on the degree of opacity. Results are provided in Table 6
(computed based on estimation results of column 1).
14 As the variable High Protectj is time invariant, we cannot use a fixed-effects model. Moreover, our
ownership variables display little variation over time. According to Plumper and Troeger (2007), a fixed-
effects model is inefficient in estimating the effect of variables that have such limited within variance.
This inefficiency might lead to highly unreliable point estimates and may thus cause wrong inferences.
We therefore decide to use a random-effect model; however, we find similar results when we use the
Hausman-Taylor estimator.
17
Results in Table 6 show that banks in Cluster 1 and Cluster 2 display significantly lower
dividends when they have higher degrees of opacity compared to those with lower
degrees of opacity. These results are in line with an entrenchment behavior either from
managers (Cluster 1) or from majority shareholders (Cluster 2) when there is a high
level of asymmetric information. However, we do not find such an entrenchment
behavior for banks having a highly concentrated ownership structure (Cluster 3), as we
do not observe significant differences in payout ratios for banks with high and low
degrees of opacity. This difference of behavior between banks in Cluster 2 and Cluster
3 could be explained by the specific ownership characteristics of the latter. As
highlighted in Table 3, majority shareholders of banks in Cluster 3 hold 100% of the
shares for half of the observations and more than 98% of the shares for 75% of the
observations. When majority shareholders hold such high levels of shares, they would
act to maximise shareholders’ wealth and not engage in expropriation of minority
shareholders who are non-existent (or almost non-existent). Hence, there might be no
incentives for an entrenchment behavior for banks in Cluster 3.
We further find that the average of the dividend payout ratio is increasing from Cluster
1 to 3 for banks with lower degrees of opacity, while we do not find any significant
differences for banks with higher degrees of opacity.15 It means that dividend payments
increase with the level of ownership concentration for banks with lower degree of
opacity. This is consistent with majority shareholders trying to signal their
unwillingness to use dividends to increase funds at their discretion, as it might be
expected by minority shareholders, but only in banks where there is a low level of
asymmetric information and where extraction of private benefit might be therefore
easier to detect.
Taking all together, these results suggest that the entrenchment behavior we observe is
related to higher degree of asymmetric information but not to higher levels of ownership
concentration. We find that banks with either a dispersed or a concentrated ownership
(but not highly concentrated) pay lower dividends when they display higher levels of
information asymmetry compared to those with lower degrees of opacity. Our results
therefore support the hypothesis of an entrenchment behavior of insiders when
outsiders face high levels of asymmetric information, independently of the nature of the
15 Wald tests are available on request.
18
conflict of interest, be it either between managers/shareholders or majority
shareholders/minority shareholders.
[Insert Tables 5 and 6 here]
4.2 Effects of the institutional and regulatory environment
We now examine whether the institutional and regulatory environment, more
specifically the level of shareholder protection and the strength of the supervisory
regime, could impede the entrenchment behavior observed for banks with higher
degrees of opacity.
The estimation results, using random effects estimators, are given in the first two
columns of Table 7. Table 8 and 9 report dividends payout ratios and Wald tests for
banks with high and low degrees of opacity across clusters, according to the level of
shareholder protection (Table 8) and the strength of the supervisory regime (Table 9).
Firstly, we observe from Table 8 (Wald tests in column (a)) that banks belonging to
Cluster 2 in countries with lower levels of shareholder protection have lower payout
ratios when they have higher degrees of opacity compared to banks with lower degrees
of opacity, in line with the entrenchment behavior. However, our results show that such
opportunistic behavior does not exist in countries with higher levels of shareholder
protection. This result does not hold for banks with a dispersed ownership (Cluster 1)
as we find that they pay lower dividends when they are more opaque in countries with
higher levels of shareholder protection. Our findings therefore show that higher levels
of shareholder protection help to constraint the entrenchment behavior of majority
shareholders but not the one of managers when the level of asymmetric information
faced by outsiders is relatively high.
Wald tests in row (b) furthermore show that, for the same degree of opacity, banks
dividend payments are higher in countries with lower levels of shareholder protection.
This is consistent with the substitute model of La Porta et al. (2000), with dividends
considered as a substitute for legal protection.
Secondly, we find for countries with weaker supervisory regimes that banks in Cluster
1 and Cluster 2 pay lower dividends when they display higher degrees of information
asymmetry compared to those with lower degrees of opacity, in line with the
entrenchment behavior (Table 9, column (a)). We do not observe such significant
differences between dividend payouts for banks located in countries with stronger
19
supervisory regimes. These results are consistent with the entrenchment behavior of
insiders, managers and majority shareholders, being impeded in countries with stronger
supervisory regimes. Higher propensities of regulatory authorities to conduct on-site
examinations, greater ability of regulator to constrain banks’ corporate governance
when problems are detected help to mitigate insiders’ entrenchment behavior and then
reduce minority shareholder expropriation.
[Insert Tables 7 to 9 here]
4.3 Impact of the 2008 global financial crisis
We further investigate whether European banks change their dividend policy during the
financial crisis of 2007-2008 and the following sovereign debt crisis. Acharya et al.
(2011) report that banks in the U.S. and in Europe had been paying out significant
dividends before the crisis period (2000-2006), but also during the crisis period (2007-
2008). The authors explain the persistence of dividend payments during the crisis period
by the conflict of interest between shareholders and debtholders that leads shareholders
to prefer immediate payouts when banks are financially distressed. Dividends are then
paid to shareholders at the expense of debtholders, including regulators and taxpayers
who fund bailouts. Kanas (2013) also provides evidence that the Prompt Corrective
Action framework was ineffective in curbing dividend behavior. However, he also
shows that the introduction of the Troubled Asset Relief Program and the increase in
the deposit insurance cap in 2008 entail the elimination of both effects. Abreu and
Gulamhussen (2013) find that even U.S. bank holding companies that were
undercapitalized before the financial crisis of 2007-2008 paid higher dividends, but
they stop doing so during the financial crisis when regulators pressure was greater.
In line with this literature, we examine whether European banks have changed their
dividend policy during the financial crisis compared to the non-crisis period; more
specifically we aim to address whether banks with high degrees of opacity relax or
amplify their entrenchment behavior during the crisis period. In order to address this
issue, we rely on the specification in Equation (2) where the variable FACT now
represents the dummy variable Crisist, taking the value of one during the financial crisis
period 2007-2012 and zero otherwise. The estimation results are given in the third
column of Table 7 and Table 10 provides dividend payout ratios and Wald tests for

20
banks with high and low degrees of opacity across clusters, before and during the
financial crisis period.
Our results show that banks in Clusters 1 and 2 do not change their behavior during the
crisis period compared to the non-crisis period (see Wald tests in Table 10, column (a)).
For these two clusters, we observe as previously that banks with higher degrees of
opacity pay fewer dividends than banks with lower degrees of opacity, not just during
the non-crisis period but also during the crisis period. The persistence of the
entrenchment behavior of insiders (either managers or majority shareholders) during
the crisis period indicates that benefits of any private extraction dominate those of
increasing immediate payments during a period of financial trouble.
Our findings also confirm the stylized facts of Acharya et al. (2011) that European
commercial banks do not reduce their dividend payments during the crisis period (see
Wald tests, row (b)).
[Insert Table 10 here]
5. Robustness checks
We carry out several additional robustness checks on our empirical results.16
Firstly, we employ two alternative variables to measure the dividend payout: the ratio
dividends to equity and the ratio dividends to total assets. The results obtained in Tables
5 to 10 are robust when we use these two measures as dependent variables.
Secondly, we use the ratio measuring the relative power of the second-largest
shareholder compared to the largest shareholder (Share2ij,t/Share1ij,t) instead of the
shares held by the second-largest shareholder (Share2ij,t) to construct our clusters. We
rerun our Equations (1) and (2) and we find similar results.
We then rerun our Equations (1) and (2) by excluding banks that change clusters during
the sample period; this leaves again our results unchanged.
We further use the third quartile of the index Opacityij,t and Protectj instead of the
median of the sample to define the dummy variables High Opacityij,t and High Protectj.
Our results are unchanged with high levels of shareholder protection that help to
constraint the opportunistic entrenchment behavior of majority shareholders in banks
that display high degrees of opacity, while stronger supervisory regimes moderate the
16 The estimation results not included in this section are available on request.

21
opportunistic behavior of both managers and majority shareholders. We also use the
indices Opacityij,t and Protectj in levels instead of dummy variables and calculate the
relevant marginal effects, with Opacityij,t and Protectj evaluated at minimum, median
and maximum levels. We find similar results when the index Opacityij,t and Protectj are
relatively high, i.e. above the median of the sample.
Finally, we investigate whether the type of the majority shareholder has an impact on
the dividend policy of banks. The existing literature highlights that dividend payments
are dependent on the identity of the largest shareholder. Institutional investors as
majority shareholder have the resources, expertise and incentives to monitor and
influence dividend payments. Prior empirical studies show that institutional investors
require firms to pay dividends to enjoy preferential tax treatment, but without
demanding higher payout ratios (e.g. Grinstein and Michaely 2005, Renneboog and
Trojanowski 2006). Banking firms are also often credited with having a comparative
advantage in monitoring firms. In line with this hypothesis, Goergen et al (2005) find
that firms with banks as major shareholder are more willing to omit dividend payments
than firms controlled by other types of shareholder. Families as majority shareholders,
on the other hand, might have stronger incentives to pursue private benefits (Claessens
et al., 2002). However, prior empirical studies find that dividend payout ratios are
lowest in firms controlled by individuals or families (e.g. Gugler 2003, Renneboog and
Trojanowski 2006). This can be linked to reputational effects and controlling families
caring about the long-term viability of the firm, resulting in higher monitoring of
managers.
To investigate the impact of the type of the majority shareholder on dividend payout
ratios, we follow the BvD Bankscope classification in differentiating between the
shareholder types. We compute five different dummy variables taking the value of one
if the majority shareholder is either a bank, an institutional investor, an industrial firm,
a state, or an individual/family. We put all the remaining categories of shareholders
(managers, public, foundations, and unnamed shareholders) in the category “others”.17
In our sample, banks’ dominant shareholders fall predominantly into the categories of
banks, institutional investors and industrial firms. Dominant shareholdings by the
government and individuals/families, on the other hand, are much less common in our
17 We do not have enough observations for this to consider them as separate groups.

22
sample. As we only have 9 banks where the majority shareholder is state and 33 banks
where the majority shareholder is an individual/family, we can only run Equation (1)
by replacing the cluster dummy variables by the shareholder type dummy variables, but
we cannot run Equation (2) where we need to further differentiate banks according to
their degree of opacity. Table A3 in Appendix 1 shows that banks which pay the lowest
dividends are those where the majority shareholder is an individual or a family. This is
consistent with the hypothesis that the incentives for expropriation might be stronger
for individuals/families as they are more able to efficiently divert benefits to themselves
(Claessens et al., 2002). The highest dividends are paid when the majority shareholder
is a bank, in line with the findings of Goergen et al. (2005).
We then test that are our results are not driven by banks where the dominant shareholder
is an individual or a family by excluding them. We rerun our Equations (1) and we find
similar results, with significantly higher payout ratios for banks in Clusters 1 and 2
having higher degrees of opacity.
6. Conclusion
We empirically examined whether dividend payout decisions of banks depend on the
degree of asymmetric information faced by their outsiders, and on the level of
ownership concentration. For this, we built a novel database on listed and non-listed
European commercial banks for the period 2004–2012 with detailed information on
banks’ individual ownership structure. We used a clustering approach to distinguish
between banks with different degrees of ownership concentration. We also constructed
a synthetic measure of banks’ opacity for listed and non-listed banks based on four
sources of information asymmetry.
We find that banks with either a concentrated or a dispersed ownership structure have
lower payout ratios when they have higher degrees of opacity. These results support the
entrenchment behavior for banks displaying higher degree of opacity and where
extraction of private benefit might be therefore more difficult to detect, with insiders
(either managers or majority shareholders) decreasing dividends to potentially increase
the amount of free cash flow they can divert for their private consumption. Our results
therefore support the hypothesis of an entrenchment behavior of insiders, independently
of the nature of the conflict of interest, be it either between managers/shareholders or
majority shareholders/minority shareholders.

23
Further analysis shows that a higher level of shareholder protection helps to constrain
the entrenchment behavior of majority shareholder but not the one of managers.
However, we find that stronger supervisory regimes where regulatory authorities do on-
site examinations in order to make an overall assessment of banks, contribute to
moderate the entrenchment behavior of both majority shareholders and managers. We
also find that banks’ dividend payout decisions are not modified during the crisis period
compared to the non-crisis period.
Our results provide therefore robust empirical support for the entrenchment behavior
for banks with either a concentrated or a dispersed ownership structure when outsiders
face a relatively high degree of asymmetric information. This is a problem that might
make it more difficult for banks to raise capital. It is therefore worthwhile to determine
governance mechanisms that could lead to an optimal dividend policy to protect and
attract minority shareholders.
Our findings are in line with the recommendation of the Federal Reserve Board (FRB,
2011) and the Basel Committee on Banking Supervision (BCBS, 2011) of having
greater oversight over the dividend policy of banks. The reform of Basel 3 suggests
imposing restrictions on dividends for banks that do not satisfy regulatory solvency
requirements. However, our findings suggest that such restrictions might have an
unintended impact by amplifying the entrenchment behavior of banks with high degrees
of opacity.
If regulators want to allow signaling and agency mechanisms to function, this requires
a lessening of information asymmetry by doing on-site examinations and imposing
more transparency and strict information disclosures. Our findings also suggest that
existing corporate mechanisms need to be improved to mitigate agency conflicts
between insiders (managers or majority shareholders) and outsiders. Overall, to arrive
at more efficient capital markets in Europe, better corporate governance mechanisms
and increased transparency are called for.
24
References
Abreu, J.F., Gulamhussen, M.A., 2013. Dividend Payouts: Evidence from U.S. Bank
Holding Companies in the Context of the Financial Crisis. Journal of Corporate
Finance 22, 54-65.
Acharya, V.V., Gujral, I., Shin, H.S., 2009. Dividends and Bank Capital in the Financial
Crisis of 2007-2009. SSRN.
Acharya, V.V., Gujral, I., Kulkarni, N., Shin, H.S., 2011. Dividends and Bank Capital
in the Financial Crisis of 2007–2009. NBER Working Paper No. 16896
(Cambridge, MA: NBER).
Acharya, V.V., Le, H.T., Shin, H.S., 2013. Bank Capital and Dividend Externalities.
CEPR Discussion Paper No. DP9479.
Ahmed, A., Takeda, C., Thomas, S., 1999. Bank loan loss provisions: a re-examination
of capital management, earnings management and signaling effects. Journal of
Accounting and Economics 28, 1–26.
Anandarajan, A., Hasan, I., McCarthy, C., 2007. Use of loan loss provisions for capital,
earnings management and signalling by Australian banks. Accounting &
Finance 47, 357–379.
Arellano, M., Bover, O., 1995. Another look at the Instrumental Variable Estimation of
Error-Components Models. Journal of Econometrics 8, 29-51.
Banerjee, S., Gatchev V., Spindt, P., 2007. Stock market liquidity and firm dividend.
Journal of Financial and Quantitative Analysis 42, 369-397.
Barth, J. R., Caprio, G., Levine, R., 2004. Bank supervision and regulation: what works
best?” Journal of Financial Intermediation 13, 205-48.
Basel Committee on Banking Supervision, 2011. Basel III: a global regulatory
framework for more resilient banks and banking systems (Bank for International
Settlements).
Benartzi, S., Michaely, R., Thaler, R., 1997. Do Changes in Dividends Signal the Future
or the Past? The Journal of Finance 52, 1007–1034.
Berlin, M., Loeys, J.G., 1988. Bond Covenants and Delegated Monitoring. The Journal
of Finance 43 397-412.
Bessler, W., Nohel, T., 1996. The Stock-Market Reaction to Dividend Cuts and
Omissions by Commercial Banks. Journal of Banking & Finance 20, 1485-
1508.
Bikker, J., Metzemakers, P., 2005. Bank provisioning behaviour and procyclicality.
Journal of International Financial Markets, Institutions and Money 15, 141–157.
Bøhren, Ø., Josefsen, M.G., Steen, P.E., 2012. Stakeholder Conflicts and Dividend
Policy. Journal of Banking & Finance 36, 2852-2864.
Bouvatier, V., Lepetit, L. (2008). Banks’ procyclical behavior: does provisioning
matter? Journal of International Financial Markets, Institutions, and Money 18,
513 - 26
Bouvatier, V., Lepetit, L., Strobel, F., 2014. Bank Income Smoothing, Ownership
Concentration and the Regulatory Environment. Journal of Banking & Finance
41, 253-270.
Brockman, P., Unlu, E. (2011). Earned/contributed capital, dividend policy, and
disclosure quality: An international study. Journal of Banking & Finance, 1610–
1625.
Campbell, T., Kracaw, W., 1980. Information production, market signaling, and the
theory of intermediation. The Journal of Finance 35, 863-882.

25
Chae, J., Kim, S., Jung Lee, E., 2009. How corporate governance affects payout policy
under agency problems and external financing constraints. Journal of Banking
& Finance 33, 2093-2101.
Chen, K.C.W., Chen, Z., Wei, K.C.J., 2009. Legal protection of investors, corporate
governance, and the cost of equity capital. Journal of Corporate Finance 15,
273-289.
Chu, T., Haw, I. M., Lee, B. B. H., Wu, W. 2014. Cost of equity capital, control
divergence, and institutions: the international evidence. Review of Quantitative
Finance and Accounting 43, 483-527.
Claessens, S., Djankov, S., Fan, J.P.H., Lang, L.H.P., 2002. Disentangling the Incentive
and Entrenchment Effects of Large Shareholdings. The Journal of Finance 57,
2741-2771.
Cornett, M.M., McNutt, J.J., Tehranian, H., 2009. Corporate governance and earnings
management at large U.S. bank holding companies. Journal of Corporate
Finance 15, 412-430.
Crouzille, C., Lepetit, L., Tarazi, A., 2004. Bank Stock Volatility, News and
Asymmetric Information in Banking: An Empirical Investigation. Journal of
Multinational Financial Management 14, 443_461
Davies, P.L., 2000. The board of directors: composition, structure, duties and powers.
Paper on Company Law Reform in OECD Countries: A Comparative Outlook
of Current Trends.
Dechow, P., and Dichev, I.D., 2002. The quality of accruals and earnings: the role
accruals estimation errors, The Accounting Review 77, 35-59
De Cesari, A., 2012. Expropriation of Minority Shareholders and Payout Policy. The
British Accounting Review 44, 207-220.
Denis, D.J., Denis, D.K., Sarin, A., 1994. The Information Content of Dividend
Changes: Cash Flow Signaling, Overinvestment, and Dividend Clienteles.
Journal of Financial and Quantitative Analysis 29, 567-587.
Diamond, D.W., 1991, Monitoring and Reputation: The Choice between Bank Loans
and Directly Placed Debt. Journal of Political Economy 99, 689-721.
Dickens, R.N., Casey, K.M., Newman, J.A., 2002. Bank dividend policy: explanatory
factors, Quaterly Journal of Business and Economics 41, 3-12.
Diether, K.B., Malloy, C.J. Scherbina, A., 2002. Differences of opinion and the cross-
section of stock returns. The Journal of Finance 57, 2113-2142.
Djankov, S., La Porta, R., Lopez-de-Silanes, F., Shleifer, A., 2008. The Law and
Economics of Self-Dealing. Journal of Financial Economics 88, 430-465.
Easterbrook, F.H., 1984. Two Agency-Cost Explanations of Dividends. American
Economic Review 74, 650-659.
Faccio, M. , Lang, L.H.P., Young, L. (2001). Dividends and Expropriation. American
Economic Review 91, 54-78.
Fama, E.F., French, K.R., 2001. Disappearing Dividends: Changing Firm
Characteristics or Lower Propensity to Pay? Journal of Financial Economics 60,
3-43.
Federal Reserve Board, 2011. Federal Reserve System, 12 CFR Part 225, capital plans.
Fed. Regist. 76 (231), 74631–74648.
26
Filbeck, G., Mullienaux, D.J., 1993. Regulatory Monitoring and The Impact of Bank
Holding Company Dividend Changes on Equity return. Financial Review 28,
403-415.
Filbeck, G., Mullienaux, D.J., 1999. Agency Cost and Dividend Payment: The Case of
Bank Holding Companies. The Quarterly Review of Economics and Finance,
409-418.
Fidrmuc, J.P., Jacob, M., 2010. Culture, Agency Costs, and Dividends. Journal of
Comparative Economics 38, 321-339.
Galiakhmetova, R., Jiaotong, X., Molyneux P., Onali E., 2015. CEO power,
government monitoring, and bank dividends, mimeo.
Goergen, M., Renneboog, L., Correira da Silva, L., 2005. When do German firms
change their dividends? Journal of Corporate Finance 11, 375-399.
Gomes, A., 2000. Going public without governance: Managerial reputation effects. The
Journal of Finance 55, 615-646.
Goyal V.K., 2005. Market Discipline of Bank Risk: Evidence from Subordinated Debt
Contracts, Journal of Financial Intermediation 14, 318–50.
Greenawalt, M., Sinkey, J., 1988. Bank loan-loss provisions and the incomesmoothing
hypothesis: an empirical analysis, 1976–1984. Journal of Financial Services
Research 1, 301–318.
Grinstein, Y., Michaely, R., 2005. Institutional holdings and payout policy, Journal of
Finance 60, 1389-1426.
Gugler, G., 2003. Corporate governance, dividend payout policy, and the interrelation
between diviends, R&D, and capital investment. Journal of Banking & Finance
27, 1297-1321.
Gugler, K., Yurtoglu, B.B., 2003. Corporate Governance and Dividend Pay-out Policy
in Germany. European Economic Review 47, 731-758
Hagendorff, J., Collins, M., Keasey, K., 2008. Investor protection and the value effects
of bank merger announcements in Europe and the US. Journal of Banking &
Finance 32, 1333-1348.
Healey, P.M., Papelu, K.G., 1988. Earnings information conveyed by dividend
initiations and omissions, Journal of Financial Economics 21, 149-175.
Hutton, A.P., Marcus, A.J., Tehranian, H., 2009. Opaque financial report, R2, and crash
risk, Journal of Financial Economics 94, 67-86.
James C., 1991. The Losses Realized in Bank Failures, The Journal of Finance 46, 223–
42.
Jensen, M.C., Meckling, W., 1976. Theory of the firm: Managerial behavior, agency
costs, and capital structure. Journal of Financial Economics 3, 305-360.
Kanas, A., 2013. Dividends, risk, and regulatory regimes. Journal of Banking &
Finance 37, 1-10.
Krishnaswami, S., Subramaniam, V., 1999. Information Asymmetry, Valuation, and
the Corporate Spin-Off Decission. Journal of Financial Economics 53, 73-112.
Lang, M.H., Maffett, M.G., 2011. Transparency and liquidity uncertainty in crisis
period. Journal of Accounting and Economics 52, 101-125.
Lang, L.H., Litzenberger, R., 1989. Dividend announcements: Cash flow signalling vs.
free cash flow hypothesis. Journal of Financial Economics 24, 181-191.
La Porta, R., Lopez-de-Silanes, F., Shleifer, A., Vishny, R.W., 1998. Law and Finance.
Journal of Political Economics 106, 1113-1155.

27
La Porta, R., Lopez-de-Silanes, F., Shleifer, A., Vishny, R.W., 2000. Agency Problems
and Dividend Policies around the World. The Journal of Finance 55, 1-33.
Leary, M.T., Michaely, R., 2011. Determinants of dividend smoothing: empirical
evidence. The Review of Financial Studies 24, 3197-3249.
Lemmon, M. L., Lins, K. V., 2003. Ownership structure, corporate governance, and
firm value: Evidence from the East Asian financial crisis. The Journal of
Finance. 58, 1445-1468.
Lepetit, L. Strobel, F., 2015, Bank Insolvency Risk and Z-Score Measures : A
Refinement. Finance Research Letters 13, 214-224.
Leuz, C., Nanda, D., Wysocki, P., 2003. Earnings management and investor protection:
an international comparison. Journal of Financial Economics 69, 505-527.
Li, K., Zhao, X., 2008. Asymmetric Information and Dividend Policy. Financial
Management 37, 673-694.
Lins, Karl V., 2003. Equity ownership and firm value in emerging markets, Journal of
Financial and Quantitative Analysis. 38, 159-184.
Morgan, D.P., 2002. Rating Banks: Risk and Uncertainty in An Opaque Industry.
American Economic Review 92, 874-888.
Onali, E., 2014. Moral Hazard, Dividends, and Risk in Banks. Journal of Business
Finance & Accounting 41, 128-155.
Park, S., 1999. Effects of Risk-Based Capital Requirements and Asymmetric
Information on Banks' Portfolio Decisions. Journal of Regulatory Economics
16, 135-150.
Plumper, T., Troeger, V.E., 2007. Efficient Estimation of Time-Invariant and Rarely
Changing Variables in Finite Sample Panel Analyses with Unit Fixed Effects.
Political Analysis 15, 124-139.
Renneboog, L., Trojanowski, G., 2006. Control structures and payout policy.
Managerial Finance 33, 43-64.
Rossi, S., Volpin, P.F., 2004. Cross-country determinants of mergers and acquisitions.
Journal of Financial Economics 74, 277–304.
Sáez, M. I., Riaño, D., 2013. Corporate governance and the shareholders meeting:
voting and litigation. European Business Organization Law Review 14, 343-
399.
Shleifer, A., Vishny, R.W., 1997. A Survey of Corporate Governance. The Journal of
Finance 52, 737-783.
Theis, J., Dutta, A.S., 2009. Explanatory factors of bank dividend policy: Revisited,
Journal of Corporate Finance, 35, 501-508.
Von Eije, H., Megginson, W.L., 2008. Dividends and Share Repurchases in the
European Union. Journal of Financial Economics 89, 347-374.
Windmeijer, F., 2005. A Finite Sample Correction for the Variance of Linear Efficient
Two-Step GMM Estimators. Journal of Econometrics 126, 25-51.
Yoon, P.S., Starks, L.T., 1995. Signaling, Investment Opportunities, and Dividend,
Announcements. Review of Financial Studies 8, 995-1018.
Zwiebel, J., 1996. Dynamic capital structure under managerial entrenchment. American
Economic Review 86, 1197-1215.

28
Table 1. Distribution of banks by country
Full sample of
Our sample of commercial banks Percent of
Country commercial banks in Bankscope total assets
Austria 12 80 56.18
Belgium 7 38 36.11
Denmark 34 58 53.31
Finland 4 10 72.52
France 53 147 45.45
Germany 21 151 60.94
Greece 9 20 61.65
Ireland 5 18 44.06
Italy 58 142 54.63
Luxembourg 36 88 26.79
Netherlands 12 40 44.45
Portugal 7 27 41.32
Spain 18 69 81.54
Sweden 11 26 72.25
U.K. 43 148 50.31
Total 330 1062 Median = 53.31
Percent of total assets represents the average of total assets of commercial banks in our sample for
the year 2004-2012 divided by the average of total assets of commercial banks of the full sample of
banks provided by BvD Bankscope for the year 2004-2012.

29
Table 2. General descriptive statistics, on average over the period 2004-2012
Deposit ETA Loan LLP ROA ROE NII Expenses TA DP
Our sample of commercial banks
All banks (330 banks, 1,150 observations)
Mean 53.90 7.02 56.35 0.28 0.86 12.99 40.05 58.10 143,122 46.08
Std. Dev. 20.05 3.68 23.60 0.43 0.81 9.40 15.95 13.15 404,462 29.71
Minimum 10.46 0.42 0.40 -6.06 -7.00 -59.04 -26.67 10.00 50 0
Maximum 91.97 21.30 94.13 4.14 9.26 77.91 87.50 87.37 3,424,403 100
Cluster 1 Dispersed ownership (89 banks, 294 observations)
Mean 51.20 7.20 61.96 0.31 0.85 12.34 38.22 58.32 306,390 32.32
Std. Dev. 18.54 3.84 17.24 0.43 0.77 6.91 13.10 10.78 650,455 22.48
Cluster 2 Concentrated ownership (119 banks, 307 observations)
Mean 51.85 7.83 60.13 0.36 0.80 10.96 37.62 58.91 86,902 46.29
Std. Dev. 18.35 3.84 24.04 0.37 0.70 8.94 14.36 13.28 288,810 28.71
Cluster 3 Highly concentrated ownership (187 banks, 549 observations)
Mean 56.42 6.47 51.15 0.22 0.90 14.50 42.62 57.58 87,429 53.88
Std. Dev. 21.50 3.39 25.20 0.46 0.88 10.53 17.72 14.20 227,734 30.95
Variable definitions (all variables are expressed in percentages, except TA which is in millions of USD): Deposit = deposits/total assets; ETA = total
equity/total assets; Loan = net loans/total assets; LLP = loan loss provisions/total assets; ROA = net income/total assets; ROE = net income/total
equity; NII = non-interest income/operating profit; Expenses = operating expenses/operating profit; TA = total assets; DP = cash dividend related
to the period/earnings.
Clusters 1-3 are determined using a hierarchical agglomerative clustering (HAC) approach that uses three ownership measures in the construction
of clusters of banks with "similar" ownership characteristics: the percentage held by the largest shareholder, the percentage held by the second-largest
shareholder, and a Herfindahl index computed for a bank's ownership distribution.

30
Table 3. Descriptive statistics on ownership measures by cluster, on average over the
period 2004–2012.
Share1 Share2 Share2/Share1 Concentration
All banks (1,150 observations)
mean 68.13 8.54 0.27 0.61
sd 35.25 11.84 0.34 0.39
min 0.01 0 0 0.00
p25 42 0 0 0.24
p50 80 3.32 0.08 0.66
p75 100 13 0.50 1
max 100 50 1 1
Cluster 1 Dispersed ownership (294 observations)
mean 15.39 10.32 0.65 0.07
sd 12.86 9.05 0.30 0.08
min 0.01 0.01 0.01 0.00
p25 5 4.99 0.42 0.00
p50 10.16 6.19 0.72 0.02
p75 25.00 16.48 0.94 0.11
max 42.18 41.00 1 0.34
Cluster 2 Concentrated ownership (307 observations)
mean 62.69 20.18 0.34 0.46
sd 12.32 13.53 0.26 0.15
min 43.37 0.01 0.00 0.20
p25 51.00 8.72 0.13 0.30
p50 60 19.69 0.30 0.47
p75 75 28.95 0.50 0.59
max 85.83 50 1 0.76
Cluster 3 Highly concentrated ownership (549 observations)
mean 98.71 0.60 0.01 0.98
sd 2.65 1.79 0.02 0.05
min 86.67 0 0 0.75
p25 98 0 0 0.96
p50 100 0 0 1
p75 100 0 0 1
max 100 10 0.11 1
Variable definitions: Share1 = percentage held by largest shareholder; Share2 = percentage held
by second-largest shareholder; Share2/Share1 = relative (voting) power of the second largest
shareholder compared to the largest shareholder; Concentration= Herfindahl index on bank's
ownership distribution (we compute for each bank i the variable OSi, defined by the ratio of the
percentage of equity held by each shareholder n to the total percentage of equity held by all
shareholders; we then compute Concentration as ∑ 𝑂𝑆𝑛2𝑁
𝑛=1 with N the total number of
shareholders).
Clusters 1-3 are determined using a hierarchical agglomerative clustering (HAC) approach that
uses three ownership measures (Share1, Share2 and Concentration) in the construction of clusters
of banks with "similar" ownership characteristics
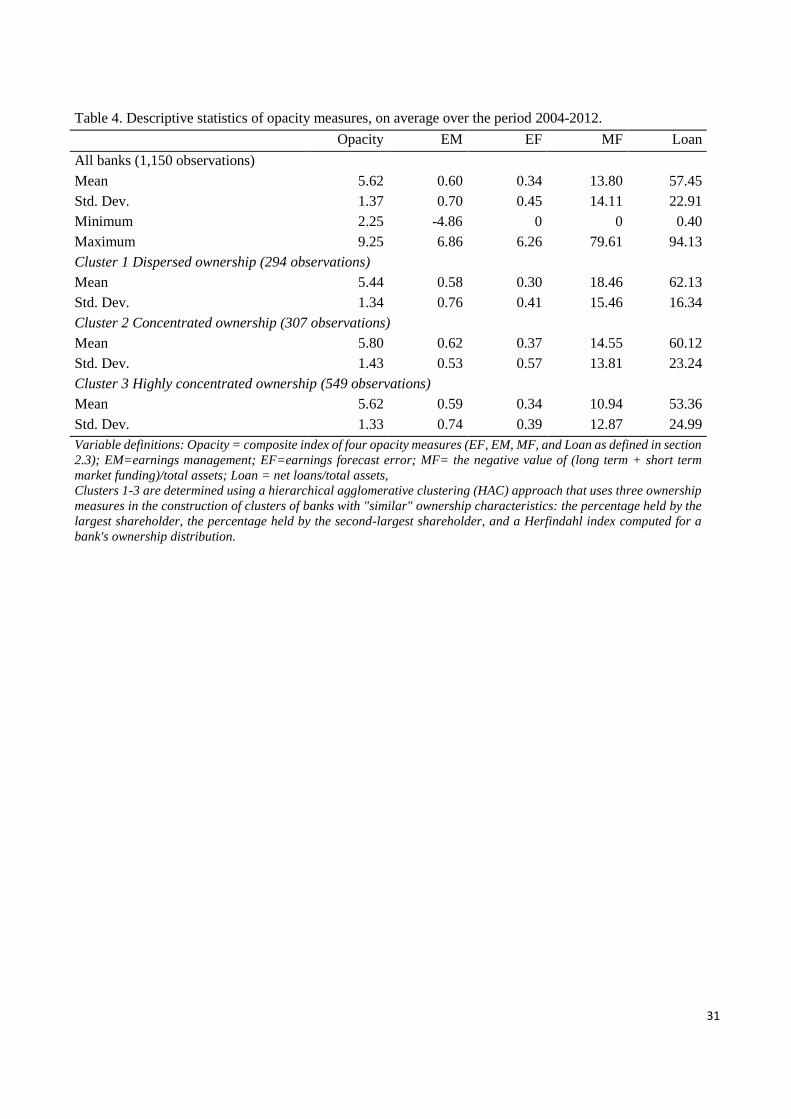
31
Table 4. Descriptive statistics of opacity measures, on average over the period 2004-2012.
Opacity EM EF MF Loan
All banks (1,150 observations)
Mean 5.62 0.60 0.34 13.80 57.45
Std. Dev. 1.37 0.70 0.45 14.11 22.91
Minimum 2.25 -4.86 0 0 0.40
Maximum 9.25 6.86 6.26 79.61 94.13
Cluster 1 Dispersed ownership (294 observations)
Mean 5.44 0.58 0.30 18.46 62.13
Std. Dev. 1.34 0.76 0.41 15.46 16.34
Cluster 2 Concentrated ownership (307 observations)
Mean 5.80 0.62 0.37 14.55 60.12
Std. Dev. 1.43 0.53 0.57 13.81 23.24
Cluster 3 Highly concentrated ownership (549 observations)
Mean 5.62 0.59 0.34 10.94 53.36
Std. Dev. 1.33 0.74 0.39 12.87 24.99
Variable definitions: Opacity = composite index of four opacity measures (EF, EM, MF, and Loan as defined in section
2.3); EM=earnings management; EF=earnings forecast error; MF= the negative value of (long term + short term
market funding)/total assets; Loan = net loans/total assets,
Clusters 1-3 are determined using a hierarchical agglomerative clustering (HAC) approach that uses three ownership
measures in the construction of clusters of banks with "similar" ownership characteristics: the percentage held by the
largest shareholder, the percentage held by the second-largest shareholder, and a Herfindahl index computed for a
bank's ownership distribution.
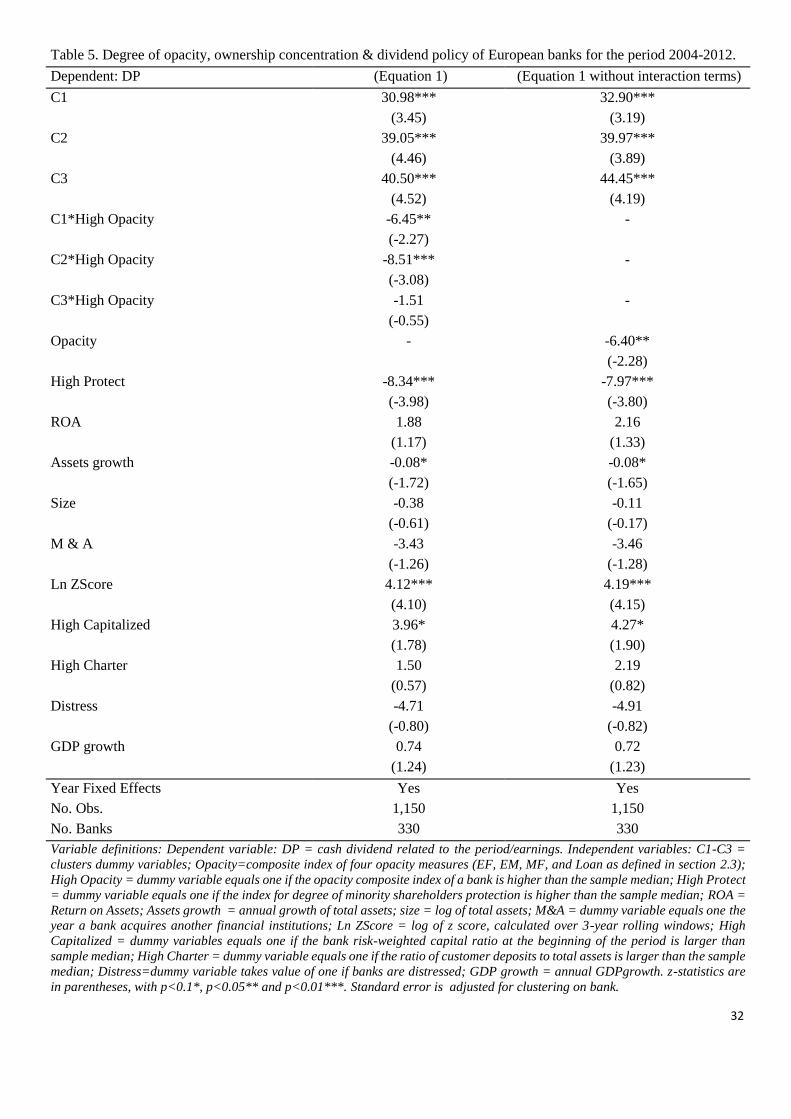
32
Table 5. Degree of opacity, ownership concentration & dividend policy of European banks for the period 2004-2012.
Dependent: DP (Equation 1) (Equation 1 without interaction terms)
C1 30.98*** 32.90***
(3.45) (3.19)
C2 39.05*** 39.97***
(4.46) (3.89)
C3 40.50*** 44.45***
(4.52) (4.19)
C1*High Opacity -6.45** -
(-2.27)
C2*High Opacity -8.51*** -
(-3.08)
C3*High Opacity -1.51 -
(-0.55)
Opacity - -6.40**
(-2.28)
High Protect -8.34*** -7.97***
(-3.98) (-3.80)
ROA 1.88 2.16
(1.17) (1.33)
Assets growth -0.08* -0.08*
(-1.72) (-1.65)
Size -0.38 -0.11
(-0.61) (-0.17)
M & A -3.43 -3.46
(-1.26) (-1.28)
Ln ZScore 4.12*** 4.19***
(4.10) (4.15)
High Capitalized 3.96* 4.27*
(1.78) (1.90)
High Charter 1.50 2.19
(0.57) (0.82)
Distress -4.71 -4.91
(-0.80) (-0.82)
GDP growth 0.74 0.72
(1.24) (1.23)
Year Fixed Effects Yes Yes
No. Obs. 1,150 1,150
No. Banks 330 330
Variable definitions: Dependent variable: DP = cash dividend related to the period/earnings. Independent variables: C1-C3 =
clusters dummy variables; Opacity=composite index of four opacity measures (EF, EM, MF, and Loan as defined in section 2.3);
High Opacity = dummy variable equals one if the opacity composite index of a bank is higher than the sample median; High Protect
= dummy variable equals one if the index for degree of minority shareholders protection is higher than the sample median; ROA =
Return on Assets; Assets growth = annual growth of total assets; size = log of total assets; M&A = dummy variable equals one the
year a bank acquires another financial institutions; Ln ZScore = log of z score, calculated over 3-year rolling windows; High
Capitalized = dummy variables equals one if the bank risk-weighted capital ratio at the beginning of the period is larger than
sample median; High Charter = dummy variable equals one if the ratio of customer deposits to total assets is larger than the sample
median; Distress=dummy variable takes value of one if banks are distressed; GDP growth = annual GDPgrowth. z-statistics are
in parentheses, with p<0.1*, p<0.05** and p<0.01***. Standard error is adjusted for clustering on bank.

33
Table 6. Dividend payout of banks according to the degree of opacity
High Opacity Low Opacity High - Low Opacity
C1 24.52*** 30.98*** -6.45**
(0.00) (0.00) (0.02)
C2 30.54*** 39.95*** -8.51***
(0.00) (0.00) (0.00)
C3 38.98*** 40.50*** -1.51
(0.00) (0.00) (0.56)
Variable definitions: C1-C3 = clusters dummy variables; High Opacity = Banks with high
opacity, dummy variable equals one if the opacity composite index of a bank is higher than
the sample median. The coefficient represents the average of dividend payout of each
clusters on each opacity condition. It is computed form equation 1, where average
dividend payout for banks with low opacity is the coefficient of Ck (γk) and for banks with
high opacity is coefficient Ck + Ck*Opacity (γk + δk). P-value are in parentheses, with
p<0.1*, p<0.05** and p<0.01***.

34
Table 7. Degree of opacity, ownership concentration and dividend policy for different levels of
shareholder protection and supervisory regime strength, and before/during the crisis period, for
European commercial banks over the period 2004-2014 (Equation (2))
FACT
Dependent: DP High Protect Strong
Supervisory
Crisis
C1 32.32*** 27.72*** 25.11***
(3.68) (3.16) (2.82)
C2 43.97*** 37.92*** 36.78***
(5.33) (4.47) (4.22)
C3 43.91*** 40.55*** 37.39***
(5.33) (4.73) (4.19)
C1* High Opacity 0.02 -8.29** -5.48
(0.00) (-2.12) (-1.58)
C2* High Opacity -9.69*** -10.85*** -12.41***
(-2.78) (-3.19) (-3.90)
C3* High Opacity -0.48 -1.30 -3.23
(-0.15) (-0.33) (-1.03)
C1*FACT -4.68 1.20 2.82
(-0.93) (0.24) (0.91)
C2*FACT -12.48*** -3.43 -1.54
(-2.85) (-0.79) (-0.35)
C3*FACT -7.76** -4.68 0.17
(-1.97) (-0.98) (0.04)
C1* High Opacity *FACT -9.90* 4.88 -1.92
(-1.94) (0.89) (-0.53)
C2* High Opacity *FACT 3.42 7.04 9.00*
(0.68) (1.39) (1.71)
C3* High Opacity *FACT -2.69 0.12 4.90
(-0.57) (0.02) (1.10)
Year Fixed Effects Yes Yes Yes
Control variables Yes Yes Yes
No. Obs. 1,150 1,150 1,150
No. Banks 330 330 330
Variable definitions: Dependent variable is DP (dividend payouts) = cash dividend related to the period/earnings.
High Opacity= dummy variable equals one if the opacity composite index is higher than the sample median.
FACT: High Protect = dummy variable equals one if the index for degree of minority shareholder protection is
higher than the sample median; Strong Supervisory=dummy variable equals one if the supervisory regime index
is higher than the sample median; Crisis=dummy variable equals one during the financial crisis period 2007 -
2012. z-statistics are in parentheses, with p<0.1*, p<0.05** and p<0.01***. Standard error is adjusted for
clustering on bank.
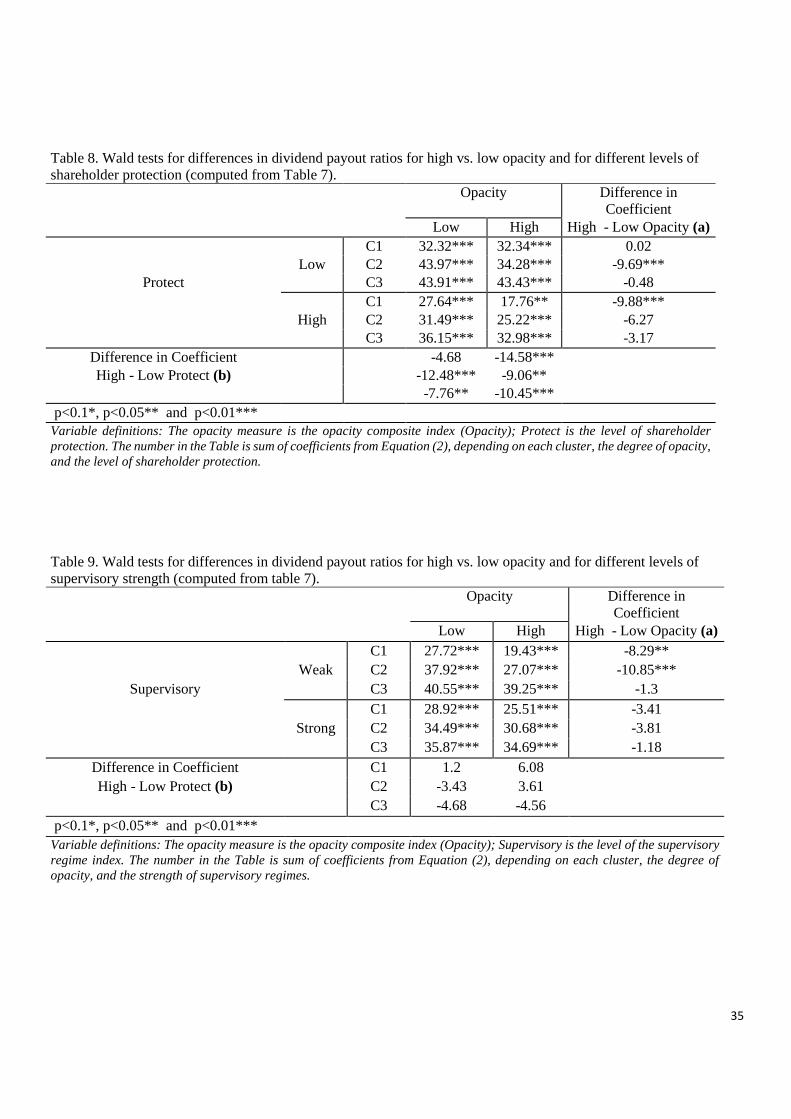
35
Table 8. Wald tests for differences in dividend payout ratios for high vs. low opacity and for different levels of
shareholder protection (computed from Table 7).
Opacity Difference in
Coefficient
Low High High - Low Opacity (a)
C1 32.32*** 32.34*** 0.02
Low C2 43.97*** 34.28*** -9.69***
Protect C3 43.91*** 43.43*** -0.48
C1 27.64*** 17.76** -9.88***
High C2 31.49*** 25.22*** -6.27
C3 36.15*** 32.98*** -3.17
Difference in Coefficient -4.68 -14.58***
High - Low Protect (b) -12.48*** -9.06**
-7.76** -10.45***
p<0.1*, p<0.05** and p<0.01*** Variable definitions: The opacity measure is the opacity composite index (Opacity); Protect is the level of shareholder
protection. The number in the Table is sum of coefficients from Equation (2), depending on each cluster, the degree of opacity,
and the level of shareholder protection.
Table 9. Wald tests for differences in dividend payout ratios for high vs. low opacity and for different levels of
supervisory strength (computed from table 7).
Opacity Difference in
Coefficient
Low High High - Low Opacity (a)
C1 27.72*** 19.43*** -8.29**
Weak C2 37.92*** 27.07*** -10.85***
Supervisory C3 40.55*** 39.25*** -1.3
C1 28.92*** 25.51*** -3.41
Strong C2 34.49*** 30.68*** -3.81
C3 35.87*** 34.69*** -1.18
Difference in Coefficient C1 1.2 6.08
High - Low Protect (b) C2 -3.43 3.61
C3 -4.68 -4.56
p<0.1*, p<0.05** and p<0.01*** Variable definitions: The opacity measure is the opacity composite index (Opacity); Supervisory is the level of the supervisory
regime index. The number in the Table is sum of coefficients from Equation (2), depending on each cluster, the degree of
opacity, and the strength of supervisory regimes.

36
Table 10. Wald tests for differences in dividend payout for high vs. low opacity in crisis and non crisis time
(computed from table 7).
Opacity Difference in Coefficient
Low High High - Low Opacity (a)
C1 34.93*** 26.49*** -8.44*
No C2 44.41*** 29.80*** -14.60***
Crisis C3 42.56*** 39.36*** -2.7
C1 28.79*** 23.82*** -4.96*
Yes C2 36.27*** 28.88*** -7.39**
C3 37.27*** 35.60*** -1.67
Difference in Coefficient C1 -6.14 -2.67
Crisis – no crisis (b) C2 -8.13 -0.92
C3 -5.29 -4.26
p<0.1*, p<0.05** and p<0.01*** Variable definitions: The opacity measure is the opacity composite index (Opacity); Crisis is the dummy variable that takes the
value of one in 2007-2012 and zero otherwise. The number in the Table is sum of coefficients from Equation (2), depending on
each cluster, the degree of opacity, and the economic condition.

37
Appendix 1
Table A1. Correlation matrix of opacity measures
Variables Opacity EM EF MF Loan
Opacity 1.000
EM 0.285* 1.000
EF 0.343* 0.056 1.000
MF -0.380* -0.135* -0.049 1.000
Loan 0.373* 0.052 -0.092* 0.301* 1.000
Variable definitions: Opacity = composite index of opacity measures (EM, EF, MF and Loan);
EM=earnings management; EF=earnings forecast error; MF= the negative value of (long
term + short term market funding)/total assets; Loan = net loans/total assets. With p<0.05*.

38
Table A2. Correlation Matrix
1 2 3 4 5 6 7 8 9 10 11 12 13 14 15
1 C1 1.000
2 C2 -0.349* 1.000
3 C3 -0.553* -0.575* 1.000
4 Opacity -0.079* 0.077* -0.002 1.000
5 Protect 0.142* -0.206* 0.047 0.107* 1.000
6 Supervisory 0.050 -0.243* 0.159* 0.035 0.600* 1.000
7 ROA 0.005 -0.054 0.048 0.489* 0.109* 0.063* 1.000
8 Assets growth 0.086* 0.001 -0.079* 0.092* 0.091* 0.092* 0.120* 1.000
9 Size 0.145* -0.129* -0.016 -0.473* -0.060* 0.058* -0.342* -0.023 1.000
10 M&A 0.175* -0.014 -0.136* -0.174* 0.024 0.082* -0.037 0.078* 0.356* 1.000
11 Ln Z Score -0.010 0.052 -0.032 0.005 -0.013 -0.008 0.056* 0.008 -0.112* -0.008 1.000
12 High Capitalized -0.287* -0.014 0.262* 0.193* 0.182* 0.133* 0.130* -0.137* -0.362* -0.164* -0.045 1.000
13 High Charter -0.106* -0.045 0.128* 0.344* 0.089* -0.000 0.229* -0.022 -0.480* -0.164* -0.002 0.288* 1.000
14 Distress 0.055 -0.017 -0.032 -0.086* -0.073* -0.029 -0.065* -0.036 0.103* 0.132* -0.091* -0.063* -0.021 1.000
15 GDP growth 0.016 -0.074* 0.058* 0.059* 0.182* 0.134* 0.173* 0.179* -0.027 0.006 0.076* 0.012 -0.013 -0.105* 1.000
Variable definitions: C1-C3 = clusters dummy variables; Opacity= composite index of opacity measures (EM, EF, MF and Loan); Protect = Index of degree of minority shareholders protection, which is
Rule of Law index multipied by revised Anti Director index (Djankov et al. 2008); Supervisory=banks supervisory regime index; ROA = Return on Assets; Assets growth = annual growth of total assets;
Size = log of total assets; M&A = dummy variable equals one the year a bank acquires another financial institutions; Ln ZScore = log of z score, calculated over 3-year rolling windows; High
Capitalized = dummy variables equals one if the bank risk-weighted capital ratio at the beginning of the period is larger than sample median; High Charter = dummy variable equals one if the ratio of
customer deposits to total assets is larger than the sample median; Distress=dummy variable takes value of one if banks are distressed; GDP growth = annual GDP growth. p<0.05*.
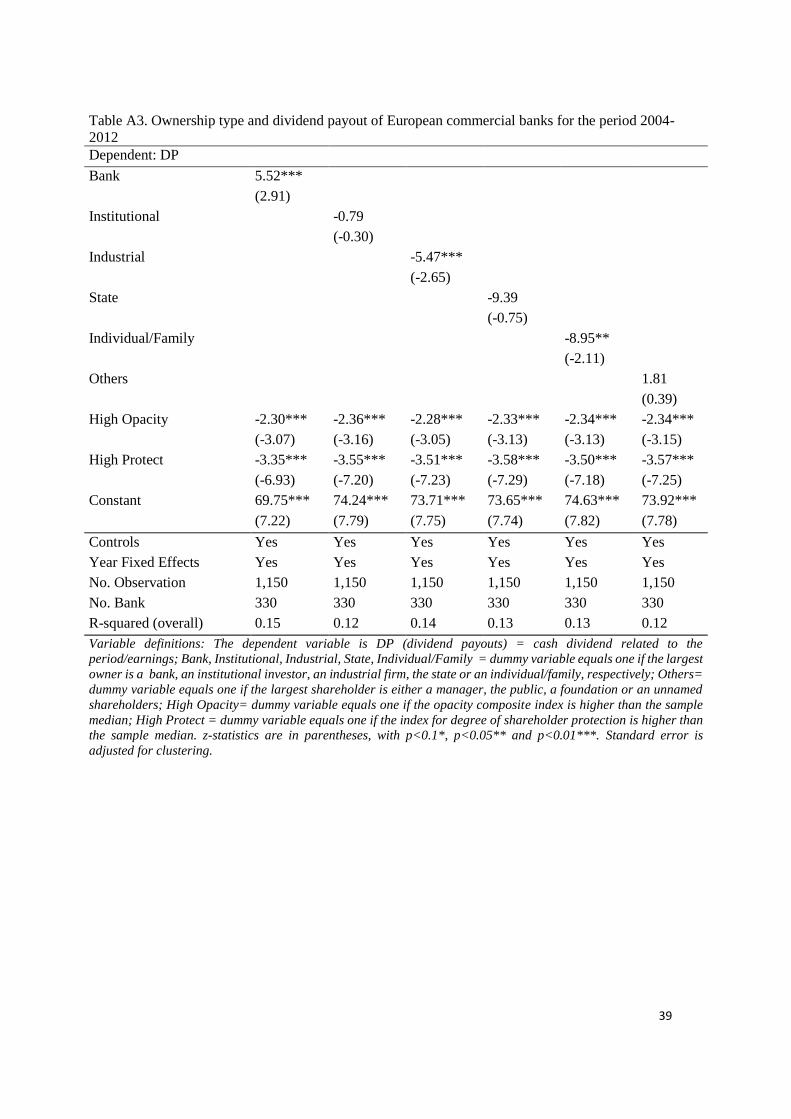
39
Table A3. Ownership type and dividend payout of European commercial banks for the period 2004-
2012
Dependent: DP
Bank 5.52***
(2.91)
Institutional -0.79
(-0.30)
Industrial -5.47***
(-2.65)
State -9.39
(-0.75)
Individual/Family -8.95**
(-2.11)
Others 1.81
(0.39)
High Opacity -2.30*** -2.36*** -2.28*** -2.33*** -2.34*** -2.34***
(-3.07) (-3.16) (-3.05) (-3.13) (-3.13) (-3.15)
High Protect -3.35*** -3.55*** -3.51*** -3.58*** -3.50*** -3.57***
(-6.93) (-7.20) (-7.23) (-7.29) (-7.18) (-7.25)
Constant 69.75*** 74.24*** 73.71*** 73.65*** 74.63*** 73.92***
(7.22) (7.79) (7.75) (7.74) (7.82) (7.78)
Controls Yes Yes Yes Yes Yes Yes
Year Fixed Effects Yes Yes Yes Yes Yes Yes
No. Observation 1,150 1,150 1,150 1,150 1,150 1,150
No. Bank 330 330 330 330 330 330
R-squared (overall) 0.15 0.12 0.14 0.13 0.13 0.12
Variable definitions: The dependent variable is DP (dividend payouts) = cash dividend related to the
period/earnings; Bank, Institutional, Industrial, State, Individual/Family = dummy variable equals one if the largest
owner is a bank, an institutional investor, an industrial firm, the state or an individual/family, respectively; Others=
dummy variable equals one if the largest shareholder is either a manager, the public, a foundation or an unnamed
shareholders; High Opacity= dummy variable equals one if the opacity composite index is higher than the sample
median; High Protect = dummy variable equals one if the index for degree of shareholder protection is higher than
the sample median. z-statistics are in parentheses, with p<0.1*, p<0.05** and p<0.01***. Standard error is
adjusted for clustering.
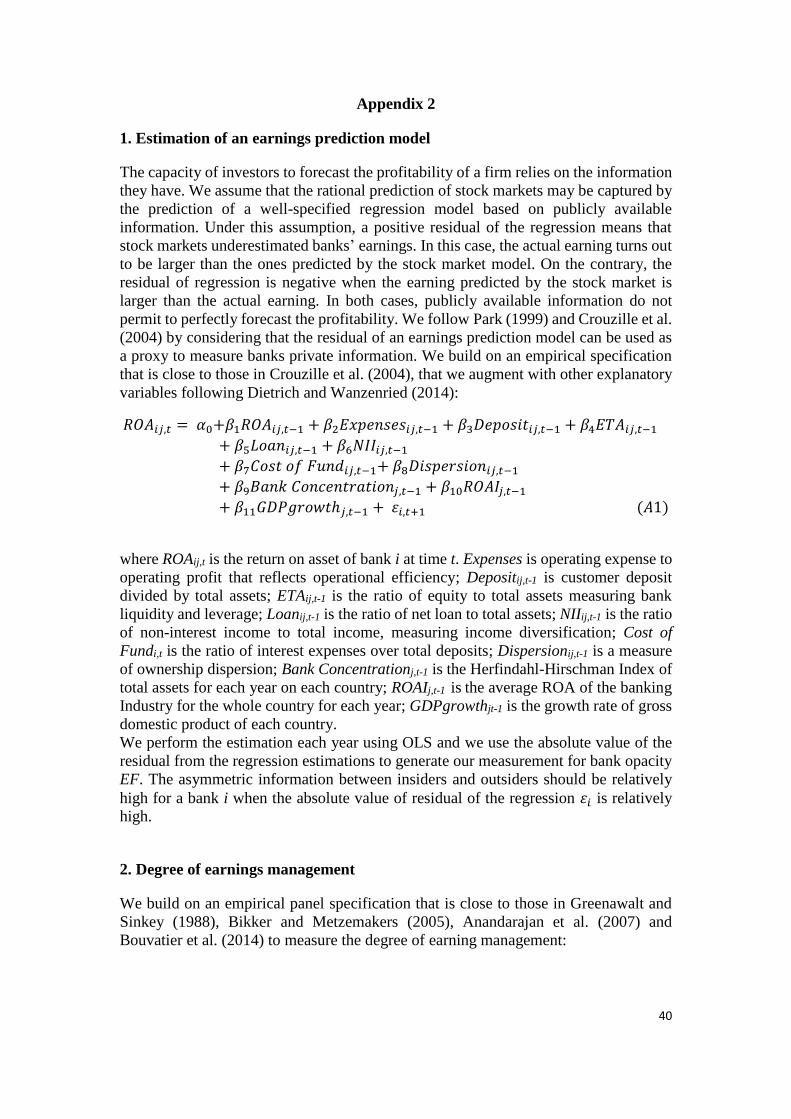
40
Appendix 2
1. Estimation of an earnings prediction model
The capacity of investors to forecast the profitability of a firm relies on the information
they have. We assume that the rational prediction of stock markets may be captured by
the prediction of a well-specified regression model based on publicly available
information. Under this assumption, a positive residual of the regression means that
stock markets underestimated banks’ earnings. In this case, the actual earning turns out
to be larger than the ones predicted by the stock market model. On the contrary, the
residual of regression is negative when the earning predicted by the stock market is
larger than the actual earning. In both cases, publicly available information do not
permit to perfectly forecast the profitability. We follow Park (1999) and Crouzille et al.
(2004) by considering that the residual of an earnings prediction model can be used as
a proxy to measure banks private information. We build on an empirical specification
that is close to those in Crouzille et al. (2004), that we augment with other explanatory
variables following Dietrich and Wanzenried (2014):
𝑅𝑂𝐴𝑖𝑗,𝑡 = 𝛼0+𝛽1𝑅𝑂𝐴𝑖𝑗,𝑡−1 + 𝛽2𝐸𝑥𝑝𝑒𝑛𝑠𝑒𝑠𝑖𝑗,𝑡−1 + 𝛽3𝐷𝑒𝑝𝑜𝑠𝑖𝑡𝑖𝑗,𝑡−1 + 𝛽4𝐸𝑇𝐴𝑖𝑗,𝑡−1
+ 𝛽5𝐿𝑜𝑎𝑛𝑖𝑗,𝑡−1 + 𝛽6𝑁𝐼𝐼𝑖𝑗,𝑡−1
+ 𝛽7𝐶𝑜𝑠𝑡 𝑜𝑓 𝐹𝑢𝑛𝑑𝑖𝑗,𝑡−1+ 𝛽8𝐷𝑖𝑠𝑝𝑒𝑟𝑠𝑖𝑜𝑛𝑖𝑗,𝑡−1
+ 𝛽9𝐵𝑎𝑛𝑘 𝐶𝑜𝑛𝑐𝑒𝑛𝑡𝑟𝑎𝑡𝑖𝑜𝑛𝑗,𝑡−1 + 𝛽10𝑅𝑂𝐴𝐼𝑗,𝑡−1
+ 𝛽11𝐺𝐷𝑃𝑔𝑟𝑜𝑤𝑡ℎ𝑗,𝑡−1 + 휀𝑖,𝑡+1 (𝐴1)
where ROAij,t is the return on asset of bank i at time t. Expenses is operating expense to
operating profit that reflects operational efficiency; Depositij,t-1 is customer deposit
divided by total assets; ETAij,t-1 is the ratio of equity to total assets measuring bank
liquidity and leverage; Loanij,t-1 is the ratio of net loan to total assets; NIIij,t-1 is the ratio
of non-interest income to total income, measuring income diversification; Cost of
Fundi,t is the ratio of interest expenses over total deposits; Dispersionij,t-1 is a measure
of ownership dispersion; Bank Concentrationj,t-1 is the Herfindahl-Hirschman Index of
total assets for each year on each country; ROAIj,t-1 is the average ROA of the banking
Industry for the whole country for each year; GDPgrowthjt-1 is the growth rate of gross
domestic product of each country.
We perform the estimation each year using OLS and we use the absolute value of the
residual from the regression estimations to generate our measurement for bank opacity
EF. The asymmetric information between insiders and outsiders should be relatively
high for a bank i when the absolute value of residual of the regression 휀𝑖 is relatively
high.
2. Degree of earnings management
We build on an empirical panel specification that is close to those in Greenawalt and
Sinkey (1988), Bikker and Metzemakers (2005), Anandarajan et al. (2007) and
Bouvatier et al. (2014) to measure the degree of earning management:

41
𝐿𝐿𝑃𝑖𝑗,𝑡 = 𝛼0 + 𝛽1𝐿𝐿𝑃𝑖𝑗,𝑡−1 + 𝛽2𝐿𝑜𝑎𝑛𝑖𝑗,𝑡 + 𝛽3𝑁𝐿 𝑔𝑟𝑜𝑤𝑡ℎ𝑖𝑗,𝑡 + 𝛽4𝐺𝐷𝑃 𝑔𝑟𝑜𝑤𝑡ℎ𝑗,𝑡
+ 𝛽5𝐶𝑂𝑀𝑖𝑗,𝑡 + 𝛽6𝐸𝑅𝑖𝑗,𝑡 + 𝛽7𝑆𝐼𝐺𝑁𝑖𝑗,𝑡 + 𝛽8𝐸𝑇𝐴𝑖𝑗,𝑡−1 + 𝛼𝑡
+ 휀𝑖𝑗,𝑡 (𝐴2)
where LLPij,t is the ratio of loan loss provision to total assets.
The non-discretionary component represents loan loss provisions made to cover
expected credit losses. In our specification it is identified by Loanij,t the ratio of net loan
to total assets, NL growthij,t the net loan growth, COMij,t the ratio of commission and
fee income to total assets and GDPgrowthjt the growth rate of gross domestic product.
The earnings management results from two different management objectives. Banks
can use their loan loss provisions (LLP) to smooth their income; banks understate
(overstate) LLP when earnings are expected to be low (high) relative to that of other
years (inter-temporal smoothing). If banks use LLP to smooth earnings, then we would
expect a significantly positive relation between earnings before taxes and loan loss
provisions ER/TAij,t and LLP. Banks can also use LLP to signal their financial strength.
If signaling is an important incentive in choosing LLP, then we should observe a
significantly positive relation between LLP and changes in future earnings before taxes
and LLP, with SIGNij,t defined as ((ERit+1 − ERit)/0.5(TAi,t + TAi,t+1)). We also control
for a possible capital management behavior, even if scope for such behavior is more
limited since Basel 1 and even more so under Basel 2. Banks with low regulatory capital
could be more inclined to make loan loss provisions to keep their capital ratio adequate.
To control for such behavior, we include the lagged ratio of equity to total assets (ETA
ij,t-1).
We use GMM system estimation to estimate Equation (A2) with forward orthogonal
deviations transformation of the original equation as suggested by Arellano and Bover
(1995) and the two-step estimator including the Windmeijer (2005) finite-sample
correction. We only instrument the lagged dependent variable and assuming the other
explanatory variables are strictly exogenous.
Our results show that European commercial banks use their LLP to smooth their
earnings and signal their financial strength. We then compute our earning management
variable (EM) as follows: EM ij,t = β6ERij,t + β7SIGNij,t.
Related Documents