Do Analysts’ Cash Flow Forecasts Encourage Managers to Improve the Firm’s Cash Flows? Evidence from Tax Planning* BENJAMIN C. AYERS, University of Georgia ANDREW C. CALL, Arizona State University † CASEY M. SCHWAB, Indiana University ABSTRACT Recent research finds that analysts’ cash flow forecasts have meaningful financial reporting ramifications, but, to date, the identified effects are unlikely to yield meaningful cash flow benefits. This study examines whether analysts’ cash flow forecasts encourage managers to enhance the firm’s cash flow position through tax avoidance activities. We evaluate the change in cash tax avoidance after analysts begin issuing cash flow forecasts relative to a propensity score matched control sample of firms without cash flow forecasts. Consistent with analysts’ cash flow forecasts encouraging tax avoidance that enhances the firm’s cash flow health, we find a negative association between cash tax payments and analysts’ cash flow coverage. Additional analysis suggests this association is driven primarily by strategies to permanently avoid rather than to temporarily defer tax payments and that increased cash tax avoidance activity represents a nontrivial component of the overall increase in reported operating cash flows after the initiation of analysts’ cash flow coverage. Les pr evisions de tr esorerie des analystes encouragent-elles les gestionnaires a am eliorer la position de tr esorerie de l’entreprise ? Donn ees tir ees de la planification fiscale R ESUM E Les travaux de recherche r ecents r eve `lent que les pr evisions de tr esorerie des analystes ont d’importantes r epercussions sur l’information financie `re; jusqu’ a maintenant, cependant, les incidences relev ees sont peu susceptibles d’entra ^ ıner des avantages appr eciables au chapitre de la tr esorerie. Les auteurs se demandent si les pr evisions de tr esorerie des analystes encouragent les gestionnaires a am eliorer la position de tr esorerie de l’entreprise en recourant a des mesures d’ evitement des d ecaissements relatifs a l’imp^ ot. Ils evaluent l’ evolution du comportement d’ evitement fiscal une fois que les analystes ont commenc e a produire des pr evisions de tr esorerie par rapport a un echantillon de contr^ ole constitu e d’entreprises a l’ egard desquelles les analystes ne produisent pas de pr evisions de tr esorerie, s electionn ees selon la m ethode de l’appariement des coefficients de propension. Conform ement a l’id ee selon laquelle les * Accepted by Partha Mohanram. Ayers gratefully acknowledges the support of the Terry College of Business and the J. M. Tull School of Accounting; Call gratefully acknowledges the support of the W. P. Carey School of Business; and Schwab gratefully acknowledges the support of the Kelley School of Business. This paper has benefited from helpful comments from John Campbell, Margaret Christ, Stacie Laplante, Rick Laux, Steve Utke, workshop partici- pants at Arizona State University, Temple University, the University of Iowa Tax Readings Group, the University of Texas Capital Markets Readings Group, and participants in the Journal of the American Taxation Association Conference. † Corresponding author. Contemporary Accounting Research Vol. 35 No. 2 (Summer 2018) pp. 767–793 V C CAAA doi:10.1111/1911-3846.12403

Welcome message from author
This document is posted to help you gain knowledge. Please leave a comment to let me know what you think about it! Share it to your friends and learn new things together.
Transcript

Do Analysts’ Cash Flow Forecasts Encourage Managers to Improve
the Firm’s Cash Flows? Evidence from Tax Planning*
BENJAMIN C. AYERS, University of Georgia
ANDREW C. CALL, Arizona State University†
CASEY M. SCHWAB, Indiana University
ABSTRACT
Recent research finds that analysts’ cash flow forecasts have meaningful financial reporting
ramifications, but, to date, the identified effects are unlikely to yield meaningful cash flow
benefits. This study examines whether analysts’ cash flow forecasts encourage managers to
enhance the firm’s cash flow position through tax avoidance activities. We evaluate the change
in cash tax avoidance after analysts begin issuing cash flow forecasts relative to a propensity
score matched control sample of firms without cash flow forecasts. Consistent with analysts’
cash flow forecasts encouraging tax avoidance that enhances the firm’s cash flow health, we find
a negative association between cash tax payments and analysts’ cash flow coverage. Additional
analysis suggests this association is driven primarily by strategies to permanently avoid rather
than to temporarily defer tax payments and that increased cash tax avoidance activity represents
a nontrivial component of the overall increase in reported operating cash flows after the
initiation of analysts’ cash flow coverage.
Les pr�evisions de tr�esorerie des analystes encouragent-elles les
gestionnaires �a am�eliorer la position de tr�esorerie de l’entreprise ?
Donn�ees tir�ees de la planification fiscale
R�ESUM�E
Les travaux de recherche r�ecents r�evelent que les pr�evisions de tr�esorerie des analystes ont
d’importantes r�epercussions sur l’information financiere; jusqu’�a maintenant, cependant, les
incidences relev�ees sont peu susceptibles d’entraıner des avantages appr�eciables au chapitre de la
tr�esorerie. Les auteurs se demandent si les pr�evisions de tr�esorerie des analystes encouragent les
gestionnaires �a am�eliorer la position de tr�esorerie de l’entreprise en recourant �a des mesures
d’�evitement des d�ecaissements relatifs �a l’impot. Ils �evaluent l’�evolution du comportement
d’�evitement fiscal une fois que les analystes ont commenc�e �a produire des pr�evisions de
tr�esorerie par rapport �a un �echantillon de controle constitu�e d’entreprises �a l’�egard desquelles les
analystes ne produisent pas de pr�evisions de tr�esorerie, s�electionn�ees selon la m�ethode de
l’appariement des coefficients de propension. Conform�ement �a l’id�ee selon laquelle les
* Accepted by Partha Mohanram. Ayers gratefully acknowledges the support of the Terry College of Business and the
J. M. Tull School of Accounting; Call gratefully acknowledges the support of the W. P. Carey School of Business;
and Schwab gratefully acknowledges the support of the Kelley School of Business. This paper has benefited from
helpful comments from John Campbell, Margaret Christ, Stacie Laplante, Rick Laux, Steve Utke, workshop partici-
pants at Arizona State University, Temple University, the University of Iowa Tax Readings Group, the University
of Texas Capital Markets Readings Group, and participants in the Journal of the American Taxation Association
Conference.
† Corresponding author.
Contemporary Accounting Research Vol. 35 No. 2 (Summer 2018) pp. 767–793 VC CAAA
doi:10.1111/1911-3846.12403

pr�evisions de tr�esorerie des analystes encouragent les activit�es d’�evitement fiscal propres �aam�eliorer la sant�e de la tr�esorerie de l’entreprise, les auteurs notent l’existence d’un lien n�egatif
entre les d�ecaissements relatifs �a l’impot et la couverture des flux de tr�esorerie par les analystes.
Une analyse suppl�ementaire semble indiquer que ce lien repose principalement sur des strat�egies
visant �a �eviter de facon permanente, plutot qu’�a reporter temporairement, les d�ecaissements
relatifs �a l’impot, et que l’intensification des activit�es d’�evitement des d�ecaissements relatifs �al’impot constitue un �el�ement non n�egligeable de la hausse globale des flux de tr�esorerie li�es �al’exploitation observ�ee apres le d�ebut de la couverture des flux de tr�esorerie par les analystes.
1. Introduction
Recent research finds that analysts’ cash flow forecasts have meaningful financial reporting
ramifications. McInnis and Collins (2011) find that when a firm’s analysts begin issuing
cash flow forecasts, the quality of the firm’s reported accruals improves and the probability
of meeting or beating earnings benchmarks declines. Lee (2012) finds that firms with cash
flow forecasts are more likely to alter the classification of cash flows within the cash flow
statement and to strategically time certain short-term transactions (i.e., delay payments to
suppliers or accelerate collections from customers in the fourth quarter) in an effort to
enhance year-end reported operating cash flows. While analysts’ cash flow forecasts have
been shown to elicit certain financial reporting responses, these responses are unlikely to
have a meaningful effect on the firm’s long-term cash flow health. Specifically, altering the
classification of cash flows within the cash flow statement has no direct cash flow conse-
quence, and delaying payments to suppliers from the fourth quarter of one year to the first
quarter of the following year is unlikely to yield meaningful cash flow benefits. In this
study, we examine whether cash flow forecasts affect managerial efforts to improve the
firm’s cash flow health. Specifically, we examine the association between analysts’ cash
flow forecasts and cash tax avoidance.
Tax avoidance is a particularly useful setting to investigate whether cash flow forecasts
impact managerial actions to improve the firm’s cash flow position for several reasons. First,
tax avoidance strategies are usually long-term in nature, either permanently avoiding taxes or
deferring the payment of taxes for several years. As a result, the cash savings from tax
avoidance can be substantial, especially relative to the modest savings that result from defer-
ring payments for only one quarter (or less). Second, while other alternatives to improving
the firm’s cash flows (e.g., reducing advertising or research and development expenditures)
may yield short-term improvements in the firm’s cash position, they can also reduce firm
value and have a negative impact on the firm’s long-term cash flows (Roychowdhury 2006),
issues less likely to plague firms that improve their cash position through tax avoidance.
Third, the accounting for income taxes allows us to identify a firm’s cash tax payments,
total tax expense, and the portion of the current year’s total tax expense that is being
deferred until subsequent years. This allows us to more cleanly measure the extent to which
the firm defers or permanently avoids tax payments, something that is much more difficult
to quantify with the avoidance of non-tax payments.
Finally, linking cash flow forecasts to cash tax avoidance is of particular interest given
recent research (Graham et al. 2014; Robinson et al. 2010) and anecdotal evidence that man-
agers focus on tax avoidance that reduces financial statement tax expense, with only a sec-
ondary interest in tax avoidance that only enhances cash flows (i.e., that reduces cash taxes
paid). Accordingly, this is a particularly interesting setting to test whether cash flow fore-
casts alter managerial behavior with respect to the firm’s cash flow position.
Prior research posits that analysts’ cash flow forecasts create an alternative focal point
that demands managers’ attention (Lee 2012), encouraging actions that improve the firm’s
768 Contemporary Accounting Research
CAR Vol. 35 No. 2 (Summer 2018)

reported cash flows. In addition, Call (2009) finds that investors assign relatively more
weight to operating cash flows after the initiation of analysts’ cash flow coverage than in
the period before analysts begin forecasting cash flows. As a result, when analysts begin
issuing cash flow forecasts, managers have increased incentives to improve the firm’s operat-
ing cash flow position, and the net benefits of engaging in activities that avoid cash tax pay-
ments increases. Accordingly, we contend that, ceteris paribus, cash flow forecasts encourage
increased tax avoidance that enhances the firm’s cash flow position.
To investigate our hypothesis, we employ a difference-in-differences design and identify
a sample of firms for which analysts begin providing cash flow forecasts and a propensity
score matched control sample of firms without cash flow forecasts. The matched sample
controls for the fact that (a) the initiation of analysts’ cash flow coverage is not an exoge-
nous event, and (b) tax avoidance activity associated with cash flow forecasts could arise
from the same underlying economic forces associated with the issuance of cash flow fore-
casts. Our primary measure of cash tax avoidance is the firm’s cash tax payment scaled by
the number of common shares outstanding. We test whether firms in our cash flow forecast
sample increase cash tax avoidance (i.e., reduce cash tax payments) in the three years fol-
lowing the initiation of analysts’ cash flow coverage relative to the three years before ana-
lysts began issuing cash flow forecasts. We compare this change in cash tax avoidance to
the corresponding change for the propensity score matched control sample, controlling for
factors associated with either the initiation of analysts’ cash flow coverage or tax avoidance
activity. These controls ensure that any changes in tax planning are not attributable to cross-
sectional differences in the determinants of analysts’ cash flow coverage or to cross-sectional
differences in other determinants of tax planning.
Consistent with cash flow forecasts encouraging increased tax avoidance that enhances
cash flows, we find that analysts’ cash flow coverage is negatively associated with cash tax
payments. In terms of economic magnitude, our findings suggest that relative to the propen-
sity score matched control sample, cash flow forecast firms experience an 8.2 cent reduction
in cash tax payments per share after analysts begin issuing cash flow forecasts for the firm
(after controlling for other determinants of tax avoidance and cash flow coverage), which
equates to approximately $35.4 million less in cash taxes paid over the three-year period fol-
lowing the initiation of analysts’ cash flow coverage for the average firm in our sample.
We investigate the relation between cash flow forecasts and cash tax avoidance in more
detail by separately analyzing cash tax avoidance attributable to permanent tax planning
strategies and tax deferral strategies. Investigating permanent tax planning and tax deferral
separately provides insight into the types of tax strategies managers pursue when faced with
increased incentives to engage in cash tax planning. While both permanent and deferral strat-
egies have the potential to reduce the firm’s cash tax payments and yield meaningful cash
flow benefits, all else equal, managers face stronger incentives to engage in permanent tax
avoidance activities because they result in tax-related cash flows that are less likely to
reverse. Consistent with increased incentives to invest in permanent tax planning strategies,
we find that, relative to the propensity score matched control sample, firms engage in more
permanent tax avoidance activities following the initiation of cash flow forecast coverage.
This finding further suggests analysts’ cash flow coverage encourages managers to engage in
tax planning activities that meaningfully improve the firm’s cash flow health.
To triangulate our results, we examine the change in reported operating cash flows after
analysts begin issuing cash flow forecasts. While both profit and loss firms reduce cash tax
payments after analysts begin cash flow coverage, we find that only profitable firms report
increased operating cash flows during this period. This increase in reported operating cash
flows is (i) unique to cash flow forecast firms (i.e., it is not found for the propensity score
matched control firms), and (ii) not explained by other determinants of reported operating
Analysts’ Forecasts and Tax Planning 769
CAR Vol. 35 No. 2 (Summer 2018)

cash flows or by the determinants of analysts’ cash flow coverage. Further, for these profit-
able firms, the cash savings resulting from increased tax avoidance is responsible for approx-
imately 56 percent of the increase in reported operating cash flows. Together, these results
suggest that analysts’ cash flow forecasts encourage managers to engage in activities that
enhance cash flows and that tax avoidance activities that improve the firm’s cash flow health
represent an economically meaningful portion of this increase.
This study makes several contributions to the literature. First, we provide insight into
real cash flow effects of analysts’ cash flow forecasts. Specifically, we find an economically
significant relation between cash flow forecasts and tax avoidance that suggests cash flow
forecasts encourage managers to focus on activities that significantly enhance the firm’s
long-term cash position. While prior research suggests cash flow forecasts impact financial
reporting behavior, we document benefits to the firm’s underlying cash flow health as a
result of analysts’ cash flow forecasting activities.
Second, the forecasting literature documents various benefits to firms of analyst coverage
and their forecasting activities, including a reduction in information asymmetry between
insiders and outsiders (Frankel and Li 2004), a reduction in the cost of capital (Easley and
O’Hara 2004), and increased external monitoring to reduce earnings management (Yu 2008).
We add to this literature by documenting that analysts’ cash flow forecasts encourage firms
to avoid or reduce cash tax payments. Given recent evidence that suggests tax planning
enhances firm value (Mills et al. 1998; Desai and Dharmapala 2009; Wilson 2009; De
Simone and Stomberg 2013; Goh et al. 2013), our findings suggest a potential benefit to
firms of analysts’ cash flow coverage.
We also add to the literature that documents the effect of firm monitors on tax
avoidance. McGuire et al. (2012) find that auditor expertise can affect a firm’s tax avoid-
ance, while Cheng et al. (2012) document that firms targeted by hedge funds experience
an increase in tax avoidance activity. We complement these findings by showing that
sell-side analysts also play a role in helping firms maximize their tax avoidance
opportunities.
Finally, this study sheds light on the determinants of tax avoidance, incentives affecting
the type of tax avoidance, and the role that an alternative performance metric plays in man-
agers’ attention to tax planning. Given the conclusions of prior research that firms “under-
shelter” their income (Weisbach 2002) and focus on total tax expense reported in the finan-
cial statements (instead of cash taxes paid), our evidence suggests one mitigating factor to
the somewhat puzzling behavior documented in prior research.
2. Prior research and hypothesis development
Analysts’ cash flow forecasts
Academic research on analysts’ cash flow forecasts began with DeFond and Hung’s (2003)
analysis of the market demand for cash flow information.1 They hypothesize that market par-
ticipants demand supplemental cash flow information when earnings are difficult to interpret
and when cash flows are particularly relevant in assessing firm viability. They find results
consistent with these hypotheses, suggesting analysts respond to market demand by providing
cash flow forecasts for firms exhibiting these characteristics.
In recent years, the literature on analysts’ cash flow forecasts has explored a variety of
issues related to analysts’ cash flow forecasting activities. These topics include country-level
1. Similar to the adjustments analysts make when forecasting earnings, they make adjustments to their cash flow
estimates to produce a forecast that is most relevant to the firm in question (Call et al. 2013). Similar to what is
done when reporting actual earnings, I/B/E/S defines the actual cash flow value based on the exclusions made
by the majority of analysts following the firm (Givoly et al. 2009).
770 Contemporary Accounting Research
CAR Vol. 35 No. 2 (Summer 2018)

institutional factors that predict the incidence of analysts’ cash flow forecasts (DeFond and
Hung 2007), analyst-level determinants of cash flow forecast issuance (Ertimur and Stubben
2005), the market pricing of cash flow surprises (Brown et al. 2013), the effect of analysts’
cash flow forecasts on the pricing of operating cash flows (Call 2009) and on market effi-
ciency (Mohanram 2014; Radhakrishnan and Wu 2014), the benefit of forecasting cash flows
on analysts’ earnings forecasts and on analyst turnover (Call et al. 2009; Pandit et al. 2012),
and the underlying quality of analysts’ cash flow forecasts (Givoly et al. 2009; Call et al.
2013).
The studies most relevant to ours are those that explore changes in managers’ financial
reporting behavior when analysts issue cash flow forecasts. McInnis and Collins (2011) argue
that when analysts supplement their earnings forecast with a cash flow forecast, they also
implicitly provide a forecast of accruals. They contend that this implicit accrual forecast
makes accrual manipulations more transparent, constraining managers’ accrual-based earnings
management. Consistent with this hypothesis, they find that after analysts start forecasting
cash flows for the firm, accrual quality improves and the probability of meeting or beating
analysts’ earnings expectations declines.
Lee (2012) argues that managers inflate reported operating cash flows when analysts
issue cash flow forecasts for the firm. Specifically, she finds that firms with cash flow fore-
casts are more likely than other firms to file a restatement that decreases operating cash
flows, suggesting cash flow forecasts create incentives for managers to opportunistically mis-
classify the firm’s cash flows to inflate reported operating cash flows. Similarly, although
prior to July 2000 GAAP allowed firms to classify the tax benefit of stock options as either
an operating, investing, or financing cash flow, Lee (2012) finds that firms whose analysts
issued cash flow forecasts were more likely to classify this cash inflow as an operating cash
flow. These findings are consistent with analysts’ cash flow forecasts encouraging managers
to opportunistically classify the firm’s cash flows in an effort to inflate reported operating
cash flows.
In addition to documenting the opportunistic classification of cash flows, Lee (2012)
also finds that managers are more likely to strategically time certain short-term transactions
that enhance reported cash flows when analysts issue cash flow forecasts for the firm. Spe-
cifically, she finds that managers delay payments in the fourth quarter (e.g., deferring cash
payments from the fourth quarter of one year to the first quarter of the following year) and
accelerate fourth quarter cash receipts (e.g., shifting cash receipts from the first quarter of
the following year to the fourth quarter of the current year) in an effort to report inflated
year-end operating cash flows.
In general, both McInnis and Collins (2011) and Lee (2012) provide evidence that ana-
lysts’ cash flow forecasts encourage managerial behavior that has a meaningful impact on
reported earnings and reported cash flows. While these studies find evidence that analysts’
cash flow forecasts affect managerial reporting choices, they do not speak to the effect of
cash flow forecasts on the firm’s underlying cash flow health.2 For example, neither a reduc-
tion in accrual-based earnings management nor misclassifications within the statement of
cash flows directly affect the firm’s cash flow position. Similarly, while Lee (2012) docu-
ments that cash flow forecasts encourage firms to delay certain cash payments (e.g., pay-
ments to suppliers), she finds that these deferrals reverse the next quarter. As such, while
these short-term activities may yield a desired financial reporting outcome at the end of the
2. McInnis and Collins (2011) also examine whether analysts’ cash flow forecasts encourage managers to engage
in more real (i.e., non-accrual) transactions to manage earnings. However, they do not examine whether manag-
ers attempt to increase cash flows following analysts’ initiation of cash flow coverage.
Analysts’ Forecasts and Tax Planning 771
CAR Vol. 35 No. 2 (Summer 2018)

fourth quarter, they are unlikely to yield any meaningful cash flow benefit to the firm.3 The
purpose of this study is to examine the effect of analysts’ cash flow forecasts on managerial
efforts to enhance the firm’s cash flow position.
Tax avoidance
Tax avoidance is a particularly useful setting to evaluate managerial efforts to enhance cash
flows for four reasons. First, tax avoidance strategies are often long-term in nature, either
permanently avoiding or deferring the payment of taxes to future years. Tax planning strate-
gies that permanently avoid tax payments include investing in tax-exempt municipal bonds
and maximizing potential research and development credits and IRC section 199 deductions.
Strategies that defer tax payments include cost-segregation studies, writing down damaged
or obsolete inventory, and accelerating deductions for fixed assets, the medical portion of
workers’ compensation, bad debts, or accrued compensation.4 The cash savings from tax
avoidance can be substantial, especially relative to the modest savings that result from
deferring payments for only one quarter (or less). Indeed, in their study of investments in
tax planning, Mills et al. (1998) estimate an average return of approximately $4 for each
$1 invested in tax planning. Likewise, Wilson (2009) estimates an average return of approx-
imately $12 for each $1 in fees paid related to tax shelters (ignoring any associated in-
house costs).
Second, although managers seeking to improve the firm’s cash position have many
options, tax avoidance is a relatively appealing choice because improvements in tax avoid-
ance generally do not interfere with the firm’s day-to-day operations. Other “real” activities
the firm could employ to improve cash flows, such as reductions in advertising budgets,
scaling back research and development expenditures, and delaying capital expenditures, can
actually reduce firm value and impair the firm’s long-term cash flows (Roychowdhury
2006).
Third, the accounting for income taxes allows us to identify a firm’s cash tax payments,
total tax expense, and the portion of the current year’s total tax expense that is being
deferred to subsequent years. This allows us to more cleanly measure the extent to which
the firm defers or permanently avoids tax payments, something that is more difficult to
quantify with the deferral of non-tax payments.
Finally, as Edwards et al. (2016) discuss, recent research (Graham et al. 2014; Arm-
strong et al. 2012; Robinson et al. 2010) suggests that when managers engage in tax avoid-
ance, they tend to focus on strategies that reduce financial statement tax expense, with only
a secondary interest in tax avoidance that enhances cash flows (i.e., reduces cash taxes
paid). The evidence suggests that managers focus on tax planning strategies with a direct
impact on earnings, not cash, likely because earnings are their main focal point.
Hypothesized relation between analysts’ cash flow forecasts and cash tax avoidance
We hypothesize that managers are more likely to engage in additional tax avoidance activi-
ties after analysts begin forecasting cash flows for two possible reasons. First, prior research
suggests that some managers may not have exhausted all positive net present value (NPV)
tax avoidance strategies prior to the initiation of analysts’ cash flow coverage. For example,
Cheng et al. (2012) find that firms targeted by hedge fund activists exhibit significant
increases in tax avoidance activity after the hedge fund intervention, and McGuire et al.
3. Short-term efforts to boost year-end cash flows can actually put the firm in a worse cash flow position. For
example, managers can improve reported cash flows at year-end by factoring the firm’s receivables.
4. Because different firms likely employ different tax avoidance strategies, it is difficult to identify a particular
strategy that is employed by firms whose analysts issue cash flow forecasts. As a result, we focus on measures
of tax avoidance that aggregate the impact of all permanent and deferral strategies.
772 Contemporary Accounting Research
CAR Vol. 35 No. 2 (Summer 2018)

(2012) find the tax expertise of the external auditor influences the tax avoidance activity of
the client firm. The results of both studies suggest that some firms leave tax savings on the
table and have not exhausted all tax avoidance opportunities.5 For these firms, we argue that
analysts’ added focus on cash flows encourages managers to exert additional effort to engage
in tax avoidance strategies.
Second, findings in prior research suggest that all firms—including those that were
already optimizing their tax avoidance activities—likely experience an increase in the net
benefits associated with cash inflows (e.g., cash tax savings) following the initiation of ana-
lysts’ cash flow coverage because (i) analyst coverage plays a valuable monitoring role in
scrutinizing managerial behavior, and (ii) analysts’ forecasts provide public signals of future
firm performance to the market. The increased monitoring results in a reduction in agency
costs and, particularly germane to our study, increases the marginal value of cash holdings
(Chen et al. 2015). Moreover, the additional signal of firm performance (i.e., the cash flow
forecast) reduces information asymmetry (Kelly and Ljungvist 2012; Li and You 2015),
which also increases the marginal value of cash holdings (Drobetz et al. 2010). In our set-
ting, the increasing marginal value of cash suggests that, holding constant the costs of tax
avoidance, managers have greater incentive to generate cash tax savings following the initia-
tion of cash flow forecasts.6 Accordingly, we predict that the initiation of analysts’ cash
flow coverage is associated with increased cash tax avoidance.
While we argue that analysts’ cash flow forecasts increase the benefits associated with
tax planning without increasing the costs of tax planning, we acknowledge that there are
costs of tax planning which may offset some or all of the incremental benefits of engaging
in additional tax planning. These costs include implementation, reputational, and agency
costs, and—for tax strategies that are not easily reversible—a loss in “managerial flexibility.”
Accordingly, whether the incremental benefits of engaging in additional tax avoidance fol-
lowing the initiation of analysts’ cash flow coverage exceed the costs of doing so is an
empirical question.7
3. Sample and research design
Sample
Table 1 details our sample selection criteria. We begin with all firms on the I/B/E/S detail
file for which analysts issue an annual EPS forecast from 1993 through 2010.8 We eliminate
firm-year observations without COMPUSTAT data needed to calculate the tax and account-
ing variables required in our empirical tests.9 Because our primary analyses rely on a pro-
pensity score matched sample (which is described in the following section), we eliminate
5. Armstrong et al. (2012), Graham et al. (2014), and Leone (2008) provide additional empirical and anecdotal evi-
dence that firms do not exhaust all tax avoidance opportunities.
6. Our assertion that analysts’ cash flow coverage plays a monitoring role and reduces information asymmetry is
consistent with evidence provided in prior studies suggesting that the initiation of analysts’ cash flow coverage
reduces earnings management (McInnis and Collins 2011), increases the value relevance of cash flows (Call
2009), and results in reported cash flows that are more predictive of future cash flows (Call 2009). Framing
these arguments in terms of a firm’s cost of capital yields similar predictions. Specifically, reductions in agency
costs and information asymmetry reduce a firm’s cost of capital (Bowen et al. 2008; Bradley et al. 2014; Kelly
and Ljungvist 2012; Li and You 2015), which results in some investments (e.g., tax strategies) that were nega-
tive NPV projects prior to the reduction in cost of capital becoming positive NPV projects.
7. We do not examine the incentive to meet-or-beat analysts’ cash flow forecasts (Brown et al. 2013), or whether
optimistic vs. pessimistic cash flow forecasts are more likely to encourage tax avoidance.
8. During our sample period, 17 percent of analysts issued at least one annual cash flow forecast for a firm they fol-
low. Among these analysts, the average analyst issues cash flow forecasts for 64 percent of his/her covered firms.
9. In untabulated tests, we also eliminate financial and utility firms, and our empirical results are unchanged.
Analysts’ Forecasts and Tax Planning 773
CAR Vol. 35 No. 2 (Summer 2018)

firm-year observations without data needed to compute the selection model variables and,
thus, the propensity scores. Consistent with Mohanram (2014), we only retain cash flow
forecast firms and their matched control firms if they are reasonable matches (i.e., their pro-
pensity scores differ by no more than 10 percent). For the matched firms, we retain firm-
year observations during the three years prior to and the three years after analysts’ initial
cash flow forecast for the firm, thereby eliminating firm-year observations that do not fall in
this window. This yields a final sample of 7,353 firm-year observations across the cash flow
forecast and control samples.
Research design
To empirically test our hypothesis that analysts’ cash flow forecasts encourage tax avoid-
ance, we examine changes in tax avoidance around the initiation of analysts’ cash flow cov-
erage. For each firm with a cash flow forecast, we identify the first year analysts issue cash
flow forecasts for the firm. This year and the following two years constitute the “post” sub-
sample. The three years prior to the first cash flow forecast constitute the “pre” subsample.10
We predict that firms with cash flow forecasts engage in more tax avoidance activity in the
“post” period than in the “pre” period. The choice of three-year windows (e.g., three years
before and three years after the initiation of analysts’ cash flow coverage) is consistent with
prior research (McInnis and Collins 2011) and allows us to capture tax avoidance strategies
that take more than one year to implement and take effect. The three-year window also
makes it unlikely that one-time tax fluctuations due to IRS settlements or payments or from
time-specific macroeconomic events (Edwards et al. 2016) would unduly influence our
analyses.
However, we note that analysts do not issue cash flow forecasts for a random set of
firms. Rather, these firms differ from firms without cash flow forecasts in predictable ways,
as documented by DeFond and Hung (2003). It is therefore possible that tax avoidance
activity is associated with firm characteristics that predict analysts’ cash flow coverage and
not with the cash flow forecasts themselves. In addition, the provision of cash flow forecasts
has increased through the years. As a result, any evidence that cash flow forecasts are
TABLE 1
Sample selection
Data restrictions N
Starting I/B/E/S sample 67,787
Less:
Firm-years missing tax measures 212,156
Firm-years missing control variables 0
Firm-years missing selection model variables 228,021
Post-forecast firm-years for firms without continuous cash flow forecasts 24,671
Subsample used to estimate propensity scores 22,939
Less:
Firm-year observations outside of the matched sample window 213,773
Firm-year control observations with a cash flow forecast 2478
Firm-year observations without quality match 21,335
Propensity score matched sample (DV 5 TXPD/CSHO) 7,353
10. If analysts do not issue a cash flow forecast for a firm in any year during the “post” subsample (e.g., either one
or two years after the initial cash flow forecast), we omit these firm-year observations from the analysis.
774 Contemporary Accounting Research
CAR Vol. 35 No. 2 (Summer 2018)

associated with an increase in tax avoidance could simply represent an increase in tax avoid-
ance in recent years.
To overcome these concerns and to provide more robust evidence on the effect of ana-
lysts’ cash flow forecasts on cash tax avoidance, we compare changes in tax avoidance
activity of firms whose analysts initiate cash flow coverage to that of a propensity score
matched control sample. The primary benefit of using a control sample matched on propen-
sity scores is that it allows us to compare firms with analysts’ cash flow forecasts to a set
of firms without cash flow forecasts but that are similar on important observable dimensions
associated with the likelihood of analyst cash flow coverage and cash tax planning, allowing
us to more clearly attribute any increase in tax avoidance to analysts’ initiation of cash flow
coverage.
To identify the propensity score matched control sample, we follow Armstrong et al.
(2010) and estimate the following model as a function of the determinants of the treatment
effect (i.e., analysts’ cash flow coverage) and the outcome effect (i.e., cash tax planning) for
all firms in the I/B/E/S database with available data:11
Prob CFFit5 1ð Þ5 c01X6
k51ckCFF Determinantskit
1X14
k57ckTaxPlanning Determinantskit1Eit: (1Þ
where CFFit is an indicator variable equal to one if firm i has a cash flow forecast in year
t, and zero otherwise; CFF_Determinantskit is a vector of variables previously shown to be
associated with analysts’ cash flow coverage (DeFond and Hung 2003; McInnis and Collins
2011); TaxPlanning_Determinantskit is a vector of variables expected to be associated with
tax planning. We briefly discuss these variables below and provide detailed variable defini-
tions in the Appendix. We winsorize all continuous variables at the 1 percent and 99 percent
levels.
Determinants of analysts’ cash flow forecast coverageSize: We control for firm size (Sizeit21) because DeFond and Hung (2003) find that
firm size is positively correlated with analysts’ cash flow coverage.
Capital intensity: We control for capital intensity (CapIntit21) because capital-intensive
firms are more reliant on operating cash flows to maintain and replace fixed assets, and their
ability to demonstrate internally generated cash flows is therefore more relevant for these
firms.
Financial health: We control for financial health (Healthit21) because for firms facing
solvency or liquidity concerns, operating cash flows become an important measure of
whether the firm will be able to continue as a going concern.
Absolute accruals: We control for the absolute value of firm i’s total accruals in year
t 2 1 (AbsAccit21) because cash flows are useful in validating earnings information when
earnings contain a large accrual component and the risk of misstatement is high (Penman
2001).
Earnings volatility: We control for the volatility of firm i’s earnings (Volit21) because
operating cash flows become a relatively more important metric when earnings are volatile.
Heterogeneity of accounting choice: We control for the heterogeneity of accounting
choice (Heteroit21) because earnings comparability is impaired and operating cash flows
11. Armstrong et al. (2010) point out that matching on the determinants of the outcome effect (as well as the deter-
minants of the treatment effect) relaxes the assumption of a constant functional relationship between control
variables and the outcome effect.
Analysts’ Forecasts and Tax Planning 775
CAR Vol. 35 No. 2 (Summer 2018)

become more important when firms elect accounting methods that differ from those used by
peer firms.
Determinants of tax planningReturn on assets: We control for pre-tax return on assets (ROAit) because more profit-
able firms generally exhibit fewer tax shields and therefore higher tax payments.12
Leverage: We control for leverage (Levit) because debt provides an important tax shield
(Graham 1996; Mills and Newberry 2004; Newberry 1998) and, for multinationals, the flexi-
bility to place debt in high-tax locations (Newberry and Dhaliwal 2001).
Intellectual property: Intellectual property, such as patents and brand intangibles,
increases opportunities for income shifting and permanent tax avoidance. As such, we control
for R&D expenditures (R&Dit) and expect them to be negatively related to tax payments.
Foreign operations: We control for the firm’s foreign operations (Foreignit) because an
extensive literature establishes that taxpayers respond to tax incentives to place income in
low-tax jurisdictions.
Net operating loss (NOL): We include an indicator variable (NOLit) for the presence of
NOL carryforwards and expect that firms with NOLs have lower cash tax payments.13
Inventory intensity: We control for inventory intensity (InvIntit) because firms with
larger inventories often have fewer tax planning opportunities.
Growth: We include the book-to-market ratio (BMit) to control for growth to account for
tax planning opportunities that vary with firm growth.
Discretionary accruals: We include discretionary accruals (DiscAccit) as a control for
earnings quality (Kothari et al. 2005). If firms that exhibit lower quality financial earnings
are more tax aggressive (Frank et al. 2009; Wilson 2009; Lisowsky 2010), we expect Dis-cAccit to be negatively related to cash tax payments.
We report the results of estimating equation (1) in Table 2. Consistent with expectations,
we find that analysts are more likely to initiate cash flow coverage for larger firms (Sizeit),
firms with larger capital expenditures (CapIntit), firms with solvency or liquidity concerns
(Healthit), more volatile firms (Volit21), and firms with greater heterogeneity in their
accounting choices (Heteroit).14 Note also that many of the coefficients on the TaxPlanning_
Determinantskit are statistically significant, which suggests that including them in the selec-
tion model is appropriate.
After estimating equation (1), we calculate a propensity score for each firm-year obser-
vation, which represents the probability of receiving the treatment effect (a cash flow fore-
cast) conditional on the independent variables included in equation (1). For each firm for
which analysts issue cash flow forecasts, we identify the first year in our sample in which
analysts issue a cash flow forecast for the firm. We then select the firm without a cash flow
forecast with the closest propensity score in the same year and industry and designate this
firm as the matched control firm.15 Requiring the matched control firm to be from the same
fiscal year as the corresponding cash flow forecast firm controls for potential time-series
changes in tax avoidance. Requiring the matched control firm to be from the same industry
12. For these variables, we make no predictions regarding their association with analysts’ cash flow forecast cover-
age, but we anticipate they will be associated with tax planning (i.e., in our second-stage analysis). Note that
TaxPlanning_Determinantskit does not include variables that represent size, capital intensity, or distress because
CFF_Determinantskit includes variables that control for these constructs.
13. Results are similar when we replace NOLit with the magnitude or change in NOLs.
14. When we replace the absolute value of accruals with signed accruals, per McInnis and Collins (2011), our
inferences are unchanged.
15. We follow Mohanram (2014) and require matched control firms to have a propensity score that is within 0.10
of the corresponding cash flow forecast firm.
776 Contemporary Accounting Research
CAR Vol. 35 No. 2 (Summer 2018)

is important given that tax avoidance opportunities vary by industry. We identify exactly
one propensity score matched control firm for each cash flow forecast firm in our sample
and find the propensity scores for the cash flow forecast firms and their matched control
firms are statistically indistinguishable.16 Because significant differences remain in some
individual variables across cash flow forecast and control firms, we include both CFF_Deter-minantskit and TaxPlanning_Determinantskit as control variables in our second-stage regres-
sion (Cram et al. 2009; Armstrong et al. 2010).
For each control firm, we classify the year of the match and the following two years as
the “post” observations and the three years prior to the match as the “pre” observations. In
this way, our treatment (cash flow forecast) and control (no cash flow forecast) firms are
aligned in calendar time and matched on firm characteristics associated with analysts’ deci-
sion to issue cash flow forecasts. While no firm-year observation in the control sample has a
cash flow forecast in the “pre” period (by construction), we remove any firm-year observa-
tion from the control sample if analysts ultimately issue a cash flow forecast for the firm in
the “post” period. Our final cash flow forecast sample consists of 2,063 firm-year observa-
tions in the “post” period and 1,494 firm-year observations in the “pre” period, and the pro-
pensity score matched control sample consists of 1,997 firm-year observations in the “post”
period and 1,799 firm-year observations in the “pre” period.
We compare changes in tax avoidance activity from the “pre” to the “post” period for
the cash flow forecast sample, relative to the corresponding change in tax avoidance activity
for the propensity score matched control sample. To investigate the effect of analysts’ cash
flow forecasts on cash tax avoidance, we estimate the following equation:
TABLE 2
Selection model
Variable Pred. Coefficient p-value
Intercept ? 24.874 <0.001
Sizeit21 1 0.5878 <0.001
CapIntit21 1 0.3392 <0.001
Healthit21 2 20.0225 <0.001
AbsAccit21 ? 0.5939 0.005
Volit21 1 0.0126 <0.001
Heteroit21 1 0.7528 <0.001
ROAit ? 0.1382 0.349
Levit ? 20.3143 0.002
R&Dit ? 21.3632 <0.001
Foreignit ? 2.9575 <0.001
NOLit ? 0.6399 <0.001
InvIntit ? 22.512 <0.001
BMit ? 0.0481 0.249
DiscAccit ? 20.2433 0.244
N 22,939
Pseudo R2 22.9%
Notes: This table reports the logistic regression that is the basis of our propensity scores. See the Appen-
dix for variable definitions.
16. In the match year, the average propensity score for cash flow forecast firms is 0.329, which is insignificantly
different (p-value 5 0.673) from the average propensity score of 0.325 for the control firms, suggesting we
have identified a reasonable control sample.
Analysts’ Forecasts and Tax Planning 777
CAR Vol. 35 No. 2 (Summer 2018)
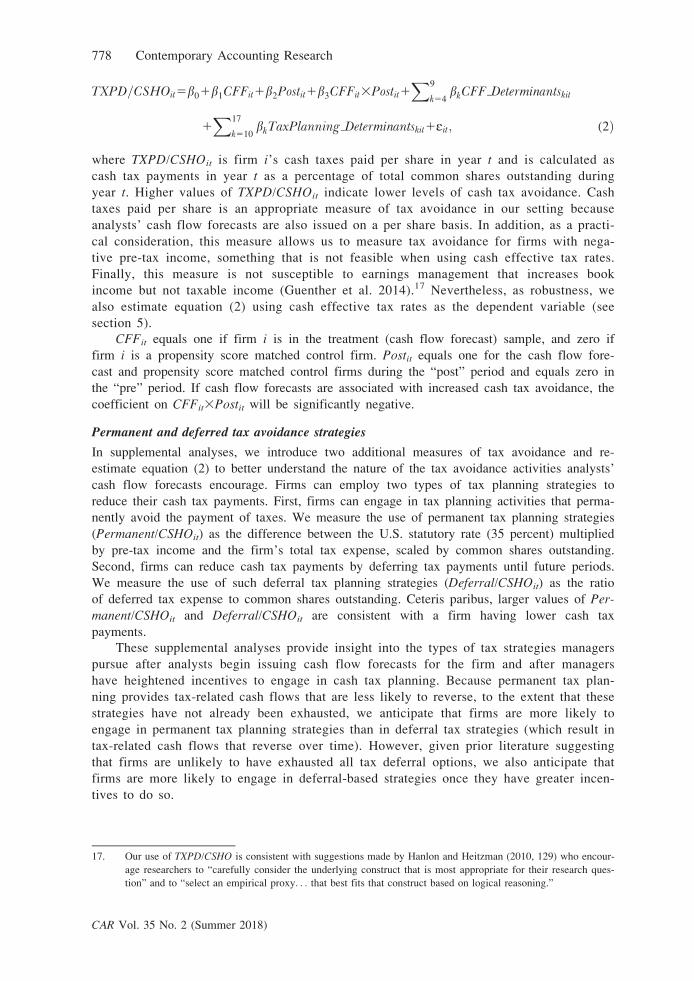
TXPD=CSHOit5b01b1CFFit1b2Postit1b3CFFit3Postit1X9
k54bkCFF Determinantskit
1X17
k510bkTaxPlanning Determinantskit1Eit; (2Þ
where TXPD/CSHOit is firm i’s cash taxes paid per share in year t and is calculated as
cash tax payments in year t as a percentage of total common shares outstanding during
year t. Higher values of TXPD/CSHOit indicate lower levels of cash tax avoidance. Cash
taxes paid per share is an appropriate measure of tax avoidance in our setting because
analysts’ cash flow forecasts are also issued on a per share basis. In addition, as a practi-
cal consideration, this measure allows us to measure tax avoidance for firms with nega-
tive pre-tax income, something that is not feasible when using cash effective tax rates.
Finally, this measure is not susceptible to earnings management that increases book
income but not taxable income (Guenther et al. 2014).17 Nevertheless, as robustness, we
also estimate equation (2) using cash effective tax rates as the dependent variable (see
section 5).
CFFit equals one if firm i is in the treatment (cash flow forecast) sample, and zero if
firm i is a propensity score matched control firm. Postit equals one for the cash flow fore-
cast and propensity score matched control firms during the “post” period and equals zero in
the “pre” period. If cash flow forecasts are associated with increased cash tax avoidance, the
coefficient on CFFit3Postit will be significantly negative.
Permanent and deferred tax avoidance strategies
In supplemental analyses, we introduce two additional measures of tax avoidance and re-
estimate equation (2) to better understand the nature of the tax avoidance activities analysts’
cash flow forecasts encourage. Firms can employ two types of tax planning strategies to
reduce their cash tax payments. First, firms can engage in tax planning activities that perma-
nently avoid the payment of taxes. We measure the use of permanent tax planning strategies
(Permanent/CSHOit) as the difference between the U.S. statutory rate (35 percent) multiplied
by pre-tax income and the firm’s total tax expense, scaled by common shares outstanding.
Second, firms can reduce cash tax payments by deferring tax payments until future periods.
We measure the use of such deferral tax planning strategies (Deferral/CSHOit) as the ratio
of deferred tax expense to common shares outstanding. Ceteris paribus, larger values of Per-manent/CSHOit and Deferral/CSHOit are consistent with a firm having lower cash tax
payments.
These supplemental analyses provide insight into the types of tax strategies managers
pursue after analysts begin issuing cash flow forecasts for the firm and after managers
have heightened incentives to engage in cash tax planning. Because permanent tax plan-
ning provides tax-related cash flows that are less likely to reverse, to the extent that these
strategies have not already been exhausted, we anticipate that firms are more likely to
engage in permanent tax planning strategies than in deferral tax strategies (which result in
tax-related cash flows that reverse over time). However, given prior literature suggesting
that firms are unlikely to have exhausted all tax deferral options, we also anticipate that
firms are more likely to engage in deferral-based strategies once they have greater incen-
tives to do so.
17. Our use of TXPD/CSHO is consistent with suggestions made by Hanlon and Heitzman (2010, 129) who encour-
age researchers to “carefully consider the underlying construct that is most appropriate for their research ques-
tion” and to “select an empirical proxy. . . that best fits that construct based on logical reasoning.”
778 Contemporary Accounting Research
CAR Vol. 35 No. 2 (Summer 2018)

TABLE 3
Descriptive statistics partitioned by pre- and post-cash flow forecast period and cash flow forecast vs.
non-cash flow forecast firm classification
Panel AMeans (CFF firms) Medians (CFF firms)
Pre-CFF Post-CFF Pre-CFF Post-CFFVariable (N 5 1,494) (N 5 2,063) (N 5 1,494) (N 5 2,063)
Cash flow forecast measures
CFF%it 0.000 0.246*** 0.000 0.167***
Tax avoidance measures
TXPD/CSHOit 0.524 0.422*** 0.360 0.231***
Deferral/CSHOit 0.051 0.055 0.005 0.007
Permanent/CSHOit 0.016 0.060*** 20.003 0.015***
CashETRit 0.245 0.221*** 0.251 0.210***
Determinants of cash flow forecasts
Sizeit21 6.407 6.659*** 6.385 6.579***
CapIntit21 0.554 0.630*** 0.385 0.374
Healthit21 5.479 5.131* 3.742 3.542
AbsAccit21 0.077 0.079 0.056 0.061**
Volit21 1.960 2.236* 0.644 0.744***
Heteroit21 0.208 0.224*** 0.250 0.250***
Determinants of tax avoidance
ROAit 0.064 0.056* 0.077 0.067***
Levit 0.215 0.205 0.201 0.186*
R&Dit 0.061 0.061 0.011 0.007***
Foreignit 0.015 0.017 0.000 0.000**
NOLit 0.300 0.392*** 0.000 0.000***
TLCFit 0.089 0.124*** 0.000 0.000***
DTLCFit 0.016 0.018 0.000 0.000**
InvIntit 0.134 0.109*** 0.112 0.077***
BMit 0.473 0.498** 0.389 0.411
AbnAccit 20.010 20.010 20.010 20.009
Additional variables
OCF/ATit 0.094 0.093 0.096 0.094
Cash&Equiv/ATit 0.159 0.175** 0.076 0.102***
Panel BMeans (Non-CFF firms) Medians (Non-CFF firms)
Pre-CFF Post-CFF Pre-CFF Post-CFFVariable (N 5 1,799) (N 5 1,997) (N 5 1,799) (N 5 1,997)
Cash flow forecast measures
CFF%it 0.000 0.000††† 0.000 0.000†††
Tax avoidance measures
TXPD/CSHOit 0.476†† 0.438** 0.268††† 0.212***
Deferral/CSHOit 0.028† 0.033†† 0.000 0.000††
Permanent/CSHOit 0.015 0.024††† 20.003 0.002†††
CashETRit 0.246 0.248††† 0.251 0.246†††
Determinants of cash flow forecasts
Sizeit21 6.044††† 6.152**, ††† 5.956††† 6.035*, †††
CapIntit21 0.616†† 0.685** 0.382 0.397
Healthit21 5.769 4.849*** 3.926 3.523***
AbsAccit21 0.079 0.086**, ††† 0.056 0.061**
Volit21 2.286† 2.521 0.697 0.834***, ††
(The table is continued on the next page.)
Analysts’ Forecasts and Tax Planning 779
CAR Vol. 35 No. 2 (Summer 2018)
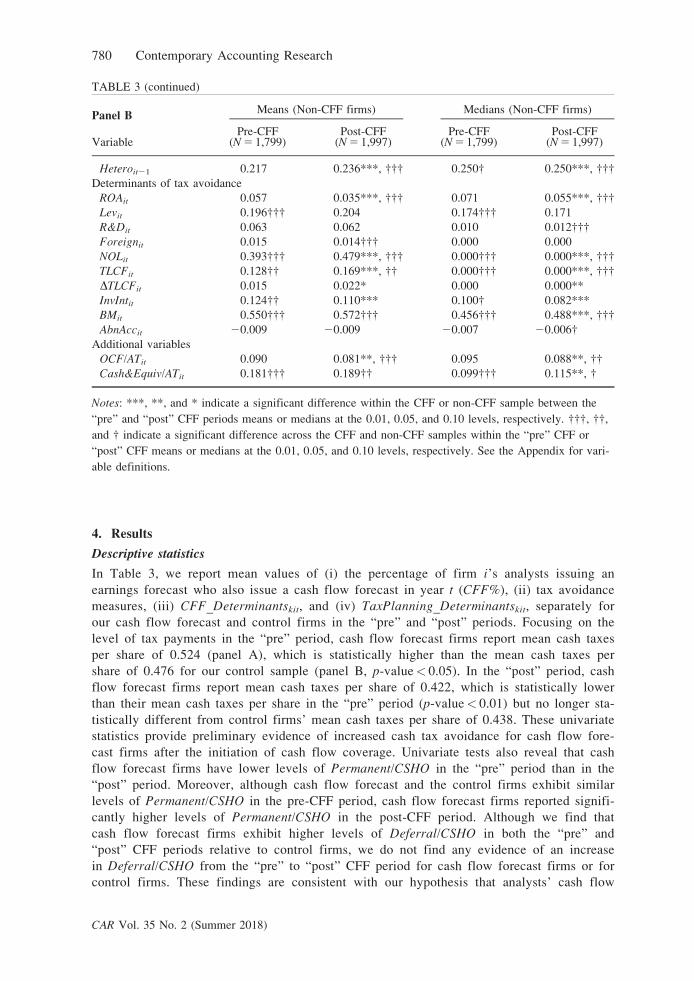
4. Results
Descriptive statistics
In Table 3, we report mean values of (i) the percentage of firm i’s analysts issuing an
earnings forecast who also issue a cash flow forecast in year t (CFF%), (ii) tax avoidance
measures, (iii) CFF_Determinantskit, and (iv) TaxPlanning_Determinantskit, separately for
our cash flow forecast and control firms in the “pre” and “post” periods. Focusing on the
level of tax payments in the “pre” period, cash flow forecast firms report mean cash taxes
per share of 0.524 (panel A), which is statistically higher than the mean cash taxes per
share of 0.476 for our control sample (panel B, p-value< 0.05). In the “post” period, cash
flow forecast firms report mean cash taxes per share of 0.422, which is statistically lower
than their mean cash taxes per share in the “pre” period (p-value< 0.01) but no longer sta-
tistically different from control firms’ mean cash taxes per share of 0.438. These univariate
statistics provide preliminary evidence of increased cash tax avoidance for cash flow fore-
cast firms after the initiation of cash flow coverage. Univariate tests also reveal that cash
flow forecast firms have lower levels of Permanent/CSHO in the “pre” period than in the
“post” period. Moreover, although cash flow forecast and the control firms exhibit similar
levels of Permanent/CSHO in the pre-CFF period, cash flow forecast firms reported signifi-
cantly higher levels of Permanent/CSHO in the post-CFF period. Although we find that
cash flow forecast firms exhibit higher levels of Deferral/CSHO in both the “pre” and
“post” CFF periods relative to control firms, we do not find any evidence of an increase
in Deferral/CSHO from the “pre” to “post” CFF period for cash flow forecast firms or for
control firms. These findings are consistent with our hypothesis that analysts’ cash flow
TABLE 3 (continued)
Panel BMeans (Non-CFF firms) Medians (Non-CFF firms)
Pre-CFF Post-CFF Pre-CFF Post-CFFVariable (N 5 1,799) (N 5 1,997) (N 5 1,799) (N 5 1,997)
Heteroit21 0.217 0.236***, ††† 0.250† 0.250***, †††
Determinants of tax avoidance
ROAit 0.057 0.035***, ††† 0.071 0.055***, †††
Levit 0.196††† 0.204 0.174††† 0.171
R&Dit 0.063 0.062 0.010 0.012†††
Foreignit 0.015 0.014††† 0.000 0.000
NOLit 0.393††† 0.479***, ††† 0.000††† 0.000***, †††
TLCFit 0.128†† 0.169***, †† 0.000††† 0.000***, †††
DTLCFit 0.015 0.022* 0.000 0.000**
InvIntit 0.124†† 0.110*** 0.100† 0.082***
BMit 0.550††† 0.572††† 0.456††† 0.488***, †††
AbnAccit 20.009 20.009 20.007 20.006†
Additional variables
OCF/ATit 0.090 0.081**, ††† 0.095 0.088**, ††
Cash&Equiv/ATit 0.181††† 0.189†† 0.099††† 0.115**, †
Notes: ***, **, and * indicate a significant difference within the CFF or non-CFF sample between the
“pre” and “post” CFF periods means or medians at the 0.01, 0.05, and 0.10 levels, respectively. †††, ††,
and † indicate a significant difference across the CFF and non-CFF samples within the “pre” CFF or
“post” CFF means or medians at the 0.01, 0.05, and 0.10 levels, respectively. See the Appendix for vari-
able definitions.
780 Contemporary Accounting Research
CAR Vol. 35 No. 2 (Summer 2018)

forecasts encourage managers to increase their tax avoidance activities and improve the
firm’s cash flow health. We refrain from drawing formal conclusions until we control for
known determinants of tax avoidance based on our difference-in-differences research
design.
Among the control variables reported in Table 3, we find various significant differ-
ences between cash flow forecast and control firms in the “pre” period that sometimes
persist in the “post” period. These differences highlight the importance of controlling for
determinants of cash flow forecasts and determinants of tax avoidance in our multivariate
analyses.
Multivariate results
We first examine the effect of analysts’ cash flow forecasts on cash tax avoidance by
estimating equation (2) and present these results in the first column of Table 4. Consistent
with our prediction, the coefficient on the CFFit3Postit interaction is negative and signifi-
cant (p-value< 0.001). The magnitude of the coefficient (20.0818) is also economically
meaningful as it suggests that, relative to the propensity score matched control sample,
cash flow forecast firms experience an 8.2 cent reduction in cash tax payments per share
after analysts begin issuing cash flow forecasts for the firm. In terms of cash taxes saved,
this reduction equates to approximately $35.4 million less in cash taxes paid over the
three-year period following the initiation of analysts’ cash flow coverage for the average
firm.18 Consistent with prior studies, we also find that cash tax payments are increasing
in profitability (ROAit) and inventory intensity (InvIntit), and decreasing in leverage
(Levit), research and development expenditures (R&Dit), the presence of net operating
losses (NOLit), and discretionary accruals (DiscAccit). We also find a positive association
between cash tax payments and firm size (Sizeit21) and heterogeneity of accounting choice
(Heteroit21), and a negative association between cash tax payments and firm health
(Healthit), the absolute value of total accruals (AbsAccit21), earnings volatility (Volit21),
and the book-to-market ratio (BMit).
In the second and third columns of Table 4, we report results for tests estimating
equation (2) using two alternative measures of tax avoidance. First, we replace TXPD/CSHOit with Permanent/CSHOit, which captures tax avoidance activity that permanently
avoids the payment of taxes. Such activity not only reduces cash tax payments but also
reduces total tax expense in the financial statements. Second, we replace TXPD/CSHOit
with Deferral/CSHOit, which captures efforts to enhance cash flows by deferring the pay-
ment of taxes. Tax deferral strategies reduce the firm’s cash tax payments in year t, but
have no impact on reported earnings in year t because they have no impact on the firm’s
total tax expense for financial statement purposes. Decomposing tax avoidance in this
way is interesting because it sheds light on the channels through which firms reduce their
cash tax payments following analysts’ initiation of cash flow coverage.
Consistent with expectations, the coefficient on CFFit3Postit is positive and significant
(p-value 5 0.022) when Permanent/CSHOit is the dependent variable. When Deferral/CSHOit
is the dependent variable, the coefficient on CFFit3Postit is insignificant. These findings
suggest that relative to a propensity score matched control sample, managers of firms whose
18. We calculate this figure ($35.4 million) as 20.0818 (coefficient on CFFit3Postit) multiplied by $147.30 (aver-
age number of common shares outstanding in the “post” period for cash flow forecast firms, the denominator
of TXPD/CSHO) multiplied by three years (the maximum number of years a cash flow forecast firm is included
in the “post” period).
Analysts’ Forecasts and Tax Planning 781
CAR Vol. 35 No. 2 (Summer 2018)

TABLE 4
Cash flow forecasts and cash tax planning
TXPD/CSHO
coefficient (p-value)
Deferral/CSHO
coefficient (p-value)
Permanent/CSHO
coefficient (p-value)
Cash ETR
coefficient (p-value)
Intercept 0.1235 0.0172 20.0212 0.1458*
(0.475) (0.762) (0.876) (0.056)
CFFt 20.0016 0.0240** 20.0080 20.0018
(0.948) (0.029) (0.443) (0.826)
Postt 0.0019 20.0007 20.0028 0.0009
(0.921) (0.942) (0.761) (0.899)
CFFt3Postt 20.0818*** 20.0038 0.0259** 20.0252***
(<0.001) (0.794) (0.022) (0.008)
Sizet21 0.0972*** 0.0068* 0.0153*** 0.0107***
(<0.001) (0.054) (<0.001) (<0.001)
CapIntt21 20.0014 0.0177** 0.0079 20.0419***
(0.922) (0.030) (0.262) (<0.001)
Healtht21 20.0088*** 20.0022*** 20.0029*** 20.0009
(<0.001) (<0.001) (<0.001) (0.216)
AbsAcct21 20.2431*** 20.0075 20.0408 20.0908*
(0.002) (0.8573) (0.329) (0.076)
Volt21 20.0086*** 0.0006 0.0012* 20.0028***
(<0.001) (0.4315) (0.091) (<0.001)
Heterot21 0.3502*** 0.0653** 0.0015 0.0378
(<0.001) (0.0360) (0.961) (0.102)
ROAt 1.1334*** 0.2472*** 0.3343*** 0.0659
(<0.001) (0.0001) (<0.001) (0.132)
Levt 20.0994** 0.0840*** 20.0011 20.0368*
(0.043) (0.0048) (0.967) (0.074)
R&Dt 20.1267** 0.0103 20.3197*** 20.2309***
(0.050) (0.7981) (<0.001) (0.001)
Foreignt 0.1008 20.1292 0.7745*** 20.1628**
(0.736) (0.2282) (<0.001) (0.045)
NOLt 20.0659*** 0.0192** 0.0147 20.0364***
(<0.001) (0.0373) (0.102) (<0.001)
InvIntt 0.7482*** 20.1078** 20.0494 0.2214***
(<0.001) (0.0417) (0.350) (<0.001)
BMt 20.0556*** 0.0221 0.0063 0.0681***
(0.009) (0.1139) (0.619) (<0.001)
DiscAcct 20.3881*** 0.3836*** 20.2402*** 20.2686***
(<0.001) (0.0001) (<0.001) (<0.001)
Adjusted R2 0.3303 0.0789 0.1382 0.1106
N 7,353 6,908 6,908 5,358
Notes: We report OLS regressions and control for industry and year fixed effects. Huber-White robust
standard errors are clustered by firm. When predictions are made, p-values are one-tailed. TXPD/CSHO
captures cash taxes paid per share. Deferral/CSHO and Permanent/CSHO capture tax savings per share
from deferral-based and permanent tax strategies, respectively. CashETR equals the ratio of cash taxes
paid (TXPD) to pre-tax income adjusted for special items (PI 2 SPI). ***, **, and * denote significance
at the 0.01, 0.05, and 0.10 levels, respectively. See the Appendix for additional variable definitions.
782 Contemporary Accounting Research
CAR Vol. 35 No. 2 (Summer 2018)

analysts initiate cash flow coverage use permanent tax strategies that help reduce cash
taxes.19
5. Supplemental analysis
Alternative measure of cash tax avoidance
In our primary tests above, we measure cash tax avoidance as the extent to which the firm
minimizes cash taxes paid per share of common stock. This measure is appealing because it
corresponds to analysts’ cash flow forecasts, which are also estimated on a per share basis.
It also allows us to examine cash tax avoidance for loss firms, which is more difficult to do
when employing cash effective tax rates that are scaled by pre-tax income. Nevertheless, in
this section we re-estimate equation (2) using an alternative measure of cash tax avoidance.
Specifically, we measure the firm’s cash effective tax rate (CashETRit) measured as the ratio
of cash taxes paid to pre-tax income adjusted for special items. If a firm’s CashETRit is
above one (below zero), we set CashETRit equal to one (zero). Note that because the
denominator of CashETRit is a measure of income, we exclude firm-year observations with
negative pre-tax income.
In the final column of Table 4, we report the results of estimating equation (2) with this
alternative measure of cash tax avoidance. We find that the coefficient on CFFit3Postit con-
tinues to be significantly negative (coefficient 5 20.0252, p-value 5 0.008), consistent with
the initiation of analysts’ cash flow coverage leading to a 2.52 percent decrease in cash
effective tax rates.
Estimating first-stage model separately by year
Prior studies examining the determinants and consequences of analysts’ initiation of cash
flow forecasts do not consider the possibility that the determinants of the initiation of cash
flow forecasts may change over time. To account for this possibility, we re-estimate equation
(1) annually and create an alternative control sample based on propensity scores generated
by this annual estimation. Using this alternative matched control sample, we then re-estimate
equation (2) and present the results in the first column of Table 5. Consistent with our pri-
mary analyses, we find that the coefficient on CFFit3Postit continues to be significantly
negative (coefficient 5 20.0428, p-value 5 0.058), consistent with the initiation of analysts’
cash flow coverage leading to a decrease in cash tax payments.
Matching separately by firm-year observation
As an alternative to our main research design, we identify a different propensity score
matched control firm for each firm-year observation in our sample, rather than comparing a
given firm in our cash flow forecast sample to a single control firm in all years in both the
“pre” and “post” periods. This alternative allows a cash flow forecast firm to be matched to
a different control firm each year, based on the most suitable match for the firm-year obser-
vation in question. When we re-estimate equation (2) using this alternative matching proce-
dure, we continue to find a significant coefficient on CFFit3Postit (coefficient 5 20.0853,
p-value 5 0.003), as reported in the second column of Table 5.
19. In untabulated analysis, we examined the association between the initiation of cash flow forecasts and “risky”
tax avoidance using predicted uncertain tax benefits (computed using the methodology outlined in Rego and
Wilson 2012) and the volatility of cash ETRs to proxy for risky tax avoidance. We find no evidence of an asso-
ciation between the initiation of cash flow forecasts and proxies for risky tax avoidance. This is not necessarily
surprising given that (i) prior studies provide little evidence of a link between increased tax avoidance and tax
risk (Dyreng et al. 2008; Saavedra 2015; Guenther et al. 2016), and (ii) managers have incentives to take
actions to manage and smooth reported items (e.g., Bartov 1993), making it less likely that managers would
avoid taxes using strategies that increase the volatility of cash flows.
Analysts’ Forecasts and Tax Planning 783
CAR Vol. 35 No. 2 (Summer 2018)

Sample imbalance and survivorship concerns
In our difference-in-differences research design, we include up to three firm-year observa-
tions in the “post” period and up to three firm-year observations in the “pre” period for
each treatment and control firm. While this design ensures that the number of unique cash
TABLE 5
Cash flow forecasts and cash tax planning: Alternative research designs
Annual estimation of propensity scores
coefficient (p-value)
Separate matched control firm each year
coefficient (p-value)
Intercept 0.4791** 0.0842
(0.041) (0.594)
CFFt 20.0515** 0.0133
(0.047) (0.379)
Postt 20.0122 0.0236
(0.561) (0.310)
CFFt3Postt 20.0428* 20.0853***
(0.058) (0.003)
Sizet21 0.0990*** 0.0905***
(<0.001) (<0.001)
CapIntt21 0.0075 20.0288
(0.572) (0.186)
Healtht21 20.0117*** 20.0150***
(<0.001) (<0.001)
AbsAcct21 20.3376*** 20.3382***
(<0.001) (0.009)
Volt21 20.0074*** 20.0081***
(<0.001) (<0.001)
Heterot21 0.3763*** 0.2418***
(<0.001) (0.007)
ROAt 1.1565*** 1.4039***
(<0.001) (<0.001)
Levt 20.1369*** 20.0431
(0.009) (0.274)
R&Dt 20.1239* 20.1681*
(0.059) (0.078)
Foreignt 0.0012 20.4461*
(0.997) (0.094)
NOLt 20.0874*** 20.1025***
(<0.001) (<0.001)
InvIntt 0.5325*** 0.5606***
(<0.001) (<0.001)
BMt 20.0421* 20.0424
(0.064) (0.203)
DiscAcct 20.2665*** 20.2914***
(0.003) (0.010)
Adjusted R2 0.3214 0.3278
N 6,859 5,208
Notes: We report OLS regressions and control for industry and year fixed effects. Huber-White robust
standard errors are clustered by firm. When predictions are made, p-values are one-tailed. TXPD/CSHO
captures cash taxes paid per share. ***, **, and * denote significance at the 0.01, 0.05, and 0.10 levels,
respectively. See the Appendix for additional variable definitions.
784 Contemporary Accounting Research
CAR Vol. 35 No. 2 (Summer 2018)
flow forecast firms in our analysis equals the number of unique control firms, the number of
firm-year observations is not identical between cash flow forecast and control samples
because data limitations eliminate some firm-year observations from the analysis. Further,
any cash flow forecast (control) firm-year observation in the “post” period without (with) a
cash flow forecast is removed from the analysis. The result is a slight imbalance in the num-
ber of firm-year observations in the cash flow forecast and control samples, as evidenced in
Table 3.
To address any concern this design creates (e.g., survivorship), we re-estimate our
analyses after requiring that (i) all firms are represented in both the “pre” and “post” peri-
ods, and (ii) each firm-year observation from the cash flow forecast sample (in either the
“pre” or “post” period) is matched to a specific firm-year observation from the corre-
sponding control firm in the same fiscal year. Specifically, we eliminate any cash flow
forecast or control firm not present in both the “pre” and “post” periods, as well as any
cash flow forecast or control firm-year observation that for any reason does not have a
matched counterpart. These requirements ensure that cash flow forecast firms and control
firms are present in both the “pre” and “post” periods and that the cash flow forecast and
control samples are perfectly aligned in calendar time. This procedure results in a total of
1,001 (1,001) cash flow forecast (control) observations in the “pre” period and 711 (711)
cash flow forecast (control) observations in the “post” period. We re-estimate our analyses
using this sample and our inferences remain unchanged (untabulated). Specifically, we
continue to find a significantly negative coefficient on CFFit3Postit (coef-
ficient 5 20.0760, p-value 5 0.009), indicating that firms whose analysts begin issuing
cash flow forecasts reduce their cash tax payments.
Matched-pair fixed effects
When using matched samples, Cram et al. (2009) recommend including an indicator variable
for each pairing in the regression model to obtain asymptotically correct coefficient esti-
mates. In our setting, such an indicator variable would take the value of one for a given
cash flow forecast firm and the corresponding control firm in both the “pre” and “post” peri-
ods and would take the value of zero for all other firm-year observations (from other cash
flow forecast and other control firms). Each set of matched firms would similarly have its
own matched-pair fixed effect.
When we include matched-pair fixed effects in our analysis, our findings yield similar
conclusions. Specifically, as reported in Table 6, the initiation of analysts’ cash flow cover-
age is associated with a reduction in cash tax payments per share (coefficient on
CFFit3Postit 5 20.0296, p-value 5 0.058). Similar to the results presented above, these find-
ings suggest that the initiation of analyst cash flow coverage results in an increase in tax
avoidance.
6. Reported operating cash flows in the “post” period
Our analyses suggest that upon initiation of analysts’ cash flow coverage, firms more
actively engage in cash tax avoidance to improve their cash flow position. A natural
follow-up question is whether firms’ total reported operating cash flows increase after
the initiation of analysts’ cash flow coverage, and if so, the extent to which cash tax
avoidance contributes to this increase. To evaluate the change in reported operating
cash flows for cash flow forecast firms from the “pre” to the “post” period relative to
the corresponding change for our propensity score matched sample, we adapt the oper-
ating cash flow prediction model developed by Barth et al. (2001), as follows:
Analysts’ Forecasts and Tax Planning 785
CAR Vol. 35 No. 2 (Summer 2018)

OCFit5b01b1CFFit1b2Postit1b3CFFit3Postit1b4OCFit211b5DARit21
1b6DInvit211b7DAPit211b8Deprit211b9Amortit211b10Otherit21
1X16
k511bkCFF Determinantskit1Eit; (3Þ
where OCFit (OCFit21) equals reported operating cash flows in year t (year t 2 1), DARit is
the change in accounts receivable from year t 2 2 to year t 2 1, DInvit is the change in
inventory from year t 2 2 to year t 2 1, DAPit is the change in accounts payable from year
t 2 2 to year t 2 1, Deprit is depreciation expense in year t 2 1, Amortit is amortization
expense in year t 2 1, and Otherit is all other accruals in year t 2 1. Barth et al. (2001) find
that year t 2 1 operating cash flows, change in accounts receivable, change in inventory,
change in accounts payable, depreciation, amortization, and other accruals have significant
predictive ability for year t operating cash flows. We also include the determinants of ana-
lysts’ cash flow coverage in equation (3), as previously defined, to account for any effect of
these firm characteristics on reported operating cash flows. We further augment the model
with CFFit, Postit, and CFFit3Postit. The coefficient on CFFit3Postit captures the change in
reported operating cash flows in the “post” period relative to the “pre” period that is (a)
unique to cash flow forecast firms, and (b) not captured by other determinants of reported
operating cash flows.
Because the data requirements imposed in equation (3) slightly reduce the size of
our sample, we first re-estimate our main test using this reduced sample to confirm our
finding that firms increase cash tax avoidance activities following the initiation of
analysts’ cash flow forecasts. As reported in column (1) of panel A of Table 7, we
TABLE 6
Cash flow forecasts and cash tax planning: controlling for matched-pair fixed effects
Variable Coefficient (p-value) Coefficient (p-value)
Intercept 0.2942* 20.0730
(0.051) (0.444)
CFFt 20.0449 20.0500*
(0.100) (0.065)
Postt 20.0348 0.0252
(0.147) (0.384)
CFFt3Postt 20.0512* 20.0492*
(0.058) (0.062)
CFF determinants controls included Yes Yes
Tax planning controls included Yes Yes
Match pair fixed effects Yes Yes
Industry and year fixed effects No Yes
N 5,413 5,413
Adjusted R2 0.5114 0.5188
Notes: We report OLS regressions and control for matched-pair fixed effects. Huber-White robust stan-
dard errors are clustered by firm and are used to control for heteroscedasticity and serial correlation.
When predictions are made, p-values are one-tailed. The dependent variable, TXPD/CSHO, captures cash
taxes paid per share. * denotes significance at the 0.10 level. See the Appendix for additional variable
definitions.
786 Contemporary Accounting Research
CAR Vol. 35 No. 2 (Summer 2018)

TABLE 7
Cash flow forecasts and reported operating cash flows
Panel A: All firms
Dependent variable:
Variable
TXPD/CSHO
Coefficient
(p-value)
OCF
Coefficient
(p-value)
Intercept 0.0724 20.0179
(0.662) (0.234)
CFFt 0.0235 0.0045*
(0.375) (0.073)
Postt 20.0191 20.0025
(0.316) (0.323)
CFFt3Postt 20.0896*** 20.0005
(<0.001) (0.880)
OCFt21 1.1835*** 0.5896***
(<0.001) (<0.001)
DARt21 0.5956*** 0.1183***
(<0.001) (<0.001)
DInvt21 0.9119*** 0.2103***
(<0.001) (<0.001)
DAPt21 20.4541*** 20.3732***
(0.006) (<0.001)
Deprt21 20.8545* 0.3775***
(0.058) (<0.001)
Amortt21 22.5370*** 0.0496
(0.001) (0.341)
Othert21 0.7977*** 0.2387***
(<0.001) (<0.001)
Sizet21 0.1038*** 0.0058***
(<0.001) (<0.001)
CapIntt21 20.0305** 20.0105***
(0.026) (<0.001)
Healtht21 20.0094*** 0.0007***
(<0.001) (0.003)
AbsAcct21 20.1050 0.0517**
(0.382) (0.028)
Volt21 20.0107*** 0.0001
(<0.001) (0.442)
Heterot21 0.3854*** 0.0004
(<0.001) (0.952)
Adjusted R2 0.2930 0.4847
N 6,876 6,876
Panel B: Profitable firms only
Intercept 0.2640 20.0083
(0.295) (0.468)
CFFt 0.0142 20.0029
(0.663) (0.260)
Postt 20.0296 20.0056**
(0.219) (0.024)
CFFt3Postt 20.1042*** 0.0073**
(0.001) (0.026)
(The table is continued on the next page.)
Analysts’ Forecasts and Tax Planning 787
CAR Vol. 35 No. 2 (Summer 2018)

continue to find a significant coefficient on CFFit3Postit (coefficient 5 20.0896,
p-value< 0.001).
In column (2), we report the results from estimating equation (3) to examine the
increase in reported operating cash flows following the initiation of analysts’ cash flow fore-
casts. However, we find no increase in reported operating cash flows following the initiation
of analysts’ cash flow coverage (coefficient on CFFit3Postit 5 20.0005, p-value 5 0.880).
We note, however, that this analysis includes both profit and loss firms, and loss firms may
have difficulty increasing operating cash flows during periods of financial distress.
Therefore, in panel B of Table 7, we examine the change in operating cash flows
among profitable firms. In column (1), we continue to find that these firms increase their
tax avoidance activity after analysts initiate cash flow coverage (coefficient on
CFFit3Postit 5 20.1042, p-value 5 0.001). Moreover, in column (2), we find a statistically
significant increase in reported operating cash flows in the “post” period for these profitable
firms, even after controlling for the determinants of operating cash flows identified by Barth
TABLE 7 (continued)
Panel B: Profitable firms only
Sizet21 0.1053*** 0.0037***
(<0.001) (<0.001)
DARt21 0.9780*** 0.1141***
(<0.001) (<0.001)
DInvt21 1.2720*** 0.1818***
(<0.001) (<0.001)
DAPt21 20.8520*** 20.2696***
(<0.001) (<0.001)
Deprt21 20.8117 0.5311***
(0.191) (<0.001)
Amortt21 25.0197*** 0.1688
(<0.001) (0.112)
Othert21 1.1016*** 0.1811***
(<0.001) (<0.001)
CapIntt21 20.1309*** 20.0078**
(<0.001) (0.012)
Healtht21 20.0172*** 0.0021***
(<0.001) (<0.001)
AbsAcct21 20.5650*** 0.1527***
(0.005) (<0.001)
Volt21 20.0099*** 0.0000
(<0.001) (0.928)
Heterot21 0.3280*** 20.0128*
(0.002) (0.078)
CashFlowst21 1.6187*** 0.4496***
(<0.001) (<0.001)
Adjusted R2 0.2512 0.4284
N 4,980 4,980
Notes: OLS regressions control for industry and year. Huber-White robust standard errors are clustered by
firm to control for heteroscedasticity and serial correlation. When predictions are made, p-values are one-
tailed. The dependent variable equals either OCF, which equals the ratio of operating cash flows adjusted for
special items and discontinued items (OANCF 2 XIDOC) to average assets, or TXPD/CSHO, which equals
the ratio of cash taxes paid (TXPD) to common shares outstanding (CSHO). ***, **, and * denote signifi-
cance at the 0.01, 0.05, and 0.10 levels, respectively. See the Appendix for additional variable definitions.
788 Contemporary Accounting Research
CAR Vol. 35 No. 2 (Summer 2018)

et al. (2001) and the determinants of analysts’ cash flow coverage identified by DeFond and
Hung (2003). This finding is consistent with our central hypothesis that analysts’ cash flow
forecasts increase the net benefit of efforts to enhance the firm’s cash flow position. Our
finding that firms engage in additional tax avoidance following the initiation of analysts’
cash flow coverage, but that only profitable firms enjoy a net increase in reported operating
cash flows, suggests that the cash savings loss firms enjoy from tax avoidance are offset by
reductions to operating cash flows in other areas.
To provide an economic interpretation of these results, we focus on the coefficient for
CFFit3Postit for profitable firms in panel B of Table 7. Our evidence suggests that, relative
to the “pre” period, reported operating cash flows in the “post” period increase by $73.4
million for the mean cash flow forecast firm in our sample. In comparison, the mean cash
flow forecast firm in this sample enjoys decreased cash tax payments in the “post” period of
$40.9 million, suggesting that 56 percent of the overall increase in reported operating cash
flows for the mean firm in our sample is attributable to increased efforts to avoid cash tax
payments.20 In sum, these findings suggest that managers of profitable firms likely engage in
a variety of activities to enhance reported operating cash flows after analysts initiate cash
flow coverage and that improvements in cash flow health through additional cash tax avoid-
ance represent an important component of these activities.
7. Conclusion
We hypothesize that when analysts initiate cash flow coverage of a firm, the firm’s manag-
ers increase their efforts to improve the firm’s cash flow health. To investigate this hypothe-
sis, we employ a difference-in-differences design where we examine changes in tax
avoidance in the years surrounding analysts’ initiation of cash flow coverage, relative to
changes in tax avoidance over the same period for a propensity score matched control sam-
ple of firms without analysts’ cash flow forecasts. Controlling for factors associated with the
initiation of analysts’ cash flow coverage and other known determinants of tax avoidance,
we find that the initiation of cash flow coverage is negatively associated with changes in
cash tax payments. This result is consistent with cash flow forecasts encouraging increased
tax avoidance that enhances the firm’s cash flow position. We also find that analysts’ cash
flow coverage is positively (and significantly) associated with permanent tax avoidance but
is not associated with deferral-based tax avoidance activity that would ultimately reverse.
We conduct additional tests to determine if reported operating cash flows increase for
cash flow forecast firms after the initiation of analysts’ cash flow coverage and to determine
the role of cash tax avoidance strategies in this increase. We find that profitable firms report
higher operating cash flows following the initiation of analysts’ cash flow coverage and that
increased cash tax avoidance is responsible for approximately 56 percent of this increase in
operating cash flows. However, while loss firms also engage in additional tax avoidance
activity when analysts issue cash flow forecasts, these cash savings appear to be offset by
reductions in operating cash flows in other areas. These findings further reinforce the notion
that analysts’ cash flow forecasts encourage managers to engage in activities, such as cash
tax avoidance, that enhance the firm’s cash flow position in nontrivial ways.
20. To make valid comparisons between reductions in cash taxes paid and increases in reported operating cash
flows, we use a common set of firms to estimate both amounts. For the subsample of profitable firms with data
to calculate both amounts, we observe a $40.9 million reduction in cash tax payments over the three years in
the “post” period. We calculate the $40.9 million decrease in tax payments as the product of the mean profit-
able cash flow forecast firm’s common shares outstanding (the denominator of TXPD/CSHOit) and the coeffi-
cient on CFF3Post in equation (2) when re-estimated using this sample ($130.85 million 3 20.1042 3 3
years). We calculate the $73.4 million increase in operating cash flows as the product of the mean firm’s aver-
age total assets (the denominator of OCFit) and the coefficient on CFF3Post in equation (3) ($3,349.8 3
0.0073 3 3 years 5 $73.4 million).
Analysts’ Forecasts and Tax Planning 789
CAR Vol. 35 No. 2 (Summer 2018)

This study makes several contributions to the literature. First, our findings suggest cash
flow forecasts encourage managers to focus on activities that significantly enhance the firm’s
long-term cash position. While prior research suggests cash flow forecasts impact financial
reporting behavior, we document improvements to the firm’s cash flow position as a result
of analysts’ cash flow forecasting activities.
Second, we add to the analyst literature by documenting that analysts’ cash flow fore-
casts encourage firms to avoid tax payments. Given recent evidence that suggests tax plan-
ning enhances firm value (Mills et al. 1998; Desai and Dharmapala 2009; Wilson 2009; De
Simone and Stomberg 2013; Goh et al. 2013), our findings suggest a potential benefit to
firms of analysts’ cash flow coverage. We also complement research on the role of firm
monitors in encouraging tax avoidance. Prior research finds that firm auditors (McGuire
et al. 2012) and hedge funds (Cheng et al. 2012) can help managers increase their tax avoid-
ance activity. We add to this literature by documenting that analysts who cover the firm can
also encourage managers to maximize their tax avoidance opportunities.
Finally, our findings shed light on the determinants of tax avoidance, the type of tax
avoidance, and the role that an alternative performance metric plays in managers’ focus on
tax planning. Given general conclusions from prior research that firms “under-shelter” their
income (Weisbach 2002) and focus on total tax expense reported in the financial statements
(instead of cash taxes paid), our evidence suggests analysts’ cash flow forecasts are a miti-
gating factor to the somewhat puzzling behavior documented in prior research.
Appendix
Variable definitions
Variable Definition
Cash flow forecast variables
CFF An indicator variable equal to one if firm t’s analysts issue a cash flow forecast
in year t, and zero otherwise
CFF% The percentage of firm i’s analysts issuing an earnings forecast who also issue a
cash flow forecast in year tTax avoidance variables
TXPD/CSHO The ratio of taxes paid to common shares outstanding (txpd/csho)
Permanent/CSHO The difference between the U.S. statutory rate multiplied by 35 percent and total
tax expense, scaled by common shares outstanding ((35 percent 3 pi 2 txt)/
csho)
Deferral/CSHO The ratio of deferred tax expense to common shares outstanding
((txdfed 1 txdfo)/csho); if missing (txdfed 1 txdfo), then (txdi/csho)
First-stage selection model variables
AbsAcc Income before extraordinary items (ib) minus cash from operations (oancf),
scaled by total assets (at). This variable is calculated in year tVol The coefficient of variation of earnings (ib) measured over year t and the previ-
ous four years scaled by the coefficient of variation of operating cash flows
(oancf) measured over the same period. This variable is calculated as (|stan-
dard deviation of earnings/mean of earnings|)/(|standard deviation of operating
cash flows/mean of operating cash flows|)
Hetero An index ranging from zero to one that captures the similarity of a firm’s
accounting choices in year t relative to other firms in the same industry. In
each year, we examine five accounting choices, and for each accounting
choice, assign the firm a value of one if its chosen method differs from the
(The table is continued on the next page.)
790 Contemporary Accounting Research
CAR Vol. 35 No. 2 (Summer 2018)

Appendix (Continued)
Variable Definition
most frequently chosen method in its industry group, and zero otherwise. The
five accounting choices are (i) inventory valuation, (ii) investment tax credit,
(iii) depreciation, (iv) successful-efforts vs. full-cost for companies with
extraction activities, and (v) purchase vs. pooling. The five scores are summed
and divided by the number of accounting choices in the industry (which for
some industries is less than five). Higher (lower) index values are consistent
with heterogeneous (homogeneous) accounting choices
Health We estimate Altman’s Z-score in year t as a proxy for financial health. Consis-
tent with Altman (1968), the Z-score equals 1.2 3 (Net working capital/Total
assets) 1 1.4 3 (Retained earnings/Total assets) 1 3.3 3 (Earnings before
interest and taxes/Total assets) 1 0.6 3 (Market value of equity/Book value of
liabilities) 1 1.0 3 (Sales/Total assets). Lower Altman’s Z-scores indicate
poorer financial health. In the empirical tests that follow, we multiply the Alt-
man’s Z-scores by negative one, such that higher values are consistent with
cash flow information being a more useful performance metric
CapInt The ratio of gross property, plant, and equipment (ppegt) divided by sales reve-
nue (sale). This variable is calculated as of year tSize The natural logarithm of market value of equity (prcc_f 3 csho) in millions of
dollars, measured as of the beginning of year tTax planning opportunities
ROA The ratio of pre-tax income to total assets (pi/at) in year tForeign The absolute ratio of pre-tax foreign income to total pre-tax income (|pifo/pi|) in
year t; if missing pre-tax foreign income, foreign pre-tax income is set equal
to zero
Lev The ratio of total debt to total assets (dltt 1 dlc)/at in year tCapInt The ratio of net property, plant, and equipment to total assets (ppent/at) in year tInvInt The ratio of inventory to total assets (invt/at) in year tR&D The ratio of R&D expense to total revenues (xrd/revt) in year tDiscAcc Discretionary accruals computed at the end of the year estimated using a modi-
fied Jones’ model (Kothari et al. 2005) in year tNOL An indicator variable if the firm reported a net operating loss (tlcf) in the current
year and zero otherwise
TLCF The ratio of net operating losses to assets (tlcf/at) in year tBM The ratio of the book value of equity to the market value of equity (ceq/(csho 3
prcc_f)) in year tDeterminants of operating cash flows
OCF Operating cash flows (oancf) in year t, or alternatively, in year t 2 1
DAR The change in accounts receivable (recch) from year t 2 2 to year t 2 1
DInv The change in inventory (invch) from year t 2 2 to year t 2 1
DAP The change in accounts payable (apalch) from year t 2 2 to year t 2 1
Depr Depreciation expense (dp 2 am) in year t 2 1
Amort Amortization expense (am) in year t 2 1
Other Other accruals (ib 2 (oancf 2 xidoc 1 DAR 1 DInv 2 DAP 2 Depr 2 Amort)) in
year t 2 1
References
Altman, E. 1968. Financial ratios, discriminant analysis, and the prediction of corporate bankruptcy. Jour-
nal of Finance 23 (4): 589–609.
Armstrong, C., J. Blouin, and D. Larcker. 2012. The incentives for tax planning. Journal of Accounting
and Economics 53 (1/2): 391–411.
Analysts’ Forecasts and Tax Planning 791
CAR Vol. 35 No. 2 (Summer 2018)

Armstrong, C., A. Jagolinzer, and D. Larcker. 2010. Chief executive officer equity incentives and
accounting irregularities. Journal of Accounting Research 48 (2): 225–71.
Barth, M. E., D. P. Cram, and K. K. Nelson. 2001. Accruals and the prediction of future cash flows. The
Accounting Review 76 (1): 27–58.
Bartov, E. 1993. The timing of asset sales and earnings manipulation. The Accounting Review 68 (4): 840–55.
Bowen, R., X. Chen, and Q. Cheng. 2008. Analyst coverage and the cost of raising equity capital: Evidence
from underpricing of seasoned equity offerings. Contemporary Accounting Research 25 (3): 657–99.
Bradley, D., J. Clarke, S. Lee, and C. Ornthanalai. 2014. Are analysts’ recommendations informative?
Intraday evidence on the impact of time stamp delays. Journal of Finance 69 (2): 645–73.
Brown, L. D., K. Huang, and A. S. Pinello. 2013. To beat or not to beat? The importance of analysts’
cash flow forecasts. Review of Quantitative Finance and Accounting 41 (4): 723–52.
Call, A. C. 2009. Analysts’ cash flow forecasts and the properties and pricing of operating cash flows.
Working paper, Arizona State University.
Call, A. C., S. Chen, and Y. H. Tong. 2009. Are analysts’ earnings forecasts more accurate when accom-
panied by cash flow forecasts? Review of Accounting Studies 14 (2–3): 358–91.
Call, A. C., S. Chen, and Y. H. Tong. 2013. Are analysts’ cash flow forecasts na€ıve extensions of their
own earnings forecasts? Contemporary Accounting Research 30 (2): 438–65.
Chen, T., J. Harford, and C. Lin. 2015. Do analysts matter for governance? Evidence from natural experi-
ments. Journal of Financial Economics 115 (2): 383–410.
Cheng, C. S. A., H. H. Huang, Y. Li, and J. Stanfield. 2012. The effect of hedge fund activism on corpo-
rate tax avoidance. The Accounting Review 87 (5): 1493–526.
Cram, D. J., V. Karan, and I. Stuart. 2009. Three threats to validity of choice-based and matched-sample
studies in accounting research. Contemporary Accounting Research 26 (2): 477–516.
De Simone, L., and B. Stomberg. 2013. Do investors differentially value tax avoidance of income mobile
firms? Working paper, Stanford University and University of Georgia.
DeFond, M., and M. Hung. 2003. An empirical analysis of analysts’ cash flow forecasts. Journal of
Accounting and Economics 35 (1): 73–100.
DeFond, M., and M. Hung. 2007. Investor protection and analysts’ cash flow forecasts around the world.
Review of Accounting Studies 12 (2–3): 377–419.
Desai, M., and D. Dharmapala. 2009. Corporate tax avoidance and firm value. Review of Economics and
Statistics 91 (3): 537–46.
Drobetz, W., M. C. Gr€uninger, and S. Hirschvogl. 2010. Information asymmetry and the value of cash.
Journal of Banking and Finance 34 (9): 2168–84.
Dyreng, S., M. Hanlon, and E. Maydew. 2008. Long-run corporate tax avoidance. The Accounting Review
83 (1): 61–82.
Easley, D., and M. O’Hara. 2004. Information and the cost of capital. Journal of Finance 59 (4): 1553–83.
Edwards, A., C. Schwab, and T. Shevlin. 2016. Financial constraints and cash tax savings. The Account-
ing Review 91 (3): 859–81.
Ertimur, Y., and S. Stubben. 2005. Analysts’ incentives to issue revenue and cash flow forecasts. Work-
ing paper, University of Colorado and University of Utah.
Frank, M., L. Lynch, and S. Rego. 2009. Tax reporting aggressiveness and its relation to aggressive
financial reporting. The Accounting Review 84 (2): 467–96.
Frankel, R., and X. Li. 2004. Characteristics of a firm’s information environment and the information asym-
metry between insiders and outsiders. Journal of Accounting and Economics 37 (2): 229–59.
Givoly, D., C. Hayn, and R. Lehavy. 2009. The quality of analysts’ cash flow forecasts. The Accounting
Review 84 (6): 1877–911.
Goh, B., J. Lee, C. Lim, and T. Shevlin. 2013. The effect of corporate tax avoidance on the cost of
equity. Working paper, Singapore Management University and University of California at Irvine.
Graham, J. 1996. Proxies for the corporate marginal tax rate. Journal of Financial Economics 42 (2):
187–221.
792 Contemporary Accounting Research
CAR Vol. 35 No. 2 (Summer 2018)

Graham, J., M. Hanlon, T. Shevlin, and N. Shroff. 2014. Incentives for tax planning and avoidance: Evi-
dence from the field. The Accounting Review 89 (3): 991–1023.
Guenther, D. A., L. K. Krull, and B. M. Williams. 2014. Are “tax aggressive” firms just inflating earn-
ings? Working paper, University of Oregon and Indiana University.
Guenther, D. A., S. R. Matsunaga, and B. M. Williams. 2016. Is tax avoidance related to firm risk? The
Accounting Review, 92 (1): 115–36.
Hanlon, M., and S. Heitzman. 2010. A review of tax research. Journal of Accounting and Economics 50
(2–3): 127–78.
Kelly, B., and A. Ljungvist. 2012. Testing asymmetric-information asset pricing models. Review of
Financial Studies 25 (5): 1366–413.
Kothari, S. P., A. Leone, and C. Wasley. 2005. Performance matched discretionary accrual measures.
Journal of Accounting and Economics 39 (1): 163–97.
Lee, L. F. 2012. Incentives to inflate reported cash from operations using classification and timing. The
Accounting Review 87 (1): 1–33.
Leone, M. 2008. There’s a cash machine in your tax department. CFO.com, December 11.
Li, K., and H. You. 2015. What is the value of sell-side analysts? Evidence from coverage initiations and
terminations. Journal of Accounting and Economics 60 (2–3): 141–60.
Lisowsky, P. 2010. Seeking shelter: Empirically modeling tax shelters using financial statement informa-
tion. The Accounting Review 85 (5): 1693–720.
McGuire, S. T., T. C. Omer, and D. Wang. 2012. Tax avoidance: Does tax-specific industry expertise
make a difference? The Accounting Review 87 (3): 975–1003.
McInnis, J., and D. Collins. 2011. The effect of cash flow forecasts on accrual quality and benchmark
beating. Journal of Accounting and Economics 51 (1): 219–39.
Mills, L., M. Erickson, and E. Maydew. 1998. Investments in tax planning. Journal of the American Tax-
ation Association 20 (1): 1–20.
Mills, L., and K. Newberry. 2004. Do foreign multinationals’ tax incentives influence their U.S. income
reporting and debt policy? National Tax Journal 57 (1): 89–107.
Mohanram, P. 2014. Analysts’ cash flow forecasts and the decline of the accruals anomaly. Contempo-
rary Accounting Research 31 (4): 1143–70.
Newberry, K. 1998. Foreign tax credit limitations and capital structure decisions. Journal of Accounting
Research 36 (1): 157–66.
Newberry, K., and D. Dhaliwal. 2001. Cross-jurisdictional income shifting by U.S. multinationals: Evi-
dence from international bond offerings. Journal of Accounting Research 39 (3): 643–62.
Pandit, S., R. Willis, and L. Zhou. 2012. Security analysts, cash flow forecasts, and turnover. Interna-
tional Journal of Forecasting 28 (4): 874–90.
Penman, S. 2001. Financial statement analysis and security valuation. New York: McGraw-Hill Irwin.
Radhakrishnan, S., and S. L. Wu. 2014. Analysts’ cash flow forecasts and accrual mispricing. Contempo-
rary Accounting Research 31 (4): 1191–219.
Rego, S., and R. J. Wilson. 2012. Equity risk incentives and corporate tax aggressiveness. Journal of
Accounting Research 50 (3): 775–810.
Robinson, J., S. Sikes, and C. Weaver. 2010. Performance measurement of corporate tax departments.
The Accounting Review 85 (3): 1035–64.
Roychowdhury, S. 2006. Earnings management through real activities manipulation. Journal of Account-
ing and Economics 42 (3): 335–80.
Saavedra, D. 2015. Tax spike firms. Working paper, University of California at Los Angeles.
Weisbach, D. A. 2002. Ten truths about tax shelters. Tax Law Review 55 (May): 215.
Wilson, R. 2009. An examination of corporate tax shelter participants. The Accounting Review 84 (3):
969–99.
Yu, F. 2008. Analyst coverage and earnings management. Journal of Financial Economics 88 (2): 245–71.
Analysts’ Forecasts and Tax Planning 793
CAR Vol. 35 No. 2 (Summer 2018)
Related Documents