DNCA INVEST Société d'investissement à Capital Variable R.C.S. Luxembourg N° B 125012 Semi-Annual Report as at June 30, 2021

Welcome message from author
This document is posted to help you gain knowledge. Please leave a comment to let me know what you think about it! Share it to your friends and learn new things together.
Transcript
DNCA INVESTSociété d'investissement à Capital Variable
R.C.S. Luxembourg N° B 125012Semi-Annual Report as at June 30, 2021
DNCA INVEST
DNCA INVEST - BEYOND EUROPEAN BOND OPPORTUNITIES
DNCA INVEST - EUROSE
DNCA INVEST - EVOLUTIF
DNCA INVEST - SOUTH EUROPE OPPORTUNITIES
DNCA INVEST - VALUE EUROPE
DNCA INVEST - BEYOND INFRASTRUCTURE & TRANSITION
DNCA INVEST - BEYOND GLOBAL LEADERS
DNCA INVEST - CONVERTIBLES
DNCA INVEST - MIURI
DNCA INVEST - SRI EUROPE GROWTH (formerly DNCA INVEST - EUROPE GROWTH until February 8, 2021)
DNCA INVEST - ARCHER MID-CAP EUROPE
DNCA INVEST - SRI NORDEN EUROPE (formerly DNCA INVEST - NORDEN EUROPE until February 8, 2021)
DNCA INVEST - SERENITE PLUS
DNCA INVEST - VENASQUO
DNCA INVEST - GLOBAL CONVERTIBLES*
DNCA INVEST - ALPHA BONDS
DNCA INVEST - FLEX INFLATION
DNCA INVEST - BEYOND ALTEROSA
DNCA INVEST - BEYOND SEMPEROSA
DNCA INVEST - LAFITENIA SUSTAIN BB (formerly DNCA INVEST - GLOBAL ALPHA until January 25, 2021)
DNCA INVEST - BEYOND CLIMATE
DNCA INVEST - GLOBAL NEW WORLD*
DNCA INVEST - SUSTAINABLE CHINA EQUITY
* Please see Note 1.
No subscription can be received on the basis of these financial statements. Subscriptions are only valid if made on the basis of the current prospectus and relevant Key Investor Information Document ("KIID") which will be accompanied by a copy of the latest available Annual Report including Audited Financial Statements and a copy of the latest available unaudited semi-annual report, if published after such annual report, including audited financial statements.
DNCA INVEST
1
Table of Contents
Board of Directors and Administration 6
General Information 8
Statistics 9
Combined Statement of Net Assets as at June 30, 2021 19
Combined Statement of Operations and Changes in Net Assets for the period ended June 30, 2021 19
DNCA INVEST - BEYOND EUROPEAN BOND OPPORTUNITIES
Statement of Net Assets as at June 30, 2021 20
Statement of Operations and Changes in Net Assets for the period ended June 30, 2021 20
Statement of Changes in Number of Shares 21
Securities Portfolio as at June 30, 2021 22
Financial derivative instruments as at June 30, 2021 23
Portfolio Breakdowns 24
Top Ten Holdings 24
DNCA INVEST - EUROSE
Statement of Net Assets as at June 30, 2021 25
Statement of Operations and Changes in Net Assets for the period ended June 30, 2021 25
Statement of Changes in Number of Shares 26
Securities Portfolio as at June 30, 2021 27
Financial derivative instruments as at June 30, 2021 30
Portfolio Breakdowns 31
Top Ten Holdings 31
DNCA INVEST - EVOLUTIF
Statement of Net Assets as at June 30, 2021 32
Statement of Operations and Changes in Net Assets for the period ended June 30, 2021 32
Statement of Changes in Number of Shares 33
Securities Portfolio as at June 30, 2021 34
Financial derivative instruments as at June 30, 2021 35
Portfolio Breakdowns 36
Top Ten Holdings 36
DNCA INVEST - SOUTH EUROPE OPPORTUNITIES
Statement of Net Assets as at June 30, 2021 37
Statement of Operations and Changes in Net Assets for the period ended June 30, 2021 37
Statement of Changes in Number of Shares 38
Securities Portfolio as at June 30, 2021 39
Portfolio Breakdowns 40
Top Ten Holdings 40
DNCA INVEST
2
Table of Contents
DNCA INVEST - VALUE EUROPE
Statement of Net Assets as at June 30, 2021 41
Statement of Operations and Changes in Net Assets for the period ended June 30, 2021 41
Statement of Changes in Number of Shares 42
Securities Portfolio as at June 30, 2021 43
Financial derivative instruments as at June 30, 2021 43
Portfolio Breakdowns 45
Top Ten Holdings 45
DNCA INVEST - BEYOND INFRASTRUCTURE & TRANSITION
Statement of Net Assets as at June 30, 2021 46
Statement of Operations and Changes in Net Assets for the period ended June 30, 2021 46
Statement of Changes in Number of Shares 47
Securities Portfolio as at June 30, 2021 48
Portfolio Breakdowns 49
Top Ten Holdings 49
DNCA INVEST - BEYOND GLOBAL LEADERS
Statement of Net Assets as at June 30, 2021 50
Statement of Operations and Changes in Net Assets for the period ended June 30, 2021 50
Statement of Changes in Number of Shares 51
Securities Portfolio as at June 30, 2021 52
Financial derivative instruments as at June 30, 2021 52
Portfolio Breakdowns 53
Top Ten Holdings 53
DNCA INVEST - CONVERTIBLES
Statement of Net Assets as at June 30, 2021 54
Statement of Operations and Changes in Net Assets for the period ended June 30, 2021 54
Statement of Changes in Number of Shares 55
Securities Portfolio as at June 30, 2021 56
Financial derivative instruments as at June 30, 2021 57
Portfolio Breakdowns 58
Top Ten Holdings 58
DNCA INVEST - MIURI
Statement of Net Assets as at June 30, 2021 59
Statement of Operations and Changes in Net Assets for the period ended June 30, 2021 59
Statement of Changes in Number of Shares 60
Securities Portfolio as at June 30, 2021 61
Financial derivative instruments as at June 30, 2021 61
Portfolio Breakdowns 63
Top Ten Holdings 63
DNCA INVEST
3
Table of Contents
DNCA INVEST - SRI EUROPE GROWTH (formerly DNCA INVEST - EUROPE GROWTH until February 8, 2021)
Statement of Net Assets as at June 30, 2021 64
Statement of Operations and Changes in Net Assets for the period ended June 30, 2021 64
Statement of Changes in Number of Shares 65
Securities Portfolio as at June 30, 2021 66
Financial derivative instruments as at June 30, 2021 66
Portfolio Breakdowns 67
Top Ten Holdings 67
DNCA INVEST - ARCHER MID-CAP EUROPE
Statement of Net Assets as at June 30, 2021 68
Statement of Operations and Changes in Net Assets for the period ended June 30, 2021 68
Statement of Changes in Number of Shares 69
Securities Portfolio as at June 30, 2021 70
Portfolio Breakdowns 71
Top Ten Holdings 71
DNCA INVEST - SRI NORDEN EUROPE (formerly DNCA INVEST - NORDEN EUROPE until February 8, 2021)
Statement of Net Assets as at June 30, 2021 72
Statement of Operations and Changes in Net Assets for the period ended June 30, 2021 72
Statement of Changes in Number of Shares 73
Securities Portfolio as at June 30, 2021 74
Portfolio Breakdowns 75
Top Ten Holdings 75
DNCA INVEST - SERENITE PLUS
Statement of Net Assets as at June 30, 2021 76
Statement of Operations and Changes in Net Assets for the period ended June 30, 2021 76
Statement of Changes in Number of Shares 77
Securities Portfolio as at June 30, 2021 78
Financial derivative instruments as at June 30, 2021 79
Portfolio Breakdowns 80
Top Ten Holdings 80
DNCA INVEST - VENASQUO
Statement of Net Assets as at June 30, 2021 81
Statement of Operations and Changes in Net Assets for the period ended June 30, 2021 81
Statement of Changes in Number of Shares 82
Securities Portfolio as at June 30, 2021 83
Financial derivative instruments as at June 30, 2021 83
Portfolio Breakdowns 85
Top Ten Holdings 85
DNCA INVEST
4
Table of Contents
DNCA INVEST - GLOBAL CONVERTIBLES*
Statement of Net Assets as at June 30, 2021 86
Statement of Operations and Changes in Net Assets for the period ended June 30, 2021 86
Statement of Changes in Number of Shares 87
DNCA INVEST - ALPHA BONDS
Statement of Net Assets as at June 30, 2021 88
Statement of Operations and Changes in Net Assets for the period ended June 30, 2021 88
Statement of Changes in Number of Shares 89
Securities Portfolio as at June 30, 2021 90
Financial derivative instruments as at June 30, 2021 90
Portfolio Breakdowns 92
Top Ten Holdings 92
DNCA INVEST - FLEX INFLATION
Statement of Net Assets as at June 30, 2021 93
Statement of Operations and Changes in Net Assets for the period ended June 30, 2021 93
Statement of Changes in Number of Shares 94
Securities Portfolio as at June 30, 2021 95
Financial derivative instruments as at June 30, 2021 95
Portfolio Breakdowns 96
Top Ten Holdings 96
DNCA INVEST - BEYOND ALTEROSA
Statement of Net Assets as at June 30, 2021 97
Statement of Operations and Changes in Net Assets for the period ended June 30, 2021 97
Statement of Changes in Number of Shares 98
Securities Portfolio as at June 30, 2021 99
Financial derivative instruments as at June 30, 2021 100
Portfolio Breakdowns 102
Top Ten Holdings 102
DNCA INVEST - BEYOND SEMPEROSA
Statement of Net Assets as at June 30, 2021 103
Statement of Operations and Changes in Net Assets for the period ended June 30, 2021 103
Statement of Changes in Number of Shares 104
Securities Portfolio as at June 30, 2021 105
Portfolio Breakdowns 106
Top Ten Holdings 106
* Please see Note 1.
DNCA INVEST
5
Table of Contents
DNCA INVEST - LAFITENIA SUSTAIN BB (formerly DNCA INVEST - GLOBAL ALPHA until January 25, 2021)
Statement of Net Assets as at June 30, 2021 107
Statement of Operations and Changes in Net Assets for the period ended June 30, 2021 107
Statement of Changes in Number of Shares 108
Securities Portfolio as at June 30, 2021 109
Financial derivative instruments as at June 30, 2021 110
Portfolio Breakdowns 111
Top Ten Holdings 111
DNCA INVEST - BEYOND CLIMATE
Statement of Net Assets as at June 30, 2021 112
Statement of Operations and Changes in Net Assets for the period ended June 30, 2021 112
Statement of Changes in Number of Shares 113
Securities Portfolio as at June 30, 2021 114
Portfolio Breakdowns 115
Top Ten Holdings 115
DNCA INVEST - GLOBAL NEW WORLD*
Statement of Net Assets as at June 30, 2021 116
Statement of Operations and Changes in Net Assets for the period ended June 30, 2021 116
Statement of Changes in Number of Shares 117
Securities Portfolio as at June 30, 2021 118
Portfolio Breakdowns 119
Top Ten Holdings 119
DNCA INVEST - SUSTAINABLE CHINA EQUITY
Statement of Net Assets as at June 30, 2021 120
Statement of Operations and Changes in Net Assets for the period ended June 30, 2021 120
Statement of Changes in Number of Shares 121
Securities Portfolio as at June 30, 2021 122
Portfolio Breakdowns 123
Top Ten Holdings 123
Notes to the Financial Statements as at June 30, 2021 124
Additional Information 140
* Please see Note 1.
DNCA INVEST
6
Board of Directors and Administration Registered office 60, Avenue J.F. Kennedy L-1855 Luxembourg Board of Directors of the Fund Chairman Jean-Charles MERIAUX Chief Investment Officer DNCA Finance, Paris Directors Grégoire SCHEIFF Chief Operating Officer DNCA Finance, Paris Luc REGENT Director Thomas PEAN (since January 20, 2021) Director of Development North Europe, DNCA Finance, DNCA Finance Luxembourg Branch, Luxembourg Pascal DELAUNAY (since January 20, 2021) Director Management Company DNCA Finance 19, Place Vendôme F-75001 Paris Supervisory Committee of the Management Company Jean RABY President of Supervisory Committee Jean-Charles MERIAUX Director, Chief Investment Officer DNCA Finance, Paris NATIXIS MANAGEMENT COMPANY S.A Director Cyril MARIE Director Grégoire SCHEIFF Director, Chief Operating Officer DNCA Finance, Paris Directors of the Management Company Jean-Charles MERIAUX Chief Investment Officer DNCA Finance, Paris Eric FRANC General manager DNCA Finance, Paris Grégoire SCHEIFF Chief Operating Officer DNCA Finance, Paris Investment Manager DNCA Finance 19, Place Vendôme F-75001 Paris
DNCA INVEST
7
Board of Directors and Administration (continued) Administrative Agent, Depositary, Domiciliary Agent, Principal Paying Agent, Registrar and Transfer Agent BNP Paribas Securities Services - Luxembourg Branch 60, Avenue J.F. Kennedy L-1855 Luxembourg Authorised Auditor Deloitte Audit Société à responsabilité limitée 20, Boulevard de Kockelscheuer L-1821 Luxembourg Legal Advisors for Luxembourg Elvinger Hoss Prussen, société anonyme 2, Place Winston Churchill L-1340 Luxembourg for Germany STARKE LEGAL Eschenheimer Anlage 28 D-60318 Frankfurt am Main for Italy STUDIO GULLO Via Montesanto, 68 I-00195 Rome Distributors NIM S.A. 2, rue Jean Monnet L-2180 Luxembourg Fund agency services provider Brown Brothers Harriman (Luxembourg) S.C.A. 2-8, Avenue Charles de Gaulle L-1653 Luxembourg Swiss Representative Carnegie Fund Services S.A. 11, rue du Général-Dufour CH-1211 Genève 11 Local paying agent for Switzerland Banque Cantonale de Genève 17, quai de l'Ile CH-1204 Genève
DNCA INVEST
8
Organisation
DNCA INVEST (the "Fund") is an investment company organised as a société anonyme under part I of the Luxembourg Law of December 17, 2010on undertakings for collective investment in transferable securities (UCITS) as amended (the “2010 Law”) and qualifies as a sociétéd'investissement à capital variable (SICAV).
The Fund was incorporated in Luxembourg under the name of LEONARDO INVEST on February 12, 2007 for an unlimited period with an initialshare capital of EUR 31,000. Its Articles of Incorporation have been published in the Mémorial C, Recueil des Sociétés et Associations (the"Mémorial") on March 26, 2007. The Articles of Incorporation of the Fund have been amended on March 6, 2007 to change the name of the Fundfrom LEONARDO INVEST into LEONARDO INVEST FUND. Such amendment has been published in the Mémorial on March 26, 2007. The Articlesof Incorporation have been amended on 31 August 2007 to change the name of the Fund to LEONARDO INVEST. Such amendment was publishedin the Mémorial on 19 October 2007. The Articles of Incorporation have been amended on 20 January 2011 to change the name of the Fund toDNCA Invest. Such amendment was published in the Mémorial on February 24, 2011. The Articles of Incorporation have been amended for the lasttime on June 5, 2019 and were published in the RESA under number RESA_2019_156 on July 8, 2019. The Fund is registered with the Registre deCommerce et des Sociétés of Luxembourg, under number B 125012.
The minimum capital of the Fund required by Luxembourg law is EUR 1,250,000 to be reached within 6 months from the launch of the Fund.
Meetings
The annual general meeting of shareholders shall be held, in accordance with the Luxembourg law, at the registered office of the Fund, or at suchother place in the Grand Duchy of Luxembourg as may be specified in the notice of the meeting, at any date and time decided by the Board ofDirectors but no later than within six (6) months from the end of the previous financial year. The annual general meeting may be held abroad if, inthe absolute and final judgment of the Board of Directors, exceptional circumstances so require.
Reports and Accounts
Annual Reports, including Audited Financial Statements are published within 4 months following the end of the accounting year and unaudited semi-annual reports are published within 2 months following the period to which they refer. The annual reports, including financial statements are sent toeach registered shareholder at the address shown on the register of shareholders. The first report prepared by the Fund was the unaudited semi-annual report dated June 30, 2007. The Fund's accounting year begins on 1 January and ends on 31 December in each year and was prepared forthe first time on December 31, 2007.
The reference currency of the Fund is the EUR. The aforesaid reports comprise combined financial statements of the Fund expressed in EUR aswell as individual information on each Sub-Fund expressed in the Reference Currency of each Sub-Fund.
Documents
Copies of the Articles of Incorporation of the Fund, the current Prospectus and the latest annual report, including audited financial statements maybe obtained free of charge during normal office hours at the registered office of the Fund in Luxembourg or on the Management Company website:www.dnca-investments.com
General Information
DNCA INVEST
9
The accompanying notes are an integral part of these financial statements.
Statistics
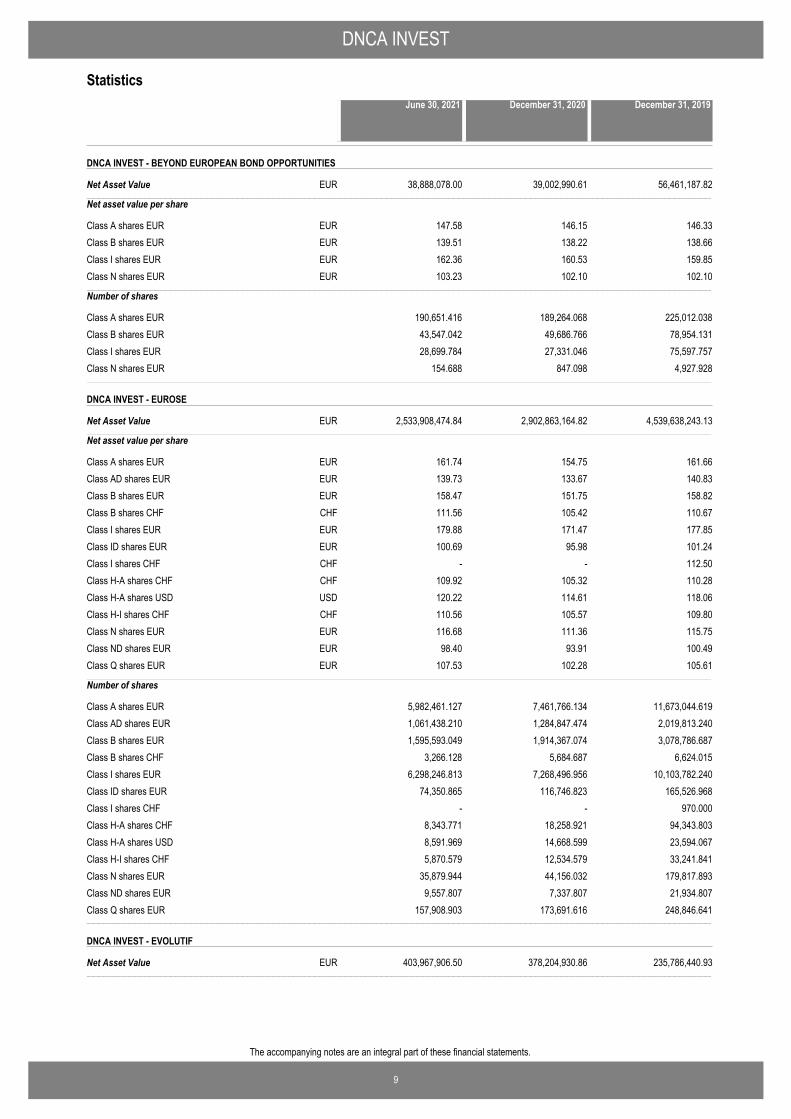
DNCA INVEST - BEYOND EUROPEAN BOND OPPORTUNITIES
Net Asset Value−−−−−−−−−−−−−−−−−−−−−−−−−−−−−−−−−−−−−−−−−−−−−−−−−−−−−−−−−−−−−−−−−−−−−−−−−−−−−−−−−−−−−−−−−−−−−−−−−−−−−−−−−−−−−−−−−−−−−−−−−−−−−−−−−−−−−−−−−−−−−−−−−−−−−−−−−−−−−−−−−−−−−−−−−−−−−−−−−−−−−−−−−−−−−−−−−−−−−−−−−−−−−−−−−−−−−−−−−−−−−−−−−−−−−−−−−−−−−−−−−−−−−−−−−−−−−−−−−−−−−−−−−−−−−−−−−−−−−−−−−−−−−−−−−−−−−−−−−−−−−−−−−−−−−−−−−−−−−−−−−−−−−−−−−−−−−−−−−−−−−−−−−−−−−−−−−−−−−−−−−−−−−−−−−−−−−−−−−−−−−−−−−−−−−−−−−−−−−−−−−−−−−−−−−−−−−−−−−−−−−−−−−−−−−−−−−−−−−−−−−−−−−−−−−−−−−−−−−−−−−−−−−−−−−−−−−−−−−−−−−−−−−−−−−−−−−−−−−−−−−−−
38,888,078.00 39,002,990.61 56,461,187.82EUR
Net asset value per share
Class A shares EUR 147.58 146.15 146.33EURClass B shares EUR 139.51 138.22 138.66EURClass I shares EUR 162.36 160.53 159.85EURClass N shares EUR 103.23 102.10 102.10EUR−−−−−−−−−−−−−−−−−−−−−−−−−−−−−−−−−−−−−−−−−−−−−−−−−−−−−−−−−−−−−−−−−−−−−−−−−−−−−−−−−−−−−−−−−−−−−−−−−−−−−−−−−−−−−−−−−−−−−−−−−−−−−−−−−−−−−−−−−−−−−−−−−−−−−−−−−−−−−−−−−−−−−−−−−−−−−−−−−−−−−−−−−−−−−−−−−−−−−−−−−−−−−−−−−−−−−−−−−−−−−−−−−−−−−−−−−−−−−−−−−−−−−−−−−−−−−−−−−−−−−−−−−−−−−−−−−−−−−−−−−−−−−−−−−−−−−−−−−−−−−−−−−−−−−−−−−−−−−−−−−−−−−−−−−−−−−−−−−−−−−−−−−−−−−−−−−−−−−−−−−−−−−−−−−−−−−−−−−−−−−−−−−−−−−−−−−−−−−−−−−−−−−−−−−−−−−−−−−−−−−−−−−−−−−−−−−−−−−−−−−−−−−−−−−−−−−−−−−−−−−−−−−−−−−−−−−−−−−−−−−−−−−−−−−−−−−−−−−−−−−−−
Number of shares
Class A shares EUR 190,651.416 189,264.068 225,012.038Class B shares EUR 43,547.042 49,686.766 78,954.131Class I shares EUR 28,699.784 27,331.046 75,597.757Class N shares EUR 154.688 847.098 4,927.928−−−−−−−−−−−−−−−−−−−−−−−−−−−−−−−−−−−−−−−−−−−−−−−−−−−−−−−−−−−−−−−−−−−−−−−−−−−−−−−−−−−−−−−−−−−−−−−−−−−−−−−−−−−−−−−−−−−−−−−−−−−−−−−−−−−−−−−−−−−−−−−−−−−−−−−−−−−−−−−−−−−−−−−−−−−−−−−−−−−−−−−−−−−−−−−−−−−−−−−−−−−−−−−−−−−−−−−−−−−−−−−−−−−−−−−−−−−−−−−−−−−−−−−−−−−−−−−−−−−−−−−−−−−−−−−−−−−−−−−−−−−−−−−−−−−−−−−−−−−−−−−−−−−−−−−−−−−−−−−−−−−−−−−−−−−−−−−−−−−−−−−−−−−−−−−−−−−−−−−−−−−−−−−−−−−−−−−−−−−−−−−−−−−−−−−−−−−−−−−−−−−−−−−−−−−−−−−−−−−−−−−−−−−−−−−−−−−−−−−−−−−−−−−−−−−−−−−−−−−−−−−−−−−−−−−−−−−−−−−−−−−−−−−−−−−−−−−−−−−−−−−
DNCA INVEST - EUROSE
Net Asset Value−−−−−−−−−−−−−−−−−−−−−−−−−−−−−−−−−−−−−−−−−−−−−−−−−−−−−−−−−−−−−−−−−−−−−−−−−−−−−−−−−−−−−−−−−−−−−−−−−−−−−−−−−−−−−−−−−−−−−−−−−−−−−−−−−−−−−−−−−−−−−−−−−−−−−−−−−−−−−−−−−−−−−−−−−−−−−−−−−−−−−−−−−−−−−−−−−−−−−−−−−−−−−−−−−−−−−−−−−−−−−−−−−−−−−−−−−−−−−−−−−−−−−−−−−−−−−−−−−−−−−−−−−−−−−−−−−−−−−−−−−−−−−−−−−−−−−−−−−−−−−−−−−−−−−−−−−−−−−−−−−−−−−−−−−−−−−−−−−−−−−−−−−−−−−−−−−−−−−−−−−−−−−−−−−−−−−−−−−−−−−−−−−−−−−−−−−−−−−−−−−−−−−−−−−−−−−−−−−−−−−−−−−−−−−−−−−−−−−−−−−−−−−−−−−−−−−−−−−−−−−−−−−−−−−−−−−−−−−−−−−−−−−−−−−−−−−−−−−−−−−−−
2,533,908,474.84 2,902,863,164.82 4,539,638,243.13EUR
Net asset value per share
Class A shares EUR 161.74 154.75 161.66EURClass AD shares EUR 139.73 133.67 140.83EURClass B shares EUR 158.47 151.75 158.82EURClass B shares CHF 111.56 105.42 110.67CHFClass I shares EUR 179.88 171.47 177.85EURClass ID shares EUR 100.69 95.98 101.24EURClass I shares CHF - - 112.50CHFClass H-A shares CHF 109.92 105.32 110.28CHFClass H-A shares USD 120.22 114.61 118.06USDClass H-I shares CHF 110.56 105.57 109.80CHFClass N shares EUR 116.68 111.36 115.75EURClass ND shares EUR 98.40 93.91 100.49EURClass Q shares EUR 107.53 102.28 105.61EUR−−−−−−−−−−−−−−−−−−−−−−−−−−−−−−−−−−−−−−−−−−−−−−−−−−−−−−−−−−−−−−−−−−−−−−−−−−−−−−−−−−−−−−−−−−−−−−−−−−−−−−−−−−−−−−−−−−−−−−−−−−−−−−−−−−−−−−−−−−−−−−−−−−−−−−−−−−−−−−−−−−−−−−−−−−−−−−−−−−−−−−−−−−−−−−−−−−−−−−−−−−−−−−−−−−−−−−−−−−−−−−−−−−−−−−−−−−−−−−−−−−−−−−−−−−−−−−−−−−−−−−−−−−−−−−−−−−−−−−−−−−−−−−−−−−−−−−−−−−−−−−−−−−−−−−−−−−−−−−−−−−−−−−−−−−−−−−−−−−−−−−−−−−−−−−−−−−−−−−−−−−−−−−−−−−−−−−−−−−−−−−−−−−−−−−−−−−−−−−−−−−−−−−−−−−−−−−−−−−−−−−−−−−−−−−−−−−−−−−−−−−−−−−−−−−−−−−−−−−−−−−−−−−−−−−−−−−−−−−−−−−−−−−−−−−−−−−−−−−−−−−−
Number of shares
Class A shares EUR 5,982,461.127 7,461,766.134 11,673,044.619Class AD shares EUR 1,061,438.210 1,284,847.474 2,019,813.240Class B shares EUR 1,595,593.049 1,914,367.074 3,078,786.687Class B shares CHF 3,266.128 5,684.687 6,624.015Class I shares EUR 6,298,246.813 7,268,496.956 10,103,782.240Class ID shares EUR 74,350.865 116,746.823 165,526.968Class I shares CHF - - 970.000Class H-A shares CHF 8,343.771 18,258.921 94,343.803Class H-A shares USD 8,591.969 14,668.599 23,594.067Class H-I shares CHF 5,870.579 12,534.579 33,241.841Class N shares EUR 35,879.944 44,156.032 179,817.893Class ND shares EUR 9,557.807 7,337.807 21,934.807Class Q shares EUR 157,908.903 173,691.616 248,846.641−−−−−−−−−−−−−−−−−−−−−−−−−−−−−−−−−−−−−−−−−−−−−−−−−−−−−−−−−−−−−−−−−−−−−−−−−−−−−−−−−−−−−−−−−−−−−−−−−−−−−−−−−−−−−−−−−−−−−−−−−−−−−−−−−−−−−−−−−−−−−−−−−−−−−−−−−−−−−−−−−−−−−−−−−−−−−−−−−−−−−−−−−−−−−−−−−−−−−−−−−−−−−−−−−−−−−−−−−−−−−−−−−−−−−−−−−−−−−−−−−−−−−−−−−−−−−−−−−−−−−−−−−−−−−−−−−−−−−−−−−−−−−−−−−−−−−−−−−−−−−−−−−−−−−−−−−−−−−−−−−−−−−−−−−−−−−−−−−−−−−−−−−−−−−−−−−−−−−−−−−−−−−−−−−−−−−−−−−−−−−−−−−−−−−−−−−−−−−−−−−−−−−−−−−−−−−−−−−−−−−−−−−−−−−−−−−−−−−−−−−−−−−−−−−−−−−−−−−−−−−−−−−−−−−−−−−−−−−−−−−−−−−−−−−−−−−−−−−−−−−−−
DNCA INVEST - EVOLUTIF
Net Asset Value−−−−−−−−−−−−−−−−−−−−−−−−−−−−−−−−−−−−−−−−−−−−−−−−−−−−−−−−−−−−−−−−−−−−−−−−−−−−−−−−−−−−−−−−−−−−−−−−−−−−−−−−−−−−−−−−−−−−−−−−−−−−−−−−−−−−−−−−−−−−−−−−−−−−−−−−−−−−−−−−−−−−−−−−−−−−−−−−−−−−−−−−−−−−−−−−−−−−−−−−−−−−−−−−−−−−−−−−−−−−−−−−−−−−−−−−−−−−−−−−−−−−−−−−−−−−−−−−−−−−−−−−−−−−−−−−−−−−−−−−−−−−−−−−−−−−−−−−−−−−−−−−−−−−−−−−−−−−−−−−−−−−−−−−−−−−−−−−−−−−−−−−−−−−−−−−−−−−−−−−−−−−−−−−−−−−−−−−−−−−−−−−−−−−−−−−−−−−−−−−−−−−−−−−−−−−−−−−−−−−−−−−−−−−−−−−−−−−−−−−−−−−−−−−−−−−−−−−−−−−−−−−−−−−−−−−−−−−−−−−−−−−−−−−−−−−−−−−−−−−−−−
403,967,906.50 378,204,930.86 235,786,440.93EUR
December 31, 2019June 30, 2021 December 31, 2020
DNCA INVEST
10
The accompanying notes are an integral part of these financial statements.
Statistics
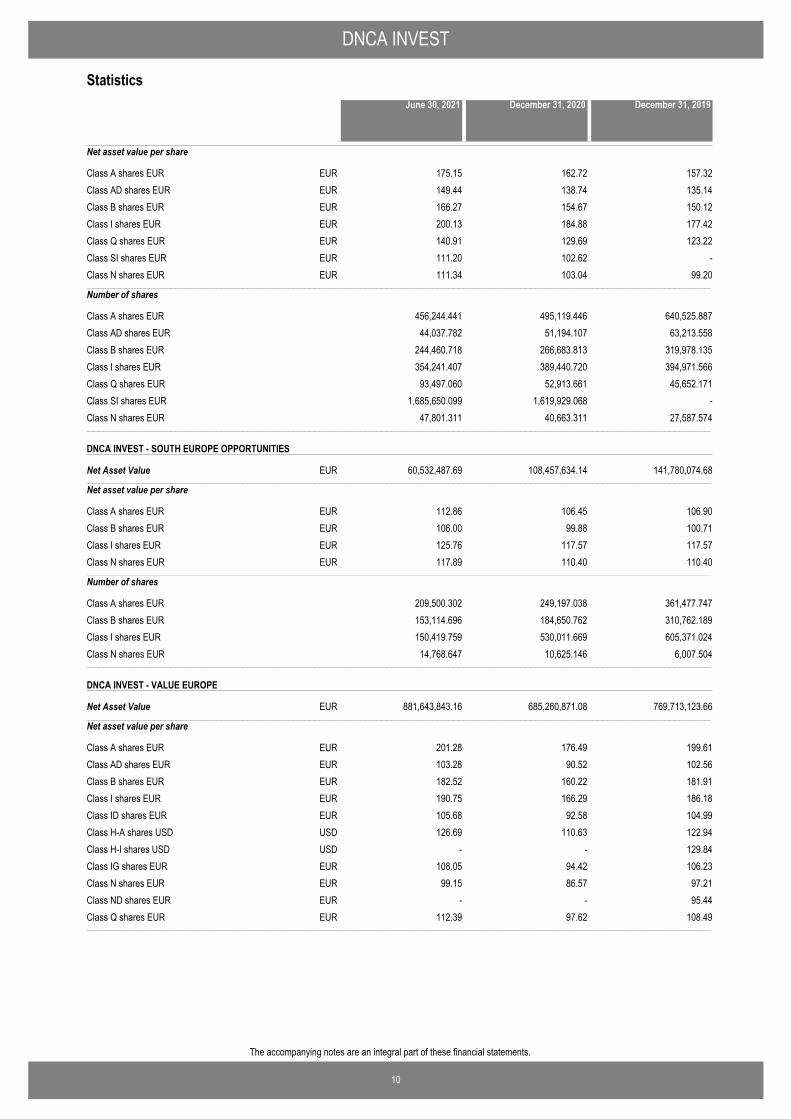
Net asset value per share
Class A shares EUR 175.15 162.72 157.32EURClass AD shares EUR 149.44 138.74 135.14EURClass B shares EUR 166.27 154.67 150.12EURClass I shares EUR 200.13 184.88 177.42EURClass Q shares EUR 140.91 129.69 123.22EURClass SI shares EUR 111.20 102.62 -EURClass N shares EUR 111.34 103.04 99.20EUR−−−−−−−−−−−−−−−−−−−−−−−−−−−−−−−−−−−−−−−−−−−−−−−−−−−−−−−−−−−−−−−−−−−−−−−−−−−−−−−−−−−−−−−−−−−−−−−−−−−−−−−−−−−−−−−−−−−−−−−−−−−−−−−−−−−−−−−−−−−−−−−−−−−−−−−−−−−−−−−−−−−−−−−−−−−−−−−−−−−−−−−−−−−−−−−−−−−−−−−−−−−−−−−−−−−−−−−−−−−−−−−−−−−−−−−−−−−−−−−−−−−−−−−−−−−−−−−−−−−−−−−−−−−−−−−−−−−−−−−−−−−−−−−−−−−−−−−−−−−−−−−−−−−−−−−−−−−−−−−−−−−−−−−−−−−−−−−−−−−−−−−−−−−−−−−−−−−−−−−−−−−−−−−−−−−−−−−−−−−−−−−−−−−−−−−−−−−−−−−−−−−−−−−−−−−−−−−−−−−−−−−−−−−−−−−−−−−−−−−−−−−−−−−−−−−−−−−−−−−−−−−−−−−−−−−−−−−−−−−−−−−−−−−−−−−−−−−−−−−−−−−
Number of shares
Class A shares EUR 456,244.441 495,119.446 640,525.887Class AD shares EUR 44,037.782 51,194.107 63,213.558Class B shares EUR 244,460.718 266,683.813 319,978.135Class I shares EUR 354,241.407 389,440.720 394,971.566Class Q shares EUR 93,497.060 52,913.661 45,652.171Class SI shares EUR 1,685,650.099 1,619,929.068 -Class N shares EUR 47,801.311 40,663.311 27,587.574−−−−−−−−−−−−−−−−−−−−−−−−−−−−−−−−−−−−−−−−−−−−−−−−−−−−−−−−−−−−−−−−−−−−−−−−−−−−−−−−−−−−−−−−−−−−−−−−−−−−−−−−−−−−−−−−−−−−−−−−−−−−−−−−−−−−−−−−−−−−−−−−−−−−−−−−−−−−−−−−−−−−−−−−−−−−−−−−−−−−−−−−−−−−−−−−−−−−−−−−−−−−−−−−−−−−−−−−−−−−−−−−−−−−−−−−−−−−−−−−−−−−−−−−−−−−−−−−−−−−−−−−−−−−−−−−−−−−−−−−−−−−−−−−−−−−−−−−−−−−−−−−−−−−−−−−−−−−−−−−−−−−−−−−−−−−−−−−−−−−−−−−−−−−−−−−−−−−−−−−−−−−−−−−−−−−−−−−−−−−−−−−−−−−−−−−−−−−−−−−−−−−−−−−−−−−−−−−−−−−−−−−−−−−−−−−−−−−−−−−−−−−−−−−−−−−−−−−−−−−−−−−−−−−−−−−−−−−−−−−−−−−−−−−−−−−−−−−−−−−−−−
DNCA INVEST - SOUTH EUROPE OPPORTUNITIES
Net Asset Value−−−−−−−−−−−−−−−−−−−−−−−−−−−−−−−−−−−−−−−−−−−−−−−−−−−−−−−−−−−−−−−−−−−−−−−−−−−−−−−−−−−−−−−−−−−−−−−−−−−−−−−−−−−−−−−−−−−−−−−−−−−−−−−−−−−−−−−−−−−−−−−−−−−−−−−−−−−−−−−−−−−−−−−−−−−−−−−−−−−−−−−−−−−−−−−−−−−−−−−−−−−−−−−−−−−−−−−−−−−−−−−−−−−−−−−−−−−−−−−−−−−−−−−−−−−−−−−−−−−−−−−−−−−−−−−−−−−−−−−−−−−−−−−−−−−−−−−−−−−−−−−−−−−−−−−−−−−−−−−−−−−−−−−−−−−−−−−−−−−−−−−−−−−−−−−−−−−−−−−−−−−−−−−−−−−−−−−−−−−−−−−−−−−−−−−−−−−−−−−−−−−−−−−−−−−−−−−−−−−−−−−−−−−−−−−−−−−−−−−−−−−−−−−−−−−−−−−−−−−−−−−−−−−−−−−−−−−−−−−−−−−−−−−−−−−−−−−−−−−−−−−
60,532,487.69 108,457,634.14 141,780,074.68EUR
Net asset value per share
Class A shares EUR 112.86 106.45 106.90EURClass B shares EUR 106.00 99.88 100.71EURClass I shares EUR 125.76 117.57 117.57EURClass N shares EUR 117.89 110.40 110.40EUR−−−−−−−−−−−−−−−−−−−−−−−−−−−−−−−−−−−−−−−−−−−−−−−−−−−−−−−−−−−−−−−−−−−−−−−−−−−−−−−−−−−−−−−−−−−−−−−−−−−−−−−−−−−−−−−−−−−−−−−−−−−−−−−−−−−−−−−−−−−−−−−−−−−−−−−−−−−−−−−−−−−−−−−−−−−−−−−−−−−−−−−−−−−−−−−−−−−−−−−−−−−−−−−−−−−−−−−−−−−−−−−−−−−−−−−−−−−−−−−−−−−−−−−−−−−−−−−−−−−−−−−−−−−−−−−−−−−−−−−−−−−−−−−−−−−−−−−−−−−−−−−−−−−−−−−−−−−−−−−−−−−−−−−−−−−−−−−−−−−−−−−−−−−−−−−−−−−−−−−−−−−−−−−−−−−−−−−−−−−−−−−−−−−−−−−−−−−−−−−−−−−−−−−−−−−−−−−−−−−−−−−−−−−−−−−−−−−−−−−−−−−−−−−−−−−−−−−−−−−−−−−−−−−−−−−−−−−−−−−−−−−−−−−−−−−−−−−−−−−−−−−
Number of shares
Class A shares EUR 209,500.302 249,197.038 361,477.747Class B shares EUR 153,114.696 184,650.762 310,762.189Class I shares EUR 150,419.759 530,011.669 605,371.024Class N shares EUR 14,768.647 10,625.146 6,007.504−−−−−−−−−−−−−−−−−−−−−−−−−−−−−−−−−−−−−−−−−−−−−−−−−−−−−−−−−−−−−−−−−−−−−−−−−−−−−−−−−−−−−−−−−−−−−−−−−−−−−−−−−−−−−−−−−−−−−−−−−−−−−−−−−−−−−−−−−−−−−−−−−−−−−−−−−−−−−−−−−−−−−−−−−−−−−−−−−−−−−−−−−−−−−−−−−−−−−−−−−−−−−−−−−−−−−−−−−−−−−−−−−−−−−−−−−−−−−−−−−−−−−−−−−−−−−−−−−−−−−−−−−−−−−−−−−−−−−−−−−−−−−−−−−−−−−−−−−−−−−−−−−−−−−−−−−−−−−−−−−−−−−−−−−−−−−−−−−−−−−−−−−−−−−−−−−−−−−−−−−−−−−−−−−−−−−−−−−−−−−−−−−−−−−−−−−−−−−−−−−−−−−−−−−−−−−−−−−−−−−−−−−−−−−−−−−−−−−−−−−−−−−−−−−−−−−−−−−−−−−−−−−−−−−−−−−−−−−−−−−−−−−−−−−−−−−−−−−−−−−−−
DNCA INVEST - VALUE EUROPE
Net Asset Value−−−−−−−−−−−−−−−−−−−−−−−−−−−−−−−−−−−−−−−−−−−−−−−−−−−−−−−−−−−−−−−−−−−−−−−−−−−−−−−−−−−−−−−−−−−−−−−−−−−−−−−−−−−−−−−−−−−−−−−−−−−−−−−−−−−−−−−−−−−−−−−−−−−−−−−−−−−−−−−−−−−−−−−−−−−−−−−−−−−−−−−−−−−−−−−−−−−−−−−−−−−−−−−−−−−−−−−−−−−−−−−−−−−−−−−−−−−−−−−−−−−−−−−−−−−−−−−−−−−−−−−−−−−−−−−−−−−−−−−−−−−−−−−−−−−−−−−−−−−−−−−−−−−−−−−−−−−−−−−−−−−−−−−−−−−−−−−−−−−−−−−−−−−−−−−−−−−−−−−−−−−−−−−−−−−−−−−−−−−−−−−−−−−−−−−−−−−−−−−−−−−−−−−−−−−−−−−−−−−−−−−−−−−−−−−−−−−−−−−−−−−−−−−−−−−−−−−−−−−−−−−−−−−−−−−−−−−−−−−−−−−−−−−−−−−−−−−−−−−−−−−
881,643,843.16 685,260,871.08 769,713,123.66EUR
Net asset value per share
Class A shares EUR 201.28 176.49 199.61EURClass AD shares EUR 103.28 90.52 102.56EURClass B shares EUR 182.52 160.22 181.91EURClass I shares EUR 190.75 166.29 186.18EURClass ID shares EUR 105.68 92.58 104.99EURClass H-A shares USD 126.69 110.63 122.94USDClass H-I shares USD - - 129.84USDClass IG shares EUR 108.05 94.42 106.23EURClass N shares EUR 99.15 86.57 97.21EURClass ND shares EUR - - 95.44EURClass Q shares EUR 112.39 97.62 108.49EUR−−−−−−−−−−−−−−−−−−−−−−−−−−−−−−−−−−−−−−−−−−−−−−−−−−−−−−−−−−−−−−−−−−−−−−−−−−−−−−−−−−−−−−−−−−−−−−−−−−−−−−−−−−−−−−−−−−−−−−−−−−−−−−−−−−−−−−−−−−−−−−−−−−−−−−−−−−−−−−−−−−−−−−−−−−−−−−−−−−−−−−−−−−−−−−−−−−−−−−−−−−−−−−−−−−−−−−−−−−−−−−−−−−−−−−−−−−−−−−−−−−−−−−−−−−−−−−−−−−−−−−−−−−−−−−−−−−−−−−−−−−−−−−−−−−−−−−−−−−−−−−−−−−−−−−−−−−−−−−−−−−−−−−−−−−−−−−−−−−−−−−−−−−−−−−−−−−−−−−−−−−−−−−−−−−−−−−−−−−−−−−−−−−−−−−−−−−−−−−−−−−−−−−−−−−−−−−−−−−−−−−−−−−−−−−−−−−−−−−−−−−−−−−−−−−−−−−−−−−−−−−−−−−−−−−−−−−−−−−−−−−−−−−−−−−−−−−−−−−−−−−−
December 31, 2019June 30, 2021 December 31, 2020
DNCA INVEST
11
The accompanying notes are an integral part of these financial statements.
Statistics
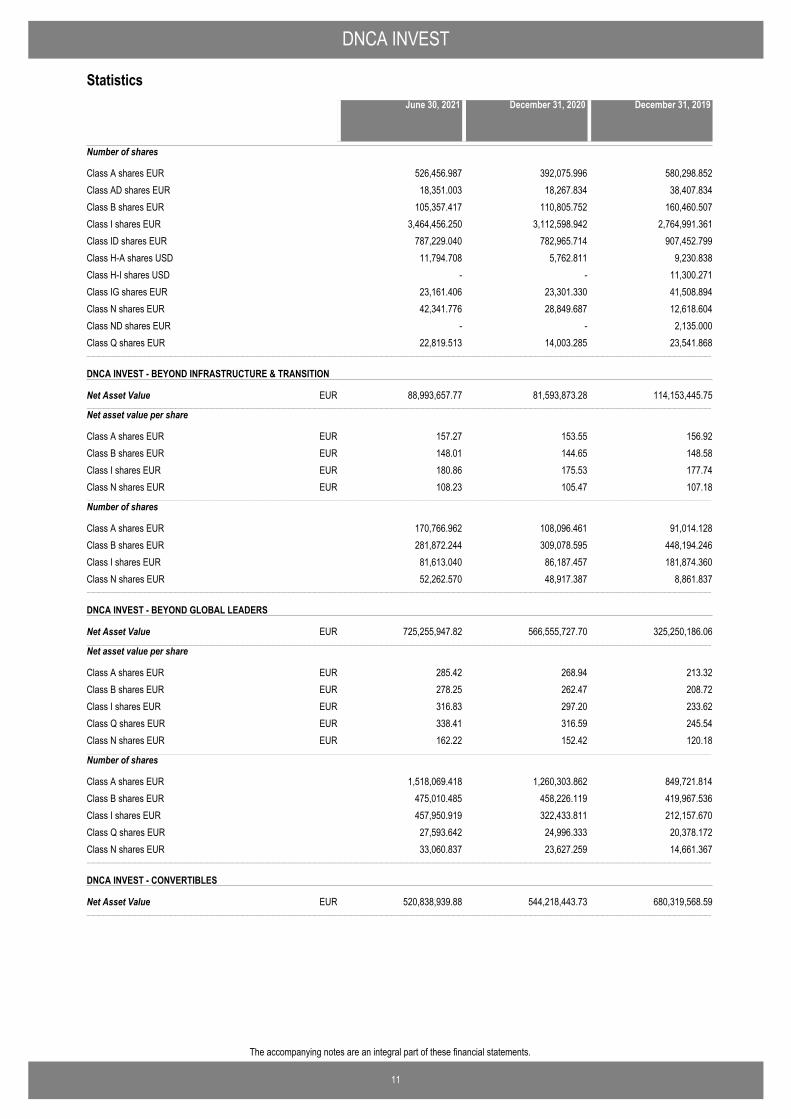
Number of shares
Class A shares EUR 526,456.987 392,075.996 580,298.852Class AD shares EUR 18,351.003 18,267.834 38,407.834Class B shares EUR 105,357.417 110,805.752 160,460.507Class I shares EUR 3,464,456.250 3,112,598.942 2,764,991.361Class ID shares EUR 787,229.040 782,965.714 907,452.799Class H-A shares USD 11,794.708 5,762.811 9,230.838Class H-I shares USD - - 11,300.271Class IG shares EUR 23,161.406 23,301.330 41,508.894Class N shares EUR 42,341.776 28,849.687 12,618.604Class ND shares EUR - - 2,135.000Class Q shares EUR 22,819.513 14,003.285 23,541.868−−−−−−−−−−−−−−−−−−−−−−−−−−−−−−−−−−−−−−−−−−−−−−−−−−−−−−−−−−−−−−−−−−−−−−−−−−−−−−−−−−−−−−−−−−−−−−−−−−−−−−−−−−−−−−−−−−−−−−−−−−−−−−−−−−−−−−−−−−−−−−−−−−−−−−−−−−−−−−−−−−−−−−−−−−−−−−−−−−−−−−−−−−−−−−−−−−−−−−−−−−−−−−−−−−−−−−−−−−−−−−−−−−−−−−−−−−−−−−−−−−−−−−−−−−−−−−−−−−−−−−−−−−−−−−−−−−−−−−−−−−−−−−−−−−−−−−−−−−−−−−−−−−−−−−−−−−−−−−−−−−−−−−−−−−−−−−−−−−−−−−−−−−−−−−−−−−−−−−−−−−−−−−−−−−−−−−−−−−−−−−−−−−−−−−−−−−−−−−−−−−−−−−−−−−−−−−−−−−−−−−−−−−−−−−−−−−−−−−−−−−−−−−−−−−−−−−−−−−−−−−−−−−−−−−−−−−−−−−−−−−−−−−−−−−−−−−−−−−−−−−−
DNCA INVEST - BEYOND INFRASTRUCTURE & TRANSITION
Net Asset Value−−−−−−−−−−−−−−−−−−−−−−−−−−−−−−−−−−−−−−−−−−−−−−−−−−−−−−−−−−−−−−−−−−−−−−−−−−−−−−−−−−−−−−−−−−−−−−−−−−−−−−−−−−−−−−−−−−−−−−−−−−−−−−−−−−−−−−−−−−−−−−−−−−−−−−−−−−−−−−−−−−−−−−−−−−−−−−−−−−−−−−−−−−−−−−−−−−−−−−−−−−−−−−−−−−−−−−−−−−−−−−−−−−−−−−−−−−−−−−−−−−−−−−−−−−−−−−−−−−−−−−−−−−−−−−−−−−−−−−−−−−−−−−−−−−−−−−−−−−−−−−−−−−−−−−−−−−−−−−−−−−−−−−−−−−−−−−−−−−−−−−−−−−−−−−−−−−−−−−−−−−−−−−−−−−−−−−−−−−−−−−−−−−−−−−−−−−−−−−−−−−−−−−−−−−−−−−−−−−−−−−−−−−−−−−−−−−−−−−−−−−−−−−−−−−−−−−−−−−−−−−−−−−−−−−−−−−−−−−−−−−−−−−−−−−−−−−−−−−−−−−−
88,993,657.77 81,593,873.28 114,153,445.75EUR
Net asset value per share
Class A shares EUR 157.27 153.55 156.92EURClass B shares EUR 148.01 144.65 148.58EURClass I shares EUR 180.86 175.53 177.74EURClass N shares EUR 108.23 105.47 107.18EUR−−−−−−−−−−−−−−−−−−−−−−−−−−−−−−−−−−−−−−−−−−−−−−−−−−−−−−−−−−−−−−−−−−−−−−−−−−−−−−−−−−−−−−−−−−−−−−−−−−−−−−−−−−−−−−−−−−−−−−−−−−−−−−−−−−−−−−−−−−−−−−−−−−−−−−−−−−−−−−−−−−−−−−−−−−−−−−−−−−−−−−−−−−−−−−−−−−−−−−−−−−−−−−−−−−−−−−−−−−−−−−−−−−−−−−−−−−−−−−−−−−−−−−−−−−−−−−−−−−−−−−−−−−−−−−−−−−−−−−−−−−−−−−−−−−−−−−−−−−−−−−−−−−−−−−−−−−−−−−−−−−−−−−−−−−−−−−−−−−−−−−−−−−−−−−−−−−−−−−−−−−−−−−−−−−−−−−−−−−−−−−−−−−−−−−−−−−−−−−−−−−−−−−−−−−−−−−−−−−−−−−−−−−−−−−−−−−−−−−−−−−−−−−−−−−−−−−−−−−−−−−−−−−−−−−−−−−−−−−−−−−−−−−−−−−−−−−−−−−−−−−−
Number of shares
Class A shares EUR 170,766.962 108,096.461 91,014.128Class B shares EUR 281,872.244 309,078.595 448,194.246Class I shares EUR 81,613.040 86,187.457 181,874.360Class N shares EUR 52,262.570 48,917.387 8,861.837−−−−−−−−−−−−−−−−−−−−−−−−−−−−−−−−−−−−−−−−−−−−−−−−−−−−−−−−−−−−−−−−−−−−−−−−−−−−−−−−−−−−−−−−−−−−−−−−−−−−−−−−−−−−−−−−−−−−−−−−−−−−−−−−−−−−−−−−−−−−−−−−−−−−−−−−−−−−−−−−−−−−−−−−−−−−−−−−−−−−−−−−−−−−−−−−−−−−−−−−−−−−−−−−−−−−−−−−−−−−−−−−−−−−−−−−−−−−−−−−−−−−−−−−−−−−−−−−−−−−−−−−−−−−−−−−−−−−−−−−−−−−−−−−−−−−−−−−−−−−−−−−−−−−−−−−−−−−−−−−−−−−−−−−−−−−−−−−−−−−−−−−−−−−−−−−−−−−−−−−−−−−−−−−−−−−−−−−−−−−−−−−−−−−−−−−−−−−−−−−−−−−−−−−−−−−−−−−−−−−−−−−−−−−−−−−−−−−−−−−−−−−−−−−−−−−−−−−−−−−−−−−−−−−−−−−−−−−−−−−−−−−−−−−−−−−−−−−−−−−−−−
DNCA INVEST - BEYOND GLOBAL LEADERS
Net Asset Value−−−−−−−−−−−−−−−−−−−−−−−−−−−−−−−−−−−−−−−−−−−−−−−−−−−−−−−−−−−−−−−−−−−−−−−−−−−−−−−−−−−−−−−−−−−−−−−−−−−−−−−−−−−−−−−−−−−−−−−−−−−−−−−−−−−−−−−−−−−−−−−−−−−−−−−−−−−−−−−−−−−−−−−−−−−−−−−−−−−−−−−−−−−−−−−−−−−−−−−−−−−−−−−−−−−−−−−−−−−−−−−−−−−−−−−−−−−−−−−−−−−−−−−−−−−−−−−−−−−−−−−−−−−−−−−−−−−−−−−−−−−−−−−−−−−−−−−−−−−−−−−−−−−−−−−−−−−−−−−−−−−−−−−−−−−−−−−−−−−−−−−−−−−−−−−−−−−−−−−−−−−−−−−−−−−−−−−−−−−−−−−−−−−−−−−−−−−−−−−−−−−−−−−−−−−−−−−−−−−−−−−−−−−−−−−−−−−−−−−−−−−−−−−−−−−−−−−−−−−−−−−−−−−−−−−−−−−−−−−−−−−−−−−−−−−−−−−−−−−−−−−
725,255,947.82 566,555,727.70 325,250,186.06EUR
Net asset value per share
Class A shares EUR 285.42 268.94 213.32EURClass B shares EUR 278.25 262.47 208.72EURClass I shares EUR 316.83 297.20 233.62EURClass Q shares EUR 338.41 316.59 245.54EURClass N shares EUR 162.22 152.42 120.18EUR−−−−−−−−−−−−−−−−−−−−−−−−−−−−−−−−−−−−−−−−−−−−−−−−−−−−−−−−−−−−−−−−−−−−−−−−−−−−−−−−−−−−−−−−−−−−−−−−−−−−−−−−−−−−−−−−−−−−−−−−−−−−−−−−−−−−−−−−−−−−−−−−−−−−−−−−−−−−−−−−−−−−−−−−−−−−−−−−−−−−−−−−−−−−−−−−−−−−−−−−−−−−−−−−−−−−−−−−−−−−−−−−−−−−−−−−−−−−−−−−−−−−−−−−−−−−−−−−−−−−−−−−−−−−−−−−−−−−−−−−−−−−−−−−−−−−−−−−−−−−−−−−−−−−−−−−−−−−−−−−−−−−−−−−−−−−−−−−−−−−−−−−−−−−−−−−−−−−−−−−−−−−−−−−−−−−−−−−−−−−−−−−−−−−−−−−−−−−−−−−−−−−−−−−−−−−−−−−−−−−−−−−−−−−−−−−−−−−−−−−−−−−−−−−−−−−−−−−−−−−−−−−−−−−−−−−−−−−−−−−−−−−−−−−−−−−−−−−−−−−−−−
Number of shares
Class A shares EUR 1,518,069.418 1,260,303.862 849,721.814Class B shares EUR 475,010.485 458,226.119 419,967.536Class I shares EUR 457,950.919 322,433.811 212,157.670Class Q shares EUR 27,593.642 24,996.333 20,378.172Class N shares EUR 33,060.837 23,627.259 14,661.367−−−−−−−−−−−−−−−−−−−−−−−−−−−−−−−−−−−−−−−−−−−−−−−−−−−−−−−−−−−−−−−−−−−−−−−−−−−−−−−−−−−−−−−−−−−−−−−−−−−−−−−−−−−−−−−−−−−−−−−−−−−−−−−−−−−−−−−−−−−−−−−−−−−−−−−−−−−−−−−−−−−−−−−−−−−−−−−−−−−−−−−−−−−−−−−−−−−−−−−−−−−−−−−−−−−−−−−−−−−−−−−−−−−−−−−−−−−−−−−−−−−−−−−−−−−−−−−−−−−−−−−−−−−−−−−−−−−−−−−−−−−−−−−−−−−−−−−−−−−−−−−−−−−−−−−−−−−−−−−−−−−−−−−−−−−−−−−−−−−−−−−−−−−−−−−−−−−−−−−−−−−−−−−−−−−−−−−−−−−−−−−−−−−−−−−−−−−−−−−−−−−−−−−−−−−−−−−−−−−−−−−−−−−−−−−−−−−−−−−−−−−−−−−−−−−−−−−−−−−−−−−−−−−−−−−−−−−−−−−−−−−−−−−−−−−−−−−−−−−−−−−
DNCA INVEST - CONVERTIBLES
Net Asset Value−−−−−−−−−−−−−−−−−−−−−−−−−−−−−−−−−−−−−−−−−−−−−−−−−−−−−−−−−−−−−−−−−−−−−−−−−−−−−−−−−−−−−−−−−−−−−−−−−−−−−−−−−−−−−−−−−−−−−−−−−−−−−−−−−−−−−−−−−−−−−−−−−−−−−−−−−−−−−−−−−−−−−−−−−−−−−−−−−−−−−−−−−−−−−−−−−−−−−−−−−−−−−−−−−−−−−−−−−−−−−−−−−−−−−−−−−−−−−−−−−−−−−−−−−−−−−−−−−−−−−−−−−−−−−−−−−−−−−−−−−−−−−−−−−−−−−−−−−−−−−−−−−−−−−−−−−−−−−−−−−−−−−−−−−−−−−−−−−−−−−−−−−−−−−−−−−−−−−−−−−−−−−−−−−−−−−−−−−−−−−−−−−−−−−−−−−−−−−−−−−−−−−−−−−−−−−−−−−−−−−−−−−−−−−−−−−−−−−−−−−−−−−−−−−−−−−−−−−−−−−−−−−−−−−−−−−−−−−−−−−−−−−−−−−−−−−−−−−−−−−−−
520,838,939.88 544,218,443.73 680,319,568.59EUR
December 31, 2019June 30, 2021 December 31, 2020
DNCA INVEST
12
The accompanying notes are an integral part of these financial statements.
Statistics
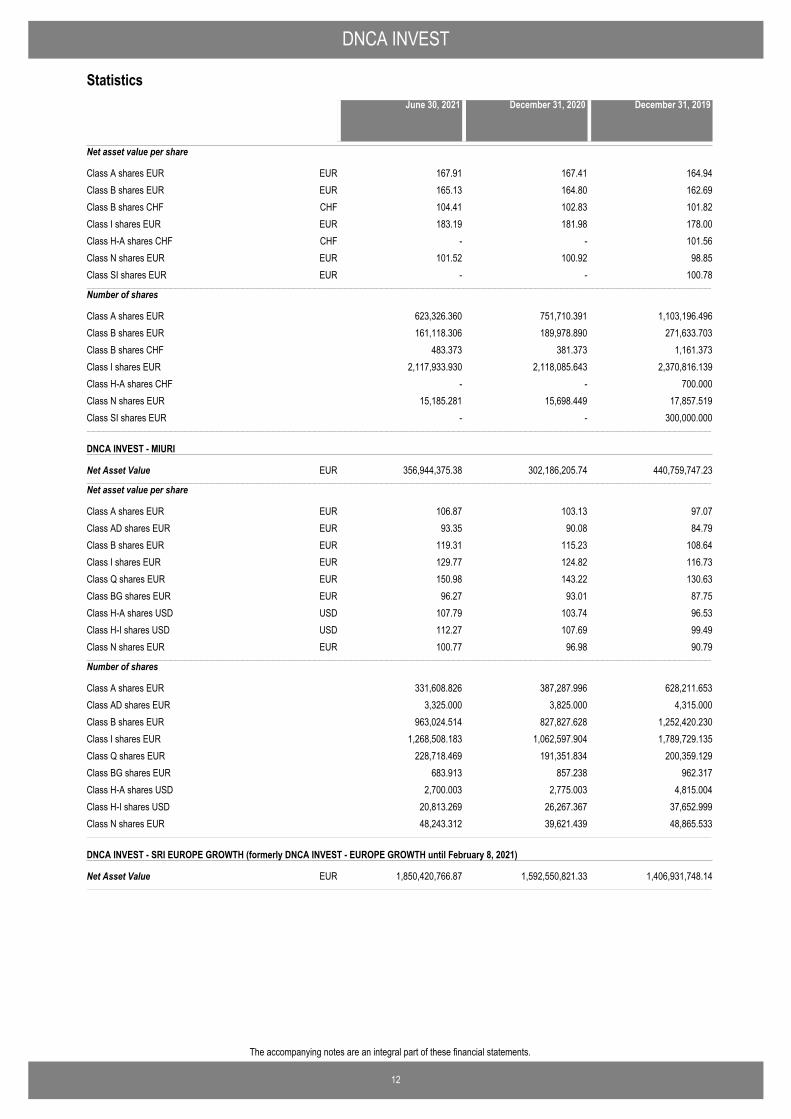
Net asset value per share
Class A shares EUR 167.91 167.41 164.94EURClass B shares EUR 165.13 164.80 162.69EURClass B shares CHF 104.41 102.83 101.82CHFClass I shares EUR 183.19 181.98 178.00EURClass H-A shares CHF - - 101.56CHFClass N shares EUR 101.52 100.92 98.85EURClass SI shares EUR - - 100.78EUR−−−−−−−−−−−−−−−−−−−−−−−−−−−−−−−−−−−−−−−−−−−−−−−−−−−−−−−−−−−−−−−−−−−−−−−−−−−−−−−−−−−−−−−−−−−−−−−−−−−−−−−−−−−−−−−−−−−−−−−−−−−−−−−−−−−−−−−−−−−−−−−−−−−−−−−−−−−−−−−−−−−−−−−−−−−−−−−−−−−−−−−−−−−−−−−−−−−−−−−−−−−−−−−−−−−−−−−−−−−−−−−−−−−−−−−−−−−−−−−−−−−−−−−−−−−−−−−−−−−−−−−−−−−−−−−−−−−−−−−−−−−−−−−−−−−−−−−−−−−−−−−−−−−−−−−−−−−−−−−−−−−−−−−−−−−−−−−−−−−−−−−−−−−−−−−−−−−−−−−−−−−−−−−−−−−−−−−−−−−−−−−−−−−−−−−−−−−−−−−−−−−−−−−−−−−−−−−−−−−−−−−−−−−−−−−−−−−−−−−−−−−−−−−−−−−−−−−−−−−−−−−−−−−−−−−−−−−−−−−−−−−−−−−−−−−−−−−−−−−−−−−
Number of shares
Class A shares EUR 623,326.360 751,710.391 1,103,196.496Class B shares EUR 161,118.306 189,978.890 271,633.703Class B shares CHF 483.373 381.373 1,161.373Class I shares EUR 2,117,933.930 2,118,085.643 2,370,816.139Class H-A shares CHF - - 700.000Class N shares EUR 15,185.281 15,698.449 17,857.519Class SI shares EUR - - 300,000.000−−−−−−−−−−−−−−−−−−−−−−−−−−−−−−−−−−−−−−−−−−−−−−−−−−−−−−−−−−−−−−−−−−−−−−−−−−−−−−−−−−−−−−−−−−−−−−−−−−−−−−−−−−−−−−−−−−−−−−−−−−−−−−−−−−−−−−−−−−−−−−−−−−−−−−−−−−−−−−−−−−−−−−−−−−−−−−−−−−−−−−−−−−−−−−−−−−−−−−−−−−−−−−−−−−−−−−−−−−−−−−−−−−−−−−−−−−−−−−−−−−−−−−−−−−−−−−−−−−−−−−−−−−−−−−−−−−−−−−−−−−−−−−−−−−−−−−−−−−−−−−−−−−−−−−−−−−−−−−−−−−−−−−−−−−−−−−−−−−−−−−−−−−−−−−−−−−−−−−−−−−−−−−−−−−−−−−−−−−−−−−−−−−−−−−−−−−−−−−−−−−−−−−−−−−−−−−−−−−−−−−−−−−−−−−−−−−−−−−−−−−−−−−−−−−−−−−−−−−−−−−−−−−−−−−−−−−−−−−−−−−−−−−−−−−−−−−−−−−−−−−−
DNCA INVEST - MIURI
Net Asset Value−−−−−−−−−−−−−−−−−−−−−−−−−−−−−−−−−−−−−−−−−−−−−−−−−−−−−−−−−−−−−−−−−−−−−−−−−−−−−−−−−−−−−−−−−−−−−−−−−−−−−−−−−−−−−−−−−−−−−−−−−−−−−−−−−−−−−−−−−−−−−−−−−−−−−−−−−−−−−−−−−−−−−−−−−−−−−−−−−−−−−−−−−−−−−−−−−−−−−−−−−−−−−−−−−−−−−−−−−−−−−−−−−−−−−−−−−−−−−−−−−−−−−−−−−−−−−−−−−−−−−−−−−−−−−−−−−−−−−−−−−−−−−−−−−−−−−−−−−−−−−−−−−−−−−−−−−−−−−−−−−−−−−−−−−−−−−−−−−−−−−−−−−−−−−−−−−−−−−−−−−−−−−−−−−−−−−−−−−−−−−−−−−−−−−−−−−−−−−−−−−−−−−−−−−−−−−−−−−−−−−−−−−−−−−−−−−−−−−−−−−−−−−−−−−−−−−−−−−−−−−−−−−−−−−−−−−−−−−−−−−−−−−−−−−−−−−−−−−−−−−−−
356,944,375.38 302,186,205.74 440,759,747.23EUR
Net asset value per share
Class A shares EUR 106.87 103.13 97.07EURClass AD shares EUR 93.35 90.08 84.79EURClass B shares EUR 119.31 115.23 108.64EURClass I shares EUR 129.77 124.82 116.73EURClass Q shares EUR 150.98 143.22 130.63EURClass BG shares EUR 96.27 93.01 87.75EURClass H-A shares USD 107.79 103.74 96.53USDClass H-I shares USD 112.27 107.69 99.49USDClass N shares EUR 100.77 96.98 90.79EUR−−−−−−−−−−−−−−−−−−−−−−−−−−−−−−−−−−−−−−−−−−−−−−−−−−−−−−−−−−−−−−−−−−−−−−−−−−−−−−−−−−−−−−−−−−−−−−−−−−−−−−−−−−−−−−−−−−−−−−−−−−−−−−−−−−−−−−−−−−−−−−−−−−−−−−−−−−−−−−−−−−−−−−−−−−−−−−−−−−−−−−−−−−−−−−−−−−−−−−−−−−−−−−−−−−−−−−−−−−−−−−−−−−−−−−−−−−−−−−−−−−−−−−−−−−−−−−−−−−−−−−−−−−−−−−−−−−−−−−−−−−−−−−−−−−−−−−−−−−−−−−−−−−−−−−−−−−−−−−−−−−−−−−−−−−−−−−−−−−−−−−−−−−−−−−−−−−−−−−−−−−−−−−−−−−−−−−−−−−−−−−−−−−−−−−−−−−−−−−−−−−−−−−−−−−−−−−−−−−−−−−−−−−−−−−−−−−−−−−−−−−−−−−−−−−−−−−−−−−−−−−−−−−−−−−−−−−−−−−−−−−−−−−−−−−−−−−−−−−−−−−−
Number of shares
Class A shares EUR 331,608.826 387,287.996 628,211.653Class AD shares EUR 3,325.000 3,825.000 4,315.000Class B shares EUR 963,024.514 827,827.628 1,252,420.230Class I shares EUR 1,268,508.183 1,062,597.904 1,789,729.135Class Q shares EUR 228,718.469 191,351.834 200,359.129Class BG shares EUR 683.913 857.238 962.317Class H-A shares USD 2,700.003 2,775.003 4,815.004Class H-I shares USD 20,813.269 26,267.367 37,652.999Class N shares EUR 48,243.312 39,621.439 48,865.533−−−−−−−−−−−−−−−−−−−−−−−−−−−−−−−−−−−−−−−−−−−−−−−−−−−−−−−−−−−−−−−−−−−−−−−−−−−−−−−−−−−−−−−−−−−−−−−−−−−−−−−−−−−−−−−−−−−−−−−−−−−−−−−−−−−−−−−−−−−−−−−−−−−−−−−−−−−−−−−−−−−−−−−−−−−−−−−−−−−−−−−−−−−−−−−−−−−−−−−−−−−−−−−−−−−−−−−−−−−−−−−−−−−−−−−−−−−−−−−−−−−−−−−−−−−−−−−−−−−−−−−−−−−−−−−−−−−−−−−−−−−−−−−−−−−−−−−−−−−−−−−−−−−−−−−−−−−−−−−−−−−−−−−−−−−−−−−−−−−−−−−−−−−−−−−−−−−−−−−−−−−−−−−−−−−−−−−−−−−−−−−−−−−−−−−−−−−−−−−−−−−−−−−−−−−−−−−−−−−−−−−−−−−−−−−−−−−−−−−−−−−−−−−−−−−−−−−−−−−−−−−−−−−−−−−−−−−−−−−−−−−−−−−−−−−−−−−−−−−−−−−
DNCA INVEST - SRI EUROPE GROWTH (formerly DNCA INVEST - EUROPE GROWTH until February 8, 2021)
Net Asset Value−−−−−−−−−−−−−−−−−−−−−−−−−−−−−−−−−−−−−−−−−−−−−−−−−−−−−−−−−−−−−−−−−−−−−−−−−−−−−−−−−−−−−−−−−−−−−−−−−−−−−−−−−−−−−−−−−−−−−−−−−−−−−−−−−−−−−−−−−−−−−−−−−−−−−−−−−−−−−−−−−−−−−−−−−−−−−−−−−−−−−−−−−−−−−−−−−−−−−−−−−−−−−−−−−−−−−−−−−−−−−−−−−−−−−−−−−−−−−−−−−−−−−−−−−−−−−−−−−−−−−−−−−−−−−−−−−−−−−−−−−−−−−−−−−−−−−−−−−−−−−−−−−−−−−−−−−−−−−−−−−−−−−−−−−−−−−−−−−−−−−−−−−−−−−−−−−−−−−−−−−−−−−−−−−−−−−−−−−−−−−−−−−−−−−−−−−−−−−−−−−−−−−−−−−−−−−−−−−−−−−−−−−−−−−−−−−−−−−−−−−−−−−−−−−−−−−−−−−−−−−−−−−−−−−−−−−−−−−−−−−−−−−−−−−−−−−−−−−−−−−−−
1,850,420,766.87 1,592,550,821.33 1,406,931,748.14EUR
December 31, 2019June 30, 2021 December 31, 2020
DNCA INVEST
13
The accompanying notes are an integral part of these financial statements.
Statistics
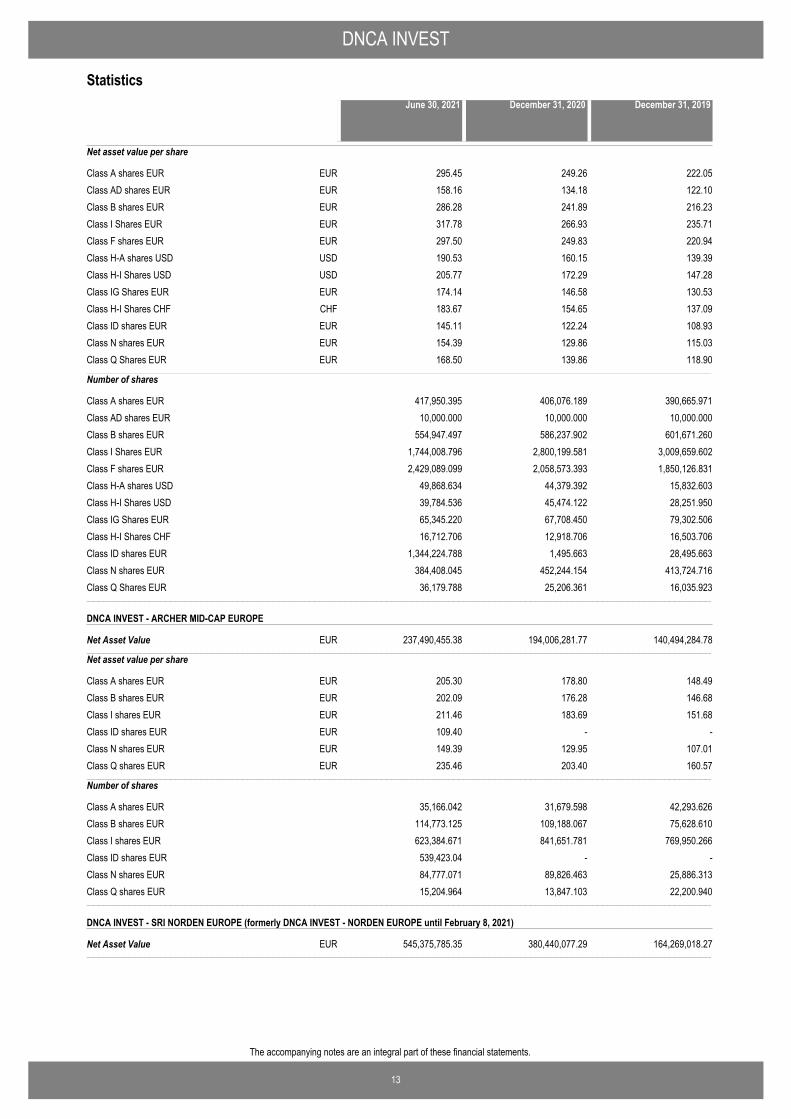
Net asset value per share
Class A shares EUR 295.45 249.26 222.05EURClass AD shares EUR 158.16 134.18 122.10EURClass B shares EUR 286.28 241.89 216.23EURClass I Shares EUR 317.78 266.93 235.71EURClass F shares EUR 297.50 249.83 220.94EURClass H-A shares USD 190.53 160.15 139.39USDClass H-I Shares USD 205.77 172.29 147.28USDClass IG Shares EUR 174.14 146.58 130.53EURClass H-I Shares CHF 183.67 154.65 137.09CHFClass ID shares EUR 145.11 122.24 108.93EURClass N shares EUR 154.39 129.86 115.03EURClass Q Shares EUR 168.50 139.86 118.90EUR−−−−−−−−−−−−−−−−−−−−−−−−−−−−−−−−−−−−−−−−−−−−−−−−−−−−−−−−−−−−−−−−−−−−−−−−−−−−−−−−−−−−−−−−−−−−−−−−−−−−−−−−−−−−−−−−−−−−−−−−−−−−−−−−−−−−−−−−−−−−−−−−−−−−−−−−−−−−−−−−−−−−−−−−−−−−−−−−−−−−−−−−−−−−−−−−−−−−−−−−−−−−−−−−−−−−−−−−−−−−−−−−−−−−−−−−−−−−−−−−−−−−−−−−−−−−−−−−−−−−−−−−−−−−−−−−−−−−−−−−−−−−−−−−−−−−−−−−−−−−−−−−−−−−−−−−−−−−−−−−−−−−−−−−−−−−−−−−−−−−−−−−−−−−−−−−−−−−−−−−−−−−−−−−−−−−−−−−−−−−−−−−−−−−−−−−−−−−−−−−−−−−−−−−−−−−−−−−−−−−−−−−−−−−−−−−−−−−−−−−−−−−−−−−−−−−−−−−−−−−−−−−−−−−−−−−−−−−−−−−−−−−−−−−−−−−−−−−−−−−−−−
Number of shares
Class A shares EUR 417,950.395 406,076.189 390,665.971Class AD shares EUR 10,000.000 10,000.000 10,000.000Class B shares EUR 554,947.497 586,237.902 601,671.260Class I Shares EUR 1,744,008.796 2,800,199.581 3,009,659.602Class F shares EUR 2,429,089.099 2,058,573.393 1,850,126.831Class H-A shares USD 49,868.634 44,379.392 15,832.603Class H-I Shares USD 39,784.536 45,474.122 28,251.950Class IG Shares EUR 65,345.220 67,708.450 79,302.506Class H-I Shares CHF 16,712.706 12,918.706 16,503.706Class ID shares EUR 1,344,224.788 1,495.663 28,495.663Class N shares EUR 384,408.045 452,244.154 413,724.716Class Q Shares EUR 36,179.788 25,206.361 16,035.923−−−−−−−−−−−−−−−−−−−−−−−−−−−−−−−−−−−−−−−−−−−−−−−−−−−−−−−−−−−−−−−−−−−−−−−−−−−−−−−−−−−−−−−−−−−−−−−−−−−−−−−−−−−−−−−−−−−−−−−−−−−−−−−−−−−−−−−−−−−−−−−−−−−−−−−−−−−−−−−−−−−−−−−−−−−−−−−−−−−−−−−−−−−−−−−−−−−−−−−−−−−−−−−−−−−−−−−−−−−−−−−−−−−−−−−−−−−−−−−−−−−−−−−−−−−−−−−−−−−−−−−−−−−−−−−−−−−−−−−−−−−−−−−−−−−−−−−−−−−−−−−−−−−−−−−−−−−−−−−−−−−−−−−−−−−−−−−−−−−−−−−−−−−−−−−−−−−−−−−−−−−−−−−−−−−−−−−−−−−−−−−−−−−−−−−−−−−−−−−−−−−−−−−−−−−−−−−−−−−−−−−−−−−−−−−−−−−−−−−−−−−−−−−−−−−−−−−−−−−−−−−−−−−−−−−−−−−−−−−−−−−−−−−−−−−−−−−−−−−−−−−
DNCA INVEST - ARCHER MID-CAP EUROPE
Net Asset Value−−−−−−−−−−−−−−−−−−−−−−−−−−−−−−−−−−−−−−−−−−−−−−−−−−−−−−−−−−−−−−−−−−−−−−−−−−−−−−−−−−−−−−−−−−−−−−−−−−−−−−−−−−−−−−−−−−−−−−−−−−−−−−−−−−−−−−−−−−−−−−−−−−−−−−−−−−−−−−−−−−−−−−−−−−−−−−−−−−−−−−−−−−−−−−−−−−−−−−−−−−−−−−−−−−−−−−−−−−−−−−−−−−−−−−−−−−−−−−−−−−−−−−−−−−−−−−−−−−−−−−−−−−−−−−−−−−−−−−−−−−−−−−−−−−−−−−−−−−−−−−−−−−−−−−−−−−−−−−−−−−−−−−−−−−−−−−−−−−−−−−−−−−−−−−−−−−−−−−−−−−−−−−−−−−−−−−−−−−−−−−−−−−−−−−−−−−−−−−−−−−−−−−−−−−−−−−−−−−−−−−−−−−−−−−−−−−−−−−−−−−−−−−−−−−−−−−−−−−−−−−−−−−−−−−−−−−−−−−−−−−−−−−−−−−−−−−−−−−−−−−−
237,490,455.38 194,006,281.77 140,494,284.78EUR
Net asset value per share
Class A shares EUR 205.30 178.80 148.49EURClass B shares EUR 202.09 176.28 146.68EURClass I shares EUR 211.46 183.69 151.68EURClass ID shares EUR 109.40 - -EURClass N shares EUR 149.39 129.95 107.01EURClass Q shares EUR 235.46 203.40 160.57EUR−−−−−−−−−−−−−−−−−−−−−−−−−−−−−−−−−−−−−−−−−−−−−−−−−−−−−−−−−−−−−−−−−−−−−−−−−−−−−−−−−−−−−−−−−−−−−−−−−−−−−−−−−−−−−−−−−−−−−−−−−−−−−−−−−−−−−−−−−−−−−−−−−−−−−−−−−−−−−−−−−−−−−−−−−−−−−−−−−−−−−−−−−−−−−−−−−−−−−−−−−−−−−−−−−−−−−−−−−−−−−−−−−−−−−−−−−−−−−−−−−−−−−−−−−−−−−−−−−−−−−−−−−−−−−−−−−−−−−−−−−−−−−−−−−−−−−−−−−−−−−−−−−−−−−−−−−−−−−−−−−−−−−−−−−−−−−−−−−−−−−−−−−−−−−−−−−−−−−−−−−−−−−−−−−−−−−−−−−−−−−−−−−−−−−−−−−−−−−−−−−−−−−−−−−−−−−−−−−−−−−−−−−−−−−−−−−−−−−−−−−−−−−−−−−−−−−−−−−−−−−−−−−−−−−−−−−−−−−−−−−−−−−−−−−−−−−−−−−−−−−−−
Number of shares
Class A shares EUR 35,166.042 31,679.598 42,293.626Class B shares EUR 114,773.125 109,188.067 75,628.610Class I shares EUR 623,384.671 841,651.781 769,950.266Class ID shares EUR 539,423.04 - -Class N shares EUR 84,777.071 89,826.463 25,886.313Class Q shares EUR 15,204.964 13,847.103 22,200.940−−−−−−−−−−−−−−−−−−−−−−−−−−−−−−−−−−−−−−−−−−−−−−−−−−−−−−−−−−−−−−−−−−−−−−−−−−−−−−−−−−−−−−−−−−−−−−−−−−−−−−−−−−−−−−−−−−−−−−−−−−−−−−−−−−−−−−−−−−−−−−−−−−−−−−−−−−−−−−−−−−−−−−−−−−−−−−−−−−−−−−−−−−−−−−−−−−−−−−−−−−−−−−−−−−−−−−−−−−−−−−−−−−−−−−−−−−−−−−−−−−−−−−−−−−−−−−−−−−−−−−−−−−−−−−−−−−−−−−−−−−−−−−−−−−−−−−−−−−−−−−−−−−−−−−−−−−−−−−−−−−−−−−−−−−−−−−−−−−−−−−−−−−−−−−−−−−−−−−−−−−−−−−−−−−−−−−−−−−−−−−−−−−−−−−−−−−−−−−−−−−−−−−−−−−−−−−−−−−−−−−−−−−−−−−−−−−−−−−−−−−−−−−−−−−−−−−−−−−−−−−−−−−−−−−−−−−−−−−−−−−−−−−−−−−−−−−−−−−−−−−−
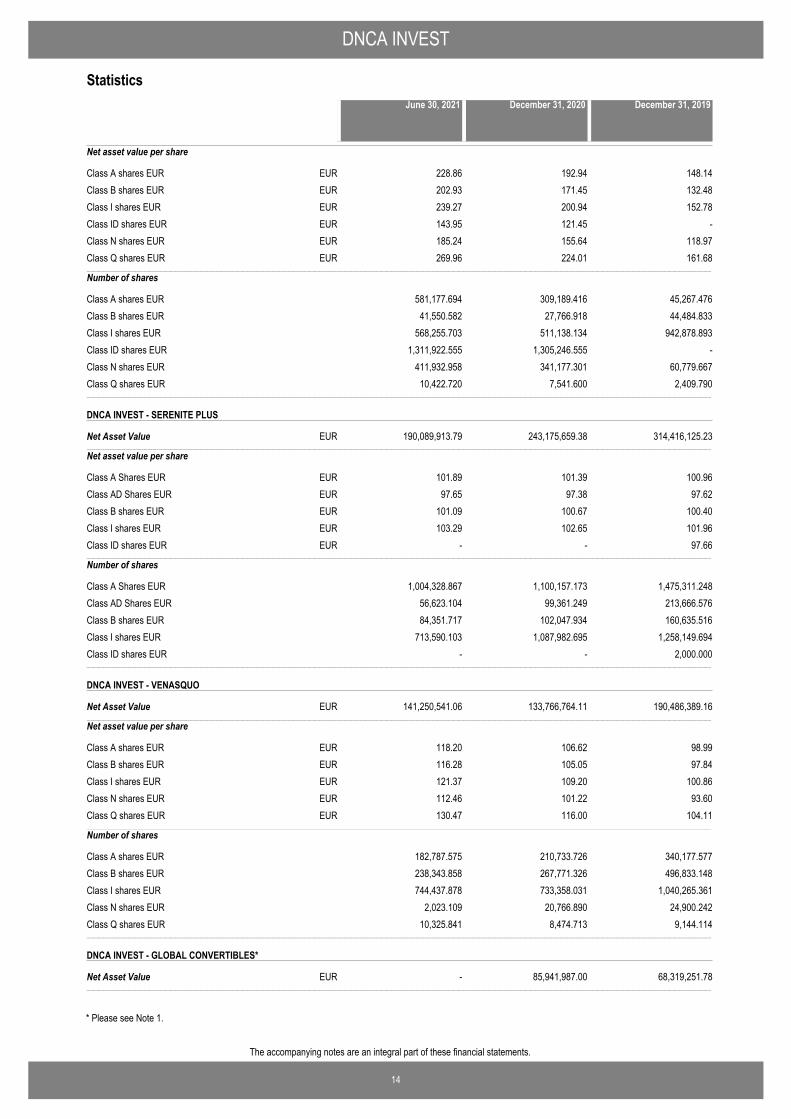
DNCA INVEST - SRI NORDEN EUROPE (formerly DNCA INVEST - NORDEN EUROPE until February 8, 2021)
Net Asset Value−−−−−−−−−−−−−−−−−−−−−−−−−−−−−−−−−−−−−−−−−−−−−−−−−−−−−−−−−−−−−−−−−−−−−−−−−−−−−−−−−−−−−−−−−−−−−−−−−−−−−−−−−−−−−−−−−−−−−−−−−−−−−−−−−−−−−−−−−−−−−−−−−−−−−−−−−−−−−−−−−−−−−−−−−−−−−−−−−−−−−−−−−−−−−−−−−−−−−−−−−−−−−−−−−−−−−−−−−−−−−−−−−−−−−−−−−−−−−−−−−−−−−−−−−−−−−−−−−−−−−−−−−−−−−−−−−−−−−−−−−−−−−−−−−−−−−−−−−−−−−−−−−−−−−−−−−−−−−−−−−−−−−−−−−−−−−−−−−−−−−−−−−−−−−−−−−−−−−−−−−−−−−−−−−−−−−−−−−−−−−−−−−−−−−−−−−−−−−−−−−−−−−−−−−−−−−−−−−−−−−−−−−−−−−−−−−−−−−−−−−−−−−−−−−−−−−−−−−−−−−−−−−−−−−−−−−−−−−−−−−−−−−−−−−−−−−−−−−−−−−−−
545,375,785.35 380,440,077.29 164,269,018.27EUR
December 31, 2019June 30, 2021 December 31, 2020
DNCA INVEST
14
The accompanying notes are an integral part of these financial statements.
Statistics
Net asset value per share
Class A shares EUR 228.86 192.94 148.14EURClass B shares EUR 202.93 171.45 132.48EURClass I shares EUR 239.27 200.94 152.78EURClass ID shares EUR 143.95 121.45 -EURClass N shares EUR 185.24 155.64 118.97EURClass Q shares EUR 269.96 224.01 161.68EUR−−−−−−−−−−−−−−−−−−−−−−−−−−−−−−−−−−−−−−−−−−−−−−−−−−−−−−−−−−−−−−−−−−−−−−−−−−−−−−−−−−−−−−−−−−−−−−−−−−−−−−−−−−−−−−−−−−−−−−−−−−−−−−−−−−−−−−−−−−−−−−−−−−−−−−−−−−−−−−−−−−−−−−−−−−−−−−−−−−−−−−−−−−−−−−−−−−−−−−−−−−−−−−−−−−−−−−−−−−−−−−−−−−−−−−−−−−−−−−−−−−−−−−−−−−−−−−−−−−−−−−−−−−−−−−−−−−−−−−−−−−−−−−−−−−−−−−−−−−−−−−−−−−−−−−−−−−−−−−−−−−−−−−−−−−−−−−−−−−−−−−−−−−−−−−−−−−−−−−−−−−−−−−−−−−−−−−−−−−−−−−−−−−−−−−−−−−−−−−−−−−−−−−−−−−−−−−−−−−−−−−−−−−−−−−−−−−−−−−−−−−−−−−−−−−−−−−−−−−−−−−−−−−−−−−−−−−−−−−−−−−−−−−−−−−−−−−−−−−−−−−−
Number of shares
Class A shares EUR 581,177.694 309,189.416 45,267.476Class B shares EUR 41,550.582 27,766.918 44,484.833Class I shares EUR 568,255.703 511,138.134 942,878.893Class ID shares EUR 1,311,922.555 1,305,246.555 -Class N shares EUR 411,932.958 341,177.301 60,779.667Class Q shares EUR 10,422.720 7,541.600 2,409.790−−−−−−−−−−−−−−−−−−−−−−−−−−−−−−−−−−−−−−−−−−−−−−−−−−−−−−−−−−−−−−−−−−−−−−−−−−−−−−−−−−−−−−−−−−−−−−−−−−−−−−−−−−−−−−−−−−−−−−−−−−−−−−−−−−−−−−−−−−−−−−−−−−−−−−−−−−−−−−−−−−−−−−−−−−−−−−−−−−−−−−−−−−−−−−−−−−−−−−−−−−−−−−−−−−−−−−−−−−−−−−−−−−−−−−−−−−−−−−−−−−−−−−−−−−−−−−−−−−−−−−−−−−−−−−−−−−−−−−−−−−−−−−−−−−−−−−−−−−−−−−−−−−−−−−−−−−−−−−−−−−−−−−−−−−−−−−−−−−−−−−−−−−−−−−−−−−−−−−−−−−−−−−−−−−−−−−−−−−−−−−−−−−−−−−−−−−−−−−−−−−−−−−−−−−−−−−−−−−−−−−−−−−−−−−−−−−−−−−−−−−−−−−−−−−−−−−−−−−−−−−−−−−−−−−−−−−−−−−−−−−−−−−−−−−−−−−−−−−−−−−−
DNCA INVEST - SERENITE PLUS
Net Asset Value−−−−−−−−−−−−−−−−−−−−−−−−−−−−−−−−−−−−−−−−−−−−−−−−−−−−−−−−−−−−−−−−−−−−−−−−−−−−−−−−−−−−−−−−−−−−−−−−−−−−−−−−−−−−−−−−−−−−−−−−−−−−−−−−−−−−−−−−−−−−−−−−−−−−−−−−−−−−−−−−−−−−−−−−−−−−−−−−−−−−−−−−−−−−−−−−−−−−−−−−−−−−−−−−−−−−−−−−−−−−−−−−−−−−−−−−−−−−−−−−−−−−−−−−−−−−−−−−−−−−−−−−−−−−−−−−−−−−−−−−−−−−−−−−−−−−−−−−−−−−−−−−−−−−−−−−−−−−−−−−−−−−−−−−−−−−−−−−−−−−−−−−−−−−−−−−−−−−−−−−−−−−−−−−−−−−−−−−−−−−−−−−−−−−−−−−−−−−−−−−−−−−−−−−−−−−−−−−−−−−−−−−−−−−−−−−−−−−−−−−−−−−−−−−−−−−−−−−−−−−−−−−−−−−−−−−−−−−−−−−−−−−−−−−−−−−−−−−−−−−−−−
190,089,913.79 243,175,659.38 314,416,125.23EUR
Net asset value per share
Class A Shares EUR 101.89 101.39 100.96EURClass AD Shares EUR 97.65 97.38 97.62EURClass B shares EUR 101.09 100.67 100.40EURClass I shares EUR 103.29 102.65 101.96EURClass ID shares EUR - - 97.66EUR−−−−−−−−−−−−−−−−−−−−−−−−−−−−−−−−−−−−−−−−−−−−−−−−−−−−−−−−−−−−−−−−−−−−−−−−−−−−−−−−−−−−−−−−−−−−−−−−−−−−−−−−−−−−−−−−−−−−−−−−−−−−−−−−−−−−−−−−−−−−−−−−−−−−−−−−−−−−−−−−−−−−−−−−−−−−−−−−−−−−−−−−−−−−−−−−−−−−−−−−−−−−−−−−−−−−−−−−−−−−−−−−−−−−−−−−−−−−−−−−−−−−−−−−−−−−−−−−−−−−−−−−−−−−−−−−−−−−−−−−−−−−−−−−−−−−−−−−−−−−−−−−−−−−−−−−−−−−−−−−−−−−−−−−−−−−−−−−−−−−−−−−−−−−−−−−−−−−−−−−−−−−−−−−−−−−−−−−−−−−−−−−−−−−−−−−−−−−−−−−−−−−−−−−−−−−−−−−−−−−−−−−−−−−−−−−−−−−−−−−−−−−−−−−−−−−−−−−−−−−−−−−−−−−−−−−−−−−−−−−−−−−−−−−−−−−−−−−−−−−−−−
Number of shares
Class A Shares EUR 1,004,328.867 1,100,157.173 1,475,311.248Class AD Shares EUR 56,623.104 99,361.249 213,666.576Class B shares EUR 84,351.717 102,047.934 160,635.516Class I shares EUR 713,590.103 1,087,982.695 1,258,149.694Class ID shares EUR - - 2,000.000−−−−−−−−−−−−−−−−−−−−−−−−−−−−−−−−−−−−−−−−−−−−−−−−−−−−−−−−−−−−−−−−−−−−−−−−−−−−−−−−−−−−−−−−−−−−−−−−−−−−−−−−−−−−−−−−−−−−−−−−−−−−−−−−−−−−−−−−−−−−−−−−−−−−−−−−−−−−−−−−−−−−−−−−−−−−−−−−−−−−−−−−−−−−−−−−−−−−−−−−−−−−−−−−−−−−−−−−−−−−−−−−−−−−−−−−−−−−−−−−−−−−−−−−−−−−−−−−−−−−−−−−−−−−−−−−−−−−−−−−−−−−−−−−−−−−−−−−−−−−−−−−−−−−−−−−−−−−−−−−−−−−−−−−−−−−−−−−−−−−−−−−−−−−−−−−−−−−−−−−−−−−−−−−−−−−−−−−−−−−−−−−−−−−−−−−−−−−−−−−−−−−−−−−−−−−−−−−−−−−−−−−−−−−−−−−−−−−−−−−−−−−−−−−−−−−−−−−−−−−−−−−−−−−−−−−−−−−−−−−−−−−−−−−−−−−−−−−−−−−−−−
DNCA INVEST - VENASQUO
Net Asset Value−−−−−−−−−−−−−−−−−−−−−−−−−−−−−−−−−−−−−−−−−−−−−−−−−−−−−−−−−−−−−−−−−−−−−−−−−−−−−−−−−−−−−−−−−−−−−−−−−−−−−−−−−−−−−−−−−−−−−−−−−−−−−−−−−−−−−−−−−−−−−−−−−−−−−−−−−−−−−−−−−−−−−−−−−−−−−−−−−−−−−−−−−−−−−−−−−−−−−−−−−−−−−−−−−−−−−−−−−−−−−−−−−−−−−−−−−−−−−−−−−−−−−−−−−−−−−−−−−−−−−−−−−−−−−−−−−−−−−−−−−−−−−−−−−−−−−−−−−−−−−−−−−−−−−−−−−−−−−−−−−−−−−−−−−−−−−−−−−−−−−−−−−−−−−−−−−−−−−−−−−−−−−−−−−−−−−−−−−−−−−−−−−−−−−−−−−−−−−−−−−−−−−−−−−−−−−−−−−−−−−−−−−−−−−−−−−−−−−−−−−−−−−−−−−−−−−−−−−−−−−−−−−−−−−−−−−−−−−−−−−−−−−−−−−−−−−−−−−−−−−−−
141,250,541.06 133,766,764.11 190,486,389.16EUR
Net asset value per share
Class A shares EUR 118.20 106.62 98.99EURClass B shares EUR 116.28 105.05 97.84EURClass I shares EUR 121.37 109.20 100.86EURClass N shares EUR 112.46 101.22 93.60EURClass Q shares EUR 130.47 116.00 104.11EUR−−−−−−−−−−−−−−−−−−−−−−−−−−−−−−−−−−−−−−−−−−−−−−−−−−−−−−−−−−−−−−−−−−−−−−−−−−−−−−−−−−−−−−−−−−−−−−−−−−−−−−−−−−−−−−−−−−−−−−−−−−−−−−−−−−−−−−−−−−−−−−−−−−−−−−−−−−−−−−−−−−−−−−−−−−−−−−−−−−−−−−−−−−−−−−−−−−−−−−−−−−−−−−−−−−−−−−−−−−−−−−−−−−−−−−−−−−−−−−−−−−−−−−−−−−−−−−−−−−−−−−−−−−−−−−−−−−−−−−−−−−−−−−−−−−−−−−−−−−−−−−−−−−−−−−−−−−−−−−−−−−−−−−−−−−−−−−−−−−−−−−−−−−−−−−−−−−−−−−−−−−−−−−−−−−−−−−−−−−−−−−−−−−−−−−−−−−−−−−−−−−−−−−−−−−−−−−−−−−−−−−−−−−−−−−−−−−−−−−−−−−−−−−−−−−−−−−−−−−−−−−−−−−−−−−−−−−−−−−−−−−−−−−−−−−−−−−−−−−−−−−−
Number of shares
Class A shares EUR 182,787.575 210,733.726 340,177.577Class B shares EUR 238,343.858 267,771.326 496,833.148Class I shares EUR 744,437.878 733,358.031 1,040,265.361Class N shares EUR 2,023.109 20,766.890 24,900.242Class Q shares EUR 10,325.841 8,474.713 9,144.114−−−−−−−−−−−−−−−−−−−−−−−−−−−−−−−−−−−−−−−−−−−−−−−−−−−−−−−−−−−−−−−−−−−−−−−−−−−−−−−−−−−−−−−−−−−−−−−−−−−−−−−−−−−−−−−−−−−−−−−−−−−−−−−−−−−−−−−−−−−−−−−−−−−−−−−−−−−−−−−−−−−−−−−−−−−−−−−−−−−−−−−−−−−−−−−−−−−−−−−−−−−−−−−−−−−−−−−−−−−−−−−−−−−−−−−−−−−−−−−−−−−−−−−−−−−−−−−−−−−−−−−−−−−−−−−−−−−−−−−−−−−−−−−−−−−−−−−−−−−−−−−−−−−−−−−−−−−−−−−−−−−−−−−−−−−−−−−−−−−−−−−−−−−−−−−−−−−−−−−−−−−−−−−−−−−−−−−−−−−−−−−−−−−−−−−−−−−−−−−−−−−−−−−−−−−−−−−−−−−−−−−−−−−−−−−−−−−−−−−−−−−−−−−−−−−−−−−−−−−−−−−−−−−−−−−−−−−−−−−−−−−−−−−−−−−−−−−−−−−−−−−
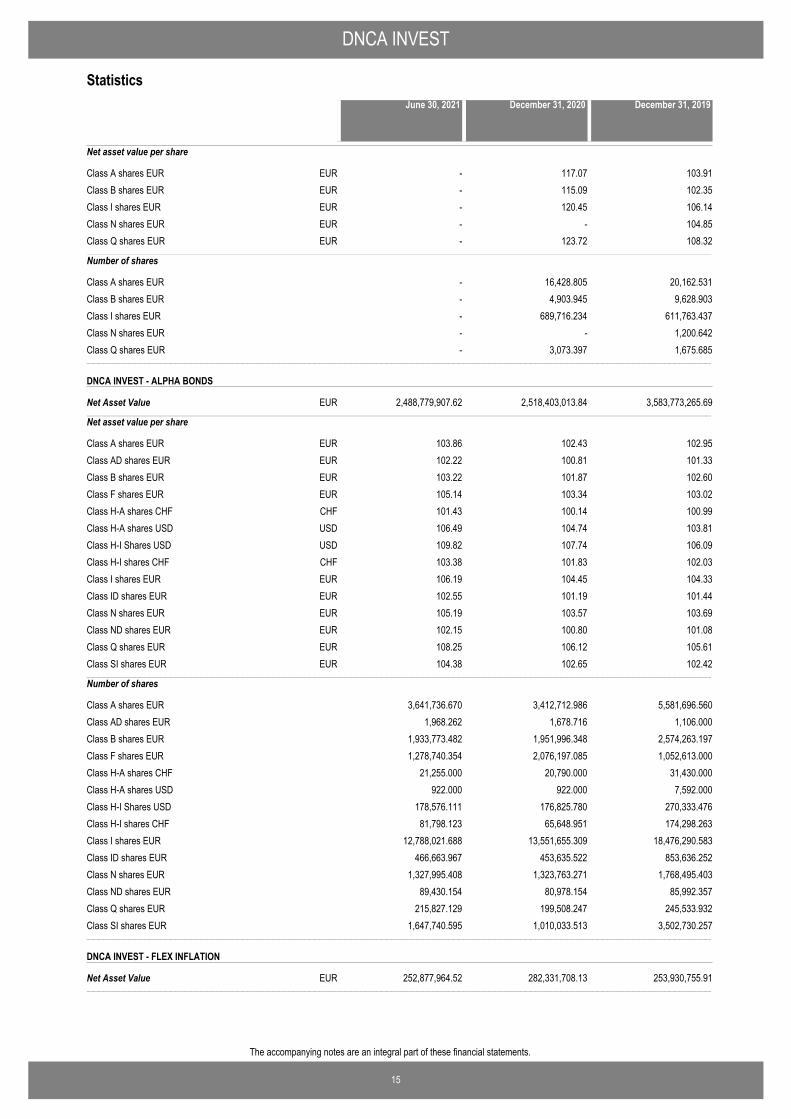
DNCA INVEST - GLOBAL CONVERTIBLES*
Net Asset Value−−−−−−−−−−−−−−−−−−−−−−−−−−−−−−−−−−−−−−−−−−−−−−−−−−−−−−−−−−−−−−−−−−−−−−−−−−−−−−−−−−−−−−−−−−−−−−−−−−−−−−−−−−−−−−−−−−−−−−−−−−−−−−−−−−−−−−−−−−−−−−−−−−−−−−−−−−−−−−−−−−−−−−−−−−−−−−−−−−−−−−−−−−−−−−−−−−−−−−−−−−−−−−−−−−−−−−−−−−−−−−−−−−−−−−−−−−−−−−−−−−−−−−−−−−−−−−−−−−−−−−−−−−−−−−−−−−−−−−−−−−−−−−−−−−−−−−−−−−−−−−−−−−−−−−−−−−−−−−−−−−−−−−−−−−−−−−−−−−−−−−−−−−−−−−−−−−−−−−−−−−−−−−−−−−−−−−−−−−−−−−−−−−−−−−−−−−−−−−−−−−−−−−−−−−−−−−−−−−−−−−−−−−−−−−−−−−−−−−−−−−−−−−−−−−−−−−−−−−−−−−−−−−−−−−−−−−−−−−−−−−−−−−−−−−−−−−−−−−−−−−−
- 85,941,987.00 68,319,251.78EUR
December 31, 2019June 30, 2021 December 31, 2020
* Please see Note 1.
DNCA INVEST
15
The accompanying notes are an integral part of these financial statements.
Statistics
Net asset value per share
Class A shares EUR - 117.07 103.91EURClass B shares EUR - 115.09 102.35EURClass I shares EUR - 120.45 106.14EURClass N shares EUR - - 104.85EURClass Q shares EUR - 123.72 108.32EUR−−−−−−−−−−−−−−−−−−−−−−−−−−−−−−−−−−−−−−−−−−−−−−−−−−−−−−−−−−−−−−−−−−−−−−−−−−−−−−−−−−−−−−−−−−−−−−−−−−−−−−−−−−−−−−−−−−−−−−−−−−−−−−−−−−−−−−−−−−−−−−−−−−−−−−−−−−−−−−−−−−−−−−−−−−−−−−−−−−−−−−−−−−−−−−−−−−−−−−−−−−−−−−−−−−−−−−−−−−−−−−−−−−−−−−−−−−−−−−−−−−−−−−−−−−−−−−−−−−−−−−−−−−−−−−−−−−−−−−−−−−−−−−−−−−−−−−−−−−−−−−−−−−−−−−−−−−−−−−−−−−−−−−−−−−−−−−−−−−−−−−−−−−−−−−−−−−−−−−−−−−−−−−−−−−−−−−−−−−−−−−−−−−−−−−−−−−−−−−−−−−−−−−−−−−−−−−−−−−−−−−−−−−−−−−−−−−−−−−−−−−−−−−−−−−−−−−−−−−−−−−−−−−−−−−−−−−−−−−−−−−−−−−−−−−−−−−−−−−−−−−−
Number of shares
Class A shares EUR - 16,428.805 20,162.531Class B shares EUR - 4,903.945 9,628.903Class I shares EUR - 689,716.234 611,763.437Class N shares EUR - - 1,200.642Class Q shares EUR - 3,073.397 1,675.685−−−−−−−−−−−−−−−−−−−−−−−−−−−−−−−−−−−−−−−−−−−−−−−−−−−−−−−−−−−−−−−−−−−−−−−−−−−−−−−−−−−−−−−−−−−−−−−−−−−−−−−−−−−−−−−−−−−−−−−−−−−−−−−−−−−−−−−−−−−−−−−−−−−−−−−−−−−−−−−−−−−−−−−−−−−−−−−−−−−−−−−−−−−−−−−−−−−−−−−−−−−−−−−−−−−−−−−−−−−−−−−−−−−−−−−−−−−−−−−−−−−−−−−−−−−−−−−−−−−−−−−−−−−−−−−−−−−−−−−−−−−−−−−−−−−−−−−−−−−−−−−−−−−−−−−−−−−−−−−−−−−−−−−−−−−−−−−−−−−−−−−−−−−−−−−−−−−−−−−−−−−−−−−−−−−−−−−−−−−−−−−−−−−−−−−−−−−−−−−−−−−−−−−−−−−−−−−−−−−−−−−−−−−−−−−−−−−−−−−−−−−−−−−−−−−−−−−−−−−−−−−−−−−−−−−−−−−−−−−−−−−−−−−−−−−−−−−−−−−−−−−
DNCA INVEST - ALPHA BONDS
Net Asset Value−−−−−−−−−−−−−−−−−−−−−−−−−−−−−−−−−−−−−−−−−−−−−−−−−−−−−−−−−−−−−−−−−−−−−−−−−−−−−−−−−−−−−−−−−−−−−−−−−−−−−−−−−−−−−−−−−−−−−−−−−−−−−−−−−−−−−−−−−−−−−−−−−−−−−−−−−−−−−−−−−−−−−−−−−−−−−−−−−−−−−−−−−−−−−−−−−−−−−−−−−−−−−−−−−−−−−−−−−−−−−−−−−−−−−−−−−−−−−−−−−−−−−−−−−−−−−−−−−−−−−−−−−−−−−−−−−−−−−−−−−−−−−−−−−−−−−−−−−−−−−−−−−−−−−−−−−−−−−−−−−−−−−−−−−−−−−−−−−−−−−−−−−−−−−−−−−−−−−−−−−−−−−−−−−−−−−−−−−−−−−−−−−−−−−−−−−−−−−−−−−−−−−−−−−−−−−−−−−−−−−−−−−−−−−−−−−−−−−−−−−−−−−−−−−−−−−−−−−−−−−−−−−−−−−−−−−−−−−−−−−−−−−−−−−−−−−−−−−−−−−−−
2,488,779,907.62 2,518,403,013.84 3,583,773,265.69EUR
Net asset value per share
Class A shares EUR 103.86 102.43 102.95EURClass AD shares EUR 102.22 100.81 101.33EURClass B shares EUR 103.22 101.87 102.60EURClass F shares EUR 105.14 103.34 103.02EURClass H-A shares CHF 101.43 100.14 100.99CHFClass H-A shares USD 106.49 104.74 103.81USDClass H-I Shares USD 109.82 107.74 106.09USDClass H-I shares CHF 103.38 101.83 102.03CHFClass I shares EUR 106.19 104.45 104.33EURClass ID shares EUR 102.55 101.19 101.44EURClass N shares EUR 105.19 103.57 103.69EURClass ND shares EUR 102.15 100.80 101.08EURClass Q shares EUR 108.25 106.12 105.61EURClass SI shares EUR 104.38 102.65 102.42EUR−−−−−−−−−−−−−−−−−−−−−−−−−−−−−−−−−−−−−−−−−−−−−−−−−−−−−−−−−−−−−−−−−−−−−−−−−−−−−−−−−−−−−−−−−−−−−−−−−−−−−−−−−−−−−−−−−−−−−−−−−−−−−−−−−−−−−−−−−−−−−−−−−−−−−−−−−−−−−−−−−−−−−−−−−−−−−−−−−−−−−−−−−−−−−−−−−−−−−−−−−−−−−−−−−−−−−−−−−−−−−−−−−−−−−−−−−−−−−−−−−−−−−−−−−−−−−−−−−−−−−−−−−−−−−−−−−−−−−−−−−−−−−−−−−−−−−−−−−−−−−−−−−−−−−−−−−−−−−−−−−−−−−−−−−−−−−−−−−−−−−−−−−−−−−−−−−−−−−−−−−−−−−−−−−−−−−−−−−−−−−−−−−−−−−−−−−−−−−−−−−−−−−−−−−−−−−−−−−−−−−−−−−−−−−−−−−−−−−−−−−−−−−−−−−−−−−−−−−−−−−−−−−−−−−−−−−−−−−−−−−−−−−−−−−−−−−−−−−−−−−−−
Number of shares
Class A shares EUR 3,641,736.670 3,412,712.986 5,581,696.560Class AD shares EUR 1,968.262 1,678.716 1,106.000Class B shares EUR 1,933,773.482 1,951,996.348 2,574,263.197Class F shares EUR 1,278,740.354 2,076,197.085 1,052,613.000Class H-A shares CHF 21,255.000 20,790.000 31,430.000Class H-A shares USD 922.000 922.000 7,592.000Class H-I Shares USD 178,576.111 176,825.780 270,333.476Class H-I shares CHF 81,798.123 65,648.951 174,298.263Class I shares EUR 12,788,021.688 13,551,655.309 18,476,290.583Class ID shares EUR 466,663.967 453,635.522 853,636.252Class N shares EUR 1,327,995.408 1,323,763.271 1,768,495.403Class ND shares EUR 89,430.154 80,978.154 85,992.357Class Q shares EUR 215,827.129 199,508.247 245,533.932Class SI shares EUR 1,647,740.595 1,010,033.513 3,502,730.257−−−−−−−−−−−−−−−−−−−−−−−−−−−−−−−−−−−−−−−−−−−−−−−−−−−−−−−−−−−−−−−−−−−−−−−−−−−−−−−−−−−−−−−−−−−−−−−−−−−−−−−−−−−−−−−−−−−−−−−−−−−−−−−−−−−−−−−−−−−−−−−−−−−−−−−−−−−−−−−−−−−−−−−−−−−−−−−−−−−−−−−−−−−−−−−−−−−−−−−−−−−−−−−−−−−−−−−−−−−−−−−−−−−−−−−−−−−−−−−−−−−−−−−−−−−−−−−−−−−−−−−−−−−−−−−−−−−−−−−−−−−−−−−−−−−−−−−−−−−−−−−−−−−−−−−−−−−−−−−−−−−−−−−−−−−−−−−−−−−−−−−−−−−−−−−−−−−−−−−−−−−−−−−−−−−−−−−−−−−−−−−−−−−−−−−−−−−−−−−−−−−−−−−−−−−−−−−−−−−−−−−−−−−−−−−−−−−−−−−−−−−−−−−−−−−−−−−−−−−−−−−−−−−−−−−−−−−−−−−−−−−−−−−−−−−−−−−−−−−−−−−
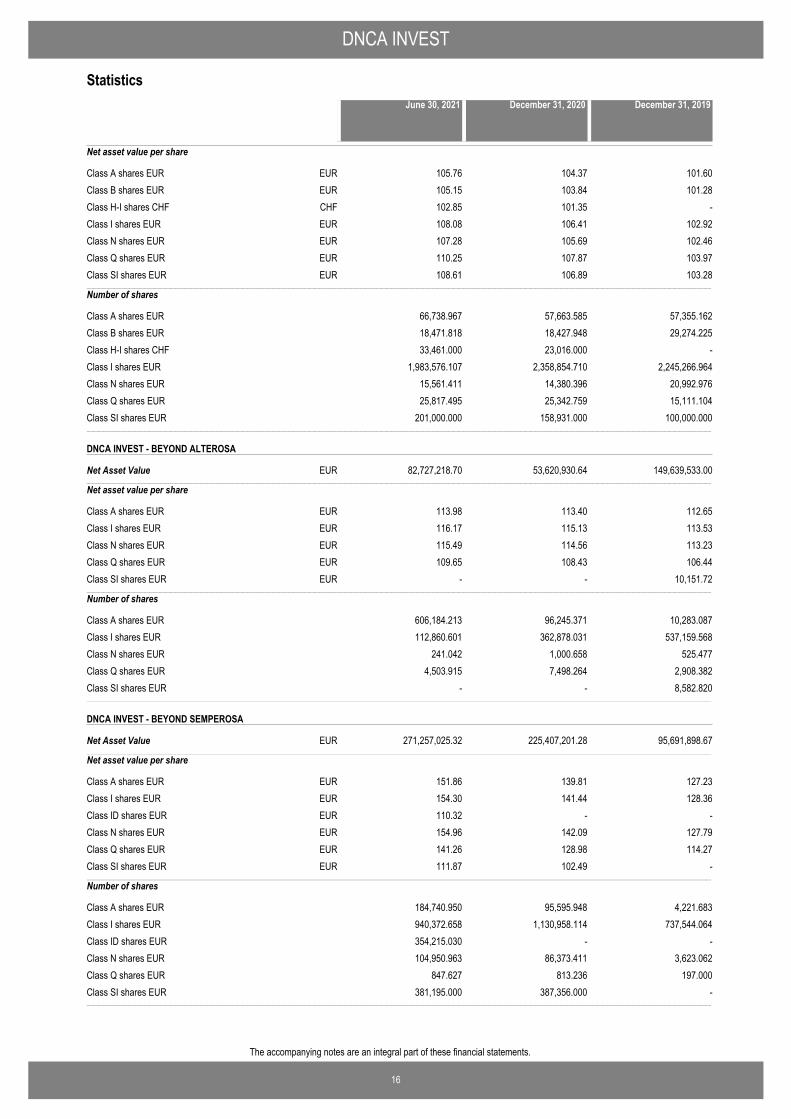
DNCA INVEST - FLEX INFLATION
Net Asset Value−−−−−−−−−−−−−−−−−−−−−−−−−−−−−−−−−−−−−−−−−−−−−−−−−−−−−−−−−−−−−−−−−−−−−−−−−−−−−−−−−−−−−−−−−−−−−−−−−−−−−−−−−−−−−−−−−−−−−−−−−−−−−−−−−−−−−−−−−−−−−−−−−−−−−−−−−−−−−−−−−−−−−−−−−−−−−−−−−−−−−−−−−−−−−−−−−−−−−−−−−−−−−−−−−−−−−−−−−−−−−−−−−−−−−−−−−−−−−−−−−−−−−−−−−−−−−−−−−−−−−−−−−−−−−−−−−−−−−−−−−−−−−−−−−−−−−−−−−−−−−−−−−−−−−−−−−−−−−−−−−−−−−−−−−−−−−−−−−−−−−−−−−−−−−−−−−−−−−−−−−−−−−−−−−−−−−−−−−−−−−−−−−−−−−−−−−−−−−−−−−−−−−−−−−−−−−−−−−−−−−−−−−−−−−−−−−−−−−−−−−−−−−−−−−−−−−−−−−−−−−−−−−−−−−−−−−−−−−−−−−−−−−−−−−−−−−−−−−−−−−−−
252,877,964.52 282,331,708.13 253,930,755.91EUR
December 31, 2019June 30, 2021 December 31, 2020
DNCA INVEST
16
The accompanying notes are an integral part of these financial statements.
Statistics
Net asset value per share
Class A shares EUR 105.76 104.37 101.60EURClass B shares EUR 105.15 103.84 101.28EURClass H-I shares CHF 102.85 101.35 -CHFClass I shares EUR 108.08 106.41 102.92EURClass N shares EUR 107.28 105.69 102.46EURClass Q shares EUR 110.25 107.87 103.97EURClass SI shares EUR 108.61 106.89 103.28EUR−−−−−−−−−−−−−−−−−−−−−−−−−−−−−−−−−−−−−−−−−−−−−−−−−−−−−−−−−−−−−−−−−−−−−−−−−−−−−−−−−−−−−−−−−−−−−−−−−−−−−−−−−−−−−−−−−−−−−−−−−−−−−−−−−−−−−−−−−−−−−−−−−−−−−−−−−−−−−−−−−−−−−−−−−−−−−−−−−−−−−−−−−−−−−−−−−−−−−−−−−−−−−−−−−−−−−−−−−−−−−−−−−−−−−−−−−−−−−−−−−−−−−−−−−−−−−−−−−−−−−−−−−−−−−−−−−−−−−−−−−−−−−−−−−−−−−−−−−−−−−−−−−−−−−−−−−−−−−−−−−−−−−−−−−−−−−−−−−−−−−−−−−−−−−−−−−−−−−−−−−−−−−−−−−−−−−−−−−−−−−−−−−−−−−−−−−−−−−−−−−−−−−−−−−−−−−−−−−−−−−−−−−−−−−−−−−−−−−−−−−−−−−−−−−−−−−−−−−−−−−−−−−−−−−−−−−−−−−−−−−−−−−−−−−−−−−−−−−−−−−−−
Number of shares
Class A shares EUR 66,738.967 57,663.585 57,355.162Class B shares EUR 18,471.818 18,427.948 29,274.225Class H-I shares CHF 33,461.000 23,016.000 -Class I shares EUR 1,983,576.107 2,358,854.710 2,245,266.964Class N shares EUR 15,561.411 14,380.396 20,992.976Class Q shares EUR 25,817.495 25,342.759 15,111.104Class SI shares EUR 201,000.000 158,931.000 100,000.000−−−−−−−−−−−−−−−−−−−−−−−−−−−−−−−−−−−−−−−−−−−−−−−−−−−−−−−−−−−−−−−−−−−−−−−−−−−−−−−−−−−−−−−−−−−−−−−−−−−−−−−−−−−−−−−−−−−−−−−−−−−−−−−−−−−−−−−−−−−−−−−−−−−−−−−−−−−−−−−−−−−−−−−−−−−−−−−−−−−−−−−−−−−−−−−−−−−−−−−−−−−−−−−−−−−−−−−−−−−−−−−−−−−−−−−−−−−−−−−−−−−−−−−−−−−−−−−−−−−−−−−−−−−−−−−−−−−−−−−−−−−−−−−−−−−−−−−−−−−−−−−−−−−−−−−−−−−−−−−−−−−−−−−−−−−−−−−−−−−−−−−−−−−−−−−−−−−−−−−−−−−−−−−−−−−−−−−−−−−−−−−−−−−−−−−−−−−−−−−−−−−−−−−−−−−−−−−−−−−−−−−−−−−−−−−−−−−−−−−−−−−−−−−−−−−−−−−−−−−−−−−−−−−−−−−−−−−−−−−−−−−−−−−−−−−−−−−−−−−−−−−
DNCA INVEST - BEYOND ALTEROSA
Net Asset Value−−−−−−−−−−−−−−−−−−−−−−−−−−−−−−−−−−−−−−−−−−−−−−−−−−−−−−−−−−−−−−−−−−−−−−−−−−−−−−−−−−−−−−−−−−−−−−−−−−−−−−−−−−−−−−−−−−−−−−−−−−−−−−−−−−−−−−−−−−−−−−−−−−−−−−−−−−−−−−−−−−−−−−−−−−−−−−−−−−−−−−−−−−−−−−−−−−−−−−−−−−−−−−−−−−−−−−−−−−−−−−−−−−−−−−−−−−−−−−−−−−−−−−−−−−−−−−−−−−−−−−−−−−−−−−−−−−−−−−−−−−−−−−−−−−−−−−−−−−−−−−−−−−−−−−−−−−−−−−−−−−−−−−−−−−−−−−−−−−−−−−−−−−−−−−−−−−−−−−−−−−−−−−−−−−−−−−−−−−−−−−−−−−−−−−−−−−−−−−−−−−−−−−−−−−−−−−−−−−−−−−−−−−−−−−−−−−−−−−−−−−−−−−−−−−−−−−−−−−−−−−−−−−−−−−−−−−−−−−−−−−−−−−−−−−−−−−−−−−−−−−−
82,727,218.70 53,620,930.64 149,639,533.00EUR
Net asset value per share
Class A shares EUR 113.98 113.40 112.65EURClass I shares EUR 116.17 115.13 113.53EURClass N shares EUR 115.49 114.56 113.23EURClass Q shares EUR 109.65 108.43 106.44EURClass SI shares EUR - - 10,151.72EUR−−−−−−−−−−−−−−−−−−−−−−−−−−−−−−−−−−−−−−−−−−−−−−−−−−−−−−−−−−−−−−−−−−−−−−−−−−−−−−−−−−−−−−−−−−−−−−−−−−−−−−−−−−−−−−−−−−−−−−−−−−−−−−−−−−−−−−−−−−−−−−−−−−−−−−−−−−−−−−−−−−−−−−−−−−−−−−−−−−−−−−−−−−−−−−−−−−−−−−−−−−−−−−−−−−−−−−−−−−−−−−−−−−−−−−−−−−−−−−−−−−−−−−−−−−−−−−−−−−−−−−−−−−−−−−−−−−−−−−−−−−−−−−−−−−−−−−−−−−−−−−−−−−−−−−−−−−−−−−−−−−−−−−−−−−−−−−−−−−−−−−−−−−−−−−−−−−−−−−−−−−−−−−−−−−−−−−−−−−−−−−−−−−−−−−−−−−−−−−−−−−−−−−−−−−−−−−−−−−−−−−−−−−−−−−−−−−−−−−−−−−−−−−−−−−−−−−−−−−−−−−−−−−−−−−−−−−−−−−−−−−−−−−−−−−−−−−−−−−−−−−−
Number of shares
Class A shares EUR 606,184.213 96,245.371 10,283.087Class I shares EUR 112,860.601 362,878.031 537,159.568Class N shares EUR 241.042 1,000.658 525.477Class Q shares EUR 4,503.915 7,498.264 2,908.382Class SI shares EUR - - 8,582.820−−−−−−−−−−−−−−−−−−−−−−−−−−−−−−−−−−−−−−−−−−−−−−−−−−−−−−−−−−−−−−−−−−−−−−−−−−−−−−−−−−−−−−−−−−−−−−−−−−−−−−−−−−−−−−−−−−−−−−−−−−−−−−−−−−−−−−−−−−−−−−−−−−−−−−−−−−−−−−−−−−−−−−−−−−−−−−−−−−−−−−−−−−−−−−−−−−−−−−−−−−−−−−−−−−−−−−−−−−−−−−−−−−−−−−−−−−−−−−−−−−−−−−−−−−−−−−−−−−−−−−−−−−−−−−−−−−−−−−−−−−−−−−−−−−−−−−−−−−−−−−−−−−−−−−−−−−−−−−−−−−−−−−−−−−−−−−−−−−−−−−−−−−−−−−−−−−−−−−−−−−−−−−−−−−−−−−−−−−−−−−−−−−−−−−−−−−−−−−−−−−−−−−−−−−−−−−−−−−−−−−−−−−−−−−−−−−−−−−−−−−−−−−−−−−−−−−−−−−−−−−−−−−−−−−−−−−−−−−−−−−−−−−−−−−−−−−−−−−−−−−−
DNCA INVEST - BEYOND SEMPEROSA
Net Asset Value−−−−−−−−−−−−−−−−−−−−−−−−−−−−−−−−−−−−−−−−−−−−−−−−−−−−−−−−−−−−−−−−−−−−−−−−−−−−−−−−−−−−−−−−−−−−−−−−−−−−−−−−−−−−−−−−−−−−−−−−−−−−−−−−−−−−−−−−−−−−−−−−−−−−−−−−−−−−−−−−−−−−−−−−−−−−−−−−−−−−−−−−−−−−−−−−−−−−−−−−−−−−−−−−−−−−−−−−−−−−−−−−−−−−−−−−−−−−−−−−−−−−−−−−−−−−−−−−−−−−−−−−−−−−−−−−−−−−−−−−−−−−−−−−−−−−−−−−−−−−−−−−−−−−−−−−−−−−−−−−−−−−−−−−−−−−−−−−−−−−−−−−−−−−−−−−−−−−−−−−−−−−−−−−−−−−−−−−−−−−−−−−−−−−−−−−−−−−−−−−−−−−−−−−−−−−−−−−−−−−−−−−−−−−−−−−−−−−−−−−−−−−−−−−−−−−−−−−−−−−−−−−−−−−−−−−−−−−−−−−−−−−−−−−−−−−−−−−−−−−−−−
271,257,025.32 225,407,201.28 95,691,898.67EUR
Net asset value per share
Class A shares EUR 151.86 139.81 127.23EURClass I shares EUR 154.30 141.44 128.36EURClass ID shares EUR 110.32 - -EURClass N shares EUR 154.96 142.09 127.79EURClass Q shares EUR 141.26 128.98 114.27EURClass SI shares EUR 111.87 102.49 -EUR−−−−−−−−−−−−−−−−−−−−−−−−−−−−−−−−−−−−−−−−−−−−−−−−−−−−−−−−−−−−−−−−−−−−−−−−−−−−−−−−−−−−−−−−−−−−−−−−−−−−−−−−−−−−−−−−−−−−−−−−−−−−−−−−−−−−−−−−−−−−−−−−−−−−−−−−−−−−−−−−−−−−−−−−−−−−−−−−−−−−−−−−−−−−−−−−−−−−−−−−−−−−−−−−−−−−−−−−−−−−−−−−−−−−−−−−−−−−−−−−−−−−−−−−−−−−−−−−−−−−−−−−−−−−−−−−−−−−−−−−−−−−−−−−−−−−−−−−−−−−−−−−−−−−−−−−−−−−−−−−−−−−−−−−−−−−−−−−−−−−−−−−−−−−−−−−−−−−−−−−−−−−−−−−−−−−−−−−−−−−−−−−−−−−−−−−−−−−−−−−−−−−−−−−−−−−−−−−−−−−−−−−−−−−−−−−−−−−−−−−−−−−−−−−−−−−−−−−−−−−−−−−−−−−−−−−−−−−−−−−−−−−−−−−−−−−−−−−−−−−−−−
Number of shares
Class A shares EUR 184,740.950 95,595.948 4,221.683Class I shares EUR 940,372.658 1,130,958.114 737,544.064Class ID shares EUR 354,215.030 - -Class N shares EUR 104,950.963 86,373.411 3,623.062Class Q shares EUR 847.627 813.236 197.000Class SI shares EUR 381,195.000 387,356.000 -−−−−−−−−−−−−−−−−−−−−−−−−−−−−−−−−−−−−−−−−−−−−−−−−−−−−−−−−−−−−−−−−−−−−−−−−−−−−−−−−−−−−−−−−−−−−−−−−−−−−−−−−−−−−−−−−−−−−−−−−−−−−−−−−−−−−−−−−−−−−−−−−−−−−−−−−−−−−−−−−−−−−−−−−−−−−−−−−−−−−−−−−−−−−−−−−−−−−−−−−−−−−−−−−−−−−−−−−−−−−−−−−−−−−−−−−−−−−−−−−−−−−−−−−−−−−−−−−−−−−−−−−−−−−−−−−−−−−−−−−−−−−−−−−−−−−−−−−−−−−−−−−−−−−−−−−−−−−−−−−−−−−−−−−−−−−−−−−−−−−−−−−−−−−−−−−−−−−−−−−−−−−−−−−−−−−−−−−−−−−−−−−−−−−−−−−−−−−−−−−−−−−−−−−−−−−−−−−−−−−−−−−−−−−−−−−−−−−−−−−−−−−−−−−−−−−−−−−−−−−−−−−−−−−−−−−−−−−−−−−−−−−−−−−−−−−−−−−−−−−−−−
December 31, 2019June 30, 2021 December 31, 2020
DNCA INVEST
17
The accompanying notes are an integral part of these financial statements.
Statistics
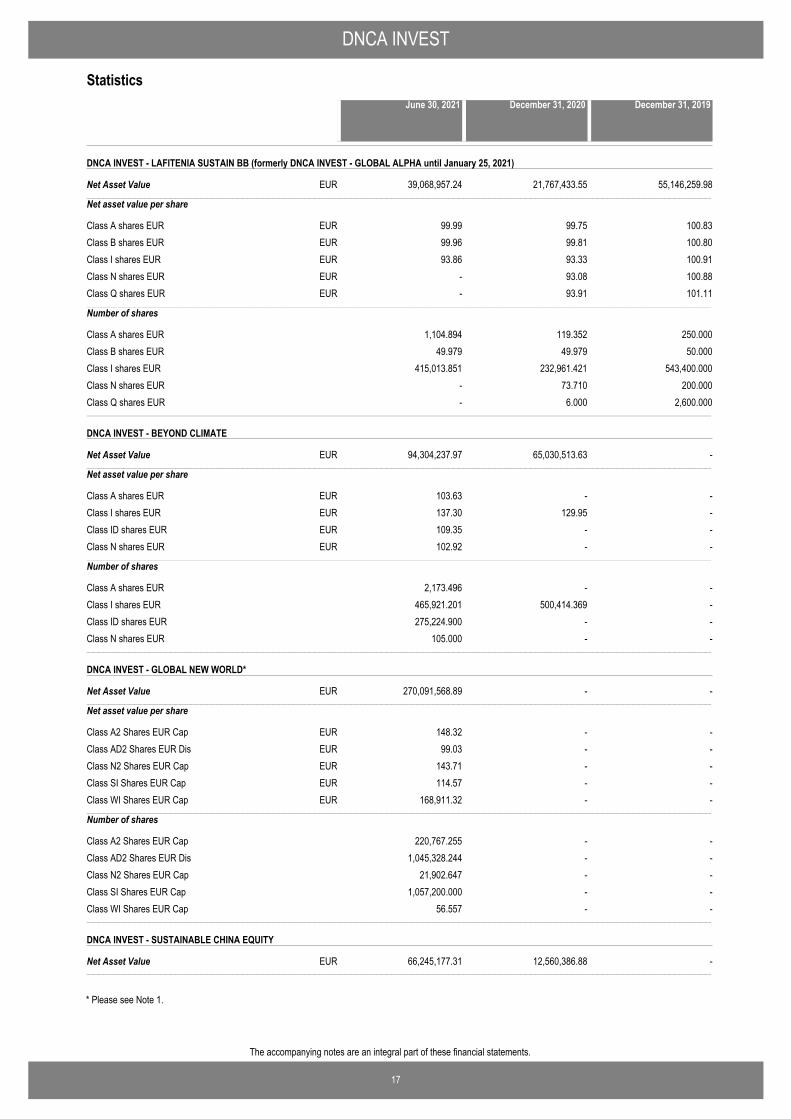
DNCA INVEST - LAFITENIA SUSTAIN BB (formerly DNCA INVEST - GLOBAL ALPHA until January 25, 2021)
Net Asset Value−−−−−−−−−−−−−−−−−−−−−−−−−−−−−−−−−−−−−−−−−−−−−−−−−−−−−−−−−−−−−−−−−−−−−−−−−−−−−−−−−−−−−−−−−−−−−−−−−−−−−−−−−−−−−−−−−−−−−−−−−−−−−−−−−−−−−−−−−−−−−−−−−−−−−−−−−−−−−−−−−−−−−−−−−−−−−−−−−−−−−−−−−−−−−−−−−−−−−−−−−−−−−−−−−−−−−−−−−−−−−−−−−−−−−−−−−−−−−−−−−−−−−−−−−−−−−−−−−−−−−−−−−−−−−−−−−−−−−−−−−−−−−−−−−−−−−−−−−−−−−−−−−−−−−−−−−−−−−−−−−−−−−−−−−−−−−−−−−−−−−−−−−−−−−−−−−−−−−−−−−−−−−−−−−−−−−−−−−−−−−−−−−−−−−−−−−−−−−−−−−−−−−−−−−−−−−−−−−−−−−−−−−−−−−−−−−−−−−−−−−−−−−−−−−−−−−−−−−−−−−−−−−−−−−−−−−−−−−−−−−−−−−−−−−−−−−−−−−−−−−−−
39,068,957.24 21,767,433.55 55,146,259.98EUR
Net asset value per share
Class A shares EUR 99.99 99.75 100.83EURClass B shares EUR 99.96 99.81 100.80EURClass I shares EUR 93.86 93.33 100.91EURClass N shares EUR - 93.08 100.88EURClass Q shares EUR - 93.91 101.11EUR−−−−−−−−−−−−−−−−−−−−−−−−−−−−−−−−−−−−−−−−−−−−−−−−−−−−−−−−−−−−−−−−−−−−−−−−−−−−−−−−−−−−−−−−−−−−−−−−−−−−−−−−−−−−−−−−−−−−−−−−−−−−−−−−−−−−−−−−−−−−−−−−−−−−−−−−−−−−−−−−−−−−−−−−−−−−−−−−−−−−−−−−−−−−−−−−−−−−−−−−−−−−−−−−−−−−−−−−−−−−−−−−−−−−−−−−−−−−−−−−−−−−−−−−−−−−−−−−−−−−−−−−−−−−−−−−−−−−−−−−−−−−−−−−−−−−−−−−−−−−−−−−−−−−−−−−−−−−−−−−−−−−−−−−−−−−−−−−−−−−−−−−−−−−−−−−−−−−−−−−−−−−−−−−−−−−−−−−−−−−−−−−−−−−−−−−−−−−−−−−−−−−−−−−−−−−−−−−−−−−−−−−−−−−−−−−−−−−−−−−−−−−−−−−−−−−−−−−−−−−−−−−−−−−−−−−−−−−−−−−−−−−−−−−−−−−−−−−−−−−−−−
Number of shares
Class A shares EUR 1,104.894 119.352 250.000Class B shares EUR 49.979 49.979 50.000Class I shares EUR 415,013.851 232,961.421 543,400.000Class N shares EUR - 73.710 200.000Class Q shares EUR - 6.000 2,600.000−−−−−−−−−−−−−−−−−−−−−−−−−−−−−−−−−−−−−−−−−−−−−−−−−−−−−−−−−−−−−−−−−−−−−−−−−−−−−−−−−−−−−−−−−−−−−−−−−−−−−−−−−−−−−−−−−−−−−−−−−−−−−−−−−−−−−−−−−−−−−−−−−−−−−−−−−−−−−−−−−−−−−−−−−−−−−−−−−−−−−−−−−−−−−−−−−−−−−−−−−−−−−−−−−−−−−−−−−−−−−−−−−−−−−−−−−−−−−−−−−−−−−−−−−−−−−−−−−−−−−−−−−−−−−−−−−−−−−−−−−−−−−−−−−−−−−−−−−−−−−−−−−−−−−−−−−−−−−−−−−−−−−−−−−−−−−−−−−−−−−−−−−−−−−−−−−−−−−−−−−−−−−−−−−−−−−−−−−−−−−−−−−−−−−−−−−−−−−−−−−−−−−−−−−−−−−−−−−−−−−−−−−−−−−−−−−−−−−−−−−−−−−−−−−−−−−−−−−−−−−−−−−−−−−−−−−−−−−−−−−−−−−−−−−−−−−−−−−−−−−−−
DNCA INVEST - BEYOND CLIMATE
Net Asset Value−−−−−−−−−−−−−−−−−−−−−−−−−−−−−−−−−−−−−−−−−−−−−−−−−−−−−−−−−−−−−−−−−−−−−−−−−−−−−−−−−−−−−−−−−−−−−−−−−−−−−−−−−−−−−−−−−−−−−−−−−−−−−−−−−−−−−−−−−−−−−−−−−−−−−−−−−−−−−−−−−−−−−−−−−−−−−−−−−−−−−−−−−−−−−−−−−−−−−−−−−−−−−−−−−−−−−−−−−−−−−−−−−−−−−−−−−−−−−−−−−−−−−−−−−−−−−−−−−−−−−−−−−−−−−−−−−−−−−−−−−−−−−−−−−−−−−−−−−−−−−−−−−−−−−−−−−−−−−−−−−−−−−−−−−−−−−−−−−−−−−−−−−−−−−−−−−−−−−−−−−−−−−−−−−−−−−−−−−−−−−−−−−−−−−−−−−−−−−−−−−−−−−−−−−−−−−−−−−−−−−−−−−−−−−−−−−−−−−−−−−−−−−−−−−−−−−−−−−−−−−−−−−−−−−−−−−−−−−−−−−−−−−−−−−−−−−−−−−−−−−−−
94,304,237.97 65,030,513.63 -EUR
Net asset value per share
Class A shares EUR 103.63 - -EURClass I shares EUR 137.30 129.95 -EURClass ID shares EUR 109.35 - -EURClass N shares EUR 102.92 - -EUR−−−−−−−−−−−−−−−−−−−−−−−−−−−−−−−−−−−−−−−−−−−−−−−−−−−−−−−−−−−−−−−−−−−−−−−−−−−−−−−−−−−−−−−−−−−−−−−−−−−−−−−−−−−−−−−−−−−−−−−−−−−−−−−−−−−−−−−−−−−−−−−−−−−−−−−−−−−−−−−−−−−−−−−−−−−−−−−−−−−−−−−−−−−−−−−−−−−−−−−−−−−−−−−−−−−−−−−−−−−−−−−−−−−−−−−−−−−−−−−−−−−−−−−−−−−−−−−−−−−−−−−−−−−−−−−−−−−−−−−−−−−−−−−−−−−−−−−−−−−−−−−−−−−−−−−−−−−−−−−−−−−−−−−−−−−−−−−−−−−−−−−−−−−−−−−−−−−−−−−−−−−−−−−−−−−−−−−−−−−−−−−−−−−−−−−−−−−−−−−−−−−−−−−−−−−−−−−−−−−−−−−−−−−−−−−−−−−−−−−−−−−−−−−−−−−−−−−−−−−−−−−−−−−−−−−−−−−−−−−−−−−−−−−−−−−−−−−−−−−−−−−
Number of shares
Class A shares EUR 2,173.496 - -Class I shares EUR 465,921.201 500,414.369 -Class ID shares EUR 275,224.900 - -Class N shares EUR 105.000 - -−−−−−−−−−−−−−−−−−−−−−−−−−−−−−−−−−−−−−−−−−−−−−−−−−−−−−−−−−−−−−−−−−−−−−−−−−−−−−−−−−−−−−−−−−−−−−−−−−−−−−−−−−−−−−−−−−−−−−−−−−−−−−−−−−−−−−−−−−−−−−−−−−−−−−−−−−−−−−−−−−−−−−−−−−−−−−−−−−−−−−−−−−−−−−−−−−−−−−−−−−−−−−−−−−−−−−−−−−−−−−−−−−−−−−−−−−−−−−−−−−−−−−−−−−−−−−−−−−−−−−−−−−−−−−−−−−−−−−−−−−−−−−−−−−−−−−−−−−−−−−−−−−−−−−−−−−−−−−−−−−−−−−−−−−−−−−−−−−−−−−−−−−−−−−−−−−−−−−−−−−−−−−−−−−−−−−−−−−−−−−−−−−−−−−−−−−−−−−−−−−−−−−−−−−−−−−−−−−−−−−−−−−−−−−−−−−−−−−−−−−−−−−−−−−−−−−−−−−−−−−−−−−−−−−−−−−−−−−−−−−−−−−−−−−−−−−−−−−−−−−−−
DNCA INVEST - GLOBAL NEW WORLD*
Net Asset Value−−−−−−−−−−−−−−−−−−−−−−−−−−−−−−−−−−−−−−−−−−−−−−−−−−−−−−−−−−−−−−−−−−−−−−−−−−−−−−−−−−−−−−−−−−−−−−−−−−−−−−−−−−−−−−−−−−−−−−−−−−−−−−−−−−−−−−−−−−−−−−−−−−−−−−−−−−−−−−−−−−−−−−−−−−−−−−−−−−−−−−−−−−−−−−−−−−−−−−−−−−−−−−−−−−−−−−−−−−−−−−−−−−−−−−−−−−−−−−−−−−−−−−−−−−−−−−−−−−−−−−−−−−−−−−−−−−−−−−−−−−−−−−−−−−−−−−−−−−−−−−−−−−−−−−−−−−−−−−−−−−−−−−−−−−−−−−−−−−−−−−−−−−−−−−−−−−−−−−−−−−−−−−−−−−−−−−−−−−−−−−−−−−−−−−−−−−−−−−−−−−−−−−−−−−−−−−−−−−−−−−−−−−−−−−−−−−−−−−−−−−−−−−−−−−−−−−−−−−−−−−−−−−−−−−−−−−−−−−−−−−−−−−−−−−−−−−−−−−−−−−−
270,091,568.89 - -EUR
Net asset value per share
Class A2 Shares EUR Cap 148.32 - -EURClass AD2 Shares EUR Dis 99.03 - -EURClass N2 Shares EUR Cap 143.71 - -EURClass SI Shares EUR Cap 114.57 - -EURClass WI Shares EUR Cap 168,911.32 - -EUR−−−−−−−−−−−−−−−−−−−−−−−−−−−−−−−−−−−−−−−−−−−−−−−−−−−−−−−−−−−−−−−−−−−−−−−−−−−−−−−−−−−−−−−−−−−−−−−−−−−−−−−−−−−−−−−−−−−−−−−−−−−−−−−−−−−−−−−−−−−−−−−−−−−−−−−−−−−−−−−−−−−−−−−−−−−−−−−−−−−−−−−−−−−−−−−−−−−−−−−−−−−−−−−−−−−−−−−−−−−−−−−−−−−−−−−−−−−−−−−−−−−−−−−−−−−−−−−−−−−−−−−−−−−−−−−−−−−−−−−−−−−−−−−−−−−−−−−−−−−−−−−−−−−−−−−−−−−−−−−−−−−−−−−−−−−−−−−−−−−−−−−−−−−−−−−−−−−−−−−−−−−−−−−−−−−−−−−−−−−−−−−−−−−−−−−−−−−−−−−−−−−−−−−−−−−−−−−−−−−−−−−−−−−−−−−−−−−−−−−−−−−−−−−−−−−−−−−−−−−−−−−−−−−−−−−−−−−−−−−−−−−−−−−−−−−−−−−−−−−−−−−
Number of shares
Class A2 Shares EUR Cap 220,767.255 - -Class AD2 Shares EUR Dis 1,045,328.244 - -Class N2 Shares EUR Cap 21,902.647 - -Class SI Shares EUR Cap 1,057,200.000 - -Class WI Shares EUR Cap 56.557 - -−−−−−−−−−−−−−−−−−−−−−−−−−−−−−−−−−−−−−−−−−−−−−−−−−−−−−−−−−−−−−−−−−−−−−−−−−−−−−−−−−−−−−−−−−−−−−−−−−−−−−−−−−−−−−−−−−−−−−−−−−−−−−−−−−−−−−−−−−−−−−−−−−−−−−−−−−−−−−−−−−−−−−−−−−−−−−−−−−−−−−−−−−−−−−−−−−−−−−−−−−−−−−−−−−−−−−−−−−−−−−−−−−−−−−−−−−−−−−−−−−−−−−−−−−−−−−−−−−−−−−−−−−−−−−−−−−−−−−−−−−−−−−−−−−−−−−−−−−−−−−−−−−−−−−−−−−−−−−−−−−−−−−−−−−−−−−−−−−−−−−−−−−−−−−−−−−−−−−−−−−−−−−−−−−−−−−−−−−−−−−−−−−−−−−−−−−−−−−−−−−−−−−−−−−−−−−−−−−−−−−−−−−−−−−−−−−−−−−−−−−−−−−−−−−−−−−−−−−−−−−−−−−−−−−−−−−−−−−−−−−−−−−−−−−−−−−−−−−−−−−−−
DNCA INVEST - SUSTAINABLE CHINA EQUITY
Net Asset Value−−−−−−−−−−−−−−−−−−−−−−−−−−−−−−−−−−−−−−−−−−−−−−−−−−−−−−−−−−−−−−−−−−−−−−−−−−−−−−−−−−−−−−−−−−−−−−−−−−−−−−−−−−−−−−−−−−−−−−−−−−−−−−−−−−−−−−−−−−−−−−−−−−−−−−−−−−−−−−−−−−−−−−−−−−−−−−−−−−−−−−−−−−−−−−−−−−−−−−−−−−−−−−−−−−−−−−−−−−−−−−−−−−−−−−−−−−−−−−−−−−−−−−−−−−−−−−−−−−−−−−−−−−−−−−−−−−−−−−−−−−−−−−−−−−−−−−−−−−−−−−−−−−−−−−−−−−−−−−−−−−−−−−−−−−−−−−−−−−−−−−−−−−−−−−−−−−−−−−−−−−−−−−−−−−−−−−−−−−−−−−−−−−−−−−−−−−−−−−−−−−−−−−−−−−−−−−−−−−−−−−−−−−−−−−−−−−−−−−−−−−−−−−−−−−−−−−−−−−−−−−−−−−−−−−−−−−−−−−−−−−−−−−−−−−−−−−−−−−−−−−−
66,245,177.31 12,560,386.88 -EUR
December 31, 2019June 30, 2021 December 31, 2020
* Please see Note 1.
DNCA INVEST
18
The accompanying notes are an integral part of these financial statements.
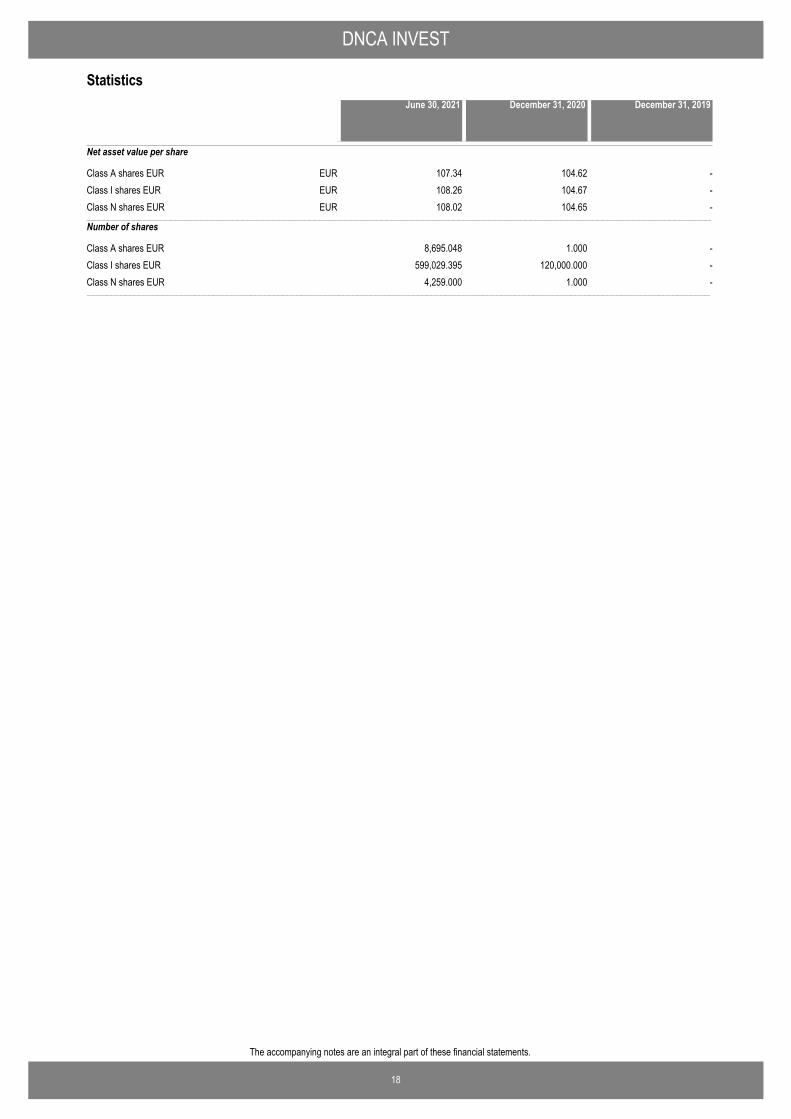
Statistics
Net asset value per share
Class A shares EUR 107.34 104.62 -EURClass I shares EUR 108.26 104.67 -EURClass N shares EUR 108.02 104.65 -EUR−−−−−−−−−−−−−−−−−−−−−−−−−−−−−−−−−−−−−−−−−−−−−−−−−−−−−−−−−−−−−−−−−−−−−−−−−−−−−−−−−−−−−−−−−−−−−−−−−−−−−−−−−−−−−−−−−−−−−−−−−−−−−−−−−−−−−−−−−−−−−−−−−−−−−−−−−−−−−−−−−−−−−−−−−−−−−−−−−−−−−−−−−−−−−−−−−−−−−−−−−−−−−−−−−−−−−−−−−−−−−−−−−−−−−−−−−−−−−−−−−−−−−−−−−−−−−−−−−−−−−−−−−−−−−−−−−−−−−−−−−−−−−−−−−−−−−−−−−−−−−−−−−−−−−−−−−−−−−−−−−−−−−−−−−−−−−−−−−−−−−−−−−−−−−−−−−−−−−−−−−−−−−−−−−−−−−−−−−−−−−−−−−−−−−−−−−−−−−−−−−−−−−−−−−−−−−−−−−−−−−−−−−−−−−−−−−−−−−−−−−−−−−−−−−−−−−−−−−−−−−−−−−−−−−−−−−−−−−−−−−−−−−−−−−−−−−−−−−−−−−−−
Number of shares
Class A shares EUR 8,695.048 1.000 -Class I shares EUR 599,029.395 120,000.000 -Class N shares EUR 4,259.000 1.000 -−−−−−−−−−−−−−−−−−−−−−−−−−−−−−−−−−−−−−−−−−−−−−−−−−−−−−−−−−−−−−−−−−−−−−−−−−−−−−−−−−−−−−−−−−−−−−−−−−−−−−−−−−−−−−−−−−−−−−−−−−−−−−−−−−−−−−−−−−−−−−−−−−−−−−−−−−−−−−−−−−−−−−−−−−−−−−−−−−−−−−−−−−−−−−−−−−−−−−−−−−−−−−−−−−−−−−−−−−−−−−−−−−−−−−−−−−−−−−−−−−−−−−−−−−−−−−−−−−−−−−−−−−−−−−−−−−−−−−−−−−−−−−−−−−−−−−−−−−−−−−−−−−−−−−−−−−−−−−−−−−−−−−−−−−−−−−−−−−−−−−−−−−−−−−−−−−−−−−−−−−−−−−−−−−−−−−−−−−−−−−−−−−−−−−−−−−−−−−−−−−−−−−−−−−−−−−−−−−−−−−−−−−−−−−−−−−−−−−−−−−−−−−−−−−−−−−−−−−−−−−−−−−−−−−−−−−−−−−−−−−−−−−−−−−
December 31, 2019June 30, 2021 December 31, 2020
19
The accompanying notes are an integral part of these financial statements.
DNCA INVEST
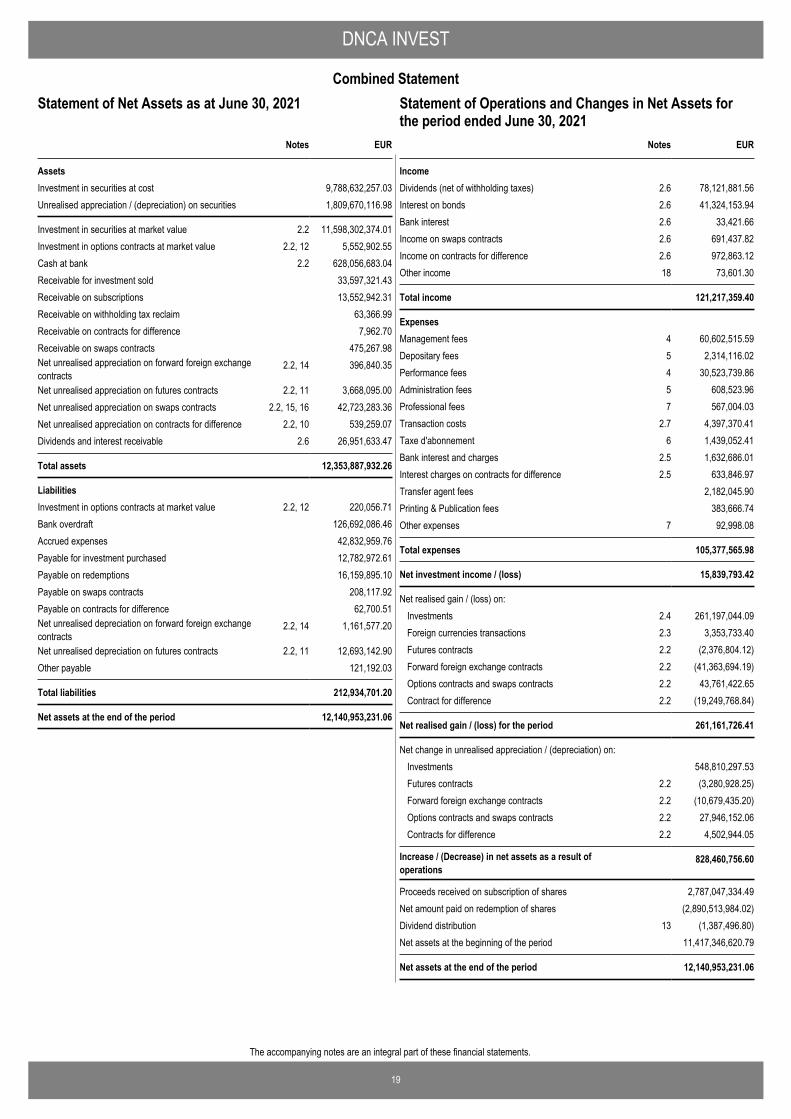
Combined Statement
EUR
AssetsInvestment in securities at cost 9,788,632,257.03Unrealised appreciation / (depreciation) on securities 1,809,670,116.98
Investment in securities at market value 2.2 11,598,302,374.01Investment in options contracts at market value 2.2, 12 5,552,902.55Cash at bank 2.2 628,056,683.04Receivable for investment sold 33,597,321.43Receivable on subscriptions 13,552,942.31Receivable on withholding tax reclaim 63,366.99Receivable on contracts for difference 7,962.70Receivable on swaps contracts 475,267.98Net unrealised appreciation on forward foreign exchangecontracts
2.2, 14 396,840.35
Net unrealised appreciation on futures contracts 2.2, 11 3,668,095.00Net unrealised appreciation on swaps contracts 2.2, 15, 16 42,723,283.36Net unrealised appreciation on contracts for difference 2.2, 10 539,259.07Dividends and interest receivable 2.6 26,951,633.47
Total assets 12,353,887,932.26
LiabilitiesInvestment in options contracts at market value 2.2, 12 220,056.71Bank overdraft 126,692,086.46Accrued expenses 42,832,959.76Payable for investment purchased 12,782,972.61Payable on redemptions 16,159,895.10Payable on swaps contracts 208,117.92Payable on contracts for difference 62,700.51Net unrealised depreciation on forward foreign exchangecontracts
2.2, 14 1,161,577.20
Net unrealised depreciation on futures contracts 2.2, 11 12,693,142.90Other payable 121,192.03
Total liabilities 212,934,701.20
Net assets at the end of the period 12,140,953,231.06
Notes
Statement of Net Assets as at June 30, 2021
IncomeDividends (net of withholding taxes) 2.6 78,121,881.56Interest on bonds 2.6 41,324,153.94Bank interest 2.6 33,421.66Income on swaps contracts 2.6 691,437.82Income on contracts for difference 2.6 972,863.12Other income 18 73,601.30
Total income 121,217,359.40
ExpensesManagement fees 4 60,602,515.59Depositary fees 5 2,314,116.02Performance fees 4 30,523,739.86Administration fees 5 608,523.96Professional fees 7 567,004.03Transaction costs 2.7 4,397,370.41Taxe d'abonnement 6 1,439,052.41Bank interest and charges 2.5 1,632,686.01Interest charges on contracts for difference 2.5 633,846.97Transfer agent fees 2,182,045.90Printing & Publication fees 383,666.74Other expenses 7 92,998.08
Total expenses 105,377,565.98
Net investment income / (loss) 15,839,793.42
Net realised gain / (loss) on: Investments 2.4 261,197,044.09Foreign currencies transactions 2.3 3,353,733.40Futures contracts 2.2 (2,376,804.12)Forward foreign exchange contracts 2.2 (41,363,694.19)Options contracts and swaps contracts 2.2 43,761,422.65Contract for difference 2.2 (19,249,768.84)
Net realised gain / (loss) for the period 261,161,726.41
Net change in unrealised appreciation / (depreciation) on: Investments 548,810,297.53Futures contracts 2.2 (3,280,928.25)Forward foreign exchange contracts 2.2 (10,679,435.20)Options contracts and swaps contracts 2.2 27,946,152.06Contracts for difference 2.2 4,502,944.05
Increase / (Decrease) in net assets as a result ofoperations
828,460,756.60
Proceeds received on subscription of shares 2,787,047,334.49Net amount paid on redemption of shares (2,890,513,984.02)Dividend distribution 13 (1,387,496.80)Net assets at the beginning of the period 11,417,346,620.79
Net assets at the end of the period 12,140,953,231.06
EURNotes
Statement of Operations and Changes in Net Assets forthe period ended June 30, 2021

20
The accompanying notes are an integral part of these financial statements.
DNCA INVEST
DNCA INVEST - BEYOND EUROPEAN BOND OPPORTUNITIES (in EUR)Statement of Operations and Changes in Net Assets for theperiod ended June 30, 2021
EUR
AssetsInvestment in securities at cost 36,951,115.15Unrealised appreciation / (depreciation) on securities 274,939.29
Investment in securities at market value 2.2 37,226,054.44Cash at bank 2.2 940,364.17Receivable on subscriptions 757,454.81Dividends and interest receivable 2.6 337,170.78
Total assets 39,261,044.20
LiabilitiesAccrued expenses 68,355.82Payable for investment purchased 300,000.00Payable on redemptions 3,591.85Net unrealised depreciation on forward foreign exchangecontracts
2.2, 14 1,018.53
Total liabilities 372,966.20
Net assets at the end of the period 38,888,078.00
Notes
Statement of Net Assets as at June 30, 2021
IncomeInterest on bonds 2.6 426,406.79
Total income 426,406.79
ExpensesManagement fees 4 186,904.63Depositary fees 5 8,234.42Performance fees 4 8,611.12Administration fees 5 17,517.84Professional fees 7 3,049.69Transaction costs 2.7 357.80Taxe d'abonnement 6 8,740.04Bank interest and charges 2.5 6,257.59Transfer agent fees 22,522.75Printing & Publication fees 747.60Other expenses 7 230.21
Total expenses 263,173.69
Net investment income / (loss) 163,233.10
Net realised gain / (loss) on: Investments 2.4 318,956.63Foreign currencies transactions 2.3 (1,259.79)Forward foreign exchange contracts 2.2 (368.48)
Net realised gain / (loss) for the period 480,561.46
Net change in unrealised appreciation / (depreciation) on: Investments (97,457.57)Forward foreign exchange contracts 2.2 (1,018.53)
Increase / (Decrease) in net assets as a result ofoperations
382,085.36
Proceeds received on subscription of shares 9,430,674.59Net amount paid on redemption of shares (9,927,672.56)Net assets at the beginning of the period 39,002,990.61
Net assets at the end of the period 38,888,078.00
EURNotes
Statement of Operations and Changes in Net Assets forthe period ended June 30, 2021
21
The accompanying notes are an integral part of these financial statements.
DNCA INVEST
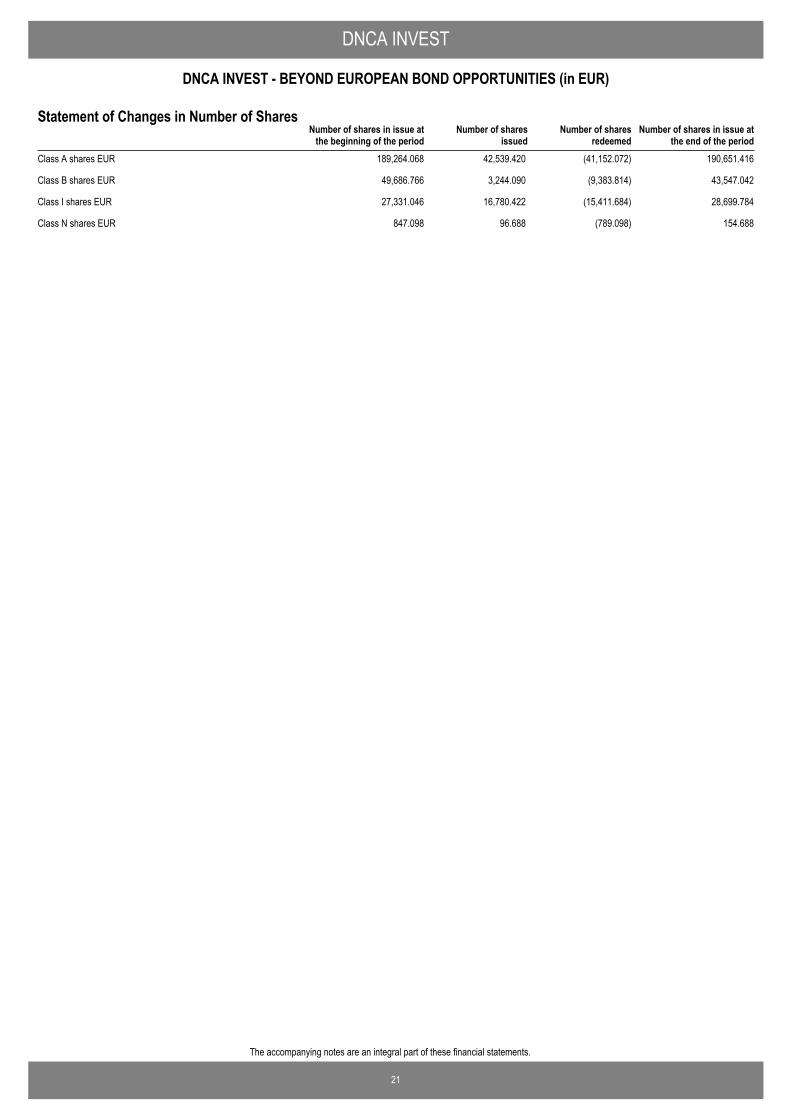
DNCA INVEST - BEYOND EUROPEAN BOND OPPORTUNITIES (in EUR)
Number of shares in issue atthe end of the period
Number of shares in issue atthe beginning of the period
Number of sharesissued
Number of sharesredeemed
Statement of Changes in Number of Shares
Class A shares EUR 189,264.068 42,539.420 (41,152.072) 190,651.416
Class B shares EUR 49,686.766 3,244.090 (9,383.814) 43,547.042
Class I shares EUR 27,331.046 16,780.422 (15,411.684) 28,699.784
Class N shares EUR 847.098 96.688 (789.098) 154.688
DNCA INVEST
22
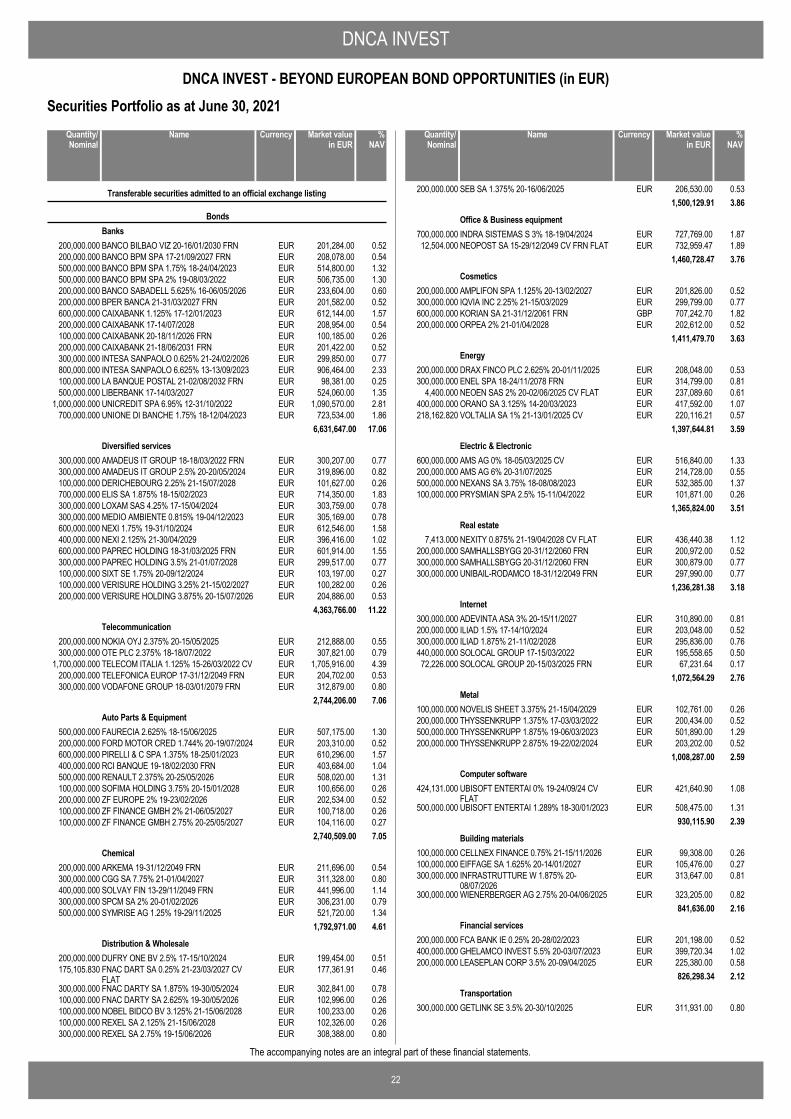
DNCA INVEST - BEYOND EUROPEAN BOND OPPORTUNITIES (in EUR)
The accompanying notes are an integral part of these financial statements.
Securities Portfolio as at June 30, 2021
BANCO BILBAO VIZ 20-16/01/2030 FRN EUR 201,284.00 0.52200,000.000
Transferable securities admitted to an official exchange listing
BondsBanks
BANCO BPM SPA 17-21/09/2027 FRN EUR 208,078.00 0.54200,000.000BANCO BPM SPA 1.75% 18-24/04/2023 EUR 514,800.00 1.32500,000.000BANCO BPM SPA 2% 19-08/03/2022 EUR 506,735.00 1.30500,000.000BANCO SABADELL 5.625% 16-06/05/2026 EUR 233,604.00 0.60200,000.000BPER BANCA 21-31/03/2027 FRN EUR 201,582.00 0.52200,000.000CAIXABANK 1.125% 17-12/01/2023 EUR 612,144.00 1.57600,000.000CAIXABANK 17-14/07/2028 EUR 208,954.00 0.54200,000.000CAIXABANK 20-18/11/2026 FRN EUR 100,185.00 0.26100,000.000CAIXABANK 21-18/06/2031 FRN EUR 201,422.00 0.52200,000.000INTESA SANPAOLO 0.625% 21-24/02/2026 EUR 299,850.00 0.77300,000.000INTESA SANPAOLO 6.625% 13-13/09/2023 EUR 906,464.00 2.33800,000.000LA BANQUE POSTAL 21-02/08/2032 FRN EUR 98,381.00 0.25100,000.000LIBERBANK 17-14/03/2027 EUR 524,060.00 1.35500,000.000UNICREDIT SPA 6.95% 12-31/10/2022 EUR 1,090,570.00 2.811,000,000.000UNIONE DI BANCHE 1.75% 18-12/04/2023 EUR 723,534.00 1.86700,000.000
6,631,647.00 17.06
AMADEUS IT GROUP 18-18/03/2022 FRN EUR 300,207.00 0.77300,000.000Diversified services
AMADEUS IT GROUP 2.5% 20-20/05/2024 EUR 319,896.00 0.82300,000.000DERICHEBOURG 2.25% 21-15/07/2028 EUR 101,627.00 0.26100,000.000ELIS SA 1.875% 18-15/02/2023 EUR 714,350.00 1.83700,000.000LOXAM SAS 4.25% 17-15/04/2024 EUR 303,759.00 0.78300,000.000MEDIO AMBIENTE 0.815% 19-04/12/2023 EUR 305,169.00 0.78300,000.000NEXI 1.75% 19-31/10/2024 EUR 612,546.00 1.58600,000.000NEXI 2.125% 21-30/04/2029 EUR 396,416.00 1.02400,000.000PAPREC HOLDING 18-31/03/2025 FRN EUR 601,914.00 1.55600,000.000PAPREC HOLDING 3.5% 21-01/07/2028 EUR 299,517.00 0.77300,000.000SIXT SE 1.75% 20-09/12/2024 EUR 103,197.00 0.27100,000.000VERISURE HOLDING 3.25% 21-15/02/2027 EUR 100,282.00 0.26100,000.000VERISURE HOLDING 3.875% 20-15/07/2026 EUR 204,886.00 0.53200,000.000
4,363,766.00 11.22
NOKIA OYJ 2.375% 20-15/05/2025 EUR 212,888.00 0.55200,000.000Telecommunication
OTE PLC 2.375% 18-18/07/2022 EUR 307,821.00 0.79300,000.000TELECOM ITALIA 1.125% 15-26/03/2022 CV EUR 1,705,916.00 4.391,700,000.000TELEFONICA EUROP 17-31/12/2049 FRN EUR 204,702.00 0.53200,000.000VODAFONE GROUP 18-03/01/2079 FRN EUR 312,879.00 0.80300,000.000
2,744,206.00 7.06
FAURECIA 2.625% 18-15/06/2025 EUR 507,175.00 1.30500,000.000Auto Parts & Equipment
FORD MOTOR CRED 1.744% 20-19/07/2024 EUR 203,310.00 0.52200,000.000PIRELLI & C SPA 1.375% 18-25/01/2023 EUR 610,296.00 1.57600,000.000RCI BANQUE 19-18/02/2030 FRN EUR 403,684.00 1.04400,000.000RENAULT 2.375% 20-25/05/2026 EUR 508,020.00 1.31500,000.000SOFIMA HOLDING 3.75% 20-15/01/2028 EUR 100,656.00 0.26100,000.000ZF EUROPE 2% 19-23/02/2026 EUR 202,534.00 0.52200,000.000ZF FINANCE GMBH 2% 21-06/05/2027 EUR 100,718.00 0.26100,000.000ZF FINANCE GMBH 2.75% 20-25/05/2027 EUR 104,116.00 0.27100,000.000
2,740,509.00 7.05
ARKEMA 19-31/12/2049 FRN EUR 211,696.00 0.54200,000.000Chemical
CGG SA 7.75% 21-01/04/2027 EUR 311,328.00 0.80300,000.000SOLVAY FIN 13-29/11/2049 FRN EUR 441,996.00 1.14400,000.000SPCM SA 2% 20-01/02/2026 EUR 306,231.00 0.79300,000.000SYMRISE AG 1.25% 19-29/11/2025 EUR 521,720.00 1.34500,000.000
1,792,971.00 4.61
DUFRY ONE BV 2.5% 17-15/10/2024 EUR 199,454.00 0.51200,000.000Distribution & Wholesale
FNAC DART SA 0.25% 21-23/03/2027 CVFLAT
EUR 177,361.91 0.46175,105.830
FNAC DARTY SA 1.875% 19-30/05/2024 EUR 302,841.00 0.78300,000.000FNAC DARTY SA 2.625% 19-30/05/2026 EUR 102,996.00 0.26100,000.000NOBEL BIDCO BV 3.125% 21-15/06/2028 EUR 100,233.00 0.26100,000.000REXEL SA 2.125% 21-15/06/2028 EUR 102,326.00 0.26100,000.000REXEL SA 2.75% 19-15/06/2026 EUR 308,388.00 0.80300,000.000
NameQuantity/Nominal
Market valuein EUR
Currency %NAV
SEB SA 1.375% 20-16/06/2025 EUR 206,530.00 0.53200,000.0001,500,129.91 3.86
INDRA SISTEMAS S 3% 18-19/04/2024 EUR 727,769.00 1.87700,000.000Office & Business equipment
NEOPOST SA 15-29/12/2049 CV FRN FLAT EUR 732,959.47 1.8912,504.0001,460,728.47 3.76
AMPLIFON SPA 1.125% 20-13/02/2027 EUR 201,826.00 0.52200,000.000Cosmetics
IQVIA INC 2.25% 21-15/03/2029 EUR 299,799.00 0.77300,000.000KORIAN SA 21-31/12/2061 FRN GBP 707,242.70 1.82600,000.000ORPEA 2% 21-01/04/2028 EUR 202,612.00 0.52200,000.000
1,411,479.70 3.63
DRAX FINCO PLC 2.625% 20-01/11/2025 EUR 208,048.00 0.53200,000.000Energy
ENEL SPA 18-24/11/2078 FRN EUR 314,799.00 0.81300,000.000NEOEN SAS 2% 20-02/06/2025 CV FLAT EUR 237,089.60 0.614,400.000ORANO SA 3.125% 14-20/03/2023 EUR 417,592.00 1.07400,000.000VOLTALIA SA 1% 21-13/01/2025 CV EUR 220,116.21 0.57218,162.820
1,397,644.81 3.59
AMS AG 0% 18-05/03/2025 CV EUR 516,840.00 1.33600,000.000Electric & Electronic
AMS AG 6% 20-31/07/2025 EUR 214,728.00 0.55200,000.000NEXANS SA 3.75% 18-08/08/2023 EUR 532,385.00 1.37500,000.000PRYSMIAN SPA 2.5% 15-11/04/2022 EUR 101,871.00 0.26100,000.000
1,365,824.00 3.51
NEXITY 0.875% 21-19/04/2028 CV FLAT EUR 436,440.38 1.127,413.000Real estate
SAMHALLSBYGG 20-31/12/2060 FRN EUR 200,972.00 0.52200,000.000SAMHALLSBYGG 20-31/12/2060 FRN EUR 300,879.00 0.77300,000.000UNIBAIL-RODAMCO 18-31/12/2049 FRN EUR 297,990.00 0.77300,000.000
1,236,281.38 3.18
ADEVINTA ASA 3% 20-15/11/2027 EUR 310,890.00 0.81300,000.000Internet
ILIAD 1.5% 17-14/10/2024 EUR 203,048.00 0.52200,000.000ILIAD 1.875% 21-11/02/2028 EUR 295,836.00 0.76300,000.000SOLOCAL GROUP 17-15/03/2022 EUR 195,558.65 0.50440,000.000SOLOCAL GROUP 20-15/03/2025 FRN EUR 67,231.64 0.1772,226.000
1,072,564.29 2.76
NOVELIS SHEET 3.375% 21-15/04/2029 EUR 102,761.00 0.26100,000.000Metal
THYSSENKRUPP 1.375% 17-03/03/2022 EUR 200,434.00 0.52200,000.000THYSSENKRUPP 1.875% 19-06/03/2023 EUR 501,890.00 1.29500,000.000THYSSENKRUPP 2.875% 19-22/02/2024 EUR 203,202.00 0.52200,000.000
1,008,287.00 2.59
UBISOFT ENTERTAI 0% 19-24/09/24 CVFLAT
EUR 421,640.90 1.08424,131.000Computer software
UBISOFT ENTERTAI 1.289% 18-30/01/2023 EUR 508,475.00 1.31500,000.000930,115.90 2.39
CELLNEX FINANCE 0.75% 21-15/11/2026 EUR 99,308.00 0.26100,000.000Building materials
EIFFAGE SA 1.625% 20-14/01/2027 EUR 105,476.00 0.27100,000.000INFRASTRUTTURE W 1.875% 20-08/07/2026
EUR 313,647.00 0.81300,000.000
WIENERBERGER AG 2.75% 20-04/06/2025 EUR 323,205.00 0.82300,000.000841,636.00 2.16
FCA BANK IE 0.25% 20-28/02/2023 EUR 201,198.00 0.52200,000.000Financial services
GHELAMCO INVEST 5.5% 20-03/07/2023 EUR 399,720.34 1.02400,000.000LEASEPLAN CORP 3.5% 20-09/04/2025 EUR 225,380.00 0.58200,000.000
826,298.34 2.12
GETLINK SE 3.5% 20-30/10/2025 EUR 311,931.00 0.80300,000.000Transportation
NameQuantity/Nominal
Market valuein EUR
Currency %NAV
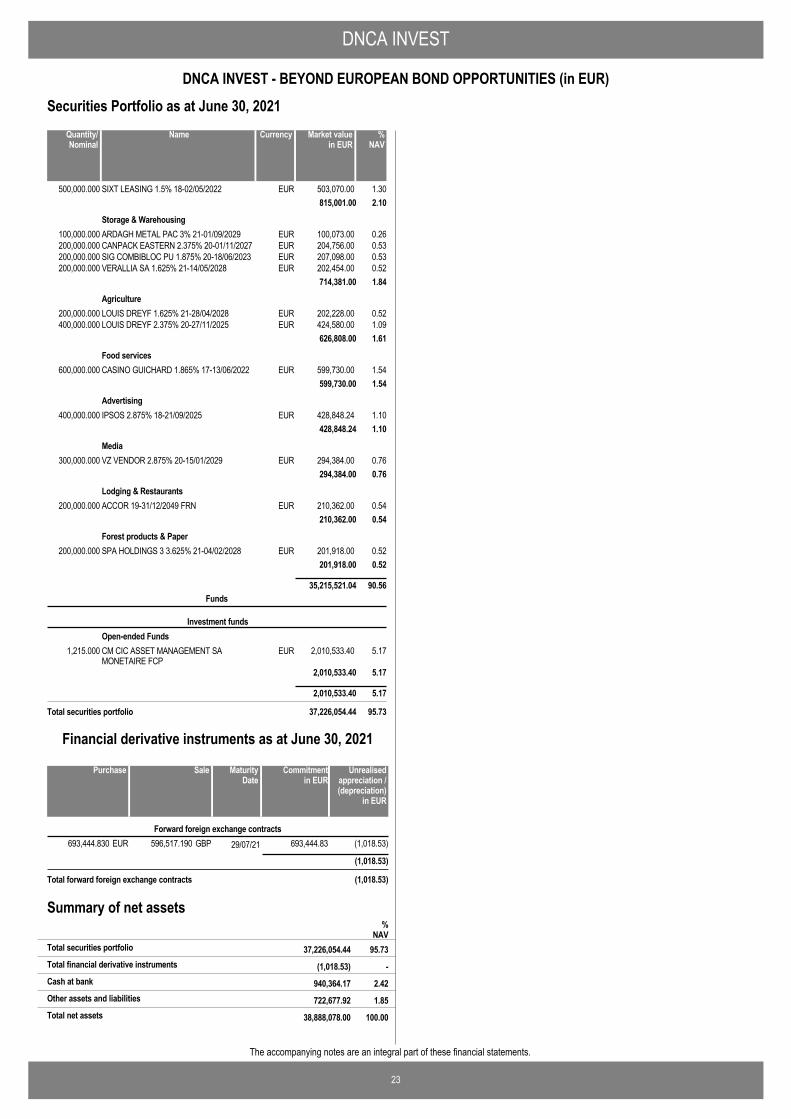
DNCA INVEST
23
DNCA INVEST - BEYOND EUROPEAN BOND OPPORTUNITIES (in EUR)
The accompanying notes are an integral part of these financial statements.
Securities Portfolio as at June 30, 2021
SIXT LEASING 1.5% 18-02/05/2022 EUR 503,070.00 1.30500,000.000815,001.00 2.10
ARDAGH METAL PAC 3% 21-01/09/2029 EUR 100,073.00 0.26100,000.000Storage & Warehousing
CANPACK EASTERN 2.375% 20-01/11/2027 EUR 204,756.00 0.53200,000.000SIG COMBIBLOC PU 1.875% 20-18/06/2023 EUR 207,098.00 0.53200,000.000VERALLIA SA 1.625% 21-14/05/2028 EUR 202,454.00 0.52200,000.000
714,381.00 1.84
LOUIS DREYF 1.625% 21-28/04/2028 EUR 202,228.00 0.52200,000.000Agriculture
LOUIS DREYF 2.375% 20-27/11/2025 EUR 424,580.00 1.09400,000.000626,808.00 1.61
CASINO GUICHARD 1.865% 17-13/06/2022 EUR 599,730.00 1.54600,000.000Food services
599,730.00 1.54
IPSOS 2.875% 18-21/09/2025 EUR 428,848.24 1.10400,000.000Advertising
428,848.24 1.10
VZ VENDOR 2.875% 20-15/01/2029 EUR 294,384.00 0.76300,000.000Media
294,384.00 0.76
ACCOR 19-31/12/2049 FRN EUR 210,362.00 0.54200,000.000Lodging & Restaurants
210,362.00 0.54
SPA HOLDINGS 3 3.625% 21-04/02/2028 EUR 201,918.00 0.52200,000.000Forest products & Paper
201,918.00 0.52
35,215,521.04 90.56
CM CIC ASSET MANAGEMENT SAMONETAIRE FCP
EUR 2,010,533.40 5.171,215.000
Funds
Investment fundsOpen-ended Funds
2,010,533.40 5.17
2,010,533.40 5.17
Total securities portfolio 37,226,054.44 95.73
NameQuantity/Nominal
Market valuein EUR
Currency %NAV
596,517.190 29/07/21693,444.830 (1,018.53)GBPEUR 693,444.83Forward foreign exchange contracts
(1,018.53)
Total forward foreign exchange contracts (1,018.53)
SalePurchase Unrealisedappreciation /(depreciation)
in EUR
MaturityDate
Commitmentin EUR
Financial derivative instruments as at June 30, 2021
Summary of net assets
(1,018.53) -Total financial derivative instruments
%NAV
37,226,054.44 95.73Total securities portfolio
940,364.17 2.42Cash at bank
722,677.92 1.85Other assets and liabilities
38,888,078.00 100.00Total net assets
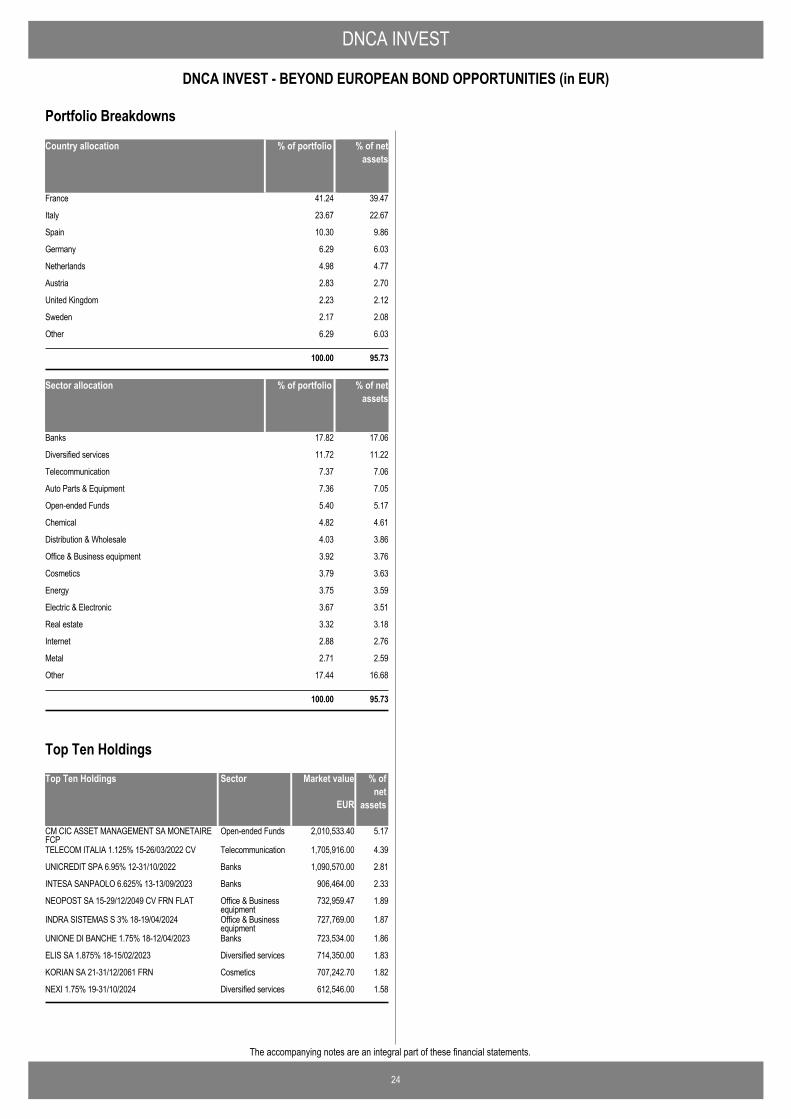
DNCA INVEST
24
DNCA INVEST - BEYOND EUROPEAN BOND OPPORTUNITIES (in EUR)
The accompanying notes are an integral part of these financial statements.
Country allocation % of portfolio % of netassets
France 41.24 39.47
Italy 23.67 22.67
Spain 10.30 9.86
Germany 6.29 6.03
Netherlands 4.98 4.77
Austria 2.83 2.70
United Kingdom 2.23 2.12
Sweden 2.17 2.08
Other 6.29 6.03
100.00 95.73
Sector allocation % of portfolio % of netassets
Banks 17.82 17.06
Diversified services 11.72 11.22
Telecommunication 7.37 7.06
Auto Parts & Equipment 7.36 7.05
Open-ended Funds 5.40 5.17
Chemical 4.82 4.61
Distribution & Wholesale 4.03 3.86
Office & Business equipment 3.92 3.76
Cosmetics 3.79 3.63
Energy 3.75 3.59
Electric & Electronic 3.67 3.51
Real estate 3.32 3.18
Internet 2.88 2.76
Metal 2.71 2.59
Other 17.44 16.68
100.00 95.73
Portfolio Breakdowns
Top Ten Holdings Market value % ofnet
assets
CM CIC ASSET MANAGEMENT SA MONETAIREFCP
2,010,533.40 5.17Open-ended Funds
TELECOM ITALIA 1.125% 15-26/03/2022 CV 1,705,916.00 4.39Telecommunication
UNICREDIT SPA 6.95% 12-31/10/2022 1,090,570.00 2.81Banks
INTESA SANPAOLO 6.625% 13-13/09/2023 906,464.00 2.33Banks
NEOPOST SA 15-29/12/2049 CV FRN FLAT 732,959.47 1.89Office & Businessequipment
INDRA SISTEMAS S 3% 18-19/04/2024 727,769.00 1.87Office & Businessequipment
UNIONE DI BANCHE 1.75% 18-12/04/2023 723,534.00 1.86Banks
ELIS SA 1.875% 18-15/02/2023 714,350.00 1.83Diversified services
KORIAN SA 21-31/12/2061 FRN 707,242.70 1.82Cosmetics
NEXI 1.75% 19-31/10/2024 612,546.00 1.58Diversified services
EUR
Sector
Top Ten Holdings
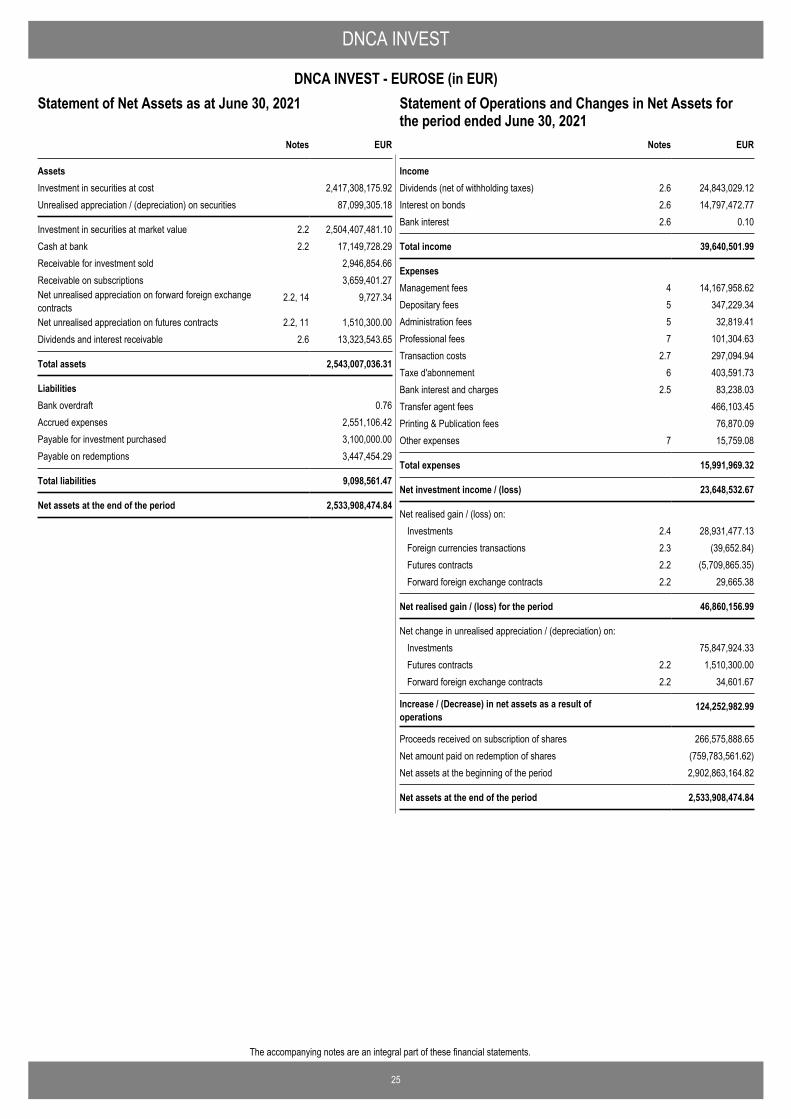
25
The accompanying notes are an integral part of these financial statements.
DNCA INVEST
DNCA INVEST - EUROSE (in EUR)Statement of Operations and Changes in Net Assets for theperiod ended June 30, 2021
EUR
AssetsInvestment in securities at cost 2,417,308,175.92Unrealised appreciation / (depreciation) on securities 87,099,305.18
Investment in securities at market value 2.2 2,504,407,481.10Cash at bank 2.2 17,149,728.29Receivable for investment sold 2,946,854.66Receivable on subscriptions 3,659,401.27Net unrealised appreciation on forward foreign exchangecontracts
2.2, 14 9,727.34
Net unrealised appreciation on futures contracts 2.2, 11 1,510,300.00Dividends and interest receivable 2.6 13,323,543.65
Total assets 2,543,007,036.31
LiabilitiesBank overdraft 0.76Accrued expenses 2,551,106.42Payable for investment purchased 3,100,000.00Payable on redemptions 3,447,454.29
Total liabilities 9,098,561.47
Net assets at the end of the period 2,533,908,474.84
Notes
Statement of Net Assets as at June 30, 2021
IncomeDividends (net of withholding taxes) 2.6 24,843,029.12Interest on bonds 2.6 14,797,472.77Bank interest 2.6 0.10
Total income 39,640,501.99
ExpensesManagement fees 4 14,167,958.62Depositary fees 5 347,229.34Administration fees 5 32,819.41Professional fees 7 101,304.63Transaction costs 2.7 297,094.94Taxe d'abonnement 6 403,591.73Bank interest and charges 2.5 83,238.03Transfer agent fees 466,103.45Printing & Publication fees 76,870.09Other expenses 7 15,759.08
Total expenses 15,991,969.32
Net investment income / (loss) 23,648,532.67
Net realised gain / (loss) on: Investments 2.4 28,931,477.13Foreign currencies transactions 2.3 (39,652.84)Futures contracts 2.2 (5,709,865.35)Forward foreign exchange contracts 2.2 29,665.38
Net realised gain / (loss) for the period 46,860,156.99
Net change in unrealised appreciation / (depreciation) on: Investments 75,847,924.33Futures contracts 2.2 1,510,300.00Forward foreign exchange contracts 2.2 34,601.67
Increase / (Decrease) in net assets as a result ofoperations
124,252,982.99
Proceeds received on subscription of shares 266,575,888.65Net amount paid on redemption of shares (759,783,561.62)Net assets at the beginning of the period 2,902,863,164.82
Net assets at the end of the period 2,533,908,474.84
EURNotes
Statement of Operations and Changes in Net Assets forthe period ended June 30, 2021
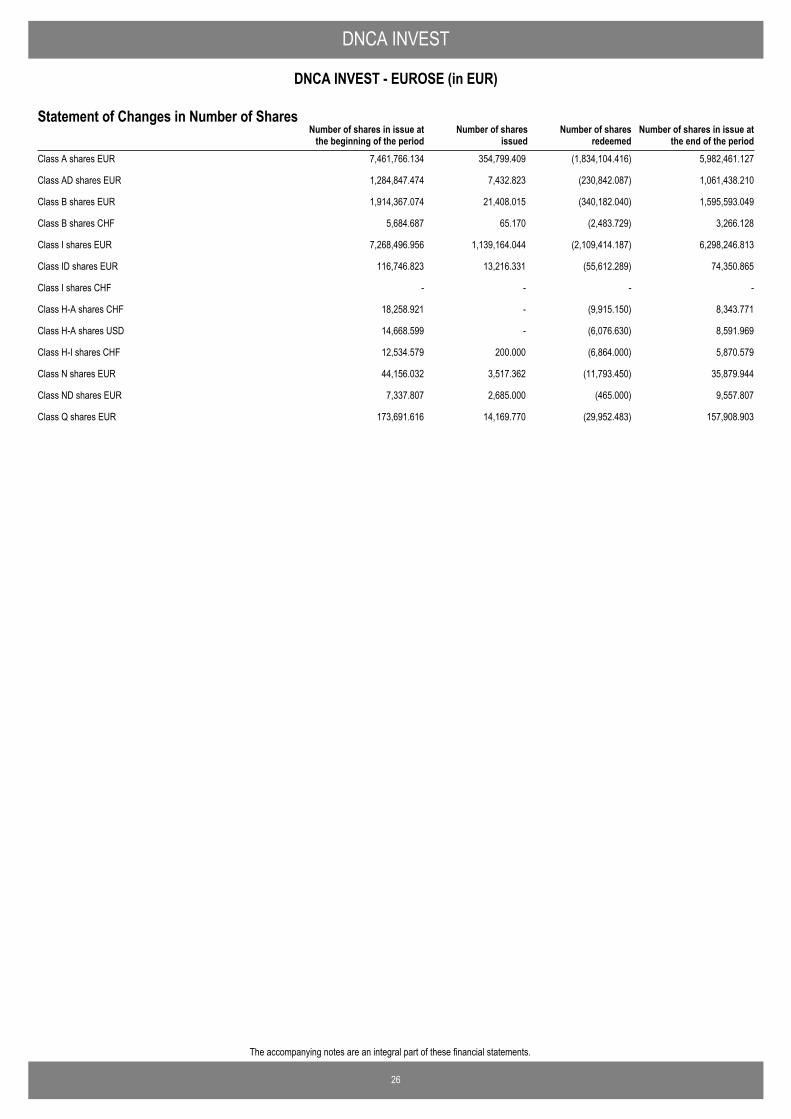
26
The accompanying notes are an integral part of these financial statements.
DNCA INVEST
DNCA INVEST - EUROSE (in EUR)
Number of shares in issue atthe end of the period
Number of shares in issue atthe beginning of the period
Number of sharesissued
Number of sharesredeemed
Statement of Changes in Number of Shares
Class A shares EUR 7,461,766.134 354,799.409 (1,834,104.416) 5,982,461.127
Class AD shares EUR 1,284,847.474 7,432.823 (230,842.087) 1,061,438.210
Class B shares EUR 1,914,367.074 21,408.015 (340,182.040) 1,595,593.049
Class B shares CHF 5,684.687 65.170 (2,483.729) 3,266.128
Class I shares EUR 7,268,496.956 1,139,164.044 (2,109,414.187) 6,298,246.813
Class ID shares EUR 116,746.823 13,216.331 (55,612.289) 74,350.865
Class I shares CHF - - - -
Class H-A shares CHF 18,258.921 - (9,915.150) 8,343.771
Class H-A shares USD 14,668.599 - (6,076.630) 8,591.969
Class H-I shares CHF 12,534.579 200.000 (6,864.000) 5,870.579
Class N shares EUR 44,156.032 3,517.362 (11,793.450) 35,879.944
Class ND shares EUR 7,337.807 2,685.000 (465.000) 9,557.807
Class Q shares EUR 173,691.616 14,169.770 (29,952.483) 157,908.903
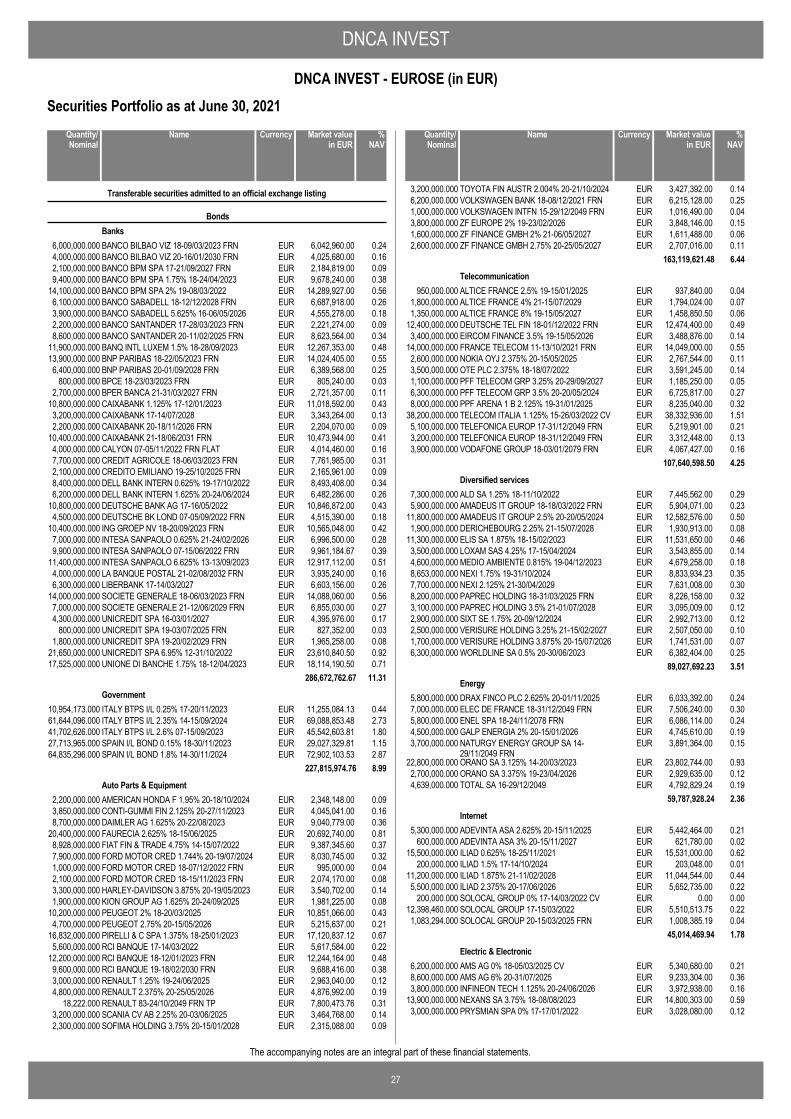
DNCA INVEST
27
DNCA INVEST - EUROSE (in EUR)
The accompanying notes are an integral part of these financial statements.
Securities Portfolio as at June 30, 2021
BANCO BILBAO VIZ 18-09/03/2023 FRN EUR 6,042,960.00 0.246,000,000.000
Transferable securities admitted to an official exchange listing
BondsBanks
BANCO BILBAO VIZ 20-16/01/2030 FRN EUR 4,025,680.00 0.164,000,000.000BANCO BPM SPA 17-21/09/2027 FRN EUR 2,184,819.00 0.092,100,000.000BANCO BPM SPA 1.75% 18-24/04/2023 EUR 9,678,240.00 0.389,400,000.000BANCO BPM SPA 2% 19-08/03/2022 EUR 14,289,927.00 0.5614,100,000.000BANCO SABADELL 18-12/12/2028 FRN EUR 6,687,918.00 0.266,100,000.000BANCO SABADELL 5.625% 16-06/05/2026 EUR 4,555,278.00 0.183,900,000.000BANCO SANTANDER 17-28/03/2023 FRN EUR 2,221,274.00 0.092,200,000.000BANCO SANTANDER 20-11/02/2025 FRN EUR 8,623,564.00 0.348,600,000.000BANQ INTL LUXEM 1.5% 18-28/09/2023 EUR 12,267,353.00 0.4811,900,000.000BNP PARIBAS 18-22/05/2023 FRN EUR 14,024,405.00 0.5513,900,000.000BNP PARIBAS 20-01/09/2028 FRN EUR 6,389,568.00 0.256,400,000.000BPCE 18-23/03/2023 FRN EUR 805,240.00 0.03800,000.000BPER BANCA 21-31/03/2027 FRN EUR 2,721,357.00 0.112,700,000.000CAIXABANK 1.125% 17-12/01/2023 EUR 11,018,592.00 0.4310,800,000.000CAIXABANK 17-14/07/2028 EUR 3,343,264.00 0.133,200,000.000CAIXABANK 20-18/11/2026 FRN EUR 2,204,070.00 0.092,200,000.000CAIXABANK 21-18/06/2031 FRN EUR 10,473,944.00 0.4110,400,000.000CALYON 07-05/11/2022 FRN FLAT EUR 4,014,460.00 0.164,000,000.000CREDIT AGRICOLE 18-06/03/2023 FRN EUR 7,761,985.00 0.317,700,000.000CREDITO EMILIANO 19-25/10/2025 FRN EUR 2,165,961.00 0.092,100,000.000DELL BANK INTERN 0.625% 19-17/10/2022 EUR 8,493,408.00 0.348,400,000.000DELL BANK INTERN 1.625% 20-24/06/2024 EUR 6,482,286.00 0.266,200,000.000DEUTSCHE BANK AG 17-16/05/2022 EUR 10,846,872.00 0.4310,800,000.000DEUTSCHE BK LOND 07-05/09/2022 FRN EUR 4,515,390.00 0.184,500,000.000ING GROEP NV 18-20/09/2023 FRN EUR 10,565,048.00 0.4210,400,000.000INTESA SANPAOLO 0.625% 21-24/02/2026 EUR 6,996,500.00 0.287,000,000.000INTESA SANPAOLO 07-15/06/2022 FRN EUR 9,961,184.67 0.399,900,000.000INTESA SANPAOLO 6.625% 13-13/09/2023 EUR 12,917,112.00 0.5111,400,000.000LA BANQUE POSTAL 21-02/08/2032 FRN EUR 3,935,240.00 0.164,000,000.000LIBERBANK 17-14/03/2027 EUR 6,603,156.00 0.266,300,000.000SOCIETE GENERALE 18-06/03/2023 FRN EUR 14,088,060.00 0.5614,000,000.000SOCIETE GENERALE 21-12/06/2029 FRN EUR 6,855,030.00 0.277,000,000.000UNICREDIT SPA 16-03/01/2027 EUR 4,395,976.00 0.174,300,000.000UNICREDIT SPA 19-03/07/2025 FRN EUR 827,352.00 0.03800,000.000UNICREDIT SPA 19-20/02/2029 FRN EUR 1,965,258.00 0.081,800,000.000UNICREDIT SPA 6.95% 12-31/10/2022 EUR 23,610,840.50 0.9221,650,000.000UNIONE DI BANCHE 1.75% 18-12/04/2023 EUR 18,114,190.50 0.7117,525,000.000
286,672,762.67 11.31
ITALY BTPS I/L 0.25% 17-20/11/2023 EUR 11,255,084.13 0.4410,954,173.000Government
ITALY BTPS I/L 2.35% 14-15/09/2024 EUR 69,088,853.48 2.7361,644,096.000ITALY BTPS I/L 2.6% 07-15/09/2023 EUR 45,542,603.81 1.8041,702,626.000SPAIN I/L BOND 0.15% 18-30/11/2023 EUR 29,027,329.81 1.1527,713,965.000SPAIN I/L BOND 1.8% 14-30/11/2024 EUR 72,902,103.53 2.8764,835,296.000
227,815,974.76 8.99
AMERICAN HONDA F 1.95% 20-18/10/2024 EUR 2,348,148.00 0.092,200,000.000Auto Parts & Equipment
CONTI-GUMMI FIN 2.125% 20-27/11/2023 EUR 4,045,041.00 0.163,850,000.000DAIMLER AG 1.625% 20-22/08/2023 EUR 9,040,779.00 0.368,700,000.000FAURECIA 2.625% 18-15/06/2025 EUR 20,692,740.00 0.8120,400,000.000FIAT FIN & TRADE 4.75% 14-15/07/2022 EUR 9,387,345.60 0.378,928,000.000FORD MOTOR CRED 1.744% 20-19/07/2024 EUR 8,030,745.00 0.327,900,000.000FORD MOTOR CRED 18-07/12/2022 FRN EUR 995,000.00 0.041,000,000.000FORD MOTOR CRED 18-15/11/2023 FRN EUR 2,074,170.00 0.082,100,000.000HARLEY-DAVIDSON 3.875% 20-19/05/2023 EUR 3,540,702.00 0.143,300,000.000KION GROUP AG 1.625% 20-24/09/2025 EUR 1,981,225.00 0.081,900,000.000PEUGEOT 2% 18-20/03/2025 EUR 10,851,066.00 0.4310,200,000.000PEUGEOT 2.75% 20-15/05/2026 EUR 5,215,637.00 0.214,700,000.000PIRELLI & C SPA 1.375% 18-25/01/2023 EUR 17,120,837.12 0.6716,832,000.000RCI BANQUE 17-14/03/2022 EUR 5,617,584.00 0.225,600,000.000RCI BANQUE 18-12/01/2023 FRN EUR 12,244,164.00 0.4812,200,000.000RCI BANQUE 19-18/02/2030 FRN EUR 9,688,416.00 0.389,600,000.000RENAULT 1.25% 19-24/06/2025 EUR 2,963,040.00 0.123,000,000.000RENAULT 2.375% 20-25/05/2026 EUR 4,876,992.00 0.194,800,000.000RENAULT 83-24/10/2049 FRN TP EUR 7,800,473.76 0.3118,222.000SCANIA CV AB 2.25% 20-03/06/2025 EUR 3,464,768.00 0.143,200,000.000SOFIMA HOLDING 3.75% 20-15/01/2028 EUR 2,315,088.00 0.092,300,000.000
NameQuantity/Nominal
Market valuein EUR
Currency %NAV
TOYOTA FIN AUSTR 2.004% 20-21/10/2024 EUR 3,427,392.00 0.143,200,000.000VOLKSWAGEN BANK 18-08/12/2021 FRN EUR 6,215,128.00 0.256,200,000.000VOLKSWAGEN INTFN 15-29/12/2049 FRN EUR 1,016,490.00 0.041,000,000.000ZF EUROPE 2% 19-23/02/2026 EUR 3,848,146.00 0.153,800,000.000ZF FINANCE GMBH 2% 21-06/05/2027 EUR 1,611,488.00 0.061,600,000.000ZF FINANCE GMBH 2.75% 20-25/05/2027 EUR 2,707,016.00 0.112,600,000.000
163,119,621.48 6.44
ALTICE FRANCE 2.5% 19-15/01/2025 EUR 937,840.00 0.04950,000.000Telecommunication
ALTICE FRANCE 4% 21-15/07/2029 EUR 1,794,024.00 0.071,800,000.000ALTICE FRANCE 8% 19-15/05/2027 EUR 1,458,850.50 0.061,350,000.000DEUTSCHE TEL FIN 18-01/12/2022 FRN EUR 12,474,400.00 0.4912,400,000.000EIRCOM FINANCE 3.5% 19-15/05/2026 EUR 3,488,876.00 0.143,400,000.000FRANCE TELECOM 11-13/10/2021 FRN EUR 14,049,000.00 0.5514,000,000.000NOKIA OYJ 2.375% 20-15/05/2025 EUR 2,767,544.00 0.112,600,000.000OTE PLC 2.375% 18-18/07/2022 EUR 3,591,245.00 0.143,500,000.000PFF TELECOM GRP 3.25% 20-29/09/2027 EUR 1,185,250.00 0.051,100,000.000PFF TELECOM GRP 3.5% 20-20/05/2024 EUR 6,725,817.00 0.276,300,000.000PPF ARENA 1 B 2.125% 19-31/01/2025 EUR 8,235,040.00 0.328,000,000.000TELECOM ITALIA 1.125% 15-26/03/2022 CV EUR 38,332,936.00 1.5138,200,000.000TELEFONICA EUROP 17-31/12/2049 FRN EUR 5,219,901.00 0.215,100,000.000TELEFONICA EUROP 18-31/12/2049 FRN EUR 3,312,448.00 0.133,200,000.000VODAFONE GROUP 18-03/01/2079 FRN EUR 4,067,427.00 0.163,900,000.000
107,640,598.50 4.25
ALD SA 1.25% 18-11/10/2022 EUR 7,445,562.00 0.297,300,000.000Diversified services
AMADEUS IT GROUP 18-18/03/2022 FRN EUR 5,904,071.00 0.235,900,000.000AMADEUS IT GROUP 2.5% 20-20/05/2024 EUR 12,582,576.00 0.5011,800,000.000DERICHEBOURG 2.25% 21-15/07/2028 EUR 1,930,913.00 0.081,900,000.000ELIS SA 1.875% 18-15/02/2023 EUR 11,531,650.00 0.4611,300,000.000LOXAM SAS 4.25% 17-15/04/2024 EUR 3,543,855.00 0.143,500,000.000MEDIO AMBIENTE 0.815% 19-04/12/2023 EUR 4,679,258.00 0.184,600,000.000NEXI 1.75% 19-31/10/2024 EUR 8,833,934.23 0.358,653,000.000NEXI 2.125% 21-30/04/2029 EUR 7,631,008.00 0.307,700,000.000PAPREC HOLDING 18-31/03/2025 FRN EUR 8,226,158.00 0.328,200,000.000PAPREC HOLDING 3.5% 21-01/07/2028 EUR 3,095,009.00 0.123,100,000.000SIXT SE 1.75% 20-09/12/2024 EUR 2,992,713.00 0.122,900,000.000VERISURE HOLDING 3.25% 21-15/02/2027 EUR 2,507,050.00 0.102,500,000.000VERISURE HOLDING 3.875% 20-15/07/2026 EUR 1,741,531.00 0.071,700,000.000WORLDLINE SA 0.5% 20-30/06/2023 EUR 6,382,404.00 0.256,300,000.000
89,027,692.23 3.51
DRAX FINCO PLC 2.625% 20-01/11/2025 EUR 6,033,392.00 0.245,800,000.000Energy
ELEC DE FRANCE 18-31/12/2049 FRN EUR 7,506,240.00 0.307,000,000.000ENEL SPA 18-24/11/2078 FRN EUR 6,086,114.00 0.245,800,000.000GALP ENERGIA 2% 20-15/01/2026 EUR 4,745,610.00 0.194,500,000.000NATURGY ENERGY GROUP SA 14-29/11/2049 FRN
EUR 3,891,364.00 0.153,700,000.000
ORANO SA 3.125% 14-20/03/2023 EUR 23,802,744.00 0.9322,800,000.000ORANO SA 3.375% 19-23/04/2026 EUR 2,929,635.00 0.122,700,000.000TOTAL SA 16-29/12/2049 EUR 4,792,829.24 0.194,639,000.000
59,787,928.24 2.36
ADEVINTA ASA 2.625% 20-15/11/2025 EUR 5,442,464.00 0.215,300,000.000Internet
ADEVINTA ASA 3% 20-15/11/2027 EUR 621,780.00 0.02600,000.000ILIAD 0.625% 18-25/11/2021 EUR 15,531,000.00 0.6215,500,000.000ILIAD 1.5% 17-14/10/2024 EUR 203,048.00 0.01200,000.000ILIAD 1.875% 21-11/02/2028 EUR 11,044,544.00 0.4411,200,000.000ILIAD 2.375% 20-17/06/2026 EUR 5,652,735.00 0.225,500,000.000SOLOCAL GROUP 0% 17-14/03/2022 CV EUR 0.00 0.00200,000.000SOLOCAL GROUP 17-15/03/2022 EUR 5,510,513.75 0.2212,398,460.000SOLOCAL GROUP 20-15/03/2025 FRN EUR 1,008,385.19 0.041,083,294.000
45,014,469.94 1.78
AMS AG 0% 18-05/03/2025 CV EUR 5,340,680.00 0.216,200,000.000Electric & Electronic
AMS AG 6% 20-31/07/2025 EUR 9,233,304.00 0.368,600,000.000INFINEON TECH 1.125% 20-24/06/2026 EUR 3,972,938.00 0.163,800,000.000NEXANS SA 3.75% 18-08/08/2023 EUR 14,800,303.00 0.5913,900,000.000PRYSMIAN SPA 0% 17-17/01/2022 EUR 3,028,080.00 0.123,000,000.000
NameQuantity/Nominal
Market valuein EUR
Currency %NAV
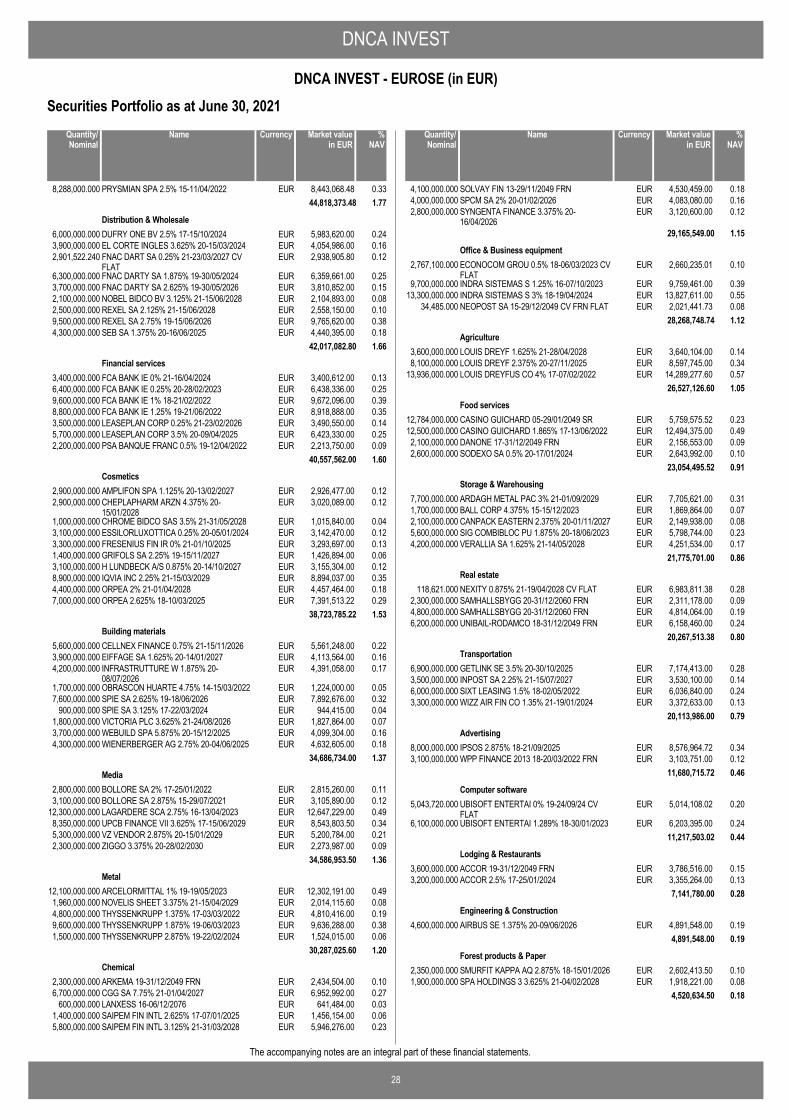
DNCA INVEST
28
DNCA INVEST - EUROSE (in EUR)
The accompanying notes are an integral part of these financial statements.
Securities Portfolio as at June 30, 2021
PRYSMIAN SPA 2.5% 15-11/04/2022 EUR 8,443,068.48 0.338,288,000.00044,818,373.48 1.77
DUFRY ONE BV 2.5% 17-15/10/2024 EUR 5,983,620.00 0.246,000,000.000Distribution & Wholesale
EL CORTE INGLES 3.625% 20-15/03/2024 EUR 4,054,986.00 0.163,900,000.000FNAC DART SA 0.25% 21-23/03/2027 CVFLAT
EUR 2,938,905.80 0.122,901,522.240
FNAC DARTY SA 1.875% 19-30/05/2024 EUR 6,359,661.00 0.256,300,000.000FNAC DARTY SA 2.625% 19-30/05/2026 EUR 3,810,852.00 0.153,700,000.000NOBEL BIDCO BV 3.125% 21-15/06/2028 EUR 2,104,893.00 0.082,100,000.000REXEL SA 2.125% 21-15/06/2028 EUR 2,558,150.00 0.102,500,000.000REXEL SA 2.75% 19-15/06/2026 EUR 9,765,620.00 0.389,500,000.000SEB SA 1.375% 20-16/06/2025 EUR 4,440,395.00 0.184,300,000.000
42,017,082.80 1.66
FCA BANK IE 0% 21-16/04/2024 EUR 3,400,612.00 0.133,400,000.000Financial services
FCA BANK IE 0.25% 20-28/02/2023 EUR 6,438,336.00 0.256,400,000.000FCA BANK IE 1% 18-21/02/2022 EUR 9,672,096.00 0.399,600,000.000FCA BANK IE 1.25% 19-21/06/2022 EUR 8,918,888.00 0.358,800,000.000LEASEPLAN CORP 0.25% 21-23/02/2026 EUR 3,490,550.00 0.143,500,000.000LEASEPLAN CORP 3.5% 20-09/04/2025 EUR 6,423,330.00 0.255,700,000.000PSA BANQUE FRANC 0.5% 19-12/04/2022 EUR 2,213,750.00 0.092,200,000.000
40,557,562.00 1.60
AMPLIFON SPA 1.125% 20-13/02/2027 EUR 2,926,477.00 0.122,900,000.000Cosmetics
CHEPLAPHARM ARZN 4.375% 20-15/01/2028
EUR 3,020,089.00 0.122,900,000.000
CHROME BIDCO SAS 3.5% 21-31/05/2028 EUR 1,015,840.00 0.041,000,000.000ESSILORLUXOTTICA 0.25% 20-05/01/2024 EUR 3,142,470.00 0.123,100,000.000FRESENIUS FIN IR 0% 21-01/10/2025 EUR 3,293,697.00 0.133,300,000.000GRIFOLS SA 2.25% 19-15/11/2027 EUR 1,426,894.00 0.061,400,000.000H LUNDBECK A/S 0.875% 20-14/10/2027 EUR 3,155,304.00 0.123,100,000.000IQVIA INC 2.25% 21-15/03/2029 EUR 8,894,037.00 0.358,900,000.000ORPEA 2% 21-01/04/2028 EUR 4,457,464.00 0.184,400,000.000ORPEA 2.625% 18-10/03/2025 EUR 7,391,513.22 0.297,000,000.000
38,723,785.22 1.53
CELLNEX FINANCE 0.75% 21-15/11/2026 EUR 5,561,248.00 0.225,600,000.000Building materials
EIFFAGE SA 1.625% 20-14/01/2027 EUR 4,113,564.00 0.163,900,000.000INFRASTRUTTURE W 1.875% 20-08/07/2026
EUR 4,391,058.00 0.174,200,000.000
OBRASCON HUARTE 4.75% 14-15/03/2022 EUR 1,224,000.00 0.051,700,000.000SPIE SA 2.625% 19-18/06/2026 EUR 7,892,676.00 0.327,600,000.000SPIE SA 3.125% 17-22/03/2024 EUR 944,415.00 0.04900,000.000VICTORIA PLC 3.625% 21-24/08/2026 EUR 1,827,864.00 0.071,800,000.000WEBUILD SPA 5.875% 20-15/12/2025 EUR 4,099,304.00 0.163,700,000.000WIENERBERGER AG 2.75% 20-04/06/2025 EUR 4,632,605.00 0.184,300,000.000
34,686,734.00 1.37
BOLLORE SA 2% 17-25/01/2022 EUR 2,815,260.00 0.112,800,000.000Media
BOLLORE SA 2.875% 15-29/07/2021 EUR 3,105,890.00 0.123,100,000.000LAGARDERE SCA 2.75% 16-13/04/2023 EUR 12,647,229.00 0.4912,300,000.000UPCB FINANCE VII 3.625% 17-15/06/2029 EUR 8,543,803.50 0.348,350,000.000VZ VENDOR 2.875% 20-15/01/2029 EUR 5,200,784.00 0.215,300,000.000ZIGGO 3.375% 20-28/02/2030 EUR 2,273,987.00 0.092,300,000.000
34,586,953.50 1.36
ARCELORMITTAL 1% 19-19/05/2023 EUR 12,302,191.00 0.4912,100,000.000Metal
NOVELIS SHEET 3.375% 21-15/04/2029 EUR 2,014,115.60 0.081,960,000.000THYSSENKRUPP 1.375% 17-03/03/2022 EUR 4,810,416.00 0.194,800,000.000THYSSENKRUPP 1.875% 19-06/03/2023 EUR 9,636,288.00 0.389,600,000.000THYSSENKRUPP 2.875% 19-22/02/2024 EUR 1,524,015.00 0.061,500,000.000
30,287,025.60 1.20
ARKEMA 19-31/12/2049 FRN EUR 2,434,504.00 0.102,300,000.000Chemical
CGG SA 7.75% 21-01/04/2027 EUR 6,952,992.00 0.276,700,000.000LANXESS 16-06/12/2076 EUR 641,484.00 0.03600,000.000SAIPEM FIN INTL 2.625% 17-07/01/2025 EUR 1,456,154.00 0.061,400,000.000SAIPEM FIN INTL 3.125% 21-31/03/2028 EUR 5,946,276.00 0.235,800,000.000
NameQuantity/Nominal
Market valuein EUR
Currency %NAV
SOLVAY FIN 13-29/11/2049 FRN EUR 4,530,459.00 0.184,100,000.000SPCM SA 2% 20-01/02/2026 EUR 4,083,080.00 0.164,000,000.000SYNGENTA FINANCE 3.375% 20-16/04/2026
EUR 3,120,600.00 0.122,800,000.000
29,165,549.00 1.15
ECONOCOM GROU 0.5% 18-06/03/2023 CVFLAT
EUR 2,660,235.01 0.102,767,100.000Office & Business equipment
INDRA SISTEMAS S 1.25% 16-07/10/2023 EUR 9,759,461.00 0.399,700,000.000INDRA SISTEMAS S 3% 18-19/04/2024 EUR 13,827,611.00 0.5513,300,000.000NEOPOST SA 15-29/12/2049 CV FRN FLAT EUR 2,021,441.73 0.0834,485.000
28,268,748.74 1.12
LOUIS DREYF 1.625% 21-28/04/2028 EUR 3,640,104.00 0.143,600,000.000Agriculture
LOUIS DREYF 2.375% 20-27/11/2025 EUR 8,597,745.00 0.348,100,000.000LOUIS DREYFUS CO 4% 17-07/02/2022 EUR 14,289,277.60 0.5713,936,000.000
26,527,126.60 1.05
CASINO GUICHARD 05-29/01/2049 SR EUR 5,759,575.52 0.2312,784,000.000Food services
CASINO GUICHARD 1.865% 17-13/06/2022 EUR 12,494,375.00 0.4912,500,000.000DANONE 17-31/12/2049 FRN EUR 2,156,553.00 0.092,100,000.000SODEXO SA 0.5% 20-17/01/2024 EUR 2,643,992.00 0.102,600,000.000
23,054,495.52 0.91
ARDAGH METAL PAC 3% 21-01/09/2029 EUR 7,705,621.00 0.317,700,000.000Storage & Warehousing
BALL CORP 4.375% 15-15/12/2023 EUR 1,869,864.00 0.071,700,000.000CANPACK EASTERN 2.375% 20-01/11/2027 EUR 2,149,938.00 0.082,100,000.000SIG COMBIBLOC PU 1.875% 20-18/06/2023 EUR 5,798,744.00 0.235,600,000.000VERALLIA SA 1.625% 21-14/05/2028 EUR 4,251,534.00 0.174,200,000.000
21,775,701.00 0.86
NEXITY 0.875% 21-19/04/2028 CV FLAT EUR 6,983,811.38 0.28118,621.000Real estate
SAMHALLSBYGG 20-31/12/2060 FRN EUR 2,311,178.00 0.092,300,000.000SAMHALLSBYGG 20-31/12/2060 FRN EUR 4,814,064.00 0.194,800,000.000UNIBAIL-RODAMCO 18-31/12/2049 FRN EUR 6,158,460.00 0.246,200,000.000
20,267,513.38 0.80
GETLINK SE 3.5% 20-30/10/2025 EUR 7,174,413.00 0.286,900,000.000Transportation
INPOST SA 2.25% 21-15/07/2027 EUR 3,530,100.00 0.143,500,000.000SIXT LEASING 1.5% 18-02/05/2022 EUR 6,036,840.00 0.246,000,000.000WIZZ AIR FIN CO 1.35% 21-19/01/2024 EUR 3,372,633.00 0.133,300,000.000
20,113,986.00 0.79
IPSOS 2.875% 18-21/09/2025 EUR 8,576,964.72 0.348,000,000.000Advertising
WPP FINANCE 2013 18-20/03/2022 FRN EUR 3,103,751.00 0.123,100,000.00011,680,715.72 0.46
UBISOFT ENTERTAI 0% 19-24/09/24 CVFLAT
EUR 5,014,108.02 0.205,043,720.000Computer software
UBISOFT ENTERTAI 1.289% 18-30/01/2023 EUR 6,203,395.00 0.246,100,000.00011,217,503.02 0.44
ACCOR 19-31/12/2049 FRN EUR 3,786,516.00 0.153,600,000.000Lodging & Restaurants
ACCOR 2.5% 17-25/01/2024 EUR 3,355,264.00 0.133,200,000.0007,141,780.00 0.28
AIRBUS SE 1.375% 20-09/06/2026 EUR 4,891,548.00 0.194,600,000.000Engineering & Construction
4,891,548.00 0.19
SMURFIT KAPPA AQ 2.875% 18-15/01/2026 EUR 2,602,413.50 0.102,350,000.000Forest products & Paper
SPA HOLDINGS 3 3.625% 21-04/02/2028 EUR 1,918,221.00 0.081,900,000.0004,520,634.50 0.18
NameQuantity/Nominal
Market valuein EUR
Currency %NAV
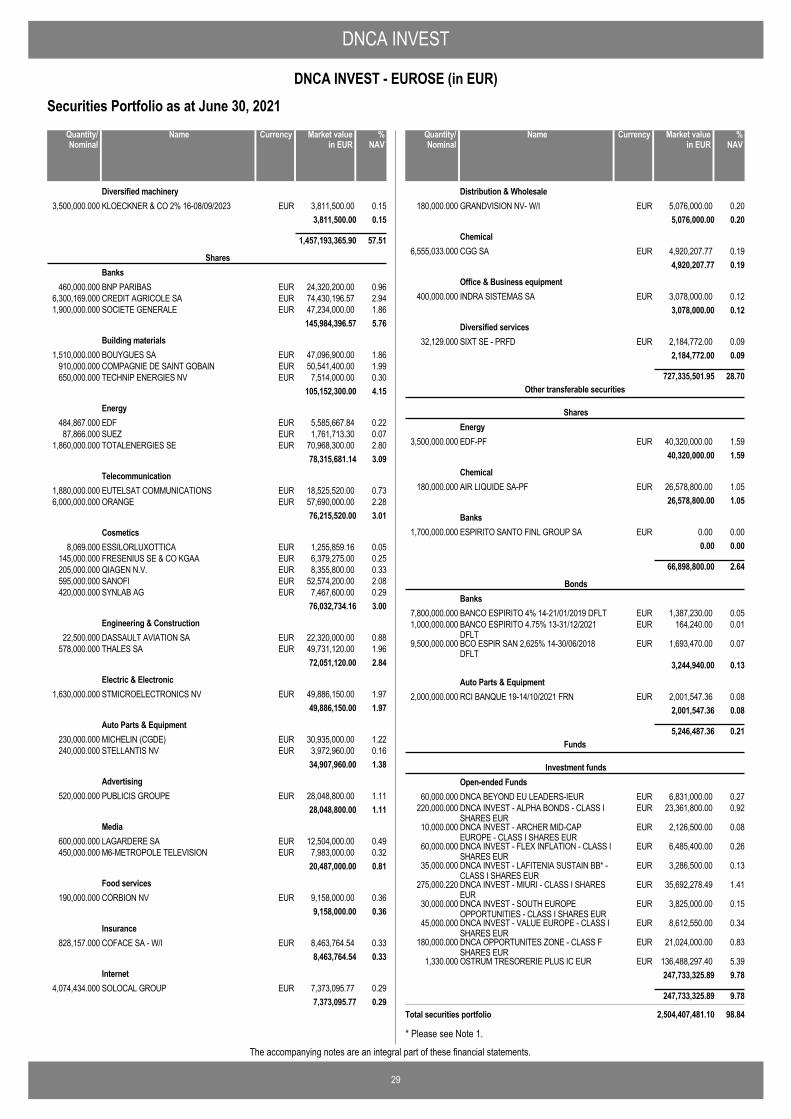
DNCA INVEST
29
DNCA INVEST - EUROSE (in EUR)
The accompanying notes are an integral part of these financial statements.
Securities Portfolio as at June 30, 2021
KLOECKNER & CO 2% 16-08/09/2023 EUR 3,811,500.00 0.153,500,000.000Diversified machinery
3,811,500.00 0.15
1,457,193,365.90 57.51
BNP PARIBAS EUR 24,320,200.00 0.96460,000.000
SharesBanks
CREDIT AGRICOLE SA EUR 74,430,196.57 2.946,300,169.000SOCIETE GENERALE EUR 47,234,000.00 1.861,900,000.000
145,984,396.57 5.76
BOUYGUES SA EUR 47,096,900.00 1.861,510,000.000Building materials
COMPAGNIE DE SAINT GOBAIN EUR 50,541,400.00 1.99910,000.000TECHNIP ENERGIES NV EUR 7,514,000.00 0.30650,000.000
105,152,300.00 4.15
EDF EUR 5,585,667.84 0.22484,867.000Energy
SUEZ EUR 1,761,713.30 0.0787,866.000TOTALENERGIES SE EUR 70,968,300.00 2.801,860,000.000
78,315,681.14 3.09
EUTELSAT COMMUNICATIONS EUR 18,525,520.00 0.731,880,000.000Telecommunication
ORANGE EUR 57,690,000.00 2.286,000,000.00076,215,520.00 3.01
ESSILORLUXOTTICA EUR 1,255,859.16 0.058,069.000Cosmetics
FRESENIUS SE & CO KGAA EUR 6,379,275.00 0.25145,000.000QIAGEN N.V. EUR 8,355,800.00 0.33205,000.000SANOFI EUR 52,574,200.00 2.08595,000.000SYNLAB AG EUR 7,467,600.00 0.29420,000.000
76,032,734.16 3.00
DASSAULT AVIATION SA EUR 22,320,000.00 0.8822,500.000Engineering & Construction
THALES SA EUR 49,731,120.00 1.96578,000.00072,051,120.00 2.84
STMICROELECTRONICS NV EUR 49,886,150.00 1.971,630,000.000Electric & Electronic
49,886,150.00 1.97
MICHELIN (CGDE) EUR 30,935,000.00 1.22230,000.000Auto Parts & Equipment
STELLANTIS NV EUR 3,972,960.00 0.16240,000.00034,907,960.00 1.38
PUBLICIS GROUPE EUR 28,048,800.00 1.11520,000.000Advertising
28,048,800.00 1.11
LAGARDERE SA EUR 12,504,000.00 0.49600,000.000Media
M6-METROPOLE TELEVISION EUR 7,983,000.00 0.32450,000.00020,487,000.00 0.81
CORBION NV EUR 9,158,000.00 0.36190,000.000Food services
9,158,000.00 0.36
COFACE SA - W/I EUR 8,463,764.54 0.33828,157.000Insurance
8,463,764.54 0.33
SOLOCAL GROUP EUR 7,373,095.77 0.294,074,434.000Internet
7,373,095.77 0.29
NameQuantity/Nominal
Market valuein EUR
Currency %NAV
GRANDVISION NV- W/I EUR 5,076,000.00 0.20180,000.000Distribution & Wholesale
5,076,000.00 0.20
CGG SA EUR 4,920,207.77 0.196,555,033.000Chemical
4,920,207.77 0.19
INDRA SISTEMAS SA EUR 3,078,000.00 0.12400,000.000Office & Business equipment
3,078,000.00 0.12
SIXT SE - PRFD EUR 2,184,772.00 0.0932,129.000Diversified services
2,184,772.00 0.09
727,335,501.95 28.70
EDF-PF EUR 40,320,000.00 1.593,500,000.000
Other transferable securities
SharesEnergy
40,320,000.00 1.59
AIR LIQUIDE SA-PF EUR 26,578,800.00 1.05180,000.000Chemical
26,578,800.00 1.05
ESPIRITO SANTO FINL GROUP SA EUR 0.00 0.001,700,000.000Banks
0.00 0.00
66,898,800.00 2.64
BANCO ESPIRITO 4% 14-21/01/2019 DFLT EUR 1,387,230.00 0.057,800,000.000
BondsBanks
BANCO ESPIRITO 4.75% 13-31/12/2021DFLT
EUR 164,240.00 0.011,000,000.000
BCO ESPIR SAN 2,625% 14-30/06/2018DFLT
EUR 1,693,470.00 0.079,500,000.000
3,244,940.00 0.13
RCI BANQUE 19-14/10/2021 FRN EUR 2,001,547.36 0.082,000,000.000Auto Parts & Equipment
2,001,547.36 0.08
5,246,487.36 0.21
DNCA BEYOND EU LEADERS-IEUR EUR 6,831,000.00 0.2760,000.000
Funds
Investment fundsOpen-ended Funds
DNCA INVEST - ALPHA BONDS - CLASS ISHARES EUR
EUR 23,361,800.00 0.92220,000.000
DNCA INVEST - ARCHER MID-CAPEUROPE - CLASS I SHARES EUR
EUR 2,126,500.00 0.0810,000.000
DNCA INVEST - FLEX INFLATION - CLASS ISHARES EUR
EUR 6,485,400.00 0.2660,000.000
DNCA INVEST - LAFITENIA SUSTAIN BB* -CLASS I SHARES EUR
EUR 3,286,500.00 0.1335,000.000
DNCA INVEST - MIURI - CLASS I SHARESEUR
EUR 35,692,278.49 1.41275,000.220
DNCA INVEST - SOUTH EUROPEOPPORTUNITIES - CLASS I SHARES EUR
EUR 3,825,000.00 0.1530,000.000
DNCA INVEST - VALUE EUROPE - CLASS ISHARES EUR
EUR 8,612,550.00 0.3445,000.000
DNCA OPPORTUNITES ZONE - CLASS FSHARES EUR
EUR 21,024,000.00 0.83180,000.000
OSTRUM TRESORERIE PLUS IC EUR EUR 136,488,297.40 5.391,330.000247,733,325.89 9.78
247,733,325.89 9.78
Total securities portfolio 2,504,407,481.10 98.84
NameQuantity/Nominal
Market valuein EUR
Currency %NAV
* Please see Note 1.
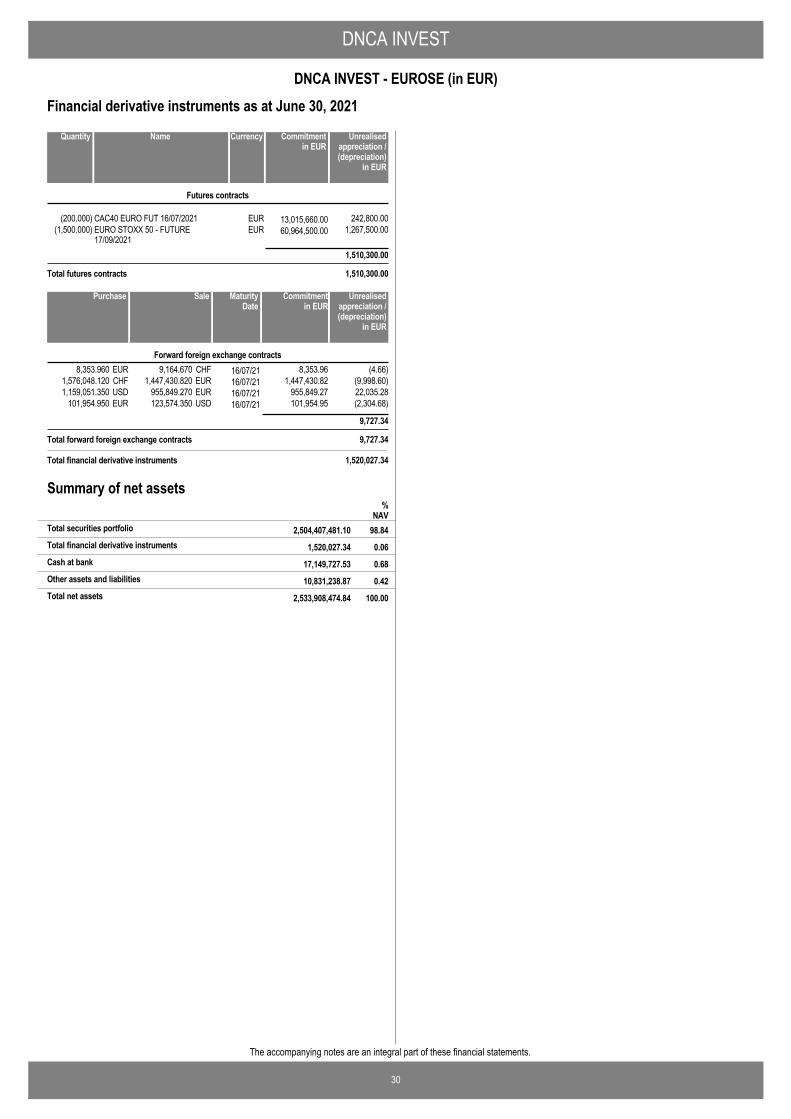
DNCA INVEST
30
DNCA INVEST - EUROSE (in EUR)
The accompanying notes are an integral part of these financial statements.
CAC40 EURO FUT 16/07/2021 EUR 13,015,660.00(200.000) 242,800.00
Futures contracts
EURO STOXX 50 - FUTURE17/09/2021
EUR 60,964,500.00(1,500.000) 1,267,500.00
1,510,300.00
Total futures contracts 1,510,300.00
NameQuantity Commitmentin EUR
Currency Unrealisedappreciation /(depreciation)
in EUR
Financial derivative instruments as at June 30, 2021
9,164.670 16/07/218,353.960 (4.66)CHFEUR 8,353.96Forward foreign exchange contracts
1,447,430.820 16/07/211,576,048.120 (9,998.60)EURCHF 1,447,430.82955,849.270 16/07/211,159,051.350 22,035.28EURUSD 955,849.27123,574.350 16/07/21101,954.950 (2,304.68)USDEUR 101,954.95
9,727.34
Total forward foreign exchange contracts 9,727.34
SalePurchase Unrealisedappreciation /(depreciation)
in EUR
MaturityDate
Commitmentin EUR
Total financial derivative instruments 1,520,027.34
Summary of net assets
1,520,027.34 0.06Total financial derivative instruments
%NAV
2,504,407,481.10 98.84Total securities portfolio
17,149,727.53 0.68Cash at bank
10,831,238.87 0.42Other assets and liabilities
2,533,908,474.84 100.00Total net assets
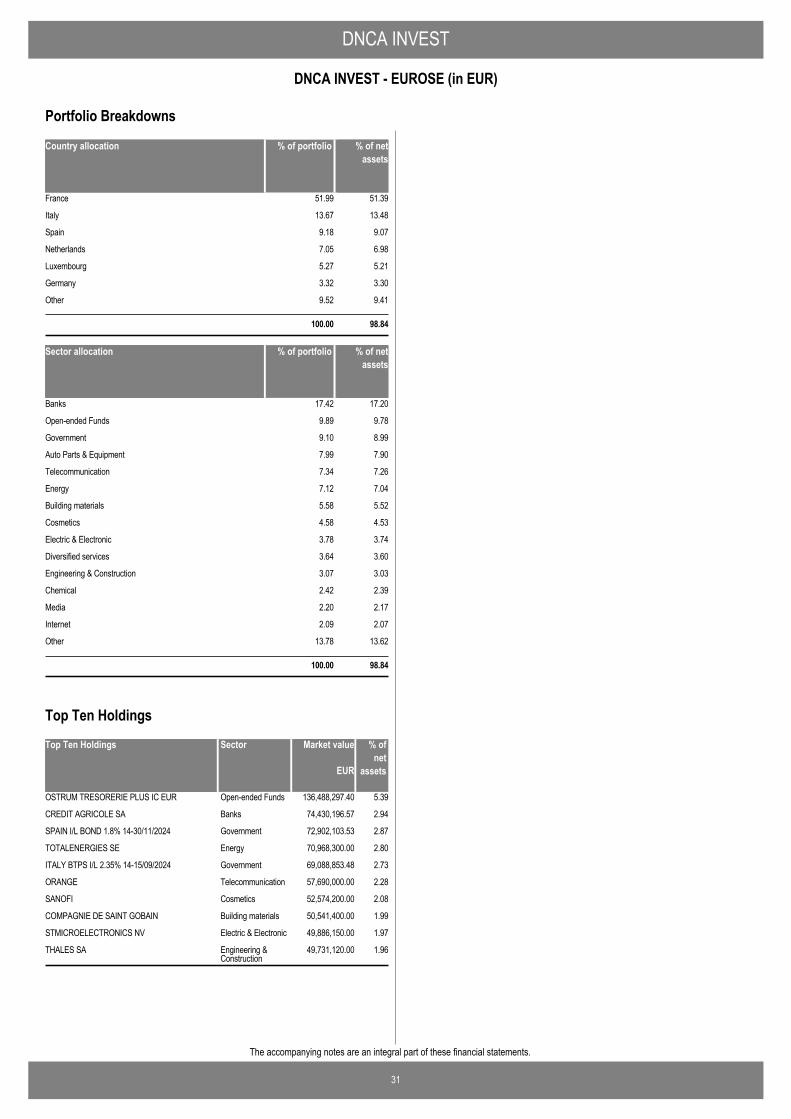
DNCA INVEST
31
DNCA INVEST - EUROSE (in EUR)
The accompanying notes are an integral part of these financial statements.
Country allocation % of portfolio % of netassets
France 51.99 51.39
Italy 13.67 13.48
Spain 9.18 9.07
Netherlands 7.05 6.98
Luxembourg 5.27 5.21
Germany 3.32 3.30
Other 9.52 9.41
100.00 98.84
Sector allocation % of portfolio % of netassets
Banks 17.42 17.20
Open-ended Funds 9.89 9.78
Government 9.10 8.99
Auto Parts & Equipment 7.99 7.90
Telecommunication 7.34 7.26
Energy 7.12 7.04
Building materials 5.58 5.52
Cosmetics 4.58 4.53
Electric & Electronic 3.78 3.74
Diversified services 3.64 3.60
Engineering & Construction 3.07 3.03
Chemical 2.42 2.39
Media 2.20 2.17
Internet 2.09 2.07
Other 13.78 13.62
100.00 98.84
Portfolio Breakdowns
Top Ten Holdings Market value % ofnet
assets
OSTRUM TRESORERIE PLUS IC EUR 136,488,297.40 5.39Open-ended Funds
CREDIT AGRICOLE SA 74,430,196.57 2.94Banks
SPAIN I/L BOND 1.8% 14-30/11/2024 72,902,103.53 2.87Government
TOTALENERGIES SE 70,968,300.00 2.80Energy
ITALY BTPS I/L 2.35% 14-15/09/2024 69,088,853.48 2.73Government
ORANGE 57,690,000.00 2.28Telecommunication
SANOFI 52,574,200.00 2.08Cosmetics
COMPAGNIE DE SAINT GOBAIN 50,541,400.00 1.99Building materials
STMICROELECTRONICS NV 49,886,150.00 1.97Electric & Electronic
THALES SA 49,731,120.00 1.96Engineering &Construction
EUR
Sector
Top Ten Holdings

32
The accompanying notes are an integral part of these financial statements.
DNCA INVEST
DNCA INVEST - EVOLUTIF (in EUR)Statement of Operations and Changes in Net Assets for theperiod ended June 30, 2021
EUR
AssetsInvestment in securities at cost 350,705,671.62Unrealised appreciation / (depreciation) on securities 47,157,388.60
Investment in securities at market value 2.2 397,863,060.22Investment in options contracts at market value 2.2, 12 5,016,629.93Cash at bank 2.2 4,214,841.89Receivable for investment sold 2,741,754.33Receivable on subscriptions 85,587.72Dividends and interest receivable 2.6 185,869.08
Total assets 410,107,743.17
LiabilitiesBank overdraft 2,775,030.05Accrued expenses 462,742.43Payable for investment purchased 1,777,103.74Payable on redemptions 89,414.20Net unrealised depreciation on futures contracts 2.2, 11 1,035,546.25
Total liabilities 6,139,836.67
Net assets at the end of the period 403,967,906.50
Notes
Statement of Net Assets as at June 30, 2021
IncomeDividends (net of withholding taxes) 2.6 2,955,003.54Interest on bonds 2.6 300,761.87Bank interest 2.6 111.62
Total income 3,255,877.03
ExpensesManagement fees 4 2,372,316.05Depositary fees 5 103,362.69Performance fees 4 168.19Administration fees 5 29,437.65Professional fees 7 22,559.77Transaction costs 2.7 1,250,035.34Taxe d'abonnement 6 46,130.12Bank interest and charges 2.5 50,211.98Transfer agent fees 89,244.14Printing & Publication fees 11,521.87Other expenses 7 2,408.72
Total expenses 3,977,396.52
Net investment income / (loss) (721,519.49)
Net realised gain / (loss) on: Investments 2.4 19,543,179.76Foreign currencies transactions 2.3 5,613.03Futures contracts 2.2 1,189,770.62Options contracts and swaps contracts 2.2 (10,343,290.90)
Net realised gain / (loss) for the period 9,673,753.02
Net change in unrealised appreciation / (depreciation) on: Investments 21,797,794.10Futures contracts 2.2 (1,361,668.54)Options contracts and swaps contracts 2.2 532,460.28
Increase / (Decrease) in net assets as a result ofoperations
30,642,338.86
Proceeds received on subscription of shares 43,537,754.90Net amount paid on redemption of shares (48,417,118.12)Net assets at the beginning of the period 378,204,930.86
Net assets at the end of the period 403,967,906.50
EURNotes
Statement of Operations and Changes in Net Assets forthe period ended June 30, 2021

33
The accompanying notes are an integral part of these financial statements.
DNCA INVEST
DNCA INVEST - EVOLUTIF (in EUR)
Number of shares in issue atthe end of the period
Number of shares in issue atthe beginning of the period
Number of sharesissued
Number of sharesredeemed
Statement of Changes in Number of Shares
Class A shares EUR 495,119.446 22,915.262 (61,790.267) 456,244.441
Class AD shares EUR 51,194.107 1,756.337 (8,912.662) 44,037.782
Class B shares EUR 266,683.813 14,611.250 (36,834.345) 244,460.718
Class I shares EUR 389,440.720 22,080.906 (57,280.219) 354,241.407
Class Q shares EUR 52,913.661 53,126.782 (12,543.383) 93,497.060
Class SI shares EUR 1,619,929.068 236,636.476 (170,915.445) 1,685,650.099
Class N shares EUR 40,663.311 8,074.000 (936.000) 47,801.311
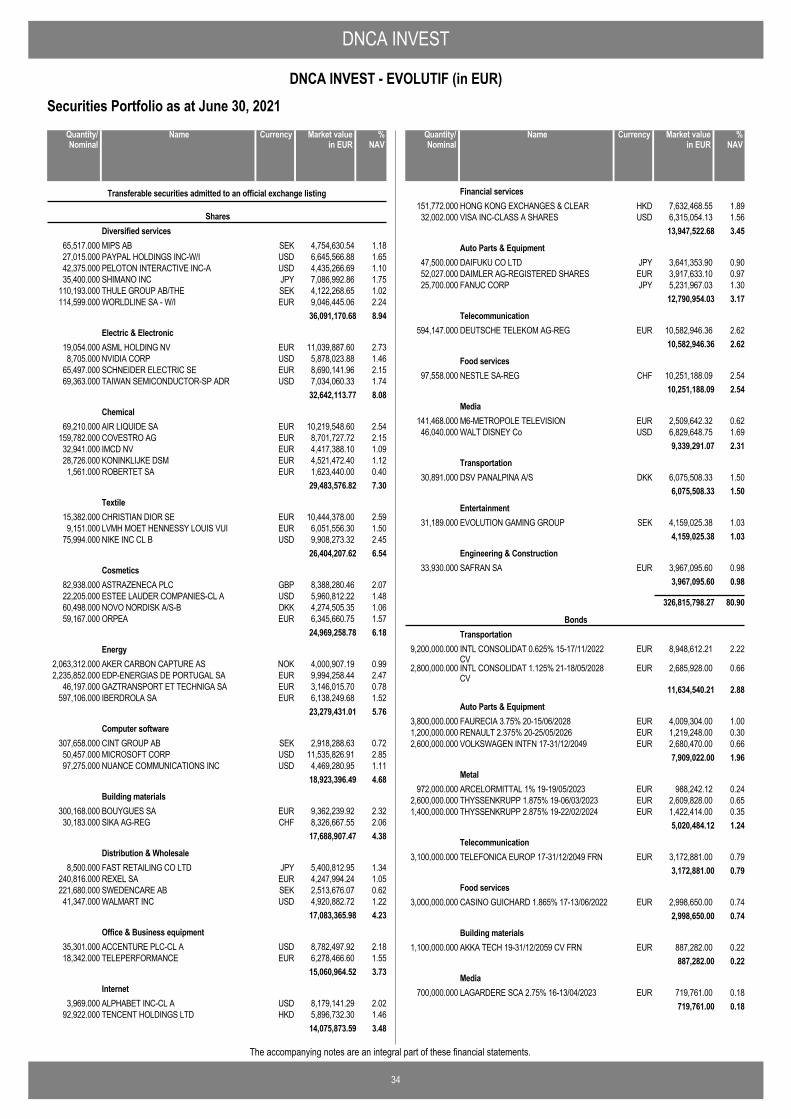
DNCA INVEST
34
DNCA INVEST - EVOLUTIF (in EUR)
The accompanying notes are an integral part of these financial statements.
Securities Portfolio as at June 30, 2021
MIPS AB SEK 4,754,630.54 1.1865,517.000
Transferable securities admitted to an official exchange listing
SharesDiversified services
PAYPAL HOLDINGS INC-W/I USD 6,645,566.88 1.6527,015.000PELOTON INTERACTIVE INC-A USD 4,435,266.69 1.1042,375.000SHIMANO INC JPY 7,086,992.86 1.7535,400.000THULE GROUP AB/THE SEK 4,122,268.65 1.02110,193.000WORLDLINE SA - W/I EUR 9,046,445.06 2.24114,599.000
36,091,170.68 8.94
ASML HOLDING NV EUR 11,039,887.60 2.7319,054.000Electric & Electronic
NVIDIA CORP USD 5,878,023.88 1.468,705.000SCHNEIDER ELECTRIC SE EUR 8,690,141.96 2.1565,497.000TAIWAN SEMICONDUCTOR-SP ADR USD 7,034,060.33 1.7469,363.000
32,642,113.77 8.08
AIR LIQUIDE SA EUR 10,219,548.60 2.5469,210.000Chemical
COVESTRO AG EUR 8,701,727.72 2.15159,782.000IMCD NV EUR 4,417,388.10 1.0932,941.000KONINKLIJKE DSM EUR 4,521,472.40 1.1228,726.000ROBERTET SA EUR 1,623,440.00 0.401,561.000
29,483,576.82 7.30
CHRISTIAN DIOR SE EUR 10,444,378.00 2.5915,382.000Textile
LVMH MOET HENNESSY LOUIS VUI EUR 6,051,556.30 1.509,151.000NIKE INC CL B USD 9,908,273.32 2.4575,994.000
26,404,207.62 6.54
ASTRAZENECA PLC GBP 8,388,280.46 2.0782,938.000Cosmetics
ESTEE LAUDER COMPANIES-CL A USD 5,960,812.22 1.4822,205.000NOVO NORDISK A/S-B DKK 4,274,505.35 1.0660,498.000ORPEA EUR 6,345,660.75 1.5759,167.000
24,969,258.78 6.18
AKER CARBON CAPTURE AS NOK 4,000,907.19 0.992,063,312.000Energy
EDP-ENERGIAS DE PORTUGAL SA EUR 9,994,258.44 2.472,235,852.000GAZTRANSPORT ET TECHNIGA SA EUR 3,146,015.70 0.7846,197.000IBERDROLA SA EUR 6,138,249.68 1.52597,106.000
23,279,431.01 5.76
CINT GROUP AB SEK 2,918,288.63 0.72307,658.000Computer software
MICROSOFT CORP USD 11,535,826.91 2.8550,457.000NUANCE COMMUNICATIONS INC USD 4,469,280.95 1.1197,275.000
18,923,396.49 4.68
BOUYGUES SA EUR 9,362,239.92 2.32300,168.000Building materials
SIKA AG-REG CHF 8,326,667.55 2.0630,183.00017,688,907.47 4.38
FAST RETAILING CO LTD JPY 5,400,812.95 1.348,500.000Distribution & Wholesale
REXEL SA EUR 4,247,994.24 1.05240,816.000SWEDENCARE AB SEK 2,513,676.07 0.62221,680.000WALMART INC USD 4,920,882.72 1.2241,347.000
17,083,365.98 4.23
ACCENTURE PLC-CL A USD 8,782,497.92 2.1835,301.000Office & Business equipment
TELEPERFORMANCE EUR 6,278,466.60 1.5518,342.00015,060,964.52 3.73
ALPHABET INC-CL A USD 8,179,141.29 2.023,969.000Internet
TENCENT HOLDINGS LTD HKD 5,896,732.30 1.4692,922.00014,075,873.59 3.48
NameQuantity/Nominal
Market valuein EUR
Currency %NAV
HONG KONG EXCHANGES & CLEAR HKD 7,632,468.55 1.89151,772.000Financial services
VISA INC-CLASS A SHARES USD 6,315,054.13 1.5632,002.00013,947,522.68 3.45
DAIFUKU CO LTD JPY 3,641,353.90 0.9047,500.000Auto Parts & Equipment
DAIMLER AG-REGISTERED SHARES EUR 3,917,633.10 0.9752,027.000FANUC CORP JPY 5,231,967.03 1.3025,700.000
12,790,954.03 3.17
DEUTSCHE TELEKOM AG-REG EUR 10,582,946.36 2.62594,147.000Telecommunication
10,582,946.36 2.62
NESTLE SA-REG CHF 10,251,188.09 2.5497,558.000Food services
10,251,188.09 2.54
M6-METROPOLE TELEVISION EUR 2,509,642.32 0.62141,468.000Media
WALT DISNEY Co USD 6,829,648.75 1.6946,040.0009,339,291.07 2.31
DSV PANALPINA A/S DKK 6,075,508.33 1.5030,891.000Transportation
6,075,508.33 1.50
EVOLUTION GAMING GROUP SEK 4,159,025.38 1.0331,189.000Entertainment
4,159,025.38 1.03
SAFRAN SA EUR 3,967,095.60 0.9833,930.000Engineering & Construction
3,967,095.60 0.98
326,815,798.27 80.90
INTL CONSOLIDAT 0.625% 15-17/11/2022CV
EUR 8,948,612.21 2.229,200,000.000
BondsTransportation
INTL CONSOLIDAT 1.125% 21-18/05/2028CV
EUR 2,685,928.00 0.662,800,000.000
11,634,540.21 2.88
FAURECIA 3.75% 20-15/06/2028 EUR 4,009,304.00 1.003,800,000.000Auto Parts & Equipment
RENAULT 2.375% 20-25/05/2026 EUR 1,219,248.00 0.301,200,000.000VOLKSWAGEN INTFN 17-31/12/2049 EUR 2,680,470.00 0.662,600,000.000
7,909,022.00 1.96
ARCELORMITTAL 1% 19-19/05/2023 EUR 988,242.12 0.24972,000.000Metal
THYSSENKRUPP 1.875% 19-06/03/2023 EUR 2,609,828.00 0.652,600,000.000THYSSENKRUPP 2.875% 19-22/02/2024 EUR 1,422,414.00 0.351,400,000.000
5,020,484.12 1.24
TELEFONICA EUROP 17-31/12/2049 FRN EUR 3,172,881.00 0.793,100,000.000Telecommunication
3,172,881.00 0.79
CASINO GUICHARD 1.865% 17-13/06/2022 EUR 2,998,650.00 0.743,000,000.000Food services
2,998,650.00 0.74
AKKA TECH 19-31/12/2059 CV FRN EUR 887,282.00 0.221,100,000.000Building materials
887,282.00 0.22
LAGARDERE SCA 2.75% 16-13/04/2023 EUR 719,761.00 0.18700,000.000Media
719,761.00 0.18
NameQuantity/Nominal
Market valuein EUR
Currency %NAV
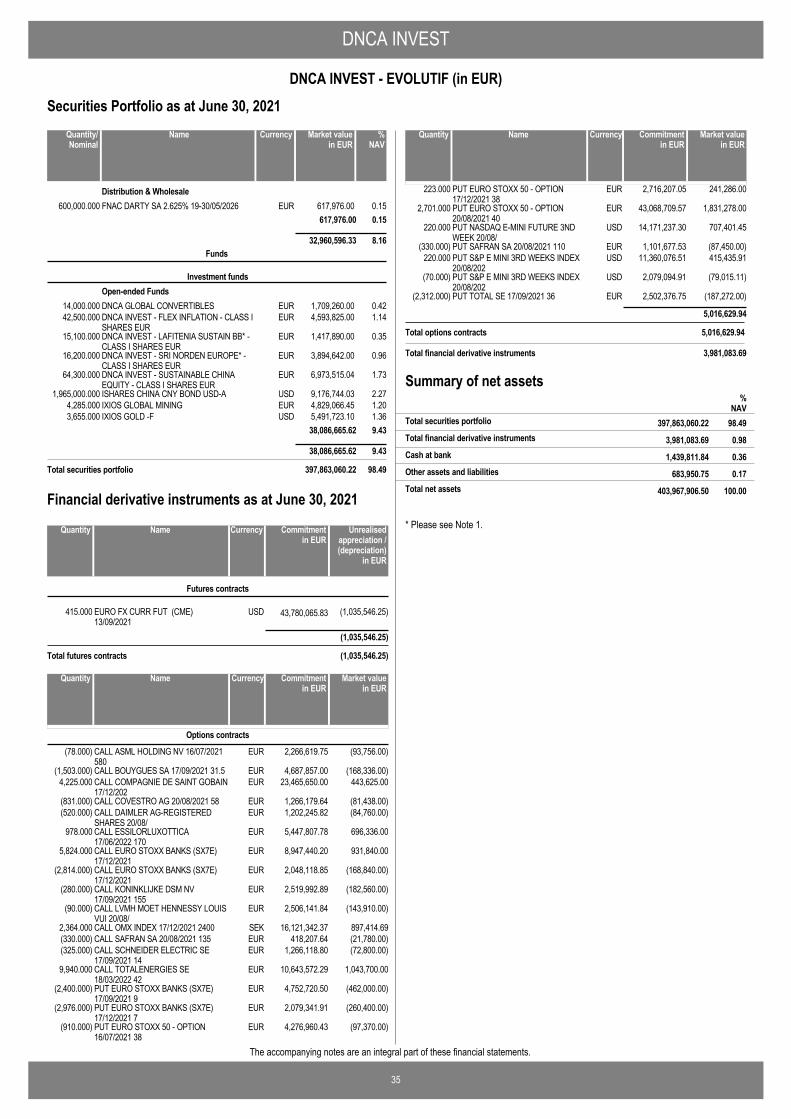
DNCA INVEST
35
DNCA INVEST - EVOLUTIF (in EUR)
The accompanying notes are an integral part of these financial statements.
Securities Portfolio as at June 30, 2021
FNAC DARTY SA 2.625% 19-30/05/2026 EUR 617,976.00 0.15600,000.000Distribution & Wholesale
617,976.00 0.15
32,960,596.33 8.16
DNCA GLOBAL CONVERTIBLES EUR 1,709,260.00 0.4214,000.000
Funds
Investment fundsOpen-ended Funds
DNCA INVEST - FLEX INFLATION - CLASS ISHARES EUR
EUR 4,593,825.00 1.1442,500.000
DNCA INVEST - LAFITENIA SUSTAIN BB* -CLASS I SHARES EUR
EUR 1,417,890.00 0.3515,100.000
DNCA INVEST - SRI NORDEN EUROPE* -CLASS I SHARES EUR
EUR 3,894,642.00 0.9616,200.000
DNCA INVEST - SUSTAINABLE CHINAEQUITY - CLASS I SHARES EUR
EUR 6,973,515.04 1.7364,300.000
ISHARES CHINA CNY BOND USD-A USD 9,176,744.03 2.271,965,000.000IXIOS GLOBAL MINING EUR 4,829,066.45 1.204,285.000IXIOS GOLD -F USD 5,491,723.10 1.363,655.000
38,086,665.62 9.43
38,086,665.62 9.43
Total securities portfolio 397,863,060.22 98.49
NameQuantity/Nominal
Market valuein EUR
Currency %NAV
EURO FX CURR FUT (CME)13/09/2021
USD 43,780,065.83415.000 (1,035,546.25)
Futures contracts
(1,035,546.25)
Total futures contracts (1,035,546.25)
NameQuantity Commitmentin EUR
Currency Unrealisedappreciation /(depreciation)
in EUR
Financial derivative instruments as at June 30, 2021
CALL ASML HOLDING NV 16/07/2021580
EUR(78.000) 2,266,619.75 (93,756.00)
Options contracts
CALL BOUYGUES SA 17/09/2021 31.5 EUR(1,503.000) 4,687,857.00 (168,336.00)CALL COMPAGNIE DE SAINT GOBAIN17/12/202
EUR4,225.000 23,465,650.00 443,625.00
CALL COVESTRO AG 20/08/2021 58 EUR(831.000) 1,266,179.64 (81,438.00)CALL DAIMLER AG-REGISTEREDSHARES 20/08/
EUR(520.000) 1,202,245.82 (84,760.00)
CALL ESSILORLUXOTTICA17/06/2022 170
EUR978.000 5,447,807.78 696,336.00
CALL EURO STOXX BANKS (SX7E)17/12/2021
EUR5,824.000 8,947,440.20 931,840.00
CALL EURO STOXX BANKS (SX7E)17/12/2021
EUR(2,814.000) 2,048,118.85 (168,840.00)
CALL KONINKLIJKE DSM NV17/09/2021 155
EUR(280.000) 2,519,992.89 (182,560.00)
CALL LVMH MOET HENNESSY LOUISVUI 20/08/
EUR(90.000) 2,506,141.84 (143,910.00)
CALL OMX INDEX 17/12/2021 2400 SEK2,364.000 16,121,342.37 897,414.69CALL SAFRAN SA 20/08/2021 135 EUR(330.000) 418,207.64 (21,780.00)CALL SCHNEIDER ELECTRIC SE17/09/2021 14
EUR(325.000) 1,266,118.80 (72,800.00)
CALL TOTALENERGIES SE18/03/2022 42
EUR9,940.000 10,643,572.29 1,043,700.00
PUT EURO STOXX BANKS (SX7E)17/09/2021 9
EUR(2,400.000) 4,752,720.50 (462,000.00)
PUT EURO STOXX BANKS (SX7E)17/12/2021 7
EUR(2,976.000) 2,079,341.91 (260,400.00)
PUT EURO STOXX 50 - OPTION16/07/2021 38
EUR(910.000) 4,276,960.43 (97,370.00)
NameQuantity Market valuein EUR
Currency Commitmentin EUR
PUT EURO STOXX 50 - OPTION17/12/2021 38
EUR223.000 2,716,207.05 241,286.00
PUT EURO STOXX 50 - OPTION20/08/2021 40
EUR2,701.000 43,068,709.57 1,831,278.00
PUT NASDAQ E-MINI FUTURE 3NDWEEK 20/08/
USD220.000 14,171,237.30 707,401.45
PUT SAFRAN SA 20/08/2021 110 EUR(330.000) 1,101,677.53 (87,450.00)PUT S&P E MINI 3RD WEEKS INDEX20/08/202
USD220.000 11,360,076.51 415,435.91
PUT S&P E MINI 3RD WEEKS INDEX20/08/202
USD(70.000) 2,079,094.91 (79,015.11)
PUT TOTAL SE 17/09/2021 36 EUR(2,312.000) 2,502,376.75 (187,272.00)
5,016,629.94
Total options contracts 5,016,629.94
NameQuantity Market valuein EUR
Currency Commitmentin EUR
Total financial derivative instruments 3,981,083.69
Summary of net assets
3,981,083.69 0.98Total financial derivative instruments
%NAV
397,863,060.22 98.49Total securities portfolio
1,439,811.84 0.36Cash at bank
683,950.75 0.17Other assets and liabilities
403,967,906.50 100.00Total net assets
* Please see Note 1.
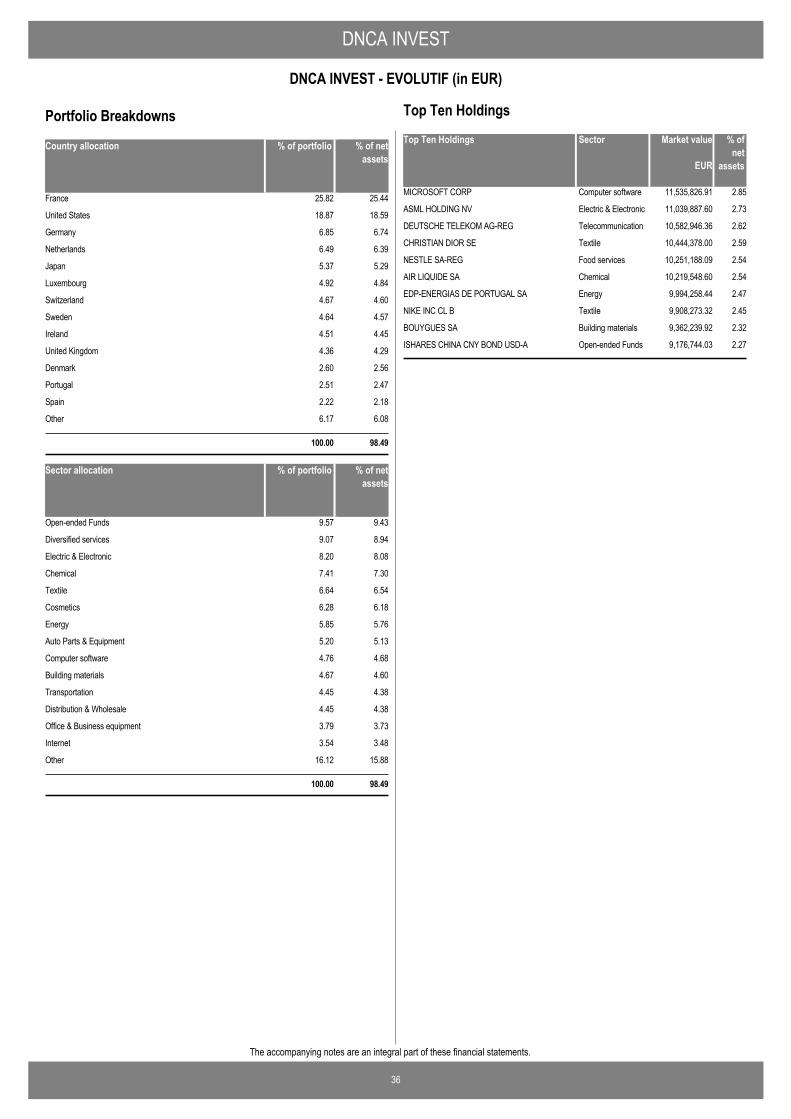
DNCA INVEST
36
DNCA INVEST - EVOLUTIF (in EUR)
The accompanying notes are an integral part of these financial statements.
Country allocation % of portfolio % of netassets
France 25.82 25.44
United States 18.87 18.59
Germany 6.85 6.74
Netherlands 6.49 6.39
Japan 5.37 5.29
Luxembourg 4.92 4.84
Switzerland 4.67 4.60
Sweden 4.64 4.57
Ireland 4.51 4.45
United Kingdom 4.36 4.29
Denmark 2.60 2.56
Portugal 2.51 2.47
Spain 2.22 2.18
Other 6.17 6.08
100.00 98.49
Sector allocation % of portfolio % of netassets
Open-ended Funds 9.57 9.43
Diversified services 9.07 8.94
Electric & Electronic 8.20 8.08
Chemical 7.41 7.30
Textile 6.64 6.54
Cosmetics 6.28 6.18
Energy 5.85 5.76
Auto Parts & Equipment 5.20 5.13
Computer software 4.76 4.68
Building materials 4.67 4.60
Transportation 4.45 4.38
Distribution & Wholesale 4.45 4.38
Office & Business equipment 3.79 3.73
Internet 3.54 3.48
Other 16.12 15.88
100.00 98.49
Portfolio BreakdownsTop Ten Holdings Market value % of
netassets
MICROSOFT CORP 11,535,826.91 2.85Computer software
ASML HOLDING NV 11,039,887.60 2.73Electric & Electronic
DEUTSCHE TELEKOM AG-REG 10,582,946.36 2.62Telecommunication
CHRISTIAN DIOR SE 10,444,378.00 2.59Textile
NESTLE SA-REG 10,251,188.09 2.54Food services
AIR LIQUIDE SA 10,219,548.60 2.54Chemical
EDP-ENERGIAS DE PORTUGAL SA 9,994,258.44 2.47Energy
NIKE INC CL B 9,908,273.32 2.45Textile
BOUYGUES SA 9,362,239.92 2.32Building materials
ISHARES CHINA CNY BOND USD-A 9,176,744.03 2.27Open-ended Funds
EUR
Sector
Top Ten Holdings
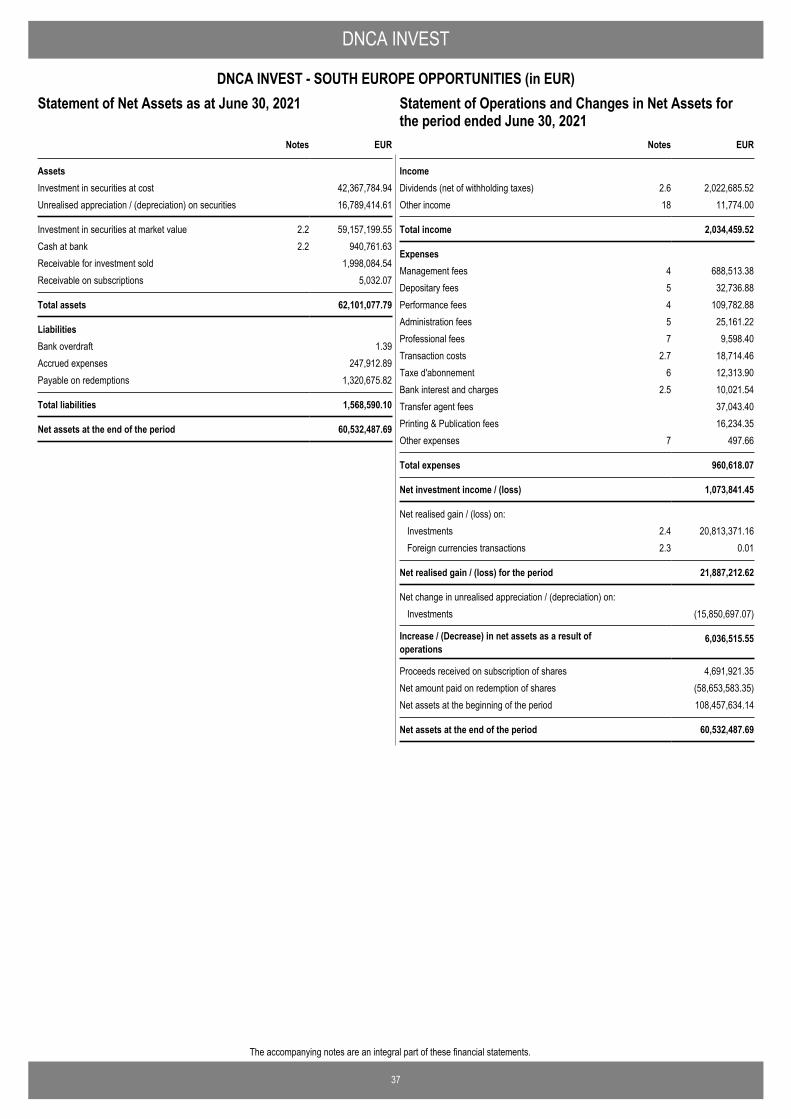
37
The accompanying notes are an integral part of these financial statements.
DNCA INVEST
DNCA INVEST - SOUTH EUROPE OPPORTUNITIES (in EUR)Statement of Operations and Changes in Net Assets for theperiod ended June 30, 2021
EUR
AssetsInvestment in securities at cost 42,367,784.94Unrealised appreciation / (depreciation) on securities 16,789,414.61
Investment in securities at market value 2.2 59,157,199.55Cash at bank 2.2 940,761.63Receivable for investment sold 1,998,084.54Receivable on subscriptions 5,032.07
Total assets 62,101,077.79
LiabilitiesBank overdraft 1.39Accrued expenses 247,912.89Payable on redemptions 1,320,675.82
Total liabilities 1,568,590.10
Net assets at the end of the period 60,532,487.69
Notes
Statement of Net Assets as at June 30, 2021
IncomeDividends (net of withholding taxes) 2.6 2,022,685.52Other income 18 11,774.00
Total income 2,034,459.52
ExpensesManagement fees 4 688,513.38Depositary fees 5 32,736.88Performance fees 4 109,782.88Administration fees 5 25,161.22Professional fees 7 9,598.40Transaction costs 2.7 18,714.46Taxe d'abonnement 6 12,313.90Bank interest and charges 2.5 10,021.54Transfer agent fees 37,043.40Printing & Publication fees 16,234.35Other expenses 7 497.66
Total expenses 960,618.07
Net investment income / (loss) 1,073,841.45
Net realised gain / (loss) on: Investments 2.4 20,813,371.16Foreign currencies transactions 2.3 0.01
Net realised gain / (loss) for the period 21,887,212.62
Net change in unrealised appreciation / (depreciation) on: Investments (15,850,697.07)
Increase / (Decrease) in net assets as a result ofoperations
6,036,515.55
Proceeds received on subscription of shares 4,691,921.35Net amount paid on redemption of shares (58,653,583.35)Net assets at the beginning of the period 108,457,634.14
Net assets at the end of the period 60,532,487.69
EURNotes
Statement of Operations and Changes in Net Assets forthe period ended June 30, 2021
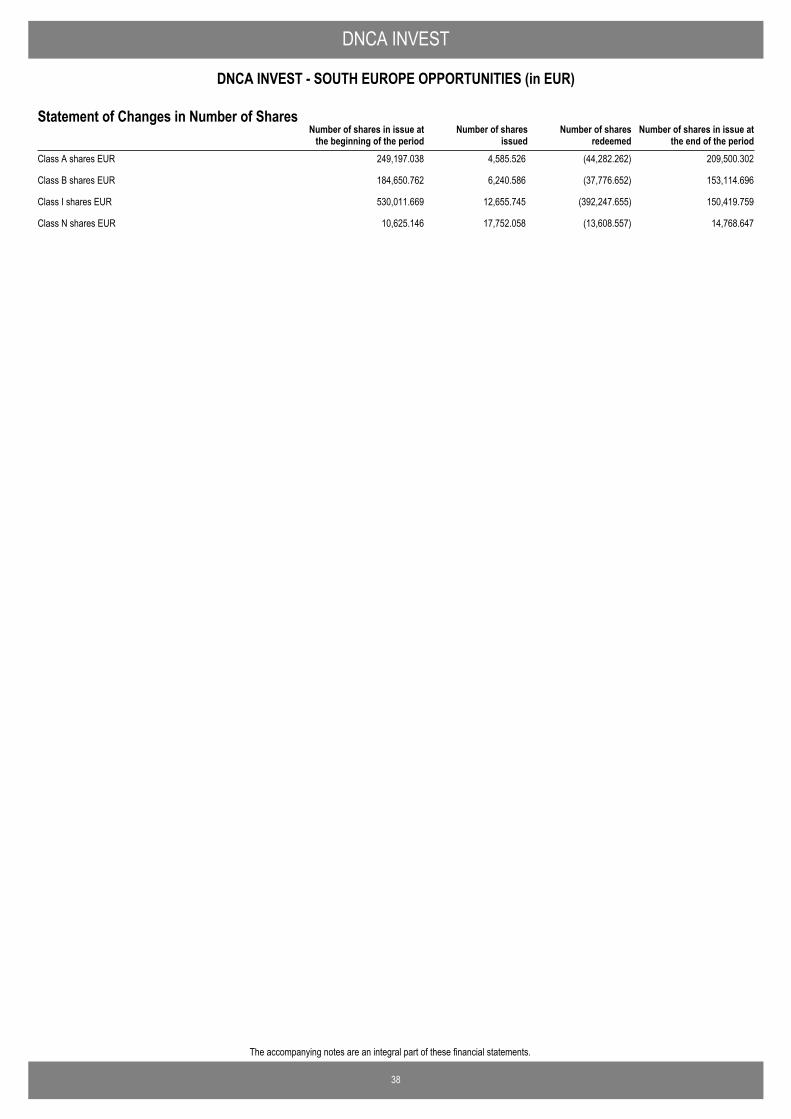
38
The accompanying notes are an integral part of these financial statements.
DNCA INVEST
DNCA INVEST - SOUTH EUROPE OPPORTUNITIES (in EUR)
Number of shares in issue atthe end of the period
Number of shares in issue atthe beginning of the period
Number of sharesissued
Number of sharesredeemed
Statement of Changes in Number of Shares
Class A shares EUR 249,197.038 4,585.526 (44,282.262) 209,500.302
Class B shares EUR 184,650.762 6,240.586 (37,776.652) 153,114.696
Class I shares EUR 530,011.669 12,655.745 (392,247.655) 150,419.759
Class N shares EUR 10,625.146 17,752.058 (13,608.557) 14,768.647
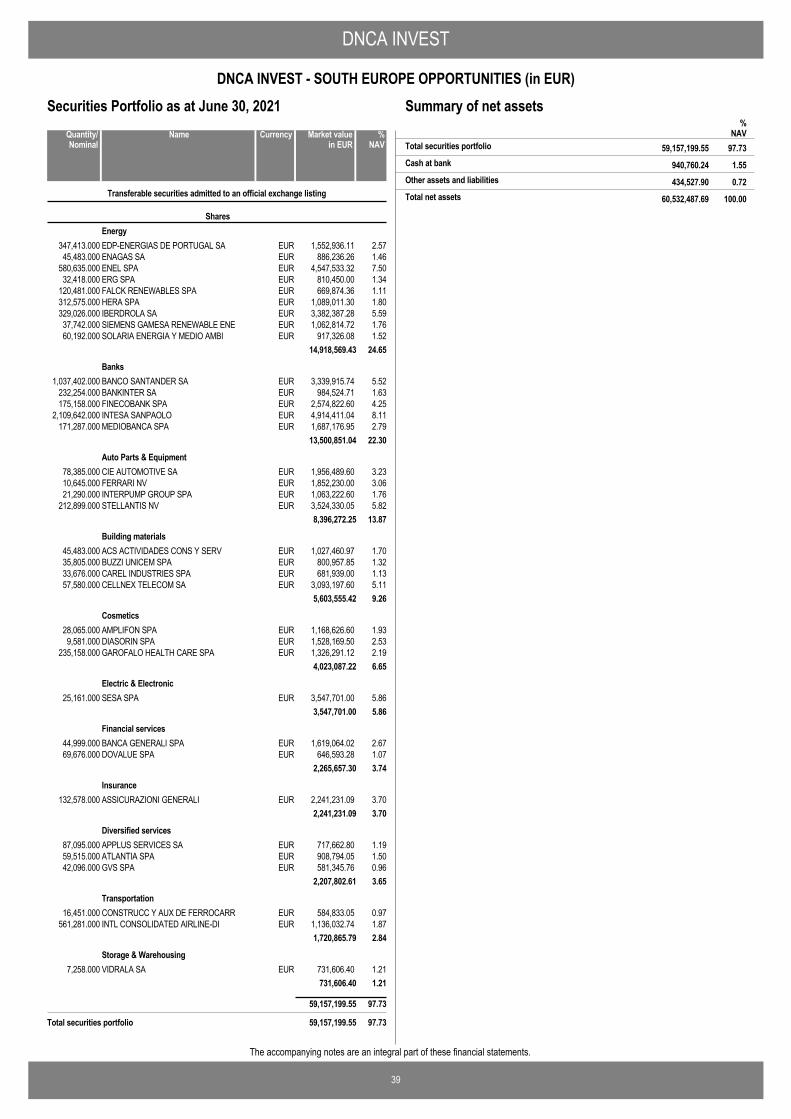
DNCA INVEST
39
DNCA INVEST - SOUTH EUROPE OPPORTUNITIES (in EUR)
The accompanying notes are an integral part of these financial statements.
Securities Portfolio as at June 30, 2021
EDP-ENERGIAS DE PORTUGAL SA EUR 1,552,936.11 2.57347,413.000
Transferable securities admitted to an official exchange listing
SharesEnergy
ENAGAS SA EUR 886,236.26 1.4645,483.000ENEL SPA EUR 4,547,533.32 7.50580,635.000ERG SPA EUR 810,450.00 1.3432,418.000FALCK RENEWABLES SPA EUR 669,874.36 1.11120,481.000HERA SPA EUR 1,089,011.30 1.80312,575.000IBERDROLA SA EUR 3,382,387.28 5.59329,026.000SIEMENS GAMESA RENEWABLE ENE EUR 1,062,814.72 1.7637,742.000SOLARIA ENERGIA Y MEDIO AMBI EUR 917,326.08 1.5260,192.000
14,918,569.43 24.65
BANCO SANTANDER SA EUR 3,339,915.74 5.521,037,402.000Banks
BANKINTER SA EUR 984,524.71 1.63232,254.000FINECOBANK SPA EUR 2,574,822.60 4.25175,158.000INTESA SANPAOLO EUR 4,914,411.04 8.112,109,642.000MEDIOBANCA SPA EUR 1,687,176.95 2.79171,287.000
13,500,851.04 22.30
CIE AUTOMOTIVE SA EUR 1,956,489.60 3.2378,385.000Auto Parts & Equipment
FERRARI NV EUR 1,852,230.00 3.0610,645.000INTERPUMP GROUP SPA EUR 1,063,222.60 1.7621,290.000STELLANTIS NV EUR 3,524,330.05 5.82212,899.000
8,396,272.25 13.87
ACS ACTIVIDADES CONS Y SERV EUR 1,027,460.97 1.7045,483.000Building materials
BUZZI UNICEM SPA EUR 800,957.85 1.3235,805.000CAREL INDUSTRIES SPA EUR 681,939.00 1.1333,676.000CELLNEX TELECOM SA EUR 3,093,197.60 5.1157,580.000
5,603,555.42 9.26
AMPLIFON SPA EUR 1,168,626.60 1.9328,065.000Cosmetics
DIASORIN SPA EUR 1,528,169.50 2.539,581.000GAROFALO HEALTH CARE SPA EUR 1,326,291.12 2.19235,158.000
4,023,087.22 6.65
SESA SPA EUR 3,547,701.00 5.8625,161.000Electric & Electronic
3,547,701.00 5.86
BANCA GENERALI SPA EUR 1,619,064.02 2.6744,999.000Financial services
DOVALUE SPA EUR 646,593.28 1.0769,676.0002,265,657.30 3.74
ASSICURAZIONI GENERALI EUR 2,241,231.09 3.70132,578.000Insurance
2,241,231.09 3.70
APPLUS SERVICES SA EUR 717,662.80 1.1987,095.000Diversified services
ATLANTIA SPA EUR 908,794.05 1.5059,515.000GVS SPA EUR 581,345.76 0.9642,096.000
2,207,802.61 3.65
CONSTRUCC Y AUX DE FERROCARR EUR 584,833.05 0.9716,451.000Transportation
INTL CONSOLIDATED AIRLINE-DI EUR 1,136,032.74 1.87561,281.0001,720,865.79 2.84
VIDRALA SA EUR 731,606.40 1.217,258.000Storage & Warehousing
731,606.40 1.21
59,157,199.55 97.73
Total securities portfolio 59,157,199.55 97.73
NameQuantity/Nominal
Market valuein EUR
Currency %NAV
Summary of net assets%
NAV59,157,199.55 97.73Total securities portfolio
940,760.24 1.55Cash at bank
434,527.90 0.72Other assets and liabilities
60,532,487.69 100.00Total net assets
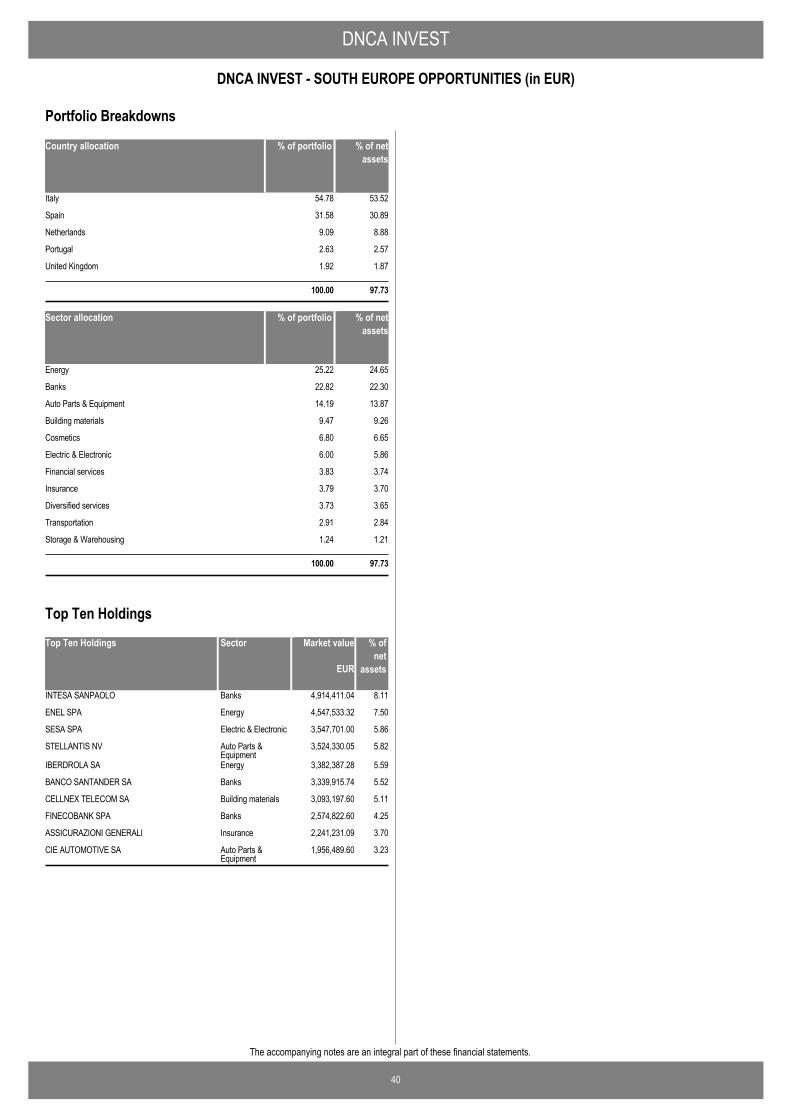
DNCA INVEST
40
DNCA INVEST - SOUTH EUROPE OPPORTUNITIES (in EUR)
The accompanying notes are an integral part of these financial statements.
Country allocation % of portfolio % of netassets
Italy 54.78 53.52
Spain 31.58 30.89
Netherlands 9.09 8.88
Portugal 2.63 2.57
United Kingdom 1.92 1.87
100.00 97.73
Sector allocation % of portfolio % of netassets
Energy 25.22 24.65
Banks 22.82 22.30
Auto Parts & Equipment 14.19 13.87
Building materials 9.47 9.26
Cosmetics 6.80 6.65
Electric & Electronic 6.00 5.86
Financial services 3.83 3.74
Insurance 3.79 3.70
Diversified services 3.73 3.65
Transportation 2.91 2.84
Storage & Warehousing 1.24 1.21
100.00 97.73
Portfolio Breakdowns
Top Ten Holdings Market value % ofnet
assets
INTESA SANPAOLO 4,914,411.04 8.11Banks
ENEL SPA 4,547,533.32 7.50Energy
SESA SPA 3,547,701.00 5.86Electric & Electronic
STELLANTIS NV 3,524,330.05 5.82Auto Parts &Equipment
IBERDROLA SA 3,382,387.28 5.59Energy
BANCO SANTANDER SA 3,339,915.74 5.52Banks
CELLNEX TELECOM SA 3,093,197.60 5.11Building materials
FINECOBANK SPA 2,574,822.60 4.25Banks
ASSICURAZIONI GENERALI 2,241,231.09 3.70Insurance
CIE AUTOMOTIVE SA 1,956,489.60 3.23Auto Parts &Equipment
EUR
Sector
Top Ten Holdings
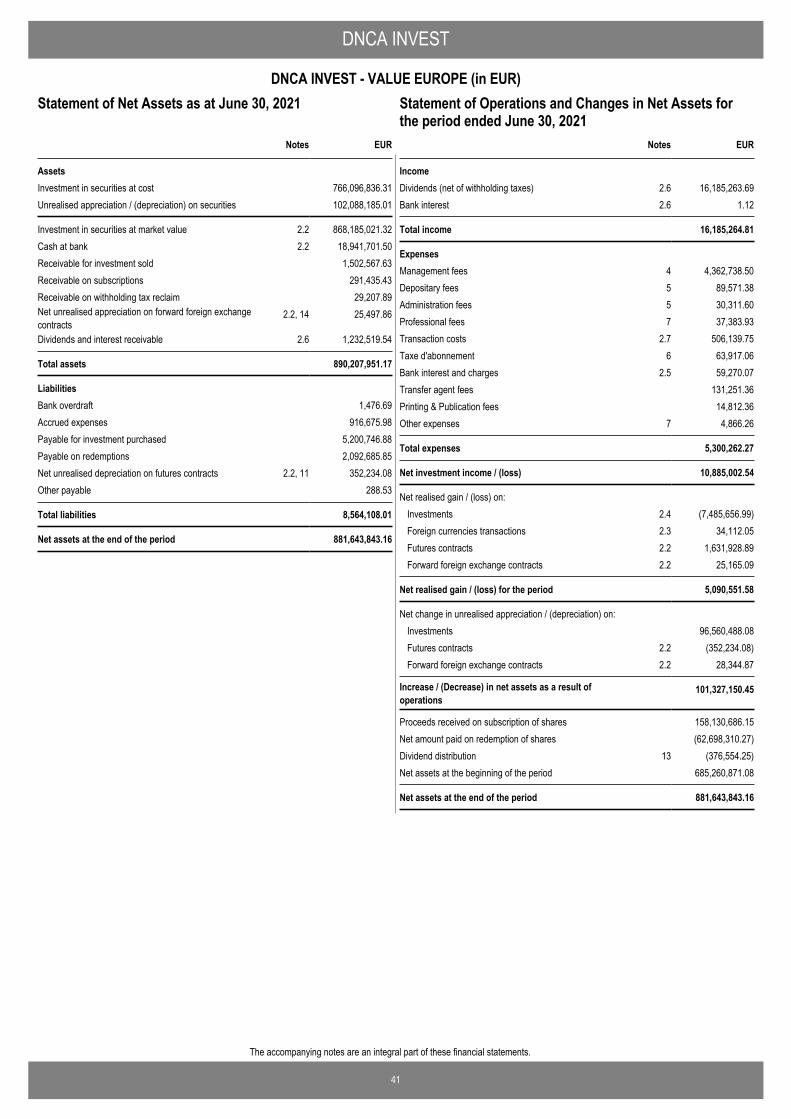
41
The accompanying notes are an integral part of these financial statements.
DNCA INVEST
DNCA INVEST - VALUE EUROPE (in EUR)Statement of Operations and Changes in Net Assets for theperiod ended June 30, 2021
EUR
AssetsInvestment in securities at cost 766,096,836.31Unrealised appreciation / (depreciation) on securities 102,088,185.01
Investment in securities at market value 2.2 868,185,021.32Cash at bank 2.2 18,941,701.50Receivable for investment sold 1,502,567.63Receivable on subscriptions 291,435.43Receivable on withholding tax reclaim 29,207.89Net unrealised appreciation on forward foreign exchangecontracts
2.2, 14 25,497.86
Dividends and interest receivable 2.6 1,232,519.54
Total assets 890,207,951.17
LiabilitiesBank overdraft 1,476.69Accrued expenses 916,675.98Payable for investment purchased 5,200,746.88Payable on redemptions 2,092,685.85Net unrealised depreciation on futures contracts 2.2, 11 352,234.08Other payable 288.53
Total liabilities 8,564,108.01
Net assets at the end of the period 881,643,843.16
Notes
Statement of Net Assets as at June 30, 2021
IncomeDividends (net of withholding taxes) 2.6 16,185,263.69Bank interest 2.6 1.12
Total income 16,185,264.81
ExpensesManagement fees 4 4,362,738.50Depositary fees 5 89,571.38Administration fees 5 30,311.60Professional fees 7 37,383.93Transaction costs 2.7 506,139.75Taxe d'abonnement 6 63,917.06Bank interest and charges 2.5 59,270.07Transfer agent fees 131,251.36Printing & Publication fees 14,812.36Other expenses 7 4,866.26
Total expenses 5,300,262.27
Net investment income / (loss) 10,885,002.54
Net realised gain / (loss) on: Investments 2.4 (7,485,656.99)Foreign currencies transactions 2.3 34,112.05Futures contracts 2.2 1,631,928.89Forward foreign exchange contracts 2.2 25,165.09
Net realised gain / (loss) for the period 5,090,551.58
Net change in unrealised appreciation / (depreciation) on: Investments 96,560,488.08Futures contracts 2.2 (352,234.08)Forward foreign exchange contracts 2.2 28,344.87
Increase / (Decrease) in net assets as a result ofoperations
101,327,150.45
Proceeds received on subscription of shares 158,130,686.15Net amount paid on redemption of shares (62,698,310.27)Dividend distribution 13 (376,554.25)Net assets at the beginning of the period 685,260,871.08
Net assets at the end of the period 881,643,843.16
EURNotes
Statement of Operations and Changes in Net Assets forthe period ended June 30, 2021
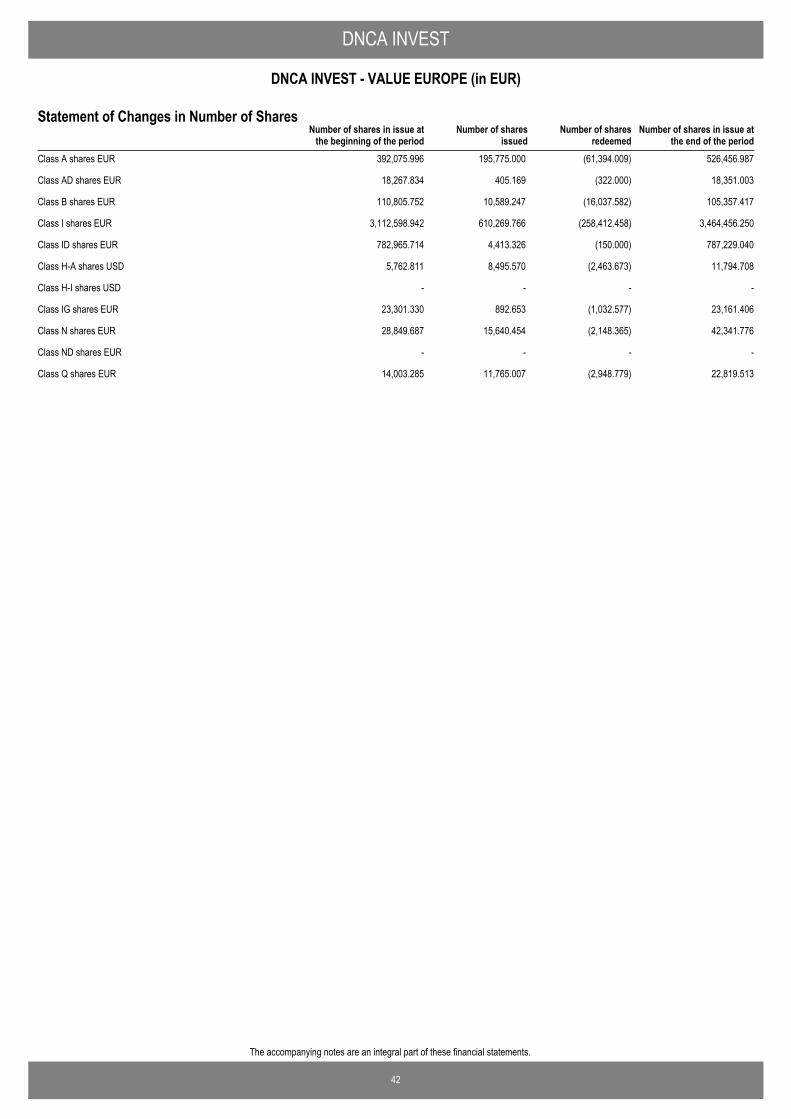
42
The accompanying notes are an integral part of these financial statements.
DNCA INVEST
DNCA INVEST - VALUE EUROPE (in EUR)
Number of shares in issue atthe end of the period
Number of shares in issue atthe beginning of the period
Number of sharesissued
Number of sharesredeemed
Statement of Changes in Number of Shares
Class A shares EUR 392,075.996 195,775.000 (61,394.009) 526,456.987
Class AD shares EUR 18,267.834 405.169 (322.000) 18,351.003
Class B shares EUR 110,805.752 10,589.247 (16,037.582) 105,357.417
Class I shares EUR 3,112,598.942 610,269.766 (258,412.458) 3,464,456.250
Class ID shares EUR 782,965.714 4,413.326 (150.000) 787,229.040
Class H-A shares USD 5,762.811 8,495.570 (2,463.673) 11,794.708
Class H-I shares USD - - - -
Class IG shares EUR 23,301.330 892.653 (1,032.577) 23,161.406
Class N shares EUR 28,849.687 15,640.454 (2,148.365) 42,341.776
Class ND shares EUR - - - -
Class Q shares EUR 14,003.285 11,765.007 (2,948.779) 22,819.513
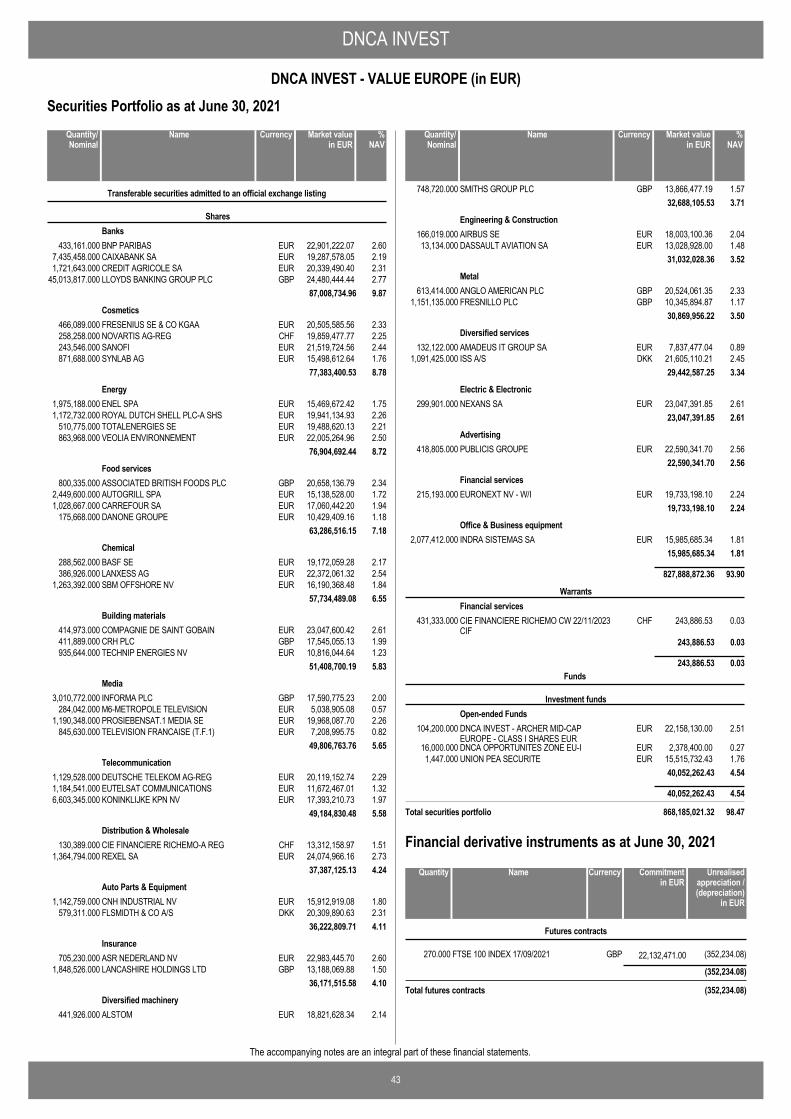
DNCA INVEST
43
DNCA INVEST - VALUE EUROPE (in EUR)
The accompanying notes are an integral part of these financial statements.
Securities Portfolio as at June 30, 2021
BNP PARIBAS EUR 22,901,222.07 2.60433,161.000
Transferable securities admitted to an official exchange listing
SharesBanks
CAIXABANK SA EUR 19,287,578.05 2.197,435,458.000CREDIT AGRICOLE SA EUR 20,339,490.40 2.311,721,643.000LLOYDS BANKING GROUP PLC GBP 24,480,444.44 2.7745,013,817.000
87,008,734.96 9.87
FRESENIUS SE & CO KGAA EUR 20,505,585.56 2.33466,089.000Cosmetics
NOVARTIS AG-REG CHF 19,859,477.77 2.25258,258.000SANOFI EUR 21,519,724.56 2.44243,546.000SYNLAB AG EUR 15,498,612.64 1.76871,688.000
77,383,400.53 8.78
ENEL SPA EUR 15,469,672.42 1.751,975,188.000Energy
ROYAL DUTCH SHELL PLC-A SHS EUR 19,941,134.93 2.261,172,732.000TOTALENERGIES SE EUR 19,488,620.13 2.21510,775.000VEOLIA ENVIRONNEMENT EUR 22,005,264.96 2.50863,968.000
76,904,692.44 8.72
ASSOCIATED BRITISH FOODS PLC GBP 20,658,136.79 2.34800,335.000Food services
AUTOGRILL SPA EUR 15,138,528.00 1.722,449,600.000CARREFOUR SA EUR 17,060,442.20 1.941,028,667.000DANONE GROUPE EUR 10,429,409.16 1.18175,668.000
63,286,516.15 7.18
BASF SE EUR 19,172,059.28 2.17288,562.000Chemical
LANXESS AG EUR 22,372,061.32 2.54386,926.000SBM OFFSHORE NV EUR 16,190,368.48 1.841,263,392.000
57,734,489.08 6.55
COMPAGNIE DE SAINT GOBAIN EUR 23,047,600.42 2.61414,973.000Building materials
CRH PLC GBP 17,545,055.13 1.99411,889.000TECHNIP ENERGIES NV EUR 10,816,044.64 1.23935,644.000
51,408,700.19 5.83
INFORMA PLC GBP 17,590,775.23 2.003,010,772.000Media
M6-METROPOLE TELEVISION EUR 5,038,905.08 0.57284,042.000PROSIEBENSAT.1 MEDIA SE EUR 19,968,087.70 2.261,190,348.000TELEVISION FRANCAISE (T.F.1) EUR 7,208,995.75 0.82845,630.000
49,806,763.76 5.65
DEUTSCHE TELEKOM AG-REG EUR 20,119,152.74 2.291,129,528.000Telecommunication
EUTELSAT COMMUNICATIONS EUR 11,672,467.01 1.321,184,541.000KONINKLIJKE KPN NV EUR 17,393,210.73 1.976,603,345.000
49,184,830.48 5.58
CIE FINANCIERE RICHEMO-A REG CHF 13,312,158.97 1.51130,389.000Distribution & Wholesale
REXEL SA EUR 24,074,966.16 2.731,364,794.00037,387,125.13 4.24
CNH INDUSTRIAL NV EUR 15,912,919.08 1.801,142,759.000Auto Parts & Equipment
FLSMIDTH & CO A/S DKK 20,309,890.63 2.31579,311.00036,222,809.71 4.11
ASR NEDERLAND NV EUR 22,983,445.70 2.60705,230.000Insurance
LANCASHIRE HOLDINGS LTD GBP 13,188,069.88 1.501,848,526.00036,171,515.58 4.10
ALSTOM EUR 18,821,628.34 2.14441,926.000Diversified machinery
NameQuantity/Nominal
Market valuein EUR
Currency %NAV
SMITHS GROUP PLC GBP 13,866,477.19 1.57748,720.00032,688,105.53 3.71
AIRBUS SE EUR 18,003,100.36 2.04166,019.000Engineering & Construction
DASSAULT AVIATION SA EUR 13,028,928.00 1.4813,134.00031,032,028.36 3.52
ANGLO AMERICAN PLC GBP 20,524,061.35 2.33613,414.000Metal
FRESNILLO PLC GBP 10,345,894.87 1.171,151,135.00030,869,956.22 3.50
AMADEUS IT GROUP SA EUR 7,837,477.04 0.89132,122.000Diversified services
ISS A/S DKK 21,605,110.21 2.451,091,425.00029,442,587.25 3.34
NEXANS SA EUR 23,047,391.85 2.61299,901.000Electric & Electronic
23,047,391.85 2.61
PUBLICIS GROUPE EUR 22,590,341.70 2.56418,805.000Advertising
22,590,341.70 2.56
EURONEXT NV - W/I EUR 19,733,198.10 2.24215,193.000Financial services
19,733,198.10 2.24
INDRA SISTEMAS SA EUR 15,985,685.34 1.812,077,412.000Office & Business equipment
15,985,685.34 1.81
827,888,872.36 93.90
CIE FINANCIERE RICHEMO CW 22/11/2023CIF
CHF 243,886.53 0.03431,333.000
WarrantsFinancial services
243,886.53 0.03
243,886.53 0.03
DNCA INVEST - ARCHER MID-CAPEUROPE - CLASS I SHARES EUR
EUR 22,158,130.00 2.51104,200.000
Funds
Investment fundsOpen-ended Funds
DNCA OPPORTUNITES ZONE EU-I EUR 2,378,400.00 0.2716,000.000UNION PEA SECURITE EUR 15,515,732.43 1.761,447.000
40,052,262.43 4.54
40,052,262.43 4.54
Total securities portfolio 868,185,021.32 98.47
NameQuantity/Nominal
Market valuein EUR
Currency %NAV
FTSE 100 INDEX 17/09/2021 GBP 22,132,471.00270.000 (352,234.08)
Futures contracts
(352,234.08)
Total futures contracts (352,234.08)
NameQuantity Commitmentin EUR
Currency Unrealisedappreciation /(depreciation)
in EUR
Financial derivative instruments as at June 30, 2021
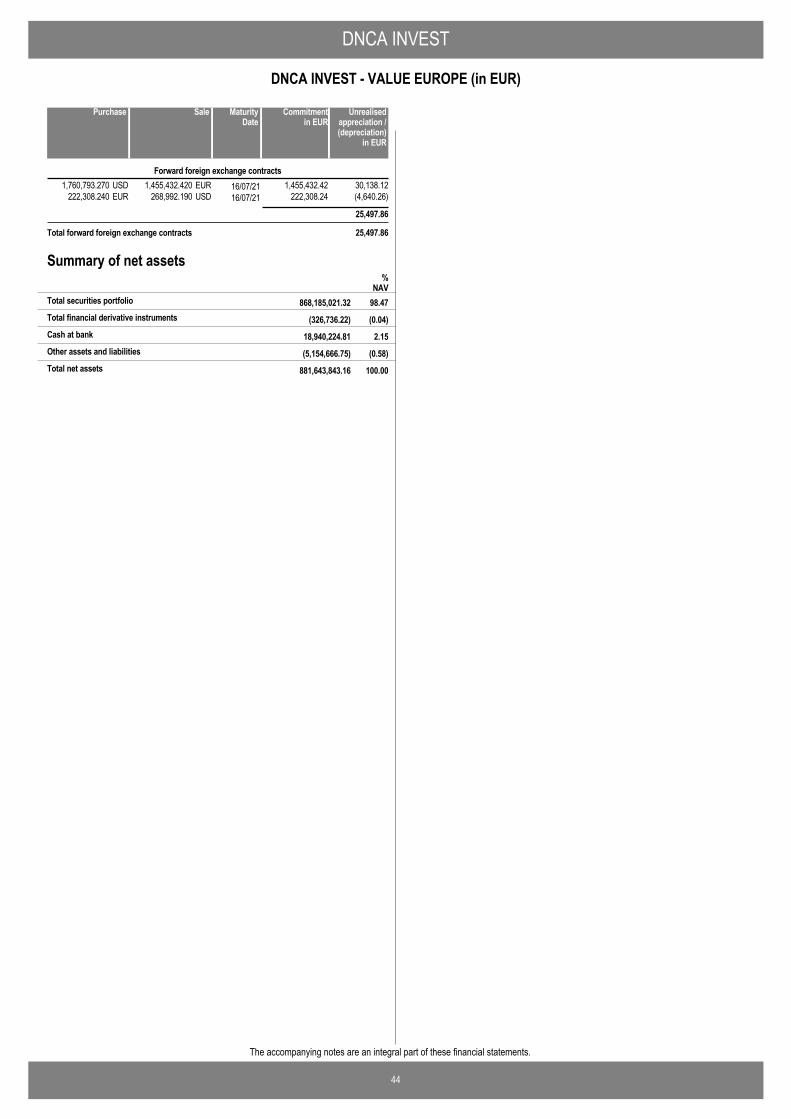
DNCA INVEST
44
DNCA INVEST - VALUE EUROPE (in EUR)
The accompanying notes are an integral part of these financial statements.
1,455,432.420 16/07/211,760,793.270 30,138.12EURUSD 1,455,432.42Forward foreign exchange contracts
268,992.190 16/07/21222,308.240 (4,640.26)USDEUR 222,308.24
25,497.86
Total forward foreign exchange contracts 25,497.86
SalePurchase Unrealisedappreciation /(depreciation)
in EUR
MaturityDate
Commitmentin EUR
Summary of net assets
(326,736.22) (0.04)Total financial derivative instruments
%NAV
868,185,021.32 98.47Total securities portfolio
18,940,224.81 2.15Cash at bank
(5,154,666.75) (0.58)Other assets and liabilities
881,643,843.16 100.00Total net assets
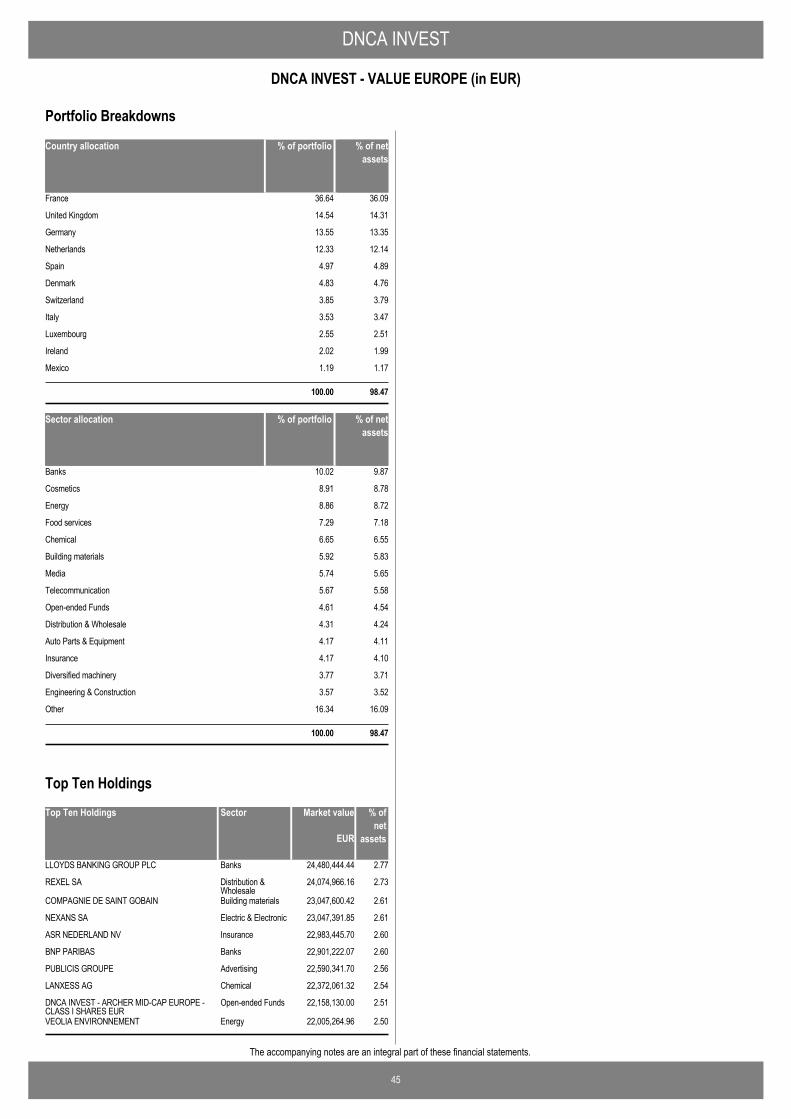
DNCA INVEST
45
DNCA INVEST - VALUE EUROPE (in EUR)
The accompanying notes are an integral part of these financial statements.
Country allocation % of portfolio % of netassets
France 36.64 36.09
United Kingdom 14.54 14.31
Germany 13.55 13.35
Netherlands 12.33 12.14
Spain 4.97 4.89
Denmark 4.83 4.76
Switzerland 3.85 3.79
Italy 3.53 3.47
Luxembourg 2.55 2.51
Ireland 2.02 1.99
Mexico 1.19 1.17
100.00 98.47
Sector allocation % of portfolio % of netassets
Banks 10.02 9.87
Cosmetics 8.91 8.78
Energy 8.86 8.72
Food services 7.29 7.18
Chemical 6.65 6.55
Building materials 5.92 5.83
Media 5.74 5.65
Telecommunication 5.67 5.58
Open-ended Funds 4.61 4.54
Distribution & Wholesale 4.31 4.24
Auto Parts & Equipment 4.17 4.11
Insurance 4.17 4.10
Diversified machinery 3.77 3.71
Engineering & Construction 3.57 3.52
Other 16.34 16.09
100.00 98.47
Portfolio Breakdowns
Top Ten Holdings Market value % ofnet
assets
LLOYDS BANKING GROUP PLC 24,480,444.44 2.77Banks
REXEL SA 24,074,966.16 2.73Distribution &Wholesale
COMPAGNIE DE SAINT GOBAIN 23,047,600.42 2.61Building materials
NEXANS SA 23,047,391.85 2.61Electric & Electronic
ASR NEDERLAND NV 22,983,445.70 2.60Insurance
BNP PARIBAS 22,901,222.07 2.60Banks
PUBLICIS GROUPE 22,590,341.70 2.56Advertising
LANXESS AG 22,372,061.32 2.54Chemical
DNCA INVEST - ARCHER MID-CAP EUROPE -CLASS I SHARES EUR
22,158,130.00 2.51Open-ended Funds
VEOLIA ENVIRONNEMENT 22,005,264.96 2.50Energy
EUR
Sector
Top Ten Holdings
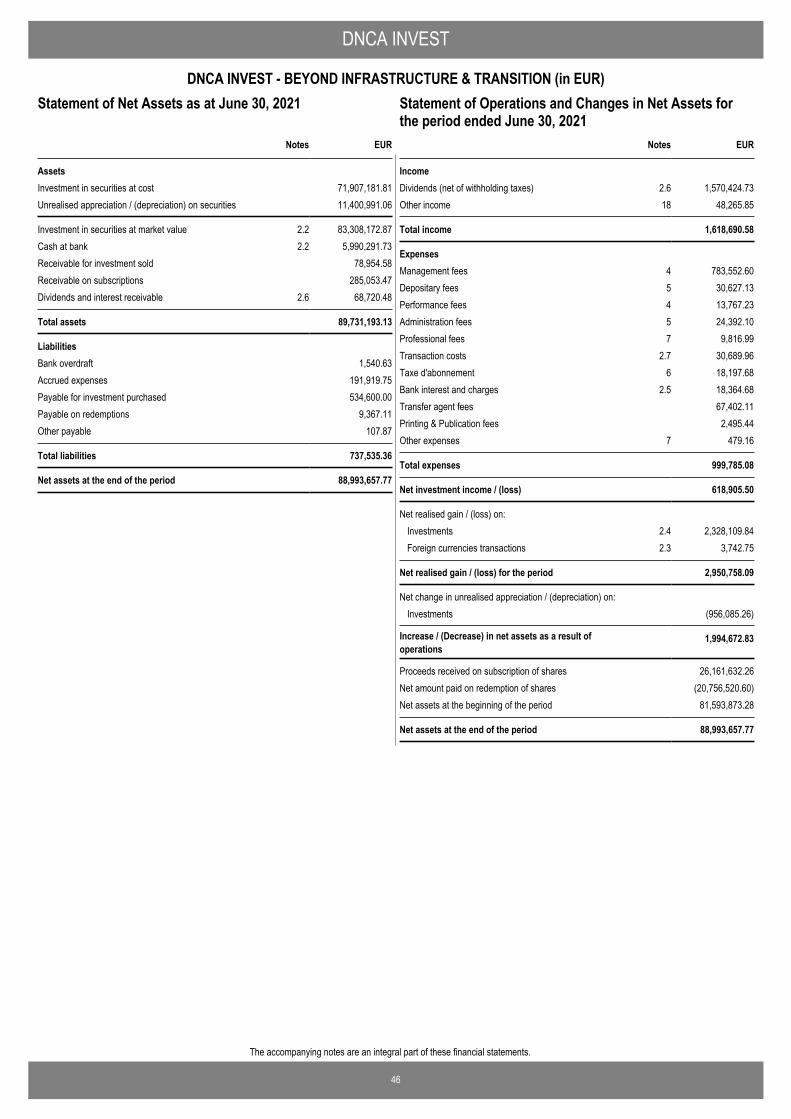
46
The accompanying notes are an integral part of these financial statements.
DNCA INVEST
DNCA INVEST - BEYOND INFRASTRUCTURE & TRANSITION (in EUR)Statement of Operations and Changes in Net Assets for theperiod ended June 30, 2021
EUR
AssetsInvestment in securities at cost 71,907,181.81Unrealised appreciation / (depreciation) on securities 11,400,991.06
Investment in securities at market value 2.2 83,308,172.87Cash at bank 2.2 5,990,291.73Receivable for investment sold 78,954.58Receivable on subscriptions 285,053.47Dividends and interest receivable 2.6 68,720.48
Total assets 89,731,193.13
LiabilitiesBank overdraft 1,540.63Accrued expenses 191,919.75Payable for investment purchased 534,600.00Payable on redemptions 9,367.11Other payable 107.87
Total liabilities 737,535.36
Net assets at the end of the period 88,993,657.77
Notes
Statement of Net Assets as at June 30, 2021
IncomeDividends (net of withholding taxes) 2.6 1,570,424.73Other income 18 48,265.85
Total income 1,618,690.58
ExpensesManagement fees 4 783,552.60Depositary fees 5 30,627.13Performance fees 4 13,767.23Administration fees 5 24,392.10Professional fees 7 9,816.99Transaction costs 2.7 30,689.96Taxe d'abonnement 6 18,197.68Bank interest and charges 2.5 18,364.68Transfer agent fees 67,402.11Printing & Publication fees 2,495.44Other expenses 7 479.16
Total expenses 999,785.08
Net investment income / (loss) 618,905.50
Net realised gain / (loss) on: Investments 2.4 2,328,109.84Foreign currencies transactions 2.3 3,742.75
Net realised gain / (loss) for the period 2,950,758.09
Net change in unrealised appreciation / (depreciation) on: Investments (956,085.26)
Increase / (Decrease) in net assets as a result ofoperations
1,994,672.83
Proceeds received on subscription of shares 26,161,632.26Net amount paid on redemption of shares (20,756,520.60)Net assets at the beginning of the period 81,593,873.28
Net assets at the end of the period 88,993,657.77
EURNotes
Statement of Operations and Changes in Net Assets forthe period ended June 30, 2021
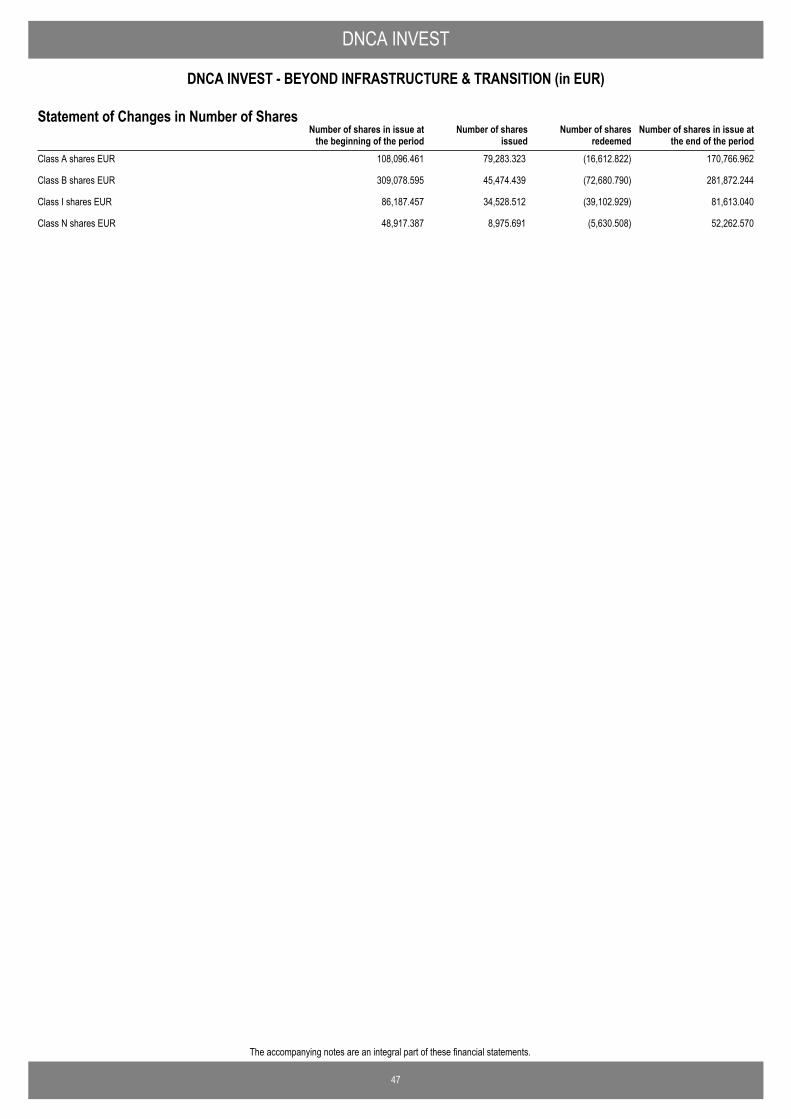
47
The accompanying notes are an integral part of these financial statements.
DNCA INVEST
DNCA INVEST - BEYOND INFRASTRUCTURE & TRANSITION (in EUR)
Number of shares in issue atthe end of the period
Number of shares in issue atthe beginning of the period
Number of sharesissued
Number of sharesredeemed
Statement of Changes in Number of Shares
Class A shares EUR 108,096.461 79,283.323 (16,612.822) 170,766.962
Class B shares EUR 309,078.595 45,474.439 (72,680.790) 281,872.244
Class I shares EUR 86,187.457 34,528.512 (39,102.929) 81,613.040
Class N shares EUR 48,917.387 8,975.691 (5,630.508) 52,262.570
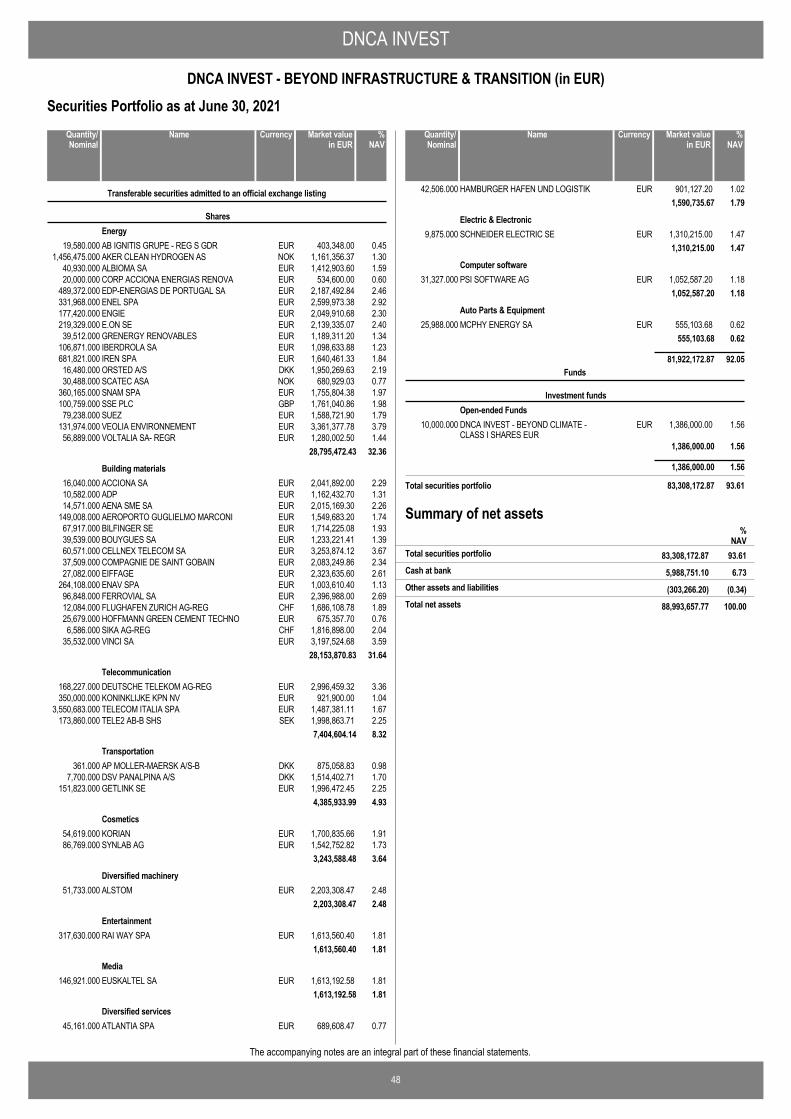
DNCA INVEST
48
DNCA INVEST - BEYOND INFRASTRUCTURE & TRANSITION (in EUR)
The accompanying notes are an integral part of these financial statements.
Securities Portfolio as at June 30, 2021
AB IGNITIS GRUPE - REG S GDR EUR 403,348.00 0.4519,580.000
Transferable securities admitted to an official exchange listing
SharesEnergy
AKER CLEAN HYDROGEN AS NOK 1,161,356.37 1.301,456,475.000ALBIOMA SA EUR 1,412,903.60 1.5940,930.000CORP ACCIONA ENERGIAS RENOVA EUR 534,600.00 0.6020,000.000EDP-ENERGIAS DE PORTUGAL SA EUR 2,187,492.84 2.46489,372.000ENEL SPA EUR 2,599,973.38 2.92331,968.000ENGIE EUR 2,049,910.68 2.30177,420.000E.ON SE EUR 2,139,335.07 2.40219,329.000GRENERGY RENOVABLES EUR 1,189,311.20 1.3439,512.000IBERDROLA SA EUR 1,098,633.88 1.23106,871.000IREN SPA EUR 1,640,461.33 1.84681,821.000ORSTED A/S DKK 1,950,269.63 2.1916,480.000SCATEC ASA NOK 680,929.03 0.7730,488.000SNAM SPA EUR 1,755,804.38 1.97360,165.000SSE PLC GBP 1,761,040.86 1.98100,759.000SUEZ EUR 1,588,721.90 1.7979,238.000VEOLIA ENVIRONNEMENT EUR 3,361,377.78 3.79131,974.000VOLTALIA SA- REGR EUR 1,280,002.50 1.4456,889.000
28,795,472.43 32.36
ACCIONA SA EUR 2,041,892.00 2.2916,040.000Building materials
ADP EUR 1,162,432.70 1.3110,582.000AENA SME SA EUR 2,015,169.30 2.2614,571.000AEROPORTO GUGLIELMO MARCONI EUR 1,549,683.20 1.74149,008.000BILFINGER SE EUR 1,714,225.08 1.9367,917.000BOUYGUES SA EUR 1,233,221.41 1.3939,539.000CELLNEX TELECOM SA EUR 3,253,874.12 3.6760,571.000COMPAGNIE DE SAINT GOBAIN EUR 2,083,249.86 2.3437,509.000EIFFAGE EUR 2,323,635.60 2.6127,082.000ENAV SPA EUR 1,003,610.40 1.13264,108.000FERROVIAL SA EUR 2,396,988.00 2.6996,848.000FLUGHAFEN ZURICH AG-REG CHF 1,686,108.78 1.8912,084.000HOFFMANN GREEN CEMENT TECHNO EUR 675,357.70 0.7625,679.000SIKA AG-REG CHF 1,816,898.00 2.046,586.000VINCI SA EUR 3,197,524.68 3.5935,532.000
28,153,870.83 31.64
DEUTSCHE TELEKOM AG-REG EUR 2,996,459.32 3.36168,227.000Telecommunication
KONINKLIJKE KPN NV EUR 921,900.00 1.04350,000.000TELECOM ITALIA SPA EUR 1,487,381.11 1.673,550,683.000TELE2 AB-B SHS SEK 1,998,863.71 2.25173,860.000
7,404,604.14 8.32
AP MOLLER-MAERSK A/S-B DKK 875,058.83 0.98361.000Transportation
DSV PANALPINA A/S DKK 1,514,402.71 1.707,700.000GETLINK SE EUR 1,996,472.45 2.25151,823.000
4,385,933.99 4.93
KORIAN EUR 1,700,835.66 1.9154,619.000Cosmetics
SYNLAB AG EUR 1,542,752.82 1.7386,769.0003,243,588.48 3.64
ALSTOM EUR 2,203,308.47 2.4851,733.000Diversified machinery
2,203,308.47 2.48
RAI WAY SPA EUR 1,613,560.40 1.81317,630.000Entertainment
1,613,560.40 1.81
EUSKALTEL SA EUR 1,613,192.58 1.81146,921.000Media
1,613,192.58 1.81
ATLANTIA SPA EUR 689,608.47 0.7745,161.000Diversified services
NameQuantity/Nominal
Market valuein EUR
Currency %NAV
HAMBURGER HAFEN UND LOGISTIK EUR 901,127.20 1.0242,506.0001,590,735.67 1.79
SCHNEIDER ELECTRIC SE EUR 1,310,215.00 1.479,875.000Electric & Electronic
1,310,215.00 1.47
PSI SOFTWARE AG EUR 1,052,587.20 1.1831,327.000Computer software
1,052,587.20 1.18
MCPHY ENERGY SA EUR 555,103.68 0.6225,988.000Auto Parts & Equipment
555,103.68 0.62
81,922,172.87 92.05
DNCA INVEST - BEYOND CLIMATE -CLASS I SHARES EUR
EUR 1,386,000.00 1.5610,000.000
Funds
Investment fundsOpen-ended Funds
1,386,000.00 1.56
1,386,000.00 1.56
Total securities portfolio 83,308,172.87 93.61
NameQuantity/Nominal
Market valuein EUR
Currency %NAV
Summary of net assets%
NAV83,308,172.87 93.61Total securities portfolio
5,988,751.10 6.73Cash at bank
(303,266.20) (0.34)Other assets and liabilities
88,993,657.77 100.00Total net assets
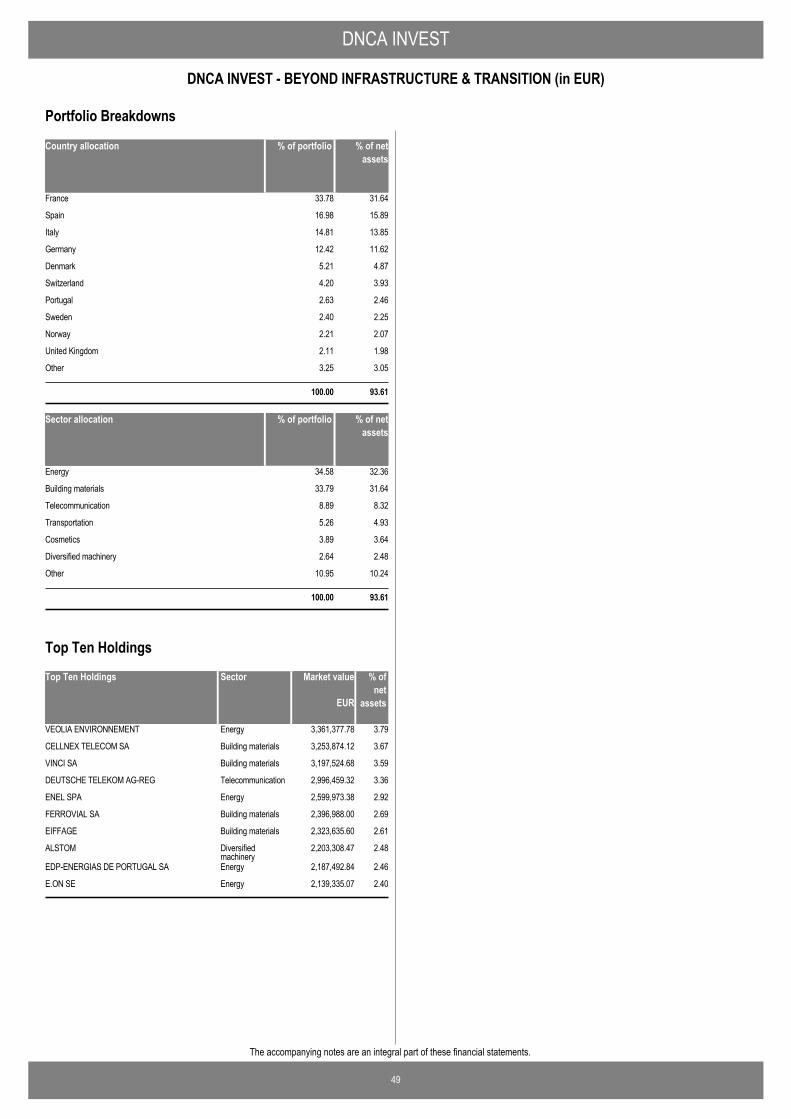
DNCA INVEST
49
DNCA INVEST - BEYOND INFRASTRUCTURE & TRANSITION (in EUR)
The accompanying notes are an integral part of these financial statements.
Country allocation % of portfolio % of netassets
France 33.78 31.64
Spain 16.98 15.89
Italy 14.81 13.85
Germany 12.42 11.62
Denmark 5.21 4.87
Switzerland 4.20 3.93
Portugal 2.63 2.46
Sweden 2.40 2.25
Norway 2.21 2.07
United Kingdom 2.11 1.98
Other 3.25 3.05
100.00 93.61
Sector allocation % of portfolio % of netassets
Energy 34.58 32.36
Building materials 33.79 31.64
Telecommunication 8.89 8.32
Transportation 5.26 4.93
Cosmetics 3.89 3.64
Diversified machinery 2.64 2.48
Other 10.95 10.24
100.00 93.61
Portfolio Breakdowns
Top Ten Holdings Market value % ofnet
assets
VEOLIA ENVIRONNEMENT 3,361,377.78 3.79Energy
CELLNEX TELECOM SA 3,253,874.12 3.67Building materials
VINCI SA 3,197,524.68 3.59Building materials
DEUTSCHE TELEKOM AG-REG 2,996,459.32 3.36Telecommunication
ENEL SPA 2,599,973.38 2.92Energy
FERROVIAL SA 2,396,988.00 2.69Building materials
EIFFAGE 2,323,635.60 2.61Building materials
ALSTOM 2,203,308.47 2.48Diversifiedmachinery
EDP-ENERGIAS DE PORTUGAL SA 2,187,492.84 2.46Energy
E.ON SE 2,139,335.07 2.40Energy
EUR
Sector
Top Ten Holdings
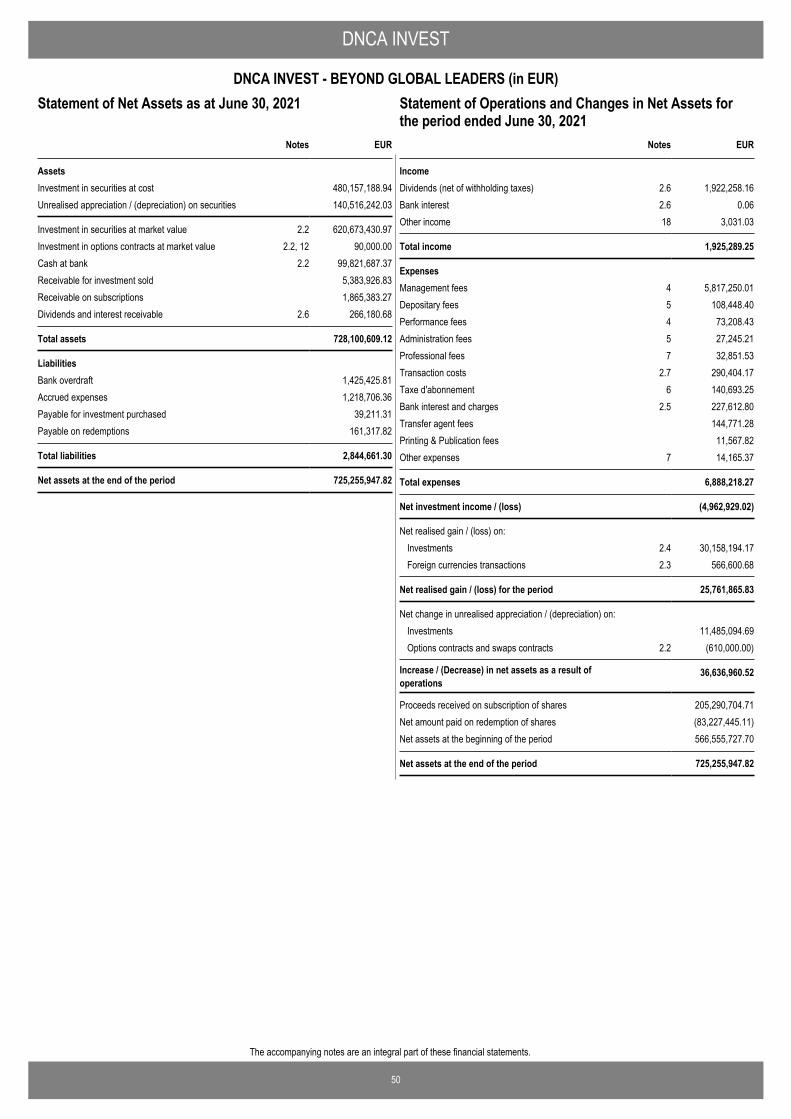
50
The accompanying notes are an integral part of these financial statements.
DNCA INVEST
DNCA INVEST - BEYOND GLOBAL LEADERS (in EUR)Statement of Operations and Changes in Net Assets for theperiod ended June 30, 2021
EUR
AssetsInvestment in securities at cost 480,157,188.94Unrealised appreciation / (depreciation) on securities 140,516,242.03
Investment in securities at market value 2.2 620,673,430.97Investment in options contracts at market value 2.2, 12 90,000.00Cash at bank 2.2 99,821,687.37Receivable for investment sold 5,383,926.83Receivable on subscriptions 1,865,383.27Dividends and interest receivable 2.6 266,180.68
Total assets 728,100,609.12
LiabilitiesBank overdraft 1,425,425.81Accrued expenses 1,218,706.36Payable for investment purchased 39,211.31Payable on redemptions 161,317.82
Total liabilities 2,844,661.30
Net assets at the end of the period 725,255,947.82
Notes
Statement of Net Assets as at June 30, 2021
IncomeDividends (net of withholding taxes) 2.6 1,922,258.16Bank interest 2.6 0.06Other income 18 3,031.03
Total income 1,925,289.25
ExpensesManagement fees 4 5,817,250.01Depositary fees 5 108,448.40Performance fees 4 73,208.43Administration fees 5 27,245.21Professional fees 7 32,851.53Transaction costs 2.7 290,404.17Taxe d'abonnement 6 140,693.25Bank interest and charges 2.5 227,612.80Transfer agent fees 144,771.28Printing & Publication fees 11,567.82Other expenses 7 14,165.37
Total expenses 6,888,218.27
Net investment income / (loss) (4,962,929.02)
Net realised gain / (loss) on: Investments 2.4 30,158,194.17Foreign currencies transactions 2.3 566,600.68
Net realised gain / (loss) for the period 25,761,865.83
Net change in unrealised appreciation / (depreciation) on: Investments 11,485,094.69Options contracts and swaps contracts 2.2 (610,000.00)
Increase / (Decrease) in net assets as a result ofoperations
36,636,960.52
Proceeds received on subscription of shares 205,290,704.71Net amount paid on redemption of shares (83,227,445.11)Net assets at the beginning of the period 566,555,727.70
Net assets at the end of the period 725,255,947.82
EURNotes
Statement of Operations and Changes in Net Assets forthe period ended June 30, 2021
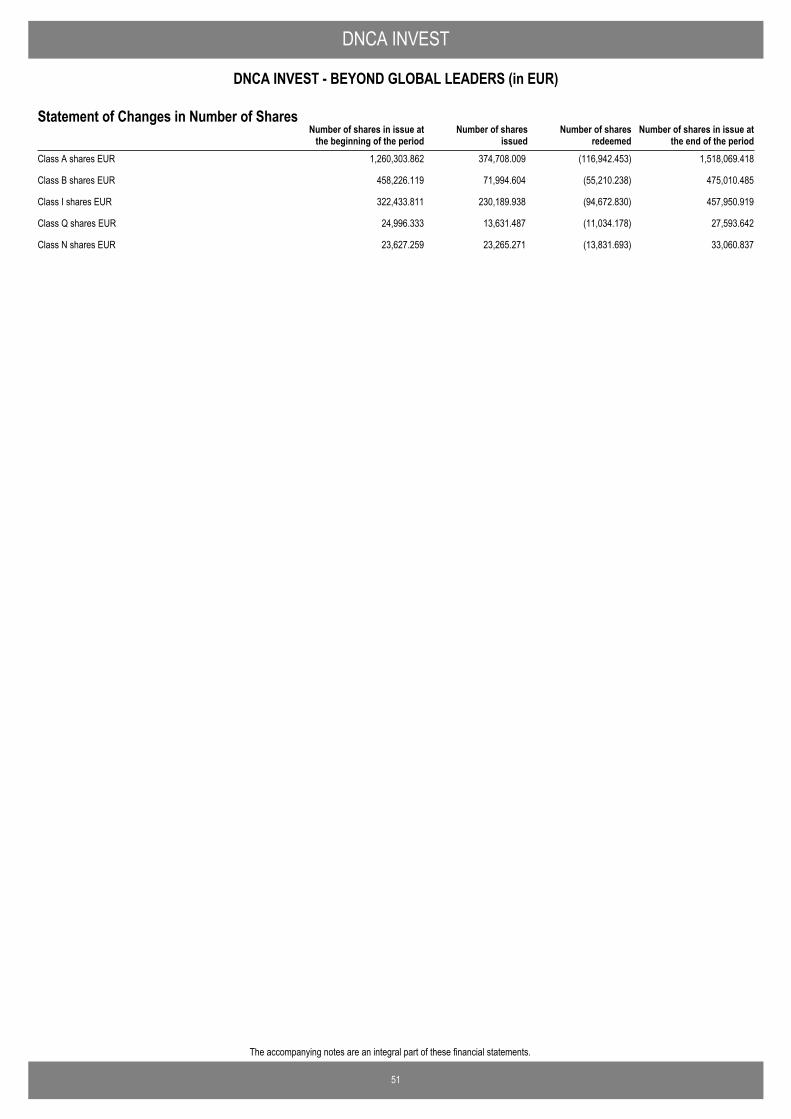
51
The accompanying notes are an integral part of these financial statements.
DNCA INVEST
DNCA INVEST - BEYOND GLOBAL LEADERS (in EUR)
Number of shares in issue atthe end of the period
Number of shares in issue atthe beginning of the period
Number of sharesissued
Number of sharesredeemed
Statement of Changes in Number of Shares
Class A shares EUR 1,260,303.862 374,708.009 (116,942.453) 1,518,069.418
Class B shares EUR 458,226.119 71,994.604 (55,210.238) 475,010.485
Class I shares EUR 322,433.811 230,189.938 (94,672.830) 457,950.919
Class Q shares EUR 24,996.333 13,631.487 (11,034.178) 27,593.642
Class N shares EUR 23,627.259 23,265.271 (13,831.693) 33,060.837
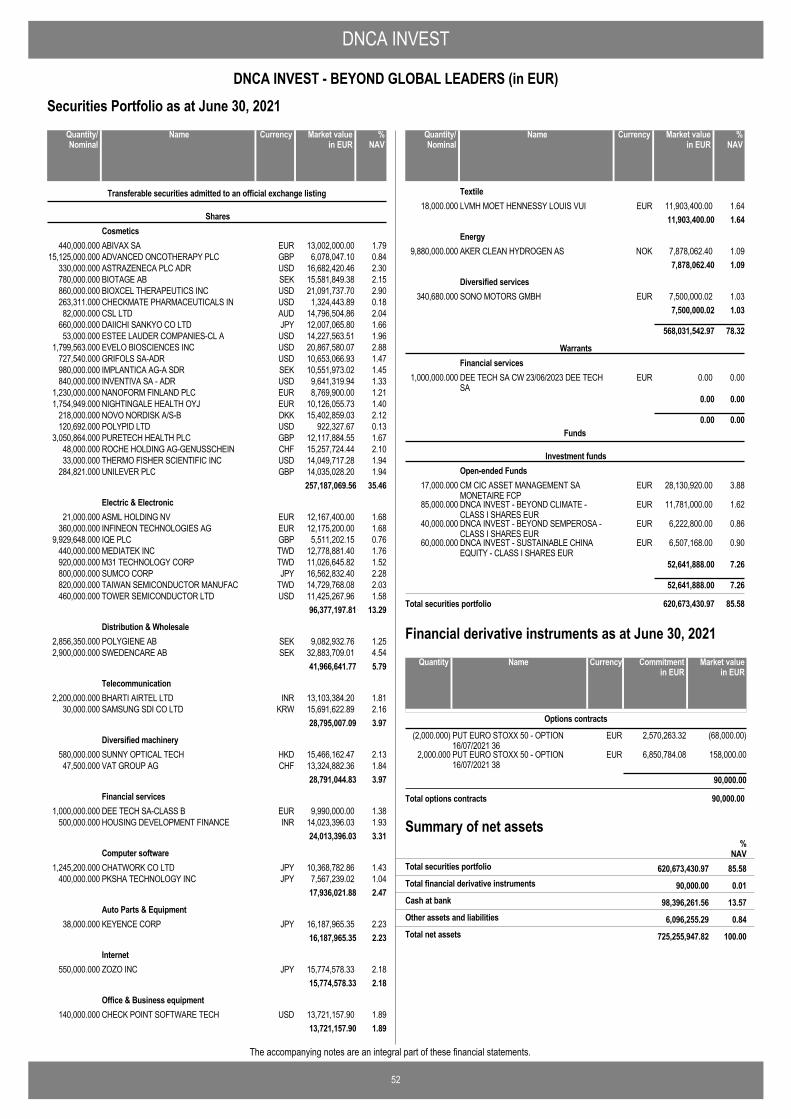
DNCA INVEST
52
DNCA INVEST - BEYOND GLOBAL LEADERS (in EUR)
The accompanying notes are an integral part of these financial statements.
Securities Portfolio as at June 30, 2021
ABIVAX SA EUR 13,002,000.00 1.79440,000.000
Transferable securities admitted to an official exchange listing
SharesCosmetics
ADVANCED ONCOTHERAPY PLC GBP 6,078,047.10 0.8415,125,000.000ASTRAZENECA PLC ADR USD 16,682,420.46 2.30330,000.000BIOTAGE AB SEK 15,581,849.38 2.15780,000.000BIOXCEL THERAPEUTICS INC USD 21,091,737.70 2.90860,000.000CHECKMATE PHARMACEUTICALS IN USD 1,324,443.89 0.18263,311.000CSL LTD AUD 14,796,504.86 2.0482,000.000DAIICHI SANKYO CO LTD JPY 12,007,065.80 1.66660,000.000ESTEE LAUDER COMPANIES-CL A USD 14,227,563.51 1.9653,000.000EVELO BIOSCIENCES INC USD 20,867,580.07 2.881,799,563.000GRIFOLS SA-ADR USD 10,653,066.93 1.47727,540.000IMPLANTICA AG-A SDR SEK 10,551,973.02 1.45980,000.000INVENTIVA SA - ADR USD 9,641,319.94 1.33840,000.000NANOFORM FINLAND PLC EUR 8,769,900.00 1.211,230,000.000NIGHTINGALE HEALTH OYJ EUR 10,126,055.73 1.401,754,949.000NOVO NORDISK A/S-B DKK 15,402,859.03 2.12218,000.000POLYPID LTD USD 922,327.67 0.13120,692.000PURETECH HEALTH PLC GBP 12,117,884.55 1.673,050,864.000ROCHE HOLDING AG-GENUSSCHEIN CHF 15,257,724.44 2.1048,000.000THERMO FISHER SCIENTIFIC INC USD 14,049,717.28 1.9433,000.000UNILEVER PLC GBP 14,035,028.20 1.94284,821.000
257,187,069.56 35.46
ASML HOLDING NV EUR 12,167,400.00 1.6821,000.000Electric & Electronic
INFINEON TECHNOLOGIES AG EUR 12,175,200.00 1.68360,000.000IQE PLC GBP 5,511,202.15 0.769,929,648.000MEDIATEK INC TWD 12,778,881.40 1.76440,000.000M31 TECHNOLOGY CORP TWD 11,026,645.82 1.52920,000.000SUMCO CORP JPY 16,562,832.40 2.28800,000.000TAIWAN SEMICONDUCTOR MANUFAC TWD 14,729,768.08 2.03820,000.000TOWER SEMICONDUCTOR LTD USD 11,425,267.96 1.58460,000.000
96,377,197.81 13.29
POLYGIENE AB SEK 9,082,932.76 1.252,856,350.000Distribution & Wholesale
SWEDENCARE AB SEK 32,883,709.01 4.542,900,000.00041,966,641.77 5.79
BHARTI AIRTEL LTD INR 13,103,384.20 1.812,200,000.000Telecommunication
SAMSUNG SDI CO LTD KRW 15,691,622.89 2.1630,000.00028,795,007.09 3.97
SUNNY OPTICAL TECH HKD 15,466,162.47 2.13580,000.000Diversified machinery
VAT GROUP AG CHF 13,324,882.36 1.8447,500.00028,791,044.83 3.97
DEE TECH SA-CLASS B EUR 9,990,000.00 1.381,000,000.000Financial services
HOUSING DEVELOPMENT FINANCE INR 14,023,396.03 1.93500,000.00024,013,396.03 3.31
CHATWORK CO LTD JPY 10,368,782.86 1.431,245,200.000Computer software
PKSHA TECHNOLOGY INC JPY 7,567,239.02 1.04400,000.00017,936,021.88 2.47
KEYENCE CORP JPY 16,187,965.35 2.2338,000.000Auto Parts & Equipment
16,187,965.35 2.23
ZOZO INC JPY 15,774,578.33 2.18550,000.000Internet
15,774,578.33 2.18
CHECK POINT SOFTWARE TECH USD 13,721,157.90 1.89140,000.000Office & Business equipment
13,721,157.90 1.89
NameQuantity/Nominal
Market valuein EUR
Currency %NAV
LVMH MOET HENNESSY LOUIS VUI EUR 11,903,400.00 1.6418,000.000Textile
11,903,400.00 1.64
AKER CLEAN HYDROGEN AS NOK 7,878,062.40 1.099,880,000.000Energy
7,878,062.40 1.09
SONO MOTORS GMBH EUR 7,500,000.02 1.03340,680.000Diversified services
7,500,000.02 1.03
568,031,542.97 78.32
DEE TECH SA CW 23/06/2023 DEE TECHSA
EUR 0.00 0.001,000,000.000
WarrantsFinancial services
0.00 0.00
0.00 0.00
CM CIC ASSET MANAGEMENT SAMONETAIRE FCP
EUR 28,130,920.00 3.8817,000.000
Funds
Investment fundsOpen-ended Funds
DNCA INVEST - BEYOND CLIMATE -CLASS I SHARES EUR
EUR 11,781,000.00 1.6285,000.000
DNCA INVEST - BEYOND SEMPEROSA -CLASS I SHARES EUR
EUR 6,222,800.00 0.8640,000.000
DNCA INVEST - SUSTAINABLE CHINAEQUITY - CLASS I SHARES EUR
EUR 6,507,168.00 0.9060,000.000
52,641,888.00 7.26
52,641,888.00 7.26
Total securities portfolio 620,673,430.97 85.58
NameQuantity/Nominal
Market valuein EUR
Currency %NAV
PUT EURO STOXX 50 - OPTION16/07/2021 36
EUR(2,000.000) 2,570,263.32 (68,000.00)
Options contracts
PUT EURO STOXX 50 - OPTION16/07/2021 38
EUR2,000.000 6,850,784.08 158,000.00
90,000.00
Total options contracts 90,000.00
NameQuantity Market valuein EUR
Currency Commitmentin EUR
Financial derivative instruments as at June 30, 2021
Summary of net assets
90,000.00 0.01Total financial derivative instruments
%NAV
620,673,430.97 85.58Total securities portfolio
98,396,261.56 13.57Cash at bank
6,096,255.29 0.84Other assets and liabilities
725,255,947.82 100.00Total net assets
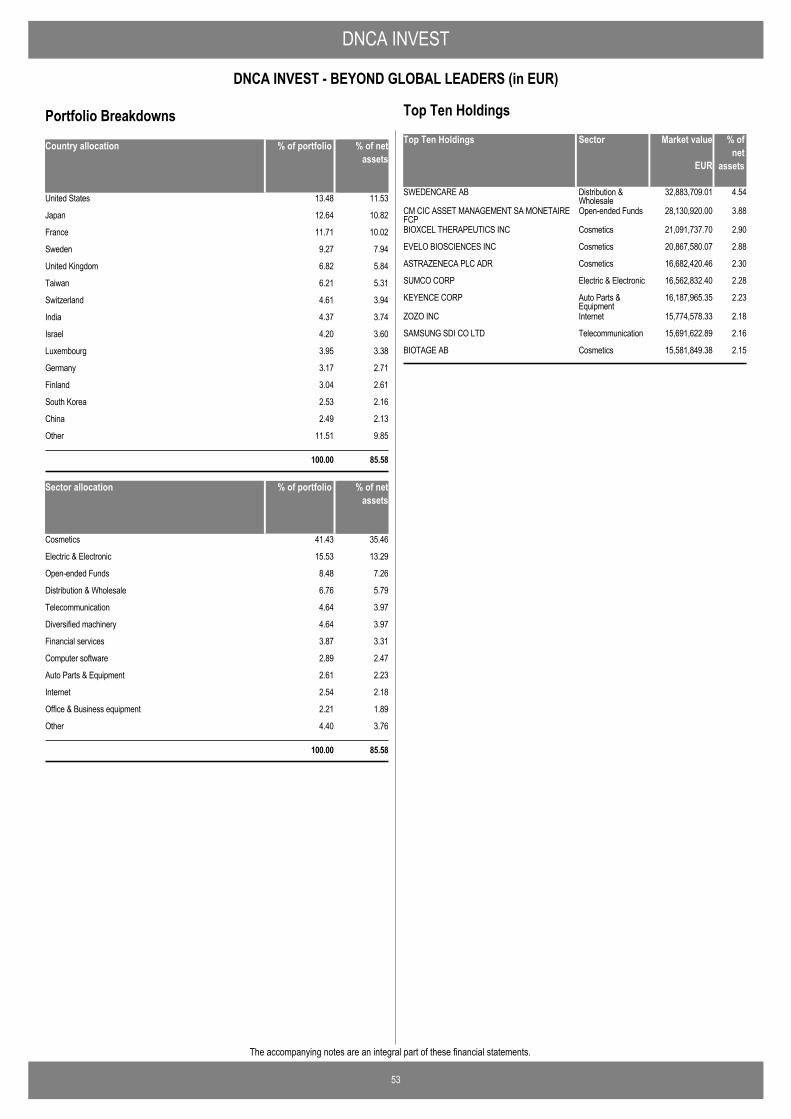
DNCA INVEST
53
DNCA INVEST - BEYOND GLOBAL LEADERS (in EUR)
The accompanying notes are an integral part of these financial statements.
Country allocation % of portfolio % of netassets
United States 13.48 11.53
Japan 12.64 10.82
France 11.71 10.02
Sweden 9.27 7.94
United Kingdom 6.82 5.84
Taiwan 6.21 5.31
Switzerland 4.61 3.94
India 4.37 3.74
Israel 4.20 3.60
Luxembourg 3.95 3.38
Germany 3.17 2.71
Finland 3.04 2.61
South Korea 2.53 2.16
China 2.49 2.13
Other 11.51 9.85
100.00 85.58
Sector allocation % of portfolio % of netassets
Cosmetics 41.43 35.46
Electric & Electronic 15.53 13.29
Open-ended Funds 8.48 7.26
Distribution & Wholesale 6.76 5.79
Telecommunication 4.64 3.97
Diversified machinery 4.64 3.97
Financial services 3.87 3.31
Computer software 2.89 2.47
Auto Parts & Equipment 2.61 2.23
Internet 2.54 2.18
Office & Business equipment 2.21 1.89
Other 4.40 3.76
100.00 85.58
Portfolio BreakdownsTop Ten Holdings Market value % of
netassets
SWEDENCARE AB 32,883,709.01 4.54Distribution &Wholesale
CM CIC ASSET MANAGEMENT SA MONETAIREFCP
28,130,920.00 3.88Open-ended Funds
BIOXCEL THERAPEUTICS INC 21,091,737.70 2.90Cosmetics
EVELO BIOSCIENCES INC 20,867,580.07 2.88Cosmetics
ASTRAZENECA PLC ADR 16,682,420.46 2.30Cosmetics
SUMCO CORP 16,562,832.40 2.28Electric & Electronic
KEYENCE CORP 16,187,965.35 2.23Auto Parts &Equipment
ZOZO INC 15,774,578.33 2.18Internet
SAMSUNG SDI CO LTD 15,691,622.89 2.16Telecommunication
BIOTAGE AB 15,581,849.38 2.15Cosmetics
EUR
Sector
Top Ten Holdings

54
The accompanying notes are an integral part of these financial statements.
DNCA INVEST
DNCA INVEST - CONVERTIBLES (in EUR)Statement of Operations and Changes in Net Assets for theperiod ended June 30, 2021
EUR
AssetsInvestment in securities at cost 502,288,404.79Unrealised appreciation / (depreciation) on securities 15,049,060.07
Investment in securities at market value 2.2 517,337,464.86Cash at bank 2.2 4,673,797.56Receivable on subscriptions 36,698.55Dividends and interest receivable 2.6 644,742.74
Total assets 522,692,703.71
LiabilitiesBank overdraft 182.06Accrued expenses 549,451.15Payable on redemptions 72,618.47Net unrealised depreciation on futures contracts 2.2, 11 1,231,512.15
Total liabilities 1,853,763.83
Net assets at the end of the period 520,838,939.88
Notes
Statement of Net Assets as at June 30, 2021
IncomeInterest on bonds 2.6 1,173,785.73Bank interest 2.6 0.99
Total income 1,173,786.72
ExpensesManagement fees 4 2,831,839.49Depositary fees 5 80,437.90Administration fees 5 32,690.65Professional fees 7 25,591.52Transaction costs 2.7 1,882.90Taxe d'abonnement 6 53,127.90Bank interest and charges 2.5 23,339.95Transfer agent fees 96,154.79Printing & Publication fees 14,321.66Other expenses 7 3,054.84
Total expenses 3,162,441.60
Net investment income / (loss) (1,988,654.88)
Net realised gain / (loss) on: Investments 2.4 19,052,375.51Foreign currencies transactions 2.3 17,287.28Futures contracts 2.2 (269,519.90)
Net realised gain / (loss) for the period 16,811,488.01
Net change in unrealised appreciation / (depreciation) on: Investments (12,166,236.48)Futures contracts 2.2 (1,686,522.37)
Increase / (Decrease) in net assets as a result ofoperations
2,958,729.16
Proceeds received on subscription of shares 37,137,925.65Net amount paid on redemption of shares (63,476,158.66)Net assets at the beginning of the period 544,218,443.73
Net assets at the end of the period 520,838,939.88
EURNotes
Statement of Operations and Changes in Net Assets forthe period ended June 30, 2021
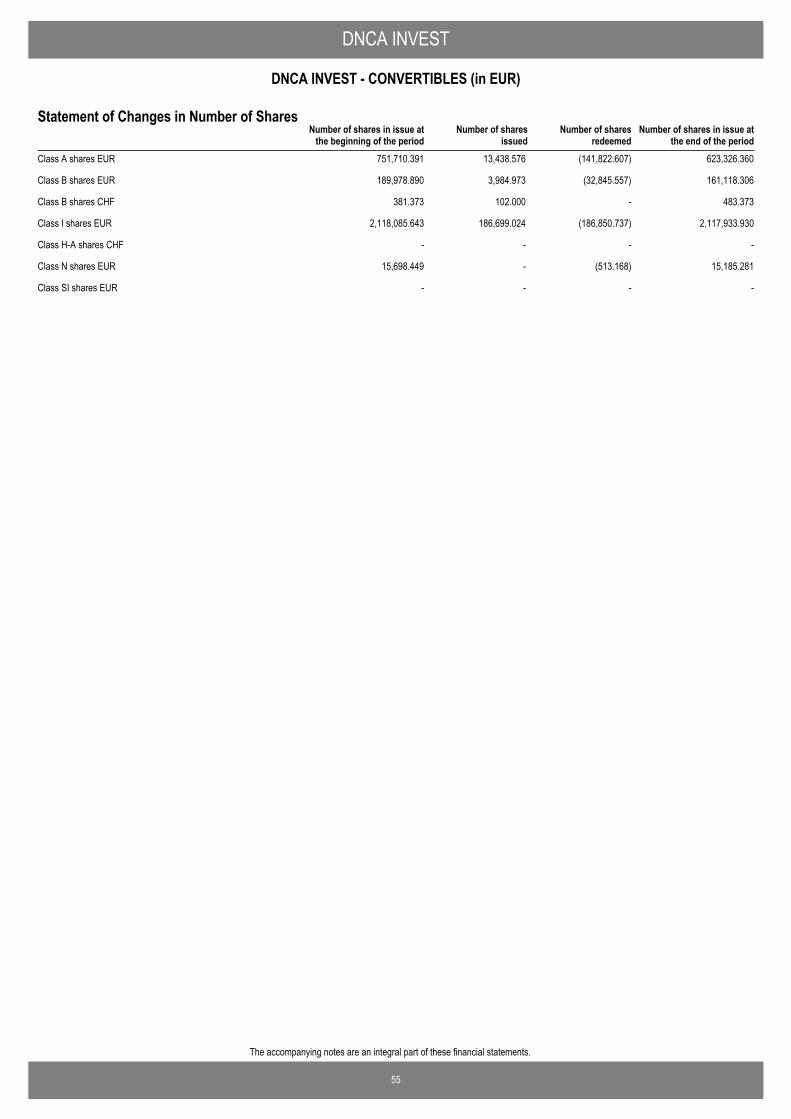
55
The accompanying notes are an integral part of these financial statements.
DNCA INVEST
DNCA INVEST - CONVERTIBLES (in EUR)
Number of shares in issue atthe end of the period
Number of shares in issue atthe beginning of the period
Number of sharesissued
Number of sharesredeemed
Statement of Changes in Number of Shares
Class A shares EUR 751,710.391 13,438.576 (141,822.607) 623,326.360
Class B shares EUR 189,978.890 3,984.973 (32,845.557) 161,118.306
Class B shares CHF 381.373 102.000 - 483.373
Class I shares EUR 2,118,085.643 186,699.024 (186,850.737) 2,117,933.930
Class H-A shares CHF - - - -
Class N shares EUR 15,698.449 - (513.168) 15,185.281
Class SI shares EUR - - - -
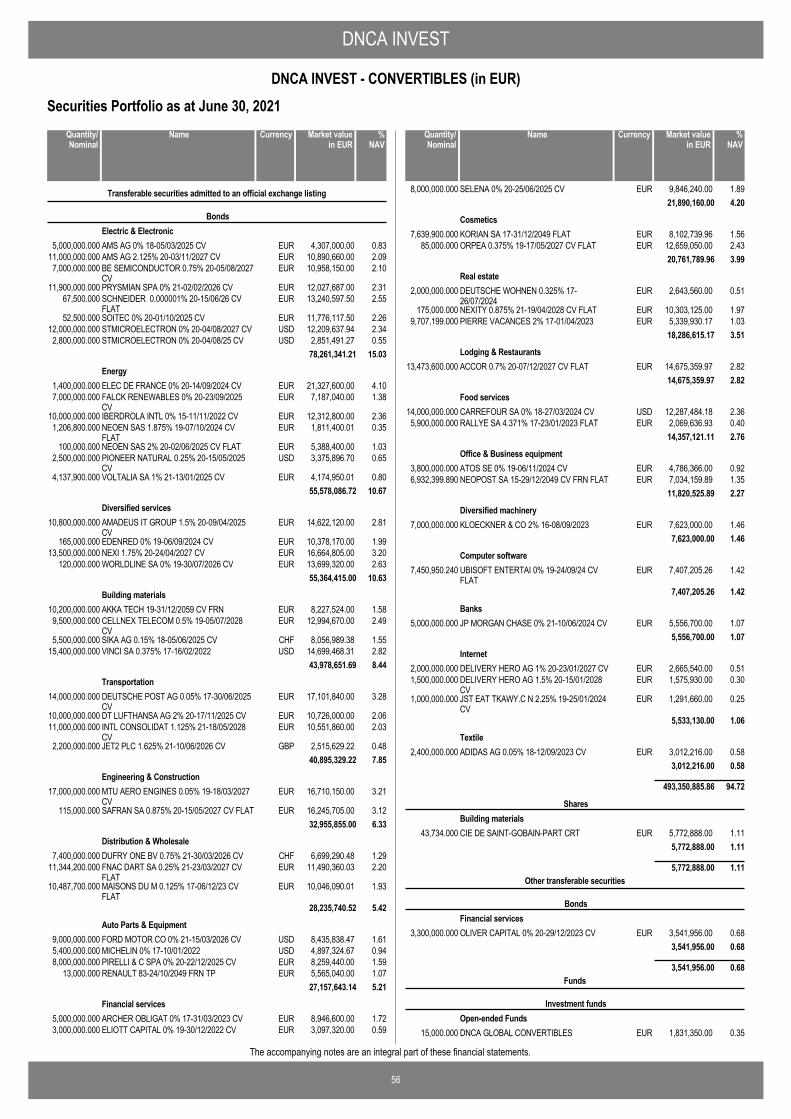
DNCA INVEST
56
DNCA INVEST - CONVERTIBLES (in EUR)
The accompanying notes are an integral part of these financial statements.
Securities Portfolio as at June 30, 2021
AMS AG 0% 18-05/03/2025 CV EUR 4,307,000.00 0.835,000,000.000
Transferable securities admitted to an official exchange listing
BondsElectric & Electronic
AMS AG 2.125% 20-03/11/2027 CV EUR 10,890,660.00 2.0911,000,000.000BE SEMICONDUCTOR 0.75% 20-05/08/2027CV
EUR 10,958,150.00 2.107,000,000.000
PRYSMIAN SPA 0% 21-02/02/2026 CV EUR 12,027,687.00 2.3111,900,000.000SCHNEIDER 0.000001% 20-15/06/26 CVFLAT
EUR 13,240,597.50 2.5567,500.000
SOITEC 0% 20-01/10/2025 CV EUR 11,776,117.50 2.2652,500.000STMICROELECTRON 0% 20-04/08/2027 CV USD 12,209,637.94 2.3412,000,000.000STMICROELECTRON 0% 20-04/08/25 CV USD 2,851,491.27 0.552,800,000.000
78,261,341.21 15.03
ELEC DE FRANCE 0% 20-14/09/2024 CV EUR 21,327,600.00 4.101,400,000.000Energy
FALCK RENEWABLES 0% 20-23/09/2025CV
EUR 7,187,040.00 1.387,000,000.000
IBERDROLA INTL 0% 15-11/11/2022 CV EUR 12,312,800.00 2.3610,000,000.000NEOEN SAS 1.875% 19-07/10/2024 CVFLAT
EUR 1,811,400.01 0.351,206,800.000
NEOEN SAS 2% 20-02/06/2025 CV FLAT EUR 5,388,400.00 1.03100,000.000PIONEER NATURAL 0.25% 20-15/05/2025CV
USD 3,375,896.70 0.652,500,000.000
VOLTALIA SA 1% 21-13/01/2025 CV EUR 4,174,950.01 0.804,137,900.00055,578,086.72 10.67
AMADEUS IT GROUP 1.5% 20-09/04/2025CV
EUR 14,622,120.00 2.8110,800,000.000Diversified services
EDENRED 0% 19-06/09/2024 CV EUR 10,378,170.00 1.99165,000.000NEXI 1.75% 20-24/04/2027 CV EUR 16,664,805.00 3.2013,500,000.000WORLDLINE SA 0% 19-30/07/2026 CV EUR 13,699,320.00 2.63120,000.000
55,364,415.00 10.63
AKKA TECH 19-31/12/2059 CV FRN EUR 8,227,524.00 1.5810,200,000.000Building materials
CELLNEX TELECOM 0.5% 19-05/07/2028CV
EUR 12,994,670.00 2.499,500,000.000
SIKA AG 0.15% 18-05/06/2025 CV CHF 8,056,989.38 1.555,500,000.000VINCI SA 0.375% 17-16/02/2022 USD 14,699,468.31 2.8215,400,000.000
43,978,651.69 8.44
DEUTSCHE POST AG 0.05% 17-30/06/2025CV
EUR 17,101,840.00 3.2814,000,000.000Transportation
DT LUFTHANSA AG 2% 20-17/11/2025 CV EUR 10,726,000.00 2.0610,000,000.000INTL CONSOLIDAT 1.125% 21-18/05/2028CV
EUR 10,551,860.00 2.0311,000,000.000
JET2 PLC 1.625% 21-10/06/2026 CV GBP 2,515,629.22 0.482,200,000.00040,895,329.22 7.85
MTU AERO ENGINES 0.05% 19-18/03/2027CV
EUR 16,710,150.00 3.2117,000,000.000Engineering & Construction
SAFRAN SA 0.875% 20-15/05/2027 CV FLAT EUR 16,245,705.00 3.12115,000.00032,955,855.00 6.33
DUFRY ONE BV 0.75% 21-30/03/2026 CV CHF 6,699,290.48 1.297,400,000.000Distribution & Wholesale
FNAC DART SA 0.25% 21-23/03/2027 CVFLAT
EUR 11,490,360.03 2.2011,344,200.000
MAISONS DU M 0.125% 17-06/12/23 CVFLAT
EUR 10,046,090.01 1.9310,487,700.000
28,235,740.52 5.42
FORD MOTOR CO 0% 21-15/03/2026 CV USD 8,435,838.47 1.619,000,000.000Auto Parts & Equipment
MICHELIN 0% 17-10/01/2022 USD 4,897,324.67 0.945,400,000.000PIRELLI & C SPA 0% 20-22/12/2025 CV EUR 8,259,440.00 1.598,000,000.000RENAULT 83-24/10/2049 FRN TP EUR 5,565,040.00 1.0713,000.000
27,157,643.14 5.21
ARCHER OBLIGAT 0% 17-31/03/2023 CV EUR 8,946,600.00 1.725,000,000.000Financial services
ELIOTT CAPITAL 0% 19-30/12/2022 CV EUR 3,097,320.00 0.593,000,000.000
NameQuantity/Nominal
Market valuein EUR
Currency %NAV
SELENA 0% 20-25/06/2025 CV EUR 9,846,240.00 1.898,000,000.00021,890,160.00 4.20
KORIAN SA 17-31/12/2049 FLAT EUR 8,102,739.96 1.567,639,900.000Cosmetics
ORPEA 0.375% 19-17/05/2027 CV FLAT EUR 12,659,050.00 2.4385,000.00020,761,789.96 3.99
DEUTSCHE WOHNEN 0.325% 17-26/07/2024
EUR 2,643,560.00 0.512,000,000.000Real estate
NEXITY 0.875% 21-19/04/2028 CV FLAT EUR 10,303,125.00 1.97175,000.000PIERRE VACANCES 2% 17-01/04/2023 EUR 5,339,930.17 1.039,707,199.000
18,286,615.17 3.51
ACCOR 0.7% 20-07/12/2027 CV FLAT EUR 14,675,359.97 2.8213,473,600.000Lodging & Restaurants
14,675,359.97 2.82
CARREFOUR SA 0% 18-27/03/2024 CV USD 12,287,484.18 2.3614,000,000.000Food services
RALLYE SA 4.371% 17-23/01/2023 FLAT EUR 2,069,636.93 0.405,900,000.00014,357,121.11 2.76
ATOS SE 0% 19-06/11/2024 CV EUR 4,786,366.00 0.923,800,000.000Office & Business equipment
NEOPOST SA 15-29/12/2049 CV FRN FLAT EUR 7,034,159.89 1.356,932,399.89011,820,525.89 2.27
KLOECKNER & CO 2% 16-08/09/2023 EUR 7,623,000.00 1.467,000,000.000Diversified machinery
7,623,000.00 1.46
UBISOFT ENTERTAI 0% 19-24/09/24 CVFLAT
EUR 7,407,205.26 1.427,450,950.240Computer software
7,407,205.26 1.42
JP MORGAN CHASE 0% 21-10/06/2024 CV EUR 5,556,700.00 1.075,000,000.000Banks
5,556,700.00 1.07
DELIVERY HERO AG 1% 20-23/01/2027 CV EUR 2,665,540.00 0.512,000,000.000Internet
DELIVERY HERO AG 1.5% 20-15/01/2028CV
EUR 1,575,930.00 0.301,500,000.000
JST EAT TKAWY.C N 2.25% 19-25/01/2024CV
EUR 1,291,660.00 0.251,000,000.000
5,533,130.00 1.06
ADIDAS AG 0.05% 18-12/09/2023 CV EUR 3,012,216.00 0.582,400,000.000Textile
3,012,216.00 0.58
493,350,885.86 94.72
CIE DE SAINT-GOBAIN-PART CRT EUR 5,772,888.00 1.1143,734.000
SharesBuilding materials
5,772,888.00 1.11
5,772,888.00 1.11
OLIVER CAPITAL 0% 20-29/12/2023 CV EUR 3,541,956.00 0.683,300,000.000
Other transferable securities
BondsFinancial services
3,541,956.00 0.68
3,541,956.00 0.68
DNCA GLOBAL CONVERTIBLES EUR 1,831,350.00 0.3515,000.000
Funds
Investment fundsOpen-ended Funds
NameQuantity/Nominal
Market valuein EUR
Currency %NAV
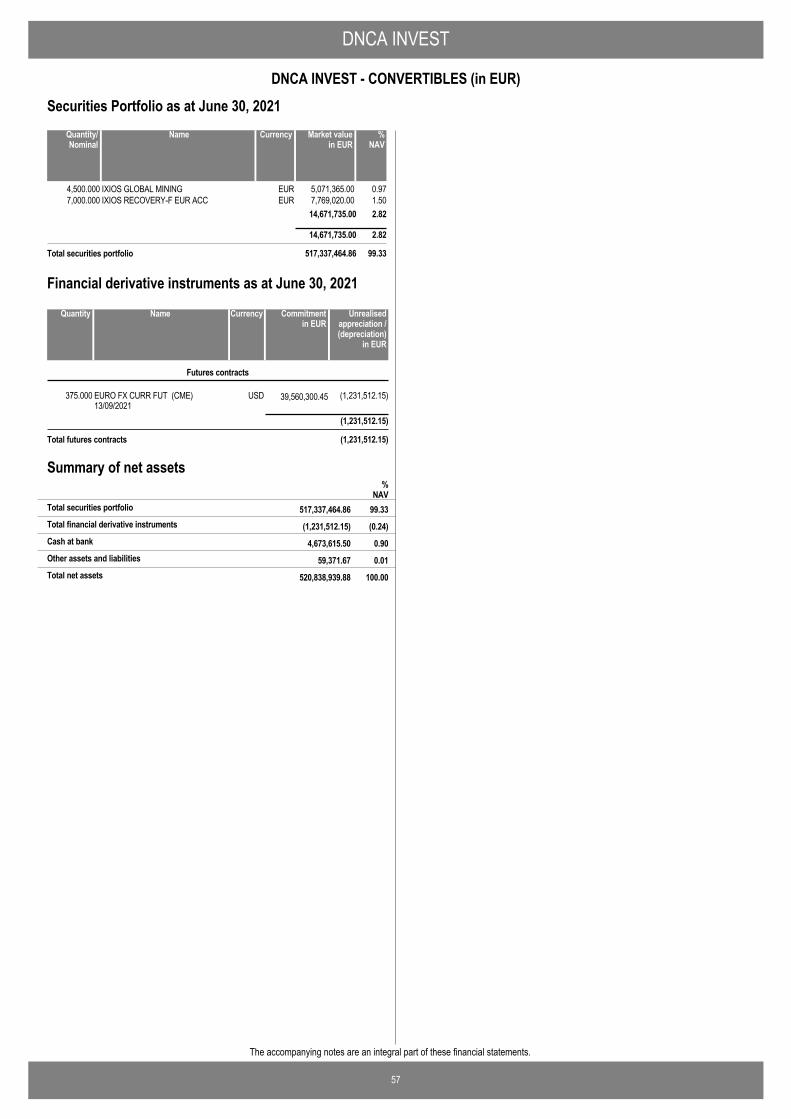
DNCA INVEST
57
DNCA INVEST - CONVERTIBLES (in EUR)
The accompanying notes are an integral part of these financial statements.
Securities Portfolio as at June 30, 2021
IXIOS GLOBAL MINING EUR 5,071,365.00 0.974,500.000IXIOS RECOVERY-F EUR ACC EUR 7,769,020.00 1.507,000.000
14,671,735.00 2.82
14,671,735.00 2.82
Total securities portfolio 517,337,464.86 99.33
NameQuantity/Nominal
Market valuein EUR
Currency %NAV
EURO FX CURR FUT (CME)13/09/2021
USD 39,560,300.45375.000 (1,231,512.15)
Futures contracts
(1,231,512.15)
Total futures contracts (1,231,512.15)
NameQuantity Commitmentin EUR
Currency Unrealisedappreciation /(depreciation)
in EUR
Financial derivative instruments as at June 30, 2021
Summary of net assets
(1,231,512.15) (0.24)Total financial derivative instruments
%NAV
517,337,464.86 99.33Total securities portfolio
4,673,615.50 0.90Cash at bank
59,371.67 0.01Other assets and liabilities
520,838,939.88 100.00Total net assets
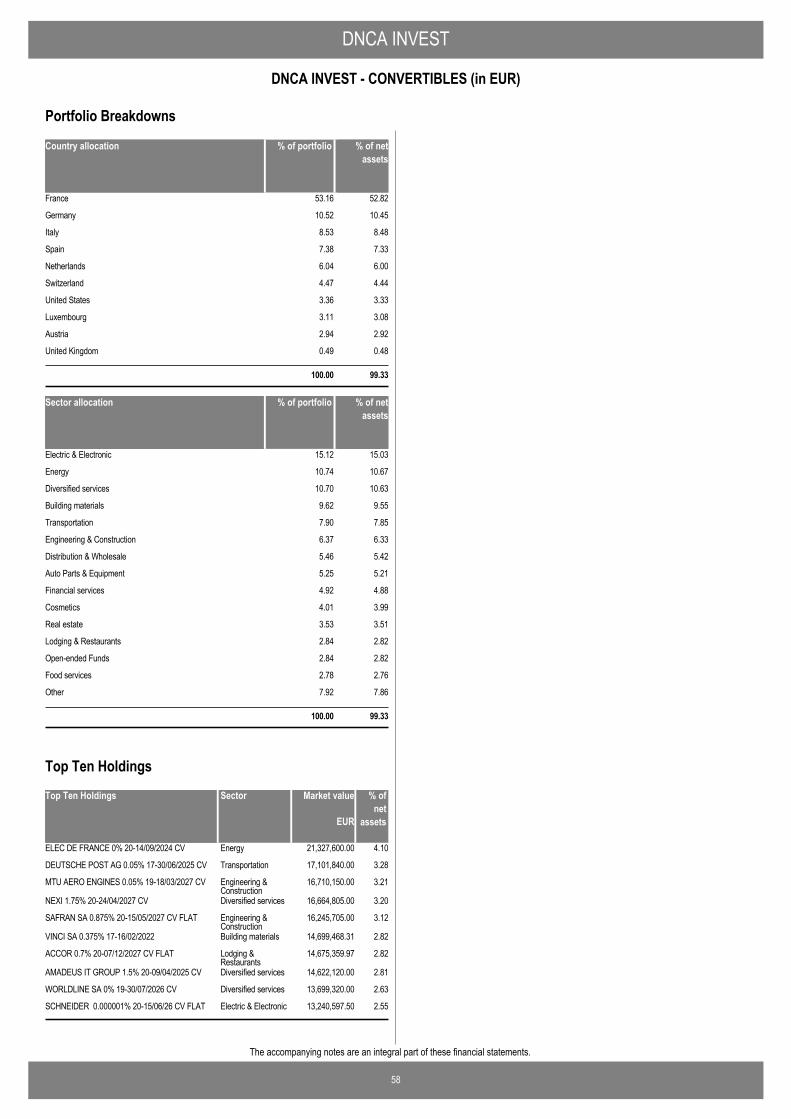
DNCA INVEST
58
DNCA INVEST - CONVERTIBLES (in EUR)
The accompanying notes are an integral part of these financial statements.
Country allocation % of portfolio % of netassets
France 53.16 52.82
Germany 10.52 10.45
Italy 8.53 8.48
Spain 7.38 7.33
Netherlands 6.04 6.00
Switzerland 4.47 4.44
United States 3.36 3.33
Luxembourg 3.11 3.08
Austria 2.94 2.92
United Kingdom 0.49 0.48
100.00 99.33
Sector allocation % of portfolio % of netassets
Electric & Electronic 15.12 15.03
Energy 10.74 10.67
Diversified services 10.70 10.63
Building materials 9.62 9.55
Transportation 7.90 7.85
Engineering & Construction 6.37 6.33
Distribution & Wholesale 5.46 5.42
Auto Parts & Equipment 5.25 5.21
Financial services 4.92 4.88
Cosmetics 4.01 3.99
Real estate 3.53 3.51
Lodging & Restaurants 2.84 2.82
Open-ended Funds 2.84 2.82
Food services 2.78 2.76
Other 7.92 7.86
100.00 99.33
Portfolio Breakdowns
Top Ten Holdings Market value % ofnet
assets
ELEC DE FRANCE 0% 20-14/09/2024 CV 21,327,600.00 4.10Energy
DEUTSCHE POST AG 0.05% 17-30/06/2025 CV 17,101,840.00 3.28Transportation
MTU AERO ENGINES 0.05% 19-18/03/2027 CV 16,710,150.00 3.21Engineering &Construction
NEXI 1.75% 20-24/04/2027 CV 16,664,805.00 3.20Diversified services
SAFRAN SA 0.875% 20-15/05/2027 CV FLAT 16,245,705.00 3.12Engineering &Construction
VINCI SA 0.375% 17-16/02/2022 14,699,468.31 2.82Building materials
ACCOR 0.7% 20-07/12/2027 CV FLAT 14,675,359.97 2.82Lodging &Restaurants
AMADEUS IT GROUP 1.5% 20-09/04/2025 CV 14,622,120.00 2.81Diversified services
WORLDLINE SA 0% 19-30/07/2026 CV 13,699,320.00 2.63Diversified services
SCHNEIDER 0.000001% 20-15/06/26 CV FLAT 13,240,597.50 2.55Electric & Electronic
EUR
Sector
Top Ten Holdings
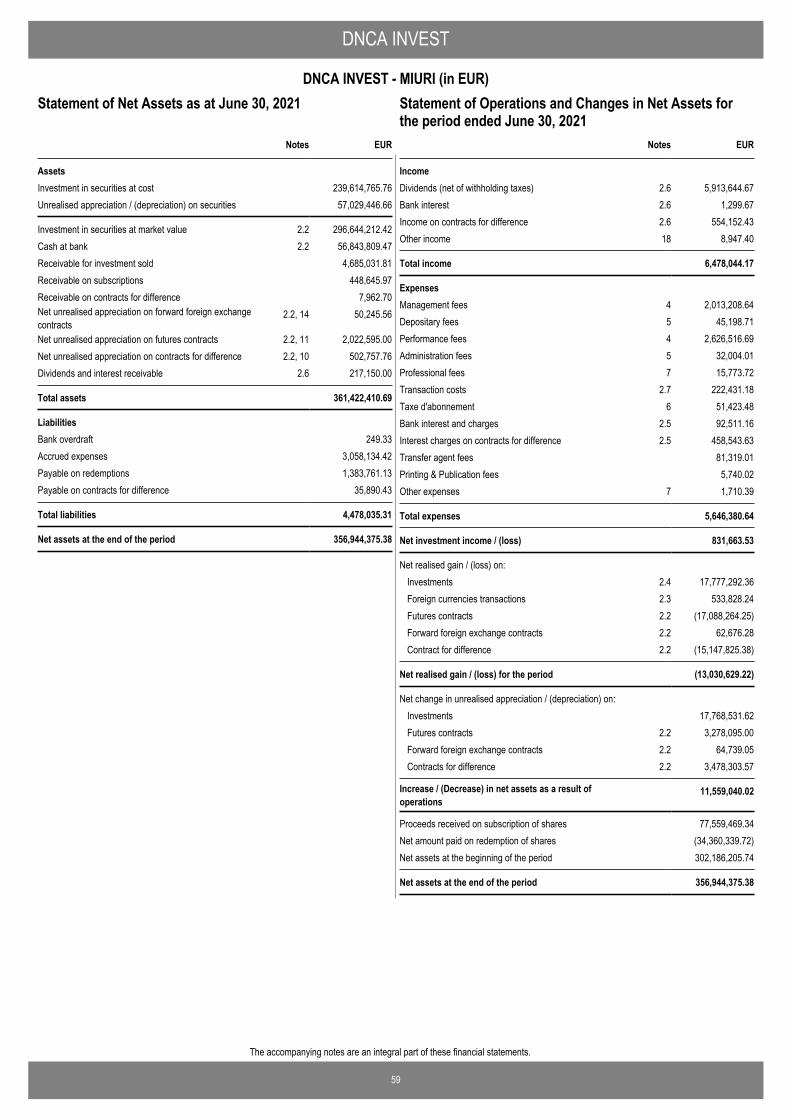
59
The accompanying notes are an integral part of these financial statements.
DNCA INVEST
DNCA INVEST - MIURI (in EUR)Statement of Operations and Changes in Net Assets for theperiod ended June 30, 2021
EUR
AssetsInvestment in securities at cost 239,614,765.76Unrealised appreciation / (depreciation) on securities 57,029,446.66
Investment in securities at market value 2.2 296,644,212.42Cash at bank 2.2 56,843,809.47Receivable for investment sold 4,685,031.81Receivable on subscriptions 448,645.97Receivable on contracts for difference 7,962.70Net unrealised appreciation on forward foreign exchangecontracts
2.2, 14 50,245.56
Net unrealised appreciation on futures contracts 2.2, 11 2,022,595.00Net unrealised appreciation on contracts for difference 2.2, 10 502,757.76Dividends and interest receivable 2.6 217,150.00
Total assets 361,422,410.69
LiabilitiesBank overdraft 249.33Accrued expenses 3,058,134.42Payable on redemptions 1,383,761.13Payable on contracts for difference 35,890.43
Total liabilities 4,478,035.31
Net assets at the end of the period 356,944,375.38
Notes
Statement of Net Assets as at June 30, 2021
IncomeDividends (net of withholding taxes) 2.6 5,913,644.67Bank interest 2.6 1,299.67Income on contracts for difference 2.6 554,152.43Other income 18 8,947.40
Total income 6,478,044.17
ExpensesManagement fees 4 2,013,208.64Depositary fees 5 45,198.71Performance fees 4 2,626,516.69Administration fees 5 32,004.01Professional fees 7 15,773.72Transaction costs 2.7 222,431.18Taxe d'abonnement 6 51,423.48Bank interest and charges 2.5 92,511.16Interest charges on contracts for difference 2.5 458,543.63Transfer agent fees 81,319.01Printing & Publication fees 5,740.02Other expenses 7 1,710.39
Total expenses 5,646,380.64
Net investment income / (loss) 831,663.53
Net realised gain / (loss) on: Investments 2.4 17,777,292.36Foreign currencies transactions 2.3 533,828.24Futures contracts 2.2 (17,088,264.25)Forward foreign exchange contracts 2.2 62,676.28Contract for difference 2.2 (15,147,825.38)
Net realised gain / (loss) for the period (13,030,629.22)
Net change in unrealised appreciation / (depreciation) on: Investments 17,768,531.62Futures contracts 2.2 3,278,095.00Forward foreign exchange contracts 2.2 64,739.05Contracts for difference 2.2 3,478,303.57
Increase / (Decrease) in net assets as a result ofoperations
11,559,040.02
Proceeds received on subscription of shares 77,559,469.34Net amount paid on redemption of shares (34,360,339.72)Net assets at the beginning of the period 302,186,205.74
Net assets at the end of the period 356,944,375.38
EURNotes
Statement of Operations and Changes in Net Assets forthe period ended June 30, 2021
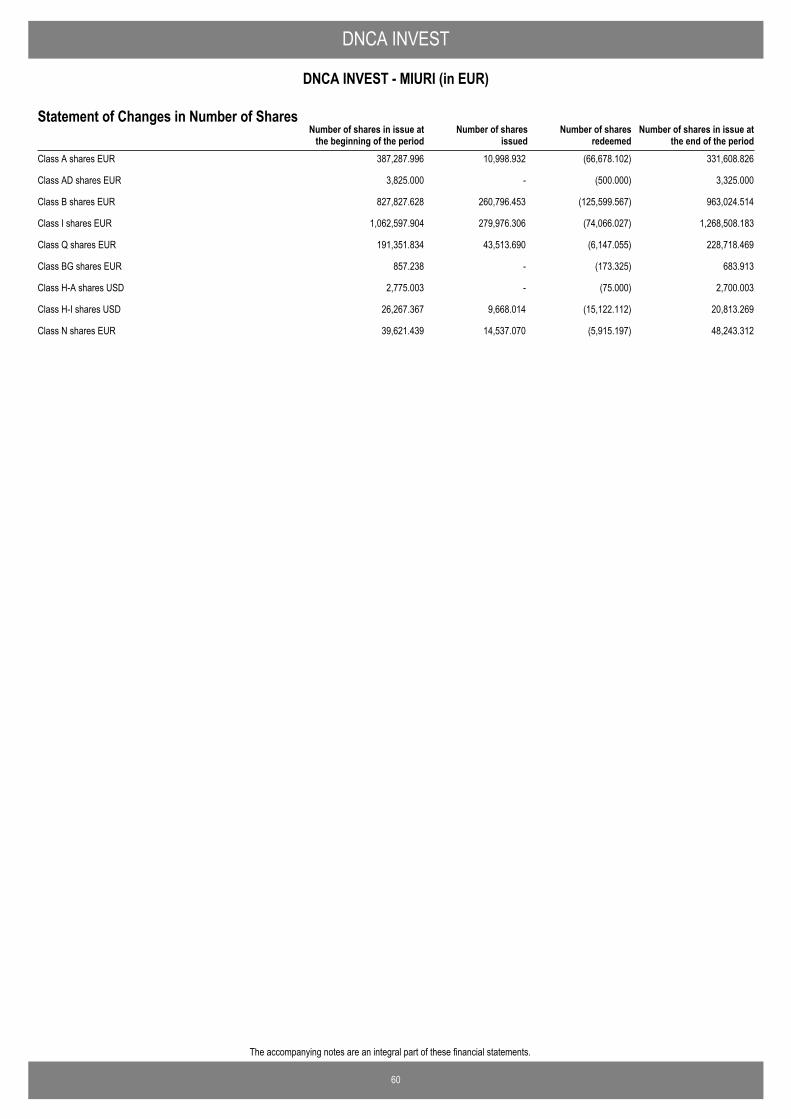
60
The accompanying notes are an integral part of these financial statements.
DNCA INVEST
DNCA INVEST - MIURI (in EUR)
Number of shares in issue atthe end of the period
Number of shares in issue atthe beginning of the period
Number of sharesissued
Number of sharesredeemed
Statement of Changes in Number of Shares
Class A shares EUR 387,287.996 10,998.932 (66,678.102) 331,608.826
Class AD shares EUR 3,825.000 - (500.000) 3,325.000
Class B shares EUR 827,827.628 260,796.453 (125,599.567) 963,024.514
Class I shares EUR 1,062,597.904 279,976.306 (74,066.027) 1,268,508.183
Class Q shares EUR 191,351.834 43,513.690 (6,147.055) 228,718.469
Class BG shares EUR 857.238 - (173.325) 683.913
Class H-A shares USD 2,775.003 - (75.000) 2,700.003
Class H-I shares USD 26,267.367 9,668.014 (15,122.112) 20,813.269
Class N shares EUR 39,621.439 14,537.070 (5,915.197) 48,243.312
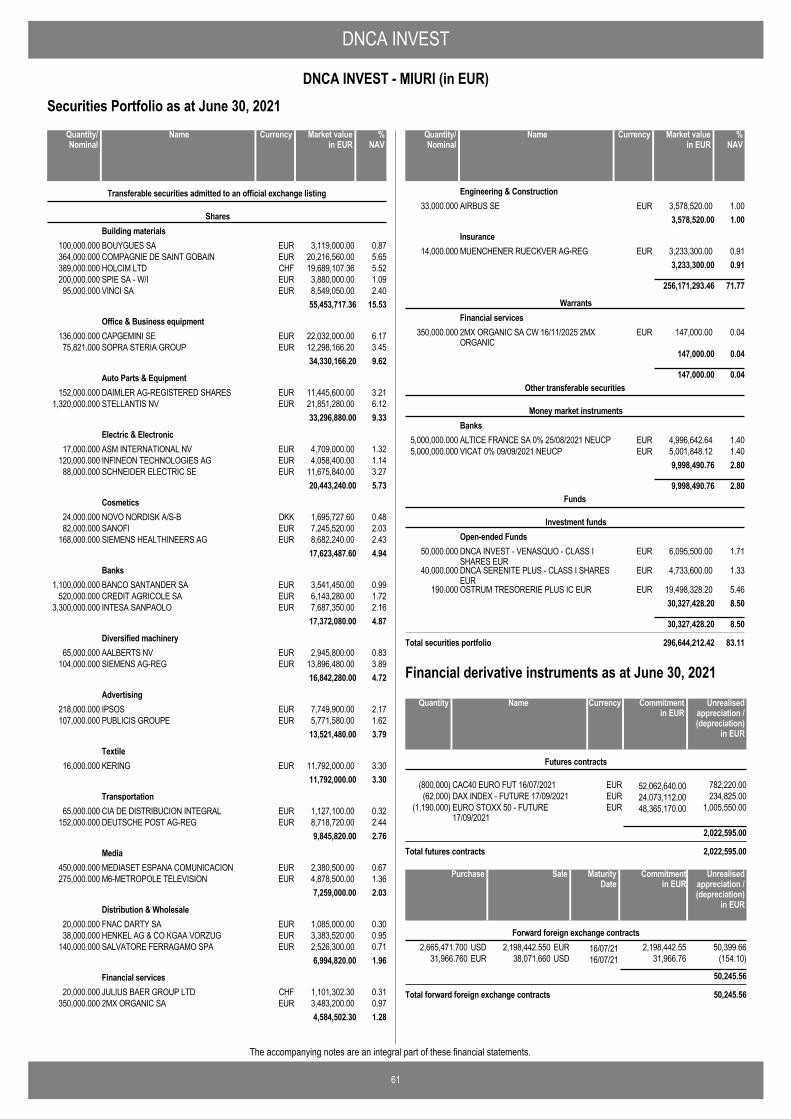
DNCA INVEST
61
DNCA INVEST - MIURI (in EUR)
The accompanying notes are an integral part of these financial statements.
Securities Portfolio as at June 30, 2021
BOUYGUES SA EUR 3,119,000.00 0.87100,000.000
Transferable securities admitted to an official exchange listing
SharesBuilding materials
COMPAGNIE DE SAINT GOBAIN EUR 20,216,560.00 5.65364,000.000HOLCIM LTD CHF 19,689,107.36 5.52389,000.000SPIE SA - W/I EUR 3,880,000.00 1.09200,000.000VINCI SA EUR 8,549,050.00 2.4095,000.000
55,453,717.36 15.53
CAPGEMINI SE EUR 22,032,000.00 6.17136,000.000Office & Business equipment
SOPRA STERIA GROUP EUR 12,298,166.20 3.4575,821.00034,330,166.20 9.62
DAIMLER AG-REGISTERED SHARES EUR 11,445,600.00 3.21152,000.000Auto Parts & Equipment
STELLANTIS NV EUR 21,851,280.00 6.121,320,000.00033,296,880.00 9.33
ASM INTERNATIONAL NV EUR 4,709,000.00 1.3217,000.000Electric & Electronic
INFINEON TECHNOLOGIES AG EUR 4,058,400.00 1.14120,000.000SCHNEIDER ELECTRIC SE EUR 11,675,840.00 3.2788,000.000
20,443,240.00 5.73
NOVO NORDISK A/S-B DKK 1,695,727.60 0.4824,000.000Cosmetics
SANOFI EUR 7,245,520.00 2.0382,000.000SIEMENS HEALTHINEERS AG EUR 8,682,240.00 2.43168,000.000
17,623,487.60 4.94
BANCO SANTANDER SA EUR 3,541,450.00 0.991,100,000.000Banks
CREDIT AGRICOLE SA EUR 6,143,280.00 1.72520,000.000INTESA SANPAOLO EUR 7,687,350.00 2.163,300,000.000
17,372,080.00 4.87
AALBERTS NV EUR 2,945,800.00 0.8365,000.000Diversified machinery
SIEMENS AG-REG EUR 13,896,480.00 3.89104,000.00016,842,280.00 4.72
IPSOS EUR 7,749,900.00 2.17218,000.000Advertising
PUBLICIS GROUPE EUR 5,771,580.00 1.62107,000.00013,521,480.00 3.79
KERING EUR 11,792,000.00 3.3016,000.000Textile
11,792,000.00 3.30
CIA DE DISTRIBUCION INTEGRAL EUR 1,127,100.00 0.3265,000.000Transportation
DEUTSCHE POST AG-REG EUR 8,718,720.00 2.44152,000.0009,845,820.00 2.76
MEDIASET ESPANA COMUNICACION EUR 2,380,500.00 0.67450,000.000Media
M6-METROPOLE TELEVISION EUR 4,878,500.00 1.36275,000.0007,259,000.00 2.03
FNAC DARTY SA EUR 1,085,000.00 0.3020,000.000Distribution & Wholesale
HENKEL AG & CO KGAA VORZUG EUR 3,383,520.00 0.9538,000.000SALVATORE FERRAGAMO SPA EUR 2,526,300.00 0.71140,000.000
6,994,820.00 1.96
JULIUS BAER GROUP LTD CHF 1,101,302.30 0.3120,000.000Financial services
2MX ORGANIC SA EUR 3,483,200.00 0.97350,000.0004,584,502.30 1.28
NameQuantity/Nominal
Market valuein EUR
Currency %NAV
AIRBUS SE EUR 3,578,520.00 1.0033,000.000Engineering & Construction
3,578,520.00 1.00
MUENCHENER RUECKVER AG-REG EUR 3,233,300.00 0.9114,000.000Insurance
3,233,300.00 0.91
256,171,293.46 71.77
2MX ORGANIC SA CW 16/11/2025 2MXORGANIC
EUR 147,000.00 0.04350,000.000
WarrantsFinancial services
147,000.00 0.04
147,000.00 0.04
ALTICE FRANCE SA 0% 25/08/2021 NEUCP EUR 4,996,642.64 1.405,000,000.000
Other transferable securities
Money market instrumentsBanks
VICAT 0% 09/09/2021 NEUCP EUR 5,001,848.12 1.405,000,000.0009,998,490.76 2.80
9,998,490.76 2.80
DNCA INVEST - VENASQUO - CLASS ISHARES EUR
EUR 6,095,500.00 1.7150,000.000
Funds
Investment fundsOpen-ended Funds
DNCA SERENITE PLUS - CLASS I SHARESEUR
EUR 4,733,600.00 1.3340,000.000
OSTRUM TRESORERIE PLUS IC EUR EUR 19,498,328.20 5.46190.00030,327,428.20 8.50
30,327,428.20 8.50
Total securities portfolio 296,644,212.42 83.11
NameQuantity/Nominal
Market valuein EUR
Currency %NAV
CAC40 EURO FUT 16/07/2021 EUR 52,062,640.00(800.000) 782,220.00
Futures contracts
DAX INDEX - FUTURE 17/09/2021 EUR 24,073,112.00(62.000) 234,825.00EURO STOXX 50 - FUTURE17/09/2021
EUR 48,365,170.00(1,190.000) 1,005,550.00
2,022,595.00
Total futures contracts 2,022,595.00
NameQuantity Commitmentin EUR
Currency Unrealisedappreciation /(depreciation)
in EUR
Financial derivative instruments as at June 30, 2021
2,198,442.550 16/07/212,665,471.700 50,399.66EURUSD 2,198,442.55Forward foreign exchange contracts
38,071.660 16/07/2131,966.760 (154.10)USDEUR 31,966.76
50,245.56
Total forward foreign exchange contracts 50,245.56
SalePurchase Unrealisedappreciation /(depreciation)
in EUR
MaturityDate
Commitmentin EUR
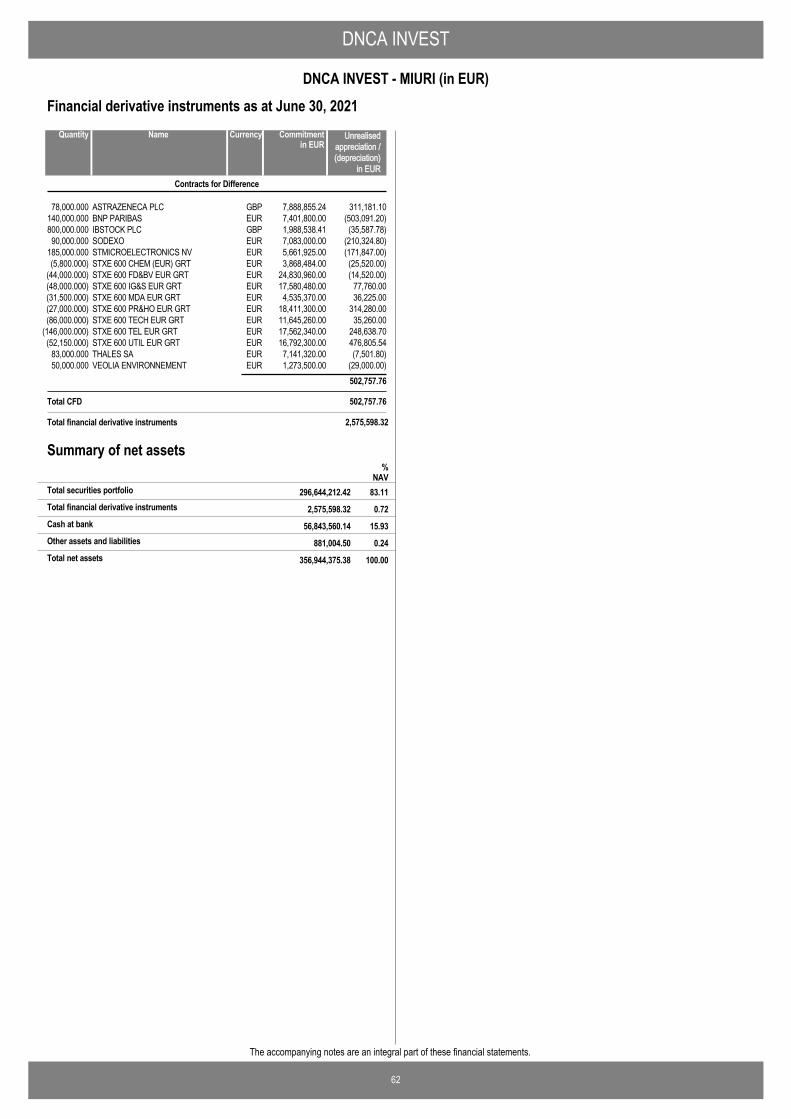
DNCA INVEST
62
DNCA INVEST - MIURI (in EUR)
The accompanying notes are an integral part of these financial statements.
ASTRAZENECA PLC GBP 311,181.107,888,855.2478,000.000
Contracts for Difference
NameQuantity Unrealisedappreciation /(depreciation)
in EUR
Currency Commitmentin EUR
BNP PARIBAS EUR (503,091.20)7,401,800.00140,000.000IBSTOCK PLC GBP (35,587.78)1,988,538.41800,000.000SODEXO EUR (210,324.80)7,083,000.0090,000.000STMICROELECTRONICS NV EUR (171,847.00)5,661,925.00185,000.000STXE 600 CHEM (EUR) GRT EUR (25,520.00)3,868,484.00(5,800.000)STXE 600 FD&BV EUR GRT EUR (14,520.00)24,830,960.00(44,000.000)STXE 600 IG&S EUR GRT EUR 77,760.0017,580,480.00(48,000.000)STXE 600 MDA EUR GRT EUR 36,225.004,535,370.00(31,500.000)STXE 600 PR&HO EUR GRT EUR 314,280.0018,411,300.00(27,000.000)STXE 600 TECH EUR GRT EUR 35,260.0011,645,260.00(86,000.000)STXE 600 TEL EUR GRT EUR 248,638.7017,562,340.00(146,000.000)STXE 600 UTIL EUR GRT EUR 476,805.5416,792,300.00(52,150.000)THALES SA EUR (7,501.80)7,141,320.0083,000.000VEOLIA ENVIRONNEMENT EUR (29,000.00)1,273,500.0050,000.000
502,757.76
Total CFD 502,757.76
Financial derivative instruments as at June 30, 2021
Total financial derivative instruments 2,575,598.32
Summary of net assets
2,575,598.32 0.72Total financial derivative instruments
%NAV
296,644,212.42 83.11Total securities portfolio
56,843,560.14 15.93Cash at bank
881,004.50 0.24Other assets and liabilities
356,944,375.38 100.00Total net assets
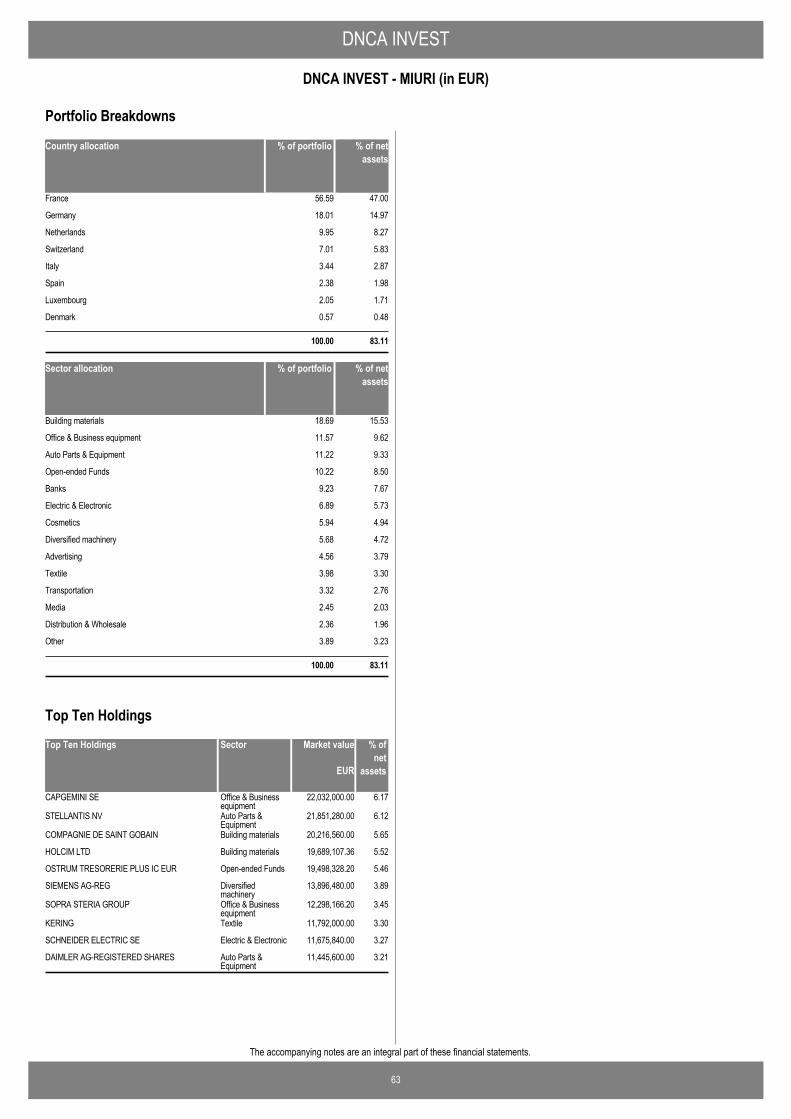
DNCA INVEST
63
DNCA INVEST - MIURI (in EUR)
The accompanying notes are an integral part of these financial statements.
Country allocation % of portfolio % of netassets
France 56.59 47.00
Germany 18.01 14.97
Netherlands 9.95 8.27
Switzerland 7.01 5.83
Italy 3.44 2.87
Spain 2.38 1.98
Luxembourg 2.05 1.71
Denmark 0.57 0.48
100.00 83.11
Sector allocation % of portfolio % of netassets
Building materials 18.69 15.53
Office & Business equipment 11.57 9.62
Auto Parts & Equipment 11.22 9.33
Open-ended Funds 10.22 8.50
Banks 9.23 7.67
Electric & Electronic 6.89 5.73
Cosmetics 5.94 4.94
Diversified machinery 5.68 4.72
Advertising 4.56 3.79
Textile 3.98 3.30
Transportation 3.32 2.76
Media 2.45 2.03
Distribution & Wholesale 2.36 1.96
Other 3.89 3.23
100.00 83.11
Portfolio Breakdowns
Top Ten Holdings Market value % ofnet
assets
CAPGEMINI SE 22,032,000.00 6.17Office & Businessequipment
STELLANTIS NV 21,851,280.00 6.12Auto Parts &Equipment
COMPAGNIE DE SAINT GOBAIN 20,216,560.00 5.65Building materials
HOLCIM LTD 19,689,107.36 5.52Building materials
OSTRUM TRESORERIE PLUS IC EUR 19,498,328.20 5.46Open-ended Funds
SIEMENS AG-REG 13,896,480.00 3.89Diversifiedmachinery
SOPRA STERIA GROUP 12,298,166.20 3.45Office & Businessequipment
KERING 11,792,000.00 3.30Textile
SCHNEIDER ELECTRIC SE 11,675,840.00 3.27Electric & Electronic
DAIMLER AG-REGISTERED SHARES 11,445,600.00 3.21Auto Parts &Equipment
EUR
Sector
Top Ten Holdings

64
The accompanying notes are an integral part of these financial statements.
DNCA INVEST
DNCA INVEST - SRI EUROPE GROWTH (formerly DNCA INVEST - EUROPE GROWTH until February 8, 2021) (in EUR)Statement of Operations and Changes in Net Assets for theperiod ended June 30, 2021
EUR
AssetsInvestment in securities at cost 991,364,955.14Unrealised appreciation / (depreciation) on securities 844,549,211.41
Investment in securities at market value 2.2 1,835,914,166.55Cash at bank 2.2 30,967,072.88Receivable on subscriptions 1,358,734.80Net unrealised appreciation on forward foreign exchangecontracts
2.2, 14 311,369.59
Total assets 1,868,551,343.82
LiabilitiesBank overdraft 445.33Accrued expenses 17,254,524.11Payable on redemptions 874,769.78Other payable 837.73
Total liabilities 18,130,576.95
Net assets at the end of the period 1,850,420,766.87
Notes
Statement of Net Assets as at June 30, 2021
IncomeDividends (net of withholding taxes) 2.6 10,882,856.63Bank interest 2.6 9.05
Total income 10,882,865.68
ExpensesManagement fees 4 9,243,159.27Depositary fees 5 216,010.55Performance fees 4 15,426,857.32Administration fees 5 34,773.85Professional fees 7 79,411.80Transaction costs 2.7 530,974.98Taxe d'abonnement 6 152,467.97Bank interest and charges 2.5 65,944.09Transfer agent fees 269,739.30Printing & Publication fees 47,215.15Other expenses 7 13,445.14
Total expenses 26,079,999.42
Net investment income / (loss) (15,197,133.74)
Net realised gain / (loss) on: Investments 2.4 64,201,685.67Foreign currencies transactions 2.3 (181,158.00)Forward foreign exchange contracts 2.2 299,100.94
Net realised gain / (loss) for the period 49,122,494.87
Net change in unrealised appreciation / (depreciation) on: Investments 242,362,378.07Forward foreign exchange contracts 2.2 397,057.04
Increase / (Decrease) in net assets as a result ofoperations
291,881,929.98
Proceeds received on subscription of shares 630,443,864.13Net amount paid on redemption of shares (664,447,848.57)Dividend distribution 13 (8,000.00)Net assets at the beginning of the period 1,592,550,821.33
Net assets at the end of the period 1,850,420,766.87
EURNotes
Statement of Operations and Changes in Net Assets forthe period ended June 30, 2021
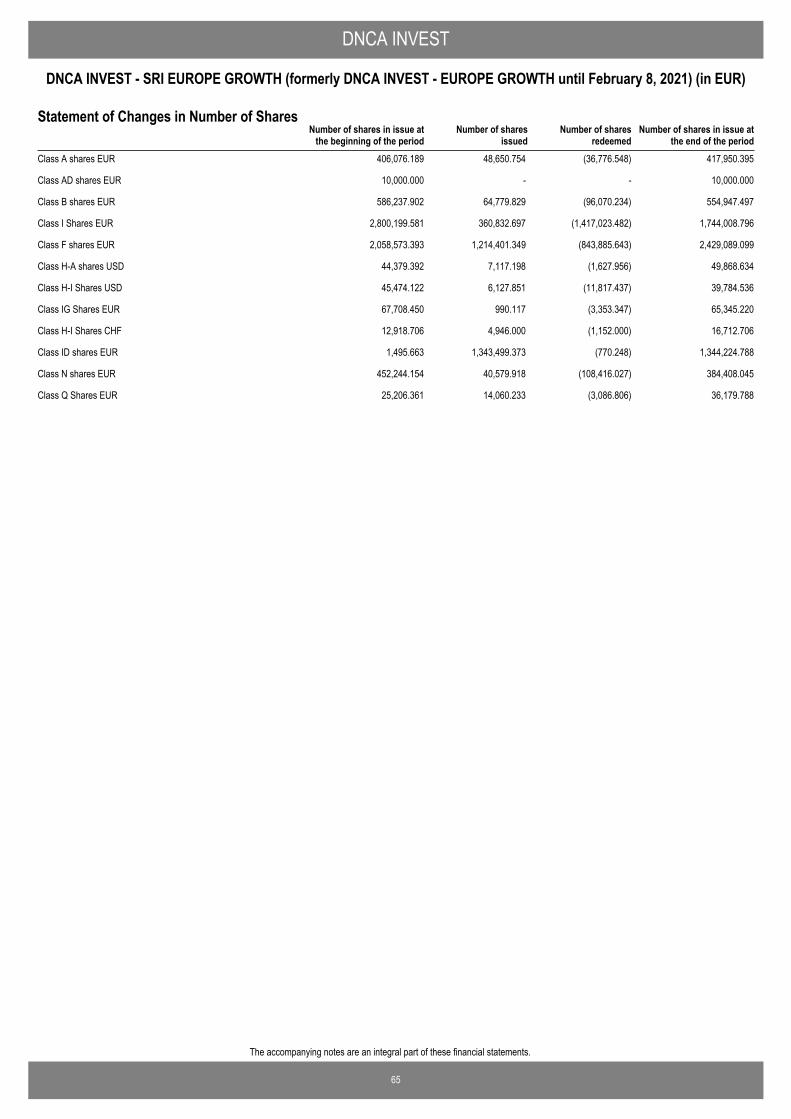
65
The accompanying notes are an integral part of these financial statements.
DNCA INVEST
DNCA INVEST - SRI EUROPE GROWTH (formerly DNCA INVEST - EUROPE GROWTH until February 8, 2021) (in EUR)
Number of shares in issue atthe end of the period
Number of shares in issue atthe beginning of the period
Number of sharesissued
Number of sharesredeemed
Statement of Changes in Number of Shares
Class A shares EUR 406,076.189 48,650.754 (36,776.548) 417,950.395
Class AD shares EUR 10,000.000 - - 10,000.000
Class B shares EUR 586,237.902 64,779.829 (96,070.234) 554,947.497
Class I Shares EUR 2,800,199.581 360,832.697 (1,417,023.482) 1,744,008.796
Class F shares EUR 2,058,573.393 1,214,401.349 (843,885.643) 2,429,089.099
Class H-A shares USD 44,379.392 7,117.198 (1,627.956) 49,868.634
Class H-I Shares USD 45,474.122 6,127.851 (11,817.437) 39,784.536
Class IG Shares EUR 67,708.450 990.117 (3,353.347) 65,345.220
Class H-I Shares CHF 12,918.706 4,946.000 (1,152.000) 16,712.706
Class ID shares EUR 1,495.663 1,343,499.373 (770.248) 1,344,224.788
Class N shares EUR 452,244.154 40,579.918 (108,416.027) 384,408.045
Class Q Shares EUR 25,206.361 14,060.233 (3,086.806) 36,179.788
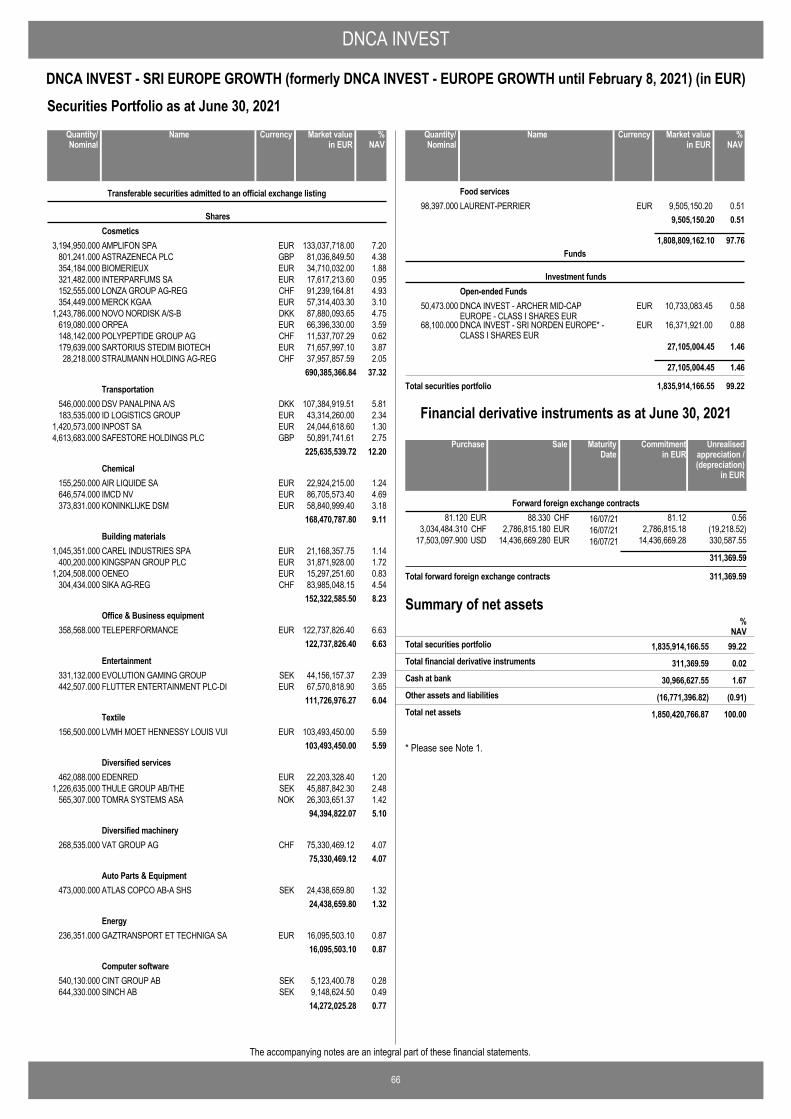
DNCA INVEST
66
DNCA INVEST - SRI EUROPE GROWTH (formerly DNCA INVEST - EUROPE GROWTH until February 8, 2021) (in EUR)
The accompanying notes are an integral part of these financial statements.
Securities Portfolio as at June 30, 2021
AMPLIFON SPA EUR 133,037,718.00 7.203,194,950.000
Transferable securities admitted to an official exchange listing
SharesCosmetics
ASTRAZENECA PLC GBP 81,036,849.50 4.38801,241.000BIOMERIEUX EUR 34,710,032.00 1.88354,184.000INTERPARFUMS SA EUR 17,617,213.60 0.95321,482.000LONZA GROUP AG-REG CHF 91,239,164.81 4.93152,555.000MERCK KGAA EUR 57,314,403.30 3.10354,449.000NOVO NORDISK A/S-B DKK 87,880,093.65 4.751,243,786.000ORPEA EUR 66,396,330.00 3.59619,080.000POLYPEPTIDE GROUP AG CHF 11,537,707.29 0.62148,142.000SARTORIUS STEDIM BIOTECH EUR 71,657,997.10 3.87179,639.000STRAUMANN HOLDING AG-REG CHF 37,957,857.59 2.0528,218.000
690,385,366.84 37.32
DSV PANALPINA A/S DKK 107,384,919.51 5.81546,000.000Transportation
ID LOGISTICS GROUP EUR 43,314,260.00 2.34183,535.000INPOST SA EUR 24,044,618.60 1.301,420,573.000SAFESTORE HOLDINGS PLC GBP 50,891,741.61 2.754,613,683.000
225,635,539.72 12.20
AIR LIQUIDE SA EUR 22,924,215.00 1.24155,250.000Chemical
IMCD NV EUR 86,705,573.40 4.69646,574.000KONINKLIJKE DSM EUR 58,840,999.40 3.18373,831.000
168,470,787.80 9.11
CAREL INDUSTRIES SPA EUR 21,168,357.75 1.141,045,351.000Building materials
KINGSPAN GROUP PLC EUR 31,871,928.00 1.72400,200.000OENEO EUR 15,297,251.60 0.831,204,508.000SIKA AG-REG CHF 83,985,048.15 4.54304,434.000
152,322,585.50 8.23
TELEPERFORMANCE EUR 122,737,826.40 6.63358,568.000Office & Business equipment
122,737,826.40 6.63
EVOLUTION GAMING GROUP SEK 44,156,157.37 2.39331,132.000Entertainment
FLUTTER ENTERTAINMENT PLC-DI EUR 67,570,818.90 3.65442,507.000111,726,976.27 6.04
LVMH MOET HENNESSY LOUIS VUI EUR 103,493,450.00 5.59156,500.000Textile
103,493,450.00 5.59
EDENRED EUR 22,203,328.40 1.20462,088.000Diversified services
THULE GROUP AB/THE SEK 45,887,842.30 2.481,226,635.000TOMRA SYSTEMS ASA NOK 26,303,651.37 1.42565,307.000
94,394,822.07 5.10
VAT GROUP AG CHF 75,330,469.12 4.07268,535.000Diversified machinery
75,330,469.12 4.07
ATLAS COPCO AB-A SHS SEK 24,438,659.80 1.32473,000.000Auto Parts & Equipment
24,438,659.80 1.32
GAZTRANSPORT ET TECHNIGA SA EUR 16,095,503.10 0.87236,351.000Energy
16,095,503.10 0.87
CINT GROUP AB SEK 5,123,400.78 0.28540,130.000Computer software
SINCH AB SEK 9,148,624.50 0.49644,330.00014,272,025.28 0.77
NameQuantity/Nominal
Market valuein EUR
Currency %NAV
LAURENT-PERRIER EUR 9,505,150.20 0.5198,397.000Food services
9,505,150.20 0.51
1,808,809,162.10 97.76
DNCA INVEST - ARCHER MID-CAPEUROPE - CLASS I SHARES EUR
EUR 10,733,083.45 0.5850,473.000
Funds
Investment fundsOpen-ended Funds
DNCA INVEST - SRI NORDEN EUROPE* -CLASS I SHARES EUR
EUR 16,371,921.00 0.8868,100.000
27,105,004.45 1.46
27,105,004.45 1.46
Total securities portfolio 1,835,914,166.55 99.22
NameQuantity/Nominal
Market valuein EUR
Currency %NAV
88.330 16/07/2181.120 0.56CHFEUR 81.12Forward foreign exchange contracts
2,786,815.180 16/07/213,034,484.310 (19,218.52)EURCHF 2,786,815.1814,436,669.280 16/07/2117,503,097.900 330,587.55EURUSD 14,436,669.28
311,369.59
Total forward foreign exchange contracts 311,369.59
SalePurchase Unrealisedappreciation /(depreciation)
in EUR
MaturityDate
Commitmentin EUR
Financial derivative instruments as at June 30, 2021
Summary of net assets
311,369.59 0.02Total financial derivative instruments
%NAV
1,835,914,166.55 99.22Total securities portfolio
30,966,627.55 1.67Cash at bank
(16,771,396.82) (0.91)Other assets and liabilities
1,850,420,766.87 100.00Total net assets
* Please see Note 1.
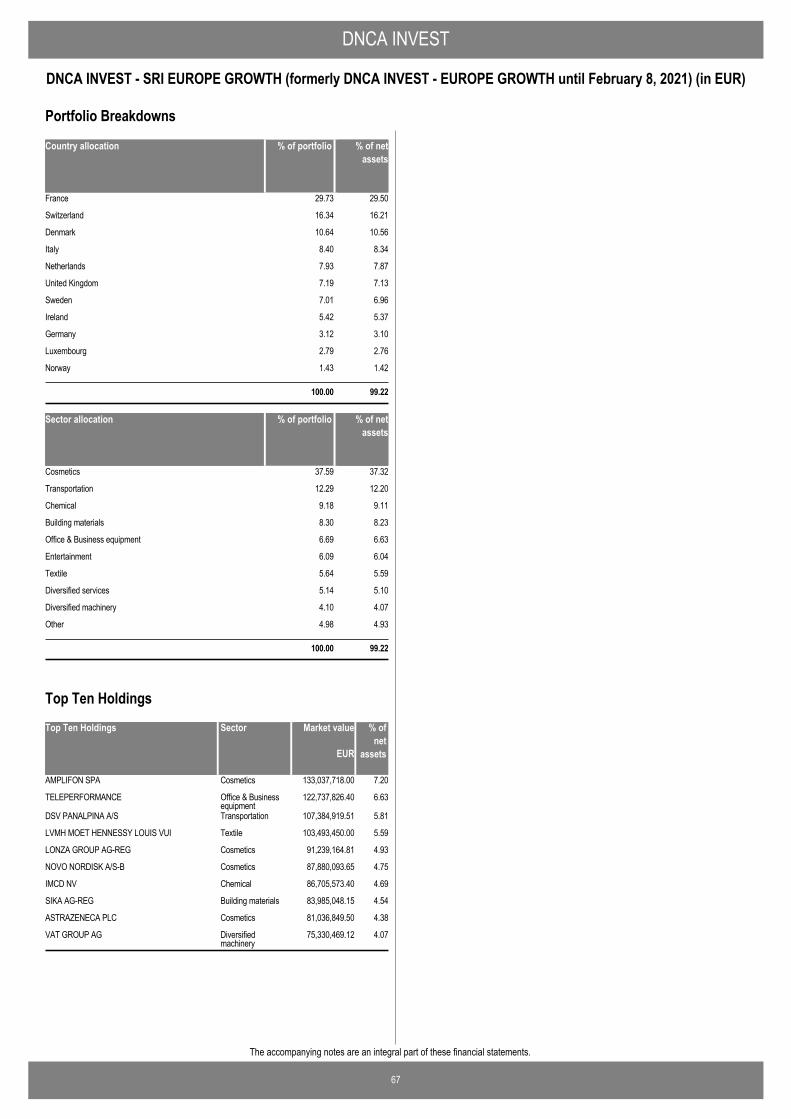
DNCA INVEST
67
DNCA INVEST - SRI EUROPE GROWTH (formerly DNCA INVEST - EUROPE GROWTH until February 8, 2021) (in EUR)
The accompanying notes are an integral part of these financial statements.
Country allocation % of portfolio % of netassets
France 29.73 29.50
Switzerland 16.34 16.21
Denmark 10.64 10.56
Italy 8.40 8.34
Netherlands 7.93 7.87
United Kingdom 7.19 7.13
Sweden 7.01 6.96
Ireland 5.42 5.37
Germany 3.12 3.10
Luxembourg 2.79 2.76
Norway 1.43 1.42
100.00 99.22
Sector allocation % of portfolio % of netassets
Cosmetics 37.59 37.32
Transportation 12.29 12.20
Chemical 9.18 9.11
Building materials 8.30 8.23
Office & Business equipment 6.69 6.63
Entertainment 6.09 6.04
Textile 5.64 5.59
Diversified services 5.14 5.10
Diversified machinery 4.10 4.07
Other 4.98 4.93
100.00 99.22
Portfolio Breakdowns
Top Ten Holdings Market value % ofnet
assets
AMPLIFON SPA 133,037,718.00 7.20Cosmetics
TELEPERFORMANCE 122,737,826.40 6.63Office & Businessequipment
DSV PANALPINA A/S 107,384,919.51 5.81Transportation
LVMH MOET HENNESSY LOUIS VUI 103,493,450.00 5.59Textile
LONZA GROUP AG-REG 91,239,164.81 4.93Cosmetics
NOVO NORDISK A/S-B 87,880,093.65 4.75Cosmetics
IMCD NV 86,705,573.40 4.69Chemical
SIKA AG-REG 83,985,048.15 4.54Building materials
ASTRAZENECA PLC 81,036,849.50 4.38Cosmetics
VAT GROUP AG 75,330,469.12 4.07Diversifiedmachinery
EUR
Sector
Top Ten Holdings

68
The accompanying notes are an integral part of these financial statements.
DNCA INVEST
DNCA INVEST - ARCHER MID-CAP EUROPE (in EUR)Statement of Operations and Changes in Net Assets for theperiod ended June 30, 2021
EUR
AssetsInvestment in securities at cost 182,703,140.06Unrealised appreciation / (depreciation) on securities 53,900,512.47
Investment in securities at market value 2.2 236,603,652.53Cash at bank 2.2 778,121.92Receivable for investment sold 2,574,009.25Receivable on subscriptions 143,355.74Dividends and interest receivable 2.6 227,932.88
Total assets 240,327,072.32
LiabilitiesBank overdraft 2,120.12Accrued expenses 693,117.24Payable on redemptions 2,141,379.58
Total liabilities 2,836,616.94
Net assets at the end of the period 237,490,455.38
Notes
Statement of Net Assets as at June 30, 2021
IncomeDividends (net of withholding taxes) 2.6 2,116,717.05Bank interest 2.6 0.03Other income 18 1,583.02
Total income 2,118,300.10
ExpensesManagement fees 4 1,231,530.71Depositary fees 5 65,717.89Performance fees 4 425,896.21Administration fees 5 27,204.00Professional fees 7 16,456.25Transaction costs 2.7 215,792.67Taxe d'abonnement 6 20,497.45Bank interest and charges 2.5 14,556.65Transfer agent fees 37,930.83Printing & Publication fees 13,079.22Other expenses 7 1,438.07
Total expenses 2,070,099.95
Net investment income / (loss) 48,200.15
Net realised gain / (loss) on: Investments 2.4 18,657,728.81Foreign currencies transactions 2.3 10,663.07
Net realised gain / (loss) for the period 18,716,592.03
Net change in unrealised appreciation / (depreciation) on: Investments 12,178,788.96
Increase / (Decrease) in net assets as a result ofoperations
30,895,380.99
Proceeds received on subscription of shares 84,787,441.69Net amount paid on redemption of shares (72,198,649.07)Net assets at the beginning of the period 194,006,281.77
Net assets at the end of the period 237,490,455.38
EURNotes
Statement of Operations and Changes in Net Assets forthe period ended June 30, 2021

69
The accompanying notes are an integral part of these financial statements.
DNCA INVEST
DNCA INVEST - ARCHER MID-CAP EUROPE (in EUR)
Number of shares in issue atthe end of the period
Number of shares in issue atthe beginning of the period
Number of sharesissued
Number of sharesredeemed
Statement of Changes in Number of Shares
Class A shares EUR 31,679.598 7,357.957 (3,871.513) 35,166.042
Class B shares EUR 109,188.067 15,376.137 (9,791.079) 114,773.125
Class I shares EUR 841,651.781 121,372.439 (339,639.549) 623,384.671
Class ID shares EUR - 539,423.042 - 539,423.042
Class N shares EUR 89,826.463 18,288.674 (23,338.066) 84,777.071
Class Q shares EUR 13,847.103 1,874.379 (516.518) 15,204.964
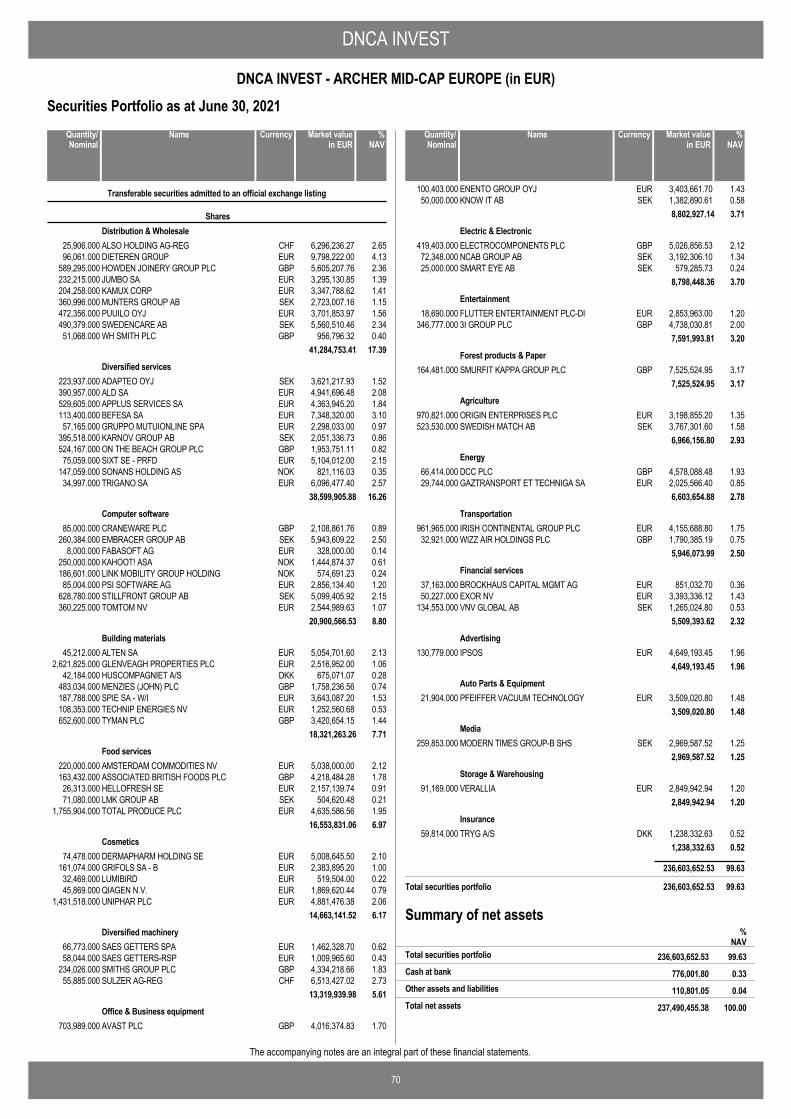
DNCA INVEST
70
DNCA INVEST - ARCHER MID-CAP EUROPE (in EUR)
The accompanying notes are an integral part of these financial statements.
Securities Portfolio as at June 30, 2021
ALSO HOLDING AG-REG CHF 6,296,236.27 2.6525,906.000
Transferable securities admitted to an official exchange listing
SharesDistribution & Wholesale
DIETEREN GROUP EUR 9,798,222.00 4.1396,061.000HOWDEN JOINERY GROUP PLC GBP 5,605,207.76 2.36589,295.000JUMBO SA EUR 3,295,130.85 1.39232,215.000KAMUX CORP EUR 3,347,788.62 1.41204,258.000MUNTERS GROUP AB SEK 2,723,007.16 1.15360,996.000PUUILO OYJ EUR 3,701,853.97 1.56472,356.000SWEDENCARE AB SEK 5,560,510.46 2.34490,379.000WH SMITH PLC GBP 956,796.32 0.4051,068.000
41,284,753.41 17.39
ADAPTEO OYJ SEK 3,621,217.93 1.52223,937.000Diversified services
ALD SA EUR 4,941,696.48 2.08390,957.000APPLUS SERVICES SA EUR 4,363,945.20 1.84529,605.000BEFESA SA EUR 7,348,320.00 3.10113,400.000GRUPPO MUTUIONLINE SPA EUR 2,298,033.00 0.9757,165.000KARNOV GROUP AB SEK 2,051,336.73 0.86395,518.000ON THE BEACH GROUP PLC GBP 1,953,751.11 0.82524,167.000SIXT SE - PRFD EUR 5,104,012.00 2.1575,059.000SONANS HOLDING AS NOK 821,116.03 0.35147,059.000TRIGANO SA EUR 6,096,477.40 2.5734,997.000
38,599,905.88 16.26
CRANEWARE PLC GBP 2,108,861.76 0.8985,000.000Computer software
EMBRACER GROUP AB SEK 5,943,609.22 2.50260,384.000FABASOFT AG EUR 328,000.00 0.148,000.000KAHOOT! ASA NOK 1,444,874.37 0.61250,000.000LINK MOBILITY GROUP HOLDING NOK 574,691.23 0.24186,601.000PSI SOFTWARE AG EUR 2,856,134.40 1.2085,004.000STILLFRONT GROUP AB SEK 5,099,405.92 2.15628,780.000TOMTOM NV EUR 2,544,989.63 1.07360,225.000
20,900,566.53 8.80
ALTEN SA EUR 5,054,701.60 2.1345,212.000Building materials
GLENVEAGH PROPERTIES PLC EUR 2,516,952.00 1.062,621,825.000HUSCOMPAGNIET A/S DKK 675,071.07 0.2842,184.000MENZIES (JOHN) PLC GBP 1,758,236.56 0.74483,034.000SPIE SA - W/I EUR 3,643,087.20 1.53187,788.000TECHNIP ENERGIES NV EUR 1,252,560.68 0.53108,353.000TYMAN PLC GBP 3,420,654.15 1.44652,600.000
18,321,263.26 7.71
AMSTERDAM COMMODITIES NV EUR 5,038,000.00 2.12220,000.000Food services
ASSOCIATED BRITISH FOODS PLC GBP 4,218,484.28 1.78163,432.000HELLOFRESH SE EUR 2,157,139.74 0.9126,313.000LMK GROUP AB SEK 504,620.48 0.2171,080.000TOTAL PRODUCE PLC EUR 4,635,586.56 1.951,755,904.000
16,553,831.06 6.97
DERMAPHARM HOLDING SE EUR 5,008,645.50 2.1074,478.000Cosmetics
GRIFOLS SA - B EUR 2,383,895.20 1.00161,074.000LUMIBIRD EUR 519,504.00 0.2232,469.000QIAGEN N.V. EUR 1,869,620.44 0.7945,869.000UNIPHAR PLC EUR 4,881,476.38 2.061,431,518.000
14,663,141.52 6.17
SAES GETTERS SPA EUR 1,462,328.70 0.6266,773.000Diversified machinery
SAES GETTERS-RSP EUR 1,009,965.60 0.4358,044.000SMITHS GROUP PLC GBP 4,334,218.66 1.83234,026.000SULZER AG-REG CHF 6,513,427.02 2.7355,885.000
13,319,939.98 5.61
AVAST PLC GBP 4,016,374.83 1.70703,989.000Office & Business equipment
NameQuantity/Nominal
Market valuein EUR
Currency %NAV
ENENTO GROUP OYJ EUR 3,403,661.70 1.43100,403.000KNOW IT AB SEK 1,382,890.61 0.5850,000.000
8,802,927.14 3.71
ELECTROCOMPONENTS PLC GBP 5,026,856.53 2.12419,403.000Electric & Electronic
NCAB GROUP AB SEK 3,192,306.10 1.3472,348.000SMART EYE AB SEK 579,285.73 0.2425,000.000
8,798,448.36 3.70
FLUTTER ENTERTAINMENT PLC-DI EUR 2,853,963.00 1.2018,690.000Entertainment
3I GROUP PLC GBP 4,738,030.81 2.00346,777.0007,591,993.81 3.20
SMURFIT KAPPA GROUP PLC GBP 7,525,524.95 3.17164,481.000Forest products & Paper
7,525,524.95 3.17
ORIGIN ENTERPRISES PLC EUR 3,198,855.20 1.35970,821.000Agriculture
SWEDISH MATCH AB SEK 3,767,301.60 1.58523,530.0006,966,156.80 2.93
DCC PLC GBP 4,578,088.48 1.9366,414.000Energy
GAZTRANSPORT ET TECHNIGA SA EUR 2,025,566.40 0.8529,744.0006,603,654.88 2.78
IRISH CONTINENTAL GROUP PLC EUR 4,155,688.80 1.75961,965.000Transportation
WIZZ AIR HOLDINGS PLC GBP 1,790,385.19 0.7532,921.0005,946,073.99 2.50
BROCKHAUS CAPITAL MGMT AG EUR 851,032.70 0.3637,163.000Financial services
EXOR NV EUR 3,393,336.12 1.4350,227.000VNV GLOBAL AB SEK 1,265,024.80 0.53134,553.000
5,509,393.62 2.32
IPSOS EUR 4,649,193.45 1.96130,779.000Advertising
4,649,193.45 1.96
PFEIFFER VACUUM TECHNOLOGY EUR 3,509,020.80 1.4821,904.000Auto Parts & Equipment
3,509,020.80 1.48
MODERN TIMES GROUP-B SHS SEK 2,969,587.52 1.25259,853.000Media
2,969,587.52 1.25
VERALLIA EUR 2,849,942.94 1.2091,169.000Storage & Warehousing
2,849,942.94 1.20
TRYG A/S DKK 1,238,332.63 0.5259,814.000Insurance
1,238,332.63 0.52
236,603,652.53 99.63
Total securities portfolio 236,603,652.53 99.63
NameQuantity/Nominal
Market valuein EUR
Currency %NAV
Summary of net assets%
NAV236,603,652.53 99.63Total securities portfolio
776,001.80 0.33Cash at bank
110,801.05 0.04Other assets and liabilities
237,490,455.38 100.00Total net assets
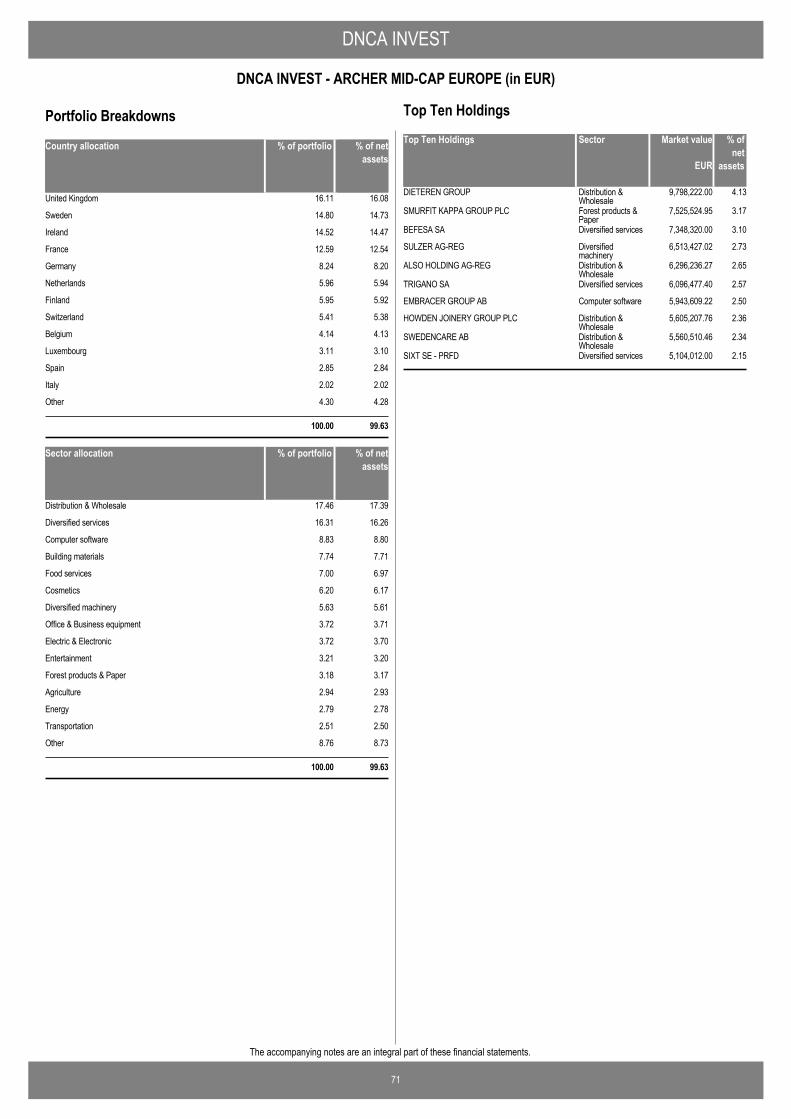
DNCA INVEST
71
DNCA INVEST - ARCHER MID-CAP EUROPE (in EUR)
The accompanying notes are an integral part of these financial statements.
Country allocation % of portfolio % of netassets
United Kingdom 16.11 16.08
Sweden 14.80 14.73
Ireland 14.52 14.47
France 12.59 12.54
Germany 8.24 8.20
Netherlands 5.96 5.94
Finland 5.95 5.92
Switzerland 5.41 5.38
Belgium 4.14 4.13
Luxembourg 3.11 3.10
Spain 2.85 2.84
Italy 2.02 2.02
Other 4.30 4.28
100.00 99.63
Sector allocation % of portfolio % of netassets
Distribution & Wholesale 17.46 17.39
Diversified services 16.31 16.26
Computer software 8.83 8.80
Building materials 7.74 7.71
Food services 7.00 6.97
Cosmetics 6.20 6.17
Diversified machinery 5.63 5.61
Office & Business equipment 3.72 3.71
Electric & Electronic 3.72 3.70
Entertainment 3.21 3.20
Forest products & Paper 3.18 3.17
Agriculture 2.94 2.93
Energy 2.79 2.78
Transportation 2.51 2.50
Other 8.76 8.73
100.00 99.63
Portfolio BreakdownsTop Ten Holdings Market value % of
netassets
DIETEREN GROUP 9,798,222.00 4.13Distribution &Wholesale
SMURFIT KAPPA GROUP PLC 7,525,524.95 3.17Forest products &Paper
BEFESA SA 7,348,320.00 3.10Diversified services
SULZER AG-REG 6,513,427.02 2.73Diversifiedmachinery
ALSO HOLDING AG-REG 6,296,236.27 2.65Distribution &Wholesale
TRIGANO SA 6,096,477.40 2.57Diversified services
EMBRACER GROUP AB 5,943,609.22 2.50Computer software
HOWDEN JOINERY GROUP PLC 5,605,207.76 2.36Distribution &Wholesale
SWEDENCARE AB 5,560,510.46 2.34Distribution &Wholesale
SIXT SE - PRFD 5,104,012.00 2.15Diversified services
EUR
Sector
Top Ten Holdings
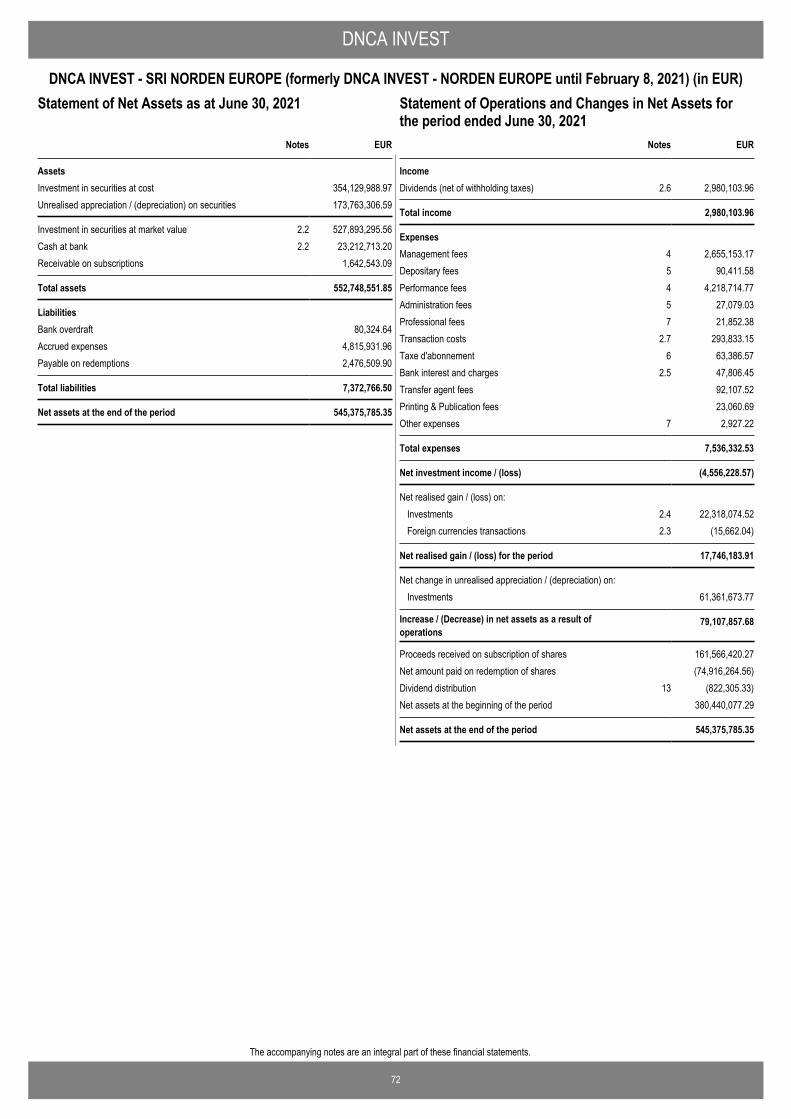
72
The accompanying notes are an integral part of these financial statements.
DNCA INVEST
DNCA INVEST - SRI NORDEN EUROPE (formerly DNCA INVEST - NORDEN EUROPE until February 8, 2021) (in EUR)Statement of Operations and Changes in Net Assets for theperiod ended June 30, 2021
EUR
AssetsInvestment in securities at cost 354,129,988.97Unrealised appreciation / (depreciation) on securities 173,763,306.59
Investment in securities at market value 2.2 527,893,295.56Cash at bank 2.2 23,212,713.20Receivable on subscriptions 1,642,543.09
Total assets 552,748,551.85
LiabilitiesBank overdraft 80,324.64Accrued expenses 4,815,931.96Payable on redemptions 2,476,509.90
Total liabilities 7,372,766.50
Net assets at the end of the period 545,375,785.35
Notes
Statement of Net Assets as at June 30, 2021
IncomeDividends (net of withholding taxes) 2.6 2,980,103.96
Total income 2,980,103.96
ExpensesManagement fees 4 2,655,153.17Depositary fees 5 90,411.58Performance fees 4 4,218,714.77Administration fees 5 27,079.03Professional fees 7 21,852.38Transaction costs 2.7 293,833.15Taxe d'abonnement 6 63,386.57Bank interest and charges 2.5 47,806.45Transfer agent fees 92,107.52Printing & Publication fees 23,060.69Other expenses 7 2,927.22
Total expenses 7,536,332.53
Net investment income / (loss) (4,556,228.57)
Net realised gain / (loss) on: Investments 2.4 22,318,074.52Foreign currencies transactions 2.3 (15,662.04)
Net realised gain / (loss) for the period 17,746,183.91
Net change in unrealised appreciation / (depreciation) on: Investments 61,361,673.77
Increase / (Decrease) in net assets as a result ofoperations
79,107,857.68
Proceeds received on subscription of shares 161,566,420.27Net amount paid on redemption of shares (74,916,264.56)Dividend distribution 13 (822,305.33)Net assets at the beginning of the period 380,440,077.29
Net assets at the end of the period 545,375,785.35
EURNotes
Statement of Operations and Changes in Net Assets forthe period ended June 30, 2021
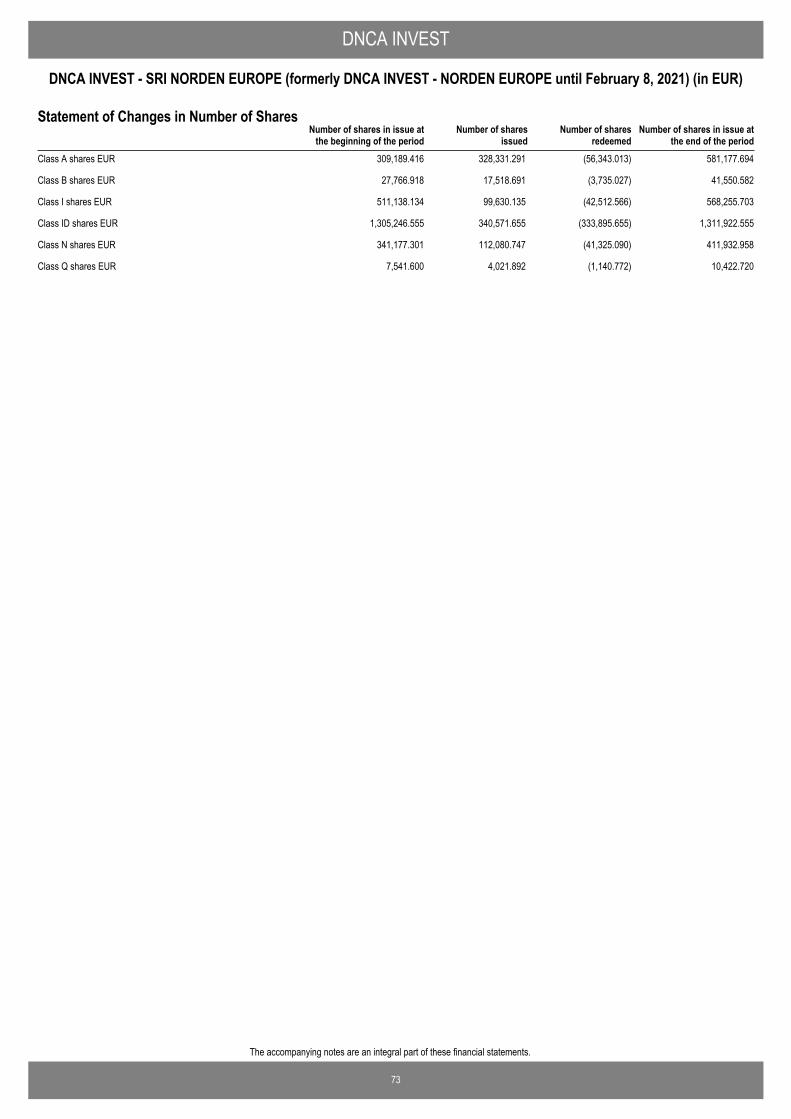
73
The accompanying notes are an integral part of these financial statements.
DNCA INVEST
DNCA INVEST - SRI NORDEN EUROPE (formerly DNCA INVEST - NORDEN EUROPE until February 8, 2021) (in EUR)
Number of shares in issue atthe end of the period
Number of shares in issue atthe beginning of the period
Number of sharesissued
Number of sharesredeemed
Statement of Changes in Number of Shares
Class A shares EUR 309,189.416 328,331.291 (56,343.013) 581,177.694
Class B shares EUR 27,766.918 17,518.691 (3,735.027) 41,550.582
Class I shares EUR 511,138.134 99,630.135 (42,512.566) 568,255.703
Class ID shares EUR 1,305,246.555 340,571.655 (333,895.655) 1,311,922.555
Class N shares EUR 341,177.301 112,080.747 (41,325.090) 411,932.958
Class Q shares EUR 7,541.600 4,021.892 (1,140.772) 10,422.720
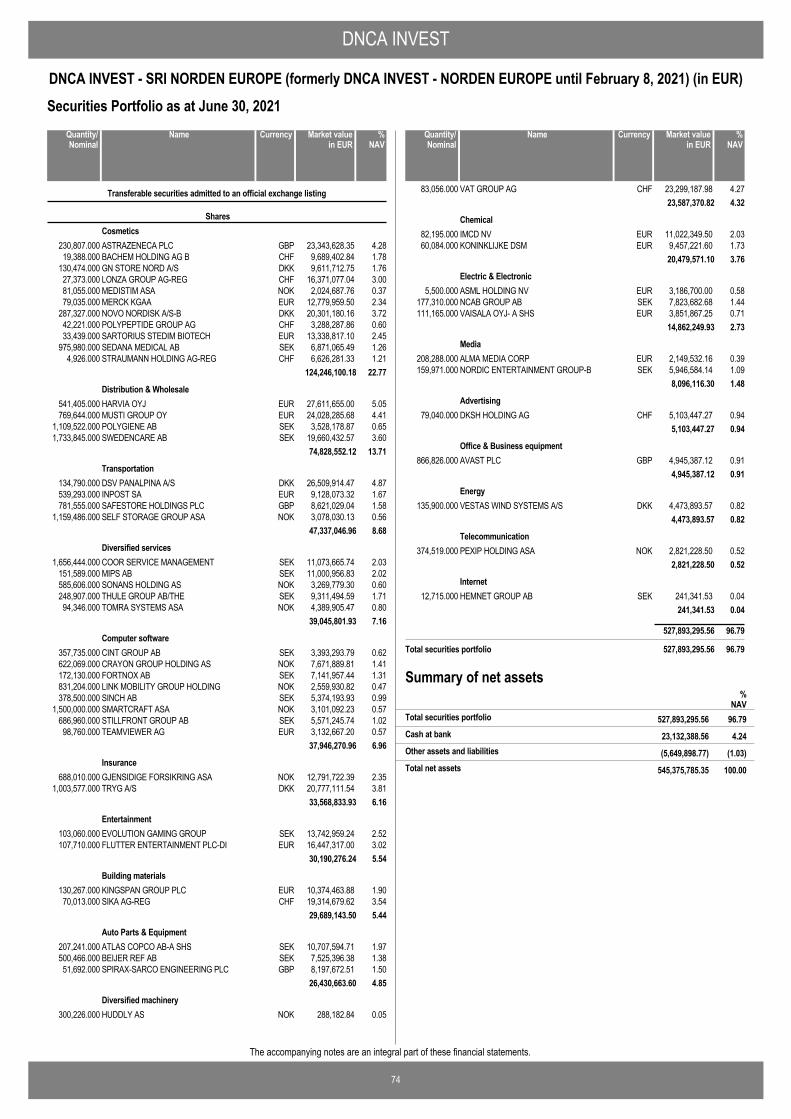
DNCA INVEST
74
DNCA INVEST - SRI NORDEN EUROPE (formerly DNCA INVEST - NORDEN EUROPE until February 8, 2021) (in EUR)
The accompanying notes are an integral part of these financial statements.
Securities Portfolio as at June 30, 2021
ASTRAZENECA PLC GBP 23,343,628.35 4.28230,807.000
Transferable securities admitted to an official exchange listing
SharesCosmetics
BACHEM HOLDING AG B CHF 9,689,402.84 1.7819,388.000GN STORE NORD A/S DKK 9,611,712.75 1.76130,474.000LONZA GROUP AG-REG CHF 16,371,077.04 3.0027,373.000MEDISTIM ASA NOK 2,024,687.76 0.3781,055.000MERCK KGAA EUR 12,779,959.50 2.3479,035.000NOVO NORDISK A/S-B DKK 20,301,180.16 3.72287,327.000POLYPEPTIDE GROUP AG CHF 3,288,287.86 0.6042,221.000SARTORIUS STEDIM BIOTECH EUR 13,338,817.10 2.4533,439.000SEDANA MEDICAL AB SEK 6,871,065.49 1.26975,980.000STRAUMANN HOLDING AG-REG CHF 6,626,281.33 1.214,926.000
124,246,100.18 22.77
HARVIA OYJ EUR 27,611,655.00 5.05541,405.000Distribution & Wholesale
MUSTI GROUP OY EUR 24,028,285.68 4.41769,644.000POLYGIENE AB SEK 3,528,178.87 0.651,109,522.000SWEDENCARE AB SEK 19,660,432.57 3.601,733,845.000
74,828,552.12 13.71
DSV PANALPINA A/S DKK 26,509,914.47 4.87134,790.000Transportation
INPOST SA EUR 9,128,073.32 1.67539,293.000SAFESTORE HOLDINGS PLC GBP 8,621,029.04 1.58781,555.000SELF STORAGE GROUP ASA NOK 3,078,030.13 0.561,159,486.000
47,337,046.96 8.68
COOR SERVICE MANAGEMENT SEK 11,073,665.74 2.031,656,444.000Diversified services
MIPS AB SEK 11,000,956.83 2.02151,589.000SONANS HOLDING AS NOK 3,269,779.30 0.60585,606.000THULE GROUP AB/THE SEK 9,311,494.59 1.71248,907.000TOMRA SYSTEMS ASA NOK 4,389,905.47 0.8094,346.000
39,045,801.93 7.16
CINT GROUP AB SEK 3,393,293.79 0.62357,735.000Computer software
CRAYON GROUP HOLDING AS NOK 7,671,889.81 1.41622,069.000FORTNOX AB SEK 7,141,957.44 1.31172,130.000LINK MOBILITY GROUP HOLDING NOK 2,559,930.82 0.47831,204.000SINCH AB SEK 5,374,193.93 0.99378,500.000SMARTCRAFT ASA NOK 3,101,092.23 0.571,500,000.000STILLFRONT GROUP AB SEK 5,571,245.74 1.02686,960.000TEAMVIEWER AG EUR 3,132,667.20 0.5798,760.000
37,946,270.96 6.96
GJENSIDIGE FORSIKRING ASA NOK 12,791,722.39 2.35688,010.000Insurance
TRYG A/S DKK 20,777,111.54 3.811,003,577.00033,568,833.93 6.16
EVOLUTION GAMING GROUP SEK 13,742,959.24 2.52103,060.000Entertainment
FLUTTER ENTERTAINMENT PLC-DI EUR 16,447,317.00 3.02107,710.00030,190,276.24 5.54
KINGSPAN GROUP PLC EUR 10,374,463.88 1.90130,267.000Building materials
SIKA AG-REG CHF 19,314,679.62 3.5470,013.00029,689,143.50 5.44
ATLAS COPCO AB-A SHS SEK 10,707,594.71 1.97207,241.000Auto Parts & Equipment
BEIJER REF AB SEK 7,525,396.38 1.38500,466.000SPIRAX-SARCO ENGINEERING PLC GBP 8,197,672.51 1.5051,692.000
26,430,663.60 4.85
HUDDLY AS NOK 288,182.84 0.05300,226.000Diversified machinery
NameQuantity/Nominal
Market valuein EUR
Currency %NAV
VAT GROUP AG CHF 23,299,187.98 4.2783,056.00023,587,370.82 4.32
IMCD NV EUR 11,022,349.50 2.0382,195.000Chemical
KONINKLIJKE DSM EUR 9,457,221.60 1.7360,084.00020,479,571.10 3.76
ASML HOLDING NV EUR 3,186,700.00 0.585,500.000Electric & Electronic
NCAB GROUP AB SEK 7,823,682.68 1.44177,310.000VAISALA OYJ- A SHS EUR 3,851,867.25 0.71111,165.000
14,862,249.93 2.73
ALMA MEDIA CORP EUR 2,149,532.16 0.39208,288.000Media
NORDIC ENTERTAINMENT GROUP-B SEK 5,946,584.14 1.09159,971.0008,096,116.30 1.48
DKSH HOLDING AG CHF 5,103,447.27 0.9479,040.000Advertising
5,103,447.27 0.94
AVAST PLC GBP 4,945,387.12 0.91866,826.000Office & Business equipment
4,945,387.12 0.91
VESTAS WIND SYSTEMS A/S DKK 4,473,893.57 0.82135,900.000Energy
4,473,893.57 0.82
PEXIP HOLDING ASA NOK 2,821,228.50 0.52374,519.000Telecommunication
2,821,228.50 0.52
HEMNET GROUP AB SEK 241,341.53 0.0412,715.000Internet
241,341.53 0.04
527,893,295.56 96.79
Total securities portfolio 527,893,295.56 96.79
NameQuantity/Nominal
Market valuein EUR
Currency %NAV
Summary of net assets%
NAV527,893,295.56 96.79Total securities portfolio
23,132,388.56 4.24Cash at bank
(5,649,898.77) (1.03)Other assets and liabilities
545,375,785.35 100.00Total net assets
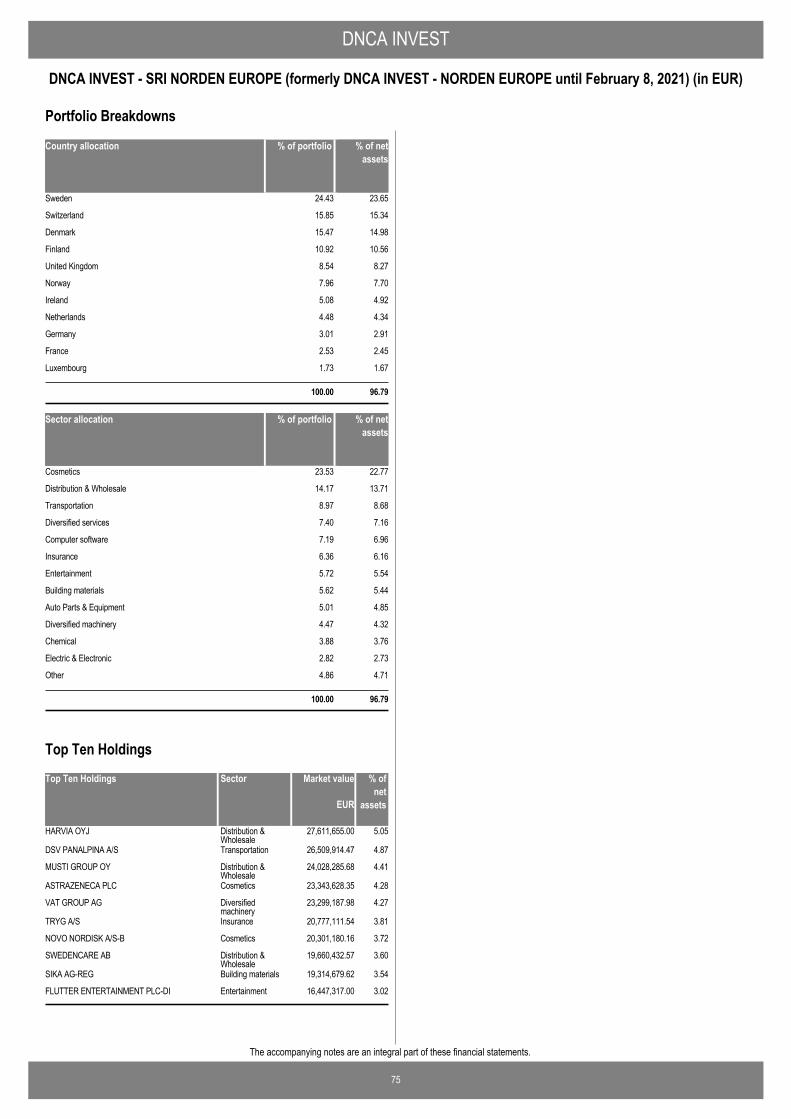
DNCA INVEST
75
DNCA INVEST - SRI NORDEN EUROPE (formerly DNCA INVEST - NORDEN EUROPE until February 8, 2021) (in EUR)
The accompanying notes are an integral part of these financial statements.
Country allocation % of portfolio % of netassets
Sweden 24.43 23.65
Switzerland 15.85 15.34
Denmark 15.47 14.98
Finland 10.92 10.56
United Kingdom 8.54 8.27
Norway 7.96 7.70
Ireland 5.08 4.92
Netherlands 4.48 4.34
Germany 3.01 2.91
France 2.53 2.45
Luxembourg 1.73 1.67
100.00 96.79
Sector allocation % of portfolio % of netassets
Cosmetics 23.53 22.77
Distribution & Wholesale 14.17 13.71
Transportation 8.97 8.68
Diversified services 7.40 7.16
Computer software 7.19 6.96
Insurance 6.36 6.16
Entertainment 5.72 5.54
Building materials 5.62 5.44
Auto Parts & Equipment 5.01 4.85
Diversified machinery 4.47 4.32
Chemical 3.88 3.76
Electric & Electronic 2.82 2.73
Other 4.86 4.71
100.00 96.79
Portfolio Breakdowns
Top Ten Holdings Market value % ofnet
assets
HARVIA OYJ 27,611,655.00 5.05Distribution &Wholesale
DSV PANALPINA A/S 26,509,914.47 4.87Transportation
MUSTI GROUP OY 24,028,285.68 4.41Distribution &Wholesale
ASTRAZENECA PLC 23,343,628.35 4.28Cosmetics
VAT GROUP AG 23,299,187.98 4.27Diversifiedmachinery
TRYG A/S 20,777,111.54 3.81Insurance
NOVO NORDISK A/S-B 20,301,180.16 3.72Cosmetics
SWEDENCARE AB 19,660,432.57 3.60Distribution &Wholesale
SIKA AG-REG 19,314,679.62 3.54Building materials
FLUTTER ENTERTAINMENT PLC-DI 16,447,317.00 3.02Entertainment
EUR
Sector
Top Ten Holdings
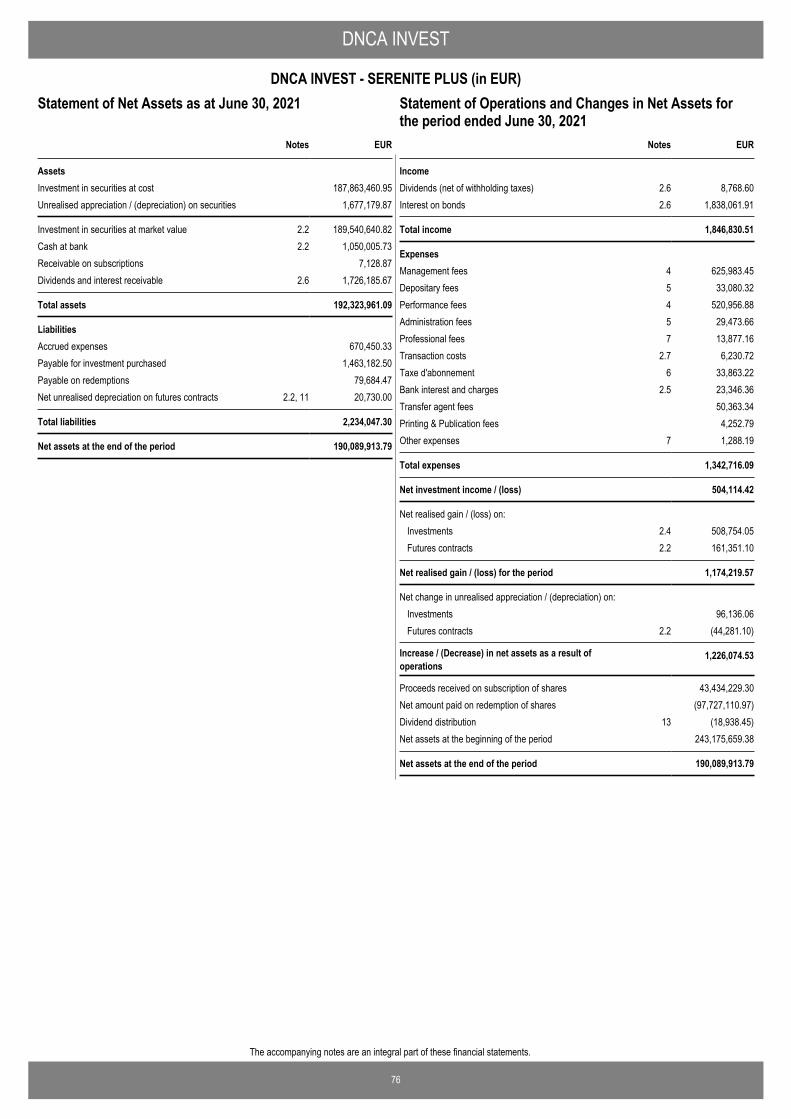
76
The accompanying notes are an integral part of these financial statements.
DNCA INVEST
DNCA INVEST - SERENITE PLUS (in EUR)Statement of Operations and Changes in Net Assets for theperiod ended June 30, 2021
EUR
AssetsInvestment in securities at cost 187,863,460.95Unrealised appreciation / (depreciation) on securities 1,677,179.87
Investment in securities at market value 2.2 189,540,640.82Cash at bank 2.2 1,050,005.73Receivable on subscriptions 7,128.87Dividends and interest receivable 2.6 1,726,185.67
Total assets 192,323,961.09
LiabilitiesAccrued expenses 670,450.33Payable for investment purchased 1,463,182.50Payable on redemptions 79,684.47Net unrealised depreciation on futures contracts 2.2, 11 20,730.00
Total liabilities 2,234,047.30
Net assets at the end of the period 190,089,913.79
Notes
Statement of Net Assets as at June 30, 2021
IncomeDividends (net of withholding taxes) 2.6 8,768.60Interest on bonds 2.6 1,838,061.91
Total income 1,846,830.51
ExpensesManagement fees 4 625,983.45Depositary fees 5 33,080.32Performance fees 4 520,956.88Administration fees 5 29,473.66Professional fees 7 13,877.16Transaction costs 2.7 6,230.72Taxe d'abonnement 6 33,863.22Bank interest and charges 2.5 23,346.36Transfer agent fees 50,363.34Printing & Publication fees 4,252.79Other expenses 7 1,288.19
Total expenses 1,342,716.09
Net investment income / (loss) 504,114.42
Net realised gain / (loss) on: Investments 2.4 508,754.05Futures contracts 2.2 161,351.10
Net realised gain / (loss) for the period 1,174,219.57
Net change in unrealised appreciation / (depreciation) on: Investments 96,136.06Futures contracts 2.2 (44,281.10)
Increase / (Decrease) in net assets as a result ofoperations
1,226,074.53
Proceeds received on subscription of shares 43,434,229.30Net amount paid on redemption of shares (97,727,110.97)Dividend distribution 13 (18,938.45)Net assets at the beginning of the period 243,175,659.38
Net assets at the end of the period 190,089,913.79
EURNotes
Statement of Operations and Changes in Net Assets forthe period ended June 30, 2021
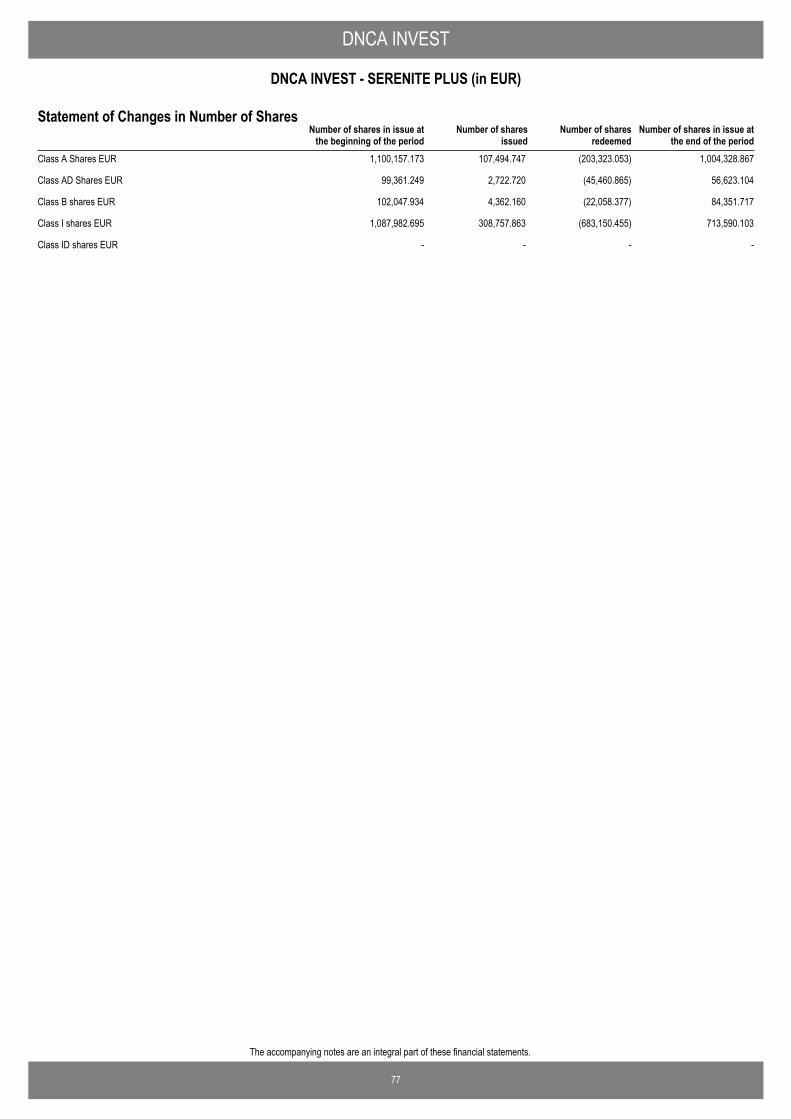
77
The accompanying notes are an integral part of these financial statements.
DNCA INVEST
DNCA INVEST - SERENITE PLUS (in EUR)
Number of shares in issue atthe end of the period
Number of shares in issue atthe beginning of the period
Number of sharesissued
Number of sharesredeemed
Statement of Changes in Number of Shares
Class A Shares EUR 1,100,157.173 107,494.747 (203,323.053) 1,004,328.867
Class AD Shares EUR 99,361.249 2,722.720 (45,460.865) 56,623.104
Class B shares EUR 102,047.934 4,362.160 (22,058.377) 84,351.717
Class I shares EUR 1,087,982.695 308,757.863 (683,150.455) 713,590.103
Class ID shares EUR - - - -
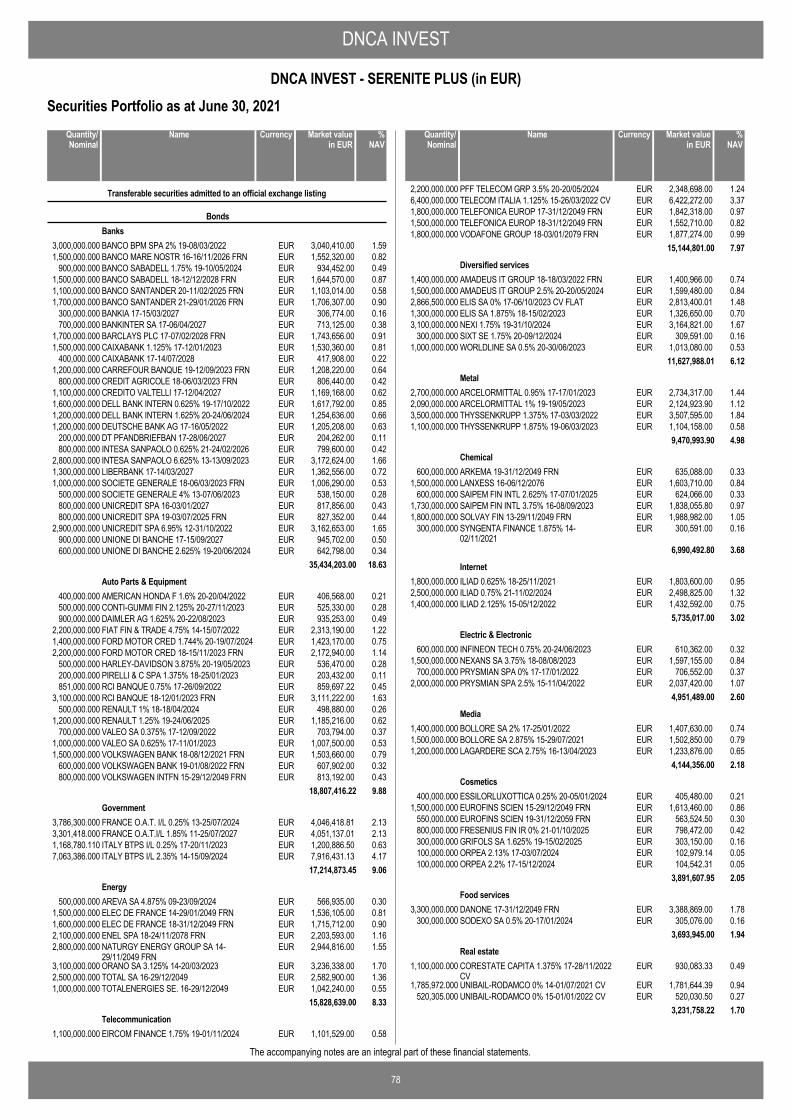
DNCA INVEST
78
DNCA INVEST - SERENITE PLUS (in EUR)
The accompanying notes are an integral part of these financial statements.
Securities Portfolio as at June 30, 2021
BANCO BPM SPA 2% 19-08/03/2022 EUR 3,040,410.00 1.593,000,000.000
Transferable securities admitted to an official exchange listing
BondsBanks
BANCO MARE NOSTR 16-16/11/2026 FRN EUR 1,552,320.00 0.821,500,000.000BANCO SABADELL 1.75% 19-10/05/2024 EUR 934,452.00 0.49900,000.000BANCO SABADELL 18-12/12/2028 FRN EUR 1,644,570.00 0.871,500,000.000BANCO SANTANDER 20-11/02/2025 FRN EUR 1,103,014.00 0.581,100,000.000BANCO SANTANDER 21-29/01/2026 FRN EUR 1,706,307.00 0.901,700,000.000BANKIA 17-15/03/2027 EUR 306,774.00 0.16300,000.000BANKINTER SA 17-06/04/2027 EUR 713,125.00 0.38700,000.000BARCLAYS PLC 17-07/02/2028 FRN EUR 1,743,656.00 0.911,700,000.000CAIXABANK 1.125% 17-12/01/2023 EUR 1,530,360.00 0.811,500,000.000CAIXABANK 17-14/07/2028 EUR 417,908.00 0.22400,000.000CARREFOUR BANQUE 19-12/09/2023 FRN EUR 1,208,220.00 0.641,200,000.000CREDIT AGRICOLE 18-06/03/2023 FRN EUR 806,440.00 0.42800,000.000CREDITO VALTELLI 17-12/04/2027 EUR 1,169,168.00 0.621,100,000.000DELL BANK INTERN 0.625% 19-17/10/2022 EUR 1,617,792.00 0.851,600,000.000DELL BANK INTERN 1.625% 20-24/06/2024 EUR 1,254,636.00 0.661,200,000.000DEUTSCHE BANK AG 17-16/05/2022 EUR 1,205,208.00 0.631,200,000.000DT PFANDBRIEFBAN 17-28/06/2027 EUR 204,262.00 0.11200,000.000INTESA SANPAOLO 0.625% 21-24/02/2026 EUR 799,600.00 0.42800,000.000INTESA SANPAOLO 6.625% 13-13/09/2023 EUR 3,172,624.00 1.662,800,000.000LIBERBANK 17-14/03/2027 EUR 1,362,556.00 0.721,300,000.000SOCIETE GENERALE 18-06/03/2023 FRN EUR 1,006,290.00 0.531,000,000.000SOCIETE GENERALE 4% 13-07/06/2023 EUR 538,150.00 0.28500,000.000UNICREDIT SPA 16-03/01/2027 EUR 817,856.00 0.43800,000.000UNICREDIT SPA 19-03/07/2025 FRN EUR 827,352.00 0.44800,000.000UNICREDIT SPA 6.95% 12-31/10/2022 EUR 3,162,653.00 1.652,900,000.000UNIONE DI BANCHE 17-15/09/2027 EUR 945,702.00 0.50900,000.000UNIONE DI BANCHE 2.625% 19-20/06/2024 EUR 642,798.00 0.34600,000.000
35,434,203.00 18.63
AMERICAN HONDA F 1.6% 20-20/04/2022 EUR 406,568.00 0.21400,000.000Auto Parts & Equipment
CONTI-GUMMI FIN 2.125% 20-27/11/2023 EUR 525,330.00 0.28500,000.000DAIMLER AG 1.625% 20-22/08/2023 EUR 935,253.00 0.49900,000.000FIAT FIN & TRADE 4.75% 14-15/07/2022 EUR 2,313,190.00 1.222,200,000.000FORD MOTOR CRED 1.744% 20-19/07/2024 EUR 1,423,170.00 0.751,400,000.000FORD MOTOR CRED 18-15/11/2023 FRN EUR 2,172,940.00 1.142,200,000.000HARLEY-DAVIDSON 3.875% 20-19/05/2023 EUR 536,470.00 0.28500,000.000PIRELLI & C SPA 1.375% 18-25/01/2023 EUR 203,432.00 0.11200,000.000RCI BANQUE 0.75% 17-26/09/2022 EUR 859,697.22 0.45851,000.000RCI BANQUE 18-12/01/2023 FRN EUR 3,111,222.00 1.633,100,000.000RENAULT 1% 18-18/04/2024 EUR 498,880.00 0.26500,000.000RENAULT 1.25% 19-24/06/2025 EUR 1,185,216.00 0.621,200,000.000VALEO SA 0.375% 17-12/09/2022 EUR 703,794.00 0.37700,000.000VALEO SA 0.625% 17-11/01/2023 EUR 1,007,500.00 0.531,000,000.000VOLKSWAGEN BANK 18-08/12/2021 FRN EUR 1,503,660.00 0.791,500,000.000VOLKSWAGEN BANK 19-01/08/2022 FRN EUR 607,902.00 0.32600,000.000VOLKSWAGEN INTFN 15-29/12/2049 FRN EUR 813,192.00 0.43800,000.000
18,807,416.22 9.88
FRANCE O.A.T. I/L 0.25% 13-25/07/2024 EUR 4,046,418.81 2.133,786,300.000Government
FRANCE O.A.T.I/L 1.85% 11-25/07/2027 EUR 4,051,137.01 2.133,301,418.000ITALY BTPS I/L 0.25% 17-20/11/2023 EUR 1,200,886.50 0.631,168,780.110ITALY BTPS I/L 2.35% 14-15/09/2024 EUR 7,916,431.13 4.177,063,386.000
17,214,873.45 9.06
AREVA SA 4.875% 09-23/09/2024 EUR 566,935.00 0.30500,000.000Energy
ELEC DE FRANCE 14-29/01/2049 FRN EUR 1,536,105.00 0.811,500,000.000ELEC DE FRANCE 18-31/12/2049 FRN EUR 1,715,712.00 0.901,600,000.000ENEL SPA 18-24/11/2078 FRN EUR 2,203,593.00 1.162,100,000.000NATURGY ENERGY GROUP SA 14-29/11/2049 FRN
EUR 2,944,816.00 1.552,800,000.000
ORANO SA 3.125% 14-20/03/2023 EUR 3,236,338.00 1.703,100,000.000TOTAL SA 16-29/12/2049 EUR 2,582,900.00 1.362,500,000.000TOTALENERGIES SE. 16-29/12/2049 EUR 1,042,240.00 0.551,000,000.000
15,828,639.00 8.33
EIRCOM FINANCE 1.75% 19-01/11/2024 EUR 1,101,529.00 0.581,100,000.000Telecommunication
NameQuantity/Nominal
Market valuein EUR
Currency %NAV
PFF TELECOM GRP 3.5% 20-20/05/2024 EUR 2,348,698.00 1.242,200,000.000TELECOM ITALIA 1.125% 15-26/03/2022 CV EUR 6,422,272.00 3.376,400,000.000TELEFONICA EUROP 17-31/12/2049 FRN EUR 1,842,318.00 0.971,800,000.000TELEFONICA EUROP 18-31/12/2049 FRN EUR 1,552,710.00 0.821,500,000.000VODAFONE GROUP 18-03/01/2079 FRN EUR 1,877,274.00 0.991,800,000.000
15,144,801.00 7.97
AMADEUS IT GROUP 18-18/03/2022 FRN EUR 1,400,966.00 0.741,400,000.000Diversified services
AMADEUS IT GROUP 2.5% 20-20/05/2024 EUR 1,599,480.00 0.841,500,000.000ELIS SA 0% 17-06/10/2023 CV FLAT EUR 2,813,400.01 1.482,866,500.000ELIS SA 1.875% 18-15/02/2023 EUR 1,326,650.00 0.701,300,000.000NEXI 1.75% 19-31/10/2024 EUR 3,164,821.00 1.673,100,000.000SIXT SE 1.75% 20-09/12/2024 EUR 309,591.00 0.16300,000.000WORLDLINE SA 0.5% 20-30/06/2023 EUR 1,013,080.00 0.531,000,000.000
11,627,988.01 6.12
ARCELORMITTAL 0.95% 17-17/01/2023 EUR 2,734,317.00 1.442,700,000.000Metal
ARCELORMITTAL 1% 19-19/05/2023 EUR 2,124,923.90 1.122,090,000.000THYSSENKRUPP 1.375% 17-03/03/2022 EUR 3,507,595.00 1.843,500,000.000THYSSENKRUPP 1.875% 19-06/03/2023 EUR 1,104,158.00 0.581,100,000.000
9,470,993.90 4.98
ARKEMA 19-31/12/2049 FRN EUR 635,088.00 0.33600,000.000Chemical
LANXESS 16-06/12/2076 EUR 1,603,710.00 0.841,500,000.000SAIPEM FIN INTL 2.625% 17-07/01/2025 EUR 624,066.00 0.33600,000.000SAIPEM FIN INTL 3.75% 16-08/09/2023 EUR 1,838,055.80 0.971,730,000.000SOLVAY FIN 13-29/11/2049 FRN EUR 1,988,982.00 1.051,800,000.000SYNGENTA FINANCE 1.875% 14-02/11/2021
EUR 300,591.00 0.16300,000.000
6,990,492.80 3.68
ILIAD 0.625% 18-25/11/2021 EUR 1,803,600.00 0.951,800,000.000Internet
ILIAD 0.75% 21-11/02/2024 EUR 2,498,825.00 1.322,500,000.000ILIAD 2.125% 15-05/12/2022 EUR 1,432,592.00 0.751,400,000.000
5,735,017.00 3.02
INFINEON TECH 0.75% 20-24/06/2023 EUR 610,362.00 0.32600,000.000Electric & Electronic
NEXANS SA 3.75% 18-08/08/2023 EUR 1,597,155.00 0.841,500,000.000PRYSMIAN SPA 0% 17-17/01/2022 EUR 706,552.00 0.37700,000.000PRYSMIAN SPA 2.5% 15-11/04/2022 EUR 2,037,420.00 1.072,000,000.000
4,951,489.00 2.60
BOLLORE SA 2% 17-25/01/2022 EUR 1,407,630.00 0.741,400,000.000Media
BOLLORE SA 2.875% 15-29/07/2021 EUR 1,502,850.00 0.791,500,000.000LAGARDERE SCA 2.75% 16-13/04/2023 EUR 1,233,876.00 0.651,200,000.000
4,144,356.00 2.18
ESSILORLUXOTTICA 0.25% 20-05/01/2024 EUR 405,480.00 0.21400,000.000Cosmetics
EUROFINS SCIEN 15-29/12/2049 FRN EUR 1,613,460.00 0.861,500,000.000EUROFINS SCIEN 19-31/12/2059 FRN EUR 563,524.50 0.30550,000.000FRESENIUS FIN IR 0% 21-01/10/2025 EUR 798,472.00 0.42800,000.000GRIFOLS SA 1.625% 19-15/02/2025 EUR 303,150.00 0.16300,000.000ORPEA 2.13% 17-03/07/2024 EUR 102,979.14 0.05100,000.000ORPEA 2.2% 17-15/12/2024 EUR 104,542.31 0.05100,000.000
3,891,607.95 2.05
DANONE 17-31/12/2049 FRN EUR 3,388,869.00 1.783,300,000.000Food services
SODEXO SA 0.5% 20-17/01/2024 EUR 305,076.00 0.16300,000.0003,693,945.00 1.94
CORESTATE CAPITA 1.375% 17-28/11/2022CV
EUR 930,083.33 0.491,100,000.000Real estate
UNIBAIL-RODAMCO 0% 14-01/07/2021 CV EUR 1,781,644.39 0.941,785,972.000UNIBAIL-RODAMCO 0% 15-01/01/2022 CV EUR 520,030.50 0.27520,305.000
3,231,758.22 1.70
NameQuantity/Nominal
Market valuein EUR
Currency %NAV
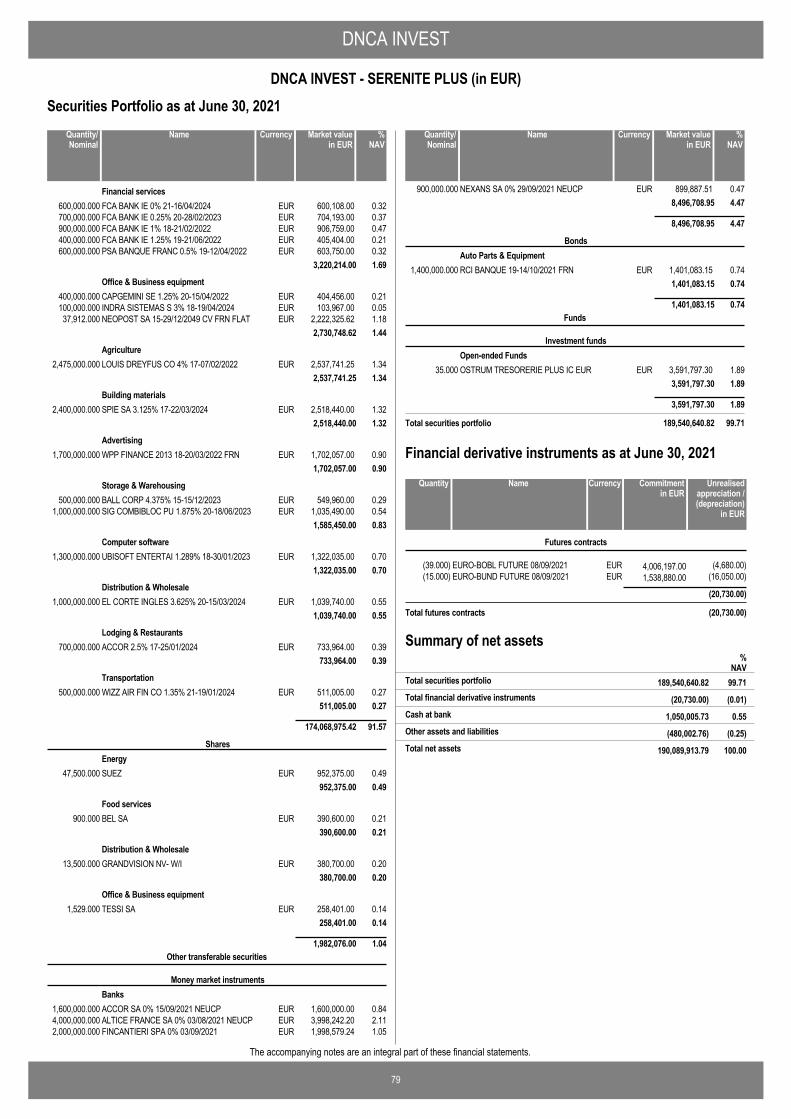
DNCA INVEST
79
DNCA INVEST - SERENITE PLUS (in EUR)
The accompanying notes are an integral part of these financial statements.
Securities Portfolio as at June 30, 2021
FCA BANK IE 0% 21-16/04/2024 EUR 600,108.00 0.32600,000.000Financial services
FCA BANK IE 0.25% 20-28/02/2023 EUR 704,193.00 0.37700,000.000FCA BANK IE 1% 18-21/02/2022 EUR 906,759.00 0.47900,000.000FCA BANK IE 1.25% 19-21/06/2022 EUR 405,404.00 0.21400,000.000PSA BANQUE FRANC 0.5% 19-12/04/2022 EUR 603,750.00 0.32600,000.000
3,220,214.00 1.69
CAPGEMINI SE 1.25% 20-15/04/2022 EUR 404,456.00 0.21400,000.000Office & Business equipment
INDRA SISTEMAS S 3% 18-19/04/2024 EUR 103,967.00 0.05100,000.000NEOPOST SA 15-29/12/2049 CV FRN FLAT EUR 2,222,325.62 1.1837,912.000
2,730,748.62 1.44
LOUIS DREYFUS CO 4% 17-07/02/2022 EUR 2,537,741.25 1.342,475,000.000Agriculture
2,537,741.25 1.34
SPIE SA 3.125% 17-22/03/2024 EUR 2,518,440.00 1.322,400,000.000Building materials
2,518,440.00 1.32
WPP FINANCE 2013 18-20/03/2022 FRN EUR 1,702,057.00 0.901,700,000.000Advertising
1,702,057.00 0.90
BALL CORP 4.375% 15-15/12/2023 EUR 549,960.00 0.29500,000.000Storage & Warehousing
SIG COMBIBLOC PU 1.875% 20-18/06/2023 EUR 1,035,490.00 0.541,000,000.0001,585,450.00 0.83
UBISOFT ENTERTAI 1.289% 18-30/01/2023 EUR 1,322,035.00 0.701,300,000.000Computer software
1,322,035.00 0.70
EL CORTE INGLES 3.625% 20-15/03/2024 EUR 1,039,740.00 0.551,000,000.000Distribution & Wholesale
1,039,740.00 0.55
ACCOR 2.5% 17-25/01/2024 EUR 733,964.00 0.39700,000.000Lodging & Restaurants
733,964.00 0.39
WIZZ AIR FIN CO 1.35% 21-19/01/2024 EUR 511,005.00 0.27500,000.000Transportation
511,005.00 0.27
174,068,975.42 91.57
SUEZ EUR 952,375.00 0.4947,500.000
SharesEnergy
952,375.00 0.49
BEL SA EUR 390,600.00 0.21900.000Food services
390,600.00 0.21
GRANDVISION NV- W/I EUR 380,700.00 0.2013,500.000Distribution & Wholesale
380,700.00 0.20
TESSI SA EUR 258,401.00 0.141,529.000Office & Business equipment
258,401.00 0.14
1,982,076.00 1.04
ACCOR SA 0% 15/09/2021 NEUCP EUR 1,600,000.00 0.841,600,000.000
Other transferable securities
Money market instrumentsBanks
ALTICE FRANCE SA 0% 03/08/2021 NEUCP EUR 3,998,242.20 2.114,000,000.000FINCANTIERI SPA 0% 03/09/2021 EUR 1,998,579.24 1.052,000,000.000
NameQuantity/Nominal
Market valuein EUR
Currency %NAV
NEXANS SA 0% 29/09/2021 NEUCP EUR 899,887.51 0.47900,000.0008,496,708.95 4.47
8,496,708.95 4.47
RCI BANQUE 19-14/10/2021 FRN EUR 1,401,083.15 0.741,400,000.000
BondsAuto Parts & Equipment
1,401,083.15 0.74
1,401,083.15 0.74
OSTRUM TRESORERIE PLUS IC EUR EUR 3,591,797.30 1.8935.000
Funds
Investment fundsOpen-ended Funds
3,591,797.30 1.89
3,591,797.30 1.89
Total securities portfolio 189,540,640.82 99.71
NameQuantity/Nominal
Market valuein EUR
Currency %NAV
EURO-BOBL FUTURE 08/09/2021 EUR 4,006,197.00(39.000) (4,680.00)
Futures contracts
EURO-BUND FUTURE 08/09/2021 EUR 1,538,880.00(15.000) (16,050.00)
(20,730.00)
Total futures contracts (20,730.00)
NameQuantity Commitmentin EUR
Currency Unrealisedappreciation /(depreciation)
in EUR
Financial derivative instruments as at June 30, 2021
Summary of net assets
(20,730.00) (0.01)Total financial derivative instruments
%NAV
189,540,640.82 99.71Total securities portfolio
1,050,005.73 0.55Cash at bank
(480,002.76) (0.25)Other assets and liabilities
190,089,913.79 100.00Total net assets
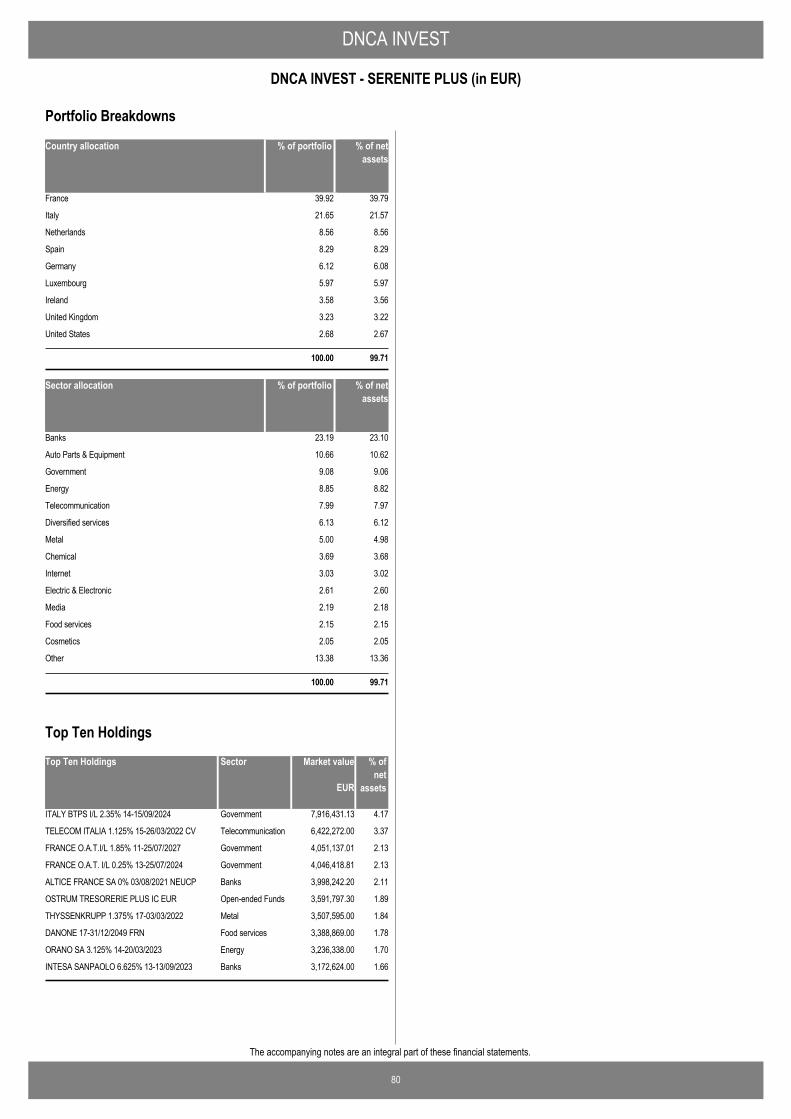
DNCA INVEST
80
DNCA INVEST - SERENITE PLUS (in EUR)
The accompanying notes are an integral part of these financial statements.
Country allocation % of portfolio % of netassets
France 39.92 39.79
Italy 21.65 21.57
Netherlands 8.56 8.56
Spain 8.29 8.29
Germany 6.12 6.08
Luxembourg 5.97 5.97
Ireland 3.58 3.56
United Kingdom 3.23 3.22
United States 2.68 2.67
100.00 99.71
Sector allocation % of portfolio % of netassets
Banks 23.19 23.10
Auto Parts & Equipment 10.66 10.62
Government 9.08 9.06
Energy 8.85 8.82
Telecommunication 7.99 7.97
Diversified services 6.13 6.12
Metal 5.00 4.98
Chemical 3.69 3.68
Internet 3.03 3.02
Electric & Electronic 2.61 2.60
Media 2.19 2.18
Food services 2.15 2.15
Cosmetics 2.05 2.05
Other 13.38 13.36
100.00 99.71
Portfolio Breakdowns
Top Ten Holdings Market value % ofnet
assets
ITALY BTPS I/L 2.35% 14-15/09/2024 7,916,431.13 4.17Government
TELECOM ITALIA 1.125% 15-26/03/2022 CV 6,422,272.00 3.37Telecommunication
FRANCE O.A.T.I/L 1.85% 11-25/07/2027 4,051,137.01 2.13Government
FRANCE O.A.T. I/L 0.25% 13-25/07/2024 4,046,418.81 2.13Government
ALTICE FRANCE SA 0% 03/08/2021 NEUCP 3,998,242.20 2.11Banks
OSTRUM TRESORERIE PLUS IC EUR 3,591,797.30 1.89Open-ended Funds
THYSSENKRUPP 1.375% 17-03/03/2022 3,507,595.00 1.84Metal
DANONE 17-31/12/2049 FRN 3,388,869.00 1.78Food services
ORANO SA 3.125% 14-20/03/2023 3,236,338.00 1.70Energy
INTESA SANPAOLO 6.625% 13-13/09/2023 3,172,624.00 1.66Banks
EUR
Sector
Top Ten Holdings
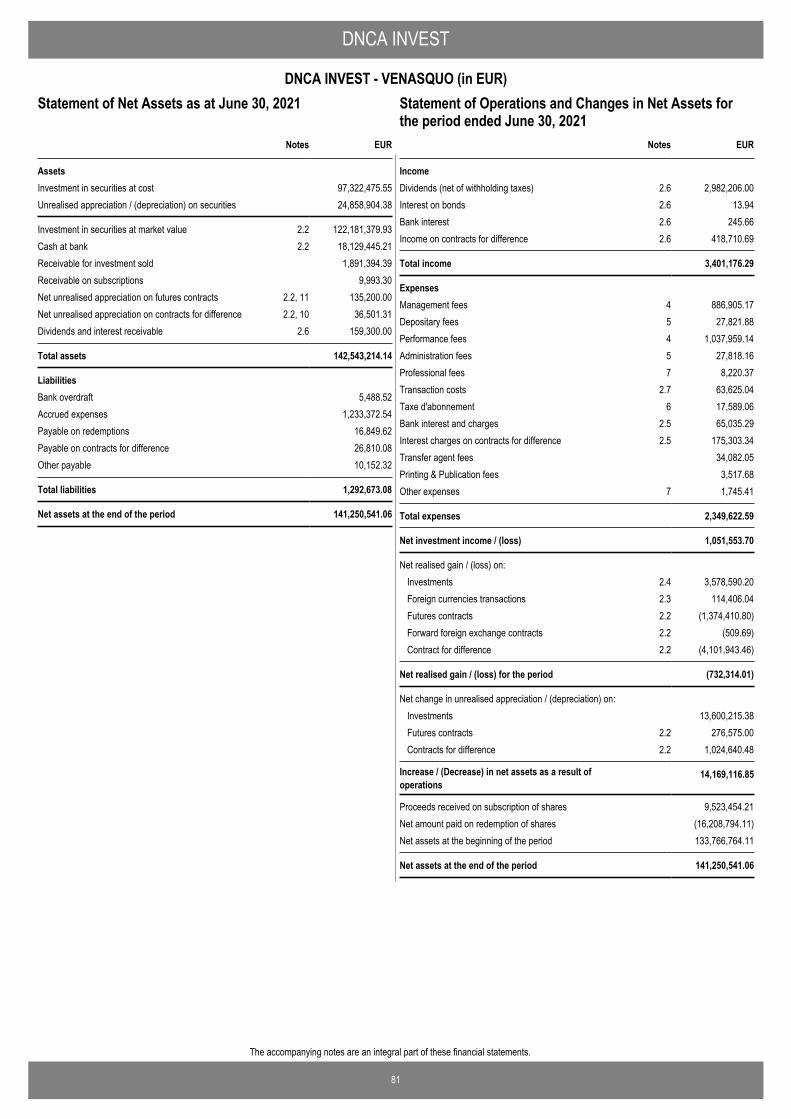
81
The accompanying notes are an integral part of these financial statements.
DNCA INVEST
DNCA INVEST - VENASQUO (in EUR)Statement of Operations and Changes in Net Assets for theperiod ended June 30, 2021
EUR
AssetsInvestment in securities at cost 97,322,475.55Unrealised appreciation / (depreciation) on securities 24,858,904.38
Investment in securities at market value 2.2 122,181,379.93Cash at bank 2.2 18,129,445.21Receivable for investment sold 1,891,394.39Receivable on subscriptions 9,993.30Net unrealised appreciation on futures contracts 2.2, 11 135,200.00Net unrealised appreciation on contracts for difference 2.2, 10 36,501.31Dividends and interest receivable 2.6 159,300.00
Total assets 142,543,214.14
LiabilitiesBank overdraft 5,488.52Accrued expenses 1,233,372.54Payable on redemptions 16,849.62Payable on contracts for difference 26,810.08Other payable 10,152.32
Total liabilities 1,292,673.08
Net assets at the end of the period 141,250,541.06
Notes
Statement of Net Assets as at June 30, 2021
IncomeDividends (net of withholding taxes) 2.6 2,982,206.00Interest on bonds 2.6 13.94Bank interest 2.6 245.66Income on contracts for difference 2.6 418,710.69
Total income 3,401,176.29
ExpensesManagement fees 4 886,905.17Depositary fees 5 27,821.88Performance fees 4 1,037,959.14Administration fees 5 27,818.16Professional fees 7 8,220.37Transaction costs 2.7 63,625.04Taxe d'abonnement 6 17,589.06Bank interest and charges 2.5 65,035.29Interest charges on contracts for difference 2.5 175,303.34Transfer agent fees 34,082.05Printing & Publication fees 3,517.68Other expenses 7 1,745.41
Total expenses 2,349,622.59
Net investment income / (loss) 1,051,553.70
Net realised gain / (loss) on: Investments 2.4 3,578,590.20Foreign currencies transactions 2.3 114,406.04Futures contracts 2.2 (1,374,410.80)Forward foreign exchange contracts 2.2 (509.69)Contract for difference 2.2 (4,101,943.46)
Net realised gain / (loss) for the period (732,314.01)
Net change in unrealised appreciation / (depreciation) on: Investments 13,600,215.38Futures contracts 2.2 276,575.00Contracts for difference 2.2 1,024,640.48
Increase / (Decrease) in net assets as a result ofoperations
14,169,116.85
Proceeds received on subscription of shares 9,523,454.21Net amount paid on redemption of shares (16,208,794.11)Net assets at the beginning of the period 133,766,764.11
Net assets at the end of the period 141,250,541.06
EURNotes
Statement of Operations and Changes in Net Assets forthe period ended June 30, 2021

82
The accompanying notes are an integral part of these financial statements.
DNCA INVEST
DNCA INVEST - VENASQUO (in EUR)
Number of shares in issue atthe end of the period
Number of shares in issue atthe beginning of the period
Number of sharesissued
Number of sharesredeemed
Statement of Changes in Number of Shares
Class A shares EUR 210,733.726 1,680.333 (29,626.484) 182,787.575
Class B shares EUR 267,771.326 20,221.610 (49,649.078) 238,343.858
Class I shares EUR 733,358.031 55,565.808 (44,485.961) 744,437.878
Class N shares EUR 20,766.890 - (18,743.781) 2,023.109
Class Q shares EUR 8,474.713 3,714.129 (1,863.001) 10,325.841
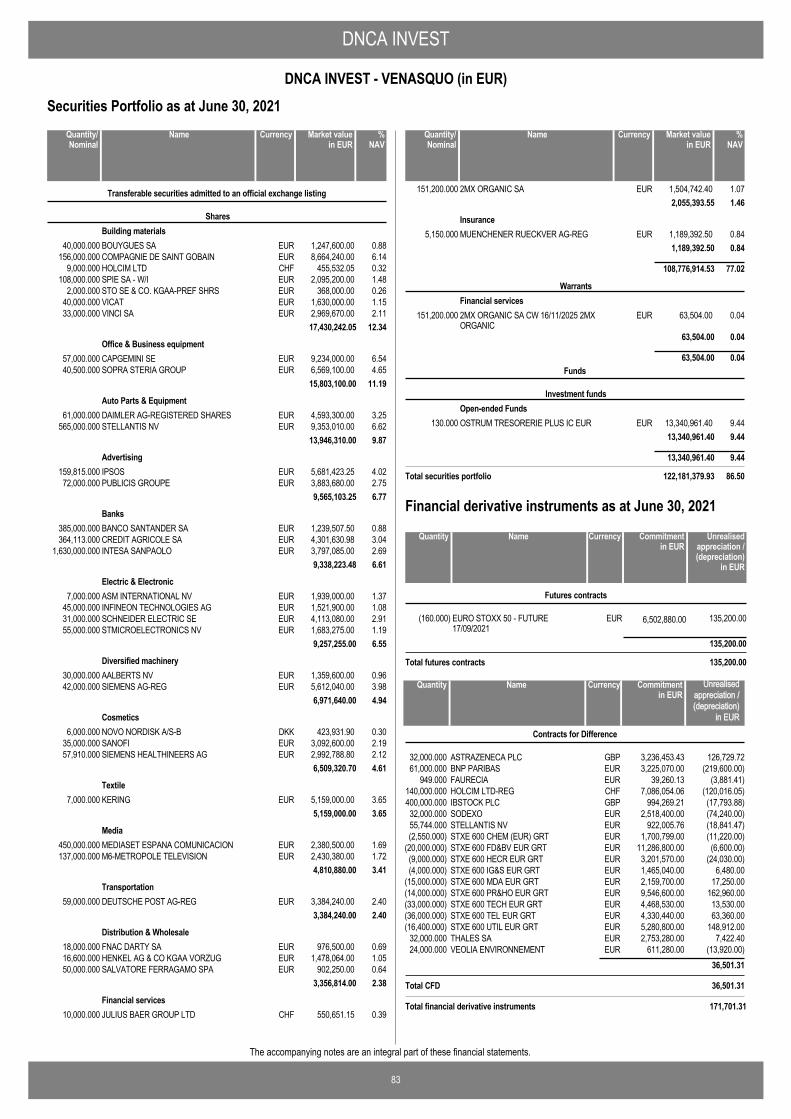
DNCA INVEST
83
DNCA INVEST - VENASQUO (in EUR)
The accompanying notes are an integral part of these financial statements.
Securities Portfolio as at June 30, 2021
BOUYGUES SA EUR 1,247,600.00 0.8840,000.000
Transferable securities admitted to an official exchange listing
SharesBuilding materials
COMPAGNIE DE SAINT GOBAIN EUR 8,664,240.00 6.14156,000.000HOLCIM LTD CHF 455,532.05 0.329,000.000SPIE SA - W/I EUR 2,095,200.00 1.48108,000.000STO SE & CO. KGAA-PREF SHRS EUR 368,000.00 0.262,000.000VICAT EUR 1,630,000.00 1.1540,000.000VINCI SA EUR 2,969,670.00 2.1133,000.000
17,430,242.05 12.34
CAPGEMINI SE EUR 9,234,000.00 6.5457,000.000Office & Business equipment
SOPRA STERIA GROUP EUR 6,569,100.00 4.6540,500.00015,803,100.00 11.19
DAIMLER AG-REGISTERED SHARES EUR 4,593,300.00 3.2561,000.000Auto Parts & Equipment
STELLANTIS NV EUR 9,353,010.00 6.62565,000.00013,946,310.00 9.87
IPSOS EUR 5,681,423.25 4.02159,815.000Advertising
PUBLICIS GROUPE EUR 3,883,680.00 2.7572,000.0009,565,103.25 6.77
BANCO SANTANDER SA EUR 1,239,507.50 0.88385,000.000Banks
CREDIT AGRICOLE SA EUR 4,301,630.98 3.04364,113.000INTESA SANPAOLO EUR 3,797,085.00 2.691,630,000.000
9,338,223.48 6.61
ASM INTERNATIONAL NV EUR 1,939,000.00 1.377,000.000Electric & Electronic
INFINEON TECHNOLOGIES AG EUR 1,521,900.00 1.0845,000.000SCHNEIDER ELECTRIC SE EUR 4,113,080.00 2.9131,000.000STMICROELECTRONICS NV EUR 1,683,275.00 1.1955,000.000
9,257,255.00 6.55
AALBERTS NV EUR 1,359,600.00 0.9630,000.000Diversified machinery
SIEMENS AG-REG EUR 5,612,040.00 3.9842,000.0006,971,640.00 4.94
NOVO NORDISK A/S-B DKK 423,931.90 0.306,000.000Cosmetics
SANOFI EUR 3,092,600.00 2.1935,000.000SIEMENS HEALTHINEERS AG EUR 2,992,788.80 2.1257,910.000
6,509,320.70 4.61
KERING EUR 5,159,000.00 3.657,000.000Textile
5,159,000.00 3.65
MEDIASET ESPANA COMUNICACION EUR 2,380,500.00 1.69450,000.000Media
M6-METROPOLE TELEVISION EUR 2,430,380.00 1.72137,000.0004,810,880.00 3.41
DEUTSCHE POST AG-REG EUR 3,384,240.00 2.4059,000.000Transportation
3,384,240.00 2.40
FNAC DARTY SA EUR 976,500.00 0.6918,000.000Distribution & Wholesale
HENKEL AG & CO KGAA VORZUG EUR 1,478,064.00 1.0516,600.000SALVATORE FERRAGAMO SPA EUR 902,250.00 0.6450,000.000
3,356,814.00 2.38
JULIUS BAER GROUP LTD CHF 550,651.15 0.3910,000.000Financial services
NameQuantity/Nominal
Market valuein EUR
Currency %NAV
2MX ORGANIC SA EUR 1,504,742.40 1.07151,200.0002,055,393.55 1.46
MUENCHENER RUECKVER AG-REG EUR 1,189,392.50 0.845,150.000Insurance
1,189,392.50 0.84
108,776,914.53 77.02
2MX ORGANIC SA CW 16/11/2025 2MXORGANIC
EUR 63,504.00 0.04151,200.000
WarrantsFinancial services
63,504.00 0.04
63,504.00 0.04
OSTRUM TRESORERIE PLUS IC EUR EUR 13,340,961.40 9.44130.000
Funds
Investment fundsOpen-ended Funds
13,340,961.40 9.44
13,340,961.40 9.44
Total securities portfolio 122,181,379.93 86.50
NameQuantity/Nominal
Market valuein EUR
Currency %NAV
EURO STOXX 50 - FUTURE17/09/2021
EUR 6,502,880.00(160.000) 135,200.00
Futures contracts
135,200.00
Total futures contracts 135,200.00
NameQuantity Commitmentin EUR
Currency Unrealisedappreciation /(depreciation)
in EUR
Financial derivative instruments as at June 30, 2021
ASTRAZENECA PLC GBP 126,729.723,236,453.4332,000.000
Contracts for Difference
NameQuantity Currency Commitmentin EUR
BNP PARIBAS EUR (219,600.00)3,225,070.0061,000.000FAURECIA EUR (3,881.41)39,260.13949.000HOLCIM LTD-REG CHF (120,016.05)7,086,054.06140,000.000IBSTOCK PLC GBP (17,793.88)994,269.21400,000.000SODEXO EUR (74,240.00)2,518,400.0032,000.000STELLANTIS NV EUR (18,841.47)922,005.7655,744.000STXE 600 CHEM (EUR) GRT EUR (11,220.00)1,700,799.00(2,550.000)STXE 600 FD&BV EUR GRT EUR (6,600.00)11,286,800.00(20,000.000)STXE 600 HECR EUR GRT EUR (24,030.00)3,201,570.00(9,000.000)STXE 600 IG&S EUR GRT EUR 6,480.001,465,040.00(4,000.000)STXE 600 MDA EUR GRT EUR 17,250.002,159,700.00(15,000.000)STXE 600 PR&HO EUR GRT EUR 162,960.009,546,600.00(14,000.000)STXE 600 TECH EUR GRT EUR 13,530.004,468,530.00(33,000.000)STXE 600 TEL EUR GRT EUR 63,360.004,330,440.00(36,000.000)STXE 600 UTIL EUR GRT EUR 148,912.005,280,800.00(16,400.000)THALES SA EUR 7,422.402,753,280.0032,000.000VEOLIA ENVIRONNEMENT EUR (13,920.00)611,280.0024,000.000
36,501.31
Total CFD 36,501.31
Total financial derivative instruments 171,701.31
Unrealisedappreciation /(depreciation)
in EUR
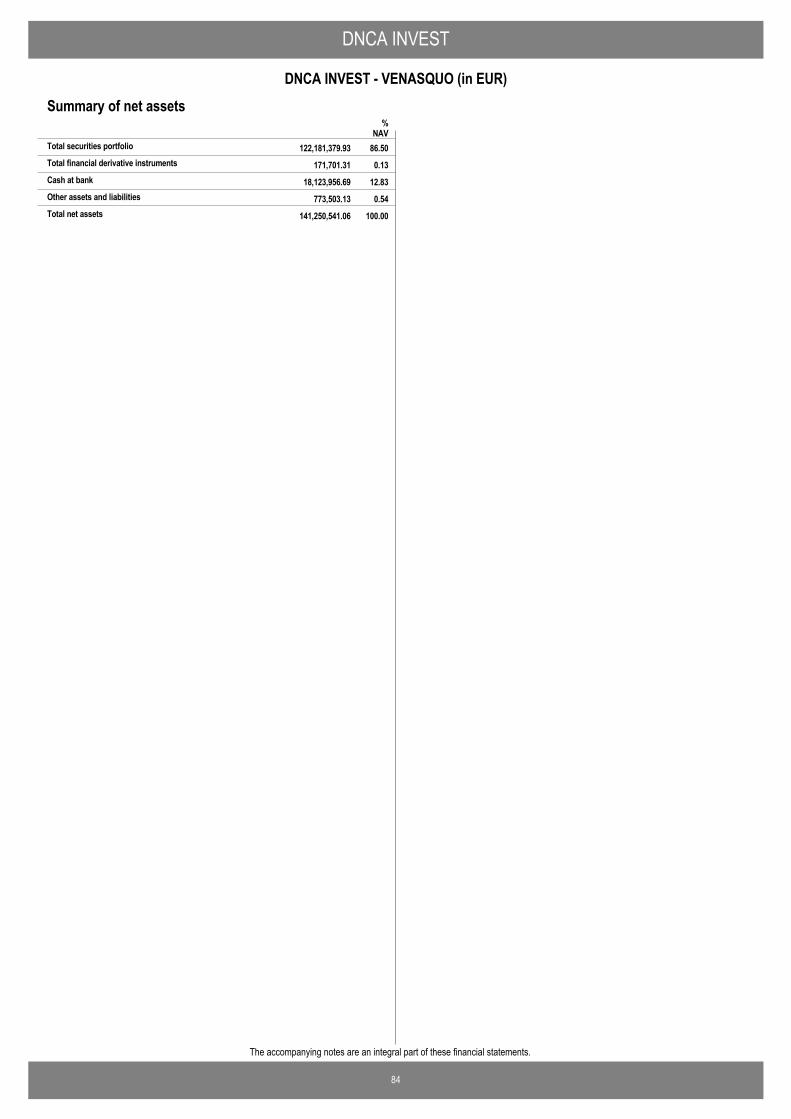
DNCA INVEST
84
DNCA INVEST - VENASQUO (in EUR)
The accompanying notes are an integral part of these financial statements.
Summary of net assets
171,701.31 0.13Total financial derivative instruments
%NAV
122,181,379.93 86.50Total securities portfolio
18,123,956.69 12.83Cash at bank
773,503.13 0.54Other assets and liabilities
141,250,541.06 100.00Total net assets
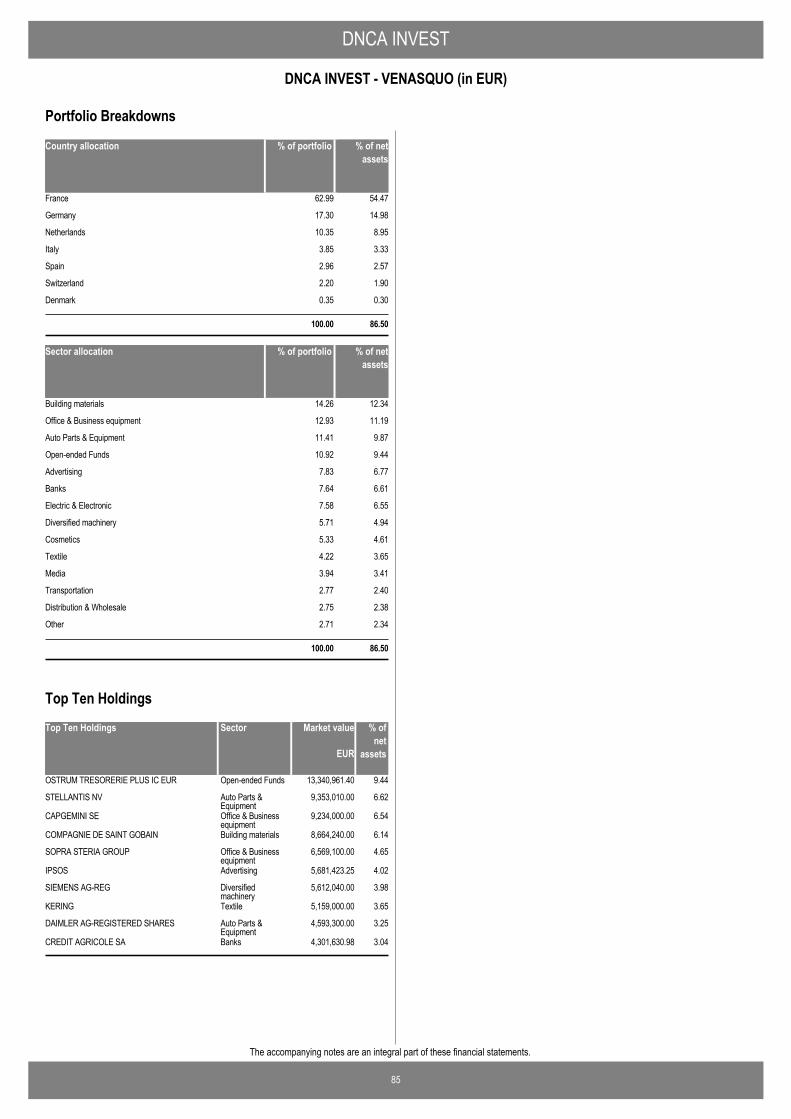
DNCA INVEST
85
DNCA INVEST - VENASQUO (in EUR)
The accompanying notes are an integral part of these financial statements.
Country allocation % of portfolio % of netassets
France 62.99 54.47
Germany 17.30 14.98
Netherlands 10.35 8.95
Italy 3.85 3.33
Spain 2.96 2.57
Switzerland 2.20 1.90
Denmark 0.35 0.30
100.00 86.50
Sector allocation % of portfolio % of netassets
Building materials 14.26 12.34
Office & Business equipment 12.93 11.19
Auto Parts & Equipment 11.41 9.87
Open-ended Funds 10.92 9.44
Advertising 7.83 6.77
Banks 7.64 6.61
Electric & Electronic 7.58 6.55
Diversified machinery 5.71 4.94
Cosmetics 5.33 4.61
Textile 4.22 3.65
Media 3.94 3.41
Transportation 2.77 2.40
Distribution & Wholesale 2.75 2.38
Other 2.71 2.34
100.00 86.50
Portfolio Breakdowns
Top Ten Holdings Market value % ofnet
assets
OSTRUM TRESORERIE PLUS IC EUR 13,340,961.40 9.44Open-ended Funds
STELLANTIS NV 9,353,010.00 6.62Auto Parts &Equipment
CAPGEMINI SE 9,234,000.00 6.54Office & Businessequipment
COMPAGNIE DE SAINT GOBAIN 8,664,240.00 6.14Building materials
SOPRA STERIA GROUP 6,569,100.00 4.65Office & Businessequipment
IPSOS 5,681,423.25 4.02Advertising
SIEMENS AG-REG 5,612,040.00 3.98Diversifiedmachinery
KERING 5,159,000.00 3.65Textile
DAIMLER AG-REGISTERED SHARES 4,593,300.00 3.25Auto Parts &Equipment
CREDIT AGRICOLE SA 4,301,630.98 3.04Banks
EUR
Sector
Top Ten Holdings
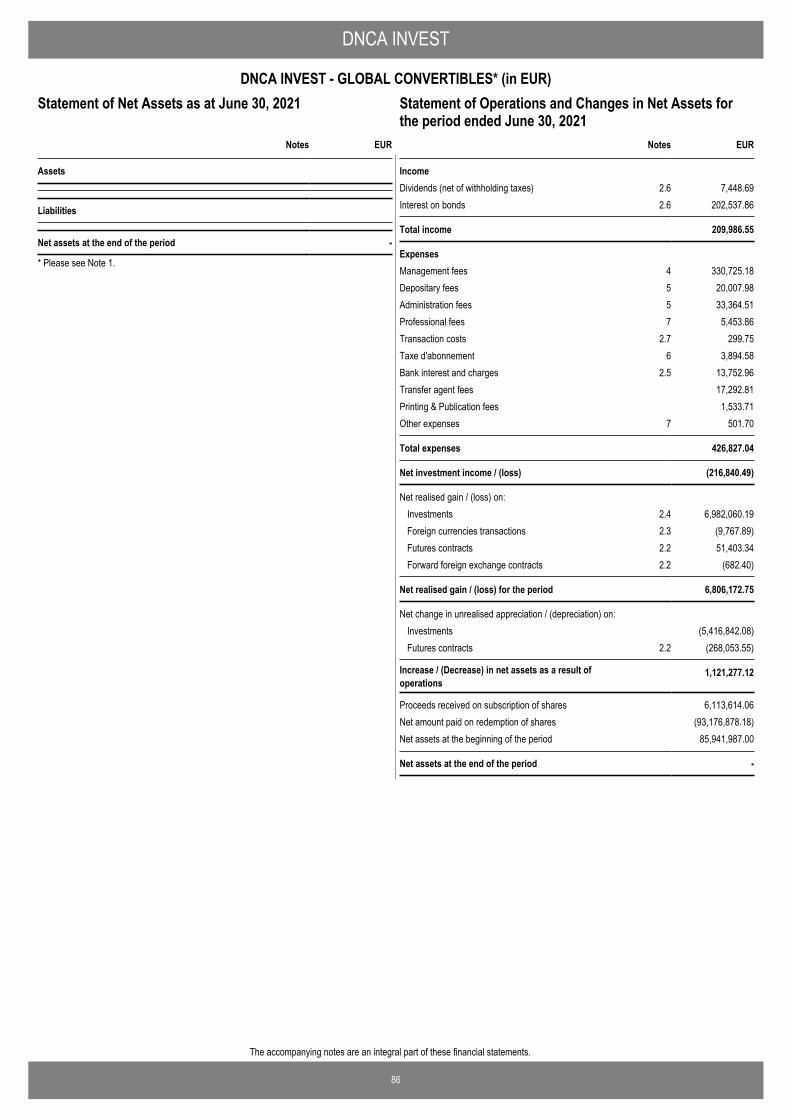
86
The accompanying notes are an integral part of these financial statements.
DNCA INVEST
DNCA INVEST - GLOBAL CONVERTIBLES* (in EUR)Statement of Operations and Changes in Net Assets for theperiod ended June 30, 2021
EUR
Assets
Liabilities
Net assets at the end of the period -
Notes
Statement of Net Assets as at June 30, 2021
* Please see Note 1.
IncomeDividends (net of withholding taxes) 2.6 7,448.69Interest on bonds 2.6 202,537.86
Total income 209,986.55
ExpensesManagement fees 4 330,725.18Depositary fees 5 20,007.98Administration fees 5 33,364.51Professional fees 7 5,453.86Transaction costs 2.7 299.75Taxe d'abonnement 6 3,894.58Bank interest and charges 2.5 13,752.96Transfer agent fees 17,292.81Printing & Publication fees 1,533.71Other expenses 7 501.70
Total expenses 426,827.04
Net investment income / (loss) (216,840.49)
Net realised gain / (loss) on: Investments 2.4 6,982,060.19Foreign currencies transactions 2.3 (9,767.89)Futures contracts 2.2 51,403.34Forward foreign exchange contracts 2.2 (682.40)
Net realised gain / (loss) for the period 6,806,172.75
Net change in unrealised appreciation / (depreciation) on: Investments (5,416,842.08)Futures contracts 2.2 (268,053.55)
Increase / (Decrease) in net assets as a result ofoperations
1,121,277.12
Proceeds received on subscription of shares 6,113,614.06Net amount paid on redemption of shares (93,176,878.18)Net assets at the beginning of the period 85,941,987.00
Net assets at the end of the period -
EURNotes
Statement of Operations and Changes in Net Assets forthe period ended June 30, 2021
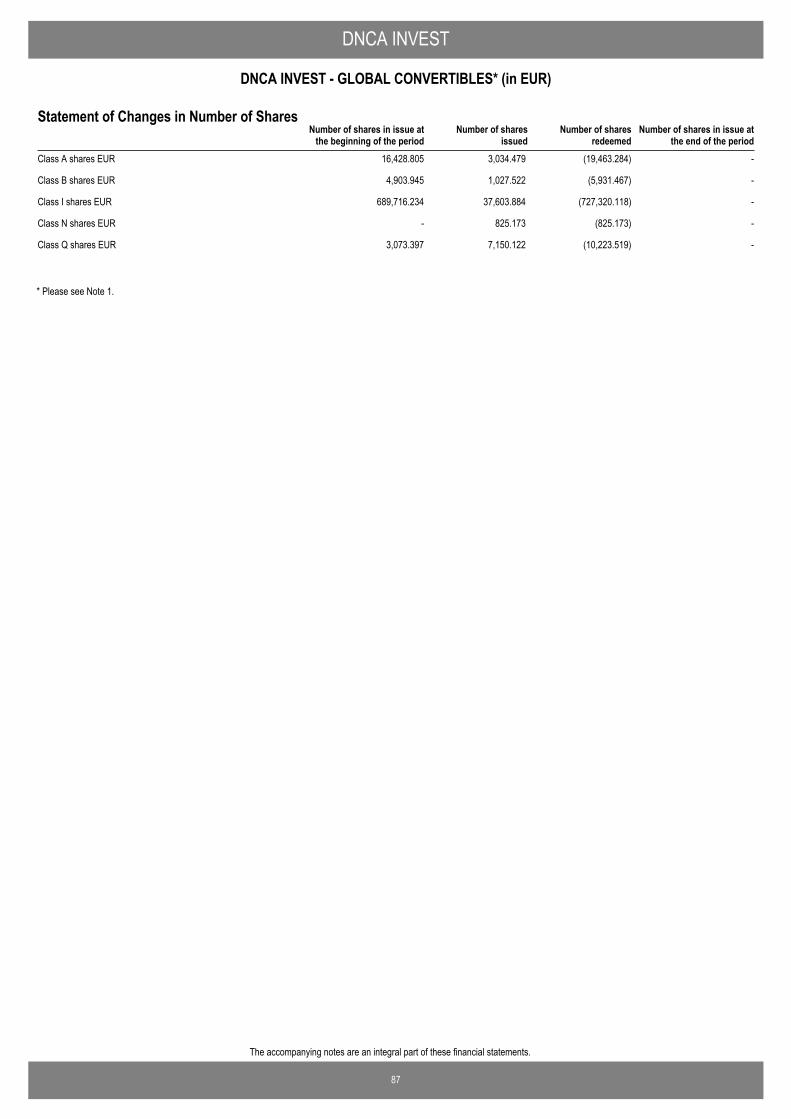
87
The accompanying notes are an integral part of these financial statements.
DNCA INVEST
DNCA INVEST - GLOBAL CONVERTIBLES* (in EUR)
Number of shares in issue atthe end of the period
Number of shares in issue atthe beginning of the period
Number of sharesissued
Number of sharesredeemed
Statement of Changes in Number of Shares
Class A shares EUR 16,428.805 3,034.479 (19,463.284) -
Class B shares EUR 4,903.945 1,027.522 (5,931.467) -
Class I shares EUR 689,716.234 37,603.884 (727,320.118) -
Class N shares EUR - 825.173 (825.173) -
Class Q shares EUR 3,073.397 7,150.122 (10,223.519) -
* Please see Note 1.
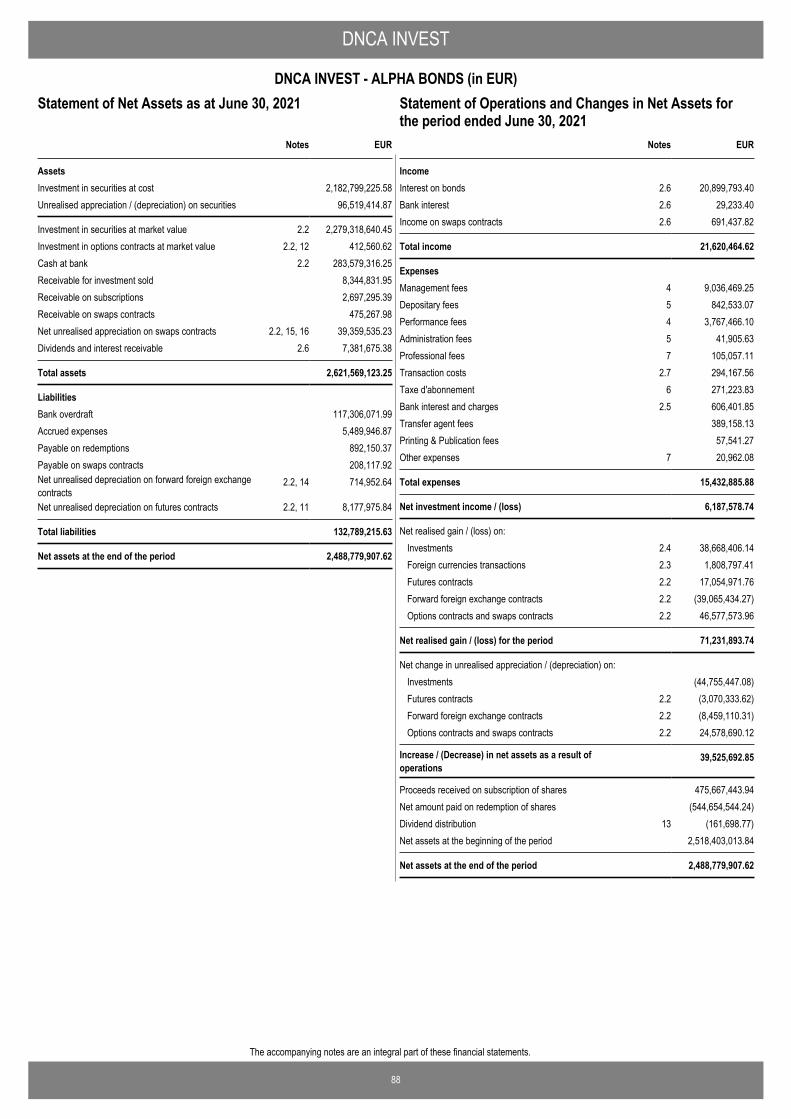
88
The accompanying notes are an integral part of these financial statements.
DNCA INVEST
DNCA INVEST - ALPHA BONDS (in EUR)Statement of Operations and Changes in Net Assets for theperiod ended June 30, 2021
EUR
AssetsInvestment in securities at cost 2,182,799,225.58Unrealised appreciation / (depreciation) on securities 96,519,414.87
Investment in securities at market value 2.2 2,279,318,640.45Investment in options contracts at market value 2.2, 12 412,560.62Cash at bank 2.2 283,579,316.25Receivable for investment sold 8,344,831.95Receivable on subscriptions 2,697,295.39Receivable on swaps contracts 475,267.98Net unrealised appreciation on swaps contracts 2.2, 15, 16 39,359,535.23Dividends and interest receivable 2.6 7,381,675.38
Total assets 2,621,569,123.25
LiabilitiesBank overdraft 117,306,071.99Accrued expenses 5,489,946.87Payable on redemptions 892,150.37Payable on swaps contracts 208,117.92Net unrealised depreciation on forward foreign exchangecontracts
2.2, 14 714,952.64
Net unrealised depreciation on futures contracts 2.2, 11 8,177,975.84
Total liabilities 132,789,215.63
Net assets at the end of the period 2,488,779,907.62
Notes
Statement of Net Assets as at June 30, 2021
IncomeInterest on bonds 2.6 20,899,793.40Bank interest 2.6 29,233.40Income on swaps contracts 2.6 691,437.82
Total income 21,620,464.62
ExpensesManagement fees 4 9,036,469.25Depositary fees 5 842,533.07Performance fees 4 3,767,466.10Administration fees 5 41,905.63Professional fees 7 105,057.11Transaction costs 2.7 294,167.56Taxe d'abonnement 6 271,223.83Bank interest and charges 2.5 606,401.85Transfer agent fees 389,158.13Printing & Publication fees 57,541.27Other expenses 7 20,962.08
Total expenses 15,432,885.88
Net investment income / (loss) 6,187,578.74
Net realised gain / (loss) on: Investments 2.4 38,668,406.14Foreign currencies transactions 2.3 1,808,797.41Futures contracts 2.2 17,054,971.76Forward foreign exchange contracts 2.2 (39,065,434.27)Options contracts and swaps contracts 2.2 46,577,573.96
Net realised gain / (loss) for the period 71,231,893.74
Net change in unrealised appreciation / (depreciation) on: Investments (44,755,447.08)Futures contracts 2.2 (3,070,333.62)Forward foreign exchange contracts 2.2 (8,459,110.31)Options contracts and swaps contracts 2.2 24,578,690.12
Increase / (Decrease) in net assets as a result ofoperations
39,525,692.85
Proceeds received on subscription of shares 475,667,443.94Net amount paid on redemption of shares (544,654,544.24)Dividend distribution 13 (161,698.77)Net assets at the beginning of the period 2,518,403,013.84
Net assets at the end of the period 2,488,779,907.62
EURNotes
Statement of Operations and Changes in Net Assets forthe period ended June 30, 2021
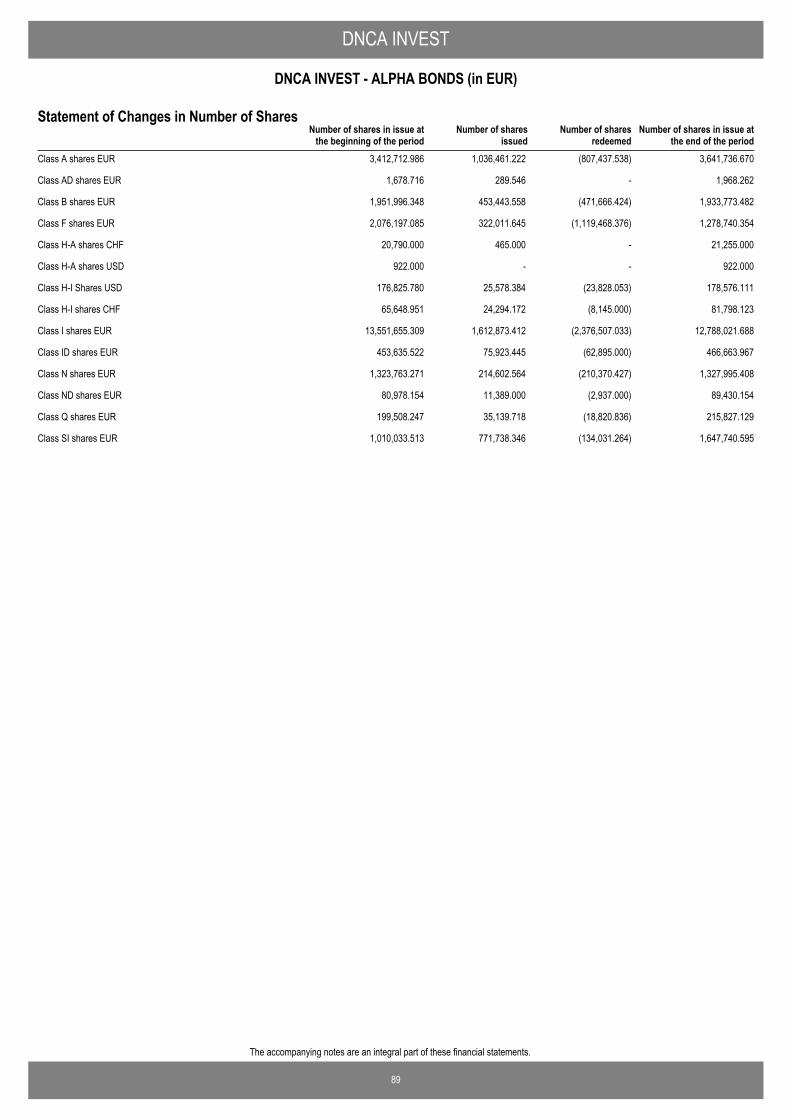
89
The accompanying notes are an integral part of these financial statements.
DNCA INVEST
DNCA INVEST - ALPHA BONDS (in EUR)
Number of shares in issue atthe end of the period
Number of shares in issue atthe beginning of the period
Number of sharesissued
Number of sharesredeemed
Statement of Changes in Number of Shares
Class A shares EUR 3,412,712.986 1,036,461.222 (807,437.538) 3,641,736.670
Class AD shares EUR 1,678.716 289.546 - 1,968.262
Class B shares EUR 1,951,996.348 453,443.558 (471,666.424) 1,933,773.482
Class F shares EUR 2,076,197.085 322,011.645 (1,119,468.376) 1,278,740.354
Class H-A shares CHF 20,790.000 465.000 - 21,255.000
Class H-A shares USD 922.000 - - 922.000
Class H-I Shares USD 176,825.780 25,578.384 (23,828.053) 178,576.111
Class H-I shares CHF 65,648.951 24,294.172 (8,145.000) 81,798.123
Class I shares EUR 13,551,655.309 1,612,873.412 (2,376,507.033) 12,788,021.688
Class ID shares EUR 453,635.522 75,923.445 (62,895.000) 466,663.967
Class N shares EUR 1,323,763.271 214,602.564 (210,370.427) 1,327,995.408
Class ND shares EUR 80,978.154 11,389.000 (2,937.000) 89,430.154
Class Q shares EUR 199,508.247 35,139.718 (18,820.836) 215,827.129
Class SI shares EUR 1,010,033.513 771,738.346 (134,031.264) 1,647,740.595
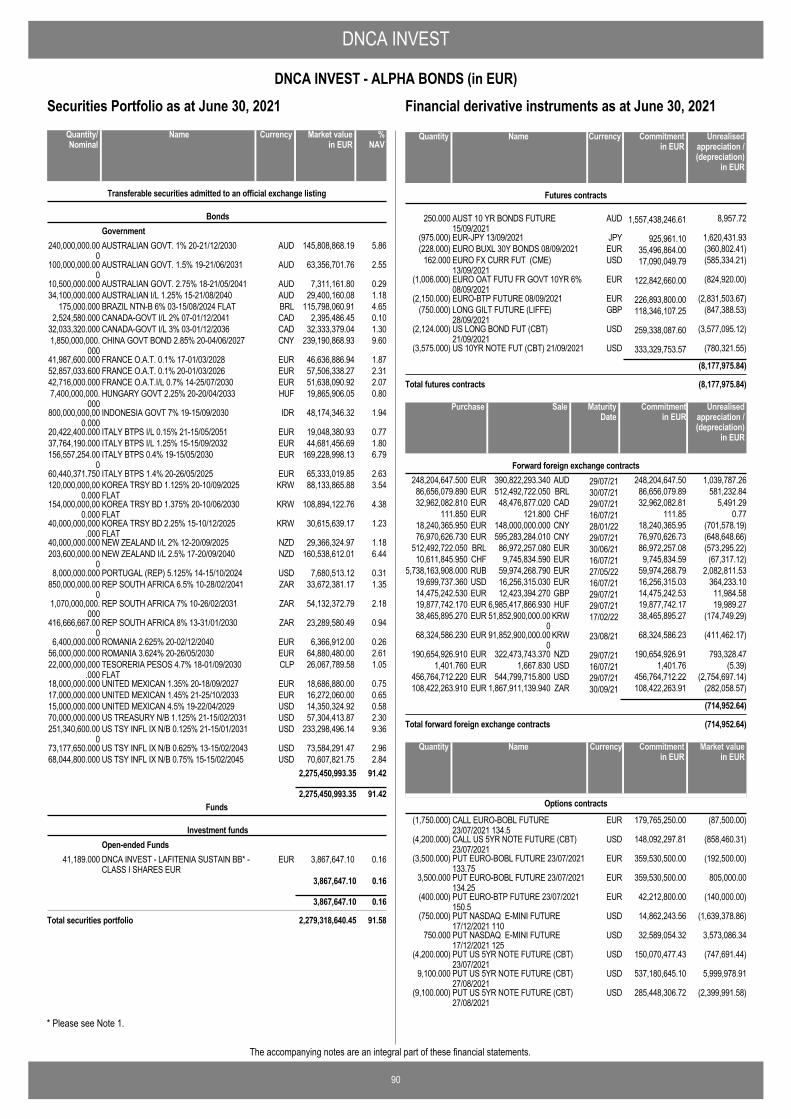
DNCA INVEST
90
DNCA INVEST - ALPHA BONDS (in EUR)
The accompanying notes are an integral part of these financial statements.
Securities Portfolio as at June 30, 2021
AUSTRALIAN GOVT. 1% 20-21/12/2030 AUD 145,808,868.19 5.86240,000,000.000
Transferable securities admitted to an official exchange listing
BondsGovernment
AUSTRALIAN GOVT. 1.5% 19-21/06/2031 AUD 63,356,701.76 2.55100,000,000.000
AUSTRALIAN GOVT. 2.75% 18-21/05/2041 AUD 7,311,161.80 0.2910,500,000.000AUSTRALIAN I/L 1.25% 15-21/08/2040 AUD 29,400,160.08 1.1834,100,000.000BRAZIL NTN-B 6% 03-15/08/2024 FLAT BRL 115,798,060.91 4.65175,000.000CANADA-GOVT I/L 2% 07-01/12/2041 CAD 2,395,486.45 0.102,524,580.000CANADA-GOVT I/L 3% 03-01/12/2036 CAD 32,333,379.04 1.3032,033,320.000CHINA GOVT BOND 2.85% 20-04/06/2027 CNY 239,190,868.93 9.601,850,000,000.
000FRANCE O.A.T. 0.1% 17-01/03/2028 EUR 46,636,886.94 1.8741,987,600.000FRANCE O.A.T. 0.1% 20-01/03/2026 EUR 57,506,338.27 2.3152,857,033.600FRANCE O.A.T.I/L 0.7% 14-25/07/2030 EUR 51,638,090.92 2.0742,716,000.000HUNGARY GOVT 2.25% 20-20/04/2033 HUF 19,865,906.05 0.807,400,000,000.
000INDONESIA GOVT 7% 19-15/09/2030 IDR 48,174,346.32 1.94800,000,000,00
0.000ITALY BTPS I/L 0.15% 21-15/05/2051 EUR 19,048,380.93 0.7720,422,400.000ITALY BTPS I/L 1.25% 15-15/09/2032 EUR 44,681,456.69 1.8037,764,190.000ITALY BTPS 0.4% 19-15/05/2030 EUR 169,228,998.13 6.79156,557,254.00
0ITALY BTPS 1.4% 20-26/05/2025 EUR 65,333,019.85 2.6360,440,371.750KOREA TRSY BD 1.125% 20-10/09/2025FLAT
KRW 88,133,865.88 3.54120,000,000,000.000
KOREA TRSY BD 1.375% 20-10/06/2030FLAT
KRW 108,894,122.76 4.38154,000,000,000.000
KOREA TRSY BD 2.25% 15-10/12/2025FLAT
KRW 30,615,639.17 1.2340,000,000,000.000
NEW ZEALAND I/L 2% 12-20/09/2025 NZD 29,366,324.97 1.1840,000,000.000NEW ZEALAND I/L 2.5% 17-20/09/2040 NZD 160,538,612.01 6.44203,600,000.00
0PORTUGAL (REP) 5.125% 14-15/10/2024 USD 7,680,513.12 0.318,000,000.000REP SOUTH AFRICA 6.5% 10-28/02/2041 ZAR 33,672,381.17 1.35850,000,000.00
0REP SOUTH AFRICA 7% 10-26/02/2031 ZAR 54,132,372.79 2.181,070,000,000.
000REP SOUTH AFRICA 8% 13-31/01/2030 ZAR 23,289,580.49 0.94416,666,667.00
0ROMANIA 2.625% 20-02/12/2040 EUR 6,366,912.00 0.266,400,000.000ROMANIA 3.624% 20-26/05/2030 EUR 64,880,480.00 2.6156,000,000.000TESORERIA PESOS 4.7% 18-01/09/2030FLAT
CLP 26,067,789.58 1.0522,000,000,000.000
UNITED MEXICAN 1.35% 20-18/09/2027 EUR 18,686,880.00 0.7518,000,000.000UNITED MEXICAN 1.45% 21-25/10/2033 EUR 16,272,060.00 0.6517,000,000.000UNITED MEXICAN 4.5% 19-22/04/2029 USD 14,350,324.92 0.5815,000,000.000US TREASURY N/B 1.125% 21-15/02/2031 USD 57,304,413.87 2.3070,000,000.000US TSY INFL IX N/B 0.125% 21-15/01/2031 USD 233,298,496.14 9.36251,340,600.00
0US TSY INFL IX N/B 0.625% 13-15/02/2043 USD 73,584,291.47 2.9673,177,650.000US TSY INFL IX N/B 0.75% 15-15/02/2045 USD 70,607,821.75 2.8468,044,800.000
2,275,450,993.35 91.42
2,275,450,993.35 91.42
DNCA INVEST - LAFITENIA SUSTAIN BB* -CLASS I SHARES EUR
EUR 3,867,647.10 0.1641,189.000
Funds
Investment fundsOpen-ended Funds
3,867,647.10 0.16
3,867,647.10 0.16
Total securities portfolio 2,279,318,640.45 91.58
NameQuantity/Nominal
Market valuein EUR
Currency %NAV
AUST 10 YR BONDS FUTURE15/09/2021
AUD 1,557,438,246.61250.000 8,957.72
Futures contracts
EUR-JPY 13/09/2021 JPY 925,961.10(975.000) 1,620,431.93EURO BUXL 30Y BONDS 08/09/2021 EUR 35,496,864.00(228.000) (360,802.41)EURO FX CURR FUT (CME)13/09/2021
USD 17,090,049.79162.000 (585,334.21)
EURO OAT FUTU FR GOVT 10YR 6%08/09/2021
EUR 122,842,660.00(1,006.000) (824,920.00)
EURO-BTP FUTURE 08/09/2021 EUR 226,893,800.00(2,150.000) (2,831,503.67)LONG GILT FUTURE (LIFFE)28/09/2021
GBP 118,346,107.25(750.000) (847,388.53)
US LONG BOND FUT (CBT)21/09/2021
USD 259,338,087.60(2,124.000) (3,577,095.12)
US 10YR NOTE FUT (CBT) 21/09/2021 USD 333,329,753.57(3,575.000) (780,321.55)
(8,177,975.84)
Total futures contracts (8,177,975.84)
NameQuantity Commitmentin EUR
Currency Unrealisedappreciation /(depreciation)
in EUR
Financial derivative instruments as at June 30, 2021
390,822,293.340 29/07/21248,204,647.500 1,039,787.26AUDEUR 248,204,647.50Forward foreign exchange contracts
512,492,722.050 30/07/2186,656,079.890 581,232.84BRLEUR 86,656,079.8948,476,877.020 29/07/2132,962,082.810 5,491.29CADEUR 32,962,082.81
121.800 16/07/21111.850 0.77CHFEUR 111.85148,000,000.000 28/01/2218,240,365.950 (701,578.19)CNYEUR 18,240,365.95595,283,284.010 29/07/2176,970,626.730 (648,648.66)CNYEUR 76,970,626.7386,972,257.080 30/06/21512,492,722.050 (573,295.22)EURBRL 86,972,257.089,745,834.590 16/07/2110,611,845.950 (67,317.12)EURCHF 9,745,834.59
59,974,268.790 27/05/225,738,163,908.000 2,082,811.53EURRUB 59,974,268.7916,256,315.030 16/07/2119,699,737.360 364,233.10EURUSD 16,256,315.0312,423,394.270 29/07/2114,475,242.530 11,984.58GBPEUR 14,475,242.53
6,985,417,866.930 29/07/2119,877,742.170 19,989.27HUFEUR 19,877,742.1751,852,900,000.00
017/02/2238,465,895.270 (174,749.29)KRWEUR 38,465,895.27
91,852,900,000.000
23/08/2168,324,586.230 (411,462.17)KRWEUR 68,324,586.23
322,473,743.370 29/07/21190,654,926.910 793,328.47NZDEUR 190,654,926.911,667.830 16/07/211,401.760 (5.39)USDEUR 1,401.76
544,799,715.800 29/07/21456,764,712.220 (2,754,697.14)USDEUR 456,764,712.221,867,911,139.940 30/09/21108,422,263.910 (282,058.57)ZAREUR 108,422,263.91
(714,952.64)
Total forward foreign exchange contracts (714,952.64)
SalePurchase Unrealisedappreciation /(depreciation)
in EUR
MaturityDate
Commitmentin EUR
CALL EURO-BOBL FUTURE23/07/2021 134.5
EUR(1,750.000) 179,765,250.00 (87,500.00)
Options contracts
CALL US 5YR NOTE FUTURE (CBT)23/07/2021
USD(4,200.000) 148,092,297.81 (858,460.31)
PUT EURO-BOBL FUTURE 23/07/2021133.75
EUR(3,500.000) 359,530,500.00 (192,500.00)
PUT EURO-BOBL FUTURE 23/07/2021134.25
EUR3,500.000 359,530,500.00 805,000.00
PUT EURO-BTP FUTURE 23/07/2021150.5
EUR(400.000) 42,212,800.00 (140,000.00)
PUT NASDAQ E-MINI FUTURE17/12/2021 110
USD(750.000) 14,862,243.56 (1,639,378.86)
PUT NASDAQ E-MINI FUTURE17/12/2021 125
USD750.000 32,589,054.32 3,573,086.34
PUT US 5YR NOTE FUTURE (CBT)23/07/2021
USD(4,200.000) 150,070,477.43 (747,691.44)
PUT US 5YR NOTE FUTURE (CBT)27/08/2021
USD9,100.000 537,180,645.10 5,999,978.91
PUT US 5YR NOTE FUTURE (CBT)27/08/2021
USD(9,100.000) 285,448,306.72 (2,399,991.58)
NameQuantity Market valuein EUR
Currency Commitmentin EUR
* Please see Note 1.
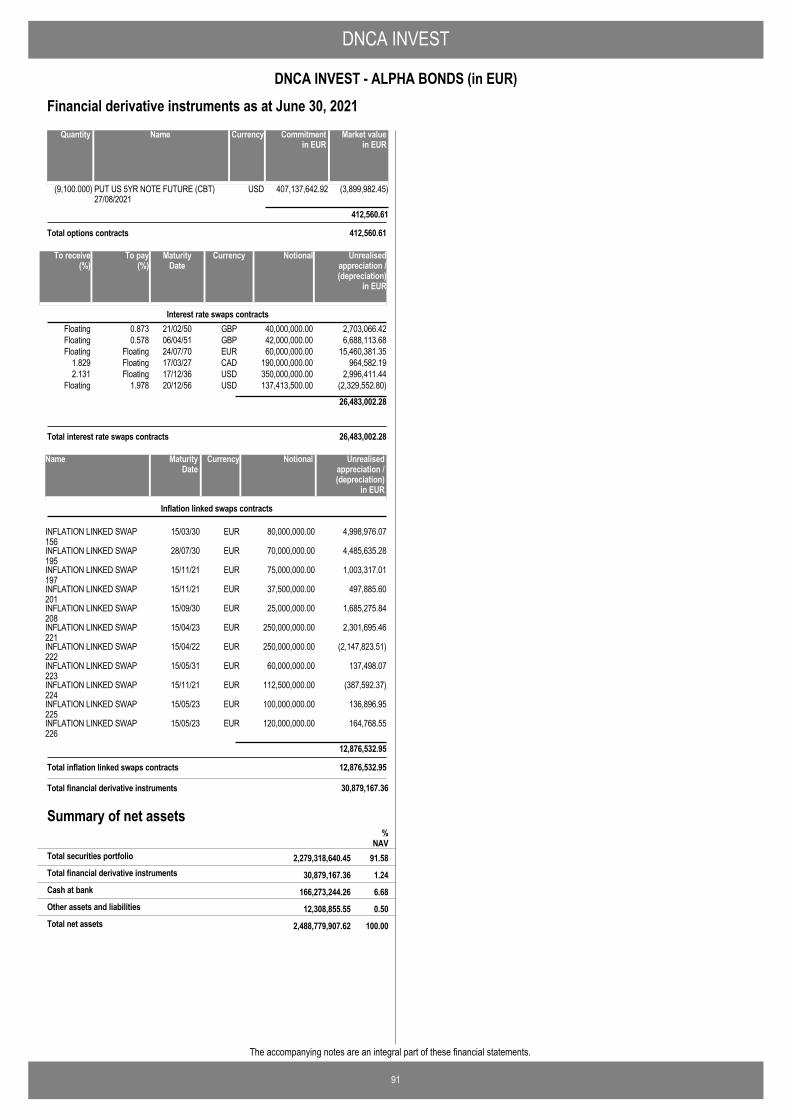
DNCA INVEST
91
DNCA INVEST - ALPHA BONDS (in EUR)
The accompanying notes are an integral part of these financial statements.
PUT US 5YR NOTE FUTURE (CBT)27/08/2021
USD(9,100.000) 407,137,642.92 (3,899,982.45)
412,560.61
Total options contracts 412,560.61
NameQuantity Market valuein EUR
Currency Commitmentin EUR
Financial derivative instruments as at June 30, 2021
0.873 21/02/50 40,000,000.00 2,703,066.42GBPFloatingInterest rate swaps contracts
0.578 06/04/51 42,000,000.00 6,688,113.68GBPFloating24/07/70 60,000,000.00 15,460,381.35EURFloating Floating17/03/271.829 190,000,000.00 964,582.19CADFloating17/12/362.131 350,000,000.00 2,996,411.44USDFloating
1.978 20/12/56 137,413,500.00 (2,329,552.80)USDFloating
26,483,002.28
To pay (%)
To receive (%)
NotionalMaturityDate
Unrealisedappreciation /(depreciation)
in EUR
Currency
Total interest rate swaps contracts 26,483,002.28
INFLATION LINKED SWAP156
EUR 4,998,976.0715/03/30 80,000,000.00
Inflation linked swaps contracts
Name MaturityDate
Currency Unrealisedappreciation /(depreciation)
in EUR
Notional
INFLATION LINKED SWAP195
EUR 4,485,635.2828/07/30 70,000,000.00
INFLATION LINKED SWAP197
EUR 1,003,317.0115/11/21 75,000,000.00
INFLATION LINKED SWAP201
EUR 497,885.6015/11/21 37,500,000.00
INFLATION LINKED SWAP208
EUR 1,685,275.8415/09/30 25,000,000.00
INFLATION LINKED SWAP221
EUR 2,301,695.4615/04/23 250,000,000.00
INFLATION LINKED SWAP222
EUR (2,147,823.51)15/04/22 250,000,000.00
INFLATION LINKED SWAP223
EUR 137,498.0715/05/31 60,000,000.00
INFLATION LINKED SWAP224
EUR (387,592.37)15/11/21 112,500,000.00
INFLATION LINKED SWAP225
EUR 136,896.9515/05/23 100,000,000.00
INFLATION LINKED SWAP226
EUR 164,768.5515/05/23 120,000,000.00
12,876,532.95
Total inflation linked swaps contracts 12,876,532.95
Total financial derivative instruments 30,879,167.36
Summary of net assets
30,879,167.36 1.24Total financial derivative instruments
%NAV
2,279,318,640.45 91.58Total securities portfolio
166,273,244.26 6.68Cash at bank
12,308,855.55 0.50Other assets and liabilities
2,488,779,907.62 100.00Total net assets
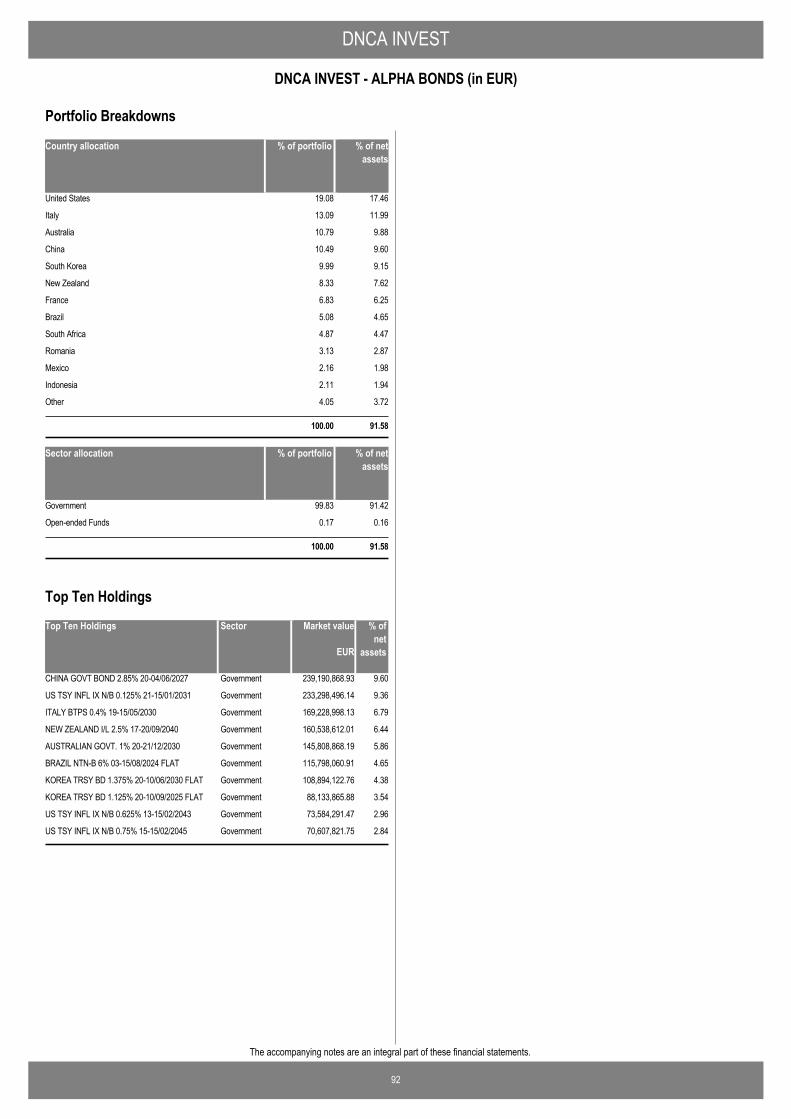
DNCA INVEST
92
DNCA INVEST - ALPHA BONDS (in EUR)
The accompanying notes are an integral part of these financial statements.
Country allocation % of portfolio % of netassets
United States 19.08 17.46
Italy 13.09 11.99
Australia 10.79 9.88
China 10.49 9.60
South Korea 9.99 9.15
New Zealand 8.33 7.62
France 6.83 6.25
Brazil 5.08 4.65
South Africa 4.87 4.47
Romania 3.13 2.87
Mexico 2.16 1.98
Indonesia 2.11 1.94
Other 4.05 3.72
100.00 91.58
Sector allocation % of portfolio % of netassets
Government 99.83 91.42
Open-ended Funds 0.17 0.16
100.00 91.58
Portfolio Breakdowns
Top Ten Holdings Market value % ofnet
assets
CHINA GOVT BOND 2.85% 20-04/06/2027 239,190,868.93 9.60Government
US TSY INFL IX N/B 0.125% 21-15/01/2031 233,298,496.14 9.36Government
ITALY BTPS 0.4% 19-15/05/2030 169,228,998.13 6.79Government
NEW ZEALAND I/L 2.5% 17-20/09/2040 160,538,612.01 6.44Government
AUSTRALIAN GOVT. 1% 20-21/12/2030 145,808,868.19 5.86Government
BRAZIL NTN-B 6% 03-15/08/2024 FLAT 115,798,060.91 4.65Government
KOREA TRSY BD 1.375% 20-10/06/2030 FLAT 108,894,122.76 4.38Government
KOREA TRSY BD 1.125% 20-10/09/2025 FLAT 88,133,865.88 3.54Government
US TSY INFL IX N/B 0.625% 13-15/02/2043 73,584,291.47 2.96Government
US TSY INFL IX N/B 0.75% 15-15/02/2045 70,607,821.75 2.84Government
EUR
Sector
Top Ten Holdings
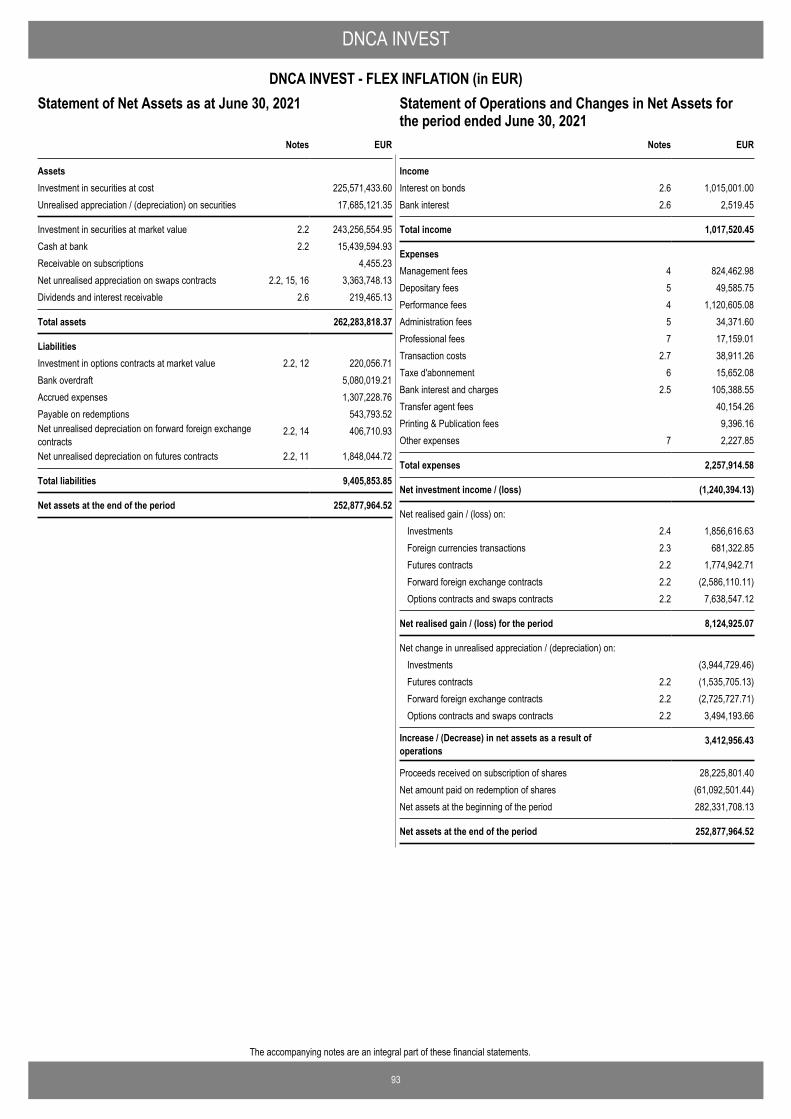
93
The accompanying notes are an integral part of these financial statements.
DNCA INVEST
DNCA INVEST - FLEX INFLATION (in EUR)Statement of Operations and Changes in Net Assets for theperiod ended June 30, 2021
EUR
AssetsInvestment in securities at cost 225,571,433.60Unrealised appreciation / (depreciation) on securities 17,685,121.35
Investment in securities at market value 2.2 243,256,554.95Cash at bank 2.2 15,439,594.93Receivable on subscriptions 4,455.23Net unrealised appreciation on swaps contracts 2.2, 15, 16 3,363,748.13Dividends and interest receivable 2.6 219,465.13
Total assets 262,283,818.37
LiabilitiesInvestment in options contracts at market value 2.2, 12 220,056.71Bank overdraft 5,080,019.21Accrued expenses 1,307,228.76Payable on redemptions 543,793.52Net unrealised depreciation on forward foreign exchangecontracts
2.2, 14 406,710.93
Net unrealised depreciation on futures contracts 2.2, 11 1,848,044.72
Total liabilities 9,405,853.85
Net assets at the end of the period 252,877,964.52
Notes
Statement of Net Assets as at June 30, 2021
IncomeInterest on bonds 2.6 1,015,001.00Bank interest 2.6 2,519.45
Total income 1,017,520.45
ExpensesManagement fees 4 824,462.98Depositary fees 5 49,585.75Performance fees 4 1,120,605.08Administration fees 5 34,371.60Professional fees 7 17,159.01Transaction costs 2.7 38,911.26Taxe d'abonnement 6 15,652.08Bank interest and charges 2.5 105,388.55Transfer agent fees 40,154.26Printing & Publication fees 9,396.16Other expenses 7 2,227.85
Total expenses 2,257,914.58
Net investment income / (loss) (1,240,394.13)
Net realised gain / (loss) on: Investments 2.4 1,856,616.63Foreign currencies transactions 2.3 681,322.85Futures contracts 2.2 1,774,942.71Forward foreign exchange contracts 2.2 (2,586,110.11)Options contracts and swaps contracts 2.2 7,638,547.12
Net realised gain / (loss) for the period 8,124,925.07
Net change in unrealised appreciation / (depreciation) on: Investments (3,944,729.46)Futures contracts 2.2 (1,535,705.13)Forward foreign exchange contracts 2.2 (2,725,727.71)Options contracts and swaps contracts 2.2 3,494,193.66
Increase / (Decrease) in net assets as a result ofoperations
3,412,956.43
Proceeds received on subscription of shares 28,225,801.40Net amount paid on redemption of shares (61,092,501.44)Net assets at the beginning of the period 282,331,708.13
Net assets at the end of the period 252,877,964.52
EURNotes
Statement of Operations and Changes in Net Assets forthe period ended June 30, 2021
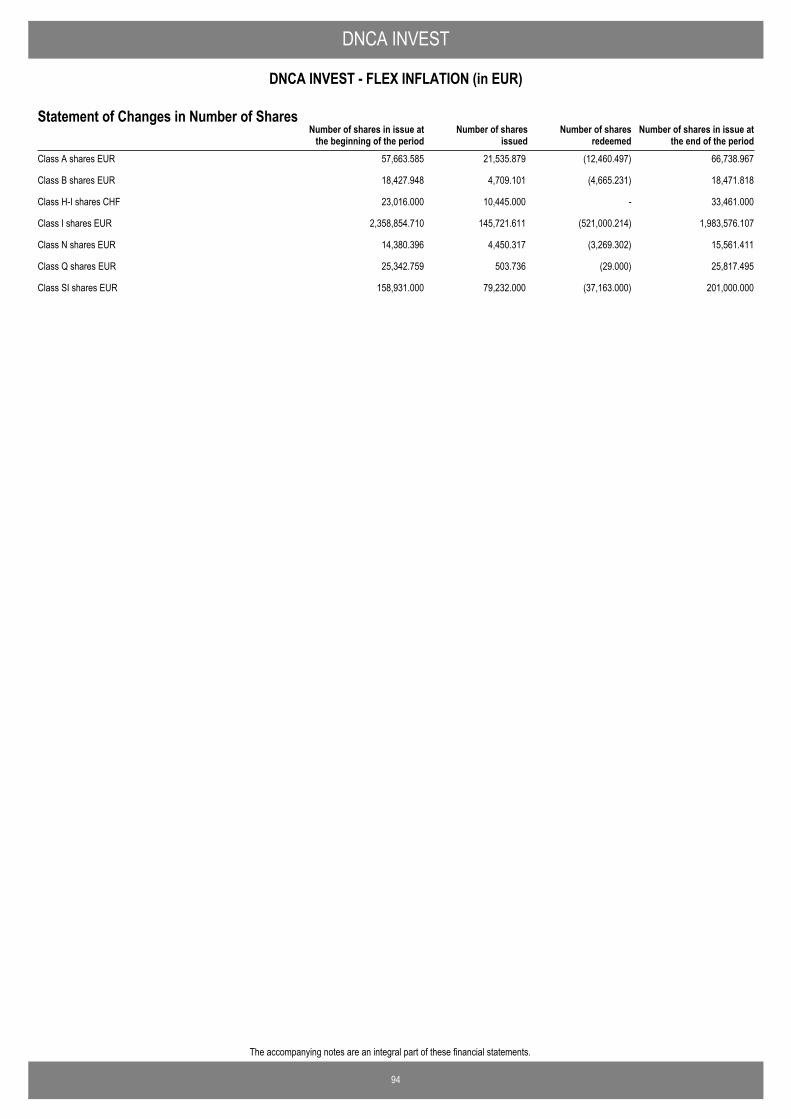
94
The accompanying notes are an integral part of these financial statements.
DNCA INVEST
DNCA INVEST - FLEX INFLATION (in EUR)
Number of shares in issue atthe end of the period
Number of shares in issue atthe beginning of the period
Number of sharesissued
Number of sharesredeemed
Statement of Changes in Number of Shares
Class A shares EUR 57,663.585 21,535.879 (12,460.497) 66,738.967
Class B shares EUR 18,427.948 4,709.101 (4,665.231) 18,471.818
Class H-I shares CHF 23,016.000 10,445.000 - 33,461.000
Class I shares EUR 2,358,854.710 145,721.611 (521,000.214) 1,983,576.107
Class N shares EUR 14,380.396 4,450.317 (3,269.302) 15,561.411
Class Q shares EUR 25,342.759 503.736 (29.000) 25,817.495
Class SI shares EUR 158,931.000 79,232.000 (37,163.000) 201,000.000
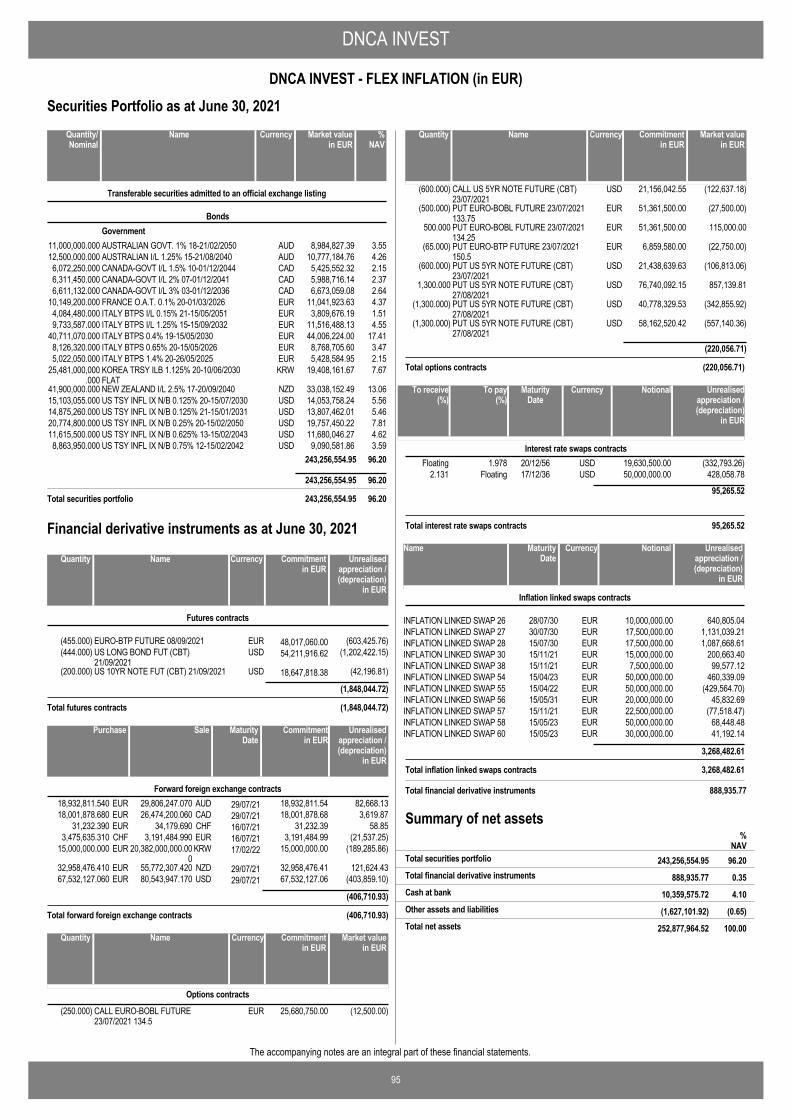
DNCA INVEST
95
DNCA INVEST - FLEX INFLATION (in EUR)
The accompanying notes are an integral part of these financial statements.
Securities Portfolio as at June 30, 2021
AUSTRALIAN GOVT. 1% 18-21/02/2050 AUD 8,984,827.39 3.5511,000,000.000
Transferable securities admitted to an official exchange listing
BondsGovernment
AUSTRALIAN I/L 1.25% 15-21/08/2040 AUD 10,777,184.76 4.2612,500,000.000CANADA-GOVT I/L 1.5% 10-01/12/2044 CAD 5,425,552.32 2.156,072,250.000CANADA-GOVT I/L 2% 07-01/12/2041 CAD 5,988,716.14 2.376,311,450.000CANADA-GOVT I/L 3% 03-01/12/2036 CAD 6,673,059.08 2.646,611,132.000FRANCE O.A.T. 0.1% 20-01/03/2026 EUR 11,041,923.63 4.3710,149,200.000ITALY BTPS I/L 0.15% 21-15/05/2051 EUR 3,809,676.19 1.514,084,480.000ITALY BTPS I/L 1.25% 15-15/09/2032 EUR 11,516,488.13 4.559,733,587.000ITALY BTPS 0.4% 19-15/05/2030 EUR 44,006,224.00 17.4140,711,070.000ITALY BTPS 0.65% 20-15/05/2026 EUR 8,768,705.60 3.478,126,320.000ITALY BTPS 1.4% 20-26/05/2025 EUR 5,428,584.95 2.155,022,050.000KOREA TRSY ILB 1.125% 20-10/06/2030FLAT
KRW 19,408,161.67 7.6725,481,000,000.000
NEW ZEALAND I/L 2.5% 17-20/09/2040 NZD 33,038,152.49 13.0641,900,000.000US TSY INFL IX N/B 0.125% 20-15/07/2030 USD 14,053,758.24 5.5615,103,055.000US TSY INFL IX N/B 0.125% 21-15/01/2031 USD 13,807,462.01 5.4614,875,260.000US TSY INFL IX N/B 0.25% 20-15/02/2050 USD 19,757,450.22 7.8120,774,800.000US TSY INFL IX N/B 0.625% 13-15/02/2043 USD 11,680,046.27 4.6211,615,500.000US TSY INFL IX N/B 0.75% 12-15/02/2042 USD 9,090,581.86 3.598,863,950.000
243,256,554.95 96.20
243,256,554.95 96.20
Total securities portfolio 243,256,554.95 96.20
NameQuantity/Nominal
Market valuein EUR
Currency %NAV
EURO-BTP FUTURE 08/09/2021 EUR 48,017,060.00(455.000) (603,425.76)
Futures contracts
US LONG BOND FUT (CBT)21/09/2021
USD 54,211,916.62(444.000) (1,202,422.15)
US 10YR NOTE FUT (CBT) 21/09/2021 USD 18,647,818.38(200.000) (42,196.81)
(1,848,044.72)
Total futures contracts (1,848,044.72)
NameQuantity Commitmentin EUR
Currency Unrealisedappreciation /(depreciation)
in EUR
Financial derivative instruments as at June 30, 2021
29,806,247.070 29/07/2118,932,811.540 82,668.13AUDEUR 18,932,811.54Forward foreign exchange contracts
26,474,200.060 29/07/2118,001,878.680 3,619.87CADEUR 18,001,878.6834,179.690 16/07/2131,232.390 58.85CHFEUR 31,232.39
3,191,484.990 16/07/213,475,635.310 (21,537.25)EURCHF 3,191,484.9920,382,000,000.00
017/02/2215,000,000.000 (189,285.86)KRWEUR 15,000,000.00
55,772,307.420 29/07/2132,958,476.410 121,624.43NZDEUR 32,958,476.4180,543,947.170 29/07/2167,532,127.060 (403,859.10)USDEUR 67,532,127.06
(406,710.93)
Total forward foreign exchange contracts (406,710.93)
SalePurchase Unrealisedappreciation /(depreciation)
in EUR
MaturityDate
Commitmentin EUR
CALL EURO-BOBL FUTURE23/07/2021 134.5
EUR(250.000) 25,680,750.00 (12,500.00)
Options contracts
NameQuantity Market valuein EUR
Currency Commitmentin EUR
CALL US 5YR NOTE FUTURE (CBT)23/07/2021
USD(600.000) 21,156,042.55 (122,637.18)
PUT EURO-BOBL FUTURE 23/07/2021133.75
EUR(500.000) 51,361,500.00 (27,500.00)
PUT EURO-BOBL FUTURE 23/07/2021134.25
EUR500.000 51,361,500.00 115,000.00
PUT EURO-BTP FUTURE 23/07/2021150.5
EUR(65.000) 6,859,580.00 (22,750.00)
PUT US 5YR NOTE FUTURE (CBT)23/07/2021
USD(600.000) 21,438,639.63 (106,813.06)
PUT US 5YR NOTE FUTURE (CBT)27/08/2021
USD1,300.000 76,740,092.15 857,139.81
PUT US 5YR NOTE FUTURE (CBT)27/08/2021
USD(1,300.000) 40,778,329.53 (342,855.92)
PUT US 5YR NOTE FUTURE (CBT)27/08/2021
USD(1,300.000) 58,162,520.42 (557,140.36)
(220,056.71)
Total options contracts (220,056.71)
NameQuantity Market valuein EUR
Currency Commitmentin EUR
1.978 20/12/56 19,630,500.00 (332,793.26)USDFloatingInterest rate swaps contracts
17/12/362.131 50,000,000.00 428,058.78USDFloating
95,265.52
To pay (%)
To receive (%)
NotionalMaturityDate
Unrealisedappreciation /(depreciation)
in EUR
Currency
Total interest rate swaps contracts 95,265.52
INFLATION LINKED SWAP 26 EUR 640,805.0428/07/30 10,000,000.00
Inflation linked swaps contracts
Name MaturityDate
Currency Unrealisedappreciation /(depreciation)
in EUR
Notional
INFLATION LINKED SWAP 27 EUR 1,131,039.2130/07/30 17,500,000.00INFLATION LINKED SWAP 28 EUR 1,087,668.6115/07/30 17,500,000.00INFLATION LINKED SWAP 30 EUR 200,663.4015/11/21 15,000,000.00INFLATION LINKED SWAP 38 EUR 99,577.1215/11/21 7,500,000.00INFLATION LINKED SWAP 54 EUR 460,339.0915/04/23 50,000,000.00INFLATION LINKED SWAP 55 EUR (429,564.70)15/04/22 50,000,000.00INFLATION LINKED SWAP 56 EUR 45,832.6915/05/31 20,000,000.00INFLATION LINKED SWAP 57 EUR (77,518.47)15/11/21 22,500,000.00INFLATION LINKED SWAP 58 EUR 68,448.4815/05/23 50,000,000.00INFLATION LINKED SWAP 60 EUR 41,192.1415/05/23 30,000,000.00
3,268,482.61
Total inflation linked swaps contracts 3,268,482.61
Total financial derivative instruments 888,935.77
Summary of net assets
888,935.77 0.35Total financial derivative instruments
%NAV
243,256,554.95 96.20Total securities portfolio
10,359,575.72 4.10Cash at bank
(1,627,101.92) (0.65)Other assets and liabilities
252,877,964.52 100.00Total net assets
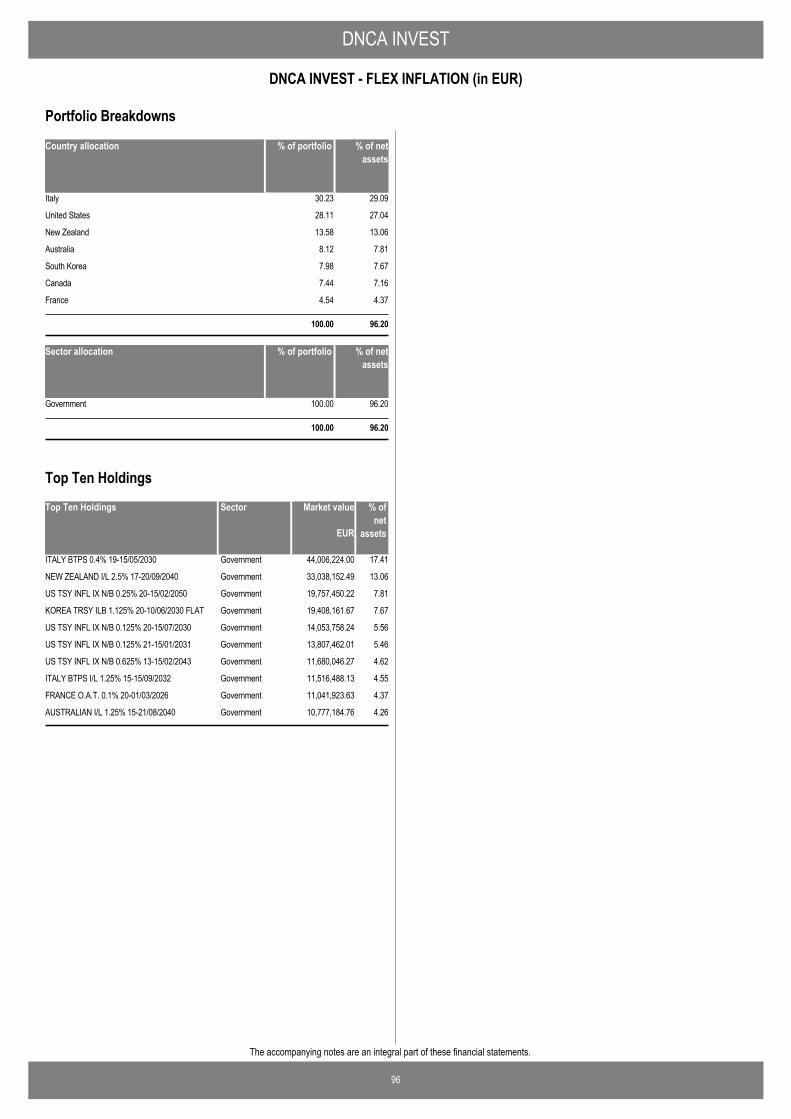
DNCA INVEST
96
DNCA INVEST - FLEX INFLATION (in EUR)
The accompanying notes are an integral part of these financial statements.
Country allocation % of portfolio % of netassets
Italy 30.23 29.09
United States 28.11 27.04
New Zealand 13.58 13.06
Australia 8.12 7.81
South Korea 7.98 7.67
Canada 7.44 7.16
France 4.54 4.37
100.00 96.20
Sector allocation % of portfolio % of netassets
Government 100.00 96.20
100.00 96.20
Portfolio Breakdowns
Top Ten Holdings Market value % ofnet
assets
ITALY BTPS 0.4% 19-15/05/2030 44,006,224.00 17.41Government
NEW ZEALAND I/L 2.5% 17-20/09/2040 33,038,152.49 13.06Government
US TSY INFL IX N/B 0.25% 20-15/02/2050 19,757,450.22 7.81Government
KOREA TRSY ILB 1.125% 20-10/06/2030 FLAT 19,408,161.67 7.67Government
US TSY INFL IX N/B 0.125% 20-15/07/2030 14,053,758.24 5.56Government
US TSY INFL IX N/B 0.125% 21-15/01/2031 13,807,462.01 5.46Government
US TSY INFL IX N/B 0.625% 13-15/02/2043 11,680,046.27 4.62Government
ITALY BTPS I/L 1.25% 15-15/09/2032 11,516,488.13 4.55Government
FRANCE O.A.T. 0.1% 20-01/03/2026 11,041,923.63 4.37Government
AUSTRALIAN I/L 1.25% 15-21/08/2040 10,777,184.76 4.26Government
EUR
Sector
Top Ten Holdings
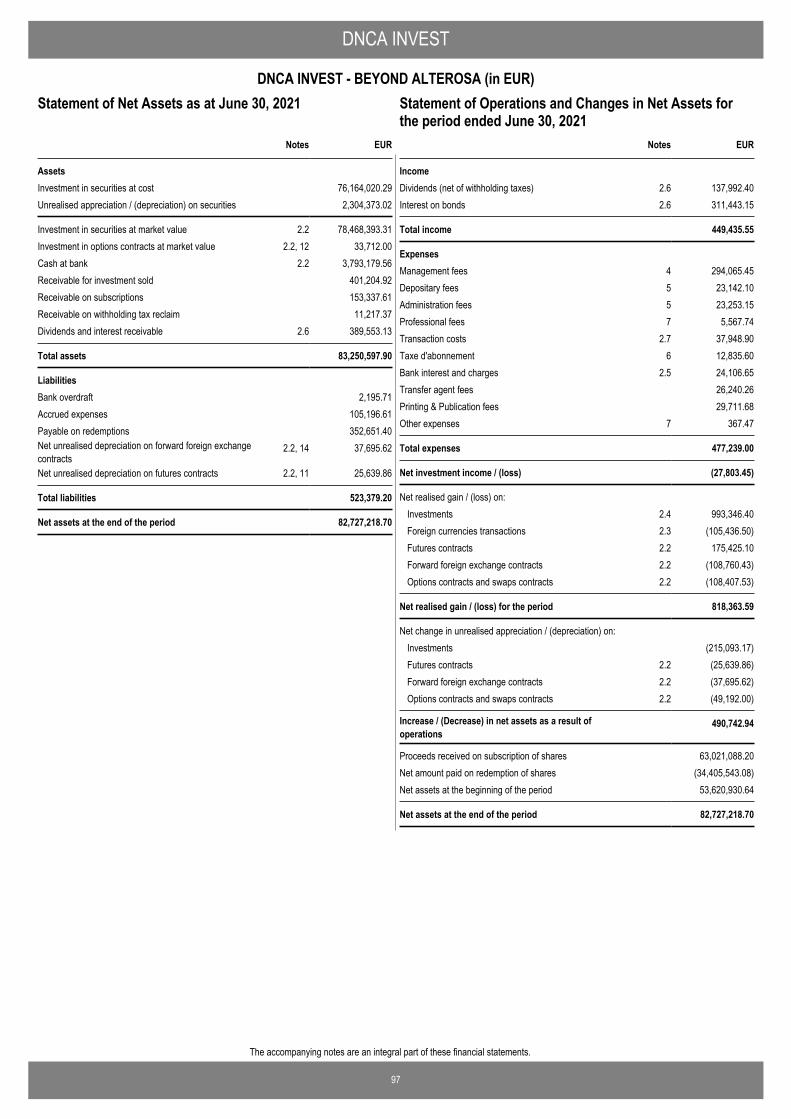
97
The accompanying notes are an integral part of these financial statements.
DNCA INVEST
DNCA INVEST - BEYOND ALTEROSA (in EUR)Statement of Operations and Changes in Net Assets for theperiod ended June 30, 2021
EUR
AssetsInvestment in securities at cost 76,164,020.29Unrealised appreciation / (depreciation) on securities 2,304,373.02
Investment in securities at market value 2.2 78,468,393.31Investment in options contracts at market value 2.2, 12 33,712.00Cash at bank 2.2 3,793,179.56Receivable for investment sold 401,204.92Receivable on subscriptions 153,337.61Receivable on withholding tax reclaim 11,217.37Dividends and interest receivable 2.6 389,553.13
Total assets 83,250,597.90
LiabilitiesBank overdraft 2,195.71Accrued expenses 105,196.61Payable on redemptions 352,651.40Net unrealised depreciation on forward foreign exchangecontracts
2.2, 14 37,695.62
Net unrealised depreciation on futures contracts 2.2, 11 25,639.86
Total liabilities 523,379.20
Net assets at the end of the period 82,727,218.70
Notes
Statement of Net Assets as at June 30, 2021
IncomeDividends (net of withholding taxes) 2.6 137,992.40Interest on bonds 2.6 311,443.15
Total income 449,435.55
ExpensesManagement fees 4 294,065.45Depositary fees 5 23,142.10Administration fees 5 23,253.15Professional fees 7 5,567.74Transaction costs 2.7 37,948.90Taxe d'abonnement 6 12,835.60Bank interest and charges 2.5 24,106.65Transfer agent fees 26,240.26Printing & Publication fees 29,711.68Other expenses 7 367.47
Total expenses 477,239.00
Net investment income / (loss) (27,803.45)
Net realised gain / (loss) on: Investments 2.4 993,346.40Foreign currencies transactions 2.3 (105,436.50)Futures contracts 2.2 175,425.10Forward foreign exchange contracts 2.2 (108,760.43)Options contracts and swaps contracts 2.2 (108,407.53)
Net realised gain / (loss) for the period 818,363.59
Net change in unrealised appreciation / (depreciation) on: Investments (215,093.17)Futures contracts 2.2 (25,639.86)Forward foreign exchange contracts 2.2 (37,695.62)Options contracts and swaps contracts 2.2 (49,192.00)
Increase / (Decrease) in net assets as a result ofoperations
490,742.94
Proceeds received on subscription of shares 63,021,088.20Net amount paid on redemption of shares (34,405,543.08)Net assets at the beginning of the period 53,620,930.64
Net assets at the end of the period 82,727,218.70
EURNotes
Statement of Operations and Changes in Net Assets forthe period ended June 30, 2021
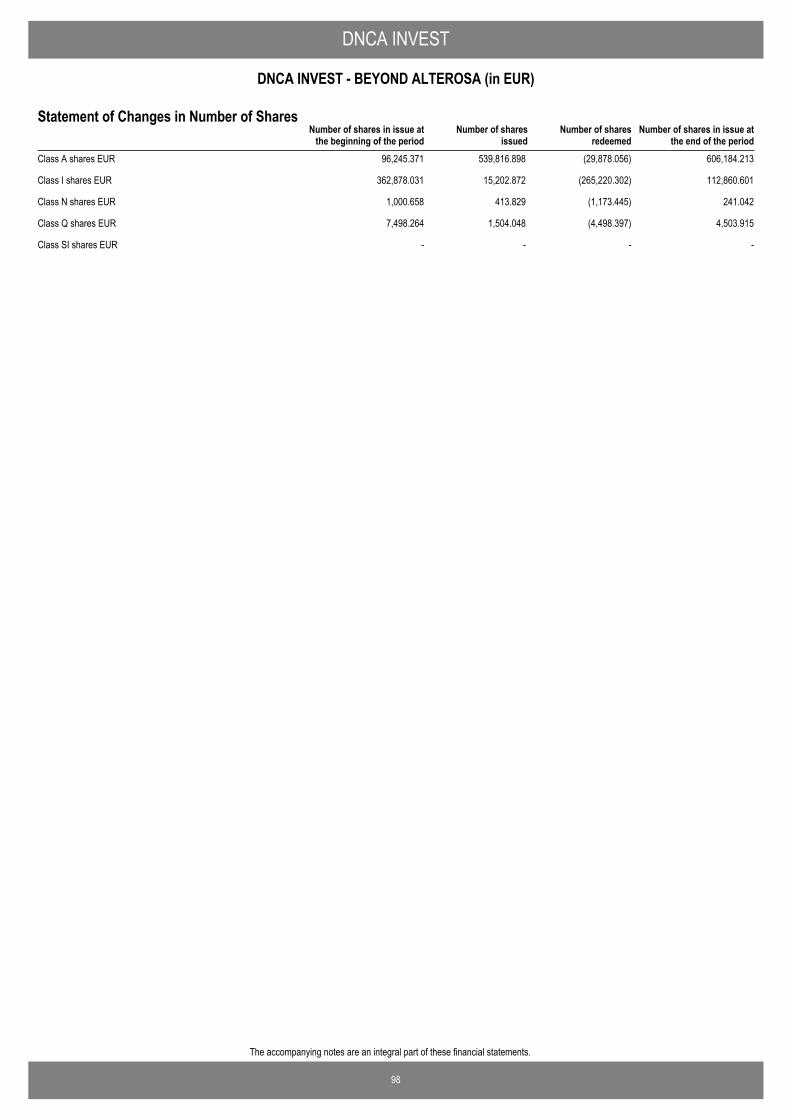
98
The accompanying notes are an integral part of these financial statements.
DNCA INVEST
DNCA INVEST - BEYOND ALTEROSA (in EUR)
Number of shares in issue atthe end of the period
Number of shares in issue atthe beginning of the period
Number of sharesissued
Number of sharesredeemed
Statement of Changes in Number of Shares
Class A shares EUR 96,245.371 539,816.898 (29,878.056) 606,184.213
Class I shares EUR 362,878.031 15,202.872 (265,220.302) 112,860.601
Class N shares EUR 1,000.658 413.829 (1,173.445) 241.042
Class Q shares EUR 7,498.264 1,504.048 (4,498.397) 4,503.915
Class SI shares EUR - - - -
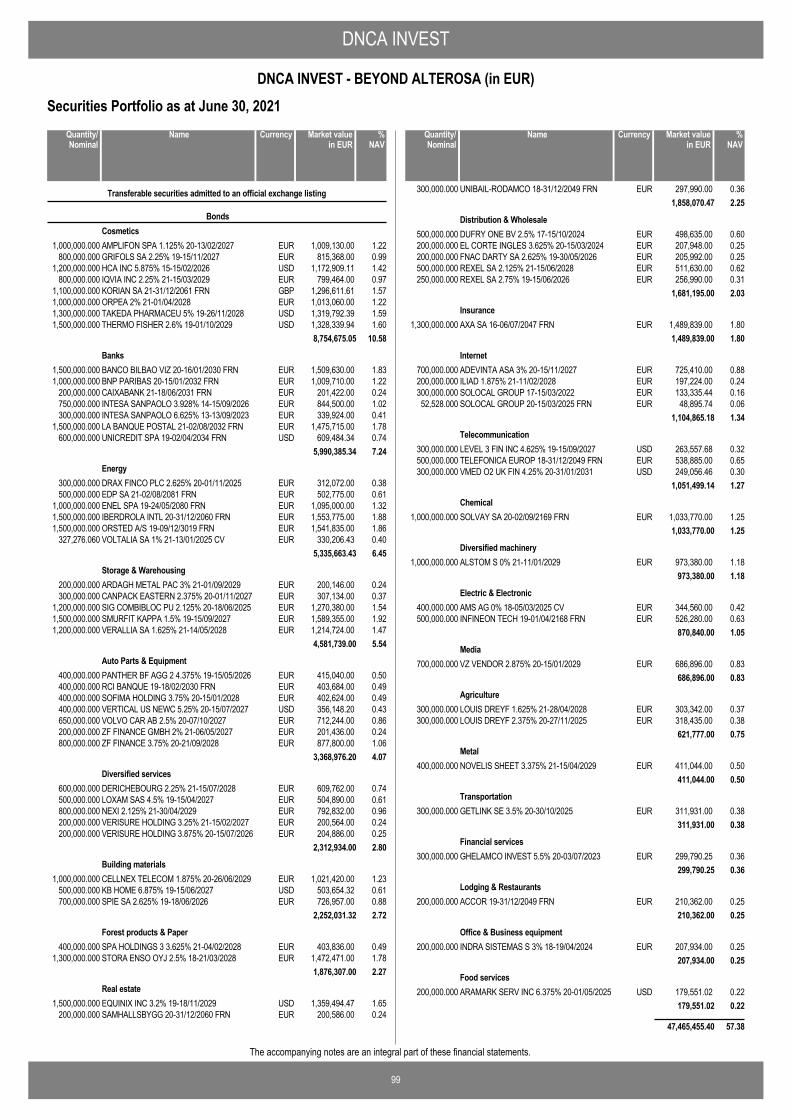
DNCA INVEST
99
DNCA INVEST - BEYOND ALTEROSA (in EUR)
The accompanying notes are an integral part of these financial statements.
Securities Portfolio as at June 30, 2021
AMPLIFON SPA 1.125% 20-13/02/2027 EUR 1,009,130.00 1.221,000,000.000
Transferable securities admitted to an official exchange listing
BondsCosmetics
GRIFOLS SA 2.25% 19-15/11/2027 EUR 815,368.00 0.99800,000.000HCA INC 5.875% 15-15/02/2026 USD 1,172,909.11 1.421,200,000.000IQVIA INC 2.25% 21-15/03/2029 EUR 799,464.00 0.97800,000.000KORIAN SA 21-31/12/2061 FRN GBP 1,296,611.61 1.571,100,000.000ORPEA 2% 21-01/04/2028 EUR 1,013,060.00 1.221,000,000.000TAKEDA PHARMACEU 5% 19-26/11/2028 USD 1,319,792.39 1.591,300,000.000THERMO FISHER 2.6% 19-01/10/2029 USD 1,328,339.94 1.601,500,000.000
8,754,675.05 10.58
BANCO BILBAO VIZ 20-16/01/2030 FRN EUR 1,509,630.00 1.831,500,000.000Banks
BNP PARIBAS 20-15/01/2032 FRN EUR 1,009,710.00 1.221,000,000.000CAIXABANK 21-18/06/2031 FRN EUR 201,422.00 0.24200,000.000INTESA SANPAOLO 3.928% 14-15/09/2026 EUR 844,500.00 1.02750,000.000INTESA SANPAOLO 6.625% 13-13/09/2023 EUR 339,924.00 0.41300,000.000LA BANQUE POSTAL 21-02/08/2032 FRN EUR 1,475,715.00 1.781,500,000.000UNICREDIT SPA 19-02/04/2034 FRN USD 609,484.34 0.74600,000.000
5,990,385.34 7.24
DRAX FINCO PLC 2.625% 20-01/11/2025 EUR 312,072.00 0.38300,000.000Energy
EDP SA 21-02/08/2081 FRN EUR 502,775.00 0.61500,000.000ENEL SPA 19-24/05/2080 FRN EUR 1,095,000.00 1.321,000,000.000IBERDROLA INTL 20-31/12/2060 FRN EUR 1,553,775.00 1.881,500,000.000ORSTED A/S 19-09/12/3019 FRN EUR 1,541,835.00 1.861,500,000.000VOLTALIA SA 1% 21-13/01/2025 CV EUR 330,206.43 0.40327,276.060
5,335,663.43 6.45
ARDAGH METAL PAC 3% 21-01/09/2029 EUR 200,146.00 0.24200,000.000Storage & Warehousing
CANPACK EASTERN 2.375% 20-01/11/2027 EUR 307,134.00 0.37300,000.000SIG COMBIBLOC PU 2.125% 20-18/06/2025 EUR 1,270,380.00 1.541,200,000.000SMURFIT KAPPA 1.5% 19-15/09/2027 EUR 1,589,355.00 1.921,500,000.000VERALLIA SA 1.625% 21-14/05/2028 EUR 1,214,724.00 1.471,200,000.000
4,581,739.00 5.54
PANTHER BF AGG 2 4.375% 19-15/05/2026 EUR 415,040.00 0.50400,000.000Auto Parts & Equipment
RCI BANQUE 19-18/02/2030 FRN EUR 403,684.00 0.49400,000.000SOFIMA HOLDING 3.75% 20-15/01/2028 EUR 402,624.00 0.49400,000.000VERTICAL US NEWC 5.25% 20-15/07/2027 USD 356,148.20 0.43400,000.000VOLVO CAR AB 2.5% 20-07/10/2027 EUR 712,244.00 0.86650,000.000ZF FINANCE GMBH 2% 21-06/05/2027 EUR 201,436.00 0.24200,000.000ZF FINANCE 3.75% 20-21/09/2028 EUR 877,800.00 1.06800,000.000
3,368,976.20 4.07
DERICHEBOURG 2.25% 21-15/07/2028 EUR 609,762.00 0.74600,000.000Diversified services
LOXAM SAS 4.5% 19-15/04/2027 EUR 504,890.00 0.61500,000.000NEXI 2.125% 21-30/04/2029 EUR 792,832.00 0.96800,000.000VERISURE HOLDING 3.25% 21-15/02/2027 EUR 200,564.00 0.24200,000.000VERISURE HOLDING 3.875% 20-15/07/2026 EUR 204,886.00 0.25200,000.000
2,312,934.00 2.80
CELLNEX TELECOM 1.875% 20-26/06/2029 EUR 1,021,420.00 1.231,000,000.000Building materials
KB HOME 6.875% 19-15/06/2027 USD 503,654.32 0.61500,000.000SPIE SA 2.625% 19-18/06/2026 EUR 726,957.00 0.88700,000.000
2,252,031.32 2.72
SPA HOLDINGS 3 3.625% 21-04/02/2028 EUR 403,836.00 0.49400,000.000Forest products & Paper
STORA ENSO OYJ 2.5% 18-21/03/2028 EUR 1,472,471.00 1.781,300,000.0001,876,307.00 2.27
EQUINIX INC 3.2% 19-18/11/2029 USD 1,359,494.47 1.651,500,000.000Real estate
SAMHALLSBYGG 20-31/12/2060 FRN EUR 200,586.00 0.24200,000.000
NameQuantity/Nominal
Market valuein EUR
Currency %NAV
UNIBAIL-RODAMCO 18-31/12/2049 FRN EUR 297,990.00 0.36300,000.0001,858,070.47 2.25
DUFRY ONE BV 2.5% 17-15/10/2024 EUR 498,635.00 0.60500,000.000Distribution & Wholesale
EL CORTE INGLES 3.625% 20-15/03/2024 EUR 207,948.00 0.25200,000.000FNAC DARTY SA 2.625% 19-30/05/2026 EUR 205,992.00 0.25200,000.000REXEL SA 2.125% 21-15/06/2028 EUR 511,630.00 0.62500,000.000REXEL SA 2.75% 19-15/06/2026 EUR 256,990.00 0.31250,000.000
1,681,195.00 2.03
AXA SA 16-06/07/2047 FRN EUR 1,489,839.00 1.801,300,000.000Insurance
1,489,839.00 1.80
ADEVINTA ASA 3% 20-15/11/2027 EUR 725,410.00 0.88700,000.000Internet
ILIAD 1.875% 21-11/02/2028 EUR 197,224.00 0.24200,000.000SOLOCAL GROUP 17-15/03/2022 EUR 133,335.44 0.16300,000.000SOLOCAL GROUP 20-15/03/2025 FRN EUR 48,895.74 0.0652,528.000
1,104,865.18 1.34
LEVEL 3 FIN INC 4.625% 19-15/09/2027 USD 263,557.68 0.32300,000.000Telecommunication
TELEFONICA EUROP 18-31/12/2049 FRN EUR 538,885.00 0.65500,000.000VMED O2 UK FIN 4.25% 20-31/01/2031 USD 249,056.46 0.30300,000.000
1,051,499.14 1.27
SOLVAY SA 20-02/09/2169 FRN EUR 1,033,770.00 1.251,000,000.000Chemical
1,033,770.00 1.25
ALSTOM S 0% 21-11/01/2029 EUR 973,380.00 1.181,000,000.000Diversified machinery
973,380.00 1.18
AMS AG 0% 18-05/03/2025 CV EUR 344,560.00 0.42400,000.000Electric & Electronic
INFINEON TECH 19-01/04/2168 FRN EUR 526,280.00 0.63500,000.000870,840.00 1.05
VZ VENDOR 2.875% 20-15/01/2029 EUR 686,896.00 0.83700,000.000Media
686,896.00 0.83
LOUIS DREYF 1.625% 21-28/04/2028 EUR 303,342.00 0.37300,000.000Agriculture
LOUIS DREYF 2.375% 20-27/11/2025 EUR 318,435.00 0.38300,000.000621,777.00 0.75
NOVELIS SHEET 3.375% 21-15/04/2029 EUR 411,044.00 0.50400,000.000Metal
411,044.00 0.50
GETLINK SE 3.5% 20-30/10/2025 EUR 311,931.00 0.38300,000.000Transportation
311,931.00 0.38
GHELAMCO INVEST 5.5% 20-03/07/2023 EUR 299,790.25 0.36300,000.000Financial services
299,790.25 0.36
ACCOR 19-31/12/2049 FRN EUR 210,362.00 0.25200,000.000Lodging & Restaurants
210,362.00 0.25
INDRA SISTEMAS S 3% 18-19/04/2024 EUR 207,934.00 0.25200,000.000Office & Business equipment
207,934.00 0.25
ARAMARK SERV INC 6.375% 20-01/05/2025 USD 179,551.02 0.22200,000.000Food services
179,551.02 0.22
47,465,455.40 57.38
NameQuantity/Nominal
Market valuein EUR
Currency %NAV
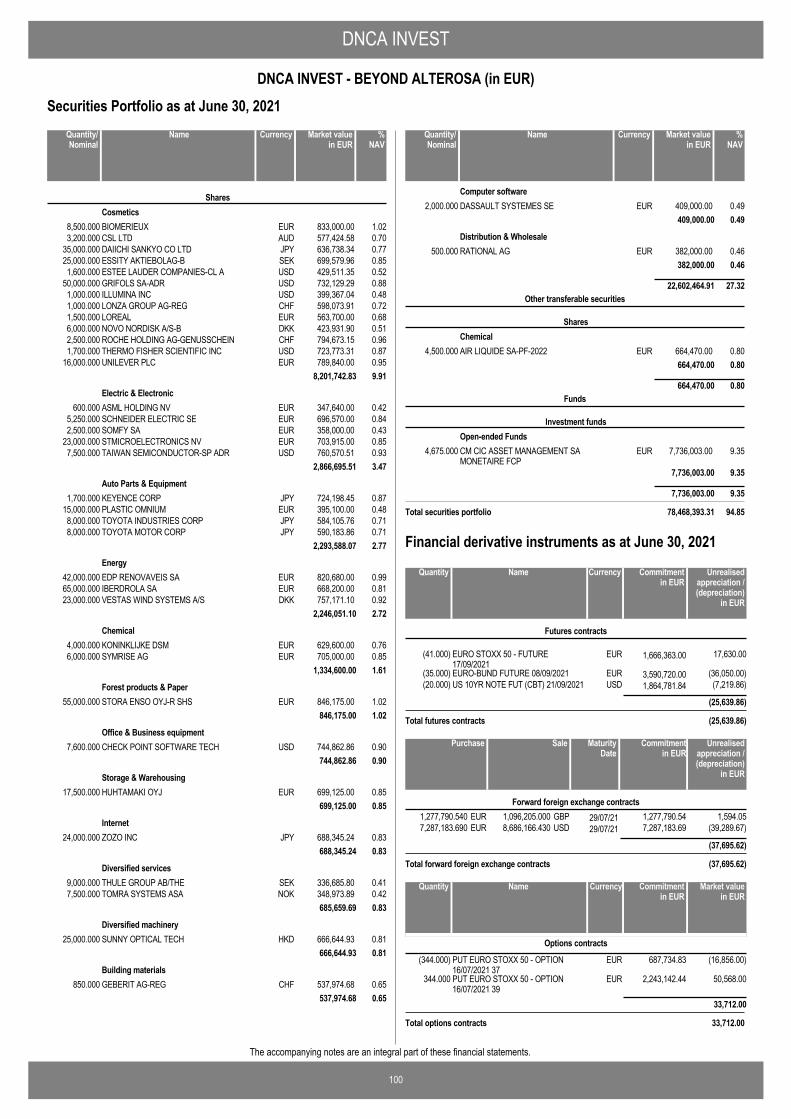
DNCA INVEST
100
DNCA INVEST - BEYOND ALTEROSA (in EUR)
The accompanying notes are an integral part of these financial statements.
Securities Portfolio as at June 30, 2021
BIOMERIEUX EUR 833,000.00 1.028,500.000
SharesCosmetics
CSL LTD AUD 577,424.58 0.703,200.000DAIICHI SANKYO CO LTD JPY 636,738.34 0.7735,000.000ESSITY AKTIEBOLAG-B SEK 699,579.96 0.8525,000.000ESTEE LAUDER COMPANIES-CL A USD 429,511.35 0.521,600.000GRIFOLS SA-ADR USD 732,129.29 0.8850,000.000ILLUMINA INC USD 399,367.04 0.481,000.000LONZA GROUP AG-REG CHF 598,073.91 0.721,000.000LOREAL EUR 563,700.00 0.681,500.000NOVO NORDISK A/S-B DKK 423,931.90 0.516,000.000ROCHE HOLDING AG-GENUSSCHEIN CHF 794,673.15 0.962,500.000THERMO FISHER SCIENTIFIC INC USD 723,773.31 0.871,700.000UNILEVER PLC EUR 789,840.00 0.9516,000.000
8,201,742.83 9.91
ASML HOLDING NV EUR 347,640.00 0.42600.000Electric & Electronic
SCHNEIDER ELECTRIC SE EUR 696,570.00 0.845,250.000SOMFY SA EUR 358,000.00 0.432,500.000STMICROELECTRONICS NV EUR 703,915.00 0.8523,000.000TAIWAN SEMICONDUCTOR-SP ADR USD 760,570.51 0.937,500.000
2,866,695.51 3.47
KEYENCE CORP JPY 724,198.45 0.871,700.000Auto Parts & Equipment
PLASTIC OMNIUM EUR 395,100.00 0.4815,000.000TOYOTA INDUSTRIES CORP JPY 584,105.76 0.718,000.000TOYOTA MOTOR CORP JPY 590,183.86 0.718,000.000
2,293,588.07 2.77
EDP RENOVAVEIS SA EUR 820,680.00 0.9942,000.000Energy
IBERDROLA SA EUR 668,200.00 0.8165,000.000VESTAS WIND SYSTEMS A/S DKK 757,171.10 0.9223,000.000
2,246,051.10 2.72
KONINKLIJKE DSM EUR 629,600.00 0.764,000.000Chemical
SYMRISE AG EUR 705,000.00 0.856,000.0001,334,600.00 1.61
STORA ENSO OYJ-R SHS EUR 846,175.00 1.0255,000.000Forest products & Paper
846,175.00 1.02
CHECK POINT SOFTWARE TECH USD 744,862.86 0.907,600.000Office & Business equipment
744,862.86 0.90
HUHTAMAKI OYJ EUR 699,125.00 0.8517,500.000Storage & Warehousing
699,125.00 0.85
ZOZO INC JPY 688,345.24 0.8324,000.000Internet
688,345.24 0.83
THULE GROUP AB/THE SEK 336,685.80 0.419,000.000Diversified services
TOMRA SYSTEMS ASA NOK 348,973.89 0.427,500.000685,659.69 0.83
SUNNY OPTICAL TECH HKD 666,644.93 0.8125,000.000Diversified machinery
666,644.93 0.81
GEBERIT AG-REG CHF 537,974.68 0.65850.000Building materials
537,974.68 0.65
NameQuantity/Nominal
Market valuein EUR
Currency %NAV
DASSAULT SYSTEMES SE EUR 409,000.00 0.492,000.000Computer software
409,000.00 0.49
RATIONAL AG EUR 382,000.00 0.46500.000Distribution & Wholesale
382,000.00 0.46
22,602,464.91 27.32
AIR LIQUIDE SA-PF-2022 EUR 664,470.00 0.804,500.000
Other transferable securities
SharesChemical
664,470.00 0.80
664,470.00 0.80
CM CIC ASSET MANAGEMENT SAMONETAIRE FCP
EUR 7,736,003.00 9.354,675.000
Funds
Investment fundsOpen-ended Funds
7,736,003.00 9.35
7,736,003.00 9.35
Total securities portfolio 78,468,393.31 94.85
NameQuantity/Nominal
Market valuein EUR
Currency %NAV
EURO STOXX 50 - FUTURE17/09/2021
EUR 1,666,363.00(41.000) 17,630.00
Futures contracts
EURO-BUND FUTURE 08/09/2021 EUR 3,590,720.00(35.000) (36,050.00)US 10YR NOTE FUT (CBT) 21/09/2021 USD 1,864,781.84(20.000) (7,219.86)
(25,639.86)
Total futures contracts (25,639.86)
NameQuantity Commitmentin EUR
Currency Unrealisedappreciation /(depreciation)
in EUR
Financial derivative instruments as at June 30, 2021
1,096,205.000 29/07/211,277,790.540 1,594.05GBPEUR 1,277,790.54Forward foreign exchange contracts
8,686,166.430 29/07/217,287,183.690 (39,289.67)USDEUR 7,287,183.69
(37,695.62)
Total forward foreign exchange contracts (37,695.62)
SalePurchase Unrealisedappreciation /(depreciation)
in EUR
MaturityDate
Commitmentin EUR
PUT EURO STOXX 50 - OPTION16/07/2021 37
EUR(344.000) 687,734.83 (16,856.00)
Options contracts
PUT EURO STOXX 50 - OPTION16/07/2021 39
EUR344.000 2,243,142.44 50,568.00
33,712.00
Total options contracts 33,712.00
NameQuantity Market valuein EUR
Currency Commitmentin EUR
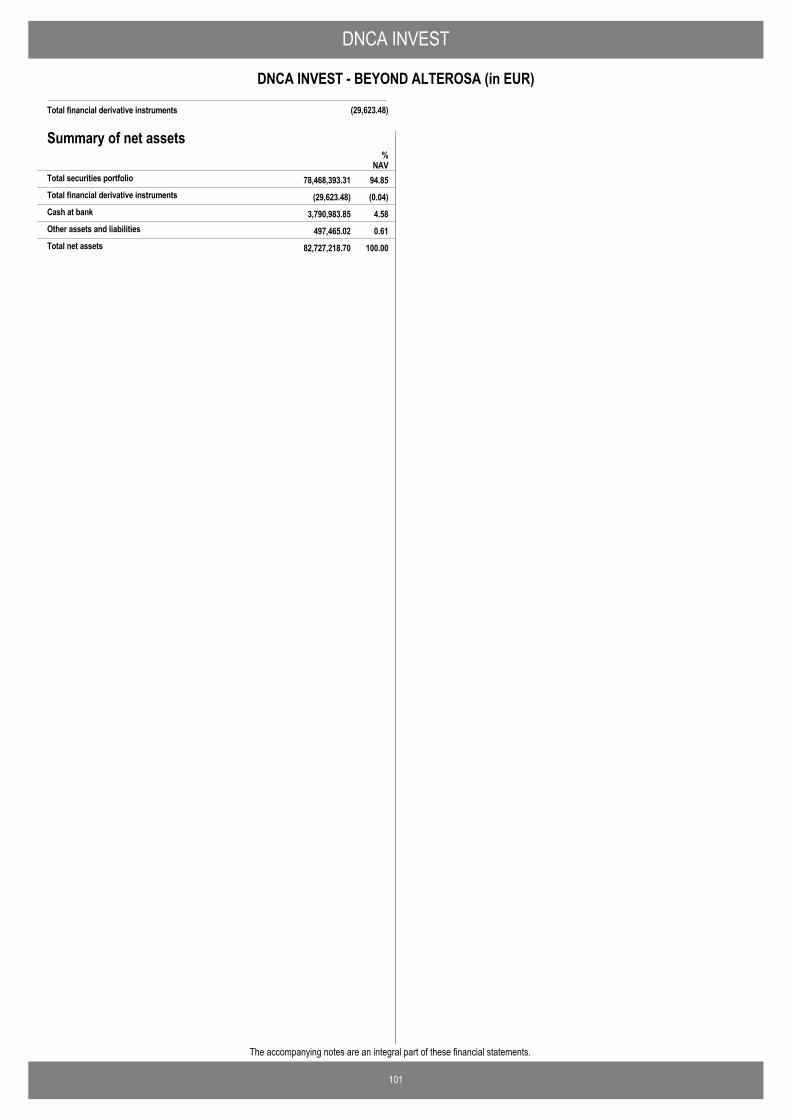
DNCA INVEST
101
DNCA INVEST - BEYOND ALTEROSA (in EUR)
The accompanying notes are an integral part of these financial statements.
Total financial derivative instruments (29,623.48)
Summary of net assets
(29,623.48) (0.04)Total financial derivative instruments
%NAV
78,468,393.31 94.85Total securities portfolio
3,790,983.85 4.58Cash at bank
497,465.02 0.61Other assets and liabilities
82,727,218.70 100.00Total net assets
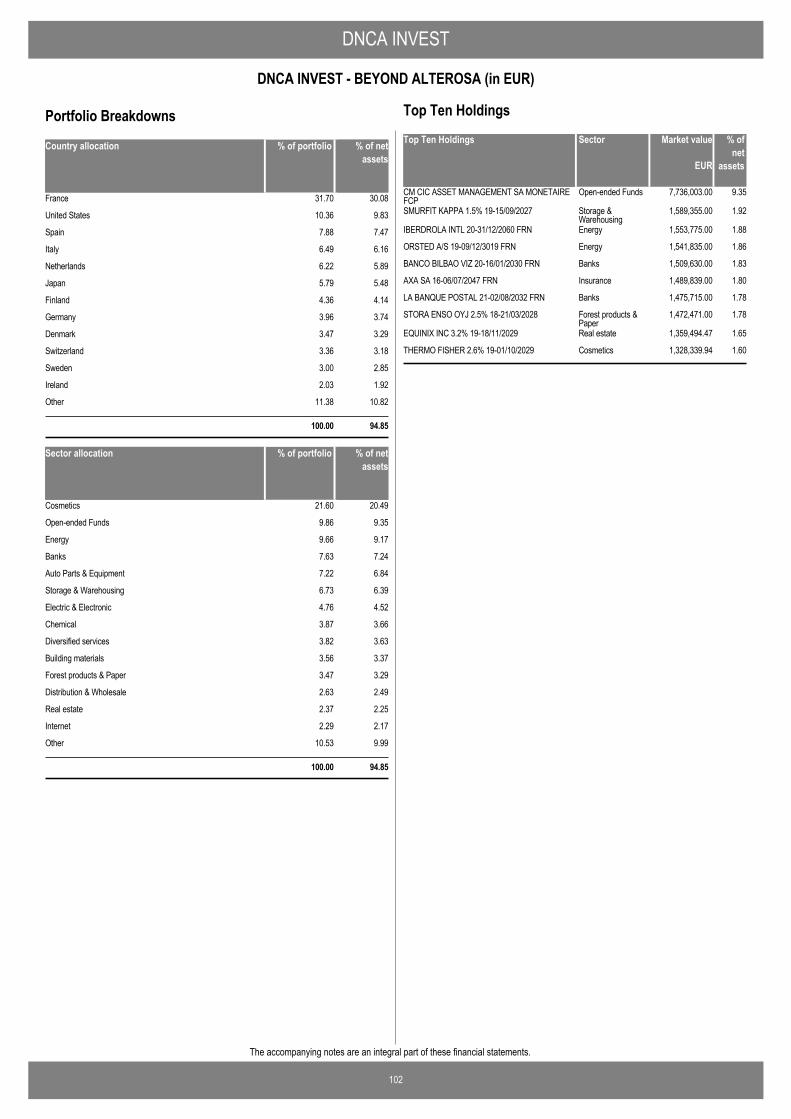
DNCA INVEST
102
DNCA INVEST - BEYOND ALTEROSA (in EUR)
The accompanying notes are an integral part of these financial statements.
Country allocation % of portfolio % of netassets
France 31.70 30.08
United States 10.36 9.83
Spain 7.88 7.47
Italy 6.49 6.16
Netherlands 6.22 5.89
Japan 5.79 5.48
Finland 4.36 4.14
Germany 3.96 3.74
Denmark 3.47 3.29
Switzerland 3.36 3.18
Sweden 3.00 2.85
Ireland 2.03 1.92
Other 11.38 10.82
100.00 94.85
Sector allocation % of portfolio % of netassets
Cosmetics 21.60 20.49
Open-ended Funds 9.86 9.35
Energy 9.66 9.17
Banks 7.63 7.24
Auto Parts & Equipment 7.22 6.84
Storage & Warehousing 6.73 6.39
Electric & Electronic 4.76 4.52
Chemical 3.87 3.66
Diversified services 3.82 3.63
Building materials 3.56 3.37
Forest products & Paper 3.47 3.29
Distribution & Wholesale 2.63 2.49
Real estate 2.37 2.25
Internet 2.29 2.17
Other 10.53 9.99
100.00 94.85
Portfolio BreakdownsTop Ten Holdings Market value % of
netassets
CM CIC ASSET MANAGEMENT SA MONETAIREFCP
7,736,003.00 9.35Open-ended Funds
SMURFIT KAPPA 1.5% 19-15/09/2027 1,589,355.00 1.92Storage &Warehousing
IBERDROLA INTL 20-31/12/2060 FRN 1,553,775.00 1.88Energy
ORSTED A/S 19-09/12/3019 FRN 1,541,835.00 1.86Energy
BANCO BILBAO VIZ 20-16/01/2030 FRN 1,509,630.00 1.83Banks
AXA SA 16-06/07/2047 FRN 1,489,839.00 1.80Insurance
LA BANQUE POSTAL 21-02/08/2032 FRN 1,475,715.00 1.78Banks
STORA ENSO OYJ 2.5% 18-21/03/2028 1,472,471.00 1.78Forest products &Paper
EQUINIX INC 3.2% 19-18/11/2029 1,359,494.47 1.65Real estate
THERMO FISHER 2.6% 19-01/10/2029 1,328,339.94 1.60Cosmetics
EUR
Sector
Top Ten Holdings

103
The accompanying notes are an integral part of these financial statements.
DNCA INVEST
DNCA INVEST - BEYOND SEMPEROSA (in EUR)Statement of Operations and Changes in Net Assets for theperiod ended June 30, 2021
EUR
AssetsInvestment in securities at cost 201,285,801.48Unrealised appreciation / (depreciation) on securities 46,536,233.45
Investment in securities at market value 2.2 247,822,034.93Cash at bank 2.2 23,747,654.64Receivable on subscriptions 46,968.97Receivable on withholding tax reclaim 18,600.80Dividends and interest receivable 2.6 56,000.00
Total assets 271,691,259.34
LiabilitiesBank overdraft 61.30Accrued expenses 276,719.58Payable on redemptions 157,453.14
Total liabilities 434,234.02
Net assets at the end of the period 271,257,025.32
Notes
Statement of Net Assets as at June 30, 2021
IncomeDividends (net of withholding taxes) 2.6 2,290,195.45Bank interest 2.6 0.51
Total income 2,290,195.96
ExpensesManagement fees 4 1,291,862.83Depositary fees 5 39,990.86Performance fees 4 2,113.82Administration fees 5 27,118.60Professional fees 7 11,537.35Transaction costs 2.7 116,043.92Taxe d'abonnement 6 20,383.04Bank interest and charges 2.5 47,558.79Transfer agent fees 60,557.29Printing & Publication fees 4,469.91Other expenses 7 1,634.80
Total expenses 1,623,271.21
Net investment income / (loss) 666,924.75
Net realised gain / (loss) on: Investments 2.4 5,589,314.98Foreign currencies transactions 2.3 (9,087.15)
Net realised gain / (loss) for the period 6,247,152.58
Net change in unrealised appreciation / (depreciation) on: Investments 15,643,904.43
Increase / (Decrease) in net assets as a result ofoperations
21,891,057.01
Proceeds received on subscription of shares 84,055,710.79Net amount paid on redemption of shares (60,096,943.76)Net assets at the beginning of the period 225,407,201.28
Net assets at the end of the period 271,257,025.32
EURNotes
Statement of Operations and Changes in Net Assets forthe period ended June 30, 2021

104
The accompanying notes are an integral part of these financial statements.
DNCA INVEST
DNCA INVEST - BEYOND SEMPEROSA (in EUR)
Number of shares in issue atthe end of the period
Number of shares in issue atthe beginning of the period
Number of sharesissued
Number of sharesredeemed
Statement of Changes in Number of Shares
Class A shares EUR 95,595.948 109,602.059 (20,457.057) 184,740.950
Class I shares EUR 1,130,958.114 114,397.033 (304,982.489) 940,372.658
Class ID shares EUR - 354,215.030 - 354,215.030
Class N shares EUR 86,373.411 30,479.376 (11,901.824) 104,950.963
Class Q shares EUR 813.236 34.391 - 847.627
Class SI shares EUR 387,356.000 111,590.000 (117,751.000) 381,195.000
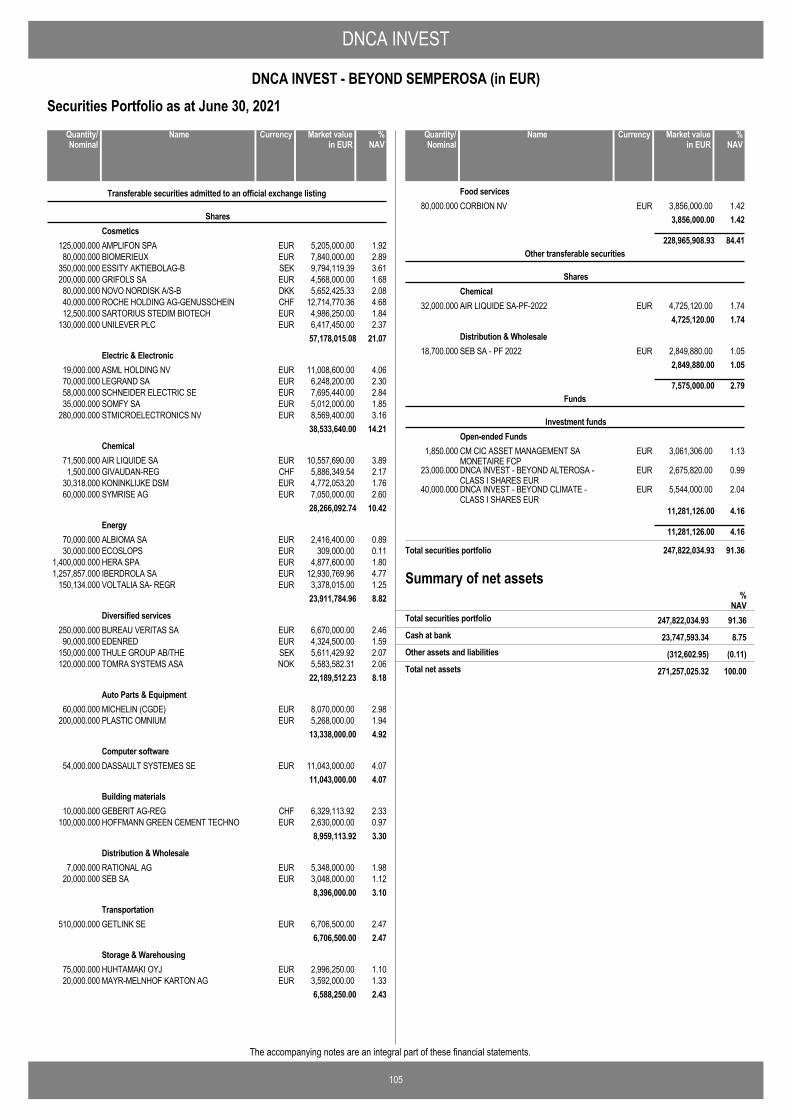
DNCA INVEST
105
DNCA INVEST - BEYOND SEMPEROSA (in EUR)
The accompanying notes are an integral part of these financial statements.
Securities Portfolio as at June 30, 2021
AMPLIFON SPA EUR 5,205,000.00 1.92125,000.000
Transferable securities admitted to an official exchange listing
SharesCosmetics
BIOMERIEUX EUR 7,840,000.00 2.8980,000.000ESSITY AKTIEBOLAG-B SEK 9,794,119.39 3.61350,000.000GRIFOLS SA EUR 4,568,000.00 1.68200,000.000NOVO NORDISK A/S-B DKK 5,652,425.33 2.0880,000.000ROCHE HOLDING AG-GENUSSCHEIN CHF 12,714,770.36 4.6840,000.000SARTORIUS STEDIM BIOTECH EUR 4,986,250.00 1.8412,500.000UNILEVER PLC EUR 6,417,450.00 2.37130,000.000
57,178,015.08 21.07
ASML HOLDING NV EUR 11,008,600.00 4.0619,000.000Electric & Electronic
LEGRAND SA EUR 6,248,200.00 2.3070,000.000SCHNEIDER ELECTRIC SE EUR 7,695,440.00 2.8458,000.000SOMFY SA EUR 5,012,000.00 1.8535,000.000STMICROELECTRONICS NV EUR 8,569,400.00 3.16280,000.000
38,533,640.00 14.21
AIR LIQUIDE SA EUR 10,557,690.00 3.8971,500.000Chemical
GIVAUDAN-REG CHF 5,886,349.54 2.171,500.000KONINKLIJKE DSM EUR 4,772,053.20 1.7630,318.000SYMRISE AG EUR 7,050,000.00 2.6060,000.000
28,266,092.74 10.42
ALBIOMA SA EUR 2,416,400.00 0.8970,000.000Energy
ECOSLOPS EUR 309,000.00 0.1130,000.000HERA SPA EUR 4,877,600.00 1.801,400,000.000IBERDROLA SA EUR 12,930,769.96 4.771,257,857.000VOLTALIA SA- REGR EUR 3,378,015.00 1.25150,134.000
23,911,784.96 8.82
BUREAU VERITAS SA EUR 6,670,000.00 2.46250,000.000Diversified services
EDENRED EUR 4,324,500.00 1.5990,000.000THULE GROUP AB/THE SEK 5,611,429.92 2.07150,000.000TOMRA SYSTEMS ASA NOK 5,583,582.31 2.06120,000.000
22,189,512.23 8.18
MICHELIN (CGDE) EUR 8,070,000.00 2.9860,000.000Auto Parts & Equipment
PLASTIC OMNIUM EUR 5,268,000.00 1.94200,000.00013,338,000.00 4.92
DASSAULT SYSTEMES SE EUR 11,043,000.00 4.0754,000.000Computer software
11,043,000.00 4.07
GEBERIT AG-REG CHF 6,329,113.92 2.3310,000.000Building materials
HOFFMANN GREEN CEMENT TECHNO EUR 2,630,000.00 0.97100,000.0008,959,113.92 3.30
RATIONAL AG EUR 5,348,000.00 1.987,000.000Distribution & Wholesale
SEB SA EUR 3,048,000.00 1.1220,000.0008,396,000.00 3.10
GETLINK SE EUR 6,706,500.00 2.47510,000.000Transportation
6,706,500.00 2.47
HUHTAMAKI OYJ EUR 2,996,250.00 1.1075,000.000Storage & Warehousing
MAYR-MELNHOF KARTON AG EUR 3,592,000.00 1.3320,000.0006,588,250.00 2.43
NameQuantity/Nominal
Market valuein EUR
Currency %NAV
CORBION NV EUR 3,856,000.00 1.4280,000.000Food services
3,856,000.00 1.42
228,965,908.93 84.41
AIR LIQUIDE SA-PF-2022 EUR 4,725,120.00 1.7432,000.000
Other transferable securities
SharesChemical
4,725,120.00 1.74
SEB SA - PF 2022 EUR 2,849,880.00 1.0518,700.000Distribution & Wholesale
2,849,880.00 1.05
7,575,000.00 2.79
CM CIC ASSET MANAGEMENT SAMONETAIRE FCP
EUR 3,061,306.00 1.131,850.000
Funds
Investment fundsOpen-ended Funds
DNCA INVEST - BEYOND ALTEROSA -CLASS I SHARES EUR
EUR 2,675,820.00 0.9923,000.000
DNCA INVEST - BEYOND CLIMATE -CLASS I SHARES EUR
EUR 5,544,000.00 2.0440,000.000
11,281,126.00 4.16
11,281,126.00 4.16
Total securities portfolio 247,822,034.93 91.36
NameQuantity/Nominal
Market valuein EUR
Currency %NAV
Summary of net assets%
NAV247,822,034.93 91.36Total securities portfolio
23,747,593.34 8.75Cash at bank
(312,602.95) (0.11)Other assets and liabilities
271,257,025.32 100.00Total net assets
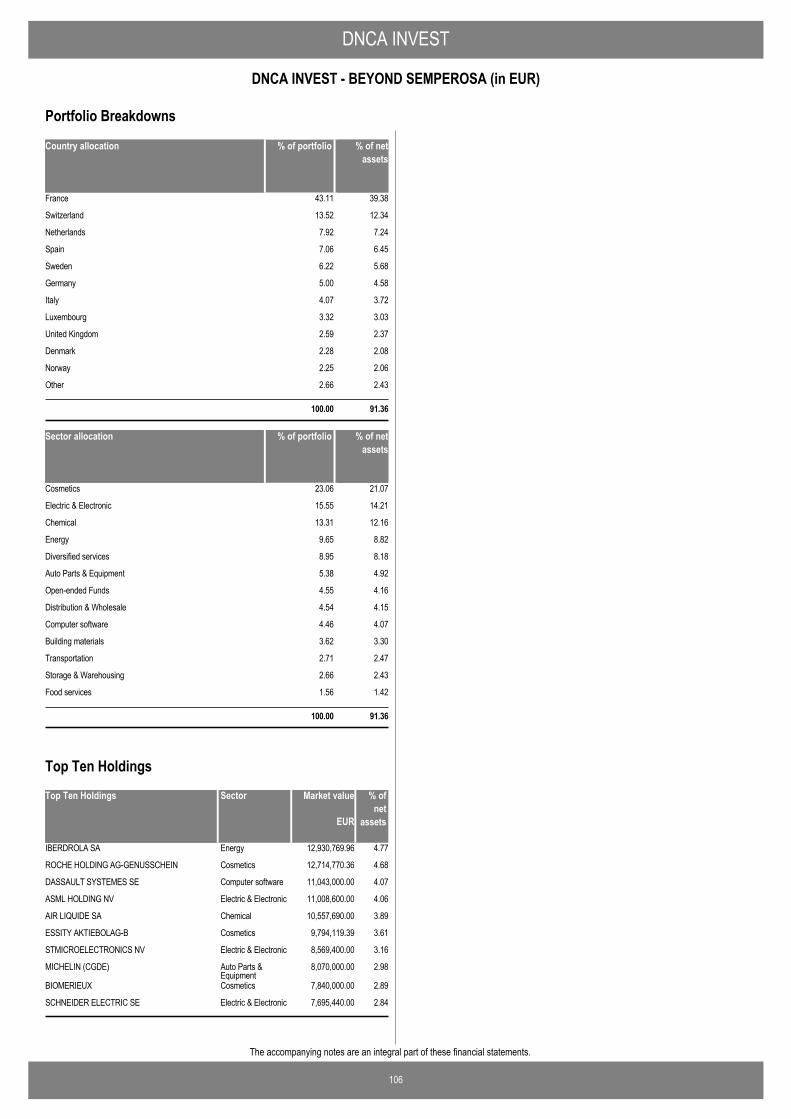
DNCA INVEST
106
DNCA INVEST - BEYOND SEMPEROSA (in EUR)
The accompanying notes are an integral part of these financial statements.
Country allocation % of portfolio % of netassets
France 43.11 39.38
Switzerland 13.52 12.34
Netherlands 7.92 7.24
Spain 7.06 6.45
Sweden 6.22 5.68
Germany 5.00 4.58
Italy 4.07 3.72
Luxembourg 3.32 3.03
United Kingdom 2.59 2.37
Denmark 2.28 2.08
Norway 2.25 2.06
Other 2.66 2.43
100.00 91.36
Sector allocation % of portfolio % of netassets
Cosmetics 23.06 21.07
Electric & Electronic 15.55 14.21
Chemical 13.31 12.16
Energy 9.65 8.82
Diversified services 8.95 8.18
Auto Parts & Equipment 5.38 4.92
Open-ended Funds 4.55 4.16
Distribution & Wholesale 4.54 4.15
Computer software 4.46 4.07
Building materials 3.62 3.30
Transportation 2.71 2.47
Storage & Warehousing 2.66 2.43
Food services 1.56 1.42
100.00 91.36
Portfolio Breakdowns
Top Ten Holdings Market value % ofnet
assets
IBERDROLA SA 12,930,769.96 4.77Energy
ROCHE HOLDING AG-GENUSSCHEIN 12,714,770.36 4.68Cosmetics
DASSAULT SYSTEMES SE 11,043,000.00 4.07Computer software
ASML HOLDING NV 11,008,600.00 4.06Electric & Electronic
AIR LIQUIDE SA 10,557,690.00 3.89Chemical
ESSITY AKTIEBOLAG-B 9,794,119.39 3.61Cosmetics
STMICROELECTRONICS NV 8,569,400.00 3.16Electric & Electronic
MICHELIN (CGDE) 8,070,000.00 2.98Auto Parts &Equipment
BIOMERIEUX 7,840,000.00 2.89Cosmetics
SCHNEIDER ELECTRIC SE 7,695,440.00 2.84Electric & Electronic
EUR
Sector
Top Ten Holdings
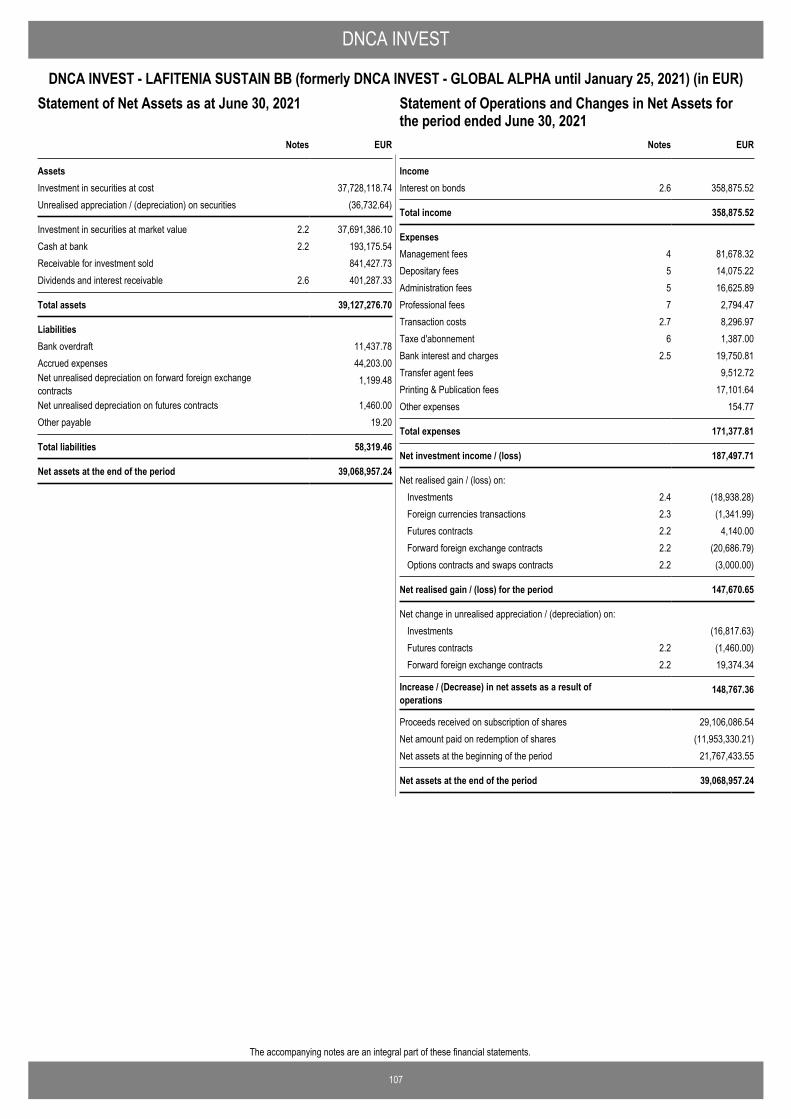
107
The accompanying notes are an integral part of these financial statements.
DNCA INVEST
DNCA INVEST - LAFITENIA SUSTAIN BB (formerly DNCA INVEST - GLOBAL ALPHA until January 25, 2021) (in EUR)Statement of Operations and Changes in Net Assets for theperiod ended June 30, 2021
EUR
AssetsInvestment in securities at cost 37,728,118.74Unrealised appreciation / (depreciation) on securities (36,732.64)
Investment in securities at market value 2.2 37,691,386.10Cash at bank 2.2 193,175.54Receivable for investment sold 841,427.73Dividends and interest receivable 2.6 401,287.33
Total assets 39,127,276.70
LiabilitiesBank overdraft 11,437.78Accrued expenses 44,203.00Net unrealised depreciation on forward foreign exchangecontracts
1,199.48
Net unrealised depreciation on futures contracts 1,460.00Other payable 19.20
Total liabilities 58,319.46
Net assets at the end of the period 39,068,957.24
Notes
Statement of Net Assets as at June 30, 2021
IncomeInterest on bonds 2.6 358,875.52
Total income 358,875.52
ExpensesManagement fees 4 81,678.32Depositary fees 5 14,075.22Administration fees 5 16,625.89Professional fees 7 2,794.47Transaction costs 2.7 8,296.97Taxe d'abonnement 6 1,387.00Bank interest and charges 2.5 19,750.81Transfer agent fees 9,512.72Printing & Publication fees 17,101.64Other expenses 154.77
Total expenses 171,377.81
Net investment income / (loss) 187,497.71
Net realised gain / (loss) on: Investments 2.4 (18,938.28)Foreign currencies transactions 2.3 (1,341.99)Futures contracts 2.2 4,140.00Forward foreign exchange contracts 2.2 (20,686.79)Options contracts and swaps contracts 2.2 (3,000.00)
Net realised gain / (loss) for the period 147,670.65
Net change in unrealised appreciation / (depreciation) on: Investments (16,817.63)Futures contracts 2.2 (1,460.00)Forward foreign exchange contracts 2.2 19,374.34
Increase / (Decrease) in net assets as a result ofoperations
148,767.36
Proceeds received on subscription of shares 29,106,086.54Net amount paid on redemption of shares (11,953,330.21)Net assets at the beginning of the period 21,767,433.55
Net assets at the end of the period 39,068,957.24
EURNotes
Statement of Operations and Changes in Net Assets forthe period ended June 30, 2021
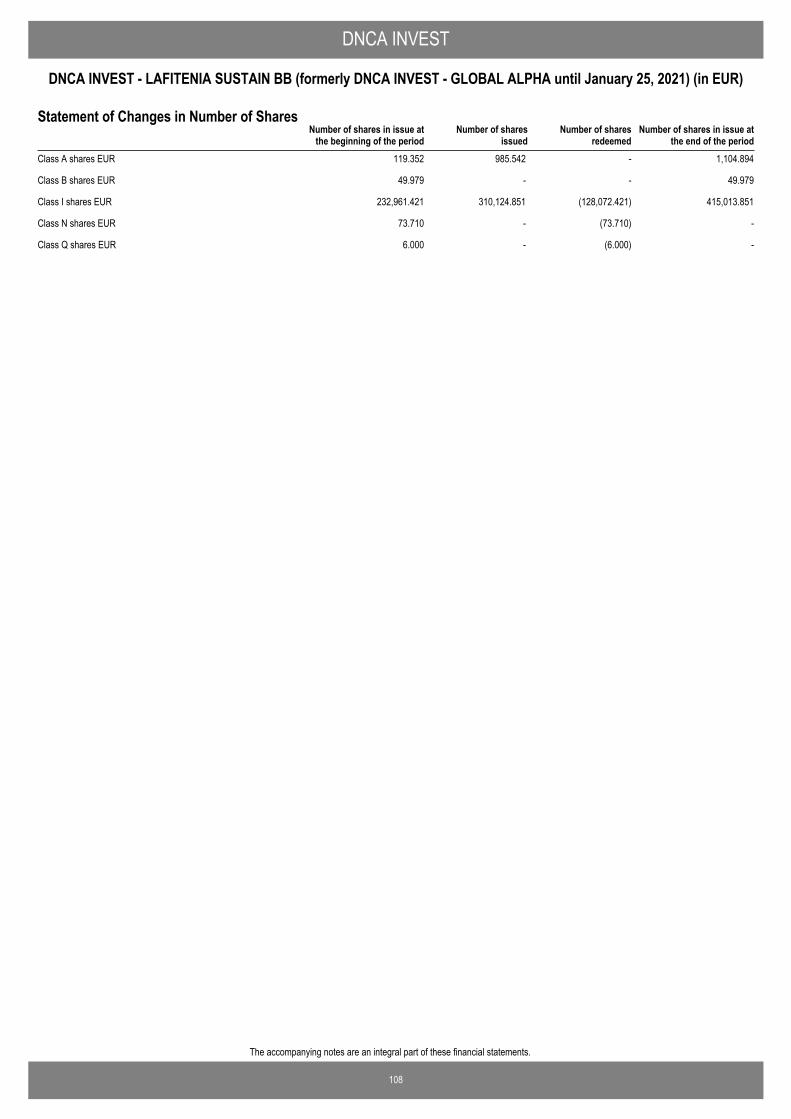
108
The accompanying notes are an integral part of these financial statements.
DNCA INVEST
DNCA INVEST - LAFITENIA SUSTAIN BB (formerly DNCA INVEST - GLOBAL ALPHA until January 25, 2021) (in EUR)
Number of shares in issue atthe end of the period
Number of shares in issue atthe beginning of the period
Number of sharesissued
Number of sharesredeemed
Statement of Changes in Number of Shares
Class A shares EUR 119.352 985.542 - 1,104.894
Class B shares EUR 49.979 - - 49.979
Class I shares EUR 232,961.421 310,124.851 (128,072.421) 415,013.851
Class N shares EUR 73.710 - (73.710) -
Class Q shares EUR 6.000 - (6.000) -
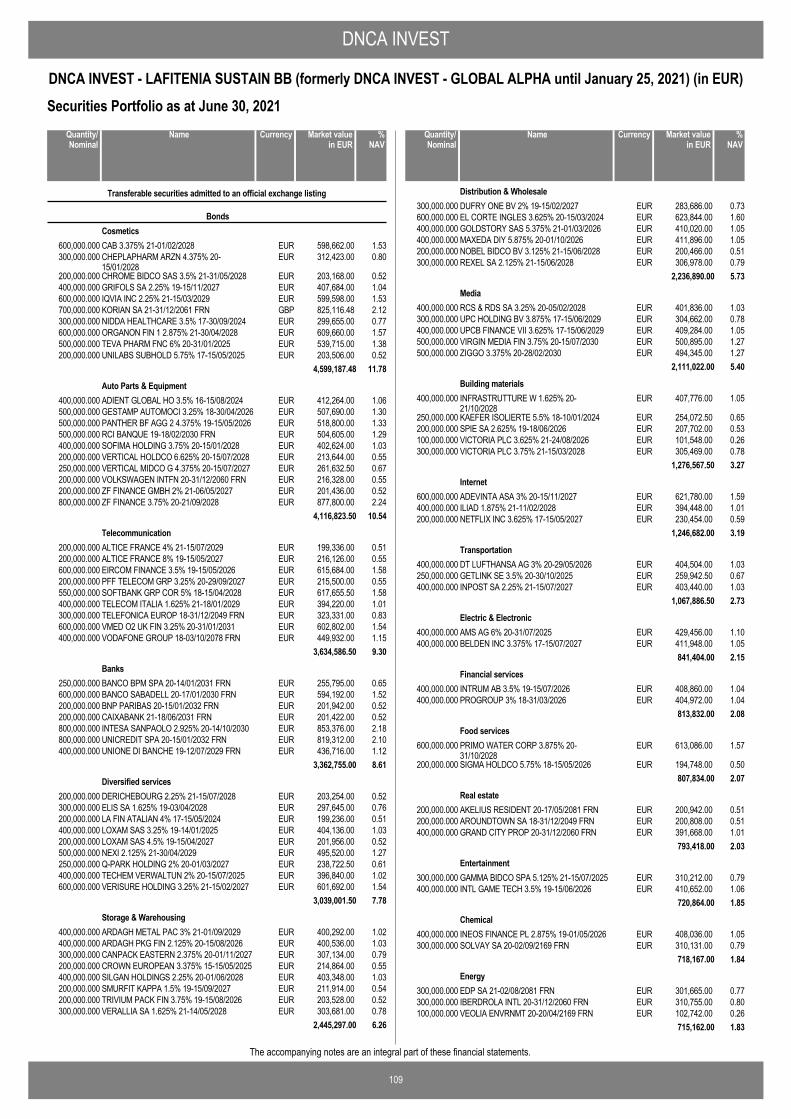
DNCA INVEST
109
DNCA INVEST - LAFITENIA SUSTAIN BB (formerly DNCA INVEST - GLOBAL ALPHA until January 25, 2021) (in EUR)
The accompanying notes are an integral part of these financial statements.
Securities Portfolio as at June 30, 2021
CAB 3.375% 21-01/02/2028 EUR 598,662.00 1.53600,000.000
Transferable securities admitted to an official exchange listing
BondsCosmetics
CHEPLAPHARM ARZN 4.375% 20-15/01/2028
EUR 312,423.00 0.80300,000.000
CHROME BIDCO SAS 3.5% 21-31/05/2028 EUR 203,168.00 0.52200,000.000GRIFOLS SA 2.25% 19-15/11/2027 EUR 407,684.00 1.04400,000.000IQVIA INC 2.25% 21-15/03/2029 EUR 599,598.00 1.53600,000.000KORIAN SA 21-31/12/2061 FRN GBP 825,116.48 2.12700,000.000NIDDA HEALTHCARE 3.5% 17-30/09/2024 EUR 299,655.00 0.77300,000.000ORGANON FIN 1 2.875% 21-30/04/2028 EUR 609,660.00 1.57600,000.000TEVA PHARM FNC 6% 20-31/01/2025 EUR 539,715.00 1.38500,000.000UNILABS SUBHOLD 5.75% 17-15/05/2025 EUR 203,506.00 0.52200,000.000
4,599,187.48 11.78
ADIENT GLOBAL HO 3.5% 16-15/08/2024 EUR 412,264.00 1.06400,000.000Auto Parts & Equipment
GESTAMP AUTOMOCI 3.25% 18-30/04/2026 EUR 507,690.00 1.30500,000.000PANTHER BF AGG 2 4.375% 19-15/05/2026 EUR 518,800.00 1.33500,000.000RCI BANQUE 19-18/02/2030 FRN EUR 504,605.00 1.29500,000.000SOFIMA HOLDING 3.75% 20-15/01/2028 EUR 402,624.00 1.03400,000.000VERTICAL HOLDCO 6.625% 20-15/07/2028 EUR 213,644.00 0.55200,000.000VERTICAL MIDCO G 4.375% 20-15/07/2027 EUR 261,632.50 0.67250,000.000VOLKSWAGEN INTFN 20-31/12/2060 FRN EUR 216,328.00 0.55200,000.000ZF FINANCE GMBH 2% 21-06/05/2027 EUR 201,436.00 0.52200,000.000ZF FINANCE 3.75% 20-21/09/2028 EUR 877,800.00 2.24800,000.000
4,116,823.50 10.54
ALTICE FRANCE 4% 21-15/07/2029 EUR 199,336.00 0.51200,000.000Telecommunication
ALTICE FRANCE 8% 19-15/05/2027 EUR 216,126.00 0.55200,000.000EIRCOM FINANCE 3.5% 19-15/05/2026 EUR 615,684.00 1.58600,000.000PFF TELECOM GRP 3.25% 20-29/09/2027 EUR 215,500.00 0.55200,000.000SOFTBANK GRP COR 5% 18-15/04/2028 EUR 617,655.50 1.58550,000.000TELECOM ITALIA 1.625% 21-18/01/2029 EUR 394,220.00 1.01400,000.000TELEFONICA EUROP 18-31/12/2049 FRN EUR 323,331.00 0.83300,000.000VMED O2 UK FIN 3.25% 20-31/01/2031 EUR 602,802.00 1.54600,000.000VODAFONE GROUP 18-03/10/2078 FRN EUR 449,932.00 1.15400,000.000
3,634,586.50 9.30
BANCO BPM SPA 20-14/01/2031 FRN EUR 255,795.00 0.65250,000.000Banks
BANCO SABADELL 20-17/01/2030 FRN EUR 594,192.00 1.52600,000.000BNP PARIBAS 20-15/01/2032 FRN EUR 201,942.00 0.52200,000.000CAIXABANK 21-18/06/2031 FRN EUR 201,422.00 0.52200,000.000INTESA SANPAOLO 2.925% 20-14/10/2030 EUR 853,376.00 2.18800,000.000UNICREDIT SPA 20-15/01/2032 FRN EUR 819,312.00 2.10800,000.000UNIONE DI BANCHE 19-12/07/2029 FRN EUR 436,716.00 1.12400,000.000
3,362,755.00 8.61
DERICHEBOURG 2.25% 21-15/07/2028 EUR 203,254.00 0.52200,000.000Diversified services
ELIS SA 1.625% 19-03/04/2028 EUR 297,645.00 0.76300,000.000LA FIN ATALIAN 4% 17-15/05/2024 EUR 199,236.00 0.51200,000.000LOXAM SAS 3.25% 19-14/01/2025 EUR 404,136.00 1.03400,000.000LOXAM SAS 4.5% 19-15/04/2027 EUR 201,956.00 0.52200,000.000NEXI 2.125% 21-30/04/2029 EUR 495,520.00 1.27500,000.000Q-PARK HOLDING 2% 20-01/03/2027 EUR 238,722.50 0.61250,000.000TECHEM VERWALTUN 2% 20-15/07/2025 EUR 396,840.00 1.02400,000.000VERISURE HOLDING 3.25% 21-15/02/2027 EUR 601,692.00 1.54600,000.000
3,039,001.50 7.78
ARDAGH METAL PAC 3% 21-01/09/2029 EUR 400,292.00 1.02400,000.000Storage & Warehousing
ARDAGH PKG FIN 2.125% 20-15/08/2026 EUR 400,536.00 1.03400,000.000CANPACK EASTERN 2.375% 20-01/11/2027 EUR 307,134.00 0.79300,000.000CROWN EUROPEAN 3.375% 15-15/05/2025 EUR 214,864.00 0.55200,000.000SILGAN HOLDINGS 2.25% 20-01/06/2028 EUR 403,348.00 1.03400,000.000SMURFIT KAPPA 1.5% 19-15/09/2027 EUR 211,914.00 0.54200,000.000TRIVIUM PACK FIN 3.75% 19-15/08/2026 EUR 203,528.00 0.52200,000.000VERALLIA SA 1.625% 21-14/05/2028 EUR 303,681.00 0.78300,000.000
2,445,297.00 6.26
NameQuantity/Nominal
Market valuein EUR
Currency %NAV
DUFRY ONE BV 2% 19-15/02/2027 EUR 283,686.00 0.73300,000.000Distribution & Wholesale
EL CORTE INGLES 3.625% 20-15/03/2024 EUR 623,844.00 1.60600,000.000GOLDSTORY SAS 5.375% 21-01/03/2026 EUR 410,020.00 1.05400,000.000MAXEDA DIY 5.875% 20-01/10/2026 EUR 411,896.00 1.05400,000.000NOBEL BIDCO BV 3.125% 21-15/06/2028 EUR 200,466.00 0.51200,000.000REXEL SA 2.125% 21-15/06/2028 EUR 306,978.00 0.79300,000.000
2,236,890.00 5.73
RCS & RDS SA 3.25% 20-05/02/2028 EUR 401,836.00 1.03400,000.000Media
UPC HOLDING BV 3.875% 17-15/06/2029 EUR 304,662.00 0.78300,000.000UPCB FINANCE VII 3.625% 17-15/06/2029 EUR 409,284.00 1.05400,000.000VIRGIN MEDIA FIN 3.75% 20-15/07/2030 EUR 500,895.00 1.27500,000.000ZIGGO 3.375% 20-28/02/2030 EUR 494,345.00 1.27500,000.000
2,111,022.00 5.40
INFRASTRUTTURE W 1.625% 20-21/10/2028
EUR 407,776.00 1.05400,000.000Building materials
KAEFER ISOLIERTE 5.5% 18-10/01/2024 EUR 254,072.50 0.65250,000.000SPIE SA 2.625% 19-18/06/2026 EUR 207,702.00 0.53200,000.000VICTORIA PLC 3.625% 21-24/08/2026 EUR 101,548.00 0.26100,000.000VICTORIA PLC 3.75% 21-15/03/2028 EUR 305,469.00 0.78300,000.000
1,276,567.50 3.27
ADEVINTA ASA 3% 20-15/11/2027 EUR 621,780.00 1.59600,000.000Internet
ILIAD 1.875% 21-11/02/2028 EUR 394,448.00 1.01400,000.000NETFLIX INC 3.625% 17-15/05/2027 EUR 230,454.00 0.59200,000.000
1,246,682.00 3.19
DT LUFTHANSA AG 3% 20-29/05/2026 EUR 404,504.00 1.03400,000.000Transportation
GETLINK SE 3.5% 20-30/10/2025 EUR 259,942.50 0.67250,000.000INPOST SA 2.25% 21-15/07/2027 EUR 403,440.00 1.03400,000.000
1,067,886.50 2.73
AMS AG 6% 20-31/07/2025 EUR 429,456.00 1.10400,000.000Electric & Electronic
BELDEN INC 3.375% 17-15/07/2027 EUR 411,948.00 1.05400,000.000841,404.00 2.15
INTRUM AB 3.5% 19-15/07/2026 EUR 408,860.00 1.04400,000.000Financial services
PROGROUP 3% 18-31/03/2026 EUR 404,972.00 1.04400,000.000813,832.00 2.08
PRIMO WATER CORP 3.875% 20-31/10/2028
EUR 613,086.00 1.57600,000.000Food services
SIGMA HOLDCO 5.75% 18-15/05/2026 EUR 194,748.00 0.50200,000.000807,834.00 2.07
AKELIUS RESIDENT 20-17/05/2081 FRN EUR 200,942.00 0.51200,000.000Real estate
AROUNDTOWN SA 18-31/12/2049 FRN EUR 200,808.00 0.51200,000.000GRAND CITY PROP 20-31/12/2060 FRN EUR 391,668.00 1.01400,000.000
793,418.00 2.03
GAMMA BIDCO SPA 5.125% 21-15/07/2025 EUR 310,212.00 0.79300,000.000Entertainment
INTL GAME TECH 3.5% 19-15/06/2026 EUR 410,652.00 1.06400,000.000720,864.00 1.85
INEOS FINANCE PL 2.875% 19-01/05/2026 EUR 408,036.00 1.05400,000.000Chemical
SOLVAY SA 20-02/09/2169 FRN EUR 310,131.00 0.79300,000.000718,167.00 1.84
EDP SA 21-02/08/2081 FRN EUR 301,665.00 0.77300,000.000Energy
IBERDROLA INTL 20-31/12/2060 FRN EUR 310,755.00 0.80300,000.000VEOLIA ENVRNMT 20-20/04/2169 FRN EUR 102,742.00 0.26100,000.000
715,162.00 1.83
NameQuantity/Nominal
Market valuein EUR
Currency %NAV
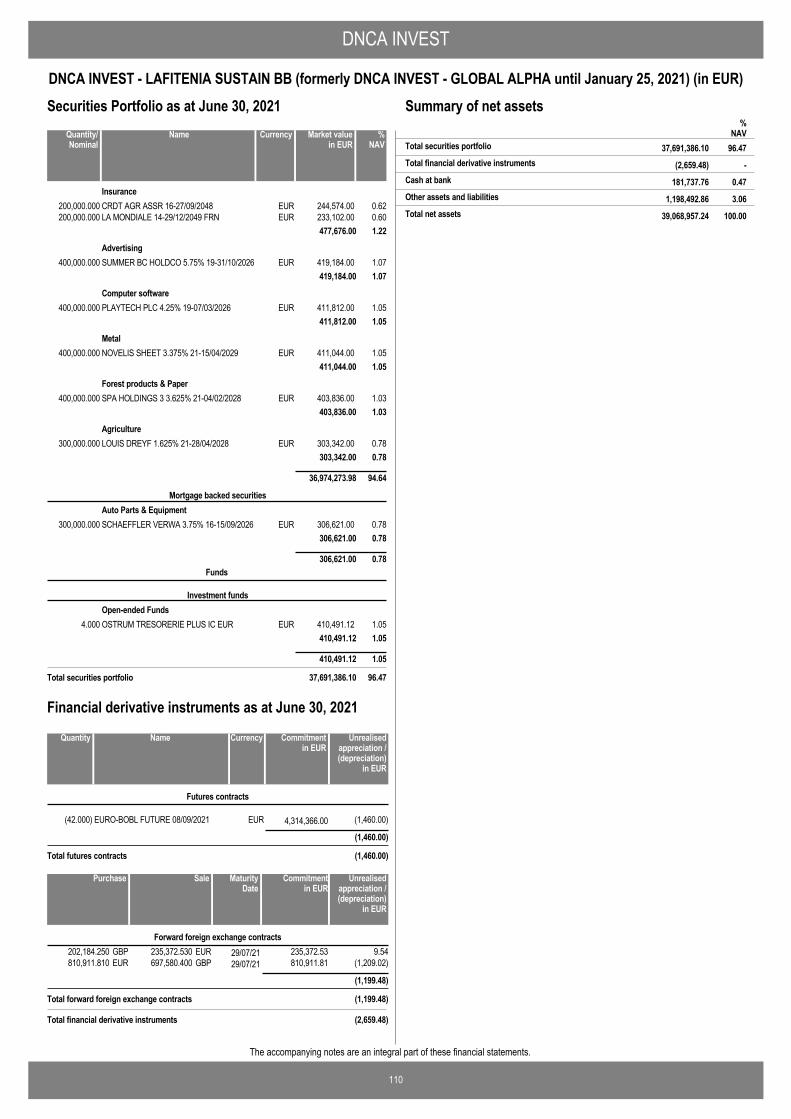
DNCA INVEST
110
DNCA INVEST - LAFITENIA SUSTAIN BB (formerly DNCA INVEST - GLOBAL ALPHA until January 25, 2021) (in EUR)
The accompanying notes are an integral part of these financial statements.
Securities Portfolio as at June 30, 2021
CRDT AGR ASSR 16-27/09/2048 EUR 244,574.00 0.62200,000.000Insurance
LA MONDIALE 14-29/12/2049 FRN EUR 233,102.00 0.60200,000.000477,676.00 1.22
SUMMER BC HOLDCO 5.75% 19-31/10/2026 EUR 419,184.00 1.07400,000.000Advertising
419,184.00 1.07
PLAYTECH PLC 4.25% 19-07/03/2026 EUR 411,812.00 1.05400,000.000Computer software
411,812.00 1.05
NOVELIS SHEET 3.375% 21-15/04/2029 EUR 411,044.00 1.05400,000.000Metal
411,044.00 1.05
SPA HOLDINGS 3 3.625% 21-04/02/2028 EUR 403,836.00 1.03400,000.000Forest products & Paper
403,836.00 1.03
LOUIS DREYF 1.625% 21-28/04/2028 EUR 303,342.00 0.78300,000.000Agriculture
303,342.00 0.78
36,974,273.98 94.64
SCHAEFFLER VERWA 3.75% 16-15/09/2026 EUR 306,621.00 0.78300,000.000
Mortgage backed securitiesAuto Parts & Equipment
306,621.00 0.78
306,621.00 0.78
OSTRUM TRESORERIE PLUS IC EUR EUR 410,491.12 1.054.000
Funds
Investment fundsOpen-ended Funds
410,491.12 1.05
410,491.12 1.05
Total securities portfolio 37,691,386.10 96.47
NameQuantity/Nominal
Market valuein EUR
Currency %NAV
EURO-BOBL FUTURE 08/09/2021 EUR 4,314,366.00(42.000) (1,460.00)
Futures contracts
(1,460.00)
Total futures contracts (1,460.00)
NameQuantity Commitmentin EUR
Currency Unrealisedappreciation /(depreciation)
in EUR
Financial derivative instruments as at June 30, 2021
235,372.530 29/07/21202,184.250 9.54EURGBP 235,372.53Forward foreign exchange contracts
697,580.400 29/07/21810,911.810 (1,209.02)GBPEUR 810,911.81
(1,199.48)
Total forward foreign exchange contracts (1,199.48)
SalePurchase Unrealisedappreciation /(depreciation)
in EUR
MaturityDate
Commitmentin EUR
Total financial derivative instruments (2,659.48)
Summary of net assets
(2,659.48) -Total financial derivative instruments
%NAV
37,691,386.10 96.47Total securities portfolio
181,737.76 0.47Cash at bank
1,198,492.86 3.06Other assets and liabilities
39,068,957.24 100.00Total net assets
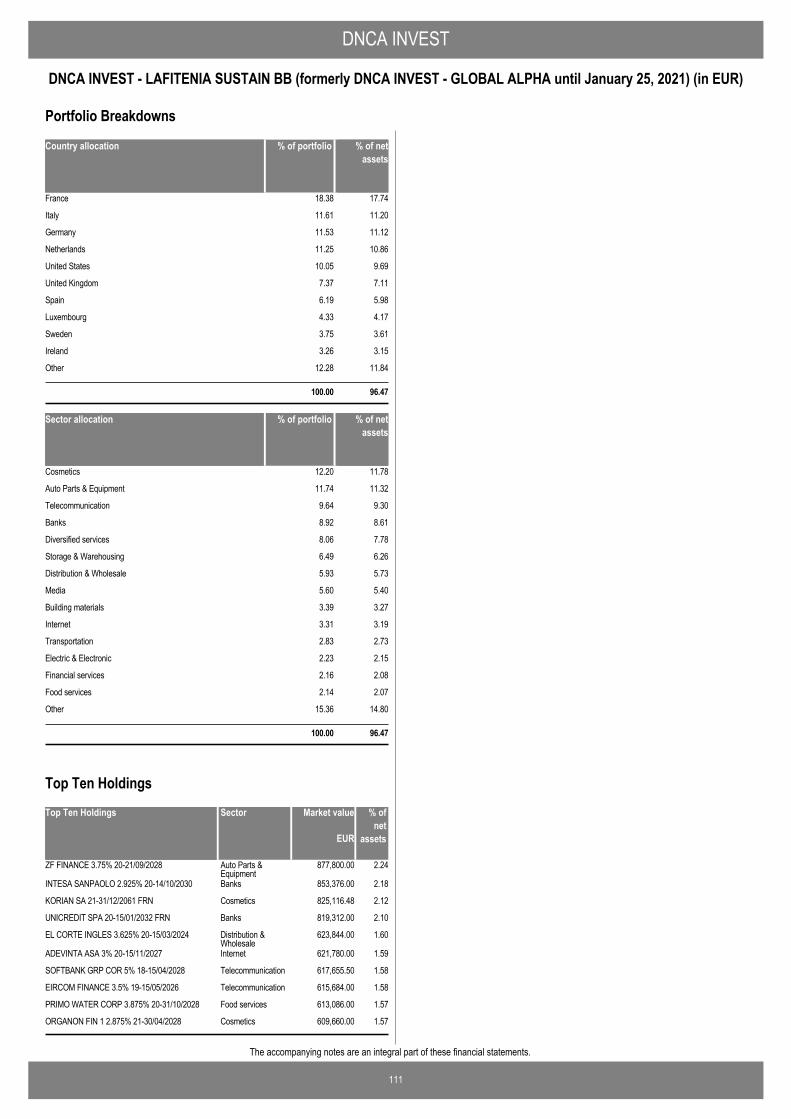
DNCA INVEST
111
DNCA INVEST - LAFITENIA SUSTAIN BB (formerly DNCA INVEST - GLOBAL ALPHA until January 25, 2021) (in EUR)
The accompanying notes are an integral part of these financial statements.
Country allocation % of portfolio % of netassets
France 18.38 17.74
Italy 11.61 11.20
Germany 11.53 11.12
Netherlands 11.25 10.86
United States 10.05 9.69
United Kingdom 7.37 7.11
Spain 6.19 5.98
Luxembourg 4.33 4.17
Sweden 3.75 3.61
Ireland 3.26 3.15
Other 12.28 11.84
100.00 96.47
Sector allocation % of portfolio % of netassets
Cosmetics 12.20 11.78
Auto Parts & Equipment 11.74 11.32
Telecommunication 9.64 9.30
Banks 8.92 8.61
Diversified services 8.06 7.78
Storage & Warehousing 6.49 6.26
Distribution & Wholesale 5.93 5.73
Media 5.60 5.40
Building materials 3.39 3.27
Internet 3.31 3.19
Transportation 2.83 2.73
Electric & Electronic 2.23 2.15
Financial services 2.16 2.08
Food services 2.14 2.07
Other 15.36 14.80
100.00 96.47
Portfolio Breakdowns
Top Ten Holdings Market value % ofnet
assets
ZF FINANCE 3.75% 20-21/09/2028 877,800.00 2.24Auto Parts &Equipment
INTESA SANPAOLO 2.925% 20-14/10/2030 853,376.00 2.18Banks
KORIAN SA 21-31/12/2061 FRN 825,116.48 2.12Cosmetics
UNICREDIT SPA 20-15/01/2032 FRN 819,312.00 2.10Banks
EL CORTE INGLES 3.625% 20-15/03/2024 623,844.00 1.60Distribution &Wholesale
ADEVINTA ASA 3% 20-15/11/2027 621,780.00 1.59Internet
SOFTBANK GRP COR 5% 18-15/04/2028 617,655.50 1.58Telecommunication
EIRCOM FINANCE 3.5% 19-15/05/2026 615,684.00 1.58Telecommunication
PRIMO WATER CORP 3.875% 20-31/10/2028 613,086.00 1.57Food services
ORGANON FIN 1 2.875% 21-30/04/2028 609,660.00 1.57Cosmetics
EUR
Sector
Top Ten Holdings
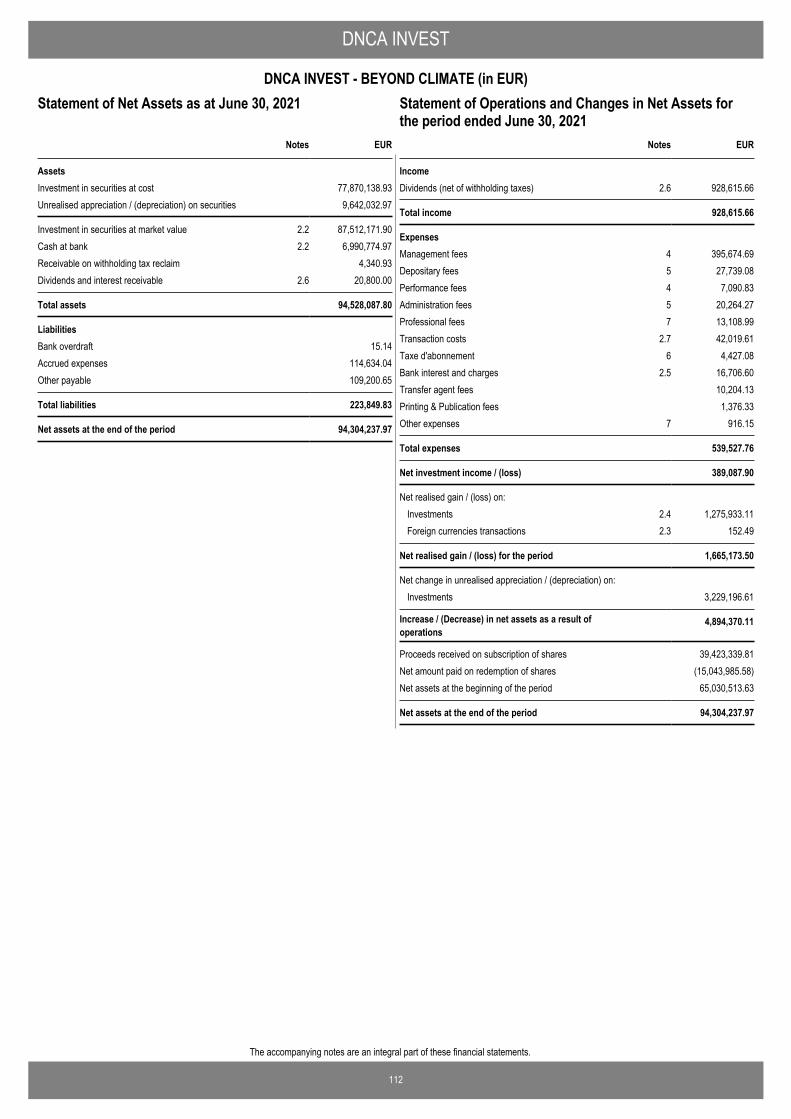
112
The accompanying notes are an integral part of these financial statements.
DNCA INVEST
DNCA INVEST - BEYOND CLIMATE (in EUR)Statement of Operations and Changes in Net Assets for theperiod ended June 30, 2021
EUR
AssetsInvestment in securities at cost 77,870,138.93Unrealised appreciation / (depreciation) on securities 9,642,032.97
Investment in securities at market value 2.2 87,512,171.90Cash at bank 2.2 6,990,774.97Receivable on withholding tax reclaim 4,340.93Dividends and interest receivable 2.6 20,800.00
Total assets 94,528,087.80
LiabilitiesBank overdraft 15.14Accrued expenses 114,634.04Other payable 109,200.65
Total liabilities 223,849.83
Net assets at the end of the period 94,304,237.97
Notes
Statement of Net Assets as at June 30, 2021
IncomeDividends (net of withholding taxes) 2.6 928,615.66
Total income 928,615.66
ExpensesManagement fees 4 395,674.69Depositary fees 5 27,739.08Performance fees 4 7,090.83Administration fees 5 20,264.27Professional fees 7 13,108.99Transaction costs 2.7 42,019.61Taxe d'abonnement 6 4,427.08Bank interest and charges 2.5 16,706.60Transfer agent fees 10,204.13Printing & Publication fees 1,376.33Other expenses 7 916.15
Total expenses 539,527.76
Net investment income / (loss) 389,087.90
Net realised gain / (loss) on: Investments 2.4 1,275,933.11Foreign currencies transactions 2.3 152.49
Net realised gain / (loss) for the period 1,665,173.50
Net change in unrealised appreciation / (depreciation) on: Investments 3,229,196.61
Increase / (Decrease) in net assets as a result ofoperations
4,894,370.11
Proceeds received on subscription of shares 39,423,339.81Net amount paid on redemption of shares (15,043,985.58)Net assets at the beginning of the period 65,030,513.63
Net assets at the end of the period 94,304,237.97
EURNotes
Statement of Operations and Changes in Net Assets forthe period ended June 30, 2021

113
The accompanying notes are an integral part of these financial statements.
DNCA INVEST
DNCA INVEST - BEYOND CLIMATE (in EUR)
Number of shares in issue atthe end of the period
Number of shares in issue atthe beginning of the period
Number of sharesissued
Number of sharesredeemed
Statement of Changes in Number of Shares
Class A shares EUR - 2,173.496 - 2,173.496
Class I shares EUR 500,414.369 83,844.832 (118,338.000) 465,921.201
Class ID shares EUR - 275,224.900 - 275,224.900
Class N shares EUR - 105.000 - 105.000
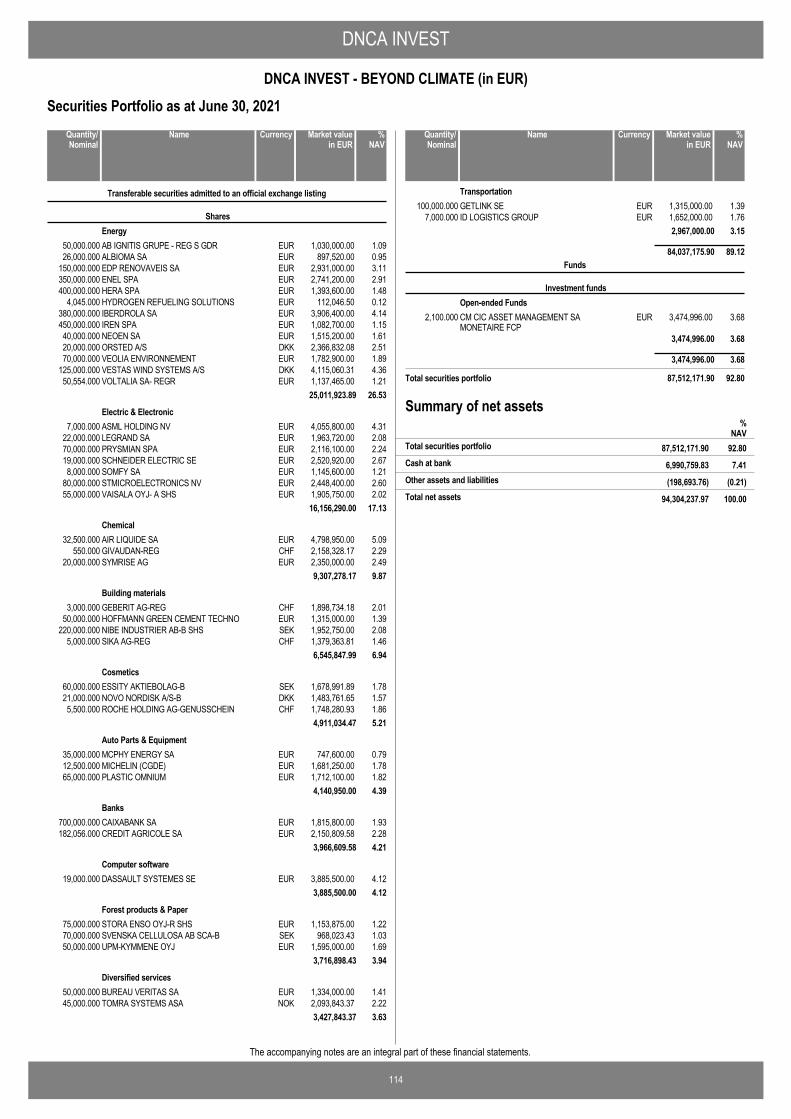
DNCA INVEST
114
DNCA INVEST - BEYOND CLIMATE (in EUR)
The accompanying notes are an integral part of these financial statements.
Securities Portfolio as at June 30, 2021
AB IGNITIS GRUPE - REG S GDR EUR 1,030,000.00 1.0950,000.000
Transferable securities admitted to an official exchange listing
SharesEnergy
ALBIOMA SA EUR 897,520.00 0.9526,000.000EDP RENOVAVEIS SA EUR 2,931,000.00 3.11150,000.000ENEL SPA EUR 2,741,200.00 2.91350,000.000HERA SPA EUR 1,393,600.00 1.48400,000.000HYDROGEN REFUELING SOLUTIONS EUR 112,046.50 0.124,045.000IBERDROLA SA EUR 3,906,400.00 4.14380,000.000IREN SPA EUR 1,082,700.00 1.15450,000.000NEOEN SA EUR 1,515,200.00 1.6140,000.000ORSTED A/S DKK 2,366,832.08 2.5120,000.000VEOLIA ENVIRONNEMENT EUR 1,782,900.00 1.8970,000.000VESTAS WIND SYSTEMS A/S DKK 4,115,060.31 4.36125,000.000VOLTALIA SA- REGR EUR 1,137,465.00 1.2150,554.000
25,011,923.89 26.53
ASML HOLDING NV EUR 4,055,800.00 4.317,000.000Electric & Electronic
LEGRAND SA EUR 1,963,720.00 2.0822,000.000PRYSMIAN SPA EUR 2,116,100.00 2.2470,000.000SCHNEIDER ELECTRIC SE EUR 2,520,920.00 2.6719,000.000SOMFY SA EUR 1,145,600.00 1.218,000.000STMICROELECTRONICS NV EUR 2,448,400.00 2.6080,000.000VAISALA OYJ- A SHS EUR 1,905,750.00 2.0255,000.000
16,156,290.00 17.13
AIR LIQUIDE SA EUR 4,798,950.00 5.0932,500.000Chemical
GIVAUDAN-REG CHF 2,158,328.17 2.29550.000SYMRISE AG EUR 2,350,000.00 2.4920,000.000
9,307,278.17 9.87
GEBERIT AG-REG CHF 1,898,734.18 2.013,000.000Building materials
HOFFMANN GREEN CEMENT TECHNO EUR 1,315,000.00 1.3950,000.000NIBE INDUSTRIER AB-B SHS SEK 1,952,750.00 2.08220,000.000SIKA AG-REG CHF 1,379,363.81 1.465,000.000
6,545,847.99 6.94
ESSITY AKTIEBOLAG-B SEK 1,678,991.89 1.7860,000.000Cosmetics
NOVO NORDISK A/S-B DKK 1,483,761.65 1.5721,000.000ROCHE HOLDING AG-GENUSSCHEIN CHF 1,748,280.93 1.865,500.000
4,911,034.47 5.21
MCPHY ENERGY SA EUR 747,600.00 0.7935,000.000Auto Parts & Equipment
MICHELIN (CGDE) EUR 1,681,250.00 1.7812,500.000PLASTIC OMNIUM EUR 1,712,100.00 1.8265,000.000
4,140,950.00 4.39
CAIXABANK SA EUR 1,815,800.00 1.93700,000.000Banks
CREDIT AGRICOLE SA EUR 2,150,809.58 2.28182,056.0003,966,609.58 4.21
DASSAULT SYSTEMES SE EUR 3,885,500.00 4.1219,000.000Computer software
3,885,500.00 4.12
STORA ENSO OYJ-R SHS EUR 1,153,875.00 1.2275,000.000Forest products & Paper
SVENSKA CELLULOSA AB SCA-B SEK 968,023.43 1.0370,000.000UPM-KYMMENE OYJ EUR 1,595,000.00 1.6950,000.000
3,716,898.43 3.94
BUREAU VERITAS SA EUR 1,334,000.00 1.4150,000.000Diversified services
TOMRA SYSTEMS ASA NOK 2,093,843.37 2.2245,000.0003,427,843.37 3.63
NameQuantity/Nominal
Market valuein EUR
Currency %NAV
GETLINK SE EUR 1,315,000.00 1.39100,000.000Transportation
ID LOGISTICS GROUP EUR 1,652,000.00 1.767,000.0002,967,000.00 3.15
84,037,175.90 89.12
CM CIC ASSET MANAGEMENT SAMONETAIRE FCP
EUR 3,474,996.00 3.682,100.000
Funds
Investment fundsOpen-ended Funds
3,474,996.00 3.68
3,474,996.00 3.68
Total securities portfolio 87,512,171.90 92.80
NameQuantity/Nominal
Market valuein EUR
Currency %NAV
Summary of net assets%
NAV87,512,171.90 92.80Total securities portfolio
6,990,759.83 7.41Cash at bank
(198,693.76) (0.21)Other assets and liabilities
94,304,237.97 100.00Total net assets
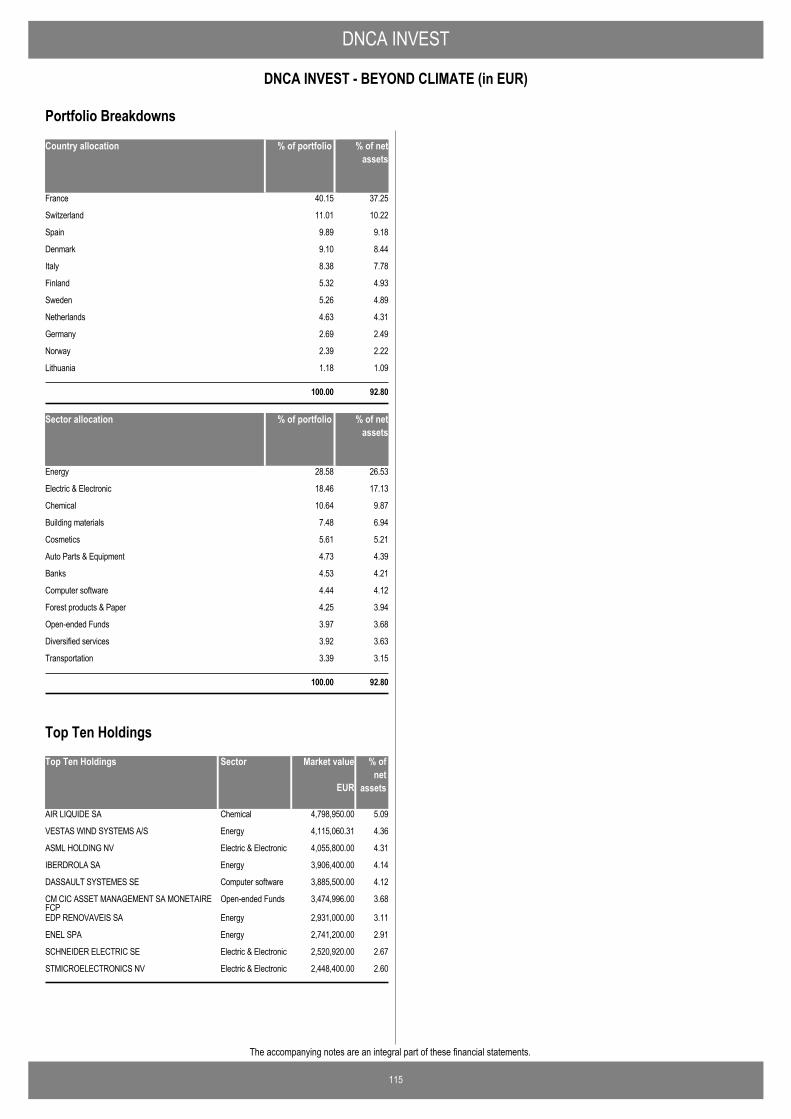
DNCA INVEST
115
DNCA INVEST - BEYOND CLIMATE (in EUR)
The accompanying notes are an integral part of these financial statements.
Country allocation % of portfolio % of netassets
France 40.15 37.25
Switzerland 11.01 10.22
Spain 9.89 9.18
Denmark 9.10 8.44
Italy 8.38 7.78
Finland 5.32 4.93
Sweden 5.26 4.89
Netherlands 4.63 4.31
Germany 2.69 2.49
Norway 2.39 2.22
Lithuania 1.18 1.09
100.00 92.80
Sector allocation % of portfolio % of netassets
Energy 28.58 26.53
Electric & Electronic 18.46 17.13
Chemical 10.64 9.87
Building materials 7.48 6.94
Cosmetics 5.61 5.21
Auto Parts & Equipment 4.73 4.39
Banks 4.53 4.21
Computer software 4.44 4.12
Forest products & Paper 4.25 3.94
Open-ended Funds 3.97 3.68
Diversified services 3.92 3.63
Transportation 3.39 3.15
100.00 92.80
Portfolio Breakdowns
Top Ten Holdings Market value % ofnet
assets
AIR LIQUIDE SA 4,798,950.00 5.09Chemical
VESTAS WIND SYSTEMS A/S 4,115,060.31 4.36Energy
ASML HOLDING NV 4,055,800.00 4.31Electric & Electronic
IBERDROLA SA 3,906,400.00 4.14Energy
DASSAULT SYSTEMES SE 3,885,500.00 4.12Computer software
CM CIC ASSET MANAGEMENT SA MONETAIREFCP
3,474,996.00 3.68Open-ended Funds
EDP RENOVAVEIS SA 2,931,000.00 3.11Energy
ENEL SPA 2,741,200.00 2.91Energy
SCHNEIDER ELECTRIC SE 2,520,920.00 2.67Electric & Electronic
STMICROELECTRONICS NV 2,448,400.00 2.60Electric & Electronic
EUR
Sector
Top Ten Holdings

116
The accompanying notes are an integral part of these financial statements.
DNCA INVEST
DNCA INVEST - GLOBAL NEW WORLD* (in EUR)Statement of Operations and Changes in Net Assets for theperiod ended June 30, 2021
EUR
AssetsInvestment in securities at cost 206,678,605.77Unrealised appreciation / (depreciation) on securities 57,503,663.91
Investment in securities at market value 2.2 264,182,269.68Cash at bank 2.2 7,643,079.00Receivable on subscriptions 52,462.85Dividends and interest receivable 2.6 26,617.00
Total assets 271,904,428.53
LiabilitiesAccrued expenses 1,400,396.85Payable for investment purchased 368,128.18Payable on redemptions 43,766.78Other payable 567.83
Total liabilities 1,812,859.64
Net assets at the end of the period 270,091,568.89
Notes
Statement of Net Assets as at June 30, 2021
* Please see Note 1.
IncomeDividends (net of withholding taxes) 2.6 116,677.10
Total income 116,677.10
ExpensesManagement fees 4 300,011.11Depositary fees 5 2,166.02Performance fees 4 1,072,820.22Administration fees 5 3,974.17Professional fees 7 1,302.94Transaction costs 2.7 40,595.25Taxe d'abonnement 6 20,797.89Bank interest and charges 2.5 2,354.88Transfer agent fees 2,778.65Other expenses 7 58.23
Total expenses 1,446,859.36
Net investment income / (loss) (1,330,182.26)
Net realised gain / (loss) on: Investments 2.4 (34,284,684.29)Foreign currencies transactions 2.3 (17,423.99)
Net realised gain / (loss) for the period (35,632,290.54)
Net change in unrealised appreciation / (depreciation) on: Investments 57,503,663.91
Increase / (Decrease) in net assets as a result ofoperations
21,871,373.37
Proceeds received on subscription of shares 251,023,161.84Net amount paid on redemption of shares (2,802,966.32)Net assets at the beginning of the period -
Net assets at the end of the period 270,091,568.89
EURNotes
Statement of Operations and Changes in Net Assets forthe period ended June 30, 2021
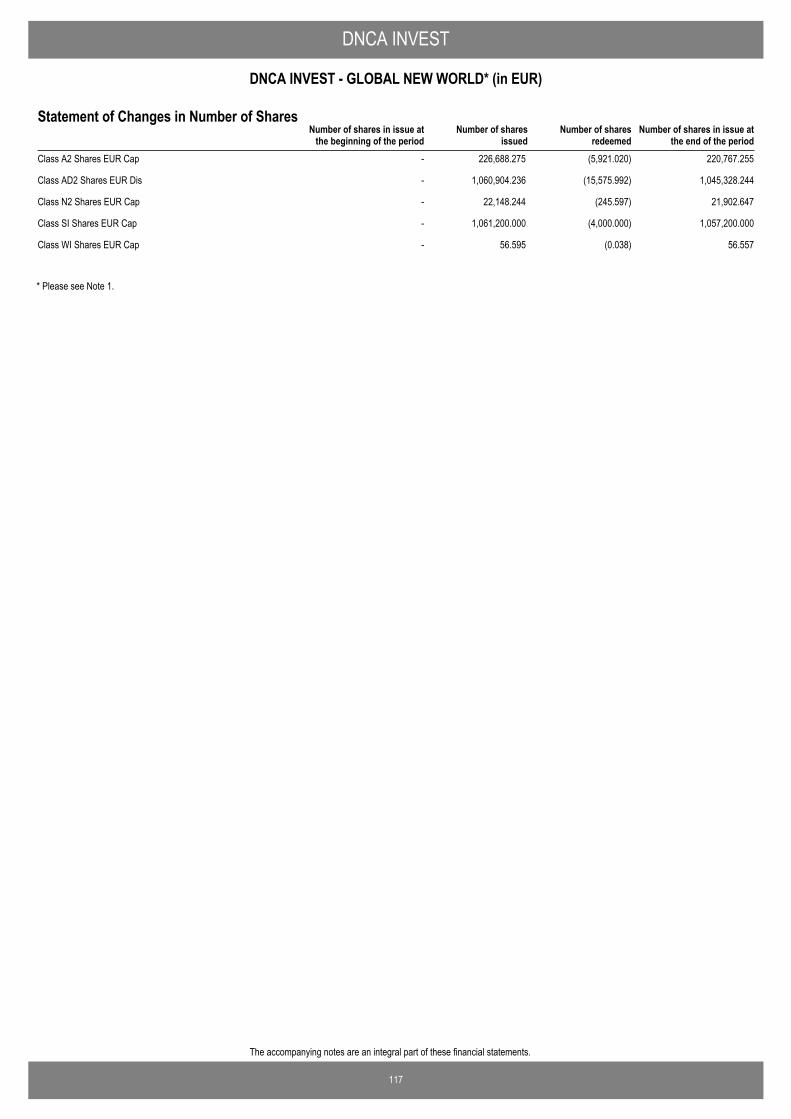
117
The accompanying notes are an integral part of these financial statements.
DNCA INVEST
DNCA INVEST - GLOBAL NEW WORLD* (in EUR)
Number of shares in issue atthe end of the period
Number of shares in issue atthe beginning of the period
Number of sharesissued
Number of sharesredeemed
Statement of Changes in Number of Shares
Class A2 Shares EUR Cap - 226,688.275 (5,921.020) 220,767.255
Class AD2 Shares EUR Dis - 1,060,904.236 (15,575.992) 1,045,328.244
Class N2 Shares EUR Cap - 22,148.244 (245.597) 21,902.647
Class SI Shares EUR Cap - 1,061,200.000 (4,000.000) 1,057,200.000
Class WI Shares EUR Cap - 56.595 (0.038) 56.557
* Please see Note 1.
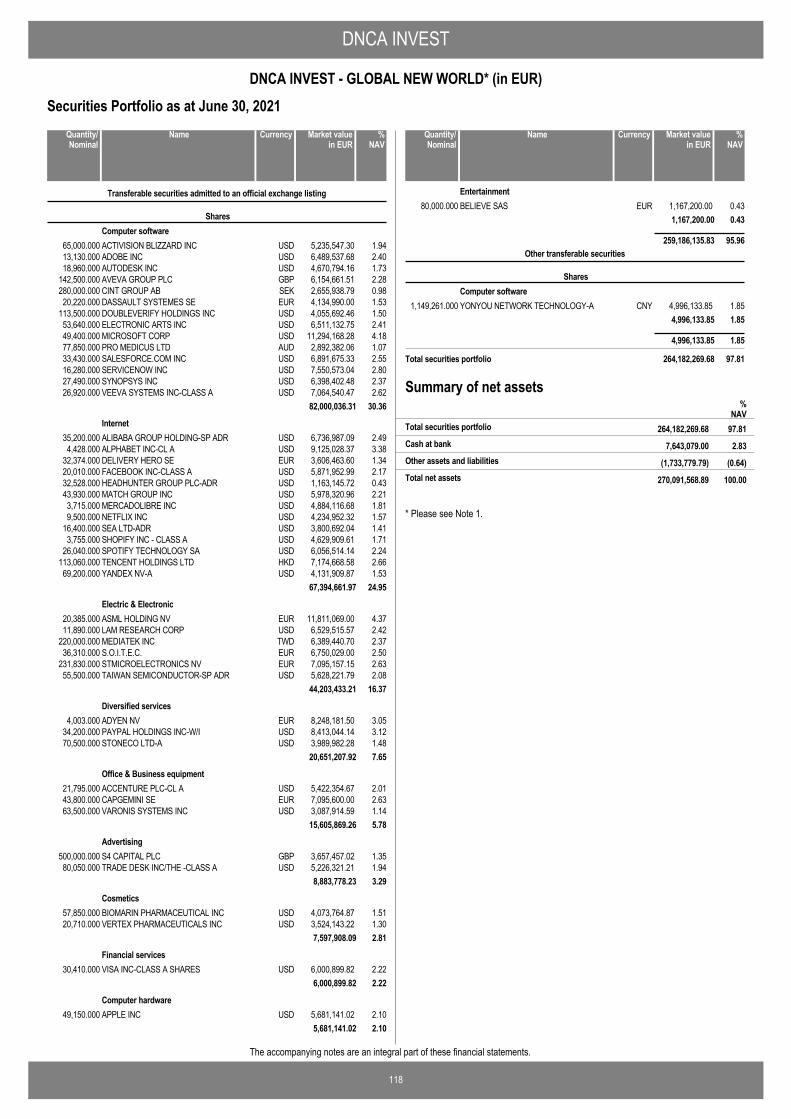
DNCA INVEST
118
DNCA INVEST - GLOBAL NEW WORLD* (in EUR)
The accompanying notes are an integral part of these financial statements.
Securities Portfolio as at June 30, 2021
ACTIVISION BLIZZARD INC USD 5,235,547.30 1.9465,000.000
Transferable securities admitted to an official exchange listing
SharesComputer software
ADOBE INC USD 6,489,537.68 2.4013,130.000AUTODESK INC USD 4,670,794.16 1.7318,960.000AVEVA GROUP PLC GBP 6,154,661.51 2.28142,500.000CINT GROUP AB SEK 2,655,938.79 0.98280,000.000DASSAULT SYSTEMES SE EUR 4,134,990.00 1.5320,220.000DOUBLEVERIFY HOLDINGS INC USD 4,055,692.46 1.50113,500.000ELECTRONIC ARTS INC USD 6,511,132.75 2.4153,640.000MICROSOFT CORP USD 11,294,168.28 4.1849,400.000PRO MEDICUS LTD AUD 2,892,382.06 1.0777,850.000SALESFORCE.COM INC USD 6,891,675.33 2.5533,430.000SERVICENOW INC USD 7,550,573.04 2.8016,280.000SYNOPSYS INC USD 6,398,402.48 2.3727,490.000VEEVA SYSTEMS INC-CLASS A USD 7,064,540.47 2.6226,920.000
82,000,036.31 30.36
ALIBABA GROUP HOLDING-SP ADR USD 6,736,987.09 2.4935,200.000Internet
ALPHABET INC-CL A USD 9,125,028.37 3.384,428.000DELIVERY HERO SE EUR 3,606,463.60 1.3432,374.000FACEBOOK INC-CLASS A USD 5,871,952.99 2.1720,010.000HEADHUNTER GROUP PLC-ADR USD 1,163,145.72 0.4332,528.000MATCH GROUP INC USD 5,978,320.96 2.2143,930.000MERCADOLIBRE INC USD 4,884,116.68 1.813,715.000NETFLIX INC USD 4,234,952.32 1.579,500.000SEA LTD-ADR USD 3,800,692.04 1.4116,400.000SHOPIFY INC - CLASS A USD 4,629,909.61 1.713,755.000SPOTIFY TECHNOLOGY SA USD 6,056,514.14 2.2426,040.000TENCENT HOLDINGS LTD HKD 7,174,668.58 2.66113,060.000YANDEX NV-A USD 4,131,909.87 1.5369,200.000
67,394,661.97 24.95
ASML HOLDING NV EUR 11,811,069.00 4.3720,385.000Electric & Electronic
LAM RESEARCH CORP USD 6,529,515.57 2.4211,890.000MEDIATEK INC TWD 6,389,440.70 2.37220,000.000S.O.I.T.E.C. EUR 6,750,029.00 2.5036,310.000STMICROELECTRONICS NV EUR 7,095,157.15 2.63231,830.000TAIWAN SEMICONDUCTOR-SP ADR USD 5,628,221.79 2.0855,500.000
44,203,433.21 16.37
ADYEN NV EUR 8,248,181.50 3.054,003.000Diversified services
PAYPAL HOLDINGS INC-W/I USD 8,413,044.14 3.1234,200.000STONECO LTD-A USD 3,989,982.28 1.4870,500.000
20,651,207.92 7.65
ACCENTURE PLC-CL A USD 5,422,354.67 2.0121,795.000Office & Business equipment
CAPGEMINI SE EUR 7,095,600.00 2.6343,800.000VARONIS SYSTEMS INC USD 3,087,914.59 1.1463,500.000
15,605,869.26 5.78
S4 CAPITAL PLC GBP 3,657,457.02 1.35500,000.000Advertising
TRADE DESK INC/THE -CLASS A USD 5,226,321.21 1.9480,050.0008,883,778.23 3.29
BIOMARIN PHARMACEUTICAL INC USD 4,073,764.87 1.5157,850.000Cosmetics
VERTEX PHARMACEUTICALS INC USD 3,524,143.22 1.3020,710.0007,597,908.09 2.81
VISA INC-CLASS A SHARES USD 6,000,899.82 2.2230,410.000Financial services
6,000,899.82 2.22
APPLE INC USD 5,681,141.02 2.1049,150.000Computer hardware
5,681,141.02 2.10
NameQuantity/Nominal
Market valuein EUR
Currency %NAV
BELIEVE SAS EUR 1,167,200.00 0.4380,000.000Entertainment
1,167,200.00 0.43
259,186,135.83 95.96
YONYOU NETWORK TECHNOLOGY-A CNY 4,996,133.85 1.851,149,261.000
Other transferable securities
SharesComputer software
4,996,133.85 1.85
4,996,133.85 1.85
Total securities portfolio 264,182,269.68 97.81
NameQuantity/Nominal
Market valuein EUR
Currency %NAV
Summary of net assets%
NAV264,182,269.68 97.81Total securities portfolio
7,643,079.00 2.83Cash at bank
(1,733,779.79) (0.64)Other assets and liabilities
270,091,568.89 100.00Total net assets
* Please see Note 1.
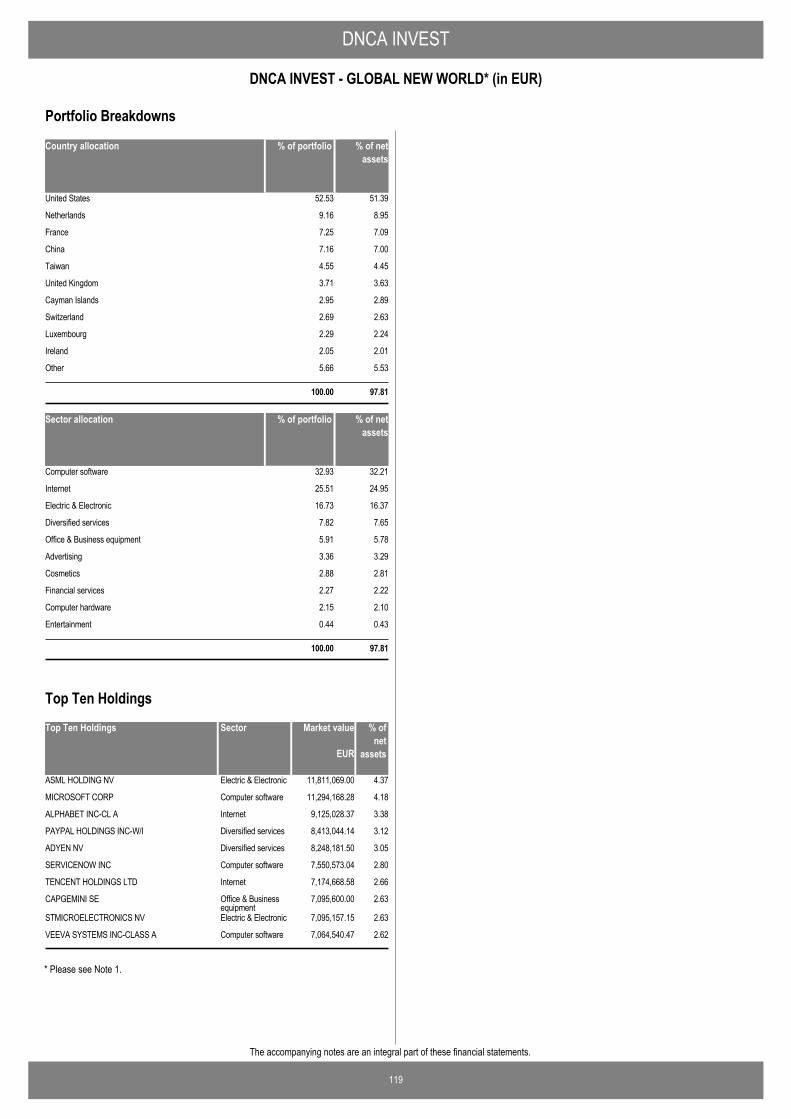
DNCA INVEST
119
DNCA INVEST - GLOBAL NEW WORLD* (in EUR)
The accompanying notes are an integral part of these financial statements.
Country allocation % of portfolio % of netassets
United States 52.53 51.39
Netherlands 9.16 8.95
France 7.25 7.09
China 7.16 7.00
Taiwan 4.55 4.45
United Kingdom 3.71 3.63
Cayman Islands 2.95 2.89
Switzerland 2.69 2.63
Luxembourg 2.29 2.24
Ireland 2.05 2.01
Other 5.66 5.53
100.00 97.81
Sector allocation % of portfolio % of netassets
Computer software 32.93 32.21
Internet 25.51 24.95
Electric & Electronic 16.73 16.37
Diversified services 7.82 7.65
Office & Business equipment 5.91 5.78
Advertising 3.36 3.29
Cosmetics 2.88 2.81
Financial services 2.27 2.22
Computer hardware 2.15 2.10
Entertainment 0.44 0.43
100.00 97.81
Portfolio Breakdowns
Top Ten Holdings Market value % ofnet
assets
ASML HOLDING NV 11,811,069.00 4.37Electric & Electronic
MICROSOFT CORP 11,294,168.28 4.18Computer software
ALPHABET INC-CL A 9,125,028.37 3.38Internet
PAYPAL HOLDINGS INC-W/I 8,413,044.14 3.12Diversified services
ADYEN NV 8,248,181.50 3.05Diversified services
SERVICENOW INC 7,550,573.04 2.80Computer software
TENCENT HOLDINGS LTD 7,174,668.58 2.66Internet
CAPGEMINI SE 7,095,600.00 2.63Office & Businessequipment
STMICROELECTRONICS NV 7,095,157.15 2.63Electric & Electronic
VEEVA SYSTEMS INC-CLASS A 7,064,540.47 2.62Computer software
EUR
Sector
Top Ten Holdings
* Please see Note 1.
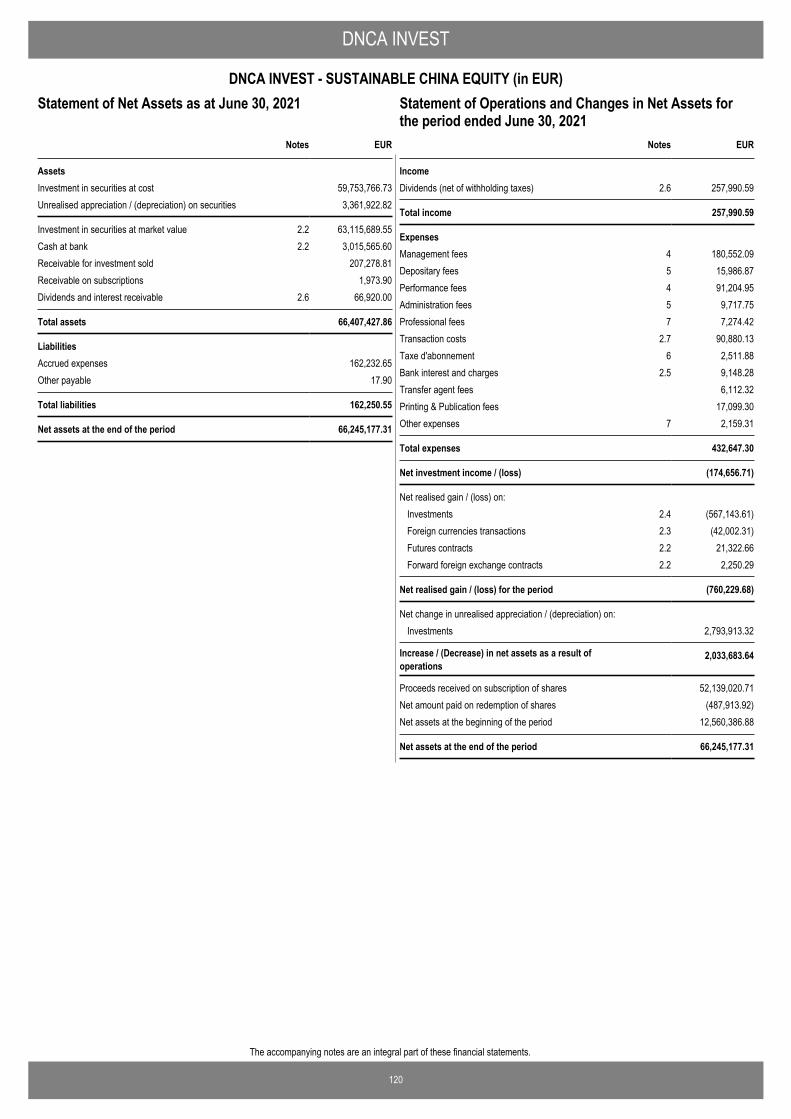
120
The accompanying notes are an integral part of these financial statements.
DNCA INVEST
DNCA INVEST - SUSTAINABLE CHINA EQUITY (in EUR)Statement of Operations and Changes in Net Assets for theperiod ended June 30, 2021
EUR
AssetsInvestment in securities at cost 59,753,766.73Unrealised appreciation / (depreciation) on securities 3,361,922.82
Investment in securities at market value 2.2 63,115,689.55Cash at bank 2.2 3,015,565.60Receivable for investment sold 207,278.81Receivable on subscriptions 1,973.90Dividends and interest receivable 2.6 66,920.00
Total assets 66,407,427.86
LiabilitiesAccrued expenses 162,232.65Other payable 17.90
Total liabilities 162,250.55
Net assets at the end of the period 66,245,177.31
Notes
Statement of Net Assets as at June 30, 2021
IncomeDividends (net of withholding taxes) 2.6 257,990.59
Total income 257,990.59
ExpensesManagement fees 4 180,552.09Depositary fees 5 15,986.87Performance fees 4 91,204.95Administration fees 5 9,717.75Professional fees 7 7,274.42Transaction costs 2.7 90,880.13Taxe d'abonnement 6 2,511.88Bank interest and charges 2.5 9,148.28Transfer agent fees 6,112.32Printing & Publication fees 17,099.30Other expenses 7 2,159.31
Total expenses 432,647.30
Net investment income / (loss) (174,656.71)
Net realised gain / (loss) on: Investments 2.4 (567,143.61)Foreign currencies transactions 2.3 (42,002.31)Futures contracts 2.2 21,322.66Forward foreign exchange contracts 2.2 2,250.29
Net realised gain / (loss) for the period (760,229.68)
Net change in unrealised appreciation / (depreciation) on: Investments 2,793,913.32
Increase / (Decrease) in net assets as a result ofoperations
2,033,683.64
Proceeds received on subscription of shares 52,139,020.71Net amount paid on redemption of shares (487,913.92)Net assets at the beginning of the period 12,560,386.88
Net assets at the end of the period 66,245,177.31
EURNotes
Statement of Operations and Changes in Net Assets forthe period ended June 30, 2021
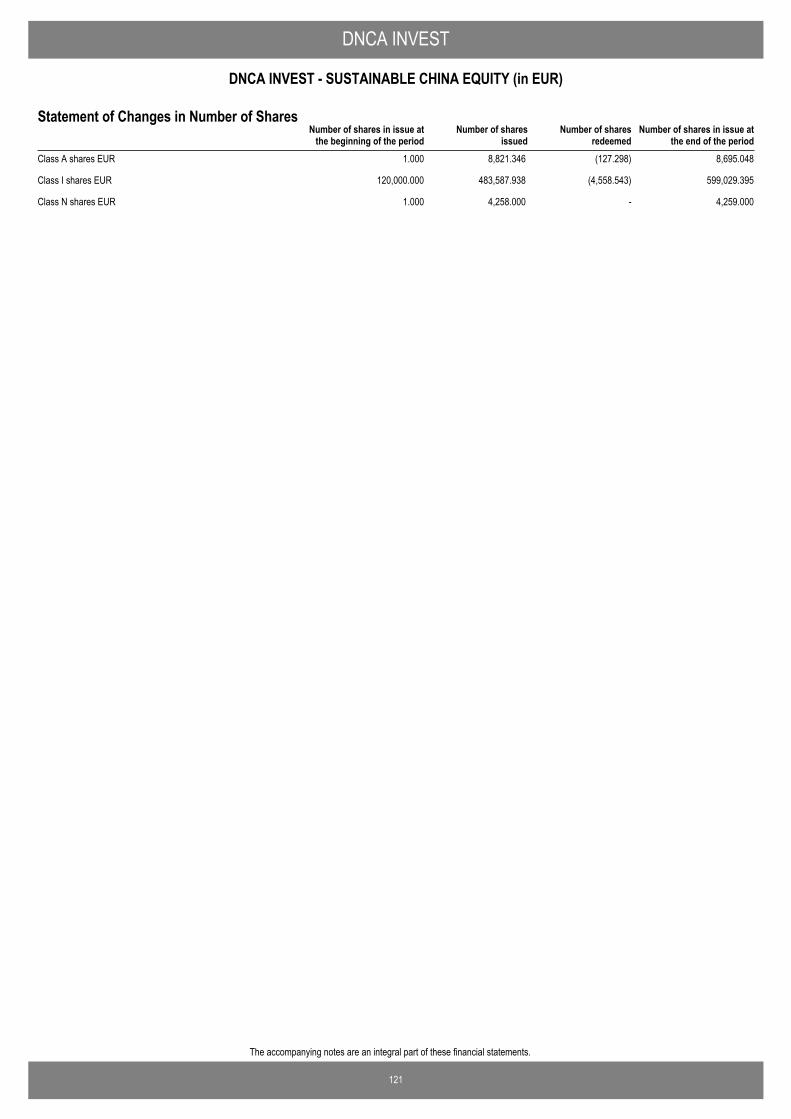
121
The accompanying notes are an integral part of these financial statements.
DNCA INVEST
DNCA INVEST - SUSTAINABLE CHINA EQUITY (in EUR)
Number of shares in issue atthe end of the period
Number of shares in issue atthe beginning of the period
Number of sharesissued
Number of sharesredeemed
Statement of Changes in Number of Shares
Class A shares EUR 1.000 8,821.346 (127.298) 8,695.048
Class I shares EUR 120,000.000 483,587.938 (4,558.543) 599,029.395
Class N shares EUR 1.000 4,258.000 - 4,259.000
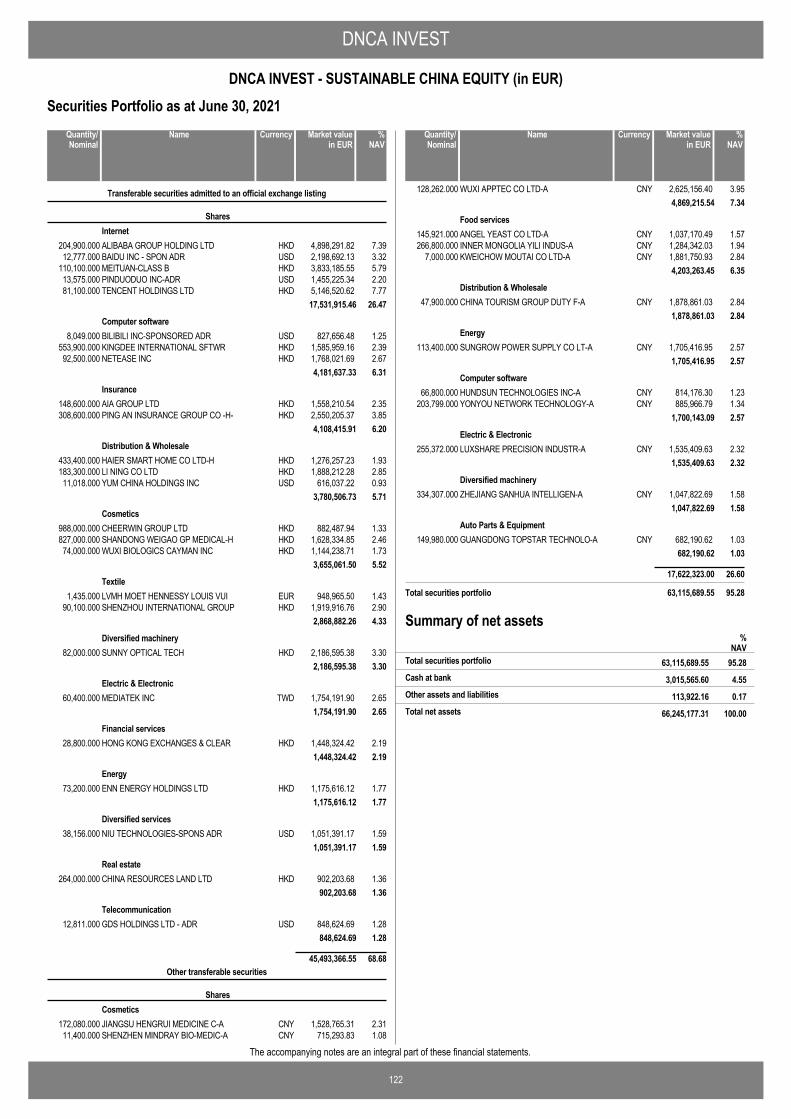
DNCA INVEST
122
DNCA INVEST - SUSTAINABLE CHINA EQUITY (in EUR)
The accompanying notes are an integral part of these financial statements.
Securities Portfolio as at June 30, 2021
ALIBABA GROUP HOLDING LTD HKD 4,898,291.82 7.39204,900.000
Transferable securities admitted to an official exchange listing
SharesInternet
BAIDU INC - SPON ADR USD 2,198,692.13 3.3212,777.000MEITUAN-CLASS B HKD 3,833,185.55 5.79110,100.000PINDUODUO INC-ADR USD 1,455,225.34 2.2013,575.000TENCENT HOLDINGS LTD HKD 5,146,520.62 7.7781,100.000
17,531,915.46 26.47
BILIBILI INC-SPONSORED ADR USD 827,656.48 1.258,049.000Computer software
KINGDEE INTERNATIONAL SFTWR HKD 1,585,959.16 2.39553,900.000NETEASE INC HKD 1,768,021.69 2.6792,500.000
4,181,637.33 6.31
AIA GROUP LTD HKD 1,558,210.54 2.35148,600.000Insurance
PING AN INSURANCE GROUP CO -H- HKD 2,550,205.37 3.85308,600.0004,108,415.91 6.20
HAIER SMART HOME CO LTD-H HKD 1,276,257.23 1.93433,400.000Distribution & Wholesale
LI NING CO LTD HKD 1,888,212.28 2.85183,300.000YUM CHINA HOLDINGS INC USD 616,037.22 0.9311,018.000
3,780,506.73 5.71
CHEERWIN GROUP LTD HKD 882,487.94 1.33988,000.000Cosmetics
SHANDONG WEIGAO GP MEDICAL-H HKD 1,628,334.85 2.46827,000.000WUXI BIOLOGICS CAYMAN INC HKD 1,144,238.71 1.7374,000.000
3,655,061.50 5.52
LVMH MOET HENNESSY LOUIS VUI EUR 948,965.50 1.431,435.000Textile
SHENZHOU INTERNATIONAL GROUP HKD 1,919,916.76 2.9090,100.0002,868,882.26 4.33
SUNNY OPTICAL TECH HKD 2,186,595.38 3.3082,000.000Diversified machinery
2,186,595.38 3.30
MEDIATEK INC TWD 1,754,191.90 2.6560,400.000Electric & Electronic
1,754,191.90 2.65
HONG KONG EXCHANGES & CLEAR HKD 1,448,324.42 2.1928,800.000Financial services
1,448,324.42 2.19
ENN ENERGY HOLDINGS LTD HKD 1,175,616.12 1.7773,200.000Energy
1,175,616.12 1.77
NIU TECHNOLOGIES-SPONS ADR USD 1,051,391.17 1.5938,156.000Diversified services
1,051,391.17 1.59
CHINA RESOURCES LAND LTD HKD 902,203.68 1.36264,000.000Real estate
902,203.68 1.36
GDS HOLDINGS LTD - ADR USD 848,624.69 1.2812,811.000Telecommunication
848,624.69 1.28
45,493,366.55 68.68
JIANGSU HENGRUI MEDICINE C-A CNY 1,528,765.31 2.31172,080.000
Other transferable securities
SharesCosmetics
SHENZHEN MINDRAY BIO-MEDIC-A CNY 715,293.83 1.0811,400.000
NameQuantity/Nominal
Market valuein EUR
Currency %NAV
WUXI APPTEC CO LTD-A CNY 2,625,156.40 3.95128,262.0004,869,215.54 7.34
ANGEL YEAST CO LTD-A CNY 1,037,170.49 1.57145,921.000Food services
INNER MONGOLIA YILI INDUS-A CNY 1,284,342.03 1.94266,800.000KWEICHOW MOUTAI CO LTD-A CNY 1,881,750.93 2.847,000.000
4,203,263.45 6.35
CHINA TOURISM GROUP DUTY F-A CNY 1,878,861.03 2.8447,900.000Distribution & Wholesale
1,878,861.03 2.84
SUNGROW POWER SUPPLY CO LT-A CNY 1,705,416.95 2.57113,400.000Energy
1,705,416.95 2.57
HUNDSUN TECHNOLOGIES INC-A CNY 814,176.30 1.2366,800.000Computer software
YONYOU NETWORK TECHNOLOGY-A CNY 885,966.79 1.34203,799.0001,700,143.09 2.57
LUXSHARE PRECISION INDUSTR-A CNY 1,535,409.63 2.32255,372.000Electric & Electronic
1,535,409.63 2.32
ZHEJIANG SANHUA INTELLIGEN-A CNY 1,047,822.69 1.58334,307.000Diversified machinery
1,047,822.69 1.58
GUANGDONG TOPSTAR TECHNOLO-A CNY 682,190.62 1.03149,980.000Auto Parts & Equipment
682,190.62 1.03
17,622,323.00 26.60
Total securities portfolio 63,115,689.55 95.28
NameQuantity/Nominal
Market valuein EUR
Currency %NAV
Summary of net assets%
NAV63,115,689.55 95.28Total securities portfolio
3,015,565.60 4.55Cash at bank
113,922.16 0.17Other assets and liabilities
66,245,177.31 100.00Total net assets
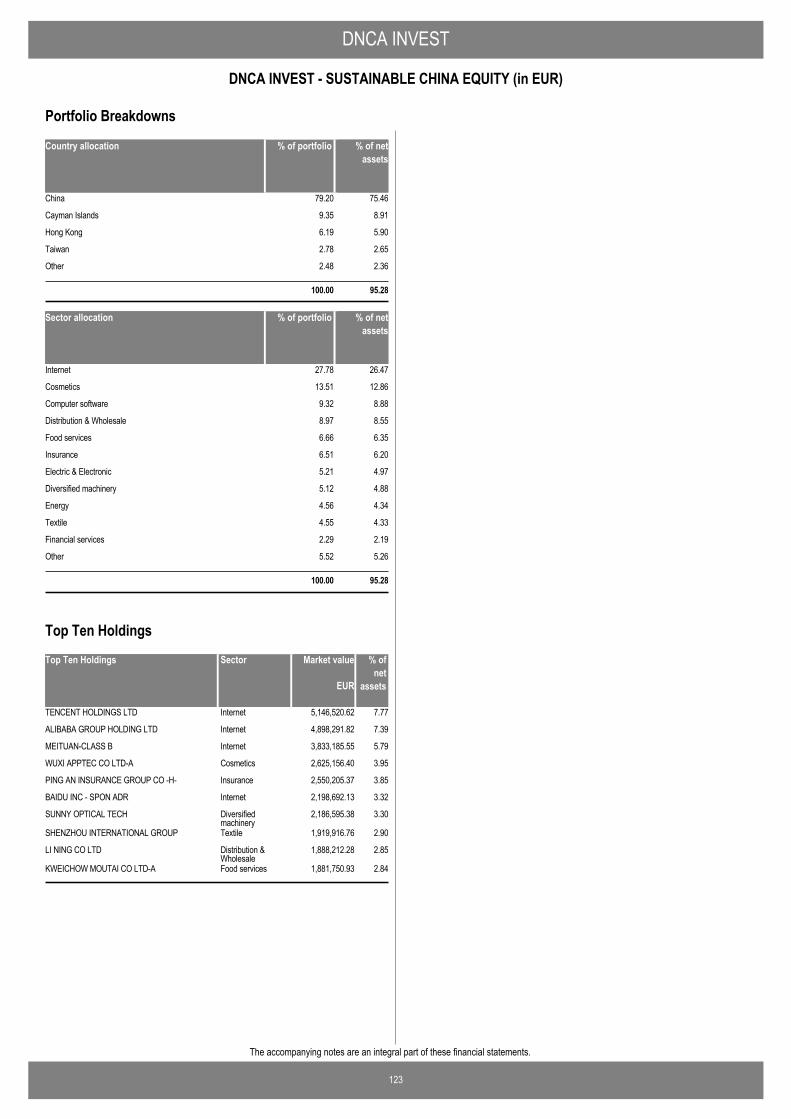
DNCA INVEST
123
DNCA INVEST - SUSTAINABLE CHINA EQUITY (in EUR)
The accompanying notes are an integral part of these financial statements.
Country allocation % of portfolio % of netassets
China 79.20 75.46
Cayman Islands 9.35 8.91
Hong Kong 6.19 5.90
Taiwan 2.78 2.65
Other 2.48 2.36
100.00 95.28
Sector allocation % of portfolio % of netassets
Internet 27.78 26.47
Cosmetics 13.51 12.86
Computer software 9.32 8.88
Distribution & Wholesale 8.97 8.55
Food services 6.66 6.35
Insurance 6.51 6.20
Electric & Electronic 5.21 4.97
Diversified machinery 5.12 4.88
Energy 4.56 4.34
Textile 4.55 4.33
Financial services 2.29 2.19
Other 5.52 5.26
100.00 95.28
Portfolio Breakdowns
Top Ten Holdings Market value % ofnet
assets
TENCENT HOLDINGS LTD 5,146,520.62 7.77Internet
ALIBABA GROUP HOLDING LTD 4,898,291.82 7.39Internet
MEITUAN-CLASS B 3,833,185.55 5.79Internet
WUXI APPTEC CO LTD-A 2,625,156.40 3.95Cosmetics
PING AN INSURANCE GROUP CO -H- 2,550,205.37 3.85Insurance
BAIDU INC - SPON ADR 2,198,692.13 3.32Internet
SUNNY OPTICAL TECH 2,186,595.38 3.30Diversifiedmachinery
SHENZHOU INTERNATIONAL GROUP 1,919,916.76 2.90Textile
LI NING CO LTD 1,888,212.28 2.85Distribution &Wholesale
KWEICHOW MOUTAI CO LTD-A 1,881,750.93 2.84Food services
EUR
Sector
Top Ten Holdings
DNCA INVEST Notes to the Financial Statements as at June 30, 2021
124
Note 1. General information DNCA INVEST (the "Fund") is registered under part I of the Luxembourg Law of December 17, 2010 on undertakings for collective investment in transferable securities (UCITS) as amended (the “2010 Law”). The Fund was incorporated on February 12, 2007 under the Law of July 19, 1991 relating to undertakings for collective investment. From February 13, 2007 to August 31, 2007, the Fund was organised under the Law of February 13, 2007 relating to specialised investment funds as amended. The extraordinary general meeting of the Shareholders held on August 31, 2007 has decided to amend the articles of incorporation in order to submit the Fund to the Luxembourg Law of December 20, 2002. Since July 1, 2011, the fund is subject to the 2010 Law on undertakings for collective investment, as amended and to change the name of the Fund from LEONARDO INVEST FUND into LEONARDO INVEST. The Board of Directors of the Fund decided to change the name of the Fund from LEONARDO INVEST to DNCA INVEST through a Circular Resolution dated January 20, 2011. The “Statuts Coordonnés” were amended on January 20, 2011. The Articles of Incorporation have been amended for the last time on June 5, 2019 and were published in the Recueil Electronique des Sociétés et Associations (RESA), on July 8, 2019. DNCA INVEST is an open-ended collective investment company (“Société d’investissement à capital variable”) established under the laws of Grand Duchy of Luxembourg for an unlimited period, with an “umbrella” structure comprising different Sub-Funds and Classes. The Board of Directors of the Fund held on August 31, 2007, has designated Leonardo Asset Management to act as the Fund’s previous Management Company under Chapter 13 of the amended Law of December 20, 2002 as of August 31, 2007 for an unlimited period (subsequently, the amended Law of December 17, 2010, and the previous Management Company is now governed by Chapter 15). Further to the Board Meeting held on January 20, 2011, the name of the previous Management Company has changed from Leonardo Asset Management to DNCA Finance Luxembourg. Effective date July 12, 2016 the previous Management Company DNCA Finance Luxembourg has been transferred from “25, rue Philippe II, L-2340 Luxembourg” to “1, place d’Armes, L-1136 Luxembourg”. The Board of Directors of the Fund held on June 26, 2020 appointed for an unlimited period, DNCA Finance to act as the Fund's Management Company under Chapter 15 Law of December 17, 2010 effectively replacing the previous management company of the Fund, DNCA Finance Luxembourg. As at June 30, 2021, the Fund has the following Sub-Funds in operation: - DNCA INVEST - BEYOND EUROPEAN BOND OPPORTUNITIES - DNCA INVEST - EUROSE - DNCA INVEST - EVOLUTIF - DNCA INVEST - SOUTH EUROPE OPPORTUNITIES - DNCA INVEST - VALUE EUROPE - DNCA INVEST - BEYOND INFRASTRUCTURE & TRANSITION - DNCA INVEST - BEYOND GLOBAL LEADERS - DNCA INVEST - CONVERTIBLES - DNCA INVEST - MIURI - DNCA INVEST - SRI EUROPE GROWTH (formerly DNCA INVEST - EUROPE GROWTH until February 8, 2021) - DNCA INVEST - ARCHER MID-CAP EUROPE - DNCA INVEST - SRI NORDEN EUROPE (formerly DNCA INVEST - NORDEN EUROPE until February 8, 2021) - DNCA INVEST - SERENITE PLUS - DNCA INVEST - VENASQUO - DNCA INVEST - GLOBAL CONVERTIBLES (the Sub-Fund was merged into Natixis AM Funds - DNCA Global Convertible Bonds on June 17, 2021) - DNCA INVEST - ALPHA BONDS - DNCA INVEST - FLEX INFLATION - DNCA INVEST - BEYOND ALTEROSA - DNCA INVEST - BEYOND SEMPEROSA - DNCA INVEST - LAFITENIA SUSTAIN BB (formerly DNCA INVEST - GLOBAL ALPHA until January 25, 2021) - DNCA INVEST - BEYOND CLIMATE - DNCA INVEST - GLOBAL NEW WORLD (launched on May 27, 2021, following the merger with the French fund DNCA Global New World) - DNCA INVEST - SUSTAINABLE CHINA EQUITY As at June 30, 2021, the following Share classes are open to investors: Classes A and B Shares are available to all investors. Classes I, SI, WI and F Shares are only available to institutional investors. Classes A, AG, A2, B, BG, I, IG, SI, WI, F, N, NG, N2 and Q Shares may be hedged. In such circumstances, the Shares will be referred by adding one “H” to the name of the class of Shares. Class A, AG, A2, B, BG, I, IG, SI, WI, F, N, NG, N2 and Q Shares may be available in a currency (the “Class Currency”) other than the reference currency of the Sub-Fund (the “Reference Currency”). Such Class Currencies may be CHF, EUR or USD.
Classes N may only be acquired by investors (i) investing through a distributor or platform or other intermediary ("Intermediary") that has been approved by the Management Company or an Intermediary approved by the Management Company (an "Approved Intermediary") and (ii) that have entered into a separate legal agreement with the Management Company or an Approved Intermediary, that are required to comply with the restrictions on the payment of commissions set-out under MiFID, or, where applicable, the more restrictive regulatory requirements imposed by local regulators in certain EU and/or non EU jurisdictions.
DNCA INVEST Notes to the Financial Statements as at June 30, 2021 (continued)
125
Note 1. General information (continued) With respect to Intermediaries incorporated in the European Union and who have signed a separate legal agreement, this share class may typically be appropriate for discretionary portfolio management services or advisory services provided on an independent basis as defined under MiFID, or subject to more restrictive regulatory requirements imposed by local regulators in certain EU and/or non EU jurisdictions. Class Q Shares are only available to employees, managers or managing agents of the Management Company or its subsidiaries and branches as well as, subject to the approval of the Board of Directors of the Fund, to their relatives. Class A2 and N2 Shares shall be reserved for investment by BPCE as approved by the Management Company. Under the Articles of Incorporation, the Board of Directors of the Fund may decide to issue, in respect of each Class, dividend Shares and/or capitalisation Shares. The distribution Shares are referenced by adding a “D” to the name of the class of Shares. Interim dividends may be distributed to the Shareholders of Classes, AD, ID and ND Shares twice a year upon decision of the Board of Directors of the Fund. Class AG, BG, IG and NG Shares are only available to specific distributors selected by the Management Company. Classes A, A2, AD, AD2, B, BG, F, H-A, H-I, I, ID, IG, N, N2, ND, Q, SI and WI Shares are in circulation. Note 2. Significant accounting policies The financial statements of the Fund are presented in accordance with Luxembourg regulations relating to undertakings for collective investment in transferable securities. They are prepared in accordance with generally accepted accounting policies in Luxembourg. 2.1 Combined financial statements The combined financial statements of DNCA INVEST are expressed in euro and are equal to the sum of the corresponding in the financial statements of each Sub-Fund converted into euro at the exchange rate prevailing at the end of the financial period. 2.2 Valuation rules The value of the following assets is determined as follows: a) The value of any cash in hand or on deposit, bills and demand notes and accounts receivable, prepaid expenses, cash dividends and interest declared or accrued as aforesaid and not yet received is deemed to be the full amount thereof, unless in any case the same is unlikely to be paid or received in full, in which case the value thereof is arrived at after making such discount as may be considered appropriate in such case to reflect the true value thereof. b) The value of securities and/or financial derivative instruments, which are listed or dealt in on any stock exchange, is based on the last available price on the stock exchange, which is normally the principal market for such assets. c) The value of assets dealt in any other Regulated Market is based on the last available price. d) In the event that any assets are not listed or dealt in on any stock exchange or on any other Regulated Market, or if, with respect to assets listed or dealt in on any stock exchange, or other Regulated Market as aforesaid, the price as determined pursuant to sub-paragraph (b) or (c) is not representative of the fair market value of the relevant assets, the value of such assets are based on the reasonably foreseeable sales price determined prudently and in good faith. e) The liquidating value of options contracts not traded on stock exchanges or on other Regulated Markets means their net liquidating value determined, pursuant to the policies established by the Board of Directors of the Fund, on a basis consistently applied for each different variety of contracts. The liquidating value of futures, forward or options contracts traded on exchanges or on other Regulated Markets is based upon the last available closing or settlement prices of these contracts on exchanges and Regulated Markets on which the particular futures, forward or options contracts are traded by the Fund; provided that if a futures, forward or options contract cannot be liquidated on the day with respect to which net assets are being determined, the basis for determining the liquidating value of such contract shall be such value as the Board of Directors of the Fund may deem fair and reasonable. f) Investments in UCITS and other UCIs are taken at their latest official net asset values or their latest unofficial net asset values (i.e. which are not generally used for the purposes of subscription and redemption of Shares of the target funds) as provided by the relevant administrators if more recent than their official net asset values and for which the Administrative Agent has sufficient assurance that the valuation method used by the relevant administrator for said unofficial net asset values is coherent as compared to the official one. If events have occurred which may have resulted in a material change of the net asset value of such Shares or units of UCITS and/or other UCI since the day on which the latest official net asset value was calculated, the value of such Shares or units may be adjusted in order to reflect, in the reasonable opinion of the Board of Directors, such change of value. g) Non-listed money market instruments held by the Fund with a remaining maturity of ninety days or less are valued at the amortised cost method which approximates market value.
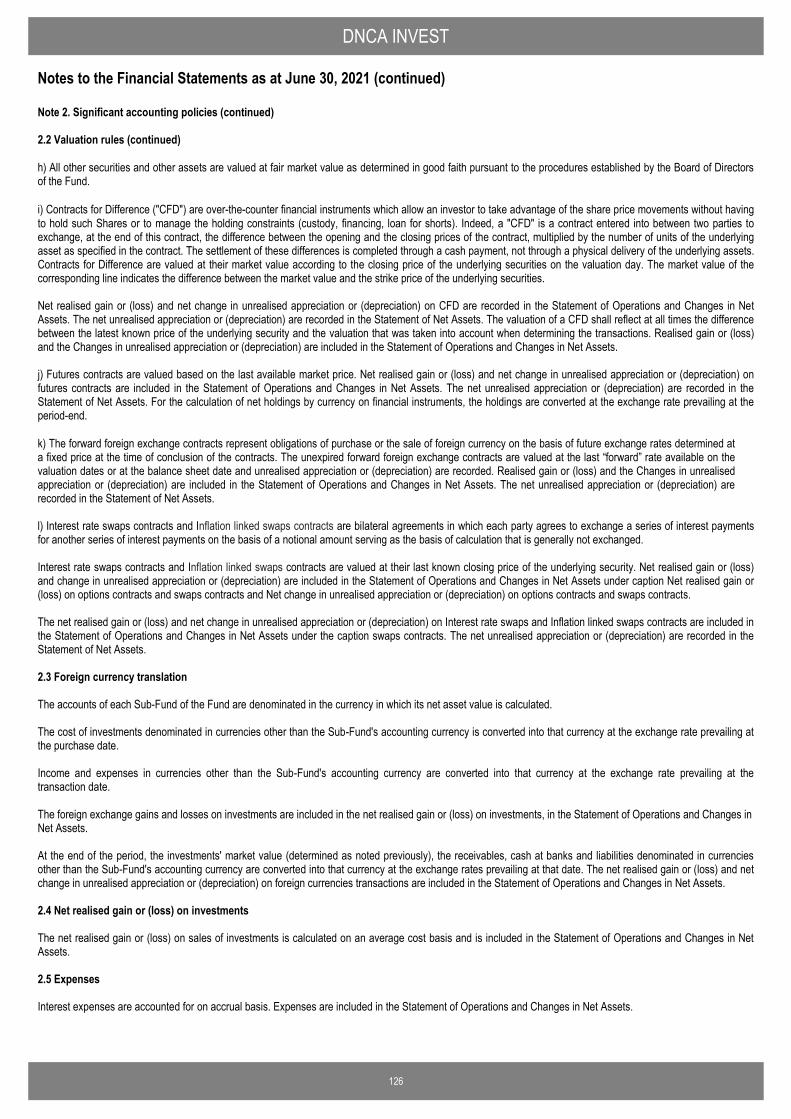
DNCA INVEST Notes to the Financial Statements as at June 30, 2021 (continued)
126
Note 2. Significant accounting policies (continued) 2.2 Valuation rules (continued) h) All other securities and other assets are valued at fair market value as determined in good faith pursuant to the procedures established by the Board of Directors of the Fund. i) Contracts for Difference ("CFD") are over-the-counter financial instruments which allow an investor to take advantage of the share price movements without having to hold such Shares or to manage the holding constraints (custody, financing, loan for shorts). Indeed, a "CFD" is a contract entered into between two parties to exchange, at the end of this contract, the difference between the opening and the closing prices of the contract, multiplied by the number of units of the underlying asset as specified in the contract. The settlement of these differences is completed through a cash payment, not through a physical delivery of the underlying assets. Contracts for Difference are valued at their market value according to the closing price of the underlying securities on the valuation day. The market value of the corresponding line indicates the difference between the market value and the strike price of the underlying securities. Net realised gain or (loss) and net change in unrealised appreciation or (depreciation) on CFD are recorded in the Statement of Operations and Changes in Net Assets. The net unrealised appreciation or (depreciation) are recorded in the Statement of Net Assets. The valuation of a CFD shall reflect at all times the difference between the latest known price of the underlying security and the valuation that was taken into account when determining the transactions. Realised gain or (loss) and the Changes in unrealised appreciation or (depreciation) are included in the Statement of Operations and Changes in Net Assets. j) Futures contracts are valued based on the last available market price. Net realised gain or (loss) and net change in unrealised appreciation or (depreciation) on futures contracts are included in the Statement of Operations and Changes in Net Assets. The net unrealised appreciation or (depreciation) are recorded in the Statement of Net Assets. For the calculation of net holdings by currency on financial instruments, the holdings are converted at the exchange rate prevailing at the period-end. k) The forward foreign exchange contracts represent obligations of purchase or the sale of foreign currency on the basis of future exchange rates determined at a fixed price at the time of conclusion of the contracts. The unexpired forward foreign exchange contracts are valued at the last “forward” rate available on the valuation dates or at the balance sheet date and unrealised appreciation or (depreciation) are recorded. Realised gain or (loss) and the Changes in unrealised appreciation or (depreciation) are included in the Statement of Operations and Changes in Net Assets. The net unrealised appreciation or (depreciation) are recorded in the Statement of Net Assets. l) Interest rate swaps contracts and Inflation linked swaps contracts are bilateral agreements in which each party agrees to exchange a series of interest payments for another series of interest payments on the basis of a notional amount serving as the basis of calculation that is generally not exchanged. Interest rate swaps contracts and Inflation linked swaps contracts are valued at their last known closing price of the underlying security. Net realised gain or (loss) and change in unrealised appreciation or (depreciation) are included in the Statement of Operations and Changes in Net Assets under caption Net realised gain or (loss) on options contracts and swaps contracts and Net change in unrealised appreciation or (depreciation) on options contracts and swaps contracts. The net realised gain or (loss) and net change in unrealised appreciation or (depreciation) on Interest rate swaps and Inflation linked swaps contracts are included in the Statement of Operations and Changes in Net Assets under the caption swaps contracts. The net unrealised appreciation or (depreciation) are recorded in the Statement of Net Assets. 2.3 Foreign currency translation The accounts of each Sub-Fund of the Fund are denominated in the currency in which its net asset value is calculated. The cost of investments denominated in currencies other than the Sub-Fund's accounting currency is converted into that currency at the exchange rate prevailing at the purchase date. Income and expenses in currencies other than the Sub-Fund's accounting currency are converted into that currency at the exchange rate prevailing at the transaction date. The foreign exchange gains and losses on investments are included in the net realised gain or (loss) on investments, in the Statement of Operations and Changes in Net Assets. At the end of the period, the investments' market value (determined as noted previously), the receivables, cash at banks and liabilities denominated in currencies other than the Sub-Fund's accounting currency are converted into that currency at the exchange rates prevailing at that date. The net realised gain or (loss) and net change in unrealised appreciation or (depreciation) on foreign currencies transactions are included in the Statement of Operations and Changes in Net Assets. 2.4 Net realised gain or (loss) on investments The net realised gain or (loss) on sales of investments is calculated on an average cost basis and is included in the Statement of Operations and Changes in Net Assets. 2.5 Expenses Interest expenses are accounted for on accrual basis. Expenses are included in the Statement of Operations and Changes in Net Assets.
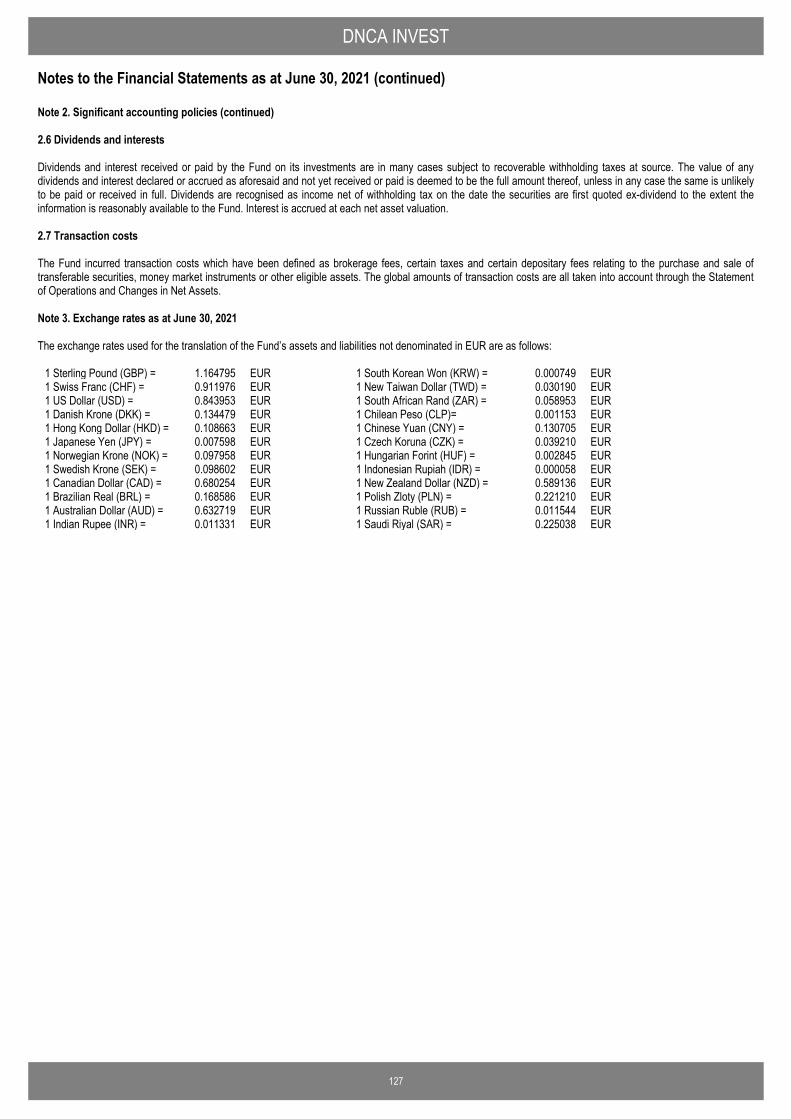
DNCA INVEST Notes to the Financial Statements as at June 30, 2021 (continued)
127
Note 2. Significant accounting policies (continued) 2.6 Dividends and interests Dividends and interest received or paid by the Fund on its investments are in many cases subject to recoverable withholding taxes at source. The value of any dividends and interest declared or accrued as aforesaid and not yet received or paid is deemed to be the full amount thereof, unless in any case the same is unlikely to be paid or received in full. Dividends are recognised as income net of withholding tax on the date the securities are first quoted ex-dividend to the extent the information is reasonably available to the Fund. Interest is accrued at each net asset valuation. 2.7 Transaction costs The Fund incurred transaction costs which have been defined as brokerage fees, certain taxes and certain depositary fees relating to the purchase and sale of transferable securities, money market instruments or other eligible assets. The global amounts of transaction costs are all taken into account through the Statement of Operations and Changes in Net Assets. Note 3. Exchange rates as at June 30, 2021 The exchange rates used for the translation of the Fund’s assets and liabilities not denominated in EUR are as follows:
1 Sterling Pound (GBP) = 1.164795 EUR
1 South Korean Won (KRW) = 0.000749 EUR 1 Swiss Franc (CHF) = 0.911976 EUR
1 New Taiwan Dollar (TWD) = 0.030190 EUR
1 US Dollar (USD) = 0.843953 EUR
1 South African Rand (ZAR) = 0.058953 EUR 1 Danish Krone (DKK) = 0.134479 EUR
1 Chilean Peso (CLP)= 0.001153 EUR
1 Hong Kong Dollar (HKD) = 0.108663 EUR
1 Chinese Yuan (CNY) = 0.130705 EUR 1 Japanese Yen (JPY) = 0.007598 EUR
1 Czech Koruna (CZK) = 0.039210 EUR
1 Norwegian Krone (NOK) = 0.097958 EUR
1 Hungarian Forint (HUF) = 0.002845 EUR 1 Swedish Krone (SEK) = 0.098602 EUR
1 Indonesian Rupiah (IDR) = 0.000058 EUR
1 Canadian Dollar (CAD) = 0.680254 EUR
1 New Zealand Dollar (NZD) = 0.589136 EUR 1 Brazilian Real (BRL) = 0.168586 EUR
1 Polish Zloty (PLN) = 0.221210 EUR
1 Australian Dollar (AUD) = 0.632719 EUR
1 Russian Ruble (RUB) = 0.011544 EUR 1 Indian Rupee (INR) = 0.011331 EUR
1 Saudi Riyal (SAR) = 0.225038 EUR
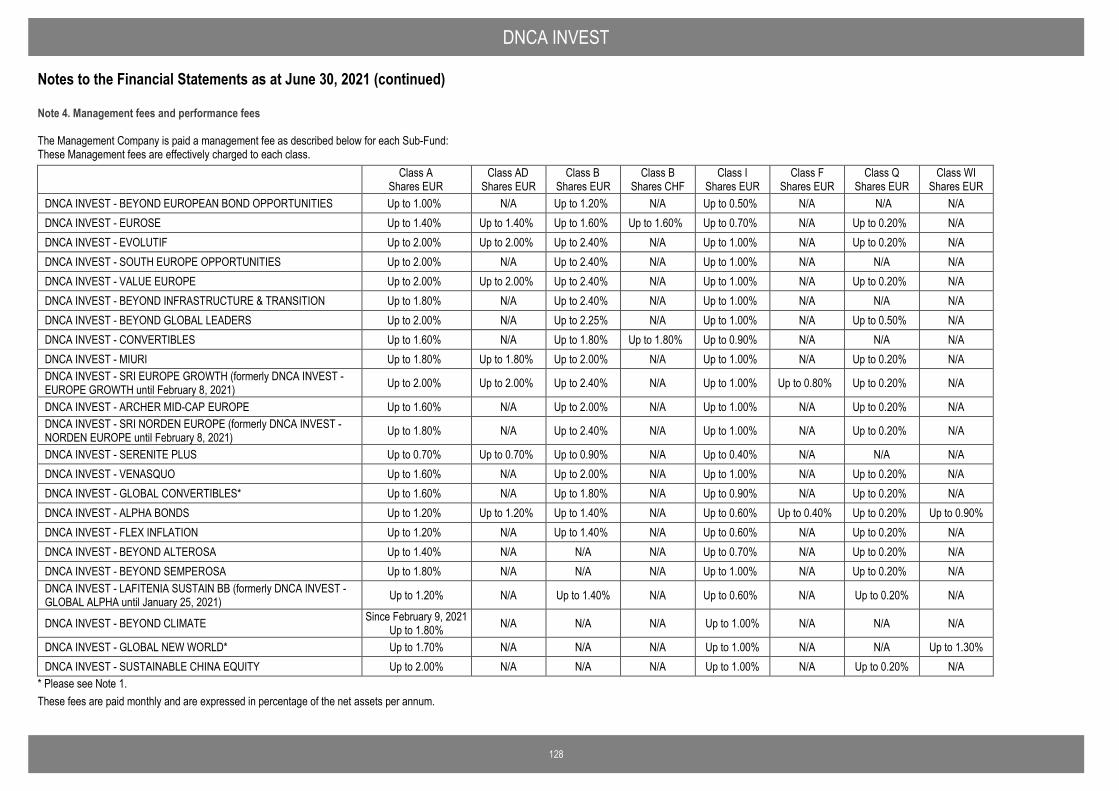
DNCA INVEST Notes to the Financial Statements as at June 30, 2021 (continued)
128
Note 4. Management fees and performance fees The Management Company is paid a management fee as described below for each Sub-Fund: These Management fees are effectively charged to each class.
Class A Class AD Class B Class B Class I Class F Class Q Class WI Shares EUR Shares EUR Shares EUR Shares CHF Shares EUR Shares EUR Shares EUR Shares EUR DNCA INVEST - BEYOND EUROPEAN BOND OPPORTUNITIES Up to 1.00% N/A Up to 1.20% N/A Up to 0.50% N/A N/A N/A DNCA INVEST - EUROSE Up to 1.40% Up to 1.40% Up to 1.60% Up to 1.60% Up to 0.70% N/A Up to 0.20% N/A DNCA INVEST - EVOLUTIF Up to 2.00% Up to 2.00% Up to 2.40% N/A Up to 1.00% N/A Up to 0.20% N/A DNCA INVEST - SOUTH EUROPE OPPORTUNITIES Up to 2.00% N/A Up to 2.40% N/A Up to 1.00% N/A N/A N/A DNCA INVEST - VALUE EUROPE Up to 2.00% Up to 2.00% Up to 2.40% N/A Up to 1.00% N/A Up to 0.20% N/A DNCA INVEST - BEYOND INFRASTRUCTURE & TRANSITION Up to 1.80% N/A Up to 2.40% N/A Up to 1.00% N/A N/A N/A DNCA INVEST - BEYOND GLOBAL LEADERS Up to 2.00% N/A Up to 2.25% N/A Up to 1.00% N/A Up to 0.50% N/A DNCA INVEST - CONVERTIBLES Up to 1.60% N/A Up to 1.80% Up to 1.80% Up to 0.90% N/A N/A N/A DNCA INVEST - MIURI Up to 1.80% Up to 1.80% Up to 2.00% N/A Up to 1.00% N/A Up to 0.20% N/A DNCA INVEST - SRI EUROPE GROWTH (formerly DNCA INVEST - EUROPE GROWTH until February 8, 2021) Up to 2.00% Up to 2.00% Up to 2.40% N/A Up to 1.00% Up to 0.80% Up to 0.20% N/A
DNCA INVEST - ARCHER MID-CAP EUROPE Up to 1.60% N/A Up to 2.00% N/A Up to 1.00% N/A Up to 0.20% N/A DNCA INVEST - SRI NORDEN EUROPE (formerly DNCA INVEST - NORDEN EUROPE until February 8, 2021) Up to 1.80% N/A Up to 2.40% N/A Up to 1.00% N/A Up to 0.20% N/A
DNCA INVEST - SERENITE PLUS Up to 0.70% Up to 0.70% Up to 0.90% N/A Up to 0.40% N/A N/A N/A DNCA INVEST - VENASQUO Up to 1.60% N/A Up to 2.00% N/A Up to 1.00% N/A Up to 0.20% N/A DNCA INVEST - GLOBAL CONVERTIBLES* Up to 1.60% N/A Up to 1.80% N/A Up to 0.90% N/A Up to 0.20% N/A DNCA INVEST - ALPHA BONDS Up to 1.20% Up to 1.20% Up to 1.40% N/A Up to 0.60% Up to 0.40% Up to 0.20% Up to 0.90% DNCA INVEST - FLEX INFLATION Up to 1.20% N/A Up to 1.40% N/A Up to 0.60% N/A Up to 0.20% N/A DNCA INVEST - BEYOND ALTEROSA Up to 1.40% N/A N/A N/A Up to 0.70% N/A Up to 0.20% N/A DNCA INVEST - BEYOND SEMPEROSA Up to 1.80% N/A N/A N/A Up to 1.00% N/A Up to 0.20% N/A DNCA INVEST - LAFITENIA SUSTAIN BB (formerly DNCA INVEST - GLOBAL ALPHA until January 25, 2021) Up to 1.20% N/A Up to 1.40% N/A Up to 0.60% N/A Up to 0.20% N/A
DNCA INVEST - BEYOND CLIMATE Since February 9, 2021 Up to 1.80% N/A N/A N/A Up to 1.00% N/A N/A N/A
DNCA INVEST - GLOBAL NEW WORLD* Up to 1.70% N/A N/A N/A Up to 1.00% N/A N/A Up to 1.30% DNCA INVEST - SUSTAINABLE CHINA EQUITY Up to 2.00% N/A N/A N/A Up to 1.00% N/A Up to 0.20% N/A
* Please see Note 1. These fees are paid monthly and are expressed in percentage of the net assets per annum.
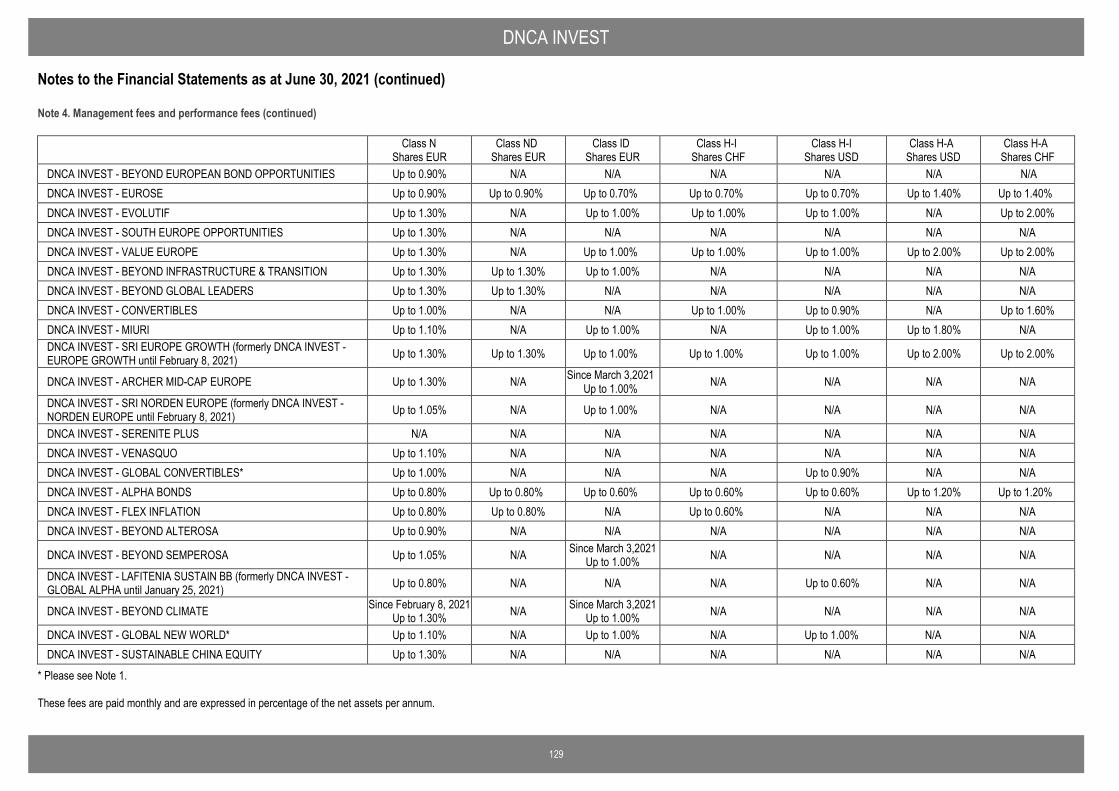
DNCA INVEST Notes to the Financial Statements as at June 30, 2021 (continued)
129
Note 4. Management fees and performance fees (continued)
Class N Class ND Class ID Class H-I Class H-I Class H-A Class H-A Shares EUR Shares EUR Shares EUR Shares CHF Shares USD Shares USD Shares CHF DNCA INVEST - BEYOND EUROPEAN BOND OPPORTUNITIES Up to 0.90% N/A N/A N/A N/A N/A N/A DNCA INVEST - EUROSE Up to 0.90% Up to 0.90% Up to 0.70% Up to 0.70% Up to 0.70% Up to 1.40% Up to 1.40% DNCA INVEST - EVOLUTIF Up to 1.30% N/A Up to 1.00% Up to 1.00% Up to 1.00% N/A Up to 2.00% DNCA INVEST - SOUTH EUROPE OPPORTUNITIES Up to 1.30% N/A N/A N/A N/A N/A N/A DNCA INVEST - VALUE EUROPE Up to 1.30% N/A Up to 1.00% Up to 1.00% Up to 1.00% Up to 2.00% Up to 2.00% DNCA INVEST - BEYOND INFRASTRUCTURE & TRANSITION Up to 1.30% Up to 1.30% Up to 1.00% N/A N/A N/A N/A DNCA INVEST - BEYOND GLOBAL LEADERS Up to 1.30% Up to 1.30% N/A N/A N/A N/A N/A DNCA INVEST - CONVERTIBLES Up to 1.00% N/A N/A Up to 1.00% Up to 0.90% N/A Up to 1.60% DNCA INVEST - MIURI Up to 1.10% N/A Up to 1.00% N/A Up to 1.00% Up to 1.80% N/A DNCA INVEST - SRI EUROPE GROWTH (formerly DNCA INVEST - EUROPE GROWTH until February 8, 2021) Up to 1.30% Up to 1.30% Up to 1.00% Up to 1.00% Up to 1.00% Up to 2.00% Up to 2.00%
DNCA INVEST - ARCHER MID-CAP EUROPE Up to 1.30% N/A Since March 3,2021 Up to 1.00% N/A N/A N/A N/A
DNCA INVEST - SRI NORDEN EUROPE (formerly DNCA INVEST - NORDEN EUROPE until February 8, 2021) Up to 1.05% N/A Up to 1.00% N/A N/A N/A N/A
DNCA INVEST - SERENITE PLUS N/A N/A N/A N/A N/A N/A N/A DNCA INVEST - VENASQUO Up to 1.10% N/A N/A N/A N/A N/A N/A DNCA INVEST - GLOBAL CONVERTIBLES* Up to 1.00% N/A N/A N/A Up to 0.90% N/A N/A DNCA INVEST - ALPHA BONDS Up to 0.80% Up to 0.80% Up to 0.60% Up to 0.60% Up to 0.60% Up to 1.20% Up to 1.20% DNCA INVEST - FLEX INFLATION Up to 0.80% Up to 0.80% N/A Up to 0.60% N/A N/A N/A DNCA INVEST - BEYOND ALTEROSA Up to 0.90% N/A N/A N/A N/A N/A N/A
DNCA INVEST - BEYOND SEMPEROSA Up to 1.05% N/A Since March 3,2021 Up to 1.00% N/A N/A N/A N/A
DNCA INVEST - LAFITENIA SUSTAIN BB (formerly DNCA INVEST - GLOBAL ALPHA until January 25, 2021) Up to 0.80% N/A N/A N/A Up to 0.60% N/A N/A
DNCA INVEST - BEYOND CLIMATE Since February 8, 2021 Up to 1.30% N/A Since March 3,2021
Up to 1.00% N/A N/A N/A N/A
DNCA INVEST - GLOBAL NEW WORLD* Up to 1.10% N/A Up to 1.00% N/A Up to 1.00% N/A N/A DNCA INVEST - SUSTAINABLE CHINA EQUITY Up to 1.30% N/A N/A N/A N/A N/A N/A
* Please see Note 1. These fees are paid monthly and are expressed in percentage of the net assets per annum.
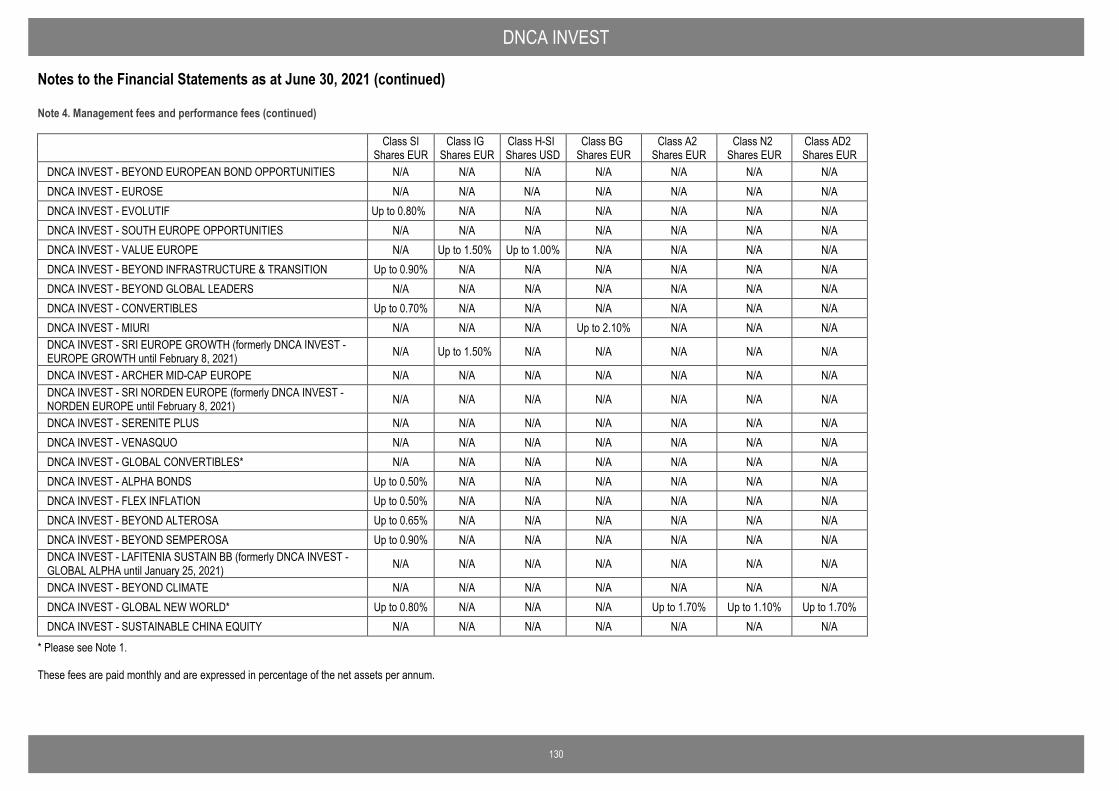
DNCA INVEST Notes to the Financial Statements as at June 30, 2021 (continued)
130
Note 4. Management fees and performance fees (continued)
Class SI Class IG Class H-SI Class BG Class A2 Class N2 Class AD2 Shares EUR Shares EUR Shares USD Shares EUR Shares EUR Shares EUR Shares EUR DNCA INVEST - BEYOND EUROPEAN BOND OPPORTUNITIES N/A N/A N/A N/A N/A N/A N/A DNCA INVEST - EUROSE N/A N/A N/A N/A N/A N/A N/A DNCA INVEST - EVOLUTIF Up to 0.80% N/A N/A N/A N/A N/A N/A DNCA INVEST - SOUTH EUROPE OPPORTUNITIES N/A N/A N/A N/A N/A N/A N/A DNCA INVEST - VALUE EUROPE N/A Up to 1.50% Up to 1.00% N/A N/A N/A N/A DNCA INVEST - BEYOND INFRASTRUCTURE & TRANSITION Up to 0.90% N/A N/A N/A N/A N/A N/A DNCA INVEST - BEYOND GLOBAL LEADERS N/A N/A N/A N/A N/A N/A N/A DNCA INVEST - CONVERTIBLES Up to 0.70% N/A N/A N/A N/A N/A N/A DNCA INVEST - MIURI N/A N/A N/A Up to 2.10% N/A N/A N/A DNCA INVEST - SRI EUROPE GROWTH (formerly DNCA INVEST - EUROPE GROWTH until February 8, 2021) N/A Up to 1.50% N/A N/A N/A N/A N/A
DNCA INVEST - ARCHER MID-CAP EUROPE N/A N/A N/A N/A N/A N/A N/A DNCA INVEST - SRI NORDEN EUROPE (formerly DNCA INVEST - NORDEN EUROPE until February 8, 2021) N/A N/A N/A N/A N/A N/A N/A
DNCA INVEST - SERENITE PLUS N/A N/A N/A N/A N/A N/A N/A DNCA INVEST - VENASQUO N/A N/A N/A N/A N/A N/A N/A DNCA INVEST - GLOBAL CONVERTIBLES* N/A N/A N/A N/A N/A N/A N/A DNCA INVEST - ALPHA BONDS Up to 0.50% N/A N/A N/A N/A N/A N/A DNCA INVEST - FLEX INFLATION Up to 0.50% N/A N/A N/A N/A N/A N/A DNCA INVEST - BEYOND ALTEROSA Up to 0.65% N/A N/A N/A N/A N/A N/A DNCA INVEST - BEYOND SEMPEROSA Up to 0.90% N/A N/A N/A N/A N/A N/A DNCA INVEST - LAFITENIA SUSTAIN BB (formerly DNCA INVEST - GLOBAL ALPHA until January 25, 2021) N/A N/A N/A N/A N/A N/A N/A
DNCA INVEST - BEYOND CLIMATE N/A N/A N/A N/A N/A N/A N/A DNCA INVEST - GLOBAL NEW WORLD* Up to 0.80% N/A N/A N/A Up to 1.70% Up to 1.10% Up to 1.70% DNCA INVEST - SUSTAINABLE CHINA EQUITY N/A N/A N/A N/A N/A N/A N/A
* Please see Note 1. These fees are paid monthly and are expressed in percentage of the net assets per annum.
DNCA INVEST Notes to the Financial Statements as at June 30, 2021 (continued)
131
Note 4. Management fees and performance fees (continued) DNCA INVEST - BEYOND EUROPEAN BOND OPPORTUNITIES: The Management Company is entitled to a performance fee calculated daily on the positive performance of the Sub-Fund compared to the performance of the FTSE MTS Global Index with High Water Mark. The High Water Mark is the Net Asset Value per Share at the last Valuation Day of any performance period where a performance fee has been paid or failing that, the initial offer price per Share for unlaunched Classes. In order to calculate daily the performance for each Class, the total net asset value before performance fee is compared to the Reference Asset Value. The daily Reference Asset Value for each Class equals the total net assets of the relevant Class as of the previous Valuation Day, plus additional subscriptions and minus redemptions multiplied by the FTSE MTS Global Index. In case of redemptions, corresponding performance f ee (if any) will be crystallised. The performance fee is paid yearly. The performance fee is equal to 20% of the positive performance net of any fees above FTSE MTS Global Index with High Water Mark. The performance period is the period running from 1 January to December 31 each year. DNCA INVEST - EUROSE: This Sub-Fund is not subject to receive performance fee. DNCA INVEST - EVOLUTIF: The Management Company is entitled to a performance fee calculated daily on the positive performance of the Sub-Fund compared to the performance of the following composite index net return: 60% Eurostoxx 50, 30% FTSE MTS EMU GOV BOND 1-3 Years and 10% EONIA with High Water Mark.The High Water Mark is the Net Asset Value per Share at the last Valuation Day of any performance period where a performance fee has been paid or failing that, the initial offer price per Share for unlaunched Classes. In order to calculate daily the performance for each Class, the total net asset value before performance fee is compared to the Reference Asset Value. The daily Reference Asset Value for each Class equals the total net assets of the relevant Class as of the previous Valuation Day, plus additional subscriptions and minus redemptions multiplied by the composite Index. In case of redemptions, corresponding performance fee (if any) will be crystallised. The performance fee is paid yearly. The performance fee is equal to 20% (none for the Class Q Shares EUR) of the positive performance net of any fees above the composite Index with High Water Mark. The performance period is the period running from 1 January to December 31 each year. DNCA INVEST - SOUTH EUROPE OPPORTUNITIES: The Management Company is entitled to a performance fee calculated daily on the positive performance of the Sub-Fund compared to the performance of the following composite index net return: 55% FTSE MIB; 40% IBEX; 5% PSI20 with High Water Mark. The High Water Mark is the Net Asset Value per Share at the last Valuation Day of any performance period where a performance fee has been paid or failing that, the initial offer price per Share for unlaunched Classes. In order to calculate daily the performance for each Class, the total net asset value before performance fee is compared to the Reference Asset Value. The daily Reference Asset Value for each Class equals the total net assets of the relevant Class as of the previous Valuation Day, plus additional subscriptions and minus redemptions multiplied by the composite Index. In case of redemptions, corresponding performance fee (if any) will be crystallised. The performance fee is paid yearly. The performance fee is equal to 20% of the positive performance net of any fees above the composite Index with High Water Mark. The performance period is the period running from 1 January to December 31 each year. DNCA INVEST - VALUE EUROPE: The Management Company is entitled to a performance fee calculated daily on the positive performance of the Sub-Fund compared to the performance of the STOXX EUROPE 600 Index Net Return with High Water Mark. The High Water Mark is the Net Asset Value per Share at the last Valuation Day of any performance period where a performance fee has been paid or failing that, the initial offer price per Share for unlaunched Classes. In order to calculate daily the performance for each Class, the total net asset value before performance fee is compared to the Reference Asset Value. The daily Reference Asset Value for each Class equals the total net assets of the relevant Class as of the previous Valuation Day, plus additional subscriptions and minus redemptions multiplied by the STOXX EUROPE 600 Index Net Return. In case of redemptions, corresponding performance fee (if any) will be crystallised. The performance fee is paid yearly. The performance fee is equal to 20% (none for the classes Q Shares EUR and H-SI Shares USD) of the positive performance net of any fees above the STOXX EUROPE 600 Index Net Return with High Water Mark. The performance period is the period running from 1 January to December 31 each year. DNCA INVEST - BEYOND INFRASTRUCTURE & TRANSITION: The Management Company is entitled to a performance fee calculated daily on the positive performance of the Sub-Fund compared to the performance of the MSCI Europe Infrastructure Net Index with High Water Mark. The High Water Mark is the Net Asset Value per Share at the last Valuation Date of any performance period where a performance fee has been paid or failing that, the initial offer price per Share for unlaunched Classes. In order to calculate daily the performance for each Class, the total net asset value before performance fee is compared to the Reference Asset Value. The daily reference Asset Value for each Class equals the total net assets of the relevant Class as of the previous Valuation Day plus additional subscriptions and minus redemptions multiplied by the MSCI Europe Infrastructure Net Index. In case of redemptions, corresponding performance fee (if any) will be crystallised. The performance fee is paid yearly. The performance fee is equal to 20% of the positive performance net of any fees above the MSCI Europe Infrastructure Net Index with High with Water Mark. The performance period is the period running from 1 January to December 31 each year. DNCA INVEST - BEYOND GLOBAL LEADERS: The Management Company is entitled to a performance fee calculated daily on the outperformance of the Sub-Fund compared to the performance of the MSCI All Countries World Index Net Return (MSCI ACWI NR Index). In order to calculate daily the performance of each Class, the total net asset value before performance fee is compared to the Reference Asset Value. The daily Reference Asset Value for each Class equals the total net assets of the relevant Class as of the previous Valuation day plus additional subscriptions and minus redemptions multiplied by the composite index described above. In case of redemptions, corresponding performance fee (if any) will be crystallised. The performance fee is paid yearly.
DNCA INVEST Notes to the Financial Statements as at June 30, 2021 (continued)
132
Note 4. Management fees and performance fees (continued) DNCA INVEST - BEYOND GLOBAL LEADERS (continued): The performance fee is equal to 10% (5% for Share class Q Shares (EUR)) of the positive performance net of any fees above the MSCI All Countries World Index Net Return. The performance period is the period running from 1 January to December 31 each year. DNCA INVEST - CONVERTIBLES: The Management Company is entitled to a performance fee calculated daily on the positive performance of the Sub-Fund compared to the performance, net of any fees, of the Exane Euro Convertibles Index with High Water Mark. The High Water Mark is the Net Asset Value per Share at the last Valuation Date of any performance period where a performance fee has been paid or failing that, the initial offer price per Share for unlaunched Classes and the Net Asset Value per Share at the last Valuation Day of December 2015 for any other Class and for the first performance period. In order to calculate daily the performance for each Class, the total net asset value before performance fee is compared to the Reference Asset Value. The daily Reference Asset Value for each Class equals the total net assets of the relevant Class as of the previous Valuation Day (and for the first performance period as of the last Valuation Day of December 2015), plus additional subscriptions and minus redemptions, multiplied by the Exane Euro Convertibles Index. In case of redemptions, corresponding performance fee (if any) will be crystallised. The performance fee is paid yearly. The performance fee is equal to 15% of the positive performance net of any fees above the Exane Euro Convertibles Index with High Water Mark. The performance period is the period running from 1 January to December 31 each year. DNCA INVEST - MIURI: The Management Company is entitled to a performance fee calculated daily on the performance of the Sub-Fund compared to the performance of the EONIA Index. In order to calculate daily the performance, the total net asset value before performance fee is compared to the Reference Asset Value. The daily Reference Asset Value for each Class equals the total net assets of the relevant Class as of the previous Valuation Day, plus additional subscriptions and minus redemptions multiplied by the EONIA Index. In case of redemptions, corresponding performance fee (if any) will be crystallised. The performance fee is paid yearly. The performance fee is equal to 20% (none for Share class Q Shares (EUR)) of the positive performance net of any fees above the EONIA Index. The performance period is the period running from 1 January to December 31 each year. DNCA INVEST - SRI EUROPE GROWTH (formerly DNCA INVEST - EUROPE GROWTH until February 8, 2021): The Management Company is entitled to a performance fee calculated daily on the positive performance of the Sub-Fund compared to the performance of the STOXX EUROPE 600 Net Return (NR) Index. In order to calculate daily the performance, the total net asset value before performance fee is compared to the Reference Asset Value. The daily Reference Asset Value for each Class equals the total net assets of the relevant Class as of the previous Valuation Day, plus additional subscriptions and minus redemptions multiplied by the STOXX EUROPE 600 (Net Return Index). In case of redemptions, corresponding performance f ee (if any) will be crystallised. The performance fee is paid yearly. The performance fee is equal to 20% (none for the Class Q Shares EUR) of the positive performance net of any fees above the STOXX EUROPE 600 (Net Return Index). The performance period is the period running from 1 January to December 31 each year. DNCA INVEST - ARCHER MID-CAP EUROPE: The Management Company is entitled to a performance fee calculated daily on the positive performance of the Sub-Fund compared to the performance of the MSCI EUROPE MID CAP Net Return Euro Index. In order to calculate daily the performance, the total net asset value before performance fee is compared to the Reference Asset Value. The daily Reference Asset Value for each Class equals the total net assets of the relevant Class as of the previous Valuation Day, plus additional subscriptions and minus redemptions multiplied by MSCI EUROPE MID CAP Net Return Euro Index. In case of redemptions, corresponding performance fee (if any) will be crystallised. The performance fee is paid yearly. The performance fee is equal to 20% (none for the Share class Q Shares (EUR)) of the positive performance net of any fees above the MSCI EUROPE MID CAP Net Return Euro Index. The performance period is the period running from 1 January to December 31 each year. DNCA INVEST - SRI NORDEN EUROPE (formerly DNCA INVEST - NORDEN EUROPE until February 8, 2021): The Management Company is entitled to a performance fee calculated daily on the positive performance of the Sub-Fund compared to the performance of the following composite net return index denominated in Euro: 40% MSCI Nordic, 35% DAX, 15% SMI, 10% MSCI UK TR UK Net Local Currency. In order to calculate daily the performance, the total net asset value before performance fee is compared to the Reference Asset Value. The daily Reference Asset Value for each Class equals the total net assets of the relevant Class as of the previous Valuation Day (and for the first performance period as of the first Valuation Day), plus additional subscriptions and minus redemptions multiplied by the composite Index. In case of redemptions, corresponding performance fee (if any) will be crystallised. The performance fee is paid yearly. The performance fee is equal to 20% (none for Share class Q Shares (EUR)) of the positive performance net of any fees above the composite index. The performance period is the period running from 1 January to December 31 each year. DNCA INVEST - SERENITE PLUS: The Management Company is entitled to a performance fee calculated daily on the positive performance of the Sub-Fund compared to the performance of the FTSE MTS Index 1-3 years. In order to calculate daily the performance, the total net asset value before performance fee is compared to the Reference Asset Value. The daily Reference Asset Value for each Class equals the total net assets of the relevant Class as of the previous Valuation Day (and for the first performance period as of the first Valuation Day), plus additional subscriptions and minus redemptions multiplied by the FTSE MTS Index 1-3 years. In case of redemptions, corresponding performance fee (if any) will be crystallised. The performance fee is paid yearly.
DNCA INVEST Notes to the Financial Statements as at June 30, 2021 (continued)
133
Note 4. Management fees and performance fees (continued) DNCA INVEST - SERENITE PLUS (continued): The performance fee is equal to 20% of the positive performance net of any fees above the Index. The performance period is the period running from 1 January to December 31 each year. DNCA INVEST - VENASQUO: The Management Company is entitled to a performance fee calculated daily on the positive performance of the Sub-Fund compared to the performance of following composite index net return: 50% EONIA + 50% EUROSTOXX 50. In order to calculate daily the performance, the total net asset value before performance fee is compared to the Reference Asset Value. The daily Reference Asset Value for each Class equals the total net assets of the relevant Class as of the previous Valuation Day, plus additional subscriptions and minus redemptions multiplied by the composite Index. In case of redemptions, corresponding performance fee (if any) will be crystallised. The performance fee is paid yearly. The performance fee is equal to 20% (none for class Q Shares EUR) of the positive performance net of any fees above the composite index. The performance period is the period running from 1 January to December 31 each year. DNCA INVEST - GLOBAL CONVERTIBLES*: The Management Company is be entitled to a performance fee calculated daily on the positive performance of the Sub-Fund compared to the performance, net of any fees, of the UBS Thomson Reuters Global Focus Vanilla Hedged (EUR) CB Index with High Water Mark. The High Water Mark is the Net Asset Value per Share at the last Valuation Day of any performance period where a performance fee has been paid or failing that, the initial offer price per Share for unlaunched Classes and the Net Asset Value per Share at the last Valuation Day of December of the relevant year for any other Class and for the first performance period. In order to calculate daily the performance for each Class, the total net asset value before performance fee is compared to the Reference Asset Value as defined below. The daily Reference Asset Value for each Class equals the total net assets of the relevant Class as of the previous Valuation Day, plus additional subscriptions and minus redemptions, multiplied by the UBS Thomson Reuters Global Focus Vanilla Hedged (EUR) CB Index. In case of redemptions, corresponding performance fee (if any) will be crystallised. The performance fee is paid yearly. The performance fee is equal to 15% (5% for class Q Shares EUR) of the positive performance net of any fees above the UBS Thomson Reuters Global Focus Vanilla Hedged (EUR) CB Index with High Water Mark. The performance period is the period running from 1 January to December 31 each year. DNCA INVEST - ALPHA BONDS: The Management Company is entitled to a performance fee calculated daily on the positive performance of the Sub-Fund compared to the performance, net of any fees, of the EONIA Index +2.5% with High Water Mark. The High Water Mark is the Net Asset Value per Share at the last Valuation Date of any performance period where a performance fee has been paid or failing that, the initial offer price per Share for unlaunched Classes. In order to calculate daily the performance for each Class, the total net asset value before performance fee is compared to the Reference Asset Value. The daily Reference Asset Value for each Class equals the total net assets of the relevant Class as of the previous Valuation Day, plus additional subscriptions and minus redemptions and any distributed dividend, multiplied by the EONIA index +2.5%. In case of redemptions, corresponding performance fee (if any) will be crystallised. The performance fee is paid yearly only in case of positive performance at the end of relevant performance period and if the Net Asset Value as of the last Valuation Day of the relevant performance period would not fall below the Net Asset Value as of the first Valuation Day of this performance period. The performance fee is equal to 20% (none for class Q and WI Shares EUR) of the positive performance net of any fees above the EONIA index + 2.5% with High Water Mark. The performance period is the period running from 1 January to December 31 each year. DNCA INVEST - FLEX INFLATION: The Management Company is entitled to a performance fee calculated daily on the positive performance of the Sub-Fund compared to the performance, net of any fees, of the Bloomberg Barclays World Govt Inflation Linked Bonds Hedged EUR with High Water Mark. The High Water Mark is the Net Asset Value per Share at the last Valuation Date of any performance period where a performance fee has been paid or failing that, the initial offer price per Share for unlaunched Classes. In order to calculate daily the performance for each Class, the total net asset value before performance fee is compared to the Reference Asset Value. The daily Reference Asset Value for each Class equals the total net assets of the relevant Class as of the previous Valuation Day, plus additional subscriptions and minus redemptions and any distributed dividend, multiplied by the Bloomberg Barclays World Govt Inflation Linked Bonds Hedged EUR. In case of redemptions, corresponding performance fee (if any) will be crystallised. The performance fee is paid yearly only in case of positive performance at the end of relevant performance period and if the Net Asset Value as of the last Valuation Day of the relevant performance period would not fall below the Net Asset Value as of the first Valuation Day of this performance period. The performance fee is equal to 20% (none for class Q Shares EUR) of the positive performance net of any fees above the Bloomberg Barclays World Govt Inflation Linked Bonds Hedged EUR with High Water Mark. The performance period is the period running from 1 January to December 31 each year. DNCA INVEST - BEYOND ALTEROSA**: The Management Company is entitled to a Performance Fee calculated daily on the positive performance of the Sub-Fund compared to the performance, net of any fees, of the 30% MSCI All Countries World Net Return + 70% Bloomberg Barclays Global Treasury Index Euro Hedged composite index with High Water Mark. The High Water Mark is the Net Asset Value per Share at the last Valuation Day of any performance period where a performance fee has been paid or failing that, the initial offer price per Share for unlaunched Classes. In order to calculate daily the performance of each Class, the total net asset value before performance fee is compared to the Reference Asset Value. The daily reference asset value for each Class equals the total net assets of the relevant Class as of the previous Valuation Day, plus additional subscriptions and minus redemptions and any distributed dividend, multiplied by the 30% MSCI All Countries World Net Return + 70% Bloomberg Barclays Global Treasury Index Euro Hedged composite index. In case of redemptions, corresponding Performance Fee (if any) will be crystallised. The Performance Fee is paid yearly only in case of positive performance at the end of relevant performance period and if the Net Asset Value as of the last Valuation Day of the relevant performance period would not fall below the Net Asset Value as of the first Valuation Day of this performance period. * Please see Note 1 ** As from January 25, 2021, the sub-funds has integrated performance fees.
DNCA INVEST Notes to the Financial Statements as at June 30, 2021 (continued)
134
Note 4. Management fees and performance fees (continued) DNCA INVEST - BEYOND ALTEROSA** (continued): The performance fee is equal to 20% (none for class Q Shares EUR) of the positive performance net of any fees above the 30% MSCI All Countries World Net Return + 70% Bloomberg Barclays Global Treasury Index Euro Hedge composite index, with High Water Mark.The performance period is the period running from 1 January to December 31 each year. DNCA INVEST - BEYOND SEMPEROSA: The Management Company is entitled to a performance fee calculated daily on the positive performance of the Sub-Fund compared to the performance, net of any fees, of the EURO STOXX Net Return. The High Water Mark is the Net Asset Value per Share at the last Valuation Date of any performance period where a performance fee has been paid or failing that, the initial offer price per Share for unlaunched Classes. In order to calculate daily the performance, the total net asset value before performance fee is compared to the Reference Asset Value. The daily Reference Asset Value for each Class equals the total net assets of the relevant Class as of the previous Valuation Day, plus additional subscriptions and minus redemptions multiplied by the EURO STOXX Net Return. In case of redemptions, corresponding p erformance fee (if any) will be crystallised. The performance fee is paid yearly only in case of positive performance at the end of relevant performance period and if the Net Asset Value per share as of the last Valuation Day of the relevant performance period would not fall below the Net Asset Value per share as of the first Valuation Day of this performance period. The performance fee is equal to 20% (none for class Q Shares EUR) of the positive performance net of any fees above the EURO STOXX Net Return with High Water Mark. The performance period is the period running from 1 January to December 31 each year. DNCA INVEST - LAFITENIA SUSTAIN BB (formerly DNCA INVEST - GLOBAL ALPHA until January 25, 2021): The Management Company is entitled to a Performance Fee calculated daily on the positive performance of the Sub-Fund compared to the performance, net of any fees, of the 50% Bloomberg Barclays Euro Corporate 500 - BBB index + 50% Bloomberg Barclays Euro High Yield BB Rating only index with High Water Mark. The High Water Mark is the Net Asset Value per Share at the last Valuation Day of any performance period where a performance fee has been paid or failing that, the initial offer price per Share for unlaunched Classes. In order to calculate daily the performance for each Class, the total Net Asset Value before Performance Fee is compared to the reference asset value. The daily reference asset value for each Class equals the total net assets of the relevant Class as of the previous Valuation Day, plus additional subscriptions and minus redemptions and any distributed dividend, multiplied by the 50% Bloomberg Barclays Euro Corporate 500 - BBB index + 50% Bloomberg Barclays Euro High Yield BB Rating only index. In case of redemptions, corresponding Performance Fee (if any) will be crystallised. The Performance Fee is paid yearly only in case of positive performance at the end of relevant performance period and if the Net Asset Value as of the last Valuation Day of the relevant performance period would not fall below the Net Asset Value as of the first Valuation Day of this performance period. The performance fee is equal to 20% (none for class Q Shares EUR) of the positive performance net of any fees above the 50% Bloomberg Barclays Euro Corporate 500 - BBB index + 50% Bloomberg Barclays Euro High Yield BB Rating only index with High Water Mark. The performance period is the period running from 1 January to December 31 each year. DNCA INVEST - BEYOND CLIMATE: The Management Company is entitled to a performance fee calculated daily on the positive performance of the Sub-Fund compared to the performance of the Euro Stoxx Net Return with High Water Mark. The High Water Mark is the Net Asset Value per Share at the last Valuation Date of any performance period where a performance fee has been paid or failing that, the initial offer price per Share for unlaunched Classes. In order to calculate daily the performance for each Class, the total net asset value before performance fee is compared to the Reference Asset Value. The daily reference Asset Value for each Class equals the total net assets of the relevant Class as of the previous Valuation Day plus additional subscriptions and minus redemptions and any distributed dividend, multiplied by the Euro Stoxx Net Return. In case of redemptions, corresponding performance fee (if any) will be crystallised. The Performance Fee is paid yearly only in case of positive performance at the end of relevant performance period and if the Net Asset Value as of the last Valuation Day of the relevant performance period would not fall below the Net Asset Value per Share as of the first Valuation Day of this performance period. The performance fee is equal to 20% of the positive performance net of any fees above the index with High with Water Mark. The performance period is the period running from 1 January to December 31 each year. DNCA INVEST - GLOBAL NEW WORLD*: The Management Company is entitled to a performance fee calculated daily on the positive performance of the Sub-Fund compared to the performance, net of any fees, of the MSCI All Countries World Index Net Return (MSCI ACWI NR Index) with High Water Mark. The High Water Mark is the Net Asset Value per Share at the last Valuation Date of any performance period where a performance fee has been paid or failing that, the initial offer price per Share for unlaunched Classes. In order to calculate daily the performance of each Class, the total net asset value before performance fee is compared to the Reference Asset Value. The daily Reference Asset Value for each Class equals the total net assets of the relevant Class as of the previous Valuation day plus additional subscriptions and minus redemptions and any distributed dividend, multiplied by the composite index described above. In case of redemptions, corresponding performance fee (if any) will be crystallised. The Performance Fee is paid yearly only in case of positive performance at the end of relevant performance period and if the Net Asset Value as of the last Valuation Day of the relevant performance period would not fall below the Net Asset Value as of the first Valuation Day of this performance period. The performance fee is equal to 20% (none for class WI, N2, ND2, A2, AD2 Shares EUR) of the positive performance net of any fees above the MSCI All Countries World Index Net Return with High Water Mark. The performance period is the period running from 1 January to December 31 each year. DNCA INVEST - SUSTAINABLE CHINA EQUITY: The Management Company is entitled to a performance fee calculated daily on the positive performance of the Sub-Fund compared to the performance, net of any fees, of the MSCI China 10/40 Index with High Water Mark. The High Water Mark is the Net Asset Value per Share at the last Valuation Date of any performance period where a performance fee has been paid or failing that, the initial offer price per Share for unlaunched Classes. In order to calculate daily the performance for each Class, the total net asset value before performance fee is compared to the Reference Asset Value. The daily reference Asset Value for each Class equals the total net assets of the relevant Class as of the previous Valuation Day plus additional subscriptions and minus redemptions and any distributed dividend, multiplied by the MSCI China 10/40 Index. * Please see Note1. ** As from January 25, 2021, the sub-funds has integrated performance fees.
DNCA INVEST Notes to the Financial Statements as at June 30, 2021 (continued)
135
Note 4. Management fees and performance fees (continued) DNCA INVEST - SUSTAINABLE CHINA EQUITY (continued): In case of redemptions, corresponding performance fee (if any) will be crystallised. The Performance Fee is paid yearly only in case of positive performance at the end of relevant performance period and if the Net Asset Value as of the last Valuation Day of the relevant performance period would not fall below the Net Asset Value as of the first Valuation Day of this performance period. The performance fee is equal to 20% (none for class Q shares EUR) of the positive performance net of any fees above the MSCI China 10/40 Index with High Water Mark. The performance period is the period running from 1 January to December 31 each year. Note 5. Depositary and administration fees The Board of Directors of the Fund has appointed BNP Paribas Securities Services - Luxembourg Branch as depositary, administrative agent, depositary agent, domiciliary agent, principal paying agent, registrar and transfer agent of the Fund. The Fund pays to the Depositary a depositary fee which shall not exceed 0.08 % of the Net Asset Value of the Fund. The depositary fee is paid monthly. The Fund pays to the Principal Transfer Agent and Administrative Agent an Administrative fee which shall not exceed 0.07% of the average Net Asset Value of the Fund. The administration fee is paid monthly. Note 6. Taxe d’abonnement Under current law and practice, the Fund is not liable to any Luxembourg income tax, nor are dividends paid by the Fund liable to any Luxembourg withholding tax. During the period, the Fund is liable to a subscription tax (“taxe d’abonnement”) at a rate of 0.05% per annum on the Net Asset Value of each class which is available to all investors. This tax is reduced to 0.01% per annum of the Net Asset Value of each class which is restricted to institutional investors. The “taxe d’abonnement” is not applicable in respect of assets invested in Luxembourg UCIs, which are themselves subject to such tax. No stamp duty or other tax is payable in Luxembourg on the issue of Shares in the Fund. The tax is payable quarterly on the basis of the value of the net assets of the Fund at the end of the relevant quarter. Note 7. Professional fees and other expenses The caption “Professional fees” include mainly legal fees, advisory fees, audit fees and compliance fees. The caption “Other expenses” is mainly composed of registrar fees, regulatory fees and Alfi fees. Note 8. Changes in portfolio statement The report on the changes in the portfolio statement during the period is available upon request and free of charges at the registered office of the Fund. Note 9. Cross Sub-Funds investment (art. 181 of the amended Law of December 17, 2010) Cross Sub-Funds investment envisages that any Sub-Fund created within an undertaking for collective investment (UCI) with multiple Sub-Funds may invest in one or more other Sub-Funds of the same UCI. This allows a single legal structure with cross Sub-Funds investment to subscribe for, acquire and hold within the same UCI. During the period ended June 30, 2021, the following cross Sub-Funds investments were processed: - DNCA INVEST - EUROSE¹ invests in:
- DNCA INVEST - ALPHA BONDS - CLASS I SHARES EUR - DNCA INVEST - ARCHER MID-CAP EUROPE - CLASS I SHARES EUR - DNCA INVEST - FLEX INFLATION - CLASS I SHARES EUR - DNCA INVEST - LAFITENIA SUSTAIN BB (formerly DNCA INVEST - GLOBAL ALPHA until January 25, 2021) - CLASS I SHARES EUR - DNCA INVEST - MIURI - CLASS I SHARES EUR - DNCA INVEST - SOUTH EUROPE OPPORTUNITIES - CLASS I SHARES EUR - DNCA INVEST - VALUE EUROPE - CLASS I SHARES EUR
- DNCA INVEST - EVOLUTIF¹ invests in:
- DNCA INVEST - LAFITENIA SUSTAIN BB (formerly DNCA INVEST - GLOBAL ALPHA until January 25, 2021) - CLASS I SHARES EUR - DNCA INVEST - SRI NORDEN EUROPE (formerly DNCA INVEST - NORDEN EUROPE until February 8, 2021) - CLASS I SHARES EUR - DNCA INVEST - FLEX INFLATION - CLASS I SHARES EUR - DNCA INVEST - SUSTAINABLE CHINA EQUITY - CLASS I SHARES EUR
- DNCA INVEST - VALUE EUROPE¹ invests in:
- DNCA INVEST - ARCHER MID-CAP EUROPE - CLASS I SHARES EUR - DNCA INVEST - BEYOND INFRASTRUCTURE & TRANSITION¹ invests in:
- DNCA INVEST - BEYOND CLIMATE - CLASS I SHARES EUR
¹ For the period ended on June 30, 2021, no duplication of subscription or redemption fees exists in the Sub-Funds.
DNCA INVEST Notes to the Financial Statements as at June 30, 2021 (continued)
136
Note 9. Cross Sub-Funds investment (art. 181 of the amended Law of December 17, 2010) (continued) - DNCA INVEST - BEYOND GLOBAL LEADERS¹ invests in:
- DNCA INVEST - BEYOND SEMPEROSA - CLASS I SHARES EUR - DNCA INVEST - BEYOND CLIMATE - CLASS I SHARES EUR - DNCA INVEST - SUSTAINABLE CHINA EQUITY - CLASS I SHARES EUR
- DNCA INVEST - MIURI¹ invests in:
- DNCA INVEST - VENASQUO - CLASS I SHARES EUR - DNCA INVEST - SRI EUROPE GROWTH (formerly DNCA INVEST - EUROPE GROWTH until February 8, 2021)¹ invests in:
- DNCA INVEST - ARCHER MID-CAP EUROPE - CLASS I SHARES EUR - DNCA INVEST - SRI NORDEN EUROPE (formerly DNCA INVEST - NORDEN EUROPE until February 8, 2021) - CLASS I SHARES EUR
- DNCA INVEST - ALPHA BONDS¹ invests in:
- DNCA INVEST - LAFITENIA SUSTAIN BB (formerly DNCA INVEST - GLOBAL ALPHA until January 25, 2021) - CLASS I SHARES EUR - DNCA INVEST - BEYOND SEMPEROSA¹ invests in:
- DNCA INVEST - BEYOND ALTEROSA - CLASS I SHARES EUR - DNCA INVEST - BEYOND CLIMATE - CLASS I SHARES EUR
¹ For the period ended on June 30, 2021, no duplication of subscription or redemption fees exists in the Sub-Funds. As at June 30, 2021, the total amount of cross-investments was EUR 193,612,970.08 so that the combined Statement of Net Assets for the financial period closed on the same date but without considering said cross-investments would be equal to EUR 11,947,340,260.98. No management fees are applied on the underlying cross Sub-Fund investments. The market value of investment realised and unrealised amounts have not been eliminated in the combined Statement of Net Assets as at June 30, 2021 and in the combined Statement of Operations and Charges in net assets for the period then ended due to a technical limit. Note 10. Contracts for difference As at June 30, 2021, the following Sub-Funds held positions in Contracts for difference (CFDs): - DNCA INVEST - MIURI - DNCA INVEST - VENASQUO The following table provides an analysis by currency of the collateral, in relation to CFDs, as at June 30, 2021.
Sub-Fund Counterparties Currency of collateral Type of collateral Cash collateral DNCA INVEST - MIURI Société Générale EUR Cash 509,824.44 Morgan Stanley EUR Cash 1,220,000.00 DNCA INVEST - VENASQUO Société Générale EUR Cash 79,922.09 Morgan Stanley EUR Cash 30,000.00
Note 11. Futures contracts As at June 30, 2021, the following Sub-Funds held positions in Futures contracts: - DNCA INVEST - EUROSE - DNCA INVEST - EVOLUTIF - DNCA INVEST - VALUE EUROPE - DNCA INVEST - CONVERTIBLES - DNCA INVEST - MIURI - DNCA INVEST - SERENITE PLUS - DNCA INVEST - VENASQUO - DNCA INVEST - ALPHA BONDS - DNCA INVEST - FLEX INFLATION - DNCA INVEST - BEYOND ALTEROSA - DNCA INVEST - LAFITENIA SUSTAIN BB (formerly DNCA INVEST - GLOBAL ALPHA until January 25, 2021) The counterparty for all of these positions is BNP Paribas Paris.
DNCA INVEST Notes to the Financial Statements as at June 30, 2021 (continued)
137
Note 12. Options contracts As at June 30, 2021, the following Sub-Fund held positions in Options contracts: - DNCA INVEST - EVOLUTIF - DNCA INVEST - BEYOND GLOBAL LEADERS - DNCA INVEST - ALPHA BONDS - DNCA INVEST - FLEX INFLATION - DNCA INVEST - BEYOND ALTEROSA The counterparty for all of these positions is BNP Paribas Paris. Note 13. Dividend distribution The Board of Directors of the Fund has decided to approve during the period ended June 30, 2021, the distribution of dividend by DNCA INVEST as follows:
Note 14. Forward foreign exchange contracts As at June 30, 2021, DNCA INVEST - BEYOND EUROPEAN BOND OPPORTUNITIES held positions in forward foreign exchange contract. The counterparty for all of these positions is Société Générale and the Sub-Fund has not pledged any collateral.
As at June 30, 2021, DNCA INVEST - EUROSE held positions in forward foreign exchange contract. The counterparty for all of these positions is BNP Paribas Securities Services and the Sub-Fund has not pledged any collateral.
As at June 30, 2021, DNCA INVEST - VALUE EUROPE held positions in forward foreign exchange contract. The counterparty for all of these positions is BNP Paribas Securities Services and the Sub-Fund has not pledged any collateral.
As at June 30, 2021, DNCA INVEST - MIURI held positions in forward foreign exchange contract. The counterparty for all of these positions is BNP Paribas Securities Services and the Sub-Fund has not pledged any collateral.
As at June 30, 2021, DNCA INVEST - SRI EUROPE GROWTH (formerly DNCA INVEST - EUROPE GROWTH until February 8, 2021) held positions in forward foreign exchange contract. The counterparty for all of these positions is BNP Paribas Securities Services and the Sub-Fund has not pledged any collateral.
As at June 30, 2021, DNCA INVEST - ALPHA BONDS held positions in forward foreign exchange contract. The counterparties for all of these positions are BNP Paribas Securities Services, Bank of America Securities Europe SA, HSBC France, J.P. Morgan, Morgan Stanley, Goldman Sachs and Société Générale, and the Sub-Fund has not pledged any collateral. As at June 30, 2021, DNCA INVEST - FLEX INFLATION held positions in forward foreign exchange contract. The counterparties for all of these positions are BNP Paribas Securities Services, Bank of America Securities Europe SA, HSBC France, Morgan Stanley and Société Générale and the Sub-Fund has not pledged any collateral.
As at June 30, 2021, DNCA INVEST - BEYOND ALTEROSA held positions in forward foreign exchange contract. The counterparties for all of these positions are BNP Paribas Securities Services and Société Générale and the Sub-Fund has not pledged any collateral.
As at June 30, 2021, DNCA INVEST - LAFITENIA SUSTAIN BB (formerly DNCA INVEST - GLOBAL ALPHA until January 25, 2021) held positions in forward foreign exchange contract. The counterparties for all of these positions are BNP Paribas Securities Services and HSBC France and the Sub-Fund has not pledged any collateral.
Ex-date Sub-Fund Classes of Shares Dividend per Share in EUR
01/03/2021
DNCA INVEST - EUROSE Class AD Shares EUR 0.00 Class ID Shares EUR 0.00 Class ND Shares EUR 0.00
DNCA INVEST - EVOLUTIF Class AD Shares EUR 0.00 DNCA INVEST - SRI EUROPE GROWTH (formerly DNCA INVEST - EUROPE GROWTH until February 8, 2021)
Class AD Shares EUR 0.80 Class ID Shares EUR 0.00
DNCA INVEST - VALUE EUROPE Class AD Shares EUR 0.04 Class ID Shares EUR 0.48
DNCA INVEST - MIURI Class AD Shares EUR 0.00 DNCA INVEST - SRI NORDEN EUROPE (formerly DNCA INVEST - NORDEN EUROPE until February 8, 2021) Class ID Shares EUR 0.63
DNCA INVEST - SERENITE PLUS Class AD Shares EUR 0.21
DNCA INVEST - ALPHA BONDS Class AD Shares EUR 0.00 Class ND Shares EUR 0.22 Class ID Shares EUR 0.33
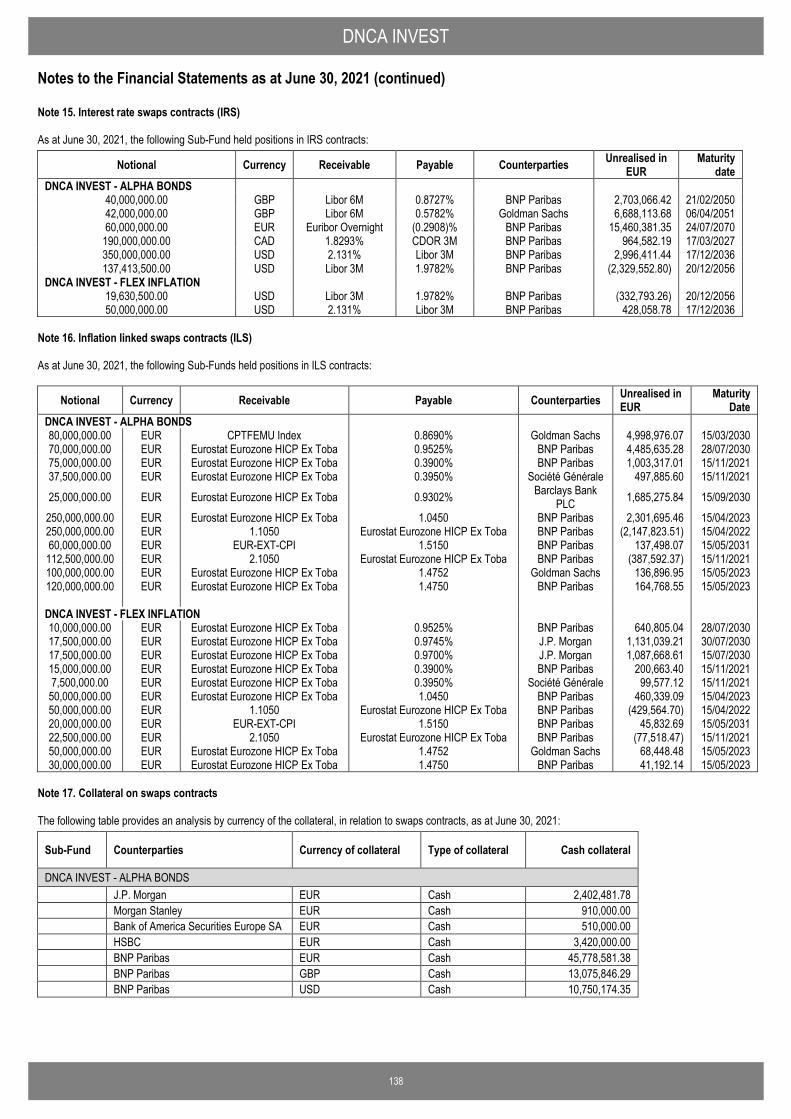
DNCA INVEST Notes to the Financial Statements as at June 30, 2021 (continued)
138
Note 15. Interest rate swaps contracts (IRS) As at June 30, 2021, the following Sub-Fund held positions in IRS contracts:
Notional Currency Receivable Payable Counterparties Unrealised in EUR
Maturity date
DNCA INVEST - ALPHA BONDS 40,000,000.00 GBP Libor 6M 0.8727% BNP Paribas 2,703,066.42 21/02/2050 42,000,000.00 GBP Libor 6M 0.5782% Goldman Sachs 6,688,113.68 06/04/2051 60,000,000.00 EUR Euribor Overnight (0.2908)% BNP Paribas 15,460,381.35 24/07/2070
190,000,000.00 CAD 1.8293% CDOR 3M BNP Paribas 964,582.19 17/03/2027 350,000,000.00 USD 2.131% Libor 3M BNP Paribas 2,996,411.44 17/12/2036 137,413,500.00 USD Libor 3M 1.9782% BNP Paribas (2,329,552.80) 20/12/2056
DNCA INVEST - FLEX INFLATION 19,630,500.00 USD Libor 3M 1.9782% BNP Paribas (332,793.26) 20/12/2056 50,000,000.00 USD 2.131% Libor 3M BNP Paribas 428,058.78 17/12/2036
Note 16. Inflation linked swaps contracts (ILS) As at June 30, 2021, the following Sub-Funds held positions in ILS contracts:
Notional Currency Receivable Payable Counterparties Unrealised in EUR
Maturity Date
DNCA INVEST - ALPHA BONDS 80,000,000.00 EUR CPTFEMU Index 0.8690% Goldman Sachs 4,998,976.07 15/03/2030 70,000,000.00 EUR Eurostat Eurozone HICP Ex Toba 0.9525% BNP Paribas 4,485,635.28 28/07/2030 75,000,000.00 EUR Eurostat Eurozone HICP Ex Toba 0.3900% BNP Paribas 1,003,317.01 15/11/2021 37,500,000.00 EUR Eurostat Eurozone HICP Ex Toba 0.3950% Société Générale 497,885.60 15/11/2021 25,000,000.00 EUR Eurostat Eurozone HICP Ex Toba 0.9302% Barclays Bank
PLC 1,685,275.84 15/09/2030 250,000,000.00 EUR Eurostat Eurozone HICP Ex Toba 1.0450 BNP Paribas 2,301,695.46 15/04/2023 250,000,000.00 EUR 1.1050 Eurostat Eurozone HICP Ex Toba BNP Paribas (2,147,823.51) 15/04/2022 60,000,000.00 EUR EUR-EXT-CPI 1.5150 BNP Paribas 137,498.07 15/05/2031 112,500,000.00 EUR 2.1050 Eurostat Eurozone HICP Ex Toba BNP Paribas (387,592.37) 15/11/2021 100,000,000.00 EUR Eurostat Eurozone HICP Ex Toba 1.4752 Goldman Sachs 136,896.95 15/05/2023 120,000,000.00 EUR Eurostat Eurozone HICP Ex Toba 1.4750 BNP Paribas 164,768.55 15/05/2023
DNCA INVEST - FLEX INFLATION 10,000,000.00 EUR Eurostat Eurozone HICP Ex Toba 0.9525% BNP Paribas 640,805.04 28/07/2030 17,500,000.00 EUR Eurostat Eurozone HICP Ex Toba 0.9745% J.P. Morgan 1,131,039.21 30/07/2030 17,500,000.00 EUR Eurostat Eurozone HICP Ex Toba 0.9700% J.P. Morgan 1,087,668.61 15/07/2030 15,000,000.00 EUR Eurostat Eurozone HICP Ex Toba 0.3900% BNP Paribas 200,663.40 15/11/2021 7,500,000.00 EUR Eurostat Eurozone HICP Ex Toba 0.3950% Société Générale 99,577.12 15/11/2021 50,000,000.00 EUR Eurostat Eurozone HICP Ex Toba 1.0450 BNP Paribas 460,339.09 15/04/2023 50,000,000.00 EUR 1.1050 Eurostat Eurozone HICP Ex Toba BNP Paribas (429,564.70) 15/04/2022 20,000,000.00 EUR EUR-EXT-CPI 1.5150 BNP Paribas 45,832.69 15/05/2031 22,500,000.00 EUR 2.1050 Eurostat Eurozone HICP Ex Toba BNP Paribas (77,518.47) 15/11/2021 50,000,000.00 EUR Eurostat Eurozone HICP Ex Toba 1.4752 Goldman Sachs 68,448.48 15/05/2023 30,000,000.00 EUR Eurostat Eurozone HICP Ex Toba 1.4750 BNP Paribas 41,192.14 15/05/2023
Note 17. Collateral on swaps contracts The following table provides an analysis by currency of the collateral, in relation to swaps contracts, as at June 30, 2021:
Sub-Fund Counterparties Currency of collateral Type of collateral Cash collateral
DNCA INVEST - ALPHA BONDS J.P. Morgan EUR Cash 2,402,481.78 Morgan Stanley EUR Cash 910,000.00 Bank of America Securities Europe SA EUR Cash 510,000.00 HSBC EUR Cash 3,420,000.00 BNP Paribas EUR Cash 45,778,581.38 BNP Paribas GBP Cash 13,075,846.29 BNP Paribas USD Cash 10,750,174.35
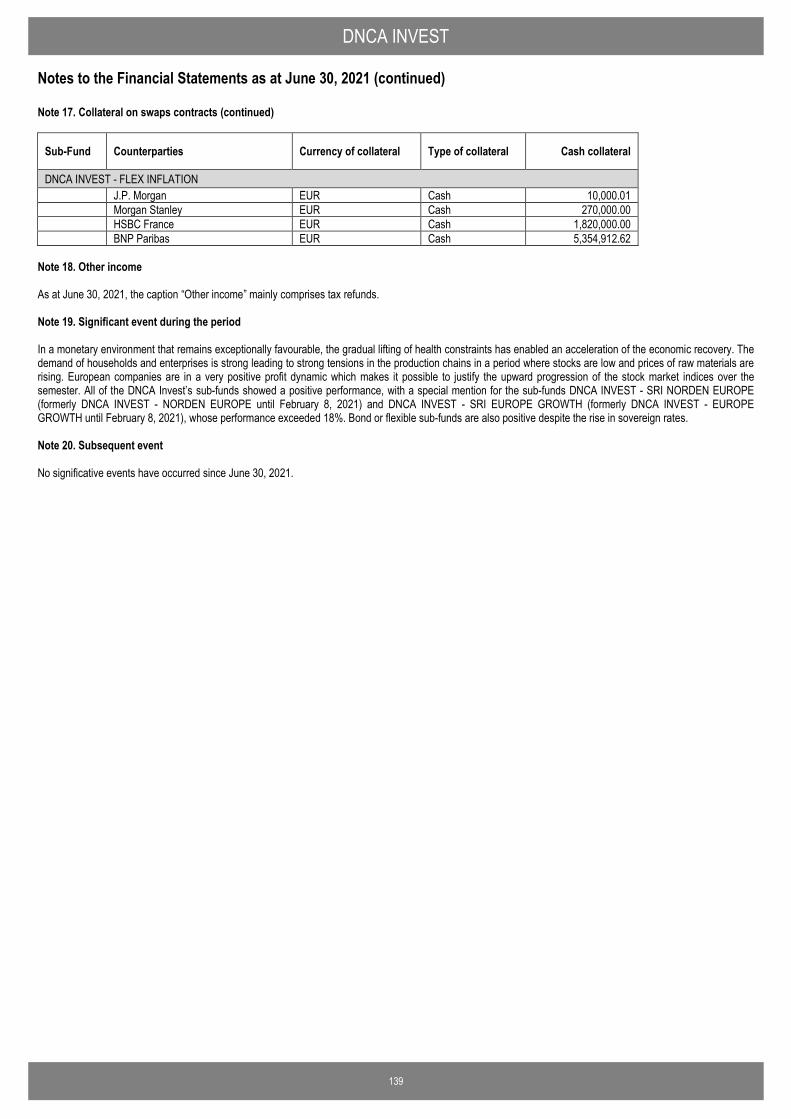
DNCA INVEST Notes to the Financial Statements as at June 30, 2021 (continued)
139
Note 17. Collateral on swaps contracts (continued)
Sub-Fund Counterparties Currency of collateral Type of collateral Cash collateral
DNCA INVEST - FLEX INFLATION J.P. Morgan EUR Cash 10,000.01 Morgan Stanley EUR Cash 270,000.00 HSBC France EUR Cash 1,820,000.00 BNP Paribas EUR Cash 5,354,912.62
Note 18. Other income As at June 30, 2021, the caption “Other income” mainly comprises tax refunds. Note 19. Significant event during the period In a monetary environment that remains exceptionally favourable, the gradual lifting of health constraints has enabled an acceleration of the economic recovery. The demand of households and enterprises is strong leading to strong tensions in the production chains in a period where stocks are low and prices of raw materials are rising. European companies are in a very positive profit dynamic which makes it possible to justify the upward progression of the stock market indices over the semester. All of the DNCA Invest’s sub-funds showed a positive performance, with a special mention for the sub-funds DNCA INVEST - SRI NORDEN EUROPE (formerly DNCA INVEST - NORDEN EUROPE until February 8, 2021) and DNCA INVEST - SRI EUROPE GROWTH (formerly DNCA INVEST - EUROPE GROWTH until February 8, 2021), whose performance exceeded 18%. Bond or flexible sub-funds are also positive despite the rise in sovereign rates. Note 20. Subsequent event No significative events have occurred since June 30, 2021.
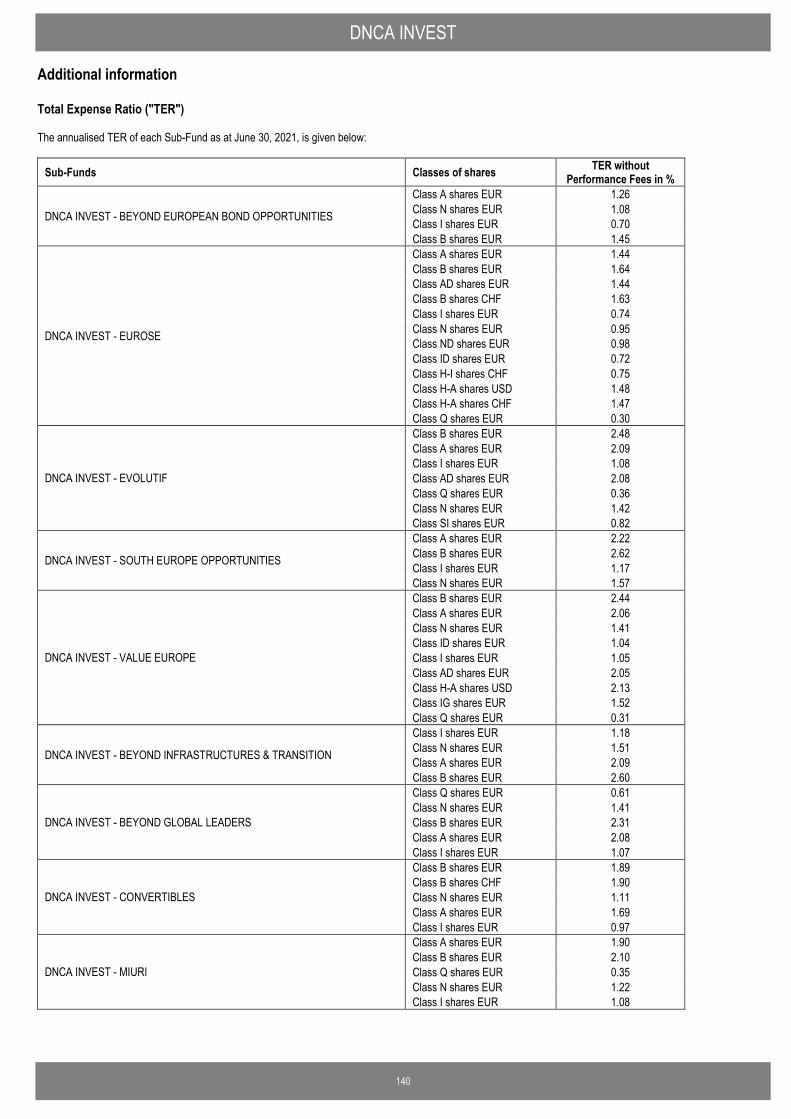
DNCA INVEST Additional information
140
Total Expense Ratio ("TER") The annualised TER of each Sub-Fund as at June 30, 2021, is given below:
Sub-Funds Classes of shares TER without Performance Fees in %
DNCA INVEST - BEYOND EUROPEAN BOND OPPORTUNITIES
Class A shares EUR 1.26 Class N shares EUR 1.08 Class I shares EUR 0.70 Class B shares EUR 1.45
DNCA INVEST - EUROSE
Class A shares EUR 1.44 Class B shares EUR 1.64 Class AD shares EUR 1.44 Class B shares CHF 1.63 Class I shares EUR 0.74 Class N shares EUR 0.95 Class ND shares EUR 0.98 Class ID shares EUR 0.72 Class H-I shares CHF 0.75 Class H-A shares USD 1.48 Class H-A shares CHF 1.47 Class Q shares EUR 0.30
DNCA INVEST - EVOLUTIF
Class B shares EUR 2.48 Class A shares EUR 2.09 Class I shares EUR 1.08 Class AD shares EUR 2.08 Class Q shares EUR 0.36 Class N shares EUR 1.42 Class SI shares EUR 0.82
DNCA INVEST - SOUTH EUROPE OPPORTUNITIES
Class A shares EUR 2.22 Class B shares EUR 2.62 Class I shares EUR 1.17 Class N shares EUR 1.57
DNCA INVEST - VALUE EUROPE
Class B shares EUR 2.44 Class A shares EUR 2.06 Class N shares EUR 1.41 Class ID shares EUR 1.04 Class I shares EUR 1.05 Class AD shares EUR 2.05 Class H-A shares USD 2.13 Class IG shares EUR 1.52 Class Q shares EUR 0.31
DNCA INVEST - BEYOND INFRASTRUCTURES & TRANSITION
Class I shares EUR 1.18 Class N shares EUR 1.51 Class A shares EUR 2.09 Class B shares EUR 2.60
DNCA INVEST - BEYOND GLOBAL LEADERS
Class Q shares EUR 0.61 Class N shares EUR 1.41 Class B shares EUR 2.31 Class A shares EUR 2.08 Class I shares EUR 1.07
DNCA INVEST - CONVERTIBLES
Class B shares EUR 1.89 Class B shares CHF 1.90 Class N shares EUR 1.11 Class A shares EUR 1.69 Class I shares EUR 0.97
DNCA INVEST - MIURI
Class A shares EUR 1.90 Class B shares EUR 2.10 Class Q shares EUR 0.35 Class N shares EUR 1.22 Class I shares EUR 1.08
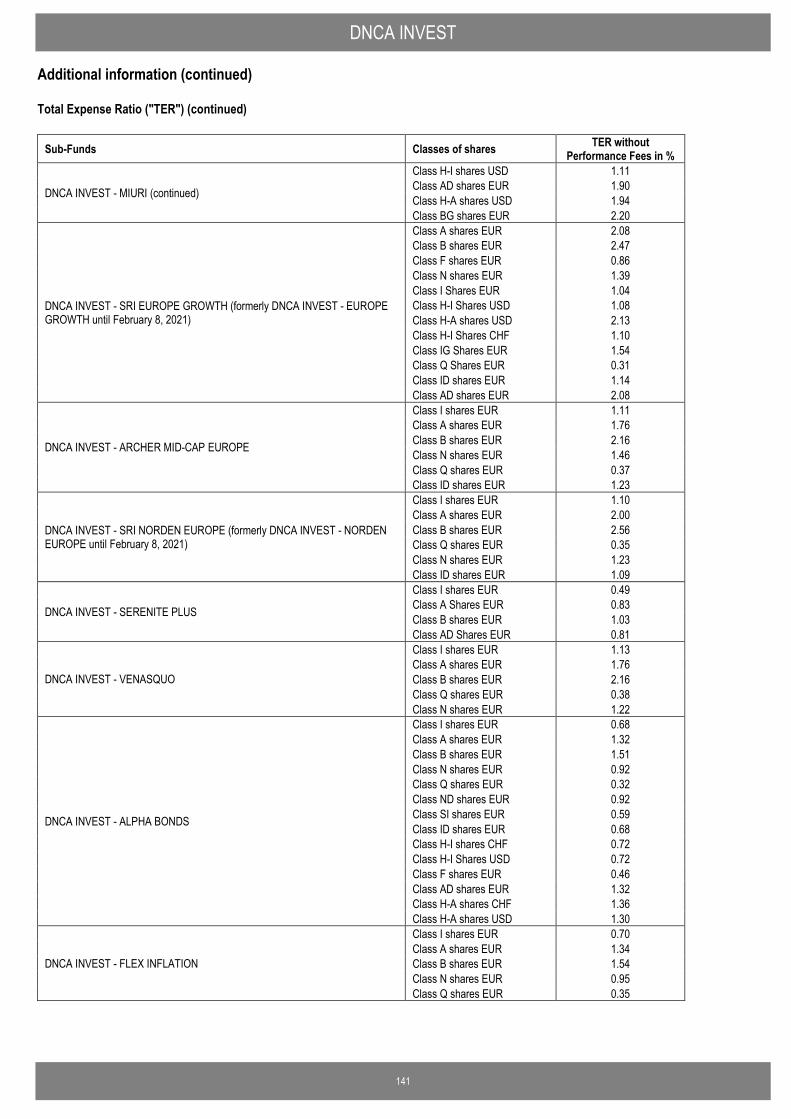
DNCA INVEST Additional information (continued)
141
Total Expense Ratio ("TER") (continued)
Sub-Funds Classes of shares TER without Performance Fees in %
DNCA INVEST - MIURI (continued)
Class H-I shares USD 1.11 Class AD shares EUR 1.90 Class H-A shares USD 1.94 Class BG shares EUR 2.20
DNCA INVEST - SRI EUROPE GROWTH (formerly DNCA INVEST - EUROPE GROWTH until February 8, 2021)
Class A shares EUR 2.08 Class B shares EUR 2.47 Class F shares EUR 0.86 Class N shares EUR 1.39 Class I Shares EUR 1.04 Class H-I Shares USD 1.08 Class H-A shares USD 2.13 Class H-I Shares CHF 1.10 Class IG Shares EUR 1.54 Class Q Shares EUR 0.31 Class ID shares EUR 1.14 Class AD shares EUR 2.08
DNCA INVEST - ARCHER MID-CAP EUROPE
Class I shares EUR 1.11 Class A shares EUR 1.76 Class B shares EUR 2.16 Class N shares EUR 1.46 Class Q shares EUR 0.37 Class ID shares EUR 1.23
DNCA INVEST - SRI NORDEN EUROPE (formerly DNCA INVEST - NORDEN EUROPE until February 8, 2021)
Class I shares EUR 1.10 Class A shares EUR 2.00 Class B shares EUR 2.56 Class Q shares EUR 0.35 Class N shares EUR 1.23 Class ID shares EUR 1.09
DNCA INVEST - SERENITE PLUS
Class I shares EUR 0.49 Class A Shares EUR 0.83 Class B shares EUR 1.03 Class AD Shares EUR 0.81
DNCA INVEST - VENASQUO
Class I shares EUR 1.13 Class A shares EUR 1.76 Class B shares EUR 2.16 Class Q shares EUR 0.38 Class N shares EUR 1.22
DNCA INVEST - ALPHA BONDS
Class I shares EUR 0.68 Class A shares EUR 1.32 Class B shares EUR 1.51 Class N shares EUR 0.92 Class Q shares EUR 0.32 Class ND shares EUR 0.92 Class SI shares EUR 0.59 Class ID shares EUR 0.68 Class H-I shares CHF 0.72 Class H-I Shares USD 0.72 Class F shares EUR 0.46 Class AD shares EUR 1.32 Class H-A shares CHF 1.36 Class H-A shares USD 1.30
DNCA INVEST - FLEX INFLATION
Class I shares EUR 0.70 Class A shares EUR 1.34 Class B shares EUR 1.54 Class N shares EUR 0.95 Class Q shares EUR 0.35
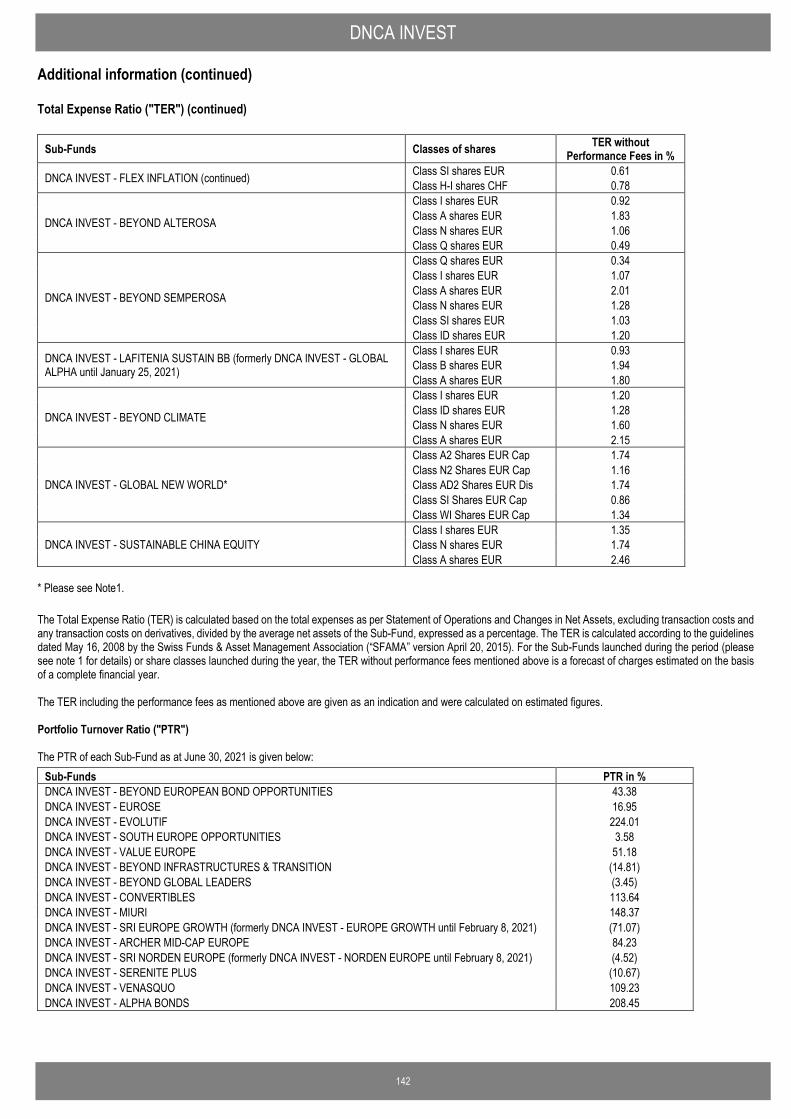
DNCA INVEST Additional information (continued)
142
Total Expense Ratio ("TER") (continued)
Sub-Funds Classes of shares TER without Performance Fees in %
DNCA INVEST - FLEX INFLATION (continued) Class SI shares EUR 0.61 Class H-I shares CHF 0.78
DNCA INVEST - BEYOND ALTEROSA
Class I shares EUR 0.92 Class A shares EUR 1.83 Class N shares EUR 1.06 Class Q shares EUR 0.49
DNCA INVEST - BEYOND SEMPEROSA
Class Q shares EUR 0.34 Class I shares EUR 1.07 Class A shares EUR 2.01 Class N shares EUR 1.28 Class SI shares EUR 1.03 Class ID shares EUR 1.20
DNCA INVEST - LAFITENIA SUSTAIN BB (formerly DNCA INVEST - GLOBAL ALPHA until January 25, 2021)
Class I shares EUR 0.93 Class B shares EUR 1.94 Class A shares EUR 1.80
DNCA INVEST - BEYOND CLIMATE
Class I shares EUR 1.20 Class ID shares EUR 1.28 Class N shares EUR 1.60 Class A shares EUR 2.15
DNCA INVEST - GLOBAL NEW WORLD*
Class A2 Shares EUR Cap 1.74 Class N2 Shares EUR Cap 1.16 Class AD2 Shares EUR Dis 1.74 Class SI Shares EUR Cap 0.86 Class WI Shares EUR Cap 1.34
DNCA INVEST - SUSTAINABLE CHINA EQUITY Class I shares EUR 1.35 Class N shares EUR 1.74 Class A shares EUR 2.46
* Please see Note1. The Total Expense Ratio (TER) is calculated based on the total expenses as per Statement of Operations and Changes in Net Assets, excluding transaction costs and any transaction costs on derivatives, divided by the average net assets of the Sub-Fund, expressed as a percentage. The TER is calculated according to the guidelines dated May 16, 2008 by the Swiss Funds & Asset Management Association (“SFAMA” version April 20, 2015). For the Sub-Funds launched during the period (please see note 1 for details) or share classes launched during the year, the TER without performance fees mentioned above is a forecast of charges estimated on the basis of a complete financial year. The TER including the performance fees as mentioned above are given as an indication and were calculated on estimated figures. Portfolio Turnover Ratio ("PTR") The PTR of each Sub-Fund as at June 30, 2021 is given below:
Sub-Funds PTR in % DNCA INVEST - BEYOND EUROPEAN BOND OPPORTUNITIES 43.38 DNCA INVEST - EUROSE 16.95 DNCA INVEST - EVOLUTIF 224.01 DNCA INVEST - SOUTH EUROPE OPPORTUNITIES 3.58 DNCA INVEST - VALUE EUROPE 51.18 DNCA INVEST - BEYOND INFRASTRUCTURES & TRANSITION (14.81) DNCA INVEST - BEYOND GLOBAL LEADERS (3.45) DNCA INVEST - CONVERTIBLES 113.64 DNCA INVEST - MIURI 148.37 DNCA INVEST - SRI EUROPE GROWTH (formerly DNCA INVEST - EUROPE GROWTH until February 8, 2021) (71.07) DNCA INVEST - ARCHER MID-CAP EUROPE 84.23 DNCA INVEST - SRI NORDEN EUROPE (formerly DNCA INVEST - NORDEN EUROPE until February 8, 2021) (4.52) DNCA INVEST - SERENITE PLUS (10.67) DNCA INVEST - VENASQUO 109.23 DNCA INVEST - ALPHA BONDS 208.45
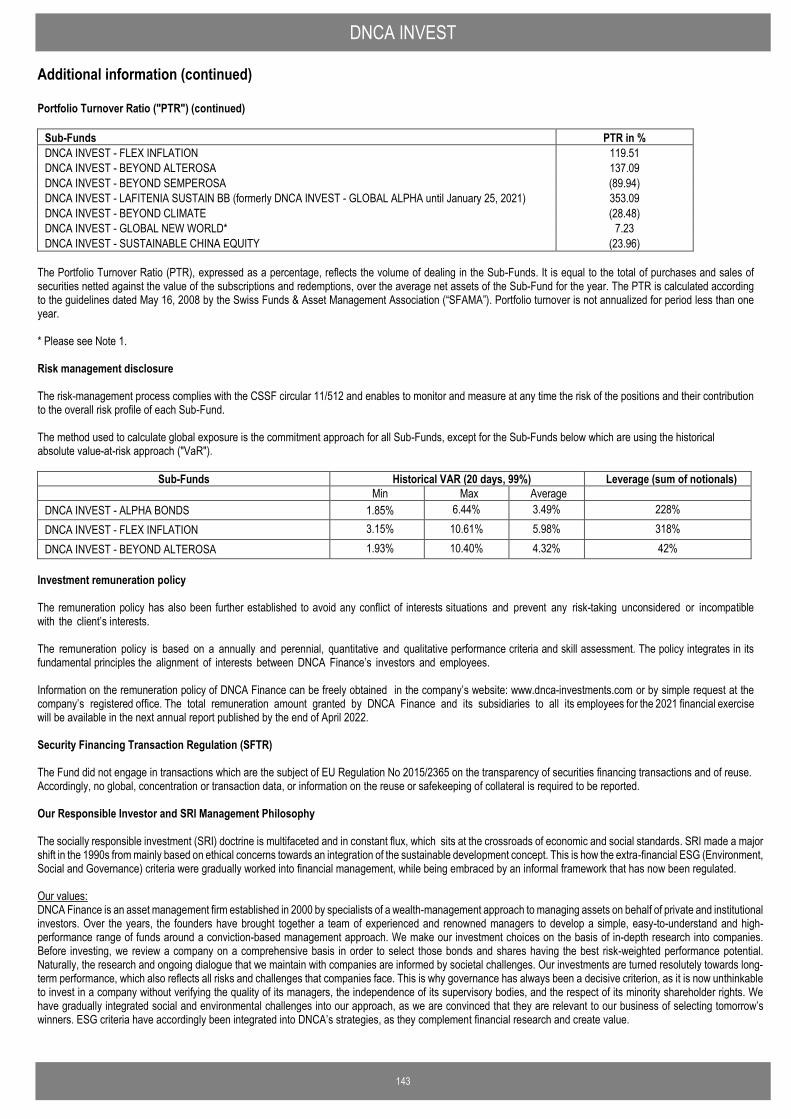
DNCA INVEST Additional information (continued)
143
Portfolio Turnover Ratio ("PTR") (continued)
Sub-Funds PTR in % DNCA INVEST - FLEX INFLATION 119.51 DNCA INVEST - BEYOND ALTEROSA 137.09 DNCA INVEST - BEYOND SEMPEROSA (89.94) DNCA INVEST - LAFITENIA SUSTAIN BB (formerly DNCA INVEST - GLOBAL ALPHA until January 25, 2021) 353.09 DNCA INVEST - BEYOND CLIMATE (28.48) DNCA INVEST - GLOBAL NEW WORLD* 7.23 DNCA INVEST - SUSTAINABLE CHINA EQUITY (23.96)
The Portfolio Turnover Ratio (PTR), expressed as a percentage, reflects the volume of dealing in the Sub-Funds. It is equal to the total of purchases and sales of securities netted against the value of the subscriptions and redemptions, over the average net assets of the Sub-Fund for the year. The PTR is calculated according to the guidelines dated May 16, 2008 by the Swiss Funds & Asset Management Association (“SFAMA”). Portfolio turnover is not annualized for period less than one year. * Please see Note 1. Risk management disclosure The risk-management process complies with the CSSF circular 11/512 and enables to monitor and measure at any time the risk of the positions and their contribution to the overall risk profile of each Sub-Fund. The method used to calculate global exposure is the commitment approach for all Sub-Funds, except for the Sub-Funds below which are using the historical absolute value-at-risk approach ("VaR").
Sub-Funds Historical VAR (20 days, 99%) Leverage (sum of notionals) Min Max Average DNCA INVEST - ALPHA BONDS 1.85% 6.44% 3.49% 228% DNCA INVEST - FLEX INFLATION 3.15% 10.61% 5.98% 318% DNCA INVEST - BEYOND ALTEROSA 1.93% 10.40% 4.32% 42%
Investment remuneration policy The remuneration policy has also been further established to avoid any conflict of interests situations and prevent any risk-taking unconsidered or incompatible with the client’s interests. The remuneration policy is based on a annually and perennial, quantitative and qualitative performance criteria and skill assessment. The policy integrates in its fundamental principles the alignment of interests between DNCA Finance’s investors and employees. Information on the remuneration policy of DNCA Finance can be freely obtained in the company’s website: www.dnca-investments.com or by simple request at the company’s registered office. The total remuneration amount granted by DNCA Finance and its subsidiaries to all its employees for the 2021 financial exercise will be available in the next annual report published by the end of April 2022.
Security Financing Transaction Regulation (SFTR) The Fund did not engage in transactions which are the subject of EU Regulation No 2015/2365 on the transparency of securities financing transactions and of reuse. Accordingly, no global, concentration or transaction data, or information on the reuse or safekeeping of collateral is required to be reported. Our Responsible Investor and SRI Management Philosophy The socially responsible investment (SRI) doctrine is multifaceted and in constant flux, which sits at the crossroads of economic and social standards. SRI made a major shift in the 1990s from mainly based on ethical concerns towards an integration of the sustainable development concept. This is how the extra-financial ESG (Environment, Social and Governance) criteria were gradually worked into financial management, while being embraced by an informal framework that has now been regulated. Our values: DNCA Finance is an asset management firm established in 2000 by specialists of a wealth-management approach to managing assets on behalf of private and institutional investors. Over the years, the founders have brought together a team of experienced and renowned managers to develop a simple, easy-to-understand and high-performance range of funds around a conviction-based management approach. We make our investment choices on the basis of in-depth research into companies. Before investing, we review a company on a comprehensive basis in order to select those bonds and shares having the best risk-weighted performance potential. Naturally, the research and ongoing dialogue that we maintain with companies are informed by societal challenges. Our investments are turned resolutely towards long-term performance, which also reflects all risks and challenges that companies face. This is why governance has always been a decisive criterion, as it is now unthinkable to invest in a company without verifying the quality of its managers, the independence of its supervisory bodies, and the respect of its minority shareholder rights. We have gradually integrated social and environmental challenges into our approach, as we are convinced that they are relevant to our business of selecting tomorrow’s winners. ESG criteria have accordingly been integrated into DNCA’s strategies, as they complement financial research and create value.
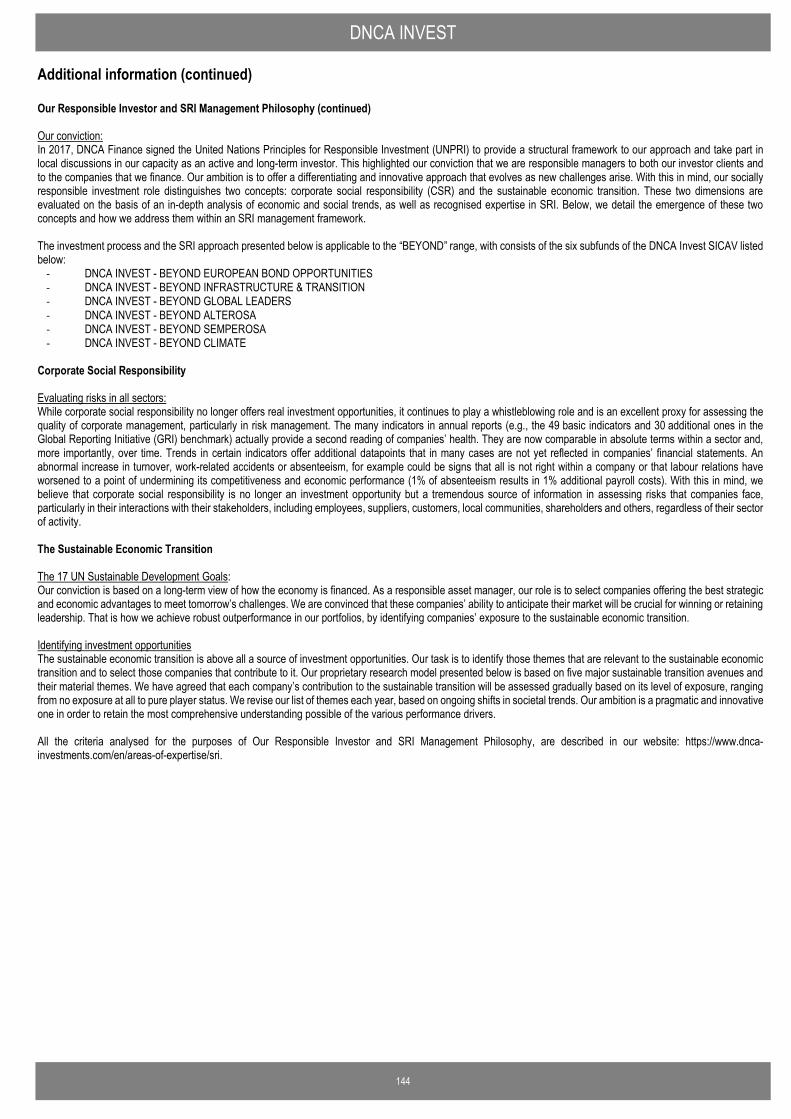
DNCA INVEST Additional information (continued)
144
Our Responsible Investor and SRI Management Philosophy (continued) Our conviction: In 2017, DNCA Finance signed the United Nations Principles for Responsible Investment (UNPRI) to provide a structural framework to our approach and take part in local discussions in our capacity as an active and long-term investor. This highlighted our conviction that we are responsible managers to both our investor clients and to the companies that we finance. Our ambition is to offer a differentiating and innovative approach that evolves as new challenges arise. With this in mind, our socially responsible investment role distinguishes two concepts: corporate social responsibility (CSR) and the sustainable economic transition. These two dimensions are evaluated on the basis of an in-depth analysis of economic and social trends, as well as recognised expertise in SRI. Below, we detail the emergence of these two concepts and how we address them within an SRI management framework. The investment process and the SRI approach presented below is applicable to the “BEYOND” range, with consists of the six subfunds of the DNCA Invest SICAV listed below:
- DNCA INVEST - BEYOND EUROPEAN BOND OPPORTUNITIES - DNCA INVEST - BEYOND INFRASTRUCTURE & TRANSITION - DNCA INVEST - BEYOND GLOBAL LEADERS - DNCA INVEST - BEYOND ALTEROSA - DNCA INVEST - BEYOND SEMPEROSA - DNCA INVEST - BEYOND CLIMATE
Corporate Social Responsibility Evaluating risks in all sectors: While corporate social responsibility no longer offers real investment opportunities, it continues to play a whistleblowing role and is an excellent proxy for assessing the quality of corporate management, particularly in risk management. The many indicators in annual reports (e.g., the 49 basic indicators and 30 additional ones in the Global Reporting Initiative (GRI) benchmark) actually provide a second reading of companies’ health. They are now comparable in absolute terms within a sector and, more importantly, over time. Trends in certain indicators offer additional datapoints that in many cases are not yet reflected in companies’ financial statements. An abnormal increase in turnover, work-related accidents or absenteeism, for example could be signs that all is not right within a company or that labour relations have worsened to a point of undermining its competitiveness and economic performance (1% of absenteeism results in 1% additional payroll costs). With this in mind, we believe that corporate social responsibility is no longer an investment opportunity but a tremendous source of information in assessing risks that companies face, particularly in their interactions with their stakeholders, including employees, suppliers, customers, local communities, shareholders and others, regardless of their sector of activity. The Sustainable Economic Transition The 17 UN Sustainable Development Goals: Our conviction is based on a long-term view of how the economy is financed. As a responsible asset manager, our role is to select companies offering the best strategic and economic advantages to meet tomorrow’s challenges. We are convinced that these companies’ ability to anticipate their market will be crucial for winning or retaining leadership. That is how we achieve robust outperformance in our portfolios, by identifying companies’ exposure to the sustainable economic transition. Identifying investment opportunities The sustainable economic transition is above all a source of investment opportunities. Our task is to identify those themes that are relevant to the sustainable economic transition and to select those companies that contribute to it. Our proprietary research model presented below is based on five major sustainable transition avenues and their material themes. We have agreed that each company’s contribution to the sustainable transition will be assessed gradually based on its level of exposure, ranging from no exposure at all to pure player status. We revise our list of themes each year, based on ongoing shifts in societal trends. Our ambition is a pragmatic and innovative one in order to retain the most comprehensive understanding possible of the various performance drivers. All the criteria analysed for the purposes of Our Responsible Investor and SRI Management Philosophy, are described in our website: https://www.dnca-investments.com/en/areas-of-expertise/sri.

Related Documents