‘ ö DNA NANOTECHNOLOGY: Building and characterizing DNA-constructs for mechano-chemical studies of single DNA-ligand interaction Master of Science Thesis Hamed Heydarian Department of Chemical and Biological Engineering Division of Chemistry and Biochemistry, Physical Chemistry CHALMERS UNIVERSITY OF TECHNOLOGY Göteborg, Sweden, 2012

Welcome message from author
This document is posted to help you gain knowledge. Please leave a comment to let me know what you think about it! Share it to your friends and learn new things together.
Transcript

‘
ö
DNA NANOTECHNOLOGY:
Building and characterizing DNA-constructs for
mechano-chemical studies of single
DNA-ligand interaction
Master of Science Thesis
Hamed Heydarian
Department of Chemical and Biological Engineering Division of Chemistry and Biochemistry, Physical Chemistry
CHALMERS UNIVERSITY OF TECHNOLOGY Göteborg, Sweden, 2012

I
THESIS FOR THE DEGREE OF MASTER OF SCIENCE
DNA nanotechnology: Building and characterizing DNA-constructs for mechano-
chemical studies of single DNA-ligand interaction
HAMED HEYDARIAN
Department of Chemical and Biological Engineering CHALMERS UNIVERSITY OF TECHNOLOGY
Göteborg, Sweden 2012
II
DNA nanotechnology: Building and characterizing DNA-constructs for mechano-chemical studies of single DNA-ligand interaction Hamed Heydarian © Hamed Heydarian, 2012
Department of Chemical and Biological Engineering Chalmers University of Technology SE-41296 Göteborg Sweden Telephone +46 (0) 31 772 1000
Cover picture:
The general scheme of this project, starting from hybridization of two single-stranded oligonucleotides into double-stranded duplexes, enzyme ligation with T4 ligase and finally assembling of concatemers on gold surface by QCM-D
Department of Chemical and Biological Engineering Göteborg, Sweden 2012

III
To my family …
"Any man who knows all the answers most likely misunderstood the questions"
(Nancy Willard)
IV
DNA nanotechnology: Building and characterizing DNA-constructs for mechanochemical studies of single DNA-ligand interaction Hamed Heydarian
Department of Chemical and Biological Engineering Chalmers University of Technology
ABSTRACT
Self-assembly of oligonucleotides with designed sequence, is very valuable method
for building fairy long linear DNA constructs. Studies of sequence-specific
interaction between different ligands and single DNA molecules are becoming
increasingly important. An approach toward this end is assembling DNA molecules
by oligonucleotides hybridization in solution. In this project we attempted to
construct double strand DNA concatemer (>500 base pairs) from two specific
sequence- designed 50bp oligonucleotides by hybridization and ligation. Due to
complementary base pairing process, two single stranded oligos can spontaneously
attach together and form long comcatemeric dsDNA molecules. Various incubation
conditions such as oligos concentration, heating and hybridization time, salt and
PEG concentration were checked to optimize the building of longer DNA constructs.
Also enzyme ligation was performed successfully to join the nicks in the
concatemers. Gel electrophoresis was employed to verify size and shape distribution
of formed constructs. For obtaining linear constructs and avoiding circular DNA
formation, step-wise adding of oligonucleotides on solid surface was done using
QCM-D technique. With this method, linear DNA constructs up to hundred base
pairs were formed reasonably and can be used as a helpful tool for single-DNA
molecule studies.
Keywords: DNA, Hybridization, Ligation, Gel Electrophoresis, Oligonucleotides, QCM-D
V
List of Abbreviations
A Adenine
APS Ammonium Persulfate
ATP Adenosine Tri-Phosphate
BIS N, N´-methylene-bisacrylamide
bp base pair(s)
C Cytosine
DNA DeoxyriboNucleic Acid
dsDNA Double-strand DNA
EDTA Ethylene Diamine Tetraacetic Acid
EEO Electroendosmosis
EtOH Ethanol
G Guanine
GE Gel Electrophoresis
IEF Isoelectric Focusing
MBE Moving Boundry Electrophoresis
mw Molecular weight
OD Optical Density
PAAG PolyAcrylAmide Gel
PAGE PolyAcrylamide Gel Electrophoresis
PBS Phosphate buffered saline
PCR Polymerase Chain Reaction
PEG PolyEthylene Glycol
PFGE Pulsed-Field Gel Electrophoresis
PNK PolyNucleotide Kinase
RNA Ribo-Nucleic Acid
RT Room temperature
SDS Sodium Dodecyl Sulfate
ssDNA Single- strand DNA
T Thymine
TBE Tris-borate-EDTA buffer
TEMED N,N,N',N'-Tetramethylethylenediamine
Tm Melting temperature of DNA
QCM-D Quartz Crystal Microbalance with Dissipation
ZE Zone Electrophoresis

VI
Table of Contents
ABSTRACT ................................................................................................ IV
List of Abbreviations ................................................................................... V
1 Introduction ............................................................................................. 1
2 Theory ...................................................................................................... 3
2.1 DNA ................................................................................................................................... 3
2.1.1 DNA Nanotechnology ................................................................................................. 4 2.1.2 DNA Hybridization ...................................................................................................... 5 2.1.3 DNA Ligation .................................................................................................................7
2.2 OLIGONUCLEOTIDE .......................................................................................................... 7
2.3 ELECTROPHORETIC TECHNIQUES .................................................................................. 8
2.3.1 Fundamental Principles .............................................................................................. 8 2.3.2 Short History of Different Electrophoretic Methods ................................................10 2.3.3 Support media ............................................................................................................. 11 2.3.4 Agarose gels ................................................................................................................. 12 2.3.5 Polyacrylamide gels .................................................................................................... 13
2.3.5.1 Denaturing PAGE ......................................................................................................................................... 14 2.3.5.2 Native PAGE .................................................................................................................................................. 15
2.4 QCM-D ............................................................................................................................ 16
2.4.1 The QCM-D principle .................................................................................................. 16 2.4.2 History of QCM............................................................................................................ 16 2.4.3 Dissipation ................................................................................................................... 17 2.4.4 Applications in Bio- science ........................................................................................ 17
3 Materials and Methods ........................................................................ 20
3.1 PBS .................................................................................................................................. 20
3.2 OLIGONUCLEOTIDES ...................................................................................................... 21
3.2.1 Hybridization of the oligonucleotides ...................................................................... 21
3.3 ENZYMES ......................................................................................................................... 22
3.3.1 T4 DNA Ligase ......................................................................................................... 22 3.3.2 T4 Polynucleotide Kinase ........................................................................................ 22 3.3.3 Ligation of the concatemers .................................................................................... 22
3.4 BUFFER SYSTEM .............................................................................................................. 23
3.4.1 TBE buffer ................................................................................................................ 24
3.5 SALTS ............................................................................................................................... 24
3.5.1 NaCl .......................................................................................................................... 24 3.5.2 PEG ........................................................................................................................... 24
3.6 INSTRUMENTATION ........................................................................................................ 25
3.6.1 Agarose gel electrophoresis ..................................................................................... 25 3.6.2 Pulsed-Field gel electrophoresis ( PFGE) .............................................................. 26 3.6.3 Polyacrylamide gel electrophoresis ......................................................................... 26 3.6.4 Denaturing PAGE .................................................................................................... 26

VII
3.6.5 Native PAGE ............................................................................................................. 28 3.6.6 QCM-D ...................................................................................................................... 28
4. Results & Discussion ............................................................................. 30
4.1 AGAROSE GEL ELECTROPHORESIS ................................................................................ 30
4.1.1 Different heating times ............................................................................................. 30 4.1.2 Different hybridization times .................................................................................... 31 4.1.3 Different hybridization temperatures ..................................................................... 32 4.1.4 Different oligo concentrations .................................................................................. 33 4.1.5 Different PEG concentrations .................................................................................. 34 4.1.6 Different salt concentrations .................................................................................... 35
4.2 POLYACRYLAMIDE ELECTROPHORESIS......................................................................... 36
4.2.1 Native PAGE ............................................................................................................. 36
4.3 SIZE DISTRIBUTION AND INTENSITY ANALYSIS ........................................................... 39
4.4 QCM-D ............................................................................................................................ 44
5. Conclusion .............................................................................................. 46
6. Perspectives ............................................................................................ 47
7. Acknowledgments .................................................................................. 49
8. References .............................................................................................. 50
9. Appendix ................................................................................................. 54
9.1 REAGENTS & CHEMICALS .............................................................................................. 54
9.2 INSTRUMENTS ................................................................................................................. 55
9.3 AGAROSE GEL ELECTROPHORESIS RESULTS ................................................................ 56
9.4 POLYACRILAMIDE GEL ELECTROPHORESIS RESULTS.................................................. 59

VIII
TABLE OF FIGURES
FIGURE. 1 CENTRAL DOGMA OF LIFE FROM DNA TO PROTEIN ............................................................................. 3 FIGURE. 2 THE DNA DOUBLE HELIX STRUCTURE ................................................................................................. 4 FIGURE. 3 BASE-PAIRING IN DNA MOLECULE ........................................................................................................ 4 FIGURE. 4 MECHANISM OF HYBRIDIZATION............................................................................................................ 6 FIGURE. 5 SIMPLE SCHEMATIC OF DNA LIGATION REACTIONS. ........................................................................... 7 FIGURE. 6 MIGRATION OF CHARGED IONS DURING ELECTROPHORESIS .............................................................. 8 FIGURE. 7 THE GEL ELECTROPHORESIS OF SAMPLES HAVING IDENTICAL CHARGE TO MASS RATIOS
RESULTS IN FRACTIONATION BY SIZE .............................................................................................................. 9 FIGURE. 8 ARNE WILHELM KAURIN TISELIUS (1902 –1971) .............................................................................. 10 FIGURE. 9 CHEMICAL STRUCTURE OF STARCH...................................................................................................... 11 FIGURE. 10 AGAROBIOSE ......................................................................................................................................... 12 FIGURE. 11 THE POLYMERIZATION OF POLYACRYLAMIDE GEL FROM ACRYLAMIDE AND BIS-ACRYLAMIDE ... 13 FIGURE. 12 ELECTROPHORETIC MOBILITY VERSUS MOLECULAR WEIGHT ........................................................ 15 FIGURE. 13 SCHEME OF DNA-DUPLEX FORMATION ............................................................................................. 21 FIGURE. 14 SCHEME OF LIGATION PROCESS BY T4 LIGASE ................................................................................. 23 FIGURE. 15 COMPONENTS OF AGAROSE GEL ELECTROPHORESIS ...................................................................... 25 FIGURE. 16 COMPONENTS OF POLYACRILAMIDE GEL ELECTROPHORESIS ........................................................ 27 FIGURE.17 SCHEMATIC VIEW OF ASSEMBLING DNA STRAND ON QUARTZ SURFACE ...................................... 29 FIGURE. 18. 2.5% AGAROSE ELECTROPHORESIS, DIFFERENT HEATING TIMES ............................................... 31 FIGURE. 19. 2.5% AGAROSE ELECTROPHORESIS, DIFFERENT HYBRIDIZATION TIMES. .................................. 32 FIGURE. 20. 2.5% AGAROSE ELECTROPHORESIS, DIFFERENT HYBRIDIZATION TEMPERATURES .................. 33 FIGURE. 21. 2.5% AGAROSE ELECTROPHORESIS, DIFFERENT OLIGO CONCENTRATIONS .............................. 34 FIGURE. 22 . 2.5% AGAROSE ELECTROPHORESIS, DIFFERENT PEG CONCENTRATIONS ................................. 35 FIGURE. 23. 2.5% AGAROSE ELECTROPHORESIS, DIFFERENT NACL CONCENTRATIONS ............................... 36 FIGURE. 24. 5% NATIVE POLYACRYLAMIDE ELECTROPHORESIS ....................................................................... 37 FIGURE. 25. 5% UREA-DENATURING POLYACRYLAMIDE ELECTROPHORESIS .................................................. 38 FIGURE. 26. SIZE DISTRIBUTION OF DIFFERENT OLIGO CONCENTARTIONS ..................................................... 40 FIGURE. 27. SIZE DISTRIBUTION AND INTENSITY ANALYSIS OF FIG.26 ............................................................ 40 FIGURE. 28. SIZE DISTRIBUTION OF DIFFERENT HYBRIDIZATION TIMES .......................................................... 41 FIGURE. 29. SIZE DISTRIBUTION AND INTENSITY ANALYSIS OF FIG.28 ............................................................ 41 FIGURE. 30. SIZE DISTRIBUTION OF DIFFERENT HYBRIDIZATION TEMPERATURES......................................... 42 FIGURE. 31. SIZE DISTRIBUTION AND INTENSITY ANALYSIS OF FIG.30 ............................................................ 42 FIGURE. 32. SIZE DISTRIBUTION OF DIFFERENT SALT CONCENTRAIONS ......................................................... 43 FIGURE. 33. SIZE DISTRIBUTION AND INTENSITY ANALYSIS OF FIG.32 ............................................................ 43 FIGURE. 34. QCM-D DATA ...................................................................................................................................... 44

1. Introduction
_____________________________________
1
1 Introduction
Today nucleic acids play very important role in cellular processes such as cell
division (DNA replication) and protein synthesis (transcription and translation).
Also as healthy and cancer cells, both are influenced by these processes, nucleic
acids are excellent targets for anti-cancer drugs (Palchaudhuri & J Hergenrother,
2007).
DNA nanotechnology involves the design and manufacture of novel constructions
with specific geometrical and topological properties (Seeman, 1998).
DNA is a unique structural element for nanotechnology, since it is the building
block of living cells with the highest information content and its self-assembly,
interactions and biological functions is most predictable compared to other types of
biomolecules (Gothelf & H. LaBean, 2005).
The sequence-specific interaction of different ligands with DNA is very
interested field because of huge potential applications in biophysics and medical
chemistry, the design of medicines that can site-specifically bind to DNA is an
important pharmacological task, for example, the therapeutic activity of most of the
currently used antitumor drugs depends on the potency and selectivity of their
interaction with DNA, for instance DNA-intercalating ligands as anti-cancer drugs
has developed significantly (Denny, 1989). Over the past thirty years many small
molecules have been discovered that bind to DNA in a sequence selective fashion,
several of these are used as therapeutic agents for treating cancer and other
diseases.
Recently new techniques have been developed to study the behavior of individual
DNA molecule during DNA-ligand binding reaction. Techniques are used for
analysis of sequence-specific ddDNA-ligand interaction have developed widely
today, for instance by means of fluorescent intercalator probes (Kirschstein, Sip, &
Kittler, 2000), but this is the first time that, interaction of DNA-ligand binding at
the single DNA level is investigated. The initial purpose is, to construct long linear
dsDNA molecules (ca. 500bp in length) by self-assembly of single-stranded
oligonucleotides.

1. Introduction
_____________________________________
2
Since building such DNA-constructs with desired length is not easy from
scratching, our suggestion is to hybridize them by utilizing two 50-mer pre-designed
sequenced single strand oligonucleotides, which could be done in a process by which
half-slide complementary oligunocleotide pairs spontaneously assemble into some
long concatemeric structures. According to Simonva et al report (Simonova,
Vladimirova, Zenkova, & Vlassov, 2006) 24 and 25-mer antisense oligonucleotides
have been designed for assembling into concatemeric complexes which are used for
increasing cellular binding efficiency. As mentioned in this report the ability of such
concatemeric structures gets better by increasing length and concentration.
Synthesized oligonucleotides with pre-specific designed sequence are simple and
useful materials for self assembly procedure. By varying incubating conditions such
as hybridization time, oligonucleotide concentration and salt concentrations, a much
optimized method for formation of long DNA concatemers can be achieved.
Agarose gel electrophoresis is the main method to verify the size distribution of
constructs and polyacrylamide gel electrophoresis can separate constructs in shape
difference. By attaching oligonucleotides onto a solid surface, complimentary
oligonucleotides will add to achieve step-wise building of DNA concatemers, QCM-D
and SPR can be used for this purpose.
2. Theory
_____________________________________
3
2 Theory This chapter explains the theoretical background of the various compounds,
materials and techniques used in this project.
2.1 DNA
"DNA is more than just the secret of life – it is also a versatile component for making
nanoscopic structures and devices"
(Nadrian C. Seeman)
DNA has been recognized as the genetic material of living organisms for more
than 60 years. As it was proposed by Crick it is central dogma of life and building
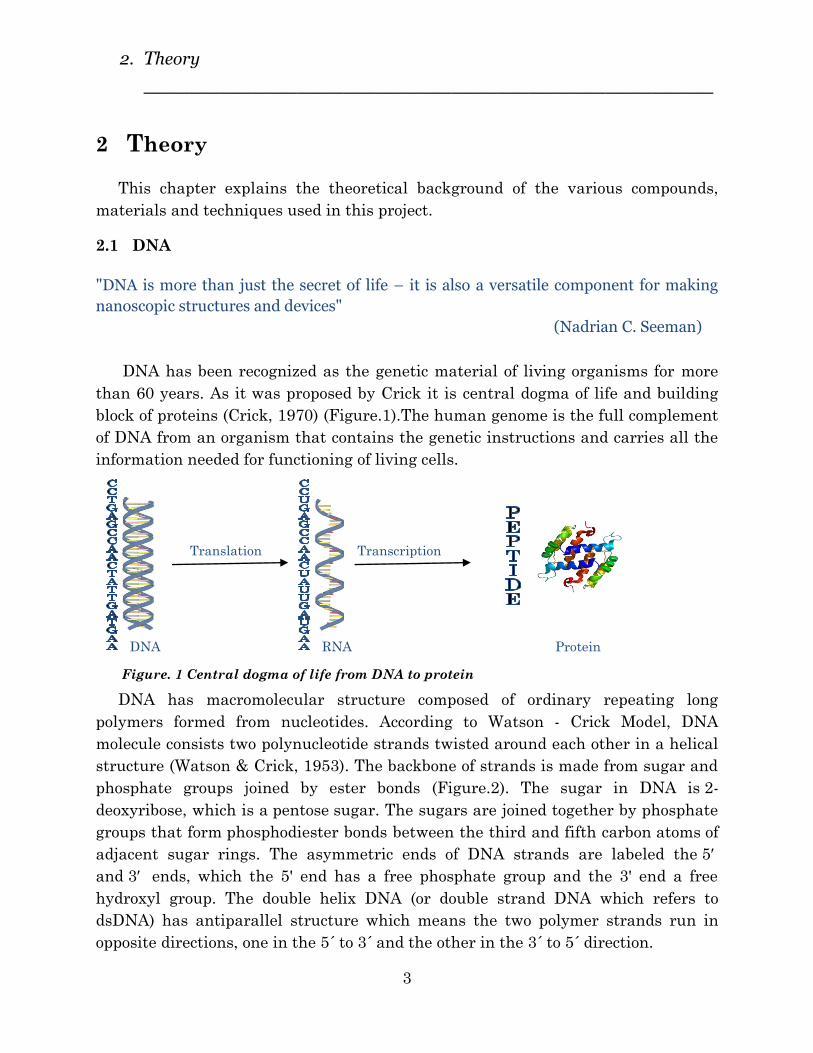
block of proteins (Crick, 1970) (Figure.1).The human genome is the full complement
of DNA from an organism that contains the genetic instructions and carries all the
information needed for functioning of living cells.
Translation Transcription
DNA RNA Protein
DNA has macromolecular structure composed of ordinary repeating long
polymers formed from nucleotides. According to Watson - Crick Model, DNA
molecule consists two polynucleotide strands twisted around each other in a helical
structure (Watson & Crick, 1953). The backbone of strands is made from sugar and
phosphate groups joined by ester bonds (Figure.2). The sugar in DNA is 2-
deoxyribose, which is a pentose sugar. The sugars are joined together by phosphate
groups that form phosphodiester bonds between the third and fifth carbon atoms of
adjacent sugar rings. The asymmetric ends of DNA strands are labeled the 5′
and 3′ ends, which the 5' end has a free phosphate group and the 3' end a free
hydroxyl group. The double helix DNA (or double strand DNA which refers to
dsDNA) has antiparallel structure which means the two polymer strands run in
opposite directions, one in the 5´ to 3´ and the other in the 3´ to 5´ direction.
Figure. 1 Central dogma of life from DNA to protein

2. Theory
_____________________________________
4
The DNA strand consists of two purine bases, namely the Adenine (A) and
Guanine (G), and two pyrimidine bases, Thymine (T) and Cytosine(C), which
attached together by hydrogen bonds, adenine to thymine by two hydrogen bonds
and cytosine to guanine by three hydrogen bonds (Figure.3). The sequence of bases
in one strand is complementary to that in other strand, which means adenine
always pairs with thymine and guanine pairs always with cytosine. The base
pairing of two complementary strands of DNA molecule permits a double strand
form. The double-helix strands (dsDNA) are held together by two forces, hydrogen
bonds between nucleotides and partly base-stacking (hydrophobic) interactions
among adjacent, stacked base-pairs.
2.1.1 DNA Nanotechnology
DNA nanotechnology employs DNA constructs to manipulate the spatial and
temporal distribution of matter and can be divided into two fields, structural and
dynamic DNA nanotechnology (Zhang & Seelig, 2011).
The specific and versatile properties of DNA, makes it a unique and powerful
material for nano engineering applications. DNA has extraordinary properties to
construct complex functional nano structures (Gothelf & Brown, 2005). Great
number of researches and developments has led to design and characterize of novel
constructions of DNA nanostructures and nanodevices within the past few decades.
Figure. 3 Base-pairing in DNA molecule Figure. 2 The DNA double helix structure

2. Theory
_____________________________________
5
DNA nanotechnology is now very rapidly growing science and becoming
increasingly attractive to different bio engineering fields with interesting large and
diverse applications.
Today DNA nanotechnology has advantages, manipulation of DNA constructs is
easy because of known DNA local structure, it can also be manipulated using
different enzymes, DNA is one of the best nanoscale materials because it can self
assembled, self replicate and adopts various states and conformations. So DNA is
used as a structural material in nanotechnology to direct the assembly of highly
structured material with specific nanoscale features, instead of just the carrier of
genetic information (C.Seeman, 2003).
The area of DNA nanotechnology has the potential to greatly impact the future
of bioscience, the very specific bonding and binding properties, makes it
undoubtedly a widely fascinating structural material.
2.1.2 DNA Hybridization
DNA is the molecule of heredity, evolutionary process changes is reflected in
changes in the base pairs in DNA molecule. Two species that have evolved from a
common ancestor have very similar base pair sequences in their DNA molecules.
The degree of relatedness of two species can be assessed by studying how similar
their base pair sequences are. DNA hybridization is the method of examining this
similarity.
In molecular genetics, for hybridization, single strands of DNA from two
different species are permitted to join together to form hybrid double helices. These
hybrid fragments of DNA can be applied to determine the evolutionary relatedness
of organisms by examining how closely two species in DNA base pair sequences are.
The degree of hybridization is proportional to this similarity.
Hybridization of DNA is achieved by denaturing strands of DNA from two
different species by heating up to 86° C [186.8° F]. The hydrogen bonds between all
complementary base pairs will break and a mixture of single-stranded segments of
DNA is incubated, allowing similar strands from both species chemically join
together or re-anneal at complementary base pairs by reforming hydrogen bonds to
recombine into hybrid DNA (Figure.4).The conversion of dsDNA to ssDNA by
heating can be influenced by many factors such as temperature, salt concentration,

2. Theory
_____________________________________
6
sequence composition, inorganic solvents and the degree of sequence similarity or
mismatch between ssDNA molecules.
As the amount of annealing is directly proportional to the similarity of the DNA
strands, it is possible to heating the hybrid DNA and recording the temperature at
which the strands separate.
The temperature at which hybrid DNA separation takes place is related to the
number of hydrogen bonds formed between complementary base pairs.
Consequently, if the two species are strictly related, most base pairs will be
complementary and the temperature of separation will be close to 86° C [186.8° F].
But if the two species are not closely related, they will not share many common
DNA sequences and fewer complementary base pairs will form. It is because less
energy is needed to break hydrogen bonds, therefore the temperature of separation
is less than 86° C.
Heat, Tm Denaturing Annealing
Heat Heat Cool
dsDNA ssDNA dsDNA
Increasing Temperature
Tm refers to the temperature at which 50% of the
DNA is hybridized.
Heating the DNA above its melting temperature (Tm) will separate two strands.
Above the Tm, DNA is mostly in single-stranded form and below the Tm, in double-
stranded form. Principally the Tm depends on GC-content so DNA molecules with
AT-rich sequences have lower Tm values, therefore in this way DNA-denaturation
(by comparing melting temperatures) can be used as a tool to detect sequence
differences.
Figure. 4 Mechanism of Hybridization.

2. Theory
_____________________________________
7
2.1.3 DNA Ligation
Generally ligation means connecting linear DNA fragments with covalent bonds,
but in particular in molecular biology, ligation is generating a phosphodiester bond
between 3' hydroxyl and 5' phosphate of two nucleotides.
T4 DNA ligase is used as enzyme for ligating DNA fragments. This enzyme
ligates fragments with blunt or cohesive ends. A ligation process needs three
components, DNA fragments, T4 DNA ligase and buffer contains ATP.
The amount of DNA ligase needed for ligation depends mainly on the nature of
DNA fragments to be ligated, particularly whether they are blunt or cohesive ends.
Normally more enzyme has to be used for blunt ends fragments (Gaastra & Hansen,
1985).
(Figure by MIT OpenCourseWare)
2.2 Oligonucleotide
An Oligonucleotide (Oligomer) is normally a short nucleic acid polymer with fifty
or fewer bases which are formed by covalently binding of the 5´-phosphate group
and 3´-hydroxyl groups to form phosphodiester bonds. They are usually synthesized
in a sequence-specific manner from single nucleoside phosphoramidites. Synthesis
of appropriate length oligonucleotides (50 bases or even longer) is now routine
(R.Fox, 1997).
Oligonucleotides with different sequences have specific chemical and biophysical
properties and generally are used as primer for DNA synthesis,Some of the
techniques that employ oligonucleotides as their prime component are
hybridization, sequencing, Southern blotting and polymerase chain reaction (PCR),
(Chavali, Mahajan, Tabassum, & Maiti, 2005).
Figure. 5 Simple schematic of DNA
ligation reactions.

2. Theory
_____________________________________
8
2.3 Electrophoretic Techniques
2.3.1 Fundamental Principles
The term electrophoresis was coined from the Greek word phoresis, which
means ‘being carried’, in other words being carried by an electrical field, it
describes the migration of charged (dispersed) particles under the influence
of an electric field. Many important biological molecules, such as amino
acids, peptides, nucleic acids, nucleotides and proteins, possess ionisable
species either as cations (+) or anions (-). Under the influence of an electric
field these charged particles will migrate either to the cathode or to the
anode, according to the nature of their net charge.
Electrophoresis is a technique used to separate and sometimes purify
macromolecules, especially proteins and nucleic acids - that differ in size,
charge or conformation, so it is one of the most widely-used techniques in
biochemistry, biophysical chemistry and molecular biology.
In order to understand better how charged species separate it is
necessary to look at some simple equations relating to electrophoresis. When
a potential difference (voltage) is applied across the electrodes, it generates a
potential gradient, E, which is the applied voltage, V, divided by the
distance, d, between the electrodes. When this potential gradient E, is
applied, the force on a molecule bearing a charge of q coulombs is Eq
newtons. This is the force that drives a charged molecule towards an
electrode. But, also there is a frictional resistance that retards the
movement of this charged molecule. This force depends on the hydrodynamic
size and shape of the molecule, the pore size of the medium in which
electrophoresis is running and the viscosity of the buffer.
Figure. 6 Migration of charged ions during electrophoresis

2. Theory
_____________________________________
9
The velocity, ν, of a charged molecule in an electric field is therefore given by
the equation:
where ƒ is the frictional coefficient (2.1)
The electrophoretic mobility (µ), defines the ratio of the velocity of the ion
to field strength (ν/E).When a potential difference is applied, therefore,
molecules with different overall charges will begin to separate due to
different electrophoretic mobilities. Because of different frictional forces,
even molecules with similar charges could be separate if they have different
molecular sizes (Wilson & Walker, 2010).
During an electrophoresis experiment, a protein or nucleic acid
experiences electric force proportional to its effective charge, q, and also the
electric field strength, E. As the electric force of the molecule is affected by
the opposite force from the frictional resistance, Ff, of the gel matrix , it will
very soon move with a constant velocity, v.
In free solution, f will follow Stoke's law:
f = 6(π) r/n = 6πηR (2.2)
Where r is the radius of the particle moving with velocity v through a
medium of viscosity n. Mobility in free solutions would then be the same for
molecules of same charge to mass ratio. However Stoke's law is not enough
to explain the frictional force within a gel matrix, because determination of
density and effective pore size of the matrix are important, so the influence
of this combination of factors is that, among the molecules with the same
charge to mass ratio, smaller molecules move faster and electrophretic
separation occurs by size (Figure.7).
larger molecules move more slowly because of their
lower electrophoretic mobility
Figure. 7 The gel electrophoresis
of samples having identical
charge to mass ratios results in
fractionation by size

2. Theory
_____________________________________
10
2.3.2 Short History of Different Electrophoretic Methods
Historically, the development of electrophoresis began with the pioneering work
of the Swedish biochemist, Arne Tiselius, published his first paper on
electrophoresis in 1937, it represented a novel technique for studying of physico-
chemical properties of different proteins. He was awarded the Noble prize on his
work in 1948 (Vesterberg, 1993).
The basic form of electrophoresis performed by A. Tiselius and co-workers using
a U-shaped type of glass with an electrode at both end, provided an efficient method
for separation of molecules in free solution, this form of moving boundary
electrophoresis (MBE) was replaced in the 1950s by zone electrophoresis (ZE),
which relied on the separation of molecules on a solid support (e.g. paper or
cellulose).
The most commonly method, gel electrophoresis (GE) was also introduced in the
1950s by Oliver Smithies. At first, GE was mainly performed for bioanalytical
analyses, but has since evolved as a major preparative technique to partially purify
biomolecules before further characterization by other advanced technologies
including: immunoblotting, mass spectrometry, and molecular techniques such as
polymerase chain reaction (PCR) and DNA sequencing. While starch-block
electrophoresis introduced the concept of sieving, other important developments in
the 1960s included Svensson’s isoelectric focusing (IEF) and Shapiro and colleagues’
sodium dodecyl sulfate-polyacrylamide gel electrophoresis (SDS-PAGE). Where IEF
allowed separation based on surface charge, the now-popular SDS-PAGE allowed
separation of biomolecules on the basis of molecular mass. The 1960s also was the
development of capillary electrophoresis (CE) by Hjerten, which has concerned
much interest because of high resolution for proteins, nucleic acids, peptides and
pharmaceuticals on the analytical scale, and today is very accepted method in the
field of clinical chemistry.
Swedish biochemist who won the Nobel Prize in Chemistry in 1948 for his
research on electrophoresis (development of MBE method) and
chromatographic adsorption analysis.
Photo by Nobel Foundation
Figure. 8 Arne Wilhelm Kaurin Tiselius (1902 –1971)

2. Theory
_____________________________________
11
During the last forty years a number of electrophoretic methods have developed
quickly to suggest high resolution analytical and preparative separations in
biochemistry, bioanalytical chemistry and life sciences for research and various
applied purposes. Over the last years electrophoretic separations in gels and
numerous applications in nucleic acid (DNA,RNA) field have been much improved ,
making possible well-organized mapping of the human genome, and many other
applications in molecular biology, genetics and medicine (Vesterberg, 1993).
2.3.3 Support media
As mentioned before the Nobel Prize in Chemistry in 1948 was awarded to
Tiselius for carrying out electrophoresis in free solution, but very soon researchers
found out that many problems such as the adverse effects of diffusion and
convection currents arise from this approach. Later it was realised that performing
electrophoresis on a porous mechanical support could minimise problems. This type
of support media reduces convection currents and diffusion. The first used supports
were filter paper or cellulose acetate strips, which should wetted in buffer, but the
problem is that the separation of macromolecules such as nucleic acids and proteins
on such supports is not strong (Wilson & Walker, 2010).
In last decades after introduction of gels as support medium a rapid
advancement in methods for analysing of macromolecules happened. Although the
earliest gel system was starch gel, but nowadays agarose gels and polyacrylamide
gels are the most important used gel systems for electrophoretic techniques.
These gels immerse within an electrophoresis buffer that supply the essential
ions for carrying the current and some type of buffer for controlling the pH in a
relatively constant range.
extracted from potato. The first gel-electrophoresis method, have
used starch as gel system
Figure. 9 Chemical structure of starch
2. Theory
_____________________________________
12
2.3.4 Agarose gels
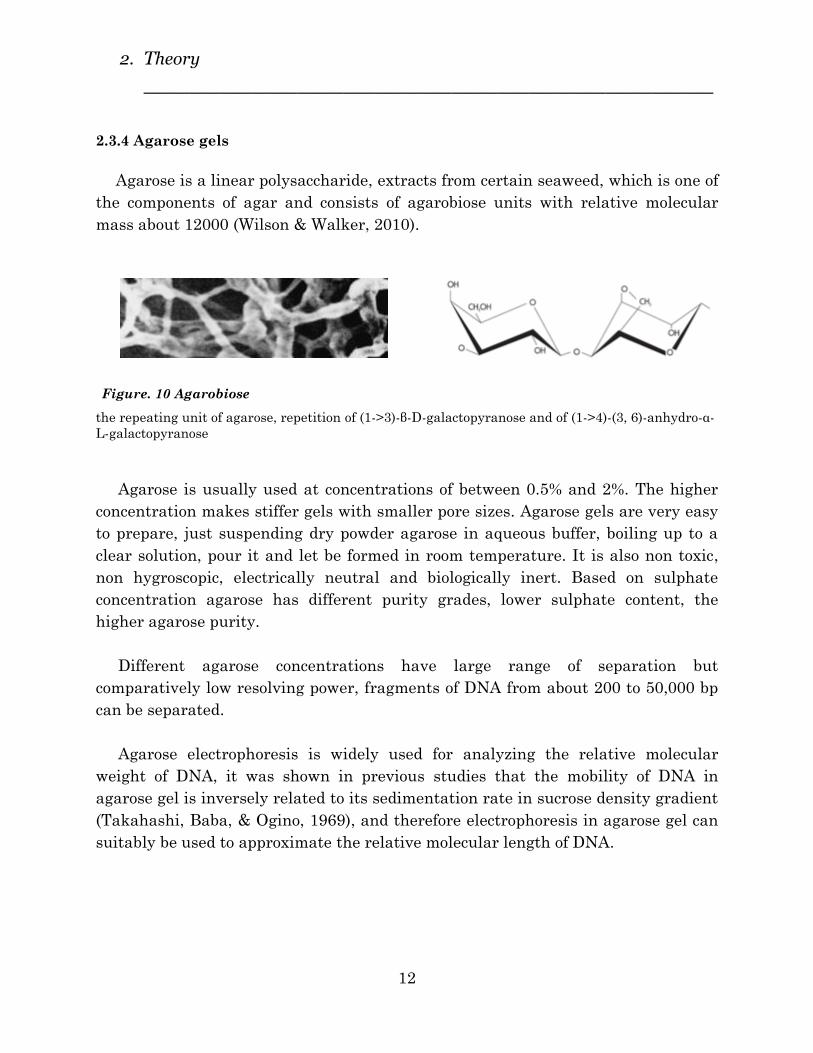
Agarose is a linear polysaccharide, extracts from certain seaweed, which is one of
the components of agar and consists of agarobiose units with relative molecular
mass about 12000 (Wilson & Walker, 2010).
the repeating unit of agarose, repetition of (1->3)-β-D-galactopyranose and of (1->4)-(3, 6)-anhydro-α-
L-galactopyranose
Agarose is usually used at concentrations of between 0.5% and 2%. The higher
concentration makes stiffer gels with smaller pore sizes. Agarose gels are very easy
to prepare, just suspending dry powder agarose in aqueous buffer, boiling up to a
clear solution, pour it and let be formed in room temperature. It is also non toxic,
non hygroscopic, electrically neutral and biologically inert. Based on sulphate
concentration agarose has different purity grades, lower sulphate content, the
higher agarose purity.
Different agarose concentrations have large range of separation but
comparatively low resolving power, fragments of DNA from about 200 to 50,000 bp
can be separated.
Agarose electrophoresis is widely used for analyzing the relative molecular
weight of DNA, it was shown in previous studies that the mobility of DNA in
agarose gel is inversely related to its sedimentation rate in sucrose density gradient
(Takahashi, Baba, & Ogino, 1969), and therefore electrophoresis in agarose gel can
suitably be used to approximate the relative molecular length of DNA.
Figure. 10 Agarobiose
2. Theory
_____________________________________
13
2.3.5 Polyacrylamide gels
Polyacrylamide gel electrophoresis (PAGE) is used widely for separation of
proteins and nucleic acids because of unparalleled resolution and flexibility of
applications.
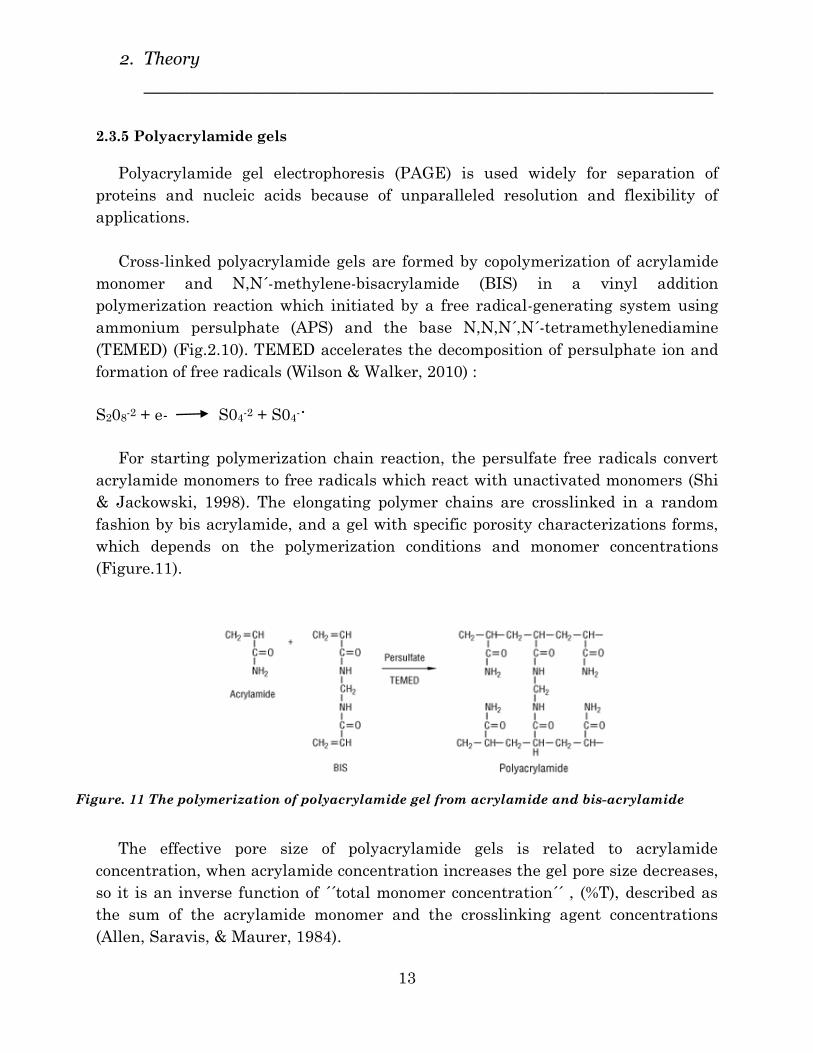
Cross-linked polyacrylamide gels are formed by copolymerization of acrylamide
monomer and N,N´-methylene-bisacrylamide (BIS) in a vinyl addition
polymerization reaction which initiated by a free radical-generating system using
ammonium persulphate (APS) and the base N,N,N´,N´-tetramethylenediamine
(TEMED) (Fig.2.10). TEMED accelerates the decomposition of persulphate ion and
formation of free radicals (Wilson & Walker, 2010) :
S208-2 + e- S04
-2 + S04-•
For starting polymerization chain reaction, the persulfate free radicals convert
acrylamide monomers to free radicals which react with unactivated monomers (Shi
& Jackowski, 1998). The elongating polymer chains are crosslinked in a random
fashion by bis acrylamide, and a gel with specific porosity characterizations forms,
which depends on the polymerization conditions and monomer concentrations
(Figure.11).
The effective pore size of polyacrylamide gels is related to acrylamide
concentration, when acrylamide concentration increases the gel pore size decreases,
so it is an inverse function of ´´total monomer concentration´´ , (%T), described as
the sum of the acrylamide monomer and the crosslinking agent concentrations
(Allen, Saravis, & Maurer, 1984).
Figure. 11 The polymerization of polyacrylamide gel from acrylamide and bis-acrylamide

2. Theory
_____________________________________
14
2.3.5.1 Denaturing PAGE
Denaturing polyacrylamide electrophoresis is very helpful technique which is
used for many applications such as analysis of proteins and separation and
purification of single stranded DNA and RNA. It can also be used for chain length
and molecular weight determination of small DNA and RNA molecules (Frank &
Köster, 1979).
The electrophoretic analysis of single stranded nucleic acids is complicated by
the secondary structures attained by these molecules. Even introduction of thin gel
techniques employing higher temperature around 50ºC was not exceptionally
successful to melt very stable secondary structures (Frank, Müller, & Wollf, 1981),
it seems, separation on the basis of molecular weight requires the addition of
denaturing agents which unfold the DNA strands and eliminate the influence of
shape on their mobility properties.
Fragments between 2 to 500 bases can be separated with this method. Gels with
different pore sizes are prepared by varying the amount of acrylamide (Table.3.3),
higher concentration gels for separating smaller fragments and lower concentration
gels for larger fragments. Hydrogen bonds between bases stabilize nucleic acids
structures. Disturbing these hydrogen bonds is needed for denaturing. The most
frequently used DNA denaturants are urea and formamide, 7M (mol L-1) urea is
widely used as denaturant agent resolved in gel structure and formamide usually is
added to samples in different concentrations. The denaturing effect of urea is
greatly increased by temperature, so electrophoresis usually carry out in a 60 or
70°C incubator, the maximum denaturing effect is reached if the electrophoresis
run at this temperature (Southern, 2002). These denaturants effectively lower the
melting temperature of DNA concatemers and accomplish the denaturation by
forming new hydrogen bonds with the DNA bases, consequently "saturating" H-
bond sites and avoiding the formation of inter-base bonds. Other denaturants
including NaOH, formaldehyde and DMSO can be used in some cases.

2. Theory
_____________________________________
15
2.3.5.2 Native PAGE
As seen from the nomenclature, native PAGE separations run in non-denaturing
conditions, therefore here a denaturing agent in not needed. Double stranded DNA
maintains its double helical structure, so with rodlike shape migrates through the
gel. But single stranded DNA can assume various conformations under native
conditions, it depends to solution, temperature and environment.
As DNA molecules have a uniform negative charge density provided by
phosphate groups in its backbone, in free solution it has mobility which is
independent of molecular size. But in a sieving medium such as polyacrylamide gel,
the ability of molecule to find a way through the gel pores determines the relative
mobility properties of molecule.
It was shown that there is a linear relation between the effective radius of the
molecule and the log of the molecular weight. As a result, on a gel of specific
concentration and porosity properties, the distance that a given fragment could
migrate is proportional to the log of its molecular weight (log mw) (Figure.12).
Photo by www.nationaldiagnostics.com
This proportionality of log mw with mobility is valid just for certain conditions.
For small size molecules, as the gel could not sieve the molecule effectively, these
small molecules and others with smaller size, migrate at the same rate. Also for
extremely large DNA molecules are unable to find a way through the gel and the
migration distance is almost zero.
Sequence of bases in dsDNA in some cases affects the mobility of the molecule,
certain sequences cause bending of helical structure, which can decrease the speed
of migration.
Figure. 12 Electrophoretic mobility versus
molecular weight

2. Theory
_____________________________________
16
2.4 QCM-D
2.4.1 The QCM-D principle
The Quartz Crystal Microbalance with Dissipation Monitoring (QCM-D) is a
particular type of QCM technique based on the ring-down rather than impedance
analysis which commercialized by Chalmers group (Rodahl & Kasemo, 1996). It is a
useful technology in surface analysis. In brief, it used for measuring structure,
viscoelastic properties and mass changes in real-time with nano-sensitivity.
2.4.2 History of QCM
For more than 50 years, QCM (Quartz Crystal Microbalance) is a traditional,
accepted method for analyzing mass changes on rigid surfaces, most successfully as
a sensor in, e.g. film deposition and film growth in air and vacuum medium. So it is
used commonly as the frequency determining element of an electronic oscillator and
recording the oscillation frequency changes (Rodahl & Kasemo, 1996). QCM was not
performed normally in liquids because the liquid overdamp the oscillation
(Johannsmann, 2008).
The basic principle of QCM is that a voltage is applied to a quartz crystal
causing it to oscillate at a specific frequency. According to Sauerbrey equation
(Eq.2.5) changes in mass on quartz surface are directly related to changes in
frequency of the oscillating crystal:
∆m= -C.∆f (Simple form of Sauerbrey equation) (2.5)
Where ∆m is mass change (g) and ∆f is frequency change (Hz).
The Sauerbrey equation is valid just for rigid, suitably thin adsorbed layers and
applies for oscillation in air only, so for soft , viscoelastic films or measurements
should be performed in liquid, Sauerbrey relationship undervalue the mass and
therefore another technique is needed to fully analyze such material.
There are some disadvantages of using an oscillator that only permits
measurements of resonant frequency: such as (1) admixture of true frequency with
frequency from the energy supplying elements due to for instance a mass increase,
2. Theory
_____________________________________
17
(2) unknown phase shift of electronic oscillator is used for QCM resonant frequency,
(3) missing of dissipation factor which in many cases is important (Rodahl &
Kasemo, 1996).
2.4.3 Dissipation
QCM-D measures frequency and dissipation of quartz crystal together. When
the driving voltage is turned off, dissipation happens, where the energy from the
oscillating crystal dissipates from the system. D describes dissipation and is defined
as follows:
D = Elost / 2 Estored (2.6)
Where Elost is the energy lost during one oscillation cycle and Estored is the total
energy stored in the oscillator.
Dissipation analysis allows qualitative measurements of the structural
properties of adsorbed layers. By combining frequency and dissipation
measurements, the QCM-D technology enables quantitative analysis of the
thickness, viscosity, morphology and shear elastic modules of the adsorbed layers
where these types of analyses are beyond the Sauerbrey approved limitations. Also
with this technique it is possible to make certain which materials can be studied in
the Sauerbrey regime or not.
Consequently QCM-D makes it possible measuring both mass and structural
properties in real-time. By measuring dissipation parameter, analysis of soft films
and other materials that do not follow the linear relation between mass and
frequency changes, could be done.
2.4.4 Applications in Bio- science
In recent years biology-based studies using QCM-D technique is rapidly growing.
In many biomolecular studies the dissipation parameter and the consequently
extracted viscoelastic parameters are essential for many applications. For example
in cellular adsorption applications, the QCM frequency and Sauerbrey relationship
can be used for underestimating of adsorbed mass of cell (Dixon, 2008).
2. Theory
_____________________________________
18
DNA as an important biological material has been used in a wide range of
researches using QCM-D technique. Some applications are DNA-protein
interactions, gene delivery, DNA hybridization, DNA-ligand binding and adsorption
of linear and supercoild DNA on surface (Dixon, 2008).
QCM-D also is used widely for studying of proteins, lipids and cells as very
strong tool for different applications.
3. Material and Methods
_____________________________________
20
3 Materials and Methods
3.1 PBS
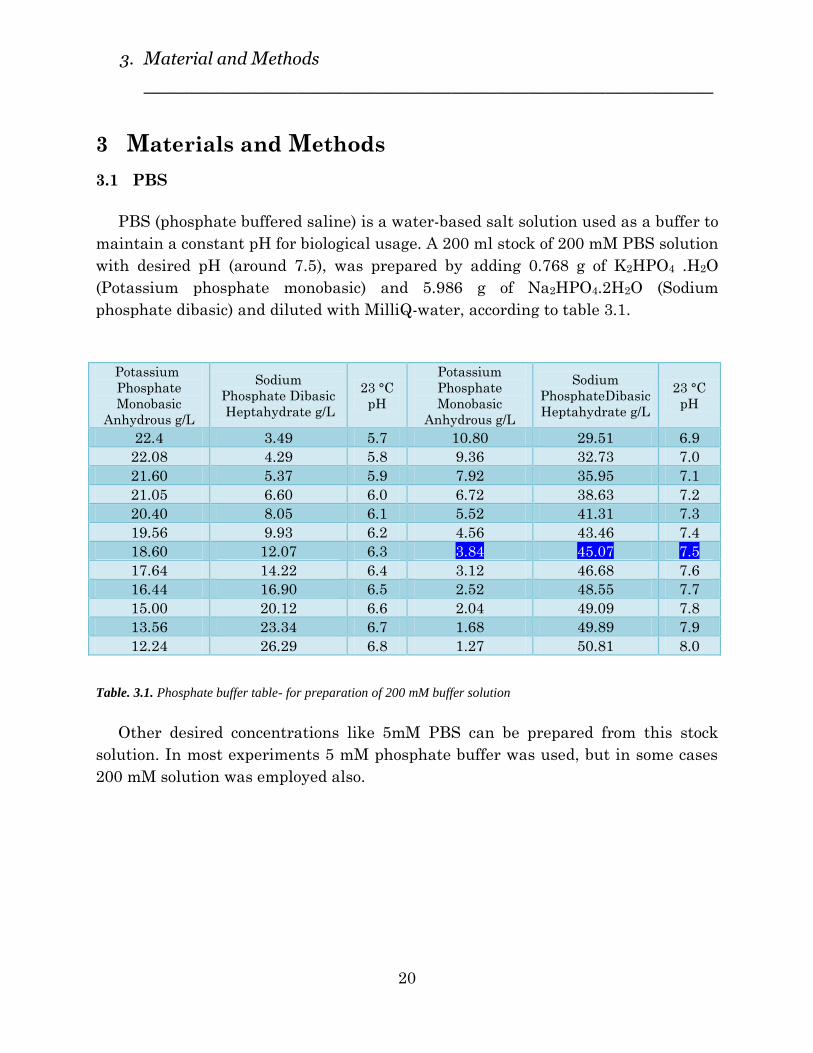
PBS (phosphate buffered saline) is a water-based salt solution used as a buffer to
maintain a constant pH for biological usage. A 200 ml stock of 200 mM PBS solution
with desired pH (around 7.5), was prepared by adding 0.768 g of K2HPO4 .H2O
(Potassium phosphate monobasic) and 5.986 g of Na2HPO4.2H2O (Sodium
phosphate dibasic) and diluted with MilliQ-water, according to table 3.1.
Potassium
Phosphate
Monobasic
Anhydrous g/L
Sodium
Phosphate Dibasic
Heptahydrate g/L
23 °C
pH
Potassium
Phosphate
Monobasic
Anhydrous g/L
Sodium
PhosphateDibasic
Heptahydrate g/L
23 °C
pH
22.4 3.49 5.7 10.80 29.51 6.9
22.08 4.29 5.8 9.36 32.73 7.0
21.60 5.37 5.9 7.92 35.95 7.1
21.05 6.60 6.0 6.72 38.63 7.2
20.40 8.05 6.1 5.52 41.31 7.3
19.56 9.93 6.2 4.56 43.46 7.4
18.60 12.07 6.3 3.84 45.07 7.5
17.64 14.22 6.4 3.12 46.68 7.6
16.44 16.90 6.5 2.52 48.55 7.7
15.00 20.12 6.6 2.04 49.09 7.8
13.56 23.34 6.7 1.68 49.89 7.9
12.24 26.29 6.8 1.27 50.81 8.0
Table. 3.1. Phosphate buffer table- for preparation of 200 mM buffer solution
Other desired concentrations like 5mM PBS can be prepared from this stock
solution. In most experiments 5 mM phosphate buffer was used, but in some cases
200 mM solution was employed also.

3. Material and Methods
_____________________________________
21
3.2 Oligonucleotides
The synthesized oligonucleotides used in this project were purchased from
ATDBio Ltd, Southampton, with following sequence.
Oligo
ID Sequence (50-mer) Mt
T
molar
conc.
OD
260nm ε
A9661 TCTCG GACTA ACCCT GAGGT CAGCG CCAGT GAGAG TGCTG CAGGC ACGGT 15480.6 273.49 143.8 525.8
A9662 CGCTG ACCTC AGGGT TAGTC CGAGA ACCGT GAATC CAGCA CTCTC ACTGG 15409.6 171.85 90.1 524.3
Table 3.2. Sequences of oligonucleotides
All oligonucleotide samples were prepared by dissolving in 5 mM PBS buffer
with a pH of 7.2 to make 20 or 25 µM concentration from stock solutions. To verify
the accurate sample concentration, the sample absorption was measured at 260 nm
with a Varian Cary 5000 spectrophotometer. The concentrations were calculated
using extinction coefficient values reported by supplier.
In this report AB represents A9961 oligo and A'B' will present A9662 oligo.
3.2.1 Hybridization of the oligonucleotides
As mentioned before, our strategy in this project for construction of DNA
concatemers was assembling them by hybridization of single-stranded
oligonucleotides (Figure.13).
Double-stranded duplexes was formed by mixing two oligonucleotides (AB and
A'B') and hybridize them by heating to 90ºC for dissociating hydrogen bonds, and
then cooling samples for different times (one hour up to overnight) to let
complementary base pairs start to hybridize.
Figure. 13 Scheme of DNA-duplex formation
3. Material and Methods
_____________________________________
22
3.3 Enzymes
All enzymes used in this project were obtained from New England Biolabs.
3.3.1 T4 DNA Ligase
T4 DNA Ligase catalyzes the formation of two covalent phosphodiester bonds
between the 5´-phosphate and the 3´-hydroxyl groups of adjacent nucleotides of two
DNA strands. It used for blunt or cohesive ligation of DNA fragments and has no
activity on single-stranded nucleic acids. For inactivation it should be heated at
65˚C for 10 minutes (Helfman, Fiddes, & Hanahan, 1987).
T4 DNA ligase plays important roles in living cells and involves in such vital
processes like DNA replication, DNA recombination and DNA repair (Gaastra &
Hansen, 1985).
3.3.2 T4 Polynucleotide Kinase
T4 Polynucleotide Kinase (T4 PNK) catalyzes exchange reaction between γ-
phosphate from ATP and 5´-terminus of polynucleotides (dsDNA or ssDNA) or
mononucleotides bearing a 3´-phosphate group (Berkner & William, 1979).
It is usually used for end-labeling of DNA and DNA sequencing, subsequent
ligation of oligonucleotides by adding of 5´-phosphates and subtraction of 3´-
phosphoryl groups. For inactivation it should be heated at 65˚C for 20 minutes
3.3.3 Ligation of the concatemers
The protocol we used for hybridization, consists stepwise increasing of
concatemer length in a mode of 25 base pairs addition of oligonucleotides, it means
after every 25 pairs, the double-stranded duplex contains a notch. Therefore for
sticking the both ends of concatemer a ligation step is needed.
The protocol was employed in this project work for ligation was according to
scheme in Figure.14.

3. Material and Methods
_____________________________________
23
3.4 Buffer system
The buffer system in electrophoresis is used to control the pH of the gel, avoiding
damage to sample molecules and in some cases, controlling the ionization state of
the molecules. Also carrying the current flowing through the electrophoresis gel is
done by buffer ions.
In denaturing PAGE electrophoresis of DNA which is a homogeneous system, the
type and concentration of buffers in the tank and gel are the same, here the buffer
prevents large swings in pH and also controls the conductivity of the gel. For the
native electrophoresis of proteins, the buffer pH has the extra function of controlling
the state of ionization of the samples. In this type of electrophoresis, even minor
changes in pH can result in great effects on the relative mobility of sample
components. But in a multiphasic system, such as SDS-PAGE electrophoresis of
proteins, as buffers in the tank and gel are not the same, the considerations of
buffer properties can take on an even larger level of complexity.
It is very important to keep the ionic strength of buffer in the gel in a
satisfactory level to maintain the sample in solution and provide sufficient buffering
capacity. To get sharper bands higher concentrations of gel buffer must be used
because it will slow the diffusion of sample, but it should be considered that higher
buffer concentrations will increase the electrical conductivity and the current will
be greater and more heat will be generated. With higher concentration, at a given
voltage, the current will be greater and more heat will be generated. For decreasing
of excessive heating problems it is better to employ high buffer concentrations at a
low voltage gradient.
Figure. 14 Scheme of ligation process
by T4 ligase

3. Material and Methods
_____________________________________
24
3.4.1 TBE buffer
In all experiments Tris-borate-EDTA (TBE) was used as electrophoresis buffer.
For making TBE buffer Boric acid, Tris base and EDTA is needed. A stock solution
of 2000ml 10×TBE buffer was prepared by adding 61.83 g Boric acid, 121.14 g
Trizma base and 9.31 g EDTA ( dehydrate salt of EDTA was used ) and diluting up
to a final volume of 2 L with MilliQ-H2O.
The solution can be stored at room temperature. However because a precipitate
will form after long time in older solutions, storing in a refrigerator may increase
life-time of solution and prevents precipitation.
From this stock solution 1×TBE buffer was prepared by diluting with MilliQ-
water by 10×.
3.5 Salts
3.5.1 NaCl
A stock solution of 10 ml of 4M NaCl solution was prepared by dissolving 2.337 g
of sodium chloride in MilliQ-water up to 10 ml final volume. Other NaCl
concentrations (50, 100, 200, 300 and 400 mM) were prepared from this stock
solution.
3.5.2 PEG
100 ml solution of 40% w/w PEG-8000 solution was prepared by adding 40 g
PEG-8000 powder to 60 ml MillQ-H2O, the solution stirred for 2 hours, the solution
was allowed to stir for overnight to obtain a homogenous solution. Other
concentrations (20, 10 and 5%) were prepared from this stock solution.
3. Material and Methods
_____________________________________
25
3.6 Instrumentation
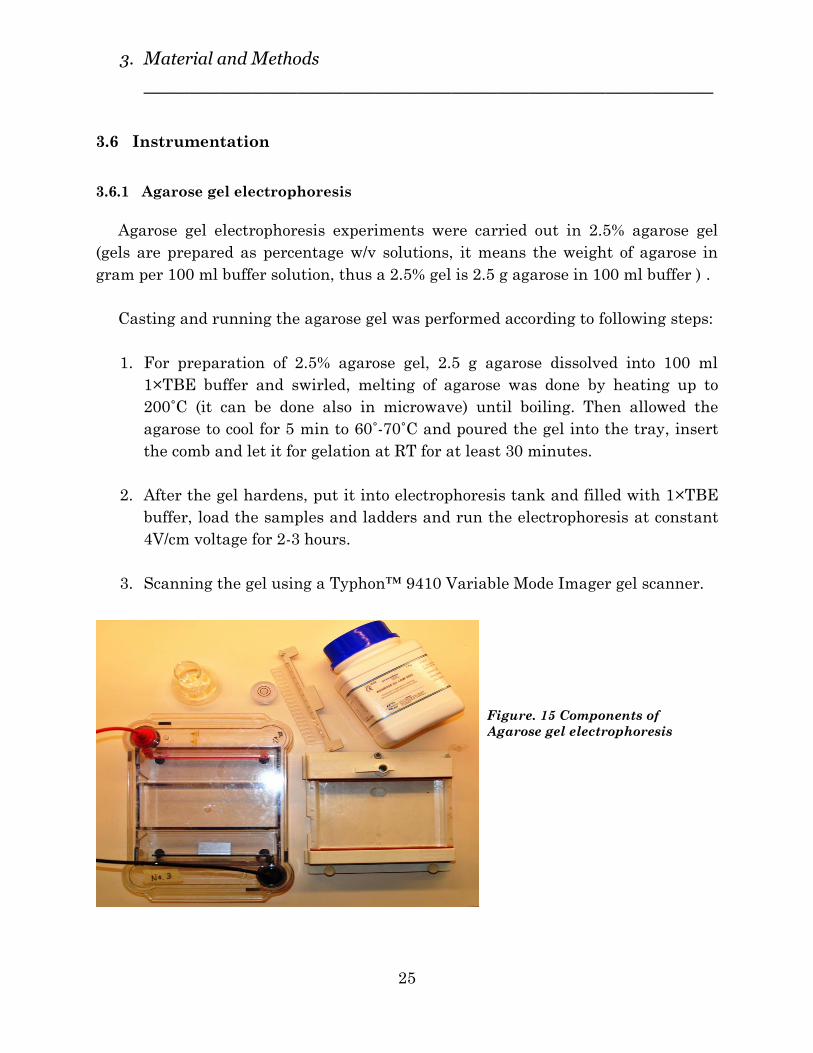
3.6.1 Agarose gel electrophoresis
Agarose gel electrophoresis experiments were carried out in 2.5% agarose gel
(gels are prepared as percentage w/v solutions, it means the weight of agarose in
gram per 100 ml buffer solution, thus a 2.5% gel is 2.5 g agarose in 100 ml buffer ) .
Casting and running the agarose gel was performed according to following steps:
1. For preparation of 2.5% agarose gel, 2.5 g agarose dissolved into 100 ml
1×TBE buffer and swirled, melting of agarose was done by heating up to
200˚C (it can be done also in microwave) until boiling. Then allowed the
agarose to cool for 5 min to 60˚-70˚C and poured the gel into the tray, insert
the comb and let it for gelation at RT for at least 30 minutes.
2. After the gel hardens, put it into electrophoresis tank and filled with 1×TBE
buffer, load the samples and ladders and run the electrophoresis at constant
4V/cm voltage for 2-3 hours.
3. Scanning the gel using a Typhon™ 9410 Variable Mode Imager gel scanner.
Figure. 15 Components of
Agarose gel electrophoresis

3. Material and Methods
_____________________________________
26
3.6.2 Pulsed-Field gel electrophoresis (PFGE)
The agarose gel electrophoresis enables to separate DNA fractions of 60 kb or
less. The development of Pulsed-Field gel electrophoresis (PFGE) made it possible
to separate larger DNA fragments up to 2 × 10³ kb, which has expanded the range
of resolution for larger DNA molecules (Schwartz & Cantor, 1984).
This method is based on applying two electric fields alternately at different
angles for definite period of time (e.g. 60s), introduction of first electric field will
stretch coiled molecules in the horizontal plane and push them to move through the
gel, activation of second electric field interrupts the first field and move the
molecule in the new direction. Since the smaller molecules realigns faster (because
of length-dependent relaxation behaviour) and larger molecules take longer to
realign, molecules according to their size will separate with periodic reversing of the
field (Wilson & Walker, 2010).
3.6.3 Polyacrylamide gel electrophoresis
Native and denaturing polyacrilamide electrophoresis experiments were carried
out. In following sections they have explained separately. All polyacrilamide gels
were hand casted.
3.6.4 Denaturing PAGE
For denaturing urea polyacrilamide gel electrophoresis, 7M urea was used.
Different PAAG concentrations were prepared according to following table:
Gel % Acrylamide 40%
(ml)
10 × TBE
(ml)
Urea
(g)
MilliQ-
H2O(ml)
APS
(µl)
TEMED
(µl)
5 1.875 1.5 6.31 11.515 105 5.3
10 3.75 1.5 6.31 9.64 105 5.3
20 5.625 1.5 6.31 7.765 105 5.3
Total Volume : 15 ml
Table 3.3. Composition of different 7M urea PAAG concentrations
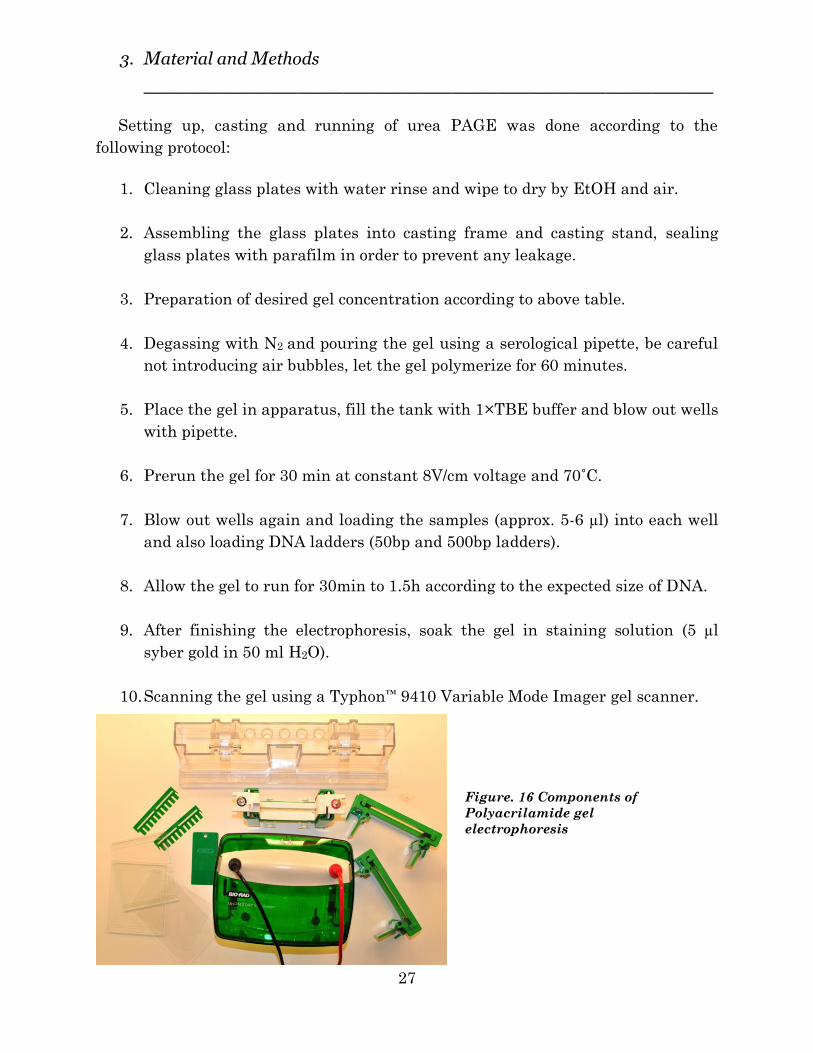
All electrophoresis experiments were done using BIO-RAD mini-PROTEIN®
Tetra system (Figure.16).
3. Material and Methods
_____________________________________
27
Setting up, casting and running of urea PAGE was done according to the
following protocol:
1. Cleaning glass plates with water rinse and wipe to dry by EtOH and air.
2. Assembling the glass plates into casting frame and casting stand, sealing
glass plates with parafilm in order to prevent any leakage.
3. Preparation of desired gel concentration according to above table.
4. Degassing with N2 and pouring the gel using a serological pipette, be careful
not introducing air bubbles, let the gel polymerize for 60 minutes.
5. Place the gel in apparatus, fill the tank with 1×TBE buffer and blow out wells
with pipette.
6. Prerun the gel for 30 min at constant 8V/cm voltage and 70˚C.
7. Blow out wells again and loading the samples (approx. 5-6 µl) into each well
and also loading DNA ladders (50bp and 500bp ladders).
8. Allow the gel to run for 30min to 1.5h according to the expected size of DNA.
9. After finishing the electrophoresis, soak the gel in staining solution (5 µl
syber gold in 50 ml H2O).
10. Scanning the gel using a Typhon™ 9410 Variable Mode Imager gel scanner.
Figure. 16 Components of
Polyacrilamide gel
electrophoresis
3. Material and Methods
_____________________________________
28
3.6.5 Native PAGE
Native polyacrylamide electrophoresis experiments were done, using the same
protocol as denaturing gel, just without using urea and water bath, all other steps
were the same.
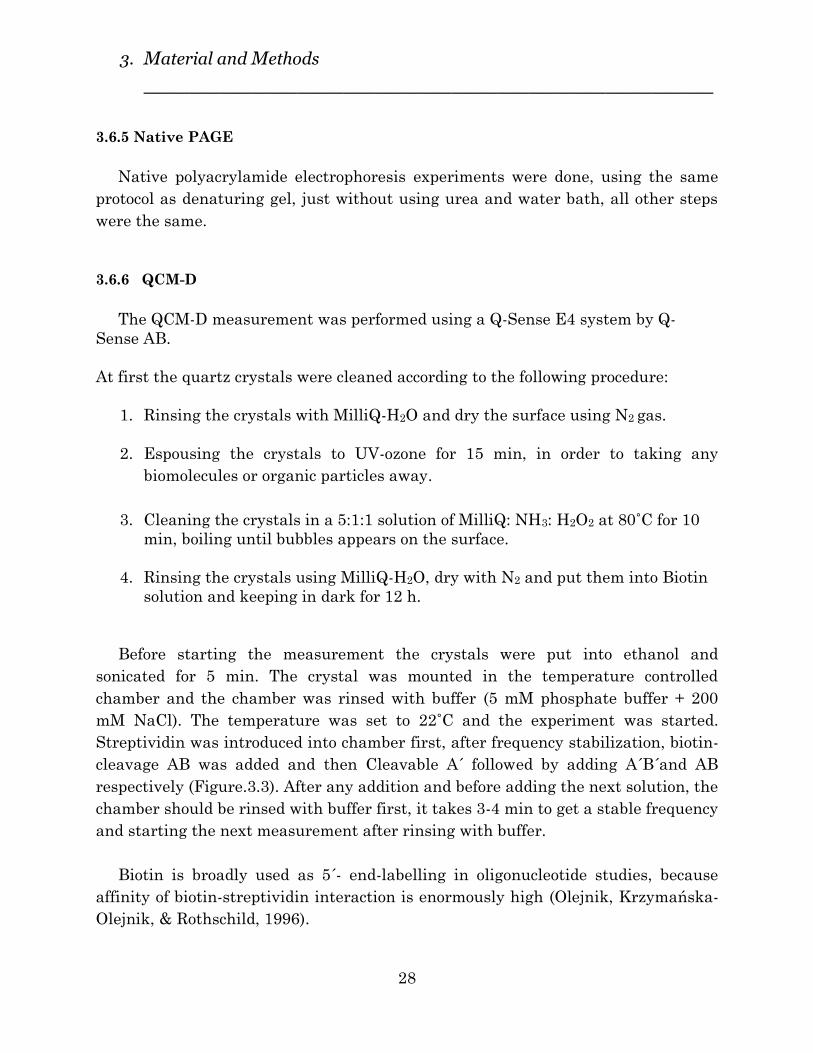
3.6.6 QCM-D
The QCM-D measurement was performed using a Q-Sense E4 system by Q-
Sense AB.
At first the quartz crystals were cleaned according to the following procedure:
1. Rinsing the crystals with MilliQ-H2O and dry the surface using N2 gas.
2. Espousing the crystals to UV-ozone for 15 min, in order to taking any
biomolecules or organic particles away.
3. Cleaning the crystals in a 5:1:1 solution of MilliQ: NH3: H2O2 at 80˚C for 10
min, boiling until bubbles appears on the surface.
4. Rinsing the crystals using MilliQ-H2O, dry with N2 and put them into Biotin
solution and keeping in dark for 12 h.
Before starting the measurement the crystals were put into ethanol and
sonicated for 5 min. The crystal was mounted in the temperature controlled
chamber and the chamber was rinsed with buffer (5 mM phosphate buffer + 200
mM NaCl). The temperature was set to 22˚C and the experiment was started.
Streptividin was introduced into chamber first, after frequency stabilization, biotin-
cleavage AB was added and then Cleavable A´ followed by adding A´B´and AB
respectively (Figure.3.3). After any addition and before adding the next solution, the
chamber should be rinsed with buffer first, it takes 3-4 min to get a stable frequency
and starting the next measurement after rinsing with buffer.
Biotin is broadly used as 5´- end-labelling in oligonucleotide studies, because
affinity of biotin-streptividin interaction is enormously high (Olejnik, Krzymańska-
Olejnik, & Rothschild, 1996).

3. Material and Methods
_____________________________________
29
The experiment was continued until assembling a 400bp strand, it took almost 7
h and 30 min to finish. The results were analyzed using QTools software.
Figure.16 Schematic view of
assembling DNA strand on quartz
surface

4. Results & Discussion
_____________________________________
30
4. Results & Discussion
This chapter contains the results obtained from gel electrophoresis (Agarose &
PAAG) and QCM-D experiment. The electrophoresis part is divided to two parts, in
the first part the raw results are presented and some important comments have
been mentioned. The second part includes some detailed analysis information for
better interpretation of results. There is also a supplementary part at the end of the
report (index chapter) where, more experiment results have been collected.
4.1 Agarose gel electrophoresis
All agarose gel experiments were performed in 1×TBE buffer (50 mM Tris,
50 mM borate, 1.25 mM EDTA, pH 8.2) at RT at 4V/cm for 3 hours. Agarose gels
(2.5%) were prepared using D1 Low EEO agarose from CONDA. O'RangeRuler™ 50
bp and 500 bp DNA ladders from Fermentas were used as size standards.
All samples were stained by 0.2 µl YO-PRO®-1 dye from invitrogen before
running. A Typhon 9410 scanner with laser excitation wavelength at 488 nm and a
520 BP 40 emission filter was used for visualization of results.
4.1.1 Different heating times
As mentioned earlier, before starting hybridization process, samples were heated
for some minutes at 90˚C to certify of dissociation of hydrogen bonds. In most cases,
samples were heated up to 90˚C for 5 minutes, in this experiment we have tested
different heating times (0 min to 20 min) to verify if longer heating times had any
influence or not.
Figure.18 shows the results, in two different conditions (High & Low salt
concentration) after one hour hybridization time. The results show that increasing
heating time from 5 to 20 min doesn´t have a big affect on length of formed
concatemers , but comparing between high and low salt concentration results,
confirms significantly the role of salt addition for making longer strands.
4. Results & Discussion
_____________________________________
31
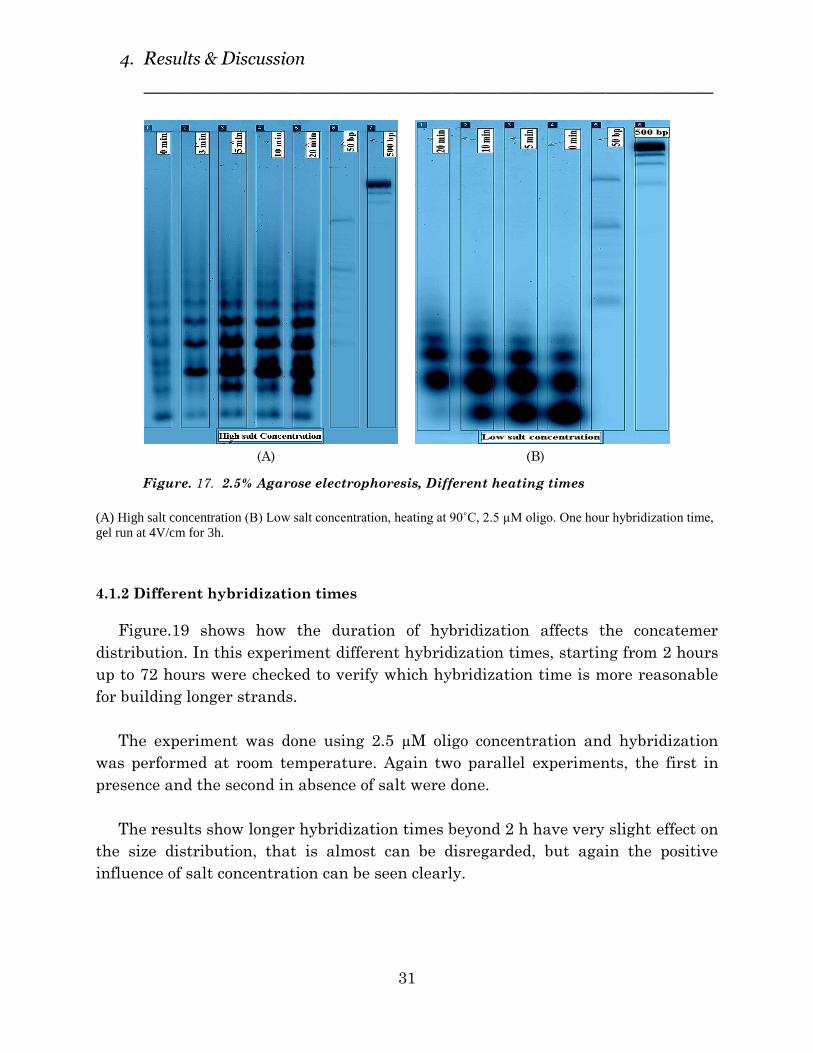
(A) (B)
(A) High salt concentration (B) Low salt concentration, heating at 90˚C, 2.5 µM oligo. One hour hybridization time,
gel run at 4V/cm for 3h.
4.1.2 Different hybridization times
Figure.19 shows how the duration of hybridization affects the concatemer
distribution. In this experiment different hybridization times, starting from 2 hours
up to 72 hours were checked to verify which hybridization time is more reasonable
for building longer strands.
The experiment was done using 2.5 µM oligo concentration and hybridization
was performed at room temperature. Again two parallel experiments, the first in
presence and the second in absence of salt were done.
The results show longer hybridization times beyond 2 h have very slight effect on
the size distribution, that is almost can be disregarded, but again the positive
influence of salt concentration can be seen clearly.
Figure. 17. 2.5% Agarose electrophoresis, Different heating times

4. Results & Discussion
_____________________________________
32
2.5 µM oligo, 5mM phosphate buffer, 1h
hybridization time at RT, gel run at 4V/cm for 3h.
4.1.3 Different hybridization temperatures
Figure.20 shows the affect of hybridization temperature as an important
parameter on size distribution. Here different hybridization temperatures (4°, RT,
37° and 60˚C) were examined applying on 2.5 µM oligo samples. Again two different
salt concentrations were assessed.
The result show considerable effect of hybridization temperature for assembling
longer constructs, as it is observable that longer concatemers has been formed in
higher hybridization temperatures. Again the optimistic effect of high salt
concentration is clear.
Figure. 18. 2.5% Agarose electrophoresis, Different
hybridization times.

4. Results & Discussion
_____________________________________
33
2.5 µM oligo, 5mM phosphate buffer, 1h
hybridization time at RT, gel run at 4V/cm for 3h.
4.1.4 Different oligo concentrations
Figure.21 shows results of testing different oligonucletide concentrations (2.5, 5,
10 and 20 µM). It is apparent that increasing of oligo concentration helps to form
longer concatemers, these results are in agreement with the previously published
reports (Simonova, Vladimirova, Zenkova, & Vlassov, 2006).
It is clear from the gel in Figure.21 that high salt concentration facilitates the
formation of longer concatemers with better efficiency even in low oligonucleotide
concentrations.
Figure. 19. 2.5% Agarose electrophoresis,
Different hybridization temperatures
4. Results & Discussion
_____________________________________
34
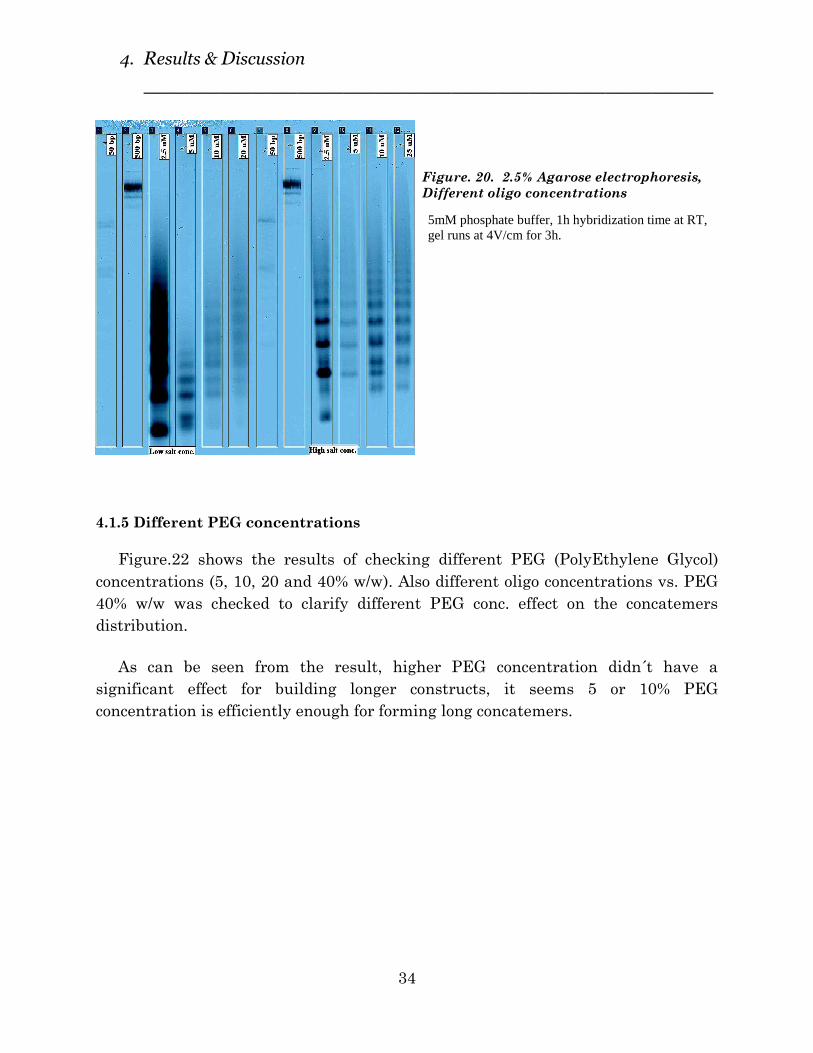
5mM phosphate buffer, 1h hybridization time at RT,
gel runs at 4V/cm for 3h.
4.1.5 Different PEG concentrations
Figure.22 shows the results of checking different PEG (PolyEthylene Glycol)
concentrations (5, 10, 20 and 40% w/w). Also different oligo concentrations vs. PEG
40% w/w was checked to clarify different PEG conc. effect on the concatemers
distribution.
As can be seen from the result, higher PEG concentration didn´t have a
significant effect for building longer constructs, it seems 5 or 10% PEG
concentration is efficiently enough for forming long concatemers.
Figure. 20. 2.5% Agarose electrophoresis,
Different oligo concentrations

4. Results & Discussion
_____________________________________
35
5mM phosphate buffer, 1h hybridization time at RT,
gel runs at 4V/cm for 3h.
4.1.6 Different salt concentrations
In all previous experiments a 400 mM solution of NaCl was used as salt additive
and confirmed that, the presence of salt has a positive effect for constructing double-
stranded duplexes, via reduction of repulsion forces between the single-stranded
structures. In this experiment different concentrations of NaCl (50, 100, 200, 300
and 400 mM) were used to check the role of salt concentration itself.
For this experiment 2 µM oligonucleotide was used and the samples were
hybridized for 2 h before running in the gel.
As expected, salt addition was increased the length of DNA concatemer (see
figure.23), but looking more carefully into the results, illustrates that maximum
effect of salt concentration is until 200 mM , beyond this value, addition of higher
salt concentration has less effect on size distribution of formed concatemers.
Figure. 21 . 2.5% Agarose electrophoresis,
Different PEG concentrations

4. Results & Discussion
_____________________________________
36
5mM phosphate buffer, 2 h hybridization times at RT,
gel runs at 4V/cm for 3h.
4.2 Polyacrylamide electrophoresis
All PAGE experiments (5% & 10% native and denaturing) were performed in
1×TBE buffer (50 mM Tris, 50 mM borate, 1.25 mM EDTA, pH 8.2). Native PAGE
was performed at 8V/cm for 30 min and urea-denaturing PAGE was performed at
70˚C at 8V/cm for 30 min. O'RangeRuler™ 50 bp and 500 bp DNA ladders from
Fermentas were used as size standards.
All samples were post-stained by Syber gold solution (5 µl in 50 ml MilliQ-
water). For scanning the gels, a Typhon 9410 scanner with laser excitation
wavelength at 488 nm and a 520 BP 40 emission filter was used.
4.2.1 Native PAGE
Figure.24 (A) shows 5% native PAGE for ligated samples. Different ligation
times (30min, 2h, 4h and overnight) were examined for 20 µM oligonucleotide
samples (lanes1,2,3 and 4 respectively). In lane 5, 10 min heating time and
overnight ligation time and in lane 6, 20 min heating time and overnight ligation
time was checked. Lane 7 is 500 bp ladder standard and lane 8, GeneRuler™ Ultra
Low Range DNA ladder.
Figure. 22. 2.5% Agarose electrophoresis,
Different NaCl concentrations

4. Results & Discussion
_____________________________________
37
(A) (B)
(A) Ligation with T4 Ligase, 25 µM oligo, gel run at 8V/cm for 30 min. (B) Heated vs. Non-heated
samples, 30 min hybridization, gel run at 8V/cm for 35 min.
Figure 24(A), clearly indicates that increasing temperature (from 5 to 20 min)
doesn’t affect the ligation efficiency remarkably, this assumption proves in Figure
25(B) where lanes 3 and 4 are samples without heating.
Figure.24 (A) clearly confirms the formation of long linear concatemers after
ligation.
Figure. 23. 5% Native Polyacrylamide electrophoresis

4. Results & Discussion
_____________________________________
38
(A) (B) Ligation with T4 Ligase, 25 µM oligo, different ligation times, gel run at 8V/cm for 30 min. (A)
without formamide addition, (B) formamide addition
Figure. 25 show 5% urea PAGE experiment for different ligation times (30 min, 2, 4
and 24 h). 25 µM oligo was used in two different experiments, in the first
experiment (Figure.25A) formamide was not added to the samples, but in second
experiment (Figure.25B) formamide was added to all samples before running.
Figure. 24. 5% Urea-denaturing Polyacrylamide electrophoresis

4. Results & Discussion
_____________________________________
39
4.3 Size distribution and intensity analysis
This section involves a detailed analysis for some of the selected results which
enable us to have a better understanding about size distribution and intensity of
formed double-stranded DNA concatemers.
As discussed in previous section about the role of salt addition and its positive
effect on size length, it was decided to do the analysis only for high salt
concentration results.
Two parallel assessments have been done, first quantification of the distributed
bands (each band corresponds to specific size length) and second the intensity
analysis of these bands which signify the amount of different-sized fragments. Four
results among various experiments have picked for detailed analysis, including the
results for different oligo concentrations, different hybridization times, different
hybridization temperatures and different salt concentrations.
Comments and discussions were mentioned in previous sections, mostly are
based on following analysis, so in this part we just try to underline some important
remarks which are more noticeable from the derivative charts.

4. Results & Discussion
_____________________________________
40
Lanes 2-6 are 2.5, 5, 10 and 20 µM oligos
respectively Figure. 27 show higher intensity for
2.5 µM oligo but almost longer length
sizes for higher oligo concentrations.
5µM oligo has lowest intensity and
fewer bands.
(A) Intensity analysis for four different DNA fragments (200,300,350 and 450bp) (B) Size
distribution analysis, 1-10 is the number of distributed bands for different oligo concentrations
0
100
200
300
400
500
600
700
800
900
1000
2.5 µm 5 µm 10 µm 20 µm
Size
of
DN
A f
ragm
ents
(b
p)
Oligo Conc. (µM)
Different oligo concentrations- High salt
1 2 3 4 5 6 7 8 9 10
Nu
mb
er o
f B
and
s
(B)
Figure. 26. Size distribution of
different oligo concentartions
Figure. 27. Size distribution and intensity analysis of Fig.26
0
5
10
15
20
25
30
35
40
Inte
nsi
ty
Миллионы
Oligo conc. (µM)
200
300
350
450
5 10 20 2.5 (A)

4. Results & Discussion
_____________________________________
41
Lanes 2-6 represent 72, 48, 24 and 2h respectively Higher intensity belongs to 2h
hybridization time, it seems after 24 h
hybridization, length size and number of
fragments doesn't change significantly.
(A) Intensity analysis for three different DNA fragments (150,200 and 250bp) (B) Size distribution
analysis, 1-11 is the number of distributed bands for different hybridization times
Figure. 28. Size distribution of different
hybridization times
0
5
10
15
20
25
30
35
40
45
50
Inte
nsi
ty Миллионы
Times (h)
250 bp
200 bp
150 bp
72 h 48 h 24 h 2 h (A)
0
200
400
600
800
1000
1200
1400
1600
1800
72 h 48 h 24 h 2 h
Size
of
DN
A f
ragm
ents
(b
p)
Hybridizatio times (h)
Different hybridization times
1 2 3 4 5 6 7 8 9 10 11
Nu
mb
er o
f b
and
s
(B)
Figure. 29. Size distribution and intensity analysis of Fig.28

4. Results & Discussion
_____________________________________
42
Lanes 2-5 are 4°, RT, 37° and 60°C respectively
It appears that higher temperature helps
to form longer DNA fragments, also more
intensity for constructs were formed at
60°C, but there is slight difference
between room temperature and incubation at
37°C.
(A) Intensity analysis for four different DNA fragments (200,250,300 and 350bp) (B) Size
distribution analysis, 1-6 is the number of distributed bands for different hybridization temperatures
Figure. 30. Size distribution of different
hybridization temperatures
0
100
200
300
400
500
600
700
800
900
1000
4˚C RT 37˚C 60˚C
Size
of
DN
A f
ragm
ents
(b
p)
Temperature (˚C)
Different hybridization Temp.
1 2 3 4 5 6
Nu
mb
er o
f b
and
s (B)
0
10
20
30
40
50
60
Inte
nsi
ty
Миллионы
Temperature (˚C)
200 bp
250 bp
300 bp
350 bp
4˚C RT 37˚C 60˚C
(A)
Figure. 31. Size distribution and intensity analysis of Fig.30

4. Results & Discussion
_____________________________________
43
Lanes 1-5 are 400, 300, 200, 100, 50 mM salt
respectively, lane 6 is no-salt condition
As discussed before, it seems that 100-
200 mM salt concentration has
sufficient effect for assembling long
fragments. The only influence of
higher salt concentration is higher
intensity of formed bands.
(A) Intensity analysis for four different DNA fragments (125,175,225 and 300bp) (B) Size
distribution analysis, 1-9 is the number of distributed bands for different salt concentrations
0
100
200
300
400
500
600
700
800
400 300 200 100 50 No-salt
Size
of
DN
A f
ragm
ents
(b
p)
Salt conc. (mM)
Different salt concentrations 1
2
3
4
5
6
7
8
9
Nu
mb
er o
f b
and
s
(B)
0
5
10
15
20
25
30
35
Inte
nsi
ty
Миллионы
Salt conc. (mM)
125 bp
175 bp
225 bp
300 bp
400 50 100 200 300
(A)
Figure. 32. Size distribution of different
salt concentraions
Figure. 33. Size distribution and intensity analysis of Fig.32

4. Results & Discussion
_____________________________________
44
4.4 QCM-D
QCM-D experiment was performed for assembling a 400 bp cocatemer. As reviled
before in section 3, first a layer of streptavidin was covered the surface, then a
biotin-cleavable of AB (cleavable duplex) sequence was bounded to the streptavidin
and then cleavable A´added and after this addition, the stepwise addition of
A´B´and AB was done until a 400 bp strand was formed. Between any additions a
rinsing step was run.
Figure.34 shows the result of QCM-D experiment. The blue line indicates the
changes in resonance frequency (decreasing) due to added mass and formation of
strands and the red line is dissipation changes (increasing). Different curves
indicate frequency and dissipation data from different harmonics.
Figure. 34. QCM-D data

4. Results & Discussion
_____________________________________
45
The result shows that the linear concatomers were formed on the surface
productively. For checking of size distribution of formed structures, the strand could
be cleaved off and investigated by gel electrophoresis.

5. Conclusion
_____________________________________
46
5. Conclusion In this project formation of the concatemeric duplexes at different hybridization
conditions have been studied. Two 50-mer synthesized oligunocletides employed as
bottom-up material for assembling long linear double-stranded DNA concatemers in
solution and long linear concatemers with different lengths were effectively
constructed.
For increasing the length, different conditions were assessed to achieve an
optimized protocol, such as oligo concentration, hybridization time and salt
concentration, among them, it seems salt concentration enhances the efficiency of
duplex formation sensibly. Comparing length of formed concatemers in presence
and in the absence of salt, confirmed that addition of enough concentration of salt,
forms similarly long concatemers either in shorter hybridization time and lower
oligo concentration, therefore in absence of salt or low salt concentration, higher
oligo concentration and higher hybridization time is needed for assembling long
concatemers. Ligation also was employed as a tool for joining the nicks between
formed concatemers.
QCM-D was used for assembling of concatemers on planar surface (a 400 bp
strand was formed by this technique as an example for studying). Maybe one of the
advantages of QCM-D is that more control is possible during assembling process,
unlike hybridization in bulk solution, that a variety of concatemers form with
different length distribution. Washing steps also help to form just a limited range of
concatemers on surface. But a major drawback of this method is the long time of
assembling route, it takes hours to build a hundred base-pairs strand (in our case it
took 7 h and 30 min to build a 400 bp stand).
This work was a bottom-up approach for designing specific-sequence DNA
constructs for studying binding thermodynamics and kinetics on a single molecule
level.

6. Perspectives
_____________________________________
47
6. Perspectives As mentioned before sequence-specific interaction of different ligands with DNA
molecule has very important role in different branches of bioscience. The primary
building block for investigating this interaction is to construct longer DNA
sequences for further ligand binding studies.
During my thesis work, I took great advantages of gel electrophoresis as a tool
for in-depth characterization of formed constructs by varying incubation conditions
to get the optimized conditions for hybridization in bulk. Concatemers were formed
by varying many different conditions for hybridization and ligation. Our intention
was to accomplish the experiments in an optimized condition (for instance in
shorter time or lower concentration by employing various strategies), but such an
optimization is greatly dependent to a variety of parameters, some of them are not
controllable in parallel or are out of control.
Actually the most part of my work involved nucleic acid thermodynamics (DNA
hybridization, denaturation and annealing) which significantly is related to the
melting temperature (Tm) of DNA. Tm itself depends on the length and sequence of
DNA molecule. Maybe more researches related to Tm and parameters influence
melting temperature is required, for instance our focus in this project was set on
AT-rich sequences, but higher temperature is needed for GC-content sequences, also
Tm depends on the solvent conditions, for instance higher salt concentrations (e.g.
NaCl) increases the Tm, because the positive sodium ions, shield the negative
charges of the phosphate groups on the DNA backbone and repelling of bonds will
decrease, but some organic solvents lower the Tm by increasing the repelling
actions.
Another critical aspect of my thesis work was QCM-D technique for attaching
the formed concatemers on surface. The long time of assembling procedure and the
yield of the final structure are important factors that should be considered. A
suggestion for increasing the synthesis yield (by increasing surface area) and a
faster assembly is performing the experiment on gold particles instead of planar
surface.

6. Perspectives
_____________________________________
48
Finally, the last question is changing the ligation strategy to “Click Nucleic Acid
Ligation” by the copper-catalyzed azide-alkyne (CuAAC) reaction. As recently a
published report from (El-Sagheer & Brown, 2012) has mentioned the procedure of
a biocompatible click DNA linkage. It seems this method is more efficient and well-
suited with large scale synthesis.
Future directions
This thesis work was part of a major project, which will focus on improving our
understandings about DNA-ligand interaction on single molecule level. In fact this
work was primary steps for manipulating DNA constructs with desired properties,
so a lot of works still has to be done. The next step, is studying elastic behaviour of
formed duplexes by mechanical stretching using optical tweezers. Also, the other
main part of whole project is investigation of sequence-dependent binding of these
constructs to different ligands, such as functional proteins, therapeutic agents or
specific drugs. Among them, binuclear ruthenium complexes (which exhibit a
remarkable sequence specific binding properties to DNA) are very interesting target
compounds, but at the first stage, Actinomycin D (Act D) as an important
antineoplastic antibiotic that inhibits cell proliferation, specifically will be
examined. Hopefully this project will be a step forward, in the field of DNA-ligand
interaction, an area with great potential and a wide range of future applications.

7. Acknowledgments
_____________________________________
49
7. Acknowledgments First of all I would like to thank Professor Björn Åkerman for allowing me to do
my thesis project in his lab. It was a great opportunity for me to work at biophysical
chemistry department, a place I learned a lot, met different people and had a
chance to discover matters I had never experienced in my life!
My gratitude goes to my supervisor Lu sun, for all the help and guidance during
my project, thanks to answer even my simple questions with patience and your
eternal smile!
I would also like to thank everyone at the division of Physical Chemistry for
helping me and made a warm and friendly working environment, and also all
diploma workers in that dark room! Although that room had no windows but with
you it was always brightened.
During my time at Chalmers, I had really everlasting memories, good friends,
great teachers and fantastic atmosphere, a university I really recommend for
studying.
Lastly, but more importantly, I would like to thank my family, those whom I
respect and admire them always, who have supported, encouraged and motivated
me during my studies. My deepest appreciation belongs to my dear parents,
especially my beloved mother, thank you for your everlasting attention and
kindness although I was always far from you but you are in my heart forever. This
thesis work is dedicated to you...

8. References
_____________________________________
50
8. References
Åkerman, B. (1998). Effects of Supercoiling in Electrophoretic Trapping of Circular DNA in
Polyacrylamide Gels. Biophysical Journal , 74 (6), 3140-3151.
Allen, R., Saravis, C., & Maurer, H. (1984). Gel Electrophoresis and Isoelectric Focusing of
Proteins, Selected Techniques. Berlin.New York: Walter de Gruyter.
Babskii, V. G., Zhukov, M. Y., & Yudovich, V. I. (1989). Mathematical Theory of
Electrophoresis. New York: Consultants Bureau.
Berkner, K. L., & W. R. (1979). Quantitation of the various termini generated by type II
restriction endonucleases using the polynucleotide kinase exchange reaction. J. Biol Chem. , 254,
2561-4.
Borejdo, J., & DeFea, K. (1988). The orientation of DNA fragments in the agarose gels.
Analytical Biochemistry , 174 (2), 393-398.
C.Seeman, N. (2003, January 23). DNA in a material world. Nature , 421, pp. 427-431.
Chaires, J. B. Drug-DNA Interactions. (1998, Ed.) Curr. Opin. Struc. Biol., , 8, 314-320.
Chavali, S., Mahajan, A., Tabassum, R., & Maiti, S. (2005). Oligonucleotide properties
determination and primer designing: a critical examination of predictions. Bioinformatics , 21
(20), 3918-3925.
CRICK, F. (1970). Central Dogma of Molecular Biology. Nature , 227 (5258), 561-563.
Dean, N. (2001). Functional genomics and target validation approaches using antisense
oligonucleotide technology. Curr. Opin. Biotechnol. , 12, 622-625.
Denny, W. (1989). DNA-intercalating ligands as anti-cancer drugs: prospects for future design.
Anticancer Drug Des. , 4, 241-63.
Dixon, M. C. (2008). Quartz Crystal Microbalance with Dissipation Monitoring: Enabling Real-
Time Characterization of Biological Materials and Their Interactions. J Biomol Tech , 19 (3),
151-158.
El-Sagheer, A. H., & Brown, T. (2012). Click Nucleic Acid Ligation: Applications in Biology
and Nanotechnology. Acc. Chem.
Frank, R., & Köster, H. (1979). DNA chain length markers and the influence of base compositin
on electrophoretic mobility of oligodeoxyribonucleotides in polyacrylamide-gels. 6.
Frank, R., Müller, D., & Wollf, C. (1981). Identification and suppression of secondary structures
formed from deoxy-oligonucleotides during electrophoresis in denaturing polyacrylamide-gels.
Nucleic Acid Research , 9 (19).

8. References
_____________________________________
51
Gaastra, W., & Hansen, K. (1985). Ligation of DNA with T4 DNA Ligase. In NUCLEIC ACIDS,
Methods in Molecular Biology (Vol. 2, pp. 225-230).
Gothelf, K. V., & Brown, R. S. (2005). A Molecular Approach to DNA-Programmed Self-
Assembly of Macromolecular Nanostructures. Chem. Eur.J , 11, 1062-1069.
Gothelf, K. V., & H. LaBean, T. (2005). DNA-programmed assembly of nanostructures. Org.
Biomol. Chem., , 3, 4023-4037.
Helfman, D., Fiddes, J., & Hanahan, D. (1987). Directional cDNA cloning in plasmid vectors by
sequential addition of oligonucleotide linkers. Meth.Enzymol , 152, 349-59.
J.Moreau, & Matyash-Smirniaguina, L. (1981). Systematic punctuation of eukaryotic DNA by
A+T-rich sequences. Biochemistry , 78, 1341-1345.
Johannsmann, D. (2008). Viscoelastic, mechanical, and dielectric measurements on complex
samples with the quartz crystal microbalance. Phys. Chem. Chem. Phys , 10, 4516-4534.
Kirschstein, O., Sip, M., & Kittler, L. (2000). Quantitative and sequence-specific analysis of
DNA-ligand interaction by means of fluorescent intercalator probes. J Mol Recognit. , 13 (3),
157-63.
Lehnman, I. (1974, November 29). DNA Ligase: Structure, Mechanism, and Function. Science ,
186, pp. 790-797.
Li, Y., & D.TSENG, Y. (2004). Controlled assembly of dendrimer-like DNA.
MOREAU, J., MARCAUD, L., MASCHAT, F., KEJZLAROVA-LEPESANT, J., LEPESANT,
J., & SCHERRER, K. (1982). A + T-rich linkers define functional domains in eukaryotic DNA.
295, 260-62.
Olejnik, J., Krzymańska-Olejnik, E., & Rothschild, K. J. (1996). Photocleavable biotin
phosphoramidite for 5'-end-labeling, affinity purification and phosphorylation of synthetic
oligonucleotides. Nucleic Acids Res , 24 (2), 361-366.
Palchaudhuri, R., & J Hergenrother, P. (2007). DNA as a target for anticancer compounds:
methods to determine the mode of binding and the mechanism of action. Current Opinion in
Biotechnology , 18 (6), 497-503.
Pascal, J. M., J. O'Brien, P., E. Tomkinson, A., & Ellenberger, T. (2004, November 25). Human
DNA ligase I completely encircles and partially unwinds nicked DNA. Nature , 432, pp. 473-
478.
Plunkett, M. A., Wang, Z., Rutland, M. W., & Johannsmann, D. (2003, July 15). Adsorption of
pNIPAM Layers on Hydrophobic Gold Surfaces, Measured in Situ by QCM and SPR. Langmuir
, 19 (17), pp. 6837-6844.

8. References
_____________________________________
52
PULLMAN, B. (1985). Specifity in the interaction of non intercalative groove binding ligands
with nucleic acids. J. Biosci., , 8, 681-688.
R.Fox, K. (1997). Drug-DNA Interaction Protocols. Humana Press Inc.
Rodahl, M., & Kasemo, B. (1996). A simple setup to simultaneously measure the resonant
frequency and the absolute dissipation factor of a quartz crystal microbalance. Rev. Sci. Instrum ,
67 (9), p. 3238.
Schwartz, D., & Cantor, C. (1984). Separation of yeast chromosome-sized DNAs by pulsed field
gradient gel electrophoresis. Cell. , 37 (1), 67-75.
Seeman, N. C. (1998). DNA NANOTECHNOLOGY: Novel DNA Constructions. Biophys.
Biomol. Struct. , 27, 225-48.
Shi, Q., & Jackowski, G. (1998). Gel Electrophoresis of Proteins: A Prectical Approach. Oxford
University Press.
Simonova, O. N., Vladimirova, A. V., Zenkova, M. A., & Vlassov, V. V. (2006). Enhanced
cellular binding of concatemeric oligonucleotide complexes. Biochimica et Biophysica Acta
(BBA) - Biomembranes , 1758 (3), 413-418.
Socransky, S. S., Haffajee, A., Smith, C., & Martin, L. (2004). Use of checkerboard DNA–DNA
hybridization to study complex microbial ecosystems. Oral Microbiology and Immunology , 19
(6), 352-362.
Southern, E. M. (2002). Denaturing Gel Electrophoresis of RNA and DNA Using Urea-
Polyacrylamide Gels. Encyclopedia of Life Science .
Sturm, J., Plusen, A., & Weill, G. (1996). Dynamics of single-stranded DNA in polyacrylamide
gels during pulsed field gel electrophoresis. A briefringence study. Biophysical Chemistry , 58,
151-155.
Takahashi, M., Baba, K., & Ogino, T. (1969). Estimation of relative molecular length of DNA by
electrophoresis in agarose gel. Biochimica et Biophysica Acta (BBA) - Nucleic Acids and Protein
Synthesis , 174 (1), 183-187.
TOMBS, M. P. (1965). The Interpretation of Gel Electrophoresis. Analytical Biochemistry , 13,
121-132.
Vesterberg, O. (1993). A Short History of Electrophoretic Methods. Electrophoresis , 14, 1243-
1249.
Wanunu, M., & Tor, Y. (2012). Methods for studying Nucleic acid/Drug Interactions. CRC
Press.
8. References
_____________________________________
53
Watson, J., & Crick, F. (1953). A Structure for Deoxyribose Nucleic Acid. Nature , 171, 737-
738.
Wilson, K., & Walker, J. (2010). Principles and Techniques of Biochemistry and Molecular
Biology (Seventh ed.). (K. Wilson, Ed.) CAMBRIDGE UNIVERSITY PRESS.
Y.Chen, A., Yu, C., Gatto, B., & F.Liu, L. (1993). DNA minor groove-binding ligands:
Adifferent class of mammalian DNA topoisomorase I inhibitors. Proc.Natl.Acad.Sci. USA , 90,
8131-8135.
Zhang, D. Y., & Seelig, G. (2011). Dynamic DNA nanotechnology using strand displacement
reactions.

9. Appendix
_____________________________________
54
9. Appendix
9.1 Reagents & Chemicals
The list of whole reagents and chemicals were used in this project.
Name Formula/Cat. No Company
Acrylamide/Bis solution* #161-0146 BIO-RAD
Agarose D1 Low EEO 8008 CONDA
Ammonia Solution 25% NH3 Scharlau
APS (NH4)2S2O8 BIO-RAD
Boric acid H3BO3 SIGMA
500bp DNA Ladder #SM0643 Fermentas
50bp DNA Ladder #SM0613 Fermentas
Ultra Low Range DNA Ladder #SM1213 Fermentas
EDTA C10H14N2Na2O8.2H2O Fluka
Formamide HCONH2 -
Hydrogen Peroxide 30% H2O2 Scharlau
Sodium chloride NaCl SIGMA
Oligonucleotide 50-mer A9661 atdbio
Oligonucleotide 50-mer A9662 atdbio
PEG-8000 #57H0144 SIGMA
Photassium phosphate monobasic K2HPO4 .H2O Sigma/Aldrich
Sodium phosphate dibasic Na2HPO4.2H2O Sigma/Aldrich
SYBER® gold #S11494 invitrogen
T4 DNA Ligase M0202L BioLabs
T4 Polynucleotide Kinase M0201S BioLabs
TEMED #161-0800 BIO-RAD
Trizma base C4H11NO3 SIGMA
Urea CH4N2O SIGMA
SYBER® gold #S11494 Invitrogen
YO-PRO®-1 - Invitrogen
*Acrylamide (CH2CHCONH2) and Bisacrylamide (N,N-methylenebisacrylamide) C7H10N2O2

9. Appendix
_____________________________________
55
9.2 Instruments
Name Model/Company
Balance PL 300/ Mettler
Electrophoresis Power supply EPS 601- GE Healthcare
Electrophoresis System BIO-RAD Mini-PROTEIN® Tetra System
Gel Scanner Typhon 9410/ GE Healthcare
Heating block QBD2- Grant Instruments Ltd
QCM-D Q-Sense E4- Biolin Scientific / Q-Sense
Spectrophotometer Cary 5000/ Varian
Water Bath -

9. Appendix
_____________________________________
56
9.3 Agarose gel electrophoresis results
(A) (B)
Figure.9.3.1 2.5% Agarose electrophoresis, 2.5 µM oligos, different hybridization temperatures,
(A) 5 mM PSB, (B) 200 mM PSB ,gel run at 4V/cm for 3h.
Figure.9.3.2 2.5% Agarose electrophoresis, 1.25 µm oligos, different hybridization temperatures, gel
run at 4V/cm for 3h.

9. Appendix
_____________________________________
57
(A) (B)
Figure.9.3.3 2.5% Agarose electrophoresis, heating vs. non-heating for differnrt oligo
concentrations, (A) 5 min heating, (B) 10 min heating, 200 mM phosphate buffer, 1h hybridization
time at RT,gel run at 4V/cm for 3h.
(A) (B)
Figure.9.3.4 2.5% Agarose electrophoresis, 1.25 µM oligos, two different protocols for different
hybridization times (1, 2, 3 and 4h) (A) same starting point (B) same ending point, gel run at 4V/cm
for 3h.
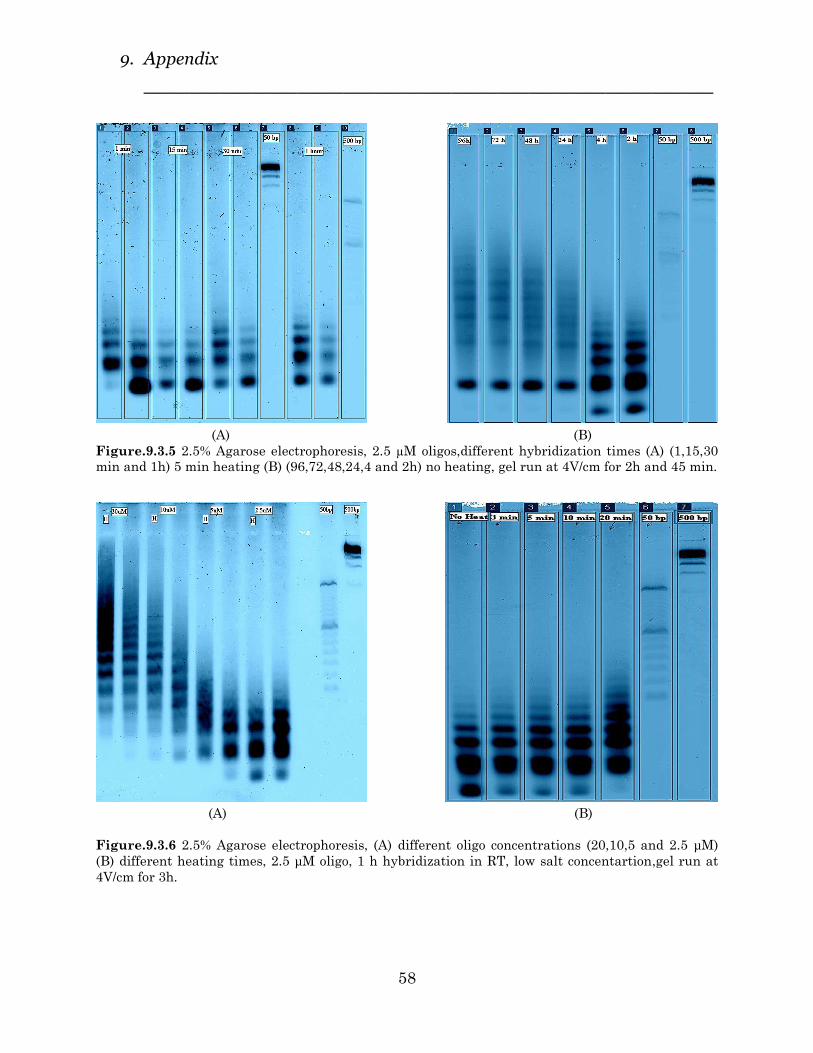
9. Appendix
_____________________________________
58
(A) (B)
Figure.9.3.5 2.5% Agarose electrophoresis, 2.5 µM oligos,different hybridization times (A) (1,15,30
min and 1h) 5 min heating (B) (96,72,48,24,4 and 2h) no heating, gel run at 4V/cm for 2h and 45 min.
(A) (B)
Figure.9.3.6 2.5% Agarose electrophoresis, (A) different oligo concentrations (20,10,5 and 2.5 µM)
(B) different heating times, 2.5 µM oligo, 1 h hybridization in RT, low salt concentartion,gel run at
4V/cm for 3h.

9. Appendix
_____________________________________
59
9.4 Polyacrilamide gel electrophoresis results
(A) (B) Figure.9.4.1 (A) 5% Native PAGE electrophoresis, Ligation of 20 µM oligo (B) 5% urea PAGE
electrophoresis, Ligation of 20 µM oligo,gel run at 8V/cm for 30 min.
Related Documents


![NANOTECHNOLOGY BASED ON DNA - UAB Barcelona · structural DNA nanotechnology. Nat.Nanotechnol.6, 763 –72 (2011). [5]Abu-Salah, K. M., Ansari, A. a & Alrokayan, S. a. DNA-based applications](https://static.cupdf.com/doc/110x72/5f9501840ebb5247471f2ebf/nanotechnology-based-on-dna-uab-barcelona-structural-dna-nanotechnology-natnanotechnol6.jpg)