DNA Nanotechnology and Supramolecular Chemistry in Biomedical Therapy Applications Peter James Cail A thesis submitted to the University of Birmingham for the degree of Doctor of Philosophy School of Chemistry University of Birmingham September 2017

Welcome message from author
This document is posted to help you gain knowledge. Please leave a comment to let me know what you think about it! Share it to your friends and learn new things together.
Transcript
DNA Nanotechnology and Supramolecular Chemistry in
Biomedical Therapy Applications
Peter James Cail
A thesis submitted to the University of Birmingham for the degree of Doctor of
Philosophy
School of Chemistry
University of Birmingham
September 2017
University of Birmingham Research Archive
e-theses repository This unpublished thesis/dissertation is copyright of the author and/or third parties. The intellectual property rights of the author or third parties in respect of this work are as defined by The Copyright Designs and Patents Act 1988 or as modified by any successor legislation. Any use made of information contained in this thesis/dissertation must be in accordance with that legislation and must be properly acknowledged. Further distribution or reproduction in any format is prohibited without the permission of the copyright holder.
i
Acknowledgements
On completing this thesis, I would firstly like to thank my supervisor Professor Mike Hannon
for giving me the PhD opportunity and for all his support and help over the four years. My time
would also have been much harder had it not been for all the friends made in the Hannon group.
To past members, for making me feel welcome when I first started I would like to thank Jeni,
Ashleigh and Lois for all their advice and jokes, making work fun from the start and for never
minding when I forgot to bring cake in on my cake week. To current members, I would like to
thank Lucia, Callum and Rich for great chats and lunches, on top of all the help and time they
gave me.
This thesis would also not be complete without help and valuable training. I would like to thanks
Dr Nik Hodges from School of Biosciences, University of Birmingham for all his training with
flow cytometry and advice presenting biological data, as well as the use of his facilities on the
4Th floor of the bioscience building. Thanks also go to Dr Luke Williams from cancer science
unit, University of Birmingham for his time taken to train me to culture cells professionally.
The confocal microscopy images presented here would not have been possible without the
training of Dr Alessio di Maio from the BALM institute, University of Birmingham, on the use
of a confocal microscope. Thanks also go to Dr Doug Browning from the IMI, University of
Birmingham, for the advice handling radioactive material and for the use of the groups hot lab
facility.
Collaborations were integral to this thesis, and credit must go to Dr Wang Liying and Professor
Shao Fangwei from the Institute of Chemical Biology, Nanyang Technological University,
Singapore, for performing the AFM experiments found in this thesis. Thanks also go to Dr
Lucia Cardo from the Hannon group, University of Birmingham, for the opportunity to work

ii
with her on her exciting project which is outlined in chapter 5. I would also like to thank Jamie
Webster from the Protein Expression Facility for his help producing the EGFP mentioned in
chapter 6
Finally I would like to thank all my friends and family for all their support throughout my
lengthy student career. I would never have made it this far without all of them and for this
reason I dedicate this thesis to my family and friends.

iii
Declaration
The experimental work, observations and recommendations reported in this thesis are the
author’s unless specifically stated and have not previously been submitted as part of a degree
at the University of Birmingham or any other institution.
Peter Cail
September 2017
iv
List of Papers Published From this Thesis
1. P. J. Cail, W. Liying, A. Mucha, S. Phongtongpasuk, S. Fangwei and M. J. Hannon,
Cellular Delivery of a Supramolecular anti-cancer agent using a DNA Tetrahedron.
(Manuscript to be submitted)
2. L. Cardo, I. Nawroth, P.J. Cail, J.A. McKeating and M.J. Hannon, Metallo
supramolecular cylinders inhibit HIV-1 TAR-TAT complex formation and viral
replication in cellulo. (Manuscript under review)
v
Contents
Acknowledgments ...................................................................................................................... i
Author’s Declaration ............................................................................................................... iii
List of papers published from this thesis ............................................................................... iv
Contents ..................................................................................................................................... v
Abbreviations ........................................................................................................................... ix
Abstract ................................................................................................................................... xii
Chapter 1 Introduction ............................................................................................................ 1
1.1 DNA – An introduction .................................................................................................... 2
1.1.1 Discovery of DNA ..................................................................................................... 2
1.1.2 Different Structures of DNA ...................................................................................... 4
1.1.2.1 Helical DNA ....................................................................................................... 4
1.1.2.2 DNA Junctions ................................................................................................... 6
1.1.2.3 Guanine Quadruplex ........................................................................................... 7
1.1.3 Targeting DNA structure with small molecules......................................................... 8
1.1.3.1 Cisplatin and derivatives .................................................................................... 9
1.1.3.2 Intercalators ...................................................................................................... 11
1.1.3.3 DNA groove binders ......................................................................................... 14
1.1.3.4 G-quadruplex binders ....................................................................................... 18
1.1.3.5 Cylinder DNA binding ..................................................................................... 19
1.2 DNA Nanotechnology .................................................................................................... 25
1.2.1 Origins and methods of structural DNA nanotechnology ........................................ 25
1.2.2 Small 3D DNA structures ........................................................................................ 29
1.2.2.1 DNA Tetrahedron ............................................................................................. 31
1.2.3 DNA Origami ........................................................................................................... 35
1.3 DNA Nanotechnology in biological applications ........................................................... 40
1.3.1 DNA tetrahedron in cellular systems ....................................................................... 40
1.3.2 Biological applications of other DNA nanostructures ............................................. 44
1.4 Overview of Thesis ......................................................................................................... 47
1.5 References ....................................................................................................................... 49
vi
Chapter 2 Interaction of an iron supramolecular cylinder
with a DNA tetrahedron and a three way junction ............................................................. 62
2.1 Introduction ..................................................................................................................... 63
2.2 Results and Discussion ................................................................................................... 65
2.2.1 Part 1 – Cylinder 3WJ Binding ................................................................................ 65
2.2.2 Part 2a –Cylinder – DNA tetrahedron interaction .................................................... 75
2.2.2.1 DNA Tetrahedron synthesis and characterisation ............................................ 75
2.2.2.2 Polyacrylamide Gel Electrophoresis ................................................................ 75
2.2.2.3 DLS ................................................................................................................... 76
2.2.2.4 Atomic Force Microscopy ................................................................................ 77
2.2.3 Interaction between the cylinder and the tetrahedron .............................................. 80
2.2.3.1 Polyacrylamide Gel Electrophoresis ............................................................... 80
2.2.3.2 DLS ................................................................................................................... 82
2.2.3.3 Atomic Force Microscopy ................................................................................ 83
2.2.3.4 Stabilisation Effect ........................................................................................... 85
2.2.4 Part 2a – Assessing the different characteristics of the cylinder enantiomers ......... 87
2.2.4.1 Separating and Characterising cylinder enantiomers ....................................... 87
2.2.4.2 Circular Dichroism ........................................................................................... 88
2.2.4.3 Chiral Shift reagent – Λ - TrisPhat ................................................................... 90
2.2.5 Part 2b – Differences in enantiomer effects on the tetrahedron ............................... 93
2.2.5.1 Polyacrylamide Gel Electrophoresis ................................................................ 93
2.2.5.2 DLS ................................................................................................................... 94
2.3 Conclusions ..................................................................................................................... 96
2.4 Experimental ................................................................................................................... 97
2.5 References ..................................................................................................................... 107
Chapter 3 Biological Activity of the iron cylinder – DNA tetrahedron conjugate ......... 111
3.1 Introduction ................................................................................................................... 112
3.2 Results and Discussion ................................................................................................. 114
3.2.1 Cellular uptake ....................................................................................................... 114
3.2.2 Flow cytometry ...................................................................................................... 115
3.2.3 Confocal microscopy.............................................................................................. 119
vii
3.2.4 ICP-MS analysis ..................................................................................................... 122
3.2.5 Cell Toxicity – MTT assay .................................................................................... 126
3.3 Conclusions ................................................................................................................... 130
3.4 Experimental ................................................................................................................. 132
3.5 References ..................................................................................................................... 137
Chapter 4 DNA photocleavage with a ruthenium cylinder .............................................. 140
4.1 Introduction ................................................................................................................... 141
4.2 Results and Discussion ................................................................................................. 145
4.2.1 Plasmid Photocleavage ........................................................................................... 145
4.2.2 Photocleavage Mechanism ..................................................................................... 151
4.2.3 Photo cleaving the DNA tetrahedron ..................................................................... 153
4.2.4 Initial Photodynamic therapy testing...................................................................... 158
4.3 Conclusion .................................................................................................................... 162
4.4 Experimental ................................................................................................................. 163
4.5 References ..................................................................................................................... 168
Chapter 5 Targeting the trans-activating response element (TAR)
In the HIV virus to prevent replication ............................................................................. 172
5.1 Introduction ................................................................................................................... 173
5.2 Results and Discussion ................................................................................................. 173
5.2.1 Gel electrophoresis ................................................................................................. 179
5.2.2 ADP-1 Binding ....................................................................................................... 181
5.2.3 Inhibition of binding using a range of cylinders .................................................... 182
5.3 Conclusion .................................................................................................................... 185
5.4 Experimental ................................................................................................................. 186
5.5 References ..................................................................................................................... 189
Chapter 6 Conclusions and Further Work ........................................................................ 193
6.1 Conclusions and future work ........................................................................................ 194
6.1.1 Conclusions ............................................................................................................ 194
6.1.2 Future work ............................................................................................................ 196
6.1.2.1 Chapter 2 ........................................................................................................ 196
viii
6.1.2.2 Chapter 3 ........................................................................................................ 196
6.1.2.3 Chapter 4 ........................................................................................................ 197
6.1.2.4 Triggered release of an encapsulated cargo .................................................... 197
6.2 References ..................................................................................................................... 201
ix
Abbreviations
µL Micro litre
µM Micro molar
3D Three Dimensions
3WJ Three way junction
A Adenine
AFM Atomic force microscopy
ATP Adenosine tri phosphate
Bp Base pair
C Cytosine
CD Circular Dichroism
Cy5 Cyanine 5
d doublet
dd doublet of doublets
DLS Dynamic Light Scattering
DMEM Dulbecco's Modified Eagle's medium
DNA Deoxyribonucleic acid
dsDNA Double stranded DNA
ESI Electrospray Ionisation
x
FeCy Iron cylinder
G Guanine
HIV-1 Human immunodeficiency virus-1
HPLC High Performance Liquid Chromatography
IC50 Half maximal inhibitory concentration
ICP-MS Inductively coupled plasma mass spectrometry
K Kelvin
M Left handed helicate (minus)
MeOD Deuterated methanol
MeOH Methanol
MTT 3-(4,5-Dimethylthiazol-2-yl)-2,5-Diphenyltetrazolium Bromide
MW Molecular weight
MWCO Molecular weight cut off
NiCy Nickel cylinder
nM Nano molar
NMR Nuclear Magnetic Resonance
Oligo Oligonucleotide
P Right handed helicate (plus)
32P Phosphorus isotope 32
xi
PAGE Polyacrylamide gel electrophoresis
PDI Poly dispersity Index
PDT Photodynamic Therapy
ppb Parts per billion
RNA Ribonucleic acid
rpm Revolutions per minute
RPMI Roswell Park Memorial Institute medium
RuCy Ruthenium cylinder
s Singlet
ssDNA Single stranded DNA
T Thymine
TAR Trans Activator Response region
TAT Transactivator protein
td triple of doublets
TEMED Tetramethylethylenediamine
Tet Tetrahedron
TM Buffer Tris Magnesium Chloride Buffer
UV-Vis Ultraviolet-visible spectroscopy
xii
Abstract
The overall aim of this thesis is to investigate the combination of supramolecular cylinders with
DNA nanotechnology and assess any effects that can occur through binding and any
applications this could have in biomedical therapy applications. From this base it is hoped that
insight can be gained as to whether supramolecular chemistry can be used to create DNA nano-
machines, capable of triggered release of cargo.
The thesis begins with a review of DNA discovery, structure and binding by small molecules,
followed by a review of the field of DNA nanotechnology. By expanding on the field of DNA
nanotechnology recognition, chapters 2 and 3 will highlight the advantages of supramolecular
chemistry when combined with DNA nanotechnology in both nano-machines and inside cell
systems with a focus on DNA tetrahedral nanostructures. Chapter 4 researches the
photocleavage capabilities of a ruthenium cylinder and the possibilities of selective release and
photodynamic therapy using a DNA tetrahedron. Chapter 5 illustrates a new class of anti-viral
agents capable of structure recognition regardless of RNA sequence. The chapter focuses on
the inhibition of binding between the TAR RNA and ADP-1 peptide found in the HIV-1 virus.

1
Chapter 1
Introduction
2
1.1 DNA – An Introduction
1.1.1 Discovery of DNA
DNA was first isolated by Friedrich Miescher in 1869. The Swiss chemist discovered what he
called nuclein inside human white blood cells obtained from pus-coated bandages. By
separating this phosphorus rich nuclein from the surrounding proteins, he realised he had
discovered a new substance which started the track towards understanding DNA fully.1
Following on from this initial discovery many years later in 1919 Phoebus Levene, a Russian
biochemist put forward his polynucleotide theory, discovered through analysing hydrolysis
products of nucleic acids. He stated that nucleic acids were in fact long chains of nucleotides,
which turned out to be correct.2 Although the theory stated that nucleotides were long
identical repeats of the nucleotides, the idea however, aided further research.3
In 1950, a vital stepping stone was reported by Erwin Chargaff, he found from separating
DNA samples with paper chromatography, the ratios of nucleic acids were different
depending on the sample being analysed.4 From this he concluded that Phoebus Levene
cannot be correct and that DNA has varying sequences. He also found that the ratio between
the purines and the pyrimidines was 1:1 regardless of the sample source. Specifically he found
that adenine and thymine were in equal proportions and the same was true of guanine and
cytosine.4 This became known as ‘Chargaff’s rules’ and was instrumental in the eventual final
elucidation of the structure of DNA.5
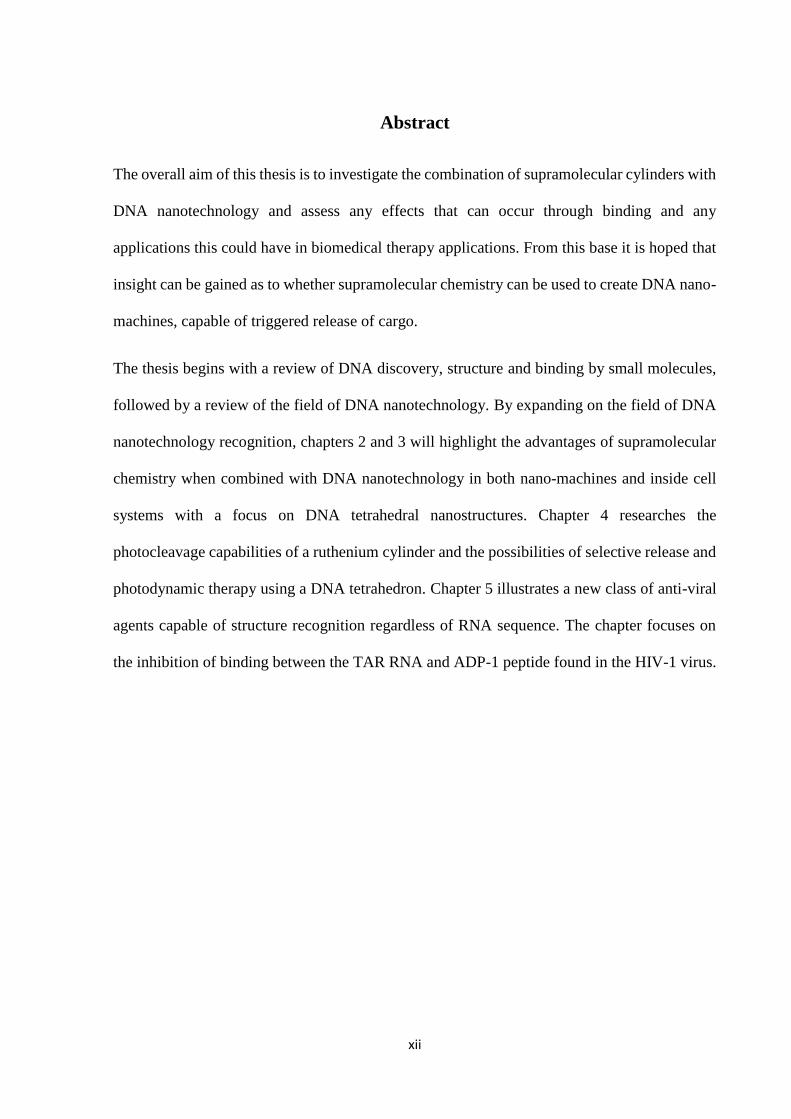
Following from this, two English chemists, Rosalind Franklin and Raymond Gosling
managed to produce the X-ray diffraction pattern of DNA in 1953 (Figure 1.1).6 This X
structure shown in the picture suggested that the structure of DNA must be a repeating
3
structure which is uniform in nature. The crystallography also gave measurements for the
width of DNA and therefore distances between the bases which would prove vital in
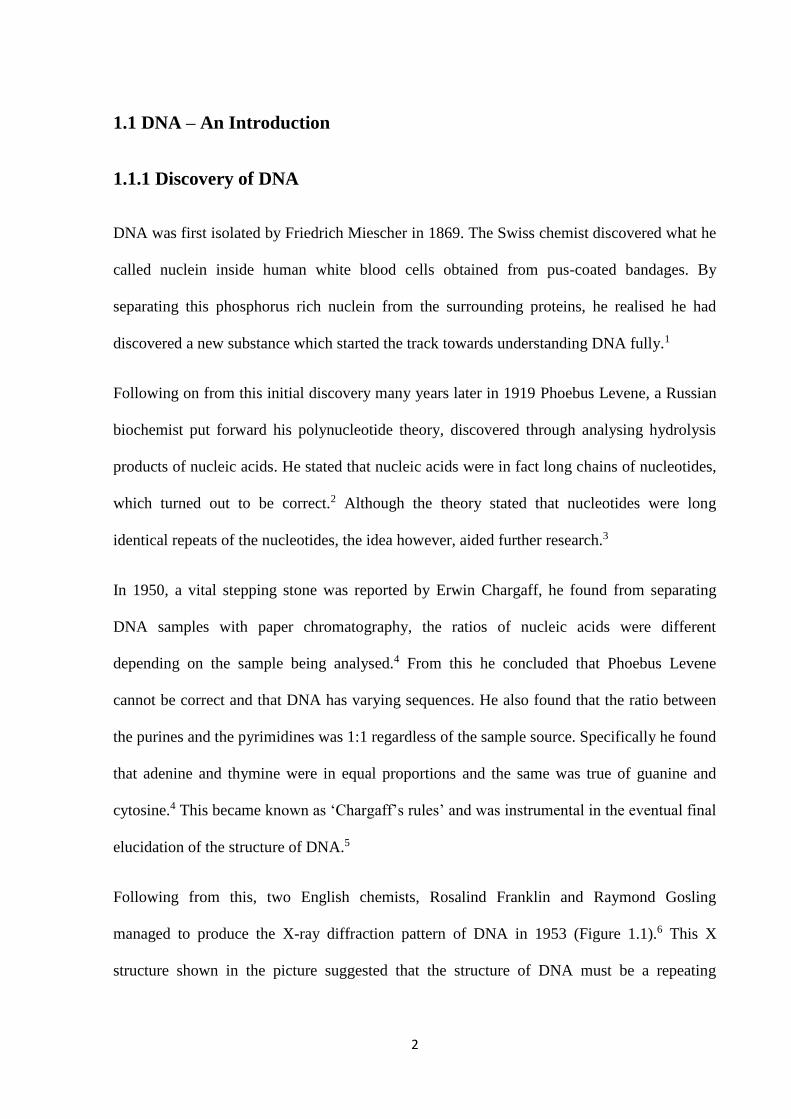
discovering the final structure. Finally, with these initial pieces of evidence in place, Watson
and Crick were able to propose their model of DNA in 1953.7 They proposed a right-handed
double helical structure, with the nucleotide bases hydrogen bonded down the centre,
surrounded by the phosphate-sugar backbone on the outside. Chargaff’s rule were also
followed by correctly pairing A to T and G to C, resulting in the observed ratios of 1:1
between the bases. Figure 1.2 shows the structure of DNA proposed by Watson and Crick in
1953.
Figure 1.1 - X-ray diffraction pattern of DNA produced by Franklin and Gosling. Taken from 6.
3
Figure 1.2 – Original model of Watson and Cricks structure of DNA. Photo from the Archives at Cold Spring Harbor Laboratory.
4
1.1.2 Different Structures of DNA
1.1.2.1 Helical DNA
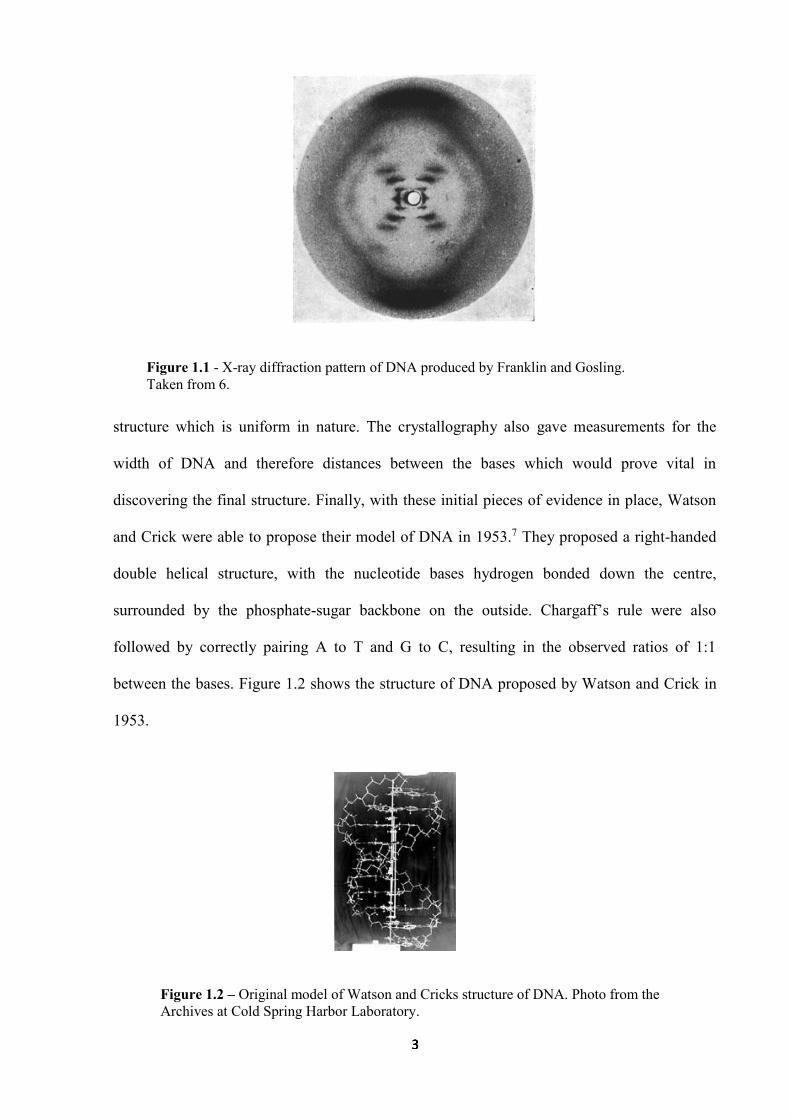
DNA has a huge variety of structures, but they mainly follow what is known as Watson-Crick
base-pairing. As discussed earlier, this is the pairing between A and T and between G and C.
This pairing is composed of hydrogen bonds between NH groups on one base and oxygen on
an adjacent base. Figure 1.3 illustrates this hydrogen bond pairing between these bases.8
The main form of helical DNA is known as B-DNA. Here, the bases shown above are bound
to a deoxyribose unit to form what is known as a nucleotide. These nucleotides are then linked
by a phosphate group to form long strands of nucleotides called an oligonucleotide. Two
complimentary strands (with regard to the above Watson-Crick base pairing) are hydrogen
bonded together as illustrated, with each base pair in the chains stacked with one above and
one below and stabilised further by favourable π interactions from the aromatic groups in the
bases. The bases are centralised due to their hydrophobicity and the stacking results in a
double helix structure. As the helix turns, a major groove and a minor groove is created, with
one of each per full turn of B-DNA. This full turn occurs across about 10-11 base pairs of
helix.9 In vivo this form of DNA is by far the most common, carrying the genetic information
Figure 1.3 – Drawing illustrating Watson-Crick base pairing between DNA nucleotides. Taken From 8.
5
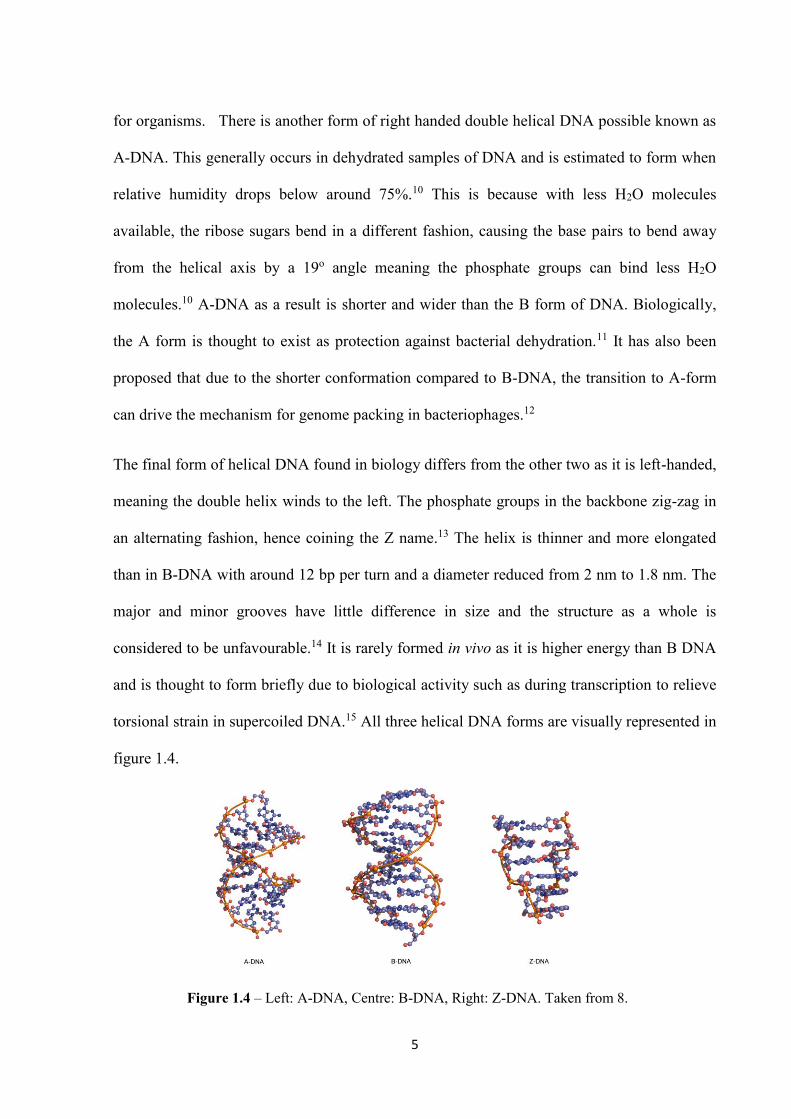
for organisms. There is another form of right handed double helical DNA possible known as
A-DNA. This generally occurs in dehydrated samples of DNA and is estimated to form when
relative humidity drops below around 75%.10 This is because with less H2O molecules
available, the ribose sugars bend in a different fashion, causing the base pairs to bend away
from the helical axis by a 19o angle meaning the phosphate groups can bind less H2O
molecules.10 A-DNA as a result is shorter and wider than the B form of DNA. Biologically,
the A form is thought to exist as protection against bacterial dehydration.11 It has also been
proposed that due to the shorter conformation compared to B-DNA, the transition to A-form
can drive the mechanism for genome packing in bacteriophages.12
The final form of helical DNA found in biology differs from the other two as it is left-handed,
meaning the double helix winds to the left. The phosphate groups in the backbone zig-zag in
an alternating fashion, hence coining the Z name.13 The helix is thinner and more elongated
than in B-DNA with around 12 bp per turn and a diameter reduced from 2 nm to 1.8 nm. The
major and minor grooves have little difference in size and the structure as a whole is
considered to be unfavourable.14 It is rarely formed in vivo as it is higher energy than B DNA
and is thought to form briefly due to biological activity such as during transcription to relieve
torsional strain in supercoiled DNA.15 All three helical DNA forms are visually represented in
figure 1.4.
Figure 1.4 – Left: A-DNA, Centre: B-DNA, Right: Z-DNA. Taken from 8.
6
1.1.2.2 DNA Junctions
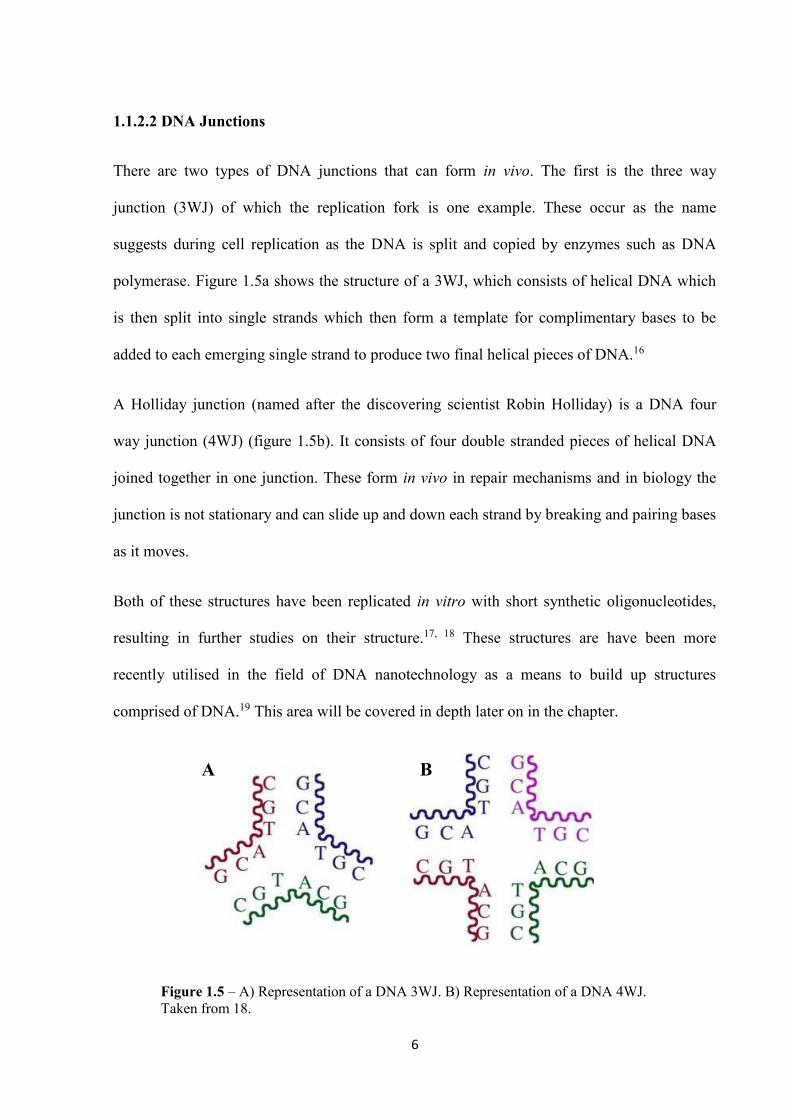
There are two types of DNA junctions that can form in vivo. The first is the three way
junction (3WJ) of which the replication fork is one example. These occur as the name
suggests during cell replication as the DNA is split and copied by enzymes such as DNA
polymerase. Figure 1.5a shows the structure of a 3WJ, which consists of helical DNA which
is then split into single strands which then form a template for complimentary bases to be
added to each emerging single strand to produce two final helical pieces of DNA.16
A Holliday junction (named after the discovering scientist Robin Holliday) is a DNA four
way junction (4WJ) (figure 1.5b). It consists of four double stranded pieces of helical DNA
joined together in one junction. These form in vivo in repair mechanisms and in biology the
junction is not stationary and can slide up and down each strand by breaking and pairing bases
as it moves.
Both of these structures have been replicated in vitro with short synthetic oligonucleotides,
resulting in further studies on their structure.17, 18 These structures are have been more
recently utilised in the field of DNA nanotechnology as a means to build up structures
comprised of DNA.19 This area will be covered in depth later on in the chapter.
Figure 1.5 – A) Representation of a DNA 3WJ. B) Representation of a DNA 4WJ. Taken from 18.
A B
7
1.1.2.3 Guanine Quadruplex
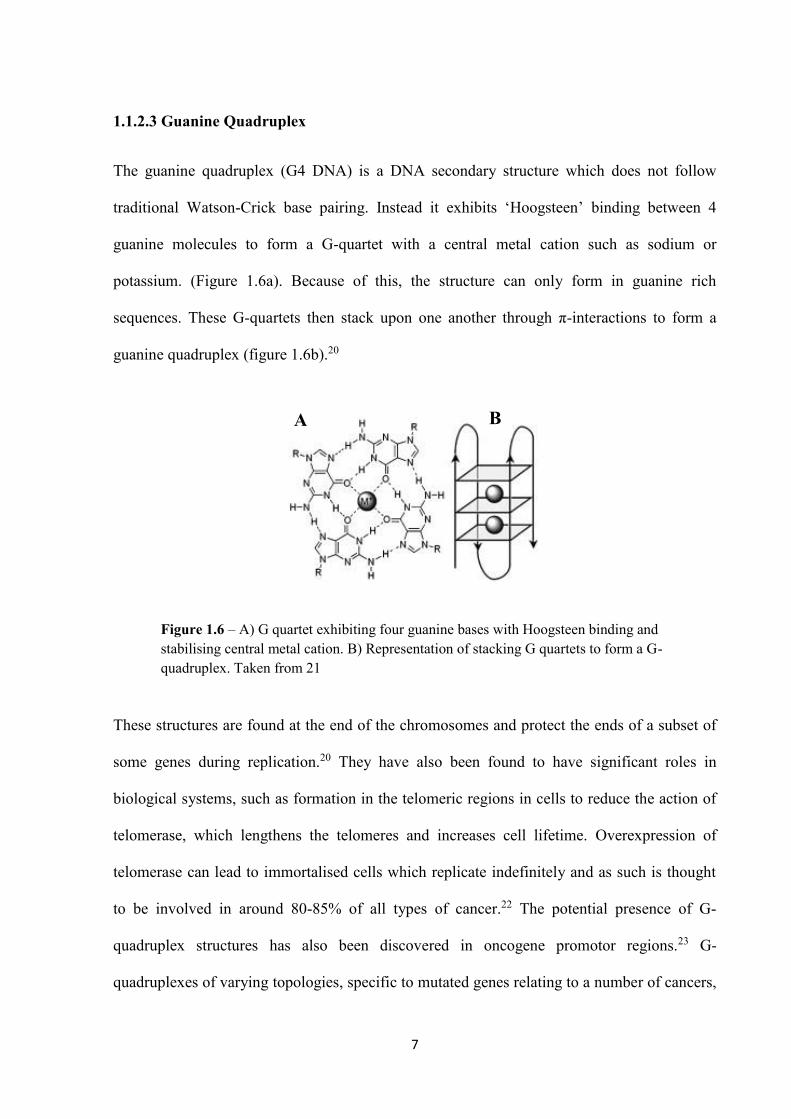
The guanine quadruplex (G4 DNA) is a DNA secondary structure which does not follow
traditional Watson-Crick base pairing. Instead it exhibits ‘Hoogsteen’ binding between 4
guanine molecules to form a G-quartet with a central metal cation such as sodium or
potassium. (Figure 1.6a). Because of this, the structure can only form in guanine rich
sequences. These G-quartets then stack upon one another through π-interactions to form a
guanine quadruplex (figure 1.6b).20 21
These structures are found at the end of the chromosomes and protect the ends of a subset of
some genes during replication.20 They have also been found to have significant roles in
biological systems, such as formation in the telomeric regions in cells to reduce the action of
telomerase, which lengthens the telomeres and increases cell lifetime. Overexpression of
telomerase can lead to immortalised cells which replicate indefinitely and as such is thought
to be involved in around 80-85% of all types of cancer.22 The potential presence of G-
quadruplex structures has also been discovered in oncogene promotor regions.23 G-
quadruplexes of varying topologies, specific to mutated genes relating to a number of cancers,
B A
Figure 1.6 – A) G quartet exhibiting four guanine bases with Hoogsteen binding and stabilising central metal cation. B) Representation of stacking G quartets to form a G-quadruplex. Taken from 21
8
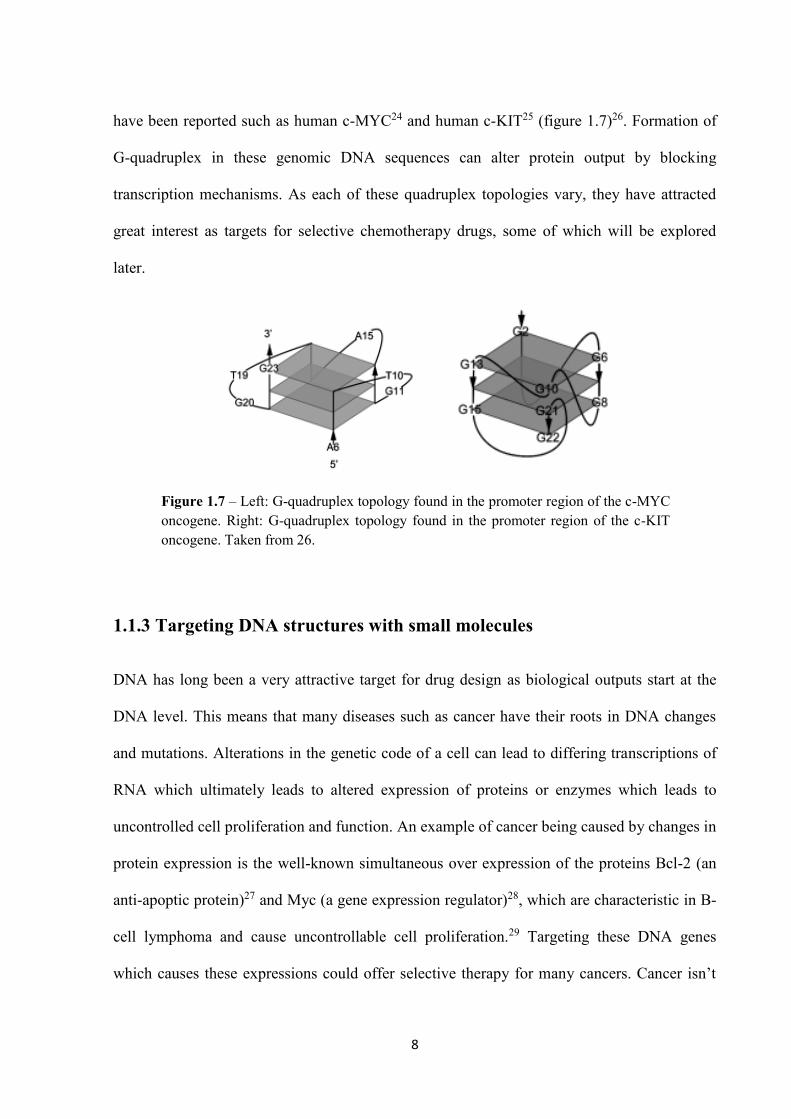
have been reported such as human c-MYC24 and human c-KIT25 (figure 1.7)26. Formation of
G-quadruplex in these genomic DNA sequences can alter protein output by blocking
transcription mechanisms. As each of these quadruplex topologies vary, they have attracted
great interest as targets for selective chemotherapy drugs, some of which will be explored
later.
1.1.3 Targeting DNA structures with small molecules
DNA has long been a very attractive target for drug design as biological outputs start at the
DNA level. This means that many diseases such as cancer have their roots in DNA changes
and mutations. Alterations in the genetic code of a cell can lead to differing transcriptions of
RNA which ultimately leads to altered expression of proteins or enzymes which leads to
uncontrolled cell proliferation and function. An example of cancer being caused by changes in
protein expression is the well-known simultaneous over expression of the proteins Bcl-2 (an
anti-apoptic protein)27 and Myc (a gene expression regulator)28, which are characteristic in B-
cell lymphoma and cause uncontrollable cell proliferation.29 Targeting these DNA genes
which causes these expressions could offer selective therapy for many cancers. Cancer isn’t
Figure 1.7 – Left: G-quadruplex topology found in the promoter region of the c-MYC oncogene. Right: G-quadruplex topology found in the promoter region of the c-KIT oncogene. Taken from 26.
9
the only disease with interesting DNA targets which could have therapeutic effects; Viruses
such as HIV work by integrating genetic material in the form of DNA or RNA into host cells.
In the case of HIV this infection allows for virus proliferation and cell death in the host T-
lymphocytes, leading to loss of immune system for the patient.30
This section aims to review the significant developments in drug and small molecule designs
for targeting DNA for applications in the clinic, discussing and providing examples of the
main modes of DNA binding exhibited by each.
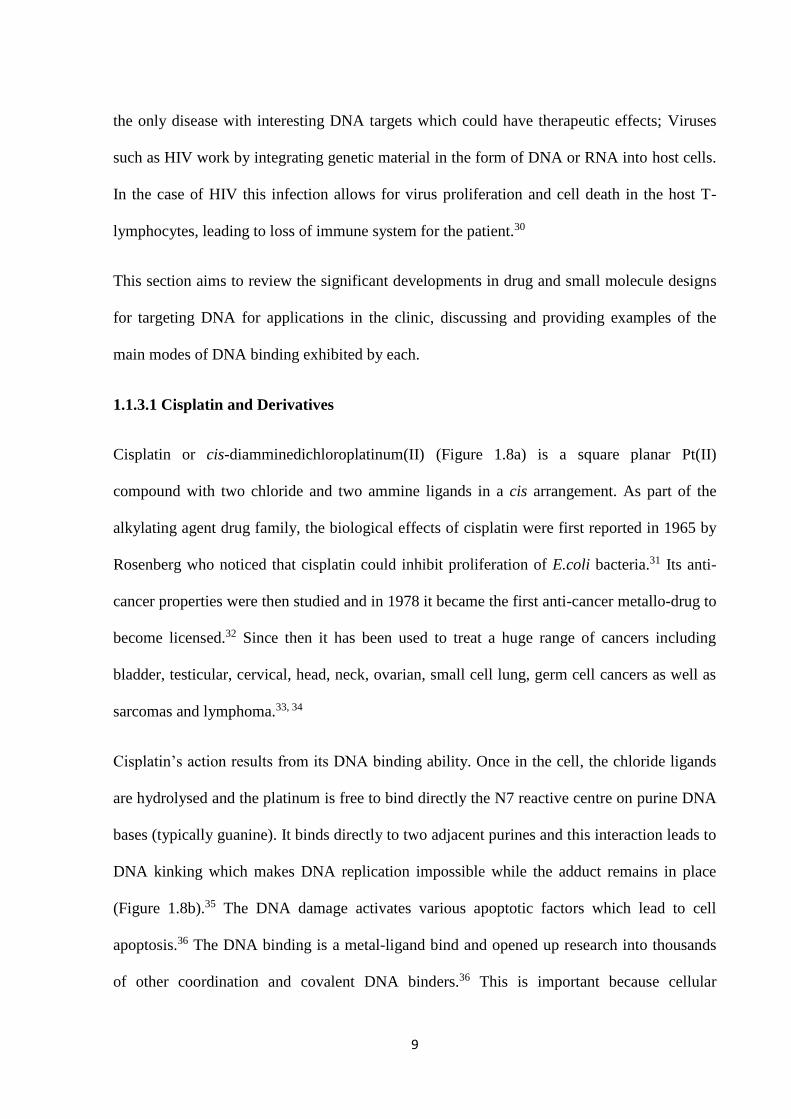
1.1.3.1 Cisplatin and Derivatives
Cisplatin or cis-diamminedichloroplatinum(II) (Figure 1.8a) is a square planar Pt(II)
compound with two chloride and two ammine ligands in a cis arrangement. As part of the
alkylating agent drug family, the biological effects of cisplatin were first reported in 1965 by
Rosenberg who noticed that cisplatin could inhibit proliferation of E.coli bacteria.31 Its anti-
cancer properties were then studied and in 1978 it became the first anti-cancer metallo-drug to
become licensed.32 Since then it has been used to treat a huge range of cancers including
bladder, testicular, cervical, head, neck, ovarian, small cell lung, germ cell cancers as well as
sarcomas and lymphoma.33, 34
Cisplatin’s action results from its DNA binding ability. Once in the cell, the chloride ligands
are hydrolysed and the platinum is free to bind directly the N7 reactive centre on purine DNA
bases (typically guanine). It binds directly to two adjacent purines and this interaction leads to
DNA kinking which makes DNA replication impossible while the adduct remains in place
(Figure 1.8b).35 The DNA damage activates various apoptotic factors which lead to cell
apoptosis.36 The DNA binding is a metal-ligand bind and opened up research into thousands
of other coordination and covalent DNA binders.36 This is important because cellular
10
mechanisms can develop to form resistance to cisplatin action. Many mechanisms have been
identified and once cells have been exposed to cisplatin, they begin to develop. Some main
examples of these are decreases in cellular uptake and increases in efflux to reduce overall
accumulation37, increases in DNA repair proteins such as topoisomerase II which can remove
cisplatin from the DNA adducts by double stranded excision to reform undamaged DNA.38
It is also worth noting that cisplatin does not discriminate between cancerous cells and the
patient’s healthy cells. This causes tissue damage throughout the body and significant side
effects which create a narrow therapeutic window and limit its clinical use. Major side effects
are neurotoxicity, nephrotoxicity, ototoxicity, haemolytic anaemia, cardiotoxicity and severe
nausea.36 It is these side effects and resistance which inspired a generation of Pt(II) drugs
which act in a similar fashion but have varying ligands to reduce toxicity and circumvent drug
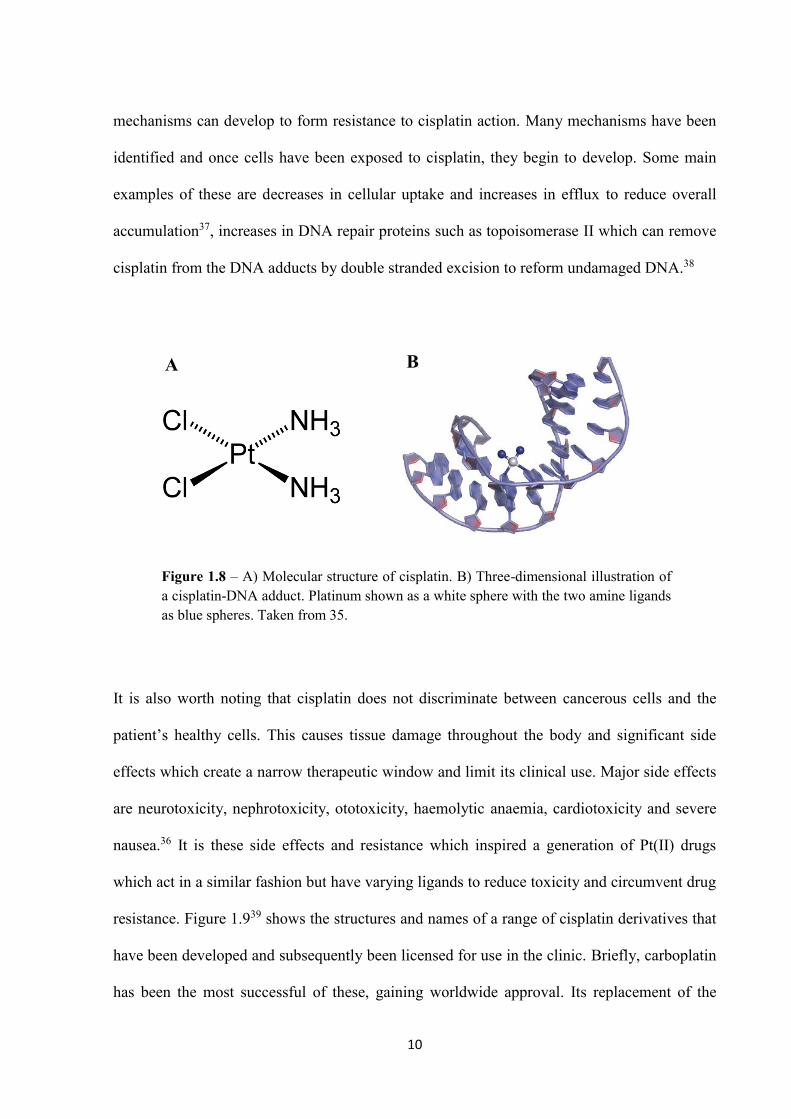
resistance. Figure 1.939 shows the structures and names of a range of cisplatin derivatives that
have been developed and subsequently been licensed for use in the clinic. Briefly, carboplatin
has been the most successful of these, gaining worldwide approval. Its replacement of the
A B
Figure 1.8 – A) Molecular structure of cisplatin. B) Three-dimensional illustration of a cisplatin-DNA adduct. Platinum shown as a white sphere with the two amine ligands as blue spheres. Taken from 35.
11
chloride ligands with one bidentate 1,1-cyclobutanedicarboxylic acid led to significantly
reduced organ toxicity40, although the mechanism of action and the DNA lesion remains the
same so cisplatin resistant cells are often also carboplatin resistant.41 Some progress has been
achieved in overcoming resistance with other agents such as oxaliplatin which by replacing
the amines (and thus changing the DNA lesion) has been shown to be effective against some
cisplatin resistant cell lines.42 None of these, however, can specifically target certain cancers,
but are an excellent example of the class of clinical “alkylating agents” with respect to DNA
targeting and binding.
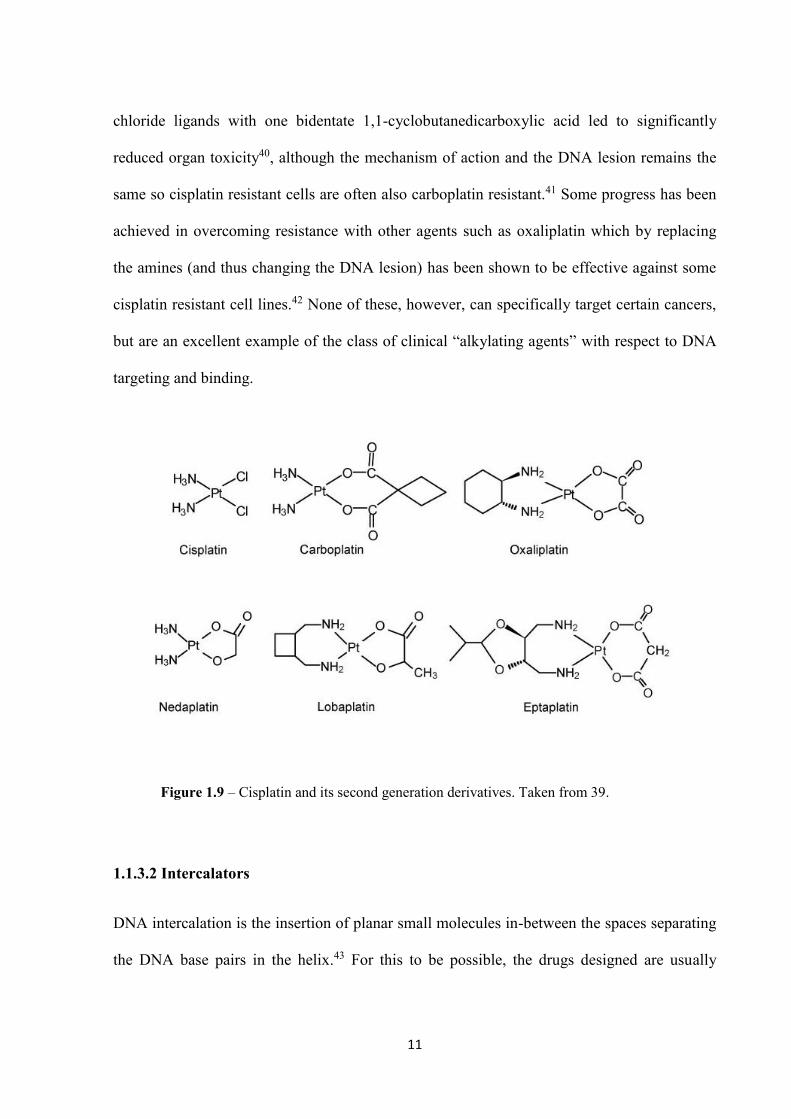
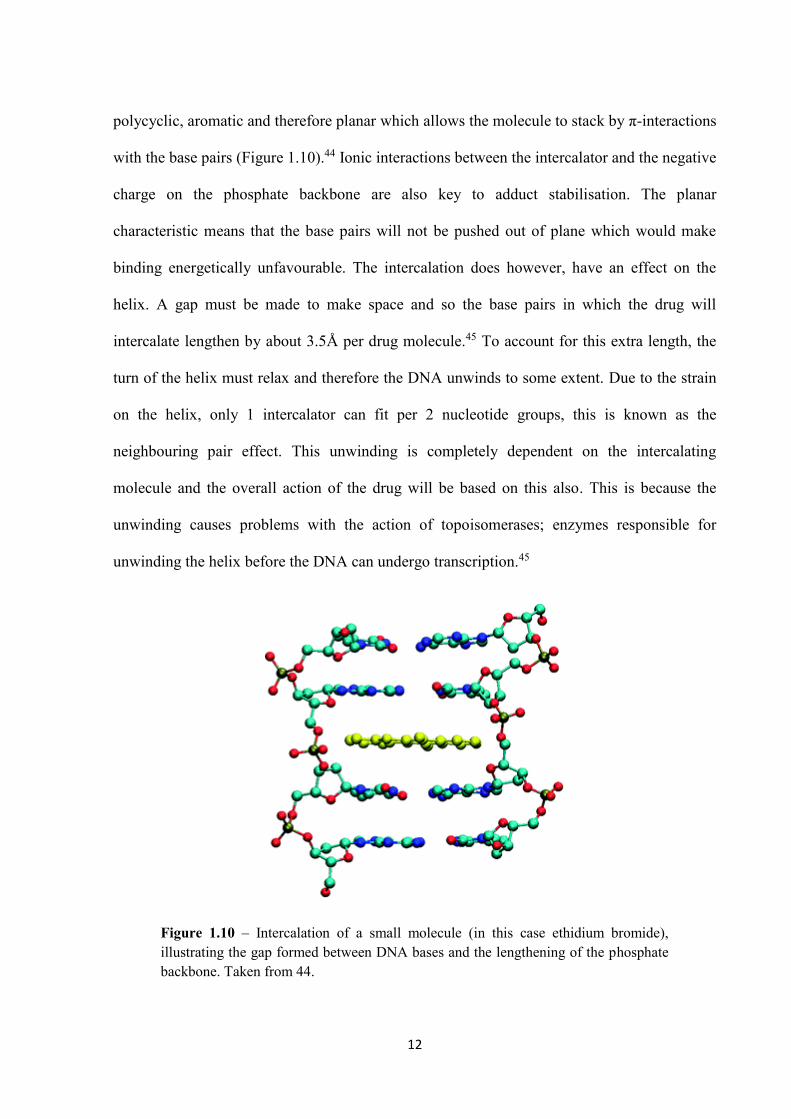
1.1.3.2 Intercalators
DNA intercalation is the insertion of planar small molecules in-between the spaces separating
the DNA base pairs in the helix.43 For this to be possible, the drugs designed are usually
Figure 1.9 – Cisplatin and its second generation derivatives. Taken from 39.
12
polycyclic, aromatic and therefore planar which allows the molecule to stack by π-interactions
with the base pairs (Figure 1.10).44 Ionic interactions between the intercalator and the negative
charge on the phosphate backbone are also key to adduct stabilisation. The planar
characteristic means that the base pairs will not be pushed out of plane which would make
binding energetically unfavourable. The intercalation does however, have an effect on the
helix. A gap must be made to make space and so the base pairs in which the drug will
intercalate lengthen by about 3.5Å per drug molecule.45 To account for this extra length, the
turn of the helix must relax and therefore the DNA unwinds to some extent. Due to the strain
on the helix, only 1 intercalator can fit per 2 nucleotide groups, this is known as the
neighbouring pair effect. This unwinding is completely dependent on the intercalating
molecule and the overall action of the drug will be based on this also. This is because the
unwinding causes problems with the action of topoisomerases; enzymes responsible for
unwinding the helix before the DNA can undergo transcription.45
Figure 1.10 – Intercalation of a small molecule (in this case ethidium bromide), illustrating the gap formed between DNA bases and the lengthening of the phosphate backbone. Taken from 44.
13
It is proposed that as the mode of action of anti-cancer intercalators is to poison the action of
topoisomerases, specifically topoisomerase II (TOP2), that these drugs can exhibit selectivity
towards cancer cells as TOP2 is active during cell proliferation, which is much more abundant
in tumours than in healthy tissue.46 There is much evidence for the action of the most
successful anti-cancer intercalators to be based on enzyme based damage due to TOP2
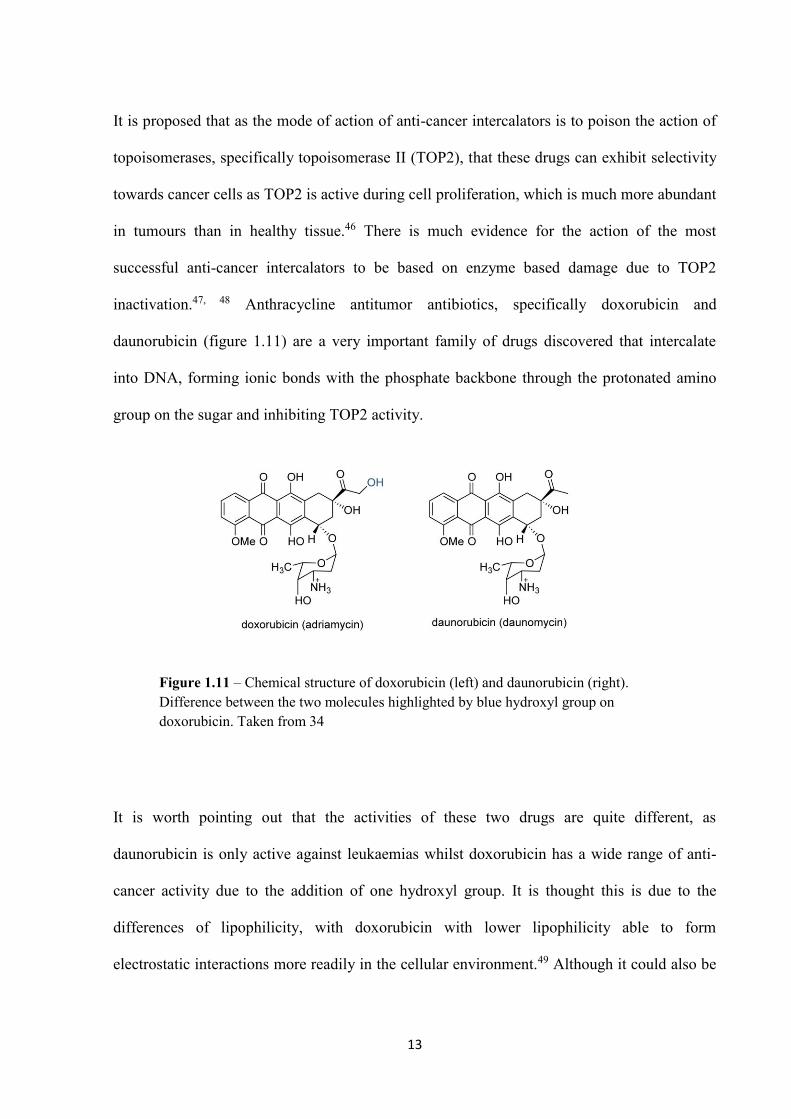
inactivation.47, 48 Anthracycline antitumor antibiotics, specifically doxorubicin and
daunorubicin (figure 1.11) are a very important family of drugs discovered that intercalate
into DNA, forming ionic bonds with the phosphate backbone through the protonated amino
group on the sugar and inhibiting TOP2 activity.
It is worth pointing out that the activities of these two drugs are quite different, as
daunorubicin is only active against leukaemias whilst doxorubicin has a wide range of anti-
cancer activity due to the addition of one hydroxyl group. It is thought this is due to the
differences of lipophilicity, with doxorubicin with lower lipophilicity able to form
electrostatic interactions more readily in the cellular environment.49 Although it could also be
Figure 1.11 – Chemical structure of doxorubicin (left) and daunorubicin (right). Difference between the two molecules highlighted by blue hydroxyl group on doxorubicin. Taken from 34
14
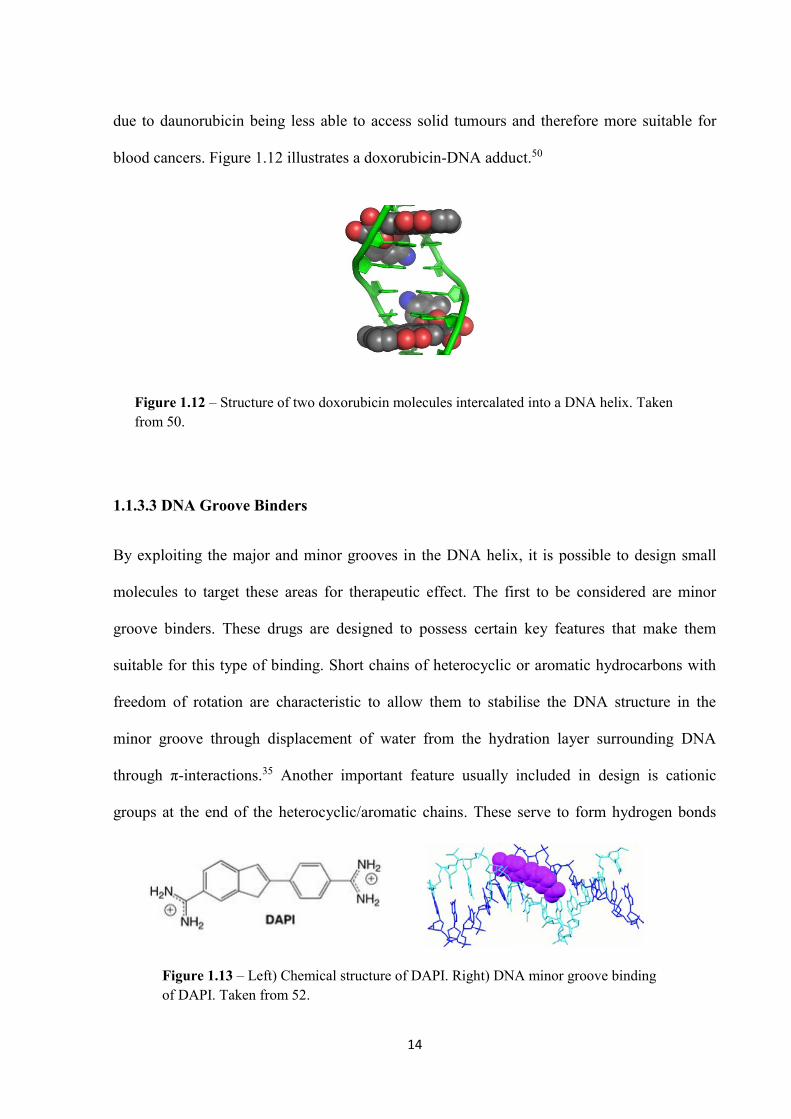
due to daunorubicin being less able to access solid tumours and therefore more suitable for
blood cancers. Figure 1.12 illustrates a doxorubicin-DNA adduct.50
1.1.3.3 DNA Groove Binders
By exploiting the major and minor grooves in the DNA helix, it is possible to design small
molecules to target these areas for therapeutic effect. The first to be considered are minor
groove binders. These drugs are designed to possess certain key features that make them
suitable for this type of binding. Short chains of heterocyclic or aromatic hydrocarbons with
freedom of rotation are characteristic to allow them to stabilise the DNA structure in the
minor groove through displacement of water from the hydration layer surrounding DNA
through π-interactions.35 Another important feature usually included in design is cationic
groups at the end of the heterocyclic/aromatic chains. These serve to form hydrogen bonds
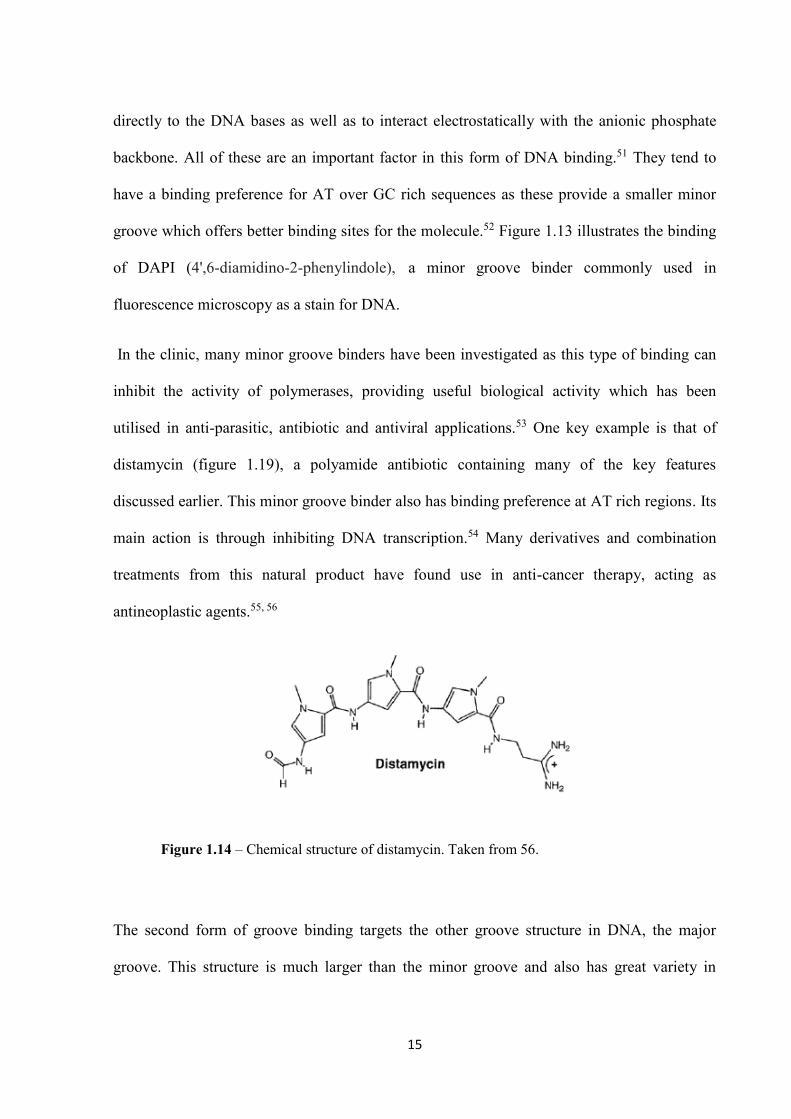
Figure 1.13 – Left) Chemical structure of DAPI. Right) DNA minor groove binding of DAPI. Taken from 52.
Figure 1.12 – Structure of two doxorubicin molecules intercalated into a DNA helix. Taken from 50.
15
directly to the DNA bases as well as to interact electrostatically with the anionic phosphate
backbone. All of these are an important factor in this form of DNA binding.51 They tend to
have a binding preference for AT over GC rich sequences as these provide a smaller minor
groove which offers better binding sites for the molecule.52 Figure 1.13 illustrates the binding
of DAPI (4',6-diamidino-2-phenylindole), a minor groove binder commonly used in
fluorescence microscopy as a stain for DNA.
In the clinic, many minor groove binders have been investigated as this type of binding can
inhibit the activity of polymerases, providing useful biological activity which has been
utilised in anti-parasitic, antibiotic and antiviral applications.53 One key example is that of
distamycin (figure 1.19), a polyamide antibiotic containing many of the key features
discussed earlier. This minor groove binder also has binding preference at AT rich regions. Its
main action is through inhibiting DNA transcription.54 Many derivatives and combination
treatments from this natural product have found use in anti-cancer therapy, acting as
antineoplastic agents.55, 56
The second form of groove binding targets the other groove structure in DNA, the major
groove. This structure is much larger than the minor groove and also has great variety in
Figure 1.14 – Chemical structure of distamycin. Taken from 56.
16
shape and binding sites due to differing base pair sequences. The interactions between the
molecule and DNA are often specific hydrogen bonds directly to the DNA bases.52 Features
characteristic of major groove binders are that firstly they are too bulky to bind to the minor
groove. Molecules employing an alpha helical peptide structure that match the turn of the
DNA are also characteristic. Strong examples of these are protein motifs such as a zinc finger
which can form base pair specific hydrogen bonds to the bases and the cylindrical shape can
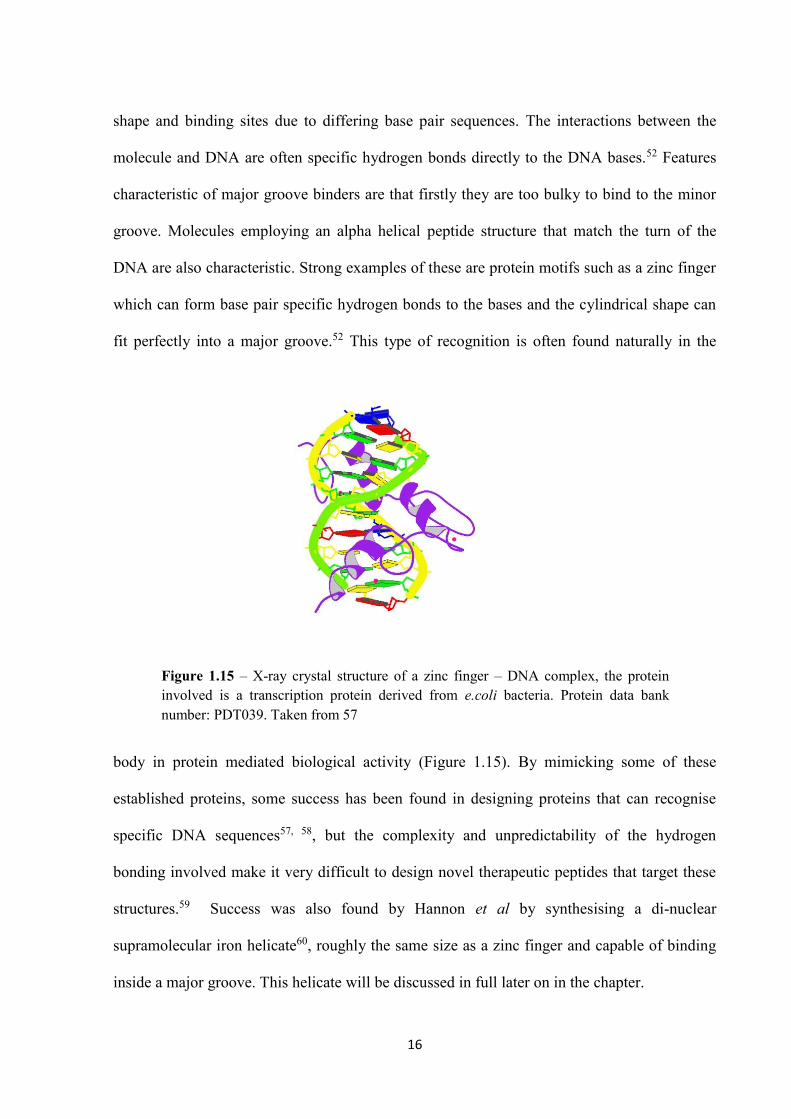
fit perfectly into a major groove.52 This type of recognition is often found naturally in the
body in protein mediated biological activity (Figure 1.15). By mimicking some of these
established proteins, some success has been found in designing proteins that can recognise
specific DNA sequences57, 58, but the complexity and unpredictability of the hydrogen
bonding involved make it very difficult to design novel therapeutic peptides that target these
structures.59 Success was also found by Hannon et al by synthesising a di-nuclear
supramolecular iron helicate60, roughly the same size as a zinc finger and capable of binding
inside a major groove. This helicate will be discussed in full later on in the chapter.
Figure 1.15 – X-ray crystal structure of a zinc finger – DNA complex, the protein involved is a transcription protein derived from e.coli bacteria. Protein data bank number: PDT039. Taken from 57
17
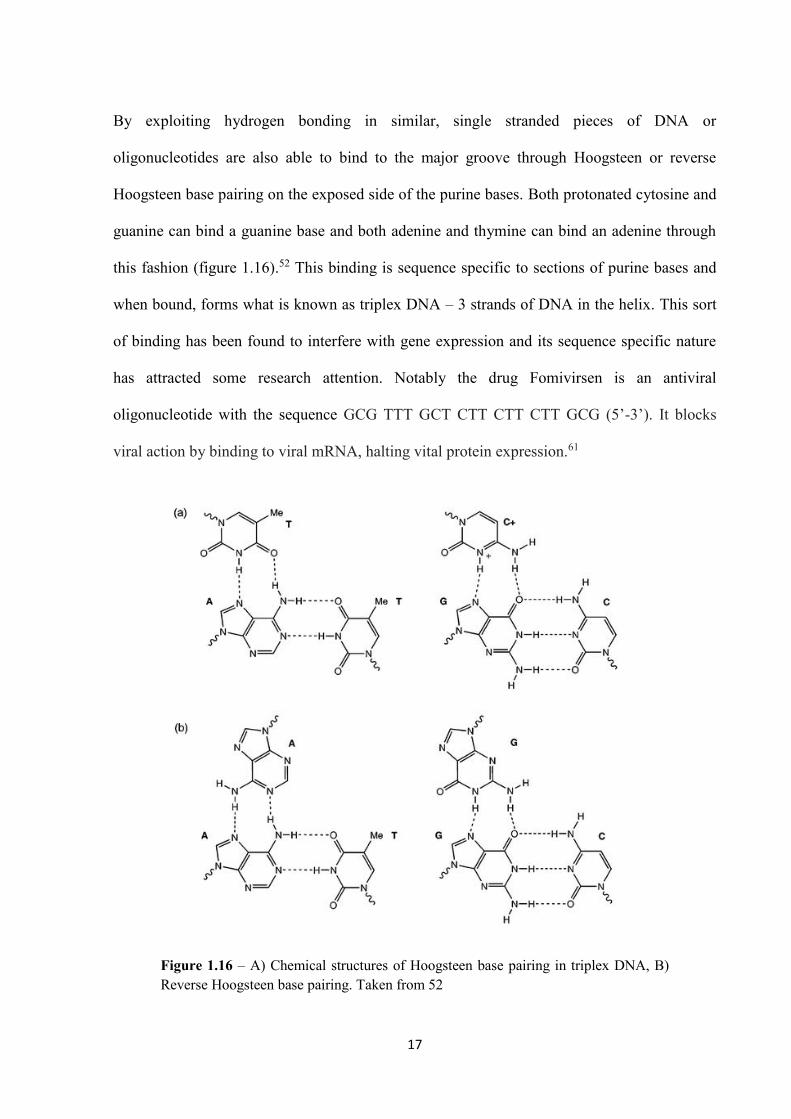
By exploiting hydrogen bonding in similar, single stranded pieces of DNA or
oligonucleotides are also able to bind to the major groove through Hoogsteen or reverse
Hoogsteen base pairing on the exposed side of the purine bases. Both protonated cytosine and
guanine can bind a guanine base and both adenine and thymine can bind an adenine through
this fashion (figure 1.16).52 This binding is sequence specific to sections of purine bases and
when bound, forms what is known as triplex DNA – 3 strands of DNA in the helix. This sort
of binding has been found to interfere with gene expression and its sequence specific nature
has attracted some research attention. Notably the drug Fomivirsen is an antiviral
oligonucleotide with the sequence GCG TTT GCT CTT CTT CTT GCG (5’-3’). It blocks
viral action by binding to viral mRNA, halting vital protein expression.61
Figure 1.16 – A) Chemical structures of Hoogsteen base pairing in triplex DNA, B) Reverse Hoogsteen base pairing. Taken from 52
18
1.1.3.4 G-Quadruplex Binders
As discussed earlier, G-quadruplexes form in guanine rich areas of the genome which have
been found to have strong biological significance such as the telomeres and gene promotor
regions of key oncogenes. They are also unusual DNA structures with strong characteristic
features whose topologies vary widely. For these reasons, they have been a target of wide
interest in recent years.62, 63 They are considered to be druggable due to their role in the
majority of human cancers, whether it be inhibiting the action of telomerase which has a key
role in cell immortalisation and transformation64 or in the gene promoter regions of key
oncogenes such as c-MYC, controlling expression of proliferation enzymes.28 Hundreds of
small molecules have been synthesised in recent years which have been shown to interact
with G-quadruplexes with certain characteristic molecule designs becoming apparent.65
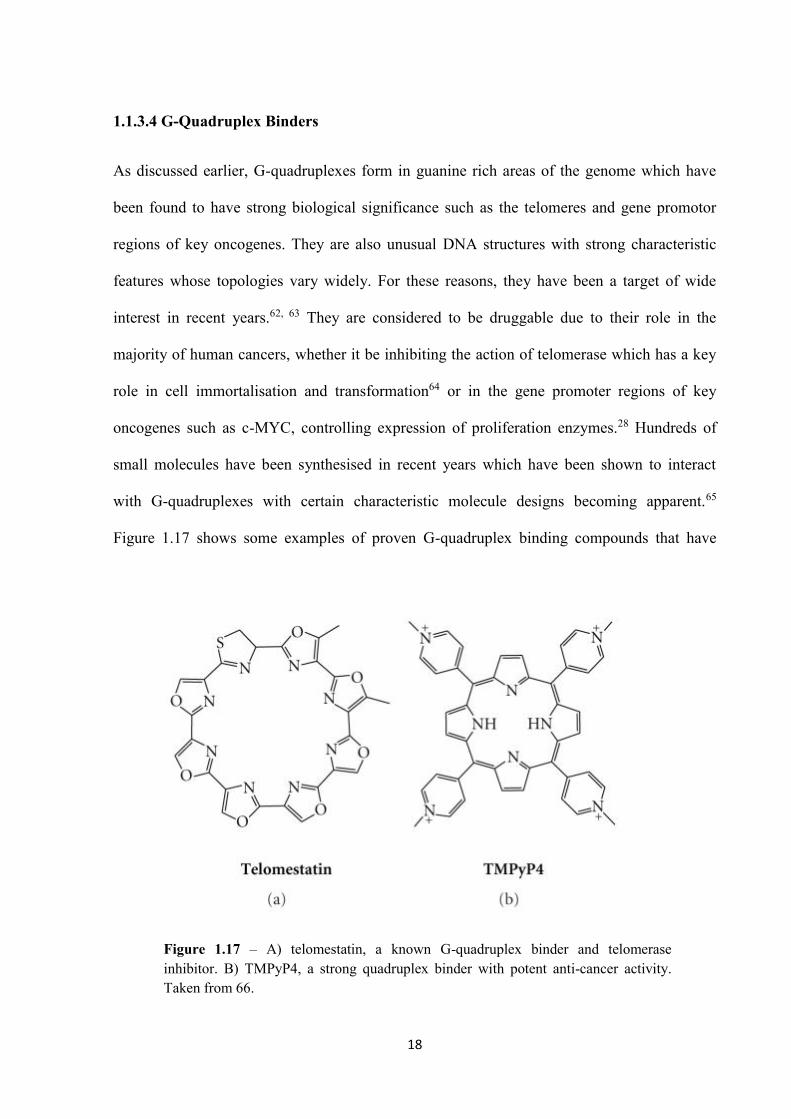
Figure 1.17 shows some examples of proven G-quadruplex binding compounds that have
Figure 1.17 – A) telomestatin, a known G-quadruplex binder and telomerase inhibitor. B) TMPyP4, a strong quadruplex binder with potent anti-cancer activity. Taken from 66.
19
made it to clinical trials. Both the molecules shown exhibit a large amount of planar aromatic
groups for stacking on top of the upper or lower most G-tetrad in the quadruplex.66 Square
planar complexes with central metal cations such as Pt(II) or Pd(II) have also been suggested
as the metal ions help co-ordinate ligands in the square planar fashion required for stacking.67
The positive central charge can also stabilise the quadruplex by substituting the central cation
Na+ or K+ usually found inside the quadruplex.67
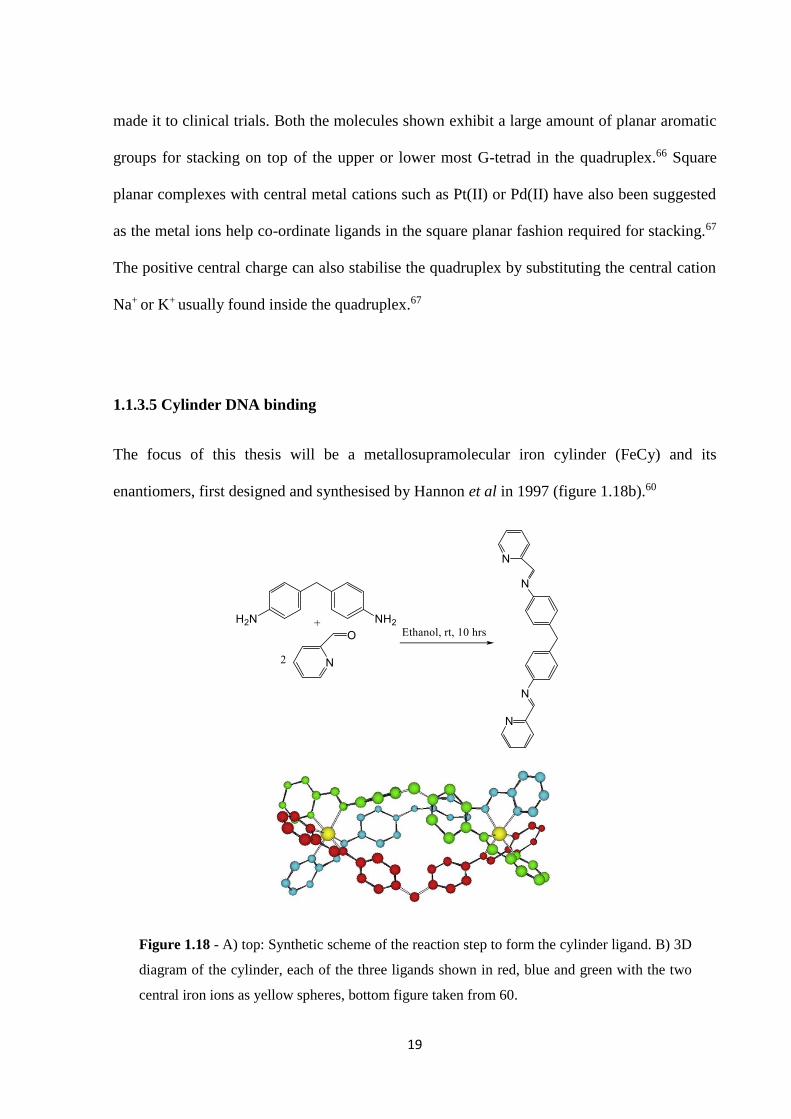
1.1.3.5 Cylinder DNA binding
The focus of this thesis will be a metallosupramolecular iron cylinder (FeCy) and its
enantiomers, first designed and synthesised by Hannon et al in 1997 (figure 1.18b).60
Figure 1.18 - A) top: Synthetic scheme of the reaction step to form the cylinder ligand. B) 3D
diagram of the cylinder, each of the three ligands shown in red, blue and green with the two
central iron ions as yellow spheres, bottom figure taken from 60.
20
Two other cylinders, containing Ni and Ru (NiCy and RuCy) as centres in place of iron will
also be explored. The iron cylinder is so named due to its cylindrical 3D shape. It is roughly 2
nm in length and 1 nm in width which gives it similar dimensions to that of a zinc finger
protein which is able to bind major grooves in DNA. The FeCy compound is synthesised in a
simple one pot reaction (Figure 1.18a)68. Firstly the pyridylimine ligand is formed before
complexation of 3 equivalents of the ligand to 2 equivalents of FeCl2 to form the iron cylinder
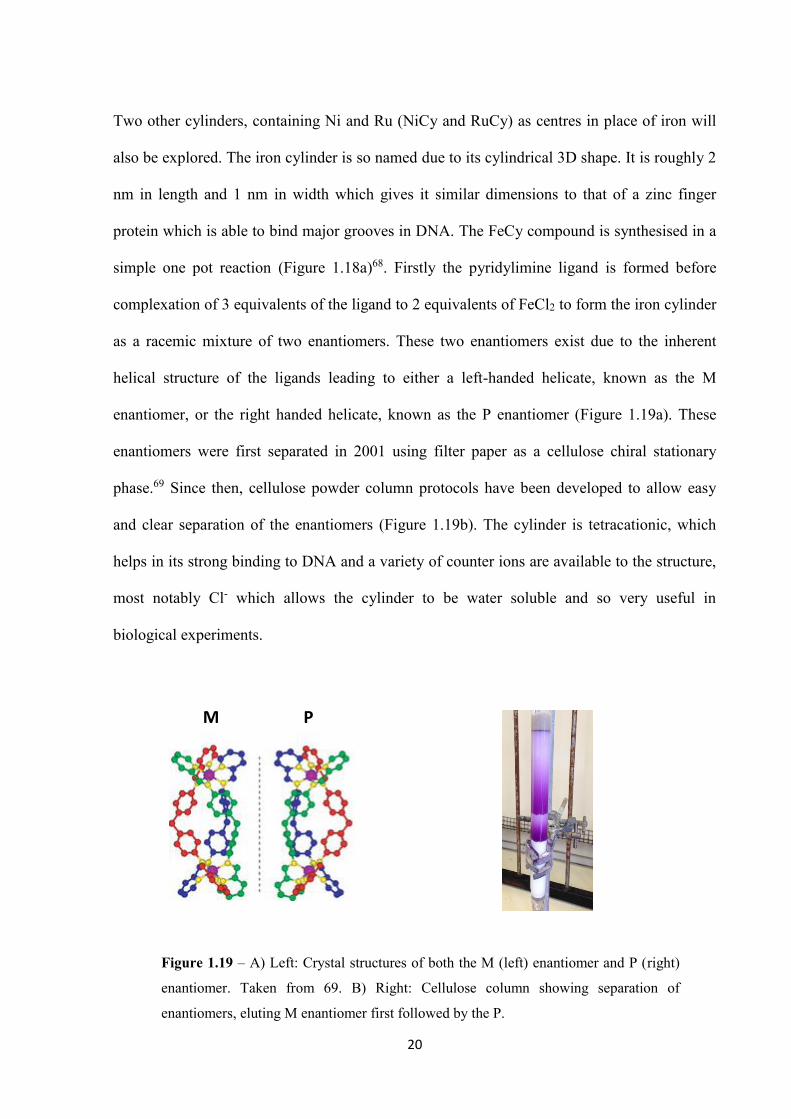
as a racemic mixture of two enantiomers. These two enantiomers exist due to the inherent
helical structure of the ligands leading to either a left-handed helicate, known as the M
enantiomer, or the right handed helicate, known as the P enantiomer (Figure 1.19a). These
enantiomers were first separated in 2001 using filter paper as a cellulose chiral stationary
phase.69 Since then, cellulose powder column protocols have been developed to allow easy
and clear separation of the enantiomers (Figure 1.19b). The cylinder is tetracationic, which
helps in its strong binding to DNA and a variety of counter ions are available to the structure,
most notably Cl- which allows the cylinder to be water soluble and so very useful in
biological experiments.
Figure 1.19 – A) Left: Crystal structures of both the M (left) enantiomer and P (right)
enantiomer. Taken from 69. B) Right: Cellulose column showing separation of
enantiomers, eluting M enantiomer first followed by the P.
M P
21
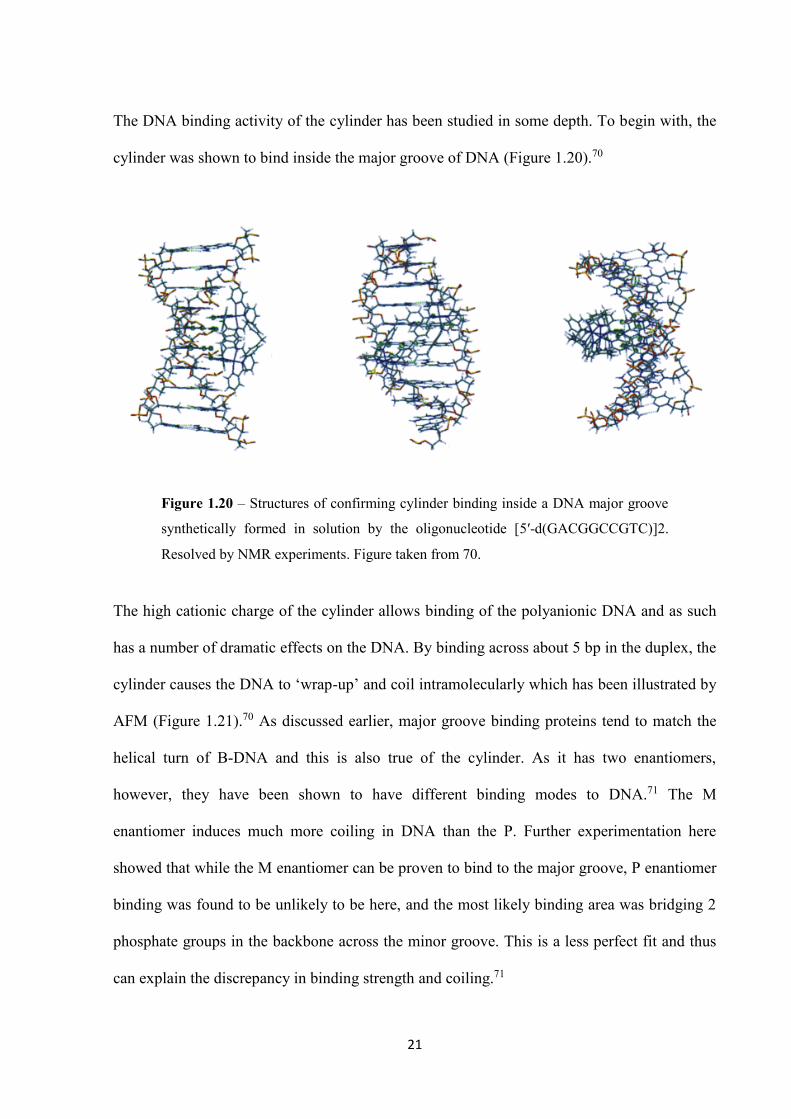
The DNA binding activity of the cylinder has been studied in some depth. To begin with, the
cylinder was shown to bind inside the major groove of DNA (Figure 1.20).70
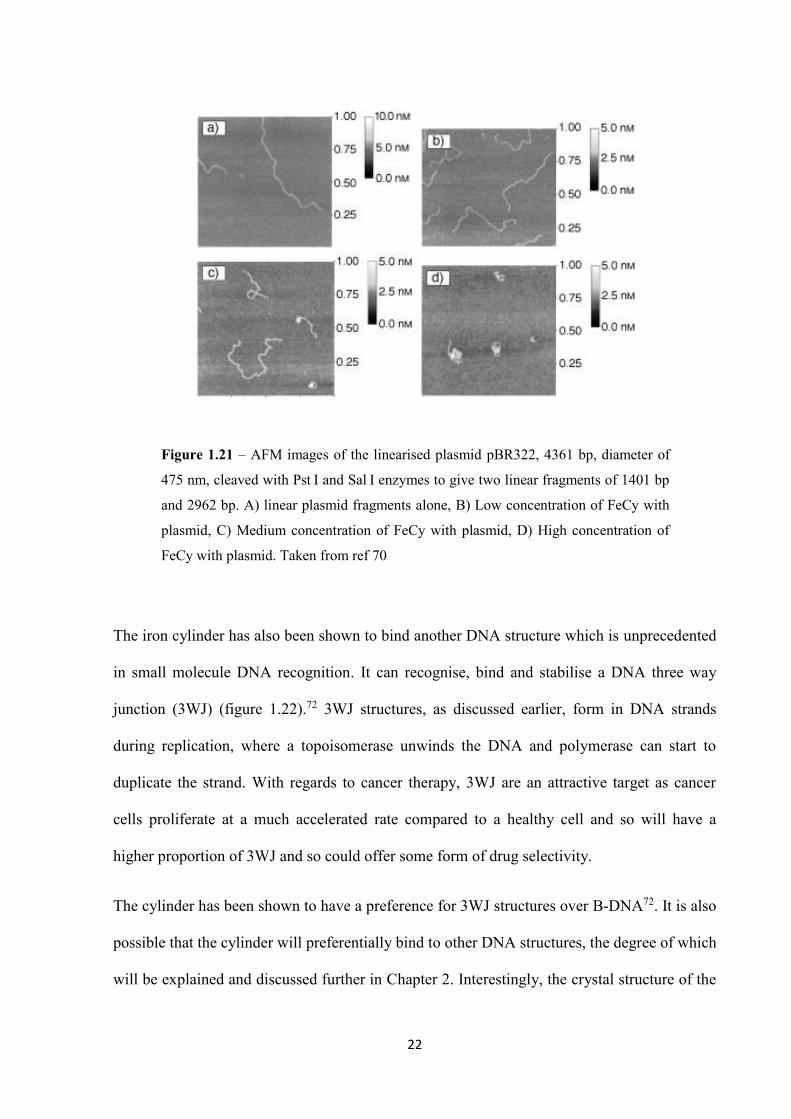
The high cationic charge of the cylinder allows binding of the polyanionic DNA and as such
has a number of dramatic effects on the DNA. By binding across about 5 bp in the duplex, the
cylinder causes the DNA to ‘wrap-up’ and coil intramolecularly which has been illustrated by
AFM (Figure 1.21).70 As discussed earlier, major groove binding proteins tend to match the
helical turn of B-DNA and this is also true of the cylinder. As it has two enantiomers,
however, they have been shown to have different binding modes to DNA.71 The M
enantiomer induces much more coiling in DNA than the P. Further experimentation here
showed that while the M enantiomer can be proven to bind to the major groove, P enantiomer
binding was found to be unlikely to be here, and the most likely binding area was bridging 2
phosphate groups in the backbone across the minor groove. This is a less perfect fit and thus
can explain the discrepancy in binding strength and coiling.71
Figure 1.20 – Structures of confirming cylinder binding inside a DNA major groove
synthetically formed in solution by the oligonucleotide [5′-d(GACGGCCGTC)]2.
Resolved by NMR experiments. Figure taken from 70.
22
The iron cylinder has also been shown to bind another DNA structure which is unprecedented
in small molecule DNA recognition. It can recognise, bind and stabilise a DNA three way
junction (3WJ) (figure 1.22).72 3WJ structures, as discussed earlier, form in DNA strands
during replication, where a topoisomerase unwinds the DNA and polymerase can start to
duplicate the strand. With regards to cancer therapy, 3WJ are an attractive target as cancer
cells proliferate at a much accelerated rate compared to a healthy cell and so will have a
higher proportion of 3WJ and so could offer some form of drug selectivity.
The cylinder has been shown to have a preference for 3WJ structures over B-DNA72. It is also
possible that the cylinder will preferentially bind to other DNA structures, the degree of which
will be explained and discussed further in Chapter 2. Interestingly, the crystal structure of the
Figure 1.21 – AFM images of the linearised plasmid pBR322, 4361 bp, diameter of
475 nm, cleaved with Pst I and Sal I enzymes to give two linear fragments of 1401 bp
and 2962 bp. A) linear plasmid fragments alone, B) Low concentration of FeCy with
plasmid, C) Medium concentration of FeCy with plasmid, D) High concentration of
FeCy with plasmid. Taken from ref 70
23
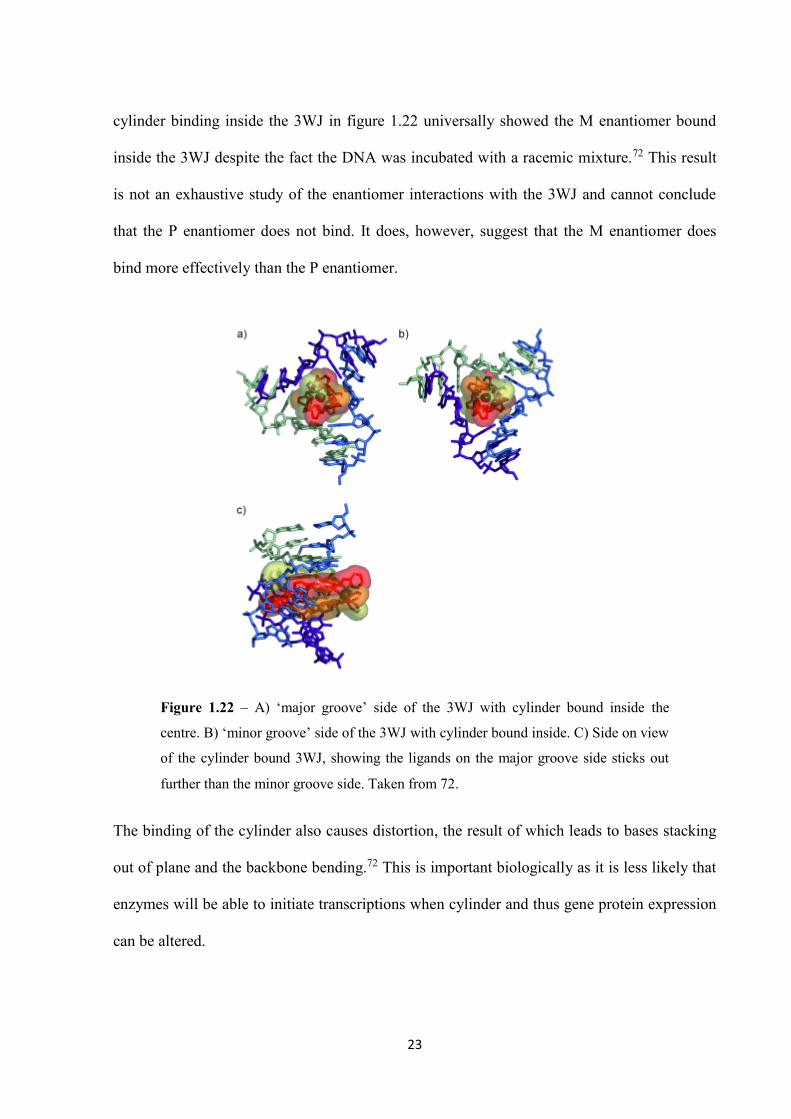
cylinder binding inside the 3WJ in figure 1.22 universally showed the M enantiomer bound
inside the 3WJ despite the fact the DNA was incubated with a racemic mixture.72 This result
is not an exhaustive study of the enantiomer interactions with the 3WJ and cannot conclude
that the P enantiomer does not bind. It does, however, suggest that the M enantiomer does
bind more effectively than the P enantiomer.
The binding of the cylinder also causes distortion, the result of which leads to bases stacking
out of plane and the backbone bending.72 This is important biologically as it is less likely that
enzymes will be able to initiate transcriptions when cylinder and thus gene protein expression
can be altered.
Figure 1.22 – A) ‘major groove’ side of the 3WJ with cylinder bound inside the
centre. B) ‘minor groove’ side of the 3WJ with cylinder bound inside. C) Side on view
of the cylinder bound 3WJ, showing the ligands on the major groove side sticks out
further than the minor groove side. Taken from 72.

24
In this regard, the biological activity of the iron cylinder has been studied in some depth due
to its unique and powerful DNA binding capabilities. Against cancer cells, the cylinder has
been shown to have potent cytotoxicity against numerous cell lines whilst proving not to be
genotoxic or mutagenic in comet assays or the AMES test.68
25
1.2 DNA Nanotechnology
1.2.1 Origins and methods of structural DNA Nanotechnology
The concept of DNA nanotechnology was first publicised by Professor Nadrian Seeman at
New York University in 1982 73, where, taking inspiration from a repeating unit picture in a
local pub, noticed similar interactions could be translated to synthetic ssDNA. By definition,
DNA nanotechnology is a branch of nanotechnology concerned with the design, study and
application of synthetic structures based on DNA. DNA nanotechnology takes advantage of
the physical and chemical properties of DNA rather than the genetic information it carries.
Specifically Seeman outlined that designed synthetic oligonucleotide strands could self-
assemble into predetermined DNA structures.73,74 This was based on maximising well known
Watson-Crick base pairing interactions and minimising symmetry which would lead to linear
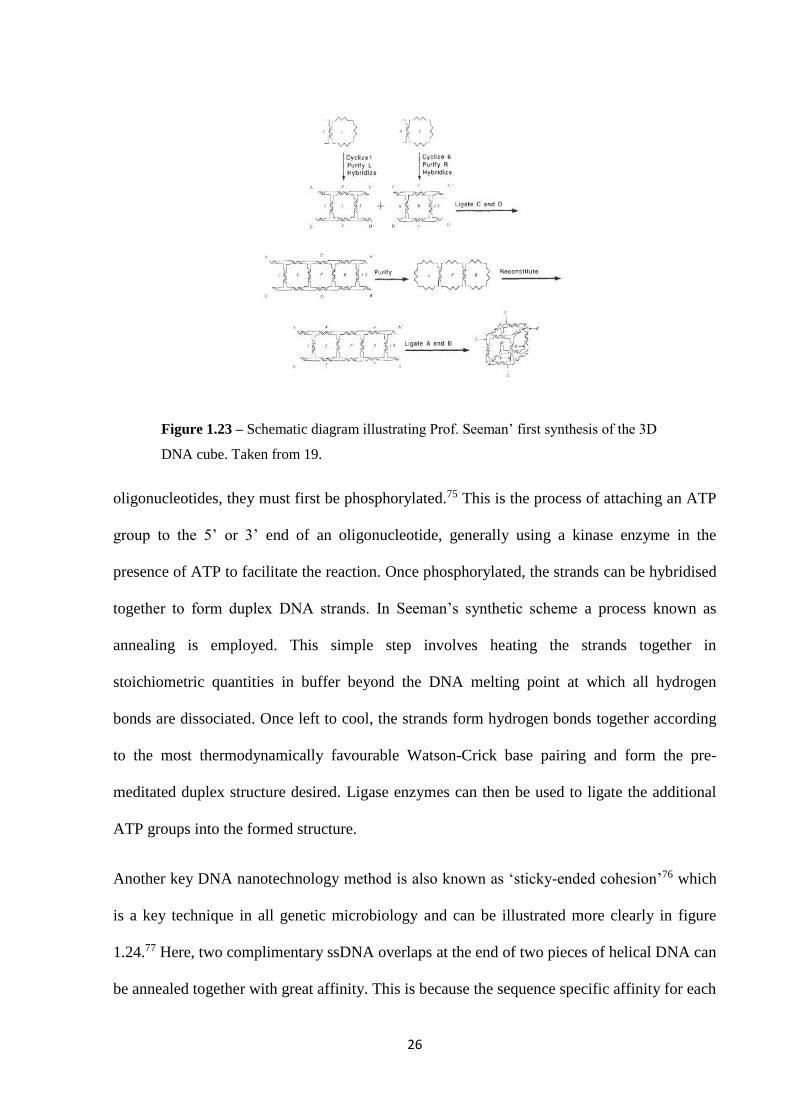
duplexes of DNA. Seeman provided proof of this concept when he synthesised a 3D cube
structure starting with specifically designed oligonucleotides.19 Figure 1.23 illustrates the
scheme starting with cyclised ssDNA leading finally to the fully formed 3D cube over a
multi-step synthesis. This initial bottom-up approach, whilst providing proof of concept for
Seeman, proved to be a laborious synthesis which provided just a 1 % yield.
The general synthetic approach for this bottom-up scheme begins with ssDNA. These strands
are designed specifically and synthetically made so they can hybridise to the most favourable
Watson-Crick base pairing and give predictably positioned double stranded DNA. To allow
these oligonucleotides to cyclise with themselves or ligate end to end with other
26
oligonucleotides, they must first be phosphorylated.75 This is the process of attaching an ATP
group to the 5’ or 3’ end of an oligonucleotide, generally using a kinase enzyme in the
presence of ATP to facilitate the reaction. Once phosphorylated, the strands can be hybridised
together to form duplex DNA strands. In Seeman’s synthetic scheme a process known as
annealing is employed. This simple step involves heating the strands together in
stoichiometric quantities in buffer beyond the DNA melting point at which all hydrogen
bonds are dissociated. Once left to cool, the strands form hydrogen bonds together according
to the most thermodynamically favourable Watson-Crick base pairing and form the pre-
meditated duplex structure desired. Ligase enzymes can then be used to ligate the additional
ATP groups into the formed structure.
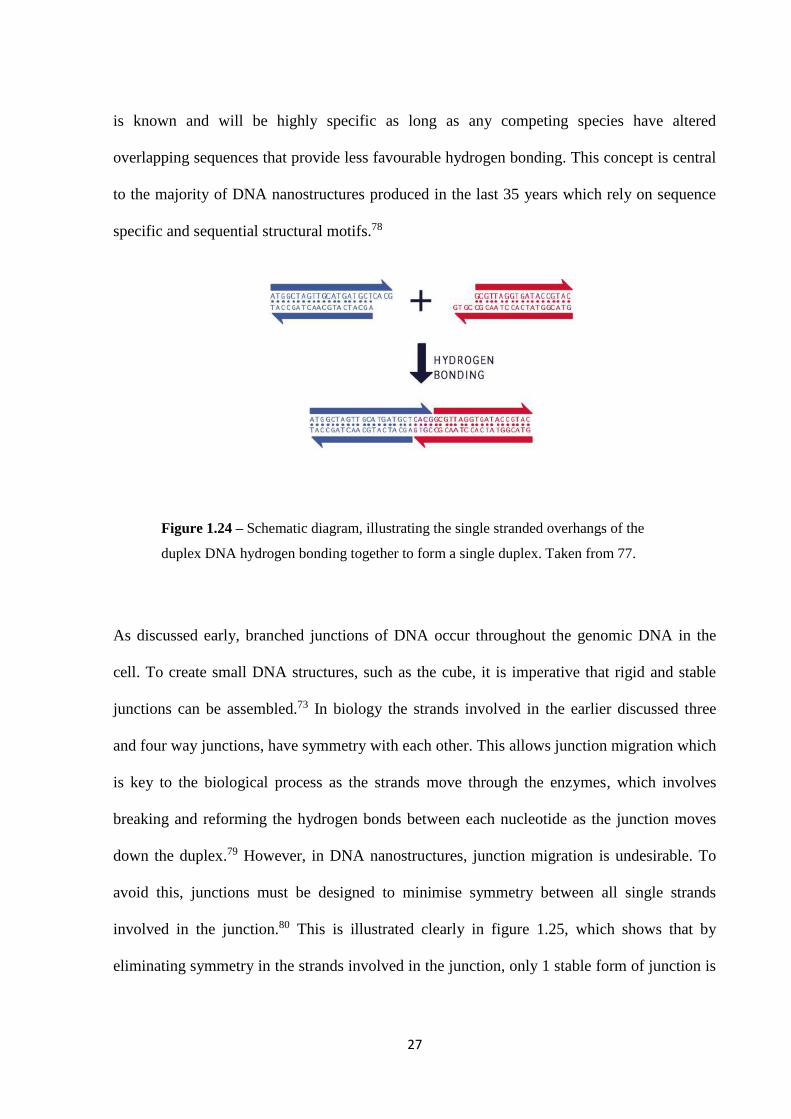
Another key DNA nanotechnology method is also known as ‘sticky-ended cohesion’76 which
is a key technique in all genetic microbiology and can be illustrated more clearly in figure
1.24.77 Here, two complimentary ssDNA overlaps at the end of two pieces of helical DNA can
be annealed together with great affinity. This is because the sequence specific affinity for each
Figure 1.23 – Schematic diagram illustrating Prof. Seeman’ first synthesis of the 3D
DNA cube. Taken from 19.
27
is known and will be highly specific as long as any competing species have altered
overlapping sequences that provide less favourable hydrogen bonding. This concept is central
to the majority of DNA nanostructures produced in the last 35 years which rely on sequence
specific and sequential structural motifs.78
As discussed early, branched junctions of DNA occur throughout the genomic DNA in the
cell. To create small DNA structures, such as the cube, it is imperative that rigid and stable
junctions can be assembled.73 In biology the strands involved in the earlier discussed three
and four way junctions, have symmetry with each other. This allows junction migration which
is key to the biological process as the strands move through the enzymes, which involves
breaking and reforming the hydrogen bonds between each nucleotide as the junction moves
down the duplex.79 However, in DNA nanostructures, junction migration is undesirable. To
avoid this, junctions must be designed to minimise symmetry between all single strands
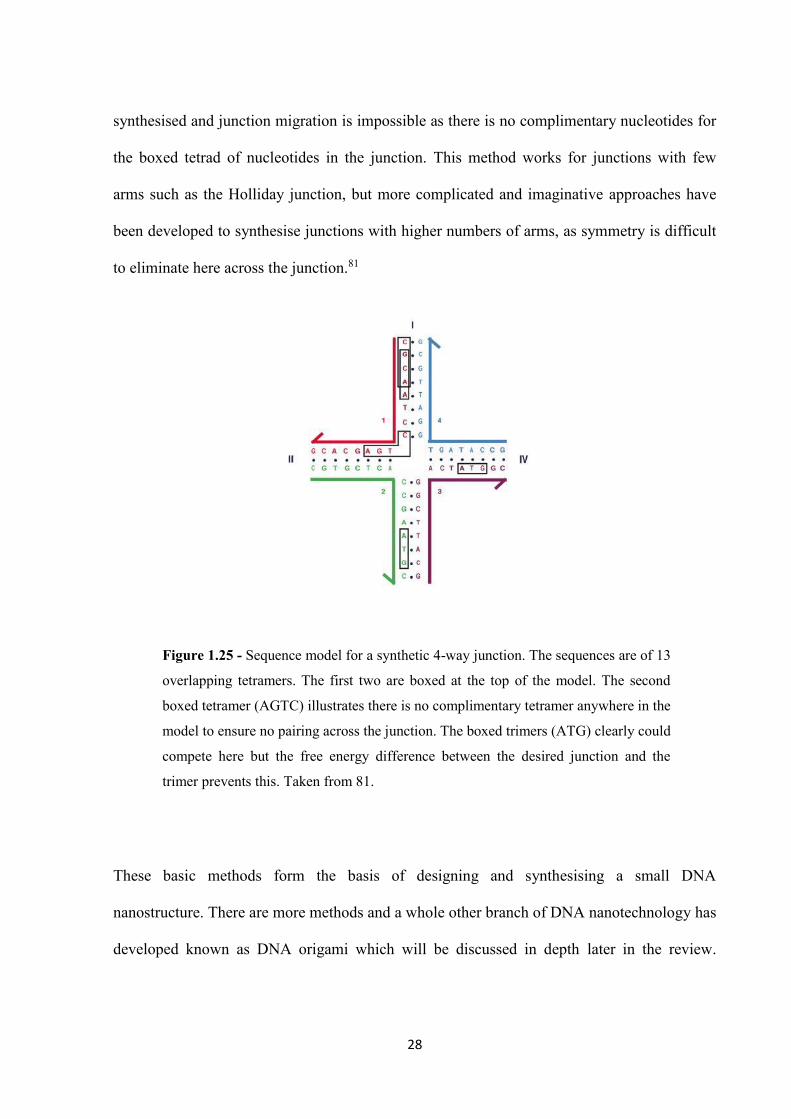
involved in the junction.80 This is illustrated clearly in figure 1.25, which shows that by
eliminating symmetry in the strands involved in the junction, only 1 stable form of junction is
Figure 1.24 – Schematic diagram, illustrating the single stranded overhangs of the
duplex DNA hydrogen bonding together to form a single duplex. Taken from 77.
28
synthesised and junction migration is impossible as there is no complimentary nucleotides for
the boxed tetrad of nucleotides in the junction. This method works for junctions with few
arms such as the Holliday junction, but more complicated and imaginative approaches have
been developed to synthesise junctions with higher numbers of arms, as symmetry is difficult
to eliminate here across the junction.81
These basic methods form the basis of designing and synthesising a small DNA
nanostructure. There are more methods and a whole other branch of DNA nanotechnology has
developed known as DNA origami which will be discussed in depth later in the review.
Figure 1.25 - Sequence model for a synthetic 4-way junction. The sequences are of 13
overlapping tetramers. The first two are boxed at the top of the model. The second
boxed tetramer (AGTC) illustrates there is no complimentary tetramer anywhere in the
model to ensure no pairing across the junction. The boxed trimers (ATG) clearly could
compete here but the free energy difference between the desired junction and the
trimer prevents this. Taken from 81.
29
Before this, various examples of structures originating from these methods and their impacts
will be discussed.
1.2.2 Small 3D DNA structures
By exploiting the design and construction techniques discussed above, numerous research
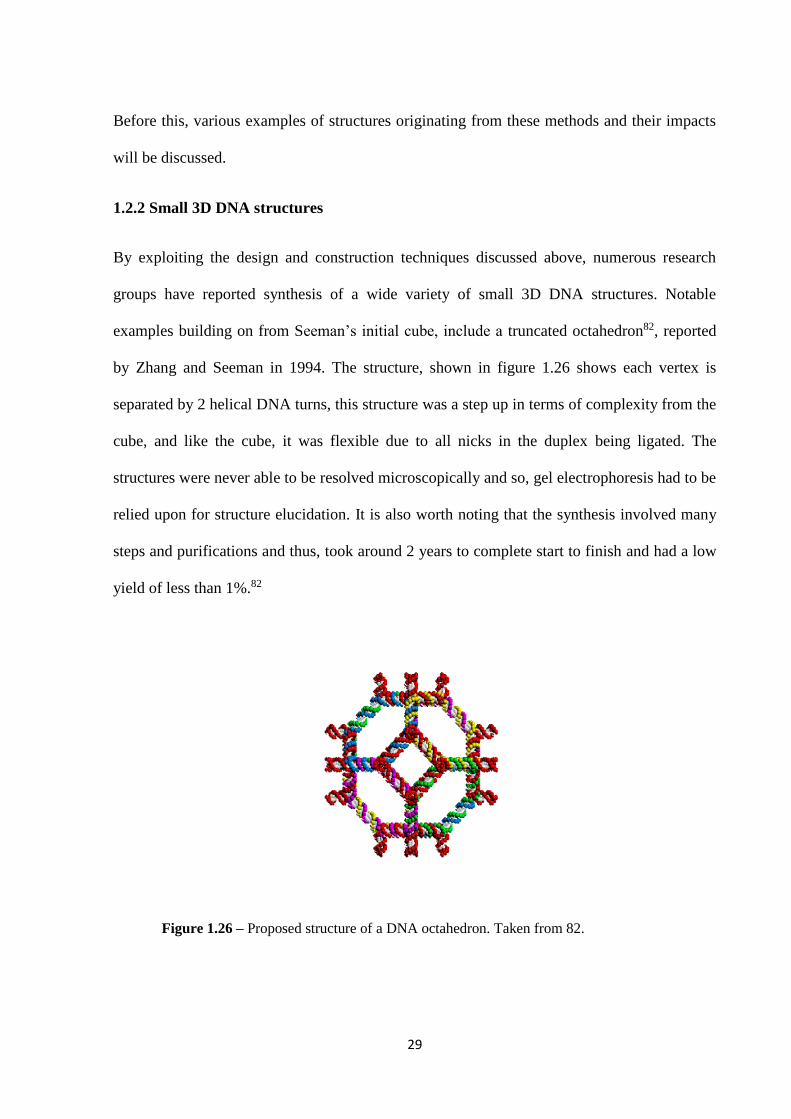
groups have reported synthesis of a wide variety of small 3D DNA structures. Notable
examples building on from Seeman’s initial cube, include a truncated octahedron82, reported
by Zhang and Seeman in 1994. The structure, shown in figure 1.26 shows each vertex is
separated by 2 helical DNA turns, this structure was a step up in terms of complexity from the
cube, and like the cube, it was flexible due to all nicks in the duplex being ligated. The
structures were never able to be resolved microscopically and so, gel electrophoresis had to be
relied upon for structure elucidation. It is also worth noting that the synthesis involved many
steps and purifications and thus, took around 2 years to complete start to finish and had a low
yield of less than 1%.82
Figure 1.26 – Proposed structure of a DNA octahedron. Taken from 82.
30
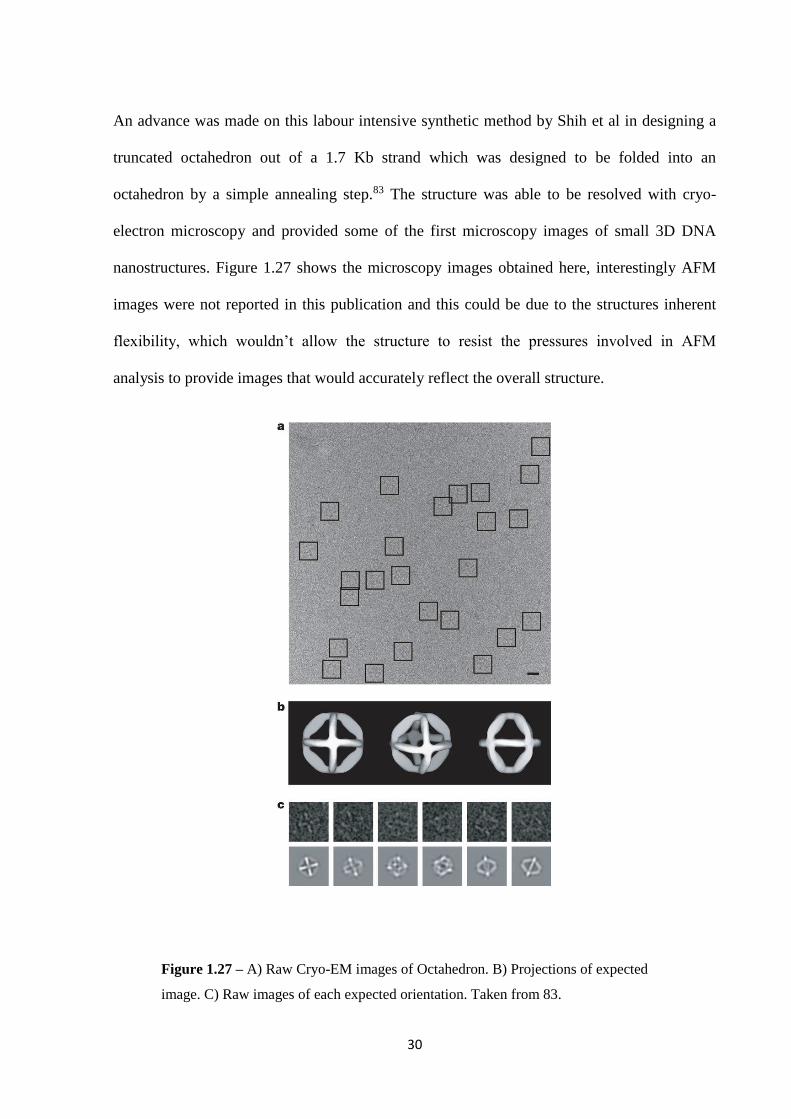
An advance was made on this labour intensive synthetic method by Shih et al in designing a
truncated octahedron out of a 1.7 Kb strand which was designed to be folded into an
octahedron by a simple annealing step.83 The structure was able to be resolved with cryo-
electron microscopy and provided some of the first microscopy images of small 3D DNA
nanostructures. Figure 1.27 shows the microscopy images obtained here, interestingly AFM
images were not reported in this publication and this could be due to the structures inherent
flexibility, which wouldn’t allow the structure to resist the pressures involved in AFM
analysis to provide images that would accurately reflect the overall structure.
Figure 1.27 – A) Raw Cryo-EM images of Octahedron. B) Projections of expected
image. C) Raw images of each expected orientation. Taken from 83.
31
1.2.2.1 DNA Tetrahedron
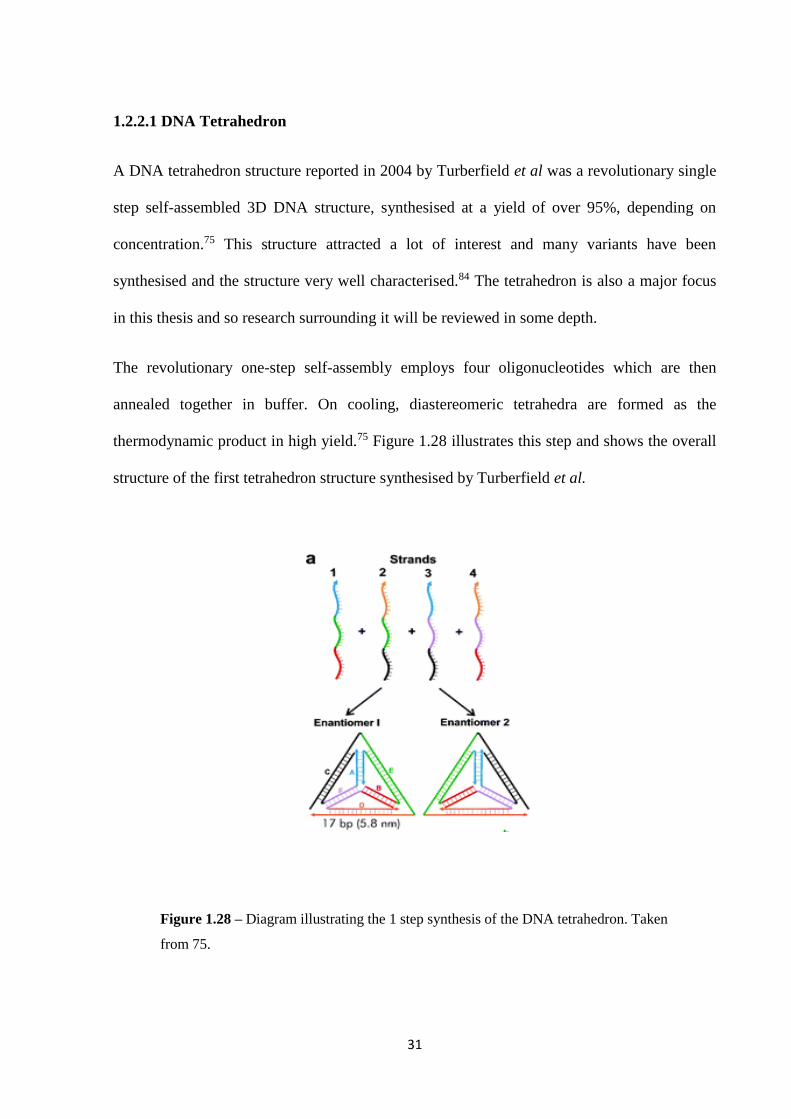
A DNA tetrahedron structure reported in 2004 by Turberfield et al was a revolutionary single
step self-assembled 3D DNA structure, synthesised at a yield of over 95%, depending on
concentration.75 This structure attracted a lot of interest and many variants have been
synthesised and the structure very well characterised.84 The tetrahedron is also a major focus
in this thesis and so research surrounding it will be reviewed in some depth.
The revolutionary one-step self-assembly employs four oligonucleotides which are then
annealed together in buffer. On cooling, diastereomeric tetrahedra are formed as the
thermodynamic product in high yield.75 Figure 1.28 illustrates this step and shows the overall
structure of the first tetrahedron structure synthesised by Turberfield et al.
Figure 1.28 – Diagram illustrating the 1 step synthesis of the DNA tetrahedron. Taken
from 75.
32
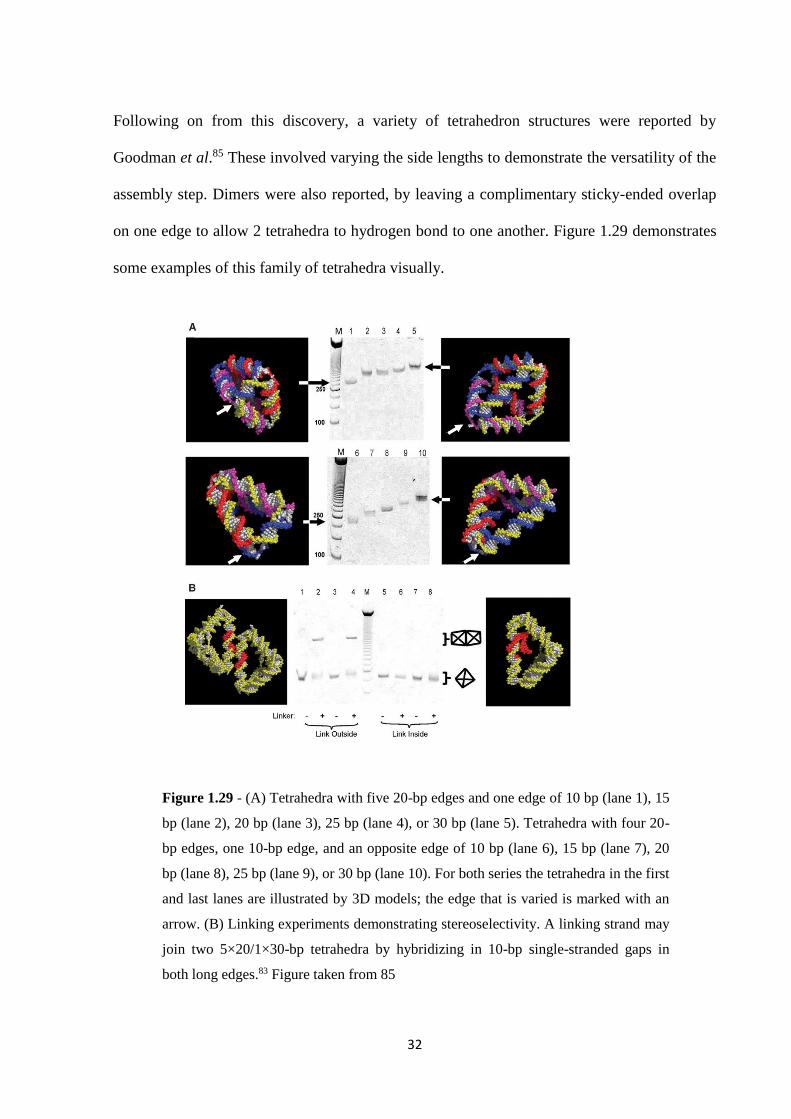
Following on from this discovery, a variety of tetrahedron structures were reported by
Goodman et al.85 These involved varying the side lengths to demonstrate the versatility of the
assembly step. Dimers were also reported, by leaving a complimentary sticky-ended overlap
on one edge to allow 2 tetrahedra to hydrogen bond to one another. Figure 1.29 demonstrates
some examples of this family of tetrahedra visually.
Figure 1.29 - (A) Tetrahedra with five 20-bp edges and one edge of 10 bp (lane 1), 15
bp (lane 2), 20 bp (lane 3), 25 bp (lane 4), or 30 bp (lane 5). Tetrahedra with four 20-
bp edges, one 10-bp edge, and an opposite edge of 10 bp (lane 6), 15 bp (lane 7), 20
bp (lane 8), 25 bp (lane 9), or 30 bp (lane 10). For both series the tetrahedra in the first
and last lanes are illustrated by 3D models; the edge that is varied is marked with an
arrow. (B) Linking experiments demonstrating stereoselectivity. A linking strand may
join two 5×20/1×30-bp tetrahedra by hybridizing in 10-bp single-stranded gaps in
both long edges.83 Figure taken from 85
33
These tetrahedra have a wide scope for functionality and variety. The hollow cavity also
represents a clear opportunity to encapsulate a cargo. Research initially focused on filling this
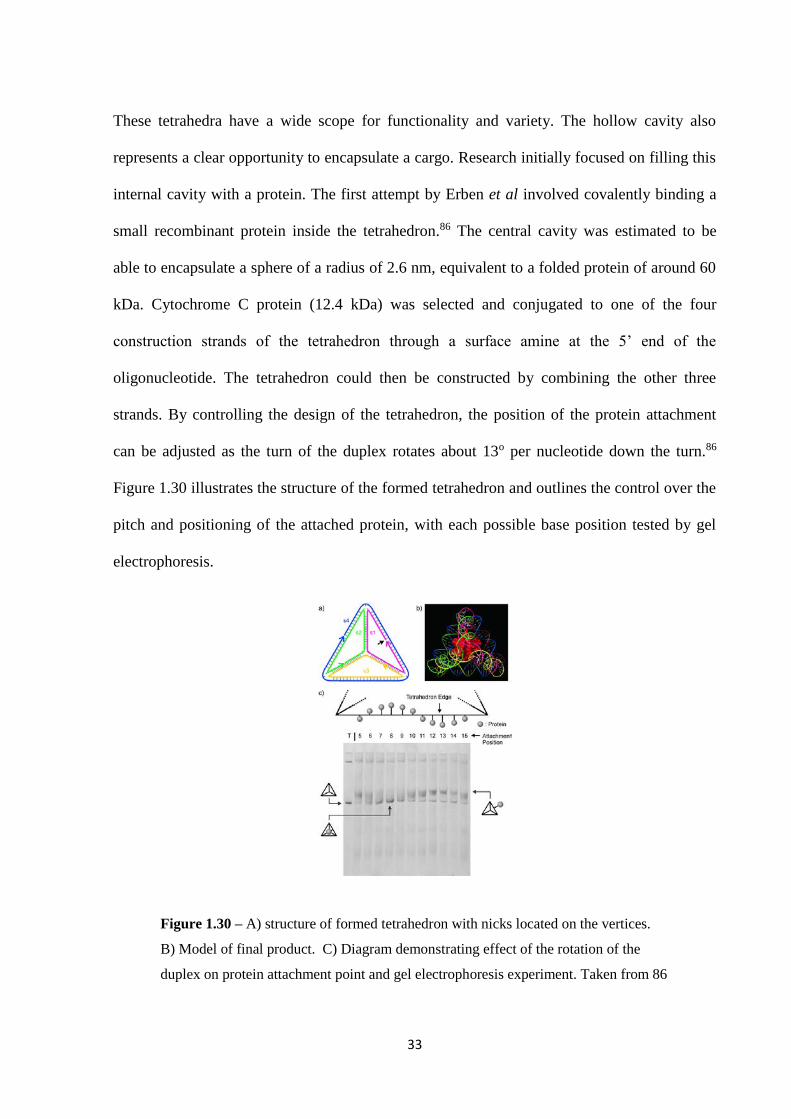
internal cavity with a protein. The first attempt by Erben et al involved covalently binding a
small recombinant protein inside the tetrahedron.86 The central cavity was estimated to be
able to encapsulate a sphere of a radius of 2.6 nm, equivalent to a folded protein of around 60
kDa. Cytochrome C protein (12.4 kDa) was selected and conjugated to one of the four
construction strands of the tetrahedron through a surface amine at the 5’ end of the
oligonucleotide. The tetrahedron could then be constructed by combining the other three
strands. By controlling the design of the tetrahedron, the position of the protein attachment
can be adjusted as the turn of the duplex rotates about 13o per nucleotide down the turn.86
Figure 1.30 illustrates the structure of the formed tetrahedron and outlines the control over the
pitch and positioning of the attached protein, with each possible base position tested by gel
electrophoresis.
Figure 1.30 – A) structure of formed tetrahedron with nicks located on the vertices.
B) Model of final product. C) Diagram demonstrating effect of the rotation of the
duplex on protein attachment point and gel electrophoresis experiment. Taken from 86
34
This publication only covered the encapsulation of the cargo and didn’t highlight any methods
for subsequently releasing the cargo. As the surface amine attachment is a covalent bond, the
bond would be very difficult to break without denaturing the protein. Various other covalent
strategies for combining DNA with proteins have been reported including bifunctional
crosslinkers87, click chemistry88 and disulphide bonds89. A reversible, non-covalent
attachment between cargo and DNA structure became the challenge and this challenge began
to be addressed when Goodman et al reported a reversible non-covalent coupling between
proteins and oligonucleotides via a nickel mediated co-ordination bond involving Histidine
tags on the protein and NTA (nitrilotriacetic acid) groups on the oligonucleotide.90 Once the
coupling was initiated, the central Ni cation could be sequestered via use of a chelating agent,
breaking the coupling.
This coupling was then used by Bermudez et al. in 2012 in a tetrahedron-like structure and
enhanced green fluorescent protein (EGFP) was internalised inside a DNA tetrahedron with i-
motif functionalities on the edges.91 The reversibility and subsequent release of the
internalised EGFP was achieved through lowering the pH of the buffer to hydrolyse the Ni
co-ordination bonds and form i-motifs in the vertexes which causes the tetrahedron to collapse
in shape, subsequently releasing the protein from the structure. Unfortunately the low pH
required for this denatured much of the protein activity.
Another cargo encapsulation example involving the tetrahedron was reported by Crawford et
al. in 2013.92 In this publication, catabolite activator protein (CAP), a transcription factor, was
encapsulated inside a DNA tetrahedron. CAP intracellularly regulates up to 100 genes in the
body and so was an interesting target as transcription factors activity can be blocked whilst
inside a DNA cage as it cannot bind cellular DNA.92 If an external trigger was found that
35
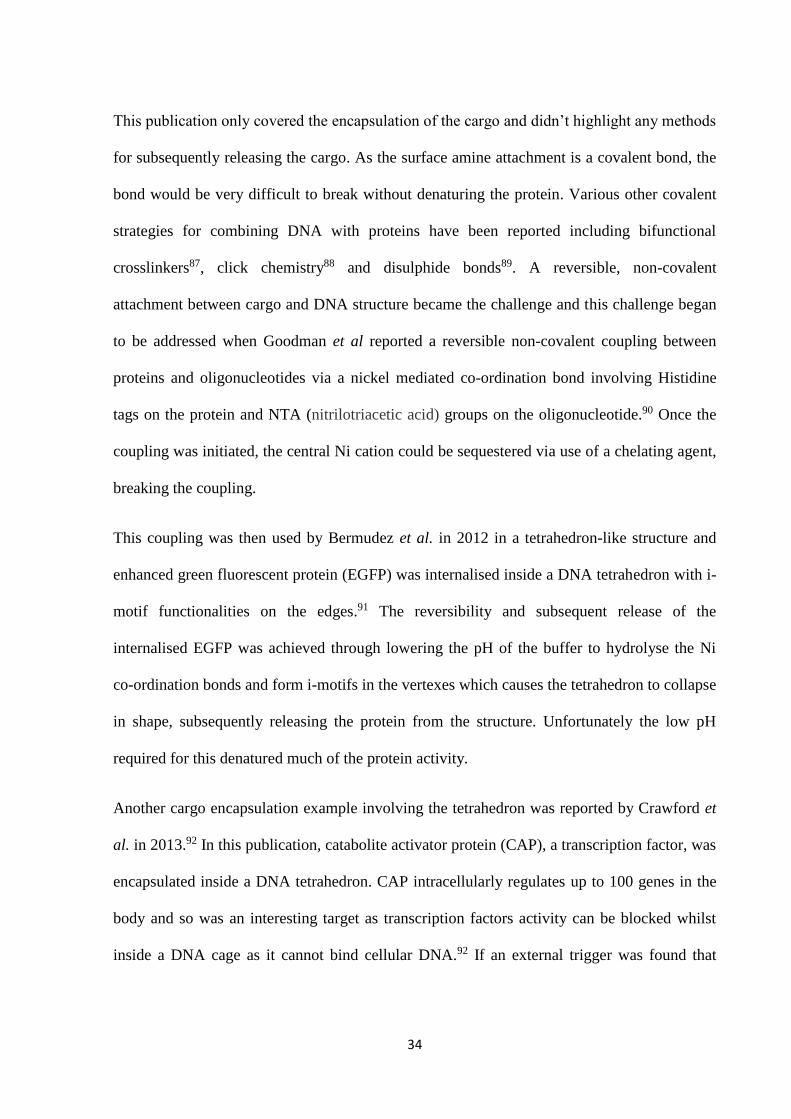
Figure 1.31 – Model diagram of the DNA tetrahedron possessing the binding site for
CAP and the subsequent encapsulation of CAP inside the central cavity. Taken from
92.
could release the protein whilst inside a cell, this would be a way to elegantly regulate gene
expression.
Encapsulation was achieved by incorporating a 22 bp sequence that matches the 22 bp
recognition site on CAP into a DNA tetrahedron. This would then allow the CAP to recognise
the site on the tetrahedron and bind inside (figure 1.31).
The subsequent release of the CAP was demonstrated by addition of a nuclease to remove the
DNA (effectively, if unselectively). However, it is reasonable to theorise any deformation of
the binding site by an external factor would result in protein release such as DNA binding of a
small molecule.
The potential of the DNA tetrahedron as a strong candidate for cellular delivery of cargo has
been discussed in depth and further literature reports of biological compatibility will be
discussed further later in this introduction.
1.2.3 DNA Origami
36
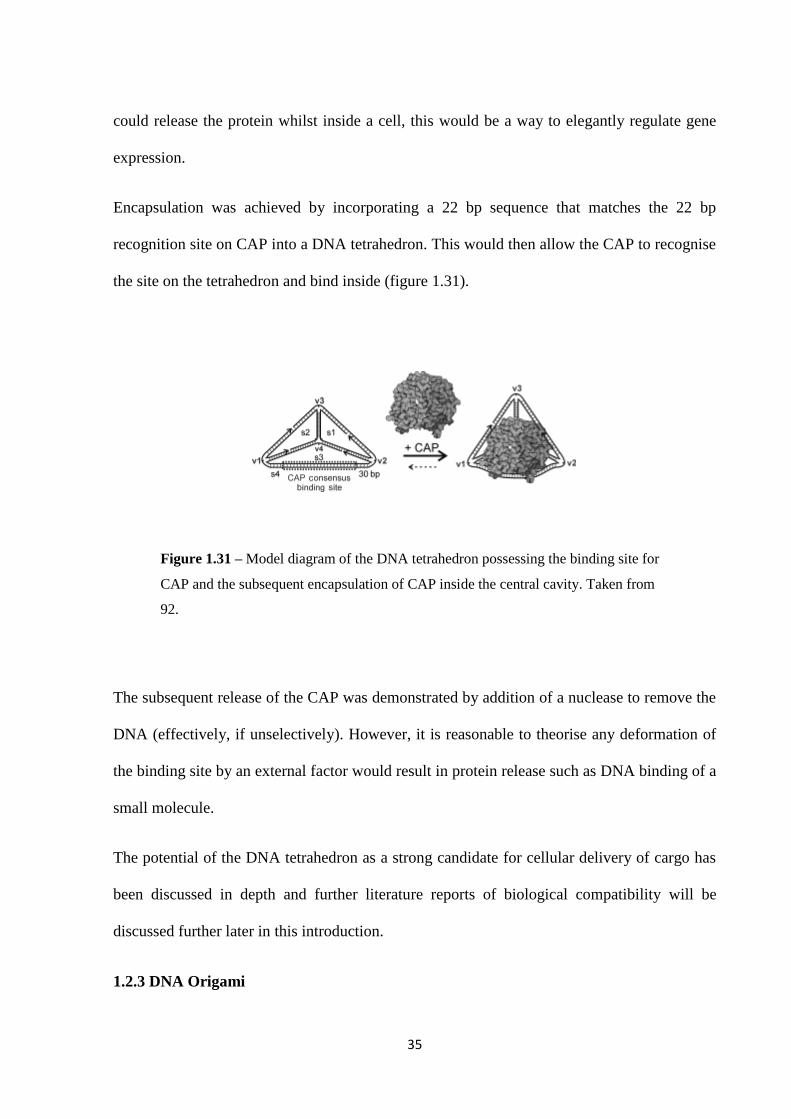
Figure 1.32 – Wide variety of shapes of folded DNA to form a) a square, b) a
rectangle, c) a star, d) a smiley face, e) a pyramid of rectangles, f) a hollow triangle.
All imaged by AFM. Taken from 93.
A large branch of DNA nanotechnology that must be mentioned has become known as DNA
origami. DNA origami was first reported in 2006 by Paul Rothemund at the California
Institute of Technology.93 It involves using a ‘construction strand’ which is an oligonucleotide
of around 7kb. This construction strand is then manipulated with designed smaller ‘staple’
strands. These smaller oligonucleotides bind to the construction strand in a single step process
to form the most energetically favourable formation. By carefully designing the staple strands,
one is able to form controllable shapes of up to 100 nm in diameter.93 This technique allowed
for a wide variety of recognisable shapes and structures to be synthesised and observed by
AFM (figure 1.32).
37
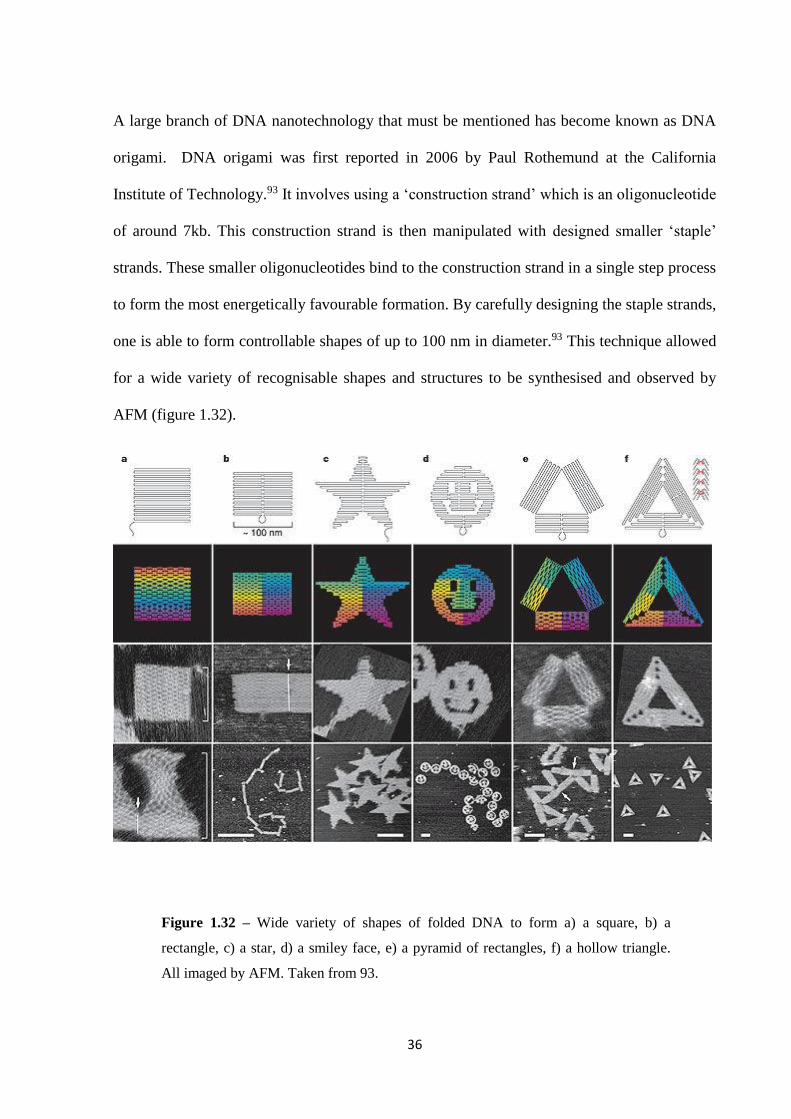
This revolutionary work opened up many research opportunities to expand, not only on these
2D arrays, but to form 3D structures out of folded DNA origami.94 The first and one of the
most notable examples was by Gothelf et al. in 2009, synthesising a 3D box which possessed
an openable lid which could be opened selectively on addition of an oligonucleotide or
‘key’(figure 1.33).95
Rigid enough to be characterised by AFM, cryo-EM and confirming the control of the lid
through FRET experiments, this box certainly had an impact on the research area. The box
has a few advantages over previously reported 3D DNA proposed cargo carriers as it can be
opened by a specific trigger of any ssDNA or ssRNA, which could be tuned to specific
Figure 1.33 – Model illustration of a) the origami construction square sections of
folded DNA, functionalised with FRET pair (yellow star and red circle), b) fully
constructed box with lid closed, allowing FRET to occur between the FRET pair. On
addition of competing oligonucleotides (keys), the box is opened and halts FRET.
Taken from 95.
38
cellular sequences. It also occurs under native conditions95 and unlike low pH conditions seen
earlier91, biological cargo is unlikely to be damaged by the triggered release.
Many groups reported similar boxes of differing size and shape to this original box, including
a very similar box synthesised through closing a single open origami motif.96 Sugiyama et al.
reported triangular, square and octahedral hollow prisms of DNA origami in simple 1 pot
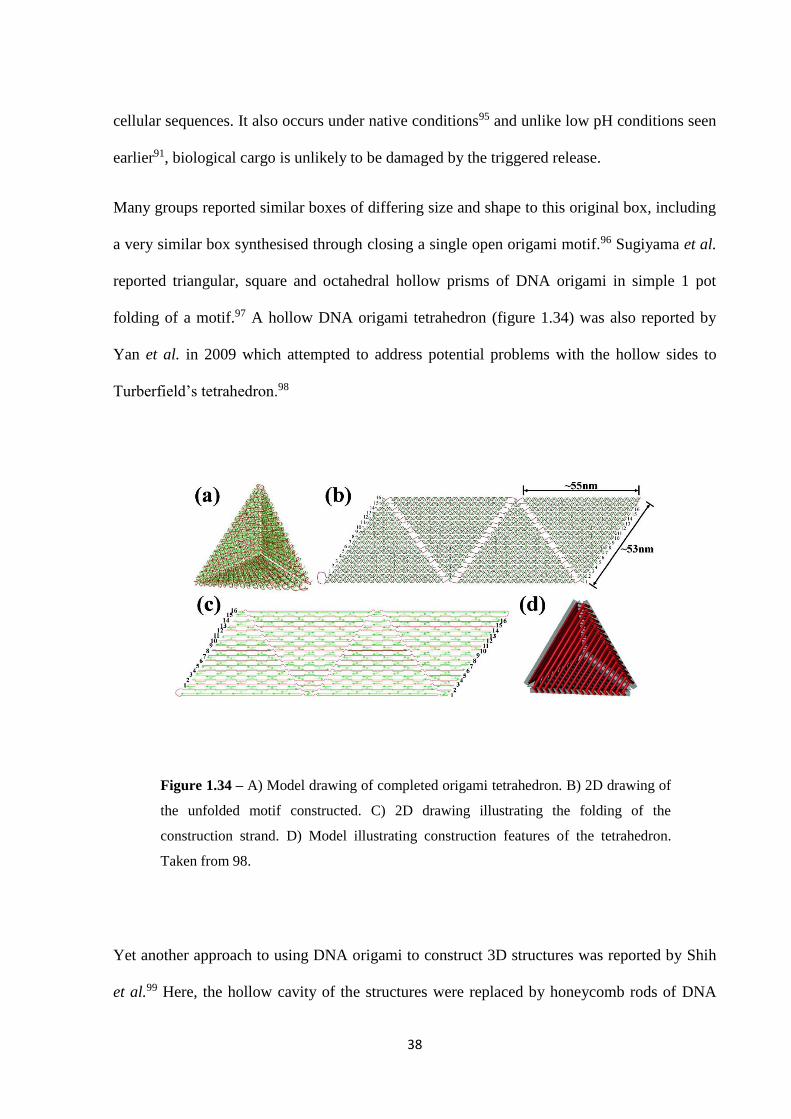
folding of a motif.97 A hollow DNA origami tetrahedron (figure 1.34) was also reported by
Yan et al. in 2009 which attempted to address potential problems with the hollow sides to
Turberfield’s tetrahedron.98
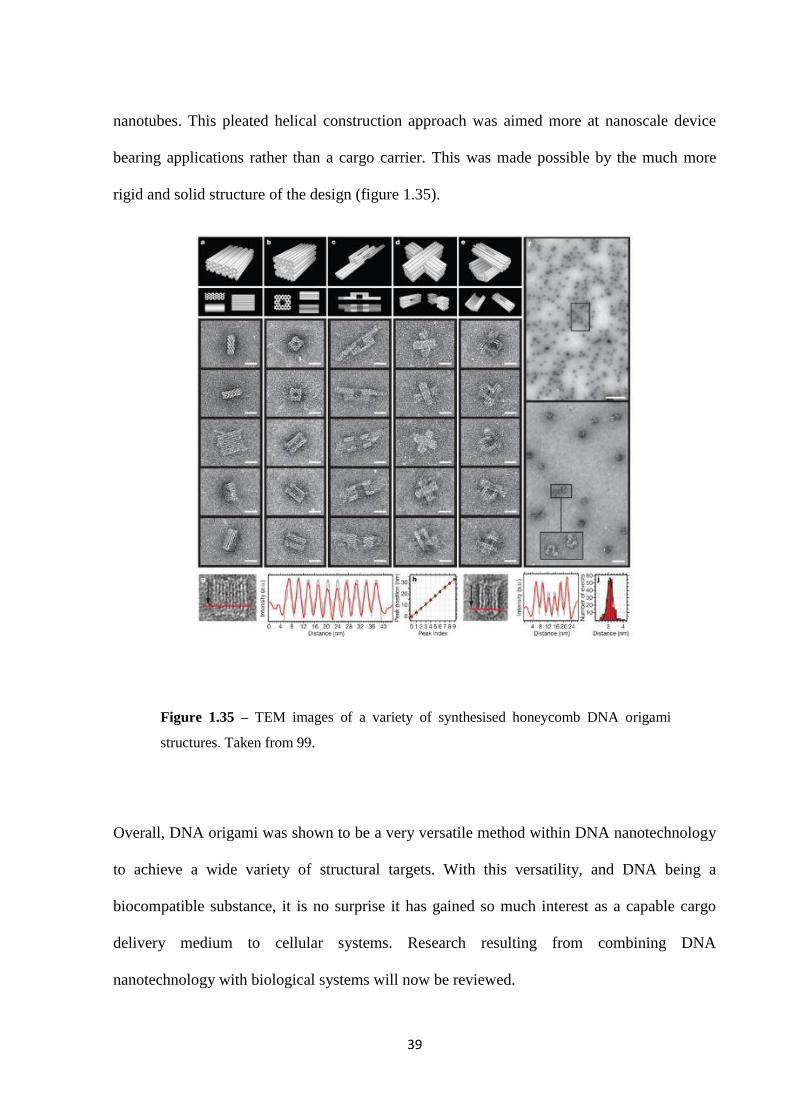
Yet another approach to using DNA origami to construct 3D structures was reported by Shih
et al.99 Here, the hollow cavity of the structures were replaced by honeycomb rods of DNA
Figure 1.34 – A) Model drawing of completed origami tetrahedron. B) 2D drawing of
the unfolded motif constructed. C) 2D drawing illustrating the folding of the
construction strand. D) Model illustrating construction features of the tetrahedron.
Taken from 98.
39
Figure 1.35 – TEM images of a variety of synthesised honeycomb DNA origami
structures. Taken from 99.
nanotubes. This pleated helical construction approach was aimed more at nanoscale device
bearing applications rather than a cargo carrier. This was made possible by the much more
rigid and solid structure of the design (figure 1.35).
Overall, DNA origami was shown to be a very versatile method within DNA nanotechnology
to achieve a wide variety of structural targets. With this versatility, and DNA being a
biocompatible substance, it is no surprise it has gained so much interest as a capable cargo
delivery medium to cellular systems. Research resulting from combining DNA
nanotechnology with biological systems will now be reviewed.
40
1.3 DNA nanotechnology in Biological Applications
1.3.1 DNA tetrahedron in cellular systems
The DNA tetrahedron was first reported to be able to enter cells by Walsh et al. in 2011
following its discovery in 2004.100 This is particularly interesting as the polyanionic nature of
DNA makes cell membranes impermeable for dsDNA and ssDNA.101 Here, Turberfield’s
original tetrahedron was fluorescently labelled with a fluorescent tag and incubated with
human embryonic kidney cells (HEK line). The uptake and localisation was observed and
measured with and without transfection agents by confocal microscopy. It was found that
even in the absence of transfection agents, the tetrahedron was readily taken up by the cells. It
was also found through FRET experiments that the tetrahedron remains intact for over 48
hours inside the cells.100
However, the article does not detail the mechanism by which the structure enters the cells.
Instead it speculates on theories consistent with other nanoparticle uptake studies,102
suggesting macropinocytosis, clathrin-mediated endocytosis, and caveolae-mediated
endocytosis as possible entry mechanisms.103 All these suggestions are reasonable; because of
the anionic nature of DNA and cell membranes, an active uptake mechanism seems the most
likely as opposed to passive diffusion (due to electrostatic repulsions.)
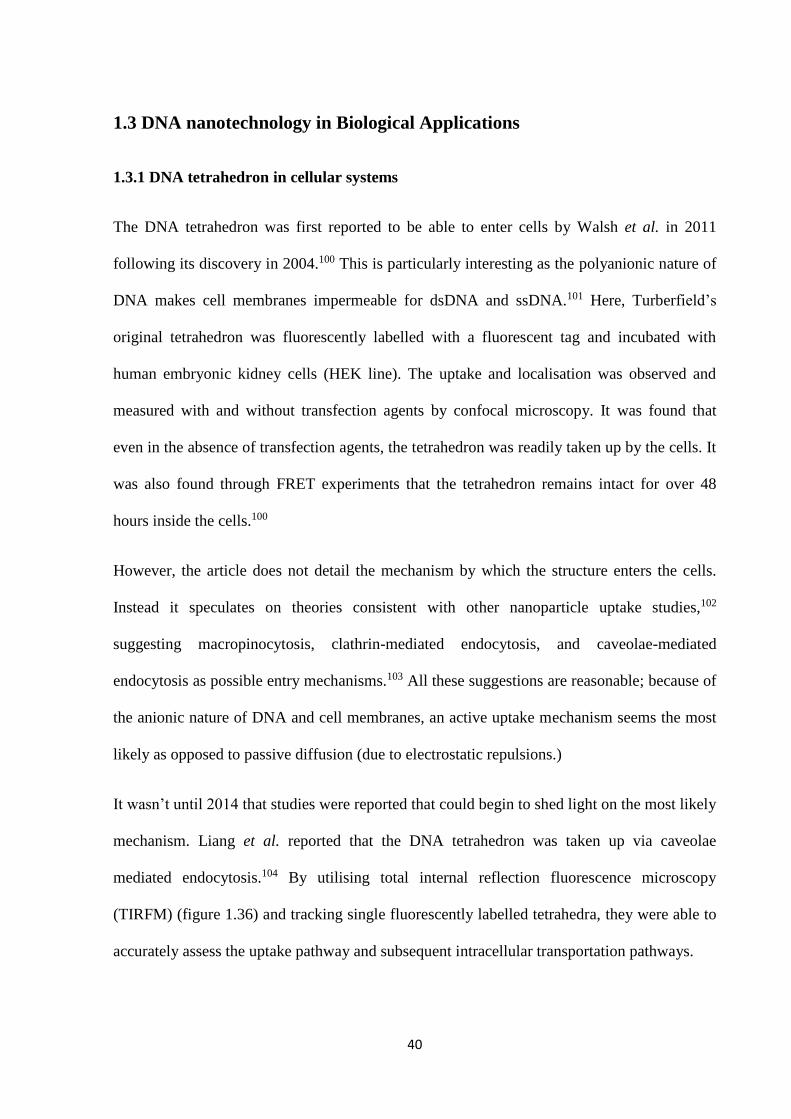
It wasn’t until 2014 that studies were reported that could begin to shed light on the most likely
mechanism. Liang et al. reported that the DNA tetrahedron was taken up via caveolae
mediated endocytosis.104 By utilising total internal reflection fluorescence microscopy
(TIRFM) (figure 1.36) and tracking single fluorescently labelled tetrahedra, they were able to
accurately assess the uptake pathway and subsequent intracellular transportation pathways.
41
Figure 1.36 – A) confocal images of cy3 labelled tetrahedron uptake from 2-12 hours.
C) TIRFM images a to f showing one tetrahedron (indicated by arrow in frame a) and
its uptake movements over time, highlighted by the blue arrow. D + E) 3D graphical
presentation illustrating tetrahedron movement over time. Taken from 104
The article managed to exclude other uptake pathways by creating conditions that would
make other options impossible and by a process of elimination left only the caveolae
dependent pathway possible. The major step came between attempting to differentiate
between clathrin and caveolae dependent pathways. By treating the HeLa cells with methyl-β-
cyclodextrin (MβCD), which depletes cholesterol and disrupts caveolae and subsequently
caveolae dependent endocytosis, the group were able to observe a decrease of approximately
54%.104, 105 Conversely, by treating with sucrose to inhibit the effectiveness of the clathrin
mediated pathway106, no change in uptake was observed, allowing the group to conclude the
uptake mechanism reported.
42
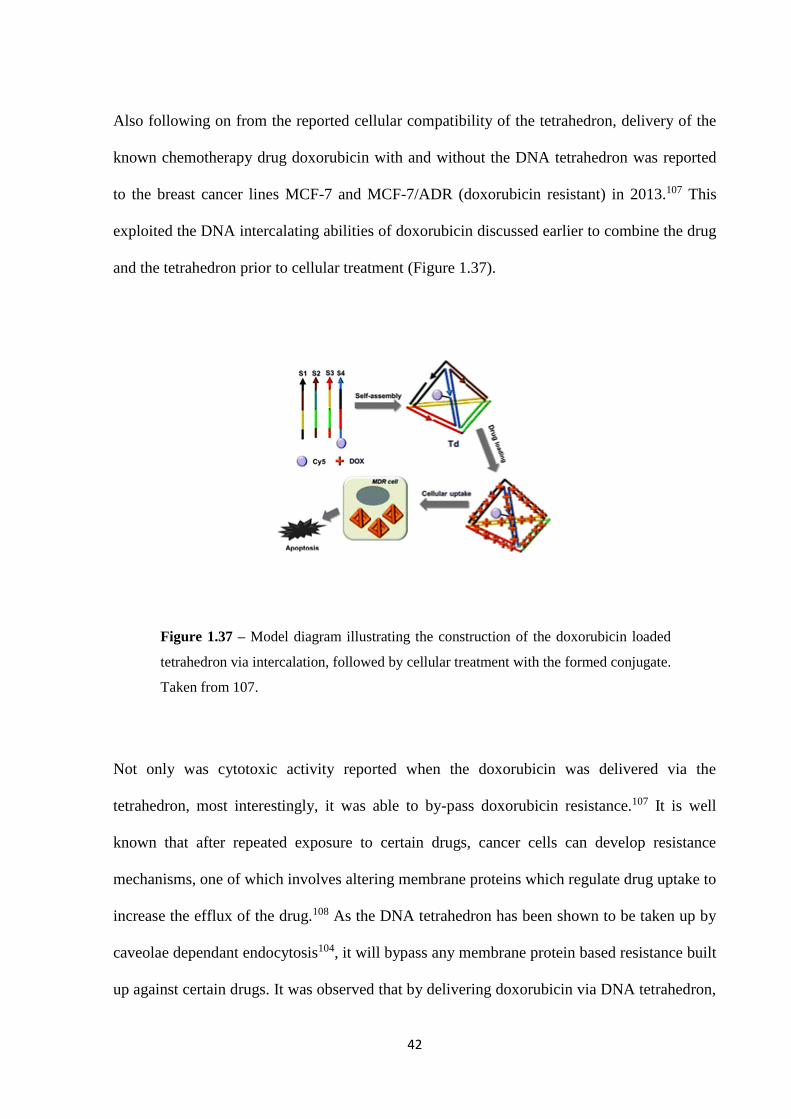
Also following on from the reported cellular compatibility of the tetrahedron, delivery of the
known chemotherapy drug doxorubicin with and without the DNA tetrahedron was reported
to the breast cancer lines MCF-7 and MCF-7/ADR (doxorubicin resistant) in 2013.107 This
exploited the DNA intercalating abilities of doxorubicin discussed earlier to combine the drug
and the tetrahedron prior to cellular treatment (Figure 1.37).
Not only was cytotoxic activity reported when the doxorubicin was delivered via the
tetrahedron, most interestingly, it was able to by-pass doxorubicin resistance.107 It is well
known that after repeated exposure to certain drugs, cancer cells can develop resistance
mechanisms, one of which involves altering membrane proteins which regulate drug uptake to
increase the efflux of the drug.108 As the DNA tetrahedron has been shown to be taken up by
caveolae dependant endocytosis104, it will bypass any membrane protein based resistance built
up against certain drugs. It was observed that by delivering doxorubicin via DNA tetrahedron,
Figure 1.37 – Model diagram illustrating the construction of the doxorubicin loaded
tetrahedron via intercalation, followed by cellular treatment with the formed conjugate.
Taken from 107.
43
not only was total cellular doxorubicin content increased in doxorubicin resistant cells, but
cell viability was significantly decreased when compared to treating with free doxorubicin.107
Whilst this wasn’t the first report of using nanoparticles to deliver therapeutics to overcome
drug resistance via altered uptake pathway, for instance, liposomal doxorubicin (marketed as
Doxil) has been used in the clinic for over 25 years109, 110, it was one of the first instances of
using a DNA nanostructure to overcome this type of resistance against a common therapeutic
agent.
Aside from delivery of classic chemotherapy drugs, the delivery of more novel therapies such
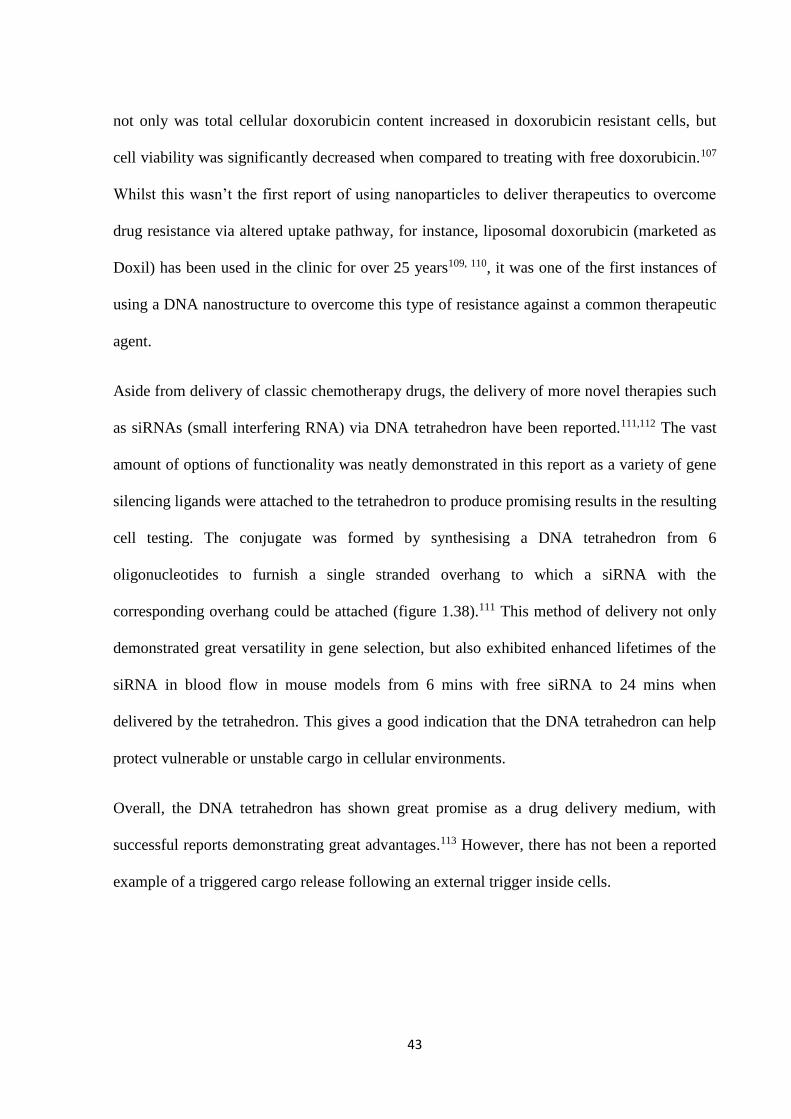
as siRNAs (small interfering RNA) via DNA tetrahedron have been reported.111,112 The vast
amount of options of functionality was neatly demonstrated in this report as a variety of gene
silencing ligands were attached to the tetrahedron to produce promising results in the resulting
cell testing. The conjugate was formed by synthesising a DNA tetrahedron from 6
oligonucleotides to furnish a single stranded overhang to which a siRNA with the
corresponding overhang could be attached (figure 1.38).111 This method of delivery not only
demonstrated great versatility in gene selection, but also exhibited enhanced lifetimes of the
siRNA in blood flow in mouse models from 6 mins with free siRNA to 24 mins when
delivered by the tetrahedron. This gives a good indication that the DNA tetrahedron can help
protect vulnerable or unstable cargo in cellular environments.
Overall, the DNA tetrahedron has shown great promise as a drug delivery medium, with
successful reports demonstrating great advantages.113 However, there has not been a reported
example of a triggered cargo release following an external trigger inside cells.
44
1.3.2 Biological Applications of Other Types of DNA Nanostructures
The DNA tetrahedron is not the only DNA structure reported to have applications in cellular
delivery. DNA origami in the form of triangular origami nanotubes has shown to be
compatible with cell systems and was reported to successfully deliver doxorubicin and bypass
drug resistance mechanisms much in the same way as previously discussed.114 It is not clear
whether the much larger DNA structures reported here are internalised via the same
mechanism as the smaller tetrahedron, but high levels of drug loading due to sheer amount of
DNA bases carrying the drugs such as doxorubicin. It will be interesting to see in years to
Figure 1.38 – A) model illustrating construction of the tetrahedron from 6
oligonucleotides and the subsequent self-assembly of the siRNA functionality. B) gel
electrophoresis experiment confirming construction of tetrahedron. C) AFM images of
tetrahedron on a surface. Taken from 111.
45
come, with the ever decreasing cost of synthetic DNA, which method will be more cost
effective when treating in vivo. It is also worth noting that these publications do not discuss
whether some of the cytotoxicity of the doxorubicin is diminished when delivered by DNA.
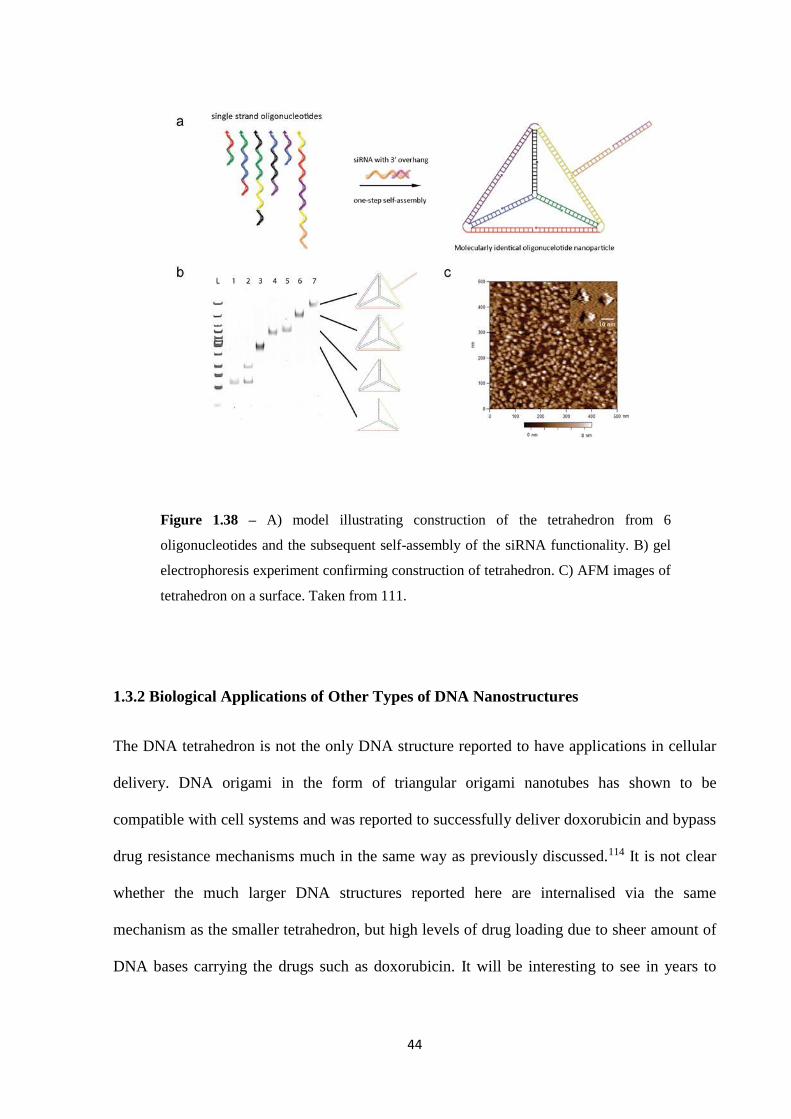
DNA nanotubes are also capable of entering cells and were reported to be able to deliver
integrated CpG-oligonucleotides.115 CpG-oligonucleotides are short ssDNA containing
sequences of the nucleotide cysteine followed by guanine, separated by a phosphodiester
group. They are active when unmethylated as they are recognised in cellular environments by
receptors which initiate an immune response from the cell.116 They have been shown to
stimulate immune responses against tumour antigens.116 However, they are vulnerable to
nucleases and as ssDNA alone, cannot enter cells alone as their polyanionic nature leads to
repulsion from cell membranes. By conjugating them inside DNA nanotube structures (figure
1.39), the CpG oligonucleotides are protected and reported to enter cells in vivo within
minutes. In mouse models, treatment with the conjugate resulted in increased levels of
leukocytes; implicit of an immune response. Nanotubes alone did not result in immune
response and as with other DNA structures, did not show cytotoxicity due to its high
biocompatibility.115
Figure 1.39 – Model illustrating the design and structure of the CpG-oligonucleotide
integrated DNA nanotubes. Taken from 115.
46
Finally, it is worth noting the most widely studied nanocarrier for targeted drug delivery as a
means of comparison to DNA nanostructures: Liposomes.117 Liposomes are phospholipid
vesicles, made up of one or more lipid bilayers surrounding an aqueous central space. Their
success can be attributed to a number of key attributes, the first being that they are capable of
encapsulating both hydrophobic and hydrophilic molecules.118 The large aqueous center also
allows encapsulation of large macromolecules such as DNA and proteins.119 This allows easy
compatibility with a wide range of drugs. As phospholipids, they are biocompatible and have
a wide range of physicochemical and biophysical properties that can be manipulated to
control their characteristics in biomedical applications and targeting.120 Unlike DNA
nanocarriers, some liposomal pharmaceuticals have become clinically approved. The most
successful example of this is PEG conjugated liposomal doxorubicin.121 Encapsulating in this
way has a number of advantages, the most notable being that it increases the half-life of
doxorubicin in the blood while decreasing the peak levels of free drug in the blood. This
increases accumulation in tumour tissue while decreasing cardiac muscle cell toxicity by
reducing exposure here.122
Despite the plethora of research, liposomal delivery modes have had a multitude of issues
surrounding them, leading to dampened success in the clinic. Some of the main reasons for
this are scaling up the manufacture of them is often problematic leading to unreliable product.
Changes in manufacturing processes can also lead to broken down or denatured encapsulated
compound.123 This highlights the importance of pursuing other nanocarriers such as DNA
nanostructures.
47
1.4 Overview of Thesis
This thesis aims to explore the effects of metallosupramolecular cylinders binding to different
nucleic acid structures, with a particular focus on the DNA tetrahedron. The interaction
between the cylinder and tetrahedron will be fully explored, examining any interactions for
potential applications, along with possible biological compatibility. This research aims to set
up findings that will plug the gap of externally triggered cargo release using DNA
nanotechnology inside cellular systems.
Chapter 2 will begin to investigate the iron-supramolecular cylinder’s affinity to a variety of
DNA structures. It will then discuss the affinity to the DNA tetrahedron and explore any
effects binding has to this structure. The enantiomers of the iron cylinder will also be explored
and any differing binding behaviours to the tetrahedron investigated.
Chapter 3 will investigate the biological activity of the cylinder-tetrahedron conjugate in
cellular systems through established biological assays and microscopy. The potential effects
of free tetrahedron and free cylinder when compared to conjugate will be investigated and
following from this, the future applications of the complexes will be discussed.
Chapter 4 explores a ruthenium cylinders ability to absorb light and induce DNA cleavage
when bound to DNA. Activity at different wavelengths will be experimented and reported.
Ruthenium cylinder photocleavage will be applied to the DNA tetrahedron with a view to
trigger breaking open the tetrahedron with an external trigger. Finally, initial experiments on
the potential application of the ruthenium cylinder as a photodynamic therapeutic agent in
cells and the possible use of the tetrahedron in this setting are described.
48
Chapter 5 investigates the binding of iron, nickel and ruthenium cylinders to a looped region
of HIV RNA, significant to the virus’ growth cycle. The effectiveness of inhibition and the
anti-retro viral activity will also be discussed.
49
1.5 References
1. R. Dahm, Friedrich Miescher and the discovery of DNA. Developmental Biology, 2005. 278(2):
p. 274-288.
2. P.A. Levene, THE STRUCTURE OF YEAST NUCLEIC ACID: IV. AMMONIA HYDROLYSIS. Journal of
Biological Chemistry, 1919. 40(2): p. 415-424.
3. L. Pray, Discovery of DNA structure and function: Watson and Crick. . Nature Education, 2008.
1((1)): p. 100.
4. E. Chargaff, B. Magasanik, E. Vischer, C. Green, R. Doniger, and D. Elson, Nucleotide
composition of pentose nucleic acids from yeast and mammalian tissues. J Biol Chem, 1950.
186(1): p. 51-67.
5. N. Kresge, R.D. Simoni, and R.L. Hill, Chargaff's Rules: the Work of Erwin Chargaff. Journal of
Biological Chemistry, 2005. 280(24): p. e21.
6. R.E. Franklin and R.G. Gosling, MOLECULAR CONFIGURATION IN SODIUM THYMONUCLEATE.
Nature, 1953. 171(4356): p. 740-741.
7. J.D. Watson and F.H. Crick, Molecular structure of nucleic acids; a structure for deoxyribose
nucleic acid. Nature, 1953. 171(4356): p. 737-8.
8. atdbio, Nucleic Acid Structure atdbio.com/content/5/Nucleic-acid-structure.
9. J.C. Wang, Helical repeat of DNA in solution. Proceedings of the National Academy of
Sciences, 1979. 76(1): p. 200-203.
10. T.J. Berg JM, Stryer L, DNA Can Assume a Variety of Structural Forms. Biochemistry. 5th
edition.
50
11. D.R. Whelan, T.J. Hiscox, J.I. Rood, K.R. Bambery, D. McNaughton, and B.R. Wood, Detection
of an <em>en masse</em> and reversible B- to A-DNA conformational transition in
prokaryotes in response to desiccation. Journal of The Royal Society Interface, 2014. 11(97).
12. S.C. Harvey, The scrunchworm hypothesis: Transitions between A-DNA and B-DNA provide the
driving force for genome packaging in double-stranded DNA bacteriophages. Journal of
Structural Biology, 2015. 189(1): p. 1-8.
13. A. Herbert and A. Rich, The Biology of Left-handed Z-DNA. Journal of Biological Chemistry,
1996. 271(20): p. 11595-11598.
14. A Rich, a. A Nordheim, and A.H.J. Wang, The Chemistry and Biology of Left-Handed Z-DNA.
Annual Review of Biochemistry, 1984. 53(1): p. 791-846.
15. J. Klysik, S.M. Stirdivant, J.E. Larson, P.A. Hart, and R.D. Wells, Left-handed DNA in restriction
fragments and a recombinant plasmid. Nature, 1981. 290(5808): p. 672-677.
16. A. Kuzminov, DNA replication meets genetic exchange: Chromosomal damage and its repair
by homologous recombination. Proceedings of the National Academy of Sciences of the
United States of America, 2001. 98(15): p. 8461-8468.
17. J. Lee, Y. Voziyanov, S. Pathania, and M. Jayaram, Structural Alterations and Conformational
Dynamics in Holliday Junctions Induced by Binding of a Site-Specific Recombinase. Molecular
Cell, 1998. 1(4): p. 483-493.
18. M.J. Hannon, DNA recognition Press release. University of Birmingham, 2006. 1(1): p. 4.
19. J. Chen and N.C. Seeman, Synthesis from DNA of a molecule with the connectivity of a cube.
Nature, 1991. 350(6319): p. 631-633.
20. M.L. Bochman, K. Paeschke, and V.A. Zakian, DNA secondary structures: stability and function
of G-quadruplex structures. Nat Rev Genet, 2012. 13(11): p. 770-780.
21. Y. Hong, M. Häußler, J.W.Y. Lam, Z. Li, K.K. Sin, Y. Dong, H. Tong, J. Liu, A. Qin, R. Renneberg,
and B.Z. Tang, Label-Free Fluorescent Probing of G-Quadruplex Formation and Real-Time
51
Monitoring of DNA Folding by a Quaternized Tetraphenylethene Salt with Aggregation-
Induced Emission Characteristics. Chemistry – A European Journal, 2008. 14(21): p. 6428-
6437.
22. D. Yang and K. Okamoto, Structural insights into G-quadruplexes: towards new anticancer
drugs. Future medicinal chemistry, 2010. 2(4): p. 619-646.
23. A. Rustighi, M.A. Tessari, F. Vascotto, R. Sgarra, V. Giancotti, and G. Manfioletti, A
polypyrimidine/polypurine tract within the Hmga2 minimal promoter: a common feature of
many growth-related genes. Biochemistry, 2002. 41(4): p. 1229-40.
24. T. Simonsson, P. Pecinka, and M. Kubista, DNA tetraplex formation in the control region of c-
myc. Nucleic Acids Res, 1998. 26(5): p. 1167-72.
25. S. Rankin, A.P. Reszka, J. Huppert, M. Zloh, G.N. Parkinson, A.K. Todd, S. Ladame, S.
Balasubramanian, and S. Neidle, Putative DNA quadruplex formation within the human c-kit
oncogene. J Am Chem Soc, 2005. 127(30): p. 10584-9.
26. T.M. Ou, Y.J. Lu, J.H. Tan, Z.S. Huang, K.Y. Wong, and L.Q. Gu, G-quadruplexes: Targets in
anticancer drug design. Chemmedchem, 2008. 3(5): p. 690-713.
27. J.M. Hardwick and L. Soane, Multiple Functions of BCL-2 Family Proteins. Cold Spring Harbor
Perspectives in Biology, 2013. 5(2).
28. D. Dominguez-Sola, C.Y. Ying, C. Grandori, L. Ruggiero, B. Chen, M. Li, D.A. Galloway, W. Gu, J.
Gautier, and R. Dalla-Favera, Non-transcriptional control of DNA replication by c-Myc. Nature,
2007. 448(7152): p. 445-451.
29. I.M. de Alboran, R.C. O'Hagan, F. Gärtner, B. Malynn, L. Davidson, R. Rickert, K. Rajewsky,
R.A. DePinho, and F.W. Alt, Analysis of C-MYC Function in Normal Cells via Conditional Gene-
Targeted Mutation. Immunity. 14(1): p. 45-55.
30. G. Maartens, C. Celum, and S.R. Lewin, HIV infection: epidemiology, pathogenesis, treatment,
and prevention. The Lancet. 384(9939): p. 258-271.
52
31. B. Rosenberg, L. Vancamp, and T. Krigas, INHIBITION OF CELL DIVISION IN ESCHERICHIA COLI
BY ELECTROLYSIS PRODUCTS FROM A PLATINUM ELECTRODE. Nature, 1965. 205: p. 698-9.
32. L. Kelland, The resurgence of platinum-based cancer chemotherapy. Nat Rev Cancer, 2007.
7(8): p. 573-84.
33. P.J. Loehrer and L.H. Einhorn, CIsplatin. Annals of Internal Medicine, 1984. 100(5): p. 704-
713.
34. T.C. Johnstone, K. Suntharalingam, and S.J. Lippard, The Next Generation of Platinum Drugs:
Targeted Pt(II) Agents, Nanoparticle Delivery, and Pt(IV) Prodrugs. Chemical Reviews, 2016.
116(5): p. 3436-3486.
35. atdbio, Nucleic Acid-Drug Interactions. Atdbio.com/content/16/Nucleic Acid-Drug
Interactions.
36. S. Dasari and P.B. Tchounwou, Cisplatin in cancer therapy: molecular mechanisms of action.
European journal of pharmacology, 2014. 0: p. 364-378.
37. L.R. Kelland, S.Y. Sharp, C.F. O'Neill, F.I. Raynaud, P.J. Beale, and I.R. Judson, Mini-review:
discovery and development of platinum complexes designed to circumvent cisplatin
resistance. J Inorg Biochem, 1999. 77(1-2): p. 111-5.
38. J.G. Hengstler, J. Lange, A. Kett, N. Dornhofer, R. Meinert, M. Arand, P.G. Knapstein, R.
Becker, F. Oesch, and B. Tanner, Contribution of c-erbB-2 and topoisomerase IIalpha to
chemoresistance in ovarian cancer. Cancer Res, 1999. 59(13): p. 3206-14.
39. W.P. Liu, Q.S. Ye, Y. Yu, X.Z. Chen, S.Q. Hou, L.G. Lou, Y.P. Yang, Y.M. Wang, and Q. Su, Novel
Lipophilic Platinum(II) Compounds of Salicylate Derivatives RESEARCH, DEVELOPMENT AND
LIPOSOMAL FORMULATION. Platinum Metals Review, 2008. 52(3): p. 163-171.
40. Y.-P. Ho, S.C.F. Au-Yeung, and K.K.W. To, Platinum-based anticancer agents: Innovative
design strategies and biological perspectives. Medicinal Research Reviews, 2003. 23(5): p.
633-655.
53
41. M.A. Jakupec, M. Galanski, and B.K. Keppler, Tumour-inhibiting platinum complexes—state of
the art and future perspectives, in Reviews of Physiology, Biochemistry and Pharmacology.
2003, Springer Berlin Heidelberg: Berlin, Heidelberg. p. 1-53.
42. S.v. Zutphen and J. Reedijk, Targeting platinum anti-tumour drugs: Overview of strategies
employed to reduce systemic toxicity. Coordination Chemistry Reviews, 2005. 249(24): p.
2845-2853.
43. N.J. Wheate, C.R. Brodie, J.G. Collins, S. Kemp, and J.R. Aldrich-Wright, DNA intercalators in
cancer therapy: organic and inorganic drugs and their spectroscopic tools of analysis. Mini
Rev Med Chem, 2007. 7(6): p. 627-48.
44. J. Cerny and P. Hobza, Non-covalent interactions in biomacromolecules. Physical Chemistry
Chemical Physics, 2007. 9(39): p. 5291-5303.
45. A. Mukherjee and W.D. Sasikala, Drug-DNA Intercalation: From Discovery to the Molecular
Mechanism, in Dynamics of Proteins and Nucleic Acids, T. KarabenchevaChristova, Editor.
2013. p. 1-62.
46. J.L. Nitiss, Targeting DNA topoisomerase II in cancer chemotherapy. Nature Reviews Cancer,
2009. 9(5): p. 338-350.
47. Y. Pommier, R.E. Schwartz, L.A. Zwelling, and K.W. Kohn, Effects of DNA intercalating agents
on topoisomerase II induced DNA strand cleavage in isolated mammalian cell nuclei.
Biochemistry, 1985. 24(23): p. 6406-10.
48. K.M. Tewey, T.C. Rowe, L. Yang, B.D. Halligan, and L.F. Liu, Adriamycin-induced DNA damage
mediated by mammalian DNA topoisomerase II. Science, 1984. 226(4673): p. 466-8.
49. L. Gallois, M. Fiallo, and A. Garnier-Suillerot, Comparison of the interaction of doxorubicin,
daunorubicin, idarubicin and idarubicinol with large unilamellar vesicles: Circular dichroism
study. Biochimica et Biophysica Acta (BBA) - Biomembranes, 1998. 1370(1): p. 31-40.
54
50. C.A. Frederick, L.D. Williams, G. Ughetto, G.A. Van der Marel, J.H. Van Boom, A. Rich, and
A.H.J. Wang, Structural comparison of anticancer drug-DNA complexes: adriamycin and
daunomycin. Biochemistry, 1990. 29(10): p. 2538-2549.
51. T.A. Larsen, D.S. Goodsell, D. Cascio, K. Grzeskowiak, and R.E. Dickerson, The structure of
DAPI bound to DNA. J Biomol Struct Dyn, 1989. 7(3): p. 477-91.
52. M.J. Hannon, Supramolecular DNA recognition. Chemical Society Reviews, 2007. 36(2): p.
280-295.
53. P.G. Baraldi, A. Bovero, F. Fruttarolo, D. Preti, M.A. Tabrizi, M.G. Pavani, and R. Romagnoli,
DNA minor groove binders as potential antitumor and antimicrobial agents. Medicinal
Research Reviews, 2004. 24(4): p. 475-528.
54. P. Majumder, A. Banerjee, J. Shandilya, P. Senapati, S. Chatterjee, T.K. Kundu, and D.
Dasgupta, Minor Groove Binder Distamycin Remodels Chromatin but Inhibits Transcription.
PLOS ONE, 2013. 8(2): p. e57693.
55. P.G. Baraldi, D. Preti, F. Fruttarolo, M.A. Tabrizi, and R. Romagnoli, Hybrid molecules between
distamycin A and active moieties of antitumor agents. Bioorganic & Medicinal Chemistry,
2007. 15(1): p. 17-35.
56. D.E. Wemmer, Designed sequence-specific minor groove ligands. Annu Rev Biophys Biomol
Struct, 2000. 29: p. 439-61.
57. D. Jantz, B.T. Amann, G.J. Gatto, and J.M. Berg, The Design of Functional DNA-Binding
Proteins Based on Zinc Finger Domains. Chemical Reviews, 2004. 104(2): p. 789-800.
58. M. Elrod-Erickson, M.A. Rould, L. Nekludova, and C.O. Pabo, Zif268 protein-DNA complex
refined at 1.6 A: a model system for understanding zinc finger-DNA interactions. Structure,
1996. 4(10): p. 1171-80.
59. A. Sarai and H. Kono, Protein-DNA Recognition Patterns and Predictions. Annual Review of
Biophysics and Biomolecular Structure, 2005. 34(1): p. 379-398.
55
60. M. J. Hannon, C. L. Painting, A. Jackson, J. Hamblin, and W. Errington, An inexpensive
approach to supramolecular architecture. Chemical Communications, 1997(18): p. 1807-
1808.
61. B. Roehr, Fomivirsen approved for CMV retinitis. J Int Assoc Physicians AIDS Care, 1998. 4(10):
p. 14-6.
62. S. Balasubramanian, L.H. Hurley, and S. Neidle, Targeting G-quadruplexes in gene promoters:
a novel anticancer strategy? Nature reviews. Drug discovery, 2011. 10(4): p. 261-275.
63. V.S. Chambers, G. Marsico, J.M. Boutell, M. Di Antonio, G.P. Smith, and S. Balasubramanian,
High-throughput sequencing of DNA G-quadruplex structures in the human genome. Nat
Biotech, 2015. 33(8): p. 877-881.
64. D. Hanahan and R.A. Weinberg, The hallmarks of cancer. Cell, 2000. 100(1): p. 57-70.
65. D. Monchaud and M.P. Teulade-Fichou, A hitchhiker's guide to G-quadruplex ligands. Org
Biomol Chem, 2008. 6(4): p. 627-36.
66. D. Monchaud, A. Granzhan, N. Saettel, A. Guedin, J.L. Mergny, and M.P. Teulade-Fichou,
"One ring to bind them all"-part I: the efficiency of the macrocyclic scaffold for g-quadruplex
DNA recognition. J Nucleic Acids, 2010. 2010.
67. S.N. Georgiades, N.H. Abd Karim, K. Suntharalingam, and R. Vilar, Interaction of Metal
Complexes with G-Quadruplex DNA. Angewandte Chemie International Edition, 2010. 49(24):
p. 4020-4034.
68. A.C.G. Hotze, N.J. Hodges, R.E. Hayden, C. Sanchez-Cano, C. Paines, N. Male, M.-K. Tse, C.M.
Bunce, J.K. Chipman, and M.J. Hannon, Supramolecular Iron Cylinder with Unprecedented
DNA Binding Is a Potent Cytostatic and Apoptotic Agent without Exhibiting Genotoxicity.
Chemistry & Biology, 2008. 15(12): p. 1258-1267.
56
69. M.J. Hannon, I. Meistermann, C.J. Isaac, C. Blomme, J.R. Aldrich-Wright, and A. Rodger,
Paper: a cheap yet effective chiral stationary phase for chromatographic resolution of
metallo-supramolecular helicates. Chemical Communications, 2001(12): p. 1078-1079.
70. M. Hannon, I. Meistermann, C.J. Isaac, A. Rodger, V. Moreno, M.J. Prieto, E. Sletten, and E.
Moldrheim, Intramolecular DNA coiling mediated by a metallo-supramolecular cylinder that
targets the major groove. Journal of Inorganic Biochemistry, 2001. 86(1): p. 56-56.
71. I. Meistermann, V. Moreno, M.J. Prieto, E. Moldrheim, E. Sletten, S. Khalid, P.M. Rodger, J.C.
Peberdy, C.J. Isaac, A. Rodger, and M.J. Hannon, Intramolecular DNA coiling mediated by
metallosupramolecular cylinders: Differential binding of P and M helical enantiomers.
Proceedings of the National Academy of Sciences of the United States of America, 2002.
99(8): p. 5069-5074.
72. A. Oleksi, A.G. Blanco, R. Boer, I. Uson, J. Aymami, A. Rodger, M.J. Hannon, and M. Coll,
Molecular recognition of a three-way DNA junction by a metallosupramolecular helicate.
Angewandte Chemie-International Edition, 2006. 45(8): p. 1227-1231.
73. N.C. Seeman, Nucleic acid junctions and lattices. Journal of Theoretical Biology, 1982. 99(2):
p. 237-247.
74. N.C. Seeman and H.F. Sleiman, DNA nanotechnology. Nature Reviews Materials, 2017. 3: p.
17068.
75. R.P. Goodman, R.M. Berry, and A.J. Turberfield, The single-step synthesis of a DNA
tetrahedron. Chemical Communications, 2004(12): p. 1372-1373.
76. S.N. Cohen, A.C. Chang, H.W. Boyer, and R.B. Helling, Construction of biologically functional
bacterial plasmids in vitro. Proc Natl Acad Sci U S A, 1973. 70(11): p. 3240-4.
77. N.C. Seeman, Nanomaterials Based on DNA. Annual review of biochemistry, 2010. 79: p. 65-
87.
57
78. P. Yin, H.M. Choi, C.R. Calvert, and N.A. Pierce, Programming biomolecular self-assembly
pathways. Nature, 2008. 451(7176): p. 318-22.
79. P. Hsieh and I.G. Panyutin, DNA Branch Migration, in Nucleic Acids and Molecular Biology, F.
Eckstein and D.M.J. Lilley, Editors. 1995, Springer Berlin Heidelberg: Berlin, Heidelberg. p. 42-
65.
80. N.C. Seeman, De Novo Design of Sequences for Nucleic Acid Structural Engineering. Journal of
Biomolecular Structure and Dynamics, 1990. 8(3): p. 573-581.
81. X. Wang and N.C. Seeman, Assembly and Characterization of 8-Arm and 12-Arm DNA
Branched Junctions. Journal of the American Chemical Society, 2007. 129(26): p. 8169-8176.
82. Y. Zhang and N.C. Seeman, Construction of a DNA-Truncated Octahedron. Journal of the
American Chemical Society, 1994. 116(5): p. 1661-1669.
83. W.M. Shih, J.D. Quispe, and G.F. Joyce, A 1.7-kilobase single-stranded DNA that folds into a
nanoscale octahedron. Nature, 2004. 427(6975): p. 618-21.
84. R.P. Goodman, I.A. Schaap, C.F. Tardin, C.M. Erben, R.M. Berry, C.F. Schmidt, and A.J.
Turberfield, Rapid chiral assembly of rigid DNA building blocks for molecular nanofabrication.
Science, 2005. 310(5754): p. 1661-5.
85. R.P. Goodman, I.A.T. Schaap, C.F. Tardin, C.M. Erben, R.M. Berry, C.F. Schmidt, and A.J.
Turberfield, Rapid Chiral Assembly of Rigid DNA Building Blocks for Molecular
Nanofabrication. Science, 2005. 310(5754): p. 1661-1665.
86. C.M. Erben, R.P. Goodman, and A.J. Turberfield, Single-molecule protein encapsulation in a
rigid DNA cage. Angew Chem Int Ed Engl, 2006. 45(44): p. 7414-7.
87. S.S. Ghosh, P.M. Kao, A.W. McCue, and H.L. Chappelle, Use of maleimide-thiol coupling
chemistry for efficient syntheses of oligonucleotide-enzyme conjugate hybridization probes.
Bioconjugate Chemistry, 1990. 1(1): p. 71-76.
58
88. B.P. Duckworth, Y. Chen, J.W. Wollack, Y. Sham, J.D. Mueller, T.A. Taton, and M.D. Distefano,
A Universal Method for the Preparation of Covalent Protein–DNA Conjugates for Use in
Creating Protein Nanostructures. Angewandte Chemie International Edition, 2007. 46(46): p.
8819-8822.
89. D. Corey and P. Schultz, Generation of a hybrid sequence-specific single-stranded
deoxyribonuclease. Science, 1987. 238(4832): p. 1401-1403.
90. R.P. Goodman, C.M. Erben, J. Malo, W.M. Ho, M.L. McKee, A.N. Kapanidis, and A.J.
Turberfield, A Facile Method for Reversibly Linking a Recombinant Protein to DNA.
ChemBioChem, 2009. 10(9): p. 1551-1557.
91. J.-W. Keum and H. Bermudez, DNA-based delivery vehicles: pH-controlled disassembly and
cargo release. Chemical Communications, 2012. 48(99): p. 12118-12120.
92. R. Crawford, C.M. Erben, J. Periz, L.M. Hall, T. Brown, A.J. Turberfield, and A.N. Kapanidis,
Non-covalent Single Transcription Factor Encapsulation Inside a DNA Cage. Angewandte
Chemie-International Edition, 2013. 52(8): p. 2284-2288.
93. P.W.K. Rothemund, Folding DNA to create nanoscale shapes and patterns. Nature, 2006.
440(7082): p. 297-302.
94. F.C. Simmel, Three-Dimensional Nanoconstruction with DNA. Angewandte Chemie
International Edition, 2008. 47(32): p. 5884-5887.
95. E.S. Andersen, M. Dong, M.M. Nielsen, K. Jahn, R. Subramani, W. Mamdouh, M.M. Golas, B.
Sander, H. Stark, C.L.P. Oliveira, J.S. Pedersen, V. Birkedal, F. Besenbacher, K.V. Gothelf, and
J. Kjems, Self-assembly of a nanoscale DNA box with a controllable lid. Nature, 2009.
459(7243): p. 73-76.
96. A. Kuzuya and M. Komiyama, Design and construction of a box-shaped 3D-DNA origami.
Chemical Communications, 2009(28): p. 4182-4184.
59
97. M. Endo, K. Hidaka, T. Kato, K. Namba, and H. Sugiyama, DNA Prism Structures Constructed
by Folding of Multiple Rectangular Arms. Journal of the American Chemical Society, 2009.
131(43): p. 15570-15571.
98. Y.G. Ke, J. Sharma, M.H. Liu, K. Jahn, Y. Liu, and H. Yan, Scaffolded DNA Origami of a DNA
Tetrahedron Molecular Container. Nano Letters, 2009. 9(6): p. 2445-2447.
99. S.M. Douglas, H. Dietz, T. Liedl, B. Hogberg, F. Graf, and W.M. Shih, Self-assembly of DNA into
nanoscale three-dimensional shapes. Nature, 2009. 459(7245): p. 414-418.
100. A.S. Walsh, H. Yin, C.M. Erben, M.J.A. Wood, and A.J. Turberfield, DNA Cage Delivery to
Mammalian Cells. ACS Nano, 2011. 5(7): p. 5427-5432.
101. J. Li, H. Pei, B. Zhu, L. Liang, M. Wei, Y. He, N. Chen, D. Li, Q. Huang, and C. Fan, Self-
Assembled Multivalent DNA Nanostructures for Noninvasive Intracellular Delivery of
Immunostimulatory CpG Oligonucleotides. ACS Nano, 2011. 5(11): p. 8783-8789.
102. H. Gao, W. Shi, and L.B. Freund, Mechanics of receptor-mediated endocytosis. Proceedings of
the National Academy of Sciences of the United States of America, 2005. 102(27): p. 9469-
9474.
103. H. Hillaireau and P. Couvreur, Nanocarriers’ entry into the cell: relevance to drug delivery.
Cellular and Molecular Life Sciences, 2009. 66(17): p. 2873-2896.
104. L. Liang, J. Li, Q. Li, Q. Huang, J.Y. Shi, H. Yan, and C.H. Fan, Single-Particle Tracking and
Modulation of Cell Entry Pathways of a Tetrahedral DNA Nanostructure in Live Cells.
Angewandte Chemie-International Edition, 2014. 53(30): p. 7745-7750.
105. M.G. Qaddoumi, H.J. Gukasyan, J. Davda, V. Labhasetwar, K.J. Kim, and V.H. Lee, Clathrin and
caveolin-1 expression in primary pigmented rabbit conjunctival epithelial cells: role in PLGA
nanoparticle endocytosis. Mol Vis, 2003. 9: p. 559-68.
106. J.E. Heuser and R.G. Anderson, Hypertonic media inhibit receptor-mediated endocytosis by
blocking clathrin-coated pit formation. The Journal of Cell Biology, 1989. 108(2): p. 389-400.
60
107. K.R. Kim, D.R. Kim, T. Lee, J.Y. Yhee, B.S. Kim, I.C. Kwon, and D.R. Ahn, Drug delivery by a self-
assembled DNA tetrahedron for overcoming drug resistance in breast cancer cells. Chem
Commun (Camb), 2013. 49(20): p. 2010-2.
108. E. Borowski, M.M. Bontemps-Gracz, and A. Piwkowska, Strategies for overcoming ABC-
transporters-mediated multidrug resistance (MDR) of tumor cells. Acta Biochimica Polonica,
2005. 52(3): p. 609-627.
109. M.E. Davis, Z. Chen, and D.M. Shin, Nanoparticle therapeutics: an emerging treatment
modality for cancer. Nat Rev Drug Discov, 2008. 7(9): p. 771-782.
110. G. Szakacs, J.K. Paterson, J.A. Ludwig, C. Booth-Genthe, and M.M. Gottesman, Targeting
multidrug resistance in cancer. Nat Rev Drug Discov, 2006. 5(3): p. 219-234.
111. H. Lee, A.K.R. Lytton-Jean, Y. Chen, K.T. Love, A.I. Park, E.D. Karagiannis, A. Sehgal, W.
Querbes, C.S. Zurenko, M. Jayaraman, C.G. Peng, K. Charisse, A. Borodovsky, M. Manoharan,
J.S. Donahoe, J. Truelove, M. Nahrendorf, R. Langer, and D.G. Anderson, Molecularly Self-
Assembled Nucleic Acid Nanoparticles for Targeted In Vivo siRNA Delivery. Nature
nanotechnology, 2012. 7(6): p. 389-393.
112. L. Li, X. Hu, M. Zhang, S. Ma, F. Yu, S. Zhao, N. Liu, Z. Wang, Y. Wang, H. Guan, X. Pan, Y. Gao,
Y. Zhang, Y. Liu, Y. Yang, X. Tang, M. Li, C. Liu, Z. Li, and X. Mei, Dual Tumor-Targeting
Nanocarrier System for siRNA Delivery Based on pRNA and Modified Chitosan. Molecular
Therapy - Nucleic Acids, 2017. 8: p. 169-183.
113. D. Wu, L. Wang, W. Li, X. Xu, and W. Jiang, DNA nanostructure-based drug delivery
nanosystems in cancer therapy. Int J Pharm, 2017. 533(1): p. 169-178.
114. Q. Jiang, C. Song, J. Nangreave, X. Liu, L. Lin, D. Qiu, Z.-G. Wang, G. Zou, X. Liang, H. Yan, and
B. Ding, DNA Origami as a Carrier for Circumvention of Drug Resistance. Journal of the
American Chemical Society, 2012. 134(32): p. 13396-13403.
61
115. S. Sellner, S. Kocabey, K. Nekolla, F. Krombach, T. Liedl, and M. Rehberg, DNA nanotubes as
intracellular delivery vehicles in vivo. Biomaterials, 2015. 53: p. 453-463.
116. G.J. Weiner, H.-M. Liu, J.E. Wooldridge, C.E. Dahle, and A.M. Krieg, Immunostimulatory
oligodeoxynucleotides containing the CpG motif are effective as immune adjuvants in tumor
antigen immunization. Proceedings of the National Academy of Sciences, 1997. 94(20): p.
10833-10837.
117. L. Sercombe, T. Veerati, F. Moheimani, S.Y. Wu, A.K. Sood, and S. Hua, Advances and
Challenges of Liposome Assisted Drug Delivery. Front Pharmacol, 2015. 6: p. 286.
118. B.-S. Ding, T. Dziubla, V. V Shuvaev, S. Muro, and V. Muzykantov, Advanced Drug Delivery
Systems That Target The Vascular Endothelium. Vol. 6. 2006. 98-112.
119. N. Monteiro, A. Martins, R.L. Reis, and N.M. Neves, Liposomes in tissue engineering and
regenerative medicine. Journal of The Royal Society Interface, 2014. 11(101).
120. S. Hua and S. Wu, The use of lipid-based nanocarriers for targeted pain therapies. Frontiers in
Pharmacology, 2013. 4(143).
121. Y.M. Ning, K. He, R. Dagher, R. Sridhara, A.T. Farrell, R. Justice, and R. Pazdur, Liposomal
doxorubicin in combination with bortezomib for relapsed or refractory multiple myeloma.
Oncology (Williston Park), 2007. 21(12): p. 1503-8; discussion 1511, 1513, 1516 passim.
122. A.M. Rahman, S.W. Yusuf, and M.S. Ewer, Anthracycline-induced cardiotoxicity and the
cardiac-sparing effect of liposomal formulation. Int J Nanomedicine, 2007. 2(4): p. 567-83.
123. A.S. Narang, R.K. Chang, and M.A. Hussain, Pharmaceutical Development and Regulatory
Considerations for Nanoparticles and Nanoparticulate Drug Delivery Systems. Journal of
Pharmaceutical Sciences, 2013. 102(11): p. 3867-3882.
62
Chapter 2
Interaction of an Iron supramolecular Cylinder with a DNA
Tetrahedron and a Three Way Junction
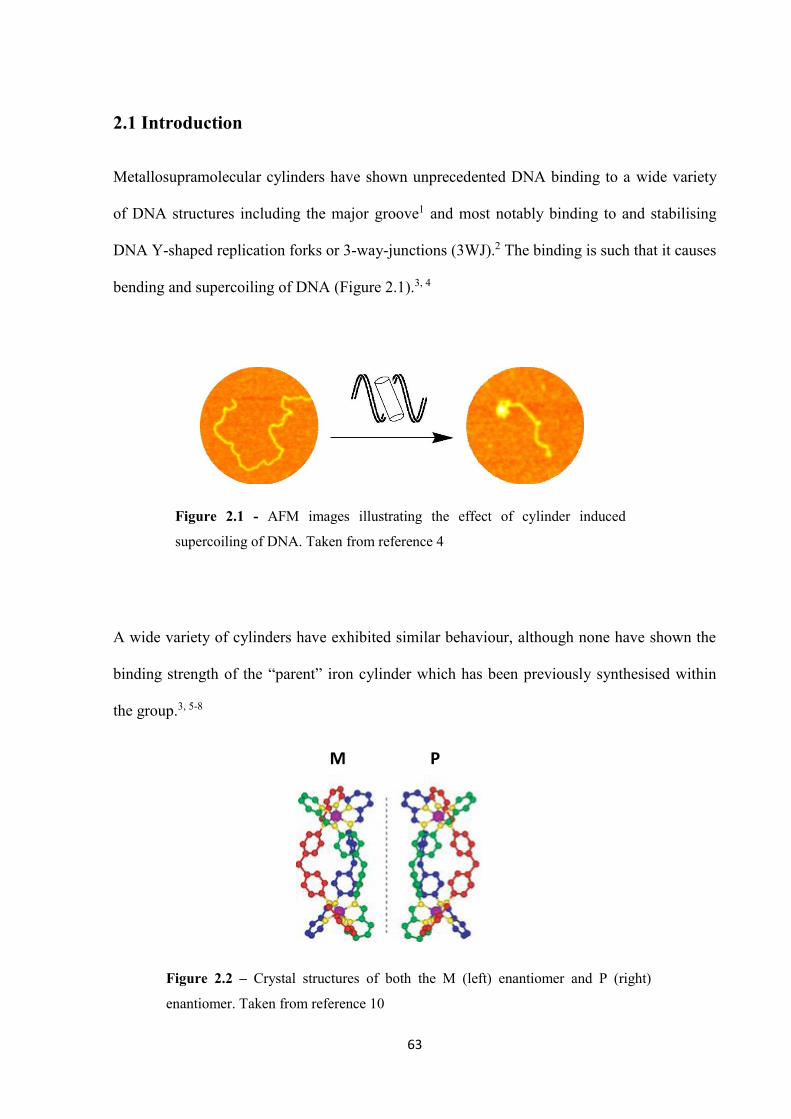
63
2.1 Introduction
Metallosupramolecular cylinders have shown unprecedented DNA binding to a wide variety
of DNA structures including the major groove1 and most notably binding to and stabilising
DNA Y-shaped replication forks or 3-way-junctions (3WJ).2 The binding is such that it causes
bending and supercoiling of DNA (Figure 2.1).3, 4
A wide variety of cylinders have exhibited similar behaviour, although none have shown the
binding strength of the “parent” iron cylinder which has been previously synthesised within
the group.3, 5-8
Figure 2.1 - AFM images illustrating the effect of cylinder induced
supercoiling of DNA. Taken from reference 4
Figure 2.2 – Crystal structures of both the M (left) enantiomer and P (right)
enantiomer. Taken from reference 10
M P
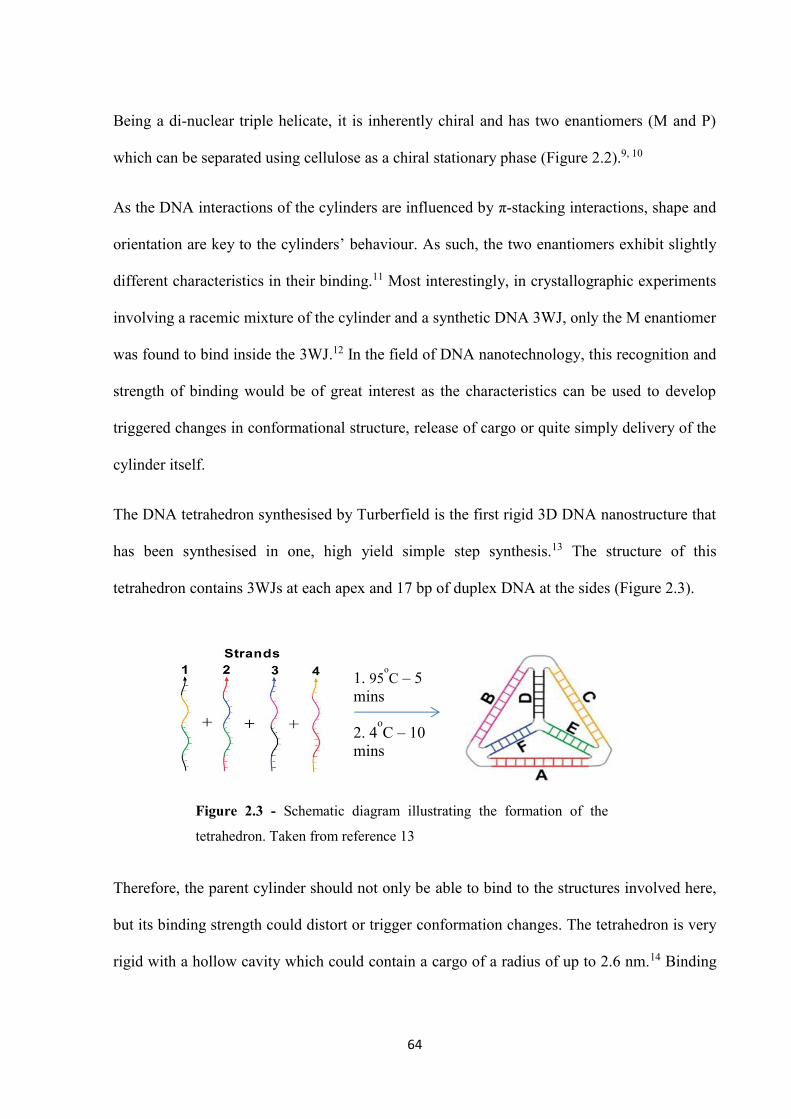
64
Being a di-nuclear triple helicate, it is inherently chiral and has two enantiomers (M and P)
which can be separated using cellulose as a chiral stationary phase (Figure 2.2).9, 10
As the DNA interactions of the cylinders are influenced by π-stacking interactions, shape and
orientation are key to the cylinders’ behaviour. As such, the two enantiomers exhibit slightly
different characteristics in their binding.11 Most interestingly, in crystallographic experiments
involving a racemic mixture of the cylinder and a synthetic DNA 3WJ, only the M enantiomer
was found to bind inside the 3WJ.12 In the field of DNA nanotechnology, this recognition and
strength of binding would be of great interest as the characteristics can be used to develop
triggered changes in conformational structure, release of cargo or quite simply delivery of the
cylinder itself.
The DNA tetrahedron synthesised by Turberfield is the first rigid 3D DNA nanostructure that
has been synthesised in one, high yield simple step synthesis.13 The structure of this
tetrahedron contains 3WJs at each apex and 17 bp of duplex DNA at the sides (Figure 2.3).
Therefore, the parent cylinder should not only be able to bind to the structures involved here,
but its binding strength could distort or trigger conformation changes. The tetrahedron is very
rigid with a hollow cavity which could contain a cargo of a radius of up to 2.6 nm.14 Binding
1. 95oC – 5
mins
2. 4oC – 10
mins
Figure 2.3 - Schematic diagram illustrating the formation of the
tetrahedron. Taken from reference 13
65
events of the cylinder to the tetrahedron in the major groove and at the apex 3WJ could cause
structure changes in the tetrahedron itself. Also the conjugate formed would itself be of
biological interest due to the cytotoxicity of the cylinder and the inherent bio-compatibility of
the tetrahedron due to its DNA building blocks and proven cellular uptake.15
This chapter initially investigates the cylinders’ binding affinity to the DNA 3WJ when in
competition with other DNA structures. Investigation then moves on to assess the cylinder –
tetrahedron interaction, building on initial work completed by Siriporn Phongtongpasuk
previously in the Hannon group. This is studied mainly by gel electrophoresis experiments to
observe any possible band shifts which would confirm the presence of a conjugate. Further
characterisation of the nature of this interaction is then attempted by different methods. Part
two of the chapter aims to explore the possible differences between the cylinders two M and P
enantiomers with regard to tetrahedron interaction. Any possible differences could shed more
light on the nature of the overall interaction and whether site specific binding is possible to
ascertain.
2.2 Results and Discussion
2.2.1 Part 1 – Cylinder 3WJ Binding
Competition Gel Electrophoresis Assays
The ability of the iron cylinder to bind inside a DNA 3WJ has been firmly established and
discussed earlier.16 With so many other DNA structures involved inside cells, it is important
to establish the binding preferences and to what extent the iron cylinder will preferentially
bind to a 3WJ over another structure. To study this, a series of polyacrylamide gel
electrophoresis (PAGE) experiments were undertaken.
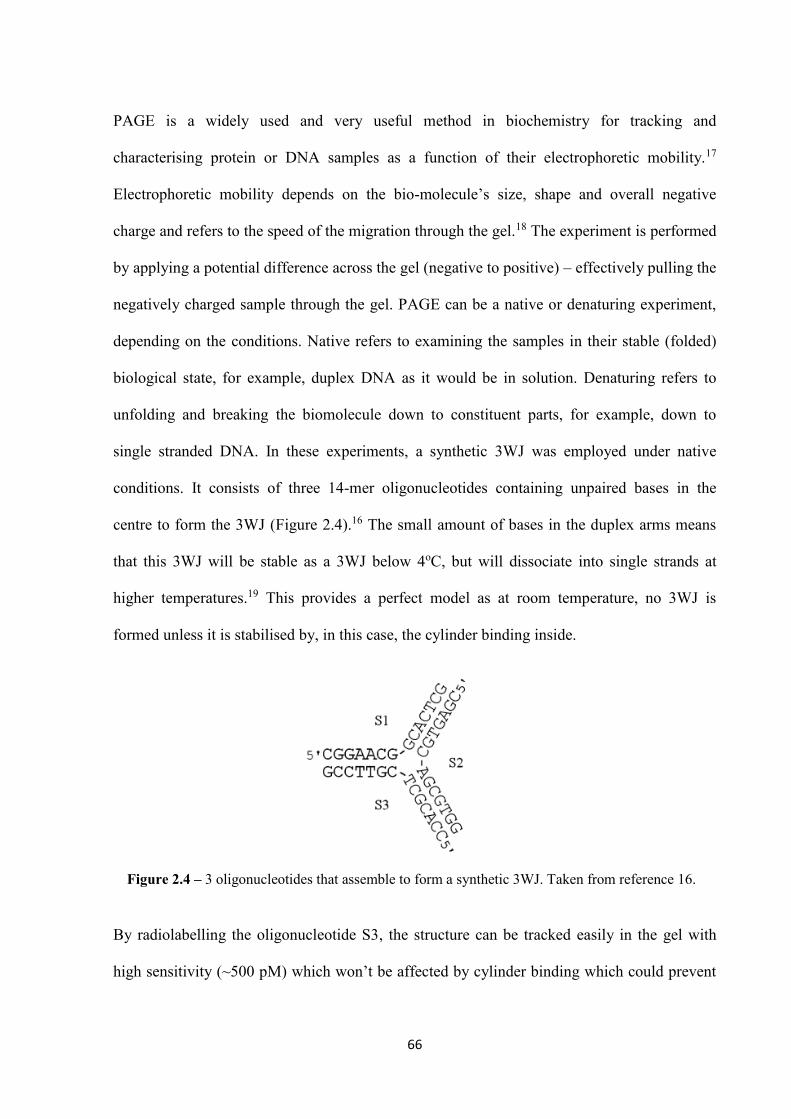
66
PAGE is a widely used and very useful method in biochemistry for tracking and
characterising protein or DNA samples as a function of their electrophoretic mobility.17
Electrophoretic mobility depends on the bio-molecule’s size, shape and overall negative
charge and refers to the speed of the migration through the gel.18 The experiment is performed
by applying a potential difference across the gel (negative to positive) – effectively pulling the
negatively charged sample through the gel. PAGE can be a native or denaturing experiment,
depending on the conditions. Native refers to examining the samples in their stable (folded)
biological state, for example, duplex DNA as it would be in solution. Denaturing refers to
unfolding and breaking the biomolecule down to constituent parts, for example, down to
single stranded DNA. In these experiments, a synthetic 3WJ was employed under native
conditions. It consists of three 14-mer oligonucleotides containing unpaired bases in the
centre to form the 3WJ (Figure 2.4).16 The small amount of bases in the duplex arms means
that this 3WJ will be stable as a 3WJ below 4oC, but will dissociate into single strands at
higher temperatures.19 This provides a perfect model as at room temperature, no 3WJ is
formed unless it is stabilised by, in this case, the cylinder binding inside.
By radiolabelling the oligonucleotide S3, the structure can be tracked easily in the gel with
high sensitivity (~500 pM) which won’t be affected by cylinder binding which could prevent
Figure 2.4 – 3 oligonucleotides that assemble to form a synthetic 3WJ. Taken from reference 16.
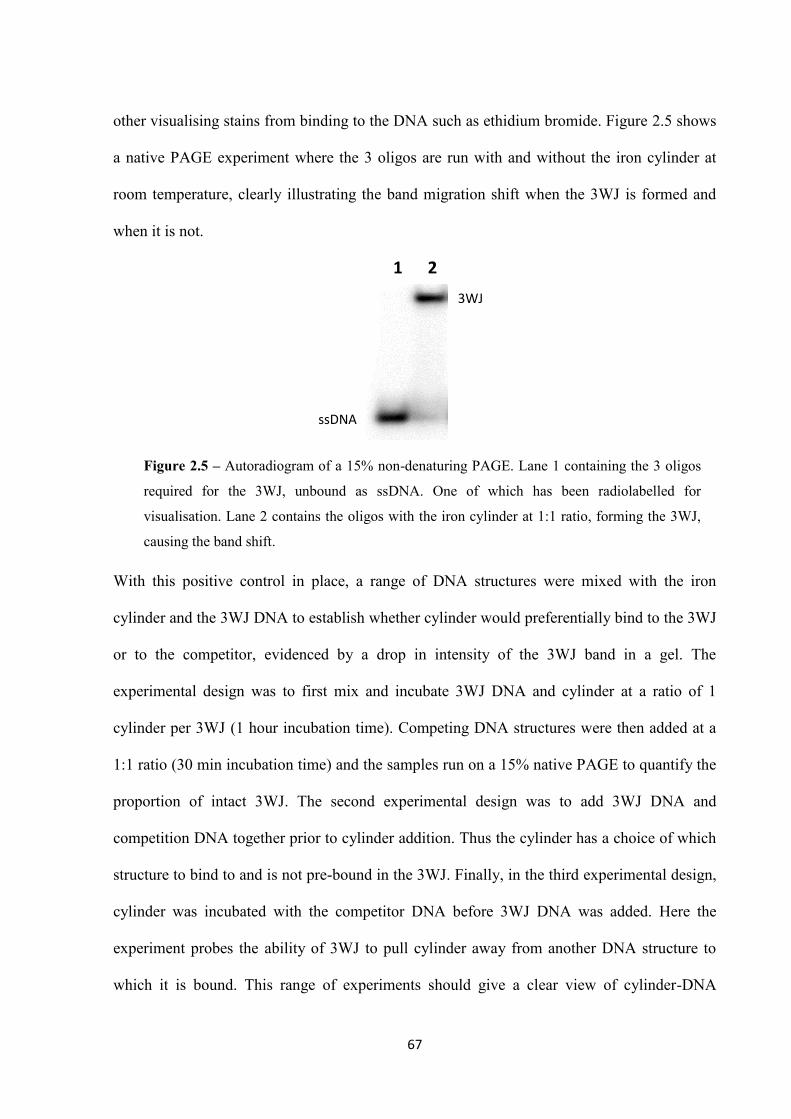
67
other visualising stains from binding to the DNA such as ethidium bromide. Figure 2.5 shows
a native PAGE experiment where the 3 oligos are run with and without the iron cylinder at
room temperature, clearly illustrating the band migration shift when the 3WJ is formed and
when it is not.
With this positive control in place, a range of DNA structures were mixed with the iron
cylinder and the 3WJ DNA to establish whether cylinder would preferentially bind to the 3WJ
or to the competitor, evidenced by a drop in intensity of the 3WJ band in a gel. The
experimental design was to first mix and incubate 3WJ DNA and cylinder at a ratio of 1
cylinder per 3WJ (1 hour incubation time). Competing DNA structures were then added at a
1:1 ratio (30 min incubation time) and the samples run on a 15% native PAGE to quantify the
proportion of intact 3WJ. The second experimental design was to add 3WJ DNA and
competition DNA together prior to cylinder addition. Thus the cylinder has a choice of which
structure to bind to and is not pre-bound in the 3WJ. Finally, in the third experimental design,
cylinder was incubated with the competitor DNA before 3WJ DNA was added. Here the
experiment probes the ability of 3WJ to pull cylinder away from another DNA structure to
which it is bound. This range of experiments should give a clear view of cylinder-DNA
Figure 2.5 – Autoradiogram of a 15% non-denaturing PAGE. Lane 1 containing the 3 oligos
required for the 3WJ, unbound as ssDNA. One of which has been radiolabelled for
visualisation. Lane 2 contains the oligos with the iron cylinder at 1:1 ratio, forming the 3WJ,
causing the band shift.
1 2 3WJ
ssDNA

68
structural binding preferences. Figure 2.6 shows the gel electrophoresis results obtained from
these experiments (A, B and C).
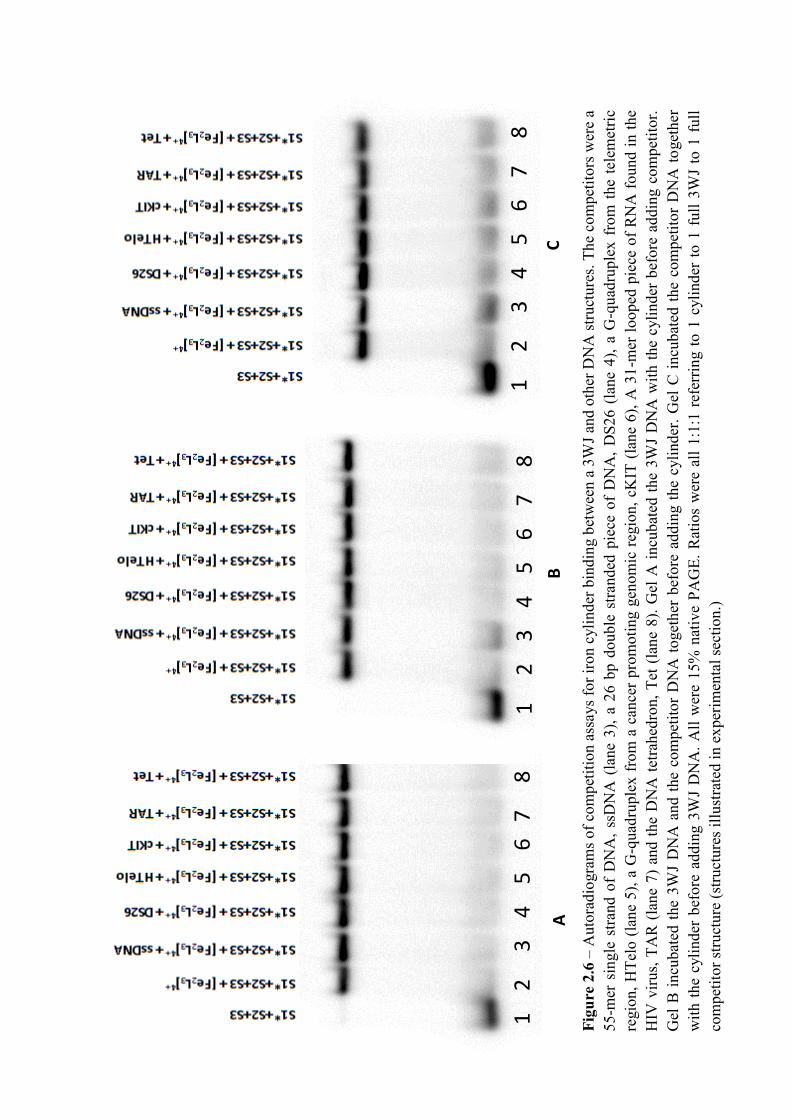
69
B 1
2
3
4
5
6
7
8
1
2
3
4
5
6
7
8
1
2
3
4
5
6
7
8
C A
Figu
re 2
.6 –
Aut
orad
iogr
ams o
f com
petit
ion
assa
ys fo
r iro
n cy
linde
r bin
ding
bet
wee
n a
3WJ a
nd o
ther
DN
A st
ruct
ures
. The
com
petit
ors w
ere
a 55
-mer
sin
gle
stra
nd o
f D
NA
, ssD
NA
(la
ne 3
), a
26 b
p do
uble
stra
nded
pie
ce o
f D
NA
, DS2
6 (la
ne 4
), a
G-q
uadr
uple
x fr
om th
e te
lem
etric
re
gion
, HTe
lo (l
ane
5), a
G-q
uadr
uple
x fr
om a
can
cer p
rom
otin
g ge
nom
ic re
gion
, cK
IT (l
ane
6), A
31-
mer
loop
ed p
iece
of R
NA
foun
d in
the
HIV
viru
s, TA
R (l
ane
7) a
nd th
e D
NA
tetra
hedr
on, T
et (l
ane
8). G
el A
incu
bate
d th
e 3W
J D
NA
with
the
cylin
der b
efor
e ad
ding
com
petit
or.
Gel
B in
cuba
ted
the
3WJ
DN
A a
nd th
e co
mpe
titor
DN
A to
geth
er b
efor
e ad
ding
the
cylin
der.
Gel
C in
cuba
ted
the
com
petit
or D
NA
toge
ther
w
ith th
e cy
linde
r be
fore
add
ing
3WJ
DN
A. A
ll w
ere
15%
nat
ive
PAG
E. R
atio
s w
ere
all 1
:1:1
ref
errin
g to
1 c
ylin
der
to 1
ful
l 3W
J to
1 f
ull
com
petit
or st
ruct
ure
(stru
ctur
es il
lust
rate
d in
exp
erim
enta
l sec
tion.
)
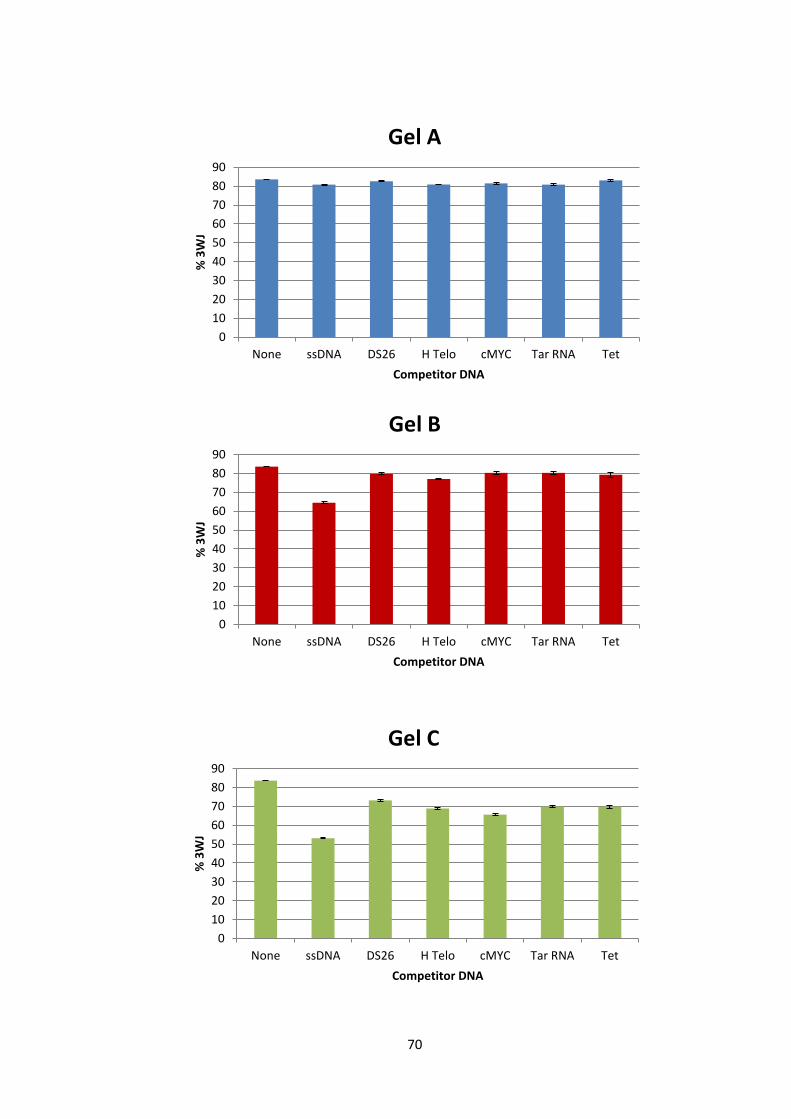
70
0
10
20
30
40
50
60
70
80
90
None ssDNA DS26 H Telo cMYC Tar RNA Tet
% 3
WJ
Competitor DNA
Gel A
0
10
20
30
40
50
60
70
80
90
None ssDNA DS26 H Telo cMYC Tar RNA Tet
% 3
WJ
Competitor DNA
Gel B
0
10
20
30
40
50
60
70
80
90
None ssDNA DS26 H Telo cMYC Tar RNA Tet
% 3
WJ
Competitor DNA
Gel C
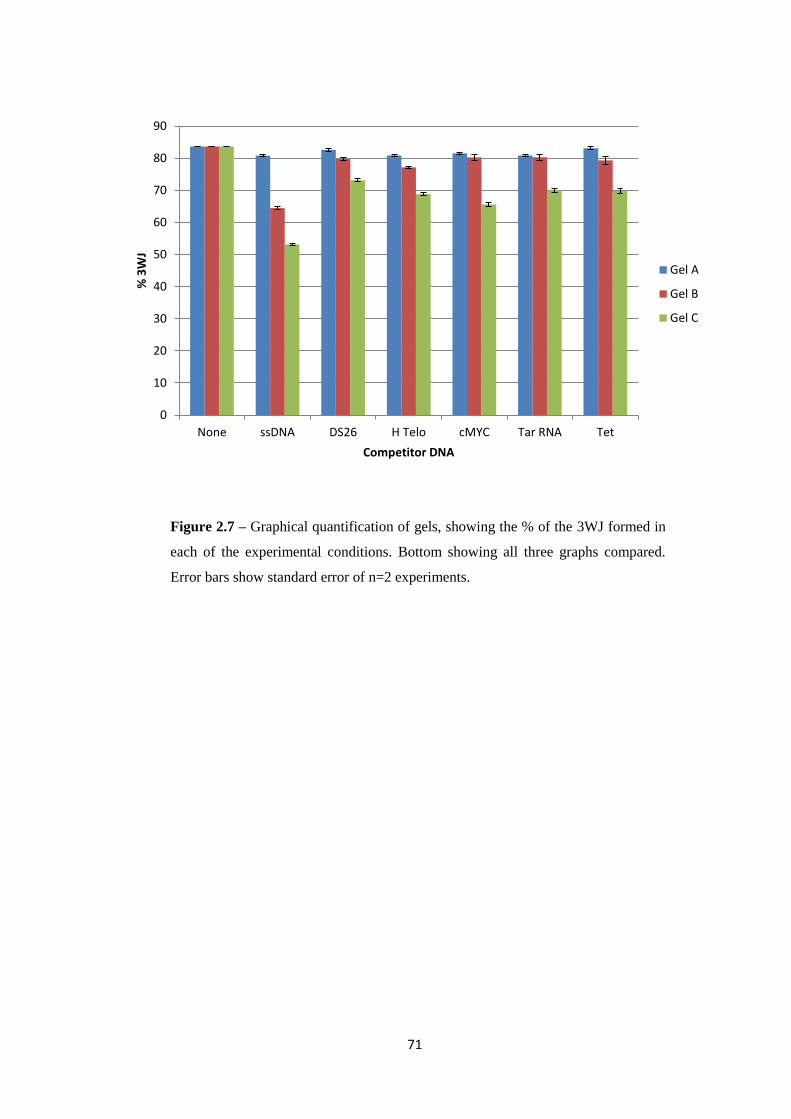
71
0
10
20
30
40
50
60
70
80
90
None ssDNA DS26 H Telo cMYC Tar RNA Tet
% 3
WJ
Competitor DNA
Gel A
Gel B
Gel C
Figure 2.7 – Graphical quantification of gels, showing the % of the 3WJ formed in
each of the experimental conditions. Bottom showing all three graphs compared.
Error bars show standard error of n=2 experiments.
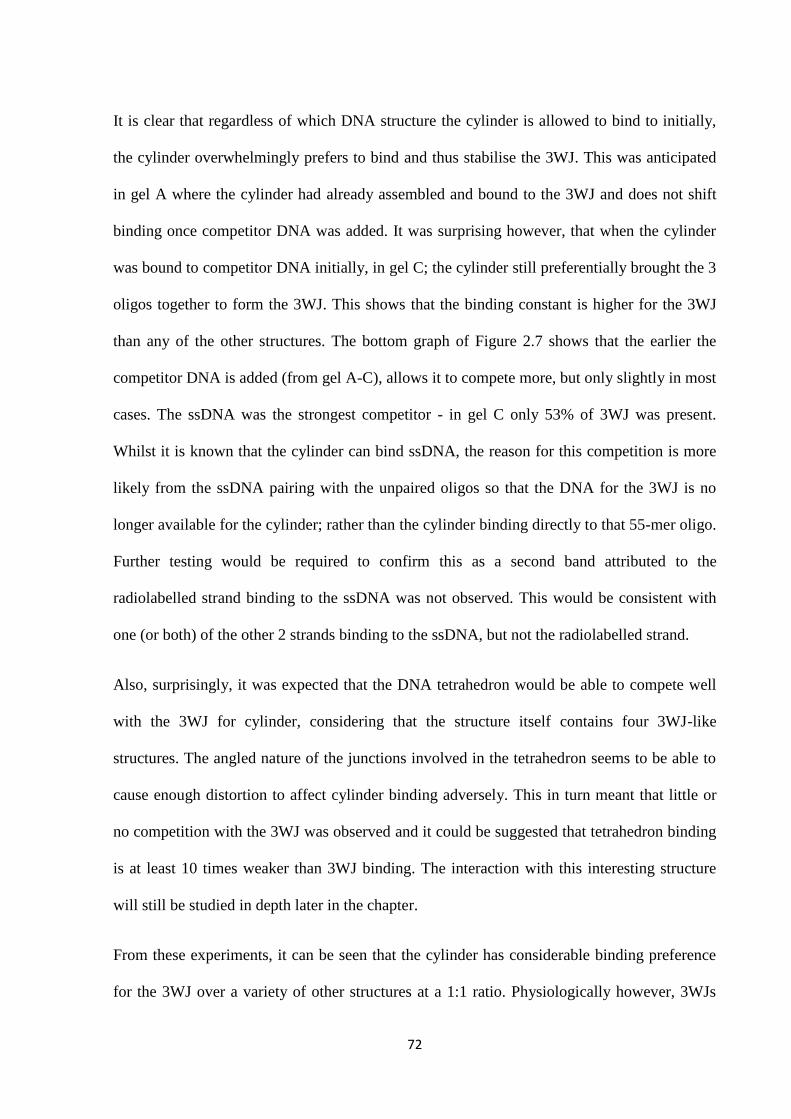
72
It is clear that regardless of which DNA structure the cylinder is allowed to bind to initially,
the cylinder overwhelmingly prefers to bind and thus stabilise the 3WJ. This was anticipated
in gel A where the cylinder had already assembled and bound to the 3WJ and does not shift
binding once competitor DNA was added. It was surprising however, that when the cylinder
was bound to competitor DNA initially, in gel C; the cylinder still preferentially brought the 3
oligos together to form the 3WJ. This shows that the binding constant is higher for the 3WJ
than any of the other structures. The bottom graph of Figure 2.7 shows that the earlier the
competitor DNA is added (from gel A-C), allows it to compete more, but only slightly in most
cases. The ssDNA was the strongest competitor - in gel C only 53% of 3WJ was present.
Whilst it is known that the cylinder can bind ssDNA, the reason for this competition is more
likely from the ssDNA pairing with the unpaired oligos so that the DNA for the 3WJ is no
longer available for the cylinder; rather than the cylinder binding directly to that 55-mer oligo.
Further testing would be required to confirm this as a second band attributed to the
radiolabelled strand binding to the ssDNA was not observed. This would be consistent with
one (or both) of the other 2 strands binding to the ssDNA, but not the radiolabelled strand.
Also, surprisingly, it was expected that the DNA tetrahedron would be able to compete well
with the 3WJ for cylinder, considering that the structure itself contains four 3WJ-like
structures. The angled nature of the junctions involved in the tetrahedron seems to be able to
cause enough distortion to affect cylinder binding adversely. This in turn meant that little or
no competition with the 3WJ was observed and it could be suggested that tetrahedron binding
is at least 10 times weaker than 3WJ binding. The interaction with this interesting structure
will still be studied in depth later in the chapter.
From these experiments, it can be seen that the cylinder has considerable binding preference
for the 3WJ over a variety of other structures at a 1:1 ratio. Physiologically however, 3WJs
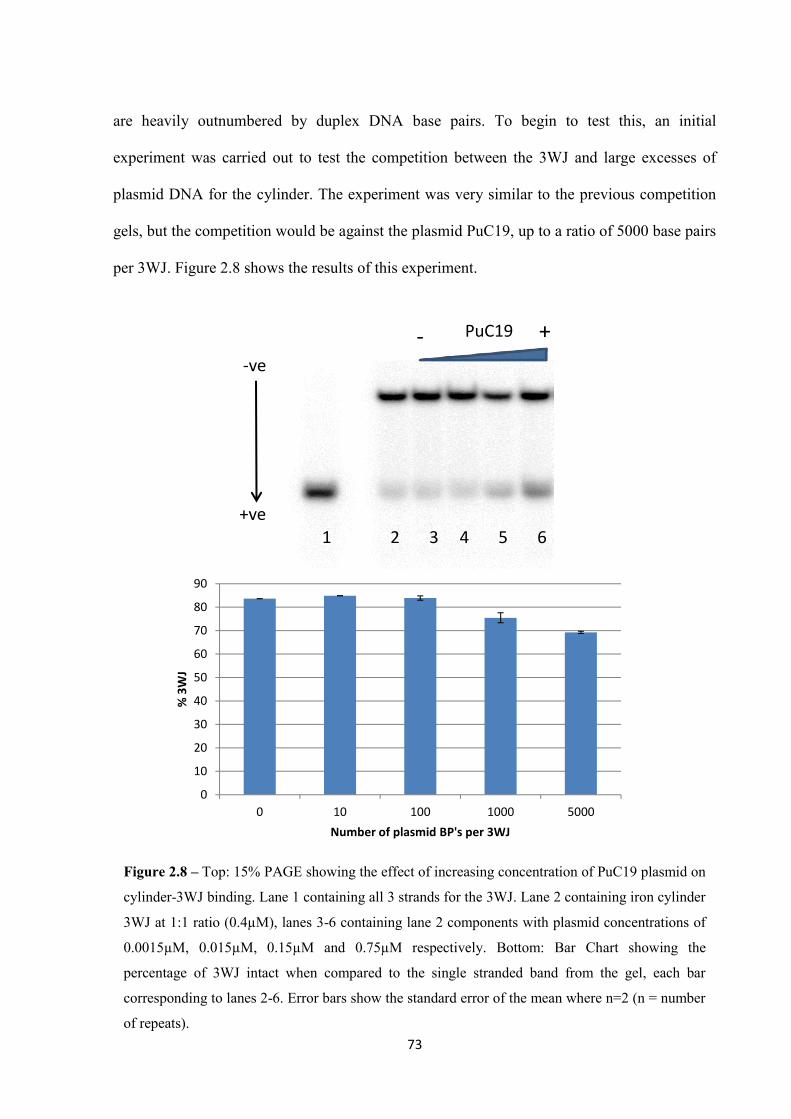
73
are heavily outnumbered by duplex DNA base pairs. To begin to test this, an initial
experiment was carried out to test the competition between the 3WJ and large excesses of
plasmid DNA for the cylinder. The experiment was very similar to the previous competition
gels, but the competition would be against the plasmid PuC19, up to a ratio of 5000 base pairs
per 3WJ. Figure 2.8 shows the results of this experiment.
-ve
+ve
PuC19 - +
1 2 3 4 5 6
0
10
20
30
40
50
60
70
80
90
0 10 100 1000 5000
% 3
WJ
Number of plasmid BP's per 3WJ
Figure 2.8 – Top: 15% PAGE showing the effect of increasing concentration of PuC19 plasmid on
cylinder-3WJ binding. Lane 1 containing all 3 strands for the 3WJ. Lane 2 containing iron cylinder
3WJ at 1:1 ratio (0.4µM), lanes 3-6 containing lane 2 components with plasmid concentrations of
0.0015µM, 0.015µM, 0.15µM and 0.75µM respectively. Bottom: Bar Chart showing the
percentage of 3WJ intact when compared to the single stranded band from the gel, each bar
corresponding to lanes 2-6. Error bars show the standard error of the mean where n=2 (n = number
of repeats).
74
This initial experiment was designed in the same way as experiment A, where the cylinder
and 3WJ DNA were incubated together for 1 hour at RT, followed by addition of the plasmid
DNA and an incubation of 30 minutes at RT. The experiment shows that by 5000 bp to 1
3WJ, the proportion of 3WJ present is decreased by approximately 18% compared to the
control. This result again confirms that the cylinder has a higher affinity to the 3WJ than
duplex DNA. However, it must be noted that the plasmid was in a supercoiled state. With
further experimentation, it would be interesting to use linear plasmid DNA that would provide
large excesses of duplex DNA in a relaxed state as supercoiled DNA may be less accessible
for cylinder binding.
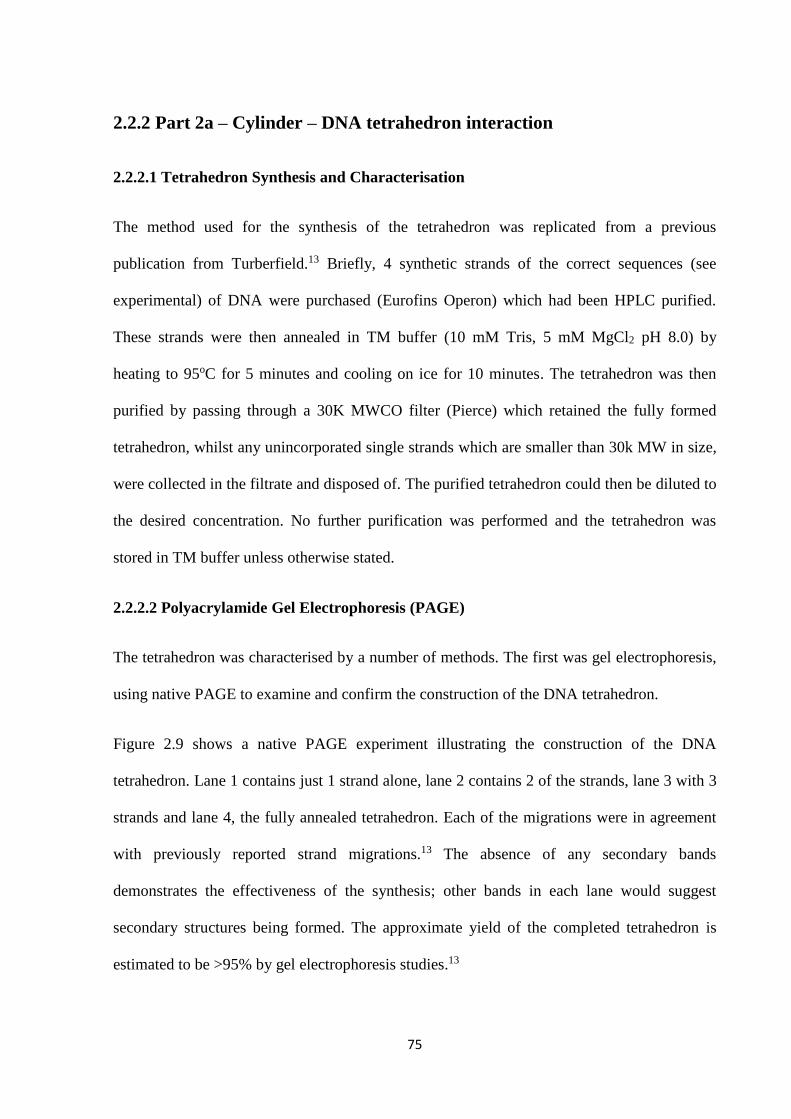
75
2.2.2 Part 2a – Cylinder – DNA tetrahedron interaction
2.2.2.1 Tetrahedron Synthesis and Characterisation
The method used for the synthesis of the tetrahedron was replicated from a previous
publication from Turberfield.13 Briefly, 4 synthetic strands of the correct sequences (see
experimental) of DNA were purchased (Eurofins Operon) which had been HPLC purified.
These strands were then annealed in TM buffer (10 mM Tris, 5 mM MgCl2 pH 8.0) by
heating to 95oC for 5 minutes and cooling on ice for 10 minutes. The tetrahedron was then
purified by passing through a 30K MWCO filter (Pierce) which retained the fully formed
tetrahedron, whilst any unincorporated single strands which are smaller than 30k MW in size,
were collected in the filtrate and disposed of. The purified tetrahedron could then be diluted to
the desired concentration. No further purification was performed and the tetrahedron was
stored in TM buffer unless otherwise stated.
2.2.2.2 Polyacrylamide Gel Electrophoresis (PAGE)
The tetrahedron was characterised by a number of methods. The first was gel electrophoresis,
using native PAGE to examine and confirm the construction of the DNA tetrahedron.
Figure 2.9 shows a native PAGE experiment illustrating the construction of the DNA
tetrahedron. Lane 1 contains just 1 strand alone, lane 2 contains 2 of the strands, lane 3 with 3
strands and lane 4, the fully annealed tetrahedron. Each of the migrations were in agreement
with previously reported strand migrations.13 The absence of any secondary bands
demonstrates the effectiveness of the synthesis; other bands in each lane would suggest
secondary structures being formed. The approximate yield of the completed tetrahedron is
estimated to be >95% by gel electrophoresis studies.13
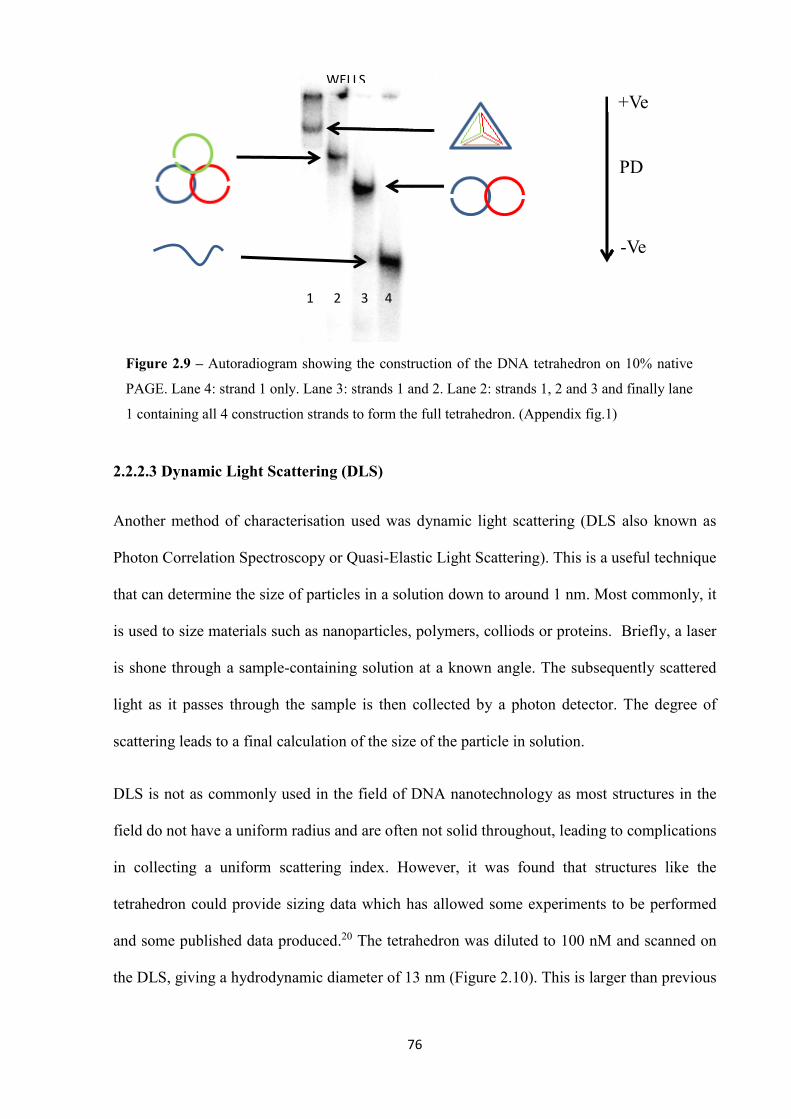
76
2.2.2.3 Dynamic Light Scattering (DLS)
Another method of characterisation used was dynamic light scattering (DLS also known as
Photon Correlation Spectroscopy or Quasi-Elastic Light Scattering). This is a useful technique
that can determine the size of particles in a solution down to around 1 nm. Most commonly, it
is used to size materials such as nanoparticles, polymers, colliods or proteins. Briefly, a laser
is shone through a sample-containing solution at a known angle. The subsequently scattered
light as it passes through the sample is then collected by a photon detector. The degree of
scattering leads to a final calculation of the size of the particle in solution.
DLS is not as commonly used in the field of DNA nanotechnology as most structures in the
field do not have a uniform radius and are often not solid throughout, leading to complications
in collecting a uniform scattering index. However, it was found that structures like the
tetrahedron could provide sizing data which has allowed some experiments to be performed
and some published data produced.20 The tetrahedron was diluted to 100 nM and scanned on
the DLS, giving a hydrodynamic diameter of 13 nm (Figure 2.10). This is larger than previous
1 2 3 4
PD
+Ve
-Ve
Figure 2.9 – Autoradiogram showing the construction of the DNA tetrahedron on 10% native
PAGE. Lane 4: strand 1 only. Lane 3: strands 1 and 2. Lane 2: strands 1, 2 and 3 and finally lane
1 containing all 4 construction strands to form the full tetrahedron. (Appendix fig.1)
1 2 3 4
WELLS
77
DLS experiments on the tetrahedron (9.08 nm).21 It is also slightly larger than the expected
diameter of the tetrahedron, just over 6 nm. The DLS calculations assume that the sample is
spherical, which exaggerates the size slightly due to the tetrahedral shape, along with some
small instrumental margins of error lead to a figure slightly larger than expected. A hydration
layer is also present which contributes to the extra size calculated. Despite these slight
inaccuracies, DLS provides useful information as not only does it show particles of the correct
region of size, it also shows that only one product is present in solution and no large aggregate
or secondary structures are left after synthesis and purification.
2.2.2.4 Atomic Force Microscopy (AFM)
All AFM experiments were completed in the labs of Prof. Shao Fengwei by Dr Wang Liying
from the institute of chemical biology, Nanyang Technological University.
Figure 2.10 - DLS data of the DNA tetrahedron – showing one species in solution
illustrated by the single peak.
Peak 1: 12.68 d nm / 100% St.dev : 3.986 nm
Z average (d.nm) : 26.90 PDI : 0.138 PDI Width : 6.403
78
Whilst the gel electrophoresis and DLS results give a good idea of the size and amount of
base pairs involved, they don’t give a full characterisation that the tetrahedron has been
formed and it cannot be said with certainty that a tetrahedron is the shape of the structure
formed here. Atomic force microscopy (AFM) is the only current method that provides both
full structural and mechanical information at high resolution of nanoscale materials.22 Briefly,
AFM works by moving a very fine tip (approximately 2 nm) over a surface. The tip is
attached to a sensitive cantilever to which a laser can record any deflections corresponding to
any analyte the tip has been dragged over. This builds up a surface topography that can be
plotted and imaged computationally.23 AFM is a powerful tool in analysing biological
samples, such as DNA, as it can be performed in an aqueous environment as opposed to
drying the sample. Drying a DNA sample can lead to deformations in DNA structure, leading
to inaccuracies when establishing structure.
The tetrahedron synthesised here was analysed in collaboration with Dr Wang Liying and
Prof. Shao Fengwei at the Nanyang Technological University in Singapore by AFM. Figure
2.11 shows the 3D image created of the sample. The figure shows remarkably clear 3D
tetrahedra, all in the size range that was expected. This very positive result fully confirms and
characterises the synthesised tetrahedron here. The size calculation, show also in Figure 2.11,
of 19.2 ± 1.5 nm is larger than modelling suggests and the DLS result. However, this was not
unexpected as AFM measurements also detect the hydration layer surrounding the DNA,
along with the added width of the AFM tip of 2 nm leading to a slightly larger value than
other methods of measurement. This size figure is included for means of comparison for later
on in the chapter.
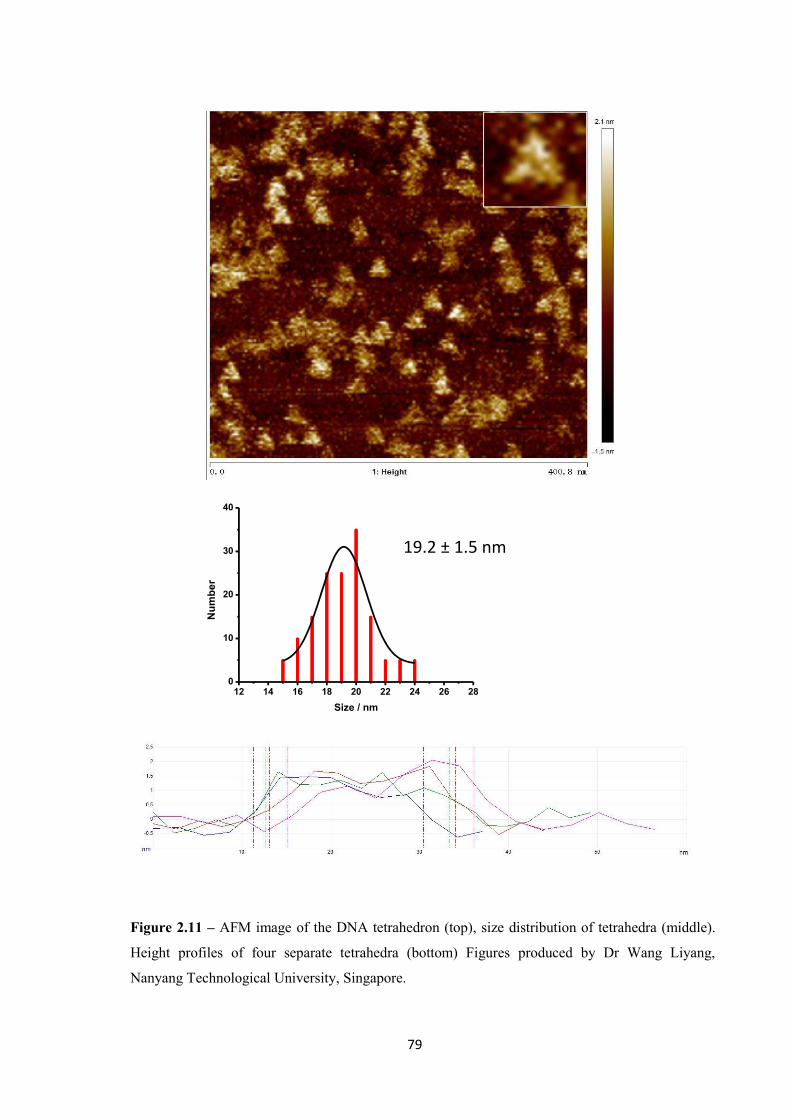
79
Figure 2.11 – AFM image of the DNA tetrahedron (top), size distribution of tetrahedra (middle).
Height profiles of four separate tetrahedra (bottom) Figures produced by Dr Wang Liyang,
Nanyang Technological University, Singapore.
12 14 16 18 20 22 24 26 280
10
20
30
40
Num
ber
Size / nm
19.2 ± 1.5 nm
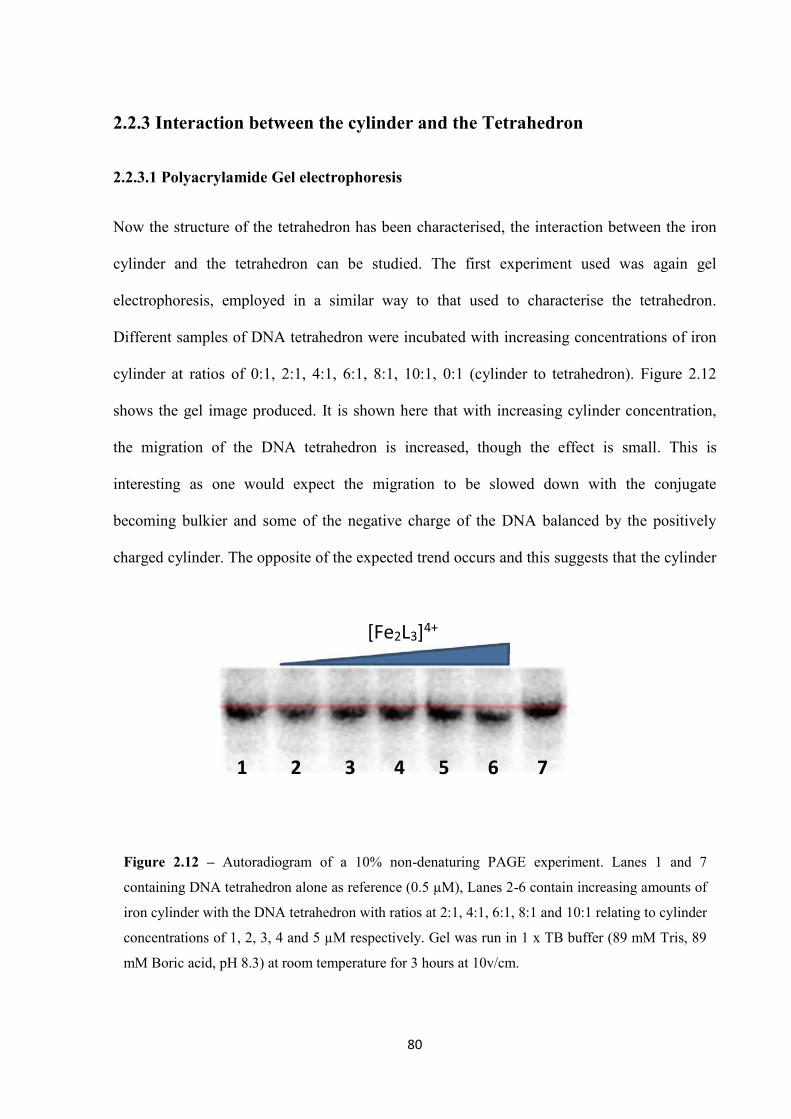
80
2.2.3 Interaction between the cylinder and the Tetrahedron
2.2.3.1 Polyacrylamide Gel electrophoresis
Now the structure of the tetrahedron has been characterised, the interaction between the iron
cylinder and the tetrahedron can be studied. The first experiment used was again gel
electrophoresis, employed in a similar way to that used to characterise the tetrahedron.
Different samples of DNA tetrahedron were incubated with increasing concentrations of iron
cylinder at ratios of 0:1, 2:1, 4:1, 6:1, 8:1, 10:1, 0:1 (cylinder to tetrahedron). Figure 2.12
shows the gel image produced. It is shown here that with increasing cylinder concentration,
the migration of the DNA tetrahedron is increased, though the effect is small. This is
interesting as one would expect the migration to be slowed down with the conjugate
becoming bulkier and some of the negative charge of the DNA balanced by the positively
charged cylinder. The opposite of the expected trend occurs and this suggests that the cylinder
Figure 2.12 – Autoradiogram of a 10% non-denaturing PAGE experiment. Lanes 1 and 7
containing DNA tetrahedron alone as reference (0.5 µM), Lanes 2-6 contain increasing amounts of
iron cylinder with the DNA tetrahedron with ratios at 2:1, 4:1, 6:1, 8:1 and 10:1 relating to cylinder
concentrations of 1, 2, 3, 4 and 5 µM respectively. Gel was run in 1 x TB buffer (89 mM Tris, 89
mM Boric acid, pH 8.3) at room temperature for 3 hours at 10v/cm.
1 2 3 4 5 6 7
[Fe2L3]4+
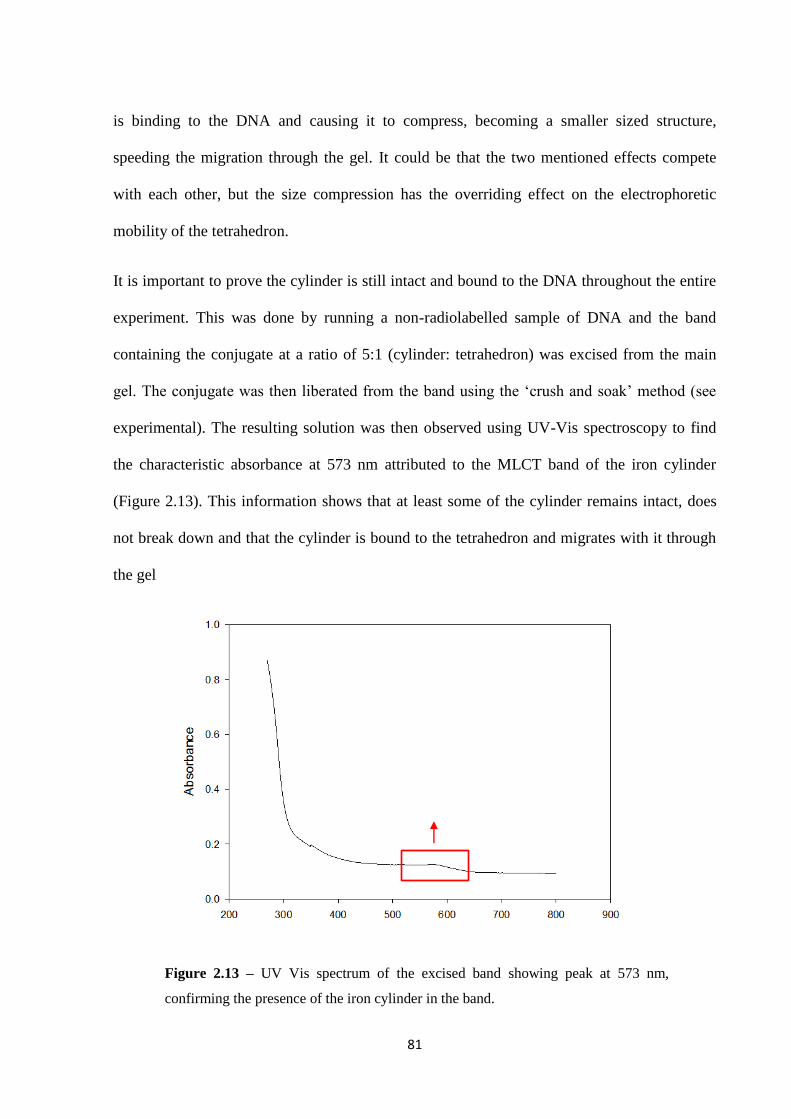
81
is binding to the DNA and causing it to compress, becoming a smaller sized structure,
speeding the migration through the gel. It could be that the two mentioned effects compete
with each other, but the size compression has the overriding effect on the electrophoretic
mobility of the tetrahedron.
It is important to prove the cylinder is still intact and bound to the DNA throughout the entire
experiment. This was done by running a non-radiolabelled sample of DNA and the band
containing the conjugate at a ratio of 5:1 (cylinder: tetrahedron) was excised from the main
gel. The conjugate was then liberated from the band using the ‘crush and soak’ method (see
experimental). The resulting solution was then observed using UV-Vis spectroscopy to find
the characteristic absorbance at 573 nm attributed to the MLCT band of the iron cylinder
(Figure 2.13). This information shows that at least some of the cylinder remains intact, does
not break down and that the cylinder is bound to the tetrahedron and migrates with it through
the gel
Figure 2.13 – UV Vis spectrum of the excised band showing peak at 573 nm,
confirming the presence of the iron cylinder in the band.
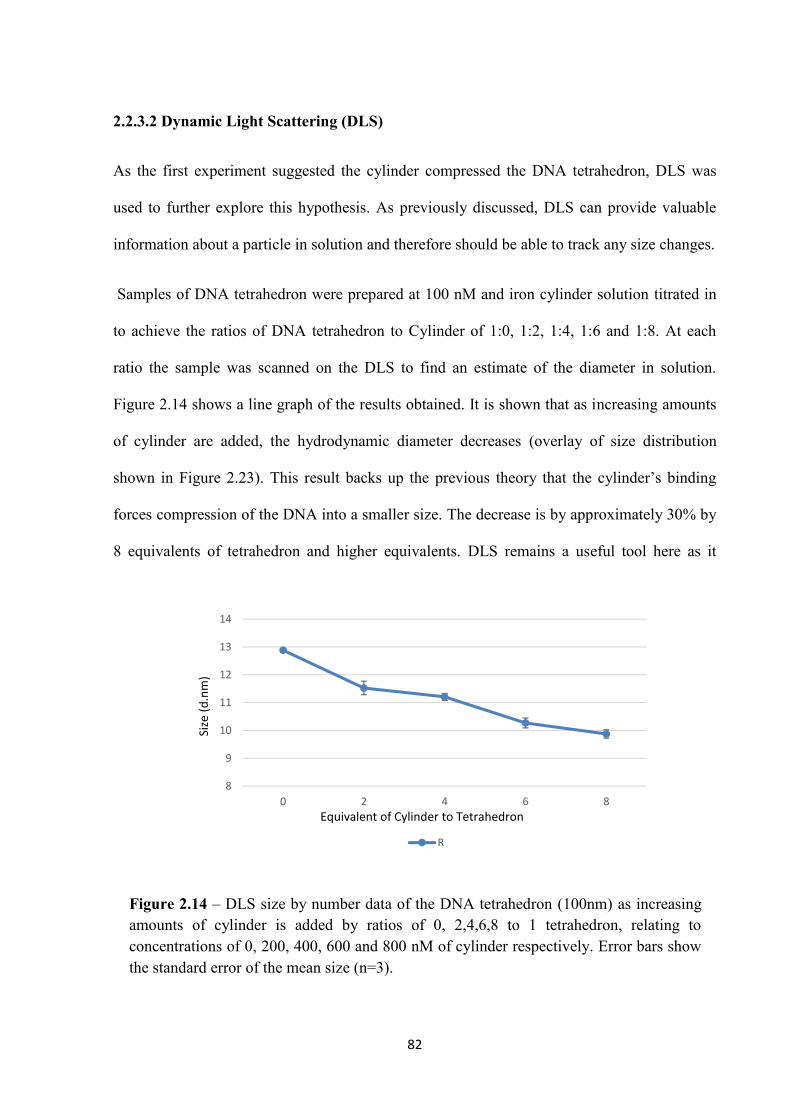
82
2.2.3.2 Dynamic Light Scattering (DLS)
As the first experiment suggested the cylinder compressed the DNA tetrahedron, DLS was
used to further explore this hypothesis. As previously discussed, DLS can provide valuable
information about a particle in solution and therefore should be able to track any size changes.
Samples of DNA tetrahedron were prepared at 100 nM and iron cylinder solution titrated in
to achieve the ratios of DNA tetrahedron to Cylinder of 1:0, 1:2, 1:4, 1:6 and 1:8. At each
ratio the sample was scanned on the DLS to find an estimate of the diameter in solution.
Figure 2.14 shows a line graph of the results obtained. It is shown that as increasing amounts
of cylinder are added, the hydrodynamic diameter decreases (overlay of size distribution
shown in Figure 2.23). This result backs up the previous theory that the cylinder’s binding
forces compression of the DNA into a smaller size. The decrease is by approximately 30% by
8 equivalents of tetrahedron and higher equivalents. DLS remains a useful tool here as it
Figure 2.14 – DLS size by number data of the DNA tetrahedron (100nm) as increasing amounts of cylinder is added by ratios of 0, 2,4,6,8 to 1 tetrahedron, relating to concentrations of 0, 200, 400, 600 and 800 nM of cylinder respectively. Error bars show the standard error of the mean size (n=3).
8
9
10
11
12
13
14
0 2 4 6 8
Size
(d
.nm
)
Equivalent of Cylinder to Tetrahedron
R
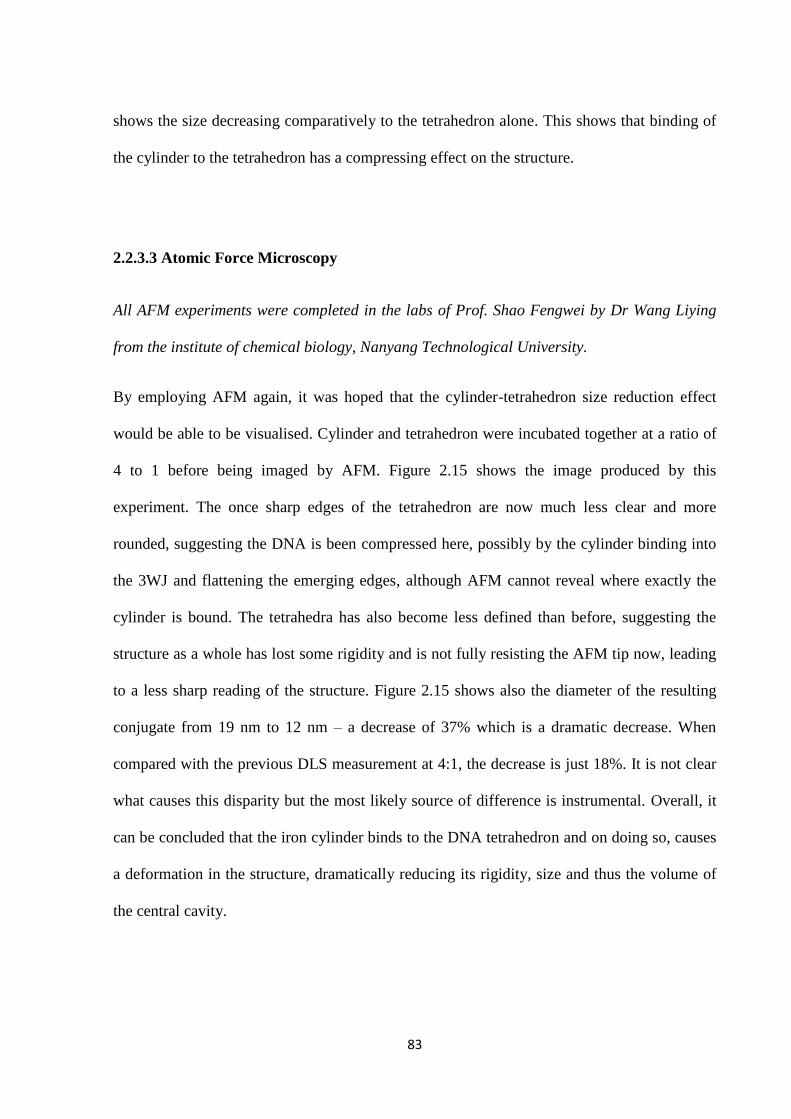
83
shows the size decreasing comparatively to the tetrahedron alone. This shows that binding of
the cylinder to the tetrahedron has a compressing effect on the structure.
2.2.3.3 Atomic Force Microscopy
All AFM experiments were completed in the labs of Prof. Shao Fengwei by Dr Wang Liying
from the institute of chemical biology, Nanyang Technological University.
By employing AFM again, it was hoped that the cylinder-tetrahedron size reduction effect
would be able to be visualised. Cylinder and tetrahedron were incubated together at a ratio of
4 to 1 before being imaged by AFM. Figure 2.15 shows the image produced by this
experiment. The once sharp edges of the tetrahedron are now much less clear and more
rounded, suggesting the DNA is been compressed here, possibly by the cylinder binding into
the 3WJ and flattening the emerging edges, although AFM cannot reveal where exactly the
cylinder is bound. The tetrahedra has also become less defined than before, suggesting the
structure as a whole has lost some rigidity and is not fully resisting the AFM tip now, leading
to a less sharp reading of the structure. Figure 2.15 shows also the diameter of the resulting
conjugate from 19 nm to 12 nm – a decrease of 37% which is a dramatic decrease. When
compared with the previous DLS measurement at 4:1, the decrease is just 18%. It is not clear
what causes this disparity but the most likely source of difference is instrumental. Overall, it
can be concluded that the iron cylinder binds to the DNA tetrahedron and on doing so, causes
a deformation in the structure, dramatically reducing its rigidity, size and thus the volume of
the central cavity.
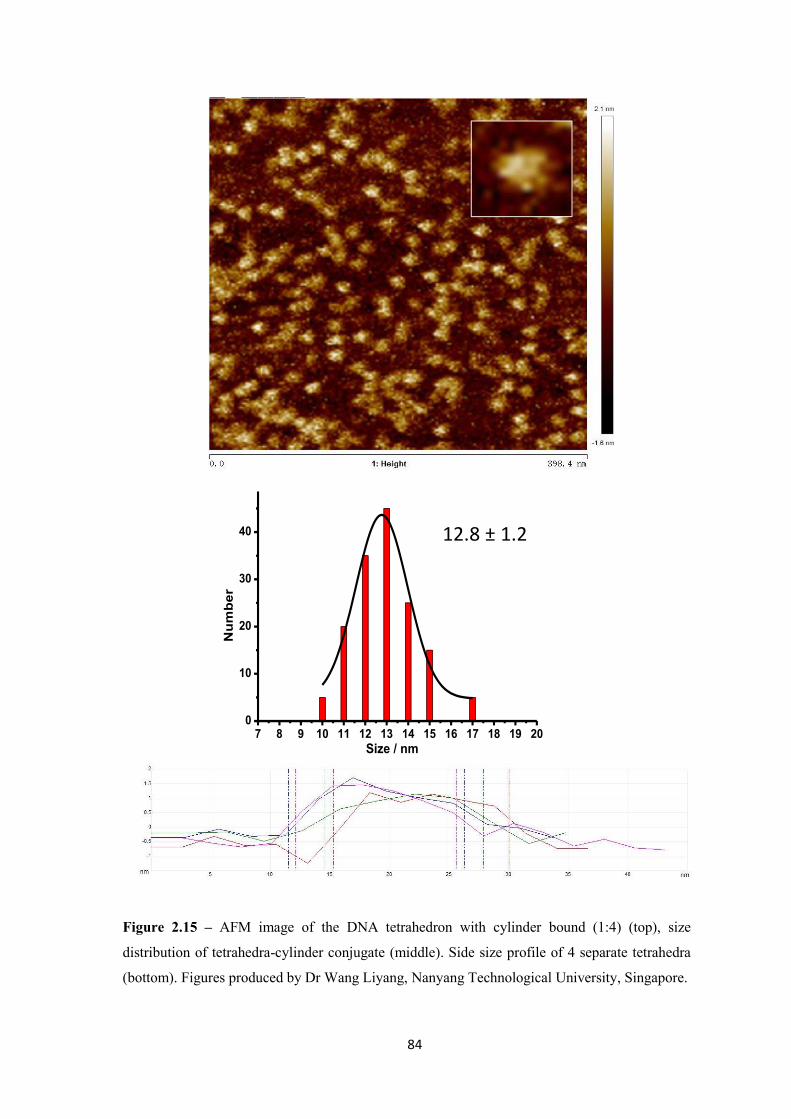
84
7 8 9 10 11 12 13 14 15 16 17 18 19 200
10
20
30
40
Num
ber
Size / nm
12.8 ± 1.2 nm
Figure 2.15 – AFM image of the DNA tetrahedron with cylinder bound (1:4) (top), size
distribution of tetrahedra-cylinder conjugate (middle). Side size profile of 4 separate tetrahedra
(bottom). Figures produced by Dr Wang Liyang, Nanyang Technological University, Singapore.
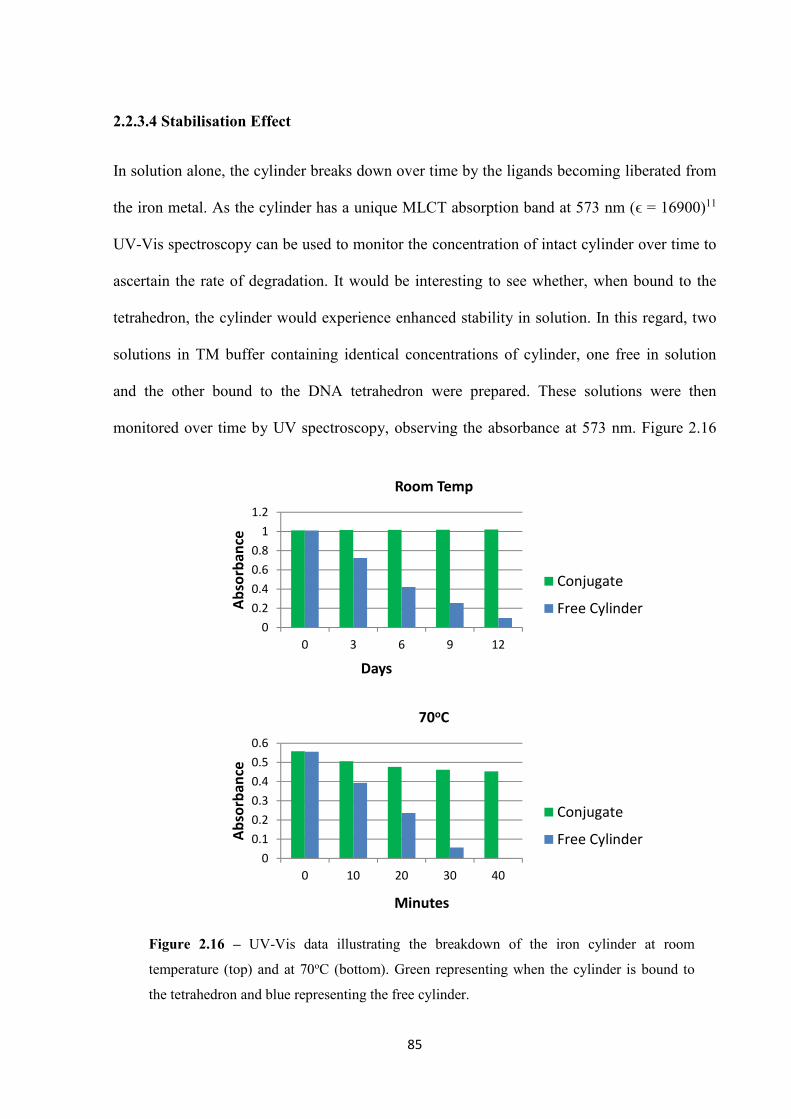
85
2.2.3.4 Stabilisation Effect
In solution alone, the cylinder breaks down over time by the ligands becoming liberated from
the iron metal. As the cylinder has a unique MLCT absorption band at 573 nm (ϵ = 16900)11
UV-Vis spectroscopy can be used to monitor the concentration of intact cylinder over time to
ascertain the rate of degradation. It would be interesting to see whether, when bound to the
tetrahedron, the cylinder would experience enhanced stability in solution. In this regard, two
solutions in TM buffer containing identical concentrations of cylinder, one free in solution
and the other bound to the DNA tetrahedron were prepared. These solutions were then
monitored over time by UV spectroscopy, observing the absorbance at 573 nm. Figure 2.16
0
0.2
0.4
0.6
0.8
1
1.2
0 3 6 9 12
Abso
rban
ce
Days
Room Temp
Conjugate
Free Cylinder
0
0.1
0.2
0.3
0.4
0.5
0.6
0 10 20 30 40
Abso
rban
ce
Minutes
70oC
Conjugate
Free Cylinder
Figure 2.16 – UV-Vis data illustrating the breakdown of the iron cylinder at room
temperature (top) and at 70oC (bottom). Green representing when the cylinder is bound to
the tetrahedron and blue representing the free cylinder.
86
shows the concentration of the two solutions when kept at room temperature and another
experiment at 70oC. When bound to the tetrahedron, at room temperature, no degradation is
observed at all over 12 days. In fact a very small increase in absorption (<1%) was observed
which was attributed to small amounts of water evaporating even though the cuvette had a lid.
Free cylinder, however, almost completely degrades in the same time period. At an elevated
temperature of 70oC, the free cylinder is fully degraded within 40 minutes, whereas the
conjugate has only slight degradation over the same period. The DNA binding helps protect
the iron-nitrogen coordination from hydration when in solution. This is particularly useful in
biological applications as the cytotoxic cylinder would remain intact for longer at
temperatures of 37.5oC in vivo, increasing the half-life inside the body and thus increasing
potential bio-availability, creating an overall more effective therapeutic.
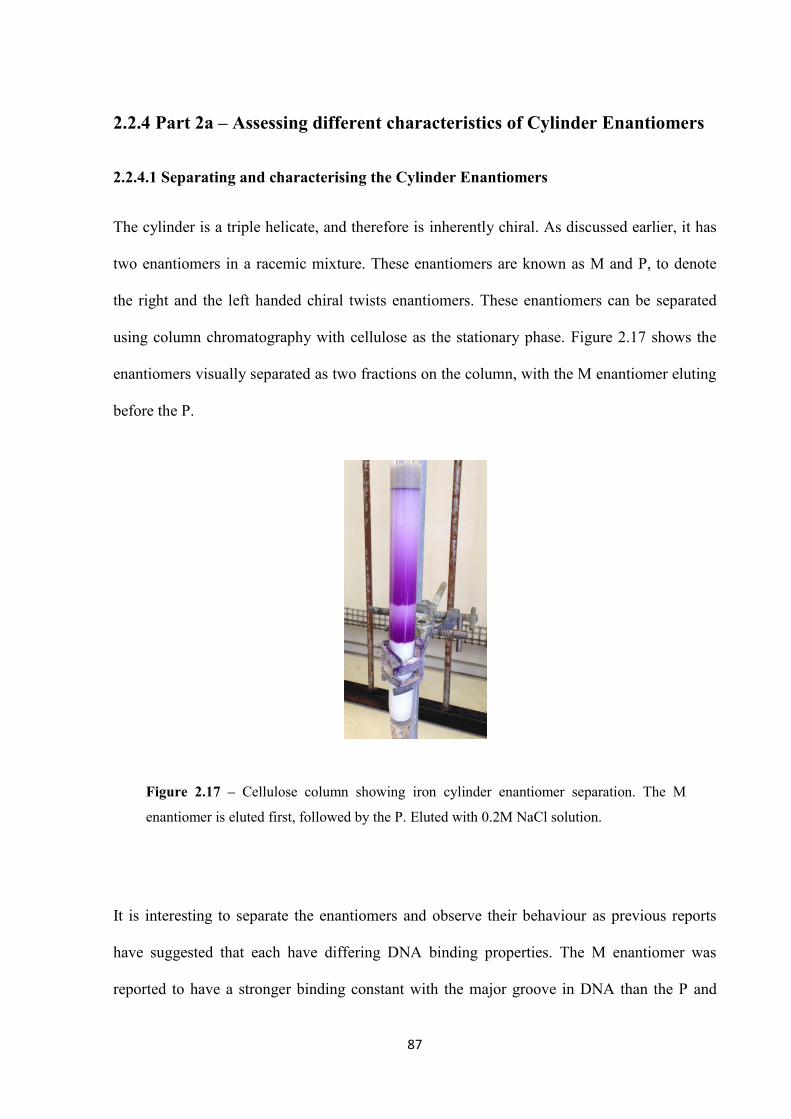
87
Figure 2.17 – Cellulose column showing iron cylinder enantiomer separation. The M
enantiomer is eluted first, followed by the P. Eluted with 0.2M NaCl solution.
2.2.4 Part 2a – Assessing different characteristics of Cylinder Enantiomers
2.2.4.1 Separating and characterising the Cylinder Enantiomers
The cylinder is a triple helicate, and therefore is inherently chiral. As discussed earlier, it has
two enantiomers in a racemic mixture. These enantiomers are known as M and P, to denote
the right and the left handed chiral twists enantiomers. These enantiomers can be separated
using column chromatography with cellulose as the stationary phase. Figure 2.17 shows the
enantiomers visually separated as two fractions on the column, with the M enantiomer eluting
before the P.
It is interesting to separate the enantiomers and observe their behaviour as previous reports
have suggested that each have differing DNA binding properties. The M enantiomer was
reported to have a stronger binding constant with the major groove in DNA than the P and
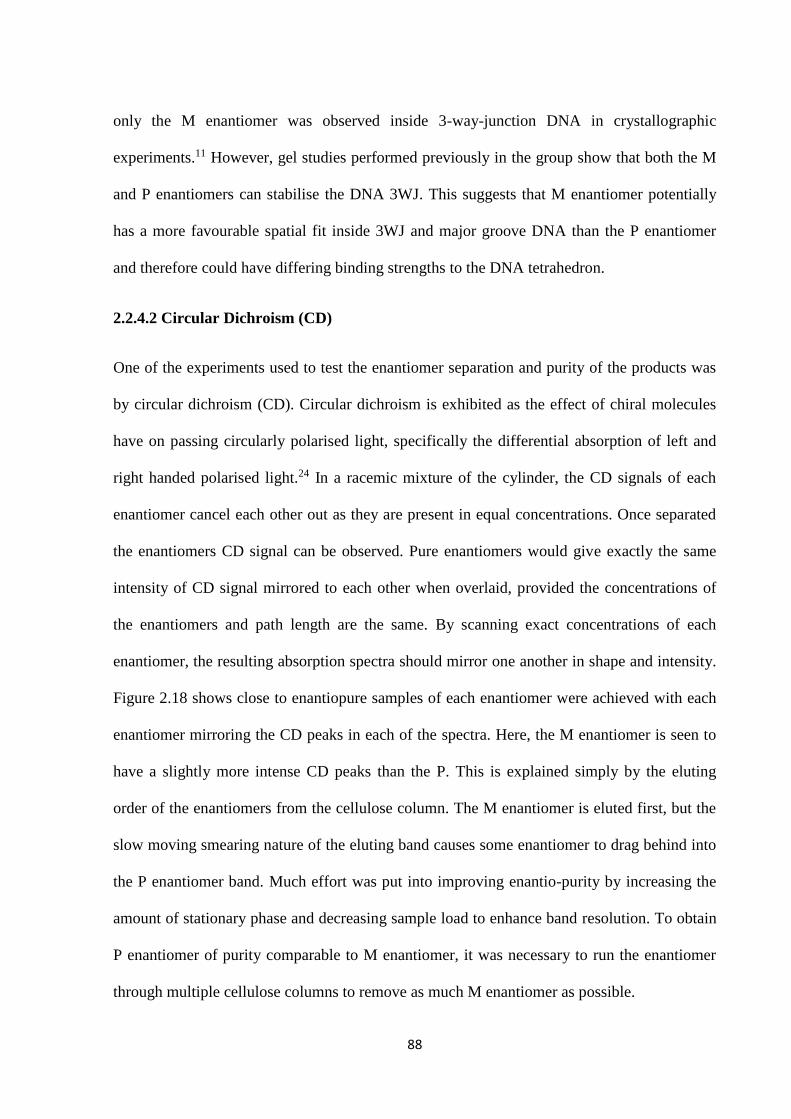
88
only the M enantiomer was observed inside 3-way-junction DNA in crystallographic
experiments.11 However, gel studies performed previously in the group show that both the M
and P enantiomers can stabilise the DNA 3WJ. This suggests that M enantiomer potentially
has a more favourable spatial fit inside 3WJ and major groove DNA than the P enantiomer
and therefore could have differing binding strengths to the DNA tetrahedron.
2.2.4.2 Circular Dichroism (CD)
One of the experiments used to test the enantiomer separation and purity of the products was
by circular dichroism (CD). Circular dichroism is exhibited as the effect of chiral molecules
have on passing circularly polarised light, specifically the differential absorption of left and
right handed polarised light.24 In a racemic mixture of the cylinder, the CD signals of each
enantiomer cancel each other out as they are present in equal concentrations. Once separated
the enantiomers CD signal can be observed. Pure enantiomers would give exactly the same
intensity of CD signal mirrored to each other when overlaid, provided the concentrations of
the enantiomers and path length are the same. By scanning exact concentrations of each
enantiomer, the resulting absorption spectra should mirror one another in shape and intensity.
Figure 2.18 shows close to enantiopure samples of each enantiomer were achieved with each
enantiomer mirroring the CD peaks in each of the spectra. Here, the M enantiomer is seen to
have a slightly more intense CD peaks than the P. This is explained simply by the eluting
order of the enantiomers from the cellulose column. The M enantiomer is eluted first, but the
slow moving smearing nature of the eluting band causes some enantiomer to drag behind into
the P enantiomer band. Much effort was put into improving enantio-purity by increasing the
amount of stationary phase and decreasing sample load to enhance band resolution. To obtain
P enantiomer of purity comparable to M enantiomer, it was necessary to run the enantiomer
through multiple cellulose columns to remove as much M enantiomer as possible.
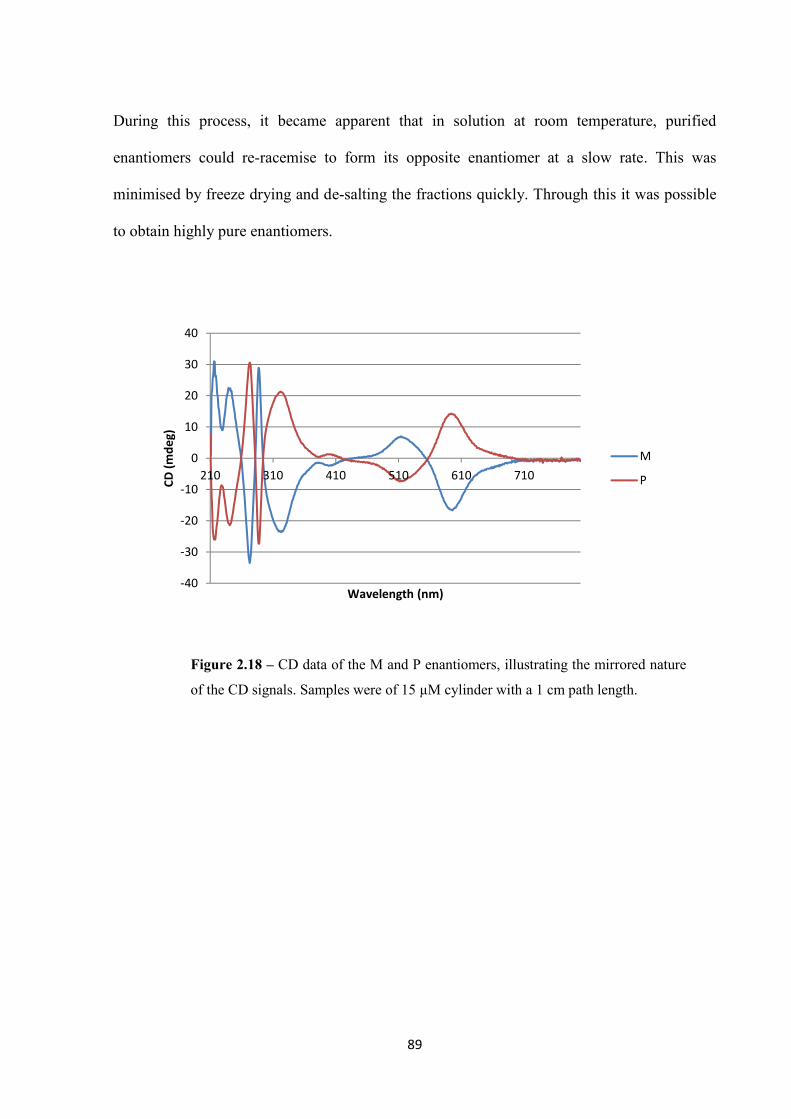
89
During this process, it became apparent that in solution at room temperature, purified
enantiomers could re-racemise to form its opposite enantiomer at a slow rate. This was
minimised by freeze drying and de-salting the fractions quickly. Through this it was possible
to obtain highly pure enantiomers.
-40
-30
-20
-10
0
10
20
30
40
210 310 410 510 610 710CD (m
deg)
Wavelength (nm)
M
P
Figure 2.18 – CD data of the M and P enantiomers, illustrating the mirrored nature
of the CD signals. Samples were of 15 µM cylinder with a 1 cm path length.
90
2.2.4.3 Chiral Shift Reagent - Λ-TrisPhat
To fully ascertain whether pure enantiomers where obtained by this method, the chiral shift
reagent Λ-TrisPhat tetrabutylammonium salt ([Tetrabutylammonium] [Δ-tris(tetrachloro-1,2-
benzenediolato)phosphate(V)]) was used (Figure 2.19). This chiral anion is configurationally
stable in solution and can be isolated as either isomer. It has also been shown to be able to
form diastereomeric ion pairs with chiral metal-ligand complexes which then exhibit different
chemical shifts in 1H NMR spectroscopy.25
By adding Λ-TrisPhat to samples of racemic cylinder and also to sample of the M and P
enantiomers, it was found that the anionic counter ion interacts each of the enantiomers
differently. Figure 2.20 shows the 1H NMR data of the racemic iron cylinder alone. On
addition of the chiral anion, 1H environments CH2, Him and 5py split into two more sets of
peaks.
Figure 2.19 - Λ-TrisPhat tetrabutylammonium salt structure, taken from Sigma Aldrich
product web page.
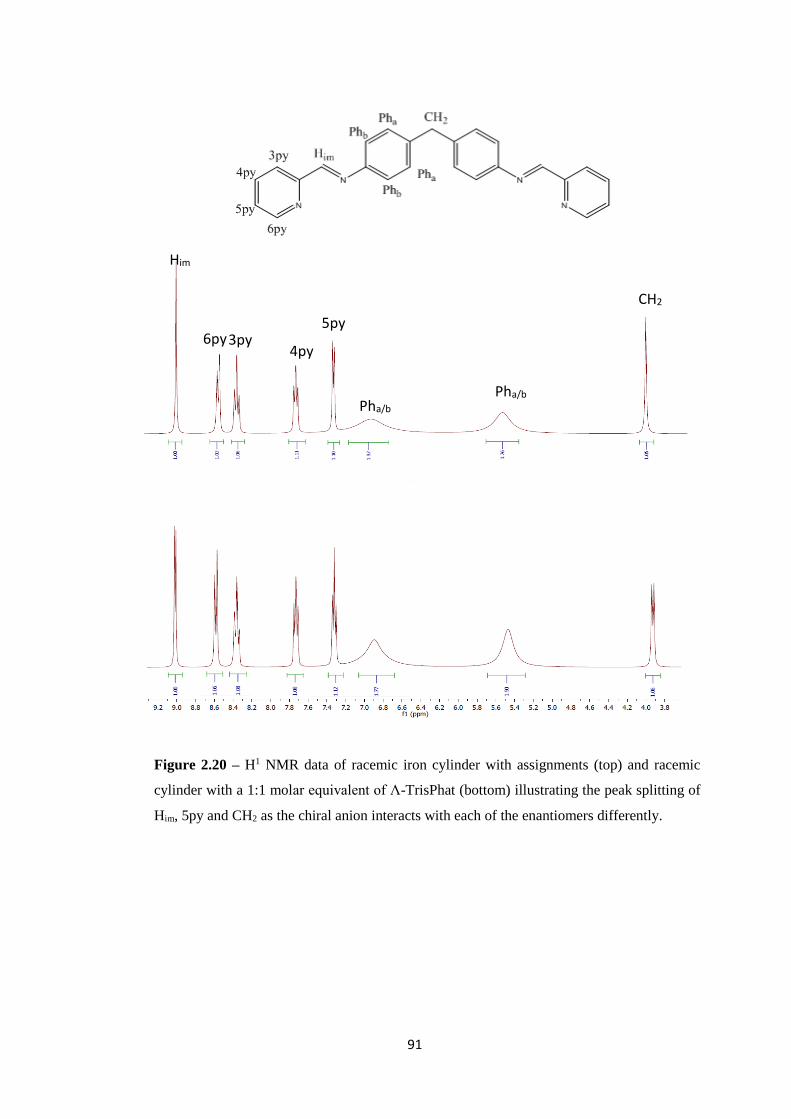
91
CH2
Pha/b
Pha/b
5py
4py 3py 6py
Him
Figure 2.20 – H1 NMR data of racemic iron cylinder with assignments (top) and racemic
cylinder with a 1:1 molar equivalent of Λ-TrisPhat (bottom) illustrating the peak splitting of
Him, 5py and CH2 as the chiral anion interacts with each of the enantiomers differently.
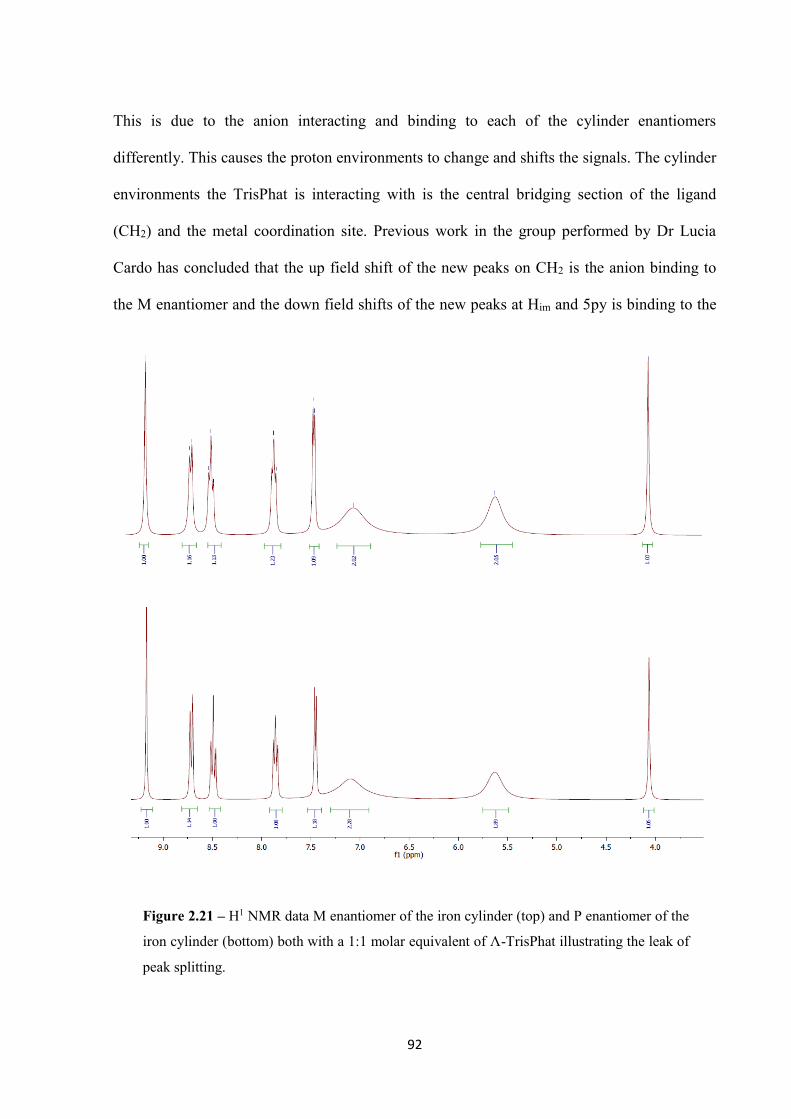
92
This is due to the anion interacting and binding to each of the cylinder enantiomers
differently. This causes the proton environments to change and shifts the signals. The cylinder
environments the TrisPhat is interacting with is the central bridging section of the ligand
(CH2) and the metal coordination site. Previous work in the group performed by Dr Lucia
Cardo has concluded that the up field shift of the new peaks on CH2 is the anion binding to
the M enantiomer and the down field shifts of the new peaks at Him and 5py is binding to the
Figure 2.21 – H1 NMR data M enantiomer of the iron cylinder (top) and P enantiomer of the
iron cylinder (bottom) both with a 1:1 molar equivalent of Λ-TrisPhat illustrating the leak of
peak splitting.
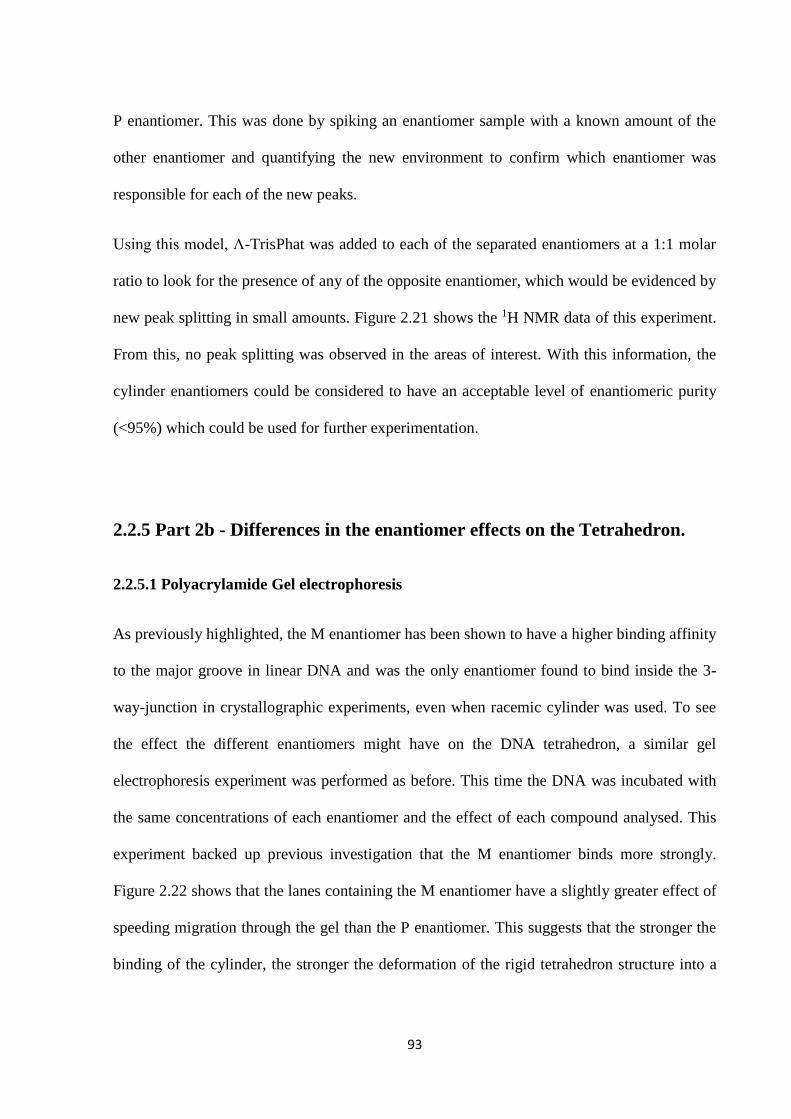
93
P enantiomer. This was done by spiking an enantiomer sample with a known amount of the
other enantiomer and quantifying the new environment to confirm which enantiomer was
responsible for each of the new peaks.
Using this model, Λ-TrisPhat was added to each of the separated enantiomers at a 1:1 molar
ratio to look for the presence of any of the opposite enantiomer, which would be evidenced by
new peak splitting in small amounts. Figure 2.21 shows the 1H NMR data of this experiment.
From this, no peak splitting was observed in the areas of interest. With this information, the
cylinder enantiomers could be considered to have an acceptable level of enantiomeric purity
(<95%) which could be used for further experimentation.
2.2.5 Part 2b - Differences in the enantiomer effects on the Tetrahedron.
2.2.5.1 Polyacrylamide Gel electrophoresis
As previously highlighted, the M enantiomer has been shown to have a higher binding affinity
to the major groove in linear DNA and was the only enantiomer found to bind inside the 3-
way-junction in crystallographic experiments, even when racemic cylinder was used. To see
the effect the different enantiomers might have on the DNA tetrahedron, a similar gel
electrophoresis experiment was performed as before. This time the DNA was incubated with
the same concentrations of each enantiomer and the effect of each compound analysed. This
experiment backed up previous investigation that the M enantiomer binds more strongly.
Figure 2.22 shows that the lanes containing the M enantiomer have a slightly greater effect of
speeding migration through the gel than the P enantiomer. This suggests that the stronger the
binding of the cylinder, the stronger the deformation of the rigid tetrahedron structure into a
94
smaller, faster migrating conjugate. Another explanation could be that both enantiomers bind
equally well, but the binding of the M enantiomer has a bigger structural effect than the P
enantiomer.
2.2.5.2 DLS
The earlier DLS experiment in which racemic cylinder was titrated into tetrahedron was now
repeated with each of the enantiomers. This was done to attempt to quantify the earlier gel
electrophoresis result in the expectation that the M enantiomer would decrease the overall size
of the DNA tetrahedron more effectively than the P enantiomer. Figure 2.23 shows the DLS
data obtained from this experiment, with the previous racemic experiment data overlaid for
comparison. From the scatter graph, it can be seen that the expected trend is very neatly
Figure 2.22 – Autoradiogram of a 10% non-denaturing PAGE experiment. Lane 1 and 6
consisting of DNA tetrahedron only (1µM), lane 2 and 3 containing tetrahedron with P
enantiomer and tetrahedron at ratios of 5:1 and 10:1 respectively, with cylinder
corresponding cylinder concentration of 5µM and 10µM respectively. Lanes 4 and 5
containing tetrahedron with P enantiomer and tetrahedron at ratios of 5:1 and 10:1
respectively, with cylinder corresponding cylinder concentrations of 5µM and 10µM
respectively.
1 2 3 4 5 6
P 2P 2M M
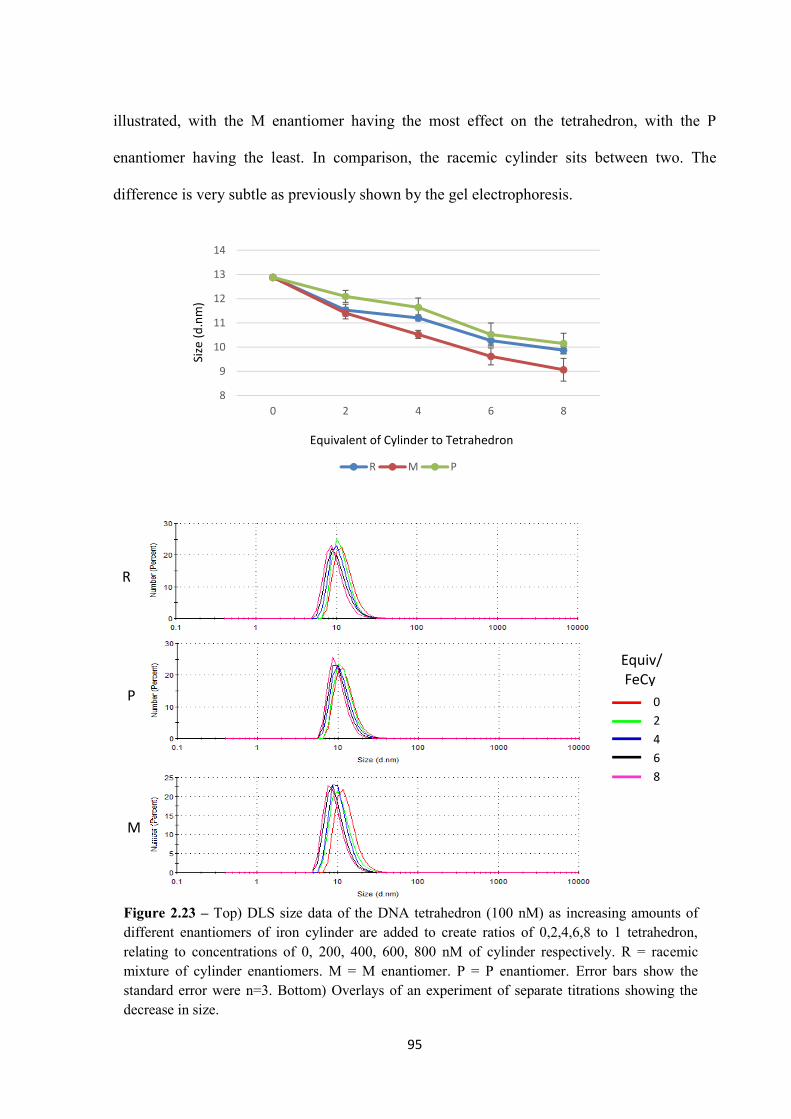
95
illustrated, with the M enantiomer having the most effect on the tetrahedron, with the P
enantiomer having the least. In comparison, the racemic cylinder sits between two. The
difference is very subtle as previously shown by the gel electrophoresis.
Figure 2.23 – Top) DLS size data of the DNA tetrahedron (100 nM) as increasing amounts of different enantiomers of iron cylinder are added to create ratios of 0,2,4,6,8 to 1 tetrahedron, relating to concentrations of 0, 200, 400, 600, 800 nM of cylinder respectively. R = racemic mixture of cylinder enantiomers. M = M enantiomer. P = P enantiomer. Error bars show the standard error were n=3. Bottom) Overlays of an experiment of separate titrations showing the decrease in size.
8
9
10
11
12
13
14
0 2 4 6 8
Size
(d
.nm
)
Equivalent of Cylinder to Tetrahedron
R M P
R
P
M
0 2 4 6 8
Equiv/ FeCy
96
It is worth noting the range in the distribution of the size is wide, and this is probably due to
the none-spherical and none solid structure of the tetrahedron causing a range of scattering.
From the overlays, however, it is clear the entire range can be seen to shift to the left on
increasing cylinder, showing an overall decrease in size.
2.3 Conclusions
Overall, in the initial parts of this chapter, it was shown that the iron cylinder has very high
affinity to a synthetic DNA 3WJ and prefers to stabilise this structure over a wide range of
other common DNA structures. From this, in part 2a, the cylinder was shown to also bind to a
DNA tetrahedron. Further investigation into this binding led to the discovery of a very
interesting interaction between the two; that cylinder binding lead to deformation and
structural compression of the tetrahedron. This interaction was characterised through various
techniques and a similar result obtained through each technique. In part 2b the cylinder
enantiomers were separated and characterised successfully, following on from previous group
work showing that the M and P enantiomers may behave differently with regards to DNA
binding. In this respect, both enantiomers were shown to cause compression on interaction
with the tetrahedron, with the M enantiomer shown to be more slightly more effective that the
P enantiomer.
The interaction discovered here is a novel one between a small molecule and DNA
nanostructure. As DNA nanostructures with hollow central cavities have been widely
championed as cargo vessels for drugs, an interaction which would potentially see an
internalised cargo pushed out on addition of cylinder is very exciting. The conjugate formed
between the iron cylinder and the tetrahedron also has great biological potential which will be
studied further in the following chapter.
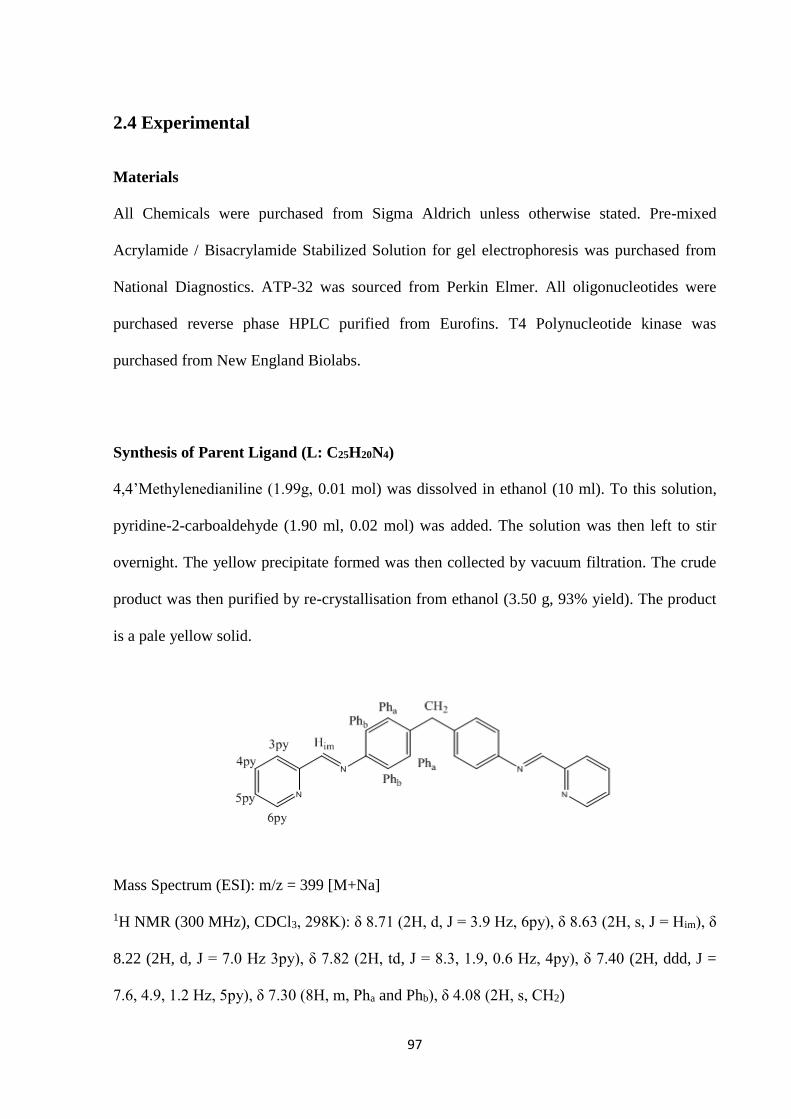
97
2.4 Experimental
Materials
All Chemicals were purchased from Sigma Aldrich unless otherwise stated. Pre-mixed
Acrylamide / Bisacrylamide Stabilized Solution for gel electrophoresis was purchased from
National Diagnostics. ATP-32 was sourced from Perkin Elmer. All oligonucleotides were
purchased reverse phase HPLC purified from Eurofins. T4 Polynucleotide kinase was
purchased from New England Biolabs.
Synthesis of Parent Ligand (L: C25H20N4)
4,4’Methylenedianiline (1.99g, 0.01 mol) was dissolved in ethanol (10 ml). To this solution,
pyridine-2-carboaldehyde (1.90 ml, 0.02 mol) was added. The solution was then left to stir
overnight. The yellow precipitate formed was then collected by vacuum filtration. The crude
product was then purified by re-crystallisation from ethanol (3.50 g, 93% yield). The product
is a pale yellow solid.
Mass Spectrum (ESI): m/z = 399 [M+Na]
1H NMR (300 MHz), CDCl3, 298K): δ 8.71 (2H, d, J = 3.9 Hz, 6py), δ 8.63 (2H, s, J = Him), δ
8.22 (2H, d, J = 7.0 Hz 3py), δ 7.82 (2H, td, J = 8.3, 1.9, 0.6 Hz, 4py), δ 7.40 (2H, ddd, J =
7.6, 4.9, 1.2 Hz, 5py), δ 7.30 (8H, m, Pha and Phb), δ 4.08 (2H, s, CH2)
98
Synthesis of the triple stranded iron helicate [Fe2(L)3]Cl4
Ligand (3.0g, 0.008 mol) was dissolved in methanol (400 ml). Iron (II) chloride tetrahydrate
(1.06 g, 0.005 mol) was then added to the solution and the resulting solution was brought to
reflux at 65oC for 3 hours. The solution was then taken to dryness in vacuo. The crude
product was then dissolved in minimal amounts of methanol (10 ml) and excess methanolic
ammonium hexafluorophosphate added. The resulting precipitate was collected by filtration
and washed with water (2 x 10 ml) and then diethyl ether (5 x 25 ml). The filtrate was then
suspended in methanol and stirred with Dowex until the product had dissolved. The Dowex
was then filtered off. The filtrate was taken to dryness in vacuo, and then redissolved in a
minimum amount of methanol. Excess diethyl ether was added until the product precipitates,
the final product was filtered and washed with ether and dried (1.65g, 59.7%). The final
product was a crystalline purple solid.
Mass Spectrum (ESI): m/z = 425.5 [Fe2L3]Cl3+ , 310 [Fe2L3]4+
1H NMR (300 MHz), CD3OD, 298K): δ 9.13 (2H, s, Him), δ 8.71 (2H, d, J = 7.2 Hz, 6py), δ
8.48 (2H, t, J = 7.8, 3py), δ 7.84 (2H, ddd, J = 5.6, 4py), δ 7.44 (2H, d, J = 5.2, 5py), δ 7.05
(4H, broadened, Pha/b), δ 5.62 (4H, broadened, Pha/b), δ 4.07 (2H, s, CH2)
UV-Vis (H2O), λmax (ϵmax/dm3mol-1cm-1) 584 (16900) nm
Radiolabelling of Oligonucleotides
A mixture of 9.6 µl of MilliQ water, 2 µl of 10x T4 polynucleotide kinase buffer (New
England Biolabs), 2 µl of bacteriophage T4 polynucleotide kinase (New England Biolabs) ,
2.4 µl of 100 µM of oligonucleotide and 4 µl of 32P ATP (6000 Ci/mmol – Perkin Elmer) was
added to a 1.5 mL eppendorf. The mixture was vortexed gently (2secs), centrifuged (3000
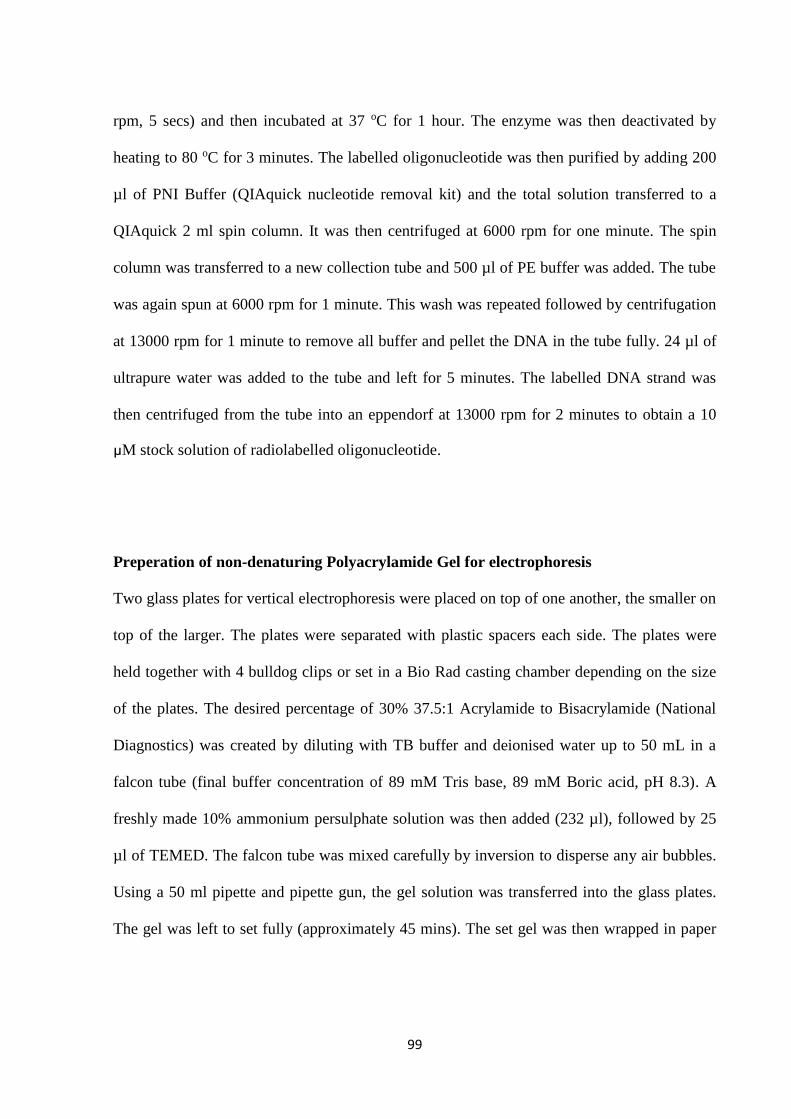
99
rpm, 5 secs) and then incubated at 37 oC for 1 hour. The enzyme was then deactivated by
heating to 80 oC for 3 minutes. The labelled oligonucleotide was then purified by adding 200
µl of PNI Buffer (QIAquick nucleotide removal kit) and the total solution transferred to a
QIAquick 2 ml spin column. It was then centrifuged at 6000 rpm for one minute. The spin
column was transferred to a new collection tube and 500 µl of PE buffer was added. The tube
was again spun at 6000 rpm for 1 minute. This wash was repeated followed by centrifugation
at 13000 rpm for 1 minute to remove all buffer and pellet the DNA in the tube fully. 24 µl of
ultrapure water was added to the tube and left for 5 minutes. The labelled DNA strand was
then centrifuged from the tube into an eppendorf at 13000 rpm for 2 minutes to obtain a 10
µM stock solution of radiolabelled oligonucleotide.
Preperation of non-denaturing Polyacrylamide Gel for electrophoresis
Two glass plates for vertical electrophoresis were placed on top of one another, the smaller on
top of the larger. The plates were separated with plastic spacers each side. The plates were
held together with 4 bulldog clips or set in a Bio Rad casting chamber depending on the size
of the plates. The desired percentage of 30% 37.5:1 Acrylamide to Bisacrylamide (National
Diagnostics) was created by diluting with TB buffer and deionised water up to 50 mL in a
falcon tube (final buffer concentration of 89 mM Tris base, 89 mM Boric acid, pH 8.3). A
freshly made 10% ammonium persulphate solution was then added (232 µl), followed by 25
µl of TEMED. The falcon tube was mixed carefully by inversion to disperse any air bubbles.
Using a 50 ml pipette and pipette gun, the gel solution was transferred into the glass plates.
The gel was left to set fully (approximately 45 mins). The set gel was then wrapped in paper
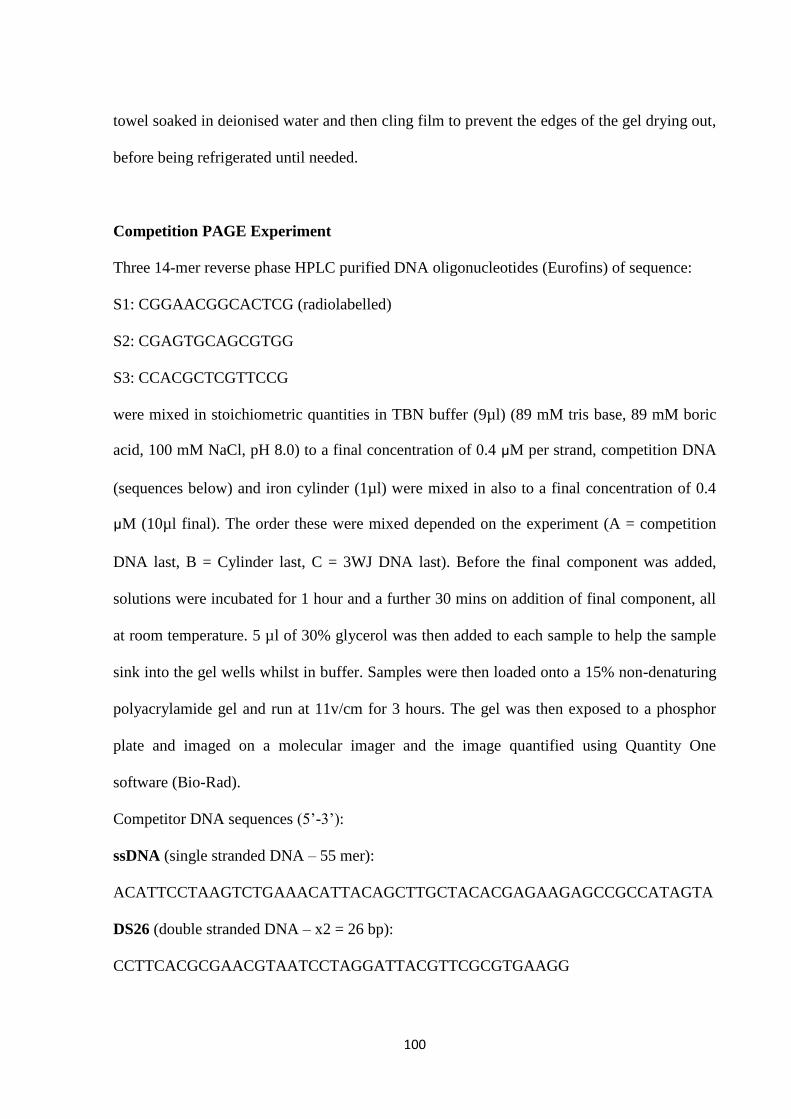
100
towel soaked in deionised water and then cling film to prevent the edges of the gel drying out,
before being refrigerated until needed.
Competition PAGE Experiment
Three 14-mer reverse phase HPLC purified DNA oligonucleotides (Eurofins) of sequence:
S1: CGGAACGGCACTCG (radiolabelled)
S2: CGAGTGCAGCGTGG
S3: CCACGCTCGTTCCG
were mixed in stoichiometric quantities in TBN buffer (9µl) (89 mM tris base, 89 mM boric
acid, 100 mM NaCl, pH 8.0) to a final concentration of 0.4 µM per strand, competition DNA
(sequences below) and iron cylinder (1µl) were mixed in also to a final concentration of 0.4
µM (10µl final). The order these were mixed depended on the experiment (A = competition
DNA last, B = Cylinder last, C = 3WJ DNA last). Before the final component was added,
solutions were incubated for 1 hour and a further 30 mins on addition of final component, all
at room temperature. 5 µl of 30% glycerol was then added to each sample to help the sample
sink into the gel wells whilst in buffer. Samples were then loaded onto a 15% non-denaturing
polyacrylamide gel and run at 11v/cm for 3 hours. The gel was then exposed to a phosphor
plate and imaged on a molecular imager and the image quantified using Quantity One
software (Bio-Rad).
Competitor DNA sequences (5’-3’):
ssDNA (single stranded DNA – 55 mer):
ACATTCCTAAGTCTGAAACATTACAGCTTGCTACACGAGAAGAGCCGCCATAGTA
DS26 (double stranded DNA – x2 = 26 bp):
CCTTCACGCGAACGTAATCCTAGGATTACGTTCGCGTGAAGG
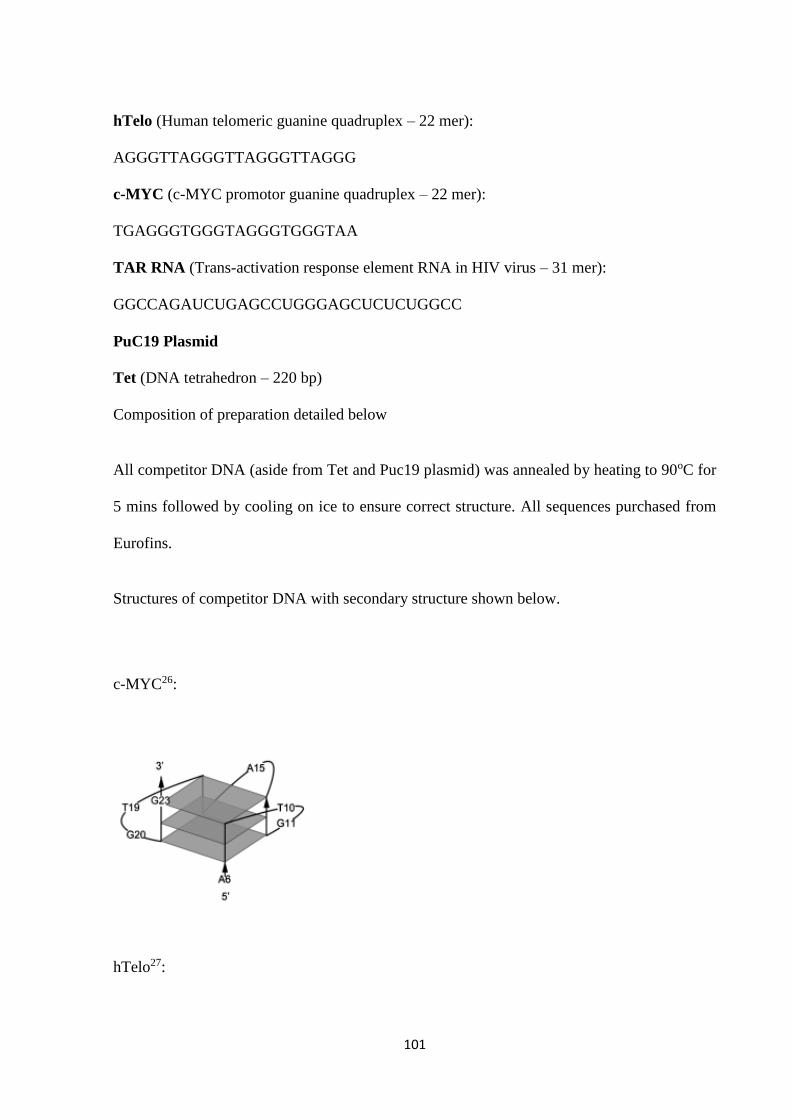
101
hTelo (Human telomeric guanine quadruplex – 22 mer):
AGGGTTAGGGTTAGGGTTAGGG
c-MYC (c-MYC promotor guanine quadruplex – 22 mer):
TGAGGGTGGGTAGGGTGGGTAA
TAR RNA (Trans-activation response element RNA in HIV virus – 31 mer):
GGCCAGAUCUGAGCCUGGGAGCUCUCUGGCC
PuC19 Plasmid
Tet (DNA tetrahedron – 220 bp)
Composition of preparation detailed below
All competitor DNA (aside from Tet and Puc19 plasmid) was annealed by heating to 90oC for
5 mins followed by cooling on ice to ensure correct structure. All sequences purchased from
Eurofins.
Structures of competitor DNA with secondary structure shown below.
c-MYC26:
hTelo27:
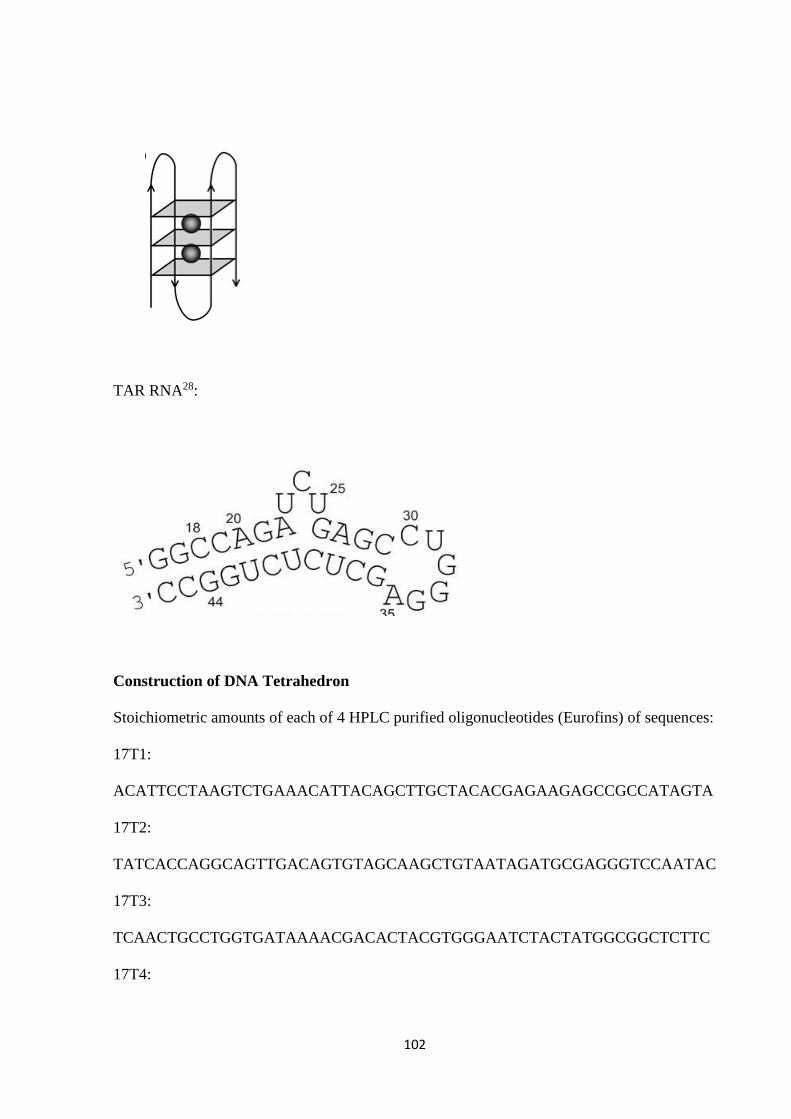
102
TAR RNA28:
Construction of DNA Tetrahedron
Stoichiometric amounts of each of 4 HPLC purified oligonucleotides (Eurofins) of sequences:
17T1:
ACATTCCTAAGTCTGAAACATTACAGCTTGCTACACGAGAAGAGCCGCCATAGTA
17T2:
TATCACCAGGCAGTTGACAGTGTAGCAAGCTGTAATAGATGCGAGGGTCCAATAC
17T3:
TCAACTGCCTGGTGATAAAACGACACTACGTGGGAATCTACTATGGCGGCTCTTC
17T4:
103
TTCAGACTTAGGAATGTGCTTCCCACGTAGTGTCGTTTGTATTGGACCCTCGCAT
were mixed in TM buffer (10mM Tris base, 5mM MgCl2, pH 8) (max concentration of 1 µM
per strand) in an Eppendorf. The mixture was then heated to 95 oC in a thermal block for 5
minutes. On cooling at room temperature for 30 seconds, the Eppendorf was placed on ice for
5 minutes and then centrifuged for 5 seconds. The product was then purified and concentrated
to desired concentration in a 30K MWCO filter (Pierce).
Tetrahedron Gel Electrophoresis
Tetrahedron samples (17T1 radiolabelled) (1 µM) were prepared in 1.5 ml Eppendorfs in 1 x
TM Buffer (10mM Tris base, 5mM MgCl2, pH 8) and cylinder added to achieve the desired
ratios. The samples were incubated at room temperature for 60 minutes and then on ice for 10
minutes. 5 µl of 30% glycerol was then added to each sample to help the sample sink into the
gel wells whilst in buffer. The samples were then loaded into separate lanes on a 10% non-
denaturing polyacrylamide gel in the desired order. 10µl of gelpilot™ (Qiagen) was added to
the adjacent wells to the samples to track the progress of the experiment. The gels were run at
a constant 11V/cm of gel at room temperature for 5 hours. The gel was extracted from the
glass plates using a sheet of Whatman paper and wrapped in clingflim. The gel was placed
inside a developing cassette with a white phosphor film placed over for 1 hour. The phosphor
film was imaged using a molecular imager to produce an autoradiogram.
Dynamic Light Scattering – DLS
DNA tetrahedron samples were prepared and diluted to 100 nm with iron cylinder to achieve
ratios of 0:1, 2:1, 4:1, 6:1 and 8:1 relating to concentrations of 0, 200, 400, 600 and 800 nM
respectively before being passed through a 1 µM syringe filter (Pall). Samples were incubated
104
at room temperature for 1 hour and then on ice for 1 mins. The samples (1 ml) were then
transferred to separate disposable sizing cuvettes and then scanned on a Malvern Zetasizer
nano for a total of 60 runs (3 x 20) to provide a size by number distribution.
Atomic Force Microscopy – AFM
All atomic force microscopy was performed in Singapore by Dr Wang Liyang in the labs of
Prof. Shao Fengwei at Nanyang Technological University. AFM images were obtained on a
Bruker Multimode 8 SPM equipped with a liquid cell.
Freshly cleaved mica was treated with 0.1 % (v/v) APTES ((3-Aminopropyl) triethoxysilane)
aqueous solution for 10 mins to make the surface positively charged, and then washed with 2
mL ultrapure water and dried by compress nitrogen. 35 uL of DNA tetrahedron (or
tetrahedron-cylinder conjugate at 1:4) solution was dropped onto the mica surface to
incubated for 5 min. Then the sample was ready for measurement under the ScanAsyst in
fluid mode with the SNL-10 probe (Bruker).
UV-Vis Stabalisation
Two iron cylinder solution of identical concentration (60µM), one alone and one bound to
DNA tetrahedron at a ratio of 4:1 cylinder to tetrahedron. Samples were incubated in a 1 cm
path length UV cuvette (Starna) at room temperature for 1 hour before the absorbance of each
solution was recorded at 573 nm for time point 0. The solutions were then incubated at the
temperature for the experiment and the absorption recorded at set time points. All UV-vis
experiments were performed in a Varian Cary 5000 spectrometer and elevated temperature
runs were also performed in this with a Varian Cary temperature controller.
105
Seperation of the iron cylinder enantiomers
A slurry of Cellulose powder (Sigma Aldrich – column chromatography grade) (8.00g) and
0.2M NaCl solution (45 mL) was stirred into a beaker before being added to a 2x40 cm
sintered glass column. Bellows were used to apply pressure to pack the cellulose in the
column. Approximately 20 mL of extra 0.2M NaCl solution was added over the next hour to
ensure the cellulose never went dry during the packing process. Once the cellulose was fully
packed and the top of the cellulose was exposed. [Fe2L3]4+ (0.05g) was dissolved in 0.2M
NaCl solution (0.75 mL). Using a glass pipette, the sample solution was very carefully loaded
onto the cellulose, ensuring no sample was accidently applied to the sides of the glass.
Pressure was then applied to push all the sample solution into the cellulose and re-expose the
top. Approximately 3 cm of sand was then added to protect the top of the cellulose. 0.2 NaCl
solution can then be freely added to fully eluate the column under pressure. Two purple bands
could be visibly distinguished and were collected as two separate fractions. The fractions
were then freeze dried, re-dissolved in methanol and de-salted separately through a G25
Sephadex column using methanol as the eluent. The samples were then taken to dryness in
vacuo. Column was repeated until enantiomer samples of sufficient purity were observed by
CD and chiral shift reagent NMR
Circular Dichroism of enantiomers
Each enantiomer was dissolved in 50mM Tris.HCl buffer (pH 8.0) to a concentration of 15
µM as established by UV-Vis at 573 nm (ε=16900) and placed inside a 1 cm path length
cuvette (starna). A Chirascan plus spectrometer (Applied Photophysics) was then used to scan
the cuvette using the following parameters; Mode: Circular Dichroism in millidegrees,
106
Bandwidth: 1 nm, Response: 1 secs, Temperature: 25oC, accumulations: 4, Wavelength range
200-800 nm. Data was collected and the 4 accumulations averaged to provide the presented
spectra.
1H NMR of enantiomers with ∆-TRISPHAT
Enantiomers M and P along with a racemic mixture were dissolved to a concentration of 500
µM in MeOD (0.75 mL, Cambridge isotope labs). ∆-TRISPHAT tetrabutylammonium salt
(sigma) (0.38 mgs) was then added to each sample to produce a molar ratio of 1:1. The NMR
was run on an AVII-300 300 mHZ NMR.
107
2.5 References
1. I. Meistermann, V. Moreno, M.J. Prieto, E. Moldrheim, E. Sletten, S. Khalid, P.M. Rodger, J.C.
Peberdy, C.J. Isaac, A. Rodger, and M.J. Hannon, Intramolecular DNA coiling mediated by
metallo-supramolecular cylinders: differential binding of P and M helical enantiomers.
Proceedings of the National Academy of Sciences of the United States of America, 2002.
99(8): p. 5069-74.
2. L. Cerasino, M.J. Hannon, and E. Sletten, DNA Three-Way Junction with a Dinuclear Iron(II)
Supramolecular Helicate at the Center: A NMR Structural Study. Inorganic Chemistry, 2007.
46(16): p. 6245-6251.
3. M.J. Hannon, V. Moreno, M.J. Prieto, E. Moldrheim, E. Sletten, I. Meistermann, C.J. Isaac, K.J.
Sanders, and A. Rodger, Intramolecular DNA Coiling Mediated by a Metallo-Supramolecular
Cylinder. Angewandte Chemie, 2001. 113(5): p. 903-908.
4. M.J. Hannon, V. Moreno, M.J. Prieto, E. Moldrheim, E. Sletten, I. Meistermann, C.J. Isaac, K.J.
Sanders, and A. Rodger, Intramolecular DNA Coiling Mediated by a Metallo-Supramolecular
Cylinder. Angewandte Chemie International Edition, 2001. 40(5): p. 879-884.
5. G.I. Pascu, A.C.G. Hotze, C. Sanchez-Cano, B.M. Kariuki, and M.J. Hannon, Dinuclear
Ruthenium(II) Triple-Stranded Helicates: Luminescent Supramolecular Cylinders That Bind and
Coil DNA and Exhibit Activity against Cancer Cell Lines. Angewandte Chemie, 2007. 119(23):
p. 4452-4456.
6. A.C.G. Hotze, N.J. Hodges, R.E. Hayden, C. Sanchez-Cano, C. Paines, N. Male, M.-K. Tse, C.M.
Bunce, J.K. Chipman, and M.J. Hannon, Supramolecular Iron Cylinder with Unprecedented
DNA Binding Is a Potent Cytostatic and Apoptotic Agent without Exhibiting Genotoxicity.
Chemistry & Biology, 2008. 15(12): p. 1258-1267.
108
7. J. Malina, M.J. Hannon, and V. Brabec, Interaction of Dinuclear Ruthenium(II) Supramolecular
Cylinders with DNA: Sequence-Specific Binding, Unwinding, and Photocleavage. Chemistry – A
European Journal, 2008. 14(33): p. 10408-10414.
8. J. Malina, M.J. Hannon, and V. Brabec, Recognition of DNA bulges by dinuclear iron(II)
metallosupramolecular helicates. FEBS Journal, 2014. 281(4): p. 987-997.
9. J.M.C.A. Kerckhoffs, J.C. Peberdy, I. Meistermann, L.J. Childs, C.J. Isaac, C.R. Pearmund, V.
Reudegger, S. Khalid, N.W. Alcock, M.J. Hannon, and A. Rodger, Enantiomeric resolution of
supramolecular helicates with different surface topographies. Dalton Transactions, 2007(7):
p. 734-742.
10. M.J. Hannon, I. Meistermann, C.J. Isaac, C. Blomme, J.R. Aldrich-Wright, and A. Rodger,
Paper: a cheap yet effective chiral stationary phase for chromatographic resolution of
metallo-supramolecular helicates. Chemical Communications, 2001(12): p. 1078-1079.
11. I. Meistermann, V. Moreno, M.J. Prieto, E. Moldrheim, E. Sletten, S. Khalid, P.M. Rodger, J.C.
Peberdy, C.J. Isaac, A. Rodger, and M.J. Hannon, Intramolecular DNA coiling mediated by
metallo-supramolecular cylinders: Differential binding of P and M helical enantiomers.
Proceedings of the National Academy of Sciences of the United States of America, 2002.
99(8): p. 5069-5074.
12. A. Oleksi, A.G. Blanco, R. Boer, I. Usón, J. Aymamí, A. Rodger, M.J. Hannon, and M. Coll, Cover
Picture: Molecular Recognition of a Three-Way DNA Junction by a Metallosupramolecular
Helicate (Angew. Chem. Int. Ed. 8/2006). Angewandte Chemie International Edition, 2006.
45(8): p. 1167-1167.
13. R.P. Goodman, R.M. Berry, and A.J. Turberfield, The single-step synthesis of a DNA
tetrahedron. Chemical Communications, 2004(12): p. 1372-1373.
14. C.M. Erben, R.P. Goodman, and A.J. Turberfield, Single-molecule protein encapsulation in a
rigid DNA cage. Angewandte Chemie International Edition, 2006. 45(44): p. 7414-7.
109
15. A.S. Walsh, H. Yin, C.M. Erben, M.J.A. Wood, and A.J. Turberfield, DNA Cage Delivery to
Mammalian Cells. ACS Nano, 2011. 5(7): p. 5427-5432.
16. J. Malina, M.J. Hannon, and V. Brabec, Recognition of DNA Three-Way Junctions by
Metallosupramolecular Cylinders: Gel Electrophoresis Studies. Chemistry – A European
Journal, 2007. 13(14): p. 3871-3877.
17. A. Rath, M. Glibowicka, V.G. Nadeau, G. Chen, and C.M. Deber, Detergent binding explains
anomalous SDS-PAGE migration of membrane proteins. Proceedings of the National Academy
of Sciences of the United States of America, 2009. 106(6): p. 1760-5.
18. S.F. Zakharov, H.T. Chang, and A. Chrambach, Reproducibility of mobility in gel
electrophoresis. Electrophoresis, 1996. 17(1): p. 84-90.
19. J.L. Kadrmas, A.J. Ravin, and N.B. Leontis, Relative stabilities of DNA three-way, four-way and
five-way junctions (multi-helix junction loops): unpaired nucleotides can be stabilizing or
destabilizing. Nucleic Acids Research, 1995. 23(12): p. 2212-2222.
20. Y. He, T. Ye, M. Su, C. Zhang, A.E. Ribbe, W. Jiang, and C. Mao, Hierarchical self-assembly of
DNA into symmetric supramolecular polyhedra. Nature, 2008. 452(7184): p. 198-201.
21. K.R. Kim, D.R. Kim, T. Lee, J.Y. Yhee, B.S. Kim, I.C. Kwon, and D.R. Ahn, Drug delivery by a self-
assembled DNA tetrahedron for overcoming drug resistance in breast cancer cells. Chemical
Communications, 2013. 49(20): p. 2010-2012.
22. A. Trache and G.A. Meininger, Atomic force microscopy (AFM). Current Protocol
Microbiology, 2008. 2(2).
23. A. Engel, Y. Lyubchenko, and D. Müller, Atomic force microscopy: a powerful tool to observe
biomolecules at work. Trends in Cell Biology, 1999. 9(2): p. 77-80.
24. B. Franck, Optical Circular Dichroism. Principles, Measurements, and Applications. Von L.
Velluz, M. Legrand und M. Grosjean, übers. von J. MacCordick. Verlag Chemie GmbH.,
110
Weinheim/Bergstr., und Academic Press, New York-London, 1965. XII, 247 S., 149 Abb., 10
Tab., geb. DM 40.–. Angewandte Chemie, 1965. 77(19): p. 875-875.
25. J. Lacour, C. Ginglinger, F. Favarger, and S. Torche-Haldimann, Application of TRISPHAT anion
as NMR chiral shift reagent. Chemical Communications, 1997(23): p. 2285-2286.
26. T.M. Ou, Y.J. Lu, J.H. Tan, Z.S. Huang, K.Y. Wong, and L.Q. Gu, G-quadruplexes: Targets in
anticancer drug design. Chemmedchem, 2008. 3(5): p. 690-713.
27. J.L. Huppert, Four-stranded DNA: cancer, gene regulation and drug development.
Philosophical Transactions of the Royal Society A: Mathematical, Physical and Engineering
Sciences, 2007. 365(1861): p. 2969-2984.
28. J. Malina, M.J. Hannon, and V. Brabec, Iron(II) supramolecular helicates interfere with the
HIV-1 Tat–TAR RNA interaction critical for viral replication. Scientific Reports, 2016. 6: p.
29674.
111
Chapter 3
Biological Activity of the Iron Cylinder-DNA Tetrahedron
conjugate
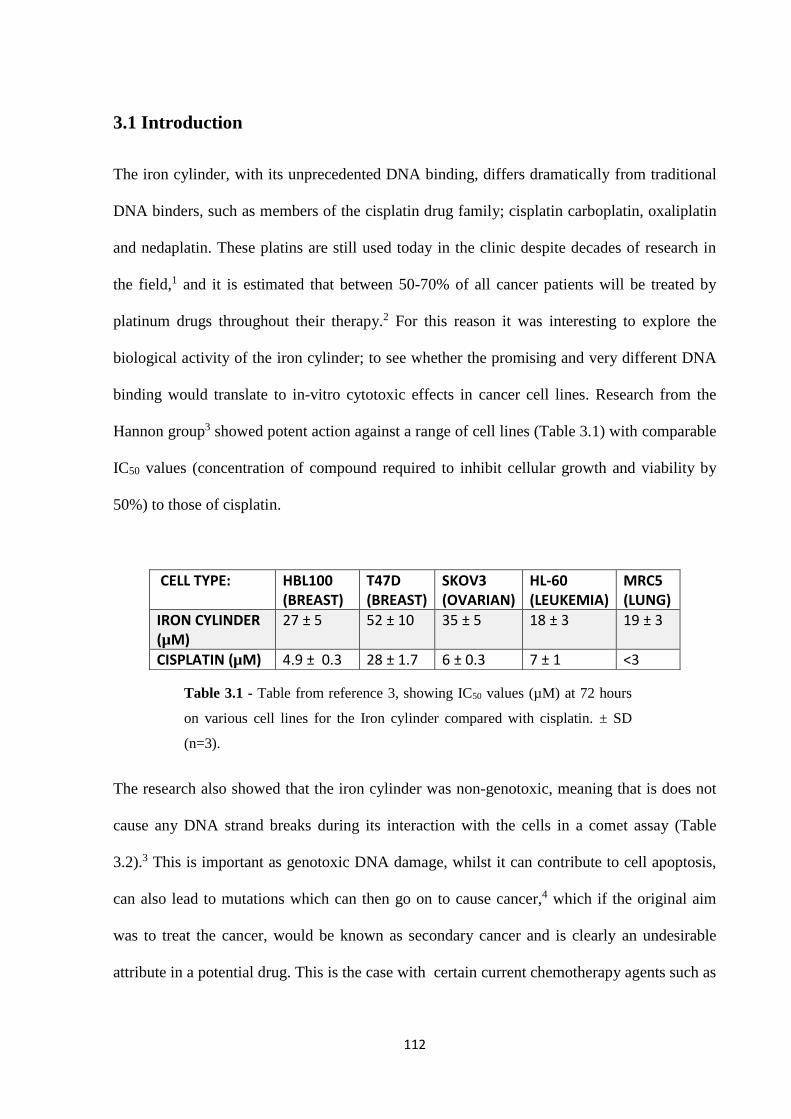
112
3.1 Introduction
The iron cylinder, with its unprecedented DNA binding, differs dramatically from traditional
DNA binders, such as members of the cisplatin drug family; cisplatin carboplatin, oxaliplatin
and nedaplatin. These platins are still used today in the clinic despite decades of research in
the field,1 and it is estimated that between 50-70% of all cancer patients will be treated by
platinum drugs throughout their therapy.2 For this reason it was interesting to explore the
biological activity of the iron cylinder; to see whether the promising and very different DNA
binding would translate to in-vitro cytotoxic effects in cancer cell lines. Research from the
Hannon group3 showed potent action against a range of cell lines (Table 3.1) with comparable
IC50 values (concentration of compound required to inhibit cellular growth and viability by
50%) to those of cisplatin.
The research also showed that the iron cylinder was non-genotoxic, meaning that is does not
cause any DNA strand breaks during its interaction with the cells in a comet assay (Table
3.2).3 This is important as genotoxic DNA damage, whilst it can contribute to cell apoptosis,
can also lead to mutations which can then go on to cause cancer,4 which if the original aim
was to treat the cancer, would be known as secondary cancer and is clearly an undesirable
attribute in a potential drug. This is the case with certain current chemotherapy agents such as
CELL TYPE: HBL100 (BREAST)
T47D (BREAST)
SKOV3 (OVARIAN)
HL-60 (LEUKEMIA)
MRC5 (LUNG)
IRON CYLINDER (µM)
27 ± 5 52 ± 10 35 ± 5 18 ± 3 19 ± 3
CISPLATIN (µM) 4.9 ± 0.3 28 ± 1.7 6 ± 0.3 7 ± 1 <3
Table 3.1 - Table from reference 3, showing IC50 values (µM) at 72 hours
on various cell lines for the Iron cylinder compared with cisplatin. ± SD
(n=3).

113
cisplatin5 and gemcitabine (a cytidine analogue).6 Overall, the iron cylinder was shown to
have very interesting biological activity.
IRON CYLINDER (µM)
MRC5 (LUNG)
HBL100 (BREAST)
HL-60 (LEUKEMIA)
0 1.43 ± 0.82 4.89 ± 3.84 0.27 ± 0.15
5 2.18 ± 0.12 8.93 ± 4.07 0.40 ± 0.51
10 2.54 ± 0.47 6.16 ± 4.41 0.39 ± 0.47
15 2.31 ± 0.57 6.29 ± 4.17 0.45 ± 0.39
20 1.86 ± 0.44 6.48 ± 2.46 1.95 ± 2.33
25 2.32 ± 0.22 ND ND
The previous chapter focussed on the interaction between the iron cylinder and DNA
tetrahedron. The tetrahedron itself has also been reported to have interesting biological
properties in that it is readily taken up by cells.7 This led to proposals suggesting that the
DNA tetrahedron could be used for drug delivery applications due to its hollow central cavity
able to hold a cargo, such as the protein cytochrome c (Figure 3.1A),8 or a single transcription
protein (figure 3.1B).9 Successful drug delivery of doxorubicin has been reported with the
DNA tetrahedron,10 which was reported to overcome drug resistance due to an altered uptake
mechanism which meant developed cellular metabolism resistance was by-passed. With these
interesting biological properties, it would be interesting to study the combined biological
effects of the cylinder-tetrahedron conjugate.
Table 3.2 - Table from reference 3. The results represent tail DNA % ± SD (n = 3) of
three independent experiments. There was no statistically significant effect of cylinder
treatment (24 hr) at any of the concentrations investigated in any cell line studied. ND,
not determined because 25 μM, 24 hr was toxic to these cell lines.
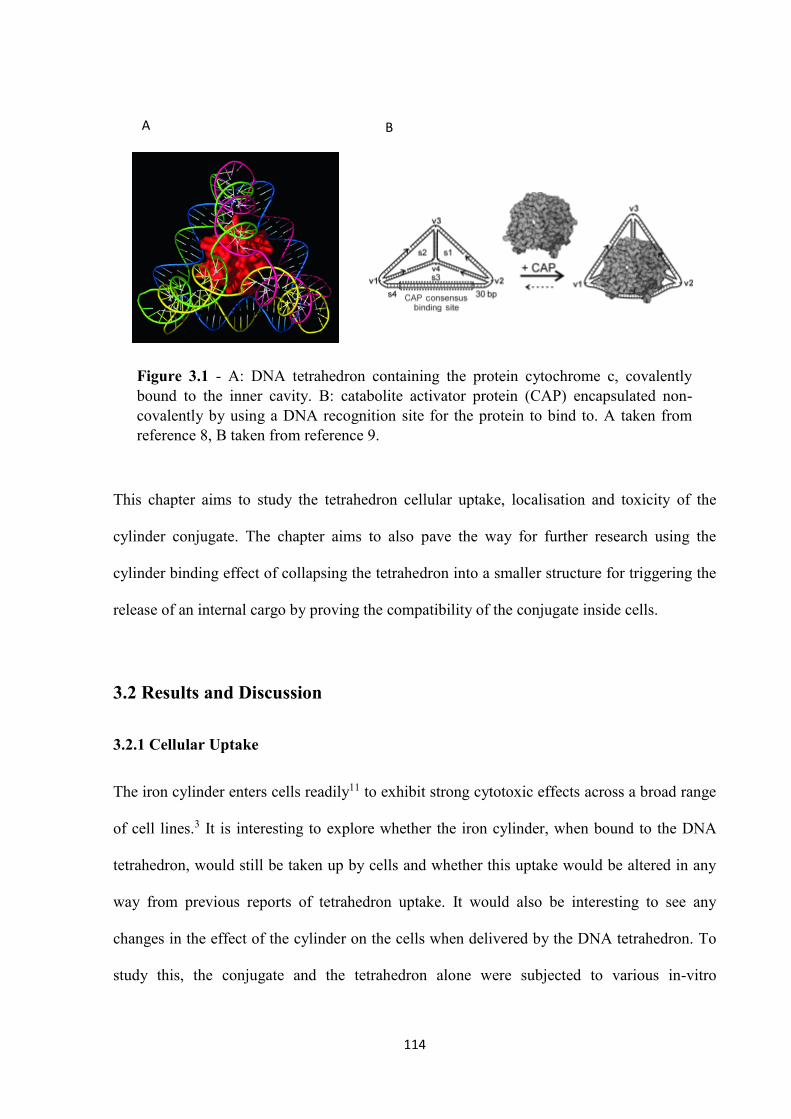
114
This chapter aims to study the tetrahedron cellular uptake, localisation and toxicity of the
cylinder conjugate. The chapter aims to also pave the way for further research using the
cylinder binding effect of collapsing the tetrahedron into a smaller structure for triggering the
release of an internal cargo by proving the compatibility of the conjugate inside cells.
3.2 Results and Discussion
3.2.1 Cellular Uptake
The iron cylinder enters cells readily11 to exhibit strong cytotoxic effects across a broad range
of cell lines.3 It is interesting to explore whether the iron cylinder, when bound to the DNA
tetrahedron, would still be taken up by cells and whether this uptake would be altered in any
way from previous reports of tetrahedron uptake. It would also be interesting to see any
changes in the effect of the cylinder on the cells when delivered by the DNA tetrahedron. To
study this, the conjugate and the tetrahedron alone were subjected to various in-vitro
A B
Figure 3.1 - A: DNA tetrahedron containing the protein cytochrome c, covalently bound to the inner cavity. B: catabolite activator protein (CAP) encapsulated non-covalently by using a DNA recognition site for the protein to bind to. A taken from reference 8, B taken from reference 9.
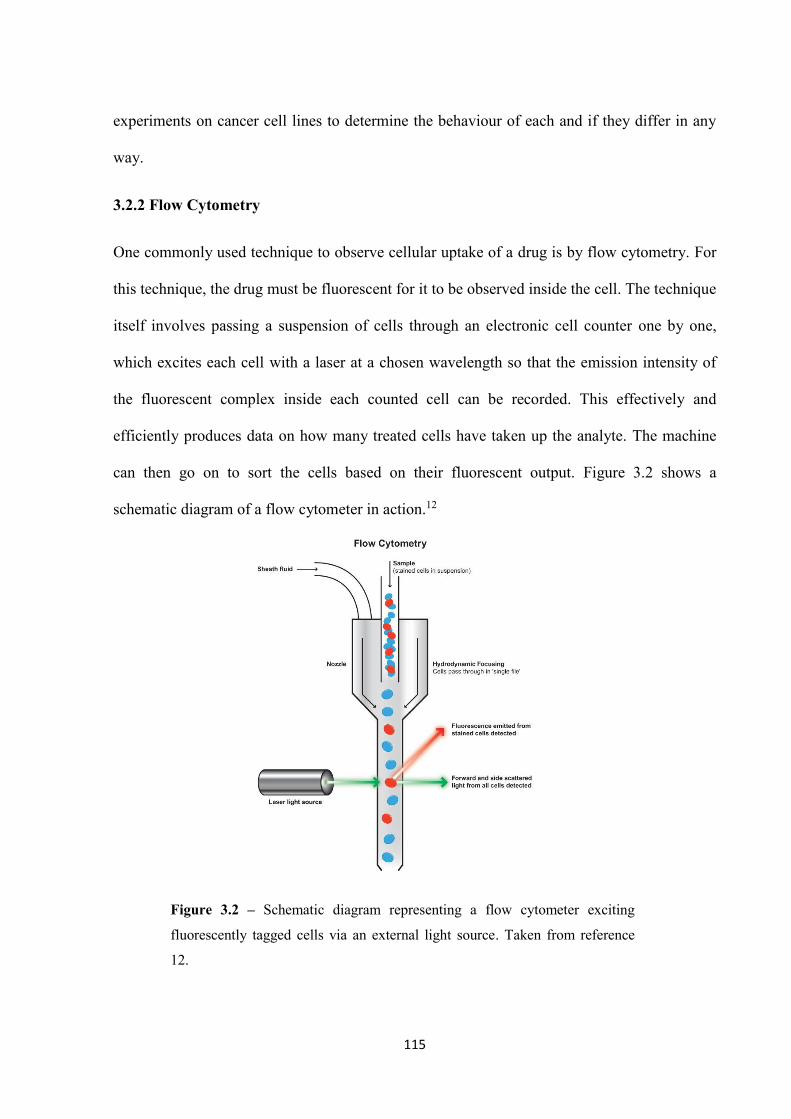
115
experiments on cancer cell lines to determine the behaviour of each and if they differ in any
way.
3.2.2 Flow Cytometry
One commonly used technique to observe cellular uptake of a drug is by flow cytometry. For
this technique, the drug must be fluorescent for it to be observed inside the cell. The technique
itself involves passing a suspension of cells through an electronic cell counter one by one,
which excites each cell with a laser at a chosen wavelength so that the emission intensity of
the fluorescent complex inside each counted cell can be recorded. This effectively and
efficiently produces data on how many treated cells have taken up the analyte. The machine
can then go on to sort the cells based on their fluorescent output. Figure 3.2 shows a
schematic diagram of a flow cytometer in action.12
Figure 3.2 – Schematic diagram representing a flow cytometer exciting
fluorescently tagged cells via an external light source. Taken from reference
12.
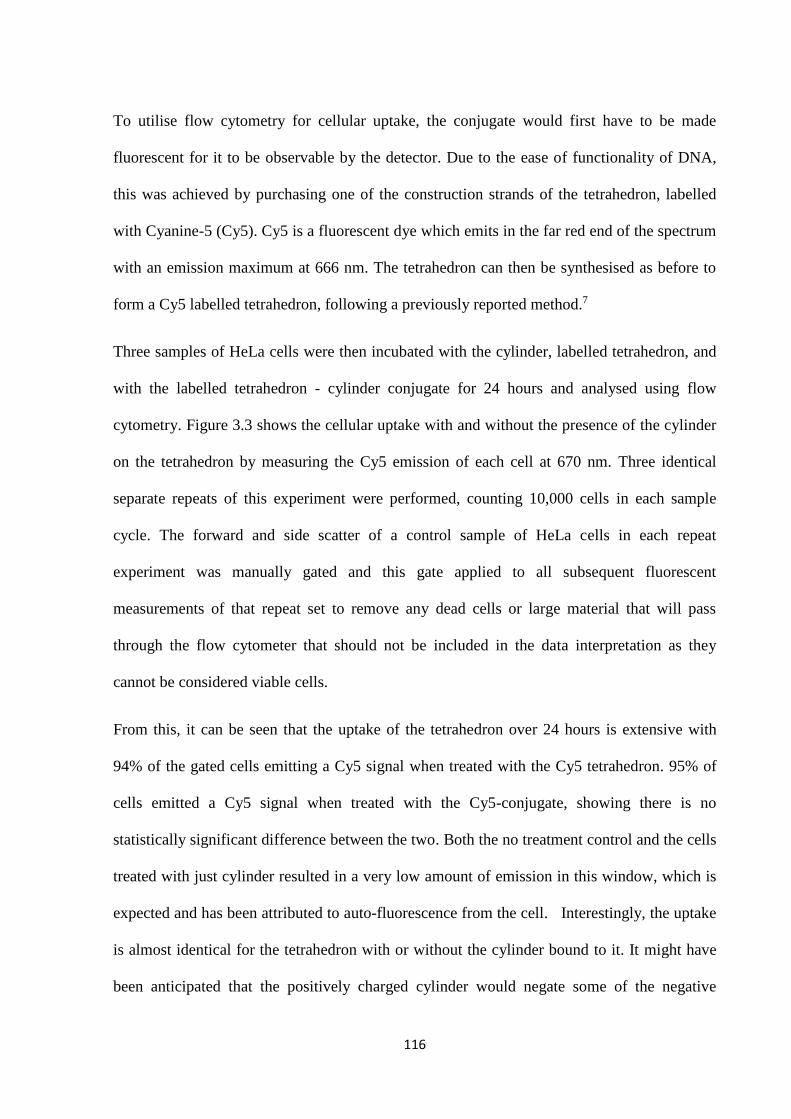
116
To utilise flow cytometry for cellular uptake, the conjugate would first have to be made
fluorescent for it to be observable by the detector. Due to the ease of functionality of DNA,
this was achieved by purchasing one of the construction strands of the tetrahedron, labelled
with Cyanine-5 (Cy5). Cy5 is a fluorescent dye which emits in the far red end of the spectrum
with an emission maximum at 666 nm. The tetrahedron can then be synthesised as before to
form a Cy5 labelled tetrahedron, following a previously reported method.7
Three samples of HeLa cells were then incubated with the cylinder, labelled tetrahedron, and
with the labelled tetrahedron - cylinder conjugate for 24 hours and analysed using flow
cytometry. Figure 3.3 shows the cellular uptake with and without the presence of the cylinder
on the tetrahedron by measuring the Cy5 emission of each cell at 670 nm. Three identical
separate repeats of this experiment were performed, counting 10,000 cells in each sample
cycle. The forward and side scatter of a control sample of HeLa cells in each repeat
experiment was manually gated and this gate applied to all subsequent fluorescent
measurements of that repeat set to remove any dead cells or large material that will pass
through the flow cytometer that should not be included in the data interpretation as they
cannot be considered viable cells.
From this, it can be seen that the uptake of the tetrahedron over 24 hours is extensive with
94% of the gated cells emitting a Cy5 signal when treated with the Cy5 tetrahedron. 95% of
cells emitted a Cy5 signal when treated with the Cy5-conjugate, showing there is no
statistically significant difference between the two. Both the no treatment control and the cells
treated with just cylinder resulted in a very low amount of emission in this window, which is
expected and has been attributed to auto-fluorescence from the cell. Interestingly, the uptake
is almost identical for the tetrahedron with or without the cylinder bound to it. It might have
been anticipated that the positively charged cylinder would negate some of the negative
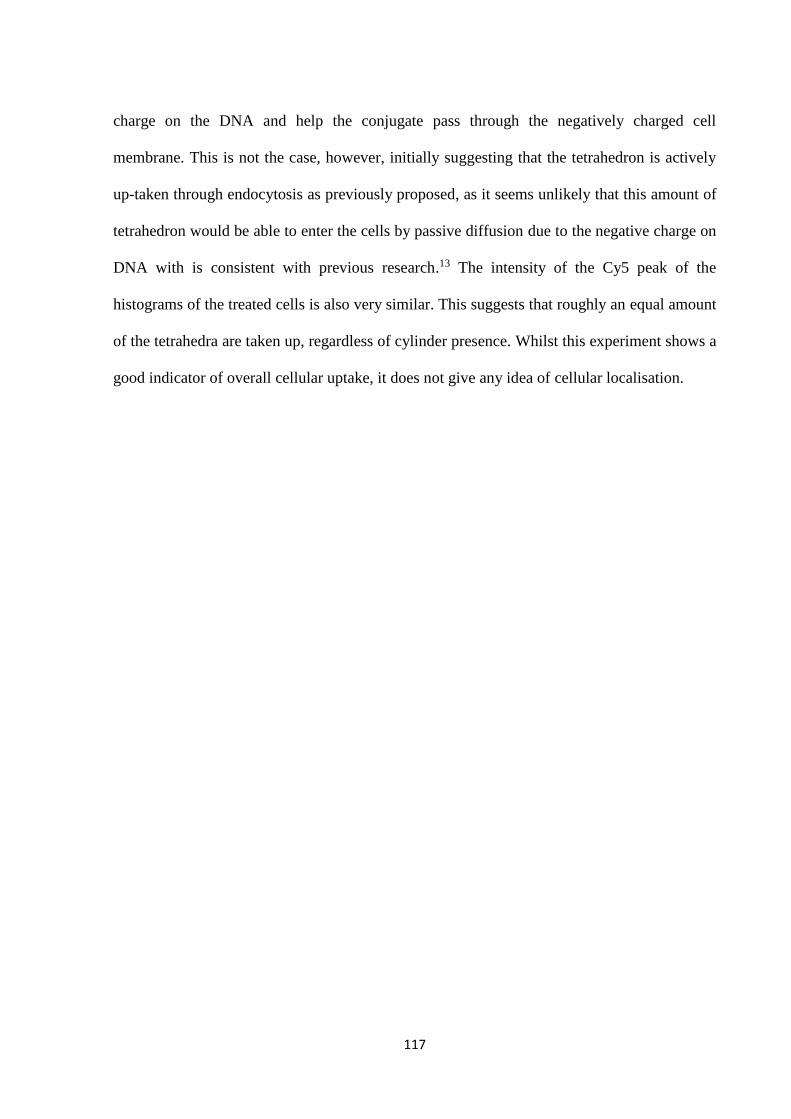
117
charge on the DNA and help the conjugate pass through the negatively charged cell
membrane. This is not the case, however, initially suggesting that the tetrahedron is actively
up-taken through endocytosis as previously proposed, as it seems unlikely that this amount of
tetrahedron would be able to enter the cells by passive diffusion due to the negative charge on
DNA with is consistent with previous research.13 The intensity of the Cy5 peak of the
histograms of the treated cells is also very similar. This suggests that roughly an equal amount
of the tetrahedra are taken up, regardless of cylinder presence. Whilst this experiment shows a
good indicator of overall cellular uptake, it does not give any idea of cellular localisation.
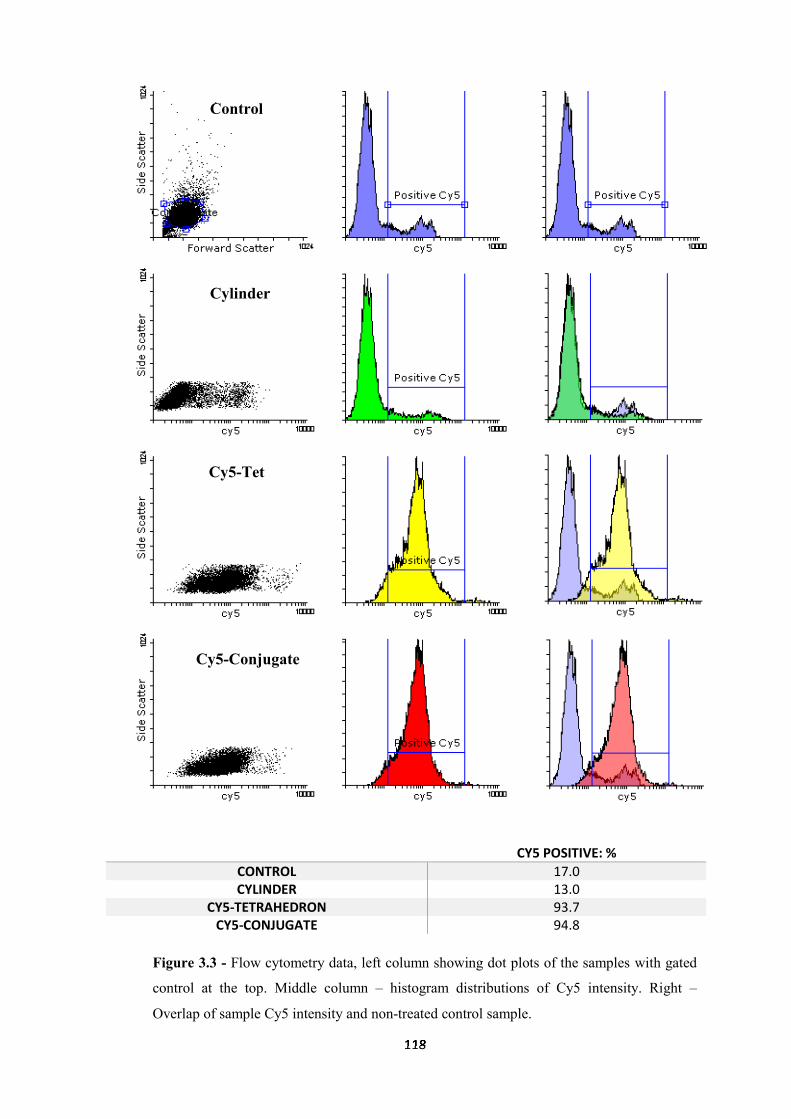
118
118
Figure 3.3 - Flow cytometry data, left column showing dot plots of the samples with gated
control at the top. Middle column – histogram distributions of Cy5 intensity. Right –
Overlap of sample Cy5 intensity and non-treated control sample.
CY5 POSITIVE: %
CONTROL 17.0 CYLINDER 13.0
CY5-TETRAHEDRON 93.7 CY5-CONJUGATE 94.8
Control
Cylinder
Control
Cy5-Tet
Control
Cy5-Conjugate
Control
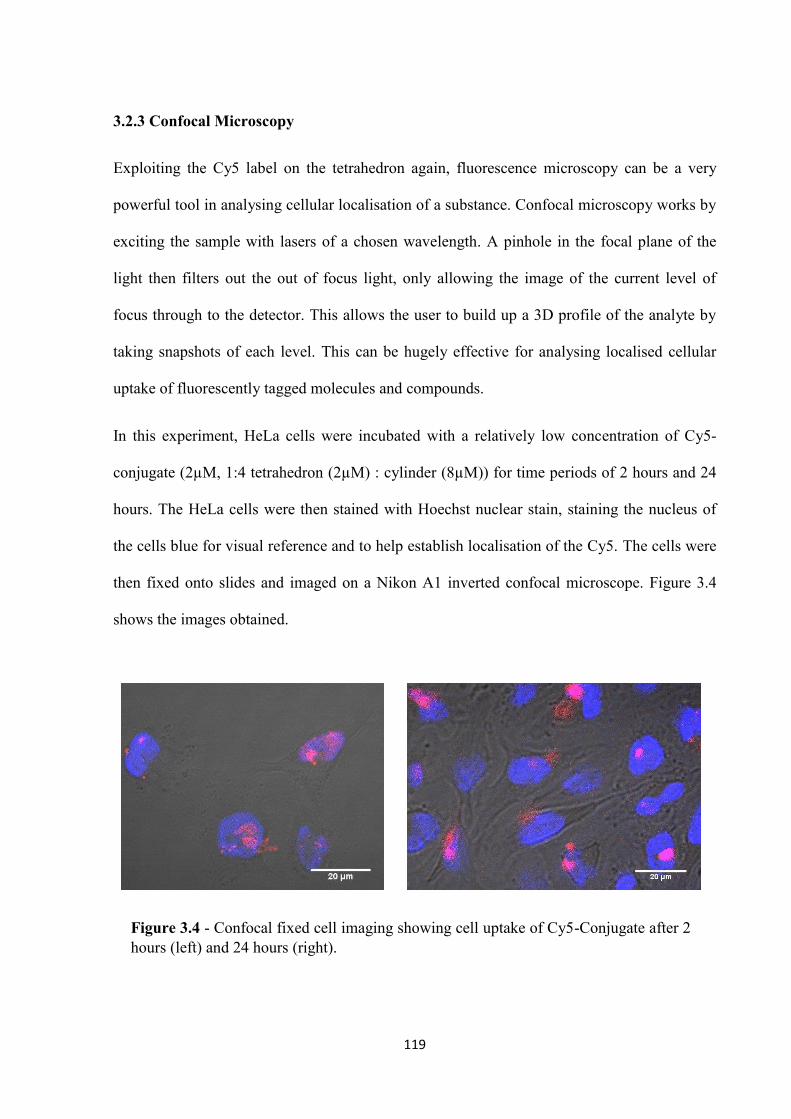
119
3.2.3 Confocal Microscopy
Exploiting the Cy5 label on the tetrahedron again, fluorescence microscopy can be a very
powerful tool in analysing cellular localisation of a substance. Confocal microscopy works by
exciting the sample with lasers of a chosen wavelength. A pinhole in the focal plane of the
light then filters out the out of focus light, only allowing the image of the current level of
focus through to the detector. This allows the user to build up a 3D profile of the analyte by
taking snapshots of each level. This can be hugely effective for analysing localised cellular
uptake of fluorescently tagged molecules and compounds.
In this experiment, HeLa cells were incubated with a relatively low concentration of Cy5-
conjugate (2µM, 1:4 tetrahedron (2µM) : cylinder (8µM)) for time periods of 2 hours and 24
hours. The HeLa cells were then stained with Hoechst nuclear stain, staining the nucleus of
the cells blue for visual reference and to help establish localisation of the Cy5. The cells were
then fixed onto slides and imaged on a Nikon A1 inverted confocal microscope. Figure 3.4
shows the images obtained.
Figure 3.4 - Confocal fixed cell imaging showing cell uptake of Cy5-Conjugate after 2 hours (left) and 24 hours (right).
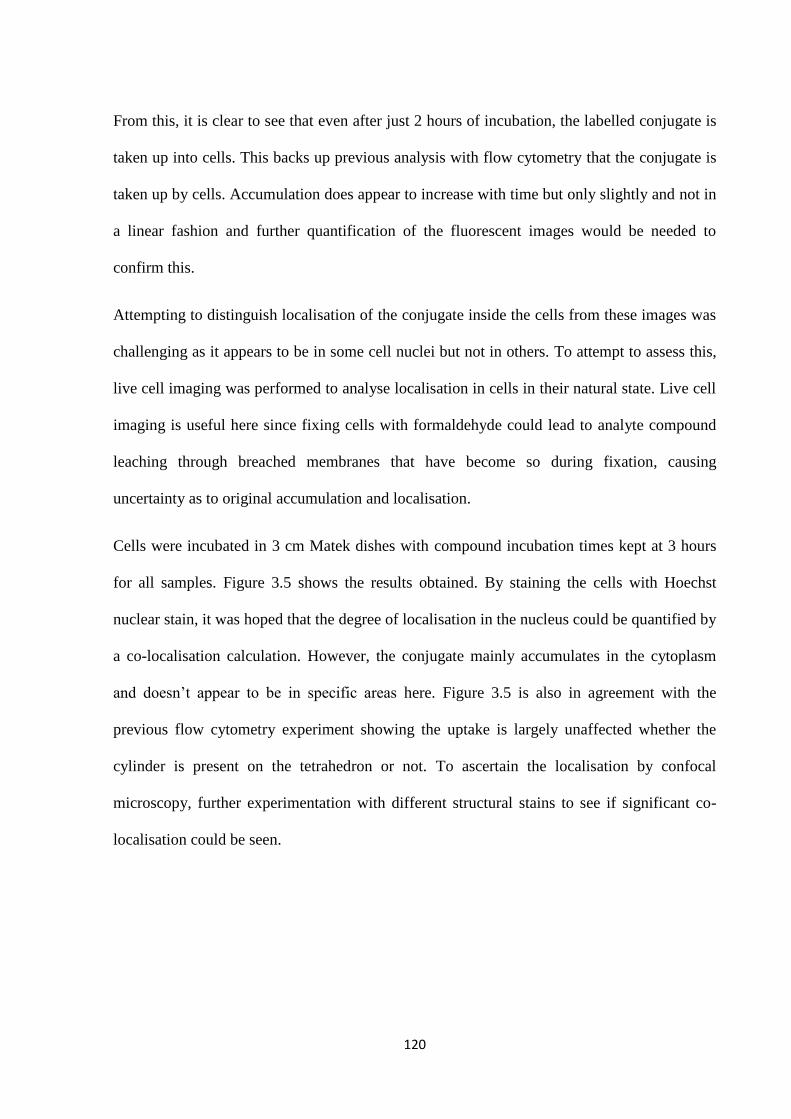
120
From this, it is clear to see that even after just 2 hours of incubation, the labelled conjugate is
taken up into cells. This backs up previous analysis with flow cytometry that the conjugate is
taken up by cells. Accumulation does appear to increase with time but only slightly and not in
a linear fashion and further quantification of the fluorescent images would be needed to
confirm this.
Attempting to distinguish localisation of the conjugate inside the cells from these images was
challenging as it appears to be in some cell nuclei but not in others. To attempt to assess this,
live cell imaging was performed to analyse localisation in cells in their natural state. Live cell
imaging is useful here since fixing cells with formaldehyde could lead to analyte compound
leaching through breached membranes that have become so during fixation, causing
uncertainty as to original accumulation and localisation.
Cells were incubated in 3 cm Matek dishes with compound incubation times kept at 3 hours
for all samples. Figure 3.5 shows the results obtained. By staining the cells with Hoechst
nuclear stain, it was hoped that the degree of localisation in the nucleus could be quantified by
a co-localisation calculation. However, the conjugate mainly accumulates in the cytoplasm
and doesn’t appear to be in specific areas here. Figure 3.5 is also in agreement with the
previous flow cytometry experiment showing the uptake is largely unaffected whether the
cylinder is present on the tetrahedron or not. To ascertain the localisation by confocal
microscopy, further experimentation with different structural stains to see if significant co-
localisation could be seen.
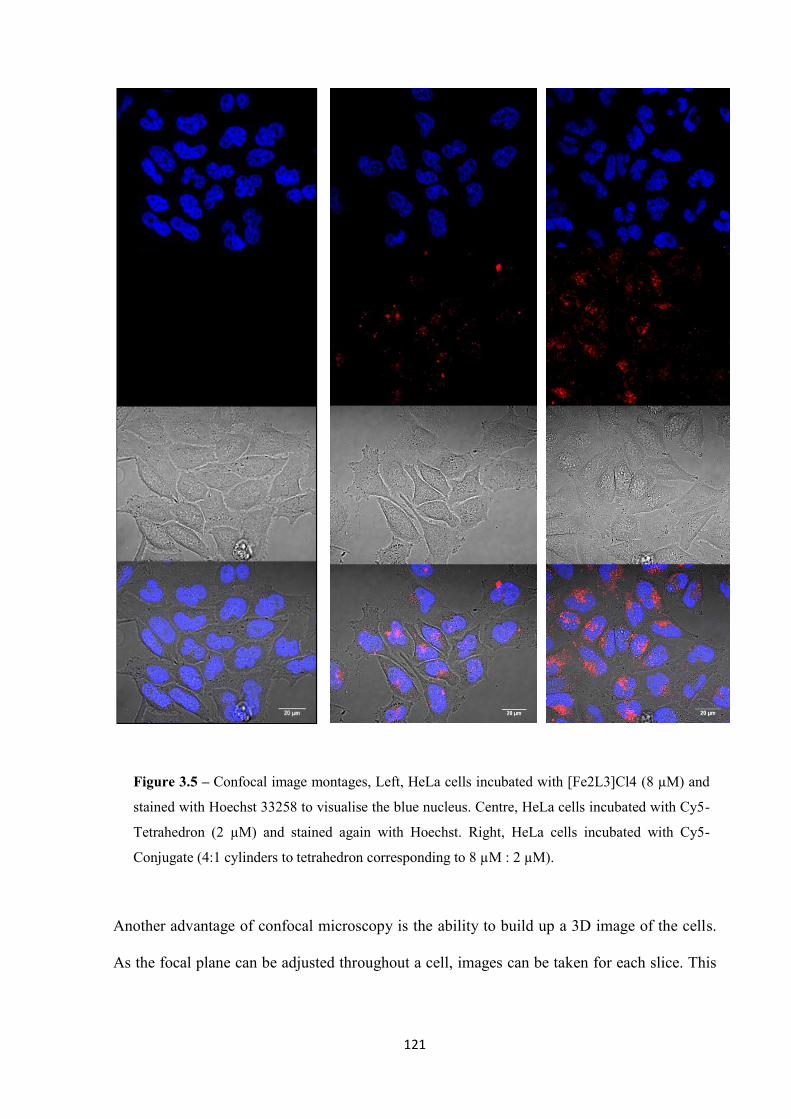
121
Another advantage of confocal microscopy is the ability to build up a 3D image of the cells.
As the focal plane can be adjusted throughout a cell, images can be taken for each slice. This
Figure 3.5 – Confocal image montages, Left, HeLa cells incubated with [Fe2L3]Cl4 (8 µM) and
stained with Hoechst 33258 to visualise the blue nucleus. Centre, HeLa cells incubated with Cy5-
Tetrahedron (2 µM) and stained again with Hoechst. Right, HeLa cells incubated with Cy5-
Conjugate (4:1 cylinders to tetrahedron corresponding to 8 µM : 2 µM).
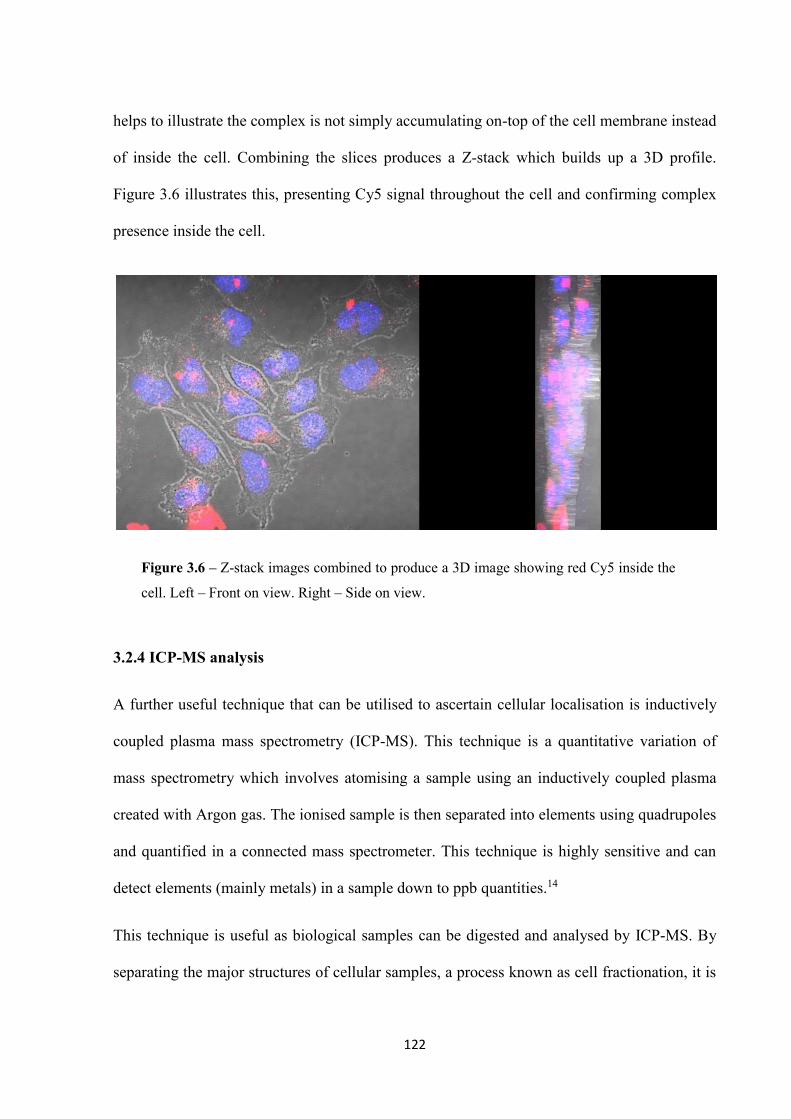
122
helps to illustrate the complex is not simply accumulating on-top of the cell membrane instead
of inside the cell. Combining the slices produces a Z-stack which builds up a 3D profile.
Figure 3.6 illustrates this, presenting Cy5 signal throughout the cell and confirming complex
presence inside the cell.
3.2.4 ICP-MS analysis
A further useful technique that can be utilised to ascertain cellular localisation is inductively
coupled plasma mass spectrometry (ICP-MS). This technique is a quantitative variation of
mass spectrometry which involves atomising a sample using an inductively coupled plasma
created with Argon gas. The ionised sample is then separated into elements using quadrupoles
and quantified in a connected mass spectrometer. This technique is highly sensitive and can
detect elements (mainly metals) in a sample down to ppb quantities.14
This technique is useful as biological samples can be digested and analysed by ICP-MS. By
separating the major structures of cellular samples, a process known as cell fractionation, it is
Figure 3.6 – Z-stack images combined to produce a 3D image showing red Cy5 inside the
cell. Left – Front on view. Right – Side on view.
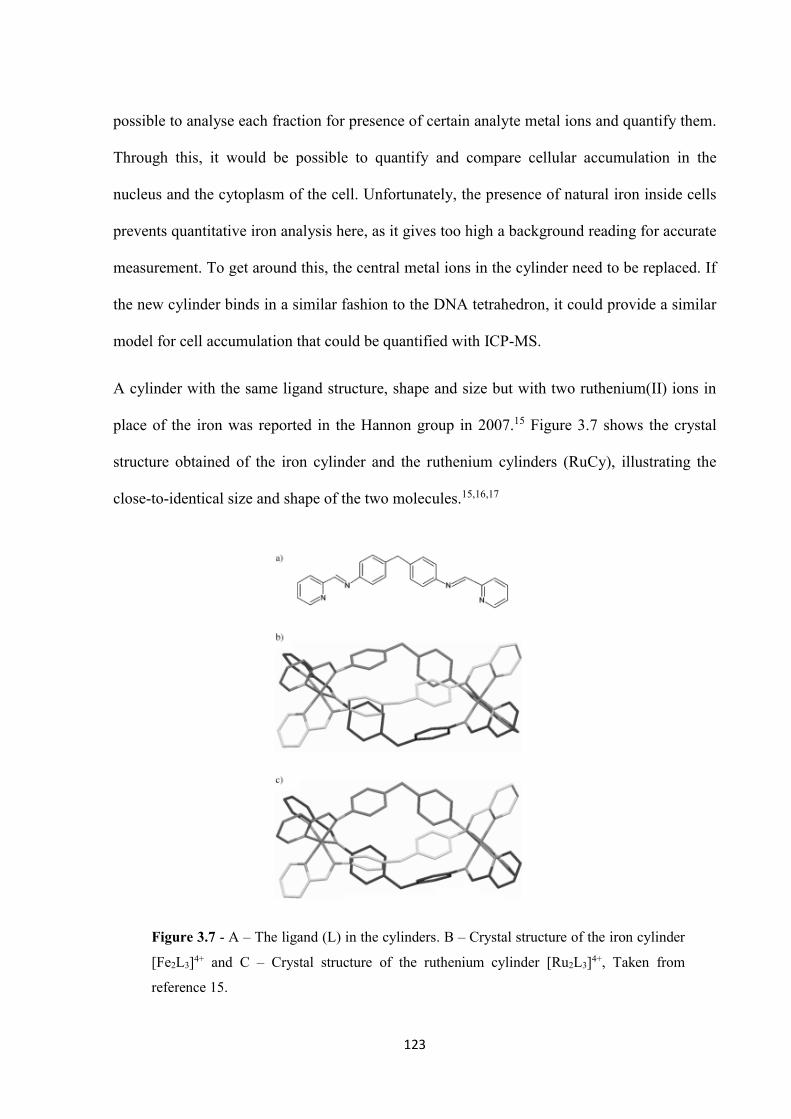
123
possible to analyse each fraction for presence of certain analyte metal ions and quantify them.
Through this, it would be possible to quantify and compare cellular accumulation in the
nucleus and the cytoplasm of the cell. Unfortunately, the presence of natural iron inside cells
prevents quantitative iron analysis here, as it gives too high a background reading for accurate
measurement. To get around this, the central metal ions in the cylinder need to be replaced. If
the new cylinder binds in a similar fashion to the DNA tetrahedron, it could provide a similar
model for cell accumulation that could be quantified with ICP-MS.
A cylinder with the same ligand structure, shape and size but with two ruthenium(II) ions in
place of the iron was reported in the Hannon group in 2007.15 Figure 3.7 shows the crystal
structure obtained of the iron cylinder and the ruthenium cylinders (RuCy), illustrating the
close-to-identical size and shape of the two molecules.15,16,17
Figure 3.7 - A – The ligand (L) in the cylinders. B – Crystal structure of the iron cylinder
[Fe2L3]4+ and C – Crystal structure of the ruthenium cylinder [Ru2L3]4+, Taken from
reference 15.
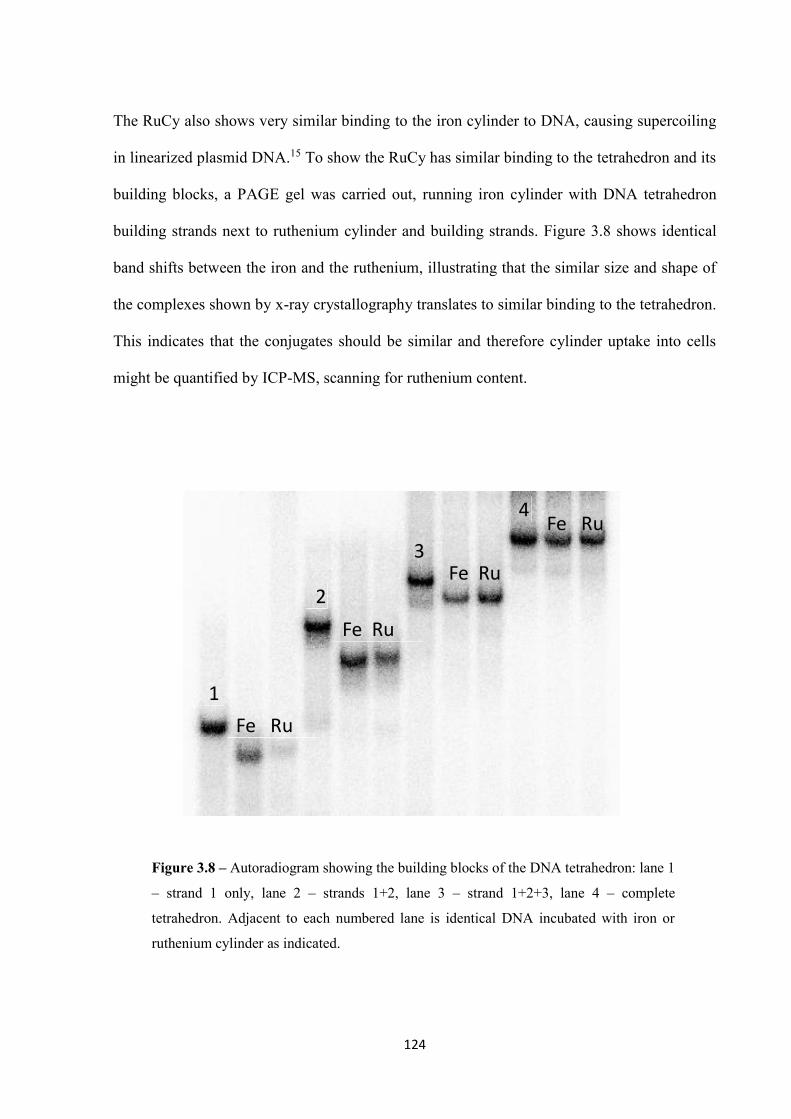
124
The RuCy also shows very similar binding to the iron cylinder to DNA, causing supercoiling
in linearized plasmid DNA.15 To show the RuCy has similar binding to the tetrahedron and its
building blocks, a PAGE gel was carried out, running iron cylinder with DNA tetrahedron
building strands next to ruthenium cylinder and building strands. Figure 3.8 shows identical
band shifts between the iron and the ruthenium, illustrating that the similar size and shape of
the complexes shown by x-ray crystallography translates to similar binding to the tetrahedron.
This indicates that the conjugates should be similar and therefore cylinder uptake into cells
might be quantified by ICP-MS, scanning for ruthenium content.
Fe Ru
Fe Ru
Fe Ru
Fe Ru
1
2
3
4
Figure 3.8 – Autoradiogram showing the building blocks of the DNA tetrahedron: lane 1
– strand 1 only, lane 2 – strands 1+2, lane 3 – strand 1+2+3, lane 4 – complete
tetrahedron. Adjacent to each numbered lane is identical DNA incubated with iron or
ruthenium cylinder as indicated.
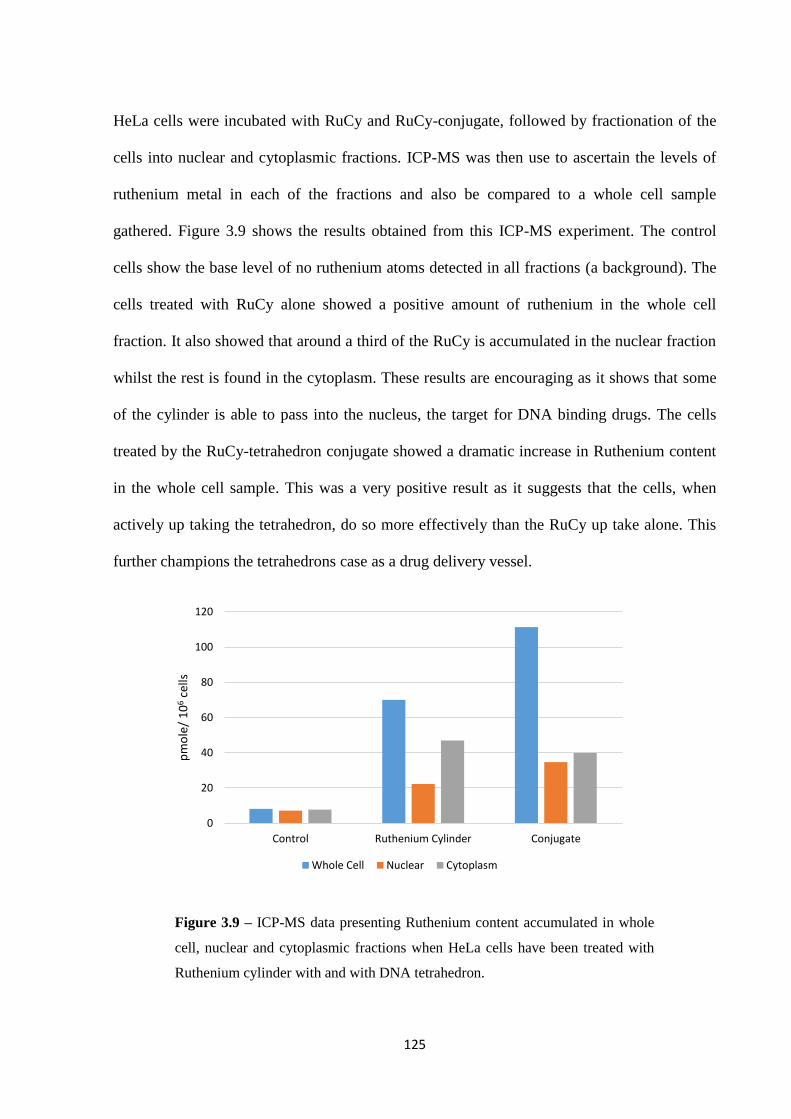
125
0
20
40
60
80
100
120
Control Ruthenium Cylinder Conjugate
pm
ole
/ 1
06
cells
Whole Cell Nuclear Cytoplasm
HeLa cells were incubated with RuCy and RuCy-conjugate, followed by fractionation of the
cells into nuclear and cytoplasmic fractions. ICP-MS was then use to ascertain the levels of
ruthenium metal in each of the fractions and also be compared to a whole cell sample
gathered. Figure 3.9 shows the results obtained from this ICP-MS experiment. The control
cells show the base level of no ruthenium atoms detected in all fractions (a background). The
cells treated with RuCy alone showed a positive amount of ruthenium in the whole cell
fraction. It also showed that around a third of the RuCy is accumulated in the nuclear fraction
whilst the rest is found in the cytoplasm. These results are encouraging as it shows that some
of the cylinder is able to pass into the nucleus, the target for DNA binding drugs. The cells
treated by the RuCy-tetrahedron conjugate showed a dramatic increase in Ruthenium content
in the whole cell sample. This was a very positive result as it suggests that the cells, when
actively up taking the tetrahedron, do so more effectively than the RuCy up take alone. This
further champions the tetrahedrons case as a drug delivery vessel.
Figure 3.9 – ICP-MS data presenting Ruthenium content accumulated in whole
cell, nuclear and cytoplasmic fractions when HeLa cells have been treated with
Ruthenium cylinder with and with DNA tetrahedron.
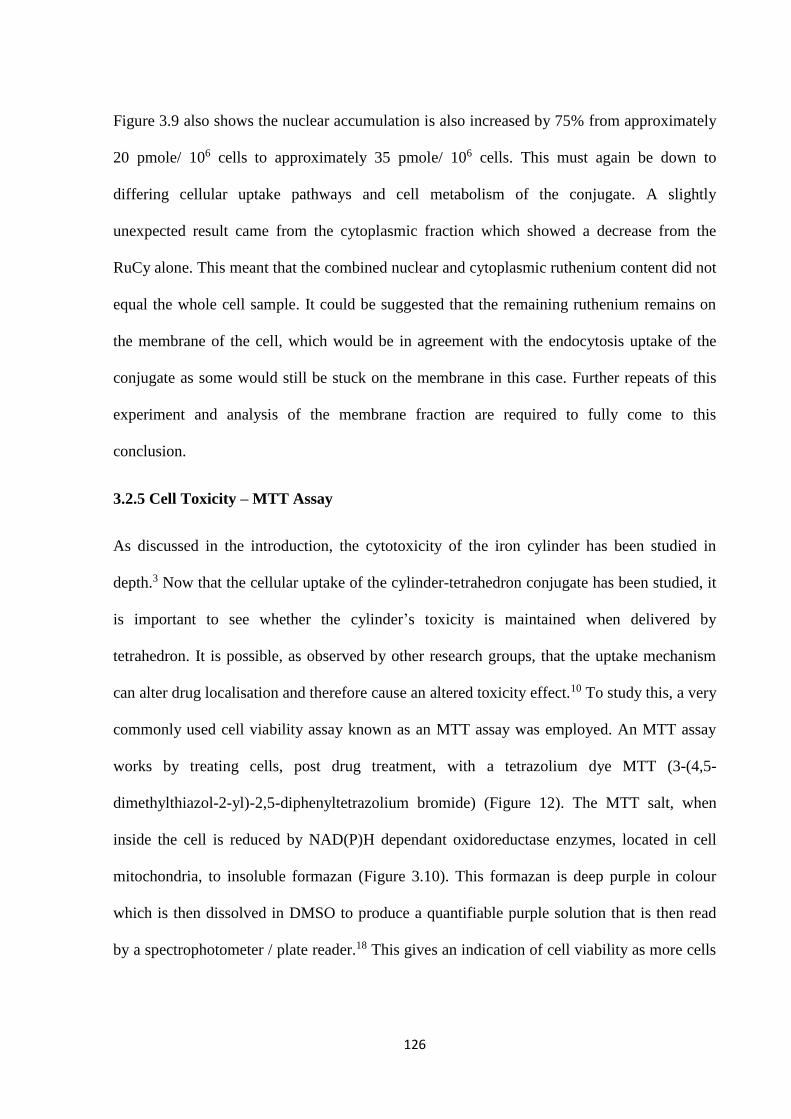
126
Figure 3.9 also shows the nuclear accumulation is also increased by 75% from approximately
20 pmole/ 106 cells to approximately 35 pmole/ 106 cells. This must again be down to
differing cellular uptake pathways and cell metabolism of the conjugate. A slightly
unexpected result came from the cytoplasmic fraction which showed a decrease from the
RuCy alone. This meant that the combined nuclear and cytoplasmic ruthenium content did not
equal the whole cell sample. It could be suggested that the remaining ruthenium remains on
the membrane of the cell, which would be in agreement with the endocytosis uptake of the
conjugate as some would still be stuck on the membrane in this case. Further repeats of this
experiment and analysis of the membrane fraction are required to fully come to this
conclusion.
3.2.5 Cell Toxicity – MTT Assay
As discussed in the introduction, the cytotoxicity of the iron cylinder has been studied in
depth.3 Now that the cellular uptake of the cylinder-tetrahedron conjugate has been studied, it
is important to see whether the cylinder’s toxicity is maintained when delivered by
tetrahedron. It is possible, as observed by other research groups, that the uptake mechanism
can alter drug localisation and therefore cause an altered toxicity effect.10 To study this, a very
commonly used cell viability assay known as an MTT assay was employed. An MTT assay
works by treating cells, post drug treatment, with a tetrazolium dye MTT (3-(4,5-
dimethylthiazol-2-yl)-2,5-diphenyltetrazolium bromide) (Figure 12). The MTT salt, when
inside the cell is reduced by NAD(P)H dependant oxidoreductase enzymes, located in cell
mitochondria, to insoluble formazan (Figure 3.10). This formazan is deep purple in colour
which is then dissolved in DMSO to produce a quantifiable purple solution that is then read
by a spectrophotometer / plate reader.18 This gives an indication of cell viability as more cells
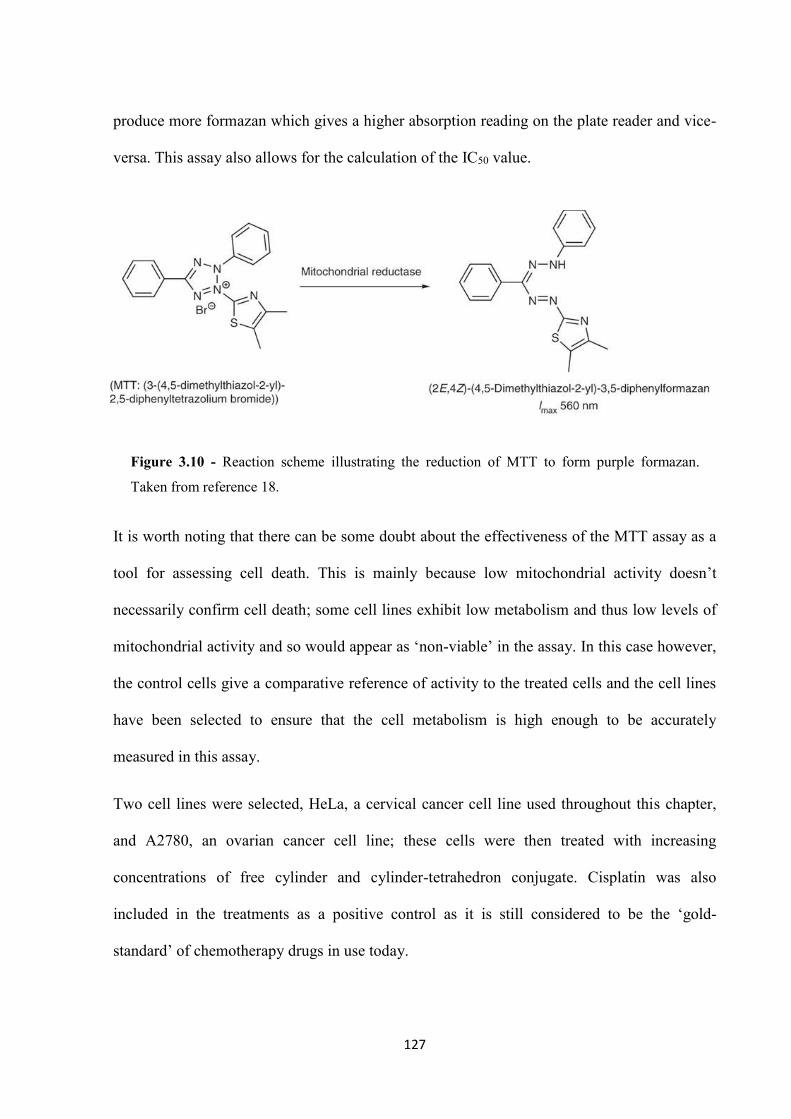
127
produce more formazan which gives a higher absorption reading on the plate reader and vice-
versa. This assay also allows for the calculation of the IC50 value.
It is worth noting that there can be some doubt about the effectiveness of the MTT assay as a
tool for assessing cell death. This is mainly because low mitochondrial activity doesn’t
necessarily confirm cell death; some cell lines exhibit low metabolism and thus low levels of
mitochondrial activity and so would appear as ‘non-viable’ in the assay. In this case however,
the control cells give a comparative reference of activity to the treated cells and the cell lines
have been selected to ensure that the cell metabolism is high enough to be accurately
measured in this assay.
Two cell lines were selected, HeLa, a cervical cancer cell line used throughout this chapter,
and A2780, an ovarian cancer cell line; these cells were then treated with increasing
concentrations of free cylinder and cylinder-tetrahedron conjugate. Cisplatin was also
included in the treatments as a positive control as it is still considered to be the ‘gold-
standard’ of chemotherapy drugs in use today.
Figure 3.10 - Reaction scheme illustrating the reduction of MTT to form purple formazan.
Taken from reference 18.
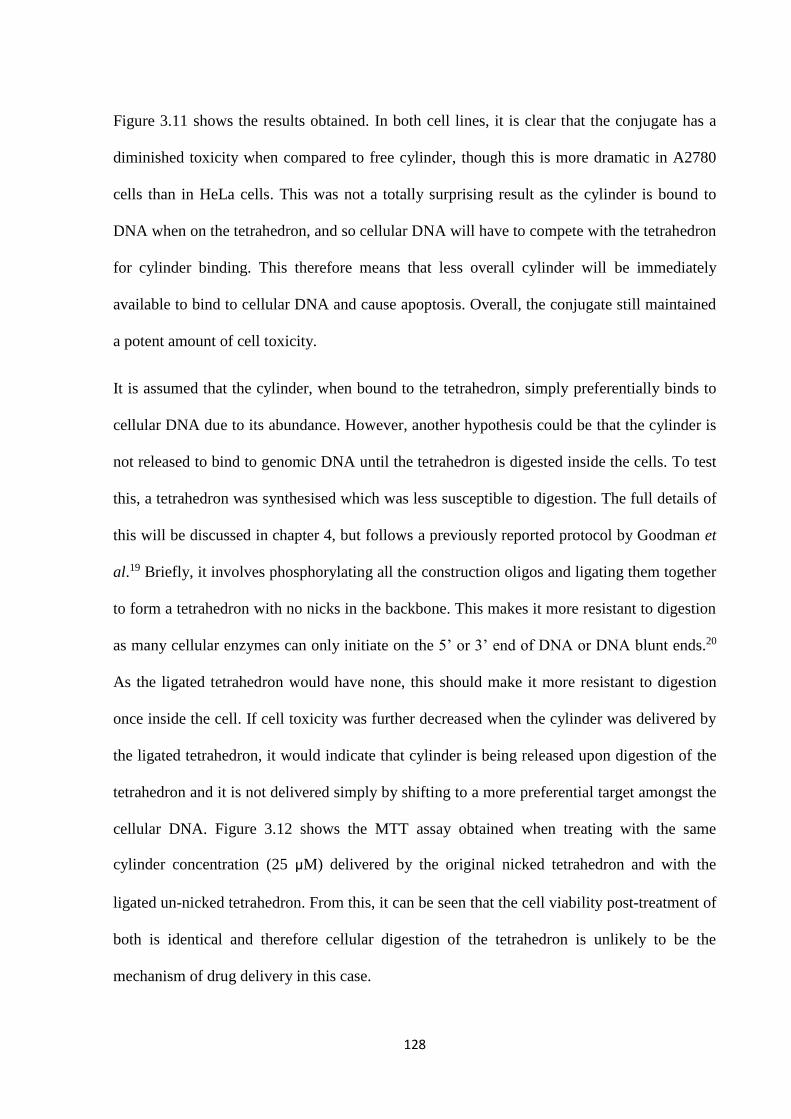
128
Figure 3.11 shows the results obtained. In both cell lines, it is clear that the conjugate has a
diminished toxicity when compared to free cylinder, though this is more dramatic in A2780
cells than in HeLa cells. This was not a totally surprising result as the cylinder is bound to
DNA when on the tetrahedron, and so cellular DNA will have to compete with the tetrahedron
for cylinder binding. This therefore means that less overall cylinder will be immediately
available to bind to cellular DNA and cause apoptosis. Overall, the conjugate still maintained
a potent amount of cell toxicity.
It is assumed that the cylinder, when bound to the tetrahedron, simply preferentially binds to
cellular DNA due to its abundance. However, another hypothesis could be that the cylinder is
not released to bind to genomic DNA until the tetrahedron is digested inside the cells. To test
this, a tetrahedron was synthesised which was less susceptible to digestion. The full details of
this will be discussed in chapter 4, but follows a previously reported protocol by Goodman et
al.19 Briefly, it involves phosphorylating all the construction oligos and ligating them together
to form a tetrahedron with no nicks in the backbone. This makes it more resistant to digestion
as many cellular enzymes can only initiate on the 5’ or 3’ end of DNA or DNA blunt ends.20
As the ligated tetrahedron would have none, this should make it more resistant to digestion
once inside the cell. If cell toxicity was further decreased when the cylinder was delivered by
the ligated tetrahedron, it would indicate that cylinder is being released upon digestion of the
tetrahedron and it is not delivered simply by shifting to a more preferential target amongst the
cellular DNA. Figure 3.12 shows the MTT assay obtained when treating with the same
cylinder concentration (25 µM) delivered by the original nicked tetrahedron and with the
ligated un-nicked tetrahedron. From this, it can be seen that the cell viability post-treatment of
both is identical and therefore cellular digestion of the tetrahedron is unlikely to be the
mechanism of drug delivery in this case.
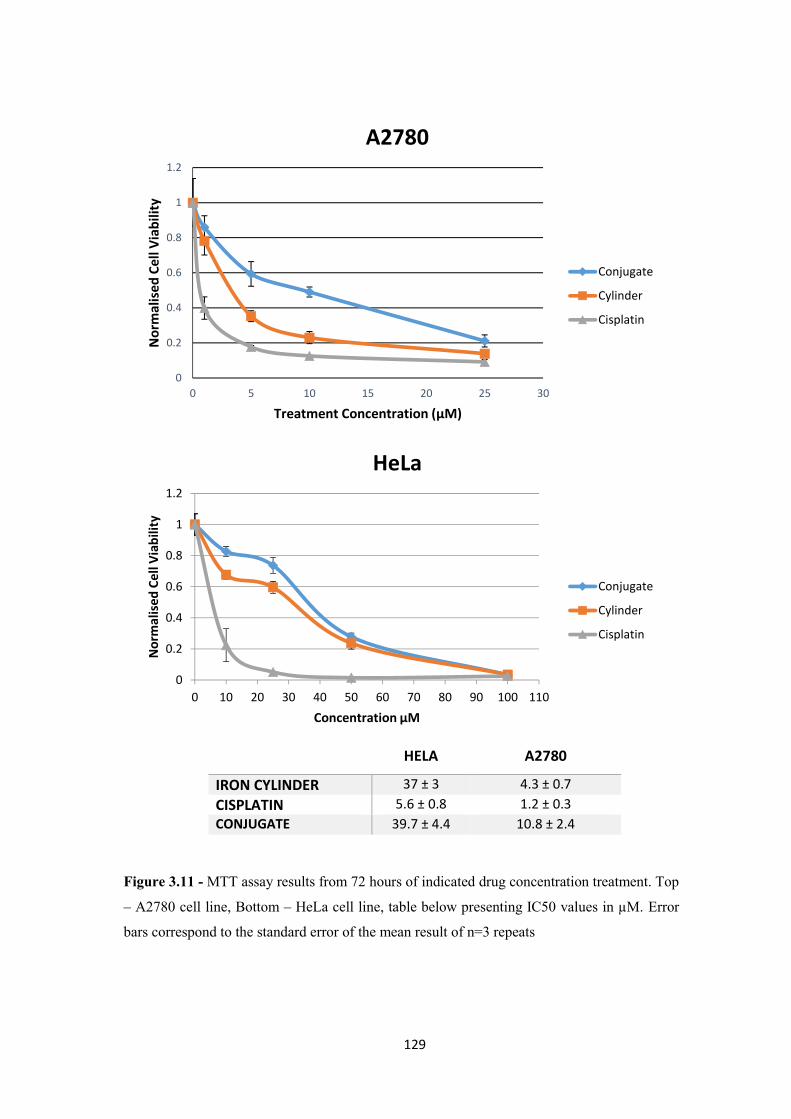
129
HELA A2780
IRON CYLINDER 37 ± 3 4.3 ± 0.7
CISPLATIN 5.6 ± 0.8 1.2 ± 0.3
CONJUGATE 39.7 ± 4.4 10.8 ± 2.4
0
0.2
0.4
0.6
0.8
1
1.2
0 5 10 15 20 25 30
No
rmal
ise
d C
ell
Via
bili
ty
Treatment Concentration (µM)
A2780
Conjugate
Cylinder
Cisplatin
0
0.2
0.4
0.6
0.8
1
1.2
0 10 20 30 40 50 60 70 80 90 100 110
No
rmal
ised
Cel
l Via
bili
ty
Concentration µM
HeLa
Conjugate
Cylinder
Cisplatin
Figure 3.11 - MTT assay results from 72 hours of indicated drug concentration treatment. Top
– A2780 cell line, Bottom – HeLa cell line, table below presenting IC50 values in µM. Error
bars correspond to the standard error of the mean result of n=3 repeats
130
0
0.2
0.4
0.6
0.8
1
1.2
Control LigatedConjugate
UnligatedConjugate
Free Cylinder
MTT Assay, 72h, A2780
3.3 Conclusions
This chapter set out to investigate the potential biological compatibility of the DNA
tetrahedron as a drug delivery vessel. By testing the cellular uptake through various means, it
can be concluded that the tetrahedron is very compatible and is readily taken up by cancer
cells in an in vitro environment. It is also shown that both the iron cylinder and the ruthenium
cylinder could be delivered by the tetrahedron to cells. Once delivered, it was shown that the
toxicity of the iron cylinder was maintained, although at a diminished level. Although ICP-
MS studies gave insight as to where the cylinders end up once delivered to cells, further
experimentation is needed to fully ascertain the localisation of the tetrahedron in the cell, for
example, by staining alternative cell structures to find co-localisation in a confocal
microscopy experiment.
Figure 3.12 – MTT assay comparing toxicity of 25 µM of cylinder when delivered by
ligated tetrahedron and un-ligated tetrahedron with free cylinder as a positive control.
131
The question of whether the conjugate remains intact when entering the cell or whether the
cylinder separates before uptake is a pertinent one. For this question to be answered, it must
first be possible to visualise the cylinder inside the cell. Currently the Hannon group is still
attempting to synthesise a cylinder possessing a fluorescent tag which would enable
simultaneous visualisation of the cylinder and the tetrahedron inside the cell, allowing FRET
studies to be carried out. This would be crucial to understanding the state of the conjugate at
this stage. Unfortunately, this continues to be a very challenging goal. However, evidence of
increased cylinder uptake when delivered by tetrahedron and diminished toxicity both point
strongly to the fact that the conjugate is initially intact inside the cell.
132
3.4 Experimental
Materials: Enzymes T4 Ligase and Kinase were purchased from New England Biolabs. All
chemicals were purchased from Sigma Aldrich unless otherwise stated. DNA oligonucleotides
were purchased HPLC purified from Eurofins. DMEM medium (high glucose) was purchased
from sigma. RPMI medium was purchased from life technologies. Cell culture equipment was
purchased from Corning.
Flow Cytometry: HeLa cells were seeded into a 24-well plate at 35,000 cells per well,
counted using a Haemocytometer. Cells were supplemented with DMEM medium (1ml) and
left to incubate in the wells for 48 hours at 37oC to allow them to adhere fully to the well.
Leaving control wells, separate wells were treated with cylinder alone, Cy5-Tetrahedron and
Cy5-Conjugate to final concentrations of 20 µM of cylinder and 10 µM of DNA tetrahedron,
corresponding to a ratio of 2:1 cylinder : tetrahedron in the Cy5-Conjugate sample well
(400µl). Samples were then incubated overnight. Samples were then trypsinised (5mins) and
re-suspended in PBS solution (2ml). They were then added to separate FACS tubes and each
sample run on a BD FACscaliber flow cytometer with a Cy5 excitation laser. For each sample
10,000 cells were counted for a total of three repeat experiments.
Fixed Cell Confocal imaging: HeLa cells were seeded at 50,000 cells per well inside a 24
well plate containing a sterilised glass coverslip and supplemented with DMEM. Cells were
left to adhere to coverslip for 24 hours. Cells were then incubated with Cy5 containing
compounds (5 µM) for either 2 or 24 hours. Media was then aspirated and cells washed with
thoroughly with PBS solution to remove any non-internalised compound. Cells were then
133
stained with Hoechst 33258 in DMEM (25 µg/mL) (500µl) for 30 min. The solution was
again aspirated and cells washed 3 times with PBS (3 x 300 µL per well) and 4% formalin
solution (500µl) was then added and left for 10 min. The formalin solution was then removed
via pipette and cells washed with PBS (2 x 300 µl). The Glass coverslips were then removed
from the wells, using a needle tip and tweezers, and washed in a PBS bath followed by a pure
water bath by dipping. Coverslips were then placed face down onto a microscope slide which
had been spotted with oil. The slide was then imaged on a Nikon A1 confocal microscope.
Live Cell Confocal imaging: HeLa cells were seeded into Matek dishes at 300,000 cells per
dish as counted with a Haemocytometer, and left to incubate at 37oC for 48 hours in DMEM
media (3ml) to allow them to adhere fully to the cover slip. Media was then removed and the
cells washed with PBS (5ml). The cells were then treated with cylinder / Cy5 labelled DNA to
a final concentration of 8 µM of cylinder and 2 µM of Cy5-Tetrahedron, corresponding to a
ratio of 4:1 cylinder : tetrahedron in the Cy5-Conjugate sample well (1ml). The dishes were
incubated for pre-determined times before the solutions were aspirated and the cells washed
thoroughly with PBS (3 x 5 ml). The cells were then stained with Hoechst 33258 nuclear stain
by incubating the cells with 2mL of 25µg/mL Hoechst in DMEM media for 30 mins. The
stain was aspirated and cells washed again with PBS (3 x 5 ml). Clear imaging medium (life
technologies) was then added to the dishes and the cells imaged on a Nikon-A1 confocal
microscope.
Cell Toxicity Assay – MTT Assay: Cells of cell lines A2780 or HeLa were seeded into 96
well plates at 13,000 cells per well as counted by a Haemocytometer and left overnight in 100
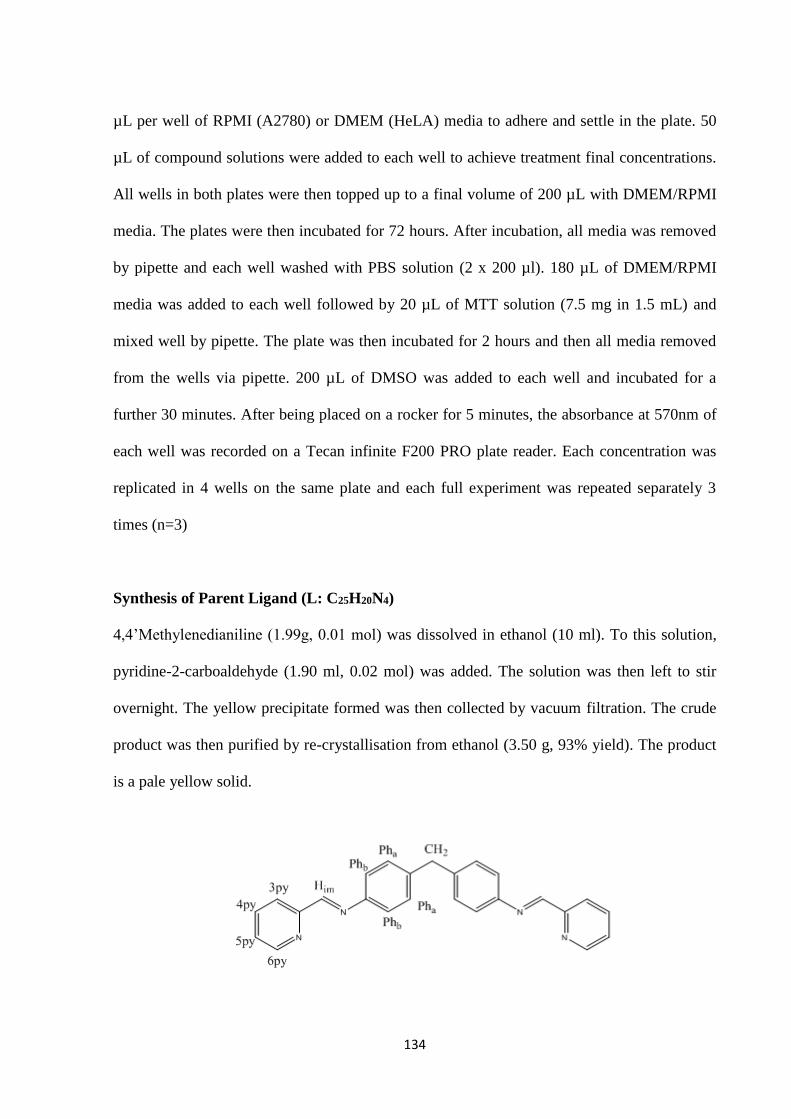
134
µL per well of RPMI (A2780) or DMEM (HeLA) media to adhere and settle in the plate. 50
µL of compound solutions were added to each well to achieve treatment final concentrations.
All wells in both plates were then topped up to a final volume of 200 µL with DMEM/RPMI
media. The plates were then incubated for 72 hours. After incubation, all media was removed
by pipette and each well washed with PBS solution (2 x 200 µl). 180 µL of DMEM/RPMI
media was added to each well followed by 20 µL of MTT solution (7.5 mg in 1.5 mL) and
mixed well by pipette. The plate was then incubated for 2 hours and then all media removed
from the wells via pipette. 200 µL of DMSO was added to each well and incubated for a
further 30 minutes. After being placed on a rocker for 5 minutes, the absorbance at 570nm of
each well was recorded on a Tecan infinite F200 PRO plate reader. Each concentration was
replicated in 4 wells on the same plate and each full experiment was repeated separately 3
times (n=3)
Synthesis of Parent Ligand (L: C25H20N4)
4,4’Methylenedianiline (1.99g, 0.01 mol) was dissolved in ethanol (10 ml). To this solution,
pyridine-2-carboaldehyde (1.90 ml, 0.02 mol) was added. The solution was then left to stir
overnight. The yellow precipitate formed was then collected by vacuum filtration. The crude
product was then purified by re-crystallisation from ethanol (3.50 g, 93% yield). The product
is a pale yellow solid.
135
Mass Spectrum (ESI): m/z = 399 {M+Na}
1H NMR (300 MHz), CDCl3, 298K: δ 8.71 (2H, d, J = 3.9 Hz, 6py), δ 8.63 (2H, s, J = Him), δ
8.22 (2H, d, J = 7.0 Hz 3py), δ 7.82 (2H, td, J = 8.3, 1.9, 0.6 Hz, 4py), δ 7.40 (2H, ddd, J =
7.6, 4.9, 1.2 Hz, 5py), δ 7.30 (8H, m, Pha and Phb), δ 4.08 (2H, s, CH2)
Synthesis of Ruthenium Cylinder, [Ru2(L)3](PF6)4: RuCl3 (3g, 14.5 mmol) was dissolved
in 15 mL of DMSO and heated under reflux at 195oC for 5 minutes. The solution was reduced
in vacuo to concentrate the solution down to 1 mL. Excess cold acetone was then added to
precipitate a yellow solid. The yellow precipitate was then filtered and washed with cold
acetone to furnish the yellow solid Ru(DMSO)4Cl2.
Ru(DMSO)4Cl2 (0.988 g, 2.04 mmol) and parent ligand (1.150 g, 3.06 mmol) were added to
degassed Ethylene glycol (50 ml) and heated to reflux under argon at 200oC for 5 days. The
mixture was allowed to cool and an excess saturated methanolic solution of ammonium
hexaflourophosphate was added. The suspension was cooled on ice before the precipitate was
filtered and washed with methanol (2 x 40 ml) and dried with ether (3 x 100 ml). The dark
brown product was purified by column chromatography on alumina using 20:1:1 MeCN/H2O/
KNO3(aq) solution as eluent to yield the product as an orange solid (11 mg, 0.6% yield).
Mass Spectrum Positive ion ESI: m/z = 666 [M-(PF6)4]2+, 444 [M-(PF6)]
3+ , 333.2 [M-(PF6)4+
1H NMR (300MHz), CD3CN, 298K : δ = 8.7 (2H, s, Him), 8.45 (2H, d, J = 7.6 Hz, 6py), 8.35
(2H, td, J = 7.78 Hz, 5.0 Hz, 3py), 7.65 (2H, d, J = 6.0 Hz, 4py), 7.65 (2H, d, J = 6.0 Hz, 5py),
7.0 (4H, d, J = 8.4 Hz, Pha/b), 5.7 (4H, d, J = 8.3 Hz, Pha/b), 4.1 (2H, s, CH2)
UV-Vis (CH3CN) : λmax (ε / dm3 mol-1 cm-1) 485 (24200)
136
ICP-MS Cell uptake analysis: 3 separate T75 flasks were seeded with HeLa cells and
incubated in DMEM media until fully confluent. Medium was aspirated from the flasks and
the cells washed with PBS. To one flask was added 5 mL of medium, to be used as a control.
To another, 5 mL of medium containing 2 µM final concentration of Ru cylinder was added
and to the final 5 mL of medium containing 4:1 Ru cylinder – Tetrahedron conjugate (0.5 µM
: 2 µM) final concentration was added. The flasks were left to incubate for 24 hours at 37oC
before the cells were collected and pelleted. Two samples of 2 million cells were taken from
each pellet. One sample was then fractionated into a nuclear fraction and a cytoplasmic
fraction whilst the other was kept as a whole cell sample. The fractionation procedure was
carried out using a Nuclear/Cytosol fractionating kit (BioVision) following the provided
protocol. All samples were then digested using 500 µL concentrated ultra-pure HNO3 (Fluka)
at 80oC for 16 hrs in glass vials. Samples were diluted to 5% HNO3 solution with ultra-pure
water to 5 ml and analysed. The Ruthenium content of each sample was then analysed on an
Agilent 7500CX ICP-MS.
137
3.5 References
1. M.J. Hannon, Metal-based anticancer drugs: From a past anchored in platinum chemistry to a
post-genomic future of diverse chemistry and biology. Pure and Applied Chemistry, 2007.
79(12): p. 2243-2261.
2. S.J. Lippard and J.M. Berg, Principles of Bioinorganic Chemistry, 1994. 23 (2): p. 115
3. A.C.G. Hotze, N.J. Hodges, R.E. Hayden, C. Sanchez-Cano, C. Paines, N. Male, M.-K. Tse, C.M.
Bunce, J.K. Chipman, and M.J. Hannon, Supramolecular Iron Cylinder with Unprecedented
DNA Binding Is a Potent Cytostatic and Apoptotic Agent without Exhibiting Genotoxicity.
Chemistry & Biology, 2008. 15(12): p. 1258-1267.
4. S.J. Lee, Y.N. Yum, S.C. Kim, Y. Kim, J. Lim, W.J. Lee, K.H. Koo, J.H. Kim, J.E. Kim, W.S. Lee, S.
Sohn, S.N. Park, J.H. Park, J. Lee, and S.W. Kwon, Distinguishing between genotoxic and non-
genotoxic hepatocarcinogens by gene expression profiling and bioinformatic pathway
analysis. Scientific Reports, 2013. 3: p. 2783.
5. D. Khynriam and S.B. Prasad, Cisplatin-induced genotoxic effects and endogenous glutathione
levels in mice bearing ascites Dalton's lymphoma. Mutation Research, 2003. 526(1-2): p. 9-
18.
6. N. Aydemir and R. Bilaloglu, Genotoxicity of two anticancer drugs, gemcitabine and
topotecan, in mouse bone marrow in vivo. Mutatation Research, 2003. 537(1): p. 43-51.
7. A.S. Walsh, H. Yin, C.M. Erben, M.J.A. Wood, and A.J. Turberfield, DNA Cage Delivery to
Mammalian Cells. ACS Nano, 2011. 5(7): p. 5427-5432.
8. C.M. Erben, R.P. Goodman, and A.J. Turberfield, Single-molecule protein encapsulation in a
rigid DNA cage. Angewante Chemie International Edition English, 2006. 45(44): p. 7414-7.
9. R. Crawford, C.M. Erben, J. Periz, L.M. Hall, T. Brown, A.J. Turberfield, and A.N. Kapanidis,
Non-covalent Single Transcription Factor Encapsulation Inside a DNA Cage. Angewandte
Chemie-International Edition, 2013. 52(8): p. 2284-2288.
138
10. K.R. Kim, D.R. Kim, T. Lee, J.Y. Yhee, B.S. Kim, I.C. Kwon, and D.R. Ahn, Drug delivery by a self-
assembled DNA tetrahedron for overcoming drug resistance in breast cancer cells. Chemical
Communications, 2013. 49(20): p. 2010-2012.
11. A.J. Pope, C. Bruce, B. Kysela, and M.J. Hannon, Issues surrounding standard cytotoxicity
testing for assessing activity of non-covalent DNA-binding metallo-drugs. Dalton
Transactions, 2010. 39(11): p. 2772-2774.
12. A. Reiger, Flow cytommetry at the faculty of medicine and destistry. [online] University of
Alberta, April 2017, January 2017 https://flowcytometry.med.ualberta.ca/author/aja/
13. L. Liang, J. Li, Q. Li, Q. Huang, J.Y. Shi, H. Yan, and C.H. Fan, Single-Particle Tracking and
Modulation of Cell Entry Pathways of a Tetrahedral DNA Nanostructure in Live Cells.
Angewandte Chemie-International Edition, 2014. 53(30): p. 7745-7750.
14. J.E. O'Sullivan, R.J. Watson, and E.C. Butler, An ICP-MS procedure to determine Cd, Co, Cu, Ni,
Pb and Zn in oceanic waters using in-line flow-injection with solid-phase extraction for
preconcentration. Talanta, 2013. 115: p. 999-1010.
15. G.I. Pascu, A.C.G. Hotze, C. Sanchez-Cano, B.M. Kariuki, and M.J. Hannon, Dinuclear
Ruthenium(II) Triple-Stranded Helicates: Luminescent Supramolecular Cylinders That Bind and
Coil DNA and Exhibit Activity against Cancer Cell Lines. Angewandte Chemie, 2007. 119(23):
p. 4452-4456.
16. J.M.C.A. Kerckhoffs, J.C. Peberdy, I. Meistermann, L.J. Childs, C.J. Isaac, C.R. Pearmund, V.
Reudegger, S. Khalid, N.W. Alcock, M.J. Hannon, and A. Rodger, Enantiomeric resolution of
supramolecular helicates with different surface topographies. Dalton Transactions, 2007(7):
p. 734-742.
17. J. Malina, M.J. Hannon, and V. Brabec, Interaction of Dinuclear Ruthenium(II) Supramolecular
Cylinders with DNA: Sequence-Specific Binding, Unwinding, and Photocleavage. Chemistry – A
European Journal, 2008. 14(33): p. 10408-10414.
139
18. J. van Meerloo, G.J. Kaspers, and J. Cloos, Cell sensitivity assays: the MTT assay. Methods in
Molecular Biology, 2011. 731: p. 237-45.
19. R.P. Goodman, I.A.T. Schaap, C.F. Tardin, C.M. Erben, R.M. Berry, C.F. Schmidt, and A.J.
Turberfield, Rapid Chiral Assembly of Rigid DNA Building Blocks for Molecular
Nanofabrication. Science, 2005. 310(5754): p. 1661-1665.
20. K.D. Bloch and B. Grossmann, Digestion of DNA with restriction endonucleases. Current
Protocols in Molecular Biology, 2001. 3(1).
140
Chapter 4:
DNA Photocleavage with a Ruthenium Cylinder
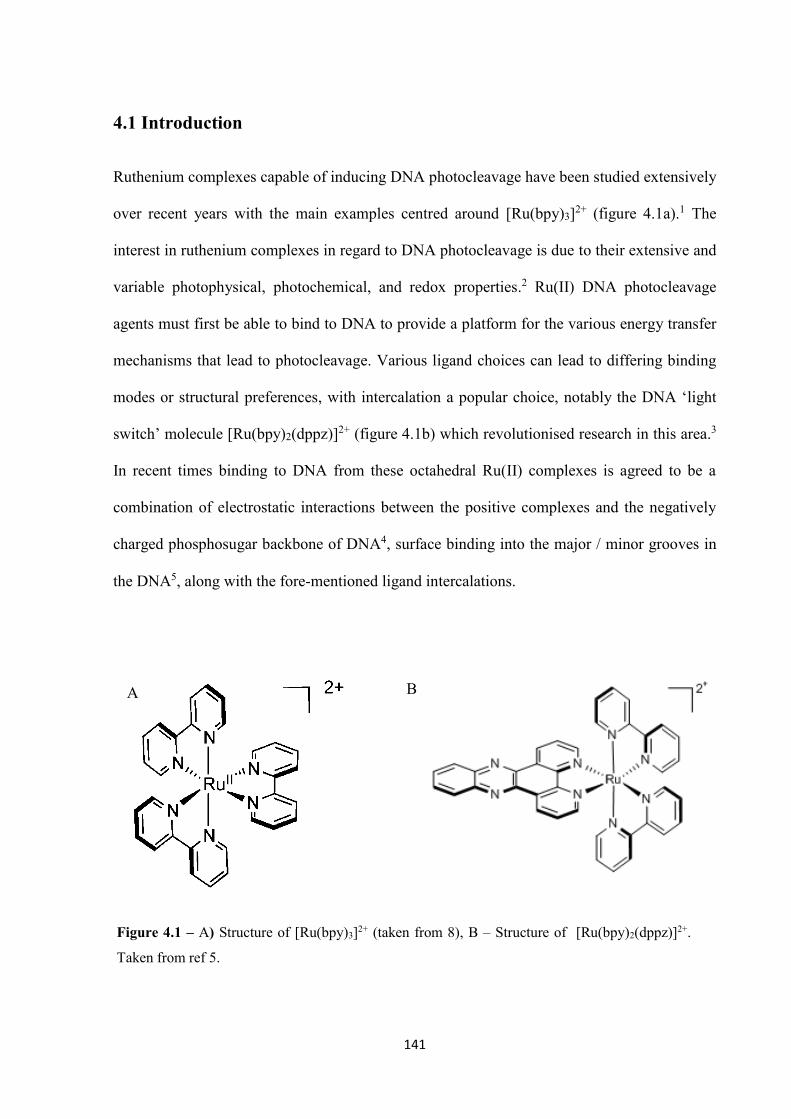
141
B A
Figure 4.1 – A) Structure of [Ru(bpy)3]2+ (taken from 8), B – Structure of [Ru(bpy)2(dppz)]2+.
Taken from ref 5.
4.1 Introduction
Ruthenium complexes capable of inducing DNA photocleavage have been studied extensively
over recent years with the main examples centred around [Ru(bpy)3]2+ (figure 4.1a).1 The
interest in ruthenium complexes in regard to DNA photocleavage is due to their extensive and
variable photophysical, photochemical, and redox properties.2 Ru(II) DNA photocleavage
agents must first be able to bind to DNA to provide a platform for the various energy transfer
mechanisms that lead to photocleavage. Various ligand choices can lead to differing binding
modes or structural preferences, with intercalation a popular choice, notably the DNA ‘light
switch’ molecule [Ru(bpy)2(dppz)]2+ (figure 4.1b) which revolutionised research in this area.3
In recent times binding to DNA from these octahedral Ru(II) complexes is agreed to be a
combination of electrostatic interactions between the positive complexes and the negatively
charged phosphosugar backbone of DNA4, surface binding into the major / minor grooves in
the DNA5, along with the fore-mentioned ligand intercalations. 6 3
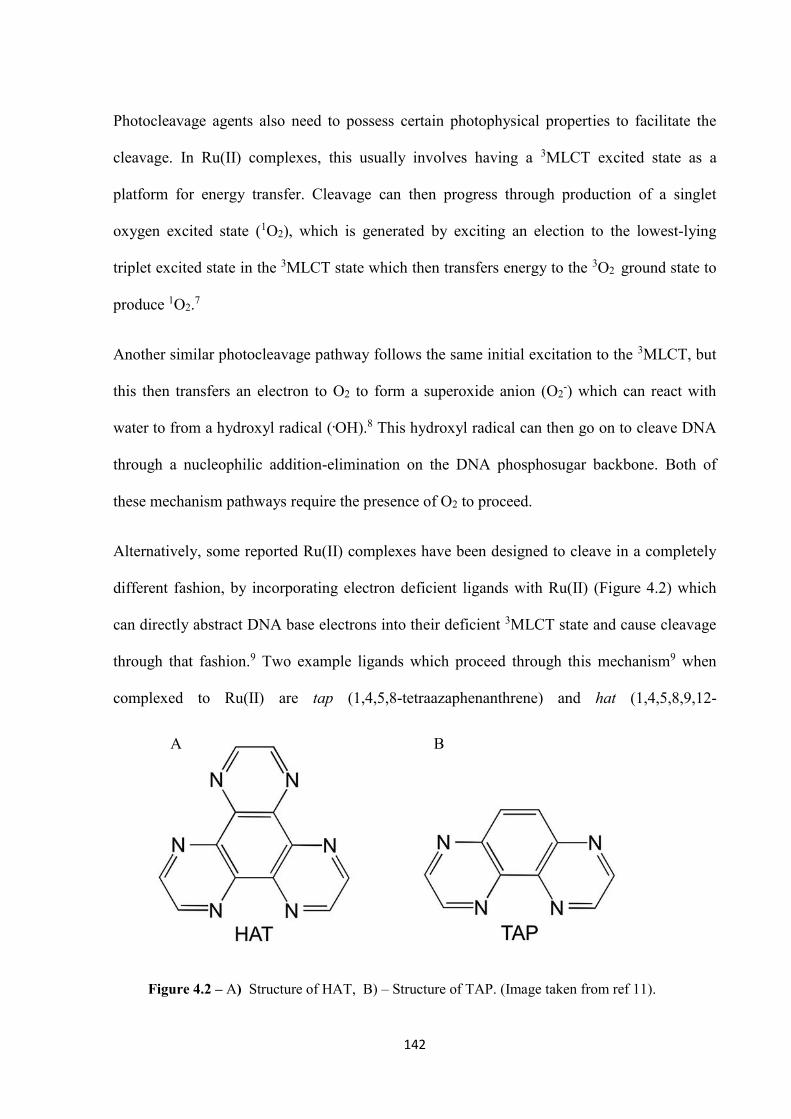
142
A B
Figure 4.2 – A) Structure of HAT, B) – Structure of TAP. (Image taken from ref 11).
Photocleavage agents also need to possess certain photophysical properties to facilitate the
cleavage. In Ru(II) complexes, this usually involves having a 3MLCT excited state as a
platform for energy transfer. Cleavage can then progress through production of a singlet
oxygen excited state (1O2), which is generated by exciting an election to the lowest-lying
triplet excited state in the 3MLCT state which then transfers energy to the 3O2 ground state to
produce 1O2.7
Another similar photocleavage pathway follows the same initial excitation to the 3MLCT, but
this then transfers an electron to O2 to form a superoxide anion (O2-) which can react with
water to from a hydroxyl radical (.OH).8 This hydroxyl radical can then go on to cleave DNA
through a nucleophilic addition-elimination on the DNA phosphosugar backbone. Both of
these mechanism pathways require the presence of O2 to proceed.
Alternatively, some reported Ru(II) complexes have been designed to cleave in a completely
different fashion, by incorporating electron deficient ligands with Ru(II) (Figure 4.2) which
can directly abstract DNA base electrons into their deficient 3MLCT state and cause cleavage
through that fashion.9 Two example ligands which proceed through this mechanism9 when
complexed to Ru(II) are tap (1,4,5,8-tetraazaphenanthrene) and hat (1,4,5,8,9,12-
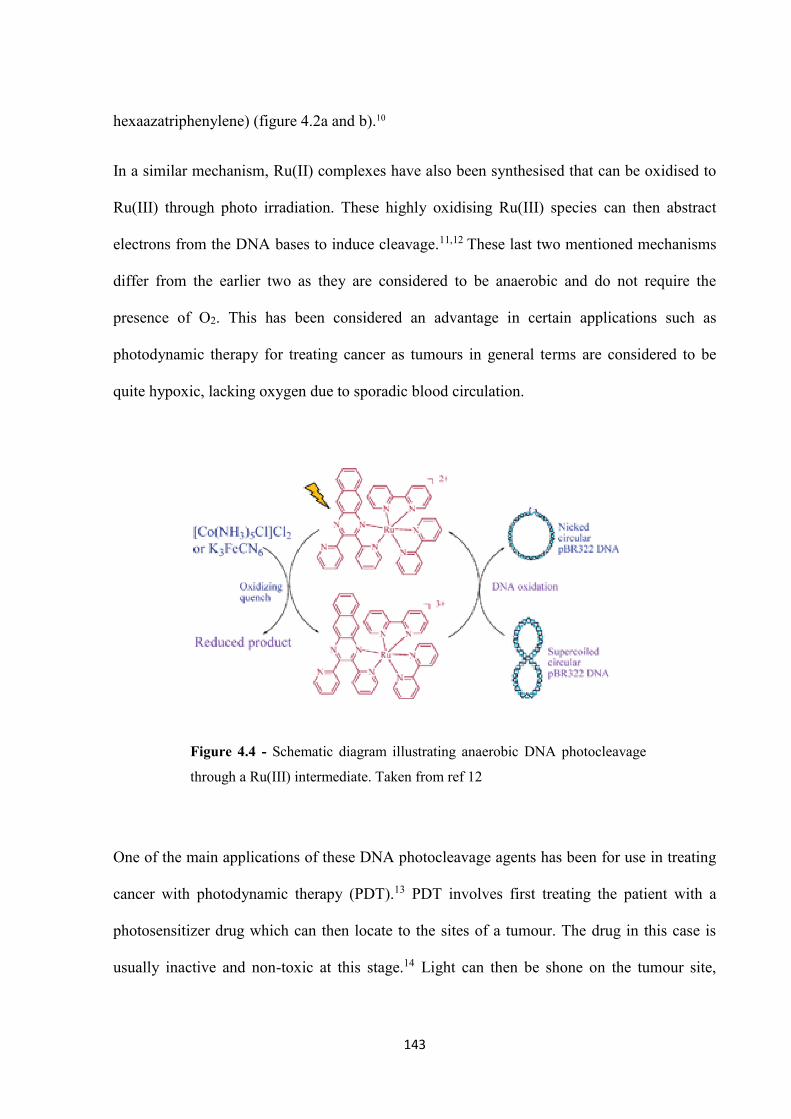
143
hexaazatriphenylene) (figure 4.2a and b).10
In a similar mechanism, Ru(II) complexes have also been synthesised that can be oxidised to
Ru(III) through photo irradiation. These highly oxidising Ru(III) species can then abstract
electrons from the DNA bases to induce cleavage.11,12 These last two mentioned mechanisms
differ from the earlier two as they are considered to be anaerobic and do not require the
presence of O2. This has been considered an advantage in certain applications such as
photodynamic therapy for treating cancer as tumours in general terms are considered to be
quite hypoxic, lacking oxygen due to sporadic blood circulation.
One of the main applications of these DNA photocleavage agents has been for use in treating
cancer with photodynamic therapy (PDT).13 PDT involves first treating the patient with a
photosensitizer drug which can then locate to the sites of a tumour. The drug in this case is
usually inactive and non-toxic at this stage.14 Light can then be shone on the tumour site,
Figure 4.4 - Schematic diagram illustrating anaerobic DNA photocleavage
through a Ru(III) intermediate. Taken from ref 12
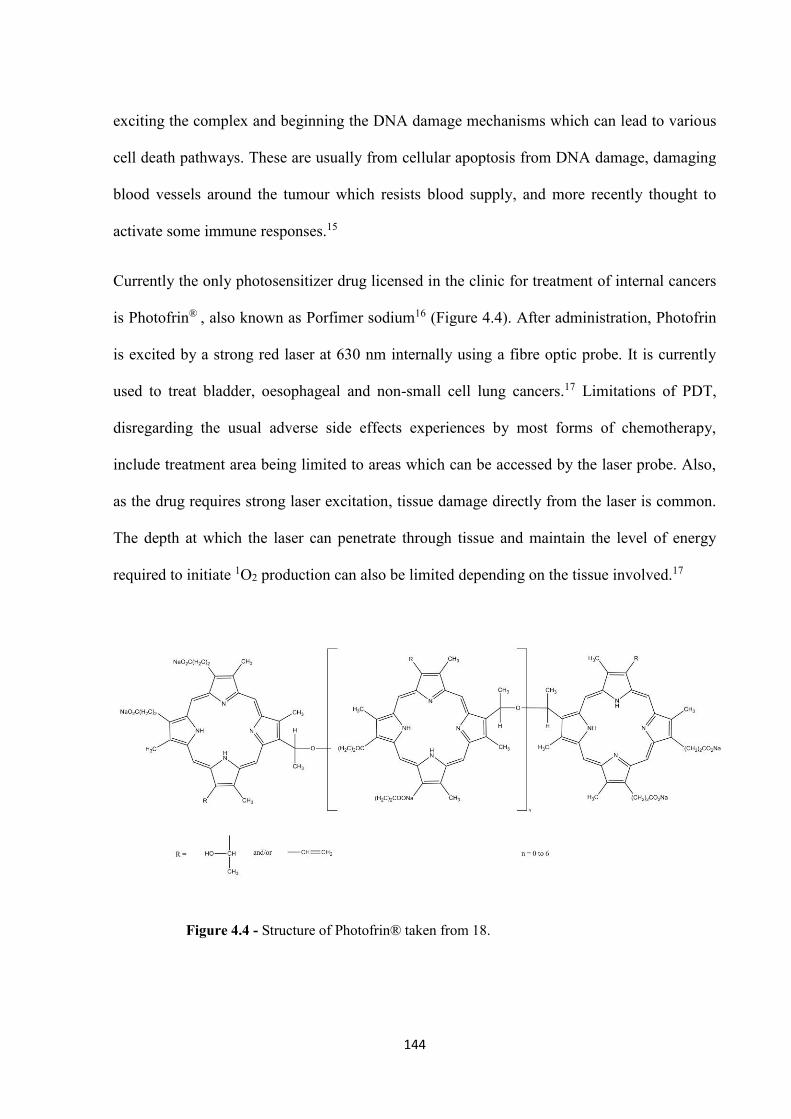
144
exciting the complex and beginning the DNA damage mechanisms which can lead to various
cell death pathways. These are usually from cellular apoptosis from DNA damage, damaging
blood vessels around the tumour which resists blood supply, and more recently thought to
activate some immune responses.15
Currently the only photosensitizer drug licensed in the clinic for treatment of internal cancers
is Photofrin® , also known as Porfimer sodium16 (Figure 4.4). After administration, Photofrin
is excited by a strong red laser at 630 nm internally using a fibre optic probe. It is currently
used to treat bladder, oesophageal and non-small cell lung cancers.17 Limitations of PDT,
disregarding the usual adverse side effects experiences by most forms of chemotherapy,
include treatment area being limited to areas which can be accessed by the laser probe. Also,
as the drug requires strong laser excitation, tissue damage directly from the laser is common.
The depth at which the laser can penetrate through tissue and maintain the level of energy
required to initiate 1O2 production can also be limited depending on the tissue involved.17, 18
Figure 4.4 - Structure of Photofrin® taken from 18.
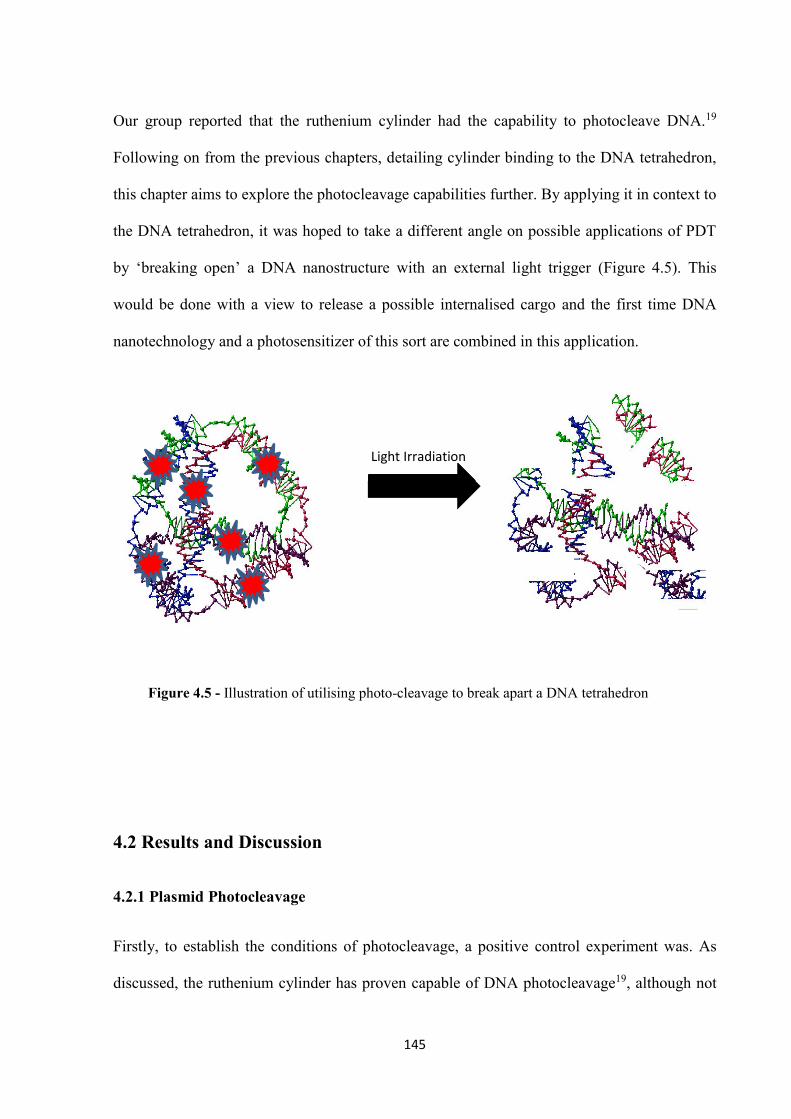
145
Our group reported that the ruthenium cylinder had the capability to photocleave DNA.19
Following on from the previous chapters, detailing cylinder binding to the DNA tetrahedron,
this chapter aims to explore the photocleavage capabilities further. By applying it in context to
the DNA tetrahedron, it was hoped to take a different angle on possible applications of PDT
by ‘breaking open’ a DNA nanostructure with an external light trigger (Figure 4.5). This
would be done with a view to release a possible internalised cargo and the first time DNA
nanotechnology and a photosensitizer of this sort are combined in this application.
4.2 Results and Discussion
4.2.1 Plasmid Photocleavage
Firstly, to establish the conditions of photocleavage, a positive control experiment was. As
discussed, the ruthenium cylinder has proven capable of DNA photocleavage19, although not
Figure 4.5 - Illustration of utilising photo-cleavage to break apart a DNA tetrahedron
Light Irradiation
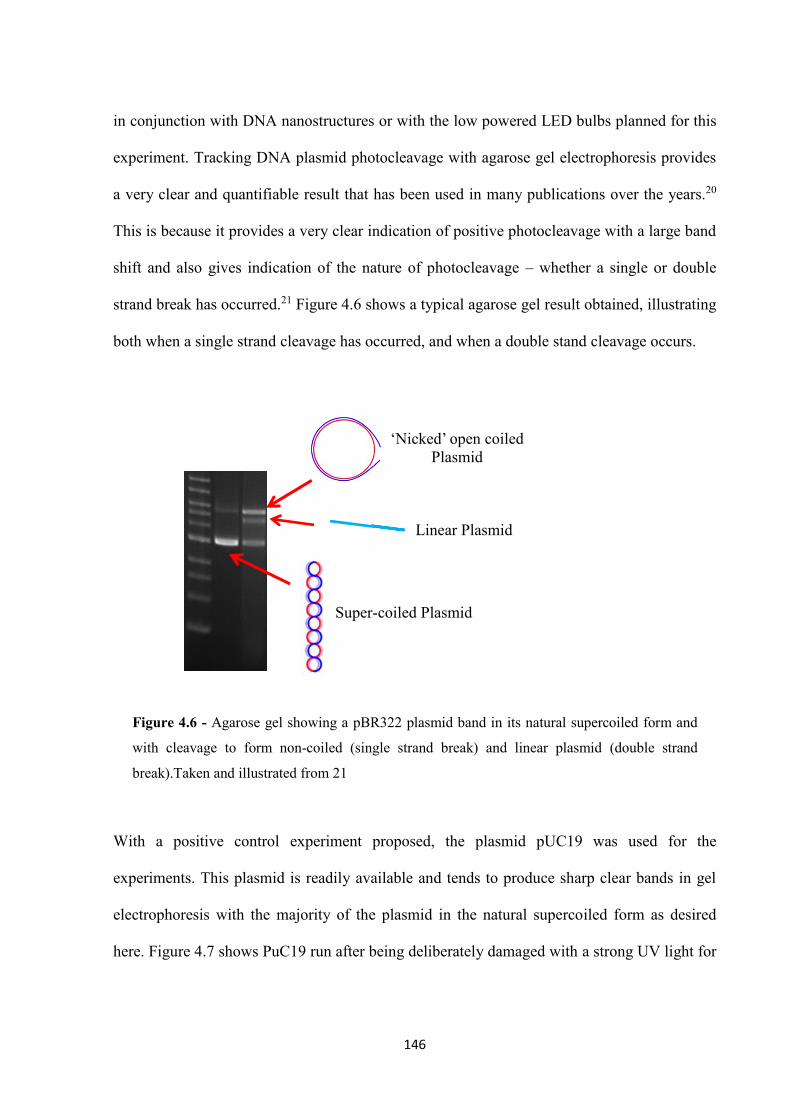
146
in conjunction with DNA nanostructures or with the low powered LED bulbs planned for this
experiment. Tracking DNA plasmid photocleavage with agarose gel electrophoresis provides
a very clear and quantifiable result that has been used in many publications over the years.20
This is because it provides a very clear indication of positive photocleavage with a large band
shift and also gives indication of the nature of photocleavage – whether a single or double
strand break has occurred.21 Figure 4.6 shows a typical agarose gel result obtained, illustrating
both when a single strand cleavage has occurred, and when a double stand cleavage occurs.
With a positive control experiment proposed, the plasmid pUC19 was used for the
experiments. This plasmid is readily available and tends to produce sharp clear bands in gel
electrophoresis with the majority of the plasmid in the natural supercoiled form as desired
here. Figure 4.7 shows PuC19 run after being deliberately damaged with a strong UV light for
Figure 4.6 - Agarose gel showing a pBR322 plasmid band in its natural supercoiled form and
with cleavage to form non-coiled (single strand break) and linear plasmid (double strand
break).Taken and illustrated from 21
Super-coiled Plasmid
‘Nicked’ open coiled
Plasmid
Linear Plasmid
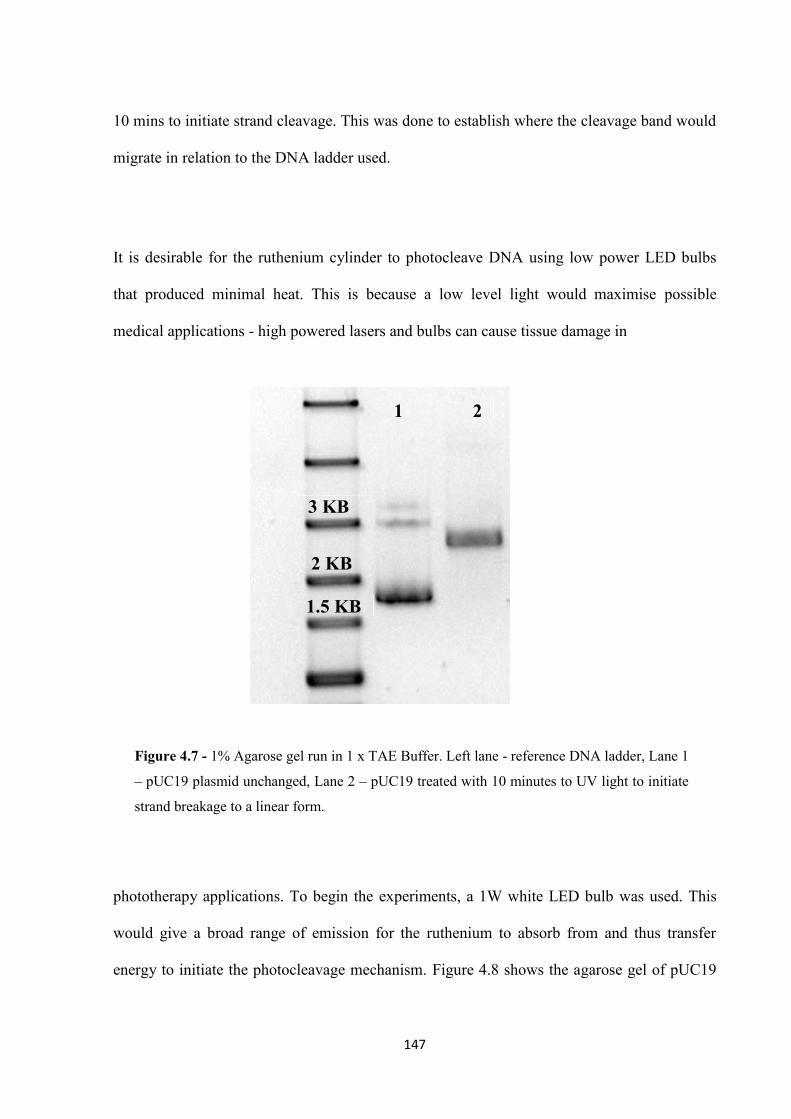
147
10 mins to initiate strand cleavage. This was done to establish where the cleavage band would
migrate in relation to the DNA ladder used.
It is desirable for the ruthenium cylinder to photocleave DNA using low power LED bulbs
that produced minimal heat. This is because a low level light would maximise possible
medical applications - high powered lasers and bulbs can cause tissue damage in
phototherapy applications. To begin the experiments, a 1W white LED bulb was used. This
would give a broad range of emission for the ruthenium to absorb from and thus transfer
energy to initiate the photocleavage mechanism. Figure 4.8 shows the agarose gel of pUC19
2 KB
1.5 KB
3 KB
1 2
Figure 4.7 - 1% Agarose gel run in 1 x TAE Buffer. Left lane - reference DNA ladder, Lane 1
– pUC19 plasmid unchanged, Lane 2 – pUC19 treated with 10 minutes to UV light to initiate
strand breakage to a linear form.
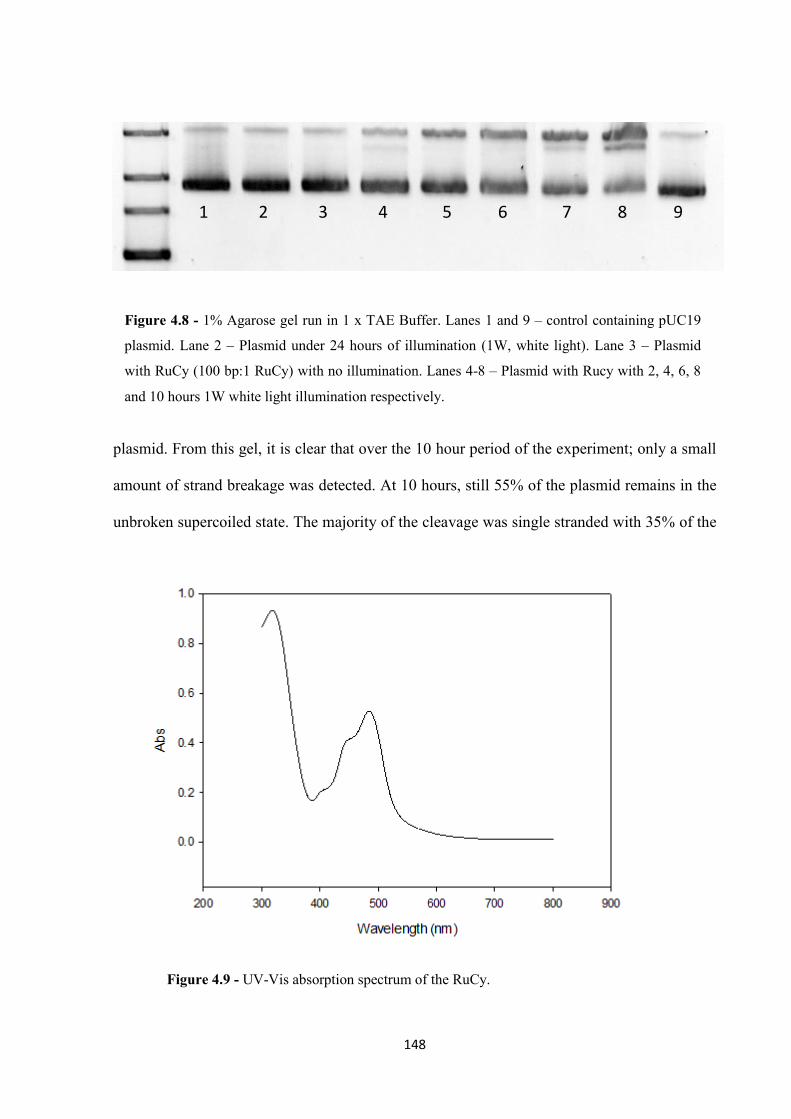
148
Figure 4.9 - UV-Vis absorption spectrum of the RuCy.
plasmid. From this gel, it is clear that over the 10 hour period of the experiment; only a small
amount of strand breakage was detected. At 10 hours, still 55% of the plasmid remains in the
unbroken supercoiled state. The majority of the cleavage was single stranded with 35% of the
Figure 4.8 - 1% Agarose gel run in 1 x TAE Buffer. Lanes 1 and 9 – control containing pUC19
plasmid. Lane 2 – Plasmid under 24 hours of illumination (1W, white light). Lane 3 – Plasmid
with RuCy (100 bp:1 RuCy) with no illumination. Lanes 4-8 – Plasmid with Rucy with 2, 4, 6, 8
and 10 hours 1W white light illumination respectively.
1 2 3 4 5 6 7 8 9
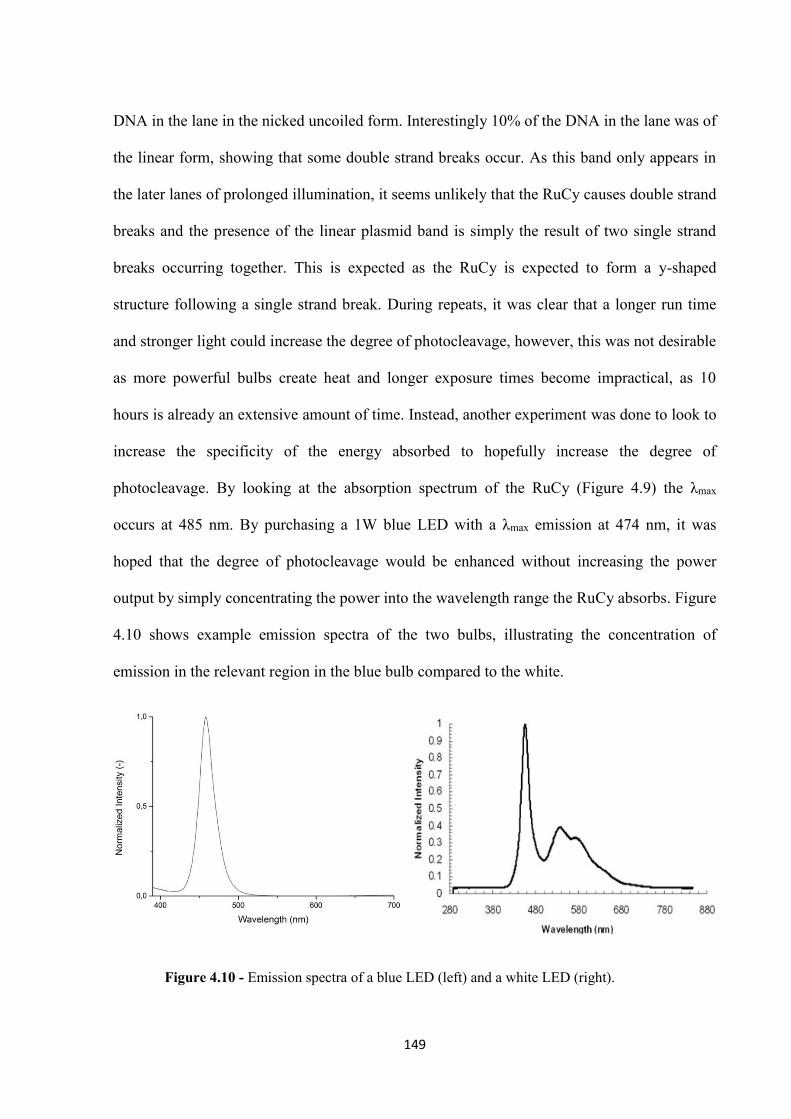
149
DNA in the lane in the nicked uncoiled form. Interestingly 10% of the DNA in the lane was of
the linear form, showing that some double strand breaks occur. As this band only appears in
the later lanes of prolonged illumination, it seems unlikely that the RuCy causes double strand
breaks and the presence of the linear plasmid band is simply the result of two single strand
breaks occurring together. This is expected as the RuCy is expected to form a y-shaped
structure following a single strand break. During repeats, it was clear that a longer run time
and stronger light could increase the degree of photocleavage, however, this was not desirable
as more powerful bulbs create heat and longer exposure times become impractical, as 10
hours is already an extensive amount of time. Instead, another experiment was done to look to
increase the specificity of the energy absorbed to hopefully increase the degree of
photocleavage. By looking at the absorption spectrum of the RuCy (Figure 4.9) the λmax
occurs at 485 nm. By purchasing a 1W blue LED with a λmax emission at 474 nm, it was
hoped that the degree of photocleavage would be enhanced without increasing the power
output by simply concentrating the power into the wavelength range the RuCy absorbs. Figure
4.10 shows example emission spectra of the two bulbs, illustrating the concentration of
emission in the relevant region in the blue bulb compared to the white.
Figure 4.10 - Emission spectra of a blue LED (left) and a white LED (right).
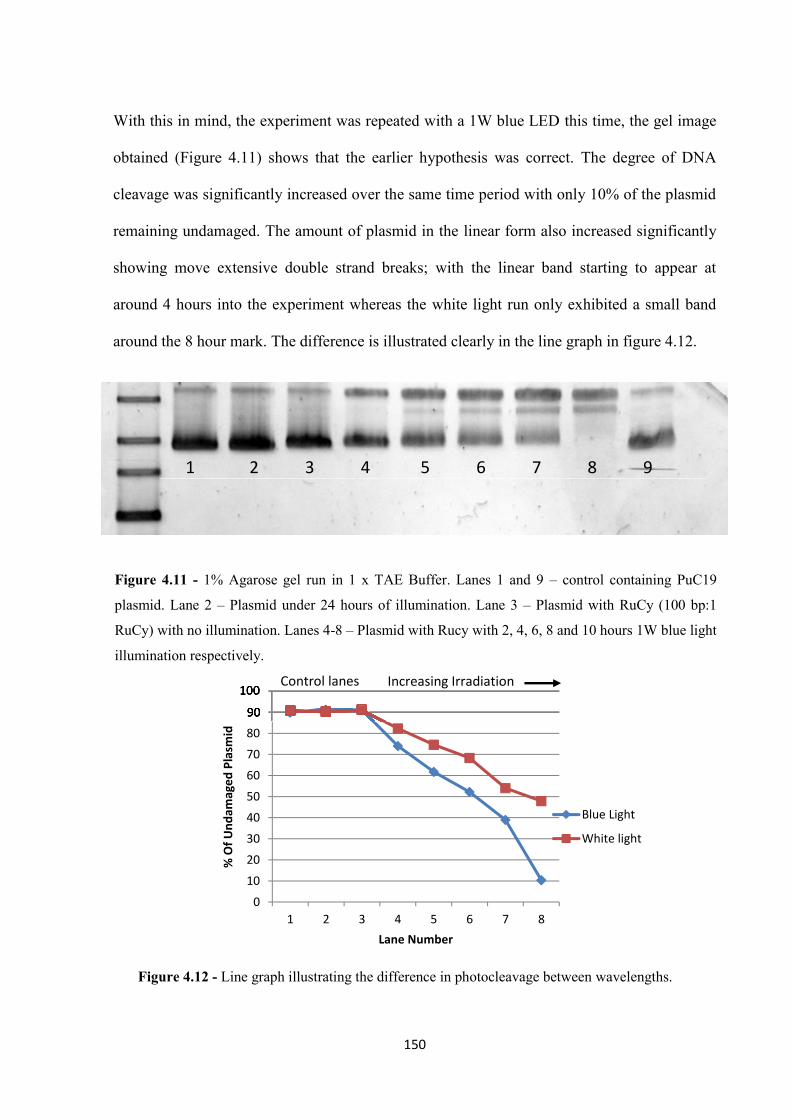
150
0
10
20
30
40
50
60
70
80
90
100
1 2 3 4 5 6 7 8
% O
f Und
amag
ed P
lasm
id
Lane Number
Blue Light
White light
Figure 4.12 - Line graph illustrating the difference in photocleavage between wavelengths.
With this in mind, the experiment was repeated with a 1W blue LED this time, the gel image
obtained (Figure 4.11) shows that the earlier hypothesis was correct. The degree of DNA
cleavage was significantly increased over the same time period with only 10% of the plasmid
remaining undamaged. The amount of plasmid in the linear form also increased significantly
showing move extensive double strand breaks; with the linear band starting to appear at
around 4 hours into the experiment whereas the white light run only exhibited a small band
around the 8 hour mark. The difference is illustrated clearly in the line graph in figure 4.12.
1 2 3 4 5 6 7 8 9
90
100
Figure 4.11 - 1% Agarose gel run in 1 x TAE Buffer. Lanes 1 and 9 – control containing PuC19
plasmid. Lane 2 – Plasmid under 24 hours of illumination. Lane 3 – Plasmid with RuCy (100 bp:1
RuCy) with no illumination. Lanes 4-8 – Plasmid with Rucy with 2, 4, 6, 8 and 10 hours 1W blue light
illumination respectively.
Control lanes Increasing Irradiation
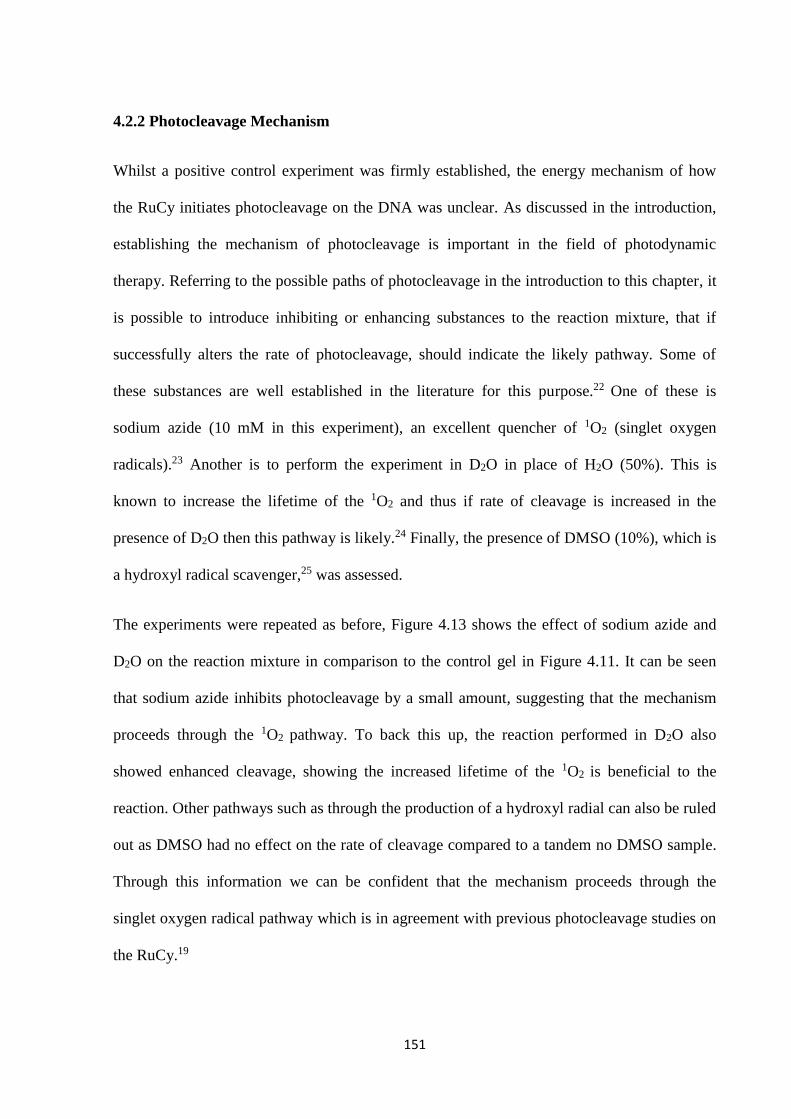
151
4.2.2 Photocleavage Mechanism
Whilst a positive control experiment was firmly established, the energy mechanism of how
the RuCy initiates photocleavage on the DNA was unclear. As discussed in the introduction,
establishing the mechanism of photocleavage is important in the field of photodynamic
therapy. Referring to the possible paths of photocleavage in the introduction to this chapter, it
is possible to introduce inhibiting or enhancing substances to the reaction mixture, that if
successfully alters the rate of photocleavage, should indicate the likely pathway. Some of
these substances are well established in the literature for this purpose.22 One of these is
sodium azide (10 mM in this experiment), an excellent quencher of 1O2 (singlet oxygen
radicals).23 Another is to perform the experiment in D2O in place of H2O (50%). This is
known to increase the lifetime of the 1O2 and thus if rate of cleavage is increased in the
presence of D2O then this pathway is likely.24 Finally, the presence of DMSO (10%), which is
a hydroxyl radical scavenger,25 was assessed.
The experiments were repeated as before, Figure 4.13 shows the effect of sodium azide and
D2O on the reaction mixture in comparison to the control gel in Figure 4.11. It can be seen
that sodium azide inhibits photocleavage by a small amount, suggesting that the mechanism
proceeds through the 1O2 pathway. To back this up, the reaction performed in D2O also
showed enhanced cleavage, showing the increased lifetime of the 1O2 is beneficial to the
reaction. Other pathways such as through the production of a hydroxyl radial can also be ruled
out as DMSO had no effect on the rate of cleavage compared to a tandem no DMSO sample.
Through this information we can be confident that the mechanism proceeds through the
singlet oxygen radical pathway which is in agreement with previous photocleavage studies on
the RuCy.19
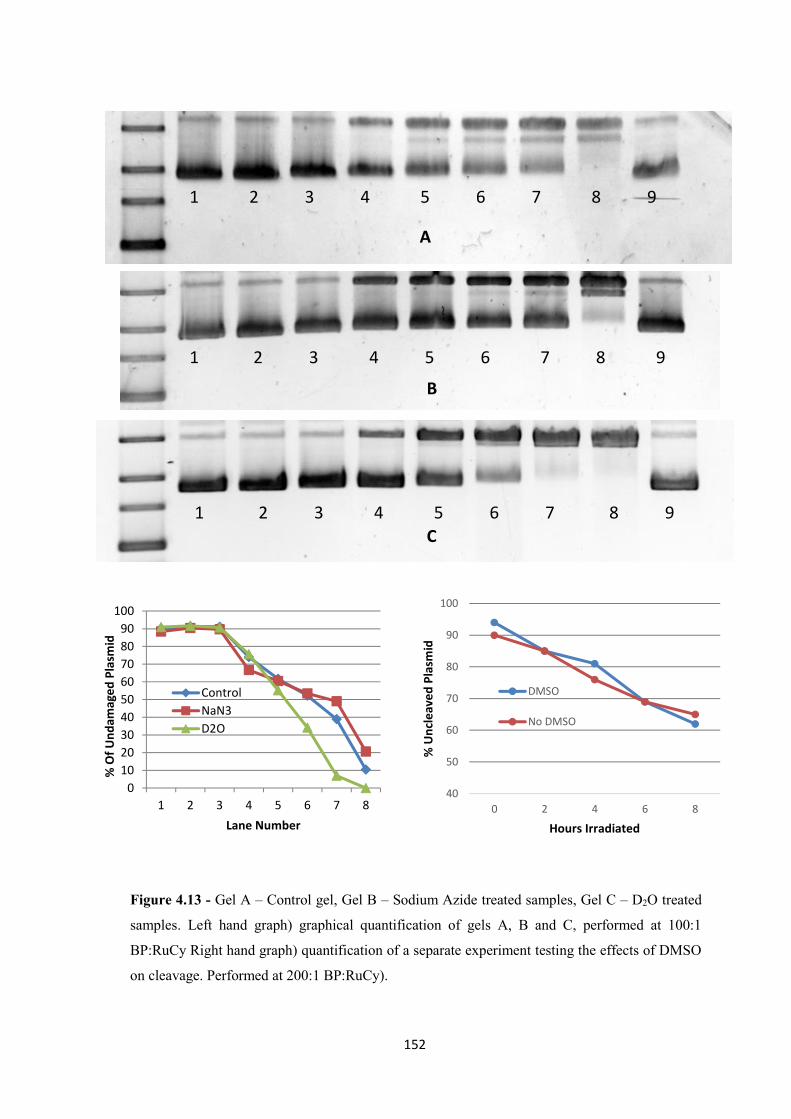
152
0
10
20
30
40
50
60
70
80
90
100
1 2 3 4 5 6 7 8
% O
f Und
amag
ed P
lasm
id
Lane Number
Control
NaN3
D2O
1 2 3 4 5 6 7 8 9
1 2 3 4 5 6 7 8 9
1 2 3 4 5 6 7 8 9
Figure 4.13 - Gel A – Control gel, Gel B – Sodium Azide treated samples, Gel C – D2O treated
samples. Left hand graph) graphical quantification of gels A, B and C, performed at 100:1
BP:RuCy Right hand graph) quantification of a separate experiment testing the effects of DMSO
on cleavage. Performed at 200:1 BP:RuCy).
A
B
C
40
50
60
70
80
90
100
0 2 4 6 8
% U
ncle
aved
Pla
smid
Hours Irradiated
DMSO
No DMSO
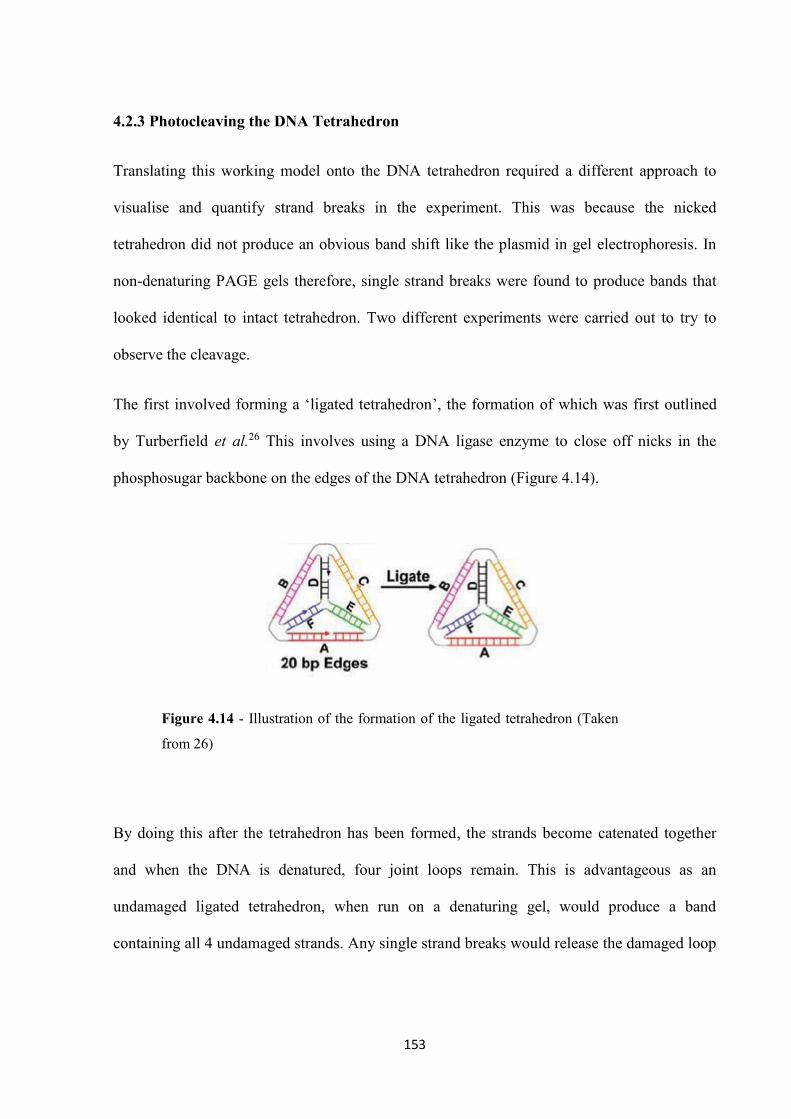
153
4.2.3 Photocleaving the DNA Tetrahedron
Translating this working model onto the DNA tetrahedron required a different approach to
visualise and quantify strand breaks in the experiment. This was because the nicked
tetrahedron did not produce an obvious band shift like the plasmid in gel electrophoresis. In
non-denaturing PAGE gels therefore, single strand breaks were found to produce bands that
looked identical to intact tetrahedron. Two different experiments were carried out to try to
observe the cleavage.
The first involved forming a ‘ligated tetrahedron’, the formation of which was first outlined
by Turberfield et al.26 This involves using a DNA ligase enzyme to close off nicks in the
phosphosugar backbone on the edges of the DNA tetrahedron (Figure 4.14).
By doing this after the tetrahedron has been formed, the strands become catenated together
and when the DNA is denatured, four joint loops remain. This is advantageous as an
undamaged ligated tetrahedron, when run on a denaturing gel, would produce a band
containing all 4 undamaged strands. Any single strand breaks would release the damaged loop
Figure 4.14 - Illustration of the formation of the ligated tetrahedron (Taken
from 26)
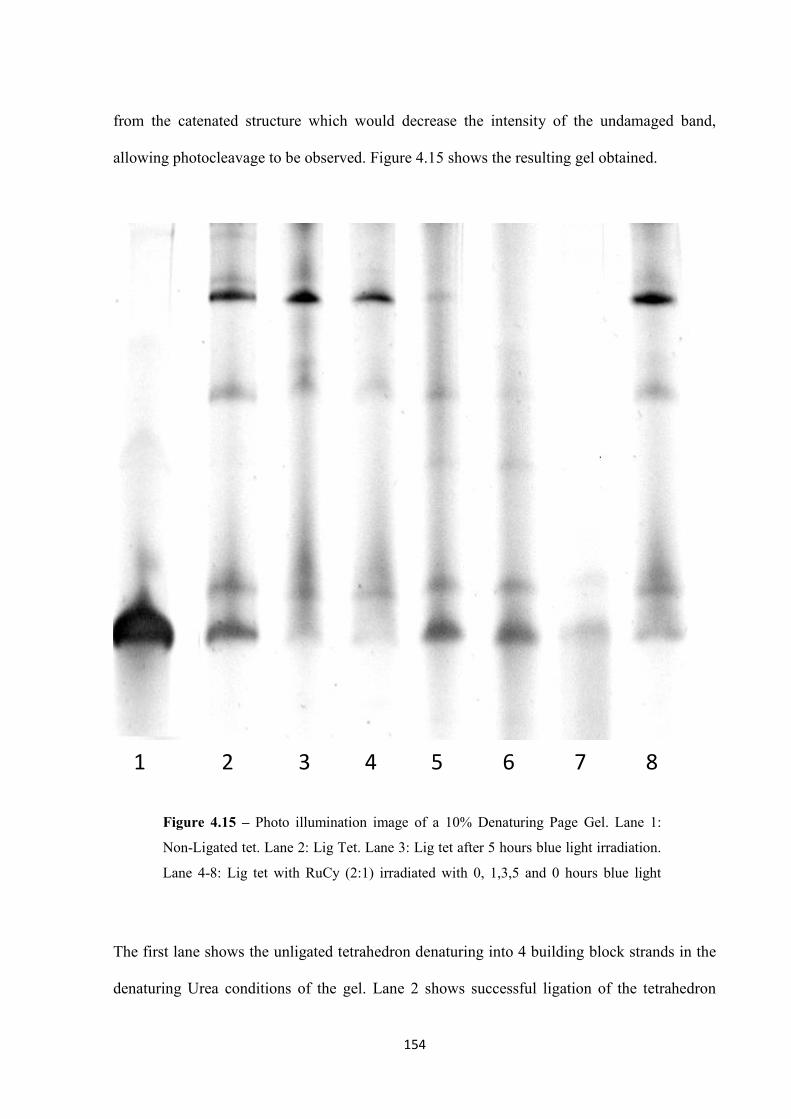
154
from the catenated structure which would decrease the intensity of the undamaged band,
allowing photocleavage to be observed. Figure 4.15 shows the resulting gel obtained.
The first lane shows the unligated tetrahedron denaturing into 4 building block strands in the
denaturing Urea conditions of the gel. Lane 2 shows successful ligation of the tetrahedron
1 2 3 4 5 6 7 8
Figure 4.15 – Photo illumination image of a 10% Denaturing Page Gel. Lane 1:
Non-Ligated tet. Lane 2: Lig Tet. Lane 3: Lig tet after 5 hours blue light irradiation.
Lane 4-8: Lig tet with RuCy (2:1) irradiated with 0, 1,3,5 and 0 hours blue light
respectively.
155
forming 4 single stranded DNA loops that cannot be separated by denaturation. Underneath
the main band at the top, there are three fainter bands; these are products of incomplete
ligation, corresponding to a 3 single stranded loop, 2 stranded loop, and 1 strand alone at the
bottom, equal in migration to the deconstructed unligated tetrahedron in lane 1, confirming
identity of the band. It is unclear as to why the ligation is not 100% effective. In previous
similar experiments to this gel, ligation was left to proceed for 4 hours as per manufacture
protocol and much less ligation efficiency was observed. Extended overnight ligation and
excess T4 DNA ligase enzyme as shown here improved ligation efficiency to the point seen
here, but total ligation was never achieved. This could be due to phosphorylation
inefficiencies and due to the short sides of the tetrahedron not allowing enough space/DNA
turns for the enzyme to initiate to full effect. Lanes 2 and 8 show that without RuCy, the blue
light does not cause any damage to the DNA. As the duration of light irradiation increases, the
tetrahedron is broken down until no intact DNA is left in lane 7. In lanes 5 and 6, it can be
observed that bands attributed to the smaller structures increase in intensity. This gave some
insight that the RuCy is cleaving initially at some point on one strand. Future work is
currently planned to attempt to excise these photocleavage product bands and sequence them
to try to see if the RuCy’s original binding and subsequent cleavage position on the
tetrahedron can be found by analysing the starting sequences of the cleaved product and
comparing them to the original construction strands. As irradiation continues, it is possible
that the RuCy cleaves and can then re bind to resulting DNA and cause further cleavage;
almost no observed DNA bands have been stained in lane 7, leaving only a smear low down
the lane. Alternatively, the RuCy could remain bound inside a vertex and continues cleaving
sequentially. This suggests only very small randomly sized fragments remain as the SYBR
gold stain could not be used to visualise them as they are so low in concentration. Overall,
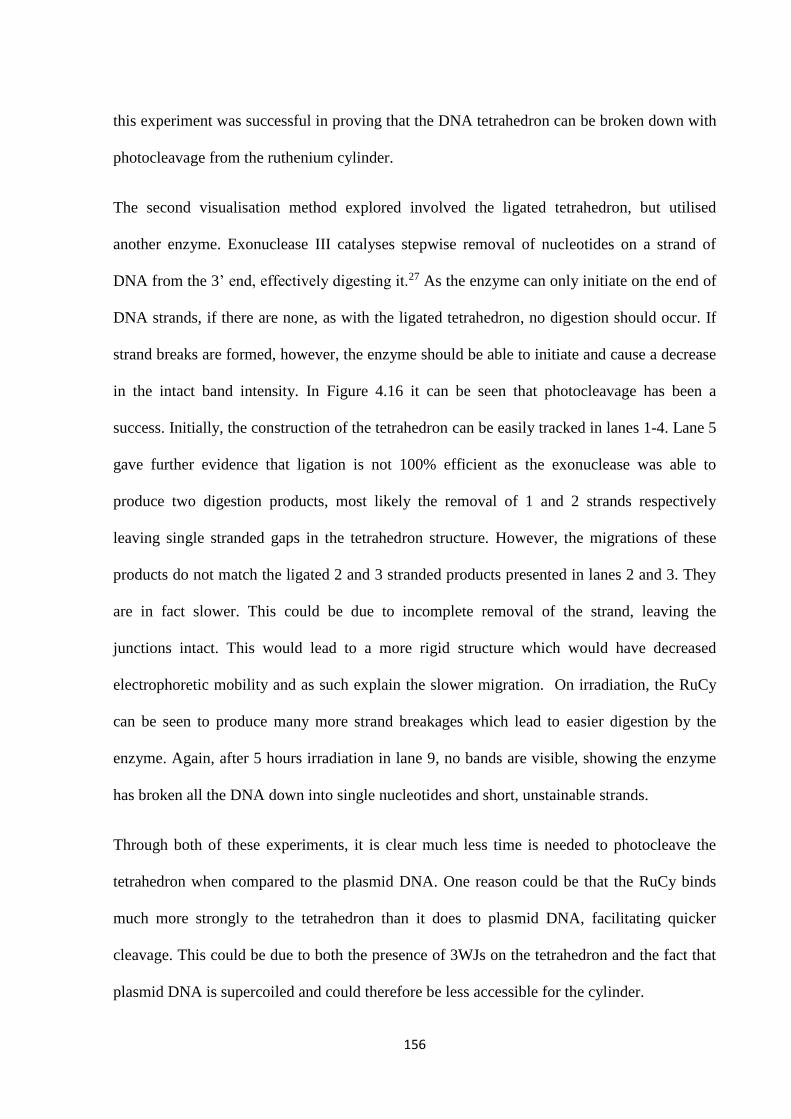
156
this experiment was successful in proving that the DNA tetrahedron can be broken down with
photocleavage from the ruthenium cylinder.
The second visualisation method explored involved the ligated tetrahedron, but utilised
another enzyme. Exonuclease III catalyses stepwise removal of nucleotides on a strand of
DNA from the 3’ end, effectively digesting it.27 As the enzyme can only initiate on the end of
DNA strands, if there are none, as with the ligated tetrahedron, no digestion should occur. If
strand breaks are formed, however, the enzyme should be able to initiate and cause a decrease
in the intact band intensity. In Figure 4.16 it can be seen that photocleavage has been a
success. Initially, the construction of the tetrahedron can be easily tracked in lanes 1-4. Lane 5
gave further evidence that ligation is not 100% efficient as the exonuclease was able to
produce two digestion products, most likely the removal of 1 and 2 strands respectively
leaving single stranded gaps in the tetrahedron structure. However, the migrations of these
products do not match the ligated 2 and 3 stranded products presented in lanes 2 and 3. They
are in fact slower. This could be due to incomplete removal of the strand, leaving the
junctions intact. This would lead to a more rigid structure which would have decreased
electrophoretic mobility and as such explain the slower migration. On irradiation, the RuCy
can be seen to produce many more strand breakages which lead to easier digestion by the
enzyme. Again, after 5 hours irradiation in lane 9, no bands are visible, showing the enzyme
has broken all the DNA down into single nucleotides and short, unstainable strands.
Through both of these experiments, it is clear much less time is needed to photocleave the
tetrahedron when compared to the plasmid DNA. One reason could be that the RuCy binds
much more strongly to the tetrahedron than it does to plasmid DNA, facilitating quicker
cleavage. This could be due to both the presence of 3WJs on the tetrahedron and the fact that
plasmid DNA is supercoiled and could therefore be less accessible for the cylinder.
157
Figure 4.16 – Photo illumination picture 10% Non-denaturing PAGE gel. Lane 1: Strand 1 ligated,
Lane 2: Strands 1 + 2 ligated, Lane 3: Strands 1 + 2 + 3 ligated, Lane 4: Full Ligated tetrahedron.
Lane 5: Lig-tet exposed to Exonuclease III for 30 mins after no light irradiation. Lane 6: Lig-tet with
2:1 RuCy and no light with Exonuclease III. Lanes 7-9, same as lane 6 but with 1, 3, 5 hours of 1W
Blue LED illumination respectively. Lane 10: Control Lig-Tet only with 5 hours light and digestion.
Gel stained with SYBR-Gold nucleic acid stain.
1 2 3 4 5 6 7 8 9 10
158
4.2.4 Initial Photodynamic Therapy Testing
Ruthenium cylinder for this section was kindly provided by Dr Lucia Cardo
With positive results obtained with the RuCy as a photocleavage agent, some initial in vitro
testing was carried out to test whether the RuCy and RuCy-tetrahedron conjugate could enter
cells, bind to cellular DNA and on excitation with blue light cause damage that triggers cell
apoptosis. The focus now would be using the DNA tetrahedron as a delivery agent and
targeting nuclear DNA for photocleavage. There are some key questions that it was hoped the
testing would address. Firstly, confirmation was sought that extensive illumination with the
blue light would not be harmful to cells alone. This would be desirable as current PDT
therapies often use powerful lasers or strong fibre optic lights that produce excess heat and
causes tissue damage in patients in the treatment area.13 From the start of this section it was
the aim to be able to cause DNA damage with a bulb that does not cause excess heat or at a
wavelength that damages DNA alone.
A second aim was that without light excitation, the complexes would not be toxic to cells at
doses shown to be active upon photo activation. This is important as low toxicity in vitro
would suggest low side effects outside of the irradiated area and provide a large therapeutic
window which would be advantageous relative to current cancer therapeutics.
Finally, as ICP-MS results shown in chapter 3, it was hoped that the increased cellular
accumulation of RuCy when delivered by the tetrahedron as opposed to cylinder alone would
cause an enhanced effect of photo activated toxicity in cells. A decrease in activity is also
possible as some of the RuCy may remain bound to the tetrahedron and instead cause strand
breaks to it. This decrease in activity was observed in MTT assays shown in chapter 3 also
when delivering FeCy with tetrahedron.
159
The initial experiment involved a crude set up using a desk lamp fitted with the same LED
bulb used throughout the chapter. 96-well plates could then be fitted to the lamp at a measured
distance. Only wells directly above the bulb were used in an attempt to make each well
receive the same intensity of light. The set-up, however, will need to be optimised in future to
guarantee this. Two 96-well plates were seeded with HeLa cells and following treatment with
the complexes, one plate was irradiated with the lamp. The other dark control plate was also
left out of the incubator and kept in darkness. It was kept outside of the incubator as it proved
impossible to set up the lamp inside a temperature controlled incubator and so to ensure cell
death contributed to by 2 hours of room temperature exposure, the control was kept in the
same conditions.
After irradiation, the cells were incubated for 24 hours to allow the apoptosis mechanisms to
initiate in response to any possible DNA damage caused. Following this a standard MTT
assay was performed to establish cell viability for each of the samples. Figure 4.17 shows the
results of this experiment.
From these results, it can be seen that the first aim of the experiment has been achieved to a
large extent. The blue light has only a small effect on the cell viability (~15%) in comparison
to the dark control in the absence of any complexes. The data is noisy but it is worth noting
that these are still preliminary experiments and more repeats of this experiment will need to
be performed before it is statistically significant.
The second aim of the experiment was to show the complexes are non-toxic to a large extent
without light irradiation. Here it can be seen that the RuCy reduces cell viability to 50% by 10
µM treatment. This was surprising as previous unpublished work within the Hannon group on
RuCy show the toxicity to be lower than seen here. However, at concentrations of 1 and 2
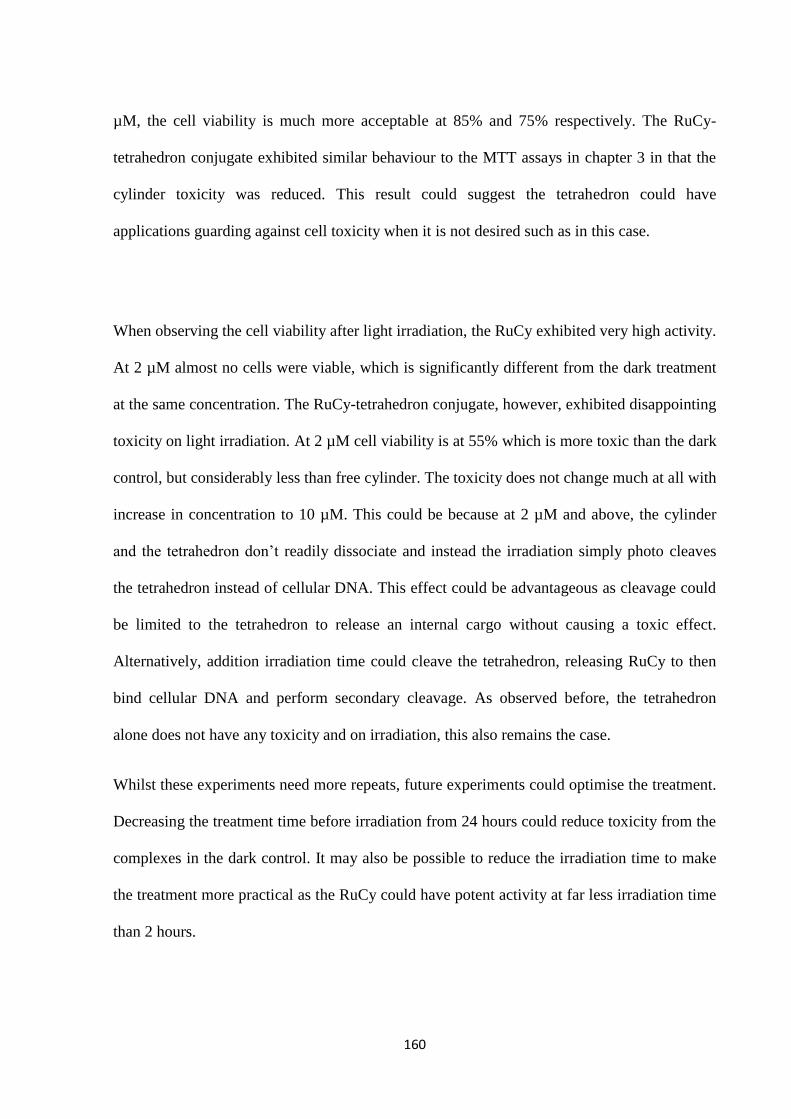
160
µM, the cell viability is much more acceptable at 85% and 75% respectively. The RuCy-
tetrahedron conjugate exhibited similar behaviour to the MTT assays in chapter 3 in that the
cylinder toxicity was reduced. This result could suggest the tetrahedron could have
applications guarding against cell toxicity when it is not desired such as in this case.
When observing the cell viability after light irradiation, the RuCy exhibited very high activity.
At 2 µM almost no cells were viable, which is significantly different from the dark treatment
at the same concentration. The RuCy-tetrahedron conjugate, however, exhibited disappointing
toxicity on light irradiation. At 2 µM cell viability is at 55% which is more toxic than the dark
control, but considerably less than free cylinder. The toxicity does not change much at all with
increase in concentration to 10 µM. This could be because at 2 µM and above, the cylinder
and the tetrahedron don’t readily dissociate and instead the irradiation simply photo cleaves
the tetrahedron instead of cellular DNA. This effect could be advantageous as cleavage could
be limited to the tetrahedron to release an internal cargo without causing a toxic effect.
Alternatively, addition irradiation time could cleave the tetrahedron, releasing RuCy to then
bind cellular DNA and perform secondary cleavage. As observed before, the tetrahedron
alone does not have any toxicity and on irradiation, this also remains the case.
Whilst these experiments need more repeats, future experiments could optimise the treatment.
Decreasing the treatment time before irradiation from 24 hours could reduce toxicity from the
complexes in the dark control. It may also be possible to reduce the irradiation time to make
the treatment more practical as the RuCy could have potent activity at far less irradiation time
than 2 hours.
161
0
0.2
0.4
0.6
0.8
1
1.2
0 2 4 6 8 10 12
Abso
rban
ce
Concentration (µM)
RuCy
Tet-RuCy
Tet
0
0.1
0.2
0.3
0.4
0.5
0.6
0.7
0.8
0.9
1
0 2 4 6 8 10 12
Abso
rban
ce
Concentration (µM)
RuCy
Tet-RuCy
Tet
Figure 4.17 – MTT assays of HeLa cells (Cervical) N=1 with data points performed
in duplicate. Top) Cell viability when cells have been treated and kept in the dark.
Bottom) Cell viability after 2 hour irradiation with blue light. Absorbance has been
normalised to the dark 0 µM data to offer easy comparison.
162
4.3 Conclusions
Overall, the RuCy was shown to be able to bind to DNA and act as a photosensitizer leading
to DNA damage. This was shown to be possible even using a weak light source. This opens
up further possible research into the area of photodynamic therapy.
When bound to the DNA tetrahedron, the RuCy was shown to break down the structure in
two different experiments. This was especially interesting as it is the first time to our
knowledge that a photosensitizer has been used in the fashion. In terms of future research, it
could be possible to encapsulate a cargo that would be then released following light
irradiation. As the tetrahedron-cylinder conjugate has already been shown to enter cells,
internal cargo such as cytotoxic viruses28 or peptides, the latter of which often are degraded
by proteolysis before it makes it to cells29, could be carried into cells in the body and then
activated in that area using light.
In initial PDT testing in vitro, the RuCy was shown to have extremely potent cytotoxic
activity on irradiation with blue light. (More repeats needed but impossible at the time due to
lack of RuCy due to the problematic synthesis). The effect is diminished with the RuCy-
tetrahedron conjugate, but this could provide an opportunity to use the conjugate to deliver a
different internalised cargo. It is also worth noting that translating these positive results to an
in vivo model could be problematic, this is because light in the red region of the spectrum has
the best tissue penetration, able to activate effectively around 3 mm deep. Blue light however,
can only activate compounds to a depth of 1 mm.30 Medical devices and light sources for this
exact purpose however, are being improved at rapid pace which could minimise this decrease
in efficiency.
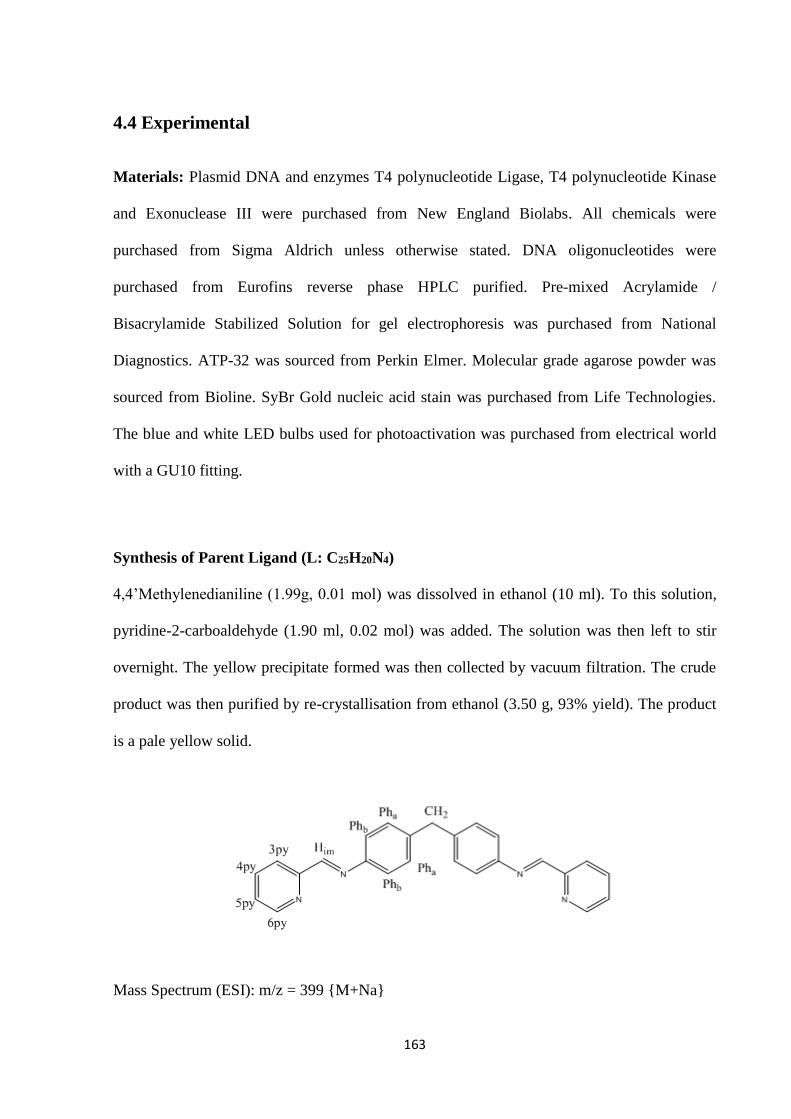
163
4.4 Experimental
Materials: Plasmid DNA and enzymes T4 polynucleotide Ligase, T4 polynucleotide Kinase
and Exonuclease III were purchased from New England Biolabs. All chemicals were
purchased from Sigma Aldrich unless otherwise stated. DNA oligonucleotides were
purchased from Eurofins reverse phase HPLC purified. Pre-mixed Acrylamide /
Bisacrylamide Stabilized Solution for gel electrophoresis was purchased from National
Diagnostics. ATP-32 was sourced from Perkin Elmer. Molecular grade agarose powder was
sourced from Bioline. SyBr Gold nucleic acid stain was purchased from Life Technologies.
The blue and white LED bulbs used for photoactivation was purchased from electrical world
with a GU10 fitting.
Synthesis of Parent Ligand (L: C25H20N4)
4,4’Methylenedianiline (1.99g, 0.01 mol) was dissolved in ethanol (10 ml). To this solution,
pyridine-2-carboaldehyde (1.90 ml, 0.02 mol) was added. The solution was then left to stir
overnight. The yellow precipitate formed was then collected by vacuum filtration. The crude
product was then purified by re-crystallisation from ethanol (3.50 g, 93% yield). The product
is a pale yellow solid.
Mass Spectrum (ESI): m/z = 399 {M+Na}
164
1H NMR (300 MHz), CDCl3, 298K): δ 8.71 (2H, d, J = 3.9 Hz, 6py), δ 8.63 (2H, s, J = Him), δ
8.22 (2H, d, J = 7.0 Hz 3py), δ 7.82 (2H, td, J = 8.3, 1.9, 0.6 Hz, 4py), δ 7.40 (2H, ddd, J =
7.6, 4.9, 1.2 Hz, 5py), δ 7.30 (8H, m, Pha and Phb), δ 4.08 (2H, s, CH2)
Synthesis of Ruthenium Cylinder, [Ru2(L)3](PF6)4: RuCl3 (3g, 14.5 mmol) was dissolved
in 15 mL of DMSO and heated under reflux at 195oC for 5 minutes. The solution was reduced
in vacuo to concentrate the solution down to 1 mL. Excess cold acetone was then added to
precipitate a yellow solid. The yellow precipitate was then filtered and washed with cold
acetone to furnish the yellow solid Ru(DMSO)4Cl2.
Ru(DMSO)4Cl2 (0.988 g, 2.04 mmol) and parent ligand (1.150 g, 3.06 mmol) were added to
degassed Ethylene glycol (50 ml) and heated to reflux under argon at 200oC for 5 days. The
mixture was allowed to cool and an excess saturated methanolic solution of ammonium
hexaflourophosphate was added. The suspension was cooled on ice before the precipitate was
filtered and washed with methanol (2 x 40 ml) and dried with ether (3 x 100 ml). The dark
brown product was purified by column chromatography on alumina using 20:1:1 MeCN/H2O/
KNO3(aq) solution as eluent to yield the product as an orange solid (11 mg, 0.6% yield). The
chloride complex could be formed by anion metathesis.
Mass Spectrum Positive ion ESI: m/z = 666 [M-(PF6)4]2+, 444 [M-(PF6)]
3+ , 333.2 [M-(PF6)4+
1H NMR (300MHz), CD3CN, 298K : δ = 8.7 (2H, s, Him), 8.45 (2H, d, J = 7.6 Hz, 6py), 8.35
(2H, td, J = 7.78 Hz, 5.0 Hz, 3py), 7.65 (2H, d, J = 6.0 Hz, 4py), 7.65 (2H, d, J = 6.0 Hz, 5py),
7.0 (4H, d, J = 8.4 Hz, Pha/b), 5.7 (4H, d, J = 8.3 Hz, Pha/b), 4.1 (2H, s, CH2)
UV-Vis (CH3CN) : λmax (ε / dm3 mol-1 cm-1) 485 (24200)
165
Plasmid Photocleavage: PuC19 plasmid (200 ng per sample) in Tris.HCl buffer (50mM pH
8.0) was incubated with RuCy (0.33 µM) to a final volume of 10 µL for 1 hour in the dark in
0.5 mL Eppendorfs. Samples were then illuminated for the allotted time over either a 1W blue
or 1W white LED bulb. Samples not requiring illumination were then kept at 4oC in the dark.
Agarose Gel Electrophoresis: 1% agarose gel was prepared by mixing 0.9 g agarose in 1 X
TAE buffer (40mM Tris, 20mM Acetic Acid, 1mM EDTA, pH 8.5) and heated in a
microwave until fully dissolved. The gel was allowed to cool to around 60oC before being
poured into a 20x15 cm gel cassette in a casting tray, ensuring any bubbles created were
removed with a spatula. The gel was allowed to cool and set fully for 60 mins. Once set the
gel was placed inside the buffer tank and immersed in 1 x TAE buffer. Samples were then
loaded into the wells, using purple gel loading dye (New England Biolabs) to aid in
visualisation and to help the samples settle in the well. The gel was then run at 4V/cm for 120
mins. The gel cassette was then removed from the tank and stained using SYBR gold nuclear
acid gel stain (Invitrogen) for 30 mins. The gel was then photographed and analysed using a
UV transilluminator (AlphaImager HP, ProteinSimple).
Ligated Tetrahedron Construction: Four oligonucleotides were purchased from Eurofins,
each of 63 bases in length. The sequences were as follows:
1: AGGCAGTTGAGACGAACATTCCTAAGTCTGAAATTTATCACCCGCCATAGTAGACGTATCACC
2: CTTGCTACACGATTCAGACTTAGGAATGTTCGACATGCGAGGGTCCAATACCGACGATTACAG
3: GGTGATAAAACGTGTAGCAAGCTGTAATCGACGGGAAGAGCATGCCCATCCACTACTATGGCG
4: CCTCGCATGACTCAACTGCCTGGTGATACGAGGATGGGCATGCTCTTCCCGACGGTATTGGAC
166
All strands were reverse-phase HPLC purified. Each strand was then phosphorylated by
mixing 2.4 µl of 100 µM of the oligonucleotide with 9.6 µl of MilliQ water, 2 µl of 10 x T4
polynucleotide kinase buffer, 2 µl of bacteriophage T4 polynucleotide kinase and 4 µl of ATP
in an Eppendorf and leaving to incubate at 37oC for an hour before heat inactivation at 80oC.
Each phosphorylated strand was then purified using a QIAquick nucleotide removal kit
following a previously discussed protocol in chapter 2. Stoichiometric quantities of each
phosphorylated strand were mixed in TM buffer (10mM Tris base, 5mM MgCl2, pH 8) and
heated to 95 oC in a thermal block for 5 minutes. On cooling at room temperature for 30
seconds, the eppendorf was placed on ice for 5 minutes and then centrifuged for 5 seconds.
10mM DTT and 1 µL per 10 µL of reaction mixture of T4 DNA ligase enzyme was added and
the resulting mixture left to incubate for 24 hours at room temperature. The enzyme was once
again heat inactivated at 70oC for 10 mins and the resulting DNA product purified on a 10%
denaturing PAGE gel and the excised DNA concentration check by UV-Vis.
Ligated Tetrahedron Photocleavage: 5 µL of LigTet was mixed with 0.75 mL of 10 µM
RuCy and 4.25 µL of MilliQ H2O. The sample was then irradiated under 1W Blue LED light
for the allotted time before being stored at 4oC in the dark.
DNA digestion: Samples to be digested were first bufferd to 1x concentration using 10x
NEBuffer 1 (New England Biolabs). 1 µL of Exonuclease III (New England Biolabs) per 10
µL of reaction mixture was then added. The mixture was incubated for 30 mins and heat
inactivated at 70oC for 10 mins.
Denaturing Gel Electrophoresis: 10% denaturing polyacrylamide gel was prepared by
mixing 17 mL 30% 29:1 acrylamide/bis-acrylamide, 5 mL 10x TB buffer, 24g Urea, 25 µL
167
TEMED, 230 µL 10% ammonium persulfate solution and topped up to 50 mL with dd H2O
and leaving to set between two glass plates with a comb for 60 mins. The samples where then
loaded and run at 11V /cm of gel for 180 mins. The gel was then removed from the plates and
stained with SYBR gold nucleic acid get stain for 30 mins before being visualised and
photographed under a UV transilluminator.
Native Polyacrylamide Gel Electrophoresis: 10% Native gel was prepared by mixing 17
mL 30% 29:1 acrylamide/bis-acrylamide, 5 mL 10x TB buffer, 25 µL TEMED, 230 µL 10%
ammonium persulfate solution and topped up to 50 mL with dd H2O and leaving to set
between two glass plates with a comb for 60 mins. The samples were then loaded and run at
11V /cm of gel for 180 mins. The gel was then removed from the plates and stained with
SYBR gold nucleic acid get stain for 30 mins before being visualised and photographed under
a UV transilluminator.
Photodynamic Therapy MTT
HeLa cells were seeded into two 96-well plates at 5000 cells per well, each well containing
200 µL of DMEM. This plates were left for 24 hours before being treated with the complexes
to the final concentrations indicated to a volume of 100 µL in DMEM. Cells were incubated
for a further 24 hours with the complexes. One plate was then irradiated with a 574 nm blue
LED bulb for 1 hour before being placed back inside the incubator for 15 minutes to retain a
temperature of 37oC before another hour of irradiation. Following this, cells were then
incubated for a further 24 hours before cell viability was checked through a standard MTT
assay described above.
168
4.5 References
1. Y. Sun, L.E. Joyce, N.M. Dickson, and C. Turro, Efficient DNA photocleavage by
[Ru(bpy)2(dppn)]2+ with visible light. Chemical Communications, 2010. 46(14): p. 2426-2428.
2. M.J. Clarke, Ruthenium metallopharmaceuticals. Coordination Chemistry Reviews, 2003.
236(1–2): p. 209-233.
3. A.E. Friedman, J.C. Chambron, J.P. Sauvage, N.J. Turro, and J.K. Barton, A molecular light
switch for DNA: Ru(bpy)2(dppz)2+. Journal of the American Chemical Society, 1990. 112(12):
p. 4960-4962.
4. J.K. Barton, Metals and DNA: molecular left-handed complements. Science, 1986. 233(4765):
p. 727-34.
5. N.J. Turro, J.K. Barton, and D.A. Tomalia, Molecular recognition and chemistry in restricted
reaction spaces. Photophysics and photoinduced electron transfer on the surfaces of micelles,
dendrimers, and DNA. Accounts of Chemical Research, 1991. 24(11): p. 332-340.
6. L. Troian-Gautier and C. Moucheron, RutheniumII Complexes bearing Fused Polycyclic
Ligands: From Fundamental Aspects to Potential Applications. Molecules, 2014. 19(4): p.
5028.
7. R. Lincoln, L. Kohler, S. Monro, H. Yin, M. Stephenson, R. Zong, A. Chouai, C. Dorsey, R.
Hennigar, R.P. Thummel, and S.A. McFarland, Exploitation of Long-Lived 3IL Excited States for
Metal–Organic Photodynamic Therapy: Verification in a Metastatic Melanoma Model.
Journal of the American Chemical Society, 2013. 135(45): p. 17161-17175.
8. Y. Zhang, Q. Zhou, Y. Zheng, K. Li, G. Jiang, Y. Hou, B. Zhang, and X. Wang, DNA
Photocleavage by Non-innocent Ligand-Based Ru(II) Complexes. Inorganic Chemistry, 2016.
55(9): p. 4296-4300.
169
9. J.-P. Lecomte, A. Kirsch-De Mesmaeker, M.M. Feeney, and J.M. Kelly, Ruthenium(II)
Complexes with 1,4,5,8,9,12-Hexaazatriphenylene and 1,4,5,8-Tetraazaphenanthrene
Ligands: Key Role Played by the Photoelectron Transfer in DNA Cleavage and Adduct
Formation. Inorganic Chemistry, 1995. 34(26): p. 6481-6491.
10. T. Romero-Morcillo, F.J. Valverde-Munoz, M.C. Munoz, J.M. Herrera, E. Colacio, and J.A. Real,
Two-step spin crossover behaviour in the chiral one-dimensional coordination polymer
[Fe(HAT)(NCS)2][infinity]. RSC Advances, 2015. 5(85): p. 69782-69789.
11. Q.-X. Zhou, W.-H. Lei, C. Li, Y.-J. Hou, X.-S. Wang, and B.-W. Zhang, DNA photocleavage in
anaerobic conditions by a Ru(ii) polypyridyl complex with long wavelength MLCT absorption.
New Journal of Chemistry, 2010. 34(1): p. 137-140.
12. J. Wang, D.F. Zigler, N. Hurst, H. Othee, B.S.J. Winkel, and K.J. Brewer, A new, bioactive
structural motif: Visible light induced DNA photobinding and oxygen independent
photocleavage by RuII, RhIII bimetallics. Journal of Inorganic Biochemistry, 2012. 116: p. 135-
139.
13. D.E. Dolmans, D. Fukumura, and R.K. Jain, Photodynamic therapy for cancer. Nature Review
Cancer, 2003. 3(5): p. 380-7.
14. B.C. Wilson, Photodynamic therapy for cancer: principles. Canadian Journal Gastroenterol
and Hepatology, 2002. 16(6): p. 393-6.
15. T.J. Dougherty, C.J. Gomer, B.W. Henderson, G. Jori, D. Kessel, M. Korbelik, J. Moan, and Q.
Peng, Photodynamic therapy. Journal of the National Cancer Institute, 1998. 90(12): p. 889-
905.
16. S. Tsukagoshi, [Porfimer sodium (Photofrin-II)]. Gan To Kagaku Ryoho, 1995. 22(9): p. 1271-8.
17. E.F. Gudgin Dickson, R.L. Goyan, and R.H. Pottier, New directions in photodynamic therapy.
Cell Molecular Biology, 2002. 48(8): p. 939-54.
170
18. R. Shi, C. Li, Z. Jiang, W. Li, A. Wang, and J. Wei, Preclinical Study of Antineoplastic
Sinoporphyrin Sodium-PDT via In Vitro and In Vivo Models. Molecules, 2017. 22(1): p. 112.
19. J. Malina, M.J. Hannon, and V. Brabec, Interaction of Dinuclear Ruthenium(II) Supramolecular
Cylinders with DNA: Sequence-Specific Binding, Unwinding, and Photocleavage. Chemistry – A
European Journal, 2008. 14(33): p. 10408-10414.
20. S.R. Chatterjee, S.J. Shetty, T.P.A. Devasagayam, and T.S. Srivastava, Photocleavage of
plasmid DNA by the prophyrin meso-tetrakis[4-(carboxymethyleneoxy)phenyl]porphyrin.
Journal of Photochemistry and Photobiology B: Biology, 1997. 41(1): p. 128-135.
21. Q.-X. Zhou, W.-H. Lei, Y. Sun, J.-R. Chen, C. Li, Y.-J. Hou, X.-S. Wang, and B.-W. Zhang,
[Ru(bpy)3−n(dpb)n]2+: Unusual Photophysical Property and Efficient DNA Photocleavage
Activity. Inorganic Chemistry, 2010. 49(11): p. 4729-4731.
22. S.R. Chatterjee, S.J. Shetty, T.P. Devasagayam, and T.S. Srivastava, Photocleavage of plasmid
DNA by the prophyrin meso-tetrakis[4-(carboxymethyleneoxy)phenyl]porphyrin. Journal of
Photochemistry and Photobiology B, 1997. 41(1-2): p. 128-35.
23. S. Mashiko, N. Suzuki, S. Koga, M. Nakano, T. Goto, T. Ashino, I. Mizumoto, and H. Inaba,
Measurement of rate constants for quenching singlet oxygen with a Cypridina luciferin
analog (2-methyl-6-[p-methoxyphenyl]-3,7-dihydroimidazo[1,2-a]pyrazin-3-one) and sodium
azide. Journal of Bioluminescence and Chemiluminescence, 1991. 6(2): p. 69-72.
24. C. Kanony, A.-S. Fabiano-Tixier, J.-L. Ravanat, P. Vicendo, and N. Paillous, Photosensitization
of DNA Damage by a New Cationic Pyropheophorbide Derivative: Sequence-specific
Formation of a Frank Scission. Photochemistry and Photobiology, 2003. 77(6): p. 659-667.
25. B. Armitage, Photocleavage of Nucleic Acids. Chemical Reviews, 1998. 98(3): p. 1171-1200.
26. R.P. Goodman, I.A.T. Schaap, C.F. Tardin, C.M. Erben, R.M. Berry, C.F. Schmidt, and A.J.
Turberfield, Rapid Chiral Assembly of Rigid DNA Building Blocks for Molecular
Nanofabrication. Science, 2005. 310(5754): p. 1661-1665.
171
27. C.D. Mol, C.-F. Kuo, M.M. Thayer, R.P. Cunningham, and J.A. Tainer, Structure and function of
the multifunctional DNA-repair enzyme exonuclease III. Nature, 1995. 374(6520): p. 381-386.
28. K.P. Garnock-Jones, Talimogene Laherparepvec: A Review in Unresectable Metastatic
Melanoma. BioDrugs, 2016. 30(5): p. 461-468.
29. J. Thundimadathil, Cancer Treatment Using Peptides: Current Therapies and Future Prospects.
Journal of Amino Acids, 2012. 2012: p. 13.
30. M.C.A. Issa and M. Manela-Azulay, Terapia fotodinâmica: revisão da literatura e
documentação iconográfica. Anais Brasileiros de Dermatologia, 2010. 85: p. 501-511.
172
Chapter 5
Targeting the trans-activating response element (TAR) in
the HIV Virus to prevent replication
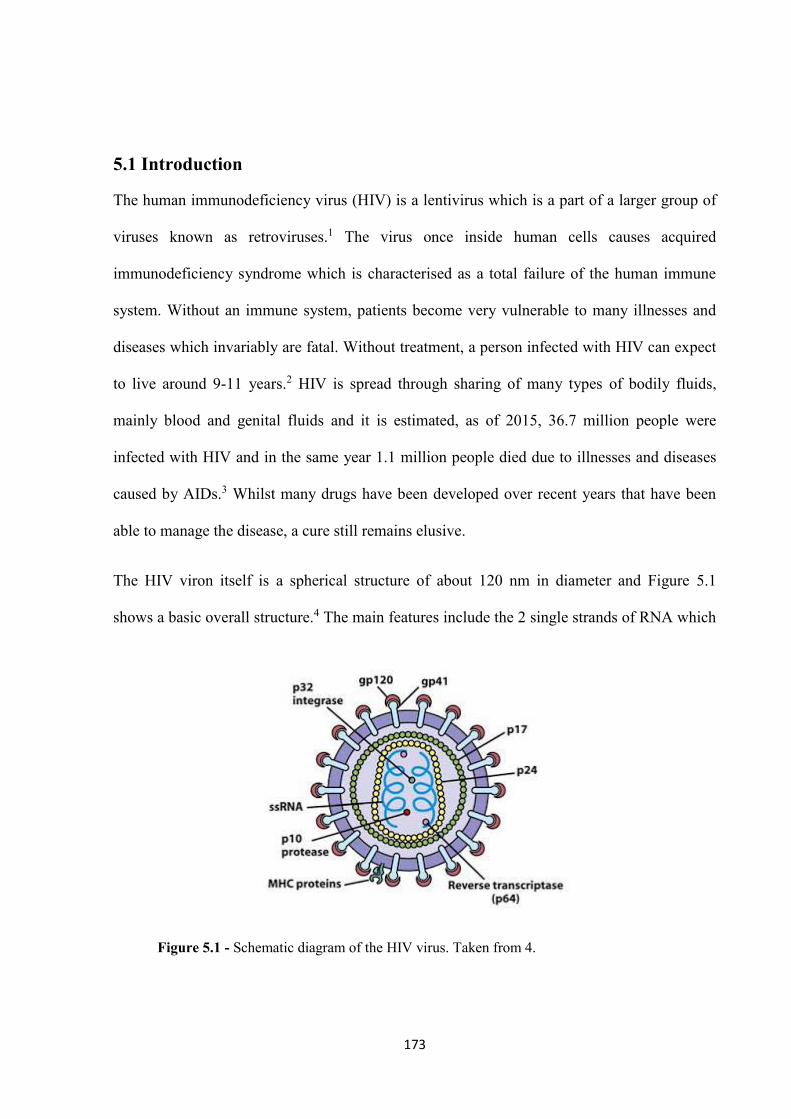
173
5.1 Introduction
The human immunodeficiency virus (HIV) is a lentivirus which is a part of a larger group of
viruses known as retroviruses.1 The virus once inside human cells causes acquired
immunodeficiency syndrome which is characterised as a total failure of the human immune
system. Without an immune system, patients become very vulnerable to many illnesses and
diseases which invariably are fatal. Without treatment, a person infected with HIV can expect
to live around 9-11 years.2 HIV is spread through sharing of many types of bodily fluids,
mainly blood and genital fluids and it is estimated, as of 2015, 36.7 million people were
infected with HIV and in the same year 1.1 million people died due to illnesses and diseases
caused by AIDs.3 Whilst many drugs have been developed over recent years that have been
able to manage the disease, a cure still remains elusive.
The HIV viron itself is a spherical structure of about 120 nm in diameter and Figure 5.1
shows a basic overall structure.4 The main features include the 2 single strands of RNA which
Figure 5.1 - Schematic diagram of the HIV virus. Taken from 4.
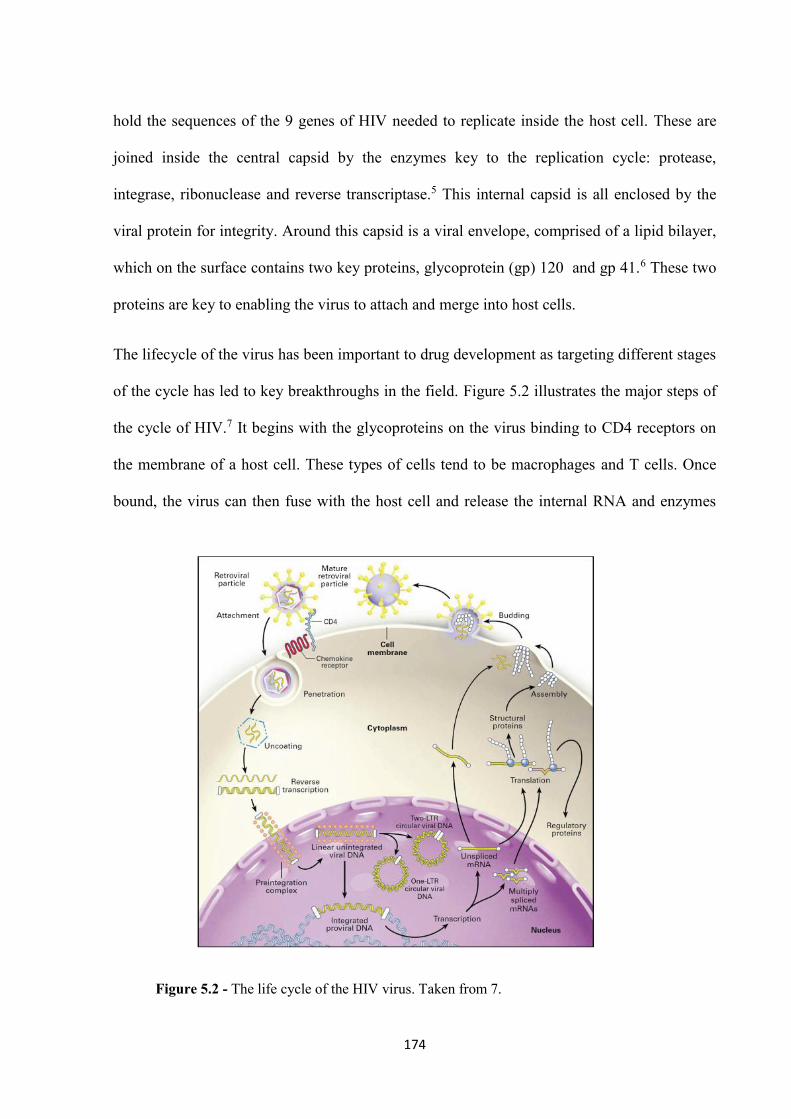
174
hold the sequences of the 9 genes of HIV needed to replicate inside the host cell. These are
joined inside the central capsid by the enzymes key to the replication cycle: protease,
integrase, ribonuclease and reverse transcriptase.5 This internal capsid is all enclosed by the
viral protein for integrity. Around this capsid is a viral envelope, comprised of a lipid bilayer,
which on the surface contains two key proteins, glycoprotein (gp) 120 and gp 41.6 These two
proteins are key to enabling the virus to attach and merge into host cells.
The lifecycle of the virus has been important to drug development as targeting different stages
of the cycle has led to key breakthroughs in the field. Figure 5.2 illustrates the major steps of
the cycle of HIV.7 It begins with the glycoproteins on the virus binding to CD4 receptors on
the membrane of a host cell. These types of cells tend to be macrophages and T cells. Once
bound, the virus can then fuse with the host cell and release the internal RNA and enzymes
Figure 5.2 - The life cycle of the HIV virus. Taken from 7.
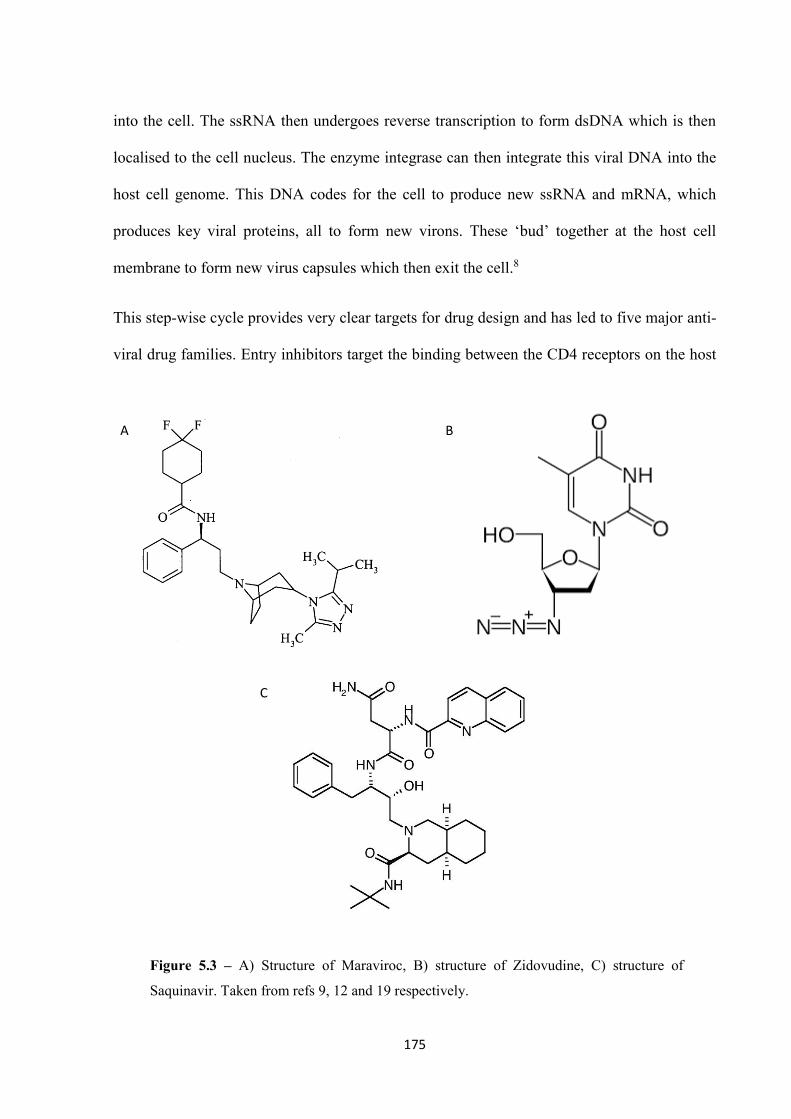
175
into the cell. The ssRNA then undergoes reverse transcription to form dsDNA which is then
localised to the cell nucleus. The enzyme integrase can then integrate this viral DNA into the
host cell genome. This DNA codes for the cell to produce new ssRNA and mRNA, which
produces key viral proteins, all to form new virons. These ‘bud’ together at the host cell
membrane to form new virus capsules which then exit the cell.8
This step-wise cycle provides very clear targets for drug design and has led to five major anti-
viral drug families. Entry inhibitors target the binding between the CD4 receptors on the host
A B
C
Figure 5.3 – A) Structure of Maraviroc, B) structure of Zidovudine, C) structure of
Saquinavir. Taken from refs 9, 12 and 19 respectively.
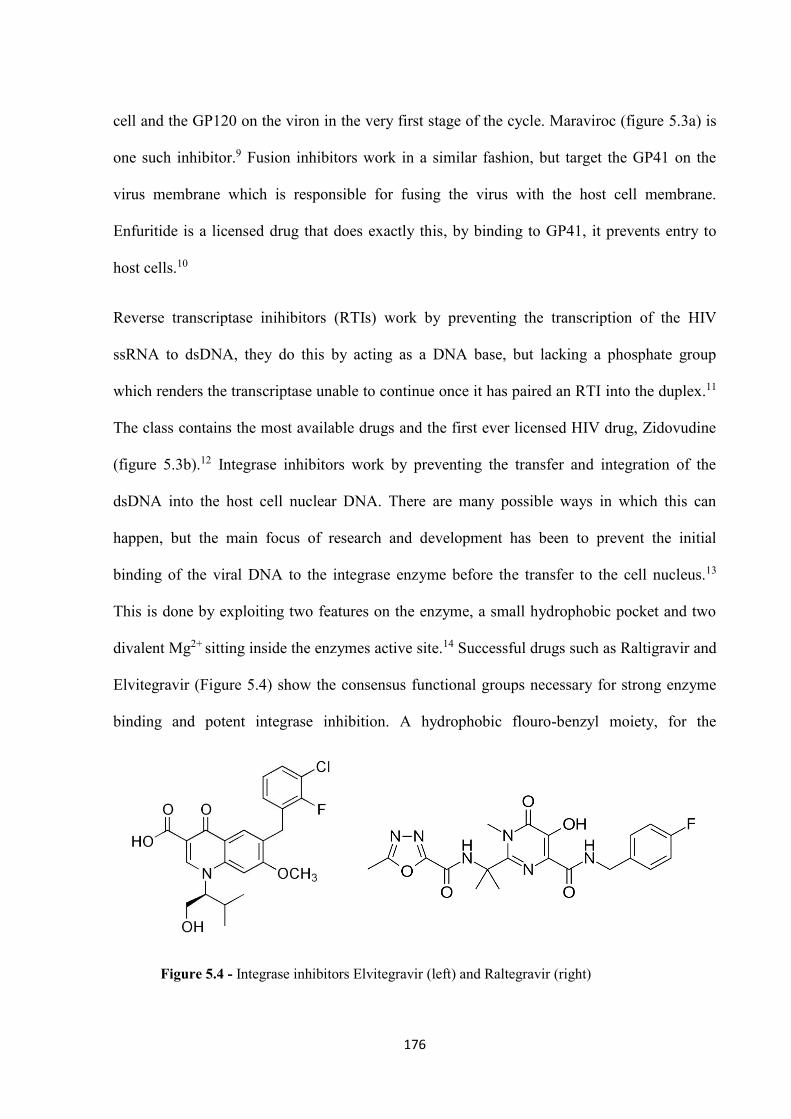
176
cell and the GP120 on the viron in the very first stage of the cycle. Maraviroc (figure 5.3a) is
one such inhibitor.9 Fusion inhibitors work in a similar fashion, but target the GP41 on the
virus membrane which is responsible for fusing the virus with the host cell membrane.
Enfuritide is a licensed drug that does exactly this, by binding to GP41, it prevents entry to
host cells.10
Reverse transcriptase inihibitors (RTIs) work by preventing the transcription of the HIV
ssRNA to dsDNA, they do this by acting as a DNA base, but lacking a phosphate group
which renders the transcriptase unable to continue once it has paired an RTI into the duplex.11
The class contains the most available drugs and the first ever licensed HIV drug, Zidovudine
(figure 5.3b).12 Integrase inhibitors work by preventing the transfer and integration of the
dsDNA into the host cell nuclear DNA. There are many possible ways in which this can
happen, but the main focus of research and development has been to prevent the initial
binding of the viral DNA to the integrase enzyme before the transfer to the cell nucleus.13
This is done by exploiting two features on the enzyme, a small hydrophobic pocket and two
divalent Mg2+ sitting inside the enzymes active site.14 Successful drugs such as Raltigravir and
Elvitegravir (Figure 5.4) show the consensus functional groups necessary for strong enzyme
binding and potent integrase inhibition. A hydrophobic flouro-benzyl moiety, for the
Figure 5.4 - Integrase inhibitors Elvitegravir (left) and Raltegravir (right)
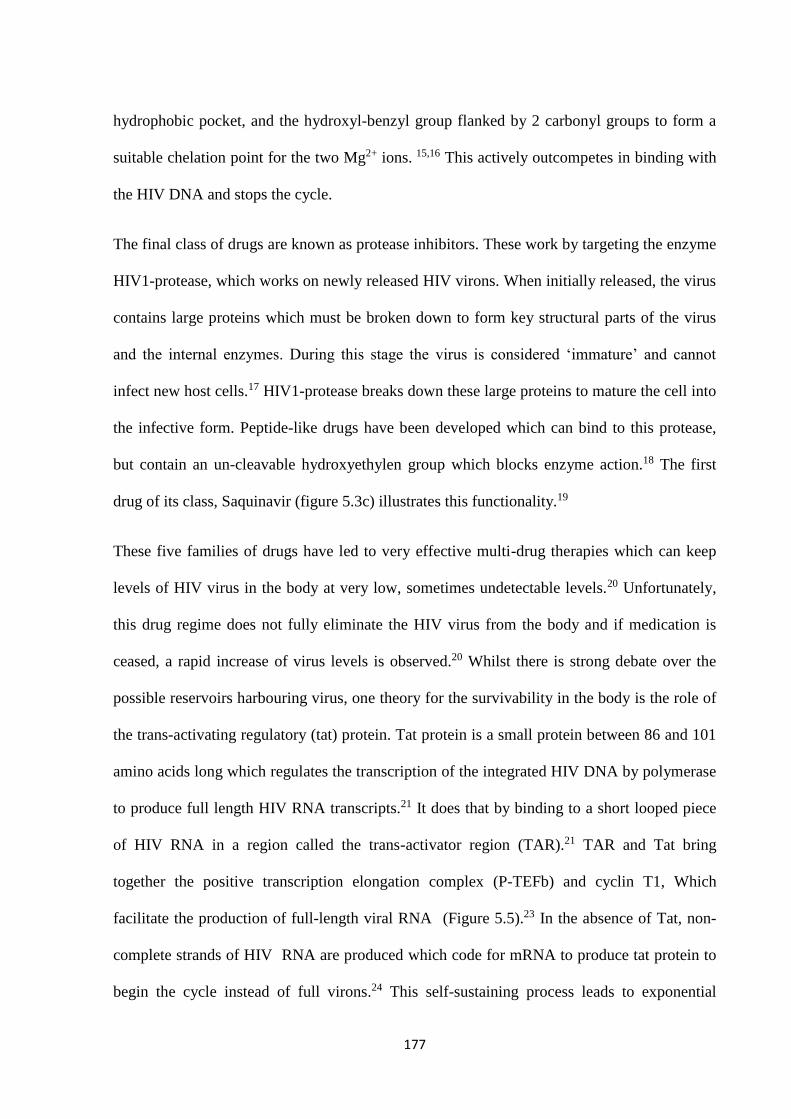
177
hydrophobic pocket, and the hydroxyl-benzyl group flanked by 2 carbonyl groups to form a
suitable chelation point for the two Mg2+ ions. 15,16 This actively outcompetes in binding with
the HIV DNA and stops the cycle.
The final class of drugs are known as protease inhibitors. These work by targeting the enzyme
HIV1-protease, which works on newly released HIV virons. When initially released, the virus
contains large proteins which must be broken down to form key structural parts of the virus
and the internal enzymes. During this stage the virus is considered ‘immature’ and cannot
infect new host cells.17 HIV1-protease breaks down these large proteins to mature the cell into
the infective form. Peptide-like drugs have been developed which can bind to this protease,
but contain an un-cleavable hydroxyethylen group which blocks enzyme action.18 The first
drug of its class, Saquinavir (figure 5.3c) illustrates this functionality.19
These five families of drugs have led to very effective multi-drug therapies which can keep
levels of HIV virus in the body at very low, sometimes undetectable levels.20 Unfortunately,
this drug regime does not fully eliminate the HIV virus from the body and if medication is
ceased, a rapid increase of virus levels is observed.20 Whilst there is strong debate over the
possible reservoirs harbouring virus, one theory for the survivability in the body is the role of
the trans-activating regulatory (tat) protein. Tat protein is a small protein between 86 and 101
amino acids long which regulates the transcription of the integrated HIV DNA by polymerase
to produce full length HIV RNA transcripts.21 It does that by binding to a short looped piece
of HIV RNA in a region called the trans-activator region (TAR).21 TAR and Tat bring
together the positive transcription elongation complex (P-TEFb) and cyclin T1, Which
facilitate the production of full-length viral RNA22(Figure 5.5).23 In the absence of Tat, non-
complete strands of HIV RNA are produced which code for mRNA to produce tat protein to
begin the cycle instead of full virons.24 This self-sustaining process leads to exponential
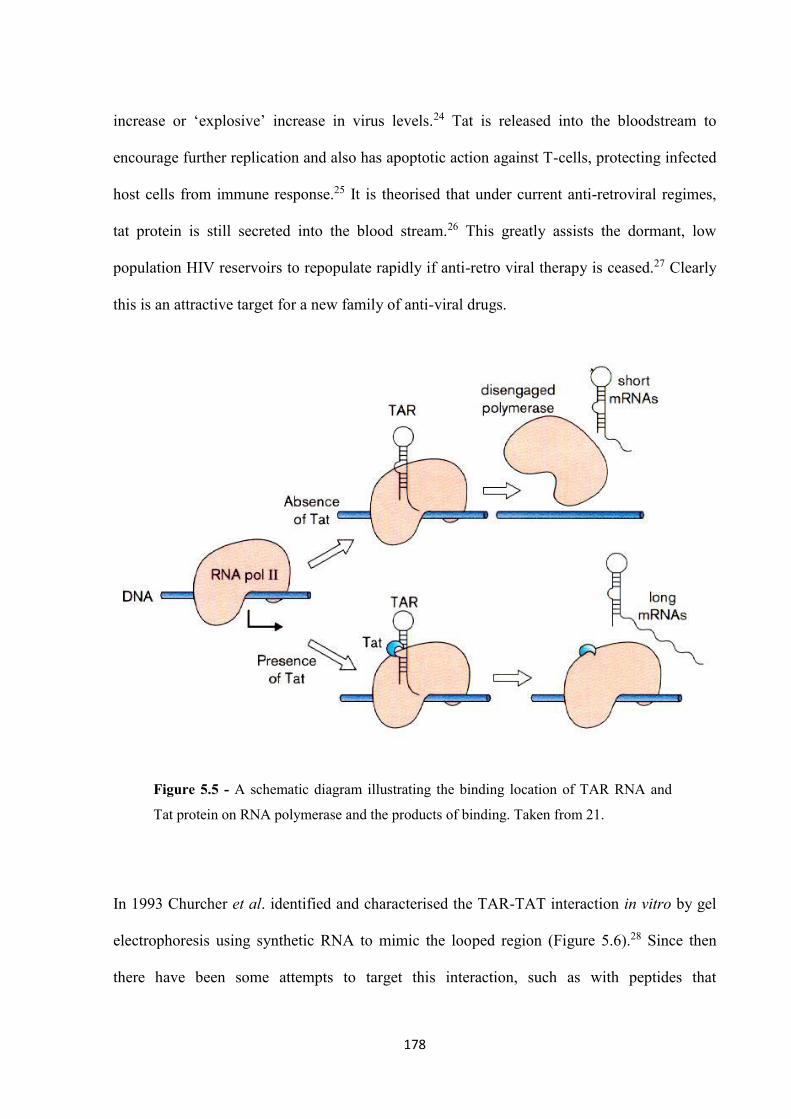
178
increase or ‘explosive’ increase in virus levels.24 Tat is released into the bloodstream to
encourage further replication and also has apoptotic action against T-cells, protecting infected
host cells from immune response.25 It is theorised that under current anti-retroviral regimes,
tat protein is still secreted into the blood stream.26 This greatly assists the dormant, low
population HIV reservoirs to repopulate rapidly if anti-retro viral therapy is ceased.27 Clearly
this is an attractive target for a new family of anti-viral drugs.
In 1993 Churcher et al. identified and characterised the TAR-TAT interaction in vitro by gel
electrophoresis using synthetic RNA to mimic the looped region (Figure 5.6).28 Since then
there have been some attempts to target this interaction, such as with peptides that
Figure 5.5 - A schematic diagram illustrating the binding location of TAR RNA and
Tat protein on RNA polymerase and the products of binding. Taken from 21.
179
competitively bind the TAR RNA.29 However, no attempts have yet made it to the clinic.
Previous studies in our group on cylinders have shown the ability of the iron cylinder to bind
to DNA bulged regions.30 Following on from this, it was shown that the iron cylinder could
bind to the 3-base bulge on TAR RNA.31 This chapter aims to assess the binding capabilities
of both the ruthenium cylinder and a nickel cylinder to TAR RNA, the potential inhibition of
tat binding and subsequent anti-viral activity.
5.2 Results and Discussion
5.2.1 Gel Electrophoresis
Nickel and ruthenium cylinders for this section were kindly provided by Dr Lucia Cardo.
After observing the potent anti-viral activity possessed by the cylinders. It is important to
verify whether the activity is due to the inhibition of Tat protein binding to the TAR RNA
looped region. To do this, a 31-mer RNA strand was synthesised (Integrated DNA
Figure 5.6 - Structure of the looped region of TAR RNA, showing the 3 base UCU
bulge where both cylinder and Tat protein bind. Taken from 31.
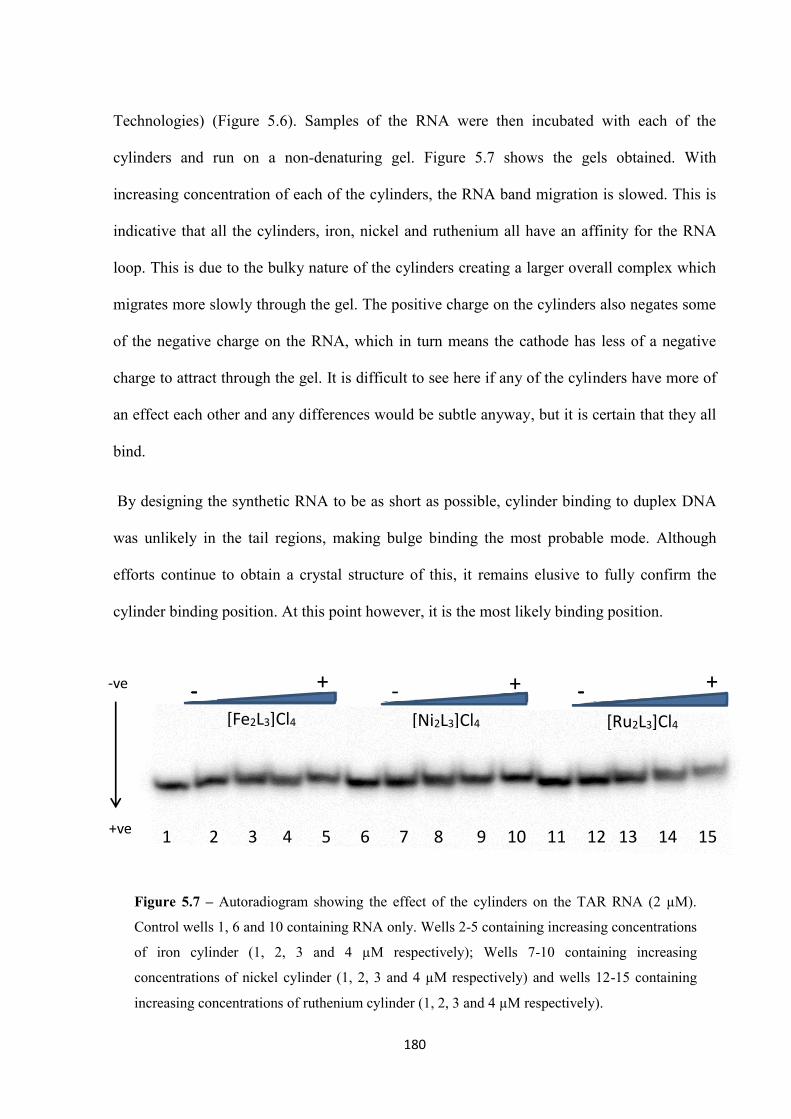
180
Technologies) (Figure 5.6). Samples of the RNA were then incubated with each of the
cylinders and run on a non-denaturing gel. Figure 5.7 shows the gels obtained. With
increasing concentration of each of the cylinders, the RNA band migration is slowed. This is
indicative that all the cylinders, iron, nickel and ruthenium all have an affinity for the RNA
loop. This is due to the bulky nature of the cylinders creating a larger overall complex which
migrates more slowly through the gel. The positive charge on the cylinders also negates some
of the negative charge on the RNA, which in turn means the cathode has less of a negative
charge to attract through the gel. It is difficult to see here if any of the cylinders have more of
an effect each other and any differences would be subtle anyway, but it is certain that they all
bind.
By designing the synthetic RNA to be as short as possible, cylinder binding to duplex DNA
was unlikely in the tail regions, making bulge binding the most probable mode. Although
efforts continue to obtain a crystal structure of this, it remains elusive to fully confirm the
cylinder binding position. At this point however, it is the most likely binding position.
- -- + - + + -
1 2 3 4 5 6 7 8 9 10 11 12 13 14 15
[Fe2L3]Cl4
Figure 5.7 – Autoradiogram showing the effect of the cylinders on the TAR RNA (2 µM).
Control wells 1, 6 and 10 containing RNA only. Wells 2-5 containing increasing concentrations
of iron cylinder (1, 2, 3 and 4 µM respectively); Wells 7-10 containing increasing
concentrations of nickel cylinder (1, 2, 3 and 4 µM respectively) and wells 12-15 containing
increasing concentrations of ruthenium cylinder (1, 2, 3 and 4 µM respectively).
-ve
+ve
[Ru2L3]Cl4 [Ni2L3]Cl4
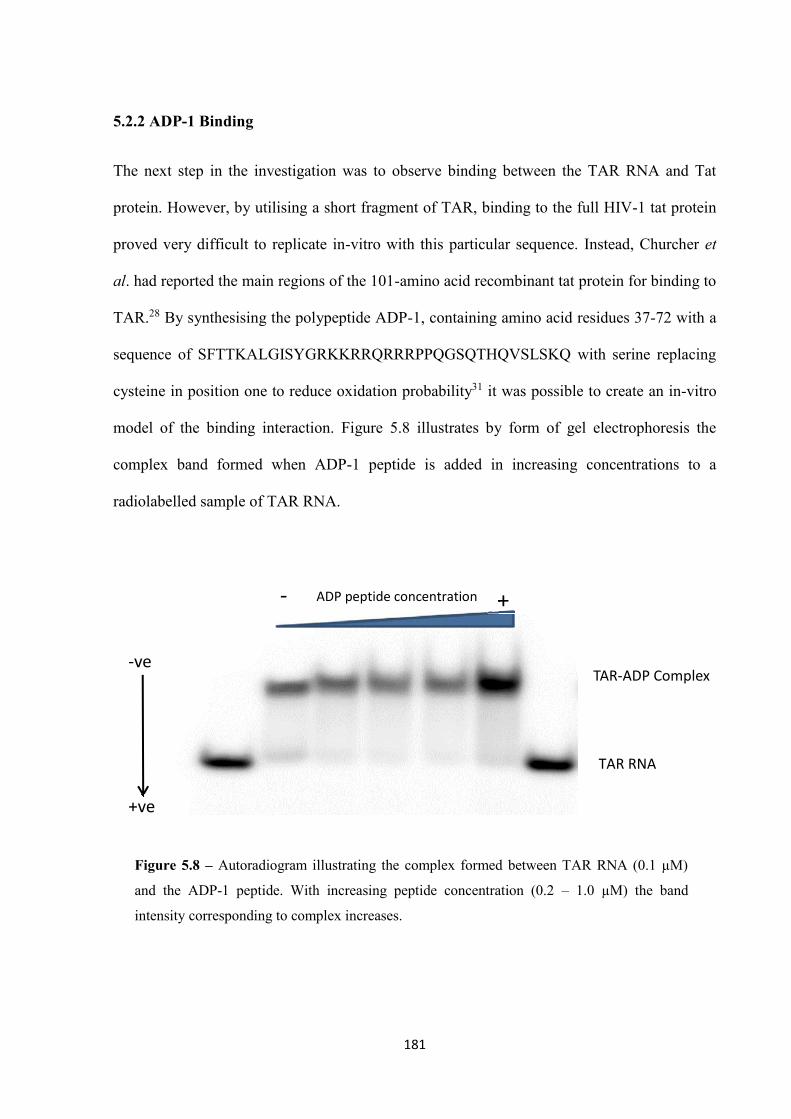
181
5.2.2 ADP-1 Binding
The next step in the investigation was to observe binding between the TAR RNA and Tat
protein. However, by utilising a short fragment of TAR, binding to the full HIV-1 tat protein
proved very difficult to replicate in-vitro with this particular sequence. Instead, Churcher et
al. had reported the main regions of the 101-amino acid recombinant tat protein for binding to
TAR.28 By synthesising the polypeptide ADP-1, containing amino acid residues 37-72 with a
sequence of SFTTKALGISYGRKKRRQRRRPPQGSQTHQVSLSKQ with serine replacing
cysteine in position one to reduce oxidation probability31 it was possible to create an in-vitro
model of the binding interaction. Figure 5.8 illustrates by form of gel electrophoresis the
complex band formed when ADP-1 peptide is added in increasing concentrations to a
radiolabelled sample of TAR RNA.
TAR RNA
TAR-ADP Complex -ve
+ve
- + +ADP peptide concentration
Figure 5.8 – Autoradiogram illustrating the complex formed between TAR RNA (0.1 µM)
and the ADP-1 peptide. With increasing peptide concentration (0.2 – 1.0 µM) the band
intensity corresponding to complex increases.
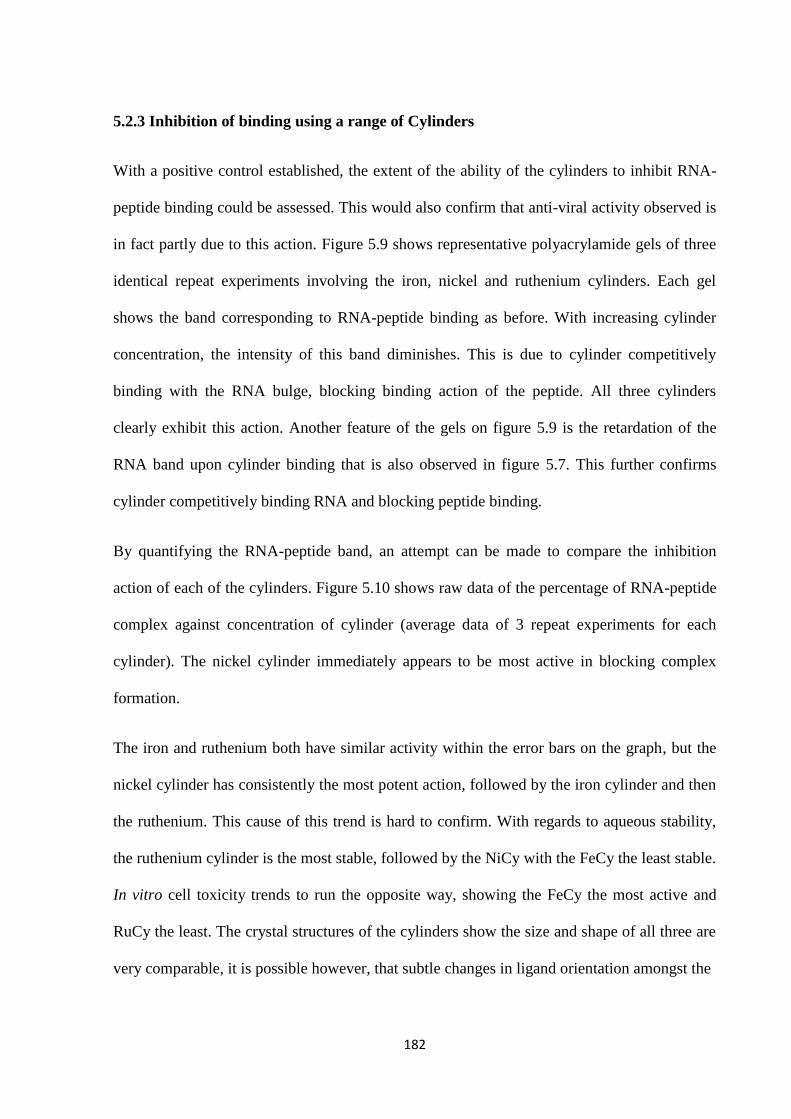
182
5.2.3 Inhibition of binding using a range of Cylinders
With a positive control established, the extent of the ability of the cylinders to inhibit RNA-
peptide binding could be assessed. This would also confirm that anti-viral activity observed is
in fact partly due to this action. Figure 5.9 shows representative polyacrylamide gels of three
identical repeat experiments involving the iron, nickel and ruthenium cylinders. Each gel
shows the band corresponding to RNA-peptide binding as before. With increasing cylinder
concentration, the intensity of this band diminishes. This is due to cylinder competitively
binding with the RNA bulge, blocking binding action of the peptide. All three cylinders
clearly exhibit this action. Another feature of the gels on figure 5.9 is the retardation of the
RNA band upon cylinder binding that is also observed in figure 5.7. This further confirms
cylinder competitively binding RNA and blocking peptide binding.
By quantifying the RNA-peptide band, an attempt can be made to compare the inhibition
action of each of the cylinders. Figure 5.10 shows raw data of the percentage of RNA-peptide
complex against concentration of cylinder (average data of 3 repeat experiments for each
cylinder). The nickel cylinder immediately appears to be most active in blocking complex
formation.
The iron and ruthenium both have similar activity within the error bars on the graph, but the
nickel cylinder has consistently the most potent action, followed by the iron cylinder and then
the ruthenium. This cause of this trend is hard to confirm. With regards to aqueous stability,
the ruthenium cylinder is the most stable, followed by the NiCy with the FeCy the least stable.
In vitro cell toxicity trends to run the opposite way, showing the FeCy the most active and
RuCy the least. The crystal structures of the cylinders show the size and shape of all three are
very comparable, it is possible however, that subtle changes in ligand orientation amongst the
183
TAR-ADP Complex
[Fe2L
3]Cl
4
-ve
+ve
TAR RNA / Tar + [Fe
2L
3]Cl
4
- + -
1 2 3 4 5 6 7
TAR-ADP Complex
[Ni2L
3]Cl
4
-ve
+ve
TAR RNA / Tar + [Ni
2L
3]Cl
4
- + -
TAR-ADP Complex
[Ru2L
3]Cl
4
-ve
+ve
TAR RNA / Tar + [Ru
2L
3]Cl
4
- + -
Figure 5.9 - Autoradiograms illustrating the inhibition of the formation of the ADP
peptide (300 nM) – TAR RNA (100 nM) complex, with increasing cylinder concentration
(0.2 µM – 1.6 µM), less complex is able to form due to cylinder binding to RNA.
Retardation of RNA band is observed confirming cylinder binding. Each gel image is one
representative of three identical repeat PAGE experiments.
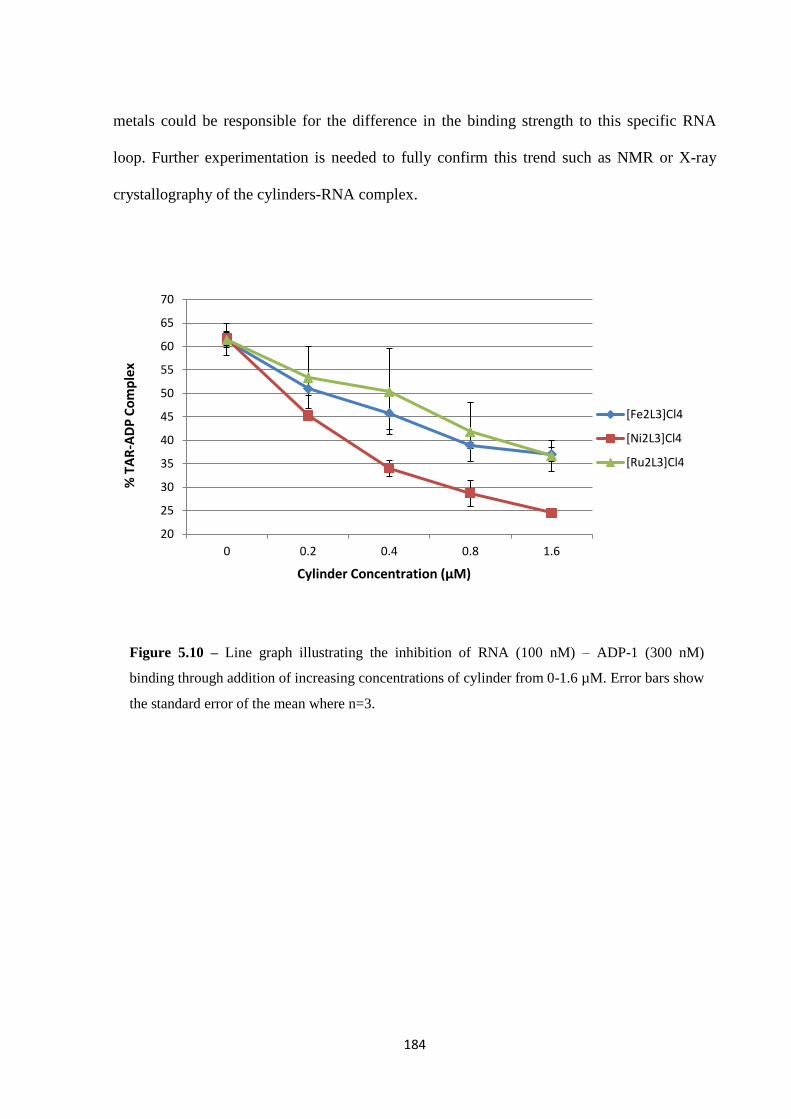
184
metals could be responsible for the difference in the binding strength to this specific RNA
loop. Further experimentation is needed to fully confirm this trend such as NMR or X-ray
crystallography of the cylinders-RNA complex.
Figure 5.10 – Line graph illustrating the inhibition of RNA (100 nM) – ADP-1 (300 nM)
binding through addition of increasing concentrations of cylinder from 0-1.6 µM. Error bars show
the standard error of the mean where n=3.
20
25
30
35
40
45
50
55
60
65
70
0 0.2 0.4 0.8 1.6
% T
AR
-AD
P C
om
ple
x
Cylinder Concentration (µM)
[Fe2L3]Cl4
[Ni2L3]Cl4
[Ru2L3]Cl4
185
5.3 Conclusions
From these experiments, iron, nickel and ruthenium cylinders were shown to be able to inhibit
TAR-ADP-1 complex formation by binding to the TAR RNA looped region. Follow on
experiments in collaboration with Dr Lucia Cardo and Dr Isabel Nawroth have shown that the
cylinders can inhibit HIV replication in cellulo in mammalian HIV infected cell lines, With
the RuCy proving particularly effective. To further prove the effectiveness of these cylinders,
the cytotoxicity of each of the cylinders was tested against the same cell lines, showing the
nickel cylinder to have minimal cytotoxicity during anti-viral treatment whilst the ruthenium
had a modest cytotoxic effect. The iron cylinder, however, proved to be too cytotoxic to be
considered useful as an anti-viral agent.
This new class of anti-viral agents is particularly interesting as many viruses can mutate viral
sequences and vary RNA bulge shapes to develop sequence specific drug resistance.32
However, the TAR RNA bulge appears to be essential to TAT recognition and therefore HIV
replication. This means the only mutations the virus has been observed exhibiting here have
been sequence changes within the bulge sequence rather that structural. As the cylinder binds
the bulge structure and not the sequence, the cylinder would not be affected by such viral
mutations. The cylinder has also been shown to be able to bind to a wide variety of bulge
structures, not just this one,30 which provides further advantage against any possible viral
structural mutations.
Therefore, these experiments have shown that targeting RNA structures which are prevalent
in a wide variety of viruses33 is an effective new approach to anti-viral research.
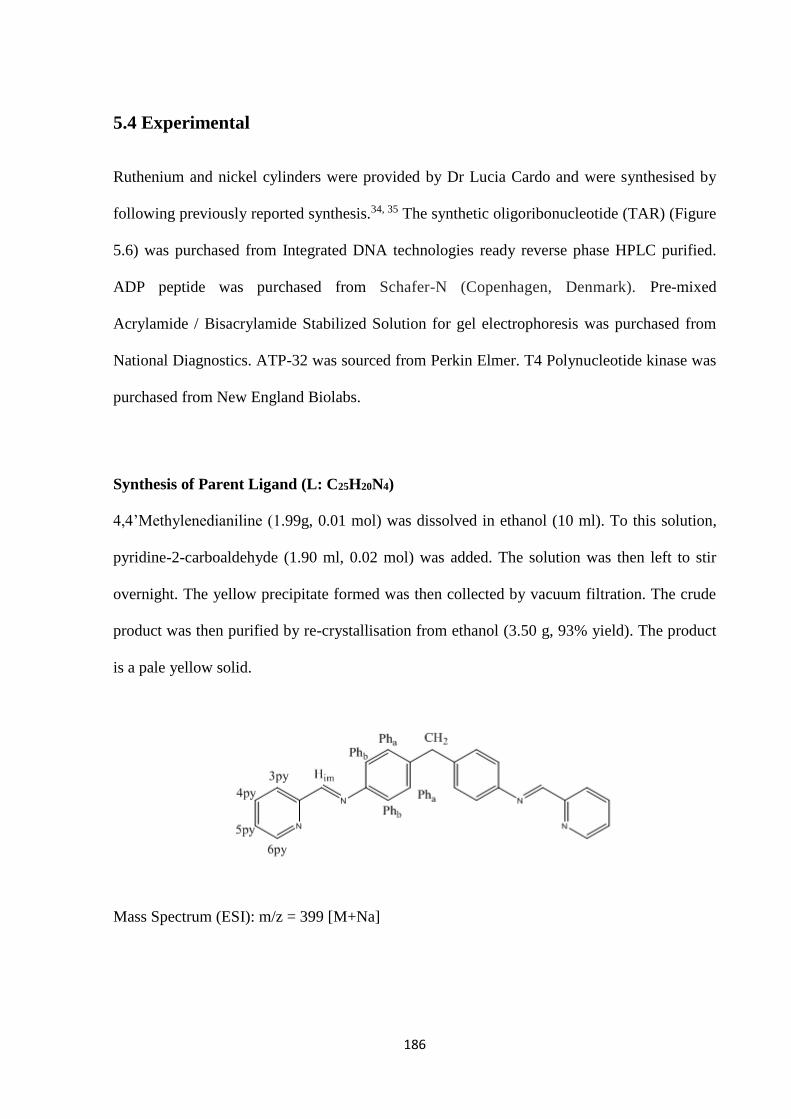
186
5.4 Experimental
Ruthenium and nickel cylinders were provided by Dr Lucia Cardo and were synthesised by
following previously reported synthesis.34, 35 The synthetic oligoribonucleotide (TAR) (Figure
5.6) was purchased from Integrated DNA technologies ready reverse phase HPLC purified.
ADP peptide was purchased from Schafer-N (Copenhagen, Denmark). Pre-mixed
Acrylamide / Bisacrylamide Stabilized Solution for gel electrophoresis was purchased from
National Diagnostics. ATP-32 was sourced from Perkin Elmer. T4 Polynucleotide kinase was
purchased from New England Biolabs.
Synthesis of Parent Ligand (L: C25H20N4)
4,4’Methylenedianiline (1.99g, 0.01 mol) was dissolved in ethanol (10 ml). To this solution,
pyridine-2-carboaldehyde (1.90 ml, 0.02 mol) was added. The solution was then left to stir
overnight. The yellow precipitate formed was then collected by vacuum filtration. The crude
product was then purified by re-crystallisation from ethanol (3.50 g, 93% yield). The product
is a pale yellow solid.
Mass Spectrum (ESI): m/z = 399 [M+Na]
187
1H NMR (300 MHz), CDCl3, 298K): δ 8.71 (2H, d, J = 3.9 Hz, 6py), δ 8.63 (2H, s, J = Him), δ
8.22 (2H, d, J = 7.0 Hz 3py), δ 7.82 (2H, td, J = 8.3, 1.9, 0.6 Hz, 4py), δ 7.40 (2H, ddd, J =
7.6, 4.9, 1.2 Hz, 5py), δ 7.30 (8H, m, Pha and Phb), δ 4.08 (2H, s, CH2)
Synthesis of the triple stranded iron helicate [Fe2(L)3]Cl4
Ligand (3.0g, 0.008 mol) was dissolved in methanol (400 ml). Iron (II) chloride tetrahydrate
(1.06 g, 0.005 mol) was then added to the solution and the resulting solution was brought to
reflux at 65oC for 3 hours. The solution was then taken to dryness in vacuo. The crude
product was then dissolved in minimal amounts of methanol (10 ml) and excess methanolic
ammonium hexafluorophosphate added. The resulting precipitate was collected by filtration
and washed with water (2 x 10 ml) and then diethyl ether (5 x 25 ml). The filtrate was then
suspended in methanol and stirred with Dowex until the product had dissolved. The Dowex
was then filtered off. The filtrate was taken to dryness in vacuo, and then redissolved in a
minimum amount of methanol. Excess diethyl ether was added until the product precipitates,
the final product was filtered and washed with ether and dried (1.65g, 59.7%). The final
product was a crystalline purple solid.
Mass Spectrum (ESI): m/z = 425.5 [Fe2L3]Cl3+ , 310 [Fe2L3]4+
1H NMR (300 MHz), CD3OD, 298K): δ 9.13 (2H, s, Him), δ 8.71 (2H, d, J = 7.2 Hz, 6py), δ
8.48 (2H, t, J = 7.8, 3py), δ 7.84 (2H, ddd, J = 5.6, 4py), δ 7.44 (2H, d, J = 5.2, 5py), δ 7.05
(4H, broadened, Pha/b), δ 5.62 (4H, broadened, Pha/b), δ 4.07 (2H, s, CH2)
UV-Vis (H2O), λmax (ϵmax/dm3mol-1cm-1) 584 (16900) nm
188
Cylinder - TAR RNA binding – A synthetic 31 base RNA strand of sequence 5’
GGCCAGAUCUGAGCCUGGGAGCUCUCUGGCC 3’ was purchased from Integrated
DNA Technologies (IDT) HPLC purified. RNA was radiolabelled at the 5’ end using T4
polynucleotide kinase and [γ-32P]ATP. RNA was then annealed in 50 mM Tris HCl (pH 8.0)
at 80oC for 5 min and then 10 min at 4oC on ice. RNA samples (2 µM) were incubated with
increasing cylinder concentrations (1-4 µM, relating to ratios of 0.5, 1, 1.5 and 2 cylinders per
RNA strand) of cylinder in TK buffer; Tris HCl (50 mM, pH 8.0), KCl (100 mM) to a final
volume of 10 µL for 30 min at RT and then on ice for 10 min. Samples were then run on a
15% non-denaturing polyacrylamide gel in 0.5 x TB buffer; Tris.HCl (40mM), Boric acid (45
mM), pH 8.3 at 11 v/cm and 4oC for 5 hours. Gel was imaged by developing on a white
phosphor screen and scanned using a Bio-Rad personal molecular imager (PMI).
ADP-RNA binding inhibition – The TAR RNA was radiolabelled and annealed as before.
10 µL sample solutions containing final concentrations of TAR RNA (100 nM) DTT (100
mM) ADP peptide (300 nM), 0.1% Triton X-100, Tris.HCl (50 mM pH 8.0) and cylinder (Fe,
Ni or Ru at 0.2, 0.4, 0.8 and 1.6 µM, corresponding to ratios of 2, 4, 8 and 16 cylinders per
RNA strand) were prepared and incubated at RT for 30 min and then on ice for 10 min.
Samples were run on a 10% non-denaturing polyacrylamide gel at 4oC for 2.5 hours at
11v/cm. Gel was imaged by developing on a white phosphor screen and scanned using a Bio-
Rad personal molecular imager (PMI).
189
5.5 References
1. R. Weiss, How does HIV cause AIDS? Science, 1993. 260(5112): p. 1273-1279.
2. G. Maartens, C. Celum, and S.R. Lewin, HIV infection: epidemiology, pathogenesis, treatment,
and prevention. The Lancet. 384(9939): p. 258-271.
3. UNAids.org, Fact sheet November 2016. 2016.
4. T. Acharya, MCQ in microbiology and microbiology classnotes [online], blogspot, April 2010 ,
Febuary 2017 (http://edusanjalmicro.blogspot.co.uk/2010_04_01_archive.html).
5. D.C. Chan, D. Fass, J.M. Berger, and P.S. Kim, Core Structure of gp41 from the HIV Envelope
Glycoprotein. Cell, 1997. 89(2): p. 263-273.
6. J.S. Klein and P.J. Bjorkman, Few and Far Between: How HIV May Be Evading Antibody
Avidity. PLOS Pathogens, 2010. 6(5): p. e1000908.
7. A.O. Pasternak, V.V. Lukashov, and B. Berkhout, Cell-associated HIV RNA: a dynamic
biomarker of viral persistence. Retrovirology, 2013. 10(41): p. 1742-4690.
8. F. Barre-Sinoussi, A.L. Ross, and J.-F. Delfraissy, Past, present and future: 30 years of HIV
research. Nature Reviews Microbiology, 2013. 11(12): p. 877-883.
9. P. Pugach, T.J. Ketas, E. Michael, and J.P. Moore, Neutralizing antibody and anti-retroviral
drug sensitivities of HIV-1 isolates resistant to small molecule CCR5 inhibitors. Virology, 2008.
377(2): p. 401-407.
10. J.P. Lalezari, J.J. Eron, M. Carlson, C. Cohen, E. DeJesus, R.C. Arduino, J.E. Gallant, P.
Volberding, R.L. Murphy, F. Valentine, E.L. Nelson, P.R. Sista, A. Dusek, and J.M. Kilby, A
phase II clinical study of the long-term safety and antiviral activity of enfuvirtide-based
antiretroviral therapy. Aids, 2003. 17(5): p. 691-8.
190
11. V. Goldschmidt and R. Marquet, Primer unblocking by HIV-1 reverse transcriptase and
resistance to nucleoside RT inhibitors (NRTIs). The International Journal of Biochemistry &
Cell Biology, 2004. 36(9): p. 1687-1705.
12. R. Sperling, Zidovudine. Infectious Diseases in Obstetrics and Gynecology, 1998. 6(5): p. 197-
203.
13. X. Fan, F.-H. Zhang, R.I. Al-Safi, L.-F. Zeng, Y. Shabaik, B. Debnath, T.W. Sanchez, S. Odde, N.
Neamati, and Y.-Q. Long, Design of HIV-1 integrase inhibitors targeting the catalytic domain
as well as its interaction with LEDGF/p75: A scaffold hopping approach using salicylate and
catechol groups. Bioorganic & Medicinal Chemistry, 2011. 19(16): p. 4935-4952.
14. A. Pendri, N.A. Meanwell, K.M. Peese, and M.A. Walker, New first and second generation
inhibitors of human immunodeficiency virus-1 integrase. Expert Opinion on Therapeutic
Patents, 2011. 21(8): p. 1173-1189.
15. M.M. Dąbrowska and A. Wiercińska-Drapało, Integrase inhibitors as a new class of ARV
treatment. HIV & AIDS Review, 2007. 6(4): p. 10-14.
16. Z. Wang, J. Tang, C.E. Salomon, C.D. Dreis, and R. Vince, Pharmacophore and structure–
activity relationships of integrase inhibition within a dual inhibitor scaffold of HIV reverse
transcriptase and integrase. Bioorganic & Medicinal Chemistry, 2010. 18(12): p. 4202-4211.
17. E.T. Brower, U.M. Bacha, Y. Kawasaki, and E. Freire, Inhibition of HIV-2 Protease by HIV-1
Protease Inhibitors in Clinical Use. Chemical Biology & Drug Design, 2008. 71(4): p. 298-305.
18. B. Turk, Targeting proteases: successes, failures and future prospects. Nature Reviews Drug
Discovery, 2006. 5(9): p. 785-799.
19. G.L. Plosker and L.J. Scott, Saquinavir: a review of its use in boosted regimens for treating HIV
infection. Drugs, 2003. 63(12): p. 1299-324.
20. E.J. Arts and D.J. Hazuda, HIV-1 Antiretroviral Drug Therapy. Cold Spring Harbor Perspectives
in Medicine, 2012. 2(4): p. a007161.
191
21. S. Debaisieux, F. Rayne, H. Yezid, and B. Beaumelle, The Ins and Outs of HIV-1 Tat. Traffic,
2012. 13(3): p. 355-363.
22. N.L. Greenbaum, How Tat targets TAR: structure of the BIV peptide–RNA complex. Structure,
1996. 4(1): p. 5-9.
23. R.S. Doherty, T. De Oliveira, C. Seebregts, S. Danaviah, M. Gordon, and S. Cassol, BioAfrica's
HIV-1 proteomics resource: combining protein data with bioinformatics tools. Retrovirology,
2005. 2: p. 18.
24. C. Zhou and T.M. Rana, A Bimolecular Mechanism of HIV-1 Tat Protein Interaction with RNA
Polymerase II Transcription Elongation Complexes. Journal of Molecular Biology, 2002.
320(5): p. 925-942.
25. G.R. Campbell, E. Pasquier, J. Watkins, V. Bourgarel-Rey, V. Peyrot, D. Esquieu, P. Barbier, J.
de Mareuil, D. Braguer, P. Kaleebu, D.L. Yirrell, and E.P. Loret, The glutamine-rich region of
the HIV-1 Tat protein is involved in T-cell apoptosis. Journal of Biological Chemistry, 2004.
279(46): p. 48197-204.
26. E. Loret, HIV extracellular Tat: myth or reality? Current HIV Research, 2015. 13(2): p. 90-7.
27. E.P. Loret, A. Darque, E. Jouve, E.A. Loret, C. Nicolino-Brunet, S. Morange, E. Castanier, J.
Casanova, C. Caloustian, C. Bornet, J. Coussirou, J. Boussetta, V. Couallier, O. Blin, B. Dussol,
and I. Ravaux, Intradermal injection of a Tat Oyi-based therapeutic HIV vaccine reduces of
1.5 log copies/mL the HIV RNA rebound median and no HIV DNA rebound following cART
interruption in a phase I/II randomized controlled clinical trial. Retrovirology, 2016. 13: p. 21.
28. M.J. Churcher, C. Lamont, F. Hamy, C. Dingwall, S.M. Green, A.D. Lowe, P.J.G. Butler, M.J.
Gait, and J. Karn, High Affinity Binding of TAR RNA by the Human Immunodeficiency Virus
Type-1 tat Protein Requires Base-pairs in the RNA Stem and Amino Acid Residues Flanking the
Basic Region. Journal of Molecular Biology, 1993. 230(1): p. 90-110.
192
29. F. Hamy, E.R. Felder, G. Heizmann, J. Lazdins, F. Aboul-ela, G. Varani, J. Karn, and T. Klimkait,
An inhibitor of the Tat/TAR RNA interaction that effectively suppresses HIV-1 replication.
Proceedings of the National Academy of Sciences of the United States of America, 1997.
94(8): p. 3548-3553.
30. J. Malina, M.J. Hannon, and V. Brabec, Recognition of DNA bulges by dinuclear iron(II)
metallosupramolecular helicates. FEBS Journal, 2014. 281(4): p. 987-997.
31. J. Malina, M.J. Hannon, and V. Brabec, Iron(II) supramolecular helicates interfere with the
HIV-1 Tat–TAR RNA interaction critical for viral replication. Scientific Reports, 2016. 6: p.
29674.
32. B.R. Cullen, MicroRNAs as mediators of viral evasion of the immune system. Nature
Immunology, 2013. 14(3): p. 205-210.
33. J. Witteveldt, R. Blundell, J.J. Maarleveld, N. McFadden, D.J. Evans, and P. Simmonds, The
influence of viral RNA secondary structure on interactions with innate host cell defences.
Nucleic Acids Research, 2014. 42(5): p. 3314-3329.
34. G.I. Pascu, A.C.G. Hotze, C. Sanchez-Cano, B.M. Kariuki, and M.J. Hannon, Dinuclear
Ruthenium(II) Triple-Stranded Helicates: Luminescent Supramolecular Cylinders That Bind and
Coil DNA and Exhibit Activity against Cancer Cell Lines. Angewandte Chemie, 2007. 119(23):
p. 4452-4456.
35. M. J. Hannon, C. L. Painting, A. Jackson, J. Hamblin, and W. Errington, An inexpensive
approach to supramolecular architecture. Chemical Communications, 1997(18): p. 1807-
1808.

193
Chapter 6
Conclusions and Future work
194
6.1 Conclusions and Future Work
6.1.1 Conclusions
Overall, this thesis has shown that the iron cylinder and its enantiomers can bind to a DNA
tetrahedron and, upon binding, cause the structure to contract, potentially having the effect of
decreasing the size of the internal cavity. It was also found that increasing the ratio of cylinder
to DNA tetrahedron increases the compression effect on the tetrahedron. However, at high
ratios, the positive charge of the cylinder overcomes the negative charge on the DNA and causes
the conjugate to precipitate out of solution. Whilst it proved very difficult to ascertain where
exactly the cylinder was bound to the tetrahedron, separate gel electrophoresis competition
experiments showed the cylinder has a much higher affinity to 3WJ structures over duplex
DNA, suggesting the cylinder preferentially binds to the 3WJs on the tetrahedron over the
duplex DNA present. Interestingly when the M and P enantiomers were separated and then
combined with the tetrahedron, the M enantiomer had a stronger effect than the P enantiomer
compressing the tetrahedron. This was interesting as previous experiments showed only the M
enantiomer bound inside 3WJs in crystallographic experiments using racemic cylinder,
suggesting that the M enantiomer prefers to bind to the 3WJ DNA in the tetrahedron more so
than the P enantiomer.
This opens up further research into other DNA nanostructures that cylinders could bind to and
effect. Potentially creating DNA nano-machines in conjunction with supramolecular chemistry.
The cylinder-tetrahedron conjugate was also found to be readily taken up by mammalian cells
through a variety of experiments. The cytotoxicity of the cylinder, when delivered by
tetrahedron was diminished but still remained potent. This was most likely due to an
equilibrium of binding for the cylinder between genomic DNA and tetrahedron DNA, reducing
195
the amount of cylinder available to cause apoptosis through genomic DNA binding. Initial
results using an almost identical ruthenium cylinder with ICP-MS suggested that overall uptake
of cylinder is increased when delivered by tetrahedron, in the cytoplasm and nucleus. Whilst
considerable research has already been published on the merits of DNA nanotechnology as
therapeutic carriers; this particular research shows supramolecular chemistry can also play a
role in the field.
The ruthenium cylinder has DNA photocleavage capabilities that are most effective in the blue
end of the spectrum, centred on its absorption maxima at 474 nm. This was very interesting
when combined with the DNA tetrahedron as it was shown that the tetrahedron could be broken
down on excitation with a specific wavelength of light, suggesting that potential internalised
cargos could be released on excitation with the external light trigger. Ruthenium cylinder and
its tetrahedron conjugate were also shown to have potent cytotoxic capabilities when utilised
as a photodynamic therapy agent, where the cylinder is delivered to genomic DNA and
apoptosis is triggered by photocleavage caused by subsequent excitation with light. By utilising
the difference in toxicity with and without tetrahedron, further research into widening the
therapeutic window of the RuCy when being used as a PDT agent would be very interesting.
The versatility of the cylinder was also demonstrated by the spatial recognition of a looped
structure of RNA. The RNA, known as TAR, is found in the virus HIV-1 and binds to ADP-1
protein to regulate transcription to facilitate viral capsid replication. The competitive binding
of the iron, nickel and ruthenium cylinders was able to inhibit binding between TAR and ADP-
1 and thus had potential to become a new class of anti-viral agents. This is particularly exciting
as the cylinder’s action in this chapter was not sequence specific, but more specific to the RNA
structure. This makes it less susceptible to common virus adaptations to develop drug
196
resistance. There is a great deal of opportunity in research for the cylinders as a new class of
anti-viral agents due to the large amount of discovered RNA secondary structures in nature.
6.1.2 Future Work
6.1.2.1 Chapter 2
Following from chapter 2, it would be interesting to see the differences between the iron
cylinder enantiomers in the 3WJ competition assays. From this thesis it has been seen that the
M enantiomer is more effective at compressing the tetrahedron. Therefore its affinity to the
synthetic 3WJ could also be different to the P enantiomer when competing with other DNA
structures.
Current collaborations are also currently working to establish whether the differences between
the M and P enantiomers on the DNA tetrahedron can be seen by atomic force microscopy as
previously seen with the racemic mixture by Prof. Shao Fengwei and Dr Liying Wang.
6.1.2.2 Chapter 3
The localisation of the tetrahedron and tetrahedron conjugate inside the cell remains a question.
Whilst no significant co-localisation with the Hoechst nuclear stain and the Cy5 labelled
tetrahedron was seen, another cell stain could be used to see whether any significant co-
localisation could be seen between the two which could confirm the cellular localisation of the
complexes. This co-localisation could be quantified and any difference to localisation when
cylinder is attached to the tetrahedron or not could be analysed.
Furthermore, the integrity of the cylinder – tetrahedron conjugate whilst inside the cell still
must be confirmed. This remains a challenging task, which one solution could be to furnish a
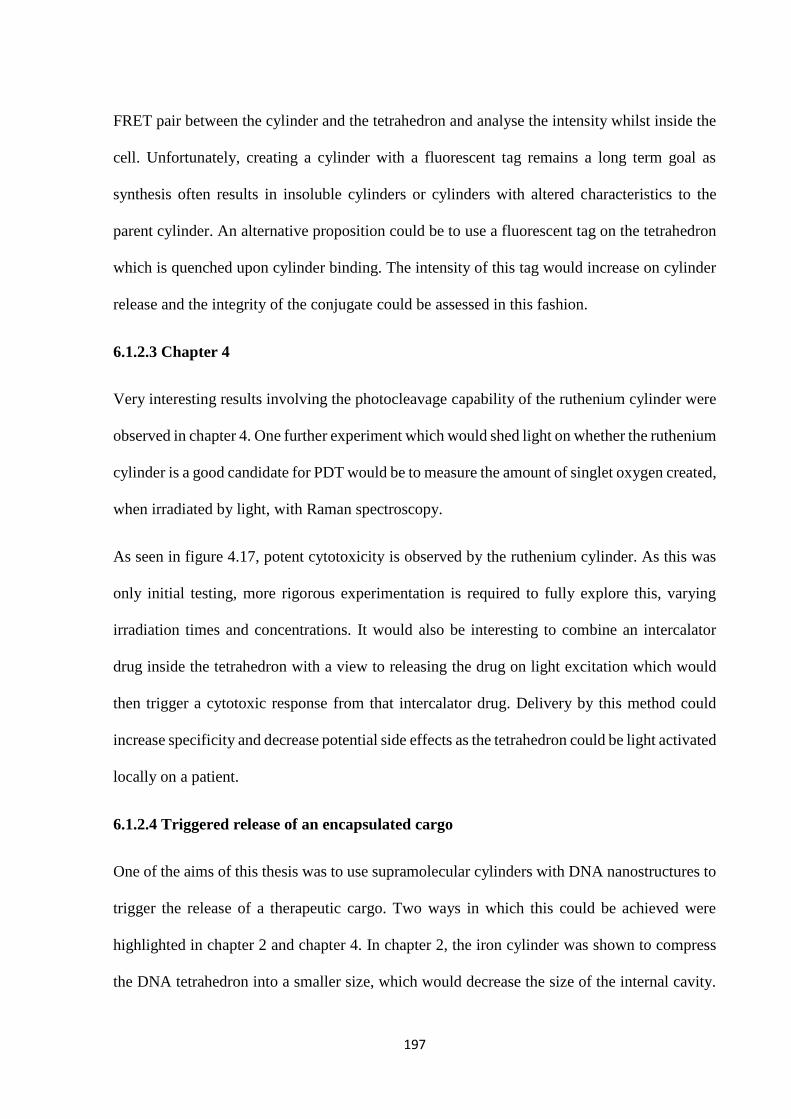
197
FRET pair between the cylinder and the tetrahedron and analyse the intensity whilst inside the
cell. Unfortunately, creating a cylinder with a fluorescent tag remains a long term goal as
synthesis often results in insoluble cylinders or cylinders with altered characteristics to the
parent cylinder. An alternative proposition could be to use a fluorescent tag on the tetrahedron
which is quenched upon cylinder binding. The intensity of this tag would increase on cylinder
release and the integrity of the conjugate could be assessed in this fashion.
6.1.2.3 Chapter 4
Very interesting results involving the photocleavage capability of the ruthenium cylinder were
observed in chapter 4. One further experiment which would shed light on whether the ruthenium
cylinder is a good candidate for PDT would be to measure the amount of singlet oxygen created,
when irradiated by light, with Raman spectroscopy.
As seen in figure 4.17, potent cytotoxicity is observed by the ruthenium cylinder. As this was
only initial testing, more rigorous experimentation is required to fully explore this, varying
irradiation times and concentrations. It would also be interesting to combine an intercalator
drug inside the tetrahedron with a view to releasing the drug on light excitation which would
then trigger a cytotoxic response from that intercalator drug. Delivery by this method could
increase specificity and decrease potential side effects as the tetrahedron could be light activated
locally on a patient.
6.1.2.4 Triggered release of an encapsulated cargo
One of the aims of this thesis was to use supramolecular cylinders with DNA nanostructures to
trigger the release of a therapeutic cargo. Two ways in which this could be achieved were
highlighted in chapter 2 and chapter 4. In chapter 2, the iron cylinder was shown to compress
the DNA tetrahedron into a smaller size, which would decrease the size of the internal cavity.
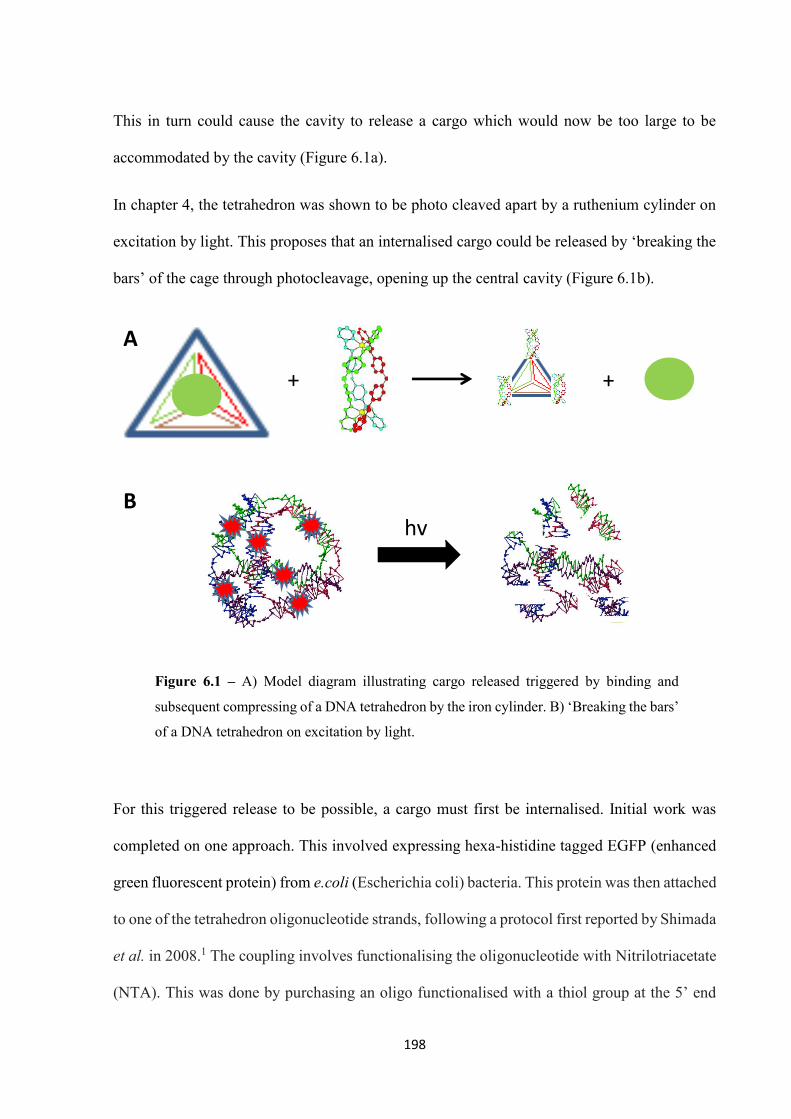
198
This in turn could cause the cavity to release a cargo which would now be too large to be
accommodated by the cavity (Figure 6.1a).
In chapter 4, the tetrahedron was shown to be photo cleaved apart by a ruthenium cylinder on
excitation by light. This proposes that an internalised cargo could be released by ‘breaking the
bars’ of the cage through photocleavage, opening up the central cavity (Figure 6.1b).
For this triggered release to be possible, a cargo must first be internalised. Initial work was
completed on one approach. This involved expressing hexa-histidine tagged EGFP (enhanced
green fluorescent protein) from e.coli (Escherichia coli) bacteria. This protein was then attached
to one of the tetrahedron oligonucleotide strands, following a protocol first reported by Shimada
et al. in 2008.1 The coupling involves functionalising the oligonucleotide with Nitrilotriacetate
(NTA). This was done by purchasing an oligo functionalised with a thiol group at the 5’ end
+ +
hv
A
B
Figure 6.1 – A) Model diagram illustrating cargo released triggered by binding and
subsequent compressing of a DNA tetrahedron by the iron cylinder. B) ‘Breaking the bars’
of a DNA tetrahedron on excitation by light.
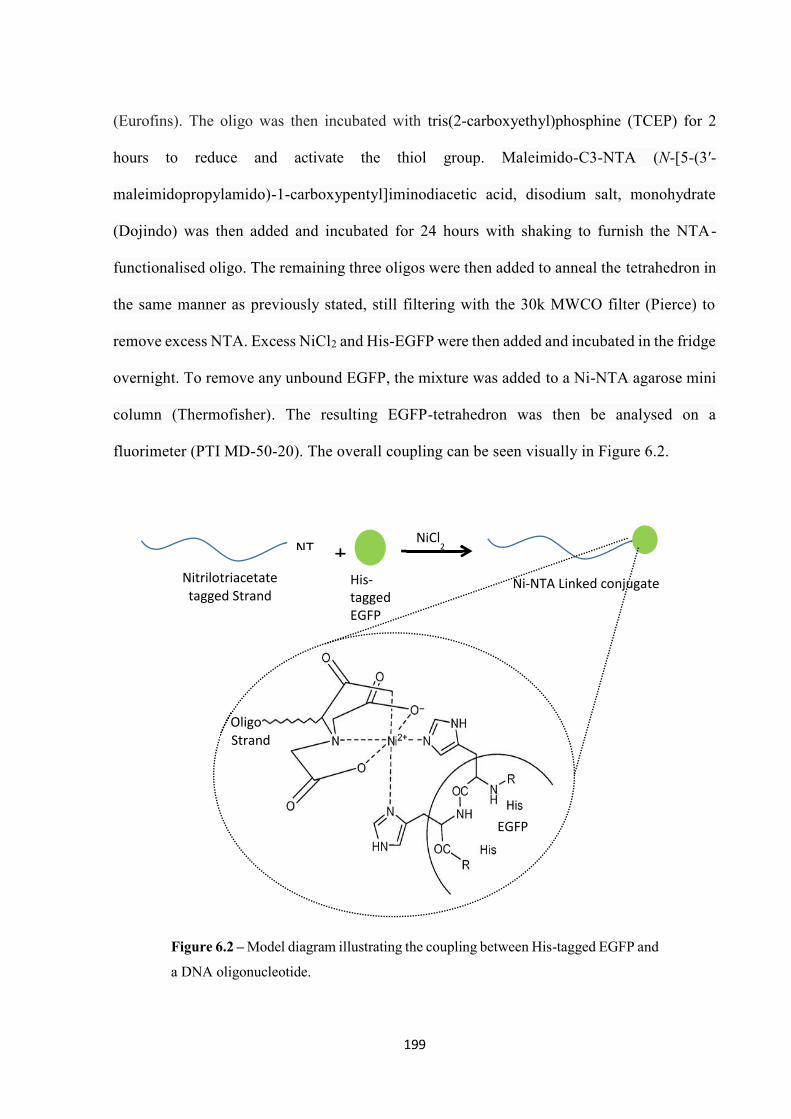
199
(Eurofins). The oligo was then incubated with tris(2-carboxyethyl)phosphine (TCEP) for 2
hours to reduce and activate the thiol group. Maleimido-C3-NTA (N-[5-(3′-
maleimidopropylamido)-1-carboxypentyl]iminodiacetic acid, disodium salt, monohydrate
(Dojindo) was then added and incubated for 24 hours with shaking to furnish the NTA-
functionalised oligo. The remaining three oligos were then added to anneal the tetrahedron in
the same manner as previously stated, still filtering with the 30k MWCO filter (Pierce) to
remove excess NTA. Excess NiCl2 and His-EGFP were then added and incubated in the fridge
overnight. To remove any unbound EGFP, the mixture was added to a Ni-NTA agarose mini
column (Thermofisher). The resulting EGFP-tetrahedron was then be analysed on a
fluorimeter (PTI MD-50-20). The overall coupling can be seen visually in Figure 6.2.
+ Nitrilotriacetate tagged Strand
NT
His-tagged EGFP
NiCl2
Ni-NTA Linked conjugate
EGFP
Oligo Strand
Figure 6.2 – Model diagram illustrating the coupling between His-tagged EGFP and
a DNA oligonucleotide.
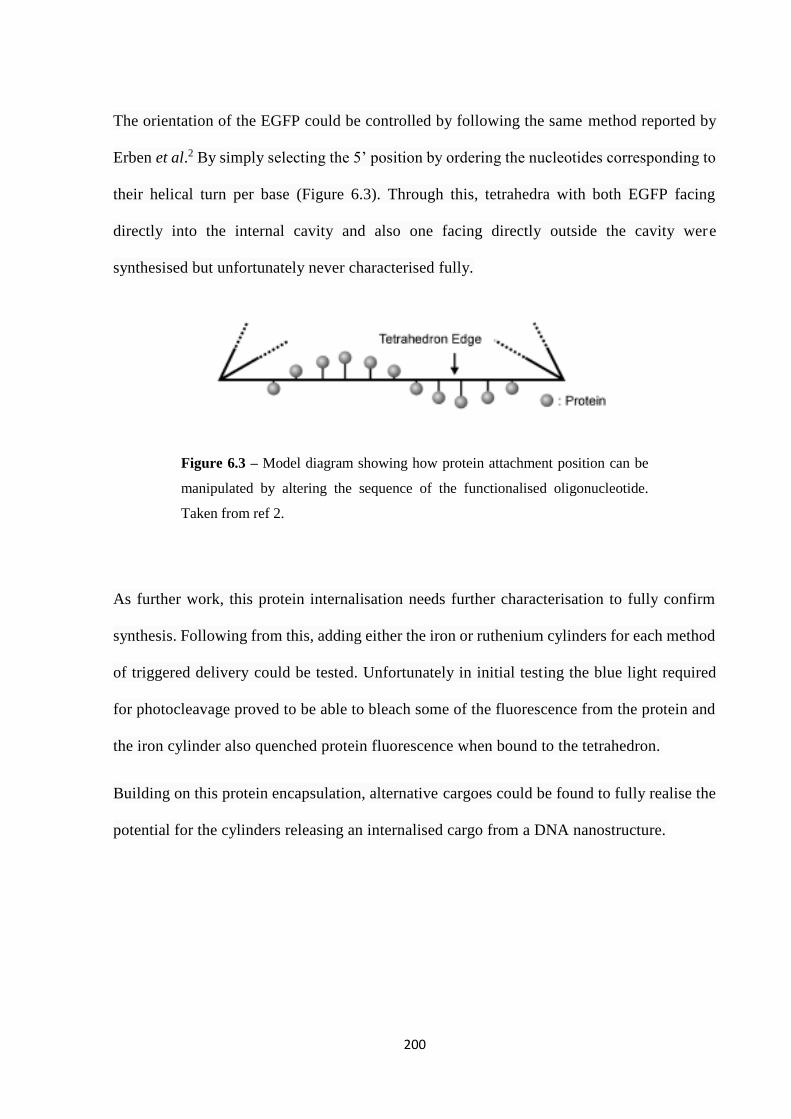
200
The orientation of the EGFP could be controlled by following the same method reported by
Erben et al.2 By simply selecting the 5’ position by ordering the nucleotides corresponding to
their helical turn per base (Figure 6.3). Through this, tetrahedra with both EGFP facing
directly into the internal cavity and also one facing directly outside the cavity were
synthesised but unfortunately never characterised fully.
As further work, this protein internalisation needs further characterisation to fully confirm
synthesis. Following from this, adding either the iron or ruthenium cylinders for each method
of triggered delivery could be tested. Unfortunately in initial testing the blue light required
for photocleavage proved to be able to bleach some of the fluorescence from the protein and
the iron cylinder also quenched protein fluorescence when bound to the tetrahedron.
Building on this protein encapsulation, alternative cargoes could be found to fully realise the
potential for the cylinders releasing an internalised cargo from a DNA nanostructure.
Figure 6.3 – Model diagram showing how protein attachment position can be
manipulated by altering the sequence of the functionalised oligonucleotide.
Taken from ref 2.
201
6.2 References
1. J. Shimada, T. Maruyama, T. Hosogi, J. Tominaga, N. Kamiya, and M. Goto, Conjugation of
DNA with protein using His-tag chemistry and its application to the aptamer-based detection
system. Biotechnology Letters, 2008. 30(11): p. 2001-6.
2. C.M. Erben, R.P. Goodman, and A.J. Turberfield, Single-molecule protein encapsulation in a
rigid DNA cage. Angewante Chemie International Edition English, 2006. 45(44): p. 7414-7.
Related Documents