ORIGINAL RESEARCH ARTICLE DNA microarray profiling of developing PS1-deficient mouse brain reveals complex and coregulated expression changes ZK Mirnics 1,4 , K Mirnics 2,4 , D Terrano 3 , DA Lewis 2 , SS Sisodia 3 and NF Schor 1 1 Pediatric Center for Neuroscience, Department of Pediatrics and Neurology, University of Pittsburgh, School of Medicine, Children’s Hospital of Pittsburgh, Pittsburgh, PA, USA; 2 Departments of Psychiatry and Neurobiology, University of Pittsburgh, Pittsburgh, PA, USA; 3 Center for Molecular Neurobiology, University of Chicago, Chicago, IL, USA Presenilin 1 (PS1) plays a critical role in the nervous system development and PS1 mutations have been associated with familial Alzheimer’s disease. PS1-deficient mice exhibit alterations in neural and vascular development and die in late embryogenesis. The present study was aimed at uncovering transcript networks that depend on intact PS1 function in the developing brain. To achieve this, we analyzed the brains of PS1-deficient and control animals at embryonic ages E12.5 and E14.5 using MG_U74Av2 oligonucleotide microarrays by Affymetrix. Based on the microarray data, overall molecular brain development appeared to be comparable between the E12.5 and E14.5 PS1-deficient and control embryos. However, in brains of PS1-deficient mice, we observed significant differences in the expression of genes encoding molecules that are associated with neural differentiation, extracellular matrix, vascular development, Notch-related signaling and lipid metabolism. Many of the expression differences between wild-type and PS1-deficient animals were present at both E12.5 and E14.5, whereas other transcript alterations were characteristic of only one developmental stage. The results suggest that the role of PS1 in development includes influences on a highly co- regulated transcript network; some of the genes participating in this expression network may contribute to the pathophysiology of Alzheimer’s disease. Molecular Psychiatry (2003) 8, 863–878. doi:10.1038/sj.mp.4001389 Keywords: Alzheimer’s disease; notch signaling; oligonucleotide GeneChips; presenilin; knockout; lipid metabolism; transcript network; in situ hybridization Introduction Presenilins (PS1 and PS2) are highly homologous integral membrane proteins essential for the intra- membranous ‘g-secretase’ cleavage of the b-amyloid precursor protein (APP), Notch, ErbB4, E-cadherin, the LDL receptor-related protein, CD44, Delta1, Jagged2 and nectin-1a. 1–12 PS1 is either the catalytic subunit or a cofactor of a high molecular weight complex that has g-secretase activity. 13,14 The vast majority of pedigrees with autosomal dominant familial Alzheimer’s disease (FAD) are linked to missense mutations in PS1 and expression of these PS1 variants leads to increased production of highly amyloidogenic Ab42 peptides. 15–18 PS1-deficient mice die at birth or in utero with skeletal deformities, cerebral hemorrhage, impaired neurogenesis and cavitations throughout the brain. 19–23 PS2-deficient mice are normal, viable and fertile. 24 In addition to being essential for early embryonic development and g-secretase cleavage, PS1 plays other physiological roles. 25,26 Based on morphological and developmental analysis of PS1-deficient mice, it has been suggested that PS1 plays a role in cell proliferation, neuronal differentiation, cell adhesion and extracellular matrix formation. 19,23,27–32 Within the developing nervous system, PS1 deficiency leads to thinning of the ventricular zone, loss of Cajal– Retzius neurons, cortical dysplasia, defective neuronal migration and leptomeningeal fibrosis. 19,23 PS1-hypomorphic mice are viable and show markedly reduced g-secretase cleavage. Analyzing PS1-hypo- morphic and wild-type (WT) mice with differential display, Liauw et al 33 uncovered 19 differentially expressed genes between the two conditions, includ- ing robustly decreased expression of Hif1a, delta- catenin, and cell division cycle 10, and increased expression of nucleoside diphosphate kinase subunit A. The molecular events leading to the profound developmental alterations in PS1-deficient mice are not well understood. The present study was aimed at uncovering complex transcript networks that show alterations in the absence of intact PS1 function in the developing brain. The obtained results argue that PS1 plays a major role in the formation of extracellular Received 28 March 2003; revised 15 May 2003; accepted 16 May 2003 Correspondence: Dr ZK Mirnics, PhD, Pediatric Center for Neuroscience, Departments of Pediatrics and Neurology, University of Pittsburgh, Pittsburgh, PA, 15213, USA. E-mail: [email protected] 4 Both contributed equally to this work. Molecular Psychiatry (2003) 8, 863–878 & 2003 Nature Publishing Group All rights reserved 1359-4184/03 $25.00 www.nature.com/mp

Welcome message from author
This document is posted to help you gain knowledge. Please leave a comment to let me know what you think about it! Share it to your friends and learn new things together.
Transcript
ORIGINAL RESEARCH ARTICLE
DNA microarray profiling of developing PS1-deficientmouse brain reveals complex and coregulated expressionchangesZK Mirnics1,4, K Mirnics2,4, D Terrano3, DA Lewis2, SS Sisodia3 and NF Schor1
1Pediatric Center for Neuroscience, Department of Pediatrics and Neurology, University of Pittsburgh, School of Medicine,Children’s Hospital of Pittsburgh, Pittsburgh, PA, USA; 2Departments of Psychiatry and Neurobiology, University of Pittsburgh,Pittsburgh, PA, USA; 3Center for Molecular Neurobiology, University of Chicago, Chicago, IL, USA
Presenilin 1 (PS1) plays a critical role in the nervous system development and PS1 mutationshave been associated with familial Alzheimer’s disease. PS1-deficient mice exhibit alterationsin neural and vascular development and die in late embryogenesis. The present studywas aimed at uncovering transcript networks that depend on intact PS1 function in thedeveloping brain. To achieve this, we analyzed the brains of PS1-deficient and control animalsat embryonic ages E12.5 and E14.5 using MG_U74Av2 oligonucleotide microarrays byAffymetrix. Based on the microarray data, overall molecular brain development appeared tobe comparable between the E12.5 and E14.5 PS1-deficient and control embryos. However, inbrains of PS1-deficient mice, we observed significant differences in the expression of genesencoding molecules that are associated with neural differentiation, extracellular matrix,vascular development, Notch-related signaling and lipid metabolism. Many of the expressiondifferences between wild-type and PS1-deficient animals were present at both E12.5 and E14.5,whereas other transcript alterations were characteristic of only one developmental stage. Theresults suggest that the role of PS1 in development includes influences on a highly co-regulated transcript network; some of the genes participating in this expression network maycontribute to the pathophysiology of Alzheimer’s disease.Molecular Psychiatry (2003) 8, 863–878. doi:10.1038/sj.mp.4001389
Keywords: Alzheimer’s disease; notch signaling; oligonucleotide GeneChips; presenilin;knockout; lipid metabolism; transcript network; in situ hybridization
Introduction
Presenilins (PS1 and PS2) are highly homologousintegral membrane proteins essential for the intra-membranous ‘g-secretase’ cleavage of the b-amyloidprecursor protein (APP), Notch, ErbB4, E-cadherin,the LDL receptor-related protein, CD44, Delta1,Jagged2 and nectin-1a.1–12 PS1 is either the catalyticsubunit or a cofactor of a high molecular weightcomplex that has g-secretase activity.13,14 The vastmajority of pedigrees with autosomal dominantfamilial Alzheimer’s disease (FAD) are linked tomissense mutations in PS1 and expression of thesePS1 variants leads to increased production of highlyamyloidogenic Ab42 peptides.15–18
PS1-deficient mice die at birth or in utero withskeletal deformities, cerebral hemorrhage, impairedneurogenesis and cavitations throughout the brain.19–23
PS2-deficient mice are normal, viable and fertile.24 In
addition to being essential for early embryonicdevelopment and g-secretase cleavage, PS1 playsother physiological roles.25,26 Based on morphologicaland developmental analysis of PS1-deficient mice, ithas been suggested that PS1 plays a role in cellproliferation, neuronal differentiation, cell adhesionand extracellular matrix formation.19,23,27–32 Withinthe developing nervous system, PS1 deficiency leadsto thinning of the ventricular zone, loss of Cajal–Retzius neurons, cortical dysplasia, defectiveneuronal migration and leptomeningeal fibrosis.19,23
PS1-hypomorphic mice are viable and show markedlyreduced g-secretase cleavage. Analyzing PS1-hypo-morphic and wild-type (WT) mice with differentialdisplay, Liauw et al33 uncovered 19 differentiallyexpressed genes between the two conditions, includ-ing robustly decreased expression of Hif1a, delta-catenin, and cell division cycle 10, and increasedexpression of nucleoside diphosphate kinase subunit A.The molecular events leading to the profound
developmental alterations in PS1-deficient mice arenot well understood. The present study was aimed atuncovering complex transcript networks that showalterations in the absence of intact PS1 function in thedeveloping brain. The obtained results argue that PS1plays a major role in the formation of extracellular
Received 28 March 2003; revised 15 May 2003; accepted 16 May2003
Correspondence: Dr ZK Mirnics, PhD, Pediatric Center forNeuroscience, Departments of Pediatrics and Neurology,University of Pittsburgh, Pittsburgh, PA, 15213, USA.E-mail: [email protected]
4Both contributed equally to this work.
Molecular Psychiatry (2003) 8, 863–878& 2003 Nature Publishing Group All rights reserved 1359-4184/03 $25.00
www.nature.com/mp
matrix, in the differentiation of progenitor cells and innormal lipid metabolism. Furthermore, PS1 mayregulate transcript levels of several genes that havebeen previously associated with the pathophysiologyof Alzheimer’s disease (AD).
Materials and methods
PS1-deficient animals
The generation of PS1-deficient animals has beendescribed.20 Timed matings were set up betweenheterozygous PS1 mice. The morning of the day whena vaginal plug is seen is designated as embryonic day0.5 (E0.5). Embryos at E12.5 and E14.5 were dissectedfrom pregnant females and the hindlimb was removedfrom each embryo for genotyping. Embryonic headswere removed, brains were rapidly dissected, frozenon dry ice and stored on �801C until use. BeyondE14.5, PS1-deficient embryos develop visible mor-phological defects in specific regions of the ventri-cular zone and show extensive brain hemorrhages. Inselecting two earlier ages for our brain analysis (E12.5and E14.5), we wanted to ensure that (1) the obtainedmicroarray data were not a reflection of nonspecificbrain deterioration and (2) we could assess develop-mental progression of the transcriptome in both PS1-deficient and WT animals. This approach allowed usto separate age-specific PS1-dependent transcriptomechanges from those persisting over a longer develop-mental timeline.
MicroarraysA total of 12 embryonic brains were analyzed bymicroarrays in the current study: three WT and threePS1-deficient, each at ages E12.5 and E14.5. RNAisolation, cDNA synthesis, in vitro transcription andmicroarray hybridization were performed using stan-dard protocols recommended by Affymetrix.34 Briefly,total RNA was isolated using Trizol reagent (Invitro-gen). The total RNA was reverse transcribed using aT7-promoter coupled oligo(d)T primer (GeneChip T7-Oligo(d)T Promoter Primer Kit, Affymetrix). After thesecond-strand cDNA synthesis, an in vitro transcrip-tion (IVT) reaction was performed using an EnzoBioArray High Yield RNA transcript labeling kit(Affymetrix). The quality of total RNA and cRNAwas analyzed on Bioanalyzer (Agilent). The labeledIVT samples that passed the Test 3 arrays werehybridized to GeneChips MG_U74Av2 microarraysthat contain B12 000 annotated genes and ESTs. 50/30
RNA integrity in all samples used was better than1:1.2.
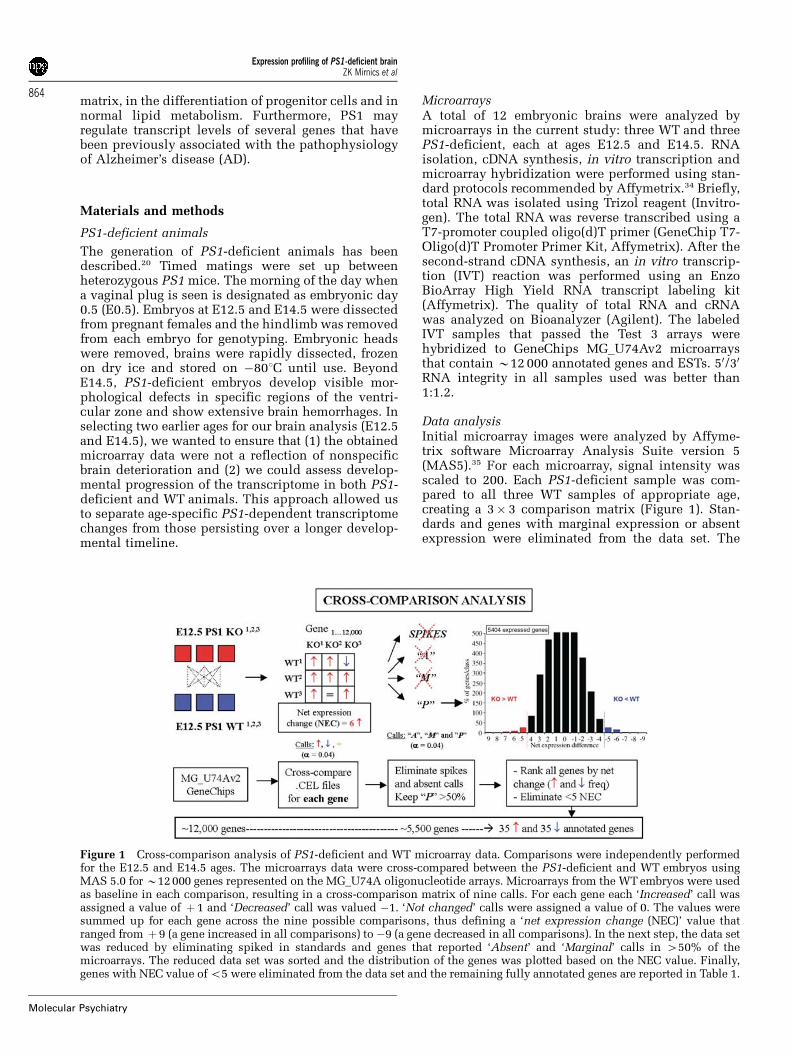
Data analysisInitial microarray images were analyzed by Affyme-trix software Microarray Analysis Suite version 5(MAS5).35 For each microarray, signal intensity wasscaled to 200. Each PS1-deficient sample was com-pared to all three WT samples of appropriate age,creating a 3� 3 comparison matrix (Figure 1). Stan-dards and genes with marginal expression or absentexpression were eliminated from the data set. The
Figure 1 Cross-comparison analysis of PS1-deficient and WT microarray data. Comparisons were independently performedfor the E12.5 and E14.5 ages. The microarrays data were cross-compared between the PS1-deficient and WT embryos usingMAS 5.0 for B12000 genes represented on the MG_U74A oligonucleotide arrays. Microarrays from the WTembryos were usedas baseline in each comparison, resulting in a cross-comparison matrix of nine calls. For each gene each ‘Increased’ call wasassigned a value of þ 1 and ‘Decreased’ call was valued �1. ‘Not changed’ calls were assigned a value of 0. The values weresummed up for each gene across the nine possible comparisons, thus defining a ‘net expression change (NEC)’ value thatranged from þ 9 (a gene increased in all comparisons) to �9 (a gene decreased in all comparisons). In the next step, the data setwas reduced by eliminating spiked in standards and genes that reported ‘Absent’ and ‘Marginal’ calls in 450% of themicroarrays. The reduced data set was sorted and the distribution of the genes was plotted based on the NEC value. Finally,genes with NEC value ofo5 were eliminated from the data set and the remaining fully annotated genes are reported in Table 1.
Expression profiling of PS1-deficient brainZK Mirnics et al
864
Molecular Psychiatry
expressed genes were ranked by the frequency of NetExpression Change, which was defined as the numberof decreased calls—number of increased calls acrossthe nine comparisons between the PS1-deficient andWT animals for each age. Net expression changes ofX5 occur at a probability of o 0.005 and only theseobservations were considered for further analysis.
For the comparison of developmental progress, weperformed hierarchical clustering by Genes@Worksoftware36 using gene vector calculations, Euclideandistance with mean calculations, and center of masscalculations. Both genes and samples were clustered.The analysis was independently performed for E12.5and E14.5.
Cross-correlation of expression levels was per-formed on MAS 5.0 scaled intensity values that wereexported into Microsoft Exel 2000.
In situ hybridizationSix additional PS1-deficient and six control E14.5embryos were used to confirm microarray data by insitu hybridization. Briefly, fresh-frozen embryos werecoronally sectioned under RNAse-free conditions at20 mm thickness. Mouse probes were generated usinggene-specific primers and normal brain cDNA as atemplate in a standard PCR reaction. The PCR productwas cloned into a plasmid with T7 and SP6polymerase sites. These plasmids were used to makea specific in situ RNA probe by an in vitro transcrip-tion reaction (Riboprobe combination system SP6/T7RNA Polymerase, Promega). The 35S-labeled RNAprobe was purified using an RNeasy column (Gibco).We determined the specific activity of the probe(B2 000000 c.p.m. per slide) and denatured it beforeadding to the slides. Slides with brain sections werefixed with 4% paraformaldehyde followed by washesand dehydration through a series of graded alcoholsolutions. Slides were dried and the radiolabeledprobe added to them. Hybridization was carried out at561C for 16–20h. This was followed by posthybridi-zation washes (4�SSC buffer with mercaptoethanol,4�SSC, formamide in formamide buffer, 2�SSC,RNase A treatment, 2�SSC, 1�SSC, 0.5�SSC,0.1�SSC) and exposure to X-ray film. After deter-mining the optimal labeling time (24h of film¼5 daysof emulsion dip), slides were dipped in emulsion andkept in a lightproof box for varying lengths of timeand then developed and counterstained with tolui-dine blue. All procedures have been described indetail previously.37–40
Results
Molecular development of the brain is comparable inPS1-deficient and WT embryosAs PS1-deficient animals died in late embryogenesis,we first wanted to establish if the normal moleculardevelopmental program was preserved in PS1-defi-cient animals (Figure 2, left panel). This was achievedby comparing the molecular developmental progres-sion of PS1-deficient animals from E12.5 and E14.5 to
that seen in WT animals. Using a cross-comparisonparadigm between E12.5 and E14.5 WT animals, wedefined 50 genes that showed prominent expressionincreases and 50 transcripts that reported significantdecreases between these two developmental ages.This was followed by testing the expression levels ofthese 100 genes in the E12.5 vs E14.5 PS1-deficientanimals (Figure 2, right panel). For these genes, weobserved parallel progression of gene expressionchanges from E12.5 to E14.5 in WT and knockout(KO) animals. The results argue that basic molecularbrain development, judged by 100 genes with age-dependent transcription level, is comparable betweenthe WT and KO animals. This suggests that insubsequent analyses, we would be able to identifychanges that are due specifically to PS1 deficiency(and not simply due to the reflection of greatlyimpaired developmental progression).
PS1-deficient animals show complex gene expressionchanges in the brainAt E12.5, the PS1-deficient embryos, when comparedto control littermates, showed 35 upregulated and 35dowregulated gene transcripts (Table 1, A1–2).Among the group of annotated genes with decreasedexpression, we identified several transcripts that werepreviously observed in independently generated PS1KO animals, thus reproducing previously publishedobservations.20,25 For example, at E12.5 we observed adecrease in protein tyrosine phosphatase Z (Ptprz;phosphacan; DSD1 proteoglycan), Notch1 andHes5.20,23,25 At this age, genes with changed expres-sion included members of the Notch (Notch1, Sfrp2)signaling pathway and many transcription factors(Lhx1, Uncx4.1, Sfrp2, Sall3, Pou3f4, Tbr1, Foxg1,Zfp312, Zac1, Eomes, Lhx8, Neurog2, Nfyb, Neurod6).Furthermore, genes contributing to normal neural/glial differentiation were also affected (Notch1, Tbr1,Eomes, Neurog2, Neurod6). Changes in the expres-sion of transcription factors in early-born neurons arelikely to be related to a premature exit of progenitorcells from the cell division cycle.25 Finally, severalextracellular matrix-related gene products were alsodownregulated (Tnc, Chl1, Ptprz, Ptprd), whilecytoskeletal genes showed both expression increases(Actb) and decreases (Mapt, Nfl, Nfm, Ina, Sncg).At E14.5, the PS1-deficient embryos, when com-
pared to control littermates, showed 17 upregulatedand 56 downregulated gene transcripts (Table 1, B1–2). The increased expression of Hba-x, Tpi, Hmox1,Hbb-b1, Alas2 and Hbb-y is most likely a response tohypoxic changes that may occur in the PS1-deficientbrain. In contrast, decreased expression was reportedfor genes belonging to the same functional groups asobserved in the E12.5 comparisons (transcriptionfactors: Zfp36I2, Zhx1, Zfhx1a; Notch signaling:Notch1, En2, Dlx1, Hes5; lipid metabolism: Acas2,Pde1b, Scd1, Asml3a, Dhcr7; extracellular matrix:Ncam1, Chl1, Tnc, Ptprz, Ptprd). Interestingly, ouranalysis also found a reduction in PAF acetylhydro-lase (phospholipase A2–Pla2g7) transcript (a gene
Expression profiling of PS1-deficient brainZK Mirnics et al
865
Molecular Psychiatry
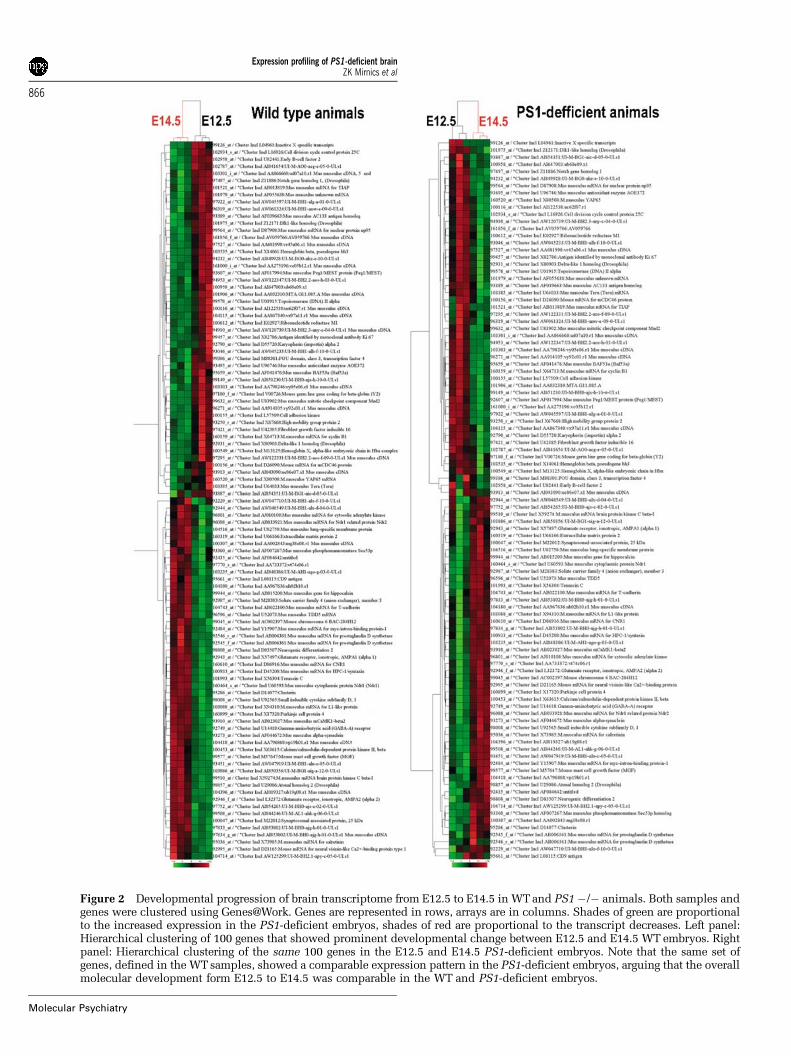
Figure 2 Developmental progression of brain transcriptome from E12.5 to E14.5 in WTand PS1 �/� animals. Both samples andgenes were clustered using Genes@Work. Genes are represented in rows, arrays are in columns. Shades of green are proportionalto the increased expression in the PS1-deficient embryos, shades of red are proportional to the transcript decreases. Left panel:Hierarchical clustering of 100 genes that showed prominent developmental change between E12.5 and E14.5 WTembryos. Rightpanel: Hierarchical clustering of the same 100 genes in the E12.5 and E14.5 PS1-deficient embryos. Note that the same set ofgenes, defined in the WTsamples, showed a comparable expression pattern in the PS1-deficient embryos, arguing that the overallmolecular development form E12.5 to E14.5 was comparable in the WT and PS1-deficient embryos.
Expression profiling of PS1-deficient brainZK Mirnics et al
866
Molecular Psychiatry
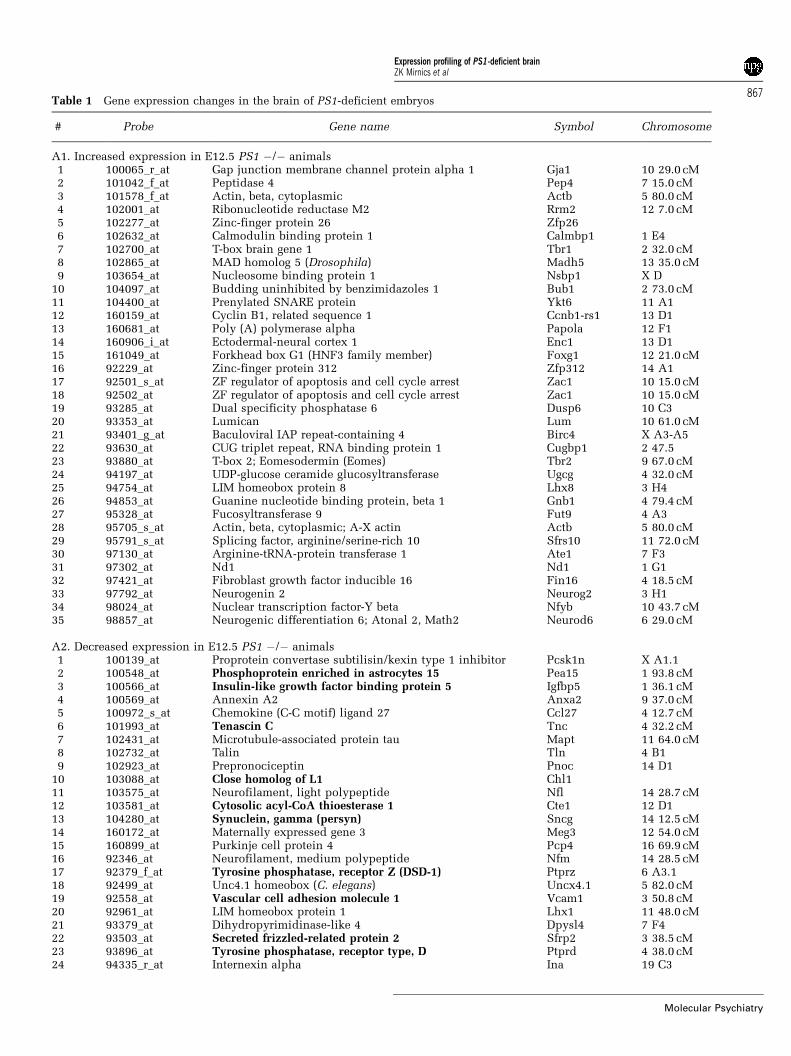
Table 1 Gene expression changes in the brain of PS1-deficient embryos
# Probe Gene name Symbol Chromosome
A1. Increased expression in E12.5 PS1 �/� animals1 100065_r_at Gap junction membrane channel protein alpha 1 Gja1 10 29.0 cM2 101042_f_at Peptidase 4 Pep4 7 15.0 cM3 101578_f_at Actin, beta, cytoplasmic Actb 5 80.0 cM4 102001_at Ribonucleotide reductase M2 Rrm2 12 7.0 cM5 102277_at Zinc-finger protein 26 Zfp266 102632_at Calmodulin binding protein 1 Calmbp1 1 E47 102700_at T-box brain gene 1 Tbr1 2 32.0 cM8 102865_at MAD homolog 5 (Drosophila) Madh5 13 35.0 cM9 103654_at Nucleosome binding protein 1 Nsbp1 X D
10 104097_at Budding uninhibited by benzimidazoles 1 Bub1 2 73.0 cM11 104400_at Prenylated SNARE protein Ykt6 11 A112 160159_at Cyclin B1, related sequence 1 Ccnb1-rs1 13 D113 160681_at Poly (A) polymerase alpha Papola 12 F114 160906_i_at Ectodermal-neural cortex 1 Enc1 13 D115 161049_at Forkhead box G1 (HNF3 family member) Foxg1 12 21.0 cM16 92229_at Zinc-finger protein 312 Zfp312 14 A117 92501_s_at ZF regulator of apoptosis and cell cycle arrest Zac1 10 15.0 cM18 92502_at ZF regulator of apoptosis and cell cycle arrest Zac1 10 15.0 cM19 93285_at Dual specificity phosphatase 6 Dusp6 10 C320 93353_at Lumican Lum 10 61.0 cM21 93401_g_at Baculoviral IAP repeat-containing 4 Birc4 X A3-A522 93630_at CUG triplet repeat, RNA binding protein 1 Cugbp1 2 47.523 93880_at T-box 2; Eomesodermin (Eomes) Tbr2 9 67.0 cM24 94197_at UDP-glucose ceramide glucosyltransferase Ugcg 4 32.0 cM25 94754_at LIM homeobox protein 8 Lhx8 3 H426 94853_at Guanine nucleotide binding protein, beta 1 Gnb1 4 79.4 cM27 95328_at Fucosyltransferase 9 Fut9 4 A328 95705_s_at Actin, beta, cytoplasmic; A-X actin Actb 5 80.0 cM29 95791_s_at Splicing factor, arginine/serine-rich 10 Sfrs10 11 72.0 cM30 97130_at Arginine-tRNA-protein transferase 1 Ate1 7 F331 97302_at Nd1 Nd1 1 G132 97421_at Fibroblast growth factor inducible 16 Fin16 4 18.5 cM33 97792_at Neurogenin 2 Neurog2 3 H134 98024_at Nuclear transcription factor-Y beta Nfyb 10 43.7 cM35 98857_at Neurogenic differentiation 6; Atonal 2, Math2 Neurod6 6 29.0 cM
A2. Decreased expression in E12.5 PS1 �/� animals1 100139_at Proprotein convertase subtilisin/kexin type 1 inhibitor Pcsk1n X A1.12 100548_at Phosphoprotein enriched in astrocytes 15 Pea15 1 93.8 cM3 100566_at Insulin-like growth factor binding protein 5 Igfbp5 1 36.1 cM4 100569_at Annexin A2 Anxa2 9 37.0 cM5 100972_s_at Chemokine (C-C motif) ligand 27 Ccl27 4 12.7 cM6 101993_at Tenascin C Tnc 4 32.2 cM7 102431_at Microtubule-associated protein tau Mapt 11 64.0 cM8 102732_at Talin Tln 4 B19 102923_at Prepronociceptin Pnoc 14 D1
10 103088_at Close homolog of L1 Chl111 103575_at Neurofilament, light polypeptide Nfl 14 28.7 cM12 103581_at Cytosolic acyl-CoA thioesterase 1 Cte1 12 D113 104280_at Synuclein, gamma (persyn) Sncg 14 12.5 cM14 160172_at Maternally expressed gene 3 Meg3 12 54.0 cM15 160899_at Purkinje cell protein 4 Pcp4 16 69.9 cM16 92346_at Neurofilament, medium polypeptide Nfm 14 28.5 cM17 92379_f_at Tyrosine phosphatase, receptor Z (DSD-1) Ptprz 6 A3.118 92499_at Unc4.1 homeobox (C. elegans) Uncx4.1 5 82.0 cM19 92558_at Vascular cell adhesion molecule 1 Vcam1 3 50.8 cM20 92961_at LIM homeobox protein 1 Lhx1 11 48.0 cM21 93379_at Dihydropyrimidinase-like 4 Dpysl4 7 F422 93503_at Secreted frizzled-related protein 2 Sfrp2 3 38.5 cM23 93896_at Tyrosine phosphatase, receptor type, D Ptprd 4 38.0 cM24 94335_r_at Internexin alpha Ina 19 C3
Expression profiling of PS1-deficient brainZK Mirnics et al
867
Molecular Psychiatry
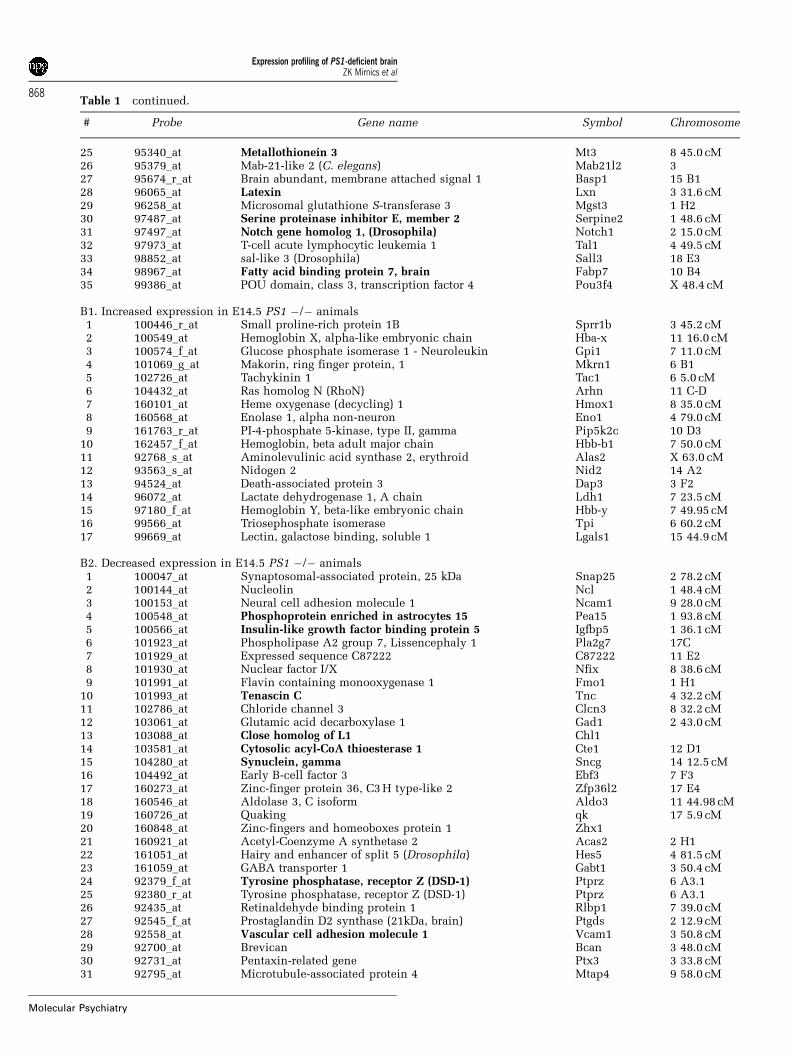
Table 1 continued.
# Probe Gene name Symbol Chromosome
25 95340_at Metallothionein 3 Mt3 8 45.0 cM26 95379_at Mab-21-like 2 (C. elegans) Mab21l2 327 95674_r_at Brain abundant, membrane attached signal 1 Basp1 15 B128 96065_at Latexin Lxn 3 31.6 cM29 96258_at Microsomal glutathione S-transferase 3 Mgst3 1 H230 97487_at Serine proteinase inhibitor E, member 2 Serpine2 1 48.6 cM31 97497_at Notch gene homolog 1, (Drosophila) Notch1 2 15.0 cM32 97973_at T-cell acute lymphocytic leukemia 1 Tal1 4 49.5 cM33 98852_at sal-like 3 (Drosophila) Sall3 18 E334 98967_at Fatty acid binding protein 7, brain Fabp7 10 B435 99386_at POU domain, class 3, transcription factor 4 Pou3f4 X 48.4 cM
B1. Increased expression in E14.5 PS1 �/� animals1 100446_r_at Small proline-rich protein 1B Sprr1b 3 45.2 cM2 100549_at Hemoglobin X, alpha-like embryonic chain Hba-x 11 16.0 cM3 100574_f_at Glucose phosphate isomerase 1 - Neuroleukin Gpi1 7 11.0 cM4 101069_g_at Makorin, ring finger protein, 1 Mkrn1 6 B15 102726_at Tachykinin 1 Tac1 6 5.0 cM6 104432_at Ras homolog N (RhoN) Arhn 11 C-D7 160101_at Heme oxygenase (decycling) 1 Hmox1 8 35.0 cM8 160568_at Enolase 1, alpha non-neuron Eno1 4 79.0 cM9 161763_r_at PI-4-phosphate 5-kinase, type II, gamma Pip5k2c 10 D3
10 162457_f_at Hemoglobin, beta adult major chain Hbb-b1 7 50.0 cM11 92768_s_at Aminolevulinic acid synthase 2, erythroid Alas2 X 63.0 cM12 93563_s_at Nidogen 2 Nid2 14 A213 94524_at Death-associated protein 3 Dap3 3 F214 96072_at Lactate dehydrogenase 1, A chain Ldh1 7 23.5 cM15 97180_f_at Hemoglobin Y, beta-like embryonic chain Hbb-y 7 49.95 cM16 99566_at Triosephosphate isomerase Tpi 6 60.2 cM17 99669_at Lectin, galactose binding, soluble 1 Lgals1 15 44.9 cM
B2. Decreased expression in E14.5 PS1 �/� animals1 100047_at Synaptosomal-associated protein, 25 kDa Snap25 2 78.2 cM2 100144_at Nucleolin Ncl 1 48.4 cM3 100153_at Neural cell adhesion molecule 1 Ncam1 9 28.0 cM4 100548_at Phosphoprotein enriched in astrocytes 15 Pea15 1 93.8 cM5 100566_at Insulin-like growth factor binding protein 5 Igfbp5 1 36.1 cM6 101923_at Phospholipase A2 group 7, Lissencephaly 1 Pla2g7 17C7 101929_at Expressed sequence C87222 C87222 11 E28 101930_at Nuclear factor I/X Nfix 8 38.6 cM9 101991_at Flavin containing monooxygenase 1 Fmo1 1 H1
10 101993_at Tenascin C Tnc 4 32.2 cM11 102786_at Chloride channel 3 Clcn3 8 32.2 cM12 103061_at Glutamic acid decarboxylase 1 Gad1 2 43.0 cM13 103088_at Close homolog of L1 Chl114 103581_at Cytosolic acyl-CoA thioesterase 1 Cte1 12 D115 104280_at Synuclein, gamma Sncg 14 12.5 cM16 104492_at Early B-cell factor 3 Ebf3 7 F317 160273_at Zinc-finger protein 36, C3H type-like 2 Zfp36l2 17 E418 160546_at Aldolase 3, C isoform Aldo3 11 44.98 cM19 160726_at Quaking qk 17 5.9 cM20 160848_at Zinc-fingers and homeoboxes protein 1 Zhx121 160921_at Acetyl-Coenzyme A synthetase 2 Acas2 2 H122 161051_at Hairy and enhancer of split 5 (Drosophila) Hes5 4 81.5 cM23 161059_at GABA transporter 1 Gabt1 3 50.4 cM24 92379_f_at Tyrosine phosphatase, receptor Z (DSD-1) Ptprz 6 A3.125 92380_r_at Tyrosine phosphatase, receptor Z (DSD-1) Ptprz 6 A3.126 92435_at Retinaldehyde binding protein 1 Rlbp1 7 39.0 cM27 92545_f_at Prostaglandin D2 synthase (21kDa, brain) Ptgds 2 12.9 cM28 92558_at Vascular cell adhesion molecule 1 Vcam1 3 50.8 cM29 92700_at Brevican Bcan 3 48.0 cM30 92731_at Pentaxin-related gene Ptx3 3 33.8 cM31 92795_at Microtubule-associated protein 4 Mtap4 9 58.0 cM
Expression profiling of PS1-deficient brainZK Mirnics et al
868
Molecular Psychiatry
that has been associated with lissencephaly), possiblyexplaining the characteristic brain morphology thatPS1-deficient embryos develop.27
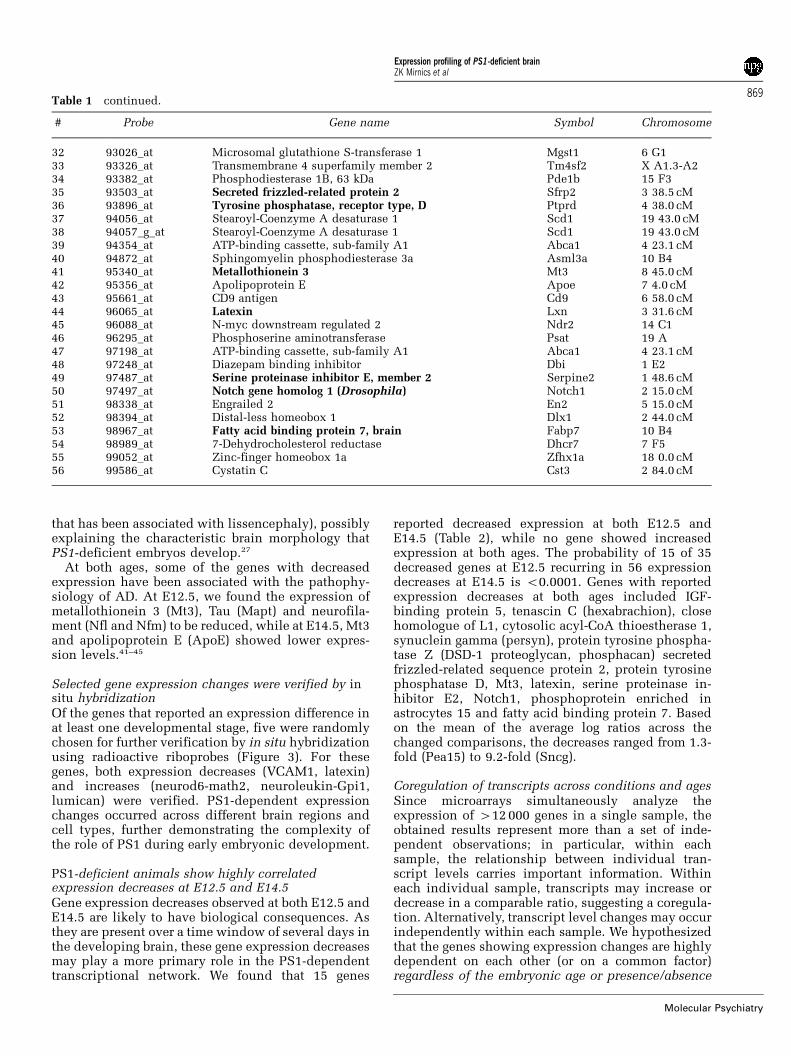
At both ages, some of the genes with decreasedexpression have been associated with the pathophy-siology of AD. At E12.5, we found the expression ofmetallothionein 3 (Mt3), Tau (Mapt) and neurofila-ment (Nfl and Nfm) to be reduced, while at E14.5, Mt3and apolipoprotein E (ApoE) showed lower expres-sion levels.41–45
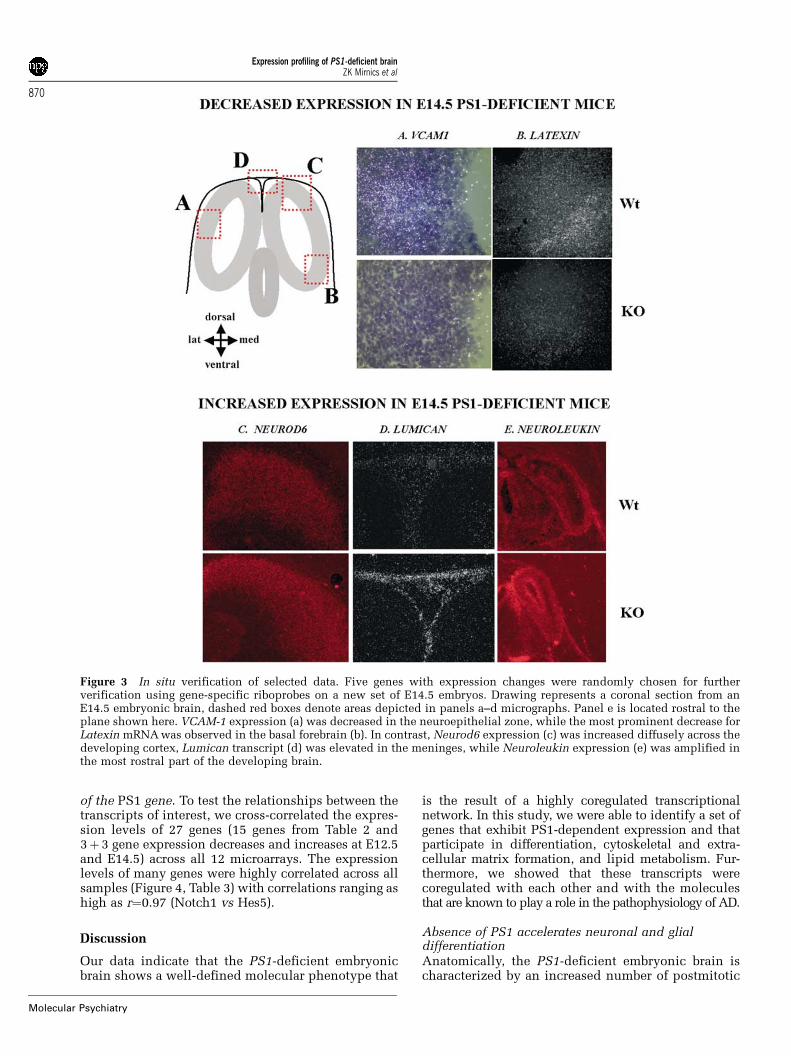
Selected gene expression changes were verified by insitu hybridizationOf the genes that reported an expression difference inat least one developmental stage, five were randomlychosen for further verification by in situ hybridizationusing radioactive riboprobes (Figure 3). For thesegenes, both expression decreases (VCAM1, latexin)and increases (neurod6-math2, neuroleukin-Gpi1,lumican) were verified. PS1-dependent expressionchanges occurred across different brain regions andcell types, further demonstrating the complexity ofthe role of PS1 during early embryonic development.
PS1-deficient animals show highly correlatedexpression decreases at E12.5 and E14.5Gene expression decreases observed at both E12.5 andE14.5 are likely to have biological consequences. Asthey are present over a time window of several days inthe developing brain, these gene expression decreasesmay play a more primary role in the PS1-dependenttranscriptional network. We found that 15 genes
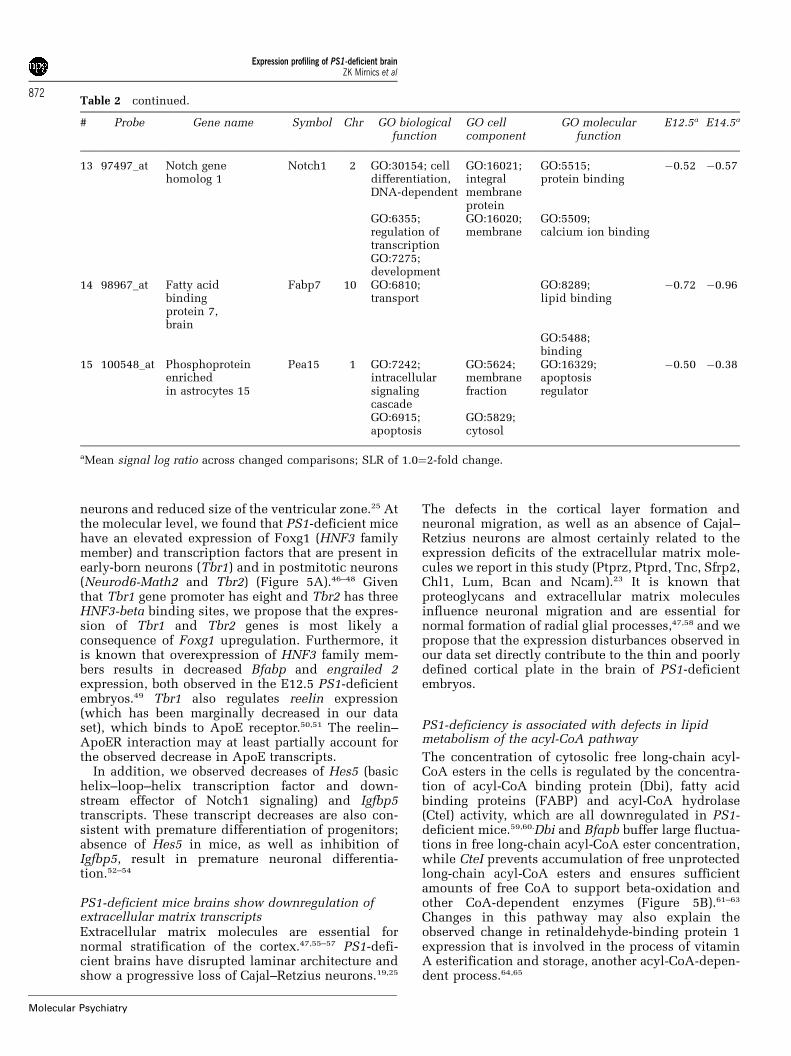
reported decreased expression at both E12.5 andE14.5 (Table 2), while no gene showed increasedexpression at both ages. The probability of 15 of 35decreased genes at E12.5 recurring in 56 expressiondecreases at E14.5 is o0.0001. Genes with reportedexpression decreases at both ages included IGF-binding protein 5, tenascin C (hexabrachion), closehomologue of L1, cytosolic acyl-CoA thioestherase 1,synuclein gamma (persyn), protein tyrosine phospha-tase Z (DSD-1 proteoglycan, phosphacan) secretedfrizzled-related sequence protein 2, protein tyrosinephosphatase D, Mt3, latexin, serine proteinase in-hibitor E2, Notch1, phosphoprotein enriched inastrocytes 15 and fatty acid binding protein 7. Basedon the mean of the average log ratios across thechanged comparisons, the decreases ranged from 1.3-fold (Pea15) to 9.2-fold (Sncg).
Coregulation of transcripts across conditions and agesSince microarrays simultaneously analyze theexpression of 412000 genes in a single sample, theobtained results represent more than a set of inde-pendent observations; in particular, within eachsample, the relationship between individual tran-script levels carries important information. Withineach individual sample, transcripts may increase ordecrease in a comparable ratio, suggesting a coregula-tion. Alternatively, transcript level changes may occurindependently within each sample. We hypothesizedthat the genes showing expression changes are highlydependent on each other (or on a common factor)regardless of the embryonic age or presence/absence
Table 1 continued.
# Probe Gene name Symbol Chromosome
32 93026_at Microsomal glutathione S-transferase 1 Mgst1 6 G133 93326_at Transmembrane 4 superfamily member 2 Tm4sf2 X A1.3-A234 93382_at Phosphodiesterase 1B, 63 kDa Pde1b 15 F335 93503_at Secreted frizzled-related protein 2 Sfrp2 3 38.5 cM36 93896_at Tyrosine phosphatase, receptor type, D Ptprd 4 38.0 cM37 94056_at Stearoyl-Coenzyme A desaturase 1 Scd1 19 43.0 cM38 94057_g_at Stearoyl-Coenzyme A desaturase 1 Scd1 19 43.0 cM39 94354_at ATP-binding cassette, sub-family A1 Abca1 4 23.1 cM40 94872_at Sphingomyelin phosphodiesterase 3a Asml3a 10 B441 95340_at Metallothionein 3 Mt3 8 45.0 cM42 95356_at Apolipoprotein E Apoe 7 4.0 cM43 95661_at CD9 antigen Cd9 6 58.0 cM44 96065_at Latexin Lxn 3 31.6 cM45 96088_at N-myc downstream regulated 2 Ndr2 14 C146 96295_at Phosphoserine aminotransferase Psat 19 A47 97198_at ATP-binding cassette, sub-family A1 Abca1 4 23.1 cM48 97248_at Diazepam binding inhibitor Dbi 1 E249 97487_at Serine proteinase inhibitor E, member 2 Serpine2 1 48.6 cM50 97497_at Notch gene homolog 1 (Drosophila) Notch1 2 15.0 cM51 98338_at Engrailed 2 En2 5 15.0 cM52 98394_at Distal-less homeobox 1 Dlx1 2 44.0 cM53 98967_at Fatty acid binding protein 7, brain Fabp7 10 B454 98989_at 7-Dehydrocholesterol reductase Dhcr7 7 F555 99052_at Zinc-finger homeobox 1a Zfhx1a 18 0.0 cM56 99586_at Cystatin C Cst3 2 84.0 cM
Expression profiling of PS1-deficient brainZK Mirnics et al
869
Molecular Psychiatry
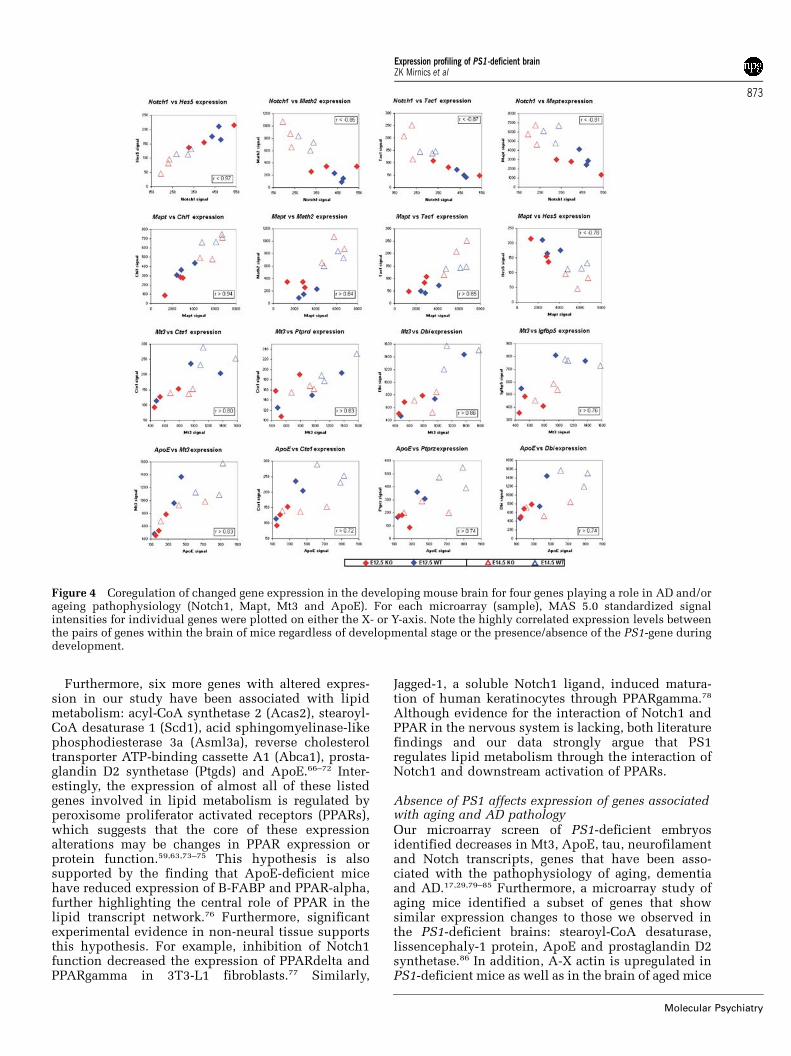
of the PS1 gene. To test the relationships between thetranscripts of interest, we cross-correlated the expres-sion levels of 27 genes (15 genes from Table 2 and3þ3 gene expression decreases and increases at E12.5and E14.5) across all 12 microarrays. The expressionlevels of many genes were highly correlated across allsamples (Figure 4, Table 3) with correlations ranging ashigh as r¼0.97 (Notch1 vs Hes5).
Discussion
Our data indicate that the PS1-deficient embryonicbrain shows a well-defined molecular phenotype that
is the result of a highly coregulated transcriptionalnetwork. In this study, we were able to identify a set ofgenes that exhibit PS1-dependent expression and thatparticipate in differentiation, cytoskeletal and extra-cellular matrix formation, and lipid metabolism. Fur-thermore, we showed that these transcripts werecoregulated with each other and with the moleculesthat are known to play a role in the pathophysiology of AD.
Absence of PS1 accelerates neuronal and glialdifferentiationAnatomically, the PS1-deficient embryonic brain ischaracterized by an increased number of postmitotic
Figure 3 In situ verification of selected data. Five genes with expression changes were randomly chosen for furtherverification using gene-specific riboprobes on a new set of E14.5 embryos. Drawing represents a coronal section from anE14.5 embryonic brain, dashed red boxes denote areas depicted in panels a–d micrographs. Panel e is located rostral to theplane shown here. VCAM-1 expression (a) was decreased in the neuroepithelial zone, while the most prominent decrease forLatexin mRNAwas observed in the basal forebrain (b). In contrast, Neurod6 expression (c) was increased diffusely across thedeveloping cortex, Lumican transcript (d) was elevated in the meninges, while Neuroleukin expression (e) was amplified inthe most rostral part of the developing brain.
Expression profiling of PS1-deficient brainZK Mirnics et al
870
Molecular Psychiatry
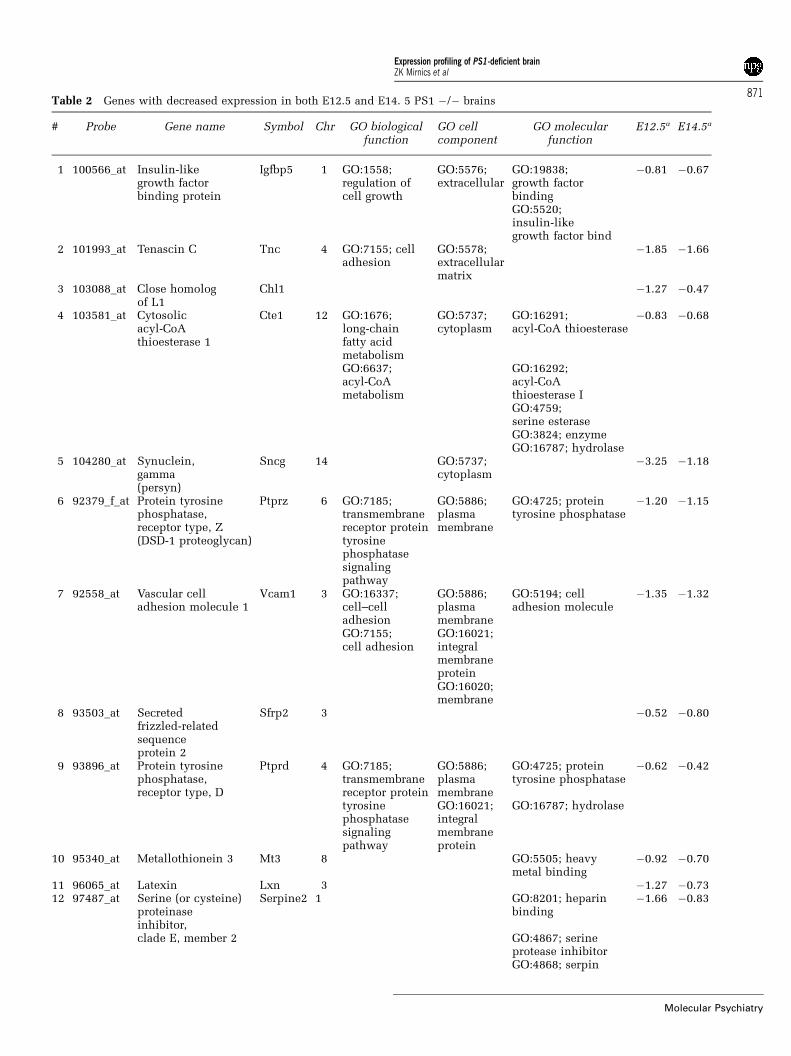
Table 2 Genes with decreased expression in both E12.5 and E14. 5 PS1 �/� brains
# Probe Gene name Symbol Chr GO biologicalfunction
GO cellcomponent
GO molecularfunction
E12.5a E14.5a
1 100566_at Insulin-likegrowth factorbinding protein
Igfbp5 1 GO:1558;regulation ofcell growth
GO:5576;extracellular
GO:19838;growth factorbinding
�0.81 �0.67
GO:5520;insulin-likegrowth factor bind
2 101993_at Tenascin C Tnc 4 GO:7155; celladhesion
GO:5578;extracellularmatrix
�1.85 �1.66
3 103088_at Close homologof L1
Chl1 �1.27 �0.47
4 103581_at Cytosolicacyl-CoAthioesterase 1
Cte1 12 GO:1676;long-chainfatty acidmetabolism
GO:5737;cytoplasm
GO:16291;acyl-CoA thioesterase
�0.83 �0.68
GO:6637;acyl-CoAmetabolism
GO:16292;acyl-CoAthioesterase IGO:4759;serine esteraseGO:3824; enzymeGO:16787; hydrolase
5 104280_at Synuclein,gamma(persyn)
Sncg 14 GO:5737;cytoplasm
�3.25 �1.18
6 92379_f_at Protein tyrosinephosphatase,receptor type, Z
Ptprz 6 GO:7185;transmembranereceptor protein
GO:5886;plasmamembrane
GO:4725; proteintyrosine phosphatase
�1.20 �1.15
(DSD-1 proteoglycan) tyrosinephosphatasesignalingpathway
7 92558_at Vascular celladhesion molecule 1
Vcam1 3 GO:16337;cell–celladhesion
GO:5886;plasmamembrane
GO:5194; celladhesion molecule
�1.35 �1.32
GO:7155;cell adhesion
GO:16021;integralmembraneproteinGO:16020;membrane
8 93503_at Secretedfrizzled-relatedsequenceprotein 2
Sfrp2 3 �0.52 �0.80
9 93896_at Protein tyrosinephosphatase,receptor type, D
Ptprd 4 GO:7185;transmembranereceptor protein
GO:5886;plasmamembrane
GO:4725; proteintyrosine phosphatase
�0.62 �0.42
tyrosinephosphatasesignalingpathway
GO:16021;integralmembraneprotein
GO:16787; hydrolase
10 95340_at Metallothionein 3 Mt3 8 GO:5505; heavymetal binding
�0.92 �0.70
11 96065_at Latexin Lxn 3 �1.27 �0.7312 97487_at Serine (or cysteine)
proteinaseinhibitor,
Serpine2 1 GO:8201; heparinbinding
�1.66 �0.83
clade E, member 2 GO:4867; serineprotease inhibitorGO:4868; serpin
Expression profiling of PS1-deficient brainZK Mirnics et al
871
Molecular Psychiatry
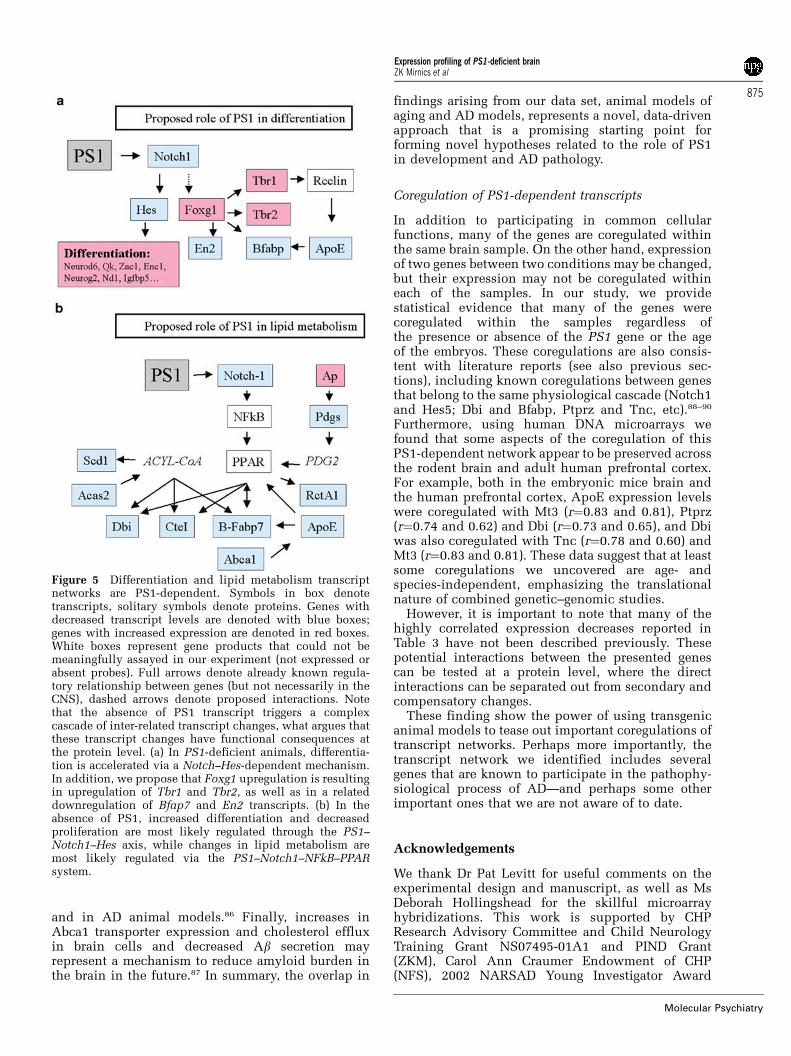
neurons and reduced size of the ventricular zone.25 Atthe molecular level, we found that PS1-deficient micehave an elevated expression of Foxg1 (HNF3 familymember) and transcription factors that are present inearly-born neurons (Tbr1) and in postmitotic neurons(Neurod6-Math2 and Tbr2) (Figure 5A).46–48 Giventhat Tbr1 gene promoter has eight and Tbr2 has threeHNF3-beta binding sites, we propose that the expres-sion of Tbr1 and Tbr2 genes is most likely aconsequence of Foxg1 upregulation. Furthermore, itis known that overexpression of HNF3 family mem-bers results in decreased Bfabp and engrailed 2expression, both observed in the E12.5 PS1-deficientembryos.49 Tbr1 also regulates reelin expression(which has been marginally decreased in our dataset), which binds to ApoE receptor.50,51 The reelin–ApoER interaction may at least partially account forthe observed decrease in ApoE transcripts.
In addition, we observed decreases of Hes5 (basichelix–loop–helix transcription factor and down-stream effector of Notch1 signaling) and Igfbp5transcripts. These transcript decreases are also con-sistent with premature differentiation of progenitors;absence of Hes5 in mice, as well as inhibition ofIgfbp5, result in premature neuronal differentia-tion.52–54
PS1-deficient mice brains show downregulation ofextracellular matrix transcriptsExtracellular matrix molecules are essential fornormal stratification of the cortex.47,55–57 PS1-defi-cient brains have disrupted laminar architecture andshow a progressive loss of Cajal–Retzius neurons.19,25
The defects in the cortical layer formation andneuronal migration, as well as an absence of Cajal–Retzius neurons are almost certainly related to theexpression deficits of the extracellular matrix mole-cules we report in this study (Ptprz, Ptprd, Tnc, Sfrp2,Chl1, Lum, Bcan and Ncam).23 It is known thatproteoglycans and extracellular matrix moleculesinfluence neuronal migration and are essential fornormal formation of radial glial processes,47,58 and wepropose that the expression disturbances observed inour data set directly contribute to the thin and poorlydefined cortical plate in the brain of PS1-deficientembryos.
PS1-deficiency is associated with defects in lipidmetabolism of the acyl-CoA pathway
The concentration of cytosolic free long-chain acyl-CoA esters in the cells is regulated by the concentra-tion of acyl-CoA binding protein (Dbi), fatty acidbinding proteins (FABP) and acyl-CoA hydrolase(CteI) activity, which are all downregulated in PS1-deficient mice.59,60.Dbi and Bfapb buffer large fluctua-tions in free long-chain acyl-CoA ester concentration,while CteI prevents accumulation of free unprotectedlong-chain acyl-CoA esters and ensures sufficientamounts of free CoA to support beta-oxidation andother CoA-dependent enzymes (Figure 5B).61–63
Changes in this pathway may also explain theobserved change in retinaldehyde-binding protein 1expression that is involved in the process of vitaminA esterification and storage, another acyl-CoA-depen-dent process.64,65
Table 2 continued.
# Probe Gene name Symbol Chr GO biologicalfunction
GO cellcomponent
GO molecularfunction
E12.5a E14.5a
13 97497_at Notch genehomolog 1
Notch1 2 GO:30154; celldifferentiation,DNA-dependent
GO:16021;integralmembraneprotein
GO:5515;protein binding
�0.52 �0.57
GO:6355;regulation oftranscription
GO:16020;membrane
GO:5509;calcium ion binding
GO:7275;development
14 98967_at Fatty acidbindingprotein 7,brain
Fabp7 10 GO:6810;transport
GO:8289;lipid binding
�0.72 �0.96
GO:5488;binding
15 100548_at Phosphoproteinenrichedin astrocytes 15
Pea15 1 GO:7242;intracellularsignalingcascade
GO:5624;membranefraction
GO:16329;apoptosisregulator
�0.50 �0.38
GO:6915;apoptosis
GO:5829;cytosol
aMean signal log ratio across changed comparisons; SLR of 1.0¼2-fold change.
Expression profiling of PS1-deficient brainZK Mirnics et al
872
Molecular Psychiatry
Furthermore, six more genes with altered expres-sion in our study have been associated with lipidmetabolism: acyl-CoA synthetase 2 (Acas2), stearoyl-CoA desaturase 1 (Scd1), acid sphingomyelinase-likephosphodiesterase 3a (Asml3a), reverse cholesteroltransporter ATP-binding cassette A1 (Abca1), prosta-glandin D2 synthetase (Ptgds) and ApoE.66–72 Inter-estingly, the expression of almost all of these listedgenes involved in lipid metabolism is regulated byperoxisome proliferator activated receptors (PPARs),which suggests that the core of these expressionalterations may be changes in PPAR expression orprotein function.59,63,73–75 This hypothesis is alsosupported by the finding that ApoE-deficient micehave reduced expression of B-FABP and PPAR-alpha,further highlighting the central role of PPAR in thelipid transcript network.76 Furthermore, significantexperimental evidence in non-neural tissue supportsthis hypothesis. For example, inhibition of Notch1function decreased the expression of PPARdelta andPPARgamma in 3T3-L1 fibroblasts.77 Similarly,
Jagged-1, a soluble Notch1 ligand, induced matura-tion of human keratinocytes through PPARgamma.78
Although evidence for the interaction of Notch1 andPPAR in the nervous system is lacking, both literaturefindings and our data strongly argue that PS1regulates lipid metabolism through the interaction ofNotch1 and downstream activation of PPARs.
Absence of PS1 affects expression of genes associatedwith aging and AD pathologyOur microarray screen of PS1-deficient embryosidentified decreases in Mt3, ApoE, tau, neurofilamentand Notch transcripts, genes that have been asso-ciated with the pathophysiology of aging, dementiaand AD.17,29,79–85 Furthermore, a microarray study ofaging mice identified a subset of genes that showsimilar expression changes to those we observed inthe PS1-deficient brains: stearoyl-CoA desaturase,lissencephaly-1 protein, ApoE and prostaglandin D2synthetase.86 In addition, A-X actin is upregulated inPS1-deficient mice as well as in the brain of aged mice
Figure 4 Coregulation of changed gene expression in the developing mouse brain for four genes playing a role in AD and/orageing pathophysiology (Notch1, Mapt, Mt3 and ApoE). For each microarray (sample), MAS 5.0 standardized signalintensities for individual genes were plotted on either the X- or Y-axis. Note the highly correlated expression levels betweenthe pairs of genes within the brain of mice regardless of developmental stage or the presence/absence of the PS1-gene duringdevelopment.
Expression profiling of PS1-deficient brainZK Mirnics et al
873
Molecular Psychiatry
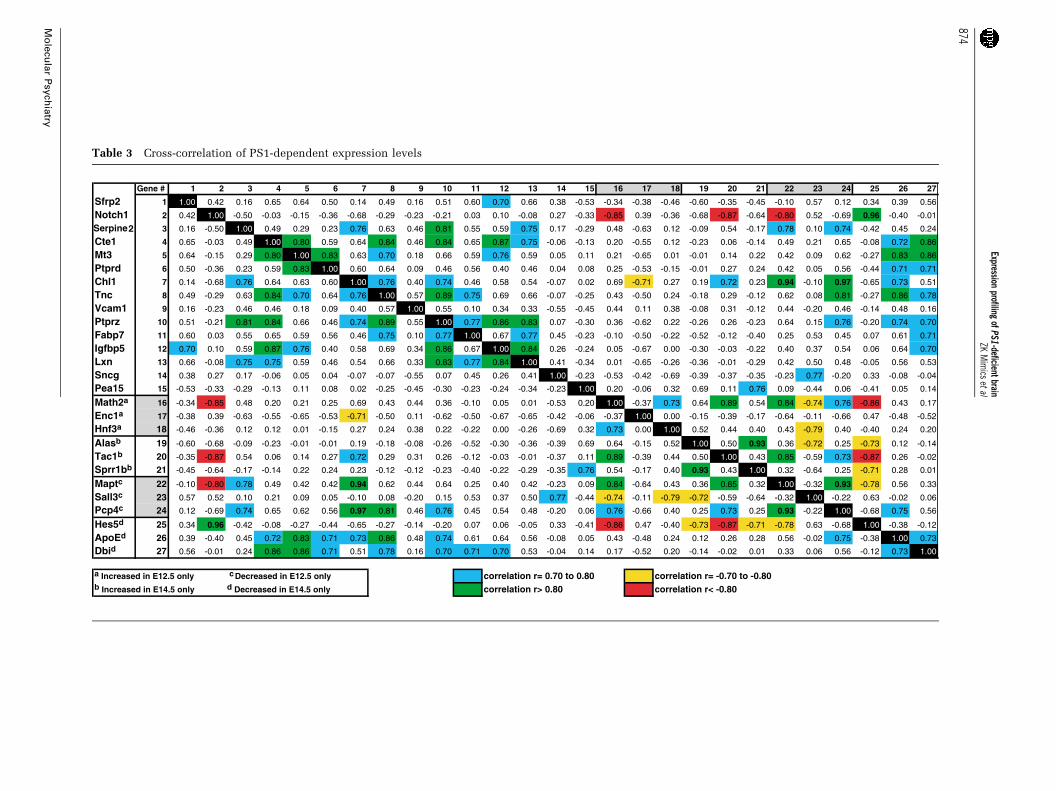
Table 3 Cross-correlation of PS1-dependent expression levels
Gene # 1 2 3 4 5 6 7 8 9 10 11 12 13 14 15 16 17 18 19 20 21 22 23 24 25 26 27
Sfrp2 1 1.00 0.42 0.16 0.65 0.64 0.50 0.14 0.49 0.16 0.51 0.60 0.70 0.66 0.38 -0.53 -0.34 -0.38 -0.46 -0.60 -0.35 -0.45 -0.10 0.57 0.12 0.34 0.39 0.56
Notch1 2 0.42 1.00 -0.50 -0.03 -0.15 -0.36 -0.68 -0.29 -0.23 -0.21 0.03 0.10 -0.08 0.27 -0.33 -0.85 0.39 -0.36 -0.68 -0.87 -0.64 -0.80 0.52 -0.69 0.96 -0.40 -0.01
Serpine2 3 0.16 -0.50 1.00 0.49 0.29 0.23 0.76 0.63 0.46 0.81 0.55 0.59 0.75 0.17 -0.29 0.48 -0.63 0.12 -0.09 0.54 -0.17 0.78 0.10 0.74 -0.42 0.45 0.24
Cte1 4 0.65 -0.03 0.49 1.00 0.80 0.59 0.64 0.84 0.46 0.84 0.65 0.87 0.75 -0.06 -0.13 0.20 -0.55 0.12 -0.23 0.06 -0.14 0.49 0.21 0.65 -0.08 0.72 0.86
Mt3 5 0.64 -0.15 0.29 0.80 1.00 0.83 0.63 0.70 0.18 0.66 0.59 0.76 0.59 0.05 0.11 0.21 -0.65 0.01 -0.01 0.14 0.22 0.42 0.09 0.62 -0.27 0.83 0.86
Ptprd 6 0.50 -0.36 0.23 0.59 0.83 1.00 0.60 0.64 0.09 0.46 0.56 0.40 0.46 0.04 0.08 0.25 -0.53 -0.15 -0.01 0.27 0.24 0.42 0.05 0.56 -0.44 0.71 0.71
Chl1 7 0.14 -0.68 0.76 0.64 0.63 0.60 1.00 0.76 0.40 0.74 0.46 0.58 0.54 -0.07 0.02 0.69 -0.71 0.27 0.19 0.72 0.23 0.94 -0.10 0.97 -0.65 0.73 0.51
Tnc 8 0.49 -0.29 0.63 0.84 0.70 0.64 0.76 1.00 0.57 0.89 0.75 0.69 0.66 -0.07 -0.25 0.43 -0.50 0.24 -0.18 0.29 -0.12 0.62 0.08 0.81 -0.27 0.86 0.78
Vcam1 9 0.16 -0.23 0.46 0.46 0.18 0.09 0.40 0.57 1.00 0.55 0.10 0.34 0.33 -0.55 -0.45 0.44 0.11 0.38 -0.08 0.31 -0.12 0.44 -0.20 0.46 -0.14 0.48 0.16
Ptprz 10 0.51 -0.21 0.81 0.84 0.66 0.46 0.74 0.89 0.55 1.00 0.77 0.86 0.83 0.07 -0.30 0.36 -0.62 0.22 -0.26 0.26 -0.23 0.64 0.15 0.76 -0.20 0.74 0.70
Fabp7 11 0.60 0.03 0.55 0.65 0.59 0.56 0.46 0.75 0.10 0.77 1.00 0.67 0.77 0.45 -0.23 -0.10 -0.50 -0.22 -0.52 -0.12 -0.40 0.25 0.53 0.45 0.07 0.61 0.71
Igfbp5 12 0.70 0.10 0.59 0.87 0.76 0.40 0.58 0.69 0.34 0.86 0.67 1.00 0.84 0.26 -0.24 0.05 -0.67 0.00 -0.30 -0.03 -0.22 0.40 0.37 0.54 0.06 0.64 0.70
Lxn 13 0.66 -0.08 0.75 0.75 0.59 0.46 0.54 0.66 0.33 0.83 0.77 0.84 1.00 0.41 -0.34 0.01 -0.65 -0.26 -0.36 -0.01 -0.29 0.42 0.50 0.48 -0.05 0.56 0.53
Sncg 14 0.38 0.27 0.17 -0.06 0.05 0.04 -0.07 -0.07 -0.55 0.07 0.45 0.26 0.41 1.00 -0.23 -0.53 -0.42 -0.69 -0.39 -0.37 -0.35 -0.23 0.77 -0.20 0.33 -0.08 -0.04
Pea15 15 -0.53 -0.33 -0.29 -0.13 0.11 0.08 0.02 -0.25 -0.45 -0.30 -0.23 -0.24 -0.34 -0.23 1.00 0.20 -0.06 0.32 0.69 0.11 0.76 0.09 -0.44 0.06 -0.41 0.05 0.14
Math2a 16 -0.34 -0.85 0.48 0.20 0.21 0.25 0.69 0.43 0.44 0.36 -0.10 0.05 0.01 -0.53 0.20 1.00 -0.37 0.73 0.64 0.89 0.54 0.84 -0.74 0.76 -0.86 0.43 0.17
Enc1a 17 -0.38 0.39 -0.63 -0.55 -0.65 -0.53 -0.71 -0.50 0.11 -0.62 -0.50 -0.67 -0.65 -0.42 -0.06 -0.37 1.00 0.00 -0.15 -0.39 -0.17 -0.64 -0.11 -0.66 0.47 -0.48 -0.52
Hnf3a 18 -0.46 -0.36 0.12 0.12 0.01 -0.15 0.27 0.24 0.38 0.22 -0.22 0.00 -0.26 -0.69 0.32 0.73 0.00 1.00 0.52 0.44 0.40 0.43 -0.79 0.40 -0.40 0.24 0.20
Alasb 19 -0.60 -0.68 -0.09 -0.23 -0.01 -0.01 0.19 -0.18 -0.08 -0.26 -0.52 -0.30 -0.36 -0.39 0.69 0.64 -0.15 0.52 1.00 0.50 0.93 0.36 -0.72 0.25 -0.73 0.12 -0.14
Tac1b 20 -0.35 -0.87 0.54 0.06 0.14 0.27 0.72 0.29 0.31 0.26 -0.12 -0.03 -0.01 -0.37 0.11 0.89 -0.39 0.44 0.50 1.00 0.43 0.85 -0.59 0.73 -0.87 0.26 -0.02
Sprr1bb 21 -0.45 -0.64 -0.17 -0.14 0.22 0.24 0.23 -0.12 -0.12 -0.23 -0.40 -0.22 -0.29 -0.35 0.76 0.54 -0.17 0.40 0.93 0.43 1.00 0.32 -0.64 0.25 -0.71 0.28 0.01
Maptc 22 -0.10 -0.80 0.78 0.49 0.42 0.42 0.94 0.62 0.44 0.64 0.25 0.40 0.42 -0.23 0.09 0.84 -0.64 0.43 0.36 0.85 0.32 1.00 -0.32 0.93 -0.78 0.56 0.33
Sall3c 23 0.57 0.52 0.10 0.21 0.09 0.05 -0.10 0.08 -0.20 0.15 0.53 0.37 0.50 0.77 -0.44 -0.74 -0.11 -0.79 -0.72 -0.59 -0.64 -0.32 1.00 -0.22 0.63 -0.02 0.06
Pcp4c 24 0.12 -0.69 0.74 0.65 0.62 0.56 0.97 0.81 0.46 0.76 0.45 0.54 0.48 -0.20 0.06 0.76 -0.66 0.40 0.25 0.73 0.25 0.93 -0.22 1.00 -0.68 0.75 0.56
Hes5d 25 0.34 0.96 -0.42 -0.08 -0.27 -0.44 -0.65 -0.27 -0.14 -0.20 0.07 0.06 -0.05 0.33 -0.41 -0.86 0.47 -0.40 -0.73 -0.87 -0.71 -0.78 0.63 -0.68 1.00 -0.38 -0.12
ApoEd 26 0.39 -0.40 0.45 0.72 0.83 0.71 0.73 0.86 0.48 0.74 0.61 0.64 0.56 -0.08 0.05 0.43 -0.48 0.24 0.12 0.26 0.28 0.56 -0.02 0.75 -0.38 1.00 0.73
Dbid 27 0.56 -0.01 0.24 0.86 0.86 0.71 0.51 0.78 0.16 0.70 0.71 0.70 0.53 -0.04 0.14 0.17 -0.52 0.20 -0.14 -0.02 0.01 0.33 0.06 0.56 -0.12 0.73 1.00
a Increased in E12.5 only cDecreased in E12.5 only correlation r= 0.70 to 0.80 correlation r= -0.70 to -0.80b Increased in E14.5 only d Decreased in E14.5 only correlation r> 0.80 correlation r< -0.80
Expressionprofiling
ofPS1-deficientbrainZK
Mirnics
etal
874
Molecu
larPsy
chiatry
and in AD animal models.86 Finally, increases inAbca1 transporter expression and cholesterol effluxin brain cells and decreased Ab secretion mayrepresent a mechanism to reduce amyloid burden inthe brain in the future.87 In summary, the overlap in
findings arising from our data set, animal models ofaging and AD models, represents a novel, data-drivenapproach that is a promising starting point forforming novel hypotheses related to the role of PS1in development and AD pathology.
Coregulation of PS1-dependent transcripts
In addition to participating in common cellularfunctions, many of the genes are coregulated withinthe same brain sample. On the other hand, expressionof two genes between two conditions may be changed,but their expression may not be coregulated withineach of the samples. In our study, we providestatistical evidence that many of the genes werecoregulated within the samples regardless ofthe presence or absence of the PS1 gene or the ageof the embryos. These coregulations are also consis-tent with literature reports (see also previous sec-tions), including known coregulations between genesthat belong to the same physiological cascade (Notch1and Hes5; Dbi and Bfabp, Ptprz and Tnc, etc).88–90
Furthermore, using human DNA microarrays wefound that some aspects of the coregulation of thisPS1-dependent network appear to be preserved acrossthe rodent brain and adult human prefrontal cortex.For example, both in the embryonic mice brain andthe human prefrontal cortex, ApoE expression levelswere coregulated with Mt3 (r¼0.83 and 0.81), Ptprz(r¼0.74 and 0.62) and Dbi (r¼0.73 and 0.65), and Dbiwas also coregulated with Tnc (r¼0.78 and 0.60) andMt3 (r¼0.83 and 0.81). These data suggest that at leastsome coregulations we uncovered are age- andspecies-independent, emphasizing the translationalnature of combined genetic–genomic studies.However, it is important to note that many of the
highly correlated expression decreases reported inTable 3 have not been described previously. Thesepotential interactions between the presented genescan be tested at a protein level, where the directinteractions can be separated out from secondary andcompensatory changes.These finding show the power of using transgenic
animal models to tease out important coregulations oftranscript networks. Perhaps more importantly, thetranscript network we identified includes severalgenes that are known to participate in the pathophy-siological process of AD—and perhaps some otherimportant ones that we are not aware of to date.
Acknowledgements
We thank Dr Pat Levitt for useful comments on theexperimental design and manuscript, as well as MsDeborah Hollingshead for the skillful microarrayhybridizations. This work is supported by CHPResearch Advisory Committee and Child NeurologyTraining Grant NS07495-01A1 and PIND Grant(ZKM), Carol Ann Craumer Endowment of CHP(NFS), 2002 NARSAD Young Investigator Award
Figure 5 Differentiation and lipid metabolism transcriptnetworks are PS1-dependent. Symbols in box denotetranscripts, solitary symbols denote proteins. Genes withdecreased transcript levels are denoted with blue boxes;genes with increased expression are denoted in red boxes.White boxes represent gene products that could not bemeaningfully assayed in our experiment (not expressed orabsent probes). Full arrows denote already known regula-tory relationship between genes (but not necessarily in theCNS), dashed arrows denote proposed interactions. Notethat the absence of PS1 transcript triggers a complexcascade of inter-related transcript changes, what argues thatthese transcript changes have functional consequences atthe protein level. (a) In PS1-deficient animals, differentia-tion is accelerated via a Notch–Hes-dependent mechanism.In addition, we propose that Foxg1 upregulation is resultingin upregulation of Tbr1 and Tbr2, as well as in a relateddownregulation of Bfap7 and En2 transcripts. (b) In theabsence of PS1, increased differentiation and decreasedproliferation are most likely regulated through the PS1–Notch1–Hes axis, while changes in lipid metabolism aremost likely regulated via the PS1–Notch1–NFkB–PPARsystem.
Expression profiling of PS1-deficient brainZK Mirnics et al
875
Molecular Psychiatry
(KM) and Ellison Medical Foundation Senior ScholarAward (SSS) and The Fidelity Foundation (SSS).
References
1 De Strooper B, Saftig P, Craessaerts K, Vanderstichele H, Guhde G,Annaert W et al. Deficiency of presenilin-1 inhibits the normalcleavage of amyloid precursor protein. Nature 1998; 391: 387–390.
2 Song W, Nadeau P, Yuan M, Yang X, Shen J, Yankner BA.Proteolytic release and nuclear translocation of Notch-1 areinduced by presenilin-1 and impaired by pathogenic presenilin-1mutations. Proc Natl Acad Sci USA 1999; 96: 6959–6963.
3 Ni CY, Murphy MP, Golde TE, Carpenter G. gamma-Secretasecleavage and nuclear localization of ErbB-4 receptor tyrosinekinase. Science 2001; 294: 2179–2181.
4 Sisodia SS, Annaert W, Kim SH, De Strooper B. Gamma-secretase:never more enigmatic. Trends Neurosci 2001; 24: S2–S6.
5 Selkoe DJ. Presenilin, Notch, and the genesis and treatment ofAlzheimer’s disease. Proc Natl Acad Sci USA 2001; 98: 11039–11041.
6 Kim DY, Ingano LA, Kovacs DM. Nectin-1 alpha, an immunoglo-bulin-like receptor involved in the formation of synapses, is asubstrate for presenilin/gamma-secretase-like cleavage. J BiolChem 2002; 277: 49976–49981.
7 Kimberly WT, LaVoie MJ, Ostaszewski BL, Ye W, Wolfe MS, SelkoeDJ. Complex N-linked glycosylated nicastrin associates with activegamma-secretase and undergoes tight cellular regulation. J BiolChem 2002; 277: 35113–35117.
8 Lammich S, Okochi M, Takeda M, Kaether C, Capell A, ZimmerAK et al. Presenilin-dependent intramembrane proteolysis ofCD44 leads to the liberation of its intracellular domain and thesecretion of an Abeta-like peptide. J Biol Chem 2002; 277: 44754–44759.
9 Marambaud P, Shioi J, Serban G, Georgakopoulos A, Sarner S,Nagy V et al. A presenilin-1/gamma-secretase cleavage releases theE-cadherin intracellular domain and regulates disassembly ofadherens junctions. EMBO J 2002; 21: 1948–1956.
10 May P, Reddy YK, Herz J. Proteolytic processing of low densitylipoprotein receptor-related protein mediates regulated release ofits intracellular domain. J Biol Chem 2002; 277: 18736–18743.
11 Sisodia SS, St George-Hyslop PH. Gamma-secretase, Notch, Abetaand Alzheimer’s disease: where do the presenilins fit in? Nat RevNeurosci 2002; 3: 281–290.
12 Ikeuchi T, Sisodia SS. The Notch ligands, delta1 and Jagged2, aresubstrates for presenilin-dependent ‘gamma-secretase’ cleavage.J Biol Chem 2003; 278: 7751–7754.
13 Wolfe MS, De Los Angeles J, Miller DD, Xia W, Selkoe DJ. Arepresenilins intramembrane-cleaving proteases? Implications forthe molecular mechanism of Alzheimer’s disease. Biochemistry1999; 38: 11223–11230.
14 Kimberly WT, Esler WP, Ye W, Ostaszewski BL, Gao J, Diehl T et al.Notch and the amyloid precursor protein are cleaved by similargamma- secretase(s). Biochemistry 2003; 42: 137–144.
15 Scheuner D, Eckman C, Jensen M, Song X, Citron M, Suzuki Net al. Secreted amyloid beta-protein similar to that in the senileplaques of Alzheimer’s disease is increased in vivo by thepresenilin 1 and 2 and APP mutations linked to familialAlzheimer’s disease. Nat Med 1996; 2: 864–870.
16 Borchelt DR, Thinakaran G, Eckman CB, Lee MK, Davenport F,Ratovitsky T et al. Familial Alzheimer’s disease-linked presenilin1 variants elevate Abeta1-42/1-40 ratio in vitro and in vivo. Neuron1996; 17: 1005–1013.
17 Price DL, Sisodia SS. Mutant genes in familial Alzheimer’s diseaseand transgenic models. Annu Rev Neurosci 1998; 21: 479–505.
18 Citron M, Eckman CB, Diehl TS, Corcoran C, Ostaszewski BL, XiaW et al. Additive effects of PS1 and APP mutations on secretion ofthe 42-residue amyloid beta-protein. Neurobiol Dis 1998; 5:107–116.
19 Shen J, Bronson RT, Chen DF, Xia W, Selkoe DJ, Tonegawa S.Skeletal and CNS defects in presenilin-1-deficient mice. Cell 1997;89: 629–639.
20 Wong PC, Zheng H, Chen H, Becher MW, Sirinathsinghji DJ,Trumbauer ME et al. Presenilin 1 is required for Notch1 and
DII1 expression in the paraxial mesoderm. Nature 1997; 387:288–292.
21 Wong PC, Borchelt DR, Lee MK, Pardo CA, Thinakaran G, MartinLJ et al. Familial amyotrophic lateral sclerosis and Alzheimer’sdisease. Transgenic models. Adv Exp Med Biol 1998; 446:145–159.
22 Davis JA, Naruse S, Chen H, Eckman C, Younkin S, Price DL et al.An Alzheimer’s disease-linked PS1 variant rescues the develop-mental abnormalities of PS1-deficient embryos. Neuron 1998; 20:603–609.
23 Hartmann D, De Strooper B, Saftig P. Presenilin-1 deficiency leadsto loss of Cajal–Retzius neurons and cortical dysplasia similar tohuman type 2 lissencephaly. Curr Biol 1999; 9: 719–727.
24 Herreman A, Hartmann D, Annaert W, Saftig P, Craessaerts K,Serneels L et al. Presenilin 2 deficiency causes a mild pulmonaryphenotype and no changes in amyloid precursor proteinprocessing but enhances the embryonic lethal phenotype ofpresenilin 1 deficiency. Proc Natl Acad Sci USA 1999; 96:11872–11877.
25 Handler M, Yang X, Shen J. Presenilin-1 regulates neuronaldifferentiation during neurogenesis. Development 2000; 127:2593–2606.
26 Herreman A, Serneels L, Annaert W, Collen D, Schoonjans L, DeStrooper B. Total inactivation of gamma-secretase activity inpresenilin-deficient embryonic stem cells. Nat Cell Biol 2000; 2:461–462.
27 Saftig P, Hartmann D, De Strooper B. The function of presenilin-1in amyloid beta-peptide generation and brain development. EurArch Psychiatry Clin Neurosci 1999; 249: 271–279.
28 Schwarzman AL, Singh N, Tsiper M, Gregori L, Dranovsky A,Vitek MP et al. Endogenous presenilin 1 redistributes to thesurface of lamellipodia upon adhesion of Jurkat cells to a collagenmatrix. Proc Natl Acad Sci USA 1999; 96: 7932–7937.
29 Johnsingh AA, Johnston JM, Merz G, Xu J, Kotula L, Jacobsen JSet al. Altered binding of mutated presenilin with cytoskeleton-interacting proteins. FEBS Lett 2000; 465: 53–58.
30 Benussi L, Alberici A, Mayhaus M, Langer U, Ghidoni R, MazzoliF et al. Detection of the presenilin 1 COOH-terminal fragment inthe extracellular compartment: a release enhanced by apoptosis.Exp Cell Res 2001; 269: 256–265.
31 Wirths O, Multhaup G, Czech C, Blanchard V, Tremp G, Pradier Let al. Reelin in plaques of beta-amyloid precursor protein andpresenilin-1 double-transgenic mice. Neurosci Lett 2001; 316:145–148.
32 Song C, Perides G, Wang D, Liu YF. Beta-amyloid peptide inducesformation of actin stress fibers through p38 mitogen-activatedprotein kinase. J Neurochem 2002; 83: 828–836.
33 Liauw J, Nguyen V, Huang J, St George-Hyslop P, Rozmahel R.Differential display analysis of presenilin 1-deficient mousebrains. Brain Res Mol Brain Res 2002; 109: 56–62.
34 Lipshutz RJ, Fodor SP, Gingeras TR, Lockhart DJ. High densitysynthetic oligonucleotide arrays. Nat Genet 1999; 21: 20–24.
35 Liu G, Loraine AE, Shigeta R, Cline M, Cheng J, Valmeekam V et al.NetAffx: Affymetrix probesets and annotations. Nucleic Acids Res2003; 31: 82–86.
36 Califano A, Stolovitzky G, Tu Y. Analysis of gene expressionmicroarrays for phenotype classification. Proc Int Conf Intell SystMol Biol 2000; 8: 75–85.
37 Mirnics K, Middleton FA, Marquez A, Lewis DA, Levitt P.Molecular characterization of schizophrenia viewed by microarrayanalysis of gene expression in prefrontal cortex. Neuron 2000; 28:53–67.
38 Mirnics K, Middleton FA, Lewis DA, Levitt P. Analysis of complexbrain disorders with gene expression microarrays: schizophreniaas a disease of the synapse. Trends Neurosci 2001; 24:479–486.
39 Mirnics K, Middleton FA, Lewis DA, Levitt P. The human genome:gene expression profiling and schizophrenia. Am J Psychiatry2001; 158: 1384.
40 Mirnics K, Lewis DA. Genes and subtypes of schizophrenia.Trends Mol Med 2001; 7: 281–283.
41 Masliah E, Mallory M, Veinbergs I, Miller A, Samuel W.Alterations in apolipoprotein E expression during aging andneurodegeneration. Prog Neurobiol 1996; 50: 493–503.
Expression profiling of PS1-deficient brainZK Mirnics et al
876
Molecular Psychiatry
42 Price DL, Wong PC, Borchelt DR, Pardo CA, Thinakaran G, DoanAP et al. Amyotrophic lateral sclerosis and Alzheimer disease. Les-sons from model systems. Rev Neurol (Paris) 1997; 153: 484–495.
43 Dowjat WK, Wisniewski H, Wisniewski T. Alzheimer’s diseasepresenilin-1 expression modulates the assembly of neurofila-ments. Neuroscience 2001; 103: 1–8.
44 Colangelo V, Schurr J, Ball MJ, Pelaez RP, Bazan NG, Lukiw WJ.Gene expression profiling of 12633 genes in Alzheimer hippo-campal CA1: transcription and neurotrophic factor down-regula-tion and up-regulation of apoptotic and pro-inflammatorysignaling. J Neurosci Res 2002; 70: 462–473.
45 Morfini G, Pigino G, Beffert U, Busciglio J, Brady ST. Fast axonaltransport misregulation and Alzheimer’s disease. NeuromolecularMed 2002; 2: 89–99.
46 Kageyama R, Ishibashi M, Takebayashi K, Tomita K. bHLHtranscription factors and mammalian neuronal differentiation.Int J Biochem Cell Biol 1997; 29: 1389–1399.
47 Lambert de Rouvroit C, Goffinet AM. A new view of early corticaldevelopment. Biochem Pharmacol 1998; 56: 1403–1409.
48 Ueno M, Kimura N, Nakashima K, Saito-Ohara F, Inazawa J, TagaT. Genomic organization, sequence and chromosomal localizationof the mouse Tbr2 gene and a comparative study with Tbr1. Gene2000; 254: 29–35.
49 Zhou H, Hughes DE, Major ML, Yoo K, Pesold C, Costa RH.Atypical mouse cerebellar development is caused by ectopicexpression of the forkhead box transcription factor HNF-3beta.Gene Express 2001; 9: 217–236.
50 Hsueh YP, Wang TF, Yang FC, Sheng M. Nuclear translocation andtranscription regulation by the membrane-associated guanylatekinase CASK/LIN-2. Nature 2000; 404: 298–302.
51 Hiesberger T, Trommsdorff M, Howell BW, Goffinet A, MumbyMC, Cooper JA et al. Direct binding of reelin to VLDL receptor andApoE receptor 2 induces tyrosine phosphorylation of disabled-1and modulates tau phosphorylation. Neuron 1999; 24: 481–489.
52 Ohtsuka T, Ishibashi M, Gradwohl G, Nakanishi S, Guillemot F,Kageyama R. Hes1 and Hes5 as notch effectors in mammalianneuronal differentiation. EMBO J 1999; 18: 2196–2207.
53 Kageyama R, Ohtsuka T. The Notch-Hes pathway in mammalianneural development. Cell Res 1999; 9: 179–188.
54 Kabos P, Kabosova A, Neuman T. Blocking HES1 expressioninitiates GABAergic differentiation and induces the expression ofp21(CIP1/WAF1) in human neural stem cells. J Biol Chem 2002;277: 8763–8766.
55 Bothwell M, Giniger E. Alzheimer’s disease: neurodevelopmentconverges with neurodegeneration. Cell 2000; 102: 271–273.
56 Fairen A, Morante-Oria J, Frassoni C. The surface of thedeveloping cerebral cortex: still special cells one century later.Prog Brain Res 2002; 136: 281–291.
57 Sobeih MM, Corfas G. Extracellular factors that regulate neuronalmigration in the central nervous system. Int J Dev Neurosci 2002;20: 349–357.
58 Halfter W, Dong S, Yip YP, Willem M, Mayer U. A critical functionof the pial basement membrane in cortical histogenesis. J Neurosci2002; 22: 6029–6040.
59 Helledie T, Antonius M, Sorensen RV, Hertzel AV, Bernlohr DA,Kolvraa S et al. Lipid-binding proteins modulate ligand-depen-dent trans-activation by peroxisome proliferator-activated recep-tors and localize to the nucleus as well as the cytoplasm. J LipidRes 2000; 41: 1740–1751.
60 Knudsen J, Neergaard TB, Gaigg B, Jensen MV, Hansen JK. Role ofacyl-CoA binding protein in acyl-CoA metabolism and acyl-CoA-mediated cell signaling. J Nutr 2000; 130: 294S–298S.
61 Schjerling CK, Hummel R, Hansen JK, Borsting C, Mikkelsen JM,Kristiansen K et al. Disruption of the gene encoding the acyl-CoA-binding protein (ACB1) perturbs acyl-CoA metabolism in Sacchar-omyces cerevisiae. J Biol Chem 1996; 271: 22514–22521.
62 Hunt MC, Nousiainen SE, Huttunen MK, Orii KE, Svensson LT,Alexson SE. Peroxisome proliferator-induced long chain acyl-CoAthioesterases comprise a highly conserved novel multi-gene familyinvolved in lipid metabolism. J Biol Chem 1999; 274:34317–34326.
63 Wolfrum C, Borrmann CM, Borchers T, Spener F. Fatty acids andhypolipidemic drugs regulate peroxisome proliferator-activatedreceptors alpha- and gamma-mediated gene expression via liver
fatty acid binding protein: a signaling path to the nucleus. ProcNatl Acad Sci USA 2001; 98: 2323–2328.
64 Ross AC. Cellular metabolism and activation of retinoids:roles of cellular retinoid-binding proteins. FASEB J 1993; 7: 317–327.
65 Hellemans K, Rombouts K, Quartier E, Dittie AS, Knorr A,Michalik L et al. PPAR{beta} regulates vitamin A metabolism-related gene expression in hepatic stellate cells undergoingactivation. J Lipid Res 2003; 44: 280–295.
66 Nimpf J, Schneider WJ. From cholesterol transport to signaltransduction: low density lipoprotein receptor, very low densitylipoprotein receptor, and apolipoprotein E receptor-2. BiochimBiophys Acta 2000; 1529: 287–298.
67 Fujino T, Kondo J, Ishikawa M, Morikawa K, Yamamoto TT.Acetyl–CoA synthetase 2, a mitochondrial matrix enzyme in-volved in the oxidation of acetate. J Biol Chem 2001; 276:11420–11426.
68 Santamarina-Fojo S, Remaley AT, Neufeld EB, Brewer Jr HB.Regulation and intracellular trafficking of the ABCA1 transporter.J Lipid Res 2001; 42: 1339–1345.
69 Miyazaki M, Ntambi JM. Role of stearoyl-coenzyme A desaturasein lipid metabolism. Prostaglandins Leukot Essent Fatty Acids2003; 68: 113–121.
70 Brousseau ME. ATP-binding cassette transporter A1, fatty acids,and cholesterol absorption. Curr Opin Lipidol 2003; 14: 35–40.
71 Joyce C, Freeman L, Brewer Jr HB, Santamarina-Fojo S. Study ofABCA1 function in transgenic mice. Arterioscler Thromb VascBiol 2003; 2: 2.
72 Fujimori K, Fujitani Y, Kadoyama K, Kumanogoh H, Ishikawa K,Urade Y. Regulation of lipocalin-type prostaglandin D synthasegene expression by Hes-1 through E-box and interleukin-1 beta viatwo NF-kappa B elements in rat leptomeningeal cells. J Biol Chem2003; 278: 6018–6026.
73 Kainu T, Wikstrom AC, Gustafsson JA, Pelto-Huikko M. Localiza-tion of the peroxisome proliferator-activated receptor in the brain.Neuroreport 1994; 5: 2481–2485.
74 Xing G, Zhang L, Heynen T, Yoshikawa T, Smith M, Weiss S et al.Rat PPAR delta contains a CGG triplet repeat and is prominentlyexpressed in the thalamic nuclei. Biochem Biophys Res Commun1995; 217: 1015–1025.
75 Gonzalez FJ. Recent update on the PPAR alpha-null mouse.Biochimie 1997; 79: 139–144.
76 Hung MC, Hayase K, Yoshida R, Sato M, Imaizumi K. Cerebralprotein kinase C and its mRNA level in apolipoprotein E-deficientmice. Life Sci 2001; 69: 1419–1427.
77 Garces C, Ruiz-Hidalgo MJ, de Mora JF, Park C, Miele L, Goldstein Jet al. Notch-1 controls the expression of fatty acid-activatedtranscription factors and is required for adipogenesis. J Biol Chem1997; 272: 29729–29734.
78 Nickoloff BJ, Qin JZ, Chaturvedi V, Denning MF, Bonish B,Miele L. Jagged-1 mediated activation of notch signalinginduces complete maturation of human keratinocytes throughNF-kappaB and PPARgamma. Cell Death Differ 2002; 9:842–855.
79 Goedert M, Sisodia SS, Price DL. Neurofibrillary tangles and beta-amyloid deposits in Alzheimer’s disease. Curr Opin Neurobiol1991; 1: 441–447.
80 Sisodia SS, Martin LJ, Walker LC, Borchelt DR, Price DL. Cellularand molecular biology of Alzheimer’s disease and animal models.Neuroimaging Clin N Am 1995; 5: 59–68.
81 Ebneth A, Godemann R, Stamer K, Illenberger S, Trinczek B,Mandelkow E. Overexpression of tau protein inhibits kinesin-dependent trafficking of vesicles, mitochondria, and endoplasmicreticulum: implications for Alzheimer’s disease. J Cell Biol 1998;143: 777–794.
82 Neely MD, Montine TJ. Csf lipoproteins and Alzheimer s disease.J Nutr Health Aging 2002; 6: 383–391.
83 Chung RS, Vickers JC, Chuah MI, Eckhardt BL, West AK.Metallothionein-III inhibits initial neurite formation in developingneurons as well as postinjury, regenerative neurite sprouting. ExpNeurol 2002; 178: 1–12.
84 Miyazaki I, Asanuma M, Higashi Y, Sogawa CA, Tanaka K, OgawaN. Age-related changes in expression of metallothionein-III in ratbrain. Neurosci Res 2002; 43: 323–333.
Expression profiling of PS1-deficient brainZK Mirnics et al
877
Molecular Psychiatry

85 Uchida Y, Gomi F, Masumizu T, Miura Y. Growth inhibitory factorprevents neurite extension and the death of cortical neuronscaused by high oxygen exposure through hydroxyl radicalscavenging. J Biol Chem 2002; 277: 32353–32359.
86 Jiang CH, Tsien JZ, Schultz PG, Hu Y. The effects of aging on geneexpression in the hypothalamus and cortex of mice. Proc NatlAcad Sci USA 2001; 98: 1930–1934.
87 Koldamova RP, Lefterov IM, Ikonomovic MD, Skoko J, Lefterov PI,Isanski BA et al. 22R-Hydroxycholesterol and 9-cis-retinoic acidinduce ABCA1 transporter expression and cholesterol efflux inbrain cells and decrease Abeta secretion. J Biol Chem 2003;22: 22.
88 Milev P, Chiba A, Haring M, Rauvala H, Schachner M, Ranscht Bet al. High affinity binding and overlapping localization ofneurocan and phosphacan/protein-tyrosine phosphatase-zeta/betawith tenascin-R, amphoterin, and the heparin-binding growth-associated molecule. J Biol Chem 1998; 273: 6998–7005.
89 Yanase H, Shimizu H, Yamada K, Iwanaga T. Cellular localizationof the diazepam binding inhibitor in glial cells with specialreference to its coexistence with brain-type fatty acid bindingprotein. Arch Histol Cytol 2002; 65: 27–36.
90 Iso T, Kedes L, Hamamori Y. HES and HERP families: multipleeffectors of the notch signaling pathway. J Cell Physiol 2003; 194:237–255.
Expression profiling of PS1-deficient brainZK Mirnics et al
878
Molecular Psychiatry
Related Documents