1 DNA MICROAARRAY (DNA CHIP) By: Dr Ashish C Patel Assistant Professor Vet College, AAU, Anand

Welcome message from author
This document is posted to help you gain knowledge. Please leave a comment to let me know what you think about it! Share it to your friends and learn new things together.
Transcript
1
DNA MICROAARRAY
(DNA CHIP)
By: Dr Ashish C PatelAssistant ProfessorVet College, AAU, Anand
2
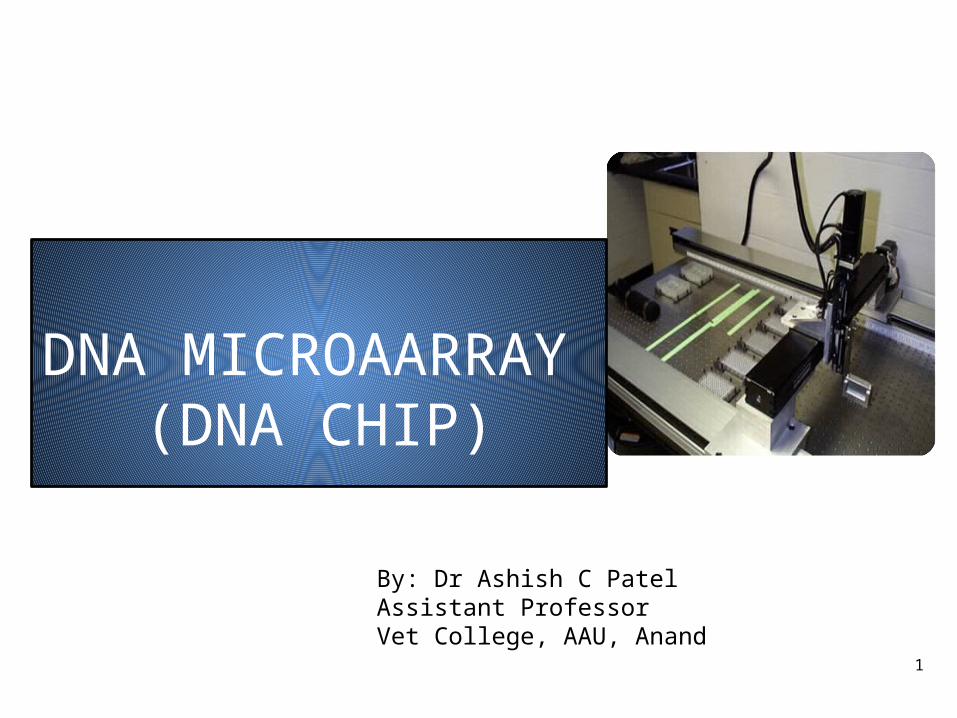
A DNA microarray is composed of pieces of DNA ranging from 20-5000 base pairs concentrated into specific areas on a solid support such as a glass or silicon. Each spot of DNA, called a probe, represents a single gene. Each spot may contain a few million copies of identical probe molecules.
There are several synonyms of DNA microarrays such as DNA chips, gene chips, DNA arrays, gene arrays and biochips.
Microarray technology evolved from Southern blotting, where fragmented DNA is attached to a substrate and then probed with a known DNA sequence.
The use of microarrays for gene expression profiling was first reported in 1995, and a complete eukaryotic genome (Saccharomyces cerevisiae) on a microarray was published in 1997.
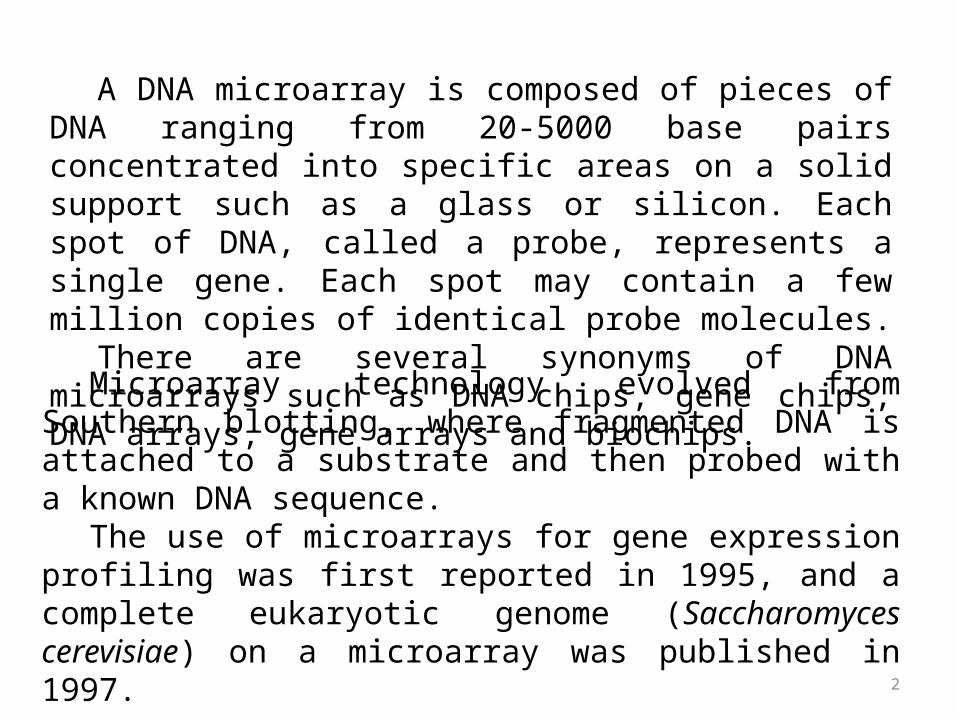
Overview
Array ProductionProbe generation &Robotic spottingOnChip Probe synthesis
Sample PreparationCells/Tissues- DNA/RNA/Protein/other biomolecules-labelling
HybridizationStringency Washes
Image ProcessingScanning, Quantification, Normalization
Data Analysis & Interpretation

4
PrincipleThe principle of DNA microarrays lies on the
hybridization between the nucleotide. Using this technology the presence of genomic or cDNA sequence in 1,00,000 or more sequences can be screened in a single hybridization.
The property of complementary nucleic acid sequences is to specifically pair with each other by forming hydrogen bonds between complementary nucleotide base pairs.

5
Design of a DNA
Microarray System
6
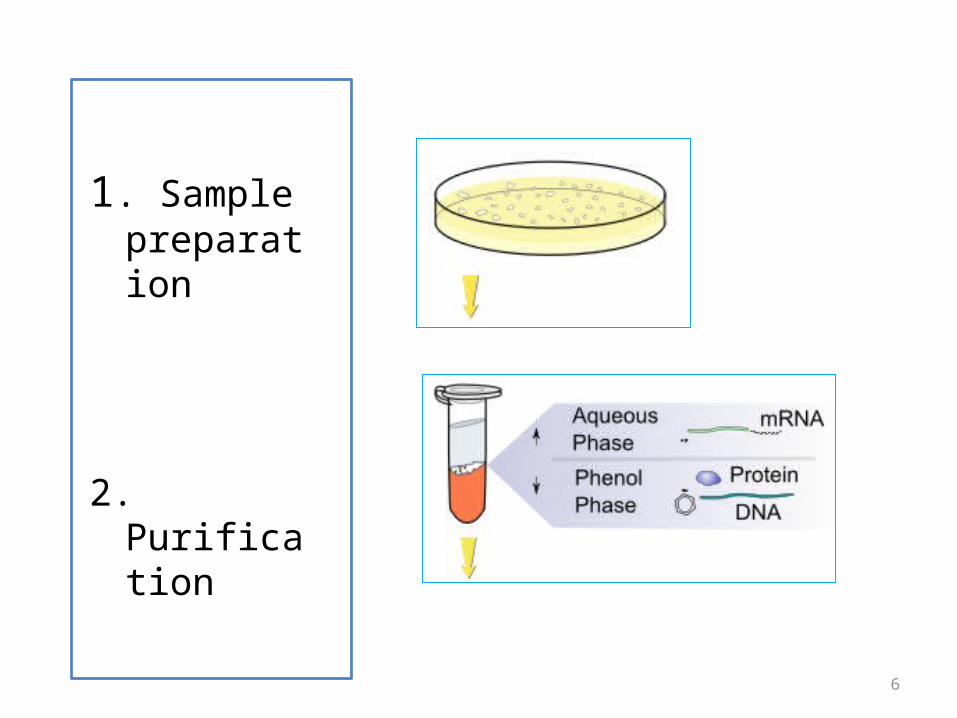
1. Sample preparation
2. Purification
7
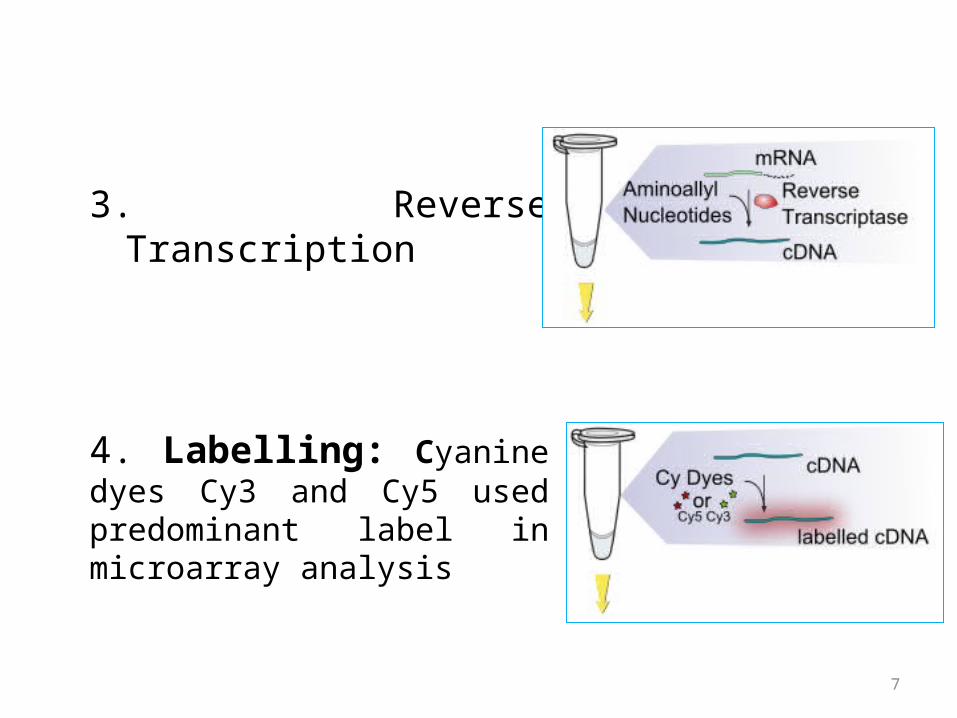
3. Reverse Transcription
4. Labelling: Cyanine dyes Cy3 and Cy5 used predominant label in microarray analysis
8
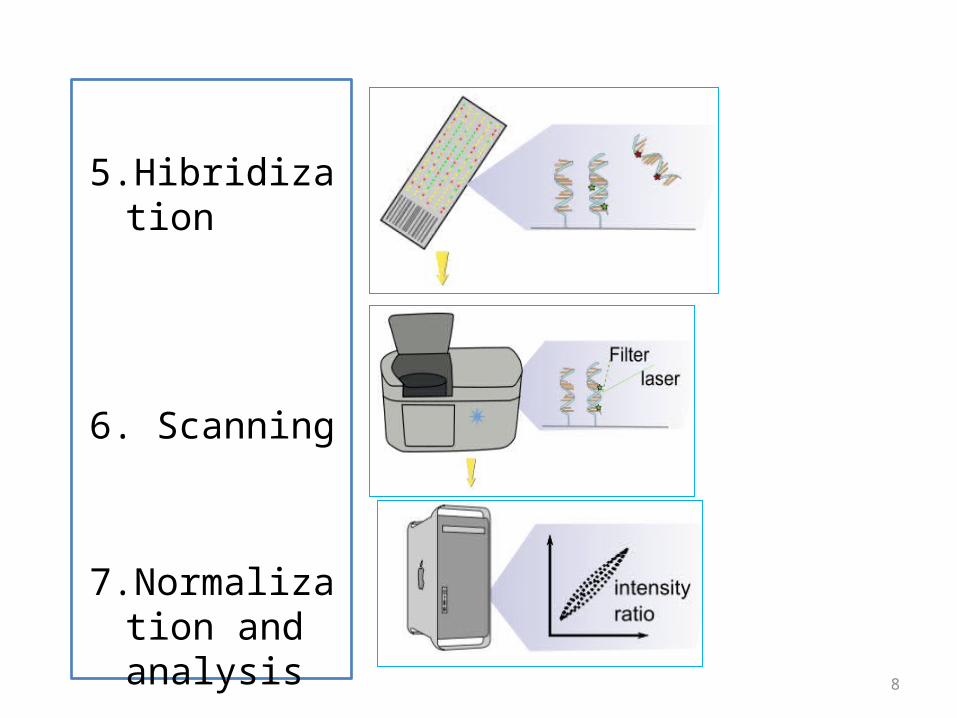
5.Hibridization
6. Scanning
7.Normalization and analysis

Types of microarray• DNA Microarray
– cDNA microarray– Oligonucleotide arrays
• Protein microarray– Analytical– Functional– Reverse phase
• Chemical compound arrays– collection of organic chemical compounds spotted on a solid surface
• Carbohydrate arrays– various oligosaccharides and/or polysaccharides immobilized on a
solid support in a spatially defined arrangement• Cellular Microarrays
– spotted with varying materials, such as antibodies, proteins, or lipids, which can interact with the cells, leading to their capture on specific spots
DNA microarray• Thousands of small “spots” or “features,”• Millions of strands of the same sequence within the spot
covalently attached to the microarray surface• The amount of DNA present in the spot correlates with the
overall binding capacity of the spot• The larger the binding capacity, the greater the amount of
fluorescence signal that can be detected• Binding capacity of the spot represents the detection range of
the microarray assay• Each spot must contain sufficient binding sites to adequately
represent differences in expression levels
• Spot is created by placing DNA “probes” on the functionalized surface
• Probes come in two distinct forms: oligonucleotide and PCR probes (“cDNA probes”)
• An oligonucleotide probe is a single-stranded DNA that can range in size typically from 20 to 80 nucleotides in length and is synthesized using standard phosphoramidite chemistry.
• The cDNA probe is essentially a PCR product (of almost any length) that is attached to the microarray surface using a specific attachment chemistry or simply ultraviolet cross-linking

• The decision to utilize oligo-probes or PCR probes depends upon the amount of genomic information known about the organism or cell system under investigation
• It is nearly impossible to design oligo-probes for organisms where no genomic data are available
• Gene expression studies in “emerging” organisms (i.e., those with little genomic data available) often involve PCR products derived from a cDNA library
• Advantages of oligo-probes are -multiple oligo-probes can be designed to a single gene, targeting oligo-probe designs to specific exons or exon boundaries to essentially avoid potential cross hybridization with non-target genes
• PCR probes can be attached to amine-reactive surfaces using the amine groups native to DNA, or by adding a 5’ amino-modifier to the PCR primer
• Once the microarrays have been spotted, a subsequent step is to quench the reactivity of the remaining amino-reactive surface on the microarray (i.e., the spaces between the spots)
• Spotting PCR probes on a poly-lysine microarray surface is carried out in a similar manner, but steps are taken to link the double-stranded PCR product to the surface
• This attachment method involves high heat (baking) and/or ultraviolet cross-linking
Fabrication of Microarray
• Printed array– Robotic Spotting: Contact printing via a variety of pins– Ink-jet printing: Non contact printing
• In-Situ Oligonucleotide synthesis– Photolithography– Ink-jet: On Chip Synthesis
• High Density Bead arrays– Sequence tagged beads are randomly assorted onto fiberoptic
bundles or silicone slides• Electronic microarray
– Microelectrode arrays, electrophoretic transport to load capture probes, hydrogel permeation layers

15
MANUFACTURING OF MICROARRAY SLIDES
• Microarray analysis is invariably performed on a glass slide, which enables to perform hybridization assays with fluorescently labelled samples.
• Microarray manufacture requires three distinct components:• 1. Production method• 2. Microarray slide• 3. Target genetic content
16
1. Production methodOligo synthesis• Two parallel approaches: a) Nucleic acid targets can either be
synthesized directly onto the microarray slide 2) purified targets can be deposited onto a solid surface that is capable of binding nucleic acids.
A) Photolithographic masking method: used in the semiconductor industry, in which attaching chemically modified linker groups, which contain photochemically removable protective groups, onto the glass surface.
• Target synthesis proceeds in a step-wise fashion. In each step, the unprotected areas are first activated with light which removes the light sensitive protective groups.
• Exposure of the activated areas to a nucleoside solution results in chemical attachment of the nucleoside to the activated positions. This process is then repeated by using a different mask and a new nucleotide until all nucleotides have been added to the oligo.
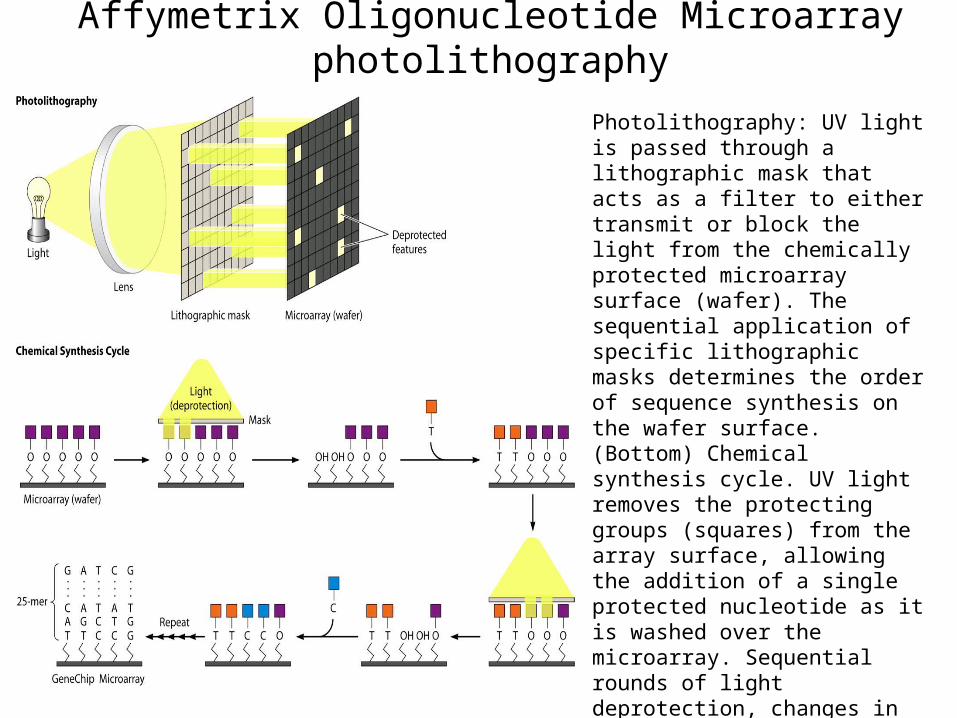
Affymetrix Oligonucleotide Microarray photolithography
Photolithography: UV light is passed through a lithographic mask that acts as a filter to either transmit or block the light from the chemically protected microarray surface (wafer). The sequential application of specific lithographic masks determines the order of sequence synthesis on the wafer surface. (Bottom) Chemical synthesis cycle. UV light removes the protecting groups (squares) from the array surface, allowing the addition of a single protected nucleotide as it is washed over the microarray. Sequential rounds of light deprotection, changes in the filtering patterns of the masks, and single nucleotide additions form microarray features with specific 25-bp probes
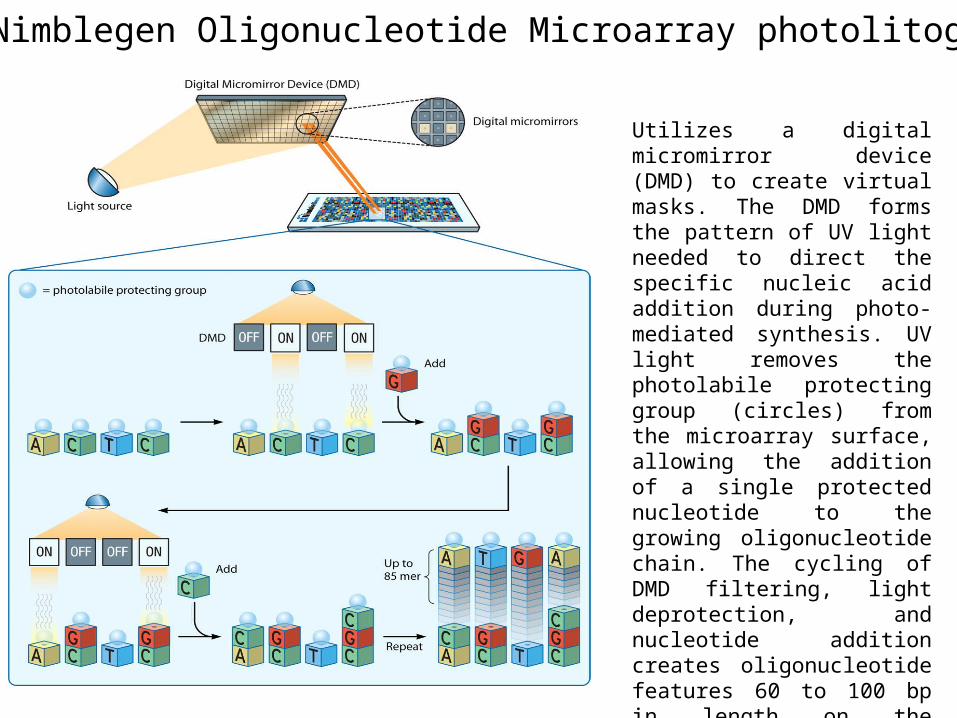
Roche Nimblegen Oligonucleotide Microarray photolitography
Utilizes a digital micromirror device (DMD) to create virtual masks. The DMD forms the pattern of UV light needed to direct the specific nucleic acid addition during photo-mediated synthesis. UV light removes the photolabile protecting group (circles) from the microarray surface, allowing the addition of a single protected nucleotide to the growing oligonucleotide chain. The cycling of DMD filtering, light deprotection, and nucleotide addition creates oligonucleotide features 60 to 100 bp in length on the NimbleGen microarray
19
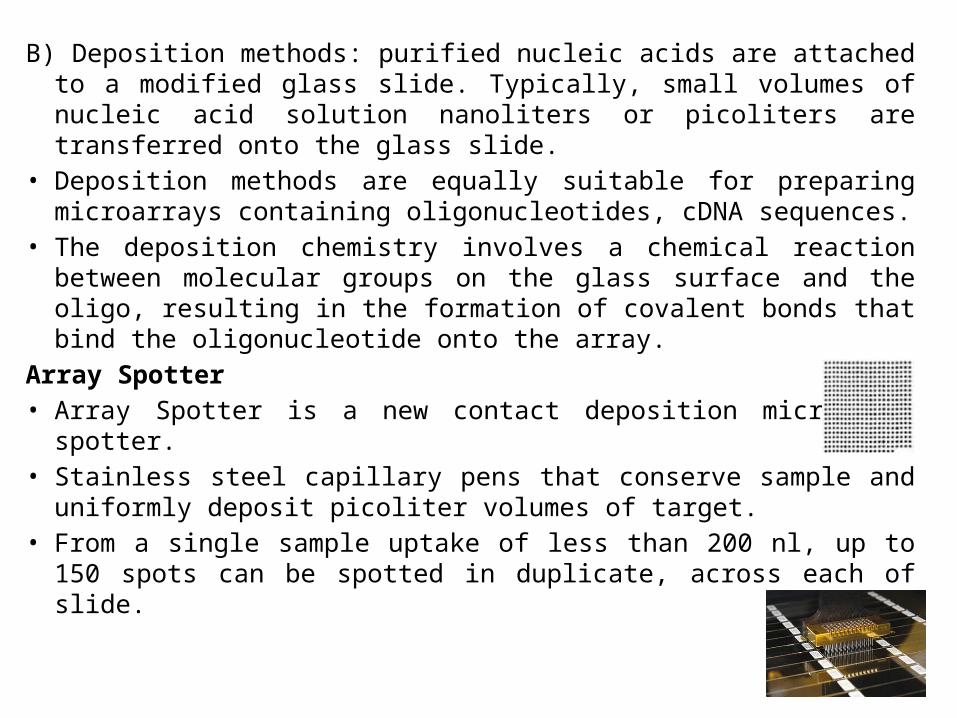
B) Deposition methods: purified nucleic acids are attached to a modified glass slide. Typically, small volumes of nucleic acid solution nanoliters or picoliters are transferred onto the glass slide.
• Deposition methods are equally suitable for preparing microarrays containing oligonucleotides, cDNA sequences.
• The deposition chemistry involves a chemical reaction between molecular groups on the glass surface and the oligo, resulting in the formation of covalent bonds that bind the oligonucleotide onto the array.
Array Spotter• Array Spotter is a new contact deposition microarray spotter. • Stainless steel capillary pens that conserve sample and uniformly
deposit picoliter volumes of target. • From a single sample uptake of less than 200 nl, up to 150 spots can
be spotted in duplicate, across each of slide.
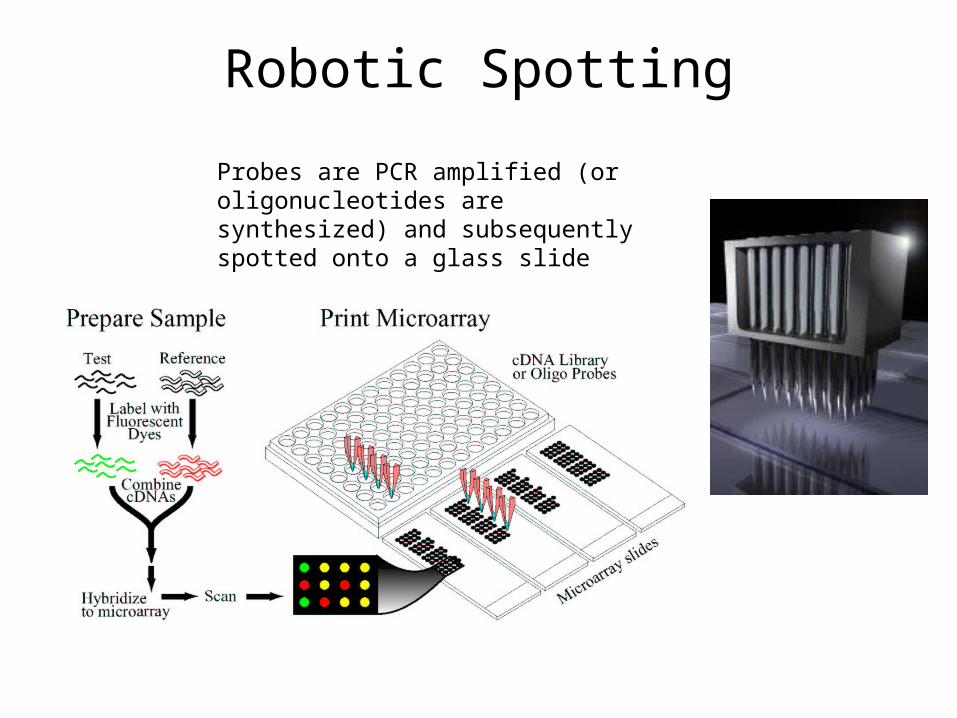
Robotic Spotting
Probes are PCR amplified (or oligonucleotides are synthesized) and subsequently spotted onto a glass slide
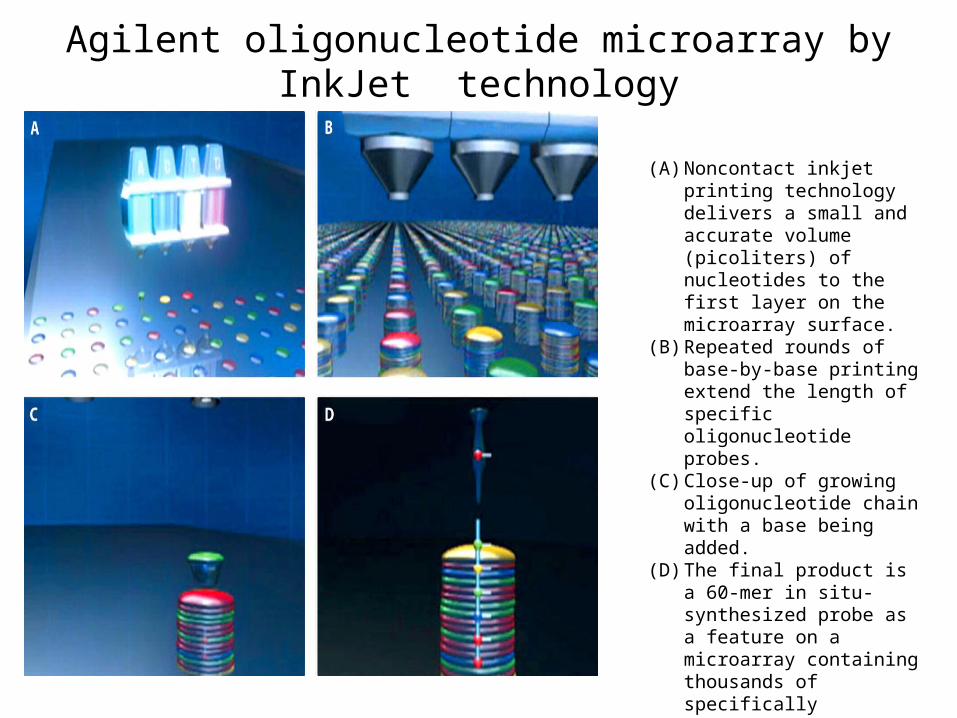
Agilent oligonucleotide microarray by InkJet technology
(A) Noncontact inkjet printing technology delivers a small and accurate volume (picoliters) of nucleotides to the first layer on the microarray surface.
(B) Repeated rounds of base-by-base printing extend the length of specific oligonucleotide probes.
(C) Close-up of growing oligonucleotide chain with a base being added.
(D) The final product is a 60-mer in situ-synthesized probe as a feature on a microarray containing thousands of specifically synthesized probes.
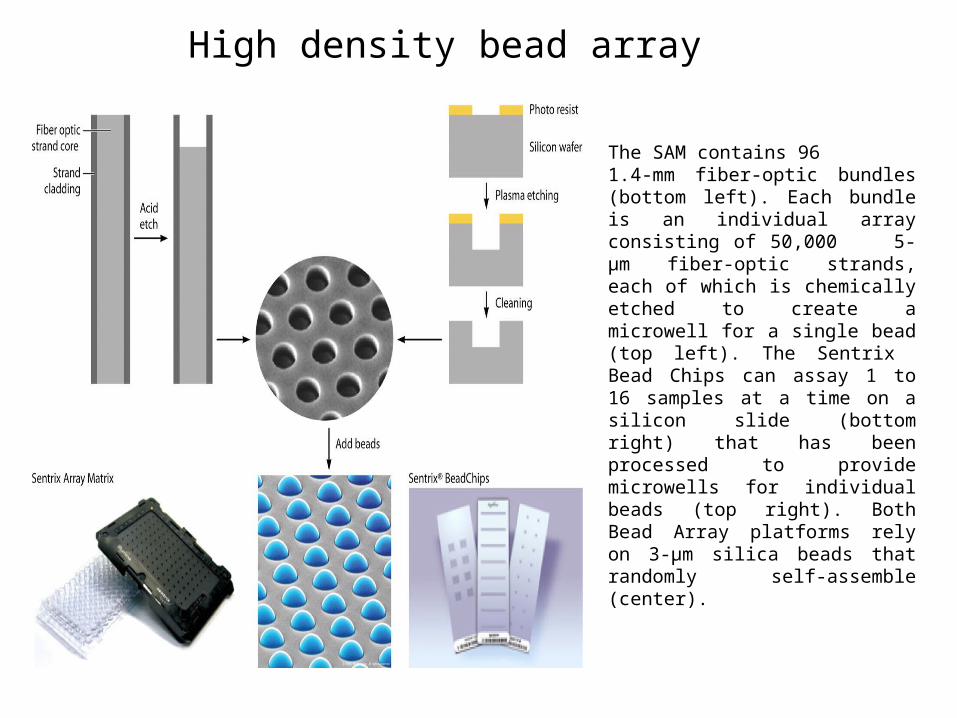
High density bead array
The SAM contains 96 1.4-mm fiber-optic bundles (bottom left). Each bundle is an individual array consisting of 50,000 5-μm fiber-optic strands, each of which is chemically etched to create a microwell for a single bead (top left). The Sentrix Bead Chips can assay 1 to 16 samples at a time on a silicon slide (bottom right) that has been processed to provide microwells for individual beads (top right). Both Bead Array platforms rely on 3-μm silica beads that randomly self-assemble (center).
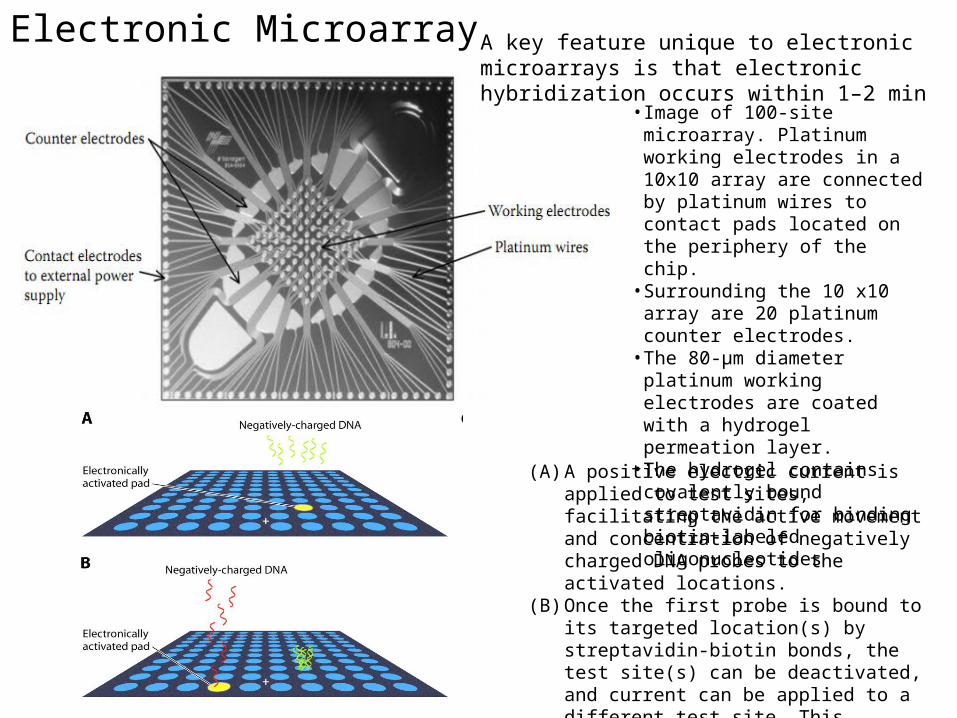
Electronic Microarray
(A) A positive electric current is applied to test sites, facilitating the active movement and concentration of negatively charged DNA probes to the activated locations.
(B) Once the first probe is bound to its targeted location(s) by streptavidin-biotin bonds, the test site(s) can be deactivated, and current can be applied to a different test site. This process is repeated until all the probes are arrayed.
• Image of 100-site microarray. Platinum working electrodes in a 10x10 array are connected by platinum wires to contact pads located on the periphery of the chip.
• Surrounding the 10 x10 array are 20 platinum counter electrodes.
• The 80-µm diameter platinum working electrodes are coated with a hydrogel permeation layer.
• The hydrogel contains covalently bound streptavidin for binding biotin-labeled oligonucleotides
A key feature unique to electronic microarrays is that electronic hybridization occurs within 1–2 min

24
Microarray slides• Most commonly used support for microarrays are standard glass
microscope slides that offer flat and rigid support with low intrinsic background fluorescence.
• Nucleic acids will not attach efficiently to an untreated glass slide. The treatment not only enable the binding of targets.
• The uniformity and thickness of the surface coating on the slide is critical for good quality microarray results.
• Variation in slide coating can contribute to the variation in microarray signals and decrease the resolution of a microarray experiment. Uneven slide coating can also lead to poor attachment of deposited nucleic acid, which may come loose during microarray hybridization.

25
• Commonly used slide surface modifications include the introduction of aldehyde, amino, or poly-lysine groups onto the slide surface.
• Treated slides give highly consistent and reproducible data with high signal to noise values, and they are most favorable for use in microarray experiments.
Aldehyde slides• To minimize fluorescent background.• Aromatic amines on the G, C, and A bases of naturally occurring
DNA can also react with aldehyde groups. Amine slides• Amine groups can be introduced onto microarray slides by
treating cleaned glass with aminosilane . • Vapor treatment of slides gives generally better results than
deposition by a dipping method.

26
Reflective slides• A large proportion of the fluorescent light emitted from the
hybridized probe is scattered in all directions when using regular glass arrays.
• The introduction of a reflective surface below the spotting surface enables a significant amount of this scattered output to be directed towards the detector, hence increasing the amount of signal detected by the system.
• These reflective slides are constructed by adding a layer of aluminium above the glass surface.

27
Target nucleic acids• The third critical component in microarray manufacturing is the
target nucleic acid. • Microarray targets must be available in high enough
concentration to allow a sufficient number of molecules to be deposited onto the slide.
• The purity of target solutions is important for both the efficient attachment of nucleic acids to the slide surface and the availability of the immobilized targets for hybridization.
• PCR-amplified targets must be purified to remove dNTPs, primers, DNA polymerase, buffer salts, and detergents.
• The targets, once attached to the microarray surface, are only available for hybridization when they are present in a denatured, single-stranded form.
• This can be achieved by spotting the targets under denaturing conditions, with in high salt solutions, or in denaturing solvents such as DMSO.
28
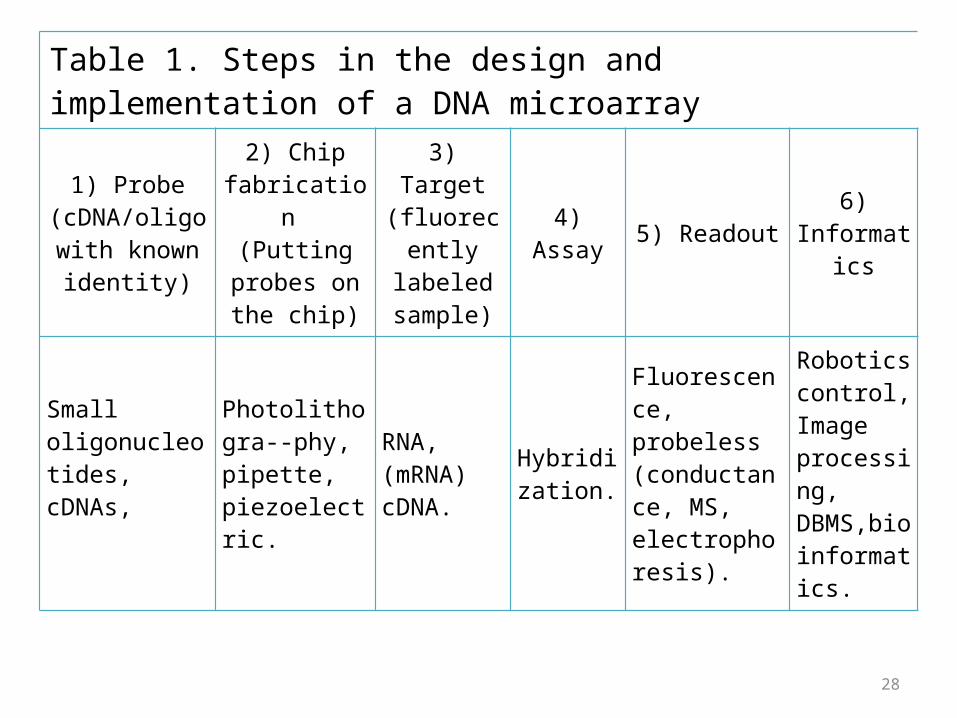
Table 1. Steps in the design and implementation of a DNA microarray
1) Probe (cDNA/oligo with known
identity)
2) Chip fabrication
(Putting probes on the chip)
3) Target (fluorecen
tly labeled sample)
4) Assay 5) Readout
6) Informati
cs
Small oligonucleotides, cDNAs,
Photolithogra--phy, pipette, piezoelectric.
RNA, (mRNA)cDNA.
Hybridization.
Fluorescence, probeless (conductance, MS, electrophoresis).
Robotics control, Image processing, DBMS,bioinformatics.

Sample Preparation for gene expression profiling by DNA microarray
• First step in sample preparation for gene expression profiling is RNA isolation from the biological sample
• The mRNA is converted to cDNA using reverse transcription with fluorescently labelled nucleotides
• These fluorescence-labeled cDNAs represent the mRNAs in the original sample and are hybridized to the microarray
• The two fluorescent dyes typically utilized in fluorescence labeling are cyanine-3 (Cy-3) and cyanine-5 (Cy-5), which are green- and red-colored dyes respectively

• Each microarray experiment involves two reverse transcription reactions (e.g., control and drug-treated)
• The “control” (e.g., untreated) mRNA sample is added to a reverse transcription reaction that includes a dye-conjugated nucleotide (green)
• Whereas the “test” (e.g., drug-treated) sample is added to a reverse transcription reaction that includes a different dye-conjugated nucleotide (red)
• The cDNAs derived from the two reactions are mixed prior to microarray hybridization, creating a “two-color” sample
• if the test sample (i.e., drug-treated sample) causes GENE X to increase the mRNA expression levels, then the GENE X spot will appear more red than green (after color channel normalization)
• If the green fluorescence (control sample) from the GENE X spot is measured at 10,000 relative fluorescence units (RFUs) and the red fluorescence (test sample) at 40,000 RFUs, then the test sample contains a fourfold increase in GENE X expression (i.e., a 400% increase over the control)
DNA microarray Hybridization
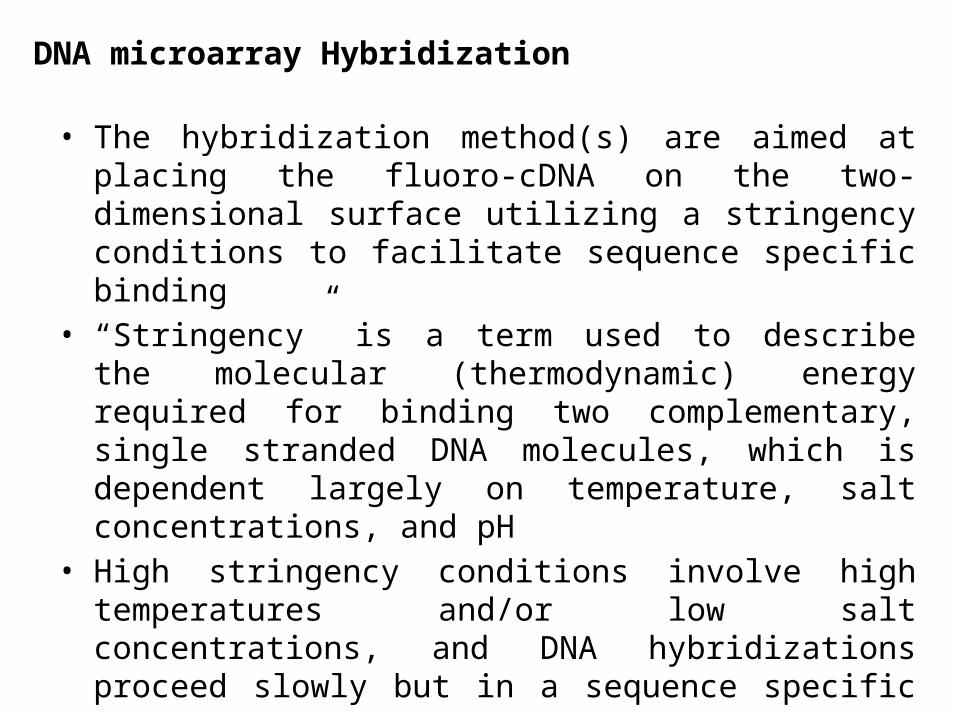
• The hybridization method(s) are aimed at placing the fluoro-cDNA on the two-dimensional surface utilizing a stringency conditions to facilitate sequence specific binding
• “Stringency” is a term used to describe the molecular (thermodynamic) energy required for binding two complementary, single stranded DNA molecules, which is dependent largely on temperature, salt concentrations, and pH
• High stringency conditions involve high temperatures and/or low salt concentrations, and DNA hybridizations proceed slowly but in a sequence specific manner
• low stringency conditions involves cooler temperatures and/or high salt concentrations, and DNA can form double-stranded complexes even if their sequences are not complementary (i.e., nonspecific binding)
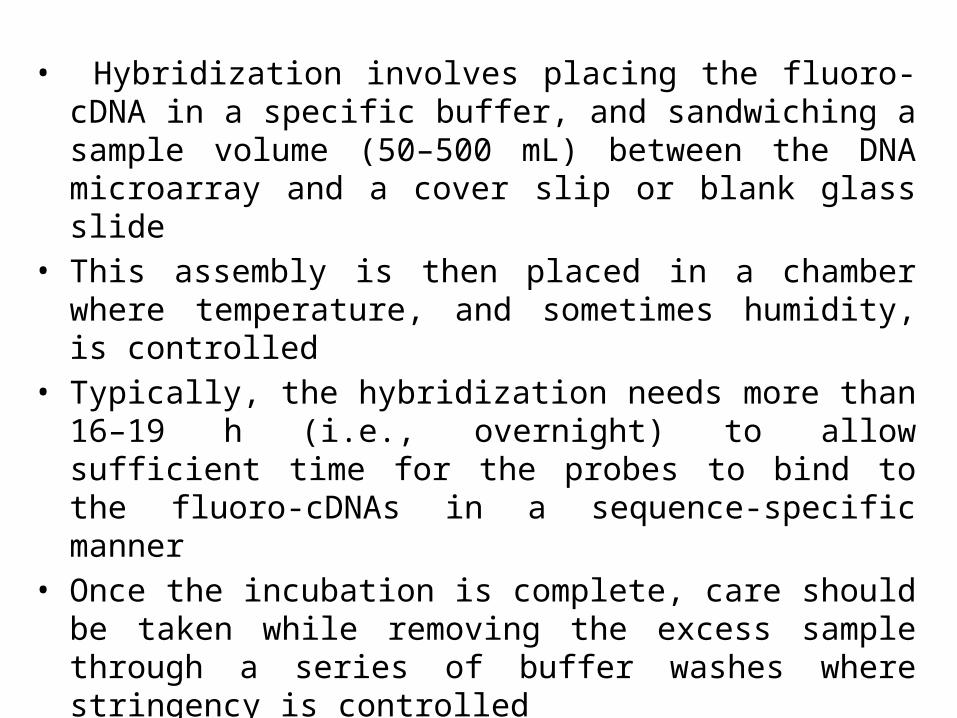
• Hybridization involves placing the fluoro-cDNA in a specific buffer, and sandwiching a sample volume (50–500 mL) between the DNA microarray and a cover slip or blank glass slide
• This assembly is then placed in a chamber where temperature, and sometimes humidity, is controlled
• Typically, the hybridization needs more than 16–19 h (i.e., overnight) to allow sufficient time for the probes to bind to the fluoro-cDNAs in a sequence-specific manner
• Once the incubation is complete, care should be taken while removing the excess sample through a series of buffer washes where stringency is controlled
• Finally the microarrays (slides) are dried using centrifugation or airflow
• The microarrays are now ready for scanning (i.e., fluorescence detection)
DNA Microarray Image processing
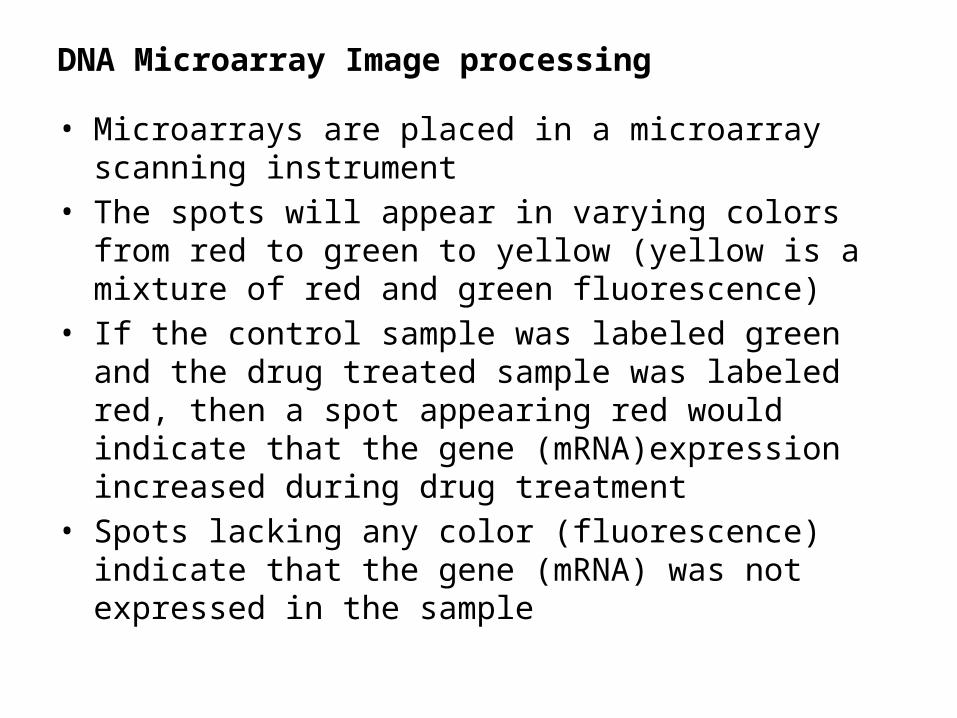
• Microarrays are placed in a microarray scanning instrument• The spots will appear in varying colors from red to green to
yellow (yellow is a mixture of red and green fluorescence)• If the control sample was labeled green and the drug treated
sample was labeled red, then a spot appearing red would indicate that the gene (mRNA)expression increased during drug treatment
• Spots lacking any color (fluorescence) indicate that the gene (mRNA) was not expressed in the sample
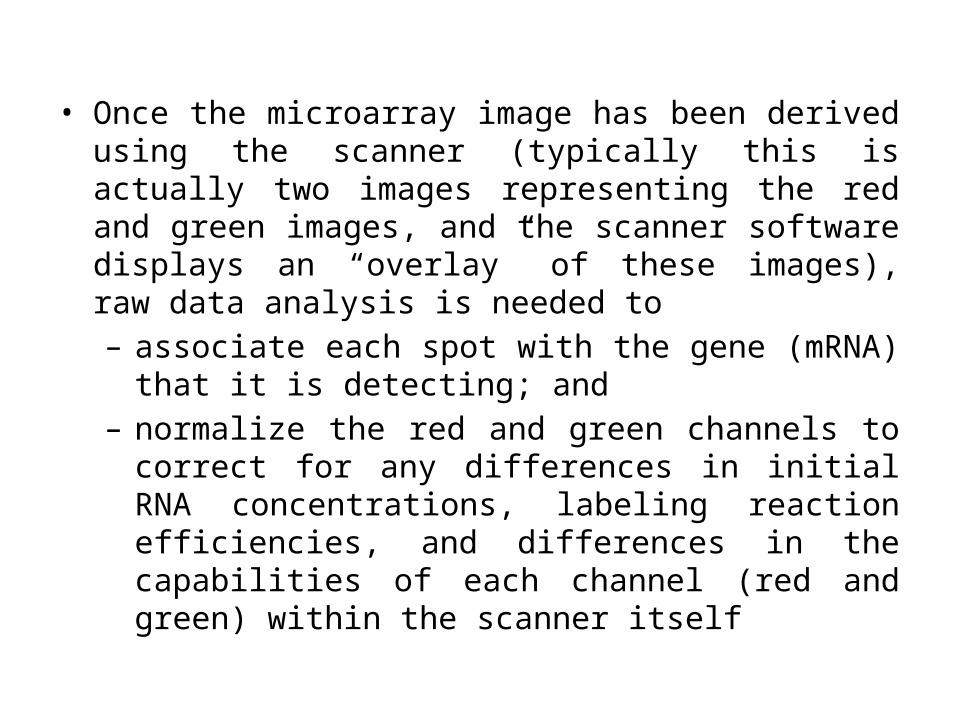
• Once the microarray image has been derived using the scanner (typically this is actually two images representing the red and green images, and the scanner software displays an “overlay” of these images), raw data analysis is needed to – associate each spot with the gene (mRNA) that it is
detecting; and – normalize the red and green channels to correct for any
differences in initial RNA concentrations, labeling reaction efficiencies, and differences in the capabilities of each channel (red and green) within the scanner itself

• Preprocessing of oligo arrays generally involves three steps: background correction, normalization, and summarization
• Normalization in microarray experiments is carried out based on the assumption that only a small proportion of genes will be differentially expressed among the thousands of genes present in the array and/or that there is symmetry in the up- and down-regulation of genes
• Most standard image processing algorithms extract the signal intensities for each spot and from the surrounding background
• The measurement of background intensities can be averaged over entire arrays or taken from the area adjacent to a spot
• The background intensity derived from the intensity values of the lowest 2% of cells on the chip, establishes an overall baseline intensity to be subtracted from all cells before gene expression levels are calculated
• Early days: fixed fold-change cut-off (usually twofold) was used to define differentially expressed genes– does not take into account the biological and experimental
variability in the data– thus many genes with high fold-changes but poor-quality
data were mistakenly identified as being differentially expressed
– whereas genes with reproducible data but low fold-changes were missed

Expression Ratio
Logarithmic Transformation of Expression Ratio
Log2(expression ratio)if the expression ratio is 1, then log2 (1) equals 0 represents no change in expression. If the expression ratio is 4, then log2 (4) equals +2 and for expression ratio of log2 (1/4) equals -2
For each gene k on the array, where Rk represents the spot intensity metric for the test sample and Gk represents the spot intensity metric for the reference sample.

• sophisticated statistical approaches-involve three steps: – calculating a test statistic, assigning the significance, and
choosing a cut-off value for the statistical significance• For a simple two condition experiment
– ordinary t-test, t = M/(s/√n ), where M is the average log-ratio, s is the standard deviation of the M-values, and n is the number of replicates
• After a test statistic has been selected, the next step is to compute the significance (P-value) of the test statistic and to choose a cut-off value, above which the genes will be considered as differentially expressed

39
Cluster AnalysisTwo Algorithms for Clustering Analysis• Hierarchical clustering• K-Means / K-Medians clusteringExpression Data Matrix• Gene expression data are usually presented in an expression matrix.
Each element is a log ratio. The log ratio is defined as log2 (T/R), where T is the gene expression level in the testing sample, R is the gene expression level in the reference sample.
40
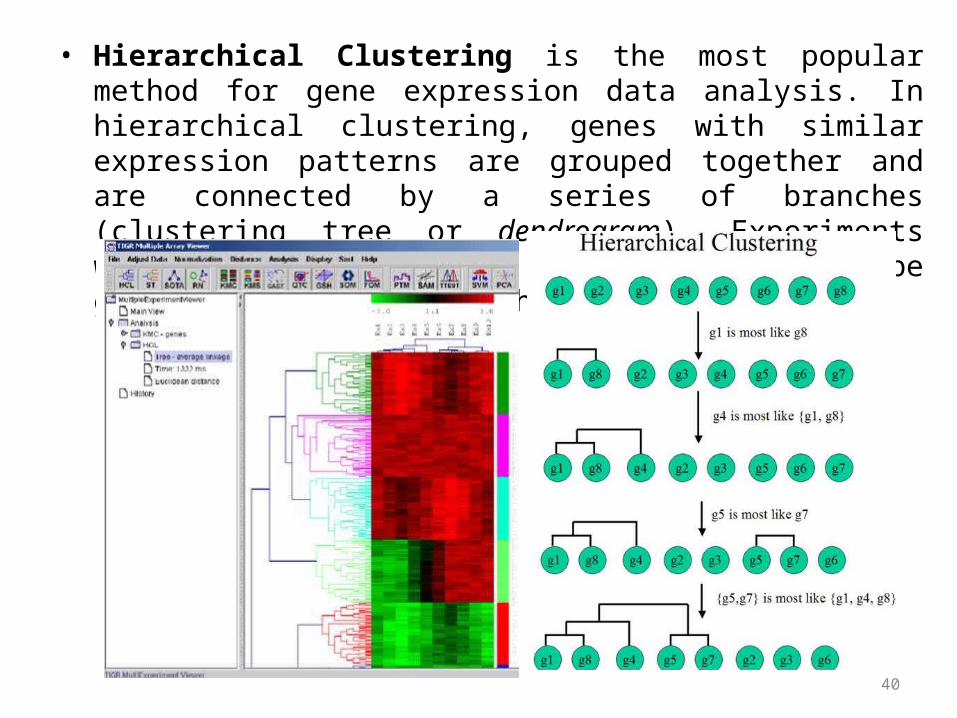
• Hierarchical Clustering is the most popular method for gene expression data analysis. In hierarchical clustering, genes with similar expression patterns are grouped together and are connected by a series of branches (clustering tree or dendrogram). Experiments with similar expression profiles can also be grouped together using the same method.

41
• K-Means / K-Medians clustering
42
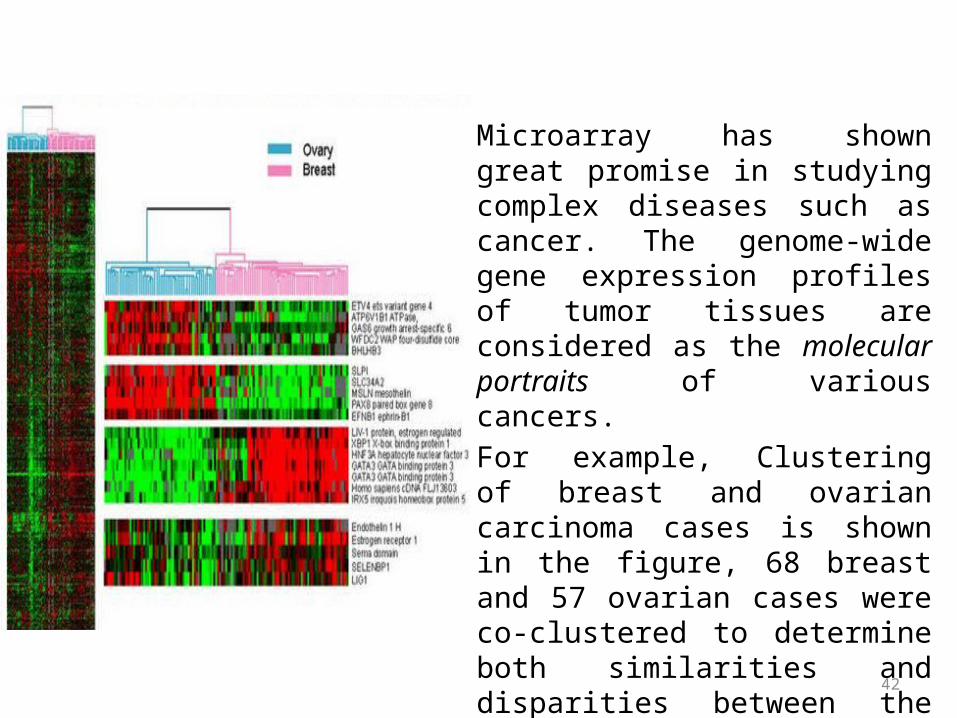
• Microarray has shown great promise in studying complex diseases such as cancer. The genome-wide gene expression profiles of tumor tissues are considered as the molecular portraits of various cancers.
• For example, Clustering of breast and ovarian carcinoma cases is shown in the figure, 68 breast and 57 ovarian cases were co-clustered to determine both similarities and disparities between the two sample sets.
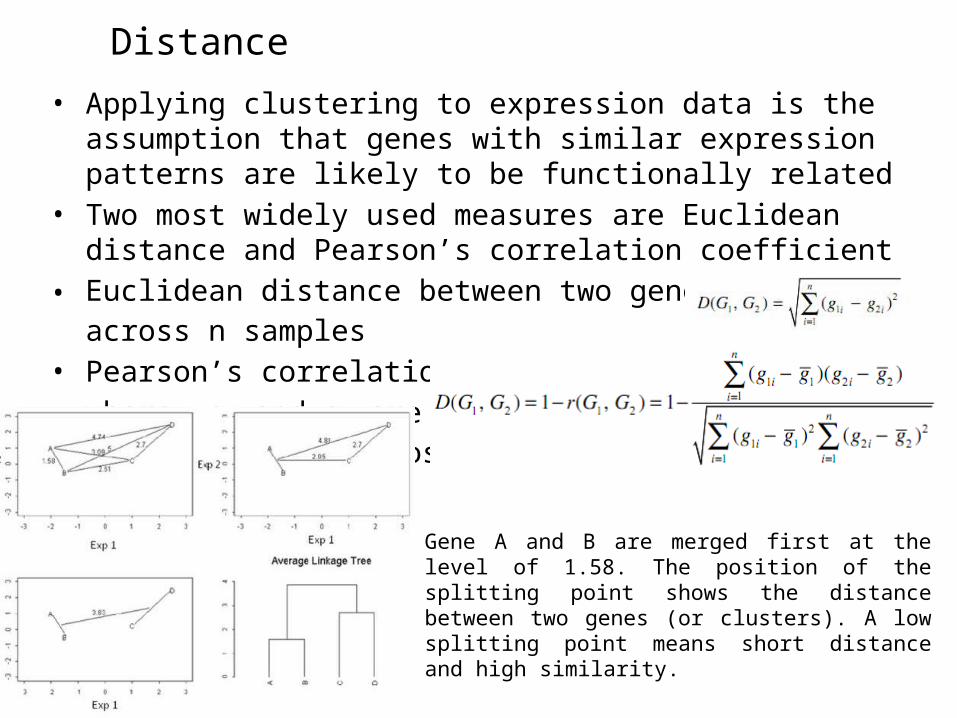
Distance• Applying clustering to expression data is the assumption that genes
with similar expression patterns are likely to be functionally related• Two most widely used measures are Euclidean distance and
Pearson’s correlation coefficient• Euclidean distance between two genes G1 and G2 across n samples• Pearson’s correlation coefficient• where g1 and g2 are mean expression values for genes G1 and G2
across n sample
Gene A and B are merged first at the level of 1.58. The position of the splitting point shows the distance between two genes (or clusters). A low splitting point means short distance and high similarity.
FUNCTIONAL ANALYSIS AND INTERPRETATION
• Generate a list of significant probe sets or probes that are differentially expressed across experimental conditions
• Add biological knowledge to the selected identifier lists either from existing literature or from databases such as Entrez Gene, Unigene, UniProt, Gene Ontology (GO), and Kyoto Encyclopedia of Genes and Genomes (KEGG) pathways
• Most of these databases classify genes into biological categories or classes that represent their function
• Estimate the statistical significance of association between the classes and probes of the obtained list

45
The DNA chips are used in many areas as given below:
• Gene expression profiling (Transcriptome profiling)• Differential expression analysis• Diagnostics (Detection of SNPs, deletions and duplications) and genetic engineering• Analysis of post translational modifications (Alternative splicing detection)• Proteomics• Functional genomics• DNA sequencing• Toxicological research (Toxicogenomics)• Cellular profiling• Glycome analysis
Applications

46
• Provides data for thousands of genes.• One experiment instead of many.• Fast and easy to obtain results. • Different parts of DNA can be used to study gene expression.
ADVANTAGES
• The biggest disadvantage of DNA chips is that they are expensive to create.• The production of too many results at a time requires long time for analysis, which is quite complex in nature.• The DNA chips do not have very long shelf life, which proves to be another major disadvantage of the technology.•Identify gene expression of only those who already reported.
Disadvantages:
47

48
No hybridization signal
Possible Causes Remedy
Target concentration too low. Determine target concentration before slide spotting.
Targets not clean enough. Remove PCR components from targets before slide spotting.
Poor retention of targets on slide. Prepare new microarray slides. Check that spotting buffer and protocol are compatible with slide type.
Failed labelling reaction. Always check the success of labelling reaction before using it in hybridization.
Loss of probe during purification Check success of probe purification before use.
Poor hybridization. Check that hybridization buffer and protocol are compatible with slide type.
Target genes not expressed in examined tissue.
Use housekeeping genes and positive controls to ascertain proper functioning of the system.
High background, weak specific signals.
Poor labelling reaction. Check success of labelling reaction specific signals. before hybridization.
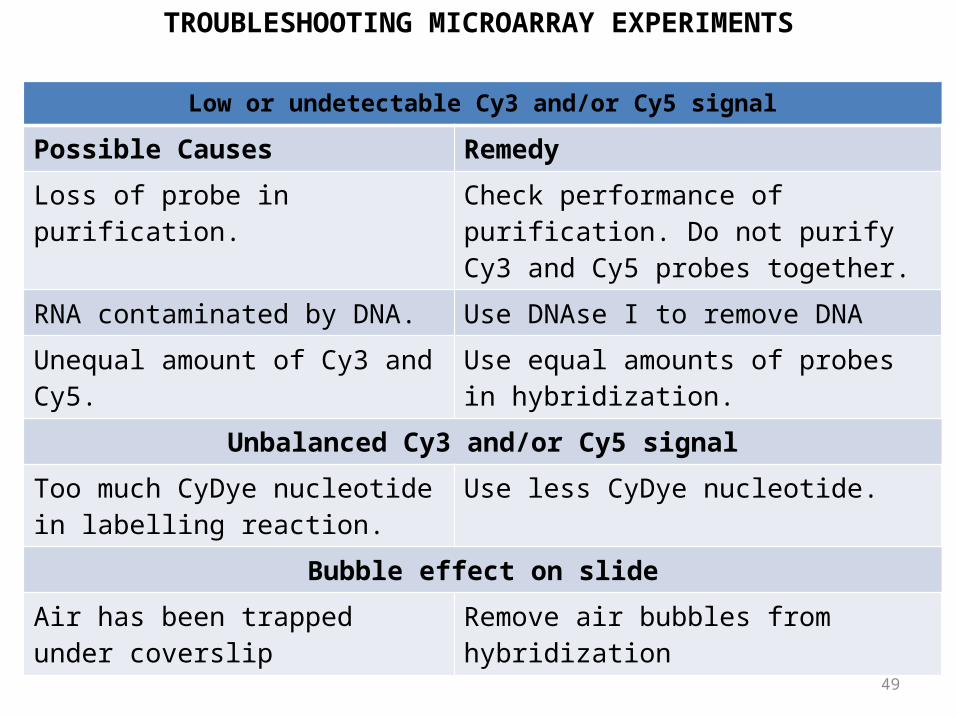
TROUBLESHOOTING MICROARRAY EXPERIMENTS
49
Low or undetectable Cy3 and/or Cy5 signal
Possible Causes Remedy
Loss of probe in purification. Check performance of purification. Do not purify Cy3 and Cy5 probes together.
RNA contaminated by DNA. Use DNAse I to remove DNA
Unequal amount of Cy3 and Cy5. Use equal amounts of probes in hybridization.
Unbalanced Cy3 and/or Cy5 signal
Too much CyDye nucleotide in labelling reaction.
Use less CyDye nucleotide.
Bubble effect on slide
Air has been trapped under coverslip Remove air bubbles from hybridization
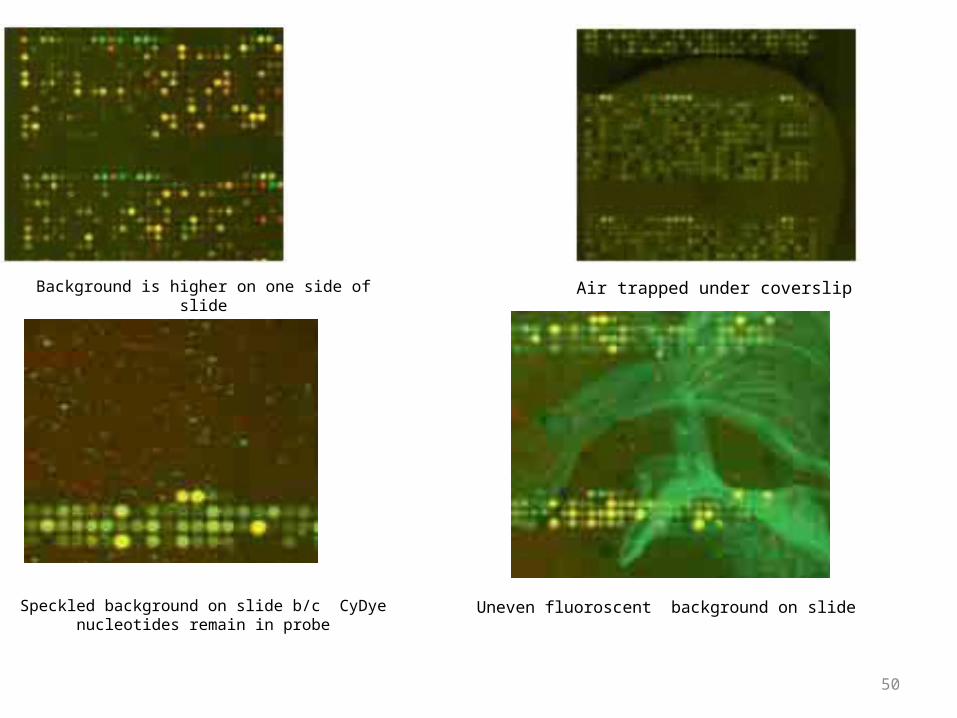
TROUBLESHOOTING MICROARRAY EXPERIMENTS
50
Background is higher on one side of slide Air trapped under coverslip
Speckled background on slide b/c CyDye nucleotides remain in probe
Uneven fluoroscent background on slide
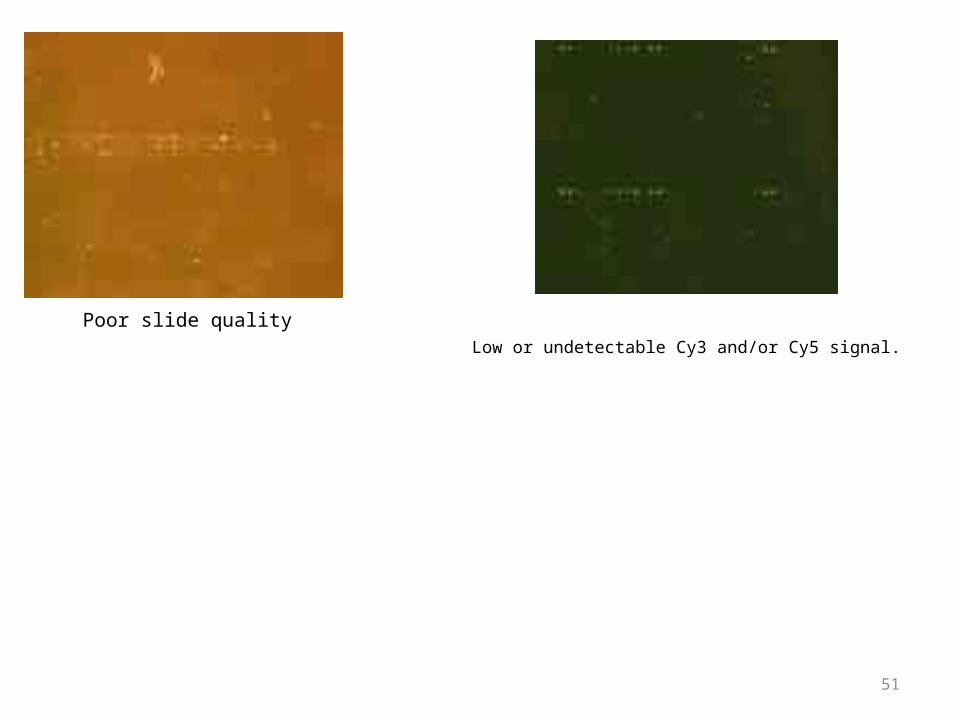
51
Poor slide qualityLow or undetectable Cy3 and/or Cy5 signal.

52
• Infection of chickens with highly pathogenic avian influenza (HPAI) H5N1 virus leads to 100% mortality within 1 to 2 days but in ducks causes mild or no clinical signs.
• The rapid onset of fatal disease in chickens, but not in ducks, suggests underlying differences in their innate immune mechanisms.
• Chicken Genechip microarrays (Affymetrix) use to analyse the gene expression profiles of primary chicken and duck lung cells infected
• with a low pathogenic avian influenza (LPAI) H2N3 virus and two HPAI H5N1 virus subtypes.
• Pro-inflammatory cytokine genes, interleukin (IL)- 6, IL-8 and IL-10 were highly up-regulated in both H5N1 virus infected chicken cells; in contrast, IL-8 expression was unchanged, and IL-6 and IL-10 were down regulated in infected duck cells with the same viruses.
• Expression of IL-18 was up-regulated in duck cells but was down-regulated in chicken cells
53
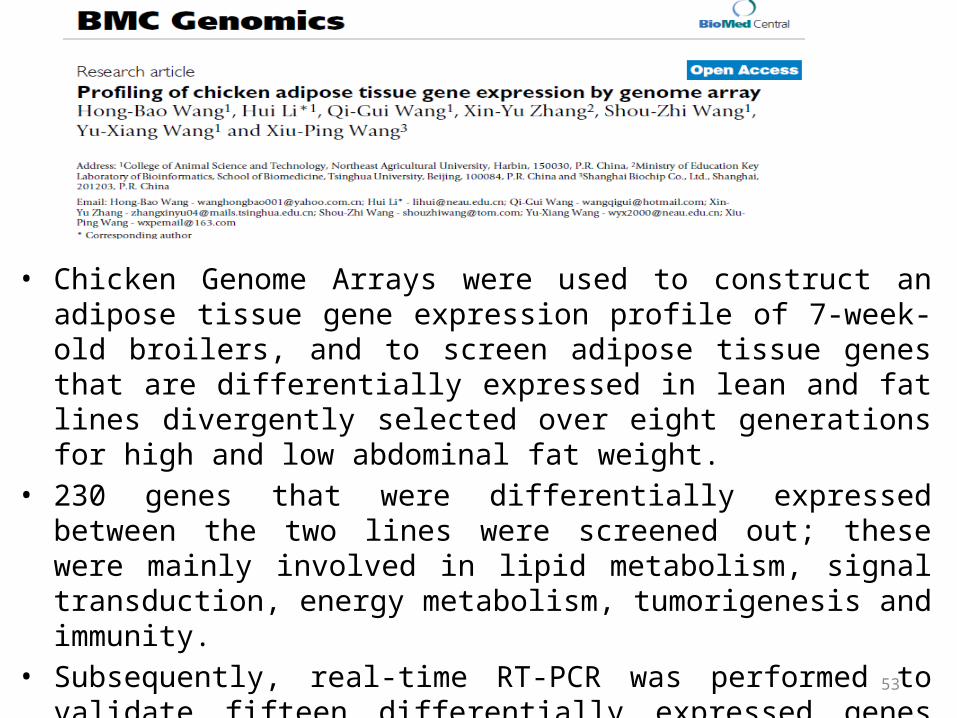
• Chicken Genome Arrays were used to construct an adipose tissue gene expression profile of 7-week-old broilers, and to screen adipose tissue genes that are differentially expressed in lean and fat lines divergently selected over eight generations for high and low abdominal fat weight.
• 230 genes that were differentially expressed between the two lines were screened out; these were mainly involved in lipid metabolism, signal transduction, energy metabolism, tumorigenesis and immunity.
• Subsequently, real-time RT-PCR was performed to validate fifteen differentially expressed genes screened out by the microarray approach and high consistency was observed between the two methods.
54

55
THANK YOU
Related Documents