Original Contribution DNA DAMAGE AND APOPTOSIS IN HYDROGEN PEROXIDE-EXPOSED JURKAT CELLS: BOLUS ADDITION VERSUS CONTINUOUS GENERATION OF H 2 O 2 ALEXANDRA BARBOUTI,PASCHALIS-THOMAS DOULIAS,LAMBROS NOUSIS,MARGARITA TENOPOULOU, and DIMITRIOS GALARIS Laboratory of Biological Chemistry, University of Ioannina Medical School, Ioannina, Greece (Received 29 January 2002; Accepted 24 May 2002) Abstract—Aspects of the molecular mechanism(s) of hydrogen peroxide-induced DNA damage and cell death were studied in the present investigation. Jurkat T-cells in culture were exposed either to low rates of continuously generated H 2 O 2 by the action of glucose oxidase or to a bolus addition of the same agent. In the first case, steady state conditions were prevailing, while in the latter, H 2 O 2 was removed by the cellular defense systems following first order kinetics. By using single-cell gel electrophoresis (also called comet assay), an initial increase in the formation of DNA single-strand breaks was observed in cells exposed to a bolus of 150 MH 2 O 2 . As the H 2 O 2 was exhausted, a gradual decrease in DNA damage was apparent, indicating the existence of an effective repair of single-strand breaks. Addition of 10 ng glucose oxidase in 100 l growth medium (containing 1.5 10 5 cells) generated 2.0 0.2 MH 2 O 2 per min. This treatment induced an increase in the level of single-strand breaks reaching the upper limit of detection by the methodology used and continued to be high for the following 6 h. However, when a variety of markers for apoptotic cell death (DNA cell content, DNA laddering, activation of caspases, PARP cleavage) were examined, only bolus additions of H 2 O 2 were able to induce apoptosis, while the continuous presence of this agent inhibited the execution of the apoptotic process no matter whether the inducer was H 2 O 2 itself or an anti-Fas antibody. These observations stress that, apart from the apparent genotoxic and proapoptotic effects of H 2 O 2 , it can also exert antiapoptotic actions when present, even at low concentrations, during the execution of apoptosis. © 2002 Elsevier Science Inc. Keywords—Hydrogen peroxide, Apoptosis, Comet assay, PARP, Single-strand breaks, Glucose oxidase, Jurkat cells, Free radicals INTRODUCTION Reactive oxygen species (ROS) are continuously gener- ated in vivo but increases in their steady states are regarded to be responsible for a variety of pathological conditions, including cardiovascular disease, cancer, and aging [1,2]. Among a great variety of ROS, hydrogen peroxide (H 2 O 2 ) plays a pivotal role because it is gen- erated from nearly all sources of oxidative stress and can diffuse freely in and out of cells and tissues. Moreover, it has been shown that H 2 O 2 has the ability to modulate signal transduction pathways [3,4], to change the ho- meostasis of ions such as calcium and iron [5–7], to activate several transcriptional factors with consequent expression of a great number of genes [8,9], to provoke cell proliferation and differentiation [3,10,11], and fi- nally to induce cell death either by apoptosis or necrosis [12–14]. Cellular DNA is especially sensitive to the action of H 2 O 2 and this DNA damage is widely believed to be mediated by transition metal ions, mainly iron and/or copper, which are able to catalyze the formation of hydroxyl radicals (HO • ) by Fenton-type reactions [15– 17]. The location of redox-active metals is likely to be of utmost importance for the ultimate effect because HO • , due to their extreme reactivity, interact exclusively in the vicinity of the bound metal [18]. Formation of HO • close to DNA (due to bound Fe or Cu ions) results in its damage, including base modifications, single- and dou- ble-strand breakage, and sister chromatid exchange [15– Address correspondence to: Dr. Dimitrios Galaris, University of Ioannina Medical School, Laboratory of Biological Chemistry, Univer- sity Campus, P.O. Box 1186, 451 10 Ioannina, Greece; Tel: 30 6510-97562; Fax: 30 6510-97868; E-Mail: [email protected]. Free Radical Biology & Medicine, Vol. 33, No. 5, pp. 691–702, 2002 Copyright © 2002 Elsevier Science Inc. Printed in the USA. All rights reserved 0891-5849/02/$–see front matter PII S0891-5849(02)00967-X 691

Welcome message from author
This document is posted to help you gain knowledge. Please leave a comment to let me know what you think about it! Share it to your friends and learn new things together.
Transcript
Original Contribution
DNA DAMAGE AND APOPTOSIS IN HYDROGEN PEROXIDE-EXPOSEDJURKAT CELLS: BOLUS ADDITION VERSUS CONTINUOUS GENERATION
OF H2O2
ALEXANDRA BARBOUTI, PASCHALIS-THOMAS DOULIAS, LAMBROS NOUSIS, MARGARITA TENOPOULOU, and
DIMITRIOS GALARIS
Laboratory of Biological Chemistry, University of Ioannina Medical School, Ioannina, Greece
(Received 29 January 2002;Accepted 24 May 2002)
Abstract—Aspects of the molecular mechanism(s) of hydrogen peroxide-induced DNA damage and cell death werestudied in the present investigation. Jurkat T-cells in culture were exposed either to low rates of continuously generatedH2O2 by the action of glucose oxidase or to a bolus addition of the same agent. In the first case, steady state conditionswere prevailing, while in the latter, H2O2 was removed by the cellular defense systems following first order kinetics.By using single-cell gel electrophoresis (also called comet assay), an initial increase in the formation of DNAsingle-strand breaks was observed in cells exposed to a bolus of 150�M H2O2. As the H2O2 was exhausted, a gradualdecrease in DNA damage was apparent, indicating the existence of an effective repair of single-strand breaks. Additionof 10 ng glucose oxidase in 100�l growth medium (containing 1.5� 105 cells) generated 2.0� 0.2�M H2O2 per min.This treatment induced an increase in the level of single-strand breaks reaching the upper limit of detection by themethodology used and continued to be high for the following 6 h. However, when a variety of markers for apoptoticcell death (DNA cell content, DNA laddering, activation of caspases, PARP cleavage) were examined, only bolusadditions of H2O2 were able to induce apoptosis, while the continuous presence of this agent inhibited the execution ofthe apoptotic process no matter whether the inducer was H2O2 itself or an anti-Fas antibody. These observations stressthat, apart from the apparent genotoxic and proapoptotic effects of H2O2, it can also exert antiapoptotic actions whenpresent, even at low concentrations, during the execution of apoptosis. © 2002 Elsevier Science Inc.
Keywords—Hydrogen peroxide, Apoptosis, Comet assay, PARP, Single-strand breaks, Glucose oxidase, Jurkat cells,Free radicals
INTRODUCTION
Reactive oxygen species (ROS) are continuously gener-ated in vivo but increases in their steady states areregarded to be responsible for a variety of pathologicalconditions, including cardiovascular disease, cancer, andaging [1,2]. Among a great variety of ROS, hydrogenperoxide (H2O2) plays a pivotal role because it is gen-erated from nearly all sources of oxidative stress and candiffuse freely in and out of cells and tissues. Moreover,it has been shown that H2O2 has the ability to modulatesignal transduction pathways [3,4], to change the ho-meostasis of ions such as calcium and iron [5–7], to
activate several transcriptional factors with consequentexpression of a great number of genes [8,9], to provokecell proliferation and differentiation [3,10,11], and fi-nally to induce cell death either by apoptosis or necrosis[12–14].
Cellular DNA is especially sensitive to the action ofH2O2 and this DNA damage is widely believed to bemediated by transition metal ions, mainly iron and/orcopper, which are able to catalyze the formation ofhydroxyl radicals (HO•) by Fenton-type reactions [15–17]. The location of redox-active metals is likely to be ofutmost importance for the ultimate effect because HO•,due to their extreme reactivity, interact exclusively in thevicinity of the bound metal [18]. Formation of HO• closeto DNA (due to bound Fe or Cu ions) results in itsdamage, including base modifications, single- and dou-ble-strand breakage, and sister chromatid exchange [15–
Address correspondence to: Dr. Dimitrios Galaris, University ofIoannina Medical School, Laboratory of Biological Chemistry, Univer-sity Campus, P.O. Box 1186, 451 10 Ioannina, Greece; Tel:�306510-97562; Fax:�30 6510-97868; E-Mail: [email protected].
Free Radical Biology & Medicine, Vol. 33, No. 5, pp. 691–702, 2002Copyright © 2002 Elsevier Science Inc.Printed in the USA. All rights reserved
0891-5849/02/$–see front matter
PII S0891-5849(02)00967-X
691

17]. However, there are indications that location of ironat positions other than DNA may contribute indirectly toDNA damage and ensuing apoptosis. Extensive workfrom Brunk’s group in Sweden has shown that lysosomaliron may be a key player in peroxide-dependent celldamage and apoptosis [19–21]. Moreover, results fromour laboratory as well as others, indicated that the for-mation of single-strand breaks in cellular DNA wasCa2�-dependent, indicating an obligatory intermediaryrole for Ca2� and, consequently, a signaling pathwayleading to DNA damage [22–25].
It is generally believed that extensive DNA damageleads invariably to cell death either by apoptosis ornecrosis. In particular, H2O2 may induce both apoptosisand necrosis depending on the concentration of the oxi-dant employed and/or the type of the cell being studied[12–14,26,27]. It has to be noted, however, that in thevast majority of studies with H2O2 it was added directlyto the cells as a bolus, so that cells were initially exposedto relatively high concentrations followed by a fast de-crease as H2O2 is gradually consumed [28]. Conse-quently, if the mode of action of H2O2 is concentrationdependent (as most probably is the case), the resultsmight appear inconsistent. In vivo the rate of H2O2
generation, although different for various kinds of cells,is continuous, with the steady state levels fluctuating atnanomolar concentrations (10�8 to 10�7 M) [29]. Hence,exposing cells to a continuous flow of H2O2, as opposedto bolus additions, represents a superior method of de-livery that mimics physiological conditions.
In previous works from our laboratory, we describedthe short-term effects (up to 60 min exposure) of con-tinuously generated H2O2 (by the action of added glu-cose oxidase) on DNA damage as assessed by “single-cell gel electrophoresis” or “comet assay” [23–25,30]. Inthe present study, we extended our previous observationsby following the cells for longer times (6 h) and at-tempted to correlate the formation of single-strandbreaks to apoptotic cell death. Contrary to the prevailingidea of the proapoptotic action of H2O2, the results of thepresent study indicate that H2O2, when continuouslygenerated even at low concentrations, may exert anti-apoptotic actions.
MATERIALS AND METHODS
Materials
RPMI 1640 growth medium supplemented with L-glutamine, MTT (3-(4,5-dimethyl)-2,5-diphenyl tetrazo-lium bromide), SDS (sodium dodecyl sulfate), glucoseoxidase (from Aspergillus niger, 18,000 units/g), catalase(from bovine liver), triton X-100, CHAPS (3-[(3-chol-amidoproyl) dimethylammonio]-1 propanesulfonate),
DTT (DL-dithiothreitol), pepstatin A, leupeptine, andHoechst 33342 were from Sigma Chemical Co. (St.Louis, MO, USA). Fetal bovine calf serum, Nunc tissueculture plastics, low melting point agarose, PMSF (phe-nylmethyl sulfonyl fluoride), penicillin/streptomycin,and proteinase K were obtained from Gibco BRL (GrandIsland, NY, USA). Normal melting point agarose wasobtained from Serva GmbH (Heidelberg, Germany). Mi-croscope glass super frosted slides were supplied byMenzel-Glaset (Menzel, Germany); 4,6-diamidine-2-phenylindole dihydrochloride (DAPI) and RNase A weresupplied by Boehringer Mannheim (Mannheim, Germa-ny). Mouse monoclonal antibody raised against aminoacids 764-1014 at the carboxy terminus of poly(ADP-ribose)polymerase (PARP) was from Santa Cruz Bio-technology, Inc. sc 8007 (Santa Cruz, CA, USA). Apro-tinin was from Roche Diagnostics (Mannheim,Germany). Mouse anti-Fas monoclonal antibody (cloneDX2) and Ac-DEVD-AMC (caspase-3 substrate) wereobtained from Calbiochem (Schwalbach, Denmark).Ethidium bromide and H2O2 was from Merck (Darm-stadt, Germany). All other chemicals used were of ana-lytical grade.
Cell culture and treatment
Jurkat cells (ATCC, clone E6-1) were grown inRPMI-1640 containing 10% heat-inactivated fetal calfserum, 2 mM glutamine, 100 U/ml penicillin, and 100ng/ml streptomycin, at 37°C in 5% CO2 in air. Cells inthe log phase were harvested by centrifugation (250 � g,10 min, room temperature), resuspended in a density of1.5 � 106 cells per ml, and allowed to stay for 1.5 hunder standard culturing conditions. Cells were thentreated with H2O2 and/or glucose oxidase for the dosesand times indicated. Finally, cells were collected andchecked for Trypan blue exclusion before any furtheranalysis. In order to assess whether the product of thereaction of glucose oxidase (D-glucono-�-lactone) or theoxygen during the reaction affected the results, cellswere incubated with both glucose oxidase and excesscatalase. No significantly different results were observed(not shown).
Single-cell gel electrophoresis (comet assay)
One hundred microliters RPMI 1640 growth mediumcontaining 1.5 � 105 Jurkat cells were placed into eachof 96 wells of ELISA plastic plates and treated withglucose oxidase or H2O2 for the time periods indicated asdescribed above.
The comet assay performed in this work was essen-tially the same as previously described [23,31,32]. Cells
692 A. BARBOUTI et al.
were suspended in 1% low melting point agarose in PBS,pH 7.4, and pipetted on to super frosted glass microscopeslides precoated with a layer of 1% normal melting pointagarose (warmed to 37°C prior to use). The agarose wasallowed to set at 4°C for 10 min and then the slides wereimmersed in lysis solution (2.5 M NaCl, 100 mM EDTA,10 mM Tris at pH 10, 1% Triton X-100 v/v) at 4°C for1 h in order to dissolve cellular proteins and lipids. Slideswere then placed in single rows in a 30 cm wide hori-zontal electrophoresis tank containing 0.3 M NaOH and1 mM EDTA, pH � 13, at 4°C for 40 min in order toallow for separation of the two DNA strands (alkalineunwinding). Electrophoresis was performed in the un-winding solution at 30 V (1 V/cm), 300 mAmps for 30min. The slides were then washed three times for 5 mineach with 0.4 M Tris, pH 7.5, at 4°C before staining withDAPI (5 mg/ml).
Image analysis and scoring
DAPI-stained nucleoids were examined under a UVmicroscope with an excitation filter of 435 nm and amagnification of 400. The damage was not homogeneousand visual scoring of the cellular DNA on each slide wasbased on characterization of 100 randomly selectednucleoids. The comet-like DNA formations were cate-gorized into 5 classes (0, 1, 2, 3, and 4) representing anincreasing extent of DNA damage seen as a “ tail.” Eachcomet was assigned a value according to its class. Ac-cordingly, the overall score for one hundred cometsranged from 0 (100% of comets in class 0) to 400 (100%of comets in class 4). In this way, the overall DNAdamage of the cell population can be expressed in arbi-trary units [23]. Visual scoring expressed in this waycorrelated near-linearly with other parameters such aspercent of DNA in the tail estimated after computerimage analysis using a specific software package (CometImager, MetaSystems, Altlussheim, Germany) (resultsnot shown). The same linear correlation between visualscoring and computer image analysis has also been re-ported by other laboratories [33,34]. Visual observationsand analyses of the results were always carried out by thesame experienced person, using a specific pattern whenmoving along the slide.
Flow cytometric analysis of cellular DNA content
For flow cytometric analysis, cells cultured andtreated by H2O2 or glucose oxidase as described above,were fixed overnight in 70% ice-cold ethanol at 4°C.After one washing, cells were resuspended in 0.5 ml PBSand 1 ml of DNA extraction buffer (192 mM Na2HPO4,4 mM citric acid, pH 7.8) was added. Cells were incu-
bated for 5 min at room temperature and centrifugedbefore addition of 0.3 ml of staining solution (0.7 �g/mlpropidium iodide (PI), 70 �g/ml RNAase A) for 30 minin the dark. Finally, 1.5 � 106 cells were suspended in0.2 ml PBS and analyzed on a FACScan Becton Dick-inson flow cytometer (Becton Dickinson, MountainView, CA, USA).
Extraction of DNA and fragmentation analysis
After treatment, cellular DNA was isolated from 3 �106 cells for each sample. Cells were collected andwashed twice in cold PBS (450 � g, 4°C), resuspendedin 500 �l lysis buffer (50 mM Tris-HCl, pH 8.0, 100 mMEDTA, 1% SDS, 0.1 M NaCl), and proteinase K wasadded to a final concentration of 0.6 mg/ml. The cellsuspension was allowed to digest overnight at 37°C.DNA samples were then extracted with an equal volumeof phenol:cloroform (v/v, 1:1) for 1 h and centrifuged at16,000 � g, for 10 min. This step was repeated two moretimes before the aqueous phase was mixed with 500 �lchloroform and centrifuged again for 5 min at 16,000 �g. The upper phase containing the DNA was then trans-ferred to new eppendorf tubes and precipitated from thesupernatant with one-tenth volume of 3 M sodium ace-tate, pH 5.2, and 2 volumes of ethanol at �20°C over-night. The samples were then centrifuged at 16,000 � gfor 15 min, the supernatant was removed, and 1 ml of70% ethanol was added to the DNA pellet. The sampleswere centrifuged again at 16,000 � g for 15 min and thesupernatant removed before the DNA pellet was allowedto dry at room temperature. After that, DNA was solu-bilized in Tris-EDTA buffer (10 mM Tris-Cl, 1mMEDTA, pH 8.0) containing boiled RNAase (1.7 mg/ml).The samples were incubated for 2 h at 37°C. The resultedsolution of DNA was quantitated spectrophotometricallyat 260/280 nm and mixed with loading buffer (0.02%bromophenol blue, 40% glycerol in Tris, boric acid,EDTA (89:89:2, pH 8.0)) before being loaded in 1.8%agarose gel containing 0.5 �g/ml ethidium bromide. Af-ter electrophoresis, gels were illuminated with ultravioletlight for examination and photography.
Measurement of caspase-3-like activity
In order to measure caspase-3-like activity, cells(7.5 � 106 cells) were lysed by incubation in lysis buffer(10 mM HEPES/KOH, pH 7.4, 2 mM EDTA, 0.1%CHAPS, 5 mM dithiothreitol, 1 mM phenylmethyl sul-fonyl fluoride (PMSF), 10 �g/ml pepstatin A, 20 �g/mlleupeptin, and 10 �g/ml aprotinin) for 20 min in ice.Lysates were centrifuged at 14,000 � g for 20 min at4°C. In order to estimate caspase activity, cell lysates
693H2O2-induced DNA damage and apoptosis

(150 �g protein) were incubated for 1 h in 1 ml reactionbuffer at 37°C (100 mM HEPES, pH 7.5, 10% sucrose,0.1% CHAPS, and 10 mM DTT) containing 100 �M ofthe fluorogenic peptide substrate Ac-DEVD-AMC. Thefluorescence intensity of the released 7-amino-4methyl-coumarin (AMC) was measured by using a fluorospec-trophotometer with excitation at 380 nm and emission at460 nm.
Western blotting
Cleavage of the enzyme poly(ADP-ribose)polymerase(PARP) from 116 kDa to an 85 kDa part was observed byusing Western blotting analysis. Briefly, 4.5 � 106 cellswere washed twice in cold PBS and resuspended in alysis buffer (20 mM Tris-Cl, pH 7.5, 1% SDS, 2 mMEDTA, 2 mM EGTA, 5 mM DTT, 1 mM PMSF,10�g/ml pepstatin, 10 �g/ml aprotinin, and 20 �g/ml leu-peptin) and incubated for 10 min on ice. The mixture wassonicated (3 � 10 s) at 4°C. For immmunoblottinganalysis, 30 �g of protein were applied on 8% SDS-polyacrylamide gel electrophoresis and transferred tonitrocellulose membranes by electroblotting. Afterblocking with 5% nonfat milk, membranes were incu-bated with a mouse monoclonal anti-PARP antibody (sc8007, Santa Cruz Biotechnology, Inc.) followed by horseradish peroxidase-conjugated secondary antibody. Mem-branes were developed using the ECL reagent.
MTT cell survival assay
The MTT assay was used as previously described [35]to estimate cell viability. This method is based on theability of viable cells to reduce MTT (3-(4,5-dimethyl)-2,5-diphenyl tetrazolium bromide) and form a blueformazan product. In brief, cells were treated by H2O2 orglucose oxidase as described above before the additionof MTT solution (stock solution of 5 mg/ml in RPMIwithout phenol red in the dark and filtered through a 0.2�m filter before use). The final concentration of MTTwas 0.2 mg/ml. The cells were left for 4 h at 37°C,followed by the addition of 80 �l 10% SDS to each wellto dissolve the cells; then the cells were left for another8 h. Finally, plates were vigorously shaken for 1 min andthe optical density of each well measured using an au-tomatic plate reader with a 550 nm test wavelength anda 690 nm reference wavelength.
Measurement of hydrogen peroxide generation
The amount of hydrogen peroxide generated by theaction of glucose oxidase in PBS containing 5.0 mMglucose was estimated either by following the increase in
the absorbance at 240 nm (Molar Extinction Coeffi-cient � 43.6 M�1 cm�1), or polarographically by usingan oxygen electrode (Hansatech Instruments, Norfolk,UK) detecting the liberation of O2 following the additionof excess catalase.
Protein determination
Protein concentrations were determined by the Brad-ford method, using bovine serum albumin as a standard.
Statistical analysis
A Student’s paired t-test was used in order to examinestatistically significant differences.
RESULTS
We have shown previously that H2O2 rapidly andefficiently induces formation of single-strand breaks inthe nuclear DNA of exposed cells [23–25,30]. In theexperiment shown in Fig. 1, the formation of single-strand breaks in nuclear DNA was followed by longerincubation time intervals (up to 6 h) after exposure of the
Fig. 1. Formation of single-strand breaks after exposure of Jurkat cellsto H2O2. Cells (1.5 � 106 per ml) in complete growth medium,containing 10% fetal calf serum, were exposed to either a bolusconcentration of 150 �M H2O2 (�), or continuously generated H2O2
by the action of 100 ng glucose oxidase per ml (‚), while control cellswere treated with the same volume of PBS (�). After initiation of thetreatment and at the time points indicated, the cells were centrifugedand the levels of single-strand breaks formed were estimated by cometassay and expressed as arbitrary units as described in Materials andMethods. Every point represents duplicate measurements, the values ofwhich did not differ more than 5%. This experiment was repeated twomore times with essentially the same results.
694 A. BARBOUTI et al.
cells (1.5 � 105 per 100 �l) to either a bolus of 150 �MH2O2 or glucose oxidase (100 ng/ml, generating 2.02 �0.2 �M H2O2 per min). In the first case, the DNAdamage, as indicated by tail formation after electrophore-sis (comet assay), was initially increased during the first15 min of incubation but subsequently decreased againas H2O2 was removed from the medium by cellulardefense mechanisms. However, the new steady statelevel of DNA damage did not reach the initial controlvalues indicating possibly the formation of irreversiblelesions. In a separate experiment, it was shown that theconcentration of H2O2, under these experimental condi-tions, was continuously decreased by first-order kinetics(half-life about 9 min) and was not apparent about 60min after its addition (results not shown). In contrast,continuous generation of H2O2 produced a fast increasein the number of single-strand breaks, reaching the upperlimit of detection for this particular method (Fig. 1). Ithas to be noted that 4 to 5 h after the initial exposure ofthe cells to continuously generated H2O2, the DNA inmany cells was completely dispersed in small parts with-out any organized structure, indicating total disintegra-tion of the cellular DNA by this treatment. It is obvious
from the above results that the kinetics of single-strandbreak formation differ, depending on the way of expo-sure (bolus addition vs. continuous generation) to H2O2,with more profound DNA effects in the case of contin-uous generation.
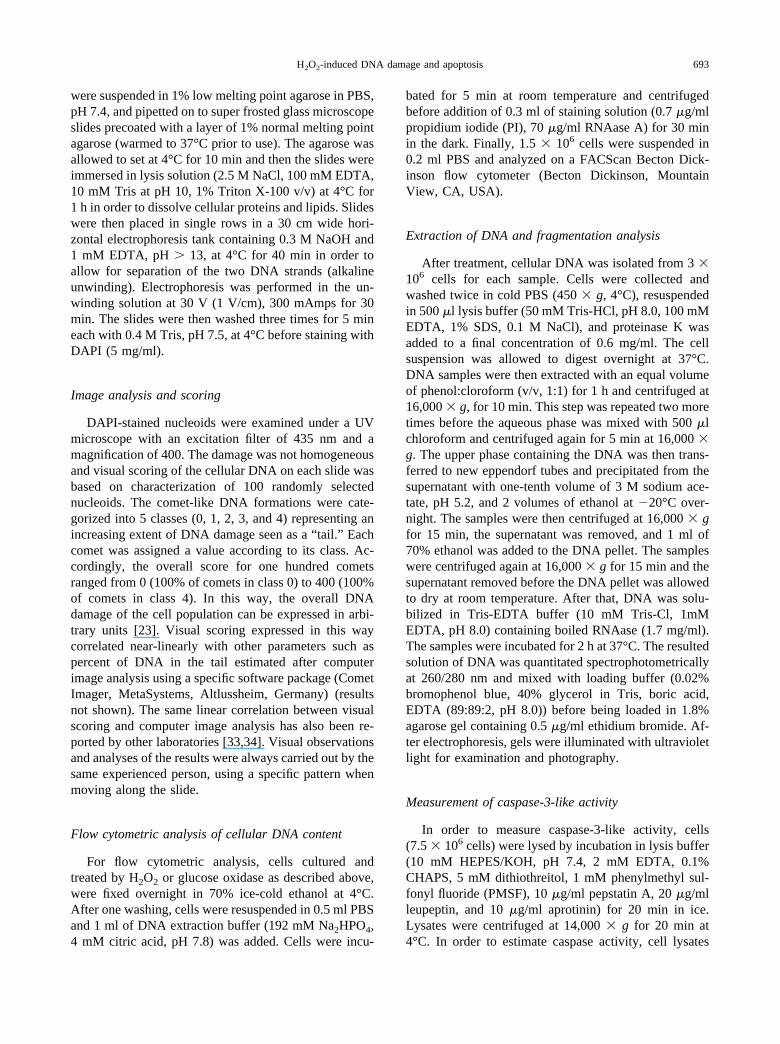
In spite of the damaged DNA observed above, whenJurkat cells were exposed to either a bolus addition (150�M H2O2) or glucose oxidase (100 ng/ml) and the ef-fects on cellular DNA content were examined 6 h later byflow cytometry (propidium iodide staining of DNA),characteristic changes indicating an apoptotic process(lower DNA content than that of G0/G1 phase) wasapparent only in the case of bolus addition of H2O2
(32.4% apoptotic cells compared to 10.8% of control)(Figs. 2A and 2B). Surprisingly, cells exposed to contin-uously generated H2O2 did not undergo such DNAchanges (12.0%) (Fig. 2C), although a high degree ofDNA damage was observed under the same conditionsby comet assay (Fig. 1). Moreover, when cells wereexposed simultaneously to bolus addition plus continu-ous generation, the number of apoptotic cells was de-creased significantly (14.9% apoptotic cells compared to32.4% and 10.8% of bolus-treated and control cells,
Fig. 2. Flow cytometric analysis of H2O2-induced apoptosis. Cells (1.5 � 106 per ml) were treated for 6 h with: PBS (A), 150 �M H2O2
(B), 100 ng glucose oxidase per ml (C), and 150 �M H2O2 plus 0.1 �g glucose oxidase per ml (D). At the end of the treatment, cellularDNA was stained by propidium iodide (0.7 �g/ml) and the cellular DNA content was analyzed on a FACScan Becton Dickinson flowcytometer as described in Materials and Methods. Cells containing less DNA than that of G0/G1 phase were regarded as apoptotic.These experiments were repeated several times with essentially the same results.
695H2O2-induced DNA damage and apoptosis
respectively) (Fig. 2D), indicating an inhibition of apo-ptosis when H2O2 is continuously present, even at lowconcentrations, during the apoptotic process.
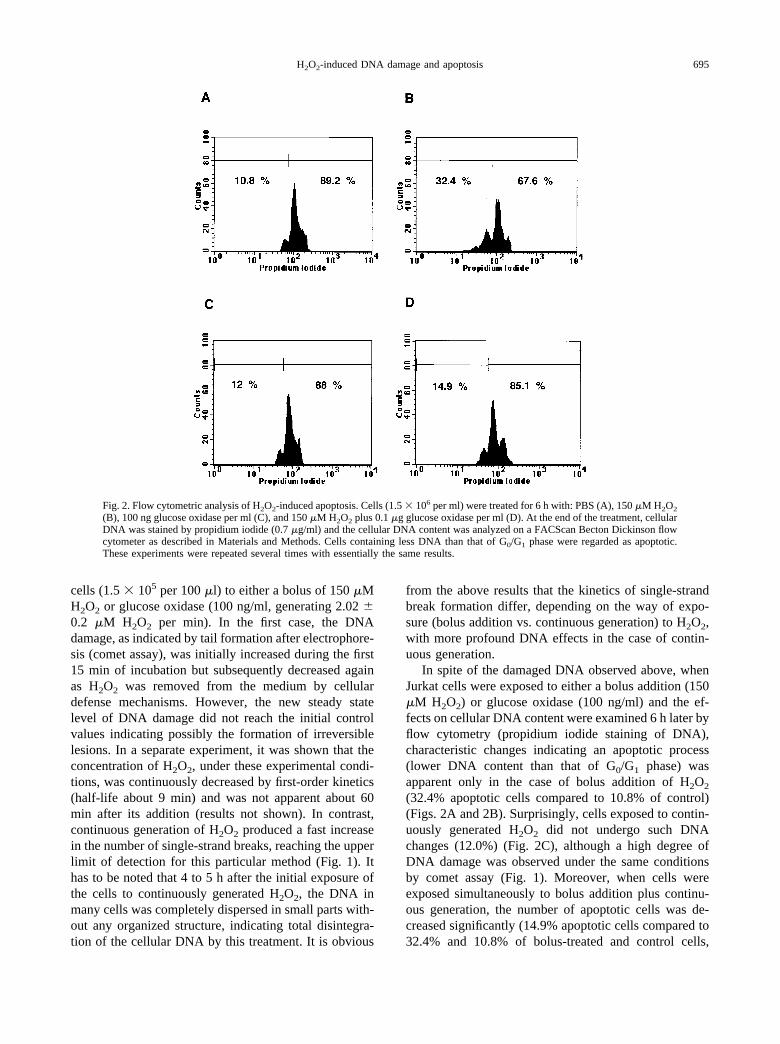
The conclusion drawn above was further substantiatedby the experiment shown in Fig. 3. Treatment of the cellswith increasing concentrations of H2O2 (30 to 1000 �M)led to the appearance of a ladder pattern in agarose gelelectrophoresis of extracted DNA, at concentrationshigher than 100 �M and reaching a maximum at 250 to500 �M H2O2 (Fig. 3A, lanes 6– 8). No such patternappeared in the case of continuous generation (1 to 750ng glucose oxidase per ml, generating H2O2 in a range
from about 0.02 to 15 �M per min) (Fig. 3B), furthersupporting the inability of continuously generated H2O2
to induce apoptosis although the same treatment wasmuch more efficient to induce formation of single-strandbreaks (Fig. 1).
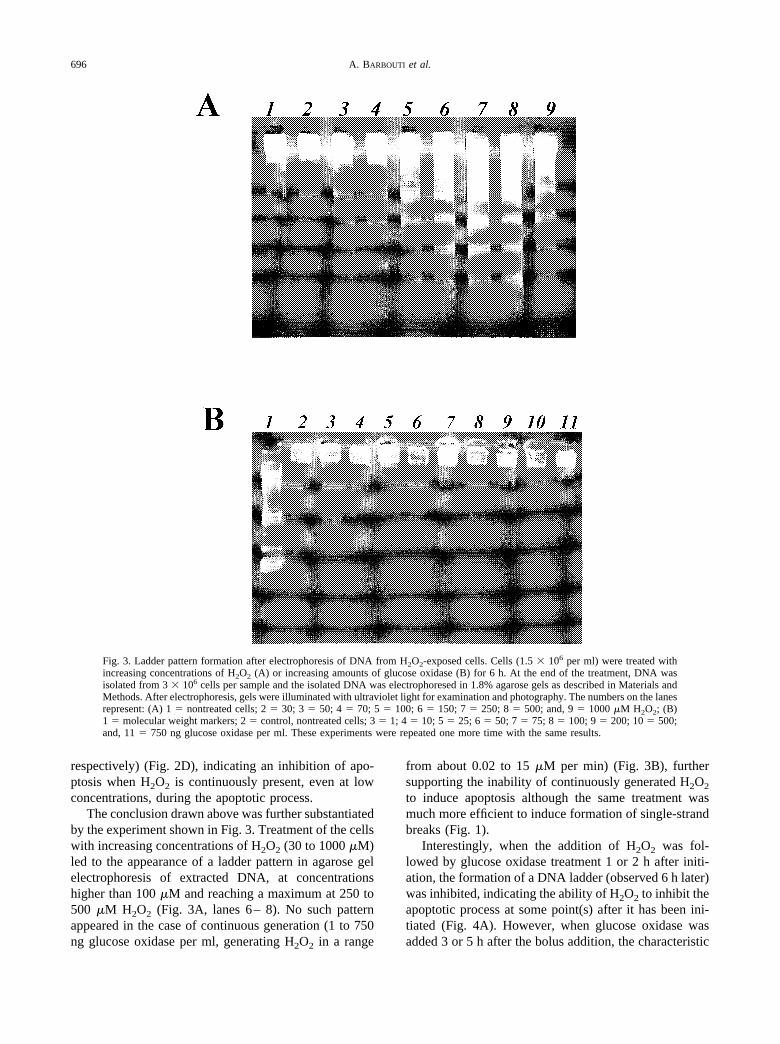
Interestingly, when the addition of H2O2 was fol-lowed by glucose oxidase treatment 1 or 2 h after initi-ation, the formation of a DNA ladder (observed 6 h later)was inhibited, indicating the ability of H2O2 to inhibit theapoptotic process at some point(s) after it has been ini-tiated (Fig. 4A). However, when glucose oxidase wasadded 3 or 5 h after the bolus addition, the characteristic
Fig. 3. Ladder pattern formation after electrophoresis of DNA from H2O2-exposed cells. Cells (1.5 � 106 per ml) were treated withincreasing concentrations of H2O2 (A) or increasing amounts of glucose oxidase (B) for 6 h. At the end of the treatment, DNA wasisolated from 3 � 106 cells per sample and the isolated DNA was electrophoresed in 1.8% agarose gels as described in Materials andMethods. After electrophoresis, gels were illuminated with ultraviolet light for examination and photography. The numbers on the lanesrepresent: (A) 1 � nontreated cells; 2 � 30; 3 � 50; 4 � 70; 5 � 100; 6 � 150; 7 � 250; 8 � 500; and, 9 � 1000 �M H2O2; (B)1 � molecular weight markers; 2 � control, nontreated cells; 3 � 1; 4 � 10; 5 � 25; 6 � 50; 7 � 75; 8 � 100; 9 � 200; 10 � 500;and, 11 � 750 ng glucose oxidase per ml. These experiments were repeated one more time with the same results.
696 A. BARBOUTI et al.

ladder pattern was apparent, although not as intense as inthe case of bolus addition alone. Essentially the sameresults were obtained when a mouse anti-Fas monoclonalantibody (0.5 �g/ml) was used as initiator of apoptosis(Fig. 4B). Addition of glucose oxidase (100 ng/ml) 1 or2 h after initiation by the anti-Fas antibody resulted in
complete abrogation of the formation of ladder pattern.However, when the addition was made 3 or 5 h afterinitiation, the apoptotic process proceeded normally.These observations indicate that the presence of H2O2,even at low concentrations, is able to inhibit a step(common for H2O2- and anti-Fas-induced apoptosis) that
Fig. 4. Effects of H2O2 on H2O2- and anti-Fas-induced apoptosis. Cells (1.5 � 106 per ml) were treated either with 150 �M H2O2 (A)or 0.5 �g/ml anti-Fas mouse monoclonal antibody (B) for initiation of apoptosis. At the time points indicated after initiation, 0.1 �gglucose oxidase per ml was added in the growth medium. Six hours after initiation, cells (3 � 106 cells per sample) were harvestedand DNA was isolated. Ten micrograms of the isolated DNA was electrophoresed in an 1.8% agarose gel as in Fig. 3. The lanesrepresent: (A) C � control, untreated cells; H2O2 � 150 �M H2O2; GO � 0.1 �g glucose oxidase per ml; 1 h, 2 h, 3 h, and 5 h representDNA extracted from cells in which glucose oxidase (0.1 �g per ml) was added at the indicated times after the addition of 150 �MH2O2. (B) 123 bp � markers; C � control, untreated cells; anti-Fas � 0.5 �M anti-Fas mouse monoclonal antibody alone; 1 h, 2 h,3 h, and 5 h represent the times of addition of glucose oxidase (0.1 �g per ml) after the initiation of apoptosis by the anti-Fas antibody.These experiments were repeated one more time with the same results.
697H2O2-induced DNA damage and apoptosis
takes place before the third hour after initiation. It has tobe noted that inhibition of apoptosis by H2O2 has beenreported previously [36–38], but it remains unclearwhether physiological sources of continuously generatedH2O2 are able to inhibit apoptosis.
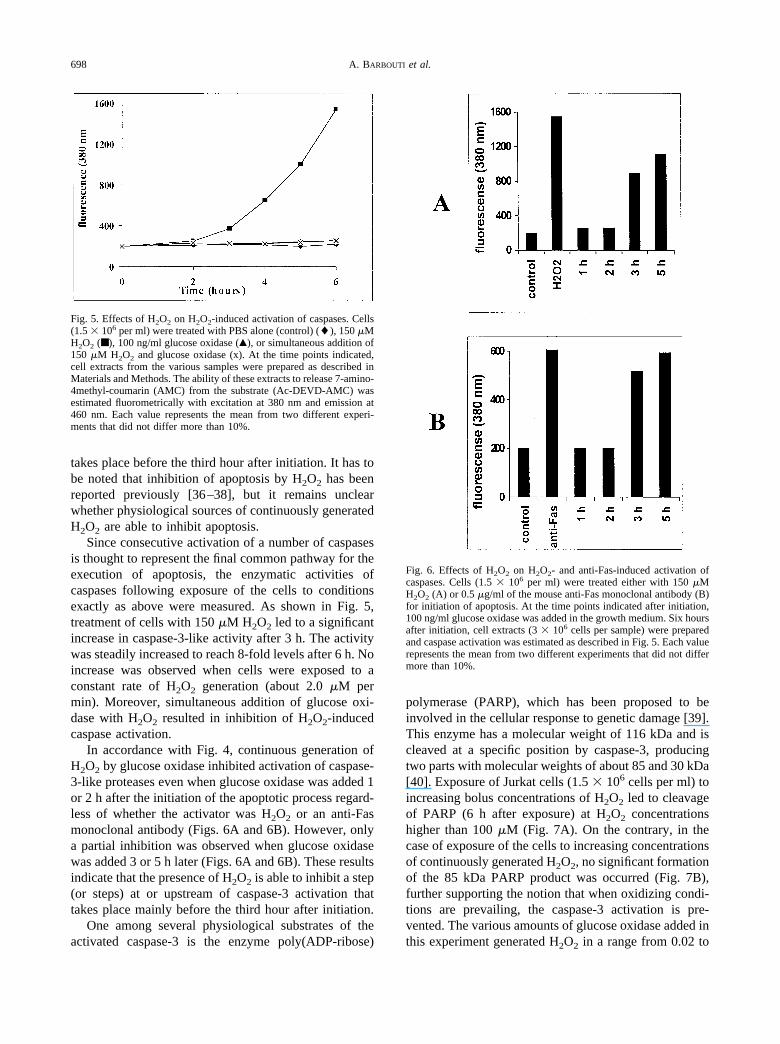
Since consecutive activation of a number of caspasesis thought to represent the final common pathway for theexecution of apoptosis, the enzymatic activities ofcaspases following exposure of the cells to conditionsexactly as above were measured. As shown in Fig. 5,treatment of cells with 150 �M H2O2 led to a significantincrease in caspase-3-like activity after 3 h. The activitywas steadily increased to reach 8-fold levels after 6 h. Noincrease was observed when cells were exposed to aconstant rate of H2O2 generation (about 2.0 �M permin). Moreover, simultaneous addition of glucose oxi-dase with H2O2 resulted in inhibition of H2O2-inducedcaspase activation.
In accordance with Fig. 4, continuous generation ofH2O2 by glucose oxidase inhibited activation of caspase-3-like proteases even when glucose oxidase was added 1or 2 h after the initiation of the apoptotic process regard-less of whether the activator was H2O2 or an anti-Fasmonoclonal antibody (Figs. 6A and 6B). However, onlya partial inhibition was observed when glucose oxidasewas added 3 or 5 h later (Figs. 6A and 6B). These resultsindicate that the presence of H2O2 is able to inhibit a step(or steps) at or upstream of caspase-3 activation thattakes place mainly before the third hour after initiation.
One among several physiological substrates of theactivated caspase-3 is the enzyme poly(ADP-ribose)
polymerase (PARP), which has been proposed to beinvolved in the cellular response to genetic damage [39].This enzyme has a molecular weight of 116 kDa and iscleaved at a specific position by caspase-3, producingtwo parts with molecular weights of about 85 and 30 kDa[40]. Exposure of Jurkat cells (1.5 � 106 cells per ml) toincreasing bolus concentrations of H2O2 led to cleavageof PARP (6 h after exposure) at H2O2 concentrationshigher than 100 �M (Fig. 7A). On the contrary, in thecase of exposure of the cells to increasing concentrationsof continuously generated H2O2, no significant formationof the 85 kDa PARP product was occurred (Fig. 7B),further supporting the notion that when oxidizing condi-tions are prevailing, the caspase-3 activation is pre-vented. The various amounts of glucose oxidase added inthis experiment generated H2O2 in a range from 0.02 to
Fig. 5. Effects of H2O2 on H2O2-induced activation of caspases. Cells(1.5 � 106 per ml) were treated with PBS alone (control) (�), 150 �MH2O2 (■ ), 100 ng/ml glucose oxidase (Œ), or simultaneous addition of150 �M H2O2 and glucose oxidase (x). At the time points indicated,cell extracts from the various samples were prepared as described inMaterials and Methods. The ability of these extracts to release 7-amino-4methyl-coumarin (AMC) from the substrate (Ac-DEVD-AMC) wasestimated fluorometrically with excitation at 380 nm and emission at460 nm. Each value represents the mean from two different experi-ments that did not differ more than 10%.
Fig. 6. Effects of H2O2 on H2O2- and anti-Fas-induced activation ofcaspases. Cells (1.5 � 106 per ml) were treated either with 150 �MH2O2 (A) or 0.5 �g/ml of the mouse anti-Fas monoclonal antibody (B)for initiation of apoptosis. At the time points indicated after initiation,100 ng/ml glucose oxidase was added in the growth medium. Six hoursafter initiation, cell extracts (3 � 106 cells per sample) were preparedand caspase activation was estimated as described in Fig. 5. Each valuerepresents the mean from two different experiments that did not differmore than 10%.
698 A. BARBOUTI et al.

15 �M per minute. The possibility that uncleaved PARPremains active consuming cellular NAD� and contribut-ing to depletion of ATP, which is needed for execution ofthe apoptotic process as previously proposed [37], iscurrently under investigation in our laboratory. In accor-dance with the time course of caspase activation (Fig. 5),Fig. 7C shows that the cleavage of PARP starts about 3 hafter the addition of 150 �M H2O2 and the cleavagecontinued to increase progressively 6 h later.
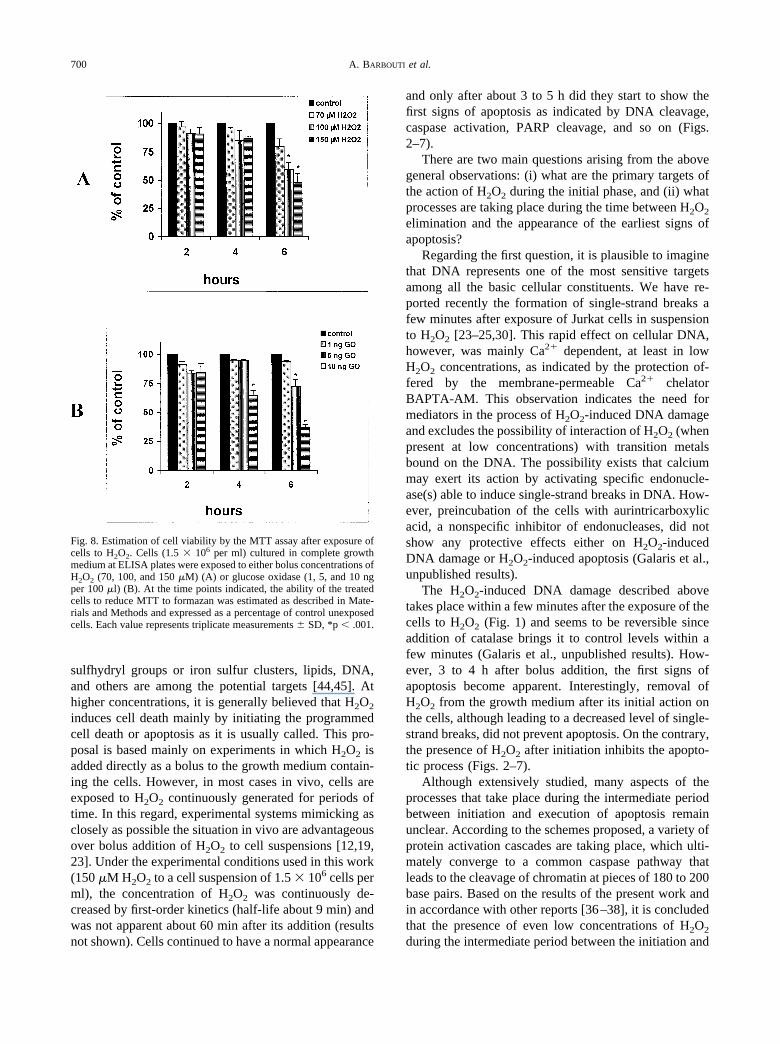
Cell membrane permeability, when evaluated byTrypan blue exclusion, was apparently unaffected duringthe periods of treatments described above (results notshown). However, effects on cell viability were apparentwhen estimated by the MTT assay, which is based on theability of living cells to reduce MTT and form a blueformazan product. It is assumed that mitochondrial de-hydrogenases are mainly responsible for the reduction ofMTT. As shown in Fig. 8, addition of increasing con-centrations of H2O2 (70, 100, and 150 �M H2O2 per1.5 � 105 Jurkat cells) did not induce any significantimpairment in the reducing ability of the cells for the first2 h, while a small decrease, about 15%, was observed at100 and 150 �M H2O2, 4 h after treatment (Fig. 8A). Asignificant and concentration-dependent decrease wasobserved 6 h after initiation of the H2O2 treatment. It hasto be noted that at 100 and 150 �M H2O2 treatment, cells
showed characteristic signs of apoptosis (Figs. 3 and 7).When cells were exposed to continuously generatedH2O2 by the action of glucose oxidase, a decreasingability to reduce MTT was observed at 100 ng/ml ofglucose oxidase after 4 h, while impaired reduction abil-ity was observed in cells exposed to 50 and 100 ng/mlafter 6 h exposure (Fig. 8B). The effects observed wereinsignificant at lower concentrations of glucose oxidaseat all time points tested. These results indicate that con-tinuously generated H2O2, although able to induce DNAdamage and mitochondrial dysfunction, is unable to leadto apparent apoptotic cell death.
DISCUSSION
It has been proposed that H2O2, at relatively lowconcentrations, is able to play important roles in signal-ing pathways [41–43]. Moreover, since H2O2 is able topenetrate freely across cell membranes, it can transferinformation to nearby cells or tissues acting in a para-crine fashion, similar to nitric oxide. However, althoughextensively studied, the exact molecular mechanisms un-derlying the mode of action of H2O2 remain elusive. Alarge number of molecules have been proposed or iden-tified as direct or indirect targets of intracellular H2O2.Protein kinases and phosphatases, proteins containing
Fig. 7. Effects of H2O2 on poly(ADP-ribose)polymerase (PARP) cleavage. Cells (1.5 � 106 per ml) were exposed to: (A) increasingconcentrations of H2O2 for 6 h, (B) increasing amounts of glucose oxidase for 6 h, and (C) 150 �M H2O2 for the time points indicated.Total cell extracts were prepared as described in Materials and Methods and detection of proteins that crossreact with a mousemonoclonal antibody against PARP were evaluated by Western blotting as described in Materials and Methods. Arrows at the rightindicate the molecular weights for uncleaved 116 kDa and cleaved 85 kDa parts of PARP. Numbers 1–7 in (A) represent: control, 70,150, 250, 500, 750, and 1000 �M H2O2, respectively. Numbers 1–8 in (B) represent: control, 1, 10, 25, 75 100, 200, and 500 ng glucoseoxidase per ml, respectively. Numbers 1–7 in (C) represent: total cell extract preparation at 0, 1, 2, 3, 4, 5, and 6 h after the additionof H2O2. These experiments were repeated one more time with essentially the same results.
699H2O2-induced DNA damage and apoptosis
sulfhydryl groups or iron sulfur clusters, lipids, DNA,and others are among the potential targets [44,45]. Athigher concentrations, it is generally believed that H2O2
induces cell death mainly by initiating the programmedcell death or apoptosis as it is usually called. This pro-posal is based mainly on experiments in which H2O2 isadded directly as a bolus to the growth medium contain-ing the cells. However, in most cases in vivo, cells areexposed to H2O2 continuously generated for periods oftime. In this regard, experimental systems mimicking asclosely as possible the situation in vivo are advantageousover bolus addition of H2O2 to cell suspensions [12,19,23]. Under the experimental conditions used in this work(150 �M H2O2 to a cell suspension of 1.5 � 106 cells perml), the concentration of H2O2 was continuously de-creased by first-order kinetics (half-life about 9 min) andwas not apparent about 60 min after its addition (resultsnot shown). Cells continued to have a normal appearance
and only after about 3 to 5 h did they start to show thefirst signs of apoptosis as indicated by DNA cleavage,caspase activation, PARP cleavage, and so on (Figs.2–7).
There are two main questions arising from the abovegeneral observations: (i) what are the primary targets ofthe action of H2O2 during the initial phase, and (ii) whatprocesses are taking place during the time between H2O2
elimination and the appearance of the earliest signs ofapoptosis?
Regarding the first question, it is plausible to imaginethat DNA represents one of the most sensitive targetsamong all the basic cellular constituents. We have re-ported recently the formation of single-strand breaks afew minutes after exposure of Jurkat cells in suspensionto H2O2 [23–25,30]. This rapid effect on cellular DNA,however, was mainly Ca2� dependent, at least in lowH2O2 concentrations, as indicated by the protection of-fered by the membrane-permeable Ca2� chelatorBAPTA-AM. This observation indicates the need formediators in the process of H2O2-induced DNA damageand excludes the possibility of interaction of H2O2 (whenpresent at low concentrations) with transition metalsbound on the DNA. The possibility exists that calciummay exert its action by activating specific endonucle-ase(s) able to induce single-strand breaks in DNA. How-ever, preincubation of the cells with aurintricarboxylicacid, a nonspecific inhibitor of endonucleases, did notshow any protective effects either on H2O2-inducedDNA damage or H2O2-induced apoptosis (Galaris et al.,unpublished results).
The H2O2-induced DNA damage described abovetakes place within a few minutes after the exposure of thecells to H2O2 (Fig. 1) and seems to be reversible sinceaddition of catalase brings it to control levels within afew minutes (Galaris et al., unpublished results). How-ever, 3 to 4 h after bolus addition, the first signs ofapoptosis become apparent. Interestingly, removal ofH2O2 from the growth medium after its initial action onthe cells, although leading to a decreased level of single-strand breaks, did not prevent apoptosis. On the contrary,the presence of H2O2 after initiation inhibits the apopto-tic process (Figs. 2–7).
Although extensively studied, many aspects of theprocesses that take place during the intermediate periodbetween initiation and execution of apoptosis remainunclear. According to the schemes proposed, a variety ofprotein activation cascades are taking place, which ulti-mately converge to a common caspase pathway thatleads to the cleavage of chromatin at pieces of 180 to 200base pairs. Based on the results of the present work andin accordance with other reports [36–38], it is concludedthat the presence of even low concentrations of H2O2
during the intermediate period between the initiation and
Fig. 8. Estimation of cell viability by the MTT assay after exposure ofcells to H2O2. Cells (1.5 � 106 per ml) cultured in complete growthmedium at ELISA plates were exposed to either bolus concentrations ofH2O2 (70, 100, and 150 �M) (A) or glucose oxidase (1, 5, and 10 ngper 100 �l) (B). At the time points indicated, the ability of the treatedcells to reduce MTT to formazan was estimated as described in Mate-rials and Methods and expressed as a percentage of control unexposedcells. Each value represents triplicate measurements � SD, *p � .001.
700 A. BARBOUTI et al.

the execution of apoptosis inhibits this process regardlessof the initiation agent being H2O2 itself or other inducers,like an anti-Fas antibody acting through the Fas receptor.Since the amount of glucose oxidase that was able toinhibit apoptosis generated about 2.0 �M H2O2 per min,the actual extracellular concentration of H2O2 must bemuch lower. In addition, if we assume that a gradient ofextra- to intracellular H2O2 exists with a ratio 7:1 [28],we can estimate that subnanomolar intracellular concen-trations of H2O2 are able to inhibit the apoptotic process.The exact mechanism of this inhibitory action is notknown, but a direct oxidation of specific cysteine resi-dues of some caspases as well as inhibition of stepsupstream caspase activation due to decreased synthesisof ATP have been proposed [36–38]. However, a num-ber of other critical points may be potential targets ofH2O2 actions.
One prominent question arising from the results ofthis work is regarding the fate of the cells beyond theperiod of 6 h. Although not mentioned, preliminary re-sults from our laboratory indicate that exposure of thecells for 6 h to 2 �M H2O2 per min resulted in growtharrest. However, after the removal of the H2O2-generat-ing system, cells continued to proliferate with a ratesimilar to control cells (results not shown). Cells exposedto 150 �M H2O2 followed by continuous low levels ofH2O2 for 6 h die later by apoptosis. An extensive searchregarding the long-term fate of Jurkat cells after expo-sure to various forms of oxidative stress is currentlyunder way in our laboratory.
In conclusion, the presence of continuously generatedH2O2, although able to induce the formation of single-strand breaks in DNA, interrupt the cascade of eventsthat leads to apoptotic cell death. The exact mecha-nism(s) of this inhibitory action of H2O2 is still un-known, but it takes place before the third hour afterinitiation and acts at or upstream of caspase-3 activation.
Acknowledgement — This research was supported by grant PENED 99,No 99ED181 of General Secretariat of Research and Technology,Athens, Greece.
REFERENCES
[1] Ames, B.; Shigenaga, M. K.; Hagen, T. M. Oxidants, antioxi-dants, and the degenerative diseases of aging. Proc. Natl. Acad.Sci. USA 90:7915–7922; 1993.
[2] Griendling, K. K.; Harrison, D. G. Dual role of reactive oxygenspecies in vascular growth. Circ. Res. 85:562–563; 1999.
[3] Sundaresan, M.; Zu-Xi, Y.; Ferrans, V. J.; Irani, K.; Finkel, T.Requirement for generation of H2O2 for platelet-derived growthfactor signal transduction. Science 270:296–299; 1995.
[4] Forman, H. J.; Torres, M. Redox signaling in macrophages. Mol.Asp. Med. 22:189–216; 2001.
[5] Roveri, A.; Coassin, M.; Maiorino, M.; Zamburlini, A.; Amster-dam, F. T. M.; Ratti, E.; Ursini, F. Effects of hydrogen peroxideon calcium homeostasis in smooth muscle cells. Arch. Biochem.Biophys. 297:265–270; 1992.
[6] Golconda, M. S.; Ueda, N.; Shah, S. V. Evidence suggesting thatiron and calcium are interrelated in oxidant-induced DNA dam-age. Kidney Intl. 44:1228–1234; 1993.
[7] Ikebuchi, Y.; Masumoto, N.; Tasaka, K.; Koike, K.; Kasahara, K.;Miyake, A.; Tanizawa, O. Superoxide anion increases intracellu-lar pH, intracellular free calcium, and arachidonate release inhuman amnion cells. J. Biol. Chem. 266:13233–13237; 1991.
[8] Jin, N.; Hatton, N. D.; Harrington, M. A.; Xia, X.; Larsen, S. H.;Rhoades, R. A. H2O2-induced egr-1, fra-1, and c-jun gene expres-sion is mediated by tyrosine kinase in aortic smooth muscle cells.Free Radic. Biol. Med. 29:736–746; 2000.
[9] Nakamura, H.; Nakamura, K.; Yodoi, J. Redox regulation ofcellular activation. Ann. Rev. Immunol. 15:351–369; 1997.
[10] Burdon, R. Superoxide and hydrogen peroxide in relation tomammalian cell proliferation. Free Radic. Biol. Med. 18:775–794; 1995.
[11] Brown, M. R.; Miller, F. J. Jr.; Li, W. G.; Ellingson, A. N.;Mozena, J. D.; Chatterjee, P.; Engelhardt, J. F.; Zwacha, R. M.;Oberley, L. W.; Fang, X.; Spector, A. A.; Weintraub, N. L.Overexpression of human catalase inhibits proliferation and pro-motes apoptosis in vascular smooth muscle cells. Circ. Res.85:524–533; 1999.
[12] Antunes, F.; Cadenas, E. Cellular titration of apoptosis withsteady state concentrations of H2O2: submicromolar levels ofH2O2 induce apoptosis through Fenton chemistry independent ofthe cellular thiol state. Free Radic. Biol. Med. 30:1008–1018;2001.
[13] Yang, Y.; Cheng, J. Z.; Singhal, S. S.; Sanai, M.; Pandya, U.;Awasthi, S.; Awasthi, Y. C. Role of glutathione S-transferases inprotection against lipid peroxidation. Overexpression of hG-STA2-2 in K562 cells protects against hydrogen peroxide-in-duced apoptosis and inhibits JNK and caspase 3 activation.J. Biol. Chem. 276:19220–19230; 2001.
[14] Chandra, J.; Samali, A.; Orrenius, S. Triggering and modulationof apoptosis by oxidative stress. Free Radic. Biol. Med. 29:323–333; 2000.
[15] Meneghini, R. Iron homeostasis, oxidative stress, and DNA dam-age. Free Radic. Biol. Med. 23:783–792; 1997.
[16] Halliwell, B.; Aruoma, O. I. DNA damage by oxygen-derivedspecies: its mechanism and measurement in mammalian systems.FEBS Lett. 281:9–19; 1991.
[17] Imlay, J.; Chin, S.; Linn, S. Toxic DNA damage by hydrogenperoxide through the Fenton reaction in vivo and in vitro. Science240:640–642; 1988.
[18] Chevion, M. A site-specific mechanism for free radical inducedbiological damage: the essential role of redox-active transitionmetals. Free Radic. Biol. Med. 5:27–37; 1988.
[19] Antunes, F.; Cadenas, E.; Brunk, U. T. Apoptosis induced byexposure to a low steady state concentration of H2O2 is a conse-quence of lysosomal rupture. Biochem. J. 356:549–555; 2001.
[20] Brunk, U. T.; Neuzil, J.; Eaton, J. W. Lysosomal involvement inapoptosis. Redox Rep. 6:91–97; 2001.
[21] Li, W.; Yuan, X.; Nordgren, G.; Dalen, H.; Dobowchik, G. M.;Firestone, R. A.; Brunk, U. T. Induction of cell death by thelysosomotropic detergent MSDH. FEBS Lett. 470:35–39; 2000.
[22] Cantoni, O.; Sestili, P.; Cattabeni, F.; Bellomo, G.; Pou, S.;Cohen, M.; Cerutti, P. Calcium chelator Quin 2 prevents hydro-gen peroxide-induced DNA breakage and cytotoxicity. Eur.J. Biochem. 182:209–212; 1989.
[23] Panagiotidis, M.; Tsolas, O.; Galaris, D. Glucose oxidase-pro-duced H2O2 induces Ca2�-dependent DNA damage in humanperipheral blood lymphocytes. Free Radic. Biol. Med. 26:548–556; 1999.
[24] Doulias, P.-T.; Barbouti, A.; Galaris, D.; Ischiropoulos, H. SIN-1-induced DNA damage in isolated human peripheral blood lym-phocytes as assessed by single-cell gel electrophoresis (cometassay). Free Radic. Biol. Med. 30:679–685; 2001.
[25] Barbouti, A.; Doulias, P.-T.; Zhu, B.-Z.; Frei, B.; Galaris, D.Intracellular iron, but not copper, plays a critical role in hydrogenperoxide-induced DNA damage. Free Radic. Biol. Med. 31:490–498; 2001.
701H2O2-induced DNA damage and apoptosis
[26] Kim, D. K.; Cho, E. S.; Um, H.-D. Caspase-dependent and-independent events in apoptosis induced by hydrogen peroxide.Exp. Cell Res. 257:82–88; 2000.
[27] Gardner, A. M.; Xu, F.-H.; Fady, C.; Jacoby, F. J.; Duffy, D. C.;Tu, Y.; Lightenstein, A. Apoptotic vs. nonapoptotic cytotoxicityinduced by hydrogen peroxide. Free Radic. Biol. Med. 22:73–83;1997.
[28] Antunes, F.; Cadenas, E. Estimation of H2O2 gradients acrossbiomembranes. FEBS Lett. 475:121–126; 2000.
[29] Chance, B.; Sies, H.; Boveris, A. Hydroperoxide metabolism inmammalian organs. Physiol. Rev. 59:527–605; 1979.
[30] Tselepis, A.; Doulias, P.-T.; Lourida, E.; Glantzounis, G.; Tsi-moyiannis, E.; Galaris, D. Trimetazidine protects low-densitylipoproteins from oxidation and cultured cells exposed to H2O2
from DNA damage. Free Radic. Biol. Med. 30:1357–1364; 2001.[31] Ostling, O.; Johanson, K. J. Microelectrophoretic study of radia-
tion-induced DNA damages in individual mammalian cells. Bio-chem. Biophys. Res. Commun. 123:291–296; 1984.
[32] Singh, N. P.; McCoy, M. T.; Tice, R. R.; Schneider, E. L. Asimple technique for quantitation of low levels of DNA damage inindividual cells. Exp. Cell Res. 184:461–470; 1988.
[33] Collins, A. R.; Ma, A.; Duthie, S. J. The kinetics of repair ofoxidative DNA damage (strand breaks and oxidized pyrimidines)in human cells. Mutat. Res. 336:69–77; 1995.
[34] Duthie, S. J.; Haedon, A. DNA instability (strand breakage, uracilmisincorporation, and defective repair) is increased by folic aciddepletion in human lymphocytes in vitro. FASEB J. 12:1491–1497; 1998.
[35] Garmichael, J.; DeGraff, W. G.; Gazdar, A. F.; Minna, J. B.;Michell, J. B. Evaluation of a tetrazolium-based semiautomatic
assay: assessment of chemosensitivity testing. Cancer Res. 47:936–942; 1987.
[36] Hampton, M. B.; Orrenius, S. Dual regulation of caspase activityby hydrogen peroxide: implications for apoptosis. FEBS Lett.414:552–556; 1997.
[37] Lee, Y.-J.; Shacter, E. Hydrogen peroxide inhibits activation, notactivity of cellular caspase-3 in vivo. Free Radic. Biol. Med.29:684–692; 2000.
[38] Lee, Y.-J.; Shacter, E. Oxidative stress inhibits apoptosis in hu-man lymphoma cells. J. Biol. Chem. 274:19792–19798; 1999.
[39] Yung, M. C. T.; Satoh, M. S. Functional competition betweenpoly(ADP-ribose)polymerase and its 24 kDa apoptotic fragmentin DNA repair and transcription. J. Biol. Chem. 276:11279–11286; 2001.
[40] Lazebnik, Y. A.; Kaufmann, S. H.; Desnoyers, S.; Poirier, G. G.;Earnshaw, W. C. Cleavage of poly(ADP-ribose) polymerase by aproteinase with properties like ICE. Nature 371:346–347; 1994.
[41] Suzuki, Y. J.; Forman, H. J.; Sevanian, A. Oxidants as stimulatorsof signal transduction. Free Radic. Biol. Med. 22:269–285; 1997.
[42] Forman, H. J.; Cadenas, E., eds. Oxidative stress and signaltransduction. New York: Chapman and Hall; 1997.
[43] Finkel, T. Oxygen radicals and signaling. Curr. Opin. Cell Biol.10:243–253; 1998.
[44] Abe, J.-I.; Kusuhara, M.; Ulevitch, R. J.; Berk, B. C.; Lee, J.-D.Big mitogen-activated protein kinase 1 (BMK1) is a redox-sen-sitive kinase. J. Biol. Chem. 271:16586–16590; 1996.
[45] Hirpara, J. L.; Clement, M.-V.; Pervaiz, S. Intracellular acidifi-cation triggered by mitochondrial-derived hydrogen peroxide isan effector mechanism for drug-induced apoptosis in tumor cells.J. Biol. Chem. 276:514–521; 2001.
702 A. BARBOUTI et al.
Related Documents