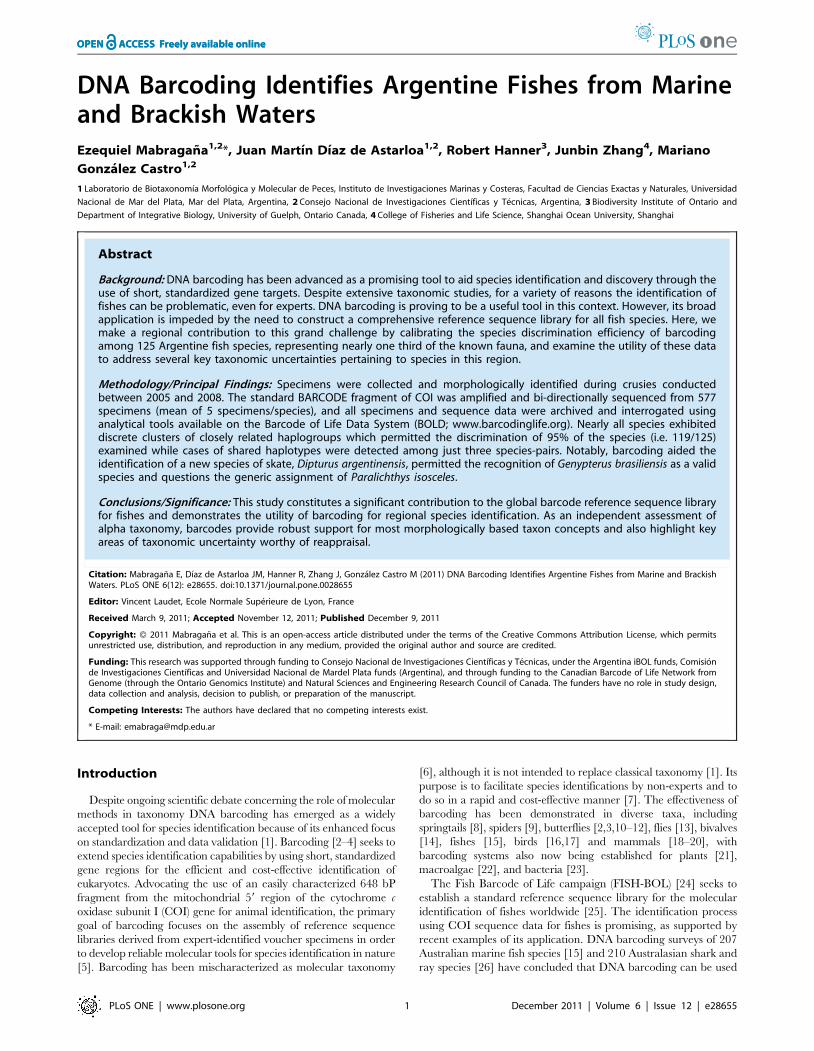
DNA Barcoding Identifies Argentine Fishes from Marine and Brackish Waters Ezequiel Mabragan ˜a 1,2 *, Juan Martı ´n Dı´az de Astarloa 1,2 , Robert Hanner 3 , Junbin Zhang 4 , Mariano Gonza ´ lez Castro 1,2 1 Laboratorio de Biotaxonomı ´a Morfolo ´ gica y Molecular de Peces, Instituto de Investigaciones Marinas y Costeras, Facultad de Ciencias Exactas y Naturales, Universidad Nacional de Mar del Plata, Mar del Plata, Argentina, 2 Consejo Nacional de Investigaciones Cientı ´ficas y Te ´cnicas, Argentina, 3 Biodiversity Institute of Ontario and Department of Integrative Biology, University of Guelph, Ontario Canada, 4 College of Fisheries and Life Science, Shanghai Ocean University, Shanghai Abstract Background: DNA barcoding has been advanced as a promising tool to aid species identification and discovery through the use of short, standardized gene targets. Despite extensive taxonomic studies, for a variety of reasons the identification of fishes can be problematic, even for experts. DNA barcoding is proving to be a useful tool in this context. However, its broad application is impeded by the need to construct a comprehensive reference sequence library for all fish species. Here, we make a regional contribution to this grand challenge by calibrating the species discrimination efficiency of barcoding among 125 Argentine fish species, representing nearly one third of the known fauna, and examine the utility of these data to address several key taxonomic uncertainties pertaining to species in this region. Methodology/Principal Findings: Specimens were collected and morphologically identified during crusies conducted between 2005 and 2008. The standard BARCODE fragment of COI was amplified and bi-directionally sequenced from 577 specimens (mean of 5 specimens/species), and all specimens and sequence data were archived and interrogated using analytical tools available on the Barcode of Life Data System (BOLD; www.barcodinglife.org). Nearly all species exhibited discrete clusters of closely related haplogroups which permitted the discrimination of 95% of the species (i.e. 119/125) examined while cases of shared haplotypes were detected among just three species-pairs. Notably, barcoding aided the identification of a new species of skate, Dipturus argentinensis, permitted the recognition of Genypterus brasiliensis as a valid species and questions the generic assignment of Paralichthys isosceles. Conclusions/Significance: This study constitutes a significant contribution to the global barcode reference sequence library for fishes and demonstrates the utility of barcoding for regional species identification. As an independent assessment of alpha taxonomy, barcodes provide robust support for most morphologically based taxon concepts and also highlight key areas of taxonomic uncertainty worthy of reappraisal. Citation: Mabragan ˜ a E, Dı ´az de Astarloa JM, Hanner R, Zhang J, Gonza ´lez Castro M (2011) DNA Barcoding Identifies Argentine Fishes from Marine and Brackish Waters. PLoS ONE 6(12): e28655. doi:10.1371/journal.pone.0028655 Editor: Vincent Laudet, Ecole Normale Supe ´rieure de Lyon, France Received March 9, 2011; Accepted November 12, 2011; Published December 9, 2011 Copyright: ß 2011 Mabragan ˜ a et al. This is an open-access article distributed under the terms of the Creative Commons Attribution License, which permits unrestricted use, distribution, and reproduction in any medium, provided the original author and source are credited. Funding: This research was supported through funding to Consejo Nacional de Investigaciones Cientı ´ficas y Te ´cnicas, under the Argentina iBOL funds, Comisio ´n de Investigaciones Cientı ´ficas and Universidad Nacional de Mardel Plata funds (Argentina), and through funding to the Canadian Barcode of Life Network from Genome (through the Ontario Genomics Institute) and Natural Sciences and Engineering Research Council of Canada. The funders have no role in study design, data collection and analysis, decision to publish, or preparation of the manuscript. Competing Interests: The authors have declared that no competing interests exist. * E-mail: [email protected] Introduction Despite ongoing scientific debate concerning the role of molecular methods in taxonomy DNA barcoding has emerged as a widely accepted tool for species identification because of its enhanced focus on standardization and data validation [1]. Barcoding [2–4] seeks to extend species identification capabilities by using short, standardized gene regions for the efficient and cost-effective identification of eukaryotes. Advocating the use of an easily characterized 648 bP fragment from the mitochondrial 59 region of the cytochrome c oxidase subunit I (COI) gene for animal identification, the primary goal of barcoding focuses on the assembly of reference sequence libraries derived from expert-identified voucher specimens in order to develop reliable molecular tools for species identification in nature [5]. Barcoding has been mischaracterized as molecular taxonomy [6], although it is not intended to replace classical taxonomy [1]. Its purpose is to facilitate species identifications by non-experts and to do so in a rapid and cost-effective manner [7]. The effectiveness of barcoding has been demonstrated in diverse taxa, including springtails [8], spiders [9], butterflies [2,3,10–12], flies [13], bivalves [14], fishes [15], birds [16,17] and mammals [18–20], with barcoding systems also now being established for plants [21], macroalgae [22], and bacteria [23]. The Fish Barcode of Life campaign (FISH-BOL) [24] seeks to establish a standard reference sequence library for the molecular identification of fishes worldwide [25]. The identification process using COI sequence data for fishes is promising, as supported by recent examples of its application. DNA barcoding surveys of 207 Australian marine fish species [15] and 210 Australasian shark and ray species [26] have concluded that DNA barcoding can be used PLoS ONE | www.plosone.org 1 December 2011 | Volume 6 | Issue 12 | e28655

Welcome message from author
This document is posted to help you gain knowledge. Please leave a comment to let me know what you think about it! Share it to your friends and learn new things together.
Transcript
DNA Barcoding Identifies Argentine Fishes from Marineand Brackish WatersEzequiel Mabragana1,2*, Juan Martın Dıaz de Astarloa1,2, Robert Hanner3, Junbin Zhang4, Mariano
Gonzalez Castro1,2
1 Laboratorio de Biotaxonomıa Morfologica y Molecular de Peces, Instituto de Investigaciones Marinas y Costeras, Facultad de Ciencias Exactas y Naturales, Universidad
Nacional de Mar del Plata, Mar del Plata, Argentina, 2 Consejo Nacional de Investigaciones Cientıficas y Tecnicas, Argentina, 3 Biodiversity Institute of Ontario and
Department of Integrative Biology, University of Guelph, Ontario Canada, 4 College of Fisheries and Life Science, Shanghai Ocean University, Shanghai
Abstract
Background: DNA barcoding has been advanced as a promising tool to aid species identification and discovery through theuse of short, standardized gene targets. Despite extensive taxonomic studies, for a variety of reasons the identification offishes can be problematic, even for experts. DNA barcoding is proving to be a useful tool in this context. However, its broadapplication is impeded by the need to construct a comprehensive reference sequence library for all fish species. Here, wemake a regional contribution to this grand challenge by calibrating the species discrimination efficiency of barcodingamong 125 Argentine fish species, representing nearly one third of the known fauna, and examine the utility of these datato address several key taxonomic uncertainties pertaining to species in this region.
Methodology/Principal Findings: Specimens were collected and morphologically identified during crusies conductedbetween 2005 and 2008. The standard BARCODE fragment of COI was amplified and bi-directionally sequenced from 577specimens (mean of 5 specimens/species), and all specimens and sequence data were archived and interrogated usinganalytical tools available on the Barcode of Life Data System (BOLD; www.barcodinglife.org). Nearly all species exhibiteddiscrete clusters of closely related haplogroups which permitted the discrimination of 95% of the species (i.e. 119/125)examined while cases of shared haplotypes were detected among just three species-pairs. Notably, barcoding aided theidentification of a new species of skate, Dipturus argentinensis, permitted the recognition of Genypterus brasiliensis as a validspecies and questions the generic assignment of Paralichthys isosceles.
Conclusions/Significance: This study constitutes a significant contribution to the global barcode reference sequence libraryfor fishes and demonstrates the utility of barcoding for regional species identification. As an independent assessment ofalpha taxonomy, barcodes provide robust support for most morphologically based taxon concepts and also highlight keyareas of taxonomic uncertainty worthy of reappraisal.
Citation: Mabragana E, Dıaz de Astarloa JM, Hanner R, Zhang J, Gonzalez Castro M (2011) DNA Barcoding Identifies Argentine Fishes from Marine and BrackishWaters. PLoS ONE 6(12): e28655. doi:10.1371/journal.pone.0028655
Editor: Vincent Laudet, Ecole Normale Superieure de Lyon, France
Received March 9, 2011; Accepted November 12, 2011; Published December 9, 2011
Copyright: � 2011 Mabragana et al. This is an open-access article distributed under the terms of the Creative Commons Attribution License, which permitsunrestricted use, distribution, and reproduction in any medium, provided the original author and source are credited.
Funding: This research was supported through funding to Consejo Nacional de Investigaciones Cientıficas y Tecnicas, under the Argentina iBOL funds, Comisionde Investigaciones Cientıficas and Universidad Nacional de Mardel Plata funds (Argentina), and through funding to the Canadian Barcode of Life Network fromGenome (through the Ontario Genomics Institute) and Natural Sciences and Engineering Research Council of Canada. The funders have no role in study design,data collection and analysis, decision to publish, or preparation of the manuscript.
Competing Interests: The authors have declared that no competing interests exist.
* E-mail: [email protected]
Introduction
Despite ongoing scientific debate concerning the role of molecular
methods in taxonomy DNA barcoding has emerged as a widely
accepted tool for species identification because of its enhanced focus
on standardization and data validation [1]. Barcoding [2–4] seeks to
extend species identification capabilities by using short, standardized
gene regions for the efficient and cost-effective identification of
eukaryotes. Advocating the use of an easily characterized 648 bP
fragment from the mitochondrial 59 region of the cytochrome c
oxidase subunit I (COI) gene for animal identification, the primary
goal of barcoding focuses on the assembly of reference sequence
libraries derived from expert-identified voucher specimens in order
to develop reliable molecular tools for species identification in nature
[5]. Barcoding has been mischaracterized as molecular taxonomy
[6], although it is not intended to replace classical taxonomy [1]. Its
purpose is to facilitate species identifications by non-experts and to
do so in a rapid and cost-effective manner [7]. The effectiveness of
barcoding has been demonstrated in diverse taxa, including
springtails [8], spiders [9], butterflies [2,3,10–12], flies [13], bivalves
[14], fishes [15], birds [16,17] and mammals [18–20], with
barcoding systems also now being established for plants [21],
macroalgae [22], and bacteria [23].
The Fish Barcode of Life campaign (FISH-BOL) [24] seeks to
establish a standard reference sequence library for the molecular
identification of fishes worldwide [25]. The identification process
using COI sequence data for fishes is promising, as supported by
recent examples of its application. DNA barcoding surveys of 207
Australian marine fish species [15] and 210 Australasian shark and
ray species [26] have concluded that DNA barcoding can be used
PLoS ONE | www.plosone.org 1 December 2011 | Volume 6 | Issue 12 | e28655
for both teleost and chondricthyan species identification. Hubert et
al. [5] were able to distinguish 93% of 190 Canadian freshwaters
fishes using the mitochondrial DNA COI gene. Steinke et al. [27]
demonstrated that sequence variability in the barcode region
permitted discrimination of 98% of 201 fish species from the
Canadian Pacific. Ward and Holmes [28] analysed the DNA
barcode region in 388 species of fishes, including 4 holocephali
and 61 elasmobranchs showing the discrimination of 98–99% of
fish species examined thus far. In addition, barcodes were
subsequently used to identify marine fish larvae from Australian
[29,30] and Antarctic [31] waters.
The ichthyofauna of the Argentine continental shelf is well
known due to information obtained by large foreign expeditions
and local research cruises since the early twentieth Century [32–
35, 36 and references therein]. However, taxonomic resolution
remains elusive for some challenging groups, and new species
remain to be discovered as evidenced by the ongoing description
of new species [35,37–42].
The aim of this study is to extend barcode coverage to
Argentine marine and brackish water fishes. Because museum
specimens are generally recalcitrant to DNA analyses due to of
their fixation in formalin, a dedicated collecting effort of fresh
material was required from Argentinean waters. We examined
the patterns of barcode sequence divergence among 577
specimens identified as belonging to 125 fish species, representing
nearly one third of the known fauna [33,35,43]. The investigation
not only provides the potential use of DNA barcoding as a tool to
aid traditional taxonomy in the identification of Argentinean
marine fish species, but also explores the application of DNA
barcodes to flag overlooked species and discusses the potential
limitations inherent to the existing morphologically-based taxo-
nomic system.
Materials and Methods
Ethics StatementAll tissue samples were extracted from specimens that were
collected as part of other biological studies carried out with
appropriate permissions from local authorities: Comision de
Investigaciones Cientıficas de la Provincia de Buenos Aires,
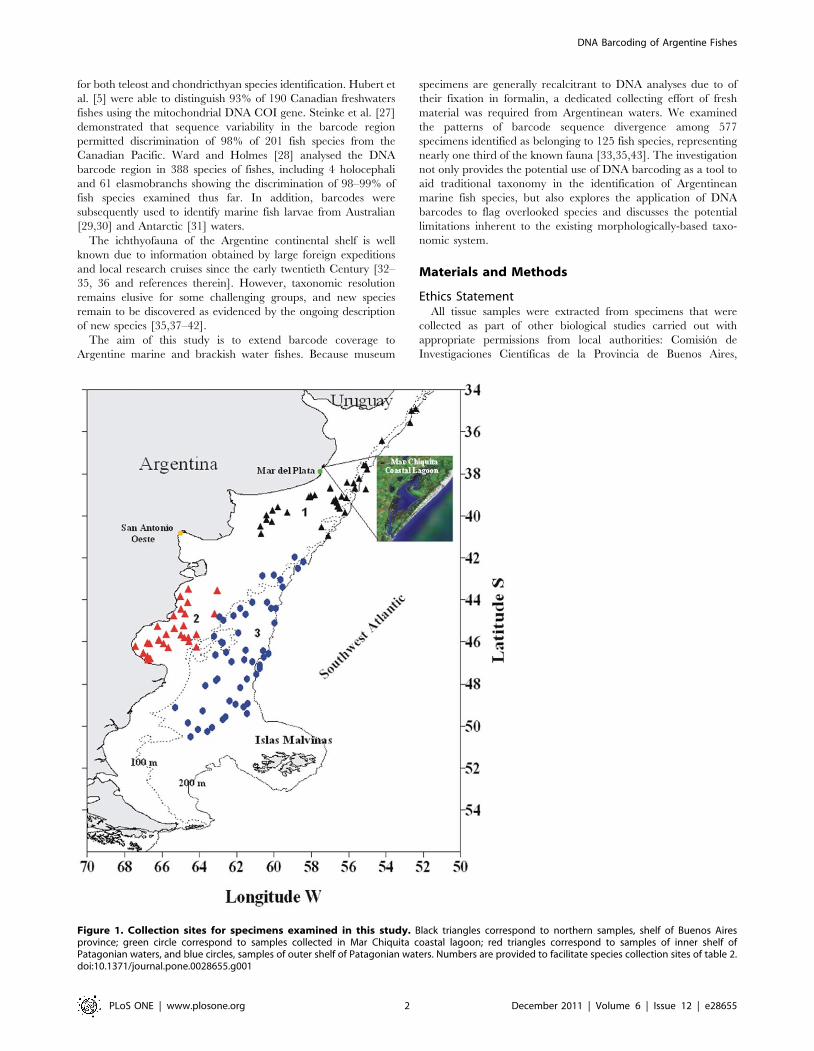
Figure 1. Collection sites for specimens examined in this study. Black triangles correspond to northern samples, shelf of Buenos Airesprovince; green circle correspond to samples collected in Mar Chiquita coastal lagoon; red triangles correspond to samples of inner shelf ofPatagonian waters, and blue circles, samples of outer shelf of Patagonian waters. Numbers are provided to facilitate species collection sites of table 2.doi:10.1371/journal.pone.0028655.g001
DNA Barcoding of Argentine Fishes
PLoS ONE | www.plosone.org 2 December 2011 | Volume 6 | Issue 12 | e28655
Argentina. (CIC, Ref. Leg. 56/S06); Consejo Nacional de
Investigaciones Cientıficas y Tecnicas (CONICET, Fdo iBOL
Argentina/2008) and Universidad Nacional de Mar del Plata,
Argentina (UNMdP, EXA 407/08).
Sampling and Taxonomic CoverageA total of 577 specimens of fishes collected in Argentine waters,
representing 125 species, 98 genera, and 63 families were
analyzed. 77 of these species were collected during research
cruises conducted by the National Institute for Fisheries Research
and Development (INIDEP) in the Argentine Sea, whereas the
other 49 species came from researches conducted by the
Laboratorio de Ictiologıa of Universidad Nacional de Mar del
Plata in Mar Chiquita coastal lagoon and off Mar del Plata coast
(Figure 1, Table S1). Methods followed recommendations of
FISH-BOL [24]. Vouchers were morphologically identified
following the identification reliability levels 1 and 2 according
to the Fish-BOL collaborator’s protocol [25]; Level 1: ‘‘highly
reliable identification—specimen identified by (1) an internation-
ally recognized authority of the group, or (2) a specialist that is
presently studying or has reviewed the group in the region in
question’’ and Level 2: ‘‘identification made with high degree of
confidence at all levels—specimen identified by a trained
identifier who had prior knowledge of the group in the region
or used available literature to identify the specimen’’. Some of the
specimens were deposited in the fish collection of INIDEP; the
other specimens studied were kept only as e-voucher (See Table
S1). All sequence assemblies, electropherogram (trace) files,
primer sequences and specimen provenance data were deposited
in the publicly accessible ‘‘Fishes of Argentina’’ Project (code
FARG) on the Barcode of Life Database (BOLD, [44]). This
included digital images of morphological voucher specimens, sex
and ontogenetic stage (post larval, juvenile or adult), total and
standard length as well as GPS coordinates for all specimen
collection localities.
DNA AnalysisMuscle tissue samples were taken from whole specimens and
genomic DNA extracted according to the protocol of Ivanova et
al. [45]. Amplification of the 59 barcode region of COI was first
attempted using FF2d_t1/FR1d_t1 primer combination and
C_FishF1t1/C_FishR1t1 primer cocktails [46]. The primer
combination C_FishF1t1 contained two primers (FishF2_t1/
VF2_t1), and C_FishR1t1 also contained two primers (FishR2_
t1/FR1d_t1) (Table 1). All primers were appended with M13 tails
to facilitate sequencing. PCR reactions were performed in 96-well
plates. The reaction master mix consisted of 825 ml water, 125 ml
106 buffer, 62.5 ml MgCl2 (25 mM), 6.25 ml dNTP (10 mM),
6.25 ml each primer (0.01 mM) and 6.25 ml Taq DNA polymerase
(5 U/ml) was prepared for each plate, and each well contained
10.5 ml mixture and 2 ml genomic DNA. The PCR reaction profile
was comprised of an initial step of 2 min at 95uC and 35 cycles of
30 sec at 94uC, 40 sec at 52uC, and 1 min at 72uC, with a final
extension at 72uC for 10 min. Amplicons were visualized on 2%
agarose E-GelH 96-well system (Invitrogen). Sequencing reactions
used M13 forward and reverse primers using the BigDyeHTerminator v.3.1 Cycle Sequencing Kit (Applied Biosystems,
Inc.), and the reaction profile was comprised of an initial step of
2 min at 96uC and 35 cycles of 30 sec at 96uC, 15 sec at 55uC,
and 4 min at 60uC. Products were directly sequenced using an
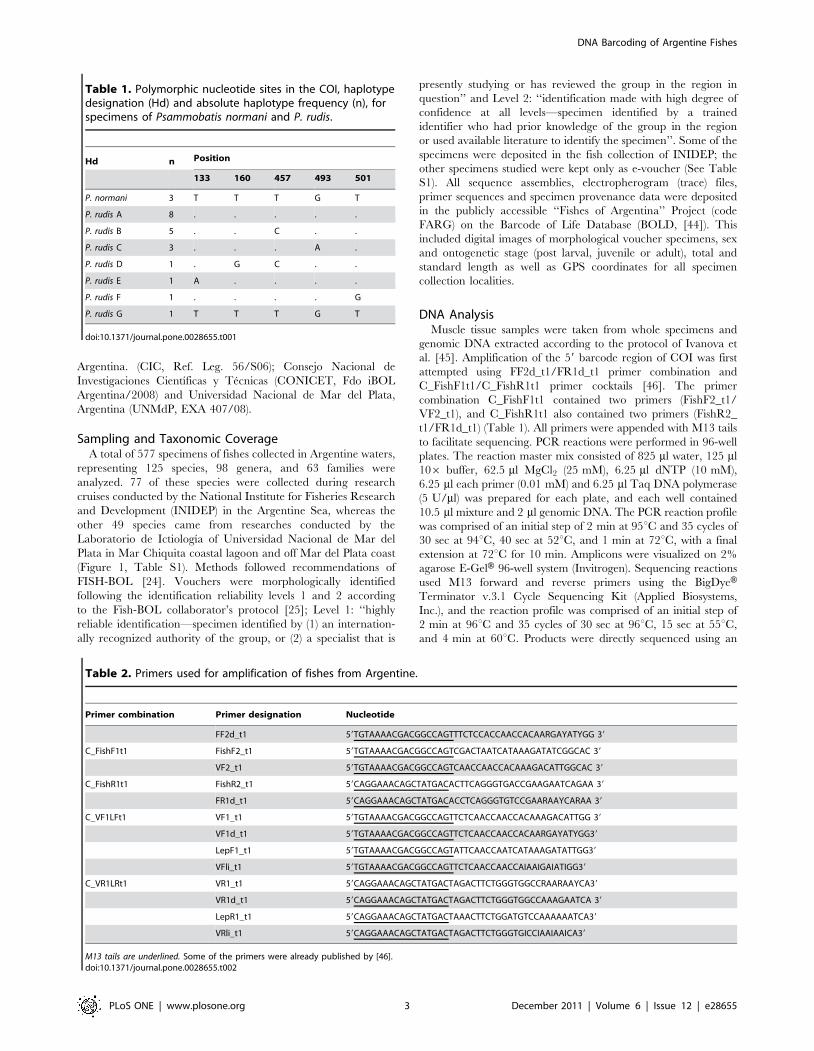
Table 2. Primers used for amplification of fishes from Argentine.
Primer combination Primer designation Nucleotide
FF2d_t1 59TGTAAAACGACGGCCAGTTTCTCCACCAACCACAARGAYATYGG 39
C_FishF1t1 FishF2_t1 59TGTAAAACGACGGCCAGTCGACTAATCATAAAGATATCGGCAC 39
VF2_t1 59TGTAAAACGACGGCCAGTCAACCAACCACAAAGACATTGGCAC 39
C_FishR1t1 FishR2_t1 59CAGGAAACAGCTATGACACTTCAGGGTGACCGAAGAATCAGAA 39
FR1d_t1 59CAGGAAACAGCTATGACACCTCAGGGTGTCCGAARAAYCARAA 39
C_VF1LFt1 VF1_t1 59TGTAAAACGACGGCCAGTTCTCAACCAACCACAAAGACATTGG 39
VF1d_t1 59TGTAAAACGACGGCCAGTTCTCAACCAACCACAARGAYATYGG39
LepF1_t1 59TGTAAAACGACGGCCAGTATTCAACCAATCATAAAGATATTGG39
VFli_t1 59TGTAAAACGACGGCCAGTTCTCAACCAACCAIAAIGAIATIGG39
C_VR1LRt1 VR1_t1 59CAGGAAACAGCTATGACTAGACTTCTGGGTGGCCRAARAAYCA39
VR1d_t1 59CAGGAAACAGCTATGACTAGACTTCTGGGTGGCCAAAGAATCA 39
LepR1_t1 59CAGGAAACAGCTATGACTAAACTTCTGGATGTCCAAAAAATCA39
VRli_t1 59CAGGAAACAGCTATGACTAGACTTCTGGGTGICCIAAIAAICA39
M13 tails are underlined. Some of the primers were already published by [46].doi:10.1371/journal.pone.0028655.t002
Table 1. Polymorphic nucleotide sites in the COI, haplotypedesignation (Hd) and absolute haplotype frequency (n), forspecimens of Psammobatis normani and P. rudis.
Hd n Position
133 160 457 493 501
P. normani 3 T T T G T
P. rudis A 8 . . . . .
P. rudis B 5 . . C . .
P. rudis C 3 . . . A .
P. rudis D 1 . G C . .
P. rudis E 1 A . . . .
P. rudis F 1 . . . . G
P. rudis G 1 T T T G T
doi:10.1371/journal.pone.0028655.t001
DNA Barcoding of Argentine Fishes
PLoS ONE | www.plosone.org 3 December 2011 | Volume 6 | Issue 12 | e28655
ABI 3730 capillary sequencer according to manufacturer’s
instructions. For specimens that failed to amplify using the primer
combinations above, C_VF1LFt1/C_ VR1LRt1 primer combi-
nations [46] were tried. C_VF1LFt1 consisted of four primers
(VF1_t1/VF1d_t1/LepF1_t1/VFli_t1), and C_VR1LRt1 also
comprised four primers (VR1_t1/VR1d_t1/LepR1_t1/VRli_t1)
(Table 2). The PCR reaction profile consisted of 1 min at 95uCand 35 cycles of 30 sec at 94uC, 40 sec at 50uC, and 1 min at
72uC, with a final extension at 72uC for 10 min. All other
procedures followed those above. DNA sequences were aligned
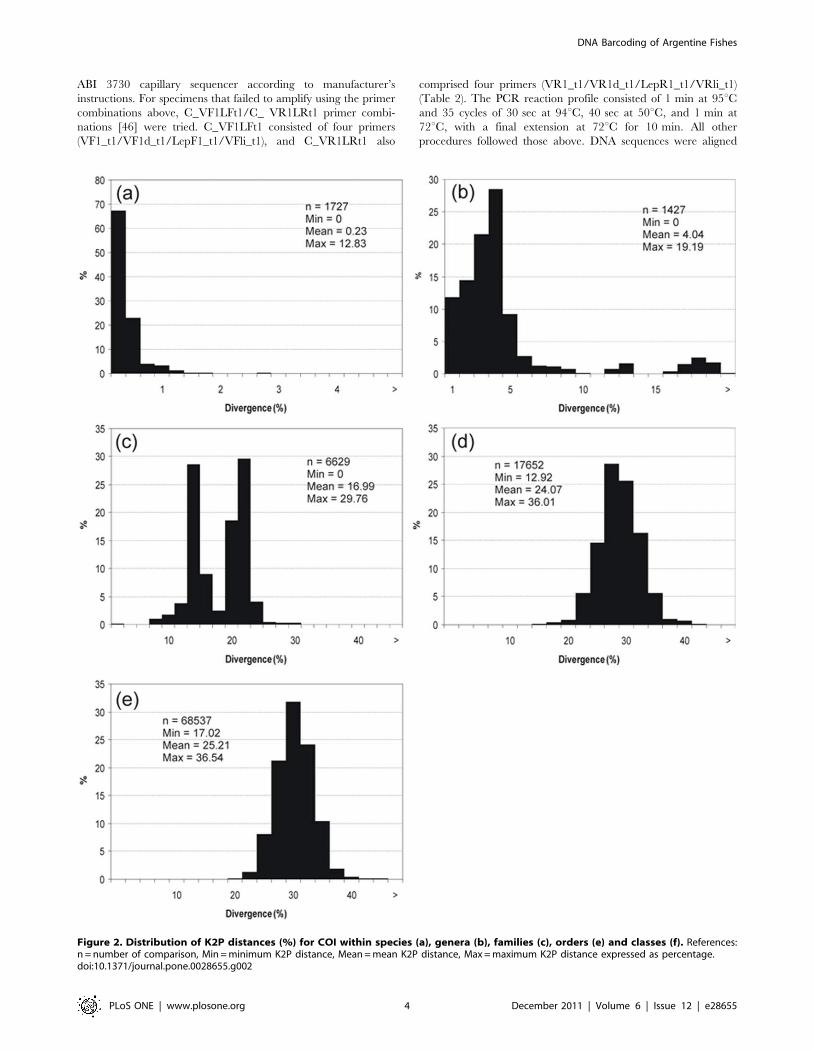
Figure 2. Distribution of K2P distances (%) for COI within species (a), genera (b), families (c), orders (e) and classes (f). References:n = number of comparison, Min = minimum K2P distance, Mean = mean K2P distance, Max = maximum K2P distance expressed as percentage.doi:10.1371/journal.pone.0028655.g002
DNA Barcoding of Argentine Fishes
PLoS ONE | www.plosone.org 4 December 2011 | Volume 6 | Issue 12 | e28655
with SeqScape v.2.1.1 software (Applied Biosystems, Inc.).
Sequence divergences were calculated using the Kimura two
parameter (K2P) distance model [47], and unrooted NJ pheno-
grams based on K2P distances were created using BOLD. K2P
model was used because data set covers a large range of taxa
spanning many orders and mtDNA is subject to mutational
saturation at this level. Eventhough there are several distance
models that take into account this issue, K2P is one of the simplest
and commonest model used for describing differentiation among
species using COI. On the other hand, being K2P the standard
model used in barcode studies allows a better comparison with
other barcode studies. Other NJ trees analysing individual genera
were constructed using MEGA 4.1 [48] and were bootstrapped
500 times to provide percentage bootstrap values for branch
points. Sequence data are available on both BOLD and GenBank
(Table S2).
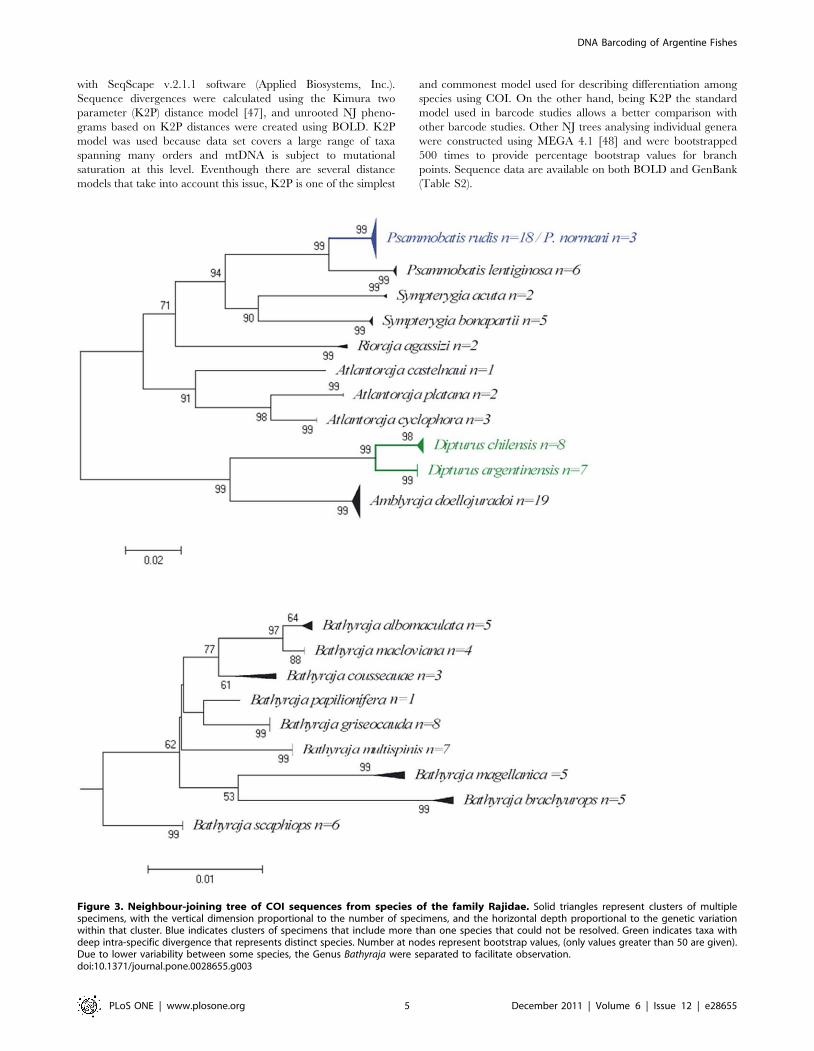
Figure 3. Neighbour-joining tree of COI sequences from species of the family Rajidae. Solid triangles represent clusters of multiplespecimens, with the vertical dimension proportional to the number of specimens, and the horizontal depth proportional to the genetic variationwithin that cluster. Blue indicates clusters of specimens that include more than one species that could not be resolved. Green indicates taxa withdeep intra-specific divergence that represents distinct species. Number at nodes represent bootstrap values, (only values greater than 50 are given).Due to lower variability between some species, the Genus Bathyraja were separated to facilitate observation.doi:10.1371/journal.pone.0028655.g003
DNA Barcoding of Argentine Fishes
PLoS ONE | www.plosone.org 5 December 2011 | Volume 6 | Issue 12 | e28655
Results and Discussion
Overall resultsNo stop codon, insertions or deletions were found in any of the
amplified sequences, showing that all of them constitute functional
mitochondrial COI sequences. Of the 651 bases, 354 nucleotid
sites were variable and most substitutions occurred in the third
nucleotide position within codons (61.3%). All the amplified
sequences were larger than 600-bp, the limit typically observed for
NUMTs (nuclear DNA sequences originating from mtDNA) [49].
As reported by Ward et al [24], in FISHBOL review, NUMTs do
not appear to be a concern for fish barcoding.
A total of 577 specimens, representing 125 species, 98 genera
and 63 families were barcoded (Table S1). Average nucleotide
frequency were C (27.25%), T (30.74%), A (24.04%) and G
(17.97%). Nearly all species exhibited unique barcode haplotypes
or cohesive clusters of very closely related haplotypes, which
permitted the discrimination of at least 95.2% of species (Appendix
S1). The K2P genetic distances averaged just 0.23% within
species, but averaged 4.04% within genera, 16.99% within
families, 24.07% within orders and 25.21% within classes,
increasing value with taxonomic level (Figure 2). Hence, overall,
there was a 17-fold more pronounced difference among
congeneric species than among conspecific individuals.
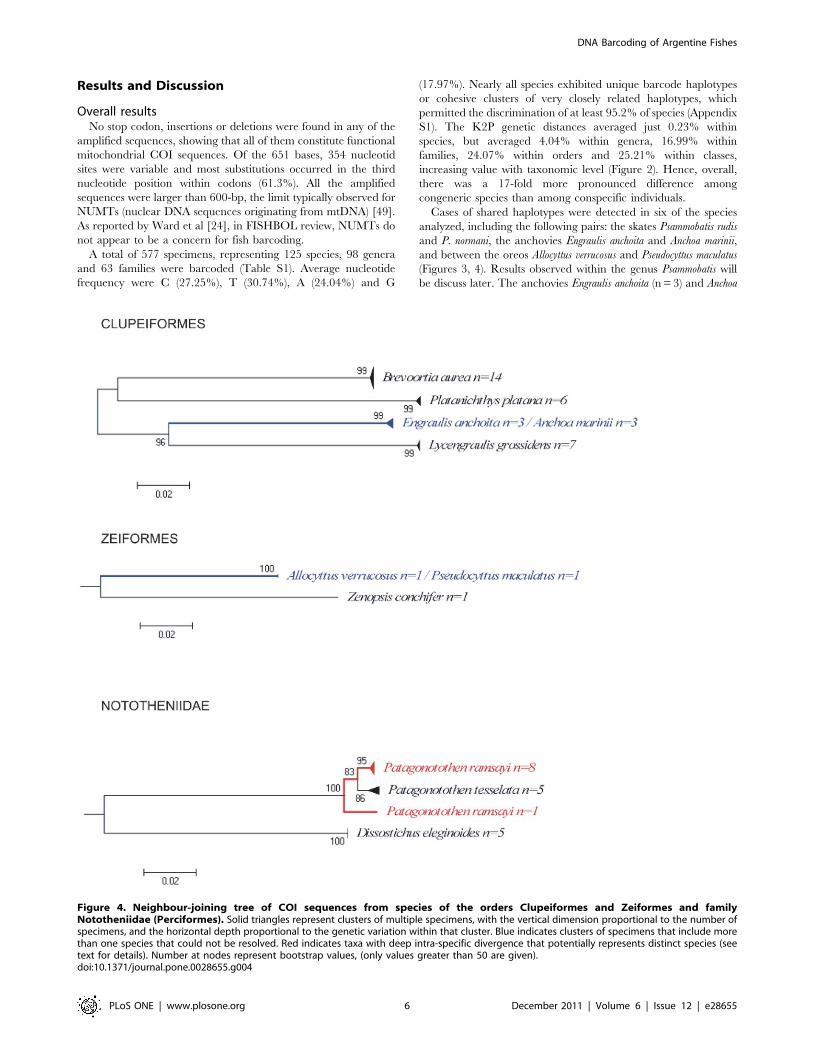
Cases of shared haplotypes were detected in six of the species
analyzed, including the following pairs: the skates Psammobatis rudis
and P. normani, the anchovies Engraulis anchoita and Anchoa marinii,
and between the oreos Allocyttus verrucosus and Pseudocyttus maculatus
(Figures 3, 4). Results observed within the genus Psammobatis will
be discuss later. The anchovies Engraulis anchoita (n = 3) and Anchoa
Figure 4. Neighbour-joining tree of COI sequences from species of the orders Clupeiformes and Zeiformes and familyNototheniidae (Perciformes). Solid triangles represent clusters of multiple specimens, with the vertical dimension proportional to the number ofspecimens, and the horizontal depth proportional to the genetic variation within that cluster. Blue indicates clusters of specimens that include morethan one species that could not be resolved. Red indicates taxa with deep intra-specific divergence that potentially represents distinct species (seetext for details). Number at nodes represent bootstrap values, (only values greater than 50 are given).doi:10.1371/journal.pone.0028655.g004
DNA Barcoding of Argentine Fishes
PLoS ONE | www.plosone.org 6 December 2011 | Volume 6 | Issue 12 | e28655
marinii (n = 3), could not be separated by COI even though they
are two valid species of Engraulidae. These species have external
morphological features that allow differentiating each other;
however when specimens are not well preserved it is more difficult
to identify them from images. Unfortunately these specimens were
not retained and only the e-vouchers (digital images) have been
recorded to reliable re-checked the identification. From images it
can be seen that specimens identified as Engraulis anchoita clearly
represent this species because of the broad silver stripe along flank,
the large size of the specimens (.14 cm TL), and the large eye size
in relation to snout. However those specimens identified as Anchoa
marini are not well preserved (most lateral scales are missing, and
both dorsal and anal fins can not be recognized), so it is difficult
from images to identify them properly. Therefore, the lack of
discrimination at molecular level between these pairs of species is
likely a problem of misidentification. Regarding the zero
divergence between Oreosomatid species from Argentina, this
case is likely to be a misidentification. Allocyttus verrucosus and
Pseudocyttus maculatus are the Oreosomatid species recorded in the
southwest Atlantic [33,50,51]. Re-examination of e-vouchers allow
identifying both specimens as Allocyttus verrucosus, because in both
the first dorsal spine is much shorter than the second spine (the
opposite occurred in P. maculatus). On the other hand, Ward, [52]
in a general analysis of DNA barcoding divergence among fishes
worldwide, showed that specimens of Allocyttus verrucosus, Allocyttus
niger and Pseudocyttus maculatus from the Indian Ocean and
Tasmanian waters were clearly identified using COI sequences
and were separated from each other in the NJ tree. However,
specimens of A. verrucosus and P. maculatus from Argentina clustered
together and near those of A. niger from Indian Ocean. Therefore it
is possible that both individuals from Argentina are actually A.
niger, a species that had never been reported for the southwest
Atlantic Ocean [33,50,51] although Yearsley et al [53] in a book
of Australian seafood shows a point in the southwest Atlantic as
part of the distribution of this species. Further morphological and
molecular studies are needed to clarify the actual taxonomic
identification of these nominal species.
The maximum intraspecific genetic variation was below 1% in
93.6% of the species analysed except for the following species:
Cynoscion guatucupa (1.72%, n = 5), Squalus acanthias (1.71%, n = 11),
Helicolenus lahillei (1.24%, n = 13), Parona signata (1.09%, n = 6),
Iluocoetes fimbriatus (1.09%, n = 11) and Prionotus nudigula (1.09%,
n = 4). In addition, deep intraspecific divergences were found
between individuals of Prepilus paru (12.3%, n = 2), this result will
be discuss later. As observed by Hebert et al. [3], species
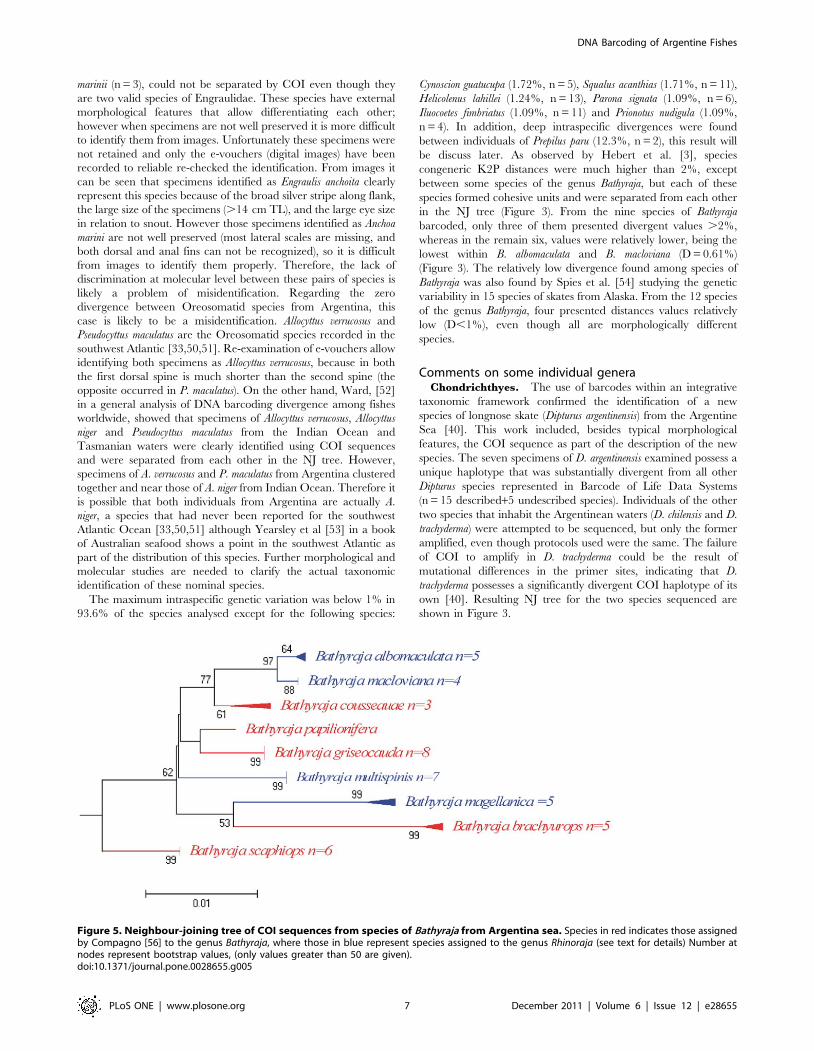
congeneric K2P distances were much higher than 2%, except
between some species of the genus Bathyraja, but each of these
species formed cohesive units and were separated from each other
in the NJ tree (Figure 3). From the nine species of Bathyraja
barcoded, only three of them presented divergent values .2%,
whereas in the remain six, values were relatively lower, being the
lowest within B. albomaculata and B. macloviana (D = 0.61%)
(Figure 3). The relatively low divergence found among species of
Bathyraja was also found by Spies et al. [54] studying the genetic
variability in 15 species of skates from Alaska. From the 12 species
of the genus Bathyraja, four presented distances values relatively
low (D,1%), even though all are morphologically different
species.
Comments on some individual generaChondrichthyes. The use of barcodes within an integrative
taxonomic framework confirmed the identification of a new
species of longnose skate (Dipturus argentinensis) from the Argentine
Sea [40]. This work included, besides typical morphological
features, the COI sequence as part of the description of the new
species. The seven specimens of D. argentinensis examined possess a
unique haplotype that was substantially divergent from all other
Dipturus species represented in Barcode of Life Data Systems
(n = 15 described+5 undescribed species). Individuals of the other
two species that inhabit the Argentinean waters (D. chilensis and D.
trachyderma) were attempted to be sequenced, but only the former
amplified, even though protocols used were the same. The failure
of COI to amplify in D. trachyderma could be the result of
mutational differences in the primer sites, indicating that D.
trachyderma possesses a significantly divergent COI haplotype of its
own [40]. Resulting NJ tree for the two species sequenced are
shown in Figure 3.
Figure 5. Neighbour-joining tree of COI sequences from species of Bathyraja from Argentina sea. Species in red indicates those assignedby Compagno [56] to the genus Bathyraja, where those in blue represent species assigned to the genus Rhinoraja (see text for details) Number atnodes represent bootstrap values, (only values greater than 50 are given).doi:10.1371/journal.pone.0028655.g005
DNA Barcoding of Argentine Fishes
PLoS ONE | www.plosone.org 7 December 2011 | Volume 6 | Issue 12 | e28655
The genus Bathyraja is represented in the southwestern Atlantic
by 10 species [55], eight of which are endemic on the Argentinean
continental shelf [34;38]. Compagno [56], based on osteological
characteristics of rostral cartilage, assigned some species, situated
in the genus Bathyraja by several authors [33,55,57,58] to Rhinoraja
Ishiyama. Analysis of COI sequences of ‘‘Bathyraja-like’’ species
from Argentina permitted the discrimination of all them.
However, species of the genus Bathyraja and those assigned to
the genus Rhinoraja were clustered together, mixed and not formed
two distinct groups (Figure 5). This result are not congruent to the
proposal of Compagno [56], but need to be clarified trough
molecular and taxonomic phylogenetic analysis that are beyond
the aim of this study.
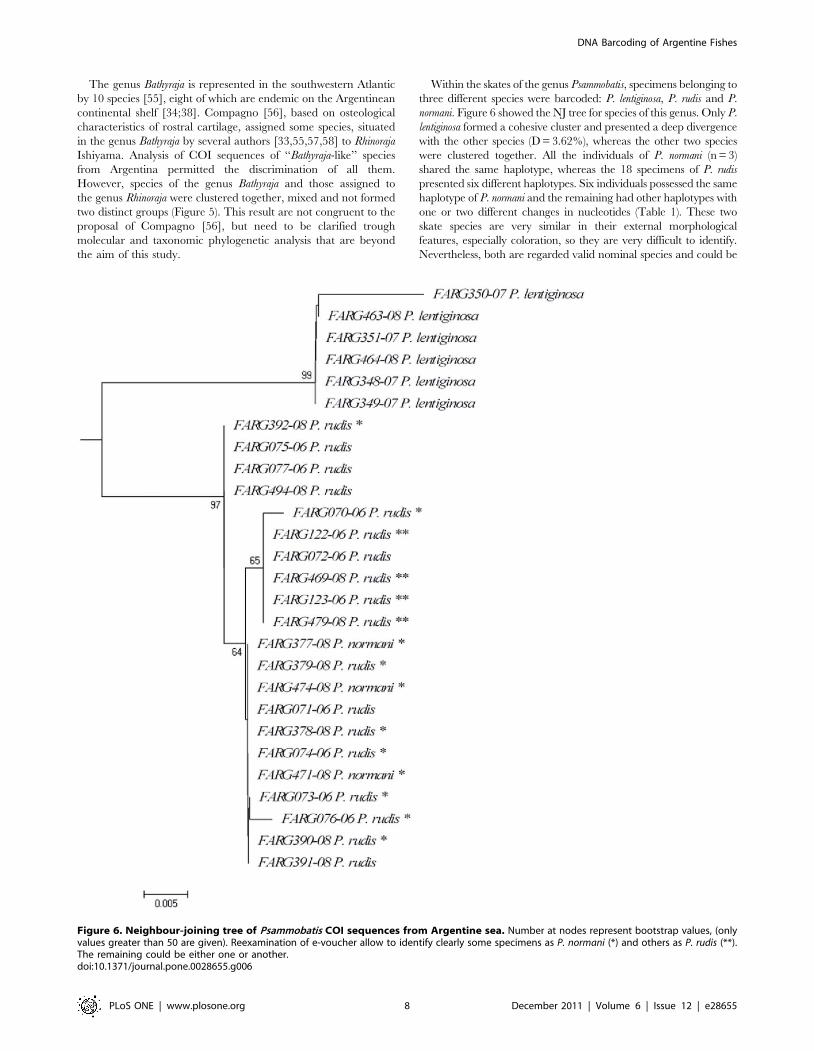
Within the skates of the genus Psammobatis, specimens belonging to
three different species were barcoded: P. lentiginosa, P. rudis and P.
normani. Figure 6 showed the NJ tree for species of this genus. Only P.
lentiginosa formed a cohesive cluster and presented a deep divergence
with the other species (D = 3.62%), whereas the other two species
were clustered together. All the individuals of P. normani (n = 3)
shared the same haplotype, whereas the 18 specimens of P. rudis
presented six different haplotypes. Six individuals possessed the same
haplotype of P. normani and the remaining had other haplotypes with
one or two different changes in nucleotides (Table 1). These two
skate species are very similar in their external morphological
features, especially coloration, so they are very difficult to identify.
Nevertheless, both are regarded valid nominal species and could be
Figure 6. Neighbour-joining tree of Psammobatis COI sequences from Argentine sea. Number at nodes represent bootstrap values, (onlyvalues greater than 50 are given). Reexamination of e-voucher allow to identify clearly some specimens as P. normani (*) and others as P. rudis (**).The remaining could be either one or another.doi:10.1371/journal.pone.0028655.g006
DNA Barcoding of Argentine Fishes
PLoS ONE | www.plosone.org 8 December 2011 | Volume 6 | Issue 12 | e28655
differentiated each other by skeletal structures, such as clasper,
neurocranium and scapulocoracoid [59], by egg cases produced by females
[60] and by pattern of spinulaton [59–60]. Reexamination of e-
vouchers made by the senior author, specialist in Psammobatis species,
who did not participate in the research cruises in which specimens of
Psammobatis were collected, allows to clearly identify some specimens
as P. normani and P. rudis (Figure 6), but unfortunately, neither of the
analyzed specimens were kept to reliable re-check the identification
of those in which photographs do not show sharply distinctive
features (i. e claspers, spinulation in tail etc).
The inability of barcoding to discriminate P. rudis and P. normani
could be a problem of mislabeling, misidentification or could
represent recent speciation. Very recently radiated species can not
be separated using COI and others more rapidly evolving markers
are required to identify these species [24].
Within the skates of the genus Amblyraja, some specimens appear
as Amblyraja sp. because they have different color pattern from the
typical A. doellojuradoi (Appendix S1). However, the analysis of COI
revealed a random grouping of individuals and the genetic
distance values are small enough to consider (conclude) that they
Figure 7. Neighbour-joining tree of COI sequences from species of the orders Pleuronectiformes and Ophidiiformes, and from thefamily Stromateidae (Perciformes). Solid triangles represent clusters of multiple specimens, with the vertical dimension proportional to thenumber of specimens, and the horizontal depth proportional to the genetic variation within that cluster. Green indicates taxa with deep intra-specificdivergence that represents distinct species. Red indicates taxa with deep intra-specific divergence that potentially represents distinct species orgenera (see text for details). Number at nodes represent bootstrap values, (only values greater than 50 are given).doi:10.1371/journal.pone.0028655.g007
DNA Barcoding of Argentine Fishes
PLoS ONE | www.plosone.org 9 December 2011 | Volume 6 | Issue 12 | e28655
are distinct species. Further morphological and molecular studies
are needed to corroborate the statement mentioned above.Actinopterygii. Figure 4 shows the neighbour-joining tree of
Nototheniid species barcoded. All specimens of Dissostichus
eleginoides and that of Patagonotothem tesselata formed cohesive units
and were separated from each other in the NJ tree. However,
within Patagonotothen ramsayi two clusters were observed. The first
group is composed by eight specimens with 0 to 0.46%
divergences, and the second group is composed by a single
individual. Genetic divergence between this specimen and those of
the first group ranged from 2.5 to 2.82%. The Family
Nototheniidae is very diverse in Argentine waters and within the
genus Patagonotothen 14 species have been recorded. Some of them
are very difficult to recognize. The divergence between the two
groups of P. ramsayi possibly represents a misidentification. Because
we only retained the e-voucher, in which no diagnostic distinctive
features are observed, we could not confirm the actual specimen
identification.
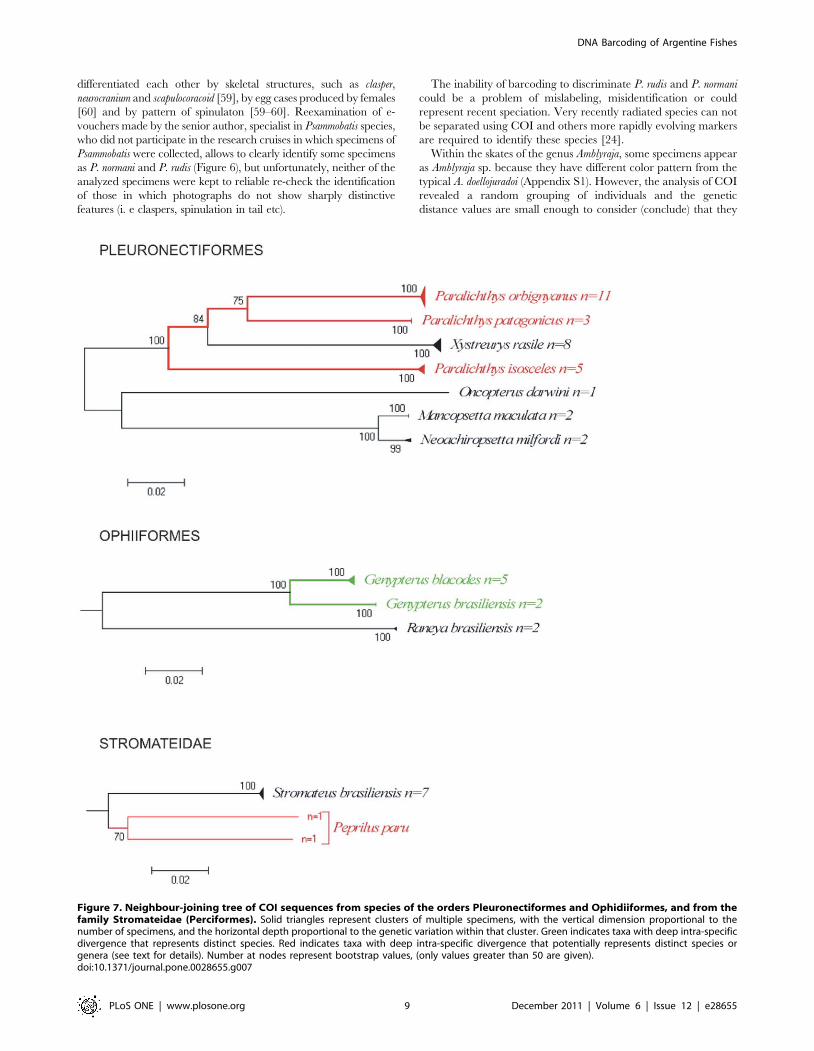
On the other hand, the use of barcode permitted the
recognition of flatfish species present in Argentine waters.
The NJ tree of Pleuronectiformes revealed deep divergences
between some species of the genus Paralichthys (Figure 7). Two of
them, P. orbignyanus and P. patagonicus, are cluster together;
whereas a third species (P. isosceles) formed a cohesive cluster
located far away from the other Paralichthys. Moreover, genetic
distance between these two groups is 16.2%, well above typical
‘‘within genera’’ values. Dıaz de Astarloa and Munroe (in
preparation) based on morphological features propose the
reassignment of P. isosceles into a new genus. Present results
on COI analysis are in accordance with them, but need to be
supported by performing phylogenetic analysis that is beyond
the aim of this study.
Figure 7 also shows the neighbour-joining tree obtained from
specimens of cusk eels from the SW Atlantic (Ophidiiformes). Each
of the two nominal species, the Brazilian cusk eel Genypterus
brasiliensis Regan, 1903 and the Pink cusk-eel G. blacodes (Forster,
1801) formed cohesive units and were separated from each other in
the NJ tree showing a genetic divergence of 5.8%, suggesting that
both should be regarded as two different species. Dıaz de Astarloa
and Figueroa [61], based on morphological and osteological
analysis, stated that the cusk eels Genypterus brasiliensis and G. blacodes
are different species. However in the FAO species catalogue
‘Ophidiiform fishes of the world’ [62] and in the Catalogue of Fishes
[63] Genypterus brasiliensis appears as a junior synonym of G. blacodes.
Present results based on analysis of COI showed a deep genetic
divergence between the two species. Thus, both morphological and
molecular approaches strongly support that Genypterus blacodes and G.
brasiliensis should be considered as valid species.
Finally, DNA barcode strongly suggest a likely second species of
American harvestfish different from Peprilus paru (Figure 7). The
kimura 2 parameter distance value was 12.83%, well above a
conspecific value. In order to avoid the possibility of a mislabeling
result, one individual (Peprilus paru FARG 563-09) was resampled
and two new individuals were sampled. Results corroborate
previous findings, so further morphological (e.g. meristics,
traditional/landmarks-based morphometry and osteology) and
molecular examination is needed to support this hypothesis.
Although some groups are highlighted for further taxonomic
analysis and several species remain to be barcoded, these results
support the utility of DNA barcodes for regional species
identification of fishes. When comparing these results to other
projects on BOLD, standardizing the application of names across
collections/regions emerges as a significant challenge for FISH-
BOL. However, we conclude this long-standing issue is most
efficiently addressed through DNA barcoding.
Supporting Information
Table S1 List and number of Argentinean fishesbarcoded, arranged by taxonomic category. Clasification
follows Nelson [64]. Collection sites: MdP coast, coast of Mar del
Plata city; SAO coast, coast of San Antonio Oeste; MCh lagoon,
Mar Chiquita coastal lagoon; 1, Off Buenos Aires province; 2,
Inner shelf of Patagonian waters; 3, outer shelf of Patagonian
waters. See Figure 1 for location in map. * Indicates species with
voucher specimens deposited.
(PDF)
Table S2 Details of species and specimens. BOLD
specimen numbers given, along with GenBank accession numbers,
geographic locality and voucher details.
(PDF)
Appendix S1 Neighbour-joining tree of 577 COI se-quences from the 125 fish species sampled as obtainedin BOLD, using K2P distances.
(PDF)
Acknowledgments
The authors wish to thank the Universidad Nacional de Mar del Plata and
the Instituto Nacional de Investigacion y Desarrollo Pesquero for giving
logistical assistance for the sampling collection in Mar Chiquita coastal
lagoon and onboard respectively. The authors would like to thank: Julio
Mangiarotti and Monica Iza (forest guard of Mar Chiquita Biosphere
Reserve) and Town Hall Mar Chiquita authorities. We also would like to
thank the following people for their valuable help during the present
survey: Matıas Delpiani, Lorena Scenna, Gabriela Blasina and Daniel
Bruno. Finally we would like to thank Vincent Laudet the Academic Editor
and two anonymous reviewers for offering helpful comments that improved
the earlier drafts of the manuscript.
Author Contributions
Conceived and designed the experiments: EM JMDdA MGC RH.
Performed the experiments: EM JMDdA MGC RH JZ. Analyzed the
data: EM JMDdA MGC RH JZ. Contributed reagents/materials/analysis
tools: RH JZ. Wrote the paper: EM JMDdA MGC RH JZ.
References
1. Teletchea F (2010) After 7 years and 1000 citations: Comparative assessment of
the DNA barcoding and the DNA taxonomy proposals for taxonomists and non-
taxonomists. Mitochondrial DNA 21: 206–226.
2. Hebert PDN, Cywinska A, Ball SL, deWaard JR (2003a) Biological
identification through DNA barcodes. Proceedings of the Royal Society of
London, Series B: Biological Sciences 270: 313–321.
3. Hebert PDN, Ratnasingham S, deWaard JR (2003b) Barcoding animal life: cyto-
chrome c oxidase subunit 1 divergences among closely related species. Proceedings of
the Royal Society of London, Series B: Biological Sciences (Suppl 1) 270: 96–99.
4. Hajibabaei M, Singer GAC, Hebert PDN, Hickey DA (2007) DNA barcoding:
how it complements taxonomy, molecular phylogenetics and population
genetics. Trends in Genetics 23: 167–172.
5. Hubert N, Hanner R, Holm E, Mandrak NE, Taylor E, et al. (2008) Identifying
Canadian freshwater fishes through DNA barcodes. PloS ONE 3: e2490.
6. Ebach MC, Holdredge C (2005) DNA barcoding is no subsitute for taxonomy.
Nature 434: 697.
7. Golding GB, Hanner R, Hebert PDN (2009) Preface. Molecular Ecology
Resources 9(Suppl. 1): iv–vi.
DNA Barcoding of Argentine Fishes
PLoS ONE | www.plosone.org 10 December 2011 | Volume 6 | Issue 12 | e28655
8. Hogg ID, Hebert PDN (2004) Biological identification of springtails (Collem-
bola: Hexapoda) from the Canadian Arctic, using mitochondrial DNA barcodes.Canadian Journal Zoology 82: 749–754.
9. Barrett RDH, Hebert PDN (2005) Identifying spiders through DNA barcodes.
Canadian Journal of Zoology 83: 481–491.10. Janzen DH, Hajibabaei M, Burns JM (2005) Wedding biodiversity inventory of a
large and complex Lepidoptera fauna with DNA barcoding. PhilosophicalTransactions of the Royal Society of London Series B Biological Sciences 1462:
1835–1846.
11. Hajibabaei M, Janzen DH, Burns JM, Hallwachs W, Hebert PDN (2006) DNAbarcodes distinguish species of tropical Lepidoptera. Proceedings of the National
Academy of Sciences of the United Sates of America, 103: 968–971.12. Lukhtanov VA, Sourakov A, Zakharov EV, Hebert PDN (2009) DNA barcoding
Central Asian butterflies: increasing geographical dimension does not signifi-cantly reduce the success of species identification. Molecular Ecology Resources
9: 1302–1310.
13. Smith MA, Wood DM, Janzen DH, Hallwachs W, Hebert PDN (2007) DNAbarcodes affirm that 16 species of apparently generalist tropical parasitoid flies
(Diptera, Tachinidae) are not all generalists. Proceedings of the NationalAcademy of Sciences of the United Sates of America 104: 4967–4972.
14. Jarnegren J, Schander C, Sneli JA, Ronningen V, Young CM (2007) Four genes,
morphology and ecology: distinguishing a new species of Acesta (Mollusca;Bivalvia) from the Gulf of Mexico. Marine Biology 152: 43–55.
15. Ward RD, Zemlak TS, Innes BH, Last PR, Hebert PDN (2005) DNA barcodingAustralia’s fish species. Philosophical Transactions of the Royal Society B 360:
1847–1857.16. Hebert PDN, Stoeckle MY, Zemlak TS, Francis CM (2004) Identification of
birds through DNA barcodes. PLoS Biology 2: 1657–1663.
17. Kerr KCR, Lijtmaer DA, Barreira AS, Hebert PDN, Tubaro PL (2009) Probingevolutionary patterns in neotropical birds through DNA barcodes. PloS ONE 4:
e4379.18. Clare EL, Lim BK, Engstrom MD, Eger JL, Hebert PDN (2007) DNA
barcoding of Neotropical bats: species identification and discovery within
Guyana. Molecular Ecology Notes 7: 184–190.19. Amaral AR, Sequeira M, Coelho MM (2007) A first approach to the usefulness
of cytochrome c oxidase I barcodes in the identification of closely relateddelphinid cetacean species. Marine and Freshwater Research 58: 505–510.
20. Borisenko AB, Lim BK, Ivanova NV, Hanner RH, Hebert PDN (2008) DNAbarcoding in surveys of small mammal communities: a field study in Suriname.
Molecular Ecology Resources 8: 471–479.
21. Hollingsworth PM, Forrest LL, Spouge JL, Hajibabaei M, Ratnasingham S,et al. (2009) A DNA barcode for land plants. Proceedings of the National
Academy of Science of the United Sates of America 106: 12794–12797.22. Saunders GW (2005) Applying DNA barcoding to red macroalgae: a
preliminary appraisal holds promise for future applications. Philosophical
Transactions of the Royal Society of London Series B Biological Sciences 360:1879–1888.
23. Sogin ML, Morrison HG, Huber JA, Welch DM, Huse SM, et al. (2006)Microbial diversity in the deep sea and the underexplored ‘rare biosphere’.
Proceedings of the National Academy of Sciences USA 103: 12115–12120.24. Ward RD, Hanner R, Hebert PDN (2009) The campaign to DNA barcode all
fishes, FISH-BOL. Journal of Fish Biology 74: 329–356.
25. Steinke D, Hanner R (2010) The FISH-BOL collaborators’ protocol.Mitochondrial DNA 21(S2): 1–5.
26. Ward RD, Holmes BH, White WT, Last PR (2008) DNA barcodingAustralasian chondrichthyans: results and potential uses in conservation. Marine
and Freshwater Research 59: 57–71.
27. Steinke D, Zemlak TS, Boutillier JA, Hebert PDN (2009) DNA barcoding ofPacific Canada’s fishes. Marine Biology 156: 2641–2647.
28. Ward RD, Holmes BH (2007) An analysis of nucleotide and amino acidvariability in the barcode region of cytochrome c oxidase I (cox1) in fishes.
Molecular Ecology Notes 7: 899–907.
29. Pegg GG, Sinclair B, Briskey L, Aspden WJ (2006) MtDNA barcodeidentification of fish larvae in the southern Great Barrier Reef, Australia.
Scientia Marina 70: 7–12.30. Victor BC (2007) Coryphopterus kuna, a new goby (Perciformes: Gobiidae:
Gobiinae) from the western Caribbean, with the identification of the late larvalstage and an estimate of the pelagic larval duration. Zootaxa 1526: 51–61.
31. Webb KE, Barnes DKA, Clark MS, Bowden DA (2006) DNA barcoding: a
molecular tool to identify Antarctic marine larvae. Deep-Sea Research Part II-Topical Studies in Oceanography 53(8–10): 1053–1060.
32. Norman JR (1937) Coast fishes, part II. The Patagonian region. DiscoveryReports 16: 1–150.
33. Menni RC, Ringuelet RA, Aramburu RH (1984) Peces marinos de la Argentina
y Uruguay. Resena historica. Clave de familias, generos y especies. Catalogocrıtico. Editorial Hemisferio Sur, Buenos Aires. 359 p.
34. Menni RC, Stehmann MFW (2000) Distribution, environment and biology ofbatoid fishes off Argentina, Uruguay and Brazil. A review. Revista del Museo
Argentino de Ciencias Naturales, n.s. 2: 69–109.35. Cousseau MB, Gosztonyi AE, Elıas I, Re ME (2004) Estado actual del
conocimiento de los peces de la plataforma continental argentina y adyacencias.
In: Sanchez RP, Bezzi SI, eds. El mar argentino y sus recursos pesqueros Tomo4. Los peces marinos de interes pesquero. Caracterizacion biologica y evaluacion
del estado de explotacion INIDEP. pp 17–38.
36. Cousseau MB, Figueroa E, Dıaz de Astarloa JM, Mabragana E, Lucifora LO
(2007) Rayas, chuchos y otros batoideos del Atlantico Sudoccidental (34uS–55uS). Publicaciones Especiales INIDEP Mar del Plata. 104 p.
37. Garcıa ML, Morgan CC (2002) Poromitra crassiceps (Teleostei, Melamphaidae)
associated with the 500 fathoms fauna off Argentina. Journal of AppliedIchthyology 18: 216–218.
38. Dıaz de Astarloa JM, Mabragana E (2004) Bathyraja cousseauae sp. n.: A NewSoftnose Skate from the Southwestern Atlantic (Rajiformes, Rajidae). Copeia 2:
326–335.
39. Wohler OC, Scarlato N (2006) Occurrence of orange roughy, Hoplostethus
atlanticus (Trachichthyidae) off Argentina. Cybium 30: 285–286.
40. Dıaz de Astarloa JM, Mabragana E, Hanner R, Figueroa DE (2008)Morphological and molecular evidence for a new species of longnose skate
(Rajiformes: Rajidae: Dipturus) from Argentinean waters based on DNAbarcoding. Zootaxa 1921: 35–46.
41. Menni RC, Rincon G, Garcıa ML (2008) Discopyge castelloi sp. nov. (Torpedini-
formes, Narcinidae), una nueva especie de raya electrica del Mar Argentino.Revista del Museo Argentino de Ciencias Naturales, n. s. 10(1): 161–171.
42. Solari A, Garcia ML, Jaureguizar JA (2010) First record of Eucinostomus
melanopterus, Bleeker 1863 (Perciformes, Gerreidae) from the Rıo de la Plata
Estuary. Journal of Applied Ichthyology 26: 137–139.
43. Menni RC, Freıs RA, Lucıfora LO (2007) Condrictios de la Argentina yUruguay. Lista de Trabajo. ProBiota Serie Tecnica-Didactica, La Plata,
Argentina 11: 1–15.44. Ratnasingham S, Hebert PDN (2007) BOLD: the Barcode of Life Data System
(www.barcodinglife.org). Molecular Ecology Notes 7: 355–364.45. Ivanova NV, deWaard JR, Hebert PDN (2006) An inexpensive, automation-
friendly protocol for recovering high-quality DNA. Molecular Ecology Notes 6:
998–1002.46. Ivanova NV, Zemlak TS, Hanner RH, Hebert PDN (2007) Universal primer
cocktails for fish DNA barcoding. Molecular Ecology Notes 7: 544–548.47. Kimura M (1980) A simple method for estimating evolutionary rate of base
substitutions through comparative studies of nucleotide sequences. Journal
Molecular Evolution 16: 111–120.48. Tamura K, Dudley J, Nei M, Kumar S (2007) MEGA4: Molecular Evolutionary
Genetics Analysis (MEGA) software version 4.0. Molecular Biology andEvolution 24: 1596–1599.
49. Zhang DX, Hewitt GM (1996) Nuclear integrations: challenge for mitochondriaDNA markers. Trends in Ecology and Evolution 11: 247–251.
50. Nakamura I, Inada T, Takeda M, Hatanaka H (1986) Important fishes trawled
off Patagonia. Japan Marine Fishery Resource Research Center, Tokyo. 369 p.51. Gon O, Heemstra PC (1990) Fishes of the Southern Ocean. Grahamstown
J.L.B. Smith Institute of Ichthyology, South Africa. 462 p.52. Ward RD (2009) DNA barcode divergence among species and genera of birds and
fishes. Molecular Ecology Resources;doi: 10.1111/j.1755-0998.2009.02541.x.
53. Yearsley GK, Last P, Gleghill DC (2003) Bony fishes. In: Yearsley GK, Last P &Ward, RD Eds. Australian Seafood. CSIRO Marine Research & Development
Corporation, Australia. pp 44–142.54. Spies IB, Gaichas S, Stevenson DE, Orr JW, Canino MF (2006) DNA based
identification of Alaska skates (Amblyraja, Bathyraja and Raja: Rajidae) usingcytochrome c oxidase subunit I (COI) variation. Journal of Fish Biology (Suppl.
B) 69: 283–292.
55. Stehmann MFW (1986) Notes on the systematics of the rajids genus Bathyrajaand its distribution in the world ocean. In: T. Uyeno T, Arai R, Taniuchi T,
Matsuura K, eds. Indo-Pacific fish biology: proceedings of the secondinternational conference on Indo-Pacific fishes, Ichthyological Society of Japan,
Tokyo. pp 261–268.
56. Compagno LJ (1999) Checklist of living Elasmobranchs. In: Hamlet WC, ed.Sharks, skates, and rays. The biology of Elasmobranch Fishes John Hopkins
University Press. 515 p.57. McEachran JD, Dunn KA (1998) Phylogenetic analusis of skates, a
morphologically conservative clade of elasmobranches (Chondrichthyes: Raji-
dae). Copeia 2: 271–290.58. McEachran JD, Aschliman N (2004) Phylogeny of Batoidea. In: Carrier JC,
Musick JA, Heithaus MR, eds. Biology of Sharks and their Relatives, CRCPress, Boca Raton, EE.UU. pp 79–113.
59. McEachran JD (1983) Results of the research cruises of FRV ‘‘Walther Herwig’’to South America LXI. Revision of the South American skate genus Psammobatis
Gunther, 1870. (Elasmobranchii, Rajiformes, Rajidae). Archiv fur Fischeriwis-
senschaf Bundesforschungsanstalt fur Fischerie 34: 23–80.60. Mabragana E (2007) Las rayas del genero Psammobatis de la Plataforma
Argentina: Biologıa y Ecologıa. Ph.D. thesis. Universidad Nacional de Mar delPlata, Mar del Plata, Argentina.
61. Dıaz de Astarloa JM, Figueroa D (1993) Las especies del genero Genypterus
(Pisces, Ophidiiformes) presentes en aguas argentinas. Universidad Catolica delNorte, Facultad de Ciencias del Mar, Serie Ocasional 2: 47–56.
62. Nielsen JG, Cohen DM (1999) Ophidiiform fishes of the world (OrderOphidiiformes). An annotated and illustrated catalogue of pearlfishes, cusk-eels,
brotulas and other ophidiiform fishes known to date. FAO species catalogue.FAO Fisheries Synopsis 125: 18 Rome. 178 p.
63. Eschmeyer WN, ed. Catalog of Fishes electronic version (19 February 2010).
http://research.calacademy.org/ichthyology/catalog/fishcatmain.asp.64. Nelson JS (2006) Fishes of the world, 4th edition. John Wiley & Sons, Inc., New
Jersey. 601 p.
DNA Barcoding of Argentine Fishes
PLoS ONE | www.plosone.org 11 December 2011 | Volume 6 | Issue 12 | e28655
Related Documents