DNA Barcode Detects High Genetic Structure within Neotropical Bird Species Erika Sendra Tavares 1 *, Priscila Gonc ¸alves 2 , Cristina Yumi Miyaki 2 , Allan J. Baker 1,3 1 Department of Natural History, Royal Ontario Museum, Toronto, Ontario, Canada, 2 Departamento de Gene ´ tica e Biologia Evolutiva, Instituto de Biocie ˆ ncias, Universidade de Sa ˜o Paulo, Sa ˜o Paulo, Sa ˜ o Paulo, Brazil, 3 Department of Zoology, University of Toronto, Toronto, Ontario, Canada Abstract Background: Towards lower latitudes the number of recognized species is not only higher, but also phylogeographic subdivision within species is more pronounced. Moreover, new genetically isolated populations are often described in recent phylogenies of Neotropical birds suggesting that the number of species in the region is underestimated. Previous COI barcoding of Argentinean bird species showed more complex patterns of regional divergence in the Neotropical than in the North American avifauna. Methods and Findings: Here we analyzed 1,431 samples from 561 different species to extend the Neotropical bird barcode survey to lower latitudes, and detected even higher geographic structure within species than reported previously. About 93% (520) of the species were identified correctly from their DNA barcodes. The remaining 41 species were not monophyletic in their COI sequences because they shared barcode sequences with closely related species (N = 21) or contained very divergent clusters suggestive of putative new species embedded within the gene tree (N = 20). Deep intraspecific divergences overlapping with among-species differences were detected in 48 species, often with samples from large geographic areas and several including multiple subspecies. This strong population genetic structure often coincided with breaks between different ecoregions or areas of endemism. Conclusions: The taxonomic uncertainty associated with the high incidence of non-monophyletic species and discovery of putative species obscures studies of historical patterns of species diversification in the Neotropical region. We showed that COI barcodes are a valuable tool to indicate which taxa would benefit from more extensive taxonomic revisions with multilocus approaches. Moreover, our results support hypotheses that the megadiversity of birds in the region is associated with multiple geographic processes starting well before the Quaternary and extending to more recent geological periods. Citation: Tavares ES, Gonc ¸alves P, Miyaki CY, Baker AJ (2011) DNA Barcode Detects High Genetic Structure within Neotropical Bird Species. PLoS ONE 6(12): e28543. doi:10.1371/journal.pone.0028543 Editor: Bernd Schierwater, University of Veterinary Medicine Hanover, Germany Received June 22, 2011; Accepted November 10, 2011; Published December 7, 2011 Copyright: ß 2011 Tavares et al. This is an open-access article distributed under the terms of the Creative Commons Attribution License, which permits unrestricted use, distribution, and reproduction in any medium, provided the original author and source are credited. Funding: This work was supported by funding through the Canadian Barcode of Life Network from Genome Canada through the Ontario Genomics Institute, Natural Sciences and Engineering Research Council of Canada (NSERC), and other sponsors, the ROM Governors’ Fund, Fundac ¸a ˜o de Amparo a ` Pesquisa do Estado de Sa ˜ o Paulo (FAPESP), Coordenac ¸a ˜o de Aperfeic ¸oamento de Pessoal de nı ´vel Superior (CAPES) and Conselho Nacional de Pesquisa (CNPq). The funders of this research had no role in study design, data collection and analysis, decision to publish, or preparation of the manuscript. Competing Interests: The authors have declared that no competing interests exist. * E-mail: [email protected] Introduction One of the striking patterns in geographic distribution of terrestrial biodiversity is the increase in species richness towards lower latitudes in several groups of organisms, including birds. The possible causes for this pattern is one of the highly debated topics in ecology and evolution, even though no definitive conclusion was yet been achieved [1,2,3,4]. The Neotropical area alone holds a third of the recognized extant bird species (about 3,300 out of 10,000) [5], with a biodiversity hotspot in the tropical forests [6]. Moreover, recent phylogenies suggest the number of species in the area is underestimated because reproductively isolated lineages are frequently described in these studies [7,8,9,10,11]. In stark contrast to bird taxonomy in temperate zones, genetic evidence for species limits in the Neotropics is often discordant with traditional taxonomy due to the high incidence of species complexes. These complexes commonly feature gradual variation in morphological and behavioural characters, masking the occurrence of similar species that can be uncovered with genetic analyses [11,12,13,14,15]. DNA barcodes based on the 59 portion of the cytochrome oxidase I gene (COI) linked with specimens vouchers and locality information provides a rapid and inexpensive method to identify species and detect ‘provisional new species’ [16]. Pilot DNA barcode surveys in birds of North America, sister-species pairs, and birds of Korea were successful in either identifying recognized species of birds, and detecting some potential new species, except for a minor proportion of cases where species are very recently diverged or hybridize [17,18,19,20]. Critics questioned if the success observed in North American birds could be extrapolated to the tropics [21], where species clearly exhibit a higher level of phylogeographic subdivision [22]. However, DNA barcoding has subsequently proved to be highly successful in identifying Neotropical species of birds; all 16 species (100%) of antbirds (Thamnophilidae) that were barcoded [23] and 494 of 500 (95.8%) species of birds of Argentina [24] had distinguishable COI PLoS ONE | www.plosone.org 1 December 2011 | Volume 6 | Issue 12 | e28543

Welcome message from author
This document is posted to help you gain knowledge. Please leave a comment to let me know what you think about it! Share it to your friends and learn new things together.
Transcript
DNA Barcode Detects High Genetic Structure withinNeotropical Bird SpeciesErika Sendra Tavares1*, Priscila Goncalves2, Cristina Yumi Miyaki2, Allan J. Baker1,3
1 Department of Natural History, Royal Ontario Museum, Toronto, Ontario, Canada, 2 Departamento de Genetica e Biologia Evolutiva, Instituto de Biociencias,
Universidade de Sao Paulo, Sao Paulo, Sao Paulo, Brazil, 3 Department of Zoology, University of Toronto, Toronto, Ontario, Canada
Abstract
Background: Towards lower latitudes the number of recognized species is not only higher, but also phylogeographicsubdivision within species is more pronounced. Moreover, new genetically isolated populations are often described inrecent phylogenies of Neotropical birds suggesting that the number of species in the region is underestimated. PreviousCOI barcoding of Argentinean bird species showed more complex patterns of regional divergence in the Neotropical than inthe North American avifauna.
Methods and Findings: Here we analyzed 1,431 samples from 561 different species to extend the Neotropical bird barcodesurvey to lower latitudes, and detected even higher geographic structure within species than reported previously. About93% (520) of the species were identified correctly from their DNA barcodes. The remaining 41 species were notmonophyletic in their COI sequences because they shared barcode sequences with closely related species (N = 21) orcontained very divergent clusters suggestive of putative new species embedded within the gene tree (N = 20). Deepintraspecific divergences overlapping with among-species differences were detected in 48 species, often with samples fromlarge geographic areas and several including multiple subspecies. This strong population genetic structure often coincidedwith breaks between different ecoregions or areas of endemism.
Conclusions: The taxonomic uncertainty associated with the high incidence of non-monophyletic species and discovery ofputative species obscures studies of historical patterns of species diversification in the Neotropical region. We showed thatCOI barcodes are a valuable tool to indicate which taxa would benefit from more extensive taxonomic revisions withmultilocus approaches. Moreover, our results support hypotheses that the megadiversity of birds in the region is associatedwith multiple geographic processes starting well before the Quaternary and extending to more recent geological periods.
Citation: Tavares ES, Goncalves P, Miyaki CY, Baker AJ (2011) DNA Barcode Detects High Genetic Structure within Neotropical Bird Species. PLoS ONE 6(12):e28543. doi:10.1371/journal.pone.0028543
Editor: Bernd Schierwater, University of Veterinary Medicine Hanover, Germany
Received June 22, 2011; Accepted November 10, 2011; Published December 7, 2011
Copyright: � 2011 Tavares et al. This is an open-access article distributed under the terms of the Creative Commons Attribution License, which permitsunrestricted use, distribution, and reproduction in any medium, provided the original author and source are credited.
Funding: This work was supported by funding through the Canadian Barcode of Life Network from Genome Canada through the Ontario Genomics Institute,Natural Sciences and Engineering Research Council of Canada (NSERC), and other sponsors, the ROM Governors’ Fund, Fundacao de Amparo a Pesquisa do Estadode Sao Paulo (FAPESP), Coordenacao de Aperfeicoamento de Pessoal de nıvel Superior (CAPES) and Conselho Nacional de Pesquisa (CNPq). The funders of thisresearch had no role in study design, data collection and analysis, decision to publish, or preparation of the manuscript.
Competing Interests: The authors have declared that no competing interests exist.
* E-mail: [email protected]
Introduction
One of the striking patterns in geographic distribution of
terrestrial biodiversity is the increase in species richness towards
lower latitudes in several groups of organisms, including birds. The
possible causes for this pattern is one of the highly debated topics
in ecology and evolution, even though no definitive conclusion was
yet been achieved [1,2,3,4]. The Neotropical area alone holds a
third of the recognized extant bird species (about 3,300 out of
10,000) [5], with a biodiversity hotspot in the tropical forests [6].
Moreover, recent phylogenies suggest the number of species in the
area is underestimated because reproductively isolated lineages are
frequently described in these studies [7,8,9,10,11]. In stark
contrast to bird taxonomy in temperate zones, genetic evidence
for species limits in the Neotropics is often discordant with
traditional taxonomy due to the high incidence of species
complexes. These complexes commonly feature gradual variation
in morphological and behavioural characters, masking the
occurrence of similar species that can be uncovered with genetic
analyses [11,12,13,14,15].
DNA barcodes based on the 59 portion of the cytochrome
oxidase I gene (COI) linked with specimens vouchers and locality
information provides a rapid and inexpensive method to identify
species and detect ‘provisional new species’ [16]. Pilot DNA
barcode surveys in birds of North America, sister-species pairs,
and birds of Korea were successful in either identifying recognized
species of birds, and detecting some potential new species, except
for a minor proportion of cases where species are very recently
diverged or hybridize [17,18,19,20]. Critics questioned if the
success observed in North American birds could be extrapolated to
the tropics [21], where species clearly exhibit a higher level of
phylogeographic subdivision [22]. However, DNA barcoding has
subsequently proved to be highly successful in identifying
Neotropical species of birds; all 16 species (100%) of antbirds
(Thamnophilidae) that were barcoded [23] and 494 of 500
(95.8%) species of birds of Argentina [24] had distinguishable COI
PLoS ONE | www.plosone.org 1 December 2011 | Volume 6 | Issue 12 | e28543
signatures. The screening of Argentinean birds also detected 21
species with deep intraspecific structure, and revealed more
complex patterns of regional divergence in the Neotropical than in
the North American avifauna [24]. Even though more species will
doubtlessly be shown to share barcodes when complete coverage
of species and genera is available, it is clear that large-scale
sequencing of COI associated with vouchered specimens and
locality information is a valuable tool in understanding genetic
differentiation within and among species of birds [17,21,24,25].
In this study we increased the coverage of Neotropical bird
species that have been barcoded by adding 637 samples from 431
species, with higher representation in tropical forest areas of Brazil
and Guyana, but also including samples from localities ranging
from Mexico to Argentina and Chile. We compared these
sequences with previously published sequences of congeneric
species of Neotropical birds, totaling 1,431 samples from 561
different species of birds, 296 of which were represented by
multiple individuals. We showed that a high success rate in species
identification (93%) with DNA barcodes can be achieved in this
large sample of avian biodiversity from the mega-diverse
Neotropical region similar to that obtained in broad geographic
surveys in the Nearctic and Palearctic regions of the world.
Additionally, a higher percentage (12%) of species had multiple
deep phylogeographic splits than in previous surveys, some of
which are likely reproductively isolated lineages.
Results
Species identification in Neotropical birdsAbout 93% of the species in our sample (520 out of 561) did not
share sequences with any other species included in the analysis,
and when multiple individuals were sampled (296 species), mean
genetic distances among individuals were lower than to the closest
species from the same genus (File S1, Table S1). Kimura 2-
Parameter genetic distances (K2P) within-species had a wide range
(0 up to 13.7%), with more than 75% of the observations below
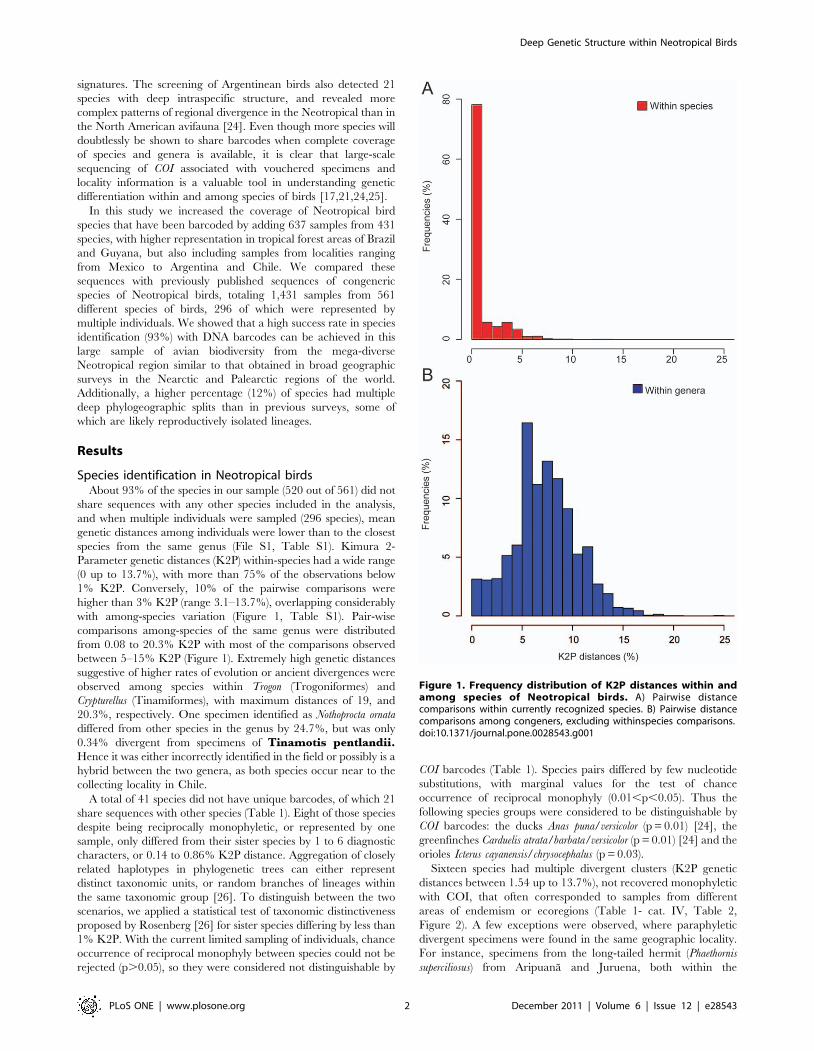
1% K2P. Conversely, 10% of the pairwise comparisons were
higher than 3% K2P (range 3.1–13.7%), overlapping considerably
with among-species variation (Figure 1, Table S1). Pair-wise
comparisons among-species of the same genus were distributed
from 0.08 to 20.3% K2P with most of the comparisons observed
between 5–15% K2P (Figure 1). Extremely high genetic distances
suggestive of higher rates of evolution or ancient divergences were
observed among species within Trogon (Trogoniformes) and
Crypturellus (Tinamiformes), with maximum distances of 19, and
20.3%, respectively. One specimen identified as Nothoprocta ornata
differed from other species in the genus by 24.7%, but was only
0.34% divergent from specimens of Tinamotis pentlandii.Hence it was either incorrectly identified in the field or possibly is a
hybrid between the two genera, as both species occur near to the
collecting locality in Chile.
A total of 41 species did not have unique barcodes, of which 21
share sequences with other species (Table 1). Eight of those species
despite being reciprocally monophyletic, or represented by one
sample, only differed from their sister species by 1 to 6 diagnostic
characters, or 0.14 to 0.86% K2P distance. Aggregation of closely
related haplotypes in phylogenetic trees can either represent
distinct taxonomic units, or random branches of lineages within
the same taxonomic group [26]. To distinguish between the two
scenarios, we applied a statistical test of taxonomic distinctiveness
proposed by Rosenberg [26] for sister species differing by less than
1% K2P. With the current limited sampling of individuals, chance
occurrence of reciprocal monophyly between species could not be
rejected (p.0.05), so they were considered not distinguishable by
COI barcodes (Table 1). Species pairs differed by few nucleotide
substitutions, with marginal values for the test of chance
occurrence of reciprocal monophyly (0.01,p,0.05). Thus the
following species groups were considered to be distinguishable by
COI barcodes: the ducks Anas puna/versicolor (p = 0.01) [24], the
greenfinches Carduelis atrata/barbata/versicolor (p = 0.01) [24] and the
orioles Icterus cayanensis/chrysocephalus (p = 0.03).
Sixteen species had multiple divergent clusters (K2P genetic
distances between 1.54 up to 13.7%), not recovered monophyletic
with COI, that often corresponded to samples from different
areas of endemism or ecoregions (Table 1- cat. IV, Table 2,
Figure 2). A few exceptions were observed, where paraphyletic
divergent specimens were found in the same geographic locality.
For instance, specimens from the long-tailed hermit (Phaethornis
superciliosus) from Aripuana and Juruena, both within the
Figure 1. Frequency distribution of K2P distances within andamong species of Neotropical birds. A) Pairwise distancecomparisons within currently recognized species. B) Pairwise distancecomparisons among congeners, excluding withinspecies comparisons.doi:10.1371/journal.pone.0028543.g001
Deep Genetic Structure within Neotropical Birds
PLoS ONE | www.plosone.org 2 December 2011 | Volume 6 | Issue 12 | e28543
Rondonian area of endemism, were 8% divergent, and the
specimen from Juruena differed from a scale-throated hermit (P.
eurynome) from Southern Atlantic forest by 7.4%. Even more
strikingly, two samples of the yellow-margined flycatcher
(Tolmomyias assimilis) from Napo were 8.3% divergent. The
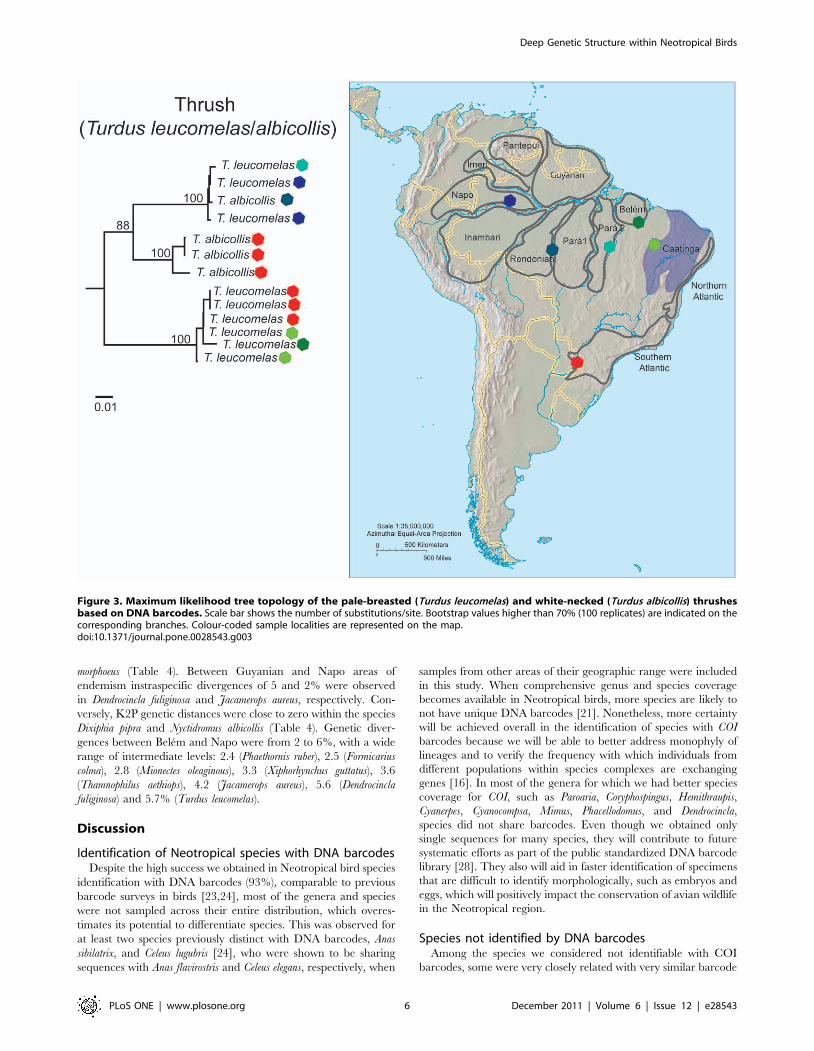
species pair of thrushes Turdus albicollis/leucomelas were para-
phyletic in their COI sequences, sharing barcodes in their
Amazonian distribution (Figure 3).
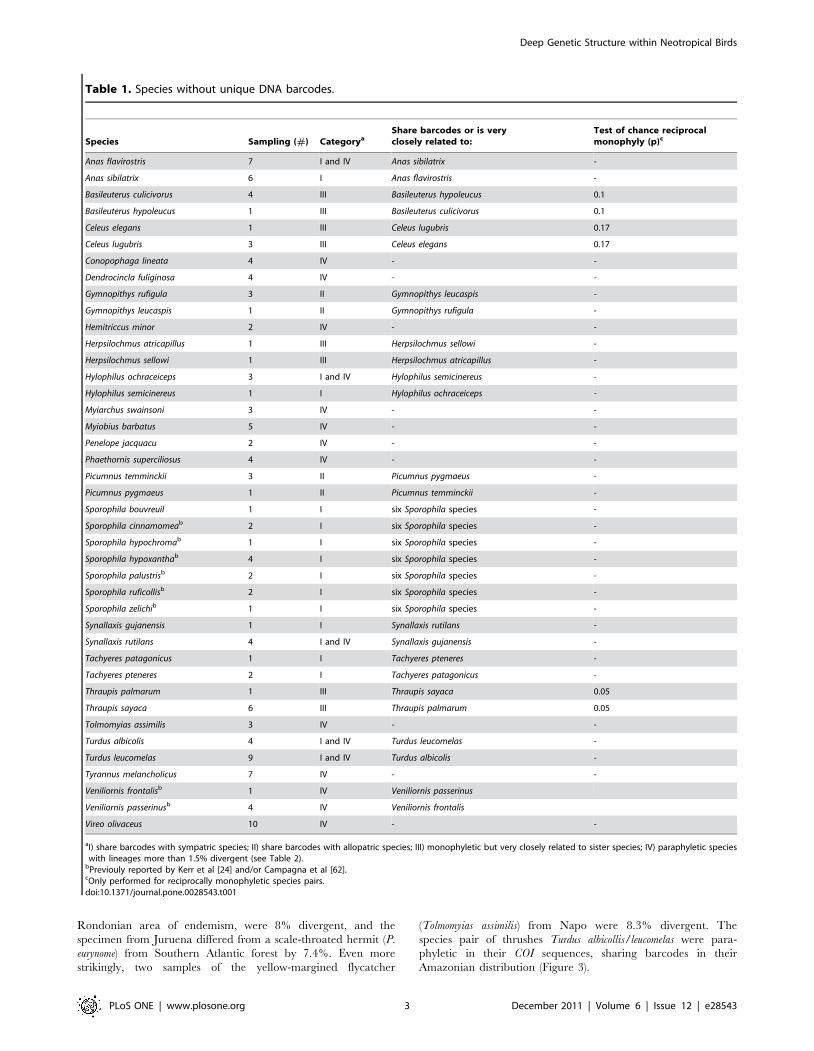
Table 1. Species without unique DNA barcodes.
Species Sampling (#) CategoryaShare barcodes or is veryclosely related to:
Test of chance reciprocalmonophyly (p)c
Anas flavirostris 7 I and IV Anas sibilatrix -
Anas sibilatrix 6 I Anas flavirostris -
Basileuterus culicivorus 4 III Basileuterus hypoleucus 0.1
Basileuterus hypoleucus 1 III Basileuterus culicivorus 0.1
Celeus elegans 1 III Celeus lugubris 0.17
Celeus lugubris 3 III Celeus elegans 0.17
Conopophaga lineata 4 IV - -
Dendrocincla fuliginosa 4 IV - -
Gymnopithys rufigula 3 II Gymnopithys leucaspis -
Gymnopithys leucaspis 1 II Gymnopithys rufigula -
Hemitriccus minor 2 IV - -
Herpsilochmus atricapillus 1 III Herpsilochmus sellowi -
Herpsilochmus sellowi 1 III Herpsilochmus atricapillus -
Hylophilus ochraceiceps 3 I and IV Hylophilus semicinereus -
Hylophilus semicinereus 1 I Hylophilus ochraceiceps -
Myiarchus swainsoni 3 IV - -
Myiobius barbatus 5 IV - -
Penelope jacquacu 2 IV - -
Phaethornis superciliosus 4 IV - -
Picumnus temminckii 3 II Picumnus pygmaeus -
Picumnus pygmaeus 1 II Picumnus temminckii -
Sporophila bouvreuil 1 I six Sporophila species -
Sporophila cinnamomeab 2 I six Sporophila species -
Sporophila hypochromab 1 I six Sporophila species -
Sporophila hypoxanthab 4 I six Sporophila species -
Sporophila palustrisb 2 I six Sporophila species -
Sporophila ruficollisb 2 I six Sporophila species -
Sporophila zelichib 1 I six Sporophila species -
Synallaxis gujanensis 1 I Synallaxis rutilans -
Synallaxis rutilans 4 I and IV Synallaxis gujanensis -
Tachyeres patagonicus 1 I Tachyeres pteneres -
Tachyeres pteneres 2 I Tachyeres patagonicus -
Thraupis palmarum 1 III Thraupis sayaca 0.05
Thraupis sayaca 6 III Thraupis palmarum 0.05
Tolmomyias assimilis 3 IV - -
Turdus albicolis 4 I and IV Turdus leucomelas -
Turdus leucomelas 9 I and IV Turdus albicolis -
Tyrannus melancholicus 7 IV - -
Veniliornis frontalisb 1 IV Veniliornis passerinus
Veniliornis passerinusb 4 IV Veniliornis frontalis
Vireo olivaceus 10 IV - -
aI) share barcodes with sympatric species; II) share barcodes with allopatric species; III) monophyletic but very closely related to sister species; IV) paraphyletic specieswith lineages more than 1.5% divergent (see Table 2).
bPreviouly reported by Kerr et al [24] and/or Campagna et al [62].cOnly performed for reciprocally monophyletic species pairs.doi:10.1371/journal.pone.0028543.t001
Deep Genetic Structure within Neotropical Birds
PLoS ONE | www.plosone.org 3 December 2011 | Volume 6 | Issue 12 | e28543
Deep genetic structure within Neotropical bird speciesDeep intraspecific divergences in 48 species overlapped widely
with among-species distances (K2P 1.6 to 7.8%, Table 3). These
genetically structured species belong to 21 bird families from nine
different bird orders, most frequently represented by antwrens
(Thamnophilidae, Passeriformes). Most of the species with deep
genetic structure were broadly distributed in the Neotropics, and
several are subdivided into multiple subspecies [27]. Often samples
from different areas of endemism or different ecoregions were the
most divergent within species (Table 3). Some species showed
genetic discontinuities in some pairs of geographic areas, but not in
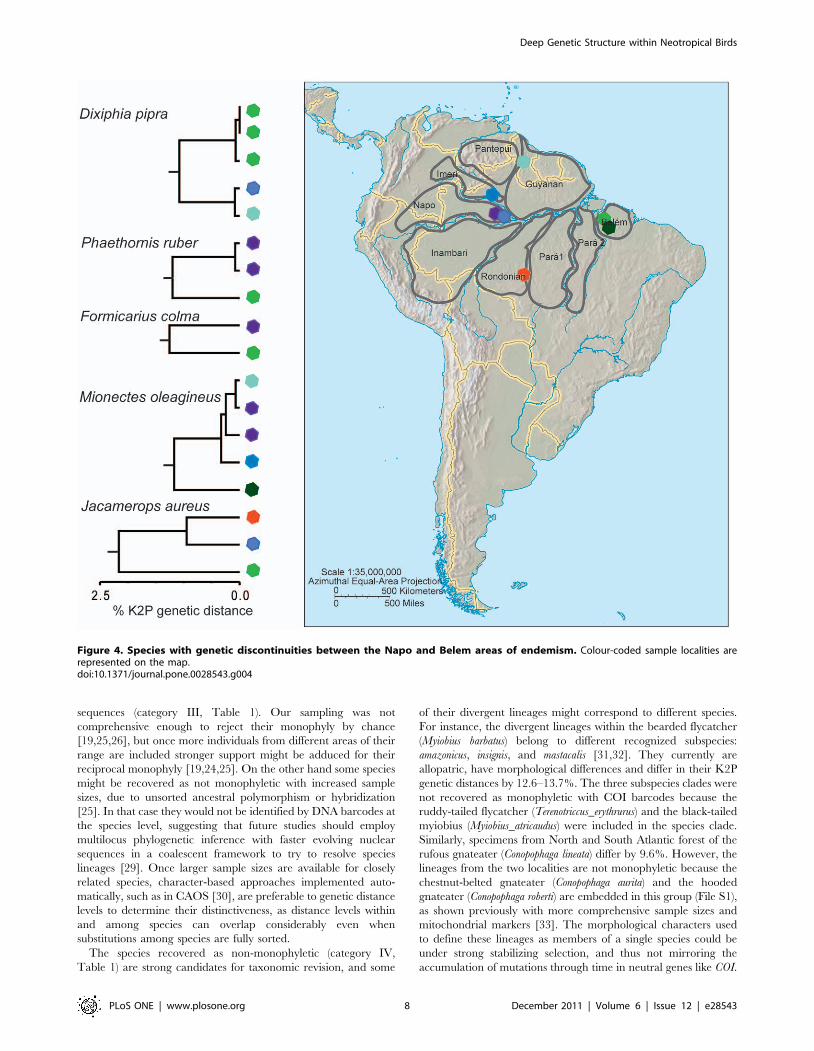
others, such as the ochre-bellied flycatcher (Mionectes oleagineus).
Samples from the Napo, Imeri and Guyanian areas of endemism
were not very distinct genetically, but specimens from Belem were
2.76% divergent from the others (Figure 4). All samples of the
white-shouldered antshrike (Thamnophilus aethiops) from different
areas of endemism (Belem, Rondonian, Imeri, and Napo) had
deep instraspecific genetic variation. The deepest split was
between Belem and the other areas, and then the next split was
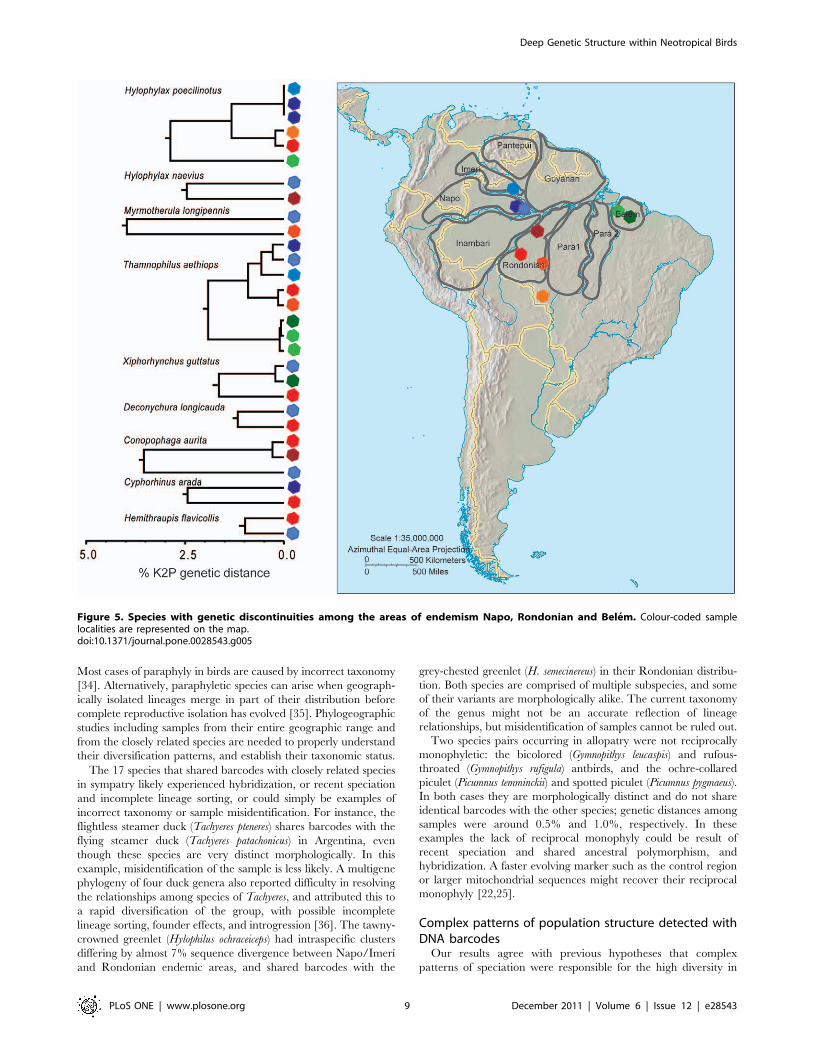
between Rondonian, Imeri, and Napo (Figure 5).
Phylogeographic patternsDeep intraspecific divergences in different species were often
located between the same pairs of areas of endemism or
ecoregions. The most common pattern observed was between
the Napo and Rondonian areas of endemism, followed by Belem
and Rondonian (Table 4, Figures 4 and 5). However, phylogeo-
graphic splits between areas varied in depth in different species.
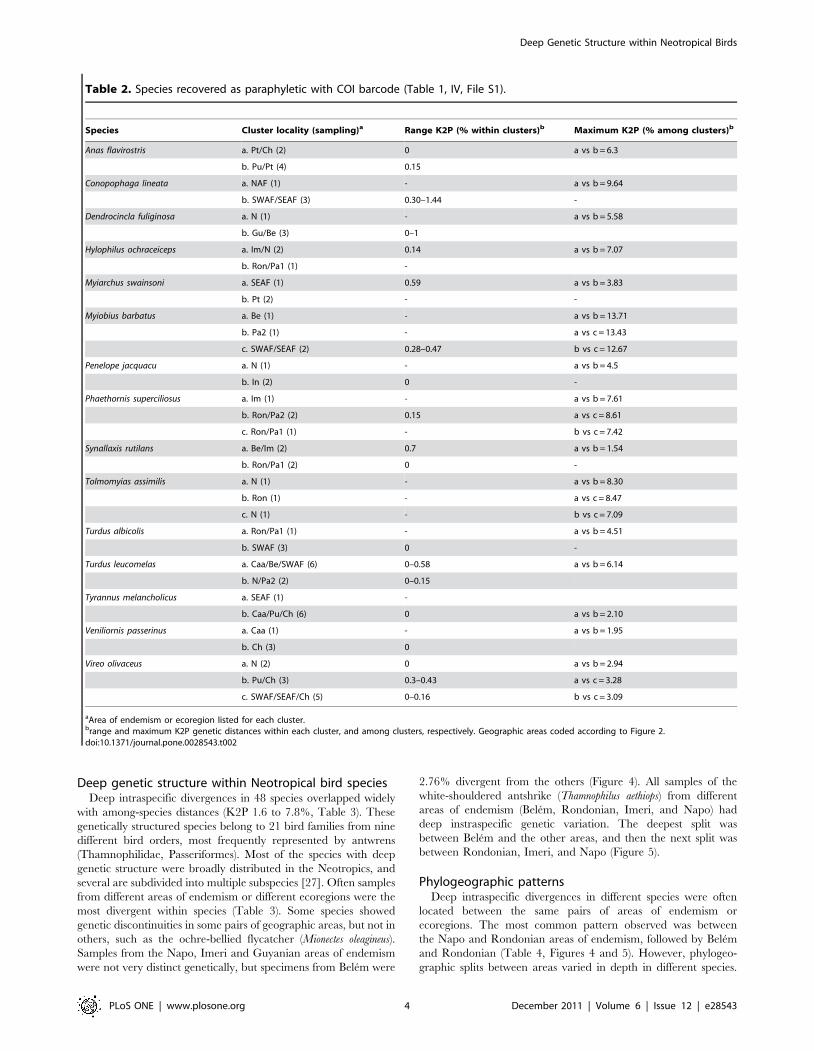
Table 2. Species recovered as paraphyletic with COI barcode (Table 1, IV, File S1).
Species Cluster locality (sampling)a Range K2P (% within clusters)b Maximum K2P (% among clusters)b
Anas flavirostris a. Pt/Ch (2) 0 a vs b = 6.3
b. Pu/Pt (4) 0.15
Conopophaga lineata a. NAF (1) - a vs b = 9.64
b. SWAF/SEAF (3) 0.30–1.44 -
Dendrocincla fuliginosa a. N (1) - a vs b = 5.58
b. Gu/Be (3) 0–1
Hylophilus ochraceiceps a. Im/N (2) 0.14 a vs b = 7.07
b. Ron/Pa1 (1) -
Myiarchus swainsoni a. SEAF (1) 0.59 a vs b = 3.83
b. Pt (2) - -
Myiobius barbatus a. Be (1) - a vs b = 13.71
b. Pa2 (1) - a vs c = 13.43
c. SWAF/SEAF (2) 0.28–0.47 b vs c = 12.67
Penelope jacquacu a. N (1) - a vs b = 4.5
b. In (2) 0 -
Phaethornis superciliosus a. Im (1) - a vs b = 7.61
b. Ron/Pa2 (2) 0.15 a vs c = 8.61
c. Ron/Pa1 (1) - b vs c = 7.42
Synallaxis rutilans a. Be/Im (2) 0.7 a vs b = 1.54
b. Ron/Pa1 (2) 0 -
Tolmomyias assimilis a. N (1) - a vs b = 8.30
b. Ron (1) - a vs c = 8.47
c. N (1) - b vs c = 7.09
Turdus albicolis a. Ron/Pa1 (1) - a vs b = 4.51
b. SWAF (3) 0 -
Turdus leucomelas a. Caa/Be/SWAF (6) 0–0.58 a vs b = 6.14
b. N/Pa2 (2) 0–0.15
Tyrannus melancholicus a. SEAF (1) -
b. Caa/Pu/Ch (6) 0 a vs b = 2.10
Veniliornis passerinus a. Caa (1) - a vs b = 1.95
b. Ch (3) 0
Vireo olivaceus a. N (2) 0 a vs b = 2.94
b. Pu/Ch (3) 0.3–0.43 a vs c = 3.28
c. SWAF/SEAF/Ch (5) 0–0.16 b vs c = 3.09
aArea of endemism or ecoregion listed for each cluster.brange and maximum K2P genetic distances within each cluster, and among clusters, respectively. Geographic areas coded according to Figure 2.doi:10.1371/journal.pone.0028543.t002
Deep Genetic Structure within Neotropical Birds
PLoS ONE | www.plosone.org 4 December 2011 | Volume 6 | Issue 12 | e28543
For example, distances between Napo and Rondonian were 8% in
Tolmomyias assimilis, Myrmotherula longipennis, and Conopophaga aurita,
5% in Thamnomanes caesius, Cyphorhinus arada, Hylophylax naevius,
Schiffornis turdina, and Jacamerops aureus, and 2% in Myrmoborus
myotherinus, Hylophylax poecilinotus, Deconychura longicauda, Deconychura
stictolaema, Hemithraupis flavicollis, Thamnophilus aethiops, and Monasa
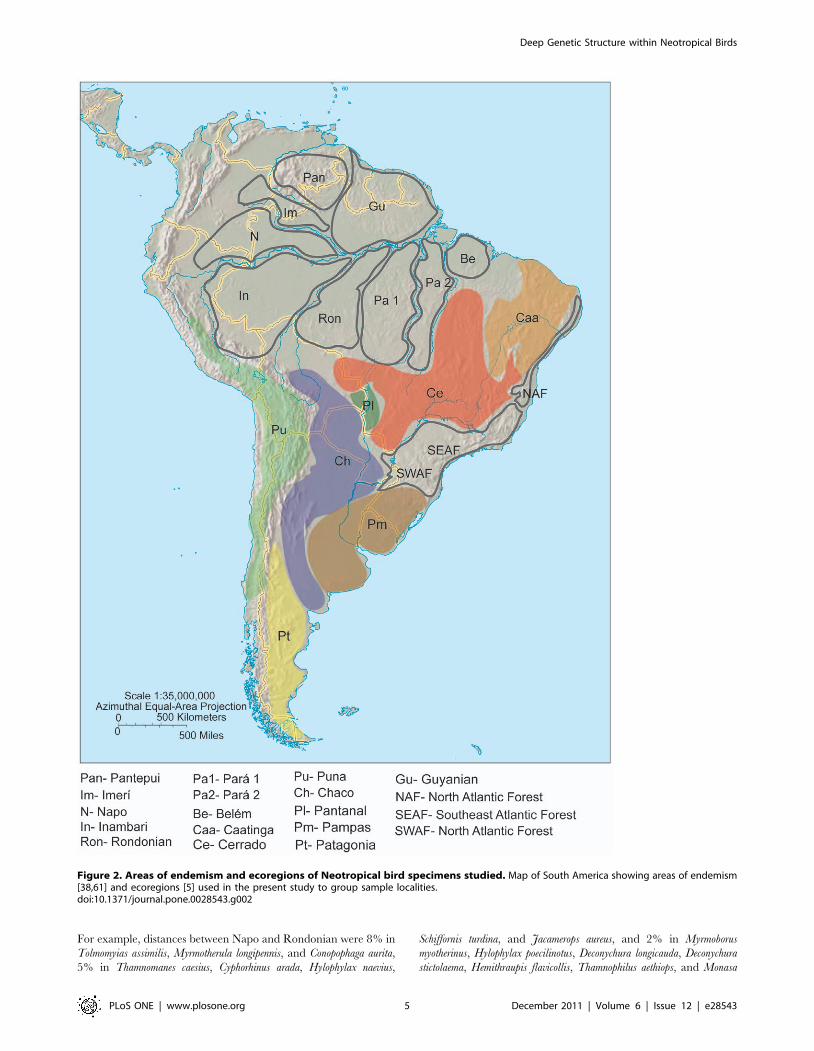
Figure 2. Areas of endemism and ecoregions of Neotropical bird specimens studied. Map of South America showing areas of endemism[38,61] and ecoregions [5] used in the present study to group sample localities.doi:10.1371/journal.pone.0028543.g002
Deep Genetic Structure within Neotropical Birds
PLoS ONE | www.plosone.org 5 December 2011 | Volume 6 | Issue 12 | e28543
morphoeus (Table 4). Between Guyanian and Napo areas of
endemism instraspecific divergences of 5 and 2% were observed
in Dendrocincla fuliginosa and Jacamerops aureus, respectively. Con-
versely, K2P genetic distances were close to zero within the species
Dixiphia pipra and Nyctidromus albicollis (Table 4). Genetic diver-
gences between Belem and Napo were from 2 to 6%, with a wide
range of intermediate levels: 2.4 (Phaethornis ruber), 2.5 (Formicarius
colma), 2.8 (Mionectes oleaginous), 3.3 (Xiphorhynchus guttatus), 3.6
(Thamnophilus aethiops), 4.2 (Jacamerops aureus), 5.6 (Dendrocincla
fuliginosa) and 5.7% (Turdus leucomelas).
Discussion
Identification of Neotropical species with DNA barcodesDespite the high success we obtained in Neotropical bird species
identification with DNA barcodes (93%), comparable to previous
barcode surveys in birds [23,24], most of the genera and species
were not sampled across their entire distribution, which overes-
timates its potential to differentiate species. This was observed for
at least two species previously distinct with DNA barcodes, Anas
sibilatrix, and Celeus lugubris [24], who were shown to be sharing
sequences with Anas flavirostris and Celeus elegans, respectively, when
samples from other areas of their geographic range were included
in this study. When comprehensive genus and species coverage
becomes available in Neotropical birds, more species are likely to
not have unique DNA barcodes [21]. Nonetheless, more certainty
will be achieved overall in the identification of species with COI
barcodes because we will be able to better address monophyly of
lineages and to verify the frequency with which individuals from
different populations within species complexes are exchanging
genes [16]. In most of the genera for which we had better species
coverage for COI, such as Paroaria, Coryphospingus, Hemithraupis,
Cyanerpes, Cyanocompsa, Mimus, Phacellodomus, and Dendrocincla,
species did not share barcodes. Even though we obtained only
single sequences for many species, they will contribute to future
systematic efforts as part of the public standardized DNA barcode
library [28]. They also will aid in faster identification of specimens
that are difficult to identify morphologically, such as embryos and
eggs, which will positively impact the conservation of avian wildlife
in the Neotropical region.
Species not identified by DNA barcodesAmong the species we considered not identifiable with COI
barcodes, some were very closely related with very similar barcode
Figure 3. Maximum likelihood tree topology of the pale-breasted (Turdus leucomelas) and white-necked (Turdus albicollis) thrushesbased on DNA barcodes. Scale bar shows the number of substitutions/site. Bootstrap values higher than 70% (100 replicates) are indicated on thecorresponding branches. Colour-coded sample localities are represented on the map.doi:10.1371/journal.pone.0028543.g003
Deep Genetic Structure within Neotropical Birds
PLoS ONE | www.plosone.org 6 December 2011 | Volume 6 | Issue 12 | e28543
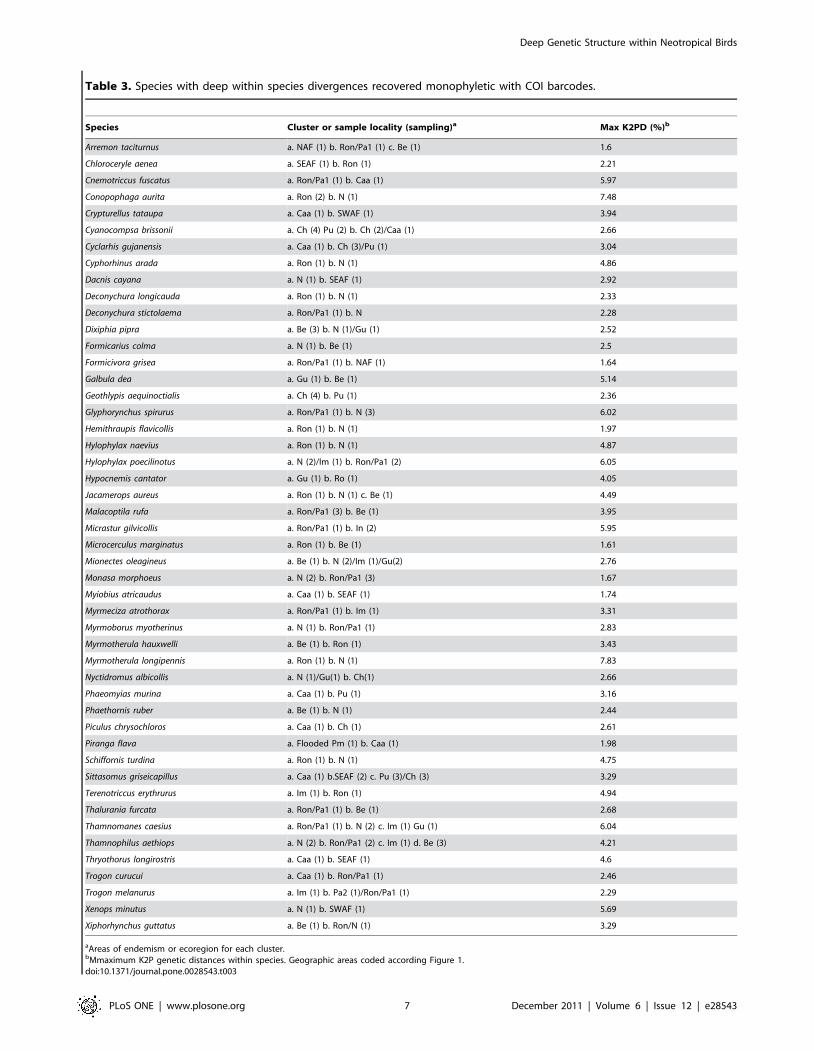
Table 3. Species with deep within species divergences recovered monophyletic with COI barcodes.
Species Cluster or sample locality (sampling)a Max K2PD (%)b
Arremon taciturnus a. NAF (1) b. Ron/Pa1 (1) c. Be (1) 1.6
Chloroceryle aenea a. SEAF (1) b. Ron (1) 2.21
Cnemotriccus fuscatus a. Ron/Pa1 (1) b. Caa (1) 5.97
Conopophaga aurita a. Ron (2) b. N (1) 7.48
Crypturellus tataupa a. Caa (1) b. SWAF (1) 3.94
Cyanocompsa brissonii a. Ch (4) Pu (2) b. Ch (2)/Caa (1) 2.66
Cyclarhis gujanensis a. Caa (1) b. Ch (3)/Pu (1) 3.04
Cyphorhinus arada a. Ron (1) b. N (1) 4.86
Dacnis cayana a. N (1) b. SEAF (1) 2.92
Deconychura longicauda a. Ron (1) b. N (1) 2.33
Deconychura stictolaema a. Ron/Pa1 (1) b. N 2.28
Dixiphia pipra a. Be (3) b. N (1)/Gu (1) 2.52
Formicarius colma a. N (1) b. Be (1) 2.5
Formicivora grisea a. Ron/Pa1 (1) b. NAF (1) 1.64
Galbula dea a. Gu (1) b. Be (1) 5.14
Geothlypis aequinoctialis a. Ch (4) b. Pu (1) 2.36
Glyphorynchus spirurus a. Ron/Pa1 (1) b. N (3) 6.02
Hemithraupis flavicollis a. Ron (1) b. N (1) 1.97
Hylophylax naevius a. Ron (1) b. N (1) 4.87
Hylophylax poecilinotus a. N (2)/Im (1) b. Ron/Pa1 (2) 6.05
Hypocnemis cantator a. Gu (1) b. Ro (1) 4.05
Jacamerops aureus a. Ron (1) b. N (1) c. Be (1) 4.49
Malacoptila rufa a. Ron/Pa1 (3) b. Be (1) 3.95
Micrastur gilvicollis a. Ron/Pa1 (1) b. In (2) 5.95
Microcerculus marginatus a. Ron (1) b. Be (1) 1.61
Mionectes oleagineus a. Be (1) b. N (2)/Im (1)/Gu(2) 2.76
Monasa morphoeus a. N (2) b. Ron/Pa1 (3) 1.67
Myiobius atricaudus a. Caa (1) b. SEAF (1) 1.74
Myrmeciza atrothorax a. Ron/Pa1 (1) b. Im (1) 3.31
Myrmoborus myotherinus a. N (1) b. Ron/Pa1 (1) 2.83
Myrmotherula hauxwelli a. Be (1) b. Ron (1) 3.43
Myrmotherula longipennis a. Ron (1) b. N (1) 7.83
Nyctidromus albicollis a. N (1)/Gu(1) b. Ch(1) 2.66
Phaeomyias murina a. Caa (1) b. Pu (1) 3.16
Phaethornis ruber a. Be (1) b. N (1) 2.44
Piculus chrysochloros a. Caa (1) b. Ch (1) 2.61
Piranga flava a. Flooded Pm (1) b. Caa (1) 1.98
Schiffornis turdina a. Ron (1) b. N (1) 4.75
Sittasomus griseicapillus a. Caa (1) b.SEAF (2) c. Pu (3)/Ch (3) 3.29
Terenotriccus erythrurus a. Im (1) b. Ron (1) 4.94
Thalurania furcata a. Ron/Pa1 (1) b. Be (1) 2.68
Thamnomanes caesius a. Ron/Pa1 (1) b. N (2) c. Im (1) Gu (1) 6.04
Thamnophilus aethiops a. N (2) b. Ron/Pa1 (2) c. Im (1) d. Be (3) 4.21
Thryothorus longirostris a. Caa (1) b. SEAF (1) 4.6
Trogon curucui a. Caa (1) b. Ron/Pa1 (1) 2.46
Trogon melanurus a. Im (1) b. Pa2 (1)/Ron/Pa1 (1) 2.29
Xenops minutus a. N (1) b. SWAF (1) 5.69
Xiphorhynchus guttatus a. Be (1) b. Ron/N (1) 3.29
aAreas of endemism or ecoregion for each cluster.bMmaximum K2P genetic distances within species. Geographic areas coded according Figure 1.doi:10.1371/journal.pone.0028543.t003
Deep Genetic Structure within Neotropical Birds
PLoS ONE | www.plosone.org 7 December 2011 | Volume 6 | Issue 12 | e28543
sequences (category III, Table 1). Our sampling was not
comprehensive enough to reject their monophyly by chance
[19,25,26], but once more individuals from different areas of their
range are included stronger support might be adduced for their
reciprocal monophyly [19,24,25]. On the other hand some species
might be recovered as not monophyletic with increased sample
sizes, due to unsorted ancestral polymorphism or hybridization
[25]. In that case they would not be identified by DNA barcodes at
the species level, suggesting that future studies should employ
multilocus phylogenetic inference with faster evolving nuclear
sequences in a coalescent framework to try to resolve species
lineages [29]. Once larger sample sizes are available for closely
related species, character-based approaches implemented auto-
matically, such as in CAOS [30], are preferable to genetic distance
levels to determine their distinctiveness, as distance levels within
and among species can overlap considerably even when
substitutions among species are fully sorted.
The species recovered as non-monophyletic (category IV,
Table 1) are strong candidates for taxonomic revision, and some
of their divergent lineages might correspond to different species.
For instance, the divergent lineages within the bearded flycatcher
(Myiobius barbatus) belong to different recognized subspecies:
amazonicus, insignis, and mastacalis [31,32]. They currently are
allopatric, have morphological differences and differ in their K2P
genetic distances by 12.6–13.7%. The three subspecies clades were
not recovered as monophyletic with COI barcodes because the
ruddy-tailed flycatcher (Terenotriccus_erythrurus) and the black-tailed
myiobius (Myiobius_atricaudus) were included in the species clade.
Similarly, specimens from North and South Atlantic forest of the
rufous gnateater (Conopophaga lineata) differ by 9.6%. However, the
lineages from the two localities are not monophyletic because the
chestnut-belted gnateater (Conopophaga aurita) and the hooded
gnateater (Conopophaga roberti) are embedded in this group (File S1),
as shown previously with more comprehensive sample sizes and
mitochondrial markers [33]. The morphological characters used
to define these lineages as members of a single species could be
under strong stabilizing selection, and thus not mirroring the
accumulation of mutations through time in neutral genes like COI.
Figure 4. Species with genetic discontinuities between the Napo and Belem areas of endemism. Colour-coded sample localities arerepresented on the map.doi:10.1371/journal.pone.0028543.g004
Deep Genetic Structure within Neotropical Birds
PLoS ONE | www.plosone.org 8 December 2011 | Volume 6 | Issue 12 | e28543
Most cases of paraphyly in birds are caused by incorrect taxonomy
[34]. Alternatively, paraphyletic species can arise when geograph-
ically isolated lineages merge in part of their distribution before
complete reproductive isolation has evolved [35]. Phylogeographic
studies including samples from their entire geographic range and
from the closely related species are needed to properly understand
their diversification patterns, and establish their taxonomic status.
The 17 species that shared barcodes with closely related species
in sympatry likely experienced hybridization, or recent speciation
and incomplete lineage sorting, or could simply be examples of
incorrect taxonomy or sample misidentification. For instance, the
flightless steamer duck (Tachyeres pteneres) shares barcodes with the
flying steamer duck (Tachyeres patachonicus) in Argentina, even
though these species are very distinct morphologically. In this
example, misidentification of the sample is less likely. A multigene
phylogeny of four duck genera also reported difficulty in resolving
the relationships among species of Tachyeres, and attributed this to
a rapid diversification of the group, with possible incomplete
lineage sorting, founder effects, and introgression [36]. The tawny-
crowned greenlet (Hylophilus ochraceiceps) had intraspecific clusters
differing by almost 7% sequence divergence between Napo/Imerı
and Rondonian endemic areas, and shared barcodes with the
grey-chested greenlet (H. semecinereus) in their Rondonian distribu-
tion. Both species are comprised of multiple subspecies, and some
of their variants are morphologically alike. The current taxonomy
of the genus might not be an accurate reflection of lineage
relationships, but misidentification of samples cannot be ruled out.
Two species pairs occurring in allopatry were not reciprocally
monophyletic: the bicolored (Gymnopithys leucaspis) and rufous-
throated (Gymnopithys rufigula) antbirds, and the ochre-collared
piculet (Picumnus temminckii) and spotted piculet (Picumnus pygmaeus).
In both cases they are morphologically distinct and do not share
identical barcodes with the other species; genetic distances among
samples were around 0.5% and 1.0%, respectively. In these
examples the lack of reciprocal monophyly could be result of
recent speciation and shared ancestral polymorphism, and
hybridization. A faster evolving marker such as the control region
or larger mitochondrial sequences might recover their reciprocal
monophyly [22,25].
Complex patterns of population structure detected withDNA barcodes
Our results agree with previous hypotheses that complex
patterns of speciation were responsible for the high diversity in
Figure 5. Species with genetic discontinuities among the areas of endemism Napo, Rondonian and Belem. Colour-coded samplelocalities are represented on the map.doi:10.1371/journal.pone.0028543.g005
Deep Genetic Structure within Neotropical Birds
PLoS ONE | www.plosone.org 9 December 2011 | Volume 6 | Issue 12 | e28543
Neotropical bird species [37], and strongly supports the view that
most avian species in the region are narrowly endemic rather
than widely distributed [9,38]. Several hypotheses were proposed
to explain the patterns of taxon distribution in the Amazonian
lowland region. The forest refugia hypothesis [5,39,40] suggested
that cycles of expansion and retraction of dry patches within
forest areas were associated with interglacial and glacial periods,
and this could create multiple events of isolation among widely
distributed groups, promoting speciation [5,39,40]. The riverine
hypothesis suggested that the formation of the rivers in the
Amazon region could have acted as important geographic
barriers to promote speciation, as they delimit most areas of
endemism [41,42,43]. This would have started at least by the end
of the Miocene with the uplift of the Northern portion of the
Andes [44,45]. Another proposal is the marine incursions hypoth-
esis, in which sea-level rises of about 100 m in the Quaternary
and late Tertiary are suggested to have fragmented the
Amazonian lowland into a large number of true islands and
archipelagos, favoring active allopatric speciation [46,47]. The
wide range of divergence levels we observed within the 61 non-
monophyletic and monophyletic species with deep intraspecific
variation (1–13% K2P distances), together with the high
incidence of recently evolved species, is consistent with speciation
events starting well before the Pliocene and Pleistocene, and
extending to more recent geologic periods [38]. Although several
groups of species have similar patterns of genetic and geographic
breaks among the same areas of endemism, different levels of
genetic distances between the same areas were also recovered in
other species. The wide range of intraspecific genetic distances
observed between a pair of geographical localities might reflect
multiple vicariant events that have occurred at different
geological times [15,48], or they could reflect multiple dispersal
events that followed a major isolation process [49], or variation in
rates of evolution across different species [50,51] whose
populations were isolated by a single vicariant event. Addition-
ally, a significant relationship was observed in previous studies
[52] between interspecific levels of cross-barrier genetic differen-
tiation within the forest stratum at which a species forages in
Neotropical rain forest. More comprehensive taxon sampling and
estimates of times of diversification that take into account
variation in rates of evolution across lineages [50] are needed
to properly associate the diversification of a particular taxon with
geographical events.
We have chosen not to flag divergent lineages as provisional
new species, because our sampling was not comprehensive enough
to properly quantify genetic variation in each locality in different
species, such as the red-eyed vireo (Vireo olivaceus) and the
ultramarine grosbeak (Cyanocompsa brissonii). Specimens of red-eyed
vireo from Puna+Napo and Atlantic Forest were genetically
divergent (2–3%), but haplotypes from the Atlantic Forest and
Puna were observed in the Chaco. Similarly, specimens of
ultramarine grosbeak from Caatinga and Puna were also divergent
(2.7%), and both haplotypes are also found in Chaco. Both species
may have reinvaded the Chaco after being isolated on the borders
of this area. To check if these lineages deserve species recognition
it is important to investigate if the highly divergent specimens in
sympatric zones are reproductively isolated. Some of the deep
intraspecific lineages we described in this study were reported
previously, such as the difference among thrush-like Schiffornis
(Schiffornis turdina) from Rondonian and Napo areas of endemism
[11]. Others, such as the whiskered myiobius (Myiobius barbatus)
from Belem, Para2 and Atlantic forest will likely prove to be
different species.
DNA barcodes of several new species of Neotropical birds will
contribute to a deeper understanding of the systematics and
diversification of these taxa in the area. Assuming the current
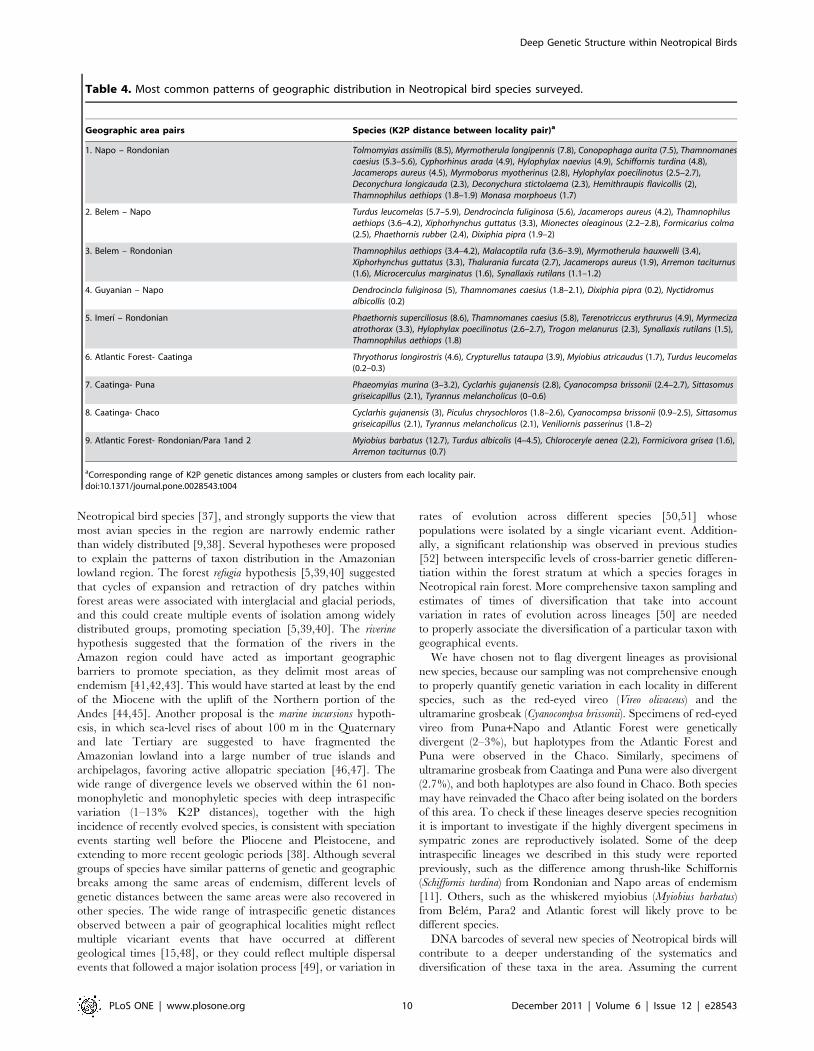
Table 4. Most common patterns of geographic distribution in Neotropical bird species surveyed.
Geographic area pairs Species (K2P distance between locality pair)a
1. Napo – Rondonian Tolmomyias assimilis (8.5), Myrmotherula longipennis (7.8), Conopophaga aurita (7.5), Thamnomanescaesius (5.3–5.6), Cyphorhinus arada (4.9), Hylophylax naevius (4.9), Schiffornis turdina (4.8),Jacamerops aureus (4.5), Myrmoborus myotherinus (2.8), Hylophylax poecilinotus (2.5–2.7),Deconychura longicauda (2.3), Deconychura stictolaema (2.3), Hemithraupis flavicollis (2),Thamnophilus aethiops (1.8–1.9) Monasa morphoeus (1.7)
2. Belem – Napo Turdus leucomelas (5.7–5.9), Dendrocincla fuliginosa (5.6), Jacamerops aureus (4.2), Thamnophilusaethiops (3.6–4.2), Xiphorhynchus guttatus (3.3), Mionectes oleaginous (2.2–2.8), Formicarius colma(2.5), Phaethornis rubber (2.4), Dixiphia pipra (1.9–2)
3. Belem – Rondonian Thamnophilus aethiops (3.4–4.2), Malacoptila rufa (3.6–3.9), Myrmotherula hauxwelli (3.4),Xiphorhynchus guttatus (3.3), Thalurania furcata (2.7), Jacamerops aureus (1.9), Arremon taciturnus(1.6), Microcerculus marginatus (1.6), Synallaxis rutilans (1.1–1.2)
4. Guyanian – Napo Dendrocincla fuliginosa (5), Thamnomanes caesius (1.8–2.1), Dixiphia pipra (0.2), Nyctidromusalbicollis (0.2)
5. Imerı – Rondonian Phaethornis superciliosus (8.6), Thamnomanes caesius (5.8), Terenotriccus erythrurus (4.9), Myrmecizaatrothorax (3.3), Hylophylax poecilinotus (2.6–2.7), Trogon melanurus (2.3), Synallaxis rutilans (1.5),Thamnophilus aethiops (1.8)
6. Atlantic Forest- Caatinga Thryothorus longirostris (4.6), Crypturellus tataupa (3.9), Myiobius atricaudus (1.7), Turdus leucomelas(0.2–0.3)
7. Caatinga- Puna Phaeomyias murina (3–3.2), Cyclarhis gujanensis (2.8), Cyanocompsa brissonii (2.4–2.7), Sittasomusgriseicapillus (2.1), Tyrannus melancholicus (0–0.6)
8. Caatinga- Chaco Cyclarhis gujanensis (3), Piculus chrysochloros (1.8–2.6), Cyanocompsa brissonii (0.9–2.5), Sittasomusgriseicapillus (2.1), Tyrannus melancholicus (2.1), Veniliornis passerinus (1.8–2)
9. Atlantic Forest- Rondonian/Para 1and 2 Myiobius barbatus (12.7), Turdus albicolis (4–4.5), Chloroceryle aenea (2.2), Formicivora grisea (1.6),Arremon taciturnus (0.7)
aCorresponding range of K2P genetic distances among samples or clusters from each locality pair.doi:10.1371/journal.pone.0028543.t004
Deep Genetic Structure within Neotropical Birds
PLoS ONE | www.plosone.org 10 December 2011 | Volume 6 | Issue 12 | e28543
species taxonomy, studies of historical patterns of diversification of
species in the area can be obscured since many species were
revealed not to be monophyletic. Moreover, a high number of
species in the Neotropical realm are comprised of multiple
divergent lineages, thus the sample sizes of barcoded individuals
and other markers within and among species in the area need to
be higher than in other biogeographic areas that are not as taxon-
diverse. This can be achieved by complementary efforts of
independent research groups. Common and divergent patterns
of genetic distances observed within and among closely related
species suggest that multiple geographic processes have shaped the
distribution of avian taxa in the Neotropics, and DNA barcodes
surveys will continue to reveal many more interesting geographic
patterns in the region.
Materials and Methods
Taxon samplingWe analyzed 637 individuals from 431 species of Neotropical
bird species from two tissue collections: Laboratorio de Genetica e
Evolucao Molecular de Aves (LGEMA) in the Universidade de
Sao Paulo, Sao Paulo, and The Royal Ontario Museum in
Toronto (ROM), with high representation in the Amazon
lowlands and Atlantic Forest (Table S2, File S2). Whenever
available, individuals from different localities of their distribution
range were sampled (Table S2, GenBank numbers JN801479 -
JN802115, project ‘‘Neotropical-BRAS’’ in the completed projects
section of the Barcode of Life Data System- BOLD [53]). To
increase intraspecific sampling and to compare more closely
related congeneres, we added sequences of individuals from the
same species and same genera of Neotropical birds from the study
of birds from Argentina [24] (project ‘‘Birds of Argentina-Phase I-
BARG’’ in the completed projects section of BOLD [53]), thus
extending our survey to 1,431 samples from 561 different species
(Table S2, File S2).
DNA extraction and amplificationDNA was extracted by a membrane purification procedure in
glass fiber-filtration plates (Acroprep 96 Filter Plate- 1.0 mm Glass,
PALL Corporation) [54], and collected in PCR plates. Sequences
of about 700 base pairs (bp) were obtained from the 59end of the
mitochondrial gene Cytochrome oxidase I (COI). Polymerase
Chain Reaction (PCR) amplifications were performed in 12.5 mL
reactions in a buffer solution containing 10 mM Tris-HCl (pH8.3),
50 mM KCl, 2.5 mM MgCl2, 0.01% gelatin, 0.4 mM dNTPs,
0.2 mM of each primer, 1 U Taq Polymerase (Invitrogen) and
20–25 ng of DNA. Cycle conditions were: an initial denaturation
at 94uC for 5 min, 36 cycles of 94uC for 40 sec, 50uC for 40 sec
and 72uC for 1 min, and a final extension at 72uC for 7 min.
Bird universal primers used in COI amplifications were LTyr
(forward – TGTAAAAAGGWCTACAGCCTAACGC [19]) and
COI907aH2 (GTRGCNGAYGTRAARTATGCTCG [19]) re-
sulting in a long but very stable amplified product of about 910 bp.
This primer set successfully amplified the 59 end of COI across a
wide range of bird species. The amplified segments were purified
by excising bands from agarose gels and centrifuging each through
a filter tip [55]. Sequences were obtained on an ABI3730 (Applied
Biosystems) according to the manufacturers’ suggested protocols
using the same primer LTyr to sequence the 59end, and the
internal primer COI748Ht (reverse-TGGGARATAATTC-
CRAAGCCTGG [19]) to sequence the reverse 39end, resulting
in a sequenced product of about 750 bp. Sequences were checked
for ambiguities in CodonCode Aligner (CodonCode Corporation), and
Geneious 5.3 [56].
Data analysesSequences were aligned in Geneious 5.3 using the Geneious
alignment algorithm, with gap penalty set as 12.8, and gap extension
penalty set as 3. Species and genera counts were performed in the
software environment R 2.12 [57]. Genetic distances were calculated
under the Kimura 2 –Parameter model (K2P) for all pair-wise
comparisons in the matrix using PAUP4b10 [58]. Two datasets of
genetic distances were built in R: the first, including all within-species
comparisons; and the second, including among-congener compar-
isons (excluding within-species ones). We wrote R scripts to
summarize the mean, variance, maximum, and minimum genetic
distances per species and among congeners, respectively, using the
first two datasets. Frequency plots of pairwise genetic distances for
congeners of different species, and with only within species
comparisons were built in R. The maximum likelihood tree topology
for the complete dataset was calculated in Geneious 5.3 [56] using
PHYML [59]. The best fit-model (General Time Reversible with
proportion of invariable sites and gamma, GTR+I+C, I = 0.5,
C= 0.42) was selected with jModelTest [60] with a sample of the
original dataset including one or two representative samples of each
bird family. Species were considered not distinguishable by DNA
barcode if: a) they were not monophyletic; b) they shared barcodes
with other species; or c) their intraspecific variation overlapped with
the lowest 5% of among-species variation, and reciprocal monophyly
of sampled individuals could not be distinguished from random
branching at p = 0.05 with the test for chance occurrence of
reciprocal monophyly [25,26].
Within-species clusters with minimum pairwise distances higher
than 1.5% K2P were considered for analyses, because this level of
genetic distances overlapped with more than 5% of among
congeners comparisons (Figure 1), but information on clades
differing by less than 1.5% K2P distance is also available (File S1).
Species without unique barcodes were sorted into the following
non-exclusive categories: I) they share barcodes with species
occurring in sympatry or II) they share barcodes with species
occurring in allopatry, or III) were monophyletic differing from
their sister species by few mutations, or IV) paraphyletic species
with lineages more than 1.5% divergent.
For all the paraphyletic and monophyletic species with deep
intraspecific divergences, we compared the genetic discontinuities
with the geographic locality of the samples. Because areas of
endemism are known to harbor unique biota, and many
subspecies of birds are delimited also by these zones [38,39,40],
we classified the sample localities of individuals according to the
areas of endemism in the Amazon and in the Atlantic forest where
they occur (Figure 1). We adopted the revised areas of endemism
in Amazon and Atlantic forest from Bates et al. [37] and Borges
[61]. Samples collected in other localities were classified according
to their respective ecoregion according to the simplified map from
Haffer [5] (Figure 2).
Supporting Information
File S1 Maximum likelihood tree of 1,431 COI barcodesfrom the 561 Neotropical bird species surveyed. Zip file
including the tree topology in pdf format. Codes after species
names correspond to their Process ID in BOLD (Table S2).
(PDF)
File S2 Map representing the sample distribution in theNeotropical region. Blue dots correspond to new samples
sequenced for this study (BOLD project BRAS), and red dots
correspond to samples available from literature (BOLD project
BARG). Dots may correspond to the locality of multiple samples.
(TIF)
Deep Genetic Structure within Neotropical Birds
PLoS ONE | www.plosone.org 11 December 2011 | Volume 6 | Issue 12 | e28543
Table S1 Within- and amongspecies mean, variance,minimum, and maximum K2P genetic distances.(XLS)
Table S2 Specimen details. List of specimens used in the
study, with detailed identification information, and sample locality
coordinates (excel file).
(XLS)
Acknowledgments
We thank A. C. Mendez, Alexandre Aleixo, Alexande Martensen,
Alexandre Uezu, Camila Ribas, E. Machado, Fernando d’Horta,
Fernando Nodari, Guilherme Brito, Gustavo Gabanne, Luis Fabio
Silveira, Pedro Develey, Renato Gaban Lima, and Rodrigo Pessoa for
collecting the biological samples deposited at LGEMA and used in this
study. For permission to barcode loaned samples we thank the American
Museum of Natural History and Field Museum of Natural History; Nicole
Leung and Nicolle Domnick for their help with sample processing, Bernd
Schierwater and three anonymous reviewers for valuable suggestions on
the manuscript, and Cedrik Juillet for advice in developing the R scripts.
Author Contributions
Conceived and designed the experiments: EST PG. Performed the
experiments: EST PG CYM. Analyzed the data: EST PG. Contributed
reagents/materials/analysis tools: CYM AJB. Wrote the paper: EST PG
CYM AJB.
References
1. Gaston K (2000) Global patterns in biodiversity. Nature 405: 220–227.
2. Cardillo M, Orme CDL, Owens IPF (2005) Testing for latitudinal bias indiversification rates: an example using new world birds. Ecology 86: 2278–2287.
3. Hawkins BA, Diniz-Filho JAF (2004) ‘Latitude’ and geographic patterns.Ecography 27: 268–272.
4. Rohde K (1999) Latitudinal gradients in species diversity and Rapoport’s rulerevisited: a review of recent work and what can parasites teach us about the
causes of the gradients? Ecography 22: 593–613.
5. Haffer J (1985) Avian zoogeography of the Neotropical lowlands. Ornithol
Monogr 36: 113–146.
6. Price T (2008) Speciation in Birds. Colorado: Greenwood Village. 512 p.
7. Ribas CC, Miyaki CY (2004) Molecular systematics in Aratinga parakeets: species
limits and historical biogeography in the ‘solstitialis’ group, and the systematicposition of Nandayus nenday. Mol Phylogenet Evol 30: 663–675.
8. Caranton-Ayala D (2010) A new species of antpitta (Grallariidae: Grallaria) fromthe northern sector of the western Andes of Colombia. Ornitol Colomb 9:
56–70.
9. Cheviron ZA, Hackett SJ, Capparella AP (2005) Complex evolutionary history
of a Neotropical lowland forest bird (Lepidothrix coronata) and its implications forhistorical hypotheses of the origin of Neotropical avian diversity. Mol Phylogenet
Evol 36: 338–357.
10. Marks BD, Hackett SJ, Capparella AP (2002) Historical relationships among
Neotropical lowland forest areas of endemism as determined by mitochondrial
DNA sequence variation within the Wedge-billed Woodcreeper (Aves: end-rocolaptidae: Glyphorynchus spirurus). Mol Phylogenet Evol 24: 153–167.
11. Nyari AS (2007) Phylogeographic patterns, molecular and vocal differentiation,
and species limits in Schiffornis turdina (Aves). Mol Phylogenet Evol 44: 154–164.
12. Ribas CC, Tavares ES, Yoshihara C, Miyaki CY (2007) Phylogeny and
biogeography of Yellow-headed and Blue-fronted Parrots (Amazona ochrocephala
and Amazona aestiva) with special reference to the South American clade. Ibis 149:564–574.
13. Joseph L, Wilke T, Bermingham E, Alpers D, Ricklefs R (2004) Towards a
phylogenetic framework for the evolution of shakes, rattles, and rolls in
Myiarchus Tyrant-flycatchers (Aves: Passeriformes: Tyrannidae). Mol Phylo-genet Evol 31: 139–152.
14. Amaral FS, Miller MJ, Silveira LF, Bermingham E, Wajntal A (2006) Polyphylyof the hawk genera Leucopternis and Buteogallus (Aves, Accipitridae): multiple
habitat shifts during the Neotropical buteonine diversification. BMC Evol Biol 6:10.
15. Miller MJ, Bermingham E, Klicka J, Escalante P, do Amaral FS, et al. (2008)Out of Amazonia again and again: episodic crossing of the Andes promotes
diversification in a lowland forest flycatcher. Proc Biol Sci 275: 1133–1142.
16. Hebert PD, Cywinska A, Ball SL, deWaard JR (2003) Biological identifications
through DNA barcodes. Proc Biol Sci 270: 313–321.
17. Kerr KCR, Stoeckle MY, Dove CJ, Weigt LA, Francis CM, et al. (2007)
Comprehensive DNA barcode coverage of North American birds. Mol EcolNotes 7: 535–543.
18. Hebert PD, Stoeckle MY, Zemlak TS, Francis CM (2004) Identification of Birdsthrough DNA Barcodes. PLoS Biol 2: 1657–1663.
19. Tavares ES, Baker AJ (2008) Single mitochondrial gene barcodes reliablyidentify sister-species in diverse clades of birds. BMC Evol Biol 8: 81.
20. Yoo HS, Eah JY, Kim JS, Min MS, Paek WK, et al. (2006) DNA barcoding
Korean birds. Mol Cell 22: 323–327.
21. Moritz C, Cicero C (2004) DNA barcoding: promise and pitfalls. PLoS Biol 2:
1529–1531.
22. Mila B, Girman DJ, Kimura M, Smith TB (2000) Genetic evidence for the effect
of a postglacial population expansion on the phylogeography of a NorthAmerican songbird. Proc R Soc Lond Biol Sci 267: 1033–1040.
23. Vilaca ST, Lacerda DR, Sari EHR, Santos FR (2006) DNA-based identificationapplied to Thamnophilidae (Passeriformes) species: the first barcodes of
Neotropical birds. Rev Bras Ornitol 14: 7–13.
24. Kerr KCR, Lijtmaer DA, Barreira AS, Hebert PDN, Tubaro PL (2009) Probing
evolutionary patterns in Neotropical birds through DNA barcodes. PLoS ONE4: e4379.
25. Baker AJ, Tavares ES, Elbourne R (2009) Countering criticisms of single
mitochondrial DNA gene barcoding in birds. Mol Ecol Res 9: 257–268.
26. Rosenberg NA (2007) Statistical tests for taxonomic distinctiveness from
observations of monophyly. Evolution 61: 317–323.
27. Sigrist T (2009) The Avis Brasilis Field Guide to the Birds of Brazil. Vinhedo,Sao Paulo: Avisbrasilis editora. 476 p.
28. Ratnasingham S, Hebert PDN (2007) BOLD: The Barcode of Life Data System.Mol Ecol Notes 7: 355–364.
29. Heled J, Drummond AJ (2010) Bayesian inference of species trees from
multilocus data. Mol Biol Evol 27: 570–580.
30. Rach J, DeSalle R, Sarkar IN, Schierwater B, Hadrys H (2008) Character-based
DNA barcoding allows discrimination of genera, species and populations in
Odonata. Proc R Soc Lond Biol Sci 275: 237–247.
31. Fitzpatrick JW, Bates JM, Bostwick KS, Caballero IC, Clock BM, et al. (2004)
Family Tyrannidae (Tyrant-flycatchers). In: Del Hoyo J, Elliot A, Christie D,
eds. Handbook of the Birds of the World Volume 9: Cotingas to Pipits andWagtails. Barcelona, Spain: Lynx Edicions. pp 170–462.
32. Integrated Taxonomic Information System (http://www.itis.gov/index.html).
33. Pessoa RO (2008) Sistematica e Biogeografia Historica da Famılia Conopopha-
gidae (Aves: Passeriformes): Especiacao nas Florestas da America do Sul [PhD].
Sao Paulo: Universidade de Sao Paulo. 94 p.
34. McKay BD, Zink RM (2010) The causes of mitochondrial DNA gene tree
paraphyly in birds. Mol Phylogenet Evol 54: 647–650.
35. de Queiroz K (2005) A unified concept of species and its consequences for thefuture of taxonomy. Proc Calif Acad Sci 56: 196–215.
36. Bulgarella M, Sorenson MD, Peters JL, Wilson RE, McCracken KG (2010)
Phylogenetic relationships of Amazonetta, Speculanas, Lophonetta, and Tachyeres: fourmorphologically divergent duck genera endemic to South America. J Avian Biol
41.
37. Bates JM, Hackett SJ, Cracraft J (1998) Area-relationships in the Neotropical
lowlands: an hypothesis based on raw distributions of Passerine birds. J Biogeogr
25: 783–793.
38. Cracraft J (1985) Historical biogeography and patterns of differentiation within
the South American avifauna: areas of endemisms. Ornithol Monog 36: 49–84.
39. Haffer J (1969) Speciation in Amazonian forest birds. Science 165: 131–137.
40. Haffer J (1974) Avian speciation in tropical South America: Cambridge, MA.
41. Ayres M, Clutton-Brock TH (1992) River boundaries and species range size inAmazonian primates. Am Nat 140: 531–537.
42. Haffer J (1992) On the ‘‘river effect’’ in some forest birds of southern Amazonia.
Bol Mus Para Emilio Goeldi Ser Zool 8: 217–245.
43. Sick H (1967) Rios e enchentes na Amazonia como obstaculo para a avifauna.
In: Lent H, ed. Atlas do Simposio sobre a Biota Amazonica- Zoologia. Rio de
Janeiro: Conselho de Pesquisas sobre o Rio de Janeiro.
44. Hoorn C (1994) An environmental reconstruction of the palaeo-Amazon River
system (Middle-Late Miocene, NW Amazonia). Palaeogeogr Palaeoclimatol
Palaeoecol 112: 187–238.
45. Hoorn C, Guerrero J, Sarmiento GA, Lorente MA (1995) Andean tectonics as a
cause for changing drainage patterns in Miocene northern South America.
Geology 23: 237–240.
46. Nores M (1999) An alternative hypothesis for the origin of Amazonian bird
diversity. J Biogeogr 26: 475–485.
47. Marroig G, Cerqueira R (1997) Plio-Pleistocene South American history and the
Amazon laggon hypothesis: a piece in the puzzle of amazonian diversification.
J Comp Biol 2: 103–119.
48. Brumfield RT, Edwards SV (2007) Evolution into and out of the Andes: a
Bayesian analysis of historical diversification in Thamnophilus antshrikes. Evolution
61: 346–367.
49. Leache AD, Crews SC, Hickerson MJ (2007) Two waves of diversification in
mammals and reptiles of Baja California revealed by hierarchical Bayesian
analysis. Biol Lett 3: 646–650.
50. Pereira SL, Baker AJ (2006) A mitogenomics timescale for birds detects variable
phylogenetic rates of molecular evolution and refutes the standard molecularclock. Mol Biol Evol 23: 1731–1740.
Deep Genetic Structure within Neotropical Birds
PLoS ONE | www.plosone.org 12 December 2011 | Volume 6 | Issue 12 | e28543
51. Nabholz B, Glemin S, Galtier N (2008) Strong variations of mitochondrial
mutation rate across mammals: the longevity hypothesis. Mol Biol Evol 25:
120–130.
52. Burney CW, Brumfield RT (2009) Ecology predicts levels of genetic
differentiation in Neotropical birds. Am Nat 174: 358–368.
53. Barcode of Life Data System (http://www.barcodinglife.org).
54. Ivanova NV, DeWaard JR, Hebert PDN (2006) An inexpensive, automation-
friendly protocol for recovering high-quality DNA. Mol Ecol Notes 6: 998–1002.
55. Dean AD, Greenwald JE (1995) Use of filtered pipet tips to elute DNA from
agarose gels. Biotechniques 18: 980.
56. Drummond AJ, Ashton B, Buxton S, Cheung M, Cooper A, et al. (2010)
Geneious (http://www.geneious.com). 5.4 ed.
57. R Development Core Team (2010) R: A language and environment for
statistical computing. 2.12 ed. Vienna, Austria: R Foundation for StatisticalComputing.
58. Swofford DL (2002) PAUP*: Phylogenetic Analysis Using Parsimony (*and
related methods) 4ed. Sunderland: Sinauer Associates.59. Guindon S, Gascuel O (2003) A simple, fast, and accurate algorithm to estimate
large phylogenies by maximum likelihood. Syst Biol 52: 696–704.60. Posada D (2008) jModelTest: Phylogenetic Model Averaging. Mol Biol Evol 25:
1253–1256.
61. Borges SH (2007) Analise biogeografica da avifauna da regiao oeste do baixoRio Negro, amazonia brasileira. Rev Bras Zool 24: 919–940.
62. Campagna L, Lijtmaer DA, Kerr KCR, Barreira AS, Hebert PD, et al. (2010)DNAbarcodes provide new evidence of a recent radiation in the genus Sporophila
(Aves: Passeriformes). Mol Ecol Res 10: 449–458.
Deep Genetic Structure within Neotropical Birds
PLoS ONE | www.plosone.org 13 December 2011 | Volume 6 | Issue 12 | e28543
Related Documents


![Neotropical cervidology_12[1]](https://static.cupdf.com/doc/110x72/547f4ab5b37959a22b8b56e0/neotropical-cervidology121.jpg)